Connecting Markets East & West See Appendix A-1 for analyst certification, important disclosures and the status of non-US analysts. Any authors named on this report are research analysts unless otherwise indicated. Global Markets Research February 2017 Asia ex-Japan’s economic outlook: Hope for the best, prepare for the worst Rob Subbaraman +65 6433 6548 [email protected]

Welcome message from author
This document is posted to help you gain knowledge. Please leave a comment to let me know what you think about it! Share it to your friends and learn new things together.
Transcript
Connecting Markets East & West
See Appendix A-1 for analyst certification, important
disclosures and the status of non-US analysts.
Any authors named on this report are research
analysts unless otherwise indicated.
Global Markets Research
February 2017
Asia ex-Japan’s economic outlook:
Hope for the best, prepare for the worst
Rob Subbaraman +65 6433 6548
Table of contents
Asia's cyclical export upswing, but big structural headwinds 3
China’s incredible five-ball juggling act 8
Nomura’s China forecasts 9
Demand-side stimulus is not the long-term solution 14
China's capital outflow risk 15
Nomura’s heat map on EM vulnerability to Trump’s ‘America First’ policies 18
Aside from Mexico, Asia is most exposed to Trumponomics 19
America's true trade with China and Mexico 21
American trade protectionism against China would quickly spread to the rest of Asia 22
USD appreciation could lead to FX debt mismatch problems… 24
… which could quickly expose Asia’s outsized financial cycle 25
Asia’s maturing financial cycle – constructing early warning indicators (EWIs) of financial crises 27
Risk of financial crisis: China stands out 33
Nomura's 3-30 Rule 34
IMF’s 5-30 rule 35
Asia's striving cubs are ripe for an investment boom 37
Five risk buckets - Asia differs from other EM 38
Nomura’s Asia league table 40
Hong Kong: could be Asia’s flashpoint 41
Korea seems to be following in Japan’s footsteps 42
India: V-shaped recovery 43
Malaysia: some cracks appearing 44
Thailand: heavy baggage is taking its toll 45
The Philippines: Goldilocks economy, but watch politics 46
Indonesia: improving growth and reform outlook 47
Singapore: besieged by negative external shocks 48
Nomura forecasts versus the street 49

Asia 2017 Outlook – Sailing into the storm
Asia's cyclical recovery, but big structural headwinds
3
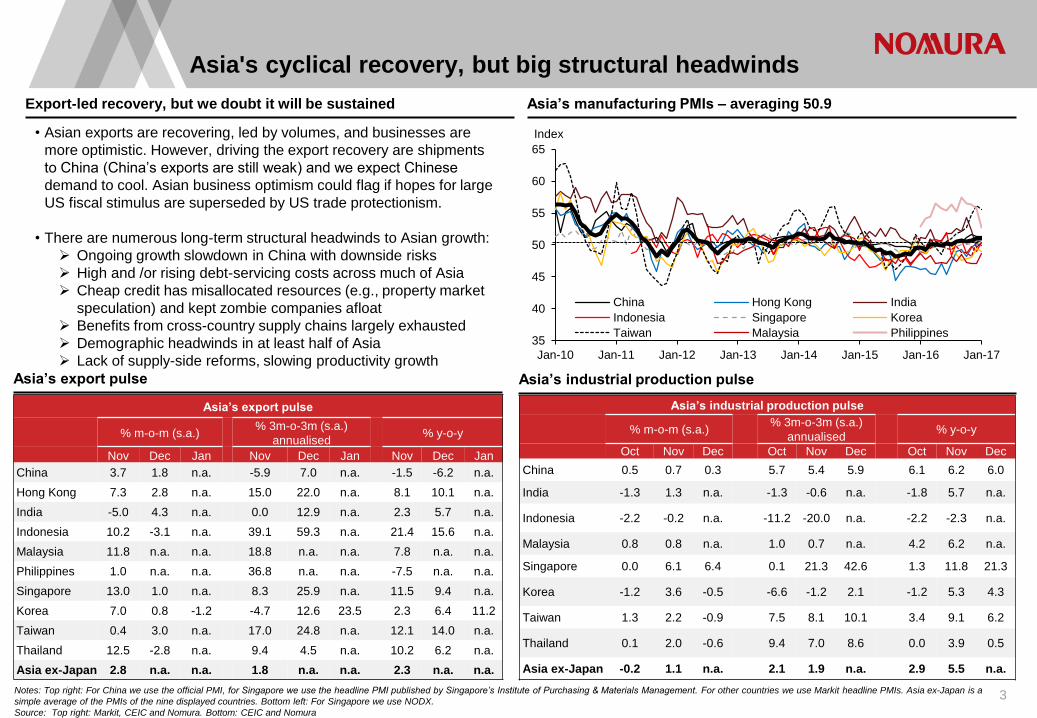
Export-led recovery, but we doubt it will be sustained Asia’s manufacturing PMIs – averaging 50.9
Asia’s export pulse Asia’s industrial production pulse
• Asian exports are recovering, led by volumes, and businesses are
more optimistic. However, driving the export recovery are shipments
to China (China’s exports are still weak) and we expect Chinese
demand to cool. Asian business optimism could flag if hopes for large
US fiscal stimulus are superseded by US trade protectionism.
• There are numerous long-term structural headwinds to Asian growth:
Ongoing growth slowdown in China with downside risks
High and /or rising debt-servicing costs across much of Asia
Cheap credit has misallocated resources (e.g., property market
speculation) and kept zombie companies afloat
Benefits from cross-country supply chains largely exhausted
Demographic headwinds in at least half of Asia
Lack of supply-side reforms, slowing productivity growth
Notes: Top right: For China we use the official PMI, for Singapore we use the headline PMI published by Singapore’s Institute of Purchasing & Materials Management. For other countries we use Markit headline PMIs. Asia ex-Japan is a
simple average of the PMIs of the nine displayed countries. Bottom left: For Singapore we use NODX.
Source: Top right: Markit, CEIC and Nomura. Bottom: CEIC and Nomura
Asia’s industrial production pulse
% m-o-m (s.a.) % 3m-o-3m (s.a.)
annualised % y-o-y
Oct Nov Dec Oct Nov Dec Oct Nov Dec
China 0.5 0.7 0.3 5.7 5.4 5.9 6.1 6.2 6.0
India -1.3 1.3 n.a. -1.3 -0.6 n.a. -1.8 5.7 n.a.
Indonesia -2.2 -0.2 n.a. -11.2 -20.0 n.a. -2.2 -2.3 n.a.
Malaysia 0.8 0.8 n.a. 1.0 0.7 n.a. 4.2 6.2 n.a.
Singapore 0.0 6.1 6.4 0.1 21.3 42.6 1.3 11.8 21.3
Korea -1.2 3.6 -0.5 -6.6 -1.2 2.1 -1.2 5.3 4.3
Taiwan 1.3 2.2 -0.9 7.5 8.1 10.1 3.4 9.1 6.2
Thailand 0.1 2.0 -0.6 9.4 7.0 8.6 0.0 3.9 0.5
Asia ex-Japan -0.2 1.1 n.a. 2.1 1.9 n.a. 2.9 5.5 n.a.
Asia’s export pulse
% m-o-m (s.a.) % 3m-o-3m (s.a.)
annualised % y-o-y
Nov Dec Jan Nov Dec Jan Nov Dec Jan
China 3.7 1.8 n.a. -5.9 7.0 n.a. -1.5 -6.2 n.a.
Hong Kong 7.3 2.8 n.a. 15.0 22.0 n.a. 8.1 10.1 n.a.
India -5.0 4.3 n.a. 0.0 12.9 n.a. 2.3 5.7 n.a.
Indonesia 10.2 -3.1 n.a. 39.1 59.3 n.a. 21.4 15.6 n.a.
Malaysia 11.8 n.a. n.a. 18.8 n.a. n.a. 7.8 n.a. n.a.
Philippines 1.0 n.a. n.a. 36.8 n.a. n.a. -7.5 n.a. n.a.
Singapore 13.0 1.0 n.a. 8.3 25.9 n.a. 11.5 9.4 n.a.
Korea 7.0 0.8 -1.2 -4.7 12.6 23.5 2.3 6.4 11.2
Taiwan 0.4 3.0 n.a. 17.0 24.8 n.a. 12.1 14.0 n.a.
Thailand 12.5 -2.8 n.a. 9.4 4.5 n.a. 10.2 6.2 n.a.
Asia ex-Japan 2.8 n.a. n.a. 1.8 n.a. n.a. 2.3 n.a. n.a.
Exports- S:\Economics\subbaraman\Stuff\Asia database\Exports seasonally adjusted.xlsx
IP- S:\Economics\subbaraman\Stuff\Asia database\asia export volumes.xlsx
PMI- S:\Economics\subbaraman\Stuff\Asia database\asia pmi.xlsx
35
40
45
50
55
60
65
Jan-10 Jan-11 Jan-12 Jan-13 Jan-14 Jan-15 Jan-16 Jan-17
Index
China Hong Kong India
Indonesia Singapore Korea
Taiwan Malaysia Philippines
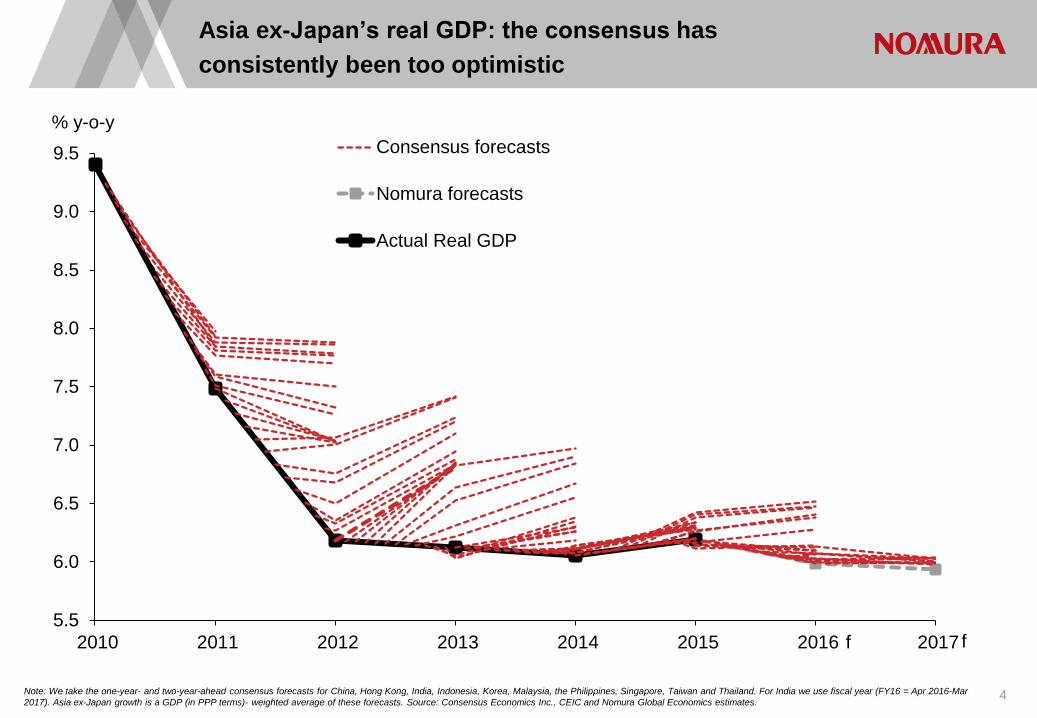
Asia ex-Japan’s real GDP: the consensus has
consistently been too optimistic
4 Note: We take the one-year- and two-year-ahead consensus forecasts for China, Hong Kong, India, Indonesia, Korea, Malaysia, the Philippines, Singapore, Taiwan and Thailand. For India we use fiscal year (FY16 = Apr 2016-Mar
2017). Asia ex-Japan growth is a GDP (in PPP terms)- weighted average of these forecasts. Source: Consensus Economics Inc., CEIC and Nomura Global Economics estimates.
5.5
6.0
6.5
7.0
7.5
8.0
8.5
9.0
9.5
2010 2011 2012 2013 2014 2015 2016 2017
% y-o-y
Consensus forecasts
Nomura forecasts
Actual Real GDP
f f
\\japan.nom\data\FID\Fixed Income\EconResearch\Economics\subbaraman\Stuff\Reports\2016 outlook\consensus forecasts.xlsx
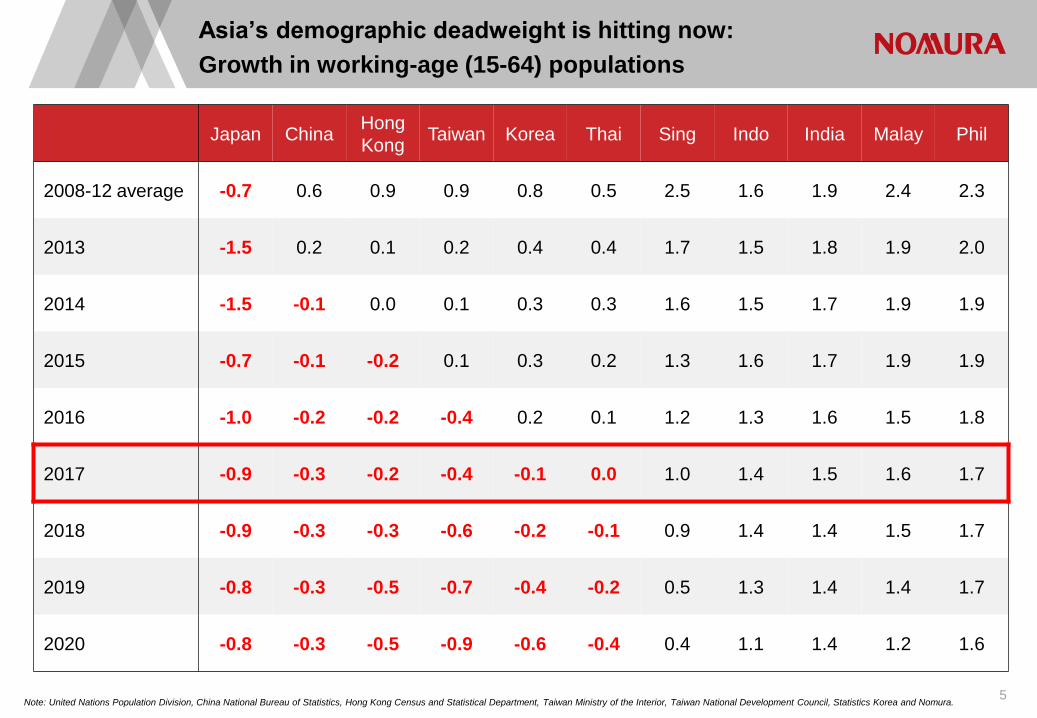
Asia’s demographic deadweight is hitting now:
Growth in working-age (15-64) populations
5 Note: United Nations Population Division, China National Bureau of Statistics, Hong Kong Census and Statistical Department, Taiwan Ministry of the Interior, Taiwan National Development Council, Statistics Korea and Nomura.
WA population- S:\Economics\subbaraman\Stuff\Reports\2016 outlook\pop and CA.xlsx
Japan China Hong
Kong Taiwan Korea Thai Sing Indo India Malay Phil
2008-12 average -0.7 0.6 0.9 0.9 0.8 0.5 2.5 1.6 1.9 2.4 2.3
2013 -1.5 0.2 0.1 0.2 0.4 0.4 1.7 1.5 1.8 1.9 2.0
2014 -1.5 -0.1 0.0 0.1 0.3 0.3 1.6 1.5 1.7 1.9 1.9
2015 -0.7 -0.1 -0.2 0.1 0.3 0.2 1.3 1.6 1.7 1.9 1.9
2016 -1.0 -0.2 -0.2 -0.4 0.2 0.1 1.2 1.3 1.6 1.5 1.8
2017 -0.9 -0.3 -0.2 -0.4 -0.1 0.0 1.0 1.4 1.5 1.6 1.7
2018 -0.9 -0.3 -0.3 -0.6 -0.2 -0.1 0.9 1.4 1.4 1.5 1.7
2019 -0.8 -0.3 -0.5 -0.7 -0.4 -0.2 0.5 1.3 1.4 1.4 1.7
2020 -0.8 -0.3 -0.5 -0.9 -0.6 -0.4 0.4 1.1 1.4 1.2 1.6
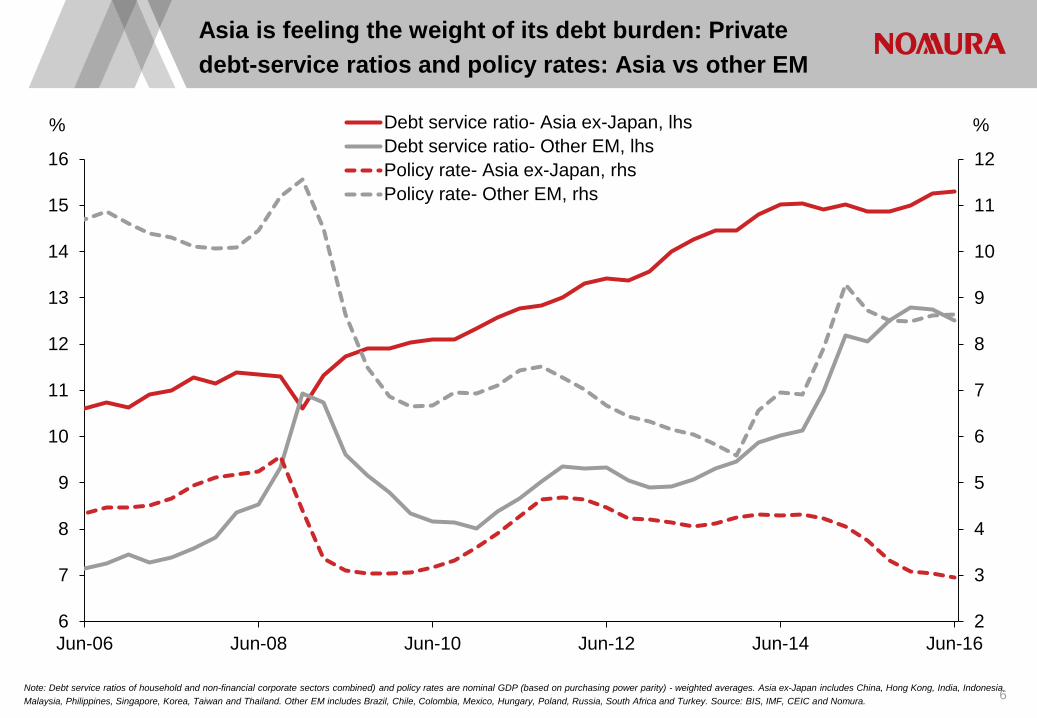
Note: Debt service ratios of household and non-financial corporate sectors combined) and policy rates are nominal GDP (based on purchasing power parity) - weighted averages. Asia ex-Japan includes China, Hong Kong, India, Indonesia,
Malaysia, Philippines, Singapore, Korea, Taiwan and Thailand. Other EM includes Brazil, Chile, Colombia, Mexico, Hungary, Poland, Russia, South Africa and Turkey. Source: BIS, IMF, CEIC and Nomura.
Asia is feeling the weight of its debt burden: Private
debt-service ratios and policy rates: Asia vs other EM
6
2
3
4
5
6
7
8
9
10
11
12
6
7
8
9
10
11
12
13
14
15
16
Jun-06 Jun-08 Jun-10 Jun-12 Jun-14 Jun-16
% % Debt service ratio- Asia ex-Japan, lhs
Debt service ratio- Other EM, lhs
Policy rate- Asia ex-Japan, rhs
Policy rate- Other EM, rhs
S:\Economics\subbaraman\Stuff\Reports\outlook 2017\outlook 2017 charts.xlsx
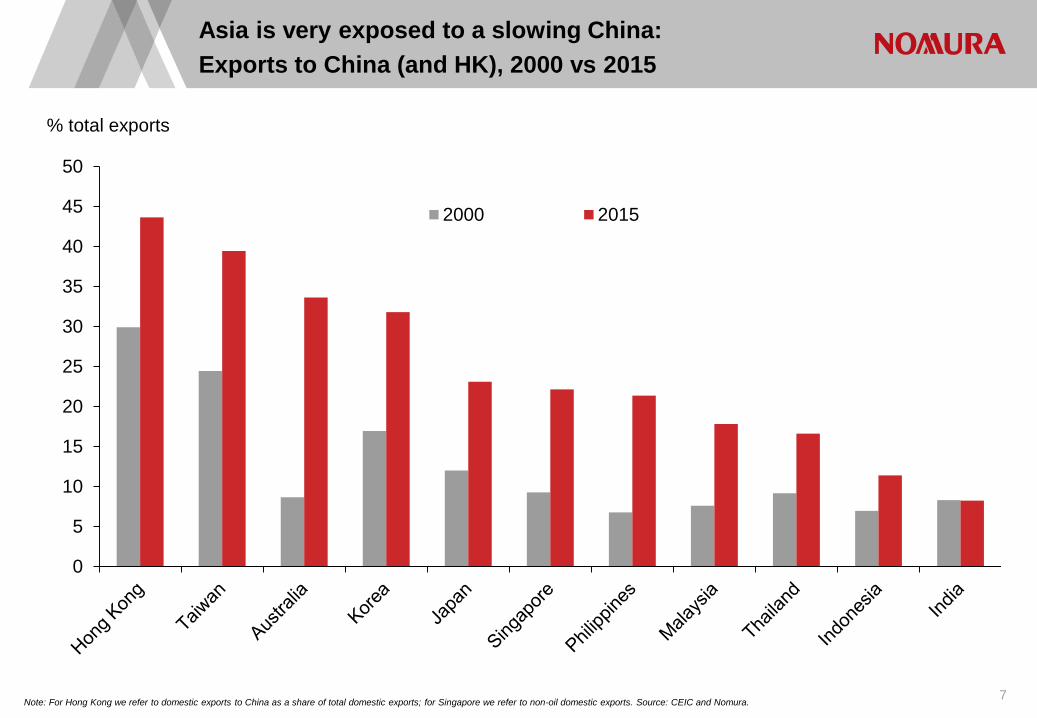
Asia is very exposed to a slowing China:
Exports to China (and HK), 2000 vs 2015
7 Note: For Hong Kong we refer to domestic exports to China as a share of total domestic exports; for Singapore we refer to non-oil domestic exports. Source: CEIC and Nomura.
0
5
10
15
20
25
30
35
40
45
50
% total exports
2000 2015
S:\Economics\subbaraman\Stuff\Asia database\Exports by destination.xlsx
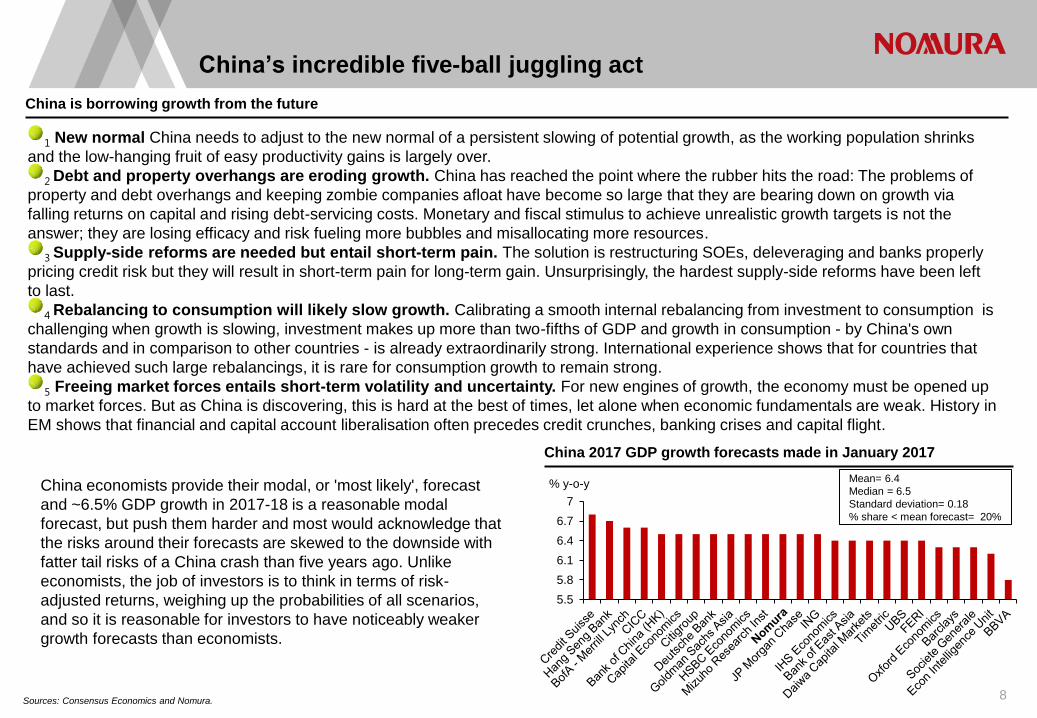
China’s incredible five-ball juggling act
8
China is borrowing growth from the future
China 2017 GDP growth forecasts made in January 2017
1 New normal China needs to adjust to the new normal of a persistent slowing of potential growth, as the working population shrinks
and the low-hanging fruit of easy productivity gains is largely over.
2 Debt and property overhangs are eroding growth. China has reached the point where the rubber hits the road: The problems of
property and debt overhangs and keeping zombie companies afloat have become so large that they are bearing down on growth via
falling returns on capital and rising debt-servicing costs. Monetary and fiscal stimulus to achieve unrealistic growth targets is not the
answer; they are losing efficacy and risk fueling more bubbles and misallocating more resources.
3 Supply-side reforms are needed but entail short-term pain. The solution is restructuring SOEs, deleveraging and banks properly
pricing credit risk but they will result in short-term pain for long-term gain. Unsurprisingly, the hardest supply-side reforms have been left
to last.
4 Rebalancing to consumption will likely slow growth. Calibrating a smooth internal rebalancing from investment to consumption is
challenging when growth is slowing, investment makes up more than two-fifths of GDP and growth in consumption - by China's own
standards and in comparison to other countries - is already extraordinarily strong. International experience shows that for countries that
have achieved such large rebalancings, it is rare for consumption growth to remain strong.
5 Freeing market forces entails short-term volatility and uncertainty. For new engines of growth, the economy must be opened up
to market forces. But as China is discovering, this is hard at the best of times, let alone when economic fundamentals are weak. History in
EM shows that financial and capital account liberalisation often precedes credit crunches, banking crises and capital flight.
Sources: Consensus Economics and Nomura.
Consensus- \\japan.nom\data\FID\Fixed Income\EconResearch\Economics\subbaraman\Stuff\China\Consensus forecasts by dispersion.xlsx
China economists provide their modal, or 'most likely', forecast
and ~6.5% GDP growth in 2017-18 is a reasonable modal
forecast, but push them harder and most would acknowledge that
the risks around their forecasts are skewed to the downside with
fatter tail risks of a China crash than five years ago. Unlike
economists, the job of investors is to think in terms of risk-
adjusted returns, weighing up the probabilities of all scenarios,
and so it is reasonable for investors to have noticeably weaker
growth forecasts than economists.
5.5
5.8
6.1
6.4
6.7
7
% y-o-y Mean= 6.4
Median = 6.5
Standard deviation= 0.18
% share < mean forecast= 20%
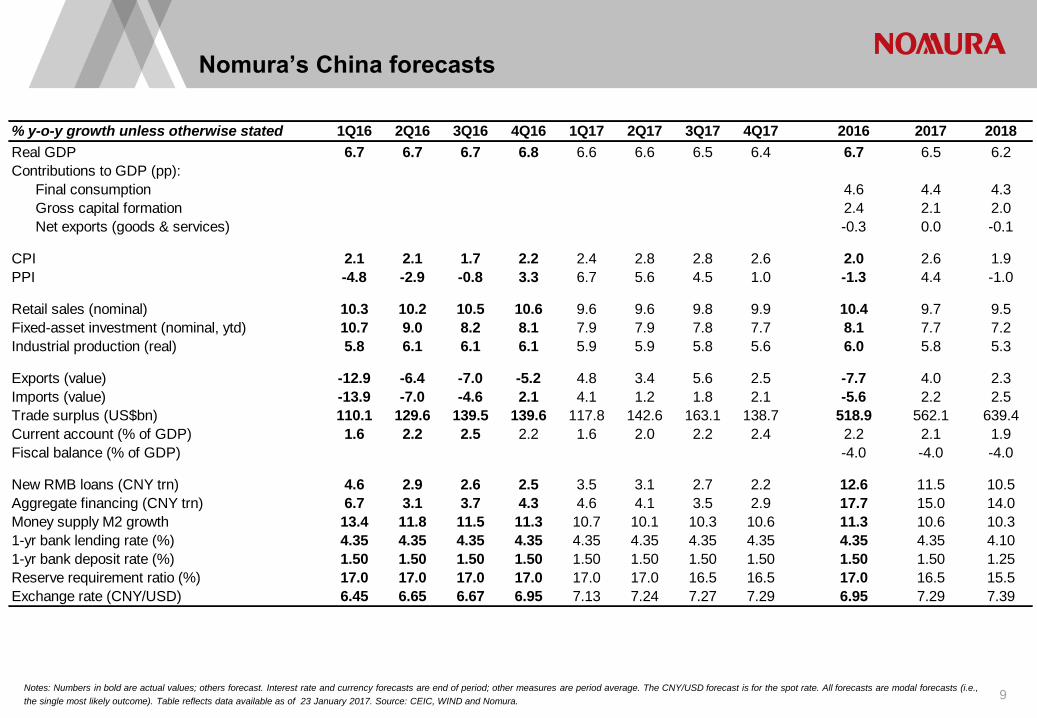
Notes: Numbers in bold are actual values; others forecast. Interest rate and currency forecasts are end of period; other measures are period average. The CNY/USD forecast is for the spot rate. All forecasts are modal forecasts (i.e.,
the single most likely outcome). Table reflects data available as of 23 January 2017. Source: CEIC, WIND and Nomura.
Nomura’s China forecasts
9
% y-o-y growth unless otherwise stated 1Q16 2Q16 3Q16 4Q16 1Q17 2Q17 3Q17 4Q17 2016 2017 2018
Real GDP 6.7 6.7 6.7 6.8 6.6 6.6 6.5 6.4 6.7 6.5 6.2
Contributions to GDP (pp):
Final consumption 4.6 4.4 4.3
Gross capital formation 2.4 2.1 2.0
Net exports (goods & services) -0.3 0.0 -0.1
CPI 2.1 2.1 1.7 2.2 2.4 2.8 2.8 2.6 2.0 2.6 1.9
PPI -4.8 -2.9 -0.8 3.3 6.7 5.6 4.5 1.0 -1.3 4.4 -1.0
Retail sales (nominal) 10.3 10.2 10.5 10.6 9.6 9.6 9.8 9.9 10.4 9.7 9.5
Fixed-asset investment (nominal, ytd) 10.7 9.0 8.2 8.1 7.9 7.9 7.8 7.7 8.1 7.7 7.2
Industrial production (real) 5.8 6.1 6.1 6.1 5.9 5.9 5.8 5.6 6.0 5.8 5.3
Exports (value) -12.9 -6.4 -7.0 -5.2 4.8 3.4 5.6 2.5 -7.7 4.0 2.3
Imports (value) -13.9 -7.0 -4.6 2.1 4.1 1.2 1.8 2.1 -5.6 2.2 2.5
Trade surplus (US$bn) 110.1 129.6 139.5 139.6 117.8 142.6 163.1 138.7 518.9 562.1 639.4
Current account (% of GDP) 1.6 2.2 2.5 2.2 1.6 2.0 2.2 2.4 2.2 2.1 1.9
Fiscal balance (% of GDP) -4.0 -4.0 -4.0
New RMB loans (CNY trn) 4.6 2.9 2.6 2.5 3.5 3.1 2.7 2.2 12.6 11.5 10.5
Aggregate financing (CNY trn) 6.7 3.1 3.7 4.3 4.6 4.1 3.5 2.9 17.7 15.0 14.0
Money supply M2 growth 13.4 11.8 11.5 11.3 10.7 10.1 10.3 10.6 11.3 10.6 10.3
1-yr bank lending rate (%) 4.35 4.35 4.35 4.35 4.35 4.35 4.35 4.35 4.35 4.35 4.10
1-yr bank deposit rate (%) 1.50 1.50 1.50 1.50 1.50 1.50 1.50 1.50 1.50 1.50 1.25
Reserve requirement ratio (%) 17.0 17.0 17.0 17.0 17.0 17.0 16.5 16.5 17.0 16.5 15.5
Exchange rate (CNY/USD) 6.45 6.65 6.67 6.95 7.13 7.24 7.27 7.29 6.95 7.29 7.39
\\japan.nom\data\FID\Fixed Income\EconResearch\Economics\subbaraman\Stuff\Asia database\Big ppt excels\china\24 jan 2017 china excel.xlsx
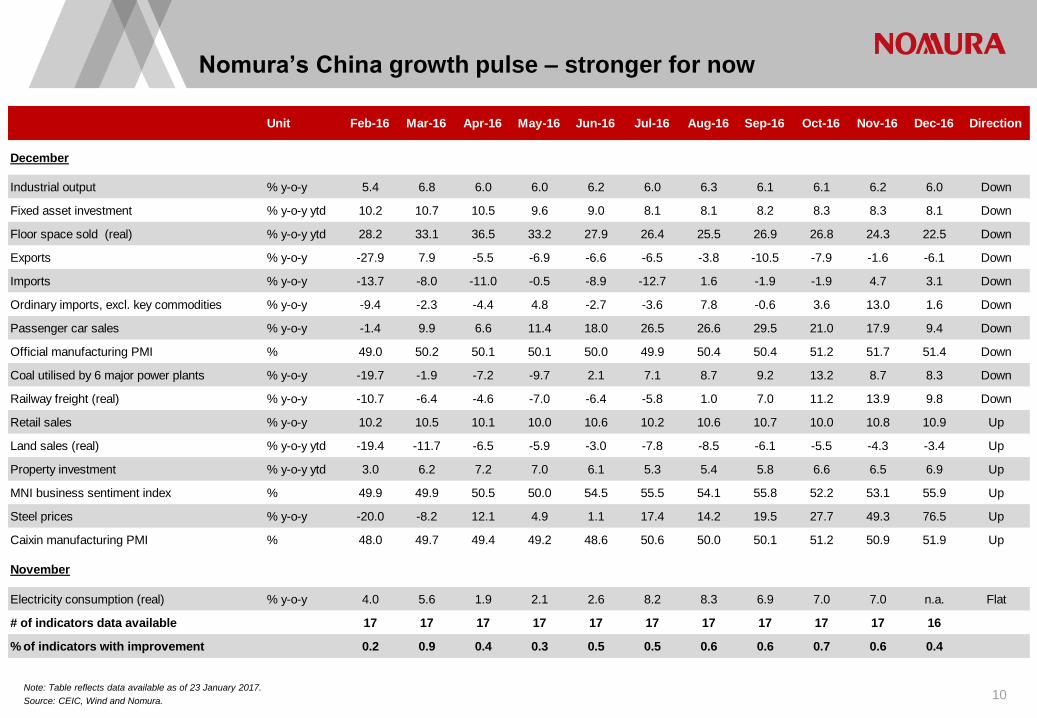
10 Note: Table reflects data available as of 23 January 2017.
Source: CEIC, Wind and Nomura.
Nomura’s China growth pulse – stronger for now
\\japan.nom\data\FID\Fixed Income\EconResearch\Economics\subbaraman\Stuff\Asia database\Big ppt excels\china\24 jan 2017 china excel.xlsx
Unit Feb-16 Mar-16 Apr-16 May-16 Jun-16 Jul-16 Aug-16 Sep-16 Oct-16 Nov-16 Dec-16 Direction
December
Industrial output % y-o-y 5.4 6.8 6.0 6.0 6.2 6.0 6.3 6.1 6.1 6.2 6.0 Down
Fixed asset investment % y-o-y ytd 10.2 10.7 10.5 9.6 9.0 8.1 8.1 8.2 8.3 8.3 8.1 Down
Floor space sold (real) % y-o-y ytd 28.2 33.1 36.5 33.2 27.9 26.4 25.5 26.9 26.8 24.3 22.5 Down
Exports % y-o-y -27.9 7.9 -5.5 -6.9 -6.6 -6.5 -3.8 -10.5 -7.9 -1.6 -6.1 Down
Imports % y-o-y -13.7 -8.0 -11.0 -0.5 -8.9 -12.7 1.6 -1.9 -1.9 4.7 3.1 Down
Ordinary imports, excl. key commodities % y-o-y -9.4 -2.3 -4.4 4.8 -2.7 -3.6 7.8 -0.6 3.6 13.0 1.6 Down
Passenger car sales % y-o-y -1.4 9.9 6.6 11.4 18.0 26.5 26.6 29.5 21.0 17.9 9.4 Down
Official manufacturing PMI % 49.0 50.2 50.1 50.1 50.0 49.9 50.4 50.4 51.2 51.7 51.4 Down
Coal utilised by 6 major power plants % y-o-y -19.7 -1.9 -7.2 -9.7 2.1 7.1 8.7 9.2 13.2 8.7 8.3 Down
Railway freight (real) % y-o-y -10.7 -6.4 -4.6 -7.0 -6.4 -5.8 1.0 7.0 11.2 13.9 9.8 Down
Retail sales % y-o-y 10.2 10.5 10.1 10.0 10.6 10.2 10.6 10.7 10.0 10.8 10.9 Up
Land sales (real) % y-o-y ytd -19.4 -11.7 -6.5 -5.9 -3.0 -7.8 -8.5 -6.1 -5.5 -4.3 -3.4 Up
Property investment % y-o-y ytd 3.0 6.2 7.2 7.0 6.1 5.3 5.4 5.8 6.6 6.5 6.9 Up
MNI business sentiment index % 49.9 49.9 50.5 50.0 54.5 55.5 54.1 55.8 52.2 53.1 55.9 Up
Steel prices % y-o-y -20.0 -8.2 12.1 4.9 1.1 17.4 14.2 19.5 27.7 49.3 76.5 Up
Caixin manufacturing PMI % 48.0 49.7 49.4 49.2 48.6 50.6 50.0 50.1 51.2 50.9 51.9 Up
November
Electricity consumption (real) % y-o-y 4.0 5.6 1.9 2.1 2.6 8.2 8.3 6.9 7.0 7.0 n.a. Flat
# of indicators data available 17 17 17 17 17 17 17 17 17 17 16
% of indicators with improvement 0.2 0.9 0.4 0.3 0.5 0.5 0.6 0.6 0.7 0.6 0.4
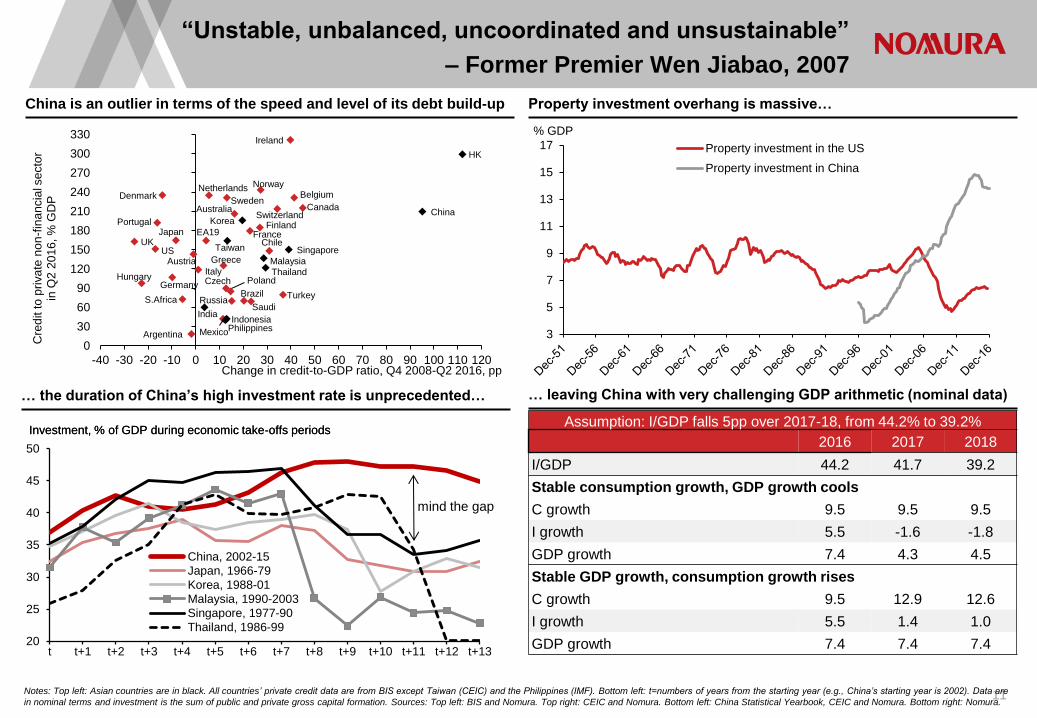
“Unstable, unbalanced, uncoordinated and unsustainable”
– Former Premier Wen Jiabao, 2007
11 Notes: Top left: Asian countries are in black. All countries’ private credit data are from BIS except Taiwan (CEIC) and the Philippines (IMF). Bottom left: t=numbers of years from the starting year (e.g., China’s starting year is 2002). Data are
in nominal terms and investment is the sum of public and private gross capital formation. Sources: Top left: BIS and Nomura. Top right: CEIC and Nomura. Bottom left: China Statistical Yearbook, CEIC and Nomura. Bottom right: Nomura.
Investment- \\japan.nom\data\FID\Fixed Income\EconResearch\Economics\subbaraman\Stuff\China\China challenges.xlsx
Pte cdt- S:\Economics\subbaraman\Stuff\Asia database\Debt database\BIS- private and govt credit to GDP.xlsx
GDP arithmatic- S:\Economics\subbaraman\subbaraman\Data requests\Slide list_Jan 2017.xlsx
China is an outlier in terms of the speed and level of its debt build-up Property investment overhang is massive…
… the duration of China’s high investment rate is unprecedented… … leaving China with very challenging GDP arithmetic (nominal data)
20
25
30
35
40
45
50
t t+1 t+2 t+3 t+4 t+5 t+6 t+7 t+8 t+9 t+10 t+11 t+12 t+13
China, 2002-15
Japan, 1966-79
Korea, 1988-01
Malaysia, 1990-2003
Singapore, 1977-90
Thailand, 1986-99
Investment, % of GDP during economic take-offs periods
mind the gap
Investment, % of GDP during economic take-offs periods
3
5
7
9
11
13
15
17
% GDP
Property investment in the US
Property investment in China
Assumption: I/GDP falls 5pp over 2017-18, from 44.2% to 39.2%
2016 2017 2018
I/GDP 44.2 41.7 39.2
Stable consumption growth, GDP growth cools
C growth 9.5 9.5 9.5
I growth 5.5 -1.6 -1.8
GDP growth 7.4 4.3 4.5
Stable GDP growth, consumption growth rises
C growth 9.5 12.9 12.6
I growth 5.5 1.4 1.0
GDP growth 7.4 7.4 7.4
Property- \\japan.nom\data\FID\Fixed Income\EconResearch\Economics\subbaraman\Stuff\China\China risks\China credit and NPLs.xlsx
Argentina
Austria
Australia
Belgium
Brazil
Canada Switzerland
Czech Germany
Denmark
Finland France
UK
Greece
Hungary
Ireland
Italy
Japan Chile
Mexico
Netherlands Norway
Poland
Portugal
Russia Saudi
Sweden
Turkey
US
EA19
S.Africa
China
HK
Indonesia India
Korea
Malaysia
Singapore
Thailand
Taiwan
Philippines
0
30
60
90
120
150
180
210
240
270
300
330
-40 -30 -20 -10 0 10 20 30 40 50 60 70 80 90 100 110 120
Cre
dit to
pri
va
te n
on
-fin
an
cia
l se
cto
r in
Q2
20
16
, %
GD
P
Change in credit-to-GDP ratio, Q4 2008-Q2 2016, pp
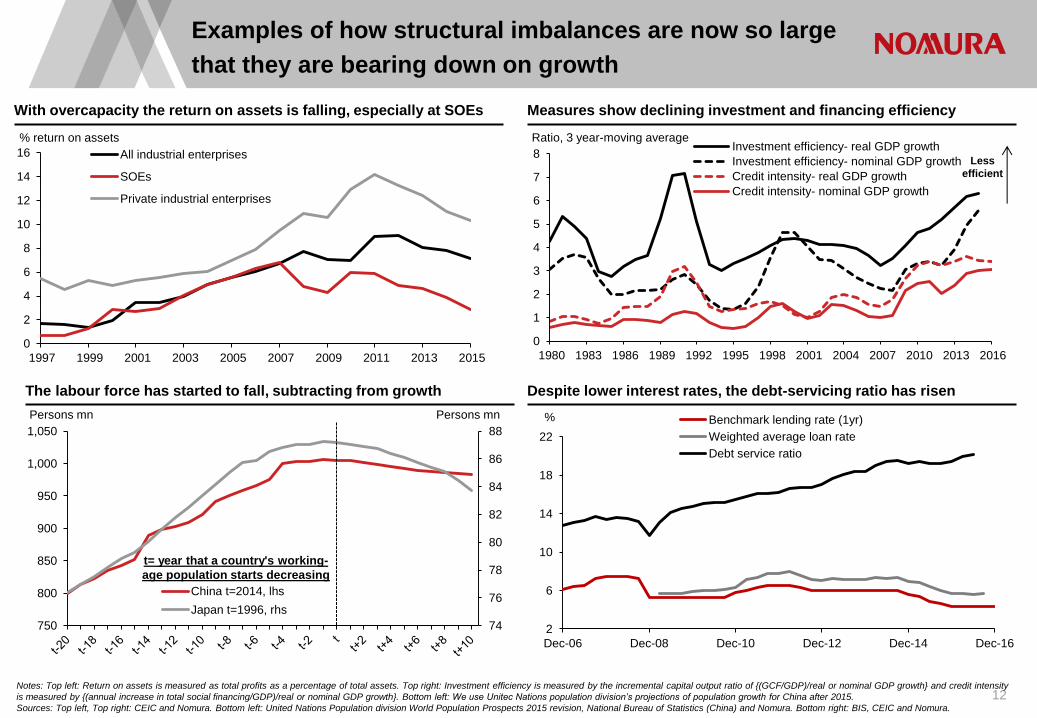
Examples of how structural imbalances are now so large
that they are bearing down on growth
12
Despite lower interest rates, the debt-servicing ratio has risen The labour force has started to fall, subtracting from growth
Notes: Top left: Return on assets is measured as total profits as a percentage of total assets. Top right: Investment efficiency is measured by the incremental capital output ratio of {(GCF/GDP)/real or nominal GDP growth} and credit intensity
is measured by {(annual increase in total social financing/GDP)/real or nominal GDP growth}. Bottom left: We use Unitec Nations population division’s projections of population growth for China after 2015.
Sources: Top left, Top right: CEIC and Nomura. Bottom left: United Nations Population division World Population Prospects 2015 revision, National Bureau of Statistics (China) and Nomura. Bottom right: BIS, CEIC and Nomura.
Measures show declining investment and financing efficiency
ICOR- \\japan.nom\data\FID\Fixed Income\EconResearch\Economics\subbaraman\Stuff\China\China challenges.xlsx
Ir debt service- S:\Economics\subbaraman\Stuff\Asia database\Big ppt excels\china charts latest.xlsx
With overcapacity the return on assets is falling, especially at SOEs
SOE profits- \\japan.nom\data\FID\Fixed Income\EconResearch\Economics\subbaraman\Stuff\China\China challenges.xlsx
Working age- \\japan.nom\data\FID\Fixed Income\EconResearch\Economics\subbaraman\Stuff\Reports\2016 outlook\pop and CA.xlsx
0
1
2
3
4
5
6
7
8
1980 1983 1986 1989 1992 1995 1998 2001 2004 2007 2010 2013 2016
Ratio, 3 year-moving average Investment efficiency- real GDP growth
Investment efficiency- nominal GDP growth
Credit intensity- real GDP growth
Credit intensity- nominal GDP growth
Less
efficient
0
2
4
6
8
10
12
14
16
1997 1999 2001 2003 2005 2007 2009 2011 2013 2015
% return on assets
All industrial enterprises
SOEs
Private industrial enterprises
74
76
78
80
82
84
86
88
750
800
850
900
950
1,000
1,050
Persons mn Persons mn
China t=2014, lhs
Japan t=1996, rhs
t= year that a country's working-
age population starts decreasing
2
6
10
14
18
22
Dec-06 Dec-08 Dec-10 Dec-12 Dec-14 Dec-16
Benchmark lending rate (1yr)
Weighted average loan rate
Debt service ratio
%
13
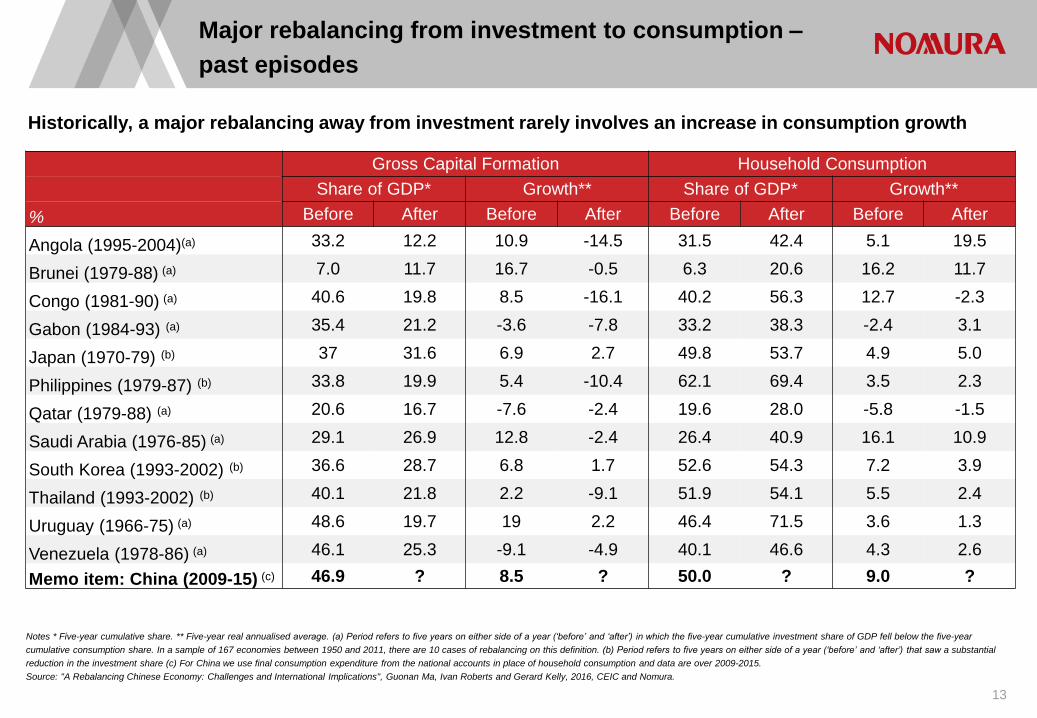
Notes * Five-year cumulative share. ** Five-year real annualised average. (a) Period refers to five years on either side of a year (‘before’ and ‘after’) in which the five-year cumulative investment share of GDP fell below the five-year
cumulative consumption share. In a sample of 167 economies between 1950 and 2011, there are 10 cases of rebalancing on this definition. (b) Period refers to five years on either side of a year (‘before’ and ‘after’) that saw a substantial
reduction in the investment share (c) For China we use final consumption expenditure from the national accounts in place of household consumption and data are over 2009-2015.
Source: "A Rebalancing Chinese Economy: Challenges and International Implications", Guonan Ma, Ivan Roberts and Gerard Kelly, 2016, CEIC and Nomura.
Historically, a major rebalancing away from investment rarely involves an increase in consumption growth
Major rebalancing from investment to consumption –
past episodes
Gross Capital Formation Household Consumption
Share of GDP* Growth** Share of GDP* Growth**
% Before After Before After Before After Before After
Angola (1995-2004)(a) 33.2 12.2 10.9 -14.5 31.5 42.4 5.1 19.5
Brunei (1979-88) (a) 7.0 11.7 16.7 -0.5 6.3 20.6 16.2 11.7
Congo (1981-90) (a) 40.6 19.8 8.5 -16.1 40.2 56.3 12.7 -2.3
Gabon (1984-93) (a) 35.4 21.2 -3.6 -7.8 33.2 38.3 -2.4 3.1
Japan (1970-79) (b) 37 31.6 6.9 2.7 49.8 53.7 4.9 5.0
Philippines (1979-87) (b) 33.8 19.9 5.4 -10.4 62.1 69.4 3.5 2.3
Qatar (1979-88) (a) 20.6 16.7 -7.6 -2.4 19.6 28.0 -5.8 -1.5
Saudi Arabia (1976-85) (a) 29.1 26.9 12.8 -2.4 26.4 40.9 16.1 10.9
South Korea (1993-2002) (b) 36.6 28.7 6.8 1.7 52.6 54.3 7.2 3.9
Thailand (1993-2002) (b) 40.1 21.8 2.2 -9.1 51.9 54.1 5.5 2.4
Uruguay (1966-75) (a) 48.6 19.7 19 2.2 46.4 71.5 3.6 1.3
Venezuela (1978-86) (a) 46.1 25.3 -9.1 -4.9 40.1 46.6 4.3 2.6
Memo item: China (2009-15) (c) 46.9 ? 8.5 ? 50.0 ? 9.0 ?
\\japan.nom\data\FID\Fixed Income\EconResearch\Economics\subbaraman\Stuff\China\China challenges.xlsx
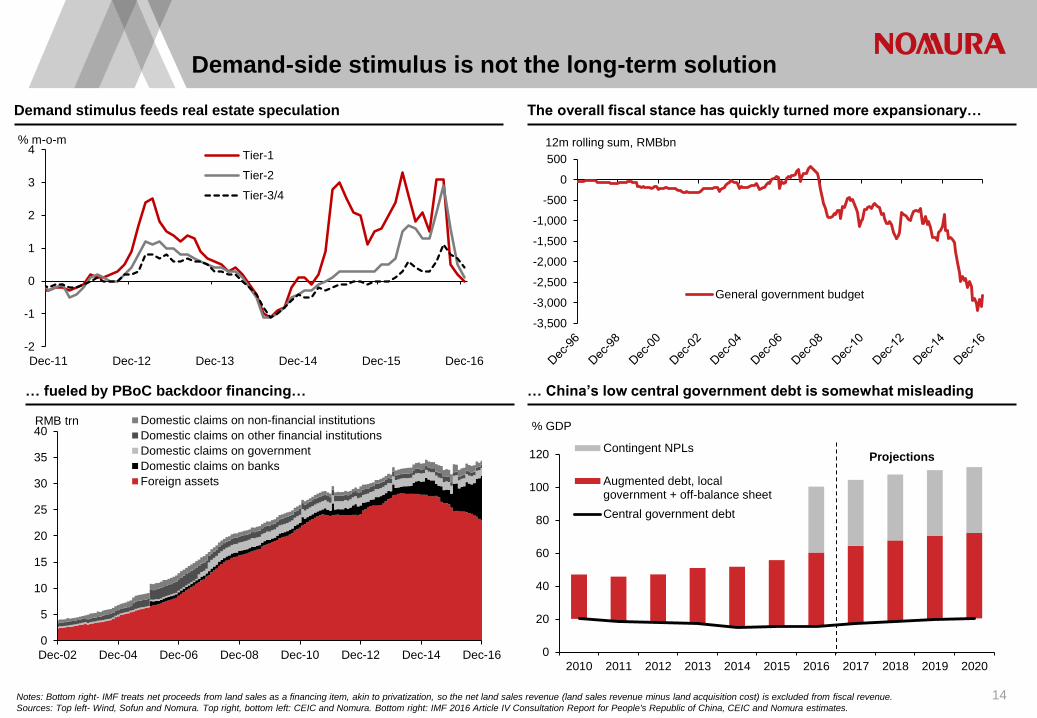
Demand-side stimulus is not the long-term solution
14
… China’s low central government debt is somewhat misleading … fueled by PBoC backdoor financing…
Notes: Bottom right- IMF treats net proceeds from land sales as a financing item, akin to privatization, so the net land sales revenue (land sales revenue minus land acquisition cost) is excluded from fiscal revenue.
Sources: Top left- Wind, Sofun and Nomura. Top right, bottom left: CEIC and Nomura. Bottom right: IMF 2016 Article IV Consultation Report for People's Republic of China, CEIC and Nomura estimates.
The overall fiscal stance has quickly turned more expansionary…
NPLs- \\japan.nom\data\FID\Fixed Income\EconResearch\Economics\subbaraman\Stuff\China\China challenges.xlsx
Fiscal deficit- S:\Economics\subbaraman\Stuff\Asia database\Big ppt excels\china charts latest.xlsx
Demand stimulus feeds real estate speculation
Property- \\japan.nom\data\FID\Fixed Income\EconResearch\Economics\subbaraman\Stuff\Asia database\Big ppt excels\china\24 jan 2017 china excel.xlsx
0
5
10
15
20
25
30
35
40
Dec-02 Dec-04 Dec-06 Dec-08 Dec-10 Dec-12 Dec-14 Dec-16
RMB trn Domestic claims on non-financial institutions
Domestic claims on other financial institutions
Domestic claims on government
Domestic claims on banks
Foreign assets
0
20
40
60
80
100
120
2010 2011 2012 2013 2014 2015 2016 2017 2018 2019 2020
% GDP
Contingent NPLs
Augmented debt, localgovernment + off-balance sheet
Central government debt
Projections
-2
-1
0
1
2
3
4
Dec-11 Dec-12 Dec-13 Dec-14 Dec-15 Dec-16
% m-o-m
Tier-1
Tier-2
Tier-3/4
-3,500
-3,000
-2,500
-2,000
-1,500
-1,000
-500
0
500
General government budget
12m rolling sum, RMBbn
S:\Economics\subbaraman\Stuff\Asia database\Big ppt excels\china\China Demand-side stimulus is not the long-term solution.xlsx
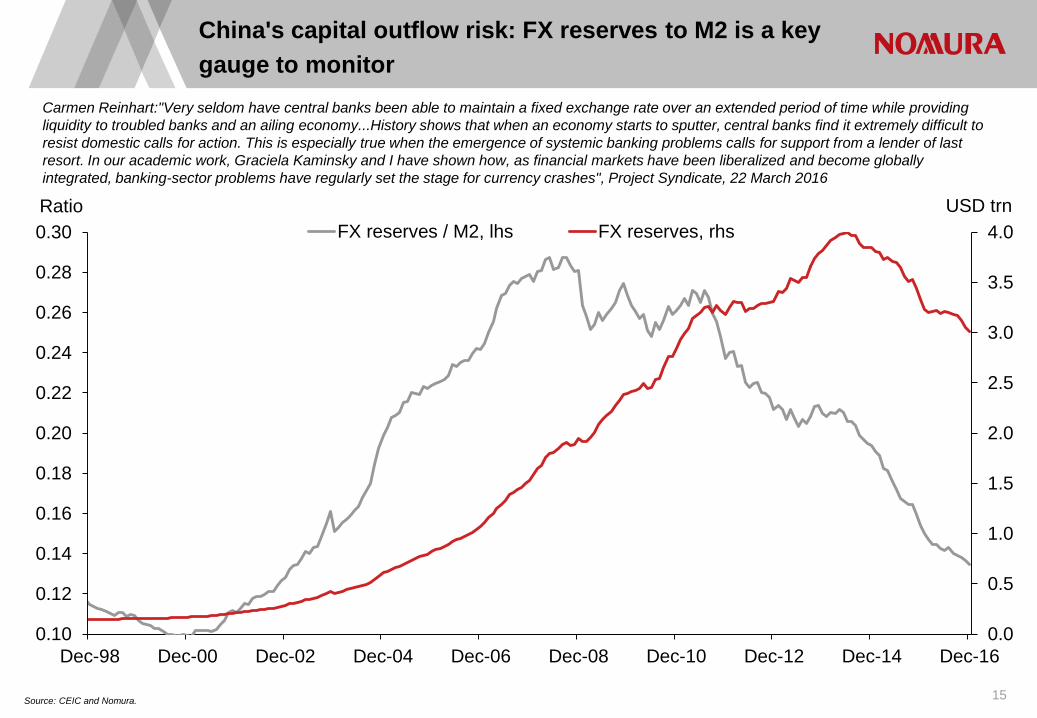
China's capital outflow risk: FX reserves to M2 is a key
gauge to monitor
15 Source: CEIC and Nomura.
Capital outflows- S:\Economics\subbaraman\Stuff\Asia database\Big ppt excels\China reserves_M2 ratio.xlsx
Carmen Reinhart:"Very seldom have central banks been able to maintain a fixed exchange rate over an extended period of time while providing
liquidity to troubled banks and an ailing economy...History shows that when an economy starts to sputter, central banks find it extremely difficult to
resist domestic calls for action. This is especially true when the emergence of systemic banking problems calls for support from a lender of last
resort. In our academic work, Graciela Kaminsky and I have shown how, as financial markets have been liberalized and become globally
integrated, banking-sector problems have regularly set the stage for currency crashes", Project Syndicate, 22 March 2016
0.0
0.5
1.0
1.5
2.0
2.5
3.0
3.5
4.0
0.10
0.12
0.14
0.16
0.18
0.20
0.22
0.24
0.26
0.28
0.30
Dec-98 Dec-00 Dec-02 Dec-04 Dec-06 Dec-08 Dec-10 Dec-12 Dec-14 Dec-16
USD trn Ratio
FX reserves / M2, lhs FX reserves, rhs
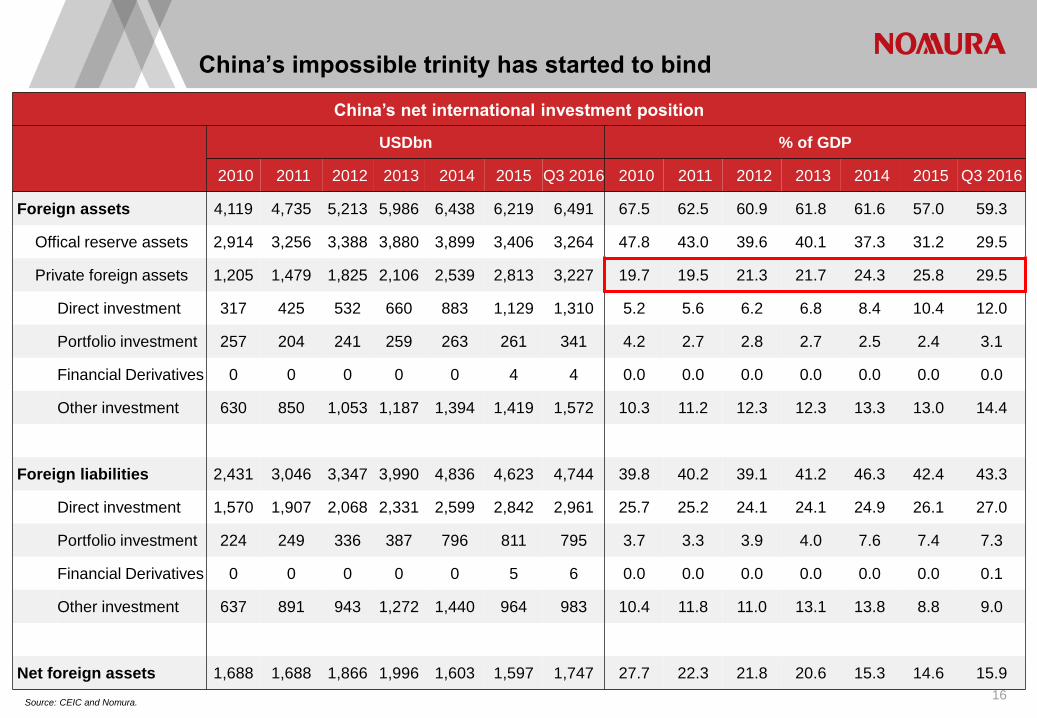
China’s impossible trinity has started to bind
Source: CEIC and Nomura. 16
S:\Economics\subbaraman\Stuff\Asia database\Private foreign assets.xlsx
China’s net international investment position
USDbn % of GDP
2010 2011 2012 2013 2014 2015 Q3 2016 2010 2011 2012 2013 2014 2015 Q3 2016
Foreign assets 4,119 4,735 5,213 5,986 6,438 6,219 6,491 67.5 62.5 60.9 61.8 61.6 57.0 59.3
Offical reserve assets 2,914 3,256 3,388 3,880 3,899 3,406 3,264 47.8 43.0 39.6 40.1 37.3 31.2 29.5
Private foreign assets 1,205 1,479 1,825 2,106 2,539 2,813 3,227 19.7 19.5 21.3 21.7 24.3 25.8 29.5
Direct investment 317 425 532 660 883 1,129 1,310 5.2 5.6 6.2 6.8 8.4 10.4 12.0
Portfolio investment 257 204 241 259 263 261 341 4.2 2.7 2.8 2.7 2.5 2.4 3.1
Financial Derivatives 0 0 0 0 0 4 4 0.0 0.0 0.0 0.0 0.0 0.0 0.0
Other investment 630 850 1,053 1,187 1,394 1,419 1,572 10.3 11.2 12.3 12.3 13.3 13.0 14.4
Foreign liabilities 2,431 3,046 3,347 3,990 4,836 4,623 4,744 39.8 40.2 39.1 41.2 46.3 42.4 43.3
Direct investment 1,570 1,907 2,068 2,331 2,599 2,842 2,961 25.7 25.2 24.1 24.1 24.9 26.1 27.0
Portfolio investment 224 249 336 387 796 811 795 3.7 3.3 3.9 4.0 7.6 7.4 7.3
Financial Derivatives 0 0 0 0 0 5 6 0.0 0.0 0.0 0.0 0.0 0.0 0.1
Other investment 637 891 943 1,272 1,440 964 983 10.4 11.8 11.0 13.1 13.8 8.8 9.0
Net foreign assets 1,688 1,688 1,866 1,996 1,603 1,597 1,747 27.7 22.3 21.8 20.6 15.3 14.6 15.9
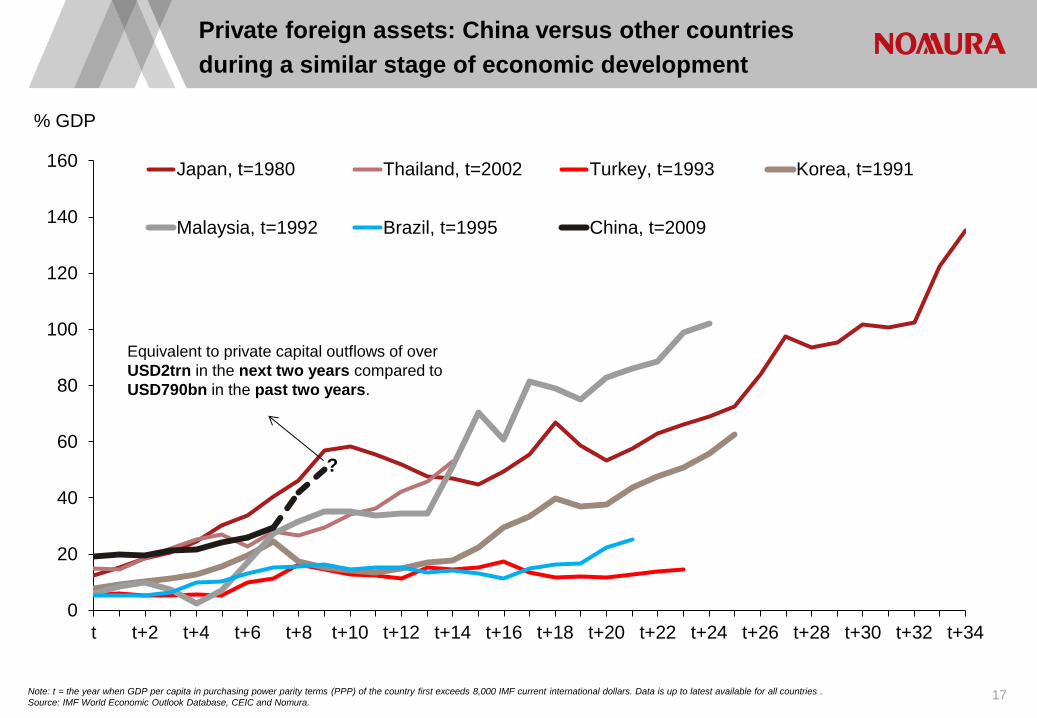
Private foreign assets: China versus other countries
during a similar stage of economic development
Note: t = the year when GDP per capita in purchasing power parity terms (PPP) of the country first exceeds 8,000 IMF current international dollars. Data is up to latest available for all countries .
Source: IMF World Economic Outlook Database, CEIC and Nomura. 17
S:\Economics\subbaraman\Stuff\Asia database\Private foreign assets.xlsx
0
20
40
60
80
100
120
140
160
t t+2 t+4 t+6 t+8 t+10 t+12 t+14 t+16 t+18 t+20 t+22 t+24 t+26 t+28 t+30 t+32 t+34
% GDP
Japan, t=1980 Thailand, t=2002 Turkey, t=1993 Korea, t=1991
Malaysia, t=1992 Brazil, t=1995 China, t=2009
?
Equivalent to private capital outflows of over
USD2trn in the next two years compared to
USD790bn in the past two years.
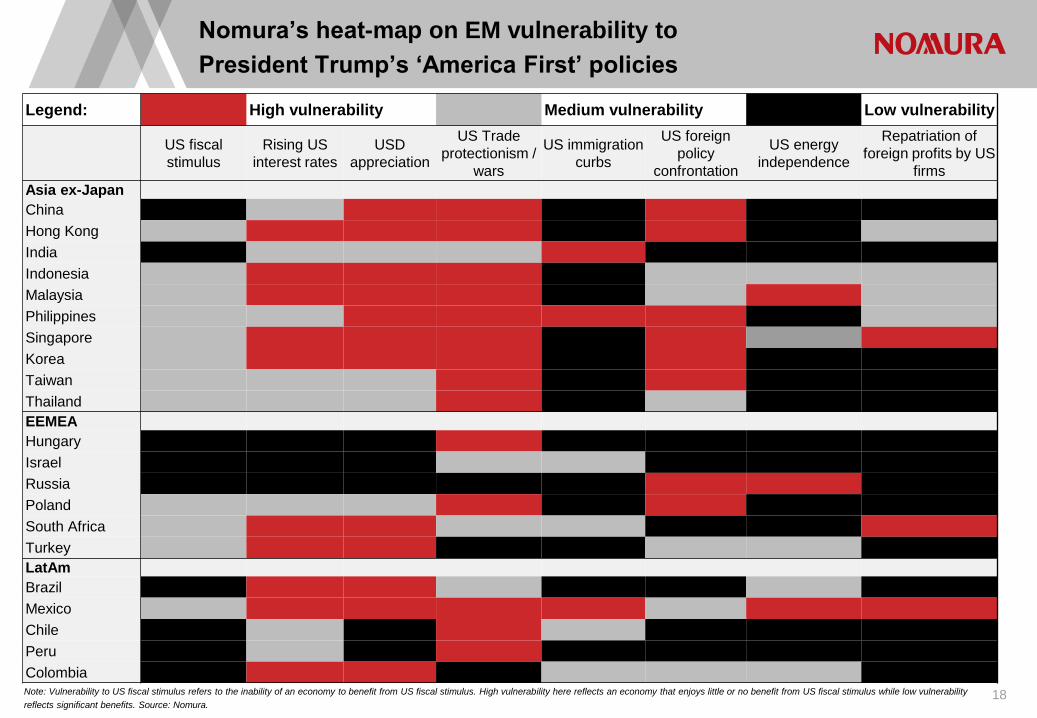
Note: Vulnerability to US fiscal stimulus refers to the inability of an economy to benefit from US fiscal stimulus. High vulnerability here reflects an economy that enjoys little or no benefit from US fiscal stimulus while low vulnerability
reflects significant benefits. Source: Nomura.
Nomura’s heat-map on EM vulnerability to
President Trump’s ‘America First’ policies
18
S:\Economics\subbaraman\Stuff\Reports\EM Trump report\EM heat map on Trumponomics.xlsx
Legend: High vulnerability Medium vulnerability Low vulnerability
US fiscal
stimulus
Rising US
interest rates
USD
appreciation
US Trade
protectionism /
wars
US immigration
curbs
US foreign
policy
confrontation
US energy
independence
Repatriation of
foreign profits by US
firms
Asia ex-Japan
China
Hong Kong
India
Indonesia
Malaysia
Philippines
Singapore
Korea
Taiwan
Thailand
EEMEA
Hungary
Israel
Russia
Poland
South Africa
Turkey
LatAm
Brazil
Mexico
Chile
Peru
Colombia
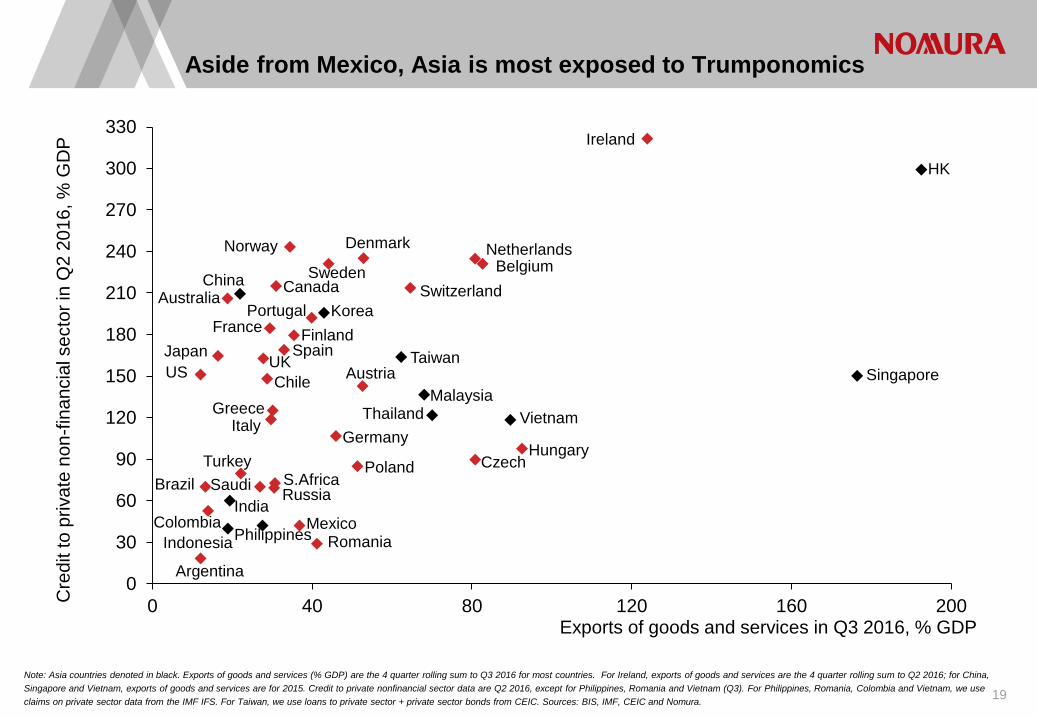
Note: Asia countries denoted in black. Exports of goods and services (% GDP) are the 4 quarter rolling sum to Q3 2016 for most countries. For Ireland, exports of goods and services are the 4 quarter rolling sum to Q2 2016; for China,
Singapore and Vietnam, exports of goods and services are for 2015. Credit to private nonfinancial sector data are Q2 2016, except for Philippines, Romania and Vietnam (Q3). For Philippines, Romania, Colombia and Vietnam, we use
claims on private sector data from the IMF IFS. For Taiwan, we use loans to private sector + private sector bonds from CEIC. Sources: BIS, IMF, CEIC and Nomura.
Aside from Mexico, Asia is most exposed to Trumponomics
19
Argentina
Austria
Australia
Belgium
Brazil
Canada Switzerland
Czech
Germany
Denmark
Spain Finland
France
UK
Greece
Hungary
Ireland
Italy
Japan
Chile
Mexico
Netherlands Norway
Poland
Portugal
Russia Saudi
Sweden
Turkey
US
S.Africa
Colombia
Romania
China
HK
Indonesia
India
Korea
Malaysia
Singapore
Thailand
Taiwan
Philippines
Vietnam
0
30
60
90
120
150
180
210
240
270
300
330
0 40 80 120 160 200Exports of goods and services in Q3 2016, % GDP
Cre
dit to
priva
te n
on
-fin
an
cia
l se
cto
r in
Q2 2
01
6, %
GD
P
S:\Economics\subbaraman\Stuff\Reports\outlook 2017\outlook 2017 charts.xlsx
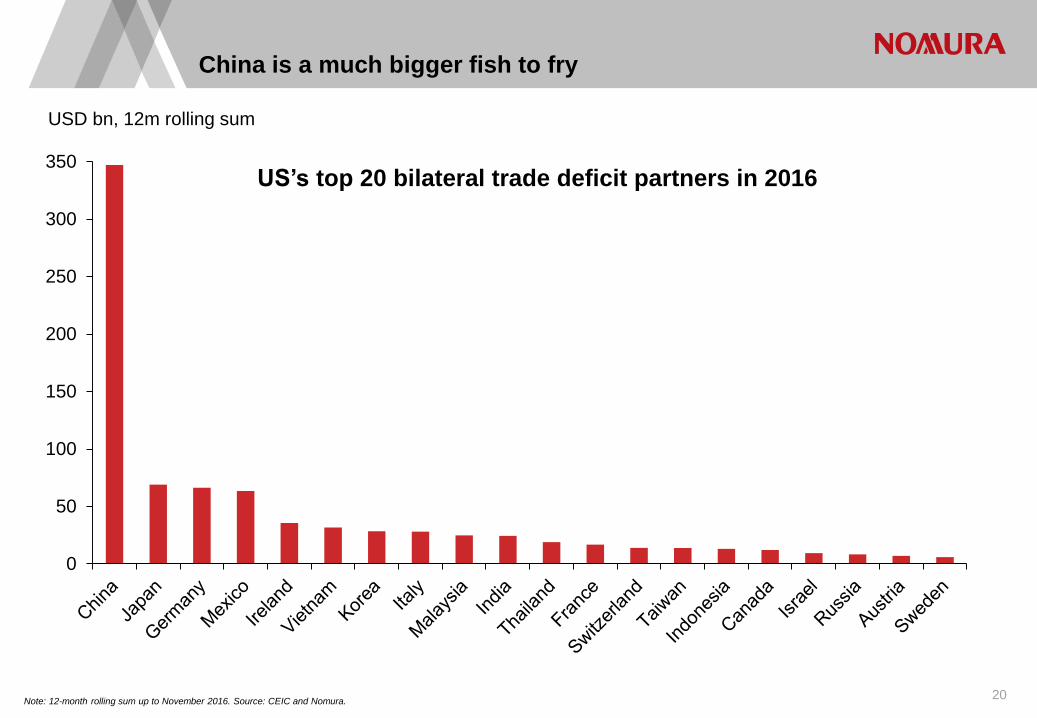
Note: 12-month rolling sum up to November 2016. Source: CEIC and Nomura.
China is a much bigger fish to fry
20
0
50
100
150
200
250
300
350
USD bn, 12m rolling sum
US’s top 20 bilateral trade deficit partners in 2016
S:\Economics\subbaraman\Stuff\Asia database\tiva - china mexico.xlsx
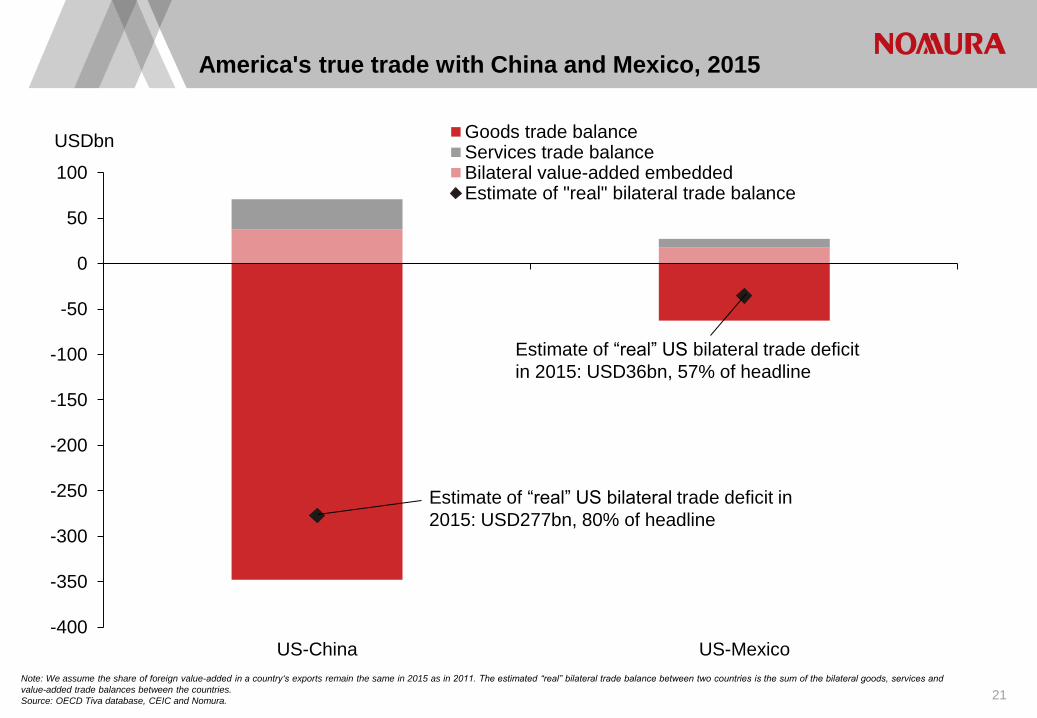
America's true trade with China and Mexico, 2015
21
Note: We assume the share of foreign value-added in a country‘s exports remain the same in 2015 as in 2011. The estimated “real” bilateral trade balance between two countries is the sum of the bilateral goods, services and
value-added trade balances between the countries.
Source: OECD Tiva database, CEIC and Nomura.
S:\Economics\subbaraman\Stuff\Asia database\tiva - china mexico.xlsx
-400
-350
-300
-250
-200
-150
-100
-50
0
50
100
US-China US-Mexico
USDbn Goods trade balanceServices trade balanceBilateral value-added embeddedEstimate of "real" bilateral trade balance
Estimate of “real” US bilateral trade deficit in
2015: USD277bn, 80% of headline
Estimate of “real” US bilateral trade deficit
in 2015: USD36bn, 57% of headline
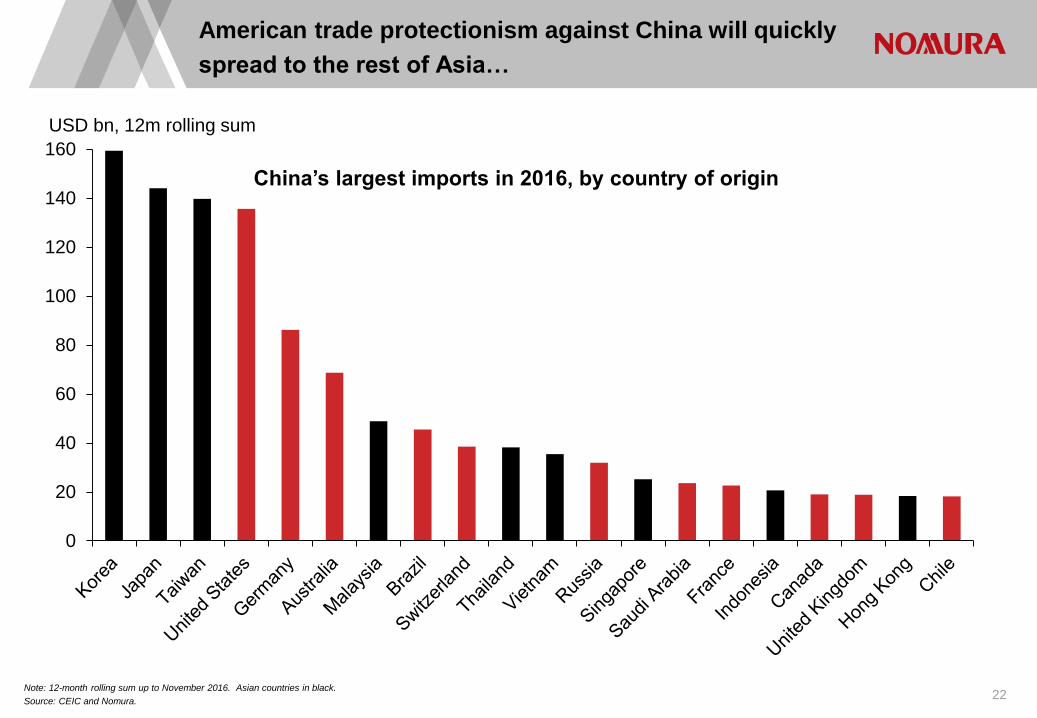
Note: 12-month rolling sum up to November 2016. Asian countries in black.
Source: CEIC and Nomura.
American trade protectionism against China will quickly
spread to the rest of Asia…
22
S:\Economics\subbaraman\Stuff\Asia database\tiva - china mexico.xlsx
0
20
40
60
80
100
120
140
160
USD bn, 12m rolling sum
China’s largest imports in 2016, by country of origin
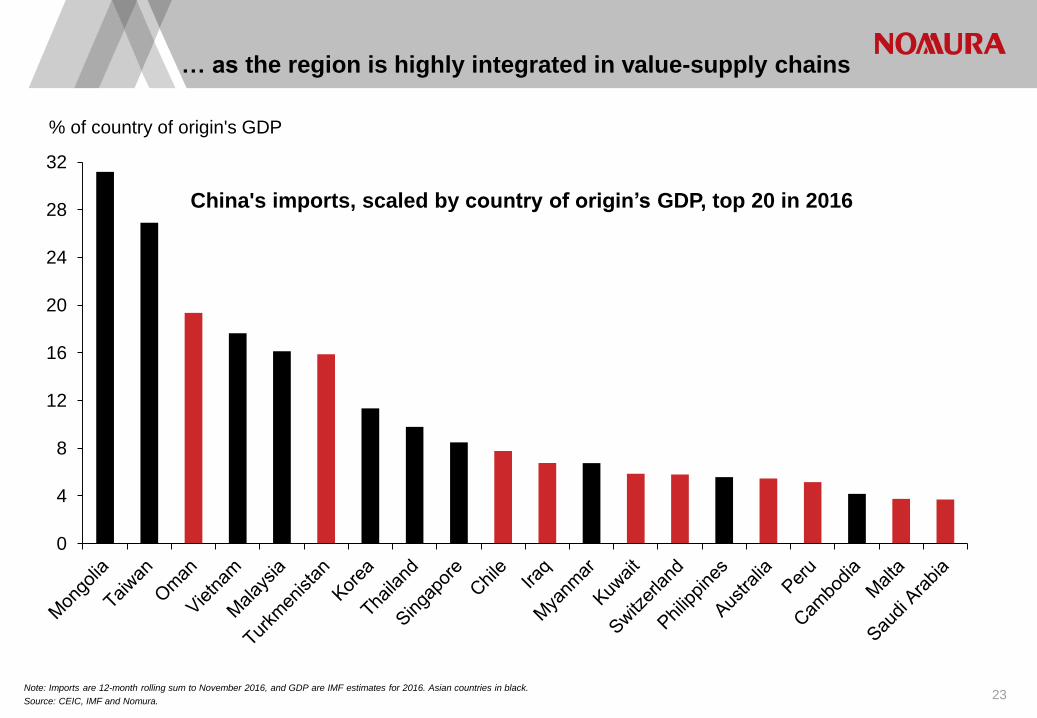
Note: Imports are 12-month rolling sum to November 2016, and GDP are IMF estimates for 2016. Asian countries in black.
Source: CEIC, IMF and Nomura.
… as the region is highly integrated in value-supply chains
23
S:\Economics\subbaraman\Stuff\Asia database\tiva - china mexico.xlsx
0
4
8
12
16
20
24
28
32
% of country of origin's GDP
China's imports, scaled by country of origin’s GDP, top 20 in 2016
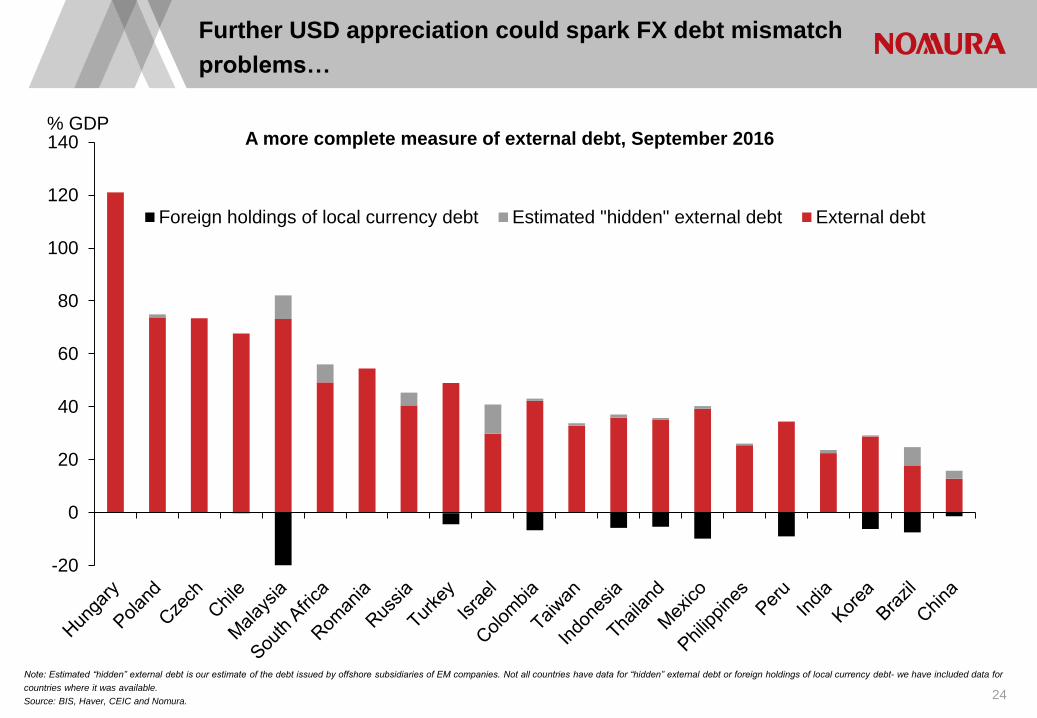
Note: Estimated “hidden” external debt is our estimate of the debt issued by offshore subsidiaries of EM companies. Not all countries have data for “hidden” external debt or foreign holdings of local currency debt- we have included data for
countries where it was available.
Source: BIS, Haver, CEIC and Nomura.
Further USD appreciation could spark FX debt mismatch
problems…
24
S:\Economics\subbaraman\Stuff\Asia database\em external debt and ca.xlsx
-20
0
20
40
60
80
100
120
140% GDP
A more complete measure of external debt, September 2016
Foreign holdings of local currency debt Estimated "hidden" external debt External debt
… which could quickly expose Asia’s outsized financial
cycle…
25
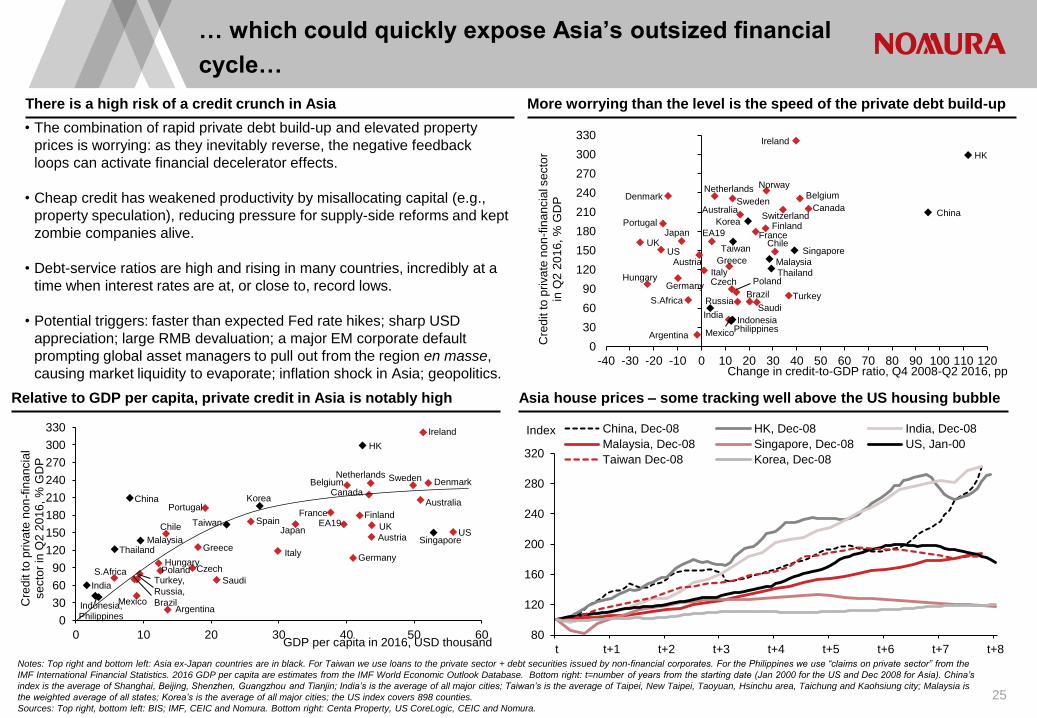
There is a high risk of a credit crunch in Asia More worrying than the level is the speed of the private debt build-up
Relative to GDP per capita, private credit in Asia is notably high Asia house prices – some tracking well above the US housing bubble
• The combination of rapid private debt build-up and elevated property
prices is worrying: as they inevitably reverse, the negative feedback
loops can activate financial decelerator effects.
• Cheap credit has weakened productivity by misallocating capital (e.g.,
property speculation), reducing pressure for supply-side reforms and kept
zombie companies alive.
• Debt-service ratios are high and rising in many countries, incredibly at a
time when interest rates are at, or close to, record lows.
• Potential triggers: faster than expected Fed rate hikes; sharp USD
appreciation; large RMB devaluation; a major EM corporate default
prompting global asset managers to pull out from the region en masse,
causing market liquidity to evaporate; inflation shock in Asia; geopolitics.
Notes: Top right and bottom left: Asia ex-Japan countries are in black. For Taiwan we use loans to the private sector + debt securities issued by non-financial corporates. For the Philippines we use “claims on private sector” from the
IMF International Financial Statistics. 2016 GDP per capita are estimates from the IMF World Economic Outlook Database. Bottom right: t=number of years from the starting date (Jan 2000 for the US and Dec 2008 for Asia). China’s
index is the average of Shanghai, Beijing, Shenzhen, Guangzhou and Tianjin; India’s is the average of all major cities; Taiwan’s is the average of Taipei, New Taipei, Taoyuan, Hsinchu area, Taichung and Kaohsiung city; Malaysia is
the weighted average of all states; Korea’s is the average of all major cities; the US index covers 898 counties.
Sources: Top right, bottom left: BIS; IMF, CEIC and Nomura. Bottom right: Centa Property, US CoreLogic, CEIC and Nomura.
Pte cdt- S:\Economics\subbaraman\Stuff\Asia database\Debt database\BIS- private and govt credit to GDP.xlsx
Debt service- S:\Economics\subbaraman\Stuff\Asia database\Debt database\BIS- debt service ratio.xlsx
Property- S:\Economics\subbaraman\Stuff\Asia database\Property indexes.xlsx
GDP per capita- probit model!!!, quarterly crisis
Argentina
Austria
Australia
Belgium
Brazil
Canada Switzerland
Czech Germany
Denmark
Finland France
UK
Greece
Hungary
Ireland
Italy
Japan Chile
Mexico
Netherlands Norway
Poland
Portugal
Russia Saudi
Sweden
Turkey
US
EA19
S.Africa
China
HK
Indonesia India
Korea
Malaysia
Singapore
Thailand
Taiwan
Philippines
0
30
60
90
120
150
180
210
240
270
300
330
-40 -30 -20 -10 0 10 20 30 40 50 60 70 80 90 100 110 120
Cre
dit to
pri
va
te n
on
-fin
an
cia
l se
cto
r in
Q2
20
16
, %
GD
P
Change in credit-to-GDP ratio, Q4 2008-Q2 2016, pp
Argentina
Austria
Australia
Belgium Canada
Czech
Germany
Denmark
Spain Finland France
UK
Greece
Hungary
Ireland
Italy
Japan Chile
Mexico
Netherlands
Poland
Portugal
Saudi
Sweden
US EA19
S.Africa
China
HK
Indonesia, Philippines
India
Korea
Malaysia Singapore Thailand
Taiwan
0
30
60
90
120
150
180
210
240
270
300
330
0 10 20 30 40 50 60
Cre
dit to
pri
va
te n
on
-fin
an
cia
l se
cto
r in
Q2 2
01
6, %
GD
P
GDP per capita in 2016, USD thousand
Turkey,
Russia,
Brazil
80
120
160
200
240
280
320
t t+1 t+2 t+3 t+4 t+5 t+6 t+7 t+8
Index China, Dec-08 HK, Dec-08 India, Dec-08
Malaysia, Dec-08 Singapore, Dec-08 US, Jan-00
Taiwan Dec-08 Korea, Dec-08
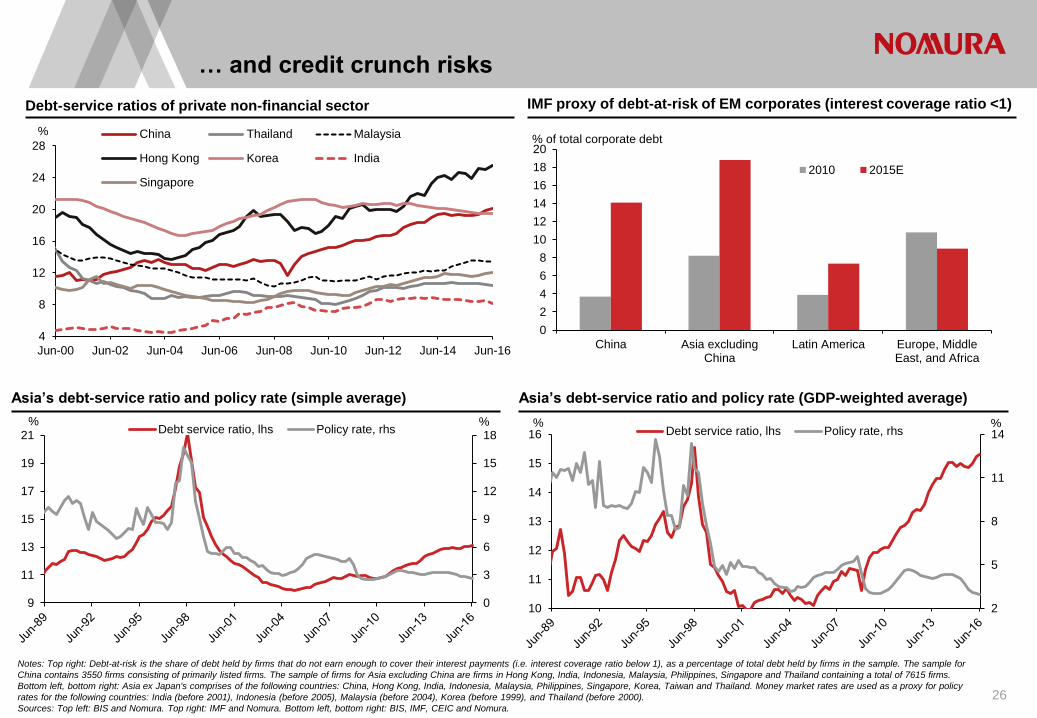
… and credit crunch risks
26
Debt-service ratios of private non-financial sector IMF proxy of debt-at-risk of EM corporates (interest coverage ratio <1)
Asia’s debt-service ratio and policy rate (simple average) Asia’s debt-service ratio and policy rate (GDP-weighted average)
Notes: Top right: Debt-at-risk is the share of debt held by firms that do not earn enough to cover their interest payments (i.e. interest coverage ratio below 1), as a percentage of total debt held by firms in the sample. The sample for
China contains 3550 firms consisting of primarily listed firms. The sample of firms for Asia excluding China are firms in Hong Kong, India, Indonesia, Malaysia, Philippines, Singapore and Thailand containing a total of 7615 firms.
Bottom left, bottom right: Asia ex Japan's comprises of the following countries: China, Hong Kong, India, Indonesia, Malaysia, Philippines, Singapore, Korea, Taiwan and Thailand. Money market rates are used as a proxy for policy
rates for the following countries: India (before 2001), Indonesia (before 2005), Malaysia (before 2004), Korea (before 1999), and Thailand (before 2000).
Sources: Top left: BIS and Nomura. Top right: IMF and Nomura. Bottom left, bottom right: BIS, IMF, CEIC and Nomura.
Pte cdt- S:\Economics\subbaraman\Stuff\Asia database\Debt database\BIS- private and govt credit to GDP.xlsx
Debt service- S:\Economics\subbaraman\Stuff\Asia database\Debt database\BIS- debt service ratio.xlsx
Property- S:\Economics\subbaraman\Stuff\Asia database\Property indexes.xlsx
0
2
4
6
8
10
12
14
16
18
20
China Asia excludingChina
Latin America Europe, MiddleEast, and Africa
% of total corporate debt
2010 2015E
Debt at risk, debt service ratio- Early warning indicators (non-recursive, domestic demand charts, quarterly crises).xlsx
0
3
6
9
12
15
18
9
11
13
15
17
19
21% %
Debt service ratio, lhs Policy rate, rhs
4
8
12
16
20
24
28
Jun-00 Jun-02 Jun-04 Jun-06 Jun-08 Jun-10 Jun-12 Jun-14 Jun-16
% China Thailand Malaysia
Hong Kong Korea India
Singapore
2
5
8
11
14
10
11
12
13
14
15
16% %
Debt service ratio, lhs Policy rate, rhs
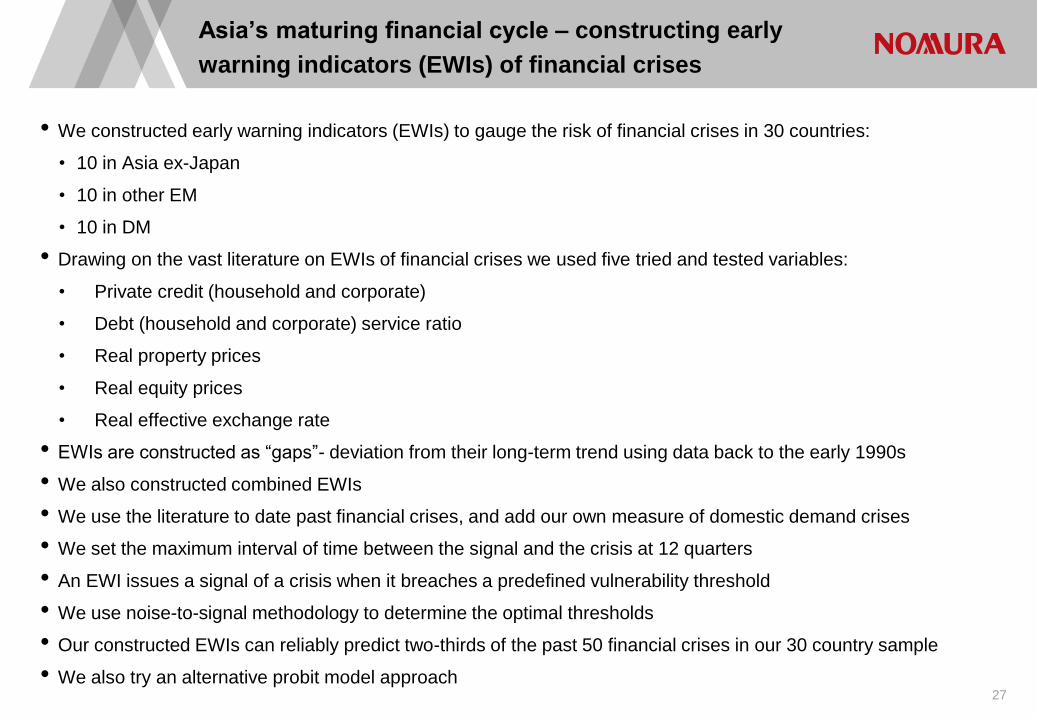
• We constructed early warning indicators (EWIs) to gauge the risk of financial crises in 30 countries:
• 10 in Asia ex-Japan
• 10 in other EM
• 10 in DM
• Drawing on the vast literature on EWIs of financial crises we used five tried and tested variables:
• Private credit (household and corporate)
• Debt (household and corporate) service ratio
• Real property prices
• Real equity prices
• Real effective exchange rate
• EWIs are constructed as “gaps”- deviation from their long-term trend using data back to the early 1990s
• We also constructed combined EWIs
• We use the literature to date past financial crises, and add our own measure of domestic demand crises
• We set the maximum interval of time between the signal and the crisis at 12 quarters
• An EWI issues a signal of a crisis when it breaches a predefined vulnerability threshold
• We use noise-to-signal methodology to determine the optimal thresholds
• Our constructed EWIs can reliably predict two-thirds of the past 50 financial crises in our 30 country sample
• We also try an alternative probit model approach
Asia’s maturing financial cycle – constructing early
warning indicators (EWIs) of financial crises
27
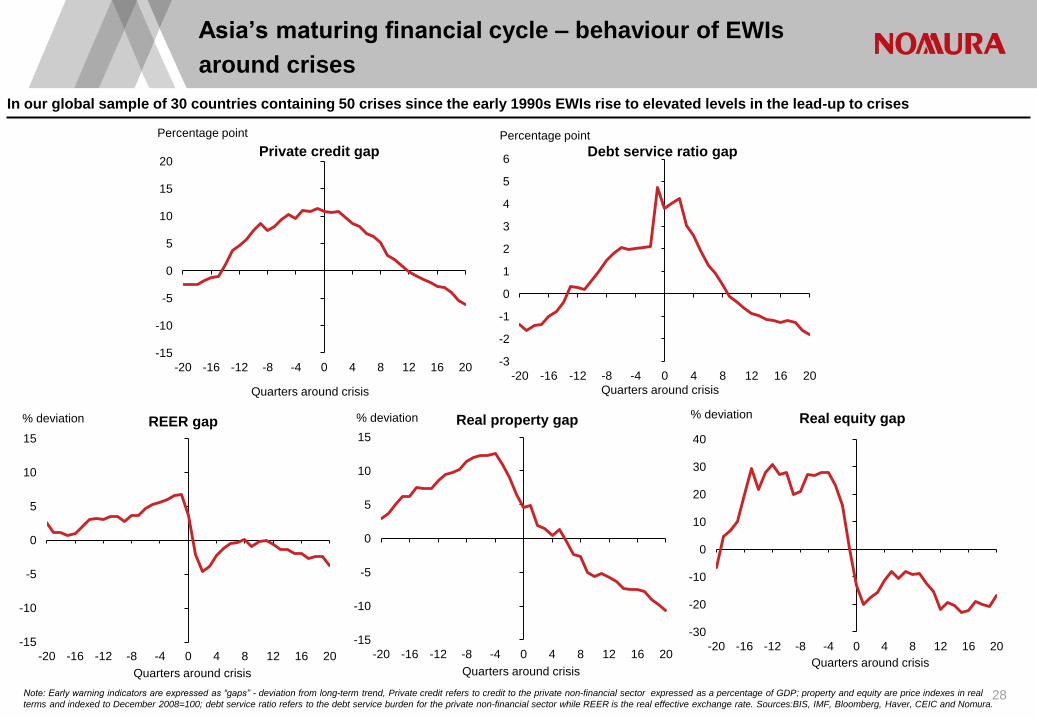
Asia’s maturing financial cycle – behaviour of EWIs
around crises
Note: Early warning indicators are expressed as “gaps” - deviation from long-term trend, Private credit refers to credit to the private non-financial sector expressed as a percentage of GDP; property and equity are price indexes in real
terms and indexed to December 2008=100; debt service ratio refers to the debt service burden for the private non-financial sector while REER is the real effective exchange rate. Sources:BIS, IMF, Bloomberg, Haver, CEIC and Nomura. 28
-15
-10
-5
0
5
10
15
20
-20 -16 -12 -8 -4 0 4 8 12 16 20
Percentage point
Private credit gap
Quarters around crisis
-15
-10
-5
0
5
10
15
-20 -16 -12 -8 -4 0 4 8 12 16 20
% deviation REER gap
Quarters around crisis
-3
-2
-1
0
1
2
3
4
5
6
-20 -16 -12 -8 -4 0 4 8 12 16 20
Percentage point
Debt service ratio gap
Quarters around crisis
-15
-10
-5
0
5
10
15
-20 -16 -12 -8 -4 0 4 8 12 16 20
% deviation Real property gap
Quarters around crisis
-30
-20
-10
0
10
20
30
40
-20 -16 -12 -8 -4 0 4 8 12 16 20
% deviation Real equity gap
Quarters around crisis
In our global sample of 30 countries containing 50 crises since the early 1990s EWIs rise to elevated levels in the lead-up to crises
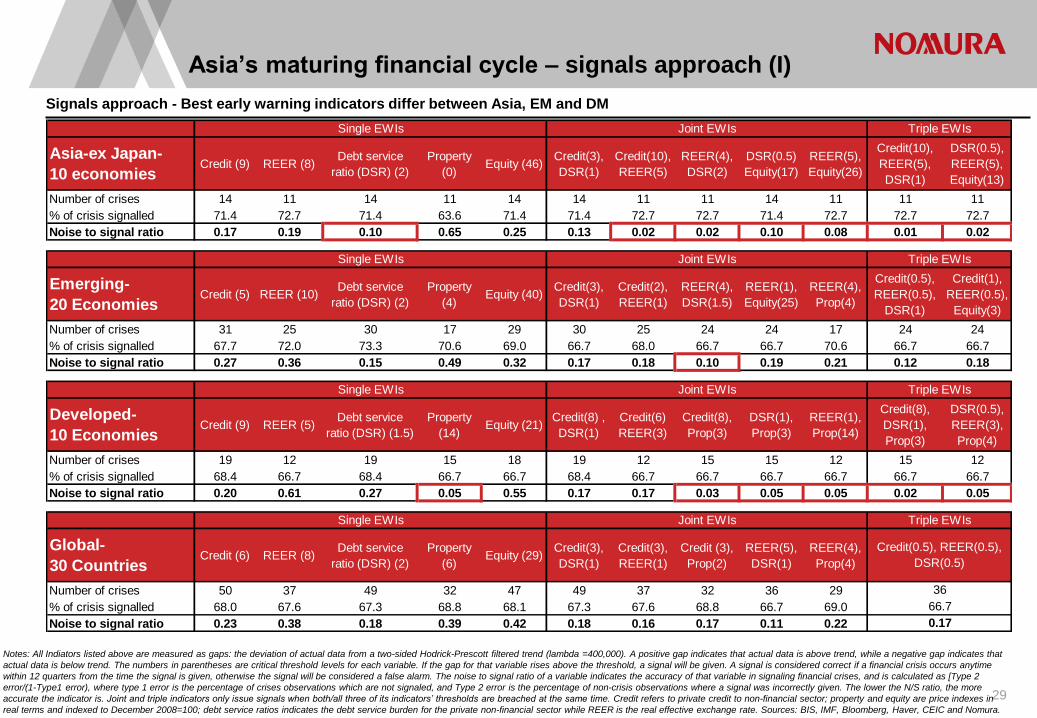
Asia’s maturing financial cycle – signals approach (I)
29
Notes: All Indiators listed above are measured as gaps: the deviation of actual data from a two-sided Hodrick-Prescott filtered trend (lambda =400,000). A positive gap indicates that actual data is above trend, while a negative gap indicates that
actual data is below trend. The numbers in parentheses are critical threshold levels for each variable. If the gap for that variable rises above the threshold, a signal will be given. A signal is considered correct if a financial crisis occurs anytime
within 12 quarters from the time the signal is given, otherwise the signal will be considered a false alarm. The noise to signal ratio of a variable indicates the accuracy of that variable in signaling financial crises, and is calculated as [Type 2
error/(1-Type1 error), where type 1 error is the percentage of crises observations which are not signaled, and Type 2 error is the percentage of non-crisis observations where a signal was incorrectly given. The lower the N/S ratio, the more
accurate the indicator is. Joint and triple indicators only issue signals when both/all three of its indicators’ thresholds are breached at the same time. Credit refers to private credit to non-financial sector; property and equity are price indexes in
real terms and indexed to December 2008=100; debt service ratios indicates the debt service burden for the private non-financial sector while REER is the real effective exchange rate. Sources: BIS, IMF, Bloomberg, Haver, CEIC and Nomura.
Signals approach - Best early warning indicators differ between Asia, EM and DM
Early warning indicators (non-recursive, domestic demand charts, quarterly crises).xlsx
Asia-ex Japan-
10 economiesCredit (9) REER (8)
Debt service
ratio (DSR) (2)
Property
(0)Equity (46)
Credit(3),
DSR(1)
Credit(10),
REER(5)
REER(4),
DSR(2)
DSR(0.5)
Equity(17)
REER(5),
Equity(26)
Credit(10),
REER(5),
DSR(1)
DSR(0.5),
REER(5),
Equity(13)
Number of crises 14 11 14 11 14 14 11 11 14 11 11 11
% of crisis signalled 71.4 72.7 71.4 63.6 71.4 71.4 72.7 72.7 71.4 72.7 72.7 72.7
Noise to signal ratio 0.17 0.19 0.10 0.65 0.25 0.13 0.02 0.02 0.10 0.08 0.01 0.02
Emerging-
20 EconomiesCredit (5) REER (10)
Debt service
ratio (DSR) (2)
Property
(4)Equity (40)
Credit(3),
DSR(1)
Credit(2),
REER(1)
REER(4),
DSR(1.5)
REER(1),
Equity(25)
REER(4),
Prop(4)
Credit(0.5),
REER(0.5),
DSR(1)
Credit(1),
REER(0.5),
Equity(3)
Number of crises 31 25 30 17 29 30 25 24 24 17 24 24
% of crisis signalled 67.7 72.0 73.3 70.6 69.0 66.7 68.0 66.7 66.7 70.6 66.7 66.7
Noise to signal ratio 0.27 0.36 0.15 0.49 0.32 0.17 0.18 0.10 0.19 0.21 0.12 0.18
Developed-
10 Economies Credit (9) REER (5)
Debt service
ratio (DSR) (1.5)
Property
(14)Equity (21)
Credit(8) ,
DSR(1)
Credit(6)
REER(3)
Credit(8),
Prop(3)
DSR(1),
Prop(3)
REER(1),
Prop(14)
Credit(8),
DSR(1),
Prop(3)
DSR(0.5),
REER(3),
Prop(4)
Number of crises 19 12 19 15 18 19 12 15 15 12 15 12
% of crisis signalled 68.4 66.7 68.4 66.7 66.7 68.4 66.7 66.7 66.7 66.7 66.7 66.7
Noise to signal ratio 0.20 0.61 0.27 0.05 0.55 0.17 0.17 0.03 0.05 0.05 0.02 0.05
Global-
30 CountriesCredit (6) REER (8)
Debt service
ratio (DSR) (2)
Property
(6)Equity (29)
Credit(3),
DSR(1)
Credit(3),
REER(1)
Credit (3),
Prop(2)
REER(5),
DSR(1)
REER(4),
Prop(4)
Number of crises 50 37 49 32 47 49 37 32 36 29
% of crisis signalled 68.0 67.6 67.3 68.8 68.1 67.3 67.6 68.8 66.7 69.0
Noise to signal ratio 0.23 0.38 0.18 0.39 0.42 0.18 0.16 0.17 0.11 0.22 0.17
Single EWIs Joint EWIs Triple EWIs
Single EWIs Joint EWIs Triple EWIs
Credit(0.5), REER(0.5),
DSR(0.5)
36
66.7
Single EWIs Joint EWIs Triple EWIs
Single EWIs Joint EWIs Triple EWIs
Asia’s maturing financial cycle – signals approach (II)
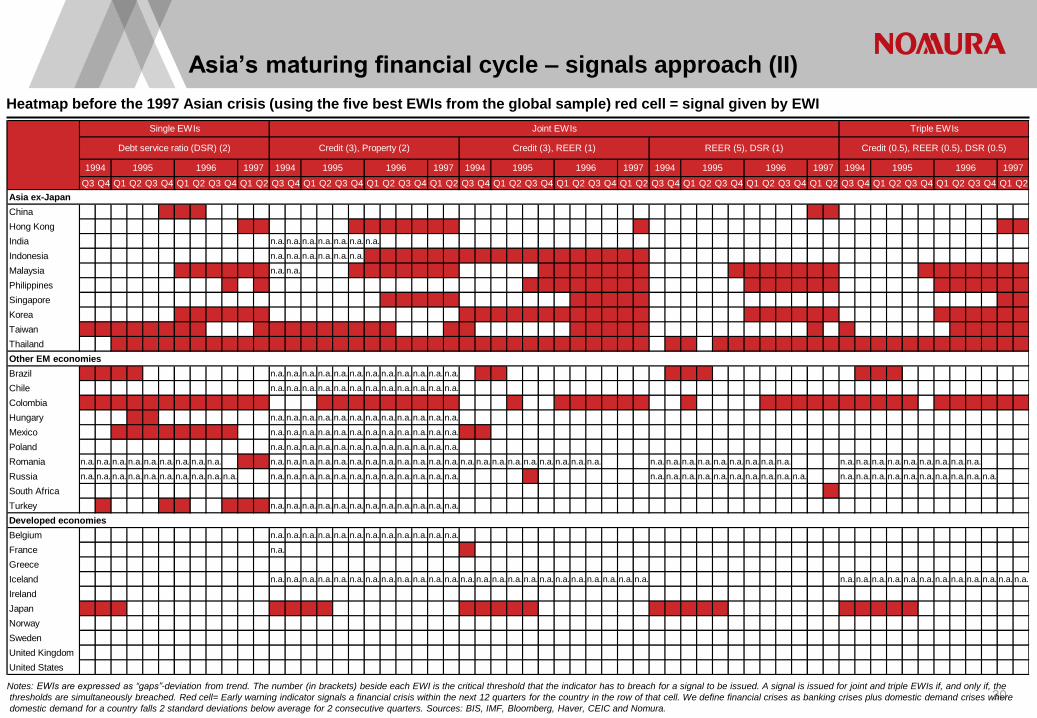
30 Notes: EWIs are expressed as “gaps”-deviation from trend. The number (in brackets) beside each EWI is the critical threshold that the indicator has to breach for a signal to be issued. A signal is issued for joint and triple EWIs if, and only if, the
thresholds are simultaneously breached. Red cell= Early warning indicator signals a financial crisis within the next 12 quarters for the country in the row of that cell. We define financial crises as banking crises plus domestic demand crises where
domestic demand for a country falls 2 standard deviations below average for 2 consecutive quarters. Sources: BIS, IMF, Bloomberg, Haver, CEIC and Nomura.
Heatmap before the 1997 Asian crisis (using the five best EWIs from the global sample) red cell = signal given by EWI
Early warning indicators (non-recursive, domestic demand charts, quarterly crises).xlsx
Q3 Q4 Q1 Q2 Q3 Q4 Q1 Q2 Q3 Q4 Q1 Q2 Q3 Q4 Q1 Q2 Q3 Q4 Q1 Q2 Q3 Q4 Q1 Q2 Q3 Q4 Q1 Q2 Q3 Q4 Q1 Q2 Q3 Q4 Q1 Q2 Q3 Q4 Q1 Q2 Q3 Q4 Q1 Q2 Q3 Q4 Q1 Q2 Q3 Q4 Q1 Q2 Q3 Q4 Q1 Q2 Q3 Q4 Q1 Q2
Asia ex-Japan
China 1.7 1.4 1.7 1.4 1.7 2.1 2.0 2.3 0.9 0.6 1.1 1.1 off off off off off off off off off off off off off off off off off off off off off off off off off off off off off off off off off off on on off off off off off off off off off off off off
Hong Kong ## ## 0.1 0.6 0.6 0.7 0.6 1.1 1.2 1.2 2.2 2.9 off off off off off on on on on on on on off off off off off off off off off off off on off off off off off off off off off off off off off off off off off off off off off off on on
India ## ## ## ## ## 0.0 0.3 0.2 0.2 ## ## ## n.a. n.a. n.a. n.a. n.a. n.a. n.a. off off off off off off off off off off off off off off off off off off off off off off off off off off off off off off off off off off off off off off off off off
Indonesia ## ## ## ## ## ## ## ## ## ## ## ## n.a. n.a. n.a. n.a. n.a. n.a. on on on on on on on on on on on on on on on on on on off off off off off off off off off off off off off off off off off off off off off off off off
Malaysia ## ## ## ## 0.1 1.4 2.1 2.9 3.6 4.6 5.5 7.1 n.a. n.a. off off off on on on on on on on off off off off off on on on on on on on off off off off off on on on on on on on off off off off off on on on on on on on
Philippines ## ## ## 0.1 ## 0.4 1.0 1.4 1.5 2.3 2.0 2.1 off off off off off off off off off off off off off off off off on on on on on on on on off off off off off off on on on on on on off off off off off off on on on on on on
Singapore ## ## ## ## ## 0.0 0.0 0.1 0.3 0.5 0.5 0.5 off off off off off off off on on on on on off off off off off off off on on on on on off off off off off off off off off off off off off off off off off off off off off off on on
Korea ## ## 0.0 0.0 0.0 ## 2.7 3.0 3.5 3.5 4.8 4.9 off off off off off off off off off off off off on on on on on on on on on on on on off off off off off off on on on on on on off off off off off off on on on on on on
Taiwan 2.9 3.0 3.0 3.0 3.0 2.5 2.3 2.2 1.9 1.9 1.7 2.1 on on on on on on on on off off off on on off off off off off off on on on on on off off off off off off off off off off on off on off off off off off off on on on on on
Thailand 0.6 1.7 2.4 4.2 4.6 5.4 5.9 5.8 5.4 5.5 5.4 5.0 on on on on on on on on on on on on on on on on on on on on on on on on off on on off on on on on on on on on on on on on on on on on on on on on
Other EM economies
Brazil ## ## 5.2 4.6 ## ## ## ## ## ## ## ## n.a. n.a. n.a. n.a. n.a. n.a. n.a. n.a. n.a. n.a. n.a. n.a. off on on off off off off off off off off off off on on on off off off off off off off off off on on on off off off off off off off off
Chile ## ## ## ## ## ## ## ## ## ## ## ## n.a. n.a. n.a. n.a. n.a. n.a. n.a. n.a. n.a. n.a. n.a. n.a. off off off off off off off off off off off off off off off off off off off off off off off off off off off off off off off off off off off off
Colombia 2.2 3.0 3.1 3.5 2.5 3.1 4.1 4.3 3.7 3.3 2.7 2.0 off off off on on on on on on on on on off off off on off off on on on on on on off off on off off off off on on on on on on on on on on off on on on on on on
Hungary 0.2 0.8 1.8 2.4 2.2 0.5 ## ## ## ## ## ## n.a. n.a. n.a. n.a. n.a. n.a. n.a. n.a. n.a. n.a. n.a. n.a. off off off off off off off off off off off off off off off off off off off off off off off off off off off off off off off off off off off off
Mexico ## ## ## ## ## ## ## 5.0 2.8 2.4 ## ## n.a. n.a. n.a. n.a. n.a. n.a. n.a. n.a. n.a. n.a. n.a. n.a. on on off off off off off off off off off off off off off off off off off off off off off off off off off off off off off off off off off off
Poland ## ## ## ## ## ## ## ## ## ## ## ## n.a. n.a. n.a. n.a. n.a. n.a. n.a. n.a. n.a. n.a. n.a. n.a. off off off off off off off off off off off off off off off off off off off off off off off off off off off off off off off off off off off off
Romania n.a. n.a. n.a. n.a. n.a. n.a. n.a. n.a. n.a. ## 7.3 3.8 n.a. n.a. n.a. n.a. n.a. n.a. n.a. n.a. n.a. n.a. n.a. n.a. n.a. n.a. n.a. n.a. n.a. n.a. n.a. n.a. n.a. off off off n.a. n.a. n.a. n.a. n.a. n.a. n.a. n.a. n.a. off off off n.a. n.a. n.a. n.a. n.a. n.a. n.a. n.a. n.a. off off off
Russia n.a. n.a. n.a. n.a. n.a. n.a. n.a. n.a. n.a. n.a. 0.8 ## n.a. n.a. n.a. n.a. n.a. n.a. n.a. n.a. n.a. n.a. n.a. n.a. off off off off on off off off off off off off n.a. n.a. n.a. n.a. n.a. n.a. n.a. n.a. n.a. n.a. off off n.a. n.a. n.a. n.a. n.a. n.a. n.a. n.a. n.a. n.a. off off
South Africa ## ## ## ## ## 0.0 0.2 1.1 0.8 1.3 1.4 1.5 off off off off off off off off off off off off off off off off off off off off off off off off off off off off off off off off off off off on off off off off off off off off off off off off
Turkey ## 2.8 0.6 ## ## 8.0 9.5 1.0 ## 3.6 7.1 6.5 n.a. n.a. n.a. n.a. n.a. n.a. n.a. n.a. n.a. n.a. n.a. n.a. off off off off off off off off off off off off off off off off off off off off off off off off off off off off off off off off off off off off
Developed economies
Belgium 0.2 ## ## ## ## ## ## ## ## ## ## ## n.a. n.a. n.a. n.a. n.a. n.a. n.a. n.a. n.a. n.a. n.a. n.a. off off off off off off off off off off off off off off off off off off off off off off off off off off off off off off off off off off off off
France ## ## ## ## ## ## ## ## ## ## ## ## n.a. off off off off off off off off off off off on off off off off off off off off off off off off off off off off off off off off off off off off off off off off off off off off off off off
Greece 0.4 0.5 0.2 ## ## ## ## ## ## ## ## ## off off off off off off off off off off off off off off off off off off off off off off off off off off off off off off off off off off off off off off off off off off off off off off off off
Iceland ## ## ## ## ## ## ## ## ## ## ## ## n.a. n.a. n.a. n.a. n.a. n.a. n.a. n.a. n.a. n.a. n.a. n.a. n.a. n.a. n.a. n.a. n.a. n.a. n.a. n.a. n.a. n.a. n.a. n.a. off off off off off off off off off off off off n.a. n.a. n.a. n.a. n.a. n.a. n.a. n.a. n.a. n.a. n.a. n.a.
Ireland ## ## ## ## ## ## ## ## ## ## ## ## off off off off off off off off off off off off off off off off off off off off off off off off off off off off off off off off off off off off off off off off off off off off off off off off
Japan 2.0 2.5 2.3 1.7 1.2 0.7 0.2 ## ## ## ## ## on on on on off off off off off off off off on on on on on off off off off off off off on on on on on off off off off off off off on on on on on off off off off off off off
Norway ## ## ## ## ## ## ## ## ## ## ## ## off off off off off off off off off off off off off off off off off off off off off off off off off off off off off off off off off off off off off off off off off off off off off off off off
Sweden 0.2 ## ## ## ## ## ## ## ## ## ## ## off off off off off off off off off off off off off off off off off off off off off off off off off off off off off off off off off off off off off off off off off off off off off off off off
United Kingdom ## ## ## ## ## ## ## ## ## ## ## ## off off off off off off off off off off off off off off off off off off off off off off off off off off off off off off off off off off off off off off off off off off off off off off off off
United States ## ## ## ## ## ## ## ## ## ## ## ## off off off off off off off off off off off off off off off off off off off off off off off off off off off off off off off off off off off off off off off off off off off off off off off off
1994
Credit (0.5), REER (0.5), DSR (0.5)
Triple EWIsJoint EWIs
1994 1995 1996 1997 1994 1995 1996
Debt service ratio (DSR) (2)
Single EWIs
Credit (3), Property (2) Credit (3), REER (1) REER (5), DSR (1)
1997 1994 1995 1996 1997 19971995 1996 1997 1994 1995 1996
Asia’s maturing financial cycle – signals approach (III)
31
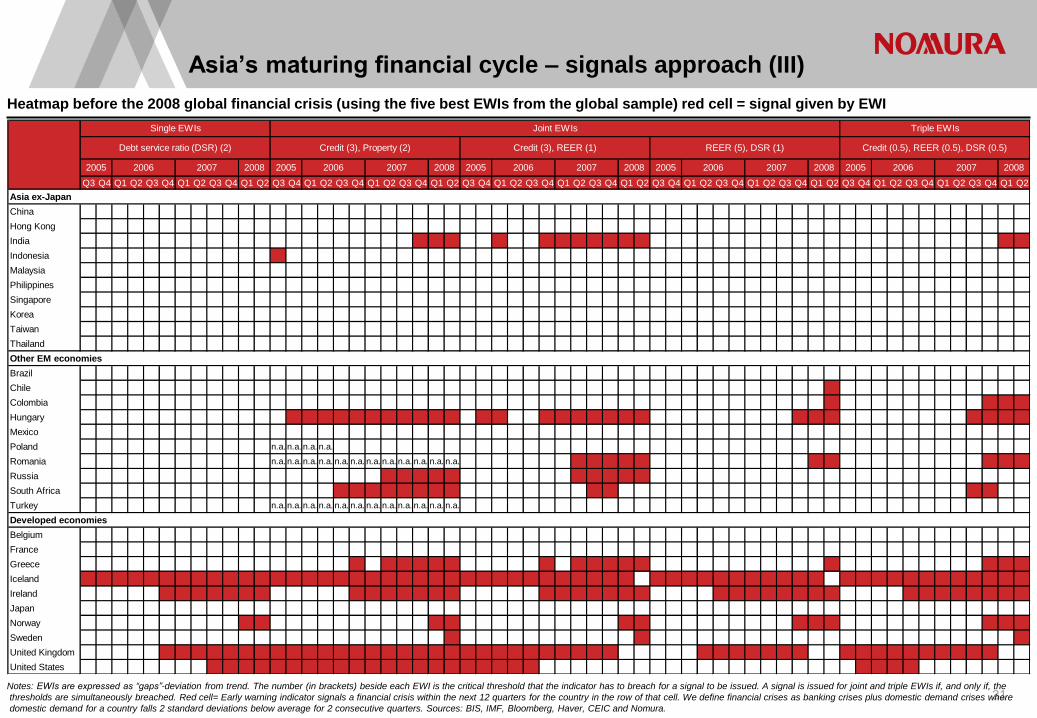
Heatmap before the 2008 global financial crisis (using the five best EWIs from the global sample) red cell = signal given by EWI
Early warning indicators (non-recursive, domestic demand charts, quarterly crises).xlsx
Notes: EWIs are expressed as “gaps”-deviation from trend. The number (in brackets) beside each EWI is the critical threshold that the indicator has to breach for a signal to be issued. A signal is issued for joint and triple EWIs if, and only if, the
thresholds are simultaneously breached. Red cell= Early warning indicator signals a financial crisis within the next 12 quarters for the country in the row of that cell. We define financial crises as banking crises plus domestic demand crises where
domestic demand for a country falls 2 standard deviations below average for 2 consecutive quarters. Sources: BIS, IMF, Bloomberg, Haver, CEIC and Nomura.
Q3 Q4 Q1 Q2 Q3 Q4 Q1 Q2 Q3 Q4 Q1 Q2 Q3 Q4 Q1 Q2 Q3 Q4 Q1 Q2 Q3 Q4 Q1 Q2 Q3 Q4 Q1 Q2 Q3 Q4 Q1 Q2 Q3 Q4 Q1 Q2 Q3 Q4 Q1 Q2 Q3 Q4 Q1 Q2 Q3 Q4 Q1 Q2 Q3 Q4 Q1 Q2 Q3 Q4 Q1 Q2 Q3 Q4 Q1 Q2
Asia ex-Japan
China ## ## ## ## ## ## ## ## ## ## ## ## off off off off off off off off off off off off off off off off off off off off off off off off off off off off off off off off off off off off off off off off off off off off off off off off
Hong Kong ## ## ## ## ## ## ## 0.4 1.0 0.3 0.3 0.4 off off off off off off off off off off off off off off off off off off off off off off off off off off off off off off off off off off off off off off off off off off off off off off off off
India ## ## ## ## ## ## 0.4 0.2 0.4 0.4 1.0 0.8 off off off off off off off off off on on on off off on off off on on on on on on on off off off off off off off off off off off off off off off off off off off off off off on on
Indonesia 0.2 0.0 ## ## ## ## ## ## ## ## ## ## on off off off off off off off off off off off off off off off off off off off off off off off off off off off off off off off off off off off off off off off off off off off off off off off
Malaysia ## ## ## ## ## ## ## ## ## ## ## ## off off off off off off off off off off off off off off off off off off off off off off off off off off off off off off off off off off off off off off off off off off off off off off off off
Philippines 0.2 0.1 ## 0.0 ## ## ## ## ## ## ## ## off off off off off off off off off off off off off off off off off off off off off off off off off off off off off off off off off off off off off off off off off off off off off off off off
Singapore ## ## ## ## ## ## ## ## ## ## ## ## off off off off off off off off off off off off off off off off off off off off off off off off off off off off off off off off off off off off off off off off off off off off off off off off
Korea ## ## ## ## ## ## ## ## ## ## ## ## off off off off off off off off off off off off off off off off off off off off off off off off off off off off off off off off off off off off off off off off off off off off off off off off
Taiwan ## ## ## ## ## ## ## ## ## ## ## ## off off off off off off off off off off off off off off off off off off off off off off off off off off off off off off off off off off off off off off off off off off off off off off off off
Thailand ## ## ## ## 0.1 0.3 0.2 0.1 ## ## ## ## off off off off off off off off off off off off off off off off off off off off off off off off off off off off off off off off off off off off off off off off off off off off off off off off
Other EM economies
Brazil ## ## ## ## ## ## ## ## ## ## ## ## off off off off off off off off off off off off off off off off off off off off off off off off off off off off off off off off off off off off off off off off off off off off off off off off
Chile ## ## ## ## ## ## ## ## ## 0.0 0.3 1.6 off off off off off off off off off off off off off off off off off off off off off off off off off off off off off off off off off off off on off off off off off off off off off off off off
Colombia ## ## ## ## ## ## ## ## 0.3 0.8 0.8 1.1 off off off off off off off off off off off off off off off off off off off off off off off off off off off off off off off off off off off on off off off off off off off off off on on on
Hungary 0.0 ## ## 0.0 ## ## ## 0.3 0.8 1.4 1.7 1.2 off on on on on on on on on on on on off on on off off on on on on on on on off off off off off off off off off on on on off off off off off off off off on on on on
Mexico ## ## ## ## ## ## ## ## ## 0.1 0.1 0.1 off off off off off off off off off off off off off off off off off off off off off off off off off off off off off off off off off off off off off off off off off off off off off off off off
Poland ## ## ## ## ## ## ## ## ## ## ## ## n.a. n.a. n.a. n.a. off off off off off off off off off off off off off off off off off off off off off off off off off off off off off off off off off off off off off off off off off off off off
Romania ## ## ## ## ## ## ## ## 0.1 0.6 1.1 1.4 n.a. n.a. n.a. n.a. n.a. n.a. n.a. n.a. n.a. n.a. n.a. n.a. off off off off off off off on on on on on off off off off off off off off off off on on off off off off off off off off off on on on
Russia ## ## ## ## ## ## ## ## ## ## ## 0.0 off off off off off off off on on on on on off off off off off off off on on on on on off off off off off off off off off off off off off off off off off off off off off off off off
South Africa ## ## ## ## ## ## ## 0.3 0.6 0.9 1.6 1.8 off off off off on on on on on on on on off off off off off off off off on on off off off off off off off off off off off off off off off off off off off off off off on on off off
Turkey ## ## ## ## ## ## ## ## ## ## ## ## n.a. n.a. n.a. n.a. n.a. n.a. n.a. n.a. n.a. n.a. n.a. n.a. off off off off off off off off off off off off off off off off off off off off off off off off off off off off off off off off off off off off
Developed economies
Belgium ## ## ## ## ## ## ## ## ## ## ## 0.0 off off off off off off off off off off off off off off off off off off off off off off off off off off off off off off off off off off off off off off off off off off off off off off off off
France ## ## ## ## ## ## ## ## ## 0.0 0.1 0.3 off off off off off off off off off off off off off off off off off off off off off off off off off off off off off off off off off off off off off off off off off off off off off off off off
Greece ## ## ## ## ## ## ## 0.0 0.3 0.6 0.9 1.2 off off off off off on off on on on on on off off off off off on off on on on on on off off off off off off off off off off off on off off off off off off off off off on on on
Iceland ## ## ## ## ## ## ## ## ## ## ## ## on on on on on on on on on on on on on on on on on on on on on on on off on on on on on on on on on on on off on on on on on on on on on on on on
Ireland ## ## ## ## 1.4 2.2 2.7 3.1 4.0 4.0 5.3 6.3 off off off off off on on on on on on on off off off off off on on on on on on on off off off off on on on on on on on on off off off off on on on on on on on on
Japan ## ## ## ## ## ## ## ## ## ## ## ## off off off off off off off off off off off off off off off off off off off off off off off off off off off off off off off off off off off off off off off off off off off off off off off off
Norway ## ## ## ## ## ## ## ## 0.3 1.4 2.6 3.5 off off off off off off off off off off on on off off off off off off off off off off on on off off off off off off off off off on on on off off off off off off off off off on on on
Sweden ## ## ## ## ## ## ## ## ## ## ## 0.9 off off off off off off off off off off off on off off off off off off off off off off off on off off off off off off off off off off off off off off off off off off off off off off off on
United Kingdom 0.8 0.9 1.0 1.3 1.9 2.0 2.0 2.1 2.8 2.9 3.1 2.8 on on on on on on on on on on on on on on on on on on on on on on off off off off off on on on on on on on off off on on on on on on on on on on off off
United States 0.3 0.5 0.7 0.9 1.1 1.4 1.7 2.0 2.2 2.3 2.4 2.1 on on on on on on on on on on on on on on on on on off off off off off off off off off off off off off off off off off off off off on on on on off off off off off off off
2008 20082006 2007 2008 2005 2006 20072007 2008 2005 2006 2007
Single EWIs Joint EWIs Triple EWIs
Debt service ratio (DSR) (2) Credit (3), Property (2) Credit (3), REER (1) REER (5), DSR (1) Credit (0.5), REER (0.5), DSR (0.5)
2005 20052006 2007 2008 2005 2006
Asia’s maturing financial cycle – signals approach (IV)
32
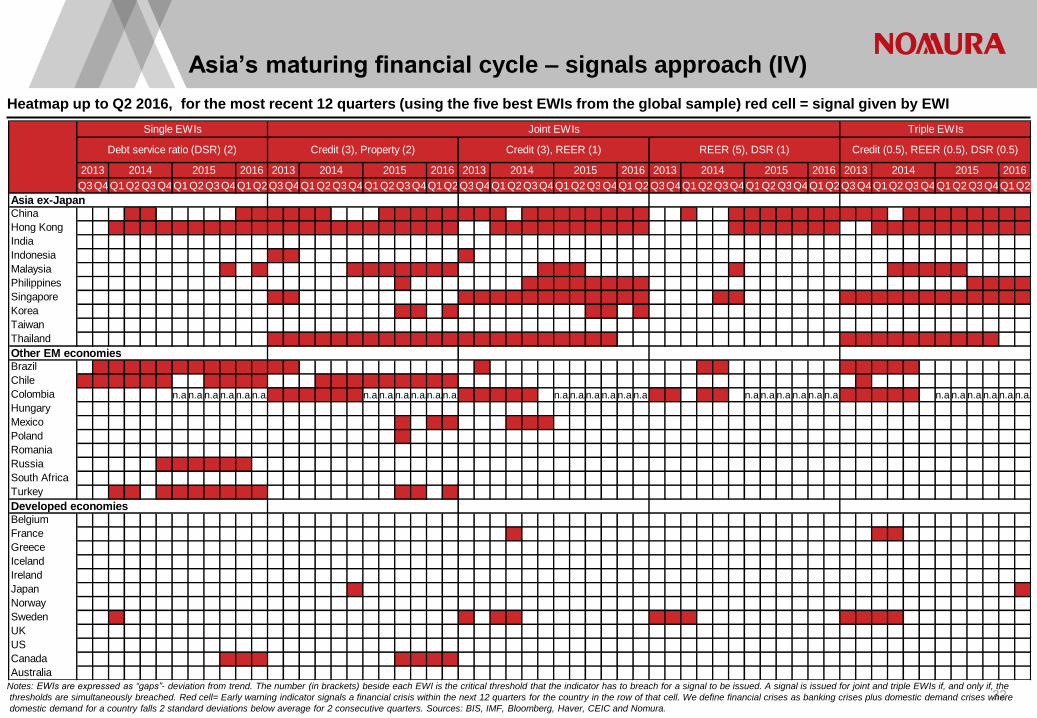
Heatmap up to Q2 2016, for the most recent 12 quarters (using the five best EWIs from the global sample) red cell = signal given by EWI
Early warning indicators (non-recursive, domestic demand charts, quarterly crises).xlsx
Notes: EWIs are expressed as “gaps”- deviation from trend. The number (in brackets) beside each EWI is the critical threshold that the indicator has to breach for a signal to be issued. A signal is issued for joint and triple EWIs if, and only if, the
thresholds are simultaneously breached. Red cell= Early warning indicator signals a financial crisis within the next 12 quarters for the country in the row of that cell. We define financial crises as banking crises plus domestic demand crises where
domestic demand for a country falls 2 standard deviations below average for 2 consecutive quarters. Sources: BIS, IMF, Bloomberg, Haver, CEIC and Nomura.
Q3 Q4 Q1 Q2 Q3 Q4 Q1 Q2 Q3 Q4 Q1 Q2 Q3 Q4 Q1 Q2 Q3 Q4 Q1 Q2 Q3 Q4 Q1 Q2 Q3 Q4 Q1 Q2 Q3 Q4 Q1 Q2 Q3 Q4 Q1 Q2 Q3 Q4 Q1 Q2 Q3 Q4 Q1 Q2 Q3 Q4 Q1 Q2 Q3 Q4 Q1 Q2 Q3 Q4 Q1 Q2 Q3 Q4 Q1 Q2
Asia ex-JapanChina ## ## ## ## ## ## ## ## ## ## ## ## on on on on off off off on on on on on on on on off on on on on on on on on off off on off off on on on on on on on on on on off on on on on on on on on
Hong Kong ## ## ## ## ## ## ## ## ## ## ## ## on on on on on on on on on on on on off off on on on on on on on on on on off off off off off on on on on on on on off off on on on on on on on on on on
India ## ## ## ## ## ## ## ## ## ## ## ## off off off off off off off off off off off off off off off off off off off off off off off off off off off off off off off off off off off off off off off off off off off off off off off off
Indonesia ## ## ## ## ## ## ## ## ## ## ## ## on on off off off off off off off off off off on off off off off off off off off off off off off off off off off off off off off off off off off off off off off off off off off off off off
Malaysia ## ## ## ## ## ## ## ## ## ## ## ## off off off off off on on on on on on on off off off off off on on on off off off off off off off off off on off off off off off off off off off on on on on on off off off off
Philippines ## ## ## ## ## ## ## ## ## ## ## ## off off off off off off off off on off off off off off off off on on on on on on on on off off off off off off off off off off off off off off off off off off off off on on on on
Singapore ## ## ## ## ## ## ## ## ## ## ## ## on on off off off off off off off off off off on on on on on on on on on on on on off off off off on on off off off off off off on on on on on on on on on on on on
Korea ## ## ## ## ## ## ## ## ## ## ## ## off off off off off off off off on on off on off off off off off off off off on on off on off off off off off off off off off off off off off off off off off off off off off off off off
Taiwan ## ## ## ## ## ## ## ## ## ## ## ## off off off off off off off off off off off off off off off off off off off off off off off off off off off off off off off off off off off off off off off off off off off off off off off off
Thailand ## ## ## ## ## ## ## ## ## ## ## ## on on on on on on on on on on on on on on on on on on on on on on off off off off off off off off off off off off off off on on on on on on on on on on off off
Other EM economiesBrazil ## ## ## ## ## ## ## ## ## ## ## ## on on off off off off off off off off off off off on off off off off off off off off off off off off off on on off off off off off off off on on on on on off off off off off off off
Chile ## ## ## ## ## ## ## ## ## ## ## ## off off off on on on on on on on on on off off off off off off off off off off off off off off off off off off off off off off off off off on off off off off off off off off off off
Colombia ## ## ## ## ## ## n.a.n.a.n.a.n.a.n.a.n.a. on on on on on on n.a.n.a.n.a.n.a.n.a.n.a. on on on on on off n.a.n.a.n.a.n.a.n.a.n.a. on on off on on off n.a.n.a.n.a.n.a.n.a.n.a. on on on on on off n.a.n.a.n.a.n.a.n.a.n.a.
Hungary ## ## ## ## ## ## ## ## ## ## ## ## off off off off off off off off off off off off off off off off off off off off off off off off off off off off off off off off off off off off off off off off off off off off off off off off
Mexico ## ## ## ## ## ## ## ## ## ## ## ## off off off off off off off off on off on on off off off on on on off off off off off off off off off off off off off off off off off off off off off off off off off off off off off off
Poland ## ## ## ## ## ## ## ## ## ## ## ## off off off off off off off off on off off off off off off off off off off off off off off off off off off off off off off off off off off off off off off off off off off off off off off off
Romania ## ## ## ## ## ## ## ## ## ## ## ## off off off off off off off off off off off off off off off off off off off off off off off off off off off off off off off off off off off off off off off off off off off off off off off off
Russia ## ## ## ## ## ## ## ## ## ## ## ## off off off off off off off off off off off off off off off off off off off off off off off off off off off off off off off off off off off off off off off off off off off off off off off off
South Africa ## ## ## ## ## ## ## ## ## ## ## ## off off off off off off off off off off off off off off off off off off off off off off off off off off off off off off off off off off off off off off off off off off off off off off off off
Turkey ## ## ## ## ## ## ## ## ## ## ## ## off off off off off off off off on on off on off off off off off off off off off off off off off off off off off off off off off off off off off off off off off off off off off off off off
Developed economiesBelgium ## ## ## ## ## ## ## ## ## ## ## ## off off off off off off off off off off off off off off off off off off off off off off off off off off off off off off off off off off off off off off off off off off off off off off off off
France ## ## ## ## ## ## ## ## ## ## ## ## off off off off off off off off off off off off off off off on off off off off off off off off off off off off off off off off off off off off off off on on off off off off off off off off
Greece ## ## ## ## ## ## ## ## ## ## ## ## off off off off off off off off off off off off off off off off off off off off off off off off off off off off off off off off off off off off off off off off off off off off off off off off
Iceland ## ## ## ## ## ## ## ## ## ## ## ## off off off off off off off off off off off off off off off off off off off off off off off off off off off off off off off off off off off off off off off off off off off off off off off off
Ireland ## ## ## ## ## ## ## ## ## ## ## ## off off off off off off off off off off off off off off off off off off off off off off off off off off off off off off off off off off off off off off off off off off off off off off off off
Japan ## ## ## ## ## ## ## ## ## ## ## ## off off off off off on off off off off off off off off off off off off off off off off off off off off off off off off off off off off off off off off off off off off off off off off off on
Norway ## ## ## ## ## ## ## ## ## ## ## ## off off off off off off off off off off off off off off off off off off off off off off off off off off off off off off off off off off off off off off off off off off off off off off off off
Sweden ## ## ## ## ## ## ## ## ## ## ## ## off off off off off off off off off off off off on off on on off off off off off off off off on on on off off off off off off off off off on on on on off off off off off off off off
UK ## ## ## ## ## ## ## ## ## ## ## ## off off off off off off off off off off off off off off off off off off off off off off off off off off off off off off off off off off off off off off off off off off off off off off off off
US ## ## ## ## ## ## ## ## ## ## ## ## off off off off off off off off off off off off off off off off off off off off off off off off off off off off off off off off off off off off off off off off off off off off off off off off
Canada ## ## ## ## ## ## ## ## ## ## ## ## off off off off off off off off on on on on off off off off off off off off off off off off off off off off off off off off off off off off off off off off off off off off off off off off
Australia ## ## ## ## ## ## ## ## ## ## ## ## off off off off off off off off off off off off off off off off off off off off off off off off off off off off off off off off off off off off off off off off off off off off off off off off
2013 2014 2015 20162013 2014 2015 2016
Single EWIs Joint EWIs Triple EWIs
Debt service ratio (DSR) (2) Credit (3), Property (2) Credit (3), REER (1) REER (5), DSR (1) Credit (0.5), REER (0.5), DSR (0.5)
2014 2015 2016 2013 2014 2015 20162013 2014 2015 2016 2013
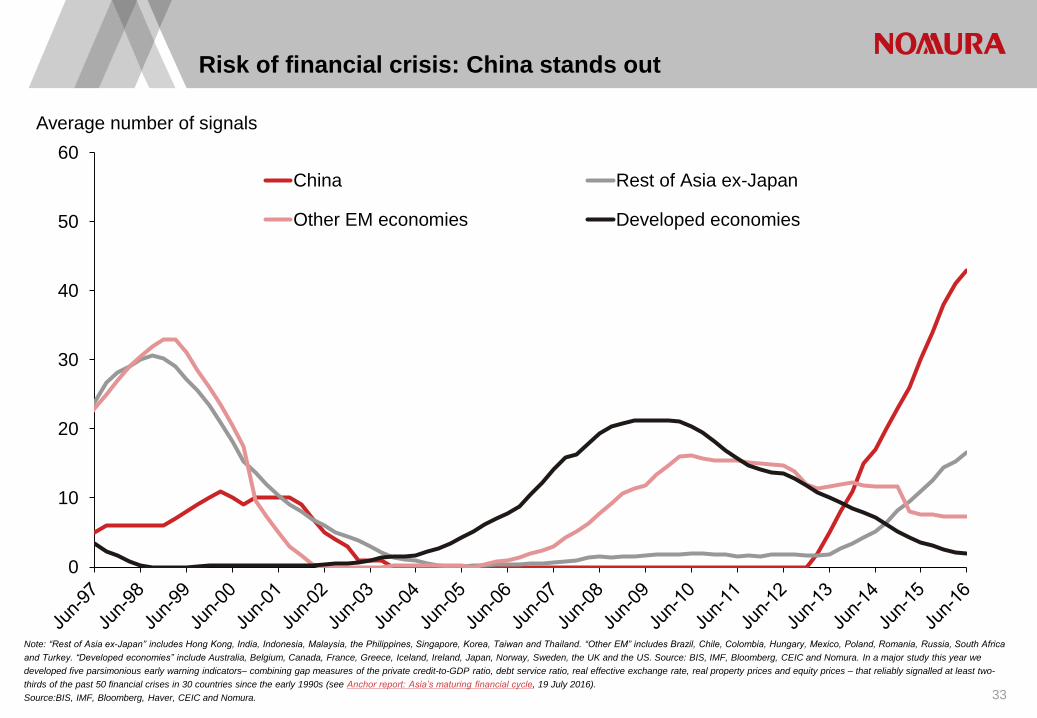
Risk of financial crisis: China stands out
Note: “Rest of Asia ex-Japan” includes Hong Kong, India, Indonesia, Malaysia, the Philippines, Singapore, Korea, Taiwan and Thailand. “Other EM” includes Brazil, Chile, Colombia, Hungary, Mexico, Poland, Romania, Russia, South Africa
and Turkey. “Developed economies” include Australia, Belgium, Canada, France, Greece, Iceland, Ireland, Japan, Norway, Sweden, the UK and the US. Source: BIS, IMF, Bloomberg, CEIC and Nomura. In a major study this year we
developed five parsimonious early warning indicators– combining gap measures of the private credit-to-GDP ratio, debt service ratio, real effective exchange rate, real property prices and equity prices – that reliably signalled at least two-
thirds of the past 50 financial crises in 30 countries since the early 1990s (see Anchor report: Asia’s maturing financial cycle, 19 July 2016).
Source:BIS, IMF, Bloomberg, Haver, CEIC and Nomura. 33
0
10
20
30
40
50
60
Average number of signals
China Rest of Asia ex-Japan
Other EM economies Developed economies
S:\Economics\subbaraman\Stuff\Reports\Early warning indicators\consolidated noise to signal index.xlsx
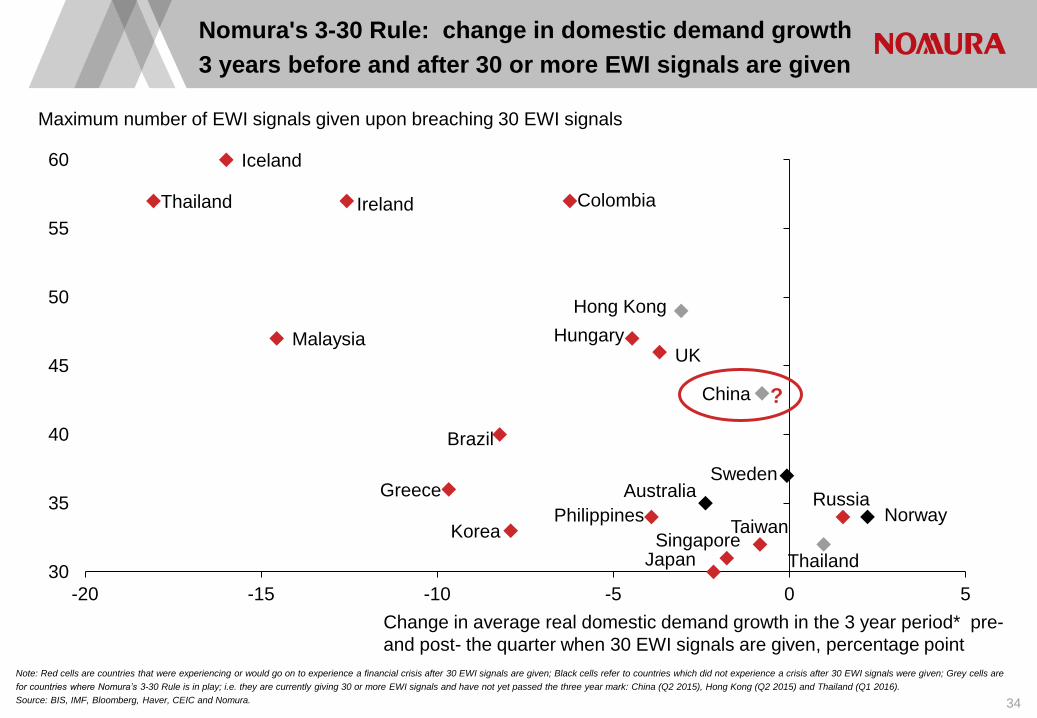
Note: Red cells are countries that were experiencing or would go on to experience a financial crisis after 30 EWI signals are given; Black cells refer to countries which did not experience a crisis after 30 EWI signals were given; Grey cells are
for countries where Nomura’s 3-30 Rule is in play; i.e. they are currently giving 30 or more EWI signals and have not yet passed the three year mark: China (Q2 2015), Hong Kong (Q2 2015) and Thailand (Q1 2016).
Source: BIS, IMF, Bloomberg, Haver, CEIC and Nomura.
Nomura's 3-30 Rule: change in domestic demand growth
3 years before and after 30 or more EWI signals are given
34
China
Hong Kong
Malaysia
Philippines
Singapore Korea Taiwan
Thailand
Brazil
Colombia
Hungary
Russia Greece
Iceland
Ireland
Japan
Norway
Sweden
UK
Australia
Thailand 30
35
40
45
50
55
60
-20 -15 -10 -5 0 5
Maximum number of EWI signals given upon breaching 30 EWI signals
Change in average real domestic demand growth in the 3 year period* pre-
and post- the quarter when 30 EWI signals are given, percentage point
S:\Economics\subbaraman\Stuff\Reports\Early warning indicators\consolidated noise to signal index.xlsx
?
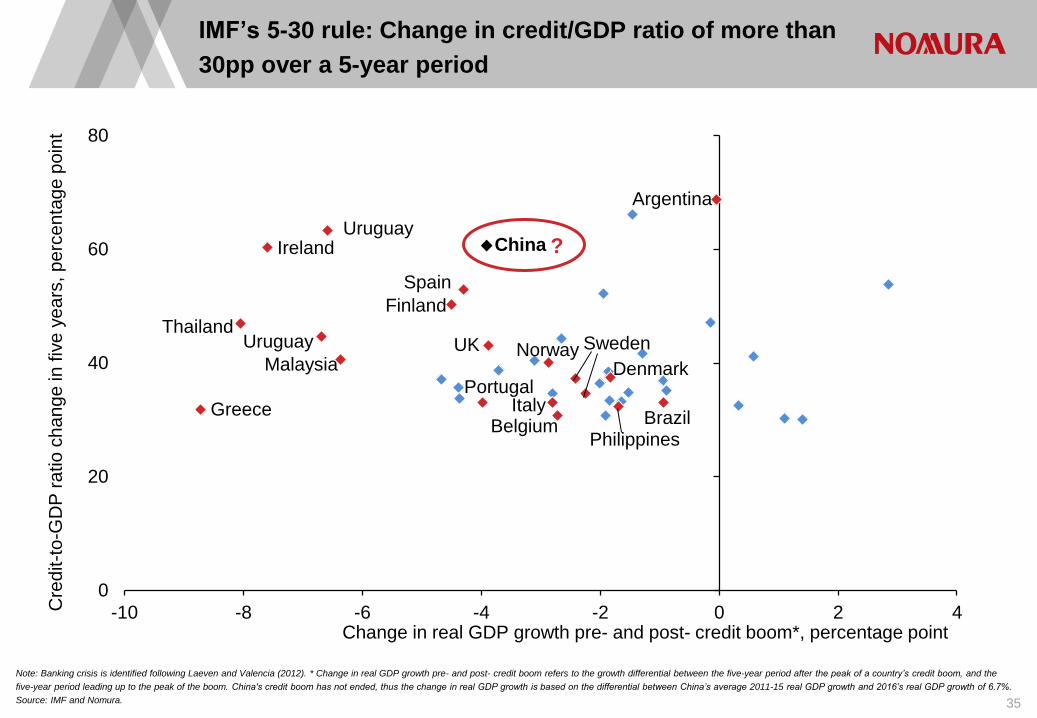
Note: Banking crisis is identified following Laeven and Valencia (2012). * Change in real GDP growth pre- and post- credit boom refers to the growth differential between the five-year period after the peak of a country’s credit boom, and the
five-year period leading up to the peak of the boom. China's credit boom has not ended, thus the change in real GDP growth is based on the differential between China’s average 2011-15 real GDP growth and 2016’s real GDP growth of 6.7%.
Source: IMF and Nomura.
IMF’s 5-30 rule: Change in credit/GDP ratio of more than
30pp over a 5-year period
35
UK
Belgium
Denmark
Italy
Norway Sweden
Finland
Greece
Ireland
Portugal
Spain
Argentina
Brazil
Uruguay
Uruguay
Malaysia
Philippines
Thailand
0
20
40
60
80
-10 -8 -6 -4 -2 0 2 4
China
Cre
dit-t
o-G
DP
ra
tio
ch
an
ge
in
fiv
e y
ea
rs, p
erc
en
tag
e p
oin
t
Change in real GDP growth pre- and post- credit boom*, percentage point
?
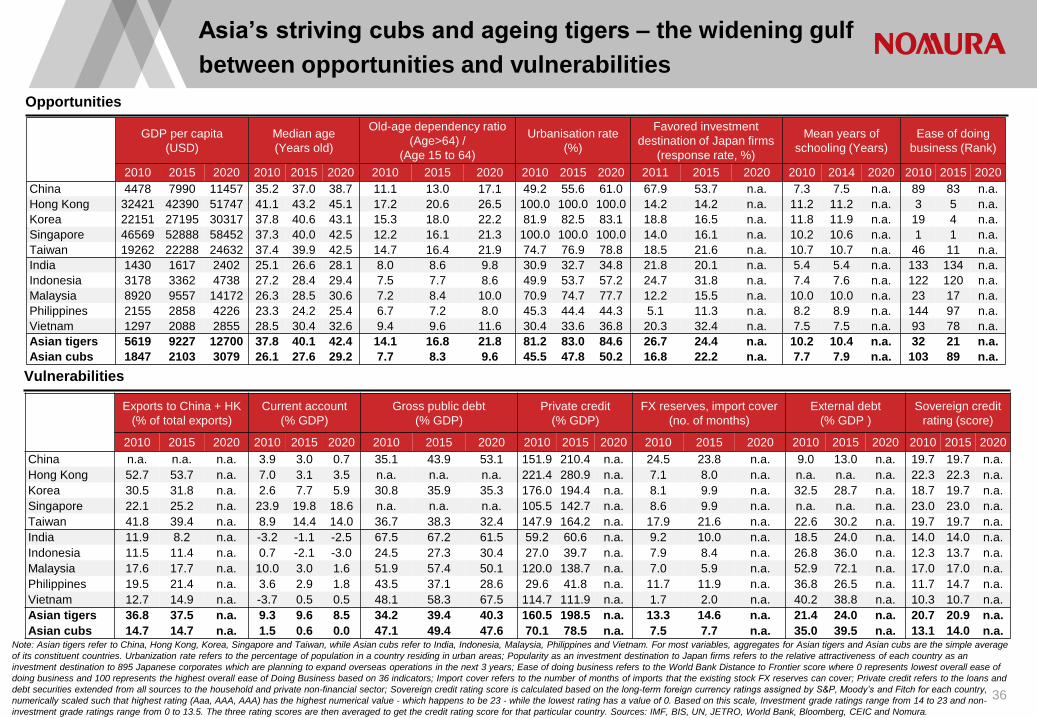
Asia’s striving cubs and ageing tigers – the widening gulf
between opportunities and vulnerabilities
36
Vulnerabilities
Note: Asian tigers refer to China, Hong Kong, Korea, Singapore and Taiwan, while Asian cubs refer to India, Indonesia, Malaysia, Philippines and Vietnam. For most variables, aggregates for Asian tigers and Asian cubs are the simple average
of its constituent countries. Urbanization rate refers to the percentage of population in a country residing in urban areas; Popularity as an investment destination to Japan firms refers to the relative attractiveness of each country as an
investment destination to 895 Japanese corporates which are planning to expand overseas operations in the next 3 years; Ease of doing business refers to the World Bank Distance to Frontier score where 0 represents lowest overall ease of
doing business and 100 represents the highest overall ease of Doing Business based on 36 indicators; Import cover refers to the number of months of imports that the existing stock FX reserves can cover; Private credit refers to the loans and
debt securities extended from all sources to the household and private non-financial sector; Sovereign credit rating score is calculated based on the long-term foreign currency ratings assigned by S&P, Moody’s and Fitch for each country,
numerically scaled such that highest rating (Aaa, AAA, AAA) has the highest numerical value - which happens to be 23 - while the lowest rating has a value of 0. Based on this scale, Investment grade ratings range from 14 to 23 and non-
investment grade ratings range from 0 to 13.5. The three rating scores are then averaged to get the credit rating score for that particular country. Sources: IMF, BIS, UN, JETRO, World Bank, Bloomberg, CEIC and Nomura.
Opportunities
S:\Economics\subbaraman\Stuff\Asia database\Tigers vs cubs.xlsx
GDP per capita
(USD)
Median age
(Years old)
Old-age dependency ratio
(Age>64) /
(Age 15 to 64)
Urbanisation rate
(%)
Favored investment
destination of Japan firms
(response rate, %)
Mean years of
schooling (Years)
Ease of doing
business (Rank)
2010 2015 2020 2010 2015 2020 2010 2015 2020 2010 2015 2020 2011 2015 2020 2010 2014 2020 2010 2015 2020
China 4478 7990 11457 35.2 37.0 38.7 11.1 13.0 17.1 49.2 55.6 61.0 67.9 53.7 n.a. 7.3 7.5 n.a. 89 83 n.a.
Hong Kong 32421 42390 51747 41.1 43.2 45.1 17.2 20.6 26.5 100.0 100.0 100.0 14.2 14.2 n.a. 11.2 11.2 n.a. 3 5 n.a.
Korea 22151 27195 30317 37.8 40.6 43.1 15.3 18.0 22.2 81.9 82.5 83.1 18.8 16.5 n.a. 11.8 11.9 n.a. 19 4 n.a.
Singapore 46569 52888 58452 37.3 40.0 42.5 12.2 16.1 21.3 100.0 100.0 100.0 14.0 16.1 n.a. 10.2 10.6 n.a. 1 1 n.a.
Taiwan 19262 22288 24632 37.4 39.9 42.5 14.7 16.4 21.9 74.7 76.9 78.8 18.5 21.6 n.a. 10.7 10.7 n.a. 46 11 n.a.
India 1430 1617 2402 25.1 26.6 28.1 8.0 8.6 9.8 30.9 32.7 34.8 21.8 20.1 n.a. 5.4 5.4 n.a. 133 134 n.a.
Indonesia 3178 3362 4738 27.2 28.4 29.4 7.5 7.7 8.6 49.9 53.7 57.2 24.7 31.8 n.a. 7.4 7.6 n.a. 122 120 n.a.
Malaysia 8920 9557 14172 26.3 28.5 30.6 7.2 8.4 10.0 70.9 74.7 77.7 12.2 15.5 n.a. 10.0 10.0 n.a. 23 17 n.a.
Philippines 2155 2858 4226 23.3 24.2 25.4 6.7 7.2 8.0 45.3 44.4 44.3 5.1 11.3 n.a. 8.2 8.9 n.a. 144 97 n.a.
Vietnam 1297 2088 2855 28.5 30.4 32.6 9.4 9.6 11.6 30.4 33.6 36.8 20.3 32.4 n.a. 7.5 7.5 n.a. 93 78 n.a.
Asian tigers 5619 9227 12700 37.8 40.1 42.4 14.1 16.8 21.8 81.2 83.0 84.6 26.7 24.4 n.a. 10.2 10.4 n.a. 32 21 n.a.
Asian cubs 1847 2103 3079 26.1 27.6 29.2 7.7 8.3 9.6 45.5 47.8 50.2 16.8 22.2 n.a. 7.7 7.9 n.a. 103 89 n.a.
Exports to China + HK
(% of total exports)
Current account
(% GDP)
Gross public debt
(% GDP)
Private credit
(% GDP)
FX reserves, import cover
(no. of months)
External debt
(% GDP )
Sovereign credit
rating (score)
2010 2015 2020 2010 2015 2020 2010 2015 2020 2010 2015 2020 2010 2015 2020 2010 2015 2020 2010 2015 2020
China n.a. n.a. n.a. 3.9 3.0 0.7 35.1 43.9 53.1 151.9 210.4 n.a. 24.5 23.8 n.a. 9.0 13.0 n.a. 19.7 19.7 n.a.
Hong Kong 52.7 53.7 n.a. 7.0 3.1 3.5 n.a. n.a. n.a. 221.4 280.9 n.a. 7.1 8.0 n.a. n.a. n.a. n.a. 22.3 22.3 n.a.
Korea 30.5 31.8 n.a. 2.6 7.7 5.9 30.8 35.9 35.3 176.0 194.4 n.a. 8.1 9.9 n.a. 32.5 28.7 n.a. 18.7 19.7 n.a.
Singapore 22.1 25.2 n.a. 23.9 19.8 18.6 n.a. n.a. n.a. 105.5 142.7 n.a. 8.6 9.9 n.a. n.a. n.a. n.a. 23.0 23.0 n.a.
Taiwan 41.8 39.4 n.a. 8.9 14.4 14.0 36.7 38.3 32.4 147.9 164.2 n.a. 17.9 21.6 n.a. 22.6 30.2 n.a. 19.7 19.7 n.a.
India 11.9 8.2 n.a. -3.2 -1.1 -2.5 67.5 67.2 61.5 59.2 60.6 n.a. 9.2 10.0 n.a. 18.5 24.0 n.a. 14.0 14.0 n.a.
Indonesia 11.5 11.4 n.a. 0.7 -2.1 -3.0 24.5 27.3 30.4 27.0 39.7 n.a. 7.9 8.4 n.a. 26.8 36.0 n.a. 12.3 13.7 n.a.
Malaysia 17.6 17.7 n.a. 10.0 3.0 1.6 51.9 57.4 50.1 120.0 138.7 n.a. 7.0 5.9 n.a. 52.9 72.1 n.a. 17.0 17.0 n.a.
Philippines 19.5 21.4 n.a. 3.6 2.9 1.8 43.5 37.1 28.6 29.6 41.8 n.a. 11.7 11.9 n.a. 36.8 26.5 n.a. 11.7 14.7 n.a.
Vietnam 12.7 14.9 n.a. -3.7 0.5 0.5 48.1 58.3 67.5 114.7 111.9 n.a. 1.7 2.0 n.a. 40.2 38.8 n.a. 10.3 10.7 n.a.
Asian tigers 36.8 37.5 n.a. 9.3 9.6 8.5 34.2 39.4 40.3 160.5 198.5 n.a. 13.3 14.6 n.a. 21.4 24.0 n.a. 20.7 20.9 n.a.
Asian cubs 14.7 14.7 n.a. 1.5 0.6 0.0 47.1 49.4 47.6 70.1 78.5 n.a. 7.5 7.7 n.a. 35.0 39.5 n.a. 13.1 14.0 n.a.
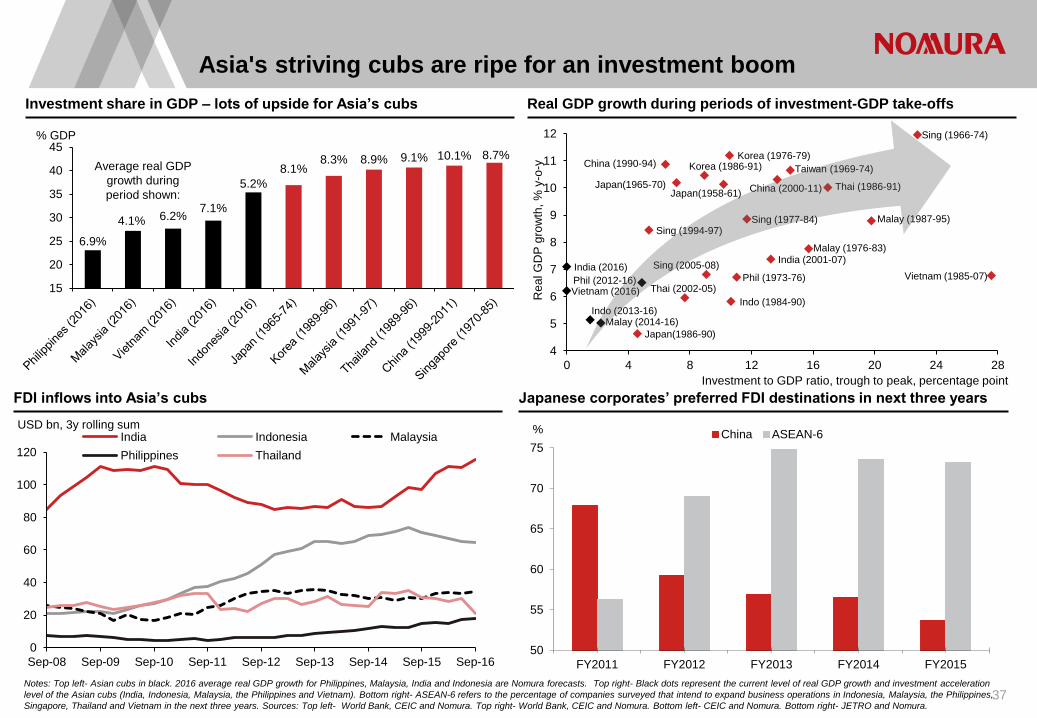
Asia's striving cubs are ripe for an investment boom
37
Real GDP growth during periods of investment-GDP take-offs
FDI inflows into Asia’s cubs Japanese corporates’ preferred FDI destinations in next three years
Notes: Top left- Asian cubs in black. 2016 average real GDP growth for Philippines, Malaysia, India and Indonesia are Nomura forecasts. Top right- Black dots represent the current level of real GDP growth and investment acceleration
level of the Asian cubs (India, Indonesia, Malaysia, the Philippines and Vietnam). Bottom right- ASEAN-6 refers to the percentage of companies surveyed that intend to expand business operations in Indonesia, Malaysia, the Philippines,
Singapore, Thailand and Vietnam in the next three years. Sources: Top left- World Bank, CEIC and Nomura. Top right- World Bank, CEIC and Nomura. Bottom left- CEIC and Nomura. Bottom right- JETRO and Nomura.
Investment share in GDP – lots of upside for Asia’s cubs
Investment share, scatter, fdi, jetro- S:\Economics\subbaraman\Stuff\China\China challenges.xlsx
50
55
60
65
70
75
FY2011 FY2012 FY2013 FY2014 FY2015
% China ASEAN-6
0
20
40
60
80
100
120
Sep-08 Sep-09 Sep-10 Sep-11 Sep-12 Sep-13 Sep-14 Sep-15 Sep-16
USD bn, 3y rolling sum India Indonesia Malaysia
Philippines Thailand
China (1990-94)
China (2000-11)
India (2001-07)
Indo (1984-90)
Japan(1958-61) Japan(1965-70)
Japan(1986-90)
Korea (1976-79) Korea (1986-91)
Malay (1976-83)
Malay (1987-95)
Phil (1973-76)
Sing (1966-74)
Sing (1977-84) Sing (1994-97)
Sing (2005-08)
Taiwan (1969-74)
Thai (1986-91)
Thai (2002-05)
Vietnam (1985-07) India (2016)
Indo (2013-16) Malay (2014-16)
Phil (2012-16) Vietnam (2016)
4
5
6
7
8
9
10
11
12
0 4 8 12 16 20 24 28
Rea
l G
DP
gro
wth
, %
y-o
-y
Investment to GDP ratio, trough to peak, percentage point
6.9%
4.1% 6.2% 7.1%
5.2%
8.1% 8.3% 8.9% 9.1% 10.1% 8.7%
15
20
25
30
35
40
45% GDP
Average real GDP
growth during
period shown:
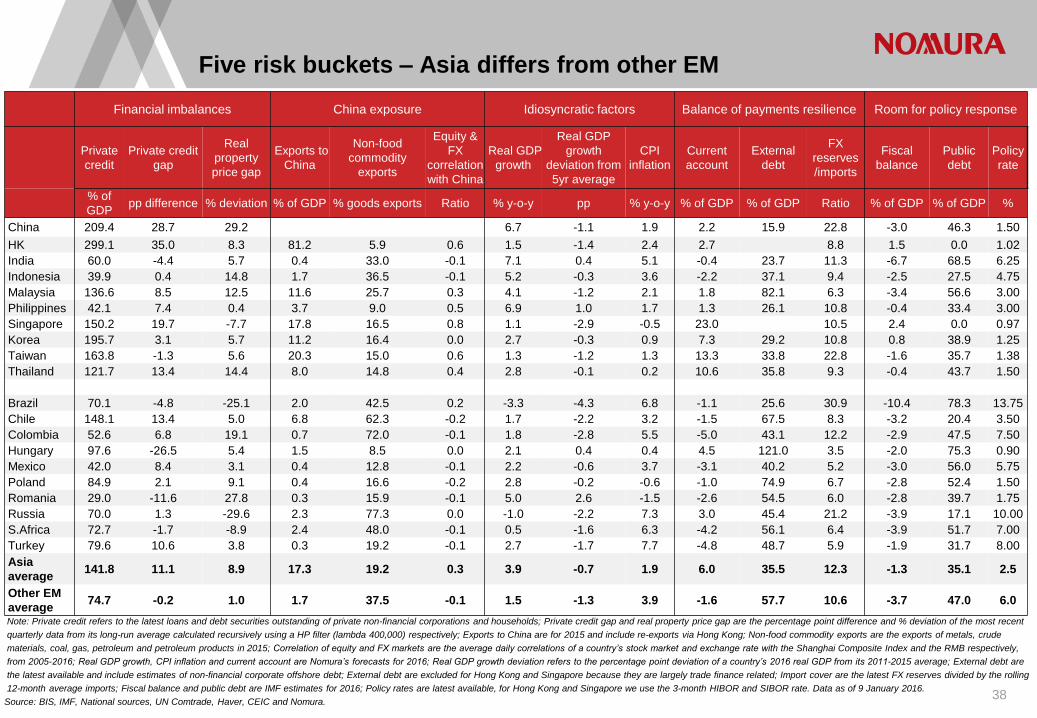
38
Five risk buckets – Asia differs from other EM
Note: Private credit refers to the latest loans and debt securities outstanding of private non-financial corporations and households; Private credit gap and real property price gap are the percentage point difference and % deviation of the most recent
quarterly data from its long-run average calculated recursively using a HP filter (lambda 400,000) respectively; Exports to China are for 2015 and include re-exports via Hong Kong; Non-food commodity exports are the exports of metals, crude
materials, coal, gas, petroleum and petroleum products in 2015; Correlation of equity and FX markets are the average daily correlations of a country’s stock market and exchange rate with the Shanghai Composite Index and the RMB respectively,
from 2005-2016; Real GDP growth, CPI inflation and current account are Nomura’s forecasts for 2016; Real GDP growth deviation refers to the percentage point deviation of a country’s 2016 real GDP from its 2011-2015 average; External debt are
the latest available and include estimates of non-financial corporate offshore debt; External debt are excluded for Hong Kong and Singapore because they are largely trade finance related; Import cover are the latest FX reserves divided by the rolling
12-month average imports; Fiscal balance and public debt are IMF estimates for 2016; Policy rates are latest available, for Hong Kong and Singapore we use the 3-month HIBOR and SIBOR rate. Data as of 9 January 2016.
Source: BIS, IMF, National sources, UN Comtrade, Haver, CEIC and Nomura.
S:\Economics\subbaraman\Stuff\Reports\2016 outlook\EM vulnerability scorecard.xlsx
Financial imbalances China exposure Idiosyncratic factors Balance of payments resilience Room for policy response
Private
credit
Private credit
gap
Real
property
price gap
Exports to
China
Non-food
commodity
exports
Equity &
FX
correlation
with China
Real GDP
growth
Real GDP
growth
deviation from
5yr average
CPI
inflation
Current
account
External
debt
FX
reserves
/imports
Fiscal
balance
Public
debt
Policy
rate
% of
GDP pp difference % deviation % of GDP % goods exports Ratio % y-o-y pp % y-o-y % of GDP % of GDP Ratio % of GDP % of GDP %
China 209.4 28.7 29.2 6.7 -1.1 1.9 2.2 15.9 22.8 -3.0 46.3 1.50
HK 299.1 35.0 8.3 81.2 5.9 0.6 1.5 -1.4 2.4 2.7 8.8 1.5 0.0 1.02
India 60.0 -4.4 5.7 0.4 33.0 -0.1 7.1 0.4 5.1 -0.4 23.7 11.3 -6.7 68.5 6.25
Indonesia 39.9 0.4 14.8 1.7 36.5 -0.1 5.2 -0.3 3.6 -2.2 37.1 9.4 -2.5 27.5 4.75
Malaysia 136.6 8.5 12.5 11.6 25.7 0.3 4.1 -1.2 2.1 1.8 82.1 6.3 -3.4 56.6 3.00
Philippines 42.1 7.4 0.4 3.7 9.0 0.5 6.9 1.0 1.7 1.3 26.1 10.8 -0.4 33.4 3.00
Singapore 150.2 19.7 -7.7 17.8 16.5 0.8 1.1 -2.9 -0.5 23.0 10.5 2.4 0.0 0.97
Korea 195.7 3.1 5.7 11.2 16.4 0.0 2.7 -0.3 0.9 7.3 29.2 10.8 0.8 38.9 1.25
Taiwan 163.8 -1.3 5.6 20.3 15.0 0.6 1.3 -1.2 1.3 13.3 33.8 22.8 -1.6 35.7 1.38
Thailand 121.7 13.4 14.4 8.0 14.8 0.4 2.8 -0.1 0.2 10.6 35.8 9.3 -0.4 43.7 1.50
Brazil 70.1 -4.8 -25.1 2.0 42.5 0.2 -3.3 -4.3 6.8 -1.1 25.6 30.9 -10.4 78.3 13.75
Chile 148.1 13.4 5.0 6.8 62.3 -0.2 1.7 -2.2 3.2 -1.5 67.5 8.3 -3.2 20.4 3.50
Colombia 52.6 6.8 19.1 0.7 72.0 -0.1 1.8 -2.8 5.5 -5.0 43.1 12.2 -2.9 47.5 7.50
Hungary 97.6 -26.5 5.4 1.5 8.5 0.0 2.1 0.4 0.4 4.5 121.0 3.5 -2.0 75.3 0.90
Mexico 42.0 8.4 3.1 0.4 12.8 -0.1 2.2 -0.6 3.7 -3.1 40.2 5.2 -3.0 56.0 5.75
Poland 84.9 2.1 9.1 0.4 16.6 -0.2 2.8 -0.2 -0.6 -1.0 74.9 6.7 -2.8 52.4 1.50
Romania 29.0 -11.6 27.8 0.3 15.9 -0.1 5.0 2.6 -1.5 -2.6 54.5 6.0 -2.8 39.7 1.75
Russia 70.0 1.3 -29.6 2.3 77.3 0.0 -1.0 -2.2 7.3 3.0 45.4 21.2 -3.9 17.1 10.00
S.Africa 72.7 -1.7 -8.9 2.4 48.0 -0.1 0.5 -1.6 6.3 -4.2 56.1 6.4 -3.9 51.7 7.00
Turkey 79.6 10.6 3.8 0.3 19.2 -0.1 2.7 -1.7 7.7 -4.8 48.7 5.9 -1.9 31.7 8.00
Asia
average 141.8 11.1 8.9 17.3 19.2 0.3 3.9 -0.7 1.9 6.0 35.5 12.3 -1.3 35.1 2.5
Other EM
average 74.7 -0.2 1.0 1.7 37.5 -0.1 1.5 -1.3 3.9 -1.6 57.7 10.6 -3.7 47.0 6.0
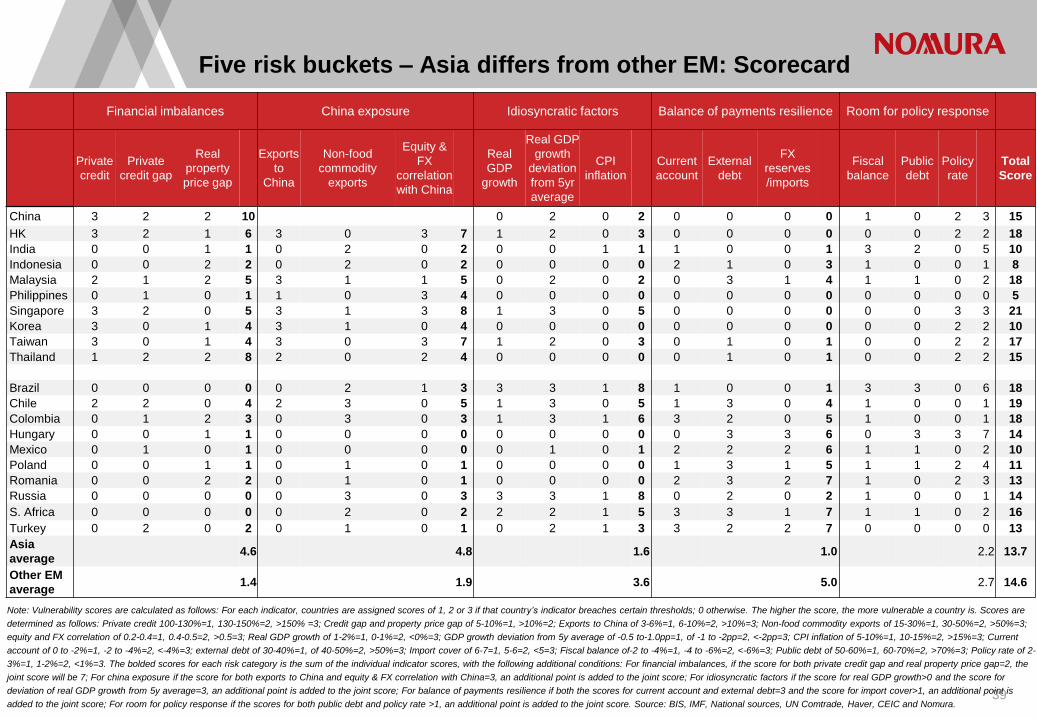
39
Five risk buckets – Asia differs from other EM: Scorecard
Note: Vulnerability scores are calculated as follows: For each indicator, countries are assigned scores of 1, 2 or 3 if that country’s indicator breaches certain thresholds; 0 otherwise. The higher the score, the more vulnerable a country is. Scores are
determined as follows: Private credit 100-130%=1, 130-150%=2, >150% =3; Credit gap and property price gap of 5-10%=1, >10%=2; Exports to China of 3-6%=1, 6-10%=2, >10%=3; Non-food commodity exports of 15-30%=1, 30-50%=2, >50%=3;
equity and FX correlation of 0.2-0.4=1, 0.4-0.5=2, >0.5=3; Real GDP growth of 1-2%=1, 0-1%=2, <0%=3; GDP growth deviation from 5y average of -0.5 to-1.0pp=1, of -1 to -2pp=2, <-2pp=3; CPI inflation of 5-10%=1, 10-15%=2, >15%=3; Current
account of 0 to -2%=1, -2 to -4%=2, <-4%=3; external debt of 30-40%=1, of 40-50%=2, >50%=3; Import cover of 6-7=1, 5-6=2, <5=3; Fiscal balance of-2 to -4%=1, -4 to -6%=2, <-6%=3; Public debt of 50-60%=1, 60-70%=2, >70%=3; Policy rate of 2-
3%=1, 1-2%=2, <1%=3. The bolded scores for each risk category is the sum of the individual indicator scores, with the following additional conditions: For financial imbalances, if the score for both private credit gap and real property price gap=2, the
joint score will be 7; For china exposure if the score for both exports to China and equity & FX correlation with China=3, an additional point is added to the joint score; For idiosyncratic factors if the score for real GDP growth>0 and the score for
deviation of real GDP growth from 5y average=3, an additional point is added to the joint score; For balance of payments resilience if both the scores for current account and external debt=3 and the score for import cover>1, an additional point is
added to the joint score; For room for policy response if the scores for both public debt and policy rate >1, an additional point is added to the joint score. Source: BIS, IMF, National sources, UN Comtrade, Haver, CEIC and Nomura.
S:\Economics\subbaraman\Stuff\Reports\2016 outlook\EM vulnerability scorecard.xlsx
Financial imbalances China exposure Idiosyncratic factors Balance of payments resilience Room for policy response
Private
credit
Private
credit gap
Real
property
price gap
Exports
to
China
Non-food
commodity
exports
Equity &
FX
correlation
with China
Real
GDP
growth
Real GDP
growth
deviation
from 5yr
average
CPI
inflation
Current
account
External
debt
FX
reserves
/imports
Fiscal
balance
Public
debt
Policy
rate
Total
Score
China 3 2 2 10 0 2 0 2 0 0 0 0 1 0 2 3 15
HK 3 2 1 6 3 0 3 7 1 2 0 3 0 0 0 0 0 0 2 2 18
India 0 0 1 1 0 2 0 2 0 0 1 1 1 0 0 1 3 2 0 5 10
Indonesia 0 0 2 2 0 2 0 2 0 0 0 0 2 1 0 3 1 0 0 1 8
Malaysia 2 1 2 5 3 1 1 5 0 2 0 2 0 3 1 4 1 1 0 2 18
Philippines 0 1 0 1 1 0 3 4 0 0 0 0 0 0 0 0 0 0 0 0 5
Singapore 3 2 0 5 3 1 3 8 1 3 0 5 0 0 0 0 0 0 3 3 21
Korea 3 0 1 4 3 1 0 4 0 0 0 0 0 0 0 0 0 0 2 2 10
Taiwan 3 0 1 4 3 0 3 7 1 2 0 3 0 1 0 1 0 0 2 2 17
Thailand 1 2 2 8 2 0 2 4 0 0 0 0 0 1 0 1 0 0 2 2 15
Brazil 0 0 0 0 0 2 1 3 3 3 1 8 1 0 0 1 3 3 0 6 18
Chile 2 2 0 4 2 3 0 5 1 3 0 5 1 3 0 4 1 0 0 1 19
Colombia 0 1 2 3 0 3 0 3 1 3 1 6 3 2 0 5 1 0 0 1 18
Hungary 0 0 1 1 0 0 0 0 0 0 0 0 0 3 3 6 0 3 3 7 14
Mexico 0 1 0 1 0 0 0 0 0 1 0 1 2 2 2 6 1 1 0 2 10
Poland 0 0 1 1 0 1 0 1 0 0 0 0 1 3 1 5 1 1 2 4 11
Romania 0 0 2 2 0 1 0 1 0 0 0 0 2 3 2 7 1 0 2 3 13
Russia 0 0 0 0 0 3 0 3 3 3 1 8 0 2 0 2 1 0 0 1 14
S. Africa 0 0 0 0 0 2 0 2 2 2 1 5 3 3 1 7 1 1 0 2 16
Turkey 0 2 0 2 0 1 0 1 0 2 1 3 3 2 2 7 0 0 0 0 13
Asia
average 4.6 4.8 1.6 1.0 2.2 13.7
Other EM
average 1.4 1.9 3.6 5.0 2.7 14.6
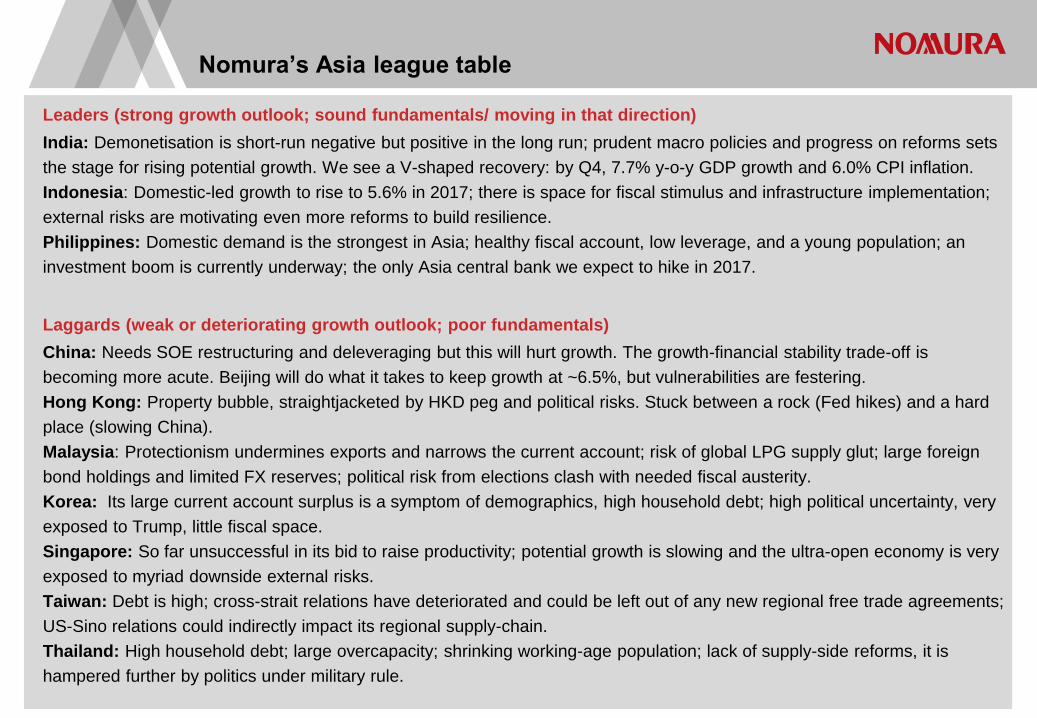
Nomura’s Asia league table
Leaders (strong growth outlook; sound fundamentals/ moving in that direction)
India: Demonetisation is short-run negative but positive in the long run; prudent macro policies and progress on reforms sets
the stage for rising potential growth. We see a V-shaped recovery: by Q4, 7.7% y-o-y GDP growth and 6.0% CPI inflation.
Indonesia: Domestic-led growth to rise to 5.6% in 2017; there is space for fiscal stimulus and infrastructure implementation;
external risks are motivating even more reforms to build resilience.
Philippines: Domestic demand is the strongest in Asia; healthy fiscal account, low leverage, and a young population; an
investment boom is currently underway; the only Asia central bank we expect to hike in 2017.
Laggards (weak or deteriorating growth outlook; poor fundamentals)
China: Needs SOE restructuring and deleveraging but this will hurt growth. The growth-financial stability trade-off is
becoming more acute. Beijing will do what it takes to keep growth at ~6.5%, but vulnerabilities are festering.
Hong Kong: Property bubble, straightjacketed by HKD peg and political risks. Stuck between a rock (Fed hikes) and a hard
place (slowing China).
Malaysia: Protectionism undermines exports and narrows the current account; risk of global LPG supply glut; large foreign
bond holdings and limited FX reserves; political risk from elections clash with needed fiscal austerity.
Korea: Its large current account surplus is a symptom of demographics, high household debt; high political uncertainty, very
exposed to Trump, little fiscal space.
Singapore: So far unsuccessful in its bid to raise productivity; potential growth is slowing and the ultra-open economy is very
exposed to myriad downside external risks.
Taiwan: Debt is high; cross-strait relations have deteriorated and could be left out of any new regional free trade agreements;
US-Sino relations could indirectly impact its regional supply-chain.
Thailand: High household debt; large overcapacity; shrinking working-age population; lack of supply-side reforms, it is
hampered further by politics under military rule.
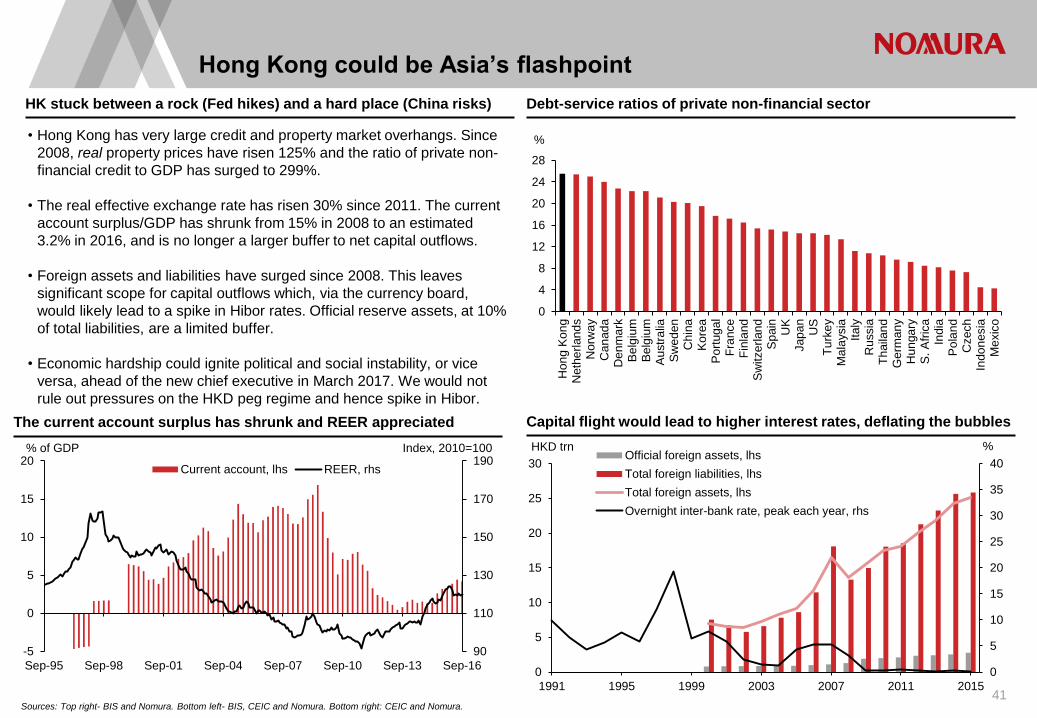
Hong Kong could be Asia’s flashpoint
41
HK stuck between a rock (Fed hikes) and a hard place (China risks) Debt-service ratios of private non-financial sector
The current account surplus has shrunk and REER appreciated Capital flight would lead to higher interest rates, deflating the bubbles
Sources: Top right- BIS and Nomura. Bottom left- BIS, CEIC and Nomura. Bottom right: CEIC and Nomura.
• Hong Kong has very large credit and property market overhangs. Since
2008, real property prices have risen 125% and the ratio of private non-
financial credit to GDP has surged to 299%.
• The real effective exchange rate has risen 30% since 2011. The current
account surplus/GDP has shrunk from 15% in 2008 to an estimated
3.2% in 2016, and is no longer a larger buffer to net capital outflows.
• Foreign assets and liabilities have surged since 2008. This leaves
significant scope for capital outflows which, via the currency board,
would likely lead to a spike in Hibor rates. Official reserve assets, at 10%
of total liabilities, are a limited buffer.
• Economic hardship could ignite political and social instability, or vice
versa, ahead of the new chief executive in March 2017. We would not
rule out pressures on the HKD peg regime and hence spike in Hibor.
CA, property- S:\Economics\subbaraman\Stuff\Asia database\Big ppt excels\HK and Thai ppt charts.xlsx
Capital account- S:\Economics\subbaraman\Stuff\General\China versus rest of world.xlsx
90
110
130
150
170
190
-5
0
5
10
15
20
Sep-95 Sep-98 Sep-01 Sep-04 Sep-07 Sep-10 Sep-13 Sep-16
Current account, lhs REER, rhs
Index, 2010=100 % of GDP
0
5
10
15
20
25
30
35
40
0
5
10
15
20
25
30
1991 1995 1999 2003 2007 2011 2015
HKD trn % Official foreign assets, lhs
Total foreign liabilities, lhs
Total foreign assets, lhs
Overnight inter-bank rate, peak each year, rhs
0
4
8
12
16
20
24
28
Hon
g K
on
gN
eth
erl
an
ds
Norw
ay
Can
ad
aD
en
ma
rkB
elg
ium
Be
lgiu
mA
ustr
alia
Sw
ed
en
Chin
aK
ore
aP
ort
ug
al
Fra
nce
Fin
land
Sw
itze
rlan
dS
pain
UK
Jap
an
US
Tu
rke
yM
ala
ysia
Italy
Russia
Th
aila
nd
Germ
an
yH
un
ga
ryS
. A
fric
aIn
dia
Po
lan
dC
zech
Indo
nesia
Me
xic
o
%
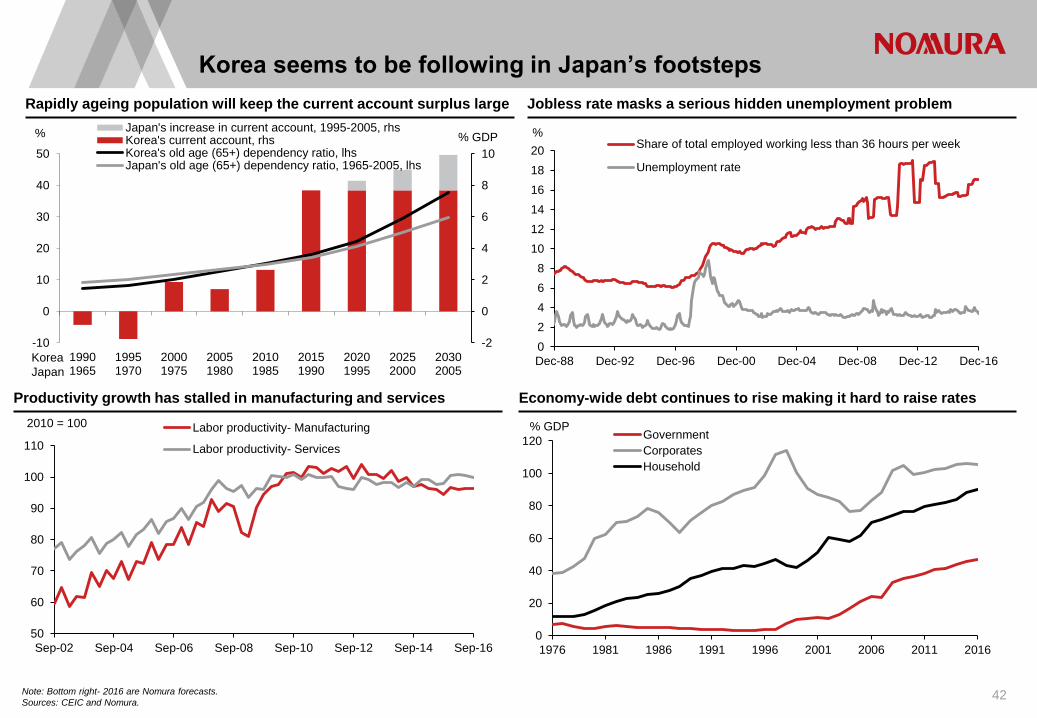
Korea seems to be following in Japan’s footsteps
42
Rapidly ageing population will keep the current account surplus large Jobless rate masks a serious hidden unemployment problem
Productivity growth has stalled in manufacturing and services Economy-wide debt continues to rise making it hard to raise rates
Note: Bottom right- 2016 are Nomura forecasts.
Sources: CEIC and Nomura.
Inv-shipment- S:\Economics\subbaraman\Stuff\Asia database\asia export volumes.xlsx
Exports, Productivity, -S:\Economics\subbaraman\Stuff\Asia database\Big ppt excels\korea trends.xlsx
Jobs- S:\Economics\subbaraman\Presentation\2015\February\Korea_Feb 2015.xlsx
Demographics, labor productivity- S:\Economics\subbaraman\subbaraman\Data requests\Korea vs Japan_demographics and current account.xlsx
0
20
40
60
80
100
120
1976 1981 1986 1991 1996 2001 2006 2011 2016
Government
Corporates
Household
% GDP
Economy wide debt- S:\Economics\subbaraman\Stuff\Asia database\Big ppt excels\korea- hh debt.XLS
-2
0
2
4
6
8
10
-10
0
10
20
30
40
50
19901965
19951970
20001975
20051980
20101985
20151990
20201995
20252000
20302005
Japan's increase in current account, 1995-2005, rhsKorea's current account, rhsKorea's old age (65+) dependency ratio, lhsJapan's old age (65+) dependency ratio, 1965-2005, lhs
% % GDP
Korea
Japan
50
60
70
80
90
100
110
Sep-02 Sep-04 Sep-06 Sep-08 Sep-10 Sep-12 Sep-14 Sep-16
2010 = 100 Labor productivity- Manufacturing
Labor productivity- Services
0
2
4
6
8
10
12
14
16
18
20
Dec-88 Dec-92 Dec-96 Dec-00 Dec-04 Dec-08 Dec-12 Dec-16
% Share of total employed working less than 36 hours per week
Unemployment rate
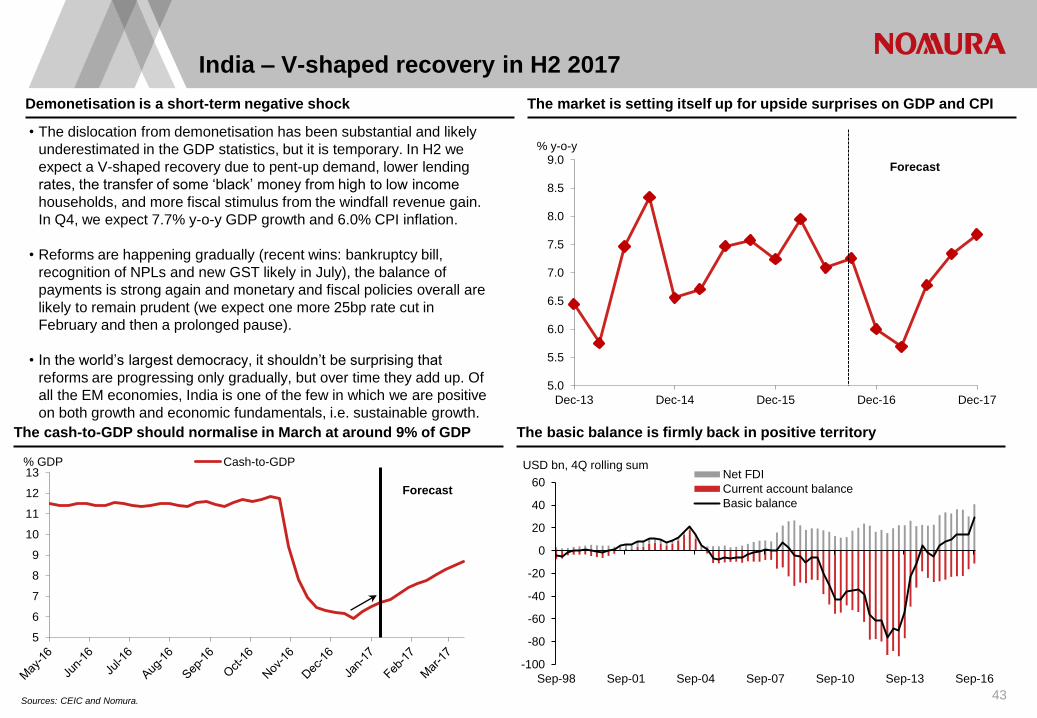
India – V-shaped recovery in H2 2017
43
Demonetisation is a short-term negative shock The market is setting itself up for upside surprises on GDP and CPI
The cash-to-GDP should normalise in March at around 9% of GDP The basic balance is firmly back in positive territory
Sources: CEIC and Nomura.
• The dislocation from demonetisation has been substantial and likely
underestimated in the GDP statistics, but it is temporary. In H2 we
expect a V-shaped recovery due to pent-up demand, lower lending
rates, the transfer of some ‘black’ money from high to low income
households, and more fiscal stimulus from the windfall revenue gain.
In Q4, we expect 7.7% y-o-y GDP growth and 6.0% CPI inflation.
• Reforms are happening gradually (recent wins: bankruptcy bill,
recognition of NPLs and new GST likely in July), the balance of
payments is strong again and monetary and fiscal policies overall are
likely to remain prudent (we expect one more 25bp rate cut in
February and then a prolonged pause).
• In the world’s largest democracy, it shouldn’t be surprising that
reforms are progressing only gradually, but over time they add up. Of
all the EM economies, India is one of the few in which we are positive
on both growth and economic fundamentals, i.e. sustainable growth.
S:\Economics\subbaraman\Stuff\Asia database\Big ppt excels\India\cash to gdp.xlsx
S:\Economics\subbaraman\Stuff\Asia database\Big ppt excels\India\India demonetisation charts.xlsx
5.0
5.5
6.0
6.5
7.0
7.5
8.0
8.5
9.0
Dec-13 Dec-14 Dec-15 Dec-16 Dec-17
% y-o-y
Forecast
-100
-80
-60
-40
-20
0
20
40
60
Sep-98 Sep-01 Sep-04 Sep-07 Sep-10 Sep-13 Sep-16
USD bn, 4Q rolling sum Net FDI
Current account balance
Basic balance
5
6
7
8
9
10
11
12
13Cash-to-GDP% GDP
Forecast
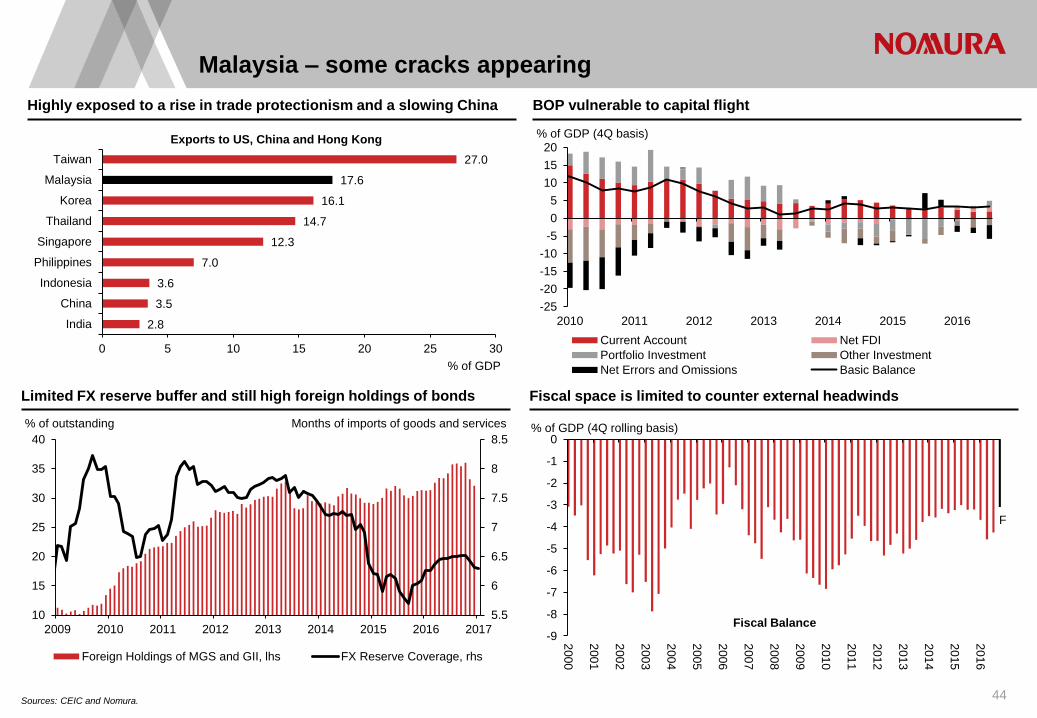
Malaysia – some cracks appearing
44
Fiscal space is limited to counter external headwinds Limited FX reserve buffer and still high foreign holdings of bonds
Highly exposed to a rise in trade protectionism and a slowing China BOP vulnerable to capital flight
Sources: CEIC and Nomura.
policy - S:\Economics\subbaraman\Stuff\Asia database\Big ppt excels\2016 july - malaysia charts.xlsx
Fiscal- \\japan.nom\data\FID\Fixed Income\EconResearch\Economics\subbaraman\Stuff\Asia database\Big ppt excels\Malaysia charts (for Rob).xlsx
TB, GDP - S:\Economics\subbaraman\Stuff\Asia database\Big ppt excels\2016 sep malaysia charts.xlsx
All charts - S:\Economics\subbaraman\Stuff\Asia database\Big ppt excels\Malaysia\Book 1.xlsx
-25
-20
-15
-10
-5
0
5
10
15
20
2010 2011 2012 2013 2014 2015 2016
Current Account Net FDI
Portfolio Investment Other Investment
Net Errors and Omissions Basic Balance
% of GDP (4Q basis)
-9
-8
-7
-6
-5
-4
-3
-2
-1
0
200
0
200
1
200
2
200
3
200
4
200
5
200
6
200
7
200
8
200
9
201
0
201
1
201
2
201
3
201
4
201
5
201
6
Fiscal Balance
% of GDP (4Q rolling basis)
F
2.8
3.5
3.6
7.0
12.3
14.7
16.1
17.6
27.0
0 5 10 15 20 25 30
India
China
Indonesia
Philippines
Singapore
Thailand
Korea
Malaysia
Taiwan
Exports to US, China and Hong Kong
% of GDP
5.5
6
6.5
7
7.5
8
8.5
10
15
20
25
30
35
40
2009 2010 2011 2012 2013 2014 2015 2016 2017
Foreign Holdings of MGS and GII, lhs FX Reserve Coverage, rhs
% of outstanding Months of imports of goods and services
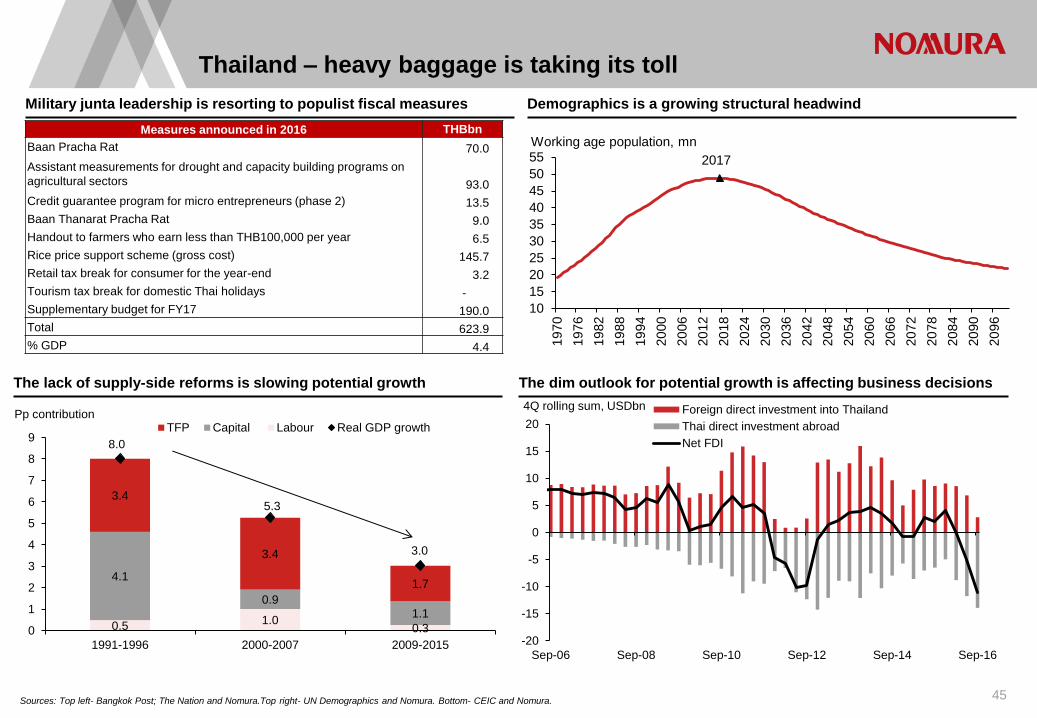
Thailand – heavy baggage is taking its toll
45
Military junta leadership is resorting to populist fiscal measures Demographics is a growing structural headwind
The lack of supply-side reforms is slowing potential growth The dim outlook for potential growth is affecting business decisions
Sources: Top left- Bangkok Post; The Nation and Nomura.Top right- UN Demographics and Nomura. Bottom- CEIC and Nomura.
Oil imports- S:\Economics\subbaraman\Stuff\Asia database\commodity and oil trade fig 5&6.xlsx
HH debt, Biz sentiment, FDI- S:\Economics\subbaraman\Stuff\Asia database\Big ppt excels\asean charts.XLS
Measures announced in 2016 THBbn
Baan Pracha Rat 70.0
Assistant measurements for drought and capacity building programs on
agricultural sectors 93.0
Credit guarantee program for micro entrepreneurs (phase 2) 13.5
Baan Thanarat Pracha Rat 9.0
Handout to farmers who earn less than THB100,000 per year 6.5
Rice price support scheme (gross cost) 145.7
Retail tax break for consumer for the year-end 3.2
Tourism tax break for domestic Thai holidays -
Supplementary budget for FY17 190.0
Total 623.9
% GDP 4.4
2017
10
15
20
25
30
35
40
45
50
55
19
70
19
76
19
82
19
88
19
94
20
00
20
06
20
12
20
18
20
24
20
30
20
36
20
42
20
48
20
54
20
60
20
66
20
72
20
78
20
84
20
90
20
96
Working age population, mn
-20
-15
-10
-5
0
5
10
15
20
Sep-06 Sep-08 Sep-10 Sep-12 Sep-14 Sep-16
4Q rolling sum, USDbn Foreign direct investment into Thailand
Thai direct investment abroad
Net FDI
0.5 1.0
0.3
4.1
0.9 1.1
3.4
3.4
1.7
8.0
5.3
3.0
0
1
2
3
4
5
6
7
8
9
1991-1996 2000-2007 2009-2015
TFP Capital Labour Real GDP growthPp contribution
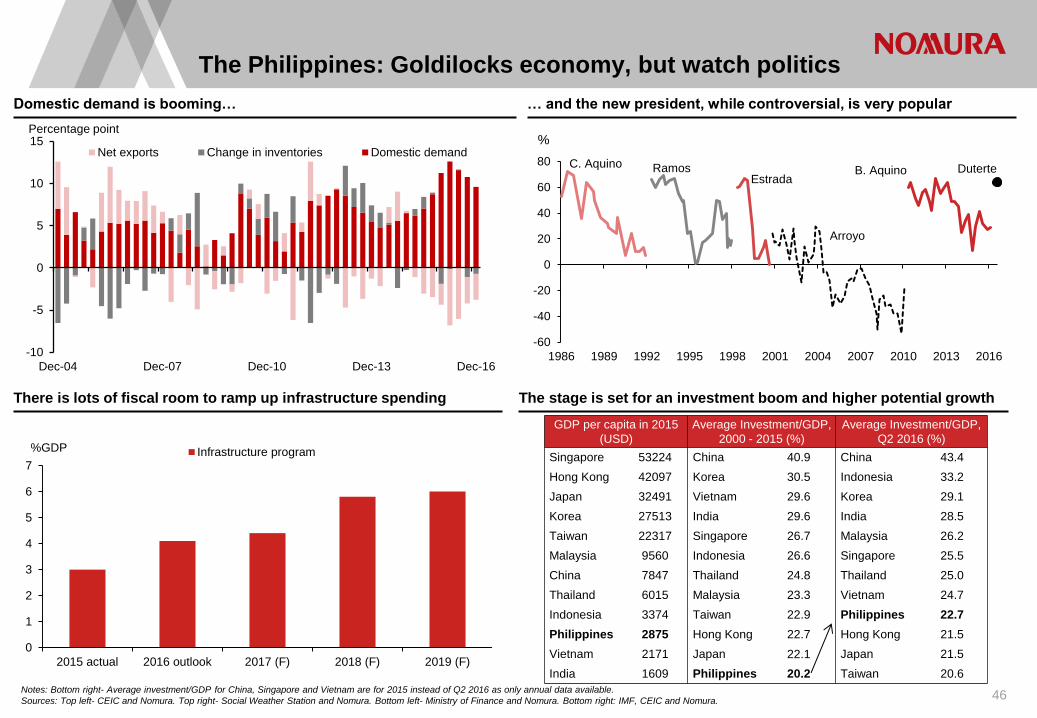
The Philippines: Goldilocks economy, but watch politics
46
Domestic demand is booming… … and the new president, while controversial, is very popular
There is lots of fiscal room to ramp up infrastructure spending The stage is set for an investment boom and higher potential growth
Notes: Bottom right- Average investment/GDP for China, Singapore and Vietnam are for 2015 instead of Q2 2016 as only annual data available.
Sources: Top left- CEIC and Nomura. Top right- Social Weather Station and Nomura. Bottom left- Ministry of Finance and Nomura. Bottom right: IMF, CEIC and Nomura.
S:\Economics\subbaraman\Stuff\Asia database\Big ppt excels\Phil_Feb 2015.xlsx
GDP per capita in 2015
(USD)
Average Investment/GDP,
2000 - 2015 (%)
Average Investment/GDP,
Q2 2016 (%)
Singapore 53224 China 40.9 China 43.4
Hong Kong 42097 Korea 30.5 Indonesia 33.2
Japan 32491 Vietnam 29.6 Korea 29.1
Korea 27513 India 29.6 India 28.5
Taiwan 22317 Singapore 26.7 Malaysia 26.2
Malaysia 9560 Indonesia 26.6 Singapore 25.5
China 7847 Thailand 24.8 Thailand 25.0
Thailand 6015 Malaysia 23.3 Vietnam 24.7
Indonesia 3374 Taiwan 22.9 Philippines 22.7
Philippines 2875 Hong Kong 22.7 Hong Kong 21.5
Vietnam 2171 Japan 22.1 Japan 21.5
India 1609 Philippines 20.2 Taiwan 20.6
-60
-40
-20
0
20
40
60
80
1986 1989 1992 1995 1998 2001 2004 2007 2010 2013 2016
%
C. Aquino Ramos Estrada
Arroyo
B. Aquino Duterte
0
1
2
3
4
5
6
7
2015 actual 2016 outlook 2017 (F) 2018 (F) 2019 (F)
Infrastructure program%GDP
-10
-5
0
5
10
15
Dec-04 Dec-07 Dec-10 Dec-13 Dec-16
Percentage point
Net exports Change in inventories Domestic demand
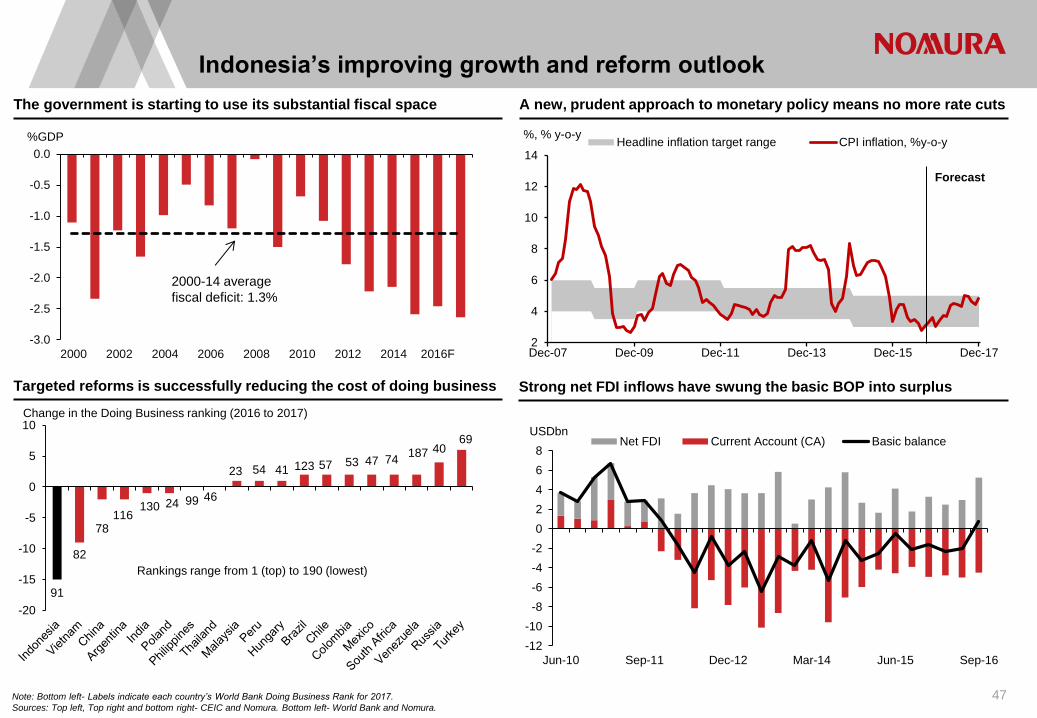
Indonesia’s improving growth and reform outlook
47
The government is starting to use its substantial fiscal space
Targeted reforms is successfully reducing the cost of doing business
Note: Bottom left- Labels indicate each country’s World Bank Doing Business Rank for 2017.
Sources: Top left, Top right and bottom right- CEIC and Nomura. Bottom left- World Bank and Nomura.
Fiscal, Jokowi- S:\Economics\subbaraman\Stuff\Asia database\Big ppt excels\asean charts.XLS
Strong net FDI inflows have swung the basic BOP into surplus
Measures- S:\Economics\subbaraman\Stuff\Asia database\Big ppt excels\indo latest charts.xlsx
CPI- S:\Economics\subbaraman\Stuff\Asia database\Big ppt excels\2016 july asean charts update july 2016 (2).xlsx
A new, prudent approach to monetary policy means no more rate cuts
-3.0
-2.5
-2.0
-1.5
-1.0
-0.5
0.0
2000 2002 2004 2006 2008 2010 2012 2014 2016F
%GDP
2000-14 average
fiscal deficit: 1.3%
2
4
6
8
10
12
14
Dec-07 Dec-09 Dec-11 Dec-13 Dec-15 Dec-17
Headline inflation target range CPI inflation, %y-o-y%, % y-o-y
Forecast
-12
-10
-8
-6
-4
-2
0
2
4
6
8
Jun-10 Sep-11 Dec-12 Mar-14 Jun-15 Sep-16
Net FDI Current Account (CA) Basic balanceUSDbn
91
82
78 116
130 24 99 46
23 54 41 123 57 53 47 74 187 40
69
-20
-15
-10
-5
0
5
10Change in the Doing Business ranking (2016 to 2017)
Rankings range from 1 (top) to 190 (lowest)
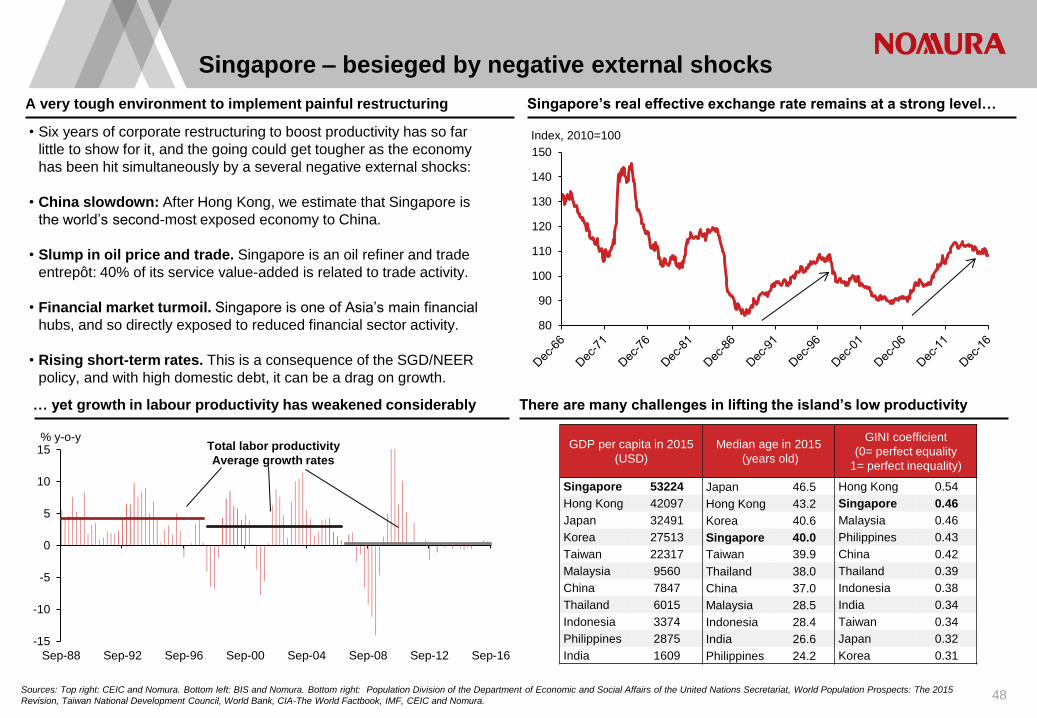
Singapore – besieged by negative external shocks
48
A very tough environment to implement painful restructuring Singapore’s real effective exchange rate remains at a strong level…
… yet growth in labour productivity has weakened considerably There are many challenges in lifting the island’s low productivity
Sources: Top right: CEIC and Nomura. Bottom left: BIS and Nomura. Bottom right: Population Division of the Department of Economic and Social Affairs of the United Nations Secretariat, World Population Prospects: The 2015
Revision, Taiwan National Development Council, World Bank, CIA-The World Factbook, IMF, CEIC and Nomura.
GDP per capita in 2015
(USD)
Median age in 2015
(years old)
GINI coefficient
(0= perfect equality
1= perfect inequality)
Singapore 53224 Japan 46.5 Hong Kong 0.54
Hong Kong 42097 Hong Kong 43.2 Singapore 0.46
Japan 32491 Korea 40.6 Malaysia 0.46
Korea 27513 Singapore 40.0 Philippines 0.43
Taiwan 22317 Taiwan 39.9 China 0.42
Malaysia 9560 Thailand 38.0 Thailand 0.39
China 7847 China 37.0 Indonesia 0.38
Thailand 6015 Malaysia 28.5 India 0.34
Indonesia 3374 Indonesia 28.4 Taiwan 0.34
Philippines 2875 India 26.6 Japan 0.32
India 1609 Philippines 24.2 Korea 0.31
• Six years of corporate restructuring to boost productivity has so far
little to show for it, and the going could get tougher as the economy
has been hit simultaneously by a several negative external shocks:
• China slowdown: After Hong Kong, we estimate that Singapore is
the world’s second-most exposed economy to China.
• Slump in oil price and trade. Singapore is an oil refiner and trade
entrepôt: 40% of its service value-added is related to trade activity.
• Financial market turmoil. Singapore is one of Asia’s main financial
hubs, and so directly exposed to reduced financial sector activity.
• Rising short-term rates. This is a consequence of the SGD/NEER
policy, and with high domestic debt, it can be a drag on growth.
S:\Economics\subbaraman\Stuff\Asia database\Big ppt excels\Singapore.xlsx
-15
-10
-5
0
5
10
15
Sep-88 Sep-92 Sep-96 Sep-00 Sep-04 Sep-08 Sep-12 Sep-16
% y-o-y Total labor productivity
Average growth rates
80
90
100
110
120
130
140
150
Index, 2010=100
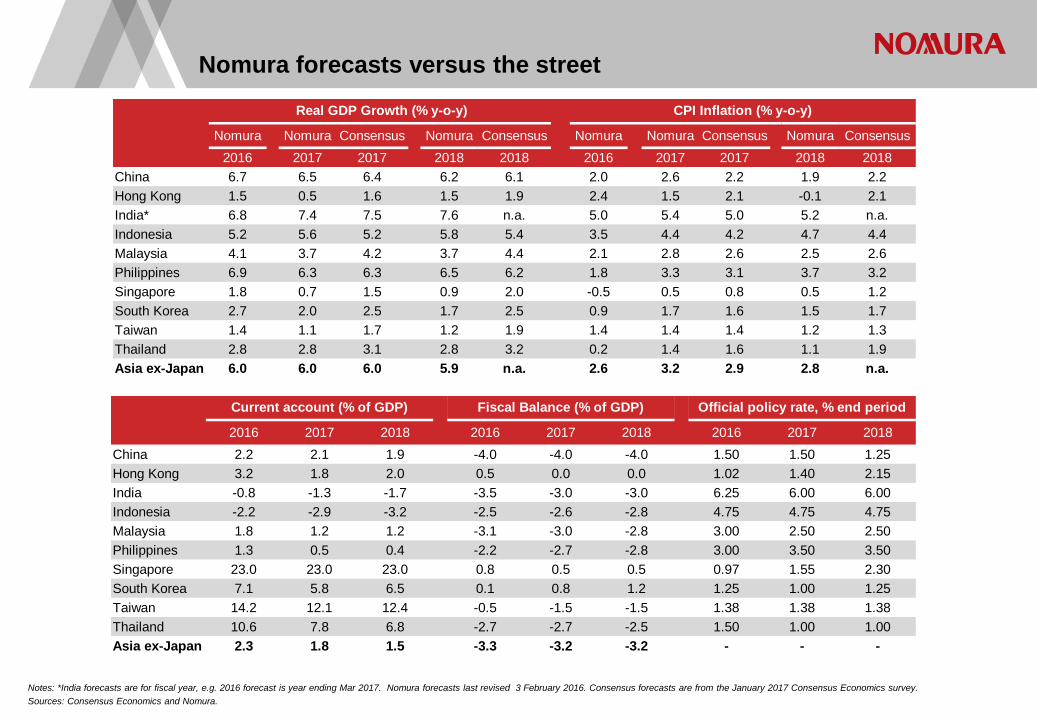
Notes: *India forecasts are for fiscal year, e.g. 2016 forecast is year ending Mar 2017. Nomura forecasts last revised 3 February 2016. Consensus forecasts are from the January 2017 Consensus Economics survey.
Sources: Consensus Economics and Nomura.
Nomura forecasts versus the street
S:\Economics\subbaraman\Stuff\Asia database\templates\table templates.xlsx
Nomura Nomura Consensus Nomura Consensus Nomura Nomura Consensus Nomura Consensus
2016 2017 2017 2018 2018 2016 2017 2017 2018 2018
China 6.7 6.5 6.4 6.2 6.1 2.0 2.6 2.2 1.9 2.2
Hong Kong 1.5 0.5 1.6 1.5 1.9 2.4 1.5 2.1 -0.1 2.1
India* 6.8 7.4 7.5 7.6 n.a. 5.0 5.4 5.0 5.2 n.a.
Indonesia 5.2 5.6 5.2 5.8 5.4 3.5 4.4 4.2 4.7 4.4
Malaysia 4.1 3.7 4.2 3.7 4.4 2.1 2.8 2.6 2.5 2.6
Philippines 6.9 6.3 6.3 6.5 6.2 1.8 3.3 3.1 3.7 3.2
Singapore 1.8 0.7 1.5 0.9 2.0 -0.5 0.5 0.8 0.5 1.2
South Korea 2.7 2.0 2.5 1.7 2.5 0.9 1.7 1.6 1.5 1.7
Taiwan 1.4 1.1 1.7 1.2 1.9 1.4 1.4 1.4 1.2 1.3
Thailand 2.8 2.8 3.1 2.8 3.2 0.2 1.4 1.6 1.1 1.9
Asia ex-Japan 6.0 6.0 6.0 5.9 n.a. 2.6 3.2 2.9 2.8 n.a.
Real GDP Growth (% y-o-y) CPI Inflation (% y-o-y)
2016 2017 2018 2016 2017 2018 2016 2017 2018
China 2.2 2.1 1.9 -4.0 -4.0 -4.0 1.50 1.50 1.25
Hong Kong 3.2 1.8 2.0 0.5 0.0 0.0 1.02 1.40 2.15
India -0.8 -1.3 -1.7 -3.5 -3.0 -3.0 6.25 6.00 6.00
Indonesia -2.2 -2.9 -3.2 -2.5 -2.6 -2.8 4.75 4.75 4.75
Malaysia 1.8 1.2 1.2 -3.1 -3.0 -2.8 3.00 2.50 2.50
Philippines 1.3 0.5 0.4 -2.2 -2.7 -2.8 3.00 3.50 3.50
Singapore 23.0 23.0 23.0 0.8 0.5 0.5 0.97 1.55 2.30
South Korea 7.1 5.8 6.5 0.1 0.8 1.2 1.25 1.00 1.25
Taiwan 14.2 12.1 12.4 -0.5 -1.5 -1.5 1.38 1.38 1.38
Thailand 10.6 7.8 6.8 -2.7 -2.7 -2.5 1.50 1.00 1.00
Asia ex-Japan 2.3 1.8 1.5 -3.3 -3.2 -3.2 - - -
Current account (% of GDP) Fiscal Balance (% of GDP) Official policy rate, % end period

Asia Special Reports
50
Asia Ex-Japan: Fixed-income Research team
51
Chief Economist,
Asia ex-Japan /
Head of Fixed
Income Research
Asia ex-Japan
Senior Korea
Economist
Senior India
Economist
Senior
Southeast Asia
Economist
Senior China
Economist
Head of EM FX Strategy,
Asia Ex- Japan
Northeast Asia
Rates Strategist
India/Southeast Asia
Rates Strategist
Australia rates
Strategist
Rob Subbaraman , MD
(Singapore-based)
Young Sun Kwon, MD
(HK-based)
Sonal Varma, MD
(Singapore-based)
Euben Paracuelles, ED
(Singapore-based)
Yang Zhao, ED
(HK-based)
Craig Chan, MD
(Singapore-based)
Albert Leung, ED
(HK-based)
Vivek Rajpal, ED
(Singapore-based)
Andrew Ticehurst, ED
(Australia-based)
Appendix A-1
Analyst Certification
I, Robert Nemmara Subbaraman, hereby certify (1) that the views expressed in this Research report accurately reflect my personal views about any or all of the subject securities or issuers referred to in this
Research report, (2) no part of my compensation was, is or will be directly or indirectly related to the specific recommendations or views expressed in this Research report and (3) no part of my compensation
is tied to any specific investment banking transactions performed by Nomura Securities International, Inc., Nomura International plc or any other Nomura Group company.
Important Disclosures Online availability of research and conflict-of-interest disclosures Nomura Group research is available on www.nomuranow.com/research, Bloomberg, Capital IQ, Factset, MarkitHub, Reuters and ThomsonOne.
Important disclosures may be read at http://go.nomuranow.com/research/globalresearchportal/pages/disclosures/disclosures.aspx or requested from Nomura Securities International, Inc., or Instinet, LLC on
1-877-865-5752. If you have any difficulties with the website, please email [email protected] for help.
The analysts responsible for preparing this report have received compensation based upon various factors including the firm's total revenues, a portion of which is generated by Investment Banking activities.
Unless otherwise noted, the non-US analysts listed at the front of this report are not registered/qualified as research analysts under FINRA rules, may not be associated persons of NSI or ILLC, and may not
be subject to FINRA Rule 2241 restrictions on communications with covered companies, public appearances, and trading securities held by a research analyst account.
Nomura Global Financial Products Inc. (“NGFP”) Nomura Derivative Products Inc. (“NDPI”) and Nomura International plc. (“NIplc”) are registered with the Commodities Futures Trading Commission and the
National Futures Association (NFA) as swap dealers. NGFP, NDPI, and NIplc are generally engaged in the trading of swaps and other derivative products, any of which may be the subject of this report.
Disclaimers This publication contains material that has been prepared by the Nomura Group entity identified on page 1 and, if applicable, with the contributions of one or more Nomura Group entities whose employees
and their respective affiliations are specified on page 1 or identified elsewhere in the publication. The term "Nomura Group" used herein refers to Nomura Holdings, Inc. and its affiliates and subsidiaries
including: Nomura Securities Co., Ltd. ('NSC') Tokyo, Japan; Nomura International plc ('NIplc'), UK; Nomura Securities International, Inc. ('NSI'), New York, US; Instinet, LLC ('ILLC'); Nomura International
(Hong Kong) Ltd. (‘NIHK’), Hong Kong; Nomura Financial Investment (Korea) Co., Ltd. (‘NFIK’), Korea (Information on Nomura analysts registered with the Korea Financial Investment Association ('KOFIA')
can be found on the KOFIA Intranet at http://dis.kofia.or.kr); Nomura Singapore Ltd. (‘NSL’), Singapore (Registration number 197201440E, regulated by the Monetary Authority of Singapore); Nomura Australia
Ltd. (‘NAL’), Australia (ABN 48 003 032 513), regulated by the Australian Securities and Investment Commission ('ASIC') and holder of an Australian financial services licence number 246412; P.T. Nomura
Indonesia (‘PTNI’), Indonesia; Nomura Securities Malaysia Sdn. Bhd. (‘NSM’), Malaysia; NIHK, Taipei Branch (‘NITB’), Taiwan; Nomura Financial Advisory and Securities (India) Private Limited (‘NFASL’),
Mumbai, India (Registered Address: Ceejay House, Level 11, Plot F, Shivsagar Estate, Dr. Annie Besant Road, Worli, Mumbai- 400 018, India; Tel: +91 22 4037 4037, Fax: +91 22 4037 4111; CIN No:
U74140MH2007PTC169116, SEBI Registration No. for Stock Broking activities : BSE INB011299030, NSE INB231299034, INF231299034, INE 231299034, MCX: INE261299034; SEBI Registration No. for
Merchant Banking : INM000011419; SEBI Registration No. for Research: INH000001014 and NIplc, Madrid Branch (‘NIplc, Madrid’). ‘CNS Thailand’ next to an analyst’s name on the front page of a research
report indicates that the analyst is employed by Capital Nomura Securities Public Company Limited (‘CNS’) to provide research assistance services to NSL under an agreement between CNS and NSL.
‘NSFSPL’ next to an employee’s name on the front page of a research report indicates that the individual is employed by Nomura Structured Finance Services Private Limited to provide assistance to certain
Nomura entities under inter-company agreements. The "BDO-NS" (which stands for "BDO Nomura Securities, Inc.") placed next to an analyst’s name on the front page of a research report indicates that the
analyst is employed by BDO Unibank Inc. ("BDO Unibank") who has been seconded to BDO-NS, to provide research assistance services to NSL under an agreement between BDO Unibank, NSL and BDO-
NS. BDO-NS is a Philippines securities dealer, which is a joint venture between BDO Unibank and the Nomura Group.
THIS MATERIAL IS: (I) FOR YOUR PRIVATE INFORMATION, AND WE ARE NOT SOLICITING ANY ACTION BASED UPON IT; (II) NOT TO BE CONSTRUED AS AN OFFER TO SELL OR A
SOLICITATION OF AN OFFER TO BUY ANY SECURITY IN ANY JURISDICTION WHERE SUCH OFFER OR SOLICITATION WOULD BE ILLEGAL; AND (III) OTHER THAN DISCLOSURES RELATING TO
THE NOMURA GROUP, BASED UPON INFORMATION FROM SOURCES THAT WE CONSIDER RELIABLE, BUT HAS NOT BEEN INDEPENDENTLY VERIFIED BY NOMURA GROUP.
Other than disclosures relating to the Nomura Group, the Nomura Group does not warrant or represent that the document is accurate, complete, reliable, fit for any particular purpose or merchantable and
does not accept liability for any act (or decision not to act) resulting from use of this document and related data. To the maximum extent permissible all warranties and
other assurances by the Nomura Group are hereby excluded and the Nomura Group shall have no liability for the use, misuse, or distribution of this information.
Opinions or estimates expressed are current opinions as of the original publication date appearing on this material and the information, including the opinions and estimates contained herein, are subject to
change without notice. The Nomura Group is under no duty to update this document. Any comments or statements made herein are those of the author(s) and may differ from views held by other parties within
Nomura Group. Clients should consider whether any advice or recommendation in this report is suitable for their particular circumstances and, if appropriate, seek professional advice, including tax advice. The
Nomura Group does not provide tax advice.
The Nomura Group, and/or its officers, directors and employees, may, to the extent permitted by applicable law and/or regulation, deal as principal, agent, or otherwise, or have long or short positions in, or
buy or sell, the securities, commodities or instruments, or options or other derivative instruments based thereon, of issuers or securities mentioned herein. The Nomura Group companies may also act as
market maker or liquidity provider (within the meaning of applicable regulations in the UK) in the financial instruments of the issuer. Where the activity of market maker is carried out in accordance with the
definition given to it by specific laws and regulations of the US or other jurisdictions, this will be separately disclosed within the specific issuer disclosures.
This document may contain information obtained from third parties, including ratings from credit ratings agencies such as Standard & Poor’s. Reproduction and distribution of third-party content in any form is
prohibited except with the prior written permission of the related third-party. Third-party content providers do not guarantee the accuracy, completeness, timeliness or availability of any information, including
ratings, and are not responsible for any errors or omissions (negligent or otherwise), regardless of the cause, or for the results obtained from the use of such content. Third-party content providers give no
express or implied warranties, including, but not limited to, any warranties of merchantability or fitness for a particular purpose or use. Third-party content providers shall not be liable for any direct, indirect,
incidental, exemplary, compensatory, punitive, special or consequential damages, costs, expenses, legal fees, or losses (including lost income or profits and opportunity costs) in connection with any use of
their content, including ratings. Credit ratings are statements of opinions and are not statements of fact or recommendations to purchase hold or sell securities. They do not address the suitability of securities
or the suitability of securities for investment purposes, and should not be relied on as investment advice.
Any MSCI sourced information in this document is the exclusive property of MSCI Inc. (‘MSCI’). Without prior written permission of MSCI, this information and any other MSCI intellectual property may not be
reproduced, re-disseminated or used to create any financial products, including any indices. This information is provided on an "as is" basis. The user assumes the entire risk of any use made of this
information. MSCI, its affiliates and any third party involved in, or related to, computing or compiling the information hereby expressly disclaim all warranties of originality, accuracy, completeness,
merchantability or fitness for a particular purpose with respect to any of this information. Without limiting any of the foregoing, in no event shall MSCI, any of its affiliates or any third party involved in, or related
to, computing or compiling the information have any liability for any damages of any kind. MSCI and the MSCI indexes are services marks of MSCI and its affiliates.
The intellectual property right and any other rights, in Russell/Nomura Japan Equity Index belong to Nomura Securities Co., Ltd. ("Nomura") and Frank Russell Company ("Russell"). Nomura and Russell do
not guarantee accuracy, completeness, reliability, usefulness, marketability, merchantability or fitness of the Index, and do not account for business activities or services that any index user and/or its affiliates
undertakes with the use of the Index.
Investors should consider this document as only a single factor in making their investment decision and, as such, the report should not be viewed as identifying or suggesting all risks, direct or indirect, that
may be associated with any investment decision. Nomura Group produces a number of different types of research product including, among others, fundamental analysis and quantitative analysis;
recommendations contained in one type of research product may differ from recommendations contained in other types of research product, whether as a result of differing time horizons, methodologies or
otherwise. The Nomura Group publishes research product in a number of different ways including the posting of product on the Nomura Group portals and/or distribution directly to clients. Different groups of
clients may receive different products and services from the research department depending on their individual requirements.
Figures presented herein may refer to past performance or simulations based on past performance which are not reliable indicators of future performance. Where the information contains an indication of
future performance, such forecasts may not be a reliable indicator of future performance. Moreover, simulations are based on models and simplifying assumptions which may oversimplify and not reflect the
future distribution of returns.
Certain securities are subject to fluctuations in exchange rates that could have an adverse effect on the value or price of, or income derived from, the investment.
With respect to Fixed Income Research: Recommendations fall into two categories: tactical, which typically last up to three months; or strategic, which typically last from 6-12 months. However, trade
recommendations may be reviewed at any time as circumstances change. ‘Stop loss’ levels for trades are also provided; which, if hit, closes the trade recommendation automatically. Prices and yields shown
in recommendations are taken at the time of submission for publication and are based on either indicative Bloomberg, Reuters or Nomura prices and yields at that time. The prices and yields shown are not
necessarily those at which the trade recommendation can be implemented.
The securities described herein may not have been registered under the US Securities Act of 1933 (the ‘1933 Act’), and, in such case, may not be offered or sold in the US or to US persons unless they have
been registered under the 1933 Act, or except in compliance with an exemption from the registration requirements of the 1933 Act. Unless governing law permits otherwise, any transaction should be executed
via a Nomura entity in your home jurisdiction.
This document has been approved for distribution in the UK and European Economic Area as investment research by NIplc. NIplc is authorised by the Prudential Regulation Authority and regulated by the
Financial Conduct Authority and the Prudential Regulation Authority. NIplc is a member of the London Stock Exchange. This document does not constitute a personal recommendation within the meaning of
applicable regulations in the UK, or take into account the particular investment objectives, financial situations, or needs of individual investors. This
document is intended only for investors who are 'eligible counterparties' or 'professional clients' for the purposes of applicable regulations in the UK, and may not, therefore, be redistributed to persons who are
'retail clients' for such purposes. This document has been approved by NIHK, which is regulated by the Hong Kong Securities and Futures Commission, for distribution in Hong Kong by NIHK. This document
has been approved for distribution in Australia by NAL, which is authorized and regulated in Australia by the ASIC. This document has also been approved for distribution in Malaysia by NSM. In Singapore,
this document has been distributed by NSL. NSL accepts legal responsibility for the content of this document, where it concerns securities, futures and foreign exchange, issued by their foreign affiliates in
respect of recipients who are not accredited, expert or institutional investors as defined by the Securities and Futures Act (Chapter 289). Recipients of this document in Singapore should contact NSL in
respect of matters arising from, or in connection with, this document. Unless prohibited by the provisions of Regulation S of the 1933 Act, this material is distributed in the US, by NSI, a US-registered broker-
dealer, which accepts responsibility for its contents in accordance with the provisions of Rule 15a-6, under the US Securities Exchange Act of 1934. The entity that prepared this document permits its
separately operated affiliates within the Nomura Group to make copies of such documents available to their clients.
This document has not been approved for distribution to persons other than ‘Authorised Persons’, ‘Exempt Persons’ or ‘Institutions’ (as defined by the Capital Markets Authority) in the Kingdom of Saudi Arabia
(‘Saudi Arabia’) or 'professional clients' (as defined by the Dubai Financial Services Authority) in the United Arab Emirates (‘UAE’) or a ‘Market Counterparty’ or ‘Business Customers’ (as defined by the Qatar
Financial Centre Regulatory Authority) in the State of Qatar (‘Qatar’) by Nomura Saudi Arabia, NIplc or any other member of the Nomura Group, as the case may be. Neither this document nor any copy
thereof may be taken or transmitted or distributed, directly or indirectly, by any person other than those authorised to do so into Saudi Arabia or in the UAE or in Qatar or to any person other than ‘Authorised
Persons’, ‘Exempt Persons’ or ‘Institutions’ located in Saudi Arabia or 'professional clients' in the UAE or a ‘Market Counterparty’ or ‘Business Customers’ in Qatar . By accepting to receive this document, you
represent that you are not located in Saudi Arabia or that you are an ‘Authorised Person’, an ‘Exempt Person’ or an ‘Institution’ in Saudi Arabia or that you are a 'professional client' in the UAE or a ‘Market
Counterparty’ or ‘Business Customers’ in Qatar and agree to comply with these restrictions. Any failure to comply with these restrictions may constitute a violation of the laws of the UAE or Saudi Arabia or
Qatar.
For report with reference of TAIWAN public companies or authored by Taiwan based research analyst:
THIS DOCUMENT IS SOLELY FOR REFERENCE ONLY. You should independently evaluate the investment risks and are solely responsible for your investment decisions. NO PORTION OF THE REPORT
MAY BE REPRODUCED OR QUOTED BY THE PRESS OR ANY OTHER PERSON WITHOUT WRITTEN AUTHORIZATION FROM NOMURA GROUP. Pursuant to Operational Regulations Governing
Securities Firms Recommending Trades in Securities to Customers and/or other applicable laws or regulations in Taiwan, you are prohibited to provide the reports to others (including but not limited to related
parties, affiliated companies and any other third parties) or engage in any activities in connection with the reports which may involve conflicts of interests. INFORMATION ON SECURITIES / INSTRUMENTS
NOT EXECUTABLE BY NOMURA INTERNATIONAL (HONG KONG) LTD., TAIPEI BRANCH IS FOR INFORMATIONAL PURPOSES ONLY AND IS NOT BE CONSTRUED AS A RECOMMENDATION OR A
SOLICITATION TO TRADE IN SUCH SECURITIES / INSTRUMENTS.
NO PART OF THIS MATERIAL MAY BE (I) COPIED, PHOTOCOPIED, OR DUPLICATED IN ANY FORM, BY ANY MEANS; OR (II) REDISTRIBUTED WITHOUT THE PRIOR WRITTEN CONSENT OF A
MEMBER OF THE NOMURA GROUP. If this document has been distributed by electronic transmission, such as e-mail, then such transmission cannot be guaranteed to be secure or error-free as information
could be intercepted, corrupted, lost, destroyed, arrive late or incomplete, or contain viruses. The sender therefore does not accept liability for any errors or omissions in the contents of this document, which
may arise as a result of electronic transmission. If verification is required, please request a hard-copy version.
Nomura Securities Co., Ltd. Financial instruments firm registered with the Kanto Local Finance Bureau (registration No. 142)
Member associations: Japan Securities Dealers Association; Japan Investment Advisers Association; The Financial Futures Association of Japan; and Type II Financial Instruments Firms Association.
The Nomura Group manages conflicts with respect to the production of research through its compliance policies and procedures (including, but not limited to, Conflicts of Interest, Chinese Wall and
Confidentiality policies) as well as through the maintenance of Chinese walls and employee training.
Additional information regarding the methodologies or models used in the production of any investment recommendations contained within this document is available upon request by
contacting the Research Analysts listed on the front page. Disclosures information is available upon request and disclosure information is available at the Nomura Disclosure web page:
http://go.nomuranow.com/research/globalresearchportal/pages/disclosures/disclosures.aspx
Copyright © 2017 Nomura International (Hong Kong) Ltd. All rights reserved.
Disclosures as of 02-Feb-2017.
Related Documents