ASEAN Integration in 2015 Dir. Mylah Faye Aurora B. Cariño, CESO IV Regional Director, NEDA Caraga Regional Forum on ASEAN Integration October 28, 2014 Butuan City

Welcome message from author
This document is posted to help you gain knowledge. Please leave a comment to let me know what you think about it! Share it to your friends and learn new things together.
Transcript

ASEAN Integration in 2015
Dir. Mylah Faye Aurora B. Cariño, CESO IV
Regional Director, NEDA Caraga
Regional Forum on ASEAN Integration
October 28, 2014
Butuan City

Outline of Presentation
• Introduction to ASEAN
• What is ASEAN Economic Integration in 2015?
• What does it mean for the Philippines and
Caraga Region?
• Challenges
• Opportunities
• Conclusion

Introduction to ASEAN
Association of Southeast Asian Nations
• Established on 8 August 1967 in
Bangkok, Thailand
• Has a population of about 600
million
• Total area of 4.5 million square
km.
• Total combined GDP of
US$737Billion
• AEC Vision 2020
• 2007 Cebu Declaration:
2015 deadline
ASEAN 6 + CLMV

ASEAN Charter
– Signed on 20 November 2007 & entered into force on
15 December 2008
– Enhance formal nature of ASEAN integration by making
it an international legal entity
– Instrument providing a legal framework for ASEAN to
be a more rules-based, effective & people-oriented
organization

Deepening and broadening economic
integration in ASEAN
• Coherent approach
towards external
economic relations
• Enhanced
participation in GPNs
Single market & production base
Competitiveeconomic region
iv
Full integration in global economy
Equitable economic development
ASEAN Economic Community Blueprint
• SME Development
• Initiative for
ASEAN Integration
Free(r) flow of
• Goods
• Services
• Investment
• Capital
• skilled labor
• Competition policy
• IPR
• Infrastructure
development
• Taxation & E-commerce
Source: JFCCT. 2012. AEC 2015 PPT

Brunei
Myanmar
AEC 2015 Benefits
ASEAN
Economic
Community
2015
Vietnam
Thailand
Singapore
Philippines
Cambodia
Indonesia
Laos
Malaysia
Greater regional
cooperation
Improved efficiency
More attractiveness than
individual countries
Emerging markets
Focuses on SMEs
More tourism opportunities
Internationalization of
health care

AEC Core Components:
Single Market & Production Base
Free Flow of
GoodsFree Flow of
Investments
Free Flow of
ServicesFree Flow of
Skilled Workers

• Elimination of tariff
• Elimination of non-tariff barriers: by 2010
(ASEAN-5), by 2012 (Philippines), and by
2015-2018 (CLMV)
Free Flow of Goods

Free Flow of Services
• No restrictions on ASEAN services suppliers in providing
services and in establishing companies across national borders
• Eliminate restrictions to trade in services
• Recognition of professional qualifications by recognizing mutual
recognition arrangements (MRAs)
• Substantial removal of all restrictions on trade in services
Priority sectors: air transport, e-ASEAN, healthcare & tourism by 2010;
logistics by 2013
• Negotiations of some specific services sectors such as financial
services and air transport are carried out by their respective
Ministerial bodies
Source: JFCCT. 2012
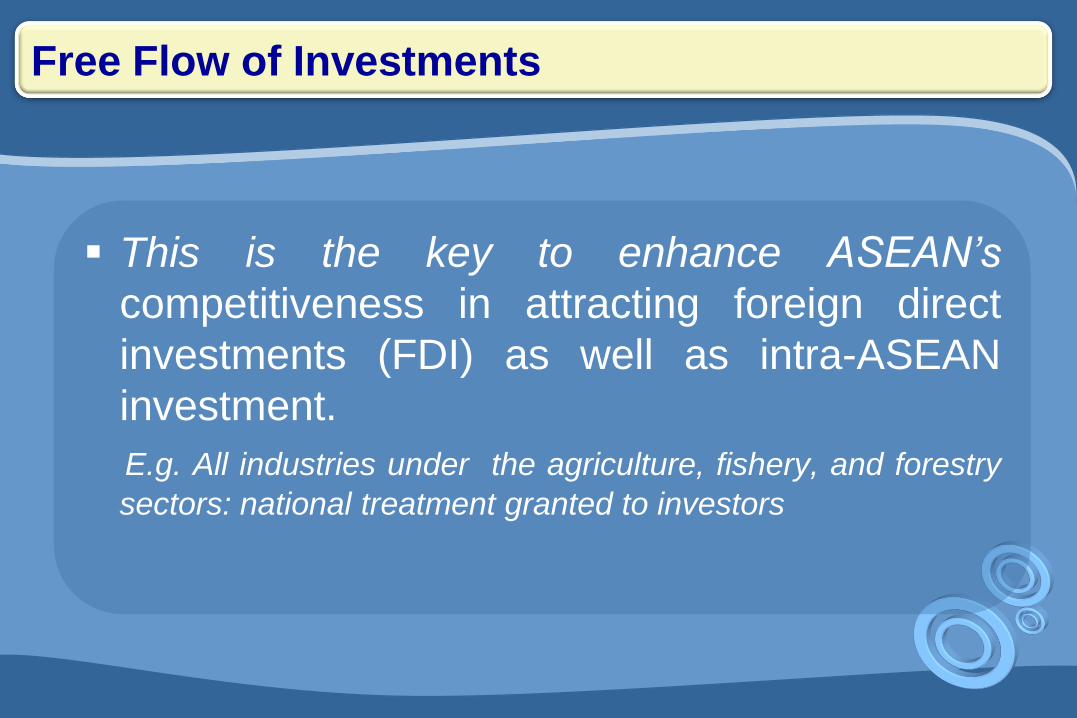
This is the key to enhance ASEAN’s
competitiveness in attracting foreign direct
investments (FDI) as well as intra-ASEAN
investment.
E.g. All industries under the agriculture, fishery, and forestry
sectors: national treatment granted to investors
Free Flow of Investments

Greater mobility of services
Greater mobility of qualified service professionals in
the region by accepting common standards of some
professionals
Free Flow of Skilled Workers

Broad status of our commitments
Free flow Status Notes
Goods Advanced EO 850 (Dec.’09) 0% tariff in ’10, range: 0-5%; rice,
sugar >5% tariff;2010 ASEAN share: 22% (exports);
28% (imports)
Investment Commenced 4 IPAs: investment promotion & facilitation remaining
foreign equity restrictions due to Constitutional
limitations
Skilled labor Commenced RA 8981 allows foreigners subject to foreign
reciprocity provisions
Accounting: bilateral negotiations commenced; PRC
& DOLE facilitate MRA implementation, DOLE
positive list
Services Behind Ph has lowest level of commitment in ASEAN
Many sectors unbound under Modes 3 & 4
Foreign equity restrictions due to Constitutional
limitations

What does it mean for the Philippines?

Philippine Trade with ASEAN (2012)
Top 10 Imports from ASEAN
Product Group%
Share
1 Electrical, electronic equipment 20.0
2 Mineral fuels, oils, distillation products 14.8
3 Machinery, nuclear reactors, boilers 11.4
4 Vehicles other than railway, tramway 8.9
5 Plastics and articles thereof 5.7
6 Miscellaneous edible preparations 3.0
7 Animal, vegetable fats and oils,
cleavage products
2.5
8 Cereals 2.1
9 Essential oils, perfumes, cosmetics,
toiletries
1.9
10 Optical, photo, technical, medical, etc
apparatus
1.9
Top 10 Exports to ASEAN
Product Group%
Share
1 Electrical, electronic equipment 59.5
2 Machinery, nuclear reactors, boilers 8.4
3 Vehicles other than railway, tramway 5.1
4 Mineral fuels, oils, distillation products 3.0
5 Optical, photo, technical, medical
apparatus
2.7
6 Copper and articles thereof 2.1
7 Tobacco and manufactured tobacco
substitutes
1.8
8 Cereal, flour, starch, milk preparations
and products
1.3
9 Rubber and articles thereof 1.2
10 Fertilizers 1.2
14
Source: ITC Trademap, August 2013

Global Competitiveness Index:
PH VS ASEAN
COUNTRIES 2011Out of 142
2012Out of 144
2013Out of 148
1. SINGAPORE 2 2 2
2. MALAYSIA 21 25 24
3. BRUNEI DARUSSALAM 28 28 26
4. THAILAND 39 38 37
5. INDONESIA 46 50 38
6. PHILIPPINES 75 65 59
7. VIETNAM 65 75 70
8. LAO PDR* - - 81
9. CAMBODIA 97 85 88
10. MYANMAR* - - 139
(*) – New Economies added for 2013 report
49
Source: DTI Caraga

Doing Business:
PH VS ASEAN
(*) – New Economies added for 2014 report
COUNTRIES2012
Out of 183
2013
Out of 185
2014
Out of 189
1. Singapore 1 1 1
2. Malaysia 14 12 6
3. Thailand 17 18 18
4. Brunei Darussalam 83 79 59
5. Vietnam 99 99 99
6. PHILIPPINES 136 138 108
7. Indonesia 130 128 120
8. Cambodia 141 133 137
9. Lao PDR 166 163 159
10. Myanmar* - - 182
63
Source: DTI Caraga

Foundation of overall national competitiveness
“We cannot build a competitive nation out of one or two competitive cities.”
– Mr. Guillermo M. LuzPrivate Sector Co-Chairman
Local
Competitiveness
Source: DTI Caraga

What will most likely happen?
Tariff and non-tariff barriers elimination EO 850 was passed in December 2009 which brought down tariffs onimports from ASEAN, to 0 % in 2010, except for a short ‘sensitive’ list ofproducts
As of 2010, duties have been eliminated on majority of agricultural andall industrial products
Not just tariffs but trade facilitation: Creation of anASEAN Single Window Customs modernization since 1996 thru computerization
Increased trade and investment opportunities Current share of ASEAN FDI is still minimal
Access to badly needed foreign investment & technology especially ininfrastructure development

What will most likely happen?
• Increased trade and investment opportunities
• Winners & losers: how to manage short term adjustment costs?
Winners: firms that gain from market expansion & improved competitiveness,
workers who get employed in growing sectors, government to collect higher
revenue, consumers from wide variety of goods & services at lower prices
Losers: inefficient, uncompetitive sectors
• English language
• Highly-skilled workers – shortage? engineers, doctors, etc working abroad/migrated
• PH: site for lower value activities in the supply/value chain? Low skilled workers: Cambodia, Lao PDR, Myanmar
• Tourism
• BPO-IT
• Agriculture: rice, sugar (highly sensitive/sensitive list)
• Utilities, infrastructure: continue to be restricted

Opportunities for Filipino firms to expand
• Market access Filipino companies can sell to 600 million people
• Investment liberalization, facilitation, promotion, protection,
national treatment, MFN treatment of investors Can own 100% of companies in other ASEAN countries
Should be treated equally as local companies/people
Should be able to own 70% (maybe more) of services companies
Access to capital markets, repatriation of profits & dividends
Likely to be many non-ASEAN companies looking for entry
• Labor mobility: visa, economic test May be able to bring in workers easier (complementary to services)
• Transport & logistics, trade facilitation, product standardization & conformance: lower transaction costs
Improved administrative processes (customs, mutual recognition arrangements)
Easier/less costly movement goods

Opportunities for the Filipino people
– Employment creation (higher wages)– Higher & faster growth– Larger FDI flows
Access to badly needed foreign investment & technology especially in infrastructure development
– Improved competitiveness & productivity through efficient resource allocation, scale economies & fragmented production
– Businesses including SMEs: larger market access, lower input costs, lower transaction costs, lower trade related costs & easier trade operations
– Investors: stronger investment rights – Better standard of living
Access to better quality goods & services at lower prices: consumers biggest beneficiaries

Part 5. Final Thoughts
• Re-orient view of “business threat” & fear tactics
• Focus on advantages & opportunities for Filipino people and consumers Access to better quality goods & services Lower prices Employment opportunities Better standard of living
• Government to implement reforms to facilitate adjustment process to
AEC 2015 (to be elaborated in the industry roadmap session) Strengthen institutional & regulatory environment before & during
liberalization Industry upgrading & restructuring: move up the value chain Human resource development
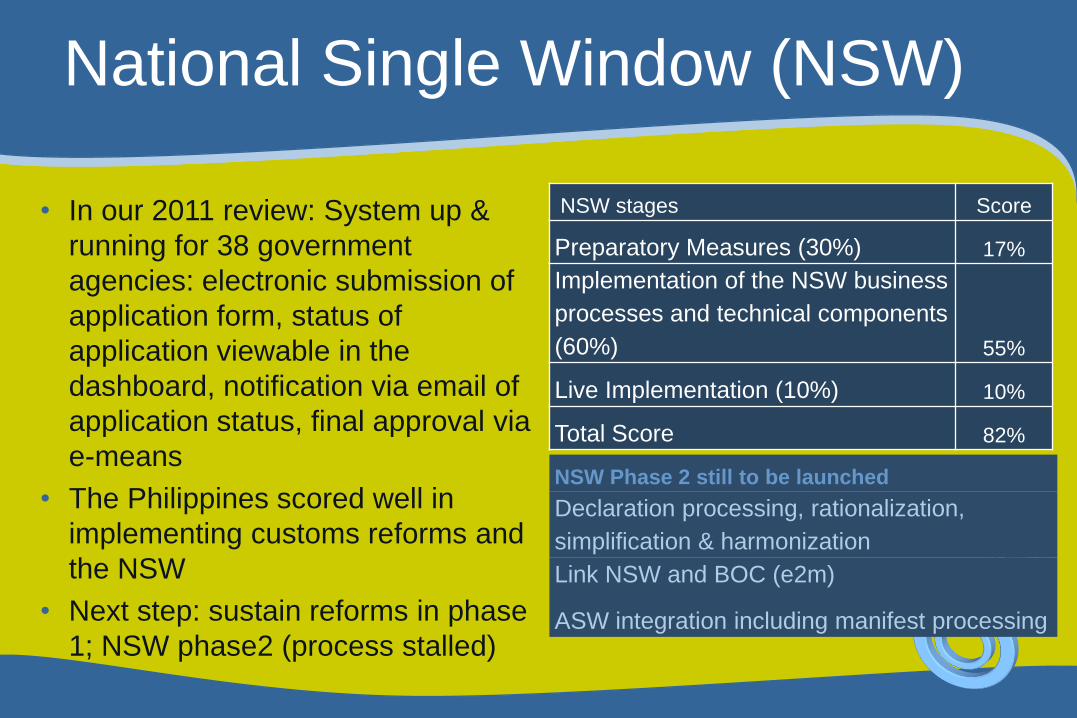
National Single Window (NSW)
• In our 2011 review: System up &
running for 38 government
agencies: electronic submission of
application form, status of
application viewable in the
dashboard, notification via email of
application status, final approval via
e-means
• The Philippines scored well in
implementing customs reforms and
the NSW
• Next step: sustain reforms in phase
1; NSW phase2 (process stalled)
NSW stages Score
Preparatory Measures (30%) 17%
Implementation of the NSW business
processes and technical components
(60%) 55%
Live Implementation (10%) 10%
Total Score 82%
NSW Phase 2 still to be launched
Declaration processing, rationalization,
simplification & harmonization
Link NSW and BOC (e2m)
ASW integration including manifest processing

What will most likely happen?
Winners & losers: how to manage short term adjustment costs?
Winners: firms that gain from market expansion & improved
competitiveness, workers who get employed in growing sectors,
government to collect higher revenue, consumers from wide
variety of goods & services at lower prices
Losers: inefficient, uncompetitive sectors
Connectivity and transport facilitation
Masterplan for ASEAN Connectivity: RORO Network
Review of the Cabotage Law to allow foreign vessels in Philippine
waters

What will most likely happen?
English language will be widely used in ASEAN:
Filipino’s advantage
Highly-skilled workers – shortage?
engineers, doctors, etc. working abroad/migrated
PH: site for lower value activities in the supply/value chain?
Low skilled workers: Cambodia, Lao PDR, Myanmar
Structural transformation did not take place: PH’s manufacturing
sector should have a sustained and positive growth
Tourism and BPO-IT: booming sectors
Agriculture: rice, sugar (highly sensitive/sensitive list)
Utilities, infrastructure: continue to be restricted

Is the Philippines ready?
Competition from new entrants to the market
– Bigger with more financial capability
– Better technical products/service systems
– May get support from home countries
– More experience competing already
Products at risk (losing competitiveness 90s-20s)
Product Group Sub-group
Forest products veneers, plywood
Tropical
agriculture
sugars, molasses, honey; cocoa;
natural rubber
Animal products fish(fresh, chilled, frozen); animal,
vegetable fats, oils, nes
Labor-intensive pottery; furniture, cushions, etc;
trunks, suitcases, bags; clothing
accessories, fabric; footwear; baby
carriage, toys, games; gold,
silverware jewellery, nes
• Leave but how to move up the value or product chain?

Is the Philippines ready (cont’d)
Product Group Product Group
Forest products copper ores & copper
Raw materials fuel wood, wood charcoal
Cereal, etc Unmanufactured tobacco & vegetable
textile fibers
Labor-intensive Knitted men’s, boys clothing; knitted
women, girl clothing; other textile
apparel
Capital-intensive tulle, lace, embroidery
Machinery electric distribution equipment, nes;
radio broadcast receiver; transistors,
valves
Chemicals alcohol, phenol
• High competitiveness
products
• Mostly products at low
end of value/supply
chain, how to move up
the value chain?

Is the Philippines ready? (cont’d)
Product Group Product Group
Animal products milk & cream
Cereals, etc tobacco manufactured
cereal preparations*, edible prod.*
Machinery electric power machinery, parts; electric
machinery apparatus nes; parts for tractors
& motor vehicles
ship, boat, float structures* cycles,
motorcycles; aircraft, associated
equipment; medical instruments;
arms/ammunitions
Labor-intensive glass
Chemicals metal salts, inorganic acid
soap, cleaners, polish, etc
Forest Pulp & paper*
Capital-intensive furskins, tanned, dressed
• Emerging
champions or
potentially
competitive
products
• How do we build on
these products?

What should be done before 2015?
Improve competitiveness of industries- remove obstacles to growth (investment climate)
- efficient use of existing capacity & expansion of productive capacity
thru technological catch-up, structural transformation
Effective government policies to catalyze private
sector growth
Boost infra spending (5% of the GDP)
Improve port infrastructure and modernize port
operation (through efficient PPP)

What does it mean for Caraga Region?

Region/Year 2011-2012 2012-2013
Philippines 6.8 7.2
NCR Metro Manila 7.0 9.1
CAR Cordillera 1.0 6.0
I Ilocos 5.2 7.7
II Cagayan Valley 8.1 6.6
III Central Luzon 6.5 4.3
IVA CALABARZON 7.3 6.7
IVB MIMAROPA 4.8 1.7
V Bicol 6.9 9.4
VI Western Visayas 7.7 4.1
VII Central Visayas 9.4 7.4
VIII Eastern Visayas (6.4) 5.7
IX Zamboanga Peninsula 12.9 4.3
X Northern Mindanao 7.2 5.6
XI Davao Region 7.4 6.8
XII SOCCSKSARGEN 8.0 8.4
XIII Caraga 10.7 7.8
ARMM Muslim Mindanao 1.1 3.6
GRDP Growth Rates, At Constant 2000 Prices, in Percent, 2011-2013
Source: PSA-NSCB 2014.

The Service sector constituted the
biggest share to the region’s Gross
Regional Domestic Product (GRDP) at
44.8 percent in 2013; followed by the
Industry sector which accounted for 34.4
percent.
Industry GRDP (in thousand pesos) Percent Distribution Growth Rates
2012 2013 2012 2013 2011-2012 2012-2013
Industry Sector 26,502,550 28,744,458 34.2 34.4 18.2 8.5
a. Mining and Quarrying 16,936,652 18,431,335 21.8 22.1 20.5 8.8
b. Manufacturing 2,453,057 2,398,531 3.2 2.9 4.4 (2.2)
c. Construction 5,948,514 6,445,449 7.7 7.7 21.6 8.4
d. Electricity, Gas and Water Supply 1,164,327 1,469,143 1.5 1.8 5.0 26.2
Service Sector 34,879,204 37,424,048 45.0 44.8 9.5 7.3
a. Transport, Storage & Communication 11,803,477 13,146,969 15.2 15.7 15.6 11.4
b. Trade and Repair of Motor Vehicles, Motorcycles,
Personal and Household Goods
3,015,601 3,193,045 3.9 3.8 8.7 5.9
c. Financial Intermediation 3,067,164 3,436,586 4.0 4.1 11.4 12.0
d. Real Estate, Renting & Business Activities 4,729,272 5,034,029 6.1 6.0 10.5 6.4
e. Public Administration & Defense; Compulsory Social
Security
4,514,797 4,807,657 5.8 5.8 7.2 6.5
f. Other Services 7,748,893 7,805,762 10.0 9.3 1.5 0.7
20.8%
34.4%
44.8%
AHFF
Industry
Service
37.4 billion
28.74 billion
17.38 billion

33
Caraga’s AFF and Industry Sectors Stagnated
Sector 1997 2013 Change
AFF 34.89 20.8 (14.09)
Industry 34.31 34.40 0.09
Mining and Quarrying 5.60 22.1 16.50
Manufacturing 12.20 2.9 (9.30)
Services 30.80 44.8 14.00
Transport, Storage & Communication 1.79 15.713.91
Trade & Repair of Motor Vehicles,
Motorcycles, Personal and Household
Goods
16.52 3.8
(12.72)
Financial Intermediation 0.72 4.1 3.38
R. Estate, Renting & Business 4.41 6.01.59
Public Administration & Defense;
Compulsory Social Security
4.99 5.8
0.81
Other Services 2.36 9.3 6.94
Total 100.00 100.00

Key Labor Statistics, Caraga, 2012-2013
2012 2013 % Change
Labor Force Participation Rate 65.23 66.5 1.94
Employment Rate 94.35 93.93 -0.44
Unemployment Rate 5.65 6.08 0.43
Underemployment Rate 24.15 27.13 2.98Source: PSA-NSO, 2014.

Caraga Subsectoral Employment Structure
Sector 2006a 2011b Change
AFF 44.4 37.8 -6.6
Agriculture, hunting and forestry 40.3 33.6 -6.7
Fishing 4.1 4.2 0.1
Industry 13.1 14.5 1.4
Mining and Quarrying 2.0 3.6 1.6
Manufacturing 7.1 6.8 -0.3
Electricity, gas and water 0.4 0.3 -0.1
Construction 3.6 3.8 0.2
Services 42.3 47.5 5.2
Wholesale and retail trade; repair of motor vehicles, motorcycles, and
personal and household goods
18.2 19.8 1.6
Hotels and restaurants 1.1 1.4 0.3
Transport, storage and communication 5.5 5.4 -0.1
Financial intermediation 0.7 0.9 0.2
Real estate, renting and business activities 1.2 1.1 -0.1
Public administration and defense; compulsory social security 5.9 8.5 2.6
Education 3.3 3.4 0.1
Health and social work 0.8 1.1 0.3
Other community, social and personal service activities 1.7 1.7 0.04
Private households with employed persons 3.8 4.2 0.4
Total 100.00% 100.00%
Source: NSO; Available figures: a October 2006, b January 2011

Rankout of 136
Region LGU Score
1 NCR Makati City 53.242174
2 Region 10 Cagayan de Oro City 49.363393
3 Region 5 Naga City 49.075166
4 Region 11 Davao City 47.716761
5 NCR Marikina City 45.465443
Overall Competitiveness – Top 5 Cities
2014 CMCI Rankings
6 – Iloilo City
7 – Cebu City
8 – Manila City
9 – Valenzuela City
10 – Paranaque City
Butuan City was
4th in rank in 2013
Source: DTI Caraga

2014 Rank 2013 Rank LGU Score
16 / 136 4 /122 Butuan City 40.337615
29 / 136 13 /122 Surigao City 36.048015
62 / 136 49 / 122 Cabadbaran City 31.731754
77 / 136 36 / 122 Bislig City 30.342161
78 / 136 Not ranked Bayugan City 30.295563
80 / 136 45 / 122 Tandag City 30.198204
Caraga Cities Rankings
2014 CMCI Rankings
Source: DTI Caraga

LGU Economic Dynamism Gov’t Efficiency Infrastructure
Butuan City 13/136 24/136 20/136
Surigao City 51/136 21/136 38/136
Cabadbaran City 55/136 77/136 51/136
Bislig City 95/136 33/136 112/136
Bayugan City 53/136 106/136 47/136
Tandag City 59/136 78/136 94/136
Caraga Cities Rankings Per Indicator
2014 CMCI Rankings
Source: DTI Caraga

2014 CMCI Rankings
Rankout of 399
Region Province LGU Score
1 Region 5 Camarines Norte Daet 43.239109
2 Region 4A Cavite General Trias 42.499789
3 Region 6 Aklan Kalibo 42.174935
4 Region 4A Cavite Carmona 41.794049
5 Region 11 Comval Nabunturan 41.112593
Overall Competitiveness – Top 5 Municipalities
San Francisco, Agusan del Sur
was 1st in rank in 2013
Source: DTI Caraga

2014 Rank 2013 Rank LGU Score
32 / 399 10/163 Prosperidad 34.252132
41 /399 1/163 San Francisco 33.752019
42 /399 41/163 Buenavista 33.651245
76 /399 - Sibagat 31.471653
82 /399 43/163 Claver 31.209036
87 /399 - Esperanza 30.97934
99 /399 25/163 Talacogon 30.353333
119 /399 - Bunawan 29.203765
122 /399 44/163 Nasipit 29.017735
123 /399 Not ranked Cantilan 29.003876
Caraga Municipalities Rankings
2014 CMCI Rankings
Source: DTI Caraga

2014 Rank 2013 Rank LGU Score
139 / 399 - San Miguel, SDS 28.516301
172 /399 Not ranked Barobo 26.836027
178 /399 42/163 San Jose, PDI 26.490542
196 /399 - Loreto, ADS 25.797938
199 /399 - La Paz 25.709702
215 /399 - Trento 24.549201
366 /399 - San Luis 12.695809
Caraga Municipalities Rankings
2014 CMCI Rankings
Source: DTI Caraga

LGU Economic Dynamism Gov’t Efficiency Infrastructure
Prosperidad 80/399 67/399 25/399
San Francisco 37/399 91/399 49/399
Buenavista 56/399 62/399 62/399
Sibagat 131/399 56/399 151/399
Claver 27/399 150/399 129/399
Esperanza 125/399 98/399 88/399
Caraga Municipalities Rankings Per Indicator
2014 CMCI Rankings
Source: DTI Caraga

LGU Economic Dynamism Gov’t Efficiency Infrastructure
Talacogon 139/399 93/399 138/399
Bunawan 142/399 121/399 148/399
Nasipit 42/399 267/399 38/399
Cantilan 277/399 87/399 86/399
San Miguel, SDS 181/399 204/399 20/399
Barobo 180/399 178/399 161/399
Caraga Municipalities Rankings Per Indicator
2014 CMCI Rankings
Source: DTI Caraga
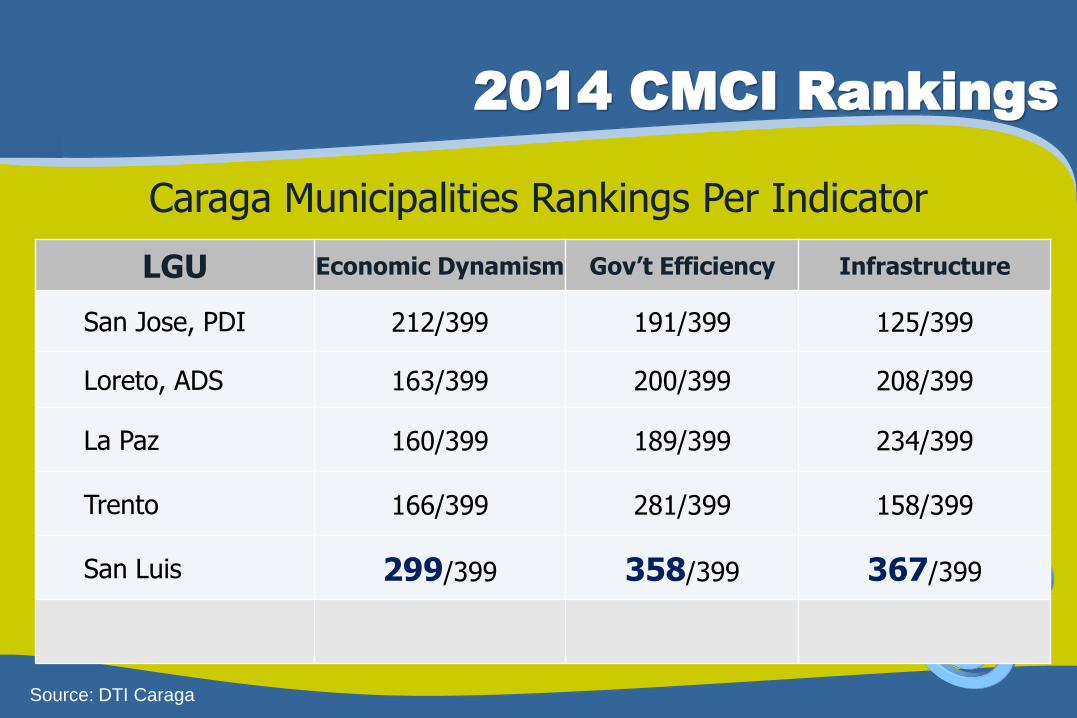
LGU Economic Dynamism Gov’t Efficiency Infrastructure
San Jose, PDI 212/399 191/399 125/399
Loreto, ADS 163/399 200/399 208/399
La Paz 160/399 189/399 234/399
Trento 166/399 281/399 158/399
San Luis 299/399 358/399 367/399
Caraga Municipalities Rankings Per Indicator
2014 CMCI Rankings
Source: DTI Caraga

Where are we ranked high?
2014 CMCI Rankings
Growth of Local Economy – our economy may be small in size but we showing considerable growth in terms of number of businesses that registers annually.
Business Groups – Involvement in established industry clusters provides proper representation
Cost of Doing Business – 17 out of 23 LGUs are ranked 52 and up; only six are ranked from 108 to 283
Business Registration Efficiency – Though results are varied, most LGUs are ranked in the 100 level.
Land Use and DRRMC Plans – Majority of the LGUs have complied with these directives except for two
Source: DTI Caraga

2014 CMCI Rankings
Security – The number of police personnel serving in an LGU is generally close to the required number as against the total population
Education Personnel and Infra – Teacher-student ratio is generally high. However, the total number of high schools and classrooms is ranked in the middle
Availability of Basic Utilities – Utilities are generally available 24/7 except for some LGUs facing challenges with water
Connection to ICT – All LGUs have mobile connection and thru it, internet connection.
Where are we ranked high?
Source: DTI Caraga

Where are we ranked low?
2014 CMCI Rankings
Size of Local Economy – the number of business registrants in our LGUs are not that competitive with other regions
Jobs – Some LGUs do not maintain data on number of persons employed in a business
Inflation Rate – Ranked as high as 126 and as low as 352
Financial Institutions (FIs) – lack of FIs in rural towns
Productivity – lack of data on number of jobs pulls down the high rankings of other LGUs
LGPMS Scores – Although 3 LGUs are ranked 1, the rest are ranked low with 6 LGUs ranked 300 and lower
Source: DTI Caraga

2014 CMCI Rankings
Ratio of LGU-collected taxes to LGU revenues – only 2 LGUs are ranked in the 100’s, all the rest are ranked in 200’s
LGU competitions-related awards – 10 LGUs have not received any relevant award for the last three years
Health Personnel and Infra – There is a lack of hospital infra and personnel in some LGUs. In some areas, the close proximity to a city with bigger hospitals/clinics negates the demand to establish local hospitals
DOT-accredited Tourism-related establishments - Lacking in most LGUs.
Where are we ranked low?
Source: DTI Caraga

Ways forward for Caraga Region
Be able to walk on two legs “manufacturing + services”
Promote value-adding activities to generate massive
employment
Leverage on FAME to boost competitiveness
Encourage private sector investment including SMEs
Address job skills mismatch and strengthen HRD
Improve infrastructure facilities
Ensure quality education and instruction to produce competent
graduates

O P P O R T U N I T I E S …
More employment opportunities particularly in the
12 key sectors
Agro-based goods
Air Transport
Automotive products
eASEAN (including ICT equipment)
Electronics goods
Wood based products
Bigger market + More FDI = More Employment
Fisheries
Health Care Products
Rubber based goods
Textile and Clothing
Tourism
Logistics

More Skills =More Quality
Job Opportunities
Compensation
Working environment
Professional growth
In demand
CHOICESCAPABILITY
O P P O R T U N I T I E S …

Mobility of skilled workers/Free entry of
professionals
O P P O R T U N I T I E S …
Issuance of visas and employment passes for
ASEAN professionals and skilled labor
Recognition of professionals from among the
ASEAN Members
Mutual Recognition Arrangements (MRAs)

Mutual Recognition Arrangements (MRAs)
A. Business/Professional Services
Engineering services (KL, Malaysia, 12/5/05)
Architectural services (Singapore, 11/19/07)
Surveying qualifications (Singapore, 11/19/07)
Accountancy services (Singapore, 9/25/08)
B. Medical/Professional Services
Nursing services (Cebu, Phil., 12/8/06)
Medical practitioners (Singapore, 8/25/08)
Dental practitioners (Cha-Am, Thailand, 2/26/09)
Recognition of professional qualifications and harmonization and
standardization
O P P O R T U N I T I E S …

Recognition
Education
Training
Experience
Certificates/
Licenses
Mobility
The ASEAN Mutual Recognition Arrangements (MRAs)
O P P O R T U N I T I E S …

Easier transfer of knowledge and skills
O P P O R T U N I T I E S …

Better information sharing
O P P O R T U N I T I E S …

More access to capability building
initiatives of the ASEAN
O P P O R T U N I T I E S …

C H A L L E N G E S …
Entry of skilled professionals from other
ASEAN countries/Competition from new
entrants to the market

Being competitive/Competitiveness Issues
Facing Selected Professions:
e.g. Engineering, Accountancy, Nursing
C H A L L E N G E S …

How can you boost your availability and
expertise?
C H A L L E N G E S …

Getting the necessary
accreditation/recognition
C H A L L E N G E S …

Effectiveness of mechanisms for provision
of continuing professional education
C H A L L E N G E S …

C H A L L E N G E S …
Differences in culture, language and
effective communication

C H A L L E N G E S …
Adjustment to local laws and regulations of
the adopted/host country
Acceptance by local professional
practitioners

Role of the Barangays
• Facilitation for a transition from informal to formal (registered) sector of
microenterprises*
• Improving the capacity of LGUs to handle disasters and calamities**
• Providing support to the local police force and local security officials
(barangay watches) to be more effective keepers of the peace and
order to further attract potential investors and tourists**
• Identification of current major and niche industries that can compete
regionally and consultation with experts to improve marketing of
strategies of said industries
• Identification of possible tourist destinations and proper maintenance
and promotion of existing ones
Sources: *Aldaba, R. and Aldaba, F., Philippine Institute for Development Studies Discussion Paper Series No. 2014-30
** 2015 ASEAN Economic Integration FAQ, Local Government Academy, DILG, 2013

Conclusion
• AEC 2015 is not a threat but an opportunity to
be seized
• There are still many things that need to be done
to maximize our gains
• Being competitive is the key in taking advantage
of the opportunities that come with AEC 2015

Thank You!!!
Related Documents