Aquaculture Stewardship Council and Marine Stewardship Council ASC-MSC Seaweed (Algae) Risk Based Framework Version 1.0, 7 March, 2018

Welcome message from author
This document is posted to help you gain knowledge. Please leave a comment to let me know what you think about it! Share it to your friends and learn new things together.
Transcript

Aquaculture Stewardship Council and Marine Stewardship Council
ASC-MSC Seaweed (Algae) Risk Based Framework
Version 1.0, 7 March, 2018
Document: ASC-MSC Seaweed (Algae) Risk Based Framework v1.0 Page 2 Date of publication: 7 March 2018 © Aquaculture Stewardship Council and Marine Stewardship Council 2018
Copyright notice
The “ASC-MSC Seaweed (Algae) Risk Based Framework” developed by the Aquaculture Stewardship Council (ASC) and the Marine Stewardship Council (MSC) is licenced under a Creative Commons Attribution-NoDerivs 3.0 Unported Licence 2018. All rights reserved.
The official language of this standard is English. The definitive version is maintained at www.asc-aqua.org/seaweed-standard. Any discrepancy between copies, versions or translations shall be resolved by reference to the definitive English version.
The ASC and the MSC prohibit any modification of part or all the contents in any form.
Email: [email protected]
Document: ASC-MSC Seaweed (Algae) Risk Based Framework v1.0 Page 3 Date of publication: 7 March 2018 © Aquaculture Stewardship Council and Marine Stewardship Council 2018
Versions published
Justification for the ASC-MSC Seaweed (Algae) Standard
The Aquaculture Stewardship Council (ASC) and the Marine Stewardship Council (MSC) are independent, non-profit organisations that are globally recognised as the world’s most credible and science-based standards for sustainable and responsible seafood. The ASC sets standards for responsible aquaculture and the MSC sets standards for the sustainable capture of wild seafood. The ASC and the MSC certification programs share a common heritage and vision that global seafood supplies should be sustainable, responsibly managed, and supported by secure supply chains.
The joint vision and mission of the ASC and the MSC in developing this standard is to contribute to the health of the world’s aquatic ecosystems by recognising, and rewarding through certification, environmentally sustainable and socially responsible seaweed harvesting/farming and farming practices.
Independent third-party certification by accredited Conformity Assessment Bodies (CABs)
The science and metric based ASC-MSC Seaweed (Algae) Standard (“the Standard” thereinafter) for the sustainable farming and harvesting/farming of wild populations of algae offers a way to confirm sustainability, using a credible, independent third-party assessment process. It means that sustainable and responsible harvesting/farming of wild populations and farming can be recognised and rewarded in the marketplace, and gives an assurance to consumers that algae (or by-products derived from algae) come from a well-managed and sustainable source. Certified harvesting/farming and farming activities incorporate institutional and operational frameworks that require the use of the resource to be responsible and sustainable from both a social and environmental point of view.
Version no. Date of publication Description of amendment
1.0 7 March 2018 First version issued for application by CABs.

Document: ASC-MSC Seaweed (Algae) Risk Based Framework v1.0 Page 4 Date of publication: 7 March 2018 © Aquaculture Stewardship Council and Marine Stewardship Council 2018
Introduction to the Risk Based Framework
The ASC-MSC intention in allowing the use of a risk-based approach is to ensure that its assessment
process is accessible to data-deficient production units that are readily demonstrated as operating in
a precautionary manner.
The FAO Guidelines on Ecolabelling for Fisheries and Fisheries Products from Marine Capture
Fisheries provided the conceptual basis for the adoption of a risk-based approach to the evaluation of
seaweed production units against certain Performance Indicators (PIs) in circumstances where
information is inadequate to evaluate those PIs conventionally.
In paragraph 32, the FAO guidelines state:
“…the use of less elaborate methods for assessment of stocks should not preclude fisheries from
possible certification for ecolabelling. However it should be noted that, to the extent that the
application of such methods results in greater uncertainty about the state of the ‘stock under
consideration’, more precautionary approaches to managing such resources will be required which
may necessitate lower levels of utilization of the resource”.
In the absence of detailed scientific information of the impacts of the production unit, the Risk Based
Framework (RBF) provides qualitative and semi-quantitative methodologies to determine the extent to
which harvesting/farming is demonstrably “precautionary” or of “less risk”.
The RBF considers a combination of risk-based indicators to arrive at a risk score which translates to
an equivalent ASC-MSC score. The risk-based indicators used in this process include qualitative and
semi-quantitative proxies which assess the impact of harvesting/farming that corresponds with the
level of utilisation of the resource. In addition, the approach requires the team to adopt the worst-case
scenario approach to score risk-based indicators in the absence of credible evidence, information or
logical reasoning to the contrary.
In the event of the RBF being used for a PI, the likelihood of being scored high risk and of receiving
low ASC-MSC scores on the specified indicator increases with increasing scale and intensity of
utilisation of resources in the production unit. While the RBF allows the use of more qualitative
information obtained under an extensive stakeholder consultation process, increased uncertainty
around the information or evidence used, or the lack of consensus on information obtained in the
process, will result in the most cautious (worst plausible) score being applied, furthering the likelihood
of lower ASC-MSC scores.
Implicit in the approach is a recognition that production units which are operating at relatively high
levels of utilisation pose a greater risk to the ecological components with which they interact, and that
the assessment and management of such risks must be underpinned by comprehensive scientific
information.
Implementation
The Seaweed (Algae) Risk Based Framework v1.0 was published 7 March 2018 and is effective from
7 March 2018. Seaweed production units who wish to enter assessment against the Standard can
apply from 1 March 2018, or earlier subject to approval by the ASC-MSC.
The RBF for Principle 1 is currently being developed following the ASC-MSC Standard Setting
Procedure. More information about this development can be found at www.improvements.msc.org.
Comments on the RBF may be submitted at any time by email to [email protected].

Document: ASC-MSC Seaweed (Algae) Risk Based Framework v1.0 Page 5 Date of publication: 7 March 2018 © Aquaculture Stewardship Council and Marine Stewardship Council 2018
Table of Contents
1 Scope......................................................................................................................................... 6
2 Terms and definitions .............................................................................................................. 6
3 Applying the RBF ..................................................................................................................... 6
3.1 Performance Indicators .............................................................................................................. 6
4 Stakeholder Involvement in the RBF ..................................................................................... 7
4.1 Announcing the RBF .................................................................................................................. 7
4.2 Information gathering ................................................................................................................. 8
4.3 Stakeholder consultation ............................................................................................................ 9
5 Consequence Analysis (CA) ................................................................................................. 11
5.1 Preparation ............................................................................................................................... 11
5.2 Stakeholder involvement in CA ................................................................................................ 11
5.3 Determine the CA score ........................................................................................................... 13
6 Productivity Susceptibility Analysis (PSA) ......................................................................... 14
6.1 Preparation ............................................................................................................................... 14
6.2 Stakeholder involvement within the PSA ................................................................................. 15
6.3 Score the Productivity attributes .............................................................................................. 15
6.4 Score the susceptibility attributes ............................................................................................ 16
6.5 Final PSA score ....................................................................................................................... 20
6.6 Overall PI score ........................................................................................................................ 21
6.7 Setting conditions or critical conditions using the RBF for species PIs ................................... 21
7 Conducting a Consequence Spatial Analysis (CSA) .......................................................... 22
7.1 Preparation ............................................................................................................................... 22
7.2 Stakeholder involvement within the CSA ................................................................................. 23
7.3 CSA Step 1: Define the habitat(s) ............................................................................................ 23
7.4 CSA Step 2: Score the consequence attributes (Table 11) ..................................................... 25
7.5 CSA Step 3: Score the spatial attributes .................................................................................. 31
7.6 CSA Step 4: Determine the CSA score and equivalent MSC score ........................................ 32
7.7 Setting conditions using the CSA ............................................................................................. 32
8 Conducting a Scale Intensity Consequence Analysis (SICA) ........................................... 32
8.1 Preparation ............................................................................................................................... 33
8.2 Stakeholder involvement within the SICA ................................................................................ 33
8.3 SICA Step 1: Prepare SICA scoring template for each data-deficient scoring element .......... 33
8.4 SICA Step 2: Score spatial scale ............................................................................................. 35
8.5 SICA Step 3: Score temporal scale ......................................................................................... 35
8.6 SICA Step 4: Score the intensity .............................................................................................. 35
8.7 SICA Step 5: Identify the most vulnerable subcomponent of the ecosystem, and score the consequence of the activity on the subcomponent .................................................................. 37
8.8 Scoring PI 2.5.1 using the RBF ................................................................................................ 38
8.9 Setting conditions using the RBF ............................................................................................. 39
A.1 Annex A: Scoring Group of Species using the PSA .......................................................... 40
Document: ASC-MSC Seaweed (Algae) Risk Based Framework v1.0 Page 6 Date of publication: 7 March 2018 © Aquaculture Stewardship Council and Marine Stewardship Council 2018
1 Scope
The Risk Based Framework (RBF) includes requirements for CABs carrying out audits of seaweed production units that have insufficient information available to score the Unit of Assessment (UoA) using the default scoring system.
2 Terms and definitions
All definitions are in the Vocabulary contained in the ASC-MSC Seaweed (Algae) Certification and Accreditation Requirements.
3 Applying the RBF
3.1 Performance Indicators
3.1.1 The team shall use Table 5 in the ASC-MSC Seaweed (Algae) Standard (“the Standard” thereinafter) to determine if the RBF should be used to score a PI.
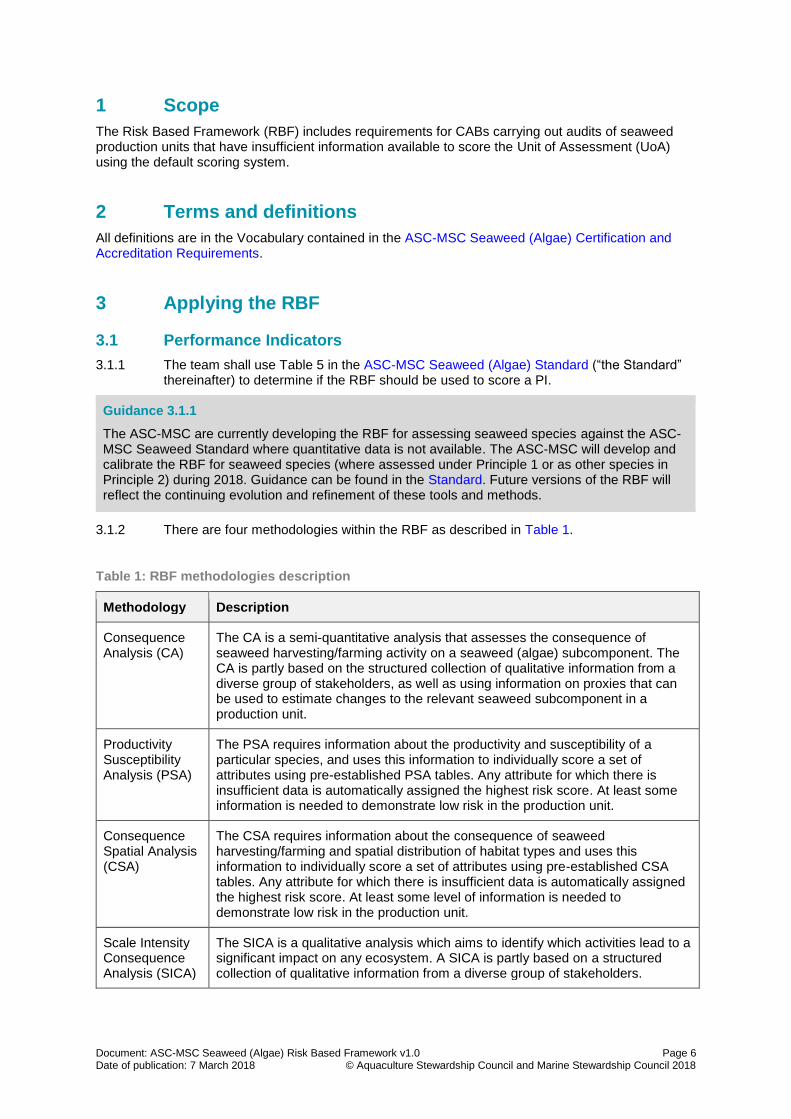
3.1.2 There are four methodologies within the RBF as described in Table 1.
Table 1: RBF methodologies description
Methodology Description
Consequence Analysis (CA)
The CA is a semi-quantitative analysis that assesses the consequence of seaweed harvesting/farming activity on a seaweed (algae) subcomponent. The CA is partly based on the structured collection of qualitative information from a diverse group of stakeholders, as well as using information on proxies that can be used to estimate changes to the relevant seaweed subcomponent in a production unit.
Productivity Susceptibility Analysis (PSA)
The PSA requires information about the productivity and susceptibility of a particular species, and uses this information to individually score a set of attributes using pre-established PSA tables. Any attribute for which there is insufficient data is automatically assigned the highest risk score. At least some information is needed to demonstrate low risk in the production unit.
Consequence Spatial Analysis (CSA)
The CSA requires information about the consequence of seaweed harvesting/farming and spatial distribution of habitat types and uses this information to individually score a set of attributes using pre-established CSA tables. Any attribute for which there is insufficient data is automatically assigned the highest risk score. At least some level of information is needed to demonstrate low risk in the production unit.
Scale Intensity Consequence Analysis (SICA)
The SICA is a qualitative analysis which aims to identify which activities lead to a significant impact on any ecosystem. A SICA is partly based on a structured collection of qualitative information from a diverse group of stakeholders.
Guidance 3.1.1
The ASC-MSC are currently developing the RBF for assessing seaweed species against the ASC-MSC Seaweed Standard where quantitative data is not available. The ASC-MSC will develop and calibrate the RBF for seaweed species (where assessed under Principle 1 or as other species in Principle 2) during 2018. Guidance can be found in the Standard. Future versions of the RBF will reflect the continuing evolution and refinement of these tools and methods.

Document: ASC-MSC Seaweed (Algae) Risk Based Framework v1.0 Page 7 Date of publication: 7 March 2018 © Aquaculture Stewardship Council and Marine Stewardship Council 2018
3.1.3 If the RBF is to be used for a PI, the team shall use Table 2 to determine which RBF methodologies should be used.
Table 2: RBF methodologies for each PI
PI RBF Methodology or methodologies to be used
1.1 Stock status Yes CA and PSA shall both be undertaken
2.1 Habitats Yes Only CSA
2.2 Ecosystem Yes Only SICA
2.3 ETP Species Yes Only PSA
2.4 Other species Yes Only PSA
All other PIs No RBF shall not be used
4 Stakeholder Involvement in the RBF
4.1 Announcing the RBF
4.1.1 If the team determines that the RBF is to be used for a PI, the team shall:
4.1.1.1 Justify the use of the RBF in the “ASC-MSC Seaweed (Algae) Audit Announcement Template” found at www.asc-aqua.org/what-we-do/our-standards/farm-standards/seaweed-standard/.
4.1.1.2 Send the template to the ASC-MSC for publication on its website.
4.1.1.3 The CAB shall inform stakeholders of the use of the RBF in the production unit assessment by including in communication, as a minimum, text equivalent to the following:
“A key purpose of the site visit is to collect information and speak to stakeholders with an interest in the production unit. For those parts of the assessment involving the ASC-MSC Seaweed Risk Based Framework (RBF), we will be using a stakeholder-driven, qualitative and semi-quantitative analysis during the site visit. To achieve a robust outcome from this consultative approach, we rely heavily on participation of a broad range of stakeholders with a balance of knowledge of the production unit. We encourage any stakeholders with experience or knowledge of the production unit to participate in these meetings.”
4.1.1.4 Allow at least 30 days for comment.
4.1.1.5 Consider all stakeholder input, recording why each comment has been accepted or rejected.
4.1.1.6 Review the decision to use the RBF (considering those comments).
4.1.1.7 Notify the ASC-MSC if a decision is made not to use the RBF for any PI for which it was previously announced.
Guidance 4.1
The use of the RBF needs to be communicated before the site visit to ensure stakeholders can effectively engage in the RBF process for all scoring elements being assessed.
The announcement of the use of the RBF should be done when the production unit assessment is first announced. The CAB may decide to trigger the RBF for a Performance Indicator (PI) after the production unit announcement; however, this will require additional communication to stakeholders
Document: ASC-MSC Seaweed (Algae) Risk Based Framework v1.0 Page 8 Date of publication: 7 March 2018 © Aquaculture Stewardship Council and Marine Stewardship Council 2018
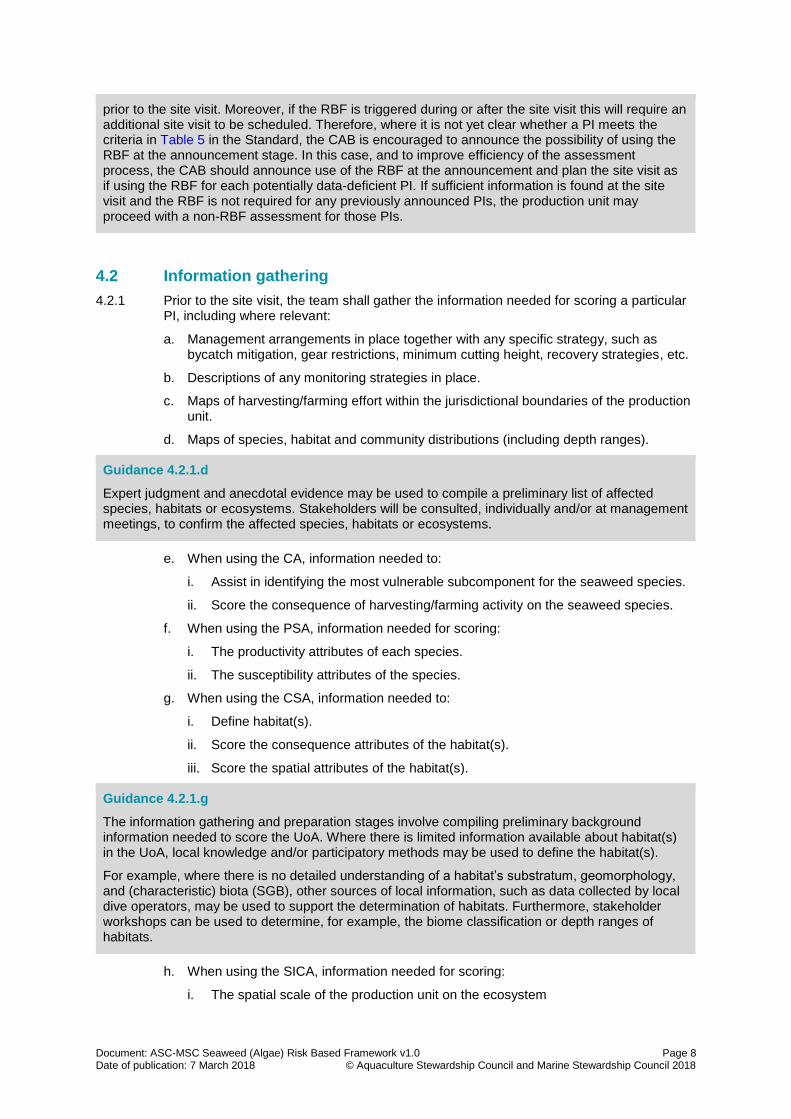
4.2 Information gathering
4.2.1 Prior to the site visit, the team shall gather the information needed for scoring a particular PI, including where relevant:
a. Management arrangements in place together with any specific strategy, such as bycatch mitigation, gear restrictions, minimum cutting height, recovery strategies, etc.
b. Descriptions of any monitoring strategies in place.
c. Maps of harvesting/farming effort within the jurisdictional boundaries of the production unit.
d. Maps of species, habitat and community distributions (including depth ranges).
e. When using the CA, information needed to:
i. Assist in identifying the most vulnerable subcomponent for the seaweed species.
ii. Score the consequence of harvesting/farming activity on the seaweed species.
f. When using the PSA, information needed for scoring:
i. The productivity attributes of each species.
ii. The susceptibility attributes of the species.
g. When using the CSA, information needed to:
i. Define habitat(s).
ii. Score the consequence attributes of the habitat(s).
iii. Score the spatial attributes of the habitat(s).
h. When using the SICA, information needed for scoring:
i. The spatial scale of the production unit on the ecosystem
prior to the site visit. Moreover, if the RBF is triggered during or after the site visit this will require an additional site visit to be scheduled. Therefore, where it is not yet clear whether a PI meets the criteria in Table 5 in the Standard, the CAB is encouraged to announce the possibility of using the RBF at the announcement stage. In this case, and to improve efficiency of the assessment process, the CAB should announce use of the RBF at the announcement and plan the site visit as if using the RBF for each potentially data-deficient PI. If sufficient information is found at the site visit and the RBF is not required for any previously announced PIs, the production unit may proceed with a non-RBF assessment for those PIs.
Guidance 4.2.1.d
Expert judgment and anecdotal evidence may be used to compile a preliminary list of affected species, habitats or ecosystems. Stakeholders will be consulted, individually and/or at management meetings, to confirm the affected species, habitats or ecosystems.
Guidance 4.2.1.g
The information gathering and preparation stages involve compiling preliminary background information needed to score the UoA. Where there is limited information available about habitat(s) in the UoA, local knowledge and/or participatory methods may be used to define the habitat(s).
For example, where there is no detailed understanding of a habitat’s substratum, geomorphology, and (characteristic) biota (SGB), other sources of local information, such as data collected by local dive operators, may be used to support the determination of habitats. Furthermore, stakeholder workshops can be used to determine, for example, the biome classification or depth ranges of habitats.

Document: ASC-MSC Seaweed (Algae) Risk Based Framework v1.0 Page 9 Date of publication: 7 March 2018 © Aquaculture Stewardship Council and Marine Stewardship Council 2018
ii. The temporal scale of the production unit on the ecosystem.
iii. The intensity of the production unit on the ecosystem
iv. The consequence of the activity on the ecosystem.
4.2.2 The information gathered above shall be used to inform the RBF stakeholder meeting(s).
4.2.2.1 The information should be made available to attendees where possible.
4.2.3 Information may also be collected during the site visit, and post-site visit as necessary.
4.2.4 The team shall use all the information gathered and reflect the analysis of this information when scoring the production unit.
4.3 Stakeholder consultation
4.3.1 The team shall carry out a stakeholder consultation process to gather data and to seek expert opinions.
4.3.2 The team shall plan the stakeholder consultation strategy to ensure effective participation from a range of stakeholders.
4.3.3 A range of stakeholder groups shall be consulted.
4.3.4 Stakeholders shall be identified early in the assessment process.
4.3.5 Meetings shall be organised to allow for the highest participation of stakeholders.
Guidance 4.3.2
Background work should be undertaken to ensure that time with stakeholders can focus on new issues that are made known by stakeholders.
Guidance 4.3.3
Stakeholder consultation with a suitably broad stakeholder group with a good balance of knowledge about the production unit is critical in a risk assessment, particularly at the qualitative (CA/SICA) level of an assessment. Stakeholders provide expert judgement, local knowledge, practical experience, ecological knowledge and raise issues that may not be covered in the documentation provided to the team.
The group should include at least harvesters/farmers, scientists, conservationists, indigenous representatives, managers, community members, processors, and other stakeholders as necessary.
Guidance 4.3.5
Early identification of stakeholders is vital to ensuring effective consultation during the assessment process. Identification of stakeholders needs to occur both through contacts known by the client, and via active engagement methods. The choice of which method(s) to use depends on the characteristics of the UoA. The CAB should use some of the following methods: newspapers, radio, email, local organisations, etc.
Guidance 4.3.5
The location of the meetings is very important to ensure good participation of stakeholders. Factors that will affect the choice of meeting location could be:
• If stakeholders are spread over a wide area, it might be necessary to hold more than one set of meetings to allow for participation.
• The choice of venue needs to be considered depending on the number of stakeholders attending the meetings and the space needed for an effective engagement.
Document: ASC-MSC Seaweed (Algae) Risk Based Framework v1.0 Page 10 Date of publication: 7 March 2018 © Aquaculture Stewardship Council and Marine Stewardship Council 2018
4.3.6 Meetings shall be structured to encourage engagement amongst stakeholders.
4.3.7 Where different language groups, educational/vocabulary levels or cultural behaviours are present, the team shall consider separate consultations tailored to those specific interest groups.
4.3.8 Stakeholder consultation shall be conducted in a language that can be understood by all stakeholders.
4.3.8.1 Any materials required for the stakeholder consultation shall be prepared in a language understood by all participants.
4.3.9 Participatory tools shall be used, where appropriate, to increase the effectiveness of the consultation.
4.3.10 This information gathered during stakeholder consultation(s) shall be used to inform the scoring of the CA, PSA, CSA and SICA.
4.3.11 The team shall be responsible for scoring the PIs.
• Meetings can be both formal and informal.
• Engagement can be effective in any location whether inside or outside if the team is prepared to run the workshop in that setting.
Guidance 4.3.6
Stakeholder meetings can be organised using many approaches: workshops, focus groups, separate meetings, or a blended approach. The decision on how to structure the meetings may depend on:
• The number of PIs that are being assessed using the RBF. It might be better to hold a separate RBF workshop with those who have information relevant to a particular PI.
• Stakeholder dynamics within the group. These will affect the decision on whom to meet in a group setting and whom to meet separately.
• There may be conflicting opinions among group members. It might be useful to allow these opinions to be shared to help the team draw conclusions from the stakeholders.
Guidance 4.3.7
Cultural sensitivity needs to be understood when planning meetings with different stakeholders.
Guidance 4.3.8
Where different language levels exist amongst stakeholders, the CAB may consider holding separate meetings with different groups.
Guidance 4.3.9
See the Participatory Methods Toolkit for further guidance:
www.msc.org/documents/get-certified/stakeholders/toolbox-for-stakeholder-participation-in-rbf-assessments/
Guidance 4.3.11
In situations where stakeholders do not reach consensus, the team should award the more precautionary score.

Document: ASC-MSC Seaweed (Algae) Risk Based Framework v1.0 Page 11 Date of publication: 7 March 2018 © Aquaculture Stewardship Council and Marine Stewardship Council 2018
5 Consequence Analysis (CA)
5.1 Preparation
5.1.1 The team shall conduct a CA for each data-deficient seaweed target species under PI1.1.
5.1.2 A CA shall only be conducted where some qualitative or quantitative data exist from which trends in one or more of the four key consequence subcomponents listed in Table 3 can be identified.
5.1.2.1 Where there is no qualitative or quantitative data as defined in 5.1.2 above, the production unit cannot be assessed using the CA against the Seaweed Standard.
5.1.3 The team shall use the CA scoring template on the ASC-MSC website, reproduced in the “ASC-MSC Seaweed (Algae) Audit Reporting Template” found at www.asc-aqua.org/what-we-do/our-standards/farm-standards/seaweed-standard/, to present the scores and rationales of the CA.
5.2 Stakeholder involvement in CA
5.2.1 The team shall use input from stakeholders to:
a. Inform the qualitative evaluation of the risks that the harvesting/farming activity poses to the seaweed species included.
b. Assist in identifying the most vulnerable subcomponent for the seaweed species.
c. Assist in scoring the consequence of harvesting/farming for a species.
Guidance Section 5
The ASC-MSC will develop and calibrate the RBF for Principle 1 during 2018. The ASC-MSC encourage interested parties to consider calibration of such equivalent risk-based approaches against PI1.1. Guidance can be found in the Seaweed Standard. Future versions of the RBF will reflect the continuing evolution and refinement of these tools and methods.
Guidance 5.1.1
Each data-deficient seaweed species in Principle 1 will need its own CA. This may be done by defining each species as a separate UoA, or by scoring the seaweed species as separate scoring elements within a combined UoA.
Document: ASC-MSC Seaweed (Algae) Risk Based Framework v1.0 Page 12 Date of publication: 7 March 2018 © Aquaculture Stewardship Council and Marine Stewardship Council 2018
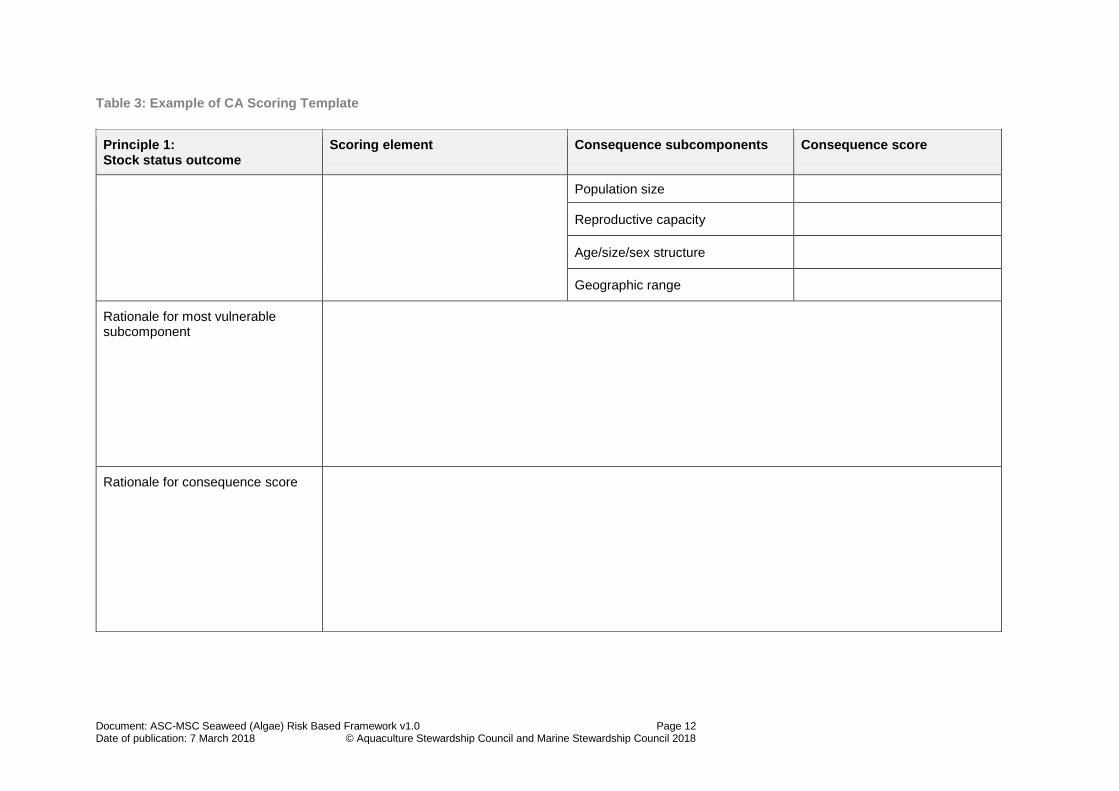
Table 3: Example of CA Scoring Template
Principle 1: Stock status outcome
Scoring element Consequence subcomponents Consequence score
Population size
Reproductive capacity
Age/size/sex structure
Geographic range
Rationale for most vulnerable subcomponent
Rationale for consequence score

Document: ASC-MSC Seaweed (Algae) Risk Based Framework v1.0 Page 13 Date of publication: 7 March 2018 © Aquaculture Stewardship Council and Marine Stewardship Council 2018
5.3 Determine the CA score
5.3.1 Scoring shall be undertaken only for the subcomponent (population size, reproductive capacity, age/size/sex structure or geographic range) on which the team decides that the harvesting/farming activity is having the most impact.
5.3.2 When working with stakeholders at the CA consultation meeting(s), the team shall use the available indicator and trend data to assign a score for the consequence of the harvesting/farming activity on the subcomponent on which the production unit is having the most impact, using Table 4.
5.3.3 The team shall interpret the terms “insignificant change”, “possible detectable” and “significant change” as follows:
a. “Insignificant change” shall mean that changes in the subcomponents are undetectable or if detectable, these are of such a low magnitude that the impact of the harvesting/farming activity cannot be differentiated from the natural variability for this population.
b. “Possible detectable” shall mean that changes are detected and can be reasonably attributable to the harvesting/farming activity, but these are of such a low magnitude that the impact of the production unit is minimal on the population size and dynamics.
c. “Significant change” shall mean that changes to the subcomponent can be attributed to the harvesting/farming activity and changes are of such magnitude that cannot be considered as minimal.
5.3.4 Where there is no agreement between stakeholders, the team shall use the consequence category with the lowest score.
5.3.5 The team shall fail the production unit if the consequence of the activity is determined to be at higher risk than the minimum level in Table 4.
5.3.6 The team shall take the final CA score into Section 6.5.
Guidance 5.3.2Where judgements about risk are uncertain, the consequence category with the lowest score (highest risk) that is still regarded as plausible should be chosen.
In the application of the Consequence Analysis, the risk that the production unit poses on stock status is determined without the use of reference points. Measures and trends of harvest effort, landings, exploitation rates and biomass, seaweed coverage (e.g. square kilometre) and density (number of plants per square metre) are examples of indicators than can be used to determine the risk associated to the harvesting/farming activity.
Production units operating at full exploitation levels will likely score below the target level and only in cases where available indicators provide evidence of recruitment not being adversely damaged will score the minimum level. Conversely, production units operating at low exploitation levels in relation to the size of the stock and biology of the species are expected to obtain the target level, in cases that the impact of the harvesting/farming activity cannot be differentiated from the natural variability for this population.

Document: ASC-MSC Seaweed (Algae) Risk Based Framework v1.0 Page 14 Date of publication: 7 March 2018 © Aquaculture Stewardship Council and Marine Stewardship Council 2018
Table 4: CA scoring of subcomponents
Consequence category
Subcomponent Target Minimum Fail
Population size Insignificant or possible detectable change in size/growth rate (r), with minimal impact on population size and none on dynamics.
Full exploitation rate but long-term recruitment dynamics not adversely damaged.
Consequence is higher-risk than the minimum level.
Reproductive capacity
Insignificant or possible detectable change in reproductive capacity, with minimal impact on population dynamics.
Detectable change in reproductive capacity. Impact on population dynamics at the maximum sustainable level, long-term recruitment dynamics not adversely affected.
Age/size/ sex structure
Insignificant or possible detectable change in age/size/sex structure, with minimal impact on population dynamics.
Detectable change in age/size/sex structure. Impact on population dynamics at the maximum sustainable level, long-term recruitment dynamics not adversely affected.
Geographic range
Insignificant or possible detectable change in geographic range but minimal impact on population distribution and none on dynamics.
Detectable change in the geographic range up to 10% of original distribution due to harvesting/farming activities.
6 Productivity Susceptibility Analysis (PSA)
6.1 Preparation
6.1.1 The team shall use the “ASC-MSC Seaweed (Algae) RBF Worksheets” found at www.asc-aqua.org/what-we-do/our-standards/seaweed-standard/ to calculate PSA scores.
6.1.2 The scores and rationales for each PSA attribute shall be documented in the PSA tables in the “ASC-MSC Seaweed (Algae) Audit Reporting Template”.
6.1.3 When evaluating PI. 2.4, the team shall conduct the PSA on “main” species only (see Standard 8.23 and 8.24).
6.1.4 When assessing a large number of species under PI 2.4, the team may elect to group species according to similar taxonomies and undertake a reduced number of PSAs.
6.1.4.1 If the team elects to group species, the team shall use Annex A.
Guidance Section 6
The ASC-MSC PSA tables can be used only to assess non-seaweed P2 species. The PSA table for seaweed species is being developed. See G6.14 in the Standard.

Document: ASC-MSC Seaweed (Algae) Risk Based Framework v1.0 Page 15 Date of publication: 7 March 2018 © Aquaculture Stewardship Council and Marine Stewardship Council 2018
6.2 Stakeholder involvement within the PSA
6.2.1 The team shall use input from stakeholders to:
a. Assist in the identification of species that are affected by the UoA.
b. Assist in the scoring of the susceptibility attributes within the PSA.
6.3 Score the Productivity attributes
6.3.1 The team shall score the productivity of each data-deficient species.
6.3.2 The team shall score each productivity attribute on a three-point risk scale: low (3), medium (2) or high (1), using the cut-offs in Table 5.
6.3.3 The average maximum size and average size at maturity attributes shall be scored in vertebrate species only.
6.3.4 The density dependence attribute shall be scored in invertebrate species only.
6.3.5 The team shall enter the three-point scores into the “ASC-MSC Seaweed (Algae) RBF Worksheets” to calculate the overall productivity score.
6.3.6 Where there is limited information available for a productivity attribute, the more precautionary score shall be awarded.
Guidance 6.3
The level of impact a species can sustain depends on the inherent productivity of the species. The productivity determines how rapidly a species can recover from depletion or impact due to harvesting/farming. The productivity of a species is determined by species attributes such as longevity, growth rate, fecundity, recruitment and natural mortality. Information about productivity attributes can be found in scientific literature and websites like FishBase (www.fishbase.org).
Guidance 6.3.4
Depensatory effects (Allee effects) can arise from the reduced probability of fertilisation, and they should therefore be taken into consideration when scoring species productivity.
It is suggested that depensatory effects may have a profound effect on the resilience of marine invertebrates to fishing mortality, as shown in some crabs and lobsters, and often also sedentary bivalves.
The density-dependent attribute should be scored as 3 (high risk, low productivity) in cases where the species slow down the rate of population growth at low densities (depensatory dynamics). Conversely, species showing compensatory dynamics at low densities should be scored as 1 (low risk, high productivity) because density dependence acts to stabilise the populations.
Lack of evidence should not be interpreted as evidence that depensatory dynamics are rare and unimportant. In absence of information on depensatory dynamics, or where no justification is provided supporting lower risk scores (1 or 2), the highest risk score (3, low productivity) should be used.

Document: ASC-MSC Seaweed (Algae) Risk Based Framework v1.0 Page 16 Date of publication: 7 March 2018 © Aquaculture Stewardship Council and Marine Stewardship Council 2018
Table 5: PSA Productivity attributes and scores
Productivity Attribute High productivity (Low risk, score=1)
Medium productivity (medium risk, score=2)
Low productivity (high risk, score=3)
Average age at maturity <5 years 5-15 years >15 years
Average maximum age <10 years 10-25 years >25 years
Fecundity >20,000 eggs per year
100-20,000 eggs per year
<100 eggs per year
Average maximum size (not to be used when scoring invertebrate species)
<100 cm 100-300 cm >300 cm
Average size at maturity (not to be used when scoring invertebrate species)
<40 cm 40-200 cm >200 cm
Reproductive strategy Broadcast spawner Demersal egg layer Live bearer
Trophic level <2.75 2.75-3.25 >3.25
Density dependence (to be used when scoring invertebrate species only)
Compensatory dynamics at low population size demonstrated or likely
No depensatory or compensatory dynamics demonstrated or likely
Depensatory dynamics at low population sizes (Allee effects) demonstrated or likely
6.4 Score the susceptibility attributes
6.4.1 The team shall score the susceptibility of each data-deficient species.
6.4.2 The team shall score the four susceptibility attributes (areal overlap (availability), encounterability, selectivity and post-capture mortality) on a three-point risk scale: high (3), medium (2) or low (1), using the cut-offs in Table 6.
6.4.3 The team shall enter the three-point scores into the “ASC-MSC Seaweed (Algae) RBF Worksheets” to calculate the overall susceptibility score.
Guidance 6.4
The level of harvesting/farming impact that a species can sustain depends on its vulnerability or susceptibility of being captured or damaged by the harvesting/farming activities. The susceptibility of a species is determined by attributes such as the degree of overlap between the distribution of the production unit and the distribution of the species; and whether the species occurs at the same depth in the water column as the harvesting/farming activity.
Guidance 6.4.1
If there are no other production units listed that impact the species, only the susceptibility of the species to the UoA should be scored.

Document: ASC-MSC Seaweed (Algae) Risk Based Framework v1.0 Page 17 Date of publication: 7 March 2018 © Aquaculture Stewardship Council and Marine Stewardship Council 2018
6.4.4 Where there is limited information available to score a susceptibility attribute, the more precautionary score shall be awarded.
6.4.5 When scoring susceptibility, the team shall consider the impacts of production units other than the UoA according to the following requirements:
a. When scoring PI 1.1 (stock status), all production units impacting the given target stock shall be identified and listed separately.
b. When scoring PI 2.4 (other species), all ASC-MSC seaweed UoAs impacting each main species shall be identified and listed separately.
c. Where a species is scored cumulatively, the team should list all ASC-MSC seaweed UoAs impacting the species.
6.4.6 In the “ASC-MSC Seaweed (Algae) RBF Worksheets” the team should manually input the data of the production unit impacting the species.
6.4.7 When scoring PI 2.3 (ETP species), only the UoA shall be considered.
Table 6: PSA Susceptibility attributes and scores
Susceptibility attribute Low susceptibility (Low risk, score=1)
Medium susceptibility (medium risk, score=2)
High susceptibility (high risk, score=3
Areal overlap (availability): Overlap of the harvesting/farming effort with a species
<10% overlap 10-30% overlap >30% overlap
Encounterability: The position of the stock/species within the water column relative to the harvesting/farming gear, and the position of the stock/species within the habitat relative to the position of the gear
Low overlap with harvesting/farming gear (low encounterability)
Medium overlap with harvesting/farming gear
High overlap with harvesting/farming gear (high encounterability) Default score for target species (Principle 1)
Selectivity of gear type: Potential of the gear to retain species
a Individuals < size at maturity are rarely caught
a Individuals < size at maturity are regularly caught
a Individuals < size at maturity are frequently caught
b Individuals < size at maturity
b Individuals < half the size at
b Individuals < half the size at
Guidance 6.4.5.a
The area of the stock should be defined geographically. It should recognise the ability of the client to manage the local stock, and does not need to extend to the full range of the stock that could be recognised on a genetic basis
Guidance 6.4.5.b
“ASC-MSC Seaweeds UoAs” refers to those seaweed UoAs that are in assessment or certified at the time that the UoA announces its assessment or re-assessment on the ASC-MSC website and that have “main” species in common.

Document: ASC-MSC Seaweed (Algae) Risk Based Framework v1.0 Page 18 Date of publication: 7 March 2018 © Aquaculture Stewardship Council and Marine Stewardship Council 2018
can escape or avoid gear
maturity can escape or avoid gear
maturity are retained by gear
Post-capture mortality (PCM): The chance that, if captured, a species would be released and that it would be in a condition permitting subsequent survival
Evidence of majority released post-capture and survival
Evidence of some released post-capture and survival
Retained species or majority dead when released Default score for retained species (Principle 1 or Principle 2)
6.4.8 To account for the impact of other production units on a given stock the team shall determine the contribution of each production unit on the total catch of the given stock.
6.4.8.1 If precise catch data are available, weights for each production unit shall be assigned according to known proportions of the total catch of the given stock.
6.4.8.2 If catch data are not available, a qualitative information-gathering process shall be used and documented to apply a weight to each production unit according to Table 7.
6.4.9 A weighted average of PSA scores for each production unit affecting the given stock shall be calculated in order to derive the final overall PSA score except in the following case:
6.4.9.1 If catch data cannot be estimated for a particular production unit using either qualitative or quantitative data, the susceptibility score for the overall PSA shall be based on the attributes of the production unit with the highest susceptibility score.
Table 7: Weighting of production units
% contribution of catch Weighting score
0–25 1
25–50 2
50–75 3
75–100 4
Areal overlap
6.4.10 The team shall score areal overlap (availability) as follows:
a. The team shall generate areal overlap scores after consideration of the overlap of the harvesting/farming effort with the distribution of the stock.
b. Where the impacts of production units other than the UoA are taken into account, the areal overlap shall be scored as the combined overlap of all listed production units with the areal concentration of a stock.
c. The resulting areal overlap risk scores shall be entered into those cells in the “ASC-MSC Seaweed (Algae) RBF Worksheets” for all listed production unit.
d. The scoring of areal overlap shall consider the concentration of species and the overlap of the harvesting gear with the concentration species.
Document: ASC-MSC Seaweed (Algae) Risk Based Framework v1.0 Page 19 Date of publication: 7 March 2018 © Aquaculture Stewardship Council and Marine Stewardship Council 2018
6.4.11 For species with good distribution maps, availability areal overlap shall be scored using detailed mapping analysis: the amount of overlap between harvesting effort and species stock distribution.
6.4.12 For species without good distribution maps, stakeholder generated maps may be used.
Encounterability
6.4.13 The team shall score encounterability as follows:
a. The team shall generate encounterability scores after consideration of the likelihood that a species will encounter harvesting/farming gear that is deployed within the geographic range of that species.
b. Where the impacts of production unit other than the UoA are taken into account, encounterability shall be scored as the combined encounterability of all listed production units.
c. The resulting encounterability risk scores shall be entered into those cells in the “ASC-MSC Seaweed (Algae) RBF Worksheets” for all listed production units.
d. The scoring of encounterability shall consider the concentration of species and the overlap of the harvesting/farming gear with the concentration species.
e. The deployment of harvesting/farming gear in relation to each species adult habitat shall be the main aspect to be considered for each species.
Selectivity
6.4.14 The team shall score selectivity as follows:
a. The team shall generate a selectivity score for each gear type after consideration of the potential of gear to capture or retain the species that encounters the harvesting/farming gear.
b. The selectivity risk scores for each combination of gear type and species shall be determined individually, and entered into the “ASC-MSC Seaweed (Algae) RBF Worksheets”.
c. Scores for gear selectivity shall be assigned using the two categories specified in Table 6.
6.4.14.1 Where elements (a) and (b) indicate different risk scores, the team shall assign a score as the average of the two categories, rounded up to the nearest whole number on the 1:3 scale.
Guidance 6.4.10
For example, on the species that are known to school, and the gear interacts with the schools, a high-risk score should be awarded for this attribute.
Guidance 6.4.13
Low, medium and high should be interpreted based on the likelihood of a gear encountering a species.
Where a production unit overlaps a large proportion of a stock distribution range, the risk is high because the species has no refuge, and the potential for impact is high.
Each production unit will have the same encounterability score as it is an aggregate of all gear types affecting the stock. It is assumed that encounterability would be scored as high-risk for a targeted species.

Document: ASC-MSC Seaweed (Algae) Risk Based Framework v1.0 Page 20 Date of publication: 7 March 2018 © Aquaculture Stewardship Council and Marine Stewardship Council 2018
6.4.15 Terms “rarely”, “regularly”, and “frequently” in Table 6 shall be interpreted as follows:
a. “Rarely” means that the capture of individuals smaller than the size at maturity occurs in less than 5% few gear deployments.
b. “Regularly” means that the capture of individuals smaller than the size at maturity occurs in 5% to 50% of the gear deployments.
c. “Frequently” means that the capture of individuals smaller than the size at maturity occurs in more than 50% of gear deployments.
Post-capture mortality
6.4.16 The team shall score post-capture mortality (PCM) as follows:
a. The team shall use its knowledge of species biology and harvesting/farming practice together with independent field observations to assess the chance that, if captured, a species would be released and that it would be in a condition to permit subsequent survival.
b. The PCM risk scores for each combination of gear type and species shall be determined individually, and entered into the “ASC-MSC Seaweed (Algae) RBF Worksheets”.
c. In the absence of information that indicates the individuals are released alive and post-release survivorship is high, the score for the PCM shall be high.
d. The team may reduce the PCM score from the default score in situations where:
i. A high score has been allocated for the selectivity.
ii. A large portion of animals are returned alive and survive the encounter.
6.4.17 The team may adjust the susceptibility scores if additional information regarding an attribute that justifies a change in score is available and the source of data is appropriate to the production unit(s) or region(s).
6.4.17.1 The team shall record the rationale for all changes made.
6.5 Final PSA score
6.5.1 The team shall use the “ASC-MSC Seaweed (Algae) RBF Worksheets” to calculate the overall productivity and susceptibility risk scores (PSA score) and the equivalent ASC-MSC scores for each scoring element.
Guidance 6.4.14
When scoring the element (a), the team should determine the frequency of deployments in which juveniles are caught. The team should only consider the frequency and not the number or proportion of juveniles caught.
When scoring the element (b), the team should focus in determining the potential of the harvesting/farming method to retain juveniles, i.e. the ability of the juveniles to escape or avoid that particular gear.
Guidance 6.4.16.a
In assessing the probability that if a species that is captured would be released in a condition that would permit subsequent survival, the team may consider for example: biological factors that may limit the potential of a species to be captured alive; handling practices of the production unit(s) being considered; etc.

Document: ASC-MSC Seaweed (Algae) Risk Based Framework v1.0 Page 21 Date of publication: 7 March 2018 © Aquaculture Stewardship Council and Marine Stewardship Council 2018
6.6 Overall PI score
6.6.1 When scoring PI 1.1, both the CA and PSA shall be used to produce an overall score for each seaweed species (target species).
6.6.1.1 The overall score for each seaweed species shall reflect the lowest score of both methodologies, as described in Table 8.
Table 8: Rules for use of CA or PSA scores
CA PSA Overall score
Target Target Target
Target Minimum Minimum
Target Below Minimum Below Minimum
Minimum Target Minimum
Minimum Minimum Minimum
Minimum Below Minimum Below Minimum
Below Minimum Target Below Minimum
Below Minimum Minimum Below Minimum
Below Minimum Below Minimum Below Minimum
Combining scoring elements
6.6.2 In cases where there is only one seaweed species, the team shall consider this as the overall score.
6.6.3 In cases where there are multiple seaweed species, the lowest score should be awarded to the PI.
6.7 Setting conditions or critical conditions using the RBF for species PIs
6.7.1 Where any species does not meet the target/minimum level the team shall set a condition or critical condition on that PI following the requirements in Sections 17.12 and 17.13 of the ASC-MSC Seaweed (Algae) Certification and Accreditation Requirements.
6.7.2 If a condition or critical condition is triggered when assessing a PI, the team shall ensure that the Client Action Plan proposed by the production unit is capable of raising the score to the target level, addressing all the species for which the score falls below the target/minimum level, and without causing additional associated problems for other species.
Guidance 6.7.2
A CAB may elect to test if the proposed Client Action Plan will have the desired effect at the time of agreeing on corrective actions by re-running the PSA.
The team may use PSA results to assist with setting conditions, by identifying the set of productivity and susceptibility attributes that have contributed to a high risk. The production unit could be then asked to reduce the risk by implementing changes in the identified attributes (i.e. by the setting of a condition related to reducing susceptibility).
Document: ASC-MSC Seaweed (Algae) Risk Based Framework v1.0 Page 22 Date of publication: 7 March 2018 © Aquaculture Stewardship Council and Marine Stewardship Council 2018
6.7.3 If the action plan is not capable of raising the score to the target level within a suitable timeframe, the team shall not allow a production unit to use the RBF for this scoring element in subsequent assessments.
6.7.3.1 In such cases, the team shall raise a condition on the PI that there shall be information collected and analysis completed when there is a direct measure of stock status that can be compared with biologically-based reference points by the time of re-assessment.
7 Conducting a Consequence Spatial Analysis (CSA)
7.1 Preparation
7.1.1 The team shall use the CSA to score PI 2.1 when information is not available on habitats encountered or the impacts of the production unit on the habitats encountered.
7.1.2 The team shall use the “ASC-MSC Seaweed (Algae) RBF Worksheets” to calculate CSA scores.
7.1.3 The team shall conduct the CSA for each data-deficient habitat.
7.1.4 The scores and rationales for each habitat shall be documented in the CSA rationale tables in the “ASC-MSC Seaweed (Algae) Audit Reporting Template” found at www.asc-aqua.org/what-we-do/our-standards/farm-standards/seaweed-standard/.
1 Hobday, A. J., Smith, A., Webb, H., Daley, R., Wayte, S., Bulman, C., Dowdney, J., Williams, A., Sporcic, M., Dambacher, J., Fuller, M. and Walker, T., 2007. Ecological risk assessment for the effects of fishing: methodology. Report R04/1072 for the Australian Fisheries Management Authority, Canberra. 2 Williams, A., Dowdney, J., Smith, A.D.M., Hobday, A.J., and Fuller, M., 2011. Evaluating impacts of fishing on benthic habitats: A risk assessment framework applied to Australian fisheries. Fisheries Research 112(3):154-167.
As productivity attributes are inherent to the species, these attributes cannot be changed through harvesting/farming improvements. Where individual productivity attributes have been defaulted to “high risk” because of lack of information, these risk scores could be reduced if additional studies revealed the risk level was actually lower. For example, if the risk score for a particular species was due to high encounterability and high PCM, then the corrective action might be to restrict harvesting/farming to night time or reduce the mortality when that species is captured. These actions can even be tested, by simulating changing the PSA attribute scores and observing if the risk category changes.
Guidance Section 7
The CSA was structured around a set of attributes that describe gear impacts (consequence) and the habitat (spatial) for each habitat being affected by different harvesting/farming gears. The CSA methodology and attributes were based on the Ecological Risk Assessment for the Effects of Fishing methodology (Hobday et al., 20071, Williams et al., 20112), which was derived from images, expert opinion, and scientific literature. Both the method and attributes were modified to enable their application to ASC-MSC assessments.
The CSA consists of the following steps:
• CSA Step 1: Define the habitat(s).
• CSA Step 2: Score the consequence attributes.
• CSA Step 3: Score the spatial attributes.
• CSA Step 4: Determine the CSA score and equivalent MSC score.
The CSA examines attributes of each habitat associated with the UoA to provide a relative measure of the risk on the scoring element (habitat) from harvesting/farming activities
Document: ASC-MSC Seaweed (Algae) Risk Based Framework v1.0 Page 23 Date of publication: 7 March 2018 © Aquaculture Stewardship Council and Marine Stewardship Council 2018
7.2 Stakeholder involvement within the CSA
7.2.1 The team shall use input from stakeholders to:
7.2.1.1 Assist in the identification of the habitat(s) that are impacted by the UoA.
7.2.1.2 Assist in the scoring of the consequence and spatial attributes within the CSA.
7.3 CSA Step 1: Define the habitat(s)
7.3.1 The team shall list and define each habitat associated with the “managed area” (i.e. each habitat in the full area managed by the governance body(s) responsible for harvesting/farming/farming management in the area(s) where the UoA operates).
7.3.1.1 When assessing the status of habitats and the impacts of fishing, the team shall consider the full area managed by the local, regional, national, or international governance body(s) responsible for the seaweed management in the area(s) where the UoA operates (the “managed area” for short).
7.3.1.2 The team shall use all available information (e.g. bioregional information) to determine the range and distribution of the habitat under consideration and whether this distribution is entirely within the “managed area” or extends beyond the “managed area”.
7.3.1.3 In cases where a habitat’s range falls within the “managed area”, the team shall consider the habitat’s range inside the “managed area”.
7.3.1.4 In cases where a habitat’s range overlaps the “managed area”, the team shall consider the habitat’s range both inside and outside the “managed area”.
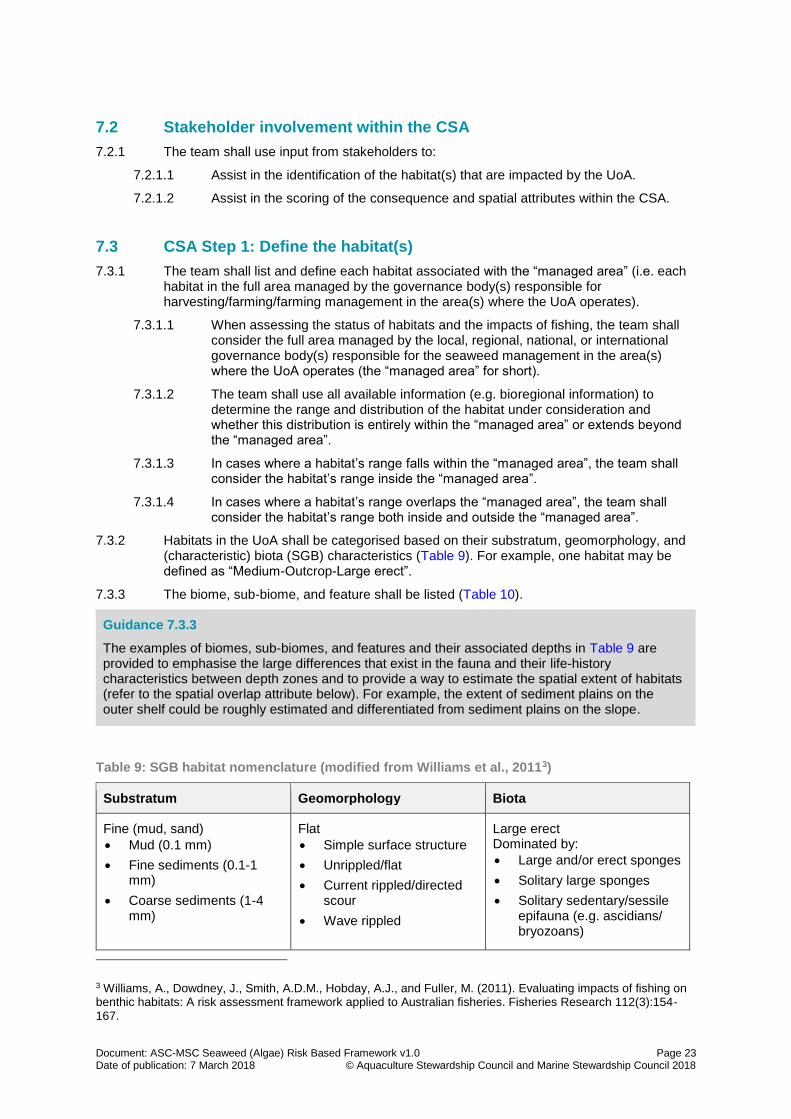
7.3.2 Habitats in the UoA shall be categorised based on their substratum, geomorphology, and (characteristic) biota (SGB) characteristics (Table 9). For example, one habitat may be defined as “Medium-Outcrop-Large erect”.
7.3.3 The biome, sub-biome, and feature shall be listed (Table 10).
Table 9: SGB habitat nomenclature (modified from Williams et al., 20113)
Substratum Geomorphology Biota
Fine (mud, sand)
• Mud (0.1 mm)
• Fine sediments (0.1-1 mm)
• Coarse sediments (1-4 mm)
Flat
• Simple surface structure
• Unrippled/flat
• Current rippled/directed scour
• Wave rippled
Large erect Dominated by:
• Large and/or erect sponges
• Solitary large sponges
• Solitary sedentary/sessile epifauna (e.g. ascidians/ bryozoans)
3 Williams, A., Dowdney, J., Smith, A.D.M., Hobday, A.J., and Fuller, M. (2011). Evaluating impacts of fishing on benthic habitats: A risk assessment framework applied to Australian fisheries. Fisheries Research 112(3):154-167.
Guidance 7.3.3
The examples of biomes, sub-biomes, and features and their associated depths in Table 9 are provided to emphasise the large differences that exist in the fauna and their life-history characteristics between depth zones and to provide a way to estimate the spatial extent of habitats (refer to the spatial overlap attribute below). For example, the extent of sediment plains on the outer shelf could be roughly estimated and differentiated from sediment plains on the slope.

Document: ASC-MSC Seaweed (Algae) Risk Based Framework v1.0 Page 24 Date of publication: 7 March 2018 © Aquaculture Stewardship Council and Marine Stewardship Council 2018
• Crinoids
• Corals
• Mixed large or erect communities
Medium
• Gravel/pebble (4-60 mm)
Low relief
• Irregular topography with mounds and depressions
• Rough surface structure
• Debris flow/rubble banks
Small erect/ encrusting/burrowing Dominated by:
• Small, low-encrusting sponges
• Small, low-standing sponges
• Consolidated (e.g. mussels) and unconsolidated bivalve beds (e.g. scallops)
• Mixed small/low-encrusting invertebrate communities
• Infaunal bioturbators
Large
• Cobble/boulders (60 mm - 3 m)
• Igneous, metamorphic, or sedimentary bedrock (>3 m)
Outcrop
• Subcrop (rock protrusions from surrounding sediment <1 m)
• Low-relief outcrop (<1 m)
No fauna or flora
• No apparent epifauna, infauna, or flora
Solid reef of biogenic origin
• Biogenic (substratum of biogenic calcium carbonate)
• Depositions of skeletal material forming coral reef base
High relief
• High outcrop (protrusion of consolidated substrate >1 m)
• Rugged surface structure
Flora Dominated by:
• Seagrass species
Table 10: List of example biomes, sub-biomes, and features (modified from Williams et al., 2011)
Biome Sub-biome Feature
Coast (0-25 m) Shelf (25-200 m)
Coastal margin (<25 m) Inner shelf (25-100 m) Outer shelf (100-200 m) )
Seamounts Canyons Shelf break (~150-300 m) Sediment plains Sediment terraces Escarpments Plains of scattered reef Large rocky banks
Document: ASC-MSC Seaweed (Algae) Risk Based Framework v1.0 Page 25 Date of publication: 7 March 2018 © Aquaculture Stewardship Council and Marine Stewardship Council 2018
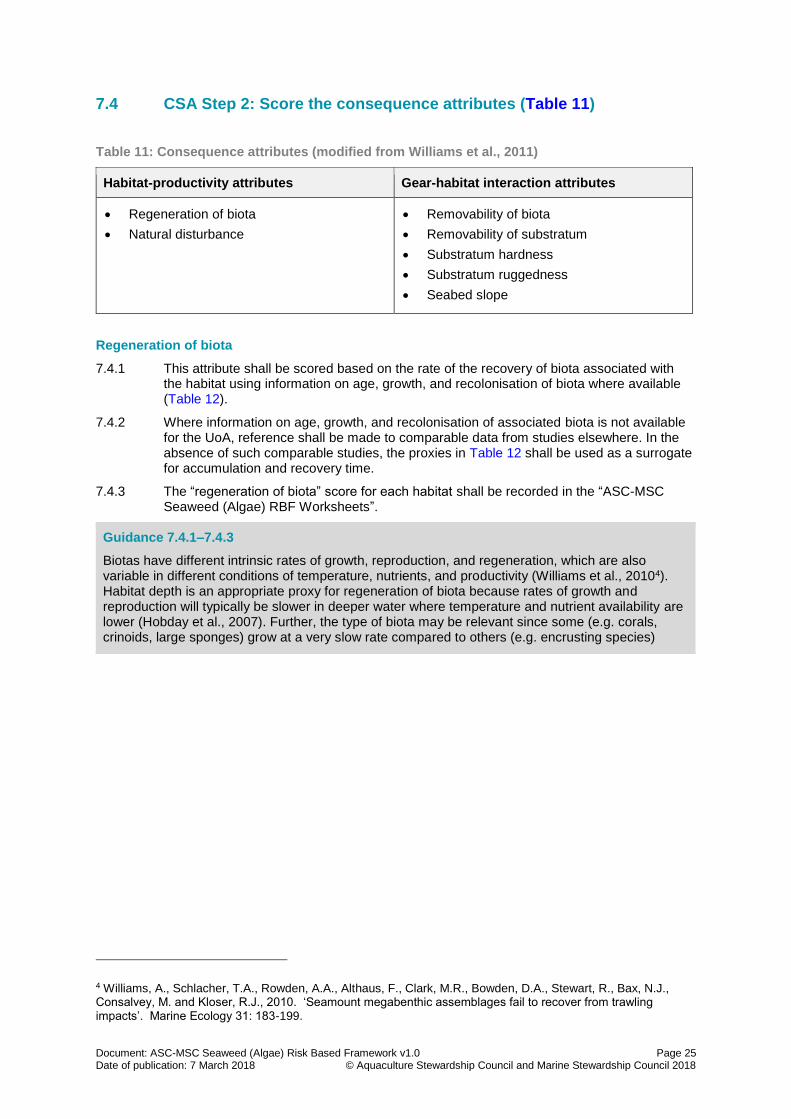
7.4 CSA Step 2: Score the consequence attributes (Table 11)
Table 11: Consequence attributes (modified from Williams et al., 2011)
Habitat-productivity attributes Gear-habitat interaction attributes
• Regeneration of biota
• Natural disturbance
• Removability of biota
• Removability of substratum
• Substratum hardness
• Substratum ruggedness
• Seabed slope
Regeneration of biota
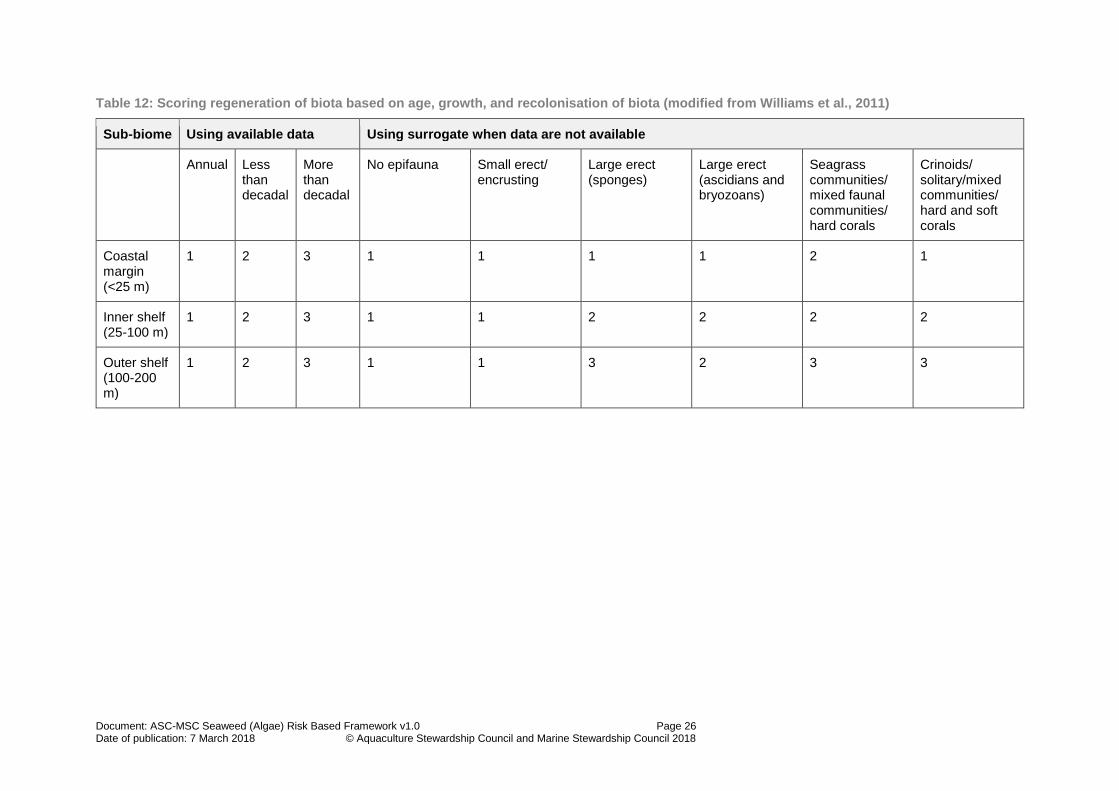
7.4.1 This attribute shall be scored based on the rate of the recovery of biota associated with the habitat using information on age, growth, and recolonisation of biota where available (Table 12).
7.4.2 Where information on age, growth, and recolonisation of associated biota is not available for the UoA, reference shall be made to comparable data from studies elsewhere. In the absence of such comparable studies, the proxies in Table 12 shall be used as a surrogate for accumulation and recovery time.
7.4.3 The “regeneration of biota” score for each habitat shall be recorded in the “ASC-MSC Seaweed (Algae) RBF Worksheets”.
4 Williams, A., Schlacher, T.A., Rowden, A.A., Althaus, F., Clark, M.R., Bowden, D.A., Stewart, R., Bax, N.J., Consalvey, M. and Kloser, R.J., 2010. ‘Seamount megabenthic assemblages fail to recover from trawling impacts’. Marine Ecology 31: 183-199.
Guidance 7.4.1–7.4.3
Biotas have different intrinsic rates of growth, reproduction, and regeneration, which are also variable in different conditions of temperature, nutrients, and productivity (Williams et al., 20104). Habitat depth is an appropriate proxy for regeneration of biota because rates of growth and reproduction will typically be slower in deeper water where temperature and nutrient availability are lower (Hobday et al., 2007). Further, the type of biota may be relevant since some (e.g. corals, crinoids, large sponges) grow at a very slow rate compared to others (e.g. encrusting species)
Document: ASC-MSC Seaweed (Algae) Risk Based Framework v1.0 Page 26 Date of publication: 7 March 2018 © Aquaculture Stewardship Council and Marine Stewardship Council 2018
Table 12: Scoring regeneration of biota based on age, growth, and recolonisation of biota (modified from Williams et al., 2011)
Sub-biome Using available data Using surrogate when data are not available
Annual Less than decadal
More than decadal
No epifauna Small erect/ encrusting
Large erect (sponges)
Large erect (ascidians and bryozoans)
Seagrass communities/ mixed faunal communities/ hard corals
Crinoids/ solitary/mixed communities/ hard and soft corals
Coastal margin (<25 m)
1 2 3 1 1 1 1 2 1
Inner shelf (25-100 m)
1 2 3 1 1 2 2 2 2
Outer shelf (100-200 m)
1 2 3 1 1 3 2 3 3

Document: ASC-MSC Seaweed (Algae) Risk Based Framework v1.0 Page 27 Date of publication: 7 March 2018 © Aquaculture Stewardship Council and Marine Stewardship Council 2018
Natural disturbance
7.4.4 This attribute shall be scored based on the natural disturbance that is assumed to occur at the particular depth zone in which the habitat and harvesting/farming activity occurs (Table 13).
7.4.5 Where information on disturbance is unavailable, proxies shall be used as outlined in Table 13.
7.4.6 The “natural disturbance” score for each habitat shall be recorded in the “ASC-MSC Seaweed (Algae) RBF Worksheets”.
Table 13: Scoring natural disturbance (modified from Williams et al., 2011)
Attribute Score
1 2 3
Natural disturbance Regular or severe natural disturbance
Irregular or moderate natural disturbance
No natural disturbance
Natural disturbance (in absence of information)
Coastal margin and shallow inner shelf (<60 m)
Deep inner shelf and outer shelf (60-200 m)
Slope (>200 m)
7.4.7 Table 14 and Table 15 shall be used to score the gear-habitat interaction attributes.
7.4.7.1 If the UoA’s gear type is not provided in Table 14 and Table 15, the team shall score the attributes using the most similar gear in terms of the extent of bottom contact that is provided.
a. The team shall be precautionary when determining the most similar gear type.
b. The team shall provide justification for the selection of the most similar gear type.
Removability of biota
7.4.8 This attribute shall be scored on the basis of the likelihood of attached biota being removed or killed by interactions with harvesting/farming gear (Table 14).
7.4.9 This attribute shall also consider the removability and mortality of structure-forming epibiota and bioturbating infauna.
7.4.10 The “removability of biota” score for each habitat shall be recorded in the “ASC-MSC Seaweed (Algae) RBF Worksheets”.
Guidance 7.4.4–7.4.6
Biotas subject to greater natural disturbances have a greater intrinsic ability to recover from impacts. Common natural disturbances result from wave action and tidal movements, but other factors, such as local currents, storm surge, flooding, temperature fluctuations, and predation, may also be relevant. Habitat depth is considered a suitable proxy for natural disturbance because deeper habitats typically experience fewer or no natural disturbances.
Guidance 7.4.8–10
Removability of biota is influenced by the size, height, robustness, flexibility, and structural complexity of the attached biota. Large, erect, inflexible, or delicate biota is more vulnerable to physical damage or removal than small, low, flexible, robust, or deep-burrowing biota. Rugosity refers to the ridged nature of the organism. In general, more rugose (i.e. complex) organisms are
Document: ASC-MSC Seaweed (Algae) Risk Based Framework v1.0 Page 28 Date of publication: 7 March 2018 © Aquaculture Stewardship Council and Marine Stewardship Council 2018
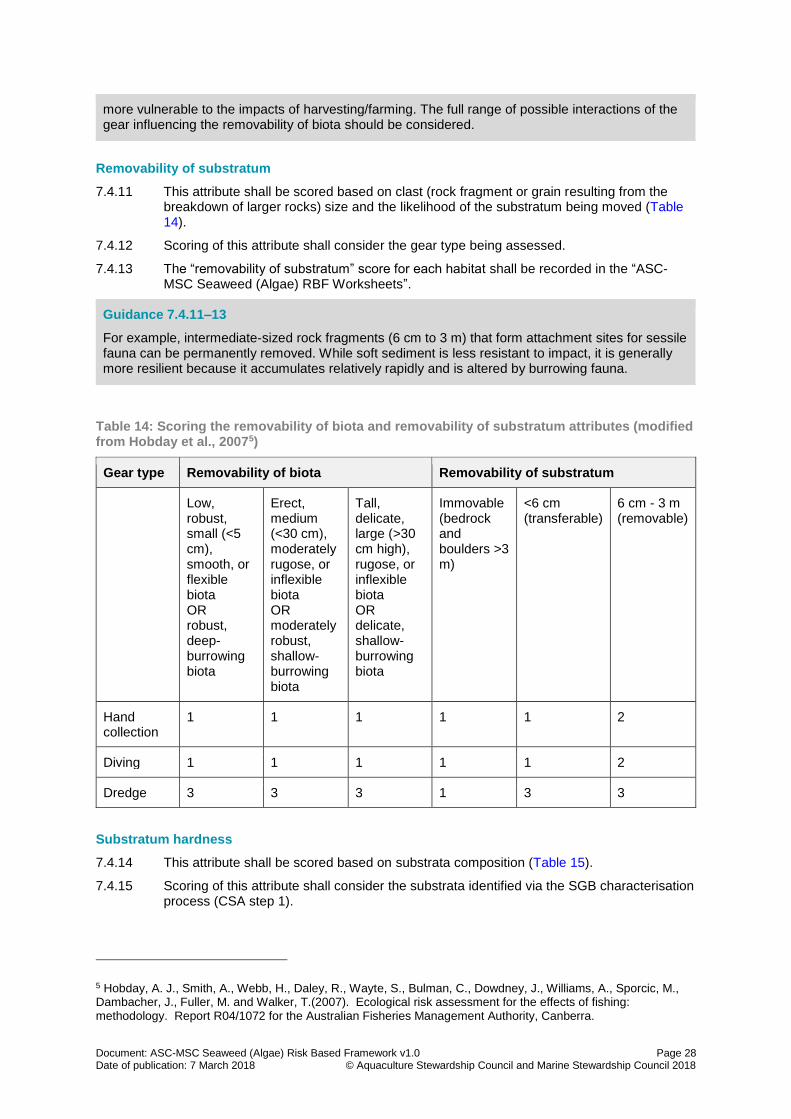
Removability of substratum
7.4.11 This attribute shall be scored based on clast (rock fragment or grain resulting from the breakdown of larger rocks) size and the likelihood of the substratum being moved (Table 14).
7.4.12 Scoring of this attribute shall consider the gear type being assessed.
7.4.13 The “removability of substratum” score for each habitat shall be recorded in the “ASC-MSC Seaweed (Algae) RBF Worksheets”.
Table 14: Scoring the removability of biota and removability of substratum attributes (modified from Hobday et al., 20075)
Gear type Removability of biota Removability of substratum
Low, robust, small (<5 cm), smooth, or flexible biota OR robust, deep-burrowing biota
Erect, medium (<30 cm), moderately rugose, or inflexible biota OR moderately robust, shallow-burrowing biota
Tall, delicate, large (>30 cm high), rugose, or inflexible biota OR delicate, shallow-burrowing biota
Immovable (bedrock and boulders >3 m)
<6 cm (transferable)
6 cm - 3 m (removable)
Hand collection
1 1 1 1 1 2
Diving 1 1 1 1 1 2
Dredge 3 3 3 1 3 3
Substratum hardness
7.4.14 This attribute shall be scored based on substrata composition (Table 15).
7.4.15 Scoring of this attribute shall consider the substrata identified via the SGB characterisation process (CSA step 1).
5 Hobday, A. J., Smith, A., Webb, H., Daley, R., Wayte, S., Bulman, C., Dowdney, J., Williams, A., Sporcic, M., Dambacher, J., Fuller, M. and Walker, T.(2007). Ecological risk assessment for the effects of fishing: methodology. Report R04/1072 for the Australian Fisheries Management Authority, Canberra.
more vulnerable to the impacts of harvesting/farming. The full range of possible interactions of the gear influencing the removability of biota should be considered.
Guidance 7.4.11–13
For example, intermediate-sized rock fragments (6 cm to 3 m) that form attachment sites for sessile fauna can be permanently removed. While soft sediment is less resistant to impact, it is generally more resilient because it accumulates relatively rapidly and is altered by burrowing fauna.
Document: ASC-MSC Seaweed (Algae) Risk Based Framework v1.0 Page 29 Date of publication: 7 March 2018 © Aquaculture Stewardship Council and Marine Stewardship Council 2018
7.4.16 The “substratum hardness” score for each habitat shall be recorded in the “ASC-MSC Seaweed (Algae) RBF Worksheets”.
Substratum ruggedness
7.4.17 This attribute shall be scored on the basis of the extent to which available habitat is actually accessible to mobile gear given the ruggedness of the substratum (Table 15).
7.4.18 Scoring of this attribute shall consider the characteristics of the substratum and the gear type being used.
7.4.19 The “substratum ruggedness” score for each habitat shall be recorded in the “ASC-MSC Seaweed (Algae) RBF Worksheets”.
Seabed slope
7.4.20 This attribute shall be scored based on the impact to habitat that occurs as a result of slope steepness and mobility of substrata once dislodged (Table 15).
7.4.20.1 Scoring this attribute shall consider the degree of slope.
7.4.21 The “seabed slope” score for each habitat shall be recorded in the “ASC-MSC Seaweed (Algae) RBF Worksheets”.
7.4.22 The aggregate consequence score for each habitat shall be determined by using the “ASC-MSC Seaweed (Algae) RBF Worksheets”.

Document: ASC-MSC Seaweed (Algae) Risk Based Framework v1.0 Page 30 Date of publication: 7 March 2018 © Aquaculture Stewardship Council and Marine Stewardship Council 2018
Table 15: Scoring the substratum hardness, substratum ruggedness, and seabed slope attributes (modified from Hobday et al., 2007)
Gear type Substratum hardness Substratum ruggedness Seabed slope
Hard (igneous, sedimentary, or heavily consolidated rock types)
Soft (lightly consolidated, weathered, or biogenic)
Sediments (unconsoli-dated)
High relief (>1 m), high outcrop, or rugged surface structure (cracks, crevices, overhangs, large boulders, rock walls)
Low relief (<1.0 m), rough surface structure (rubble, small boulders, rock edges), subcrop, or low outcrop
Flat, simple surface structure (mounds, undulations, ripples), current rippled, wave rippled, or irregular
Low degree (<1): Plains in coastal margin, inner or outer shelf or mid-slope OR terraces in mid-slope OR rocky banks/ fringing reefs in coastal margin, inner or outer shelf, or upper or mid-slope
Medium degree (1-10): Terraces in the outer shelf
High degree (>10): Canyons in outer shelf, or mid-slope OR seamounts/ bioherms in the coastal margin, inner shelf or mid-slope
Hand collection
1 2 3 3 3 1 1 2 3
Diving 1 2 3 3 3 1 1 2 3
Dredge 1 2 3 1 1 3 1 2 3

Document: ASC-MSC Seaweed (Algae) Risk Based Framework v1.0 Page 31 Date of publication: 7 March 2018 © Aquaculture Stewardship Council and Marine Stewardship Council 2018
7.5 CSA Step 3: Score the spatial attributes
Gear footprint
7.5.1 This attribute shall be scored on the basis of the gear’s potential for disturbance and the number of encounters required to produce an impact on a habitat, taking into account the size, weight, and mobility of individual gears and the footprint of the gears (Table 16).
7.5.2 7.4.7.1 and its sub-clauses shall apply here.
7.5.3 The “gear footprint” score for each habitat shall be recorded in the “ASC-MSC Seaweed (Algae) RBF Worksheets”.
Table 16: Scoring the gear footprint attribute (modified from Hobday et al., 2007)
Gear type Gear footprint score
Hand collection 1
Diving 1
Dredge 3
Spatial overlap
7.5.4 This attribute shall be scored based on the spatial overlap between the habitat(s) distribution within the “managed area” and the distribution of areas harvested/farmed by the UoA (Table 17)
7.5.5 The “spatial overlap” score for each habitat shall be recorded in the “ASC-MSC Seaweed (Algae) RBF Worksheets”.
Encounterability
7.5.6 This attribute shall be scored based on the likelihood that a harvesting/farming gear will encounter the habitat within the “managed area”, taking into account the nature and deployment of the harvesting/farming gear and the possibility of its interaction with the habitat (Table 17).
7.5.7 The “encounterability” score for each habitat shall be recorded in the “ASC-MSC Seaweed (Algae) RBF Worksheets”.
7.5.8 The aggregate spatial score shall be determined by using the “ASC-MSC Seaweed (Algae) RBF Worksheets”.
Table 17: Scoring spatial attributes (modified from Williams et al., 2011)
Spatial attribute
Score
0.5 1 1.5 2 2.5 3
Spatial overlap UoA overlap with a habitat is ≤15%
UoA overlap with a habitat is ≤30%
UoA overlap with a habitat is ≤45%
UoA overlap with a habitat is ≤60%
UoA overlap with a habitat is ≤75%
UoA overlap with a habitat is >75%
Encounter-ability
Likelihood of encounter-
Likelihood of encounter-
Likelihood of encounter-
Likelihood of encounter-
Likelihood of encounter-
Likelihood of encounter-

Document: ASC-MSC Seaweed (Algae) Risk Based Framework v1.0 Page 32 Date of publication: 7 March 2018 © Aquaculture Stewardship Council and Marine Stewardship Council 2018
ability is ≤15%
ability is ≤30%
ability is ≤45%
ability is ≤60%
ability is ≤75%
ability is >75%
7.6 CSA Step 4: Determine the CSA score and equivalent MSC score
7.6.1 The team shall use the “ASC-MSC Seaweed (Algae) RBF Worksheets” to obtain the CSA score for each habitat and the equivalent ASC-MSC score.
7.6.2 In cases where there is only one habitat scored in the PI, the team shall consider this as the overall score.
7.6.3 In cases where there are multiple habitats, the lowest score should be awarded to the PI.
7.6.4 If there is additional information regarding the attribute(s) that justifies modifying the ASC-MSC score either upward or downward such information shall be used to reach the final ASC-MSC score for the PI.
7.6.4.1 The team shall provide the justification for any score modification.
7.7 Setting conditions using the CSA
7.7.1 Where any habitat score is less than target/minimum level, the team shall set a condition or critical condition on the PI.
8 Conducting a Scale Intensity Consequence Analysis (SICA)
Guidance 7.7.1
Since some of the CSA attributes are inherent to the habitat (i.e. consequence attributes), these attributes are not likely to be changed through UoA improvements. Where attributes have been defaulted to “high risk” because of a lack of information, these risk scores could be reduced if additional studies revealed the risk level was actually lower.
However, UoA improvements can lead to changes in the spatial attributes. For example, UoAs can implement gear modifications that lessen their habitat impacts, change their spatial footprint by avoiding high-score habitats (e.g. corals), and/or make other spatial changes that will result in lower-risk impacts.
The CAB may elect to test if the proposed Client Action Plan will have the desired effect at the time of agreeing on corrective actions by re-running the CSA. For instance, if the proposal was to decrease the removability of a biota by using a different type of gear, it would be important to ensure that any future CSA score with the alternative gear did not identify a consequential problem for another, currently unaffected habitat.
Guidance Section 8
The five MSC SICA steps are summarised below:
• SICA Step 1: Prepare a SICA scoring template for each ecosystem.
• SICA Step 2: Score spatial scale of the harvesting/farming activity.
• SICA Step 3: Score temporal scale of the harvesting/farming activity.
• SICA Step 4: Score the intensity of the harvesting/farming activity.
• SICA Step 5: Score the consequence resulting from the scale and intensity of the harvesting/farming activity for the most vulnerable subcomponent of the ecosystem.
Document: ASC-MSC Seaweed (Algae) Risk Based Framework v1.0 Page 33 Date of publication: 7 March 2018 © Aquaculture Stewardship Council and Marine Stewardship Council 2018
8.1 Preparation
8.1.1 The team shall conduct a SICA for each data-deficient ecosystem within PI 2.2.
8.2 Stakeholder involvement within the SICA
8.2.1 The team shall use input from stakeholders to:
a. Assist in the identification of ecosystems which are affected by the production unit.
b. Provide information suitable for the qualitative evaluation of the risks that the harvesting/farming activity poses to the ecosystem.
c. Assist in scoring the spatial and temporal scales and the intensity of the harvesting/farming activity.
d. Assist in scoring the consequence for the ecosystem.
8.3 SICA Step 1: Prepare SICA scoring template for each data-deficient scoring element
8.3.1 The scores and rationales shall be documented in the SICA scoring template (Table 18), in the “ASC-MSC Seaweed (Algae) Audit Reporting Template”.

Document: ASC-MSC Seaweed (Algae) Risk Based Framework v1.0 Page 34 Date of publication: 7 March 2018 © Aquaculture Stewardship Council and Marine Stewardship Council 2018
Table 18: SICA scoring template for PI 2.2 Ecosystem
Performance Indicator PI 2.5.1 Ecosystem outcome
Spatial scale of harvesting/farming activity
Temporal scale of harvesting/farming activity
Intensity of harvesting/farming activity
Relevant subcomponents
Consequence score
Production unit name: Species composition
Functional group composition
Distribution of the community
Trophic size/structure
Rationale for spatial scale of harvesting/farming activity
Rationale for temporal scale of harvesting/farming activity
Rationale for intensity of harvesting/farming activity
Rationale for Consequence score
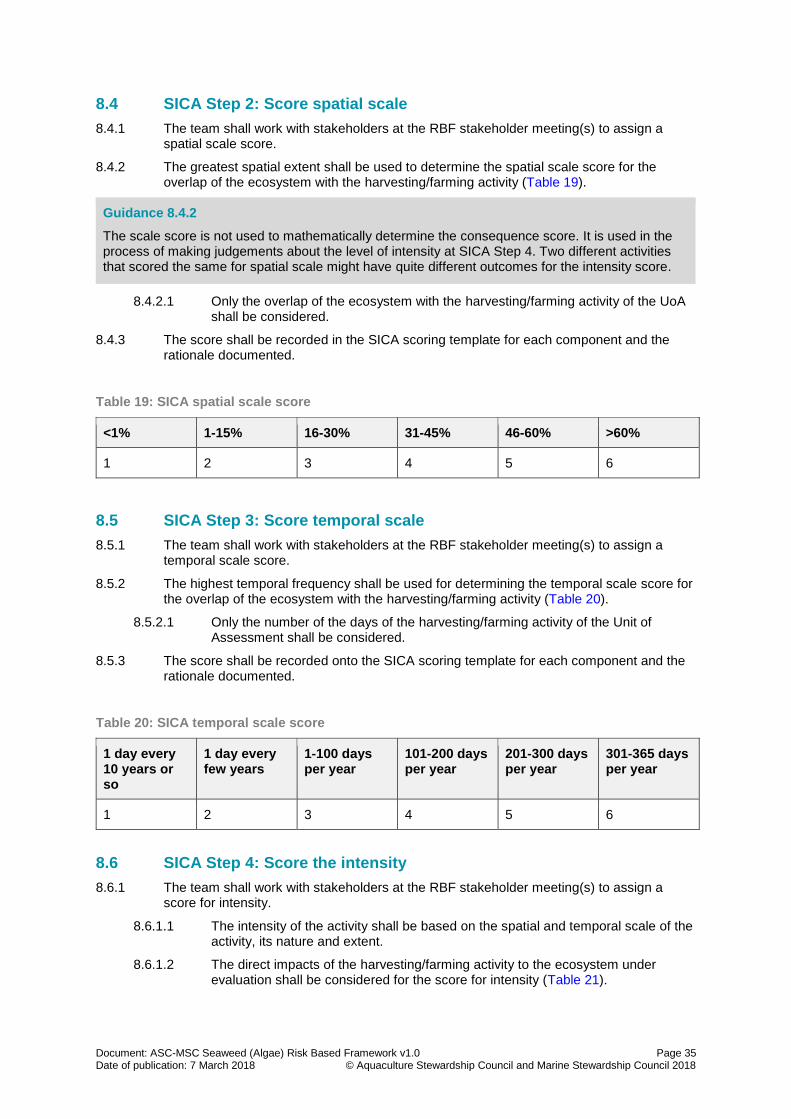
Document: ASC-MSC Seaweed (Algae) Risk Based Framework v1.0 Page 35 Date of publication: 7 March 2018 © Aquaculture Stewardship Council and Marine Stewardship Council 2018
8.4 SICA Step 2: Score spatial scale
8.4.1 The team shall work with stakeholders at the RBF stakeholder meeting(s) to assign a spatial scale score.
8.4.2 The greatest spatial extent shall be used to determine the spatial scale score for the overlap of the ecosystem with the harvesting/farming activity (Table 19).
8.4.2.1 Only the overlap of the ecosystem with the harvesting/farming activity of the UoA shall be considered.
8.4.3 The score shall be recorded in the SICA scoring template for each component and the rationale documented.
Table 19: SICA spatial scale score
<1% 1-15% 16-30% 31-45% 46-60% >60%
1 2 3 4 5 6
8.5 SICA Step 3: Score temporal scale
8.5.1 The team shall work with stakeholders at the RBF stakeholder meeting(s) to assign a temporal scale score.
8.5.2 The highest temporal frequency shall be used for determining the temporal scale score for the overlap of the ecosystem with the harvesting/farming activity (Table 20).
8.5.2.1 Only the number of the days of the harvesting/farming activity of the Unit of Assessment shall be considered.
8.5.3 The score shall be recorded onto the SICA scoring template for each component and the rationale documented.
Table 20: SICA temporal scale score
1 day every 10 years or so
1 day every few years
1-100 days per year
101-200 days per year
201-300 days per year
301-365 days per year
1 2 3 4 5 6
8.6 SICA Step 4: Score the intensity
8.6.1 The team shall work with stakeholders at the RBF stakeholder meeting(s) to assign a score for intensity.
8.6.1.1 The intensity of the activity shall be based on the spatial and temporal scale of the activity, its nature and extent.
8.6.1.2 The direct impacts of the harvesting/farming activity to the ecosystem under evaluation shall be considered for the score for intensity (Table 21).
Guidance 8.4.2
The scale score is not used to mathematically determine the consequence score. It is used in the process of making judgements about the level of intensity at SICA Step 4. Two different activities that scored the same for spatial scale might have quite different outcomes for the intensity score.

Document: ASC-MSC Seaweed (Algae) Risk Based Framework v1.0 Page 36 Date of publication: 7 March 2018 © Aquaculture Stewardship Council and Marine Stewardship Council 2018
8.6.2 The score shall be recorded in the SICA scoring template for the component in question, and the rationale documented.
Table 21: SICA intensity score
Level Score Description
Negligible 1 Remote likelihood of detection of harvesting/farming activity at any spatial or temporal scale
Minor 2 Activity occurs rarely or in few restricted locations and detectability of harvesting/farming activity even at these scales is rare
Moderate 3 Moderate detectability of harvesting/farming activity at broader spatial scale, or obvious but local detectability
Major 4 Detectable evidence of harvesting/farming activity occurs reasonably often at a broad spatial scale
Severe 5 Occasional but very obvious detectability or widespread and frequent evidence of harvesting/farming activity
Catastrophic 6 Local to regional evidence of harvesting/farming activity or continual and widespread detectability
Guidance 8.6.1.2
The intensity score should reflect the frequency and extent of the harvesting/farming activity.
Scale scores are not used to mathematically determine the consequence score. It is used in the process of making judgements about the level of intensity. Two different activities that scored the same for scale score might have quite different outcomes for the intensity score.
Examples of Intensity scores:
• Spatial scale score = low, and temporal scale score = low
Intensity score = low
Rationale: The spatial overlap between the harvesting/farming activity and the ecosystem distribution is extremely low and the harvesting/farming activity occurs very rarely. This combination of scale scores indicates that the intensity of this production unit is negligible.
• Spatial scale score = high, and temporal scale score = high
Intensity score = high
Rationale: The harvesting/farming activity covers almost half of the spatial distribution of the stock and the activity occurs frequently. This combination of scale scores indicates that the intensity of this production unit is severe.
• Spatial scale score = low, and temporal scale score = high
Intensity score = high
Rationale: The spatial overlap between the harvesting/farming activity and the stock distribution is extremely low, and the harvesting/farming activity occurs frequently. This combination of scale scores indicates that the intensity of this production unit is severe as the harvesting/farming activity has frequent impacts on a small part of the stock.
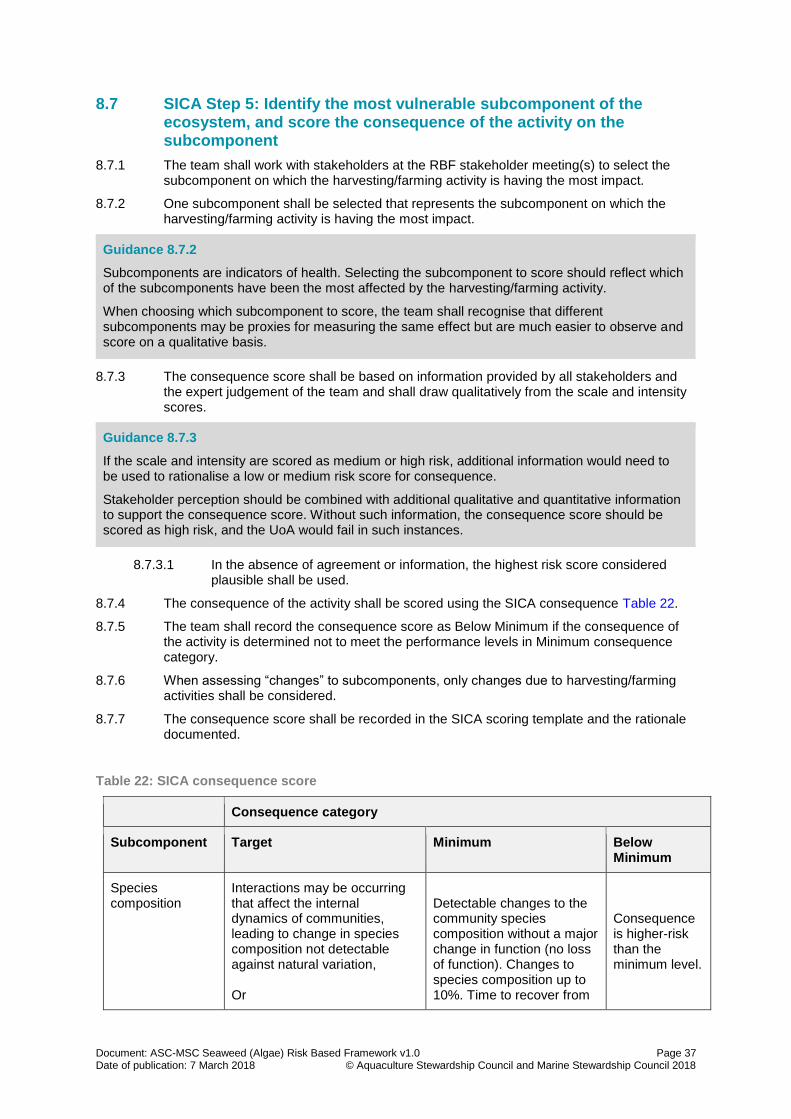
Document: ASC-MSC Seaweed (Algae) Risk Based Framework v1.0 Page 37 Date of publication: 7 March 2018 © Aquaculture Stewardship Council and Marine Stewardship Council 2018
8.7 SICA Step 5: Identify the most vulnerable subcomponent of the ecosystem, and score the consequence of the activity on the subcomponent
8.7.1 The team shall work with stakeholders at the RBF stakeholder meeting(s) to select the subcomponent on which the harvesting/farming activity is having the most impact.
8.7.2 One subcomponent shall be selected that represents the subcomponent on which the harvesting/farming activity is having the most impact.
8.7.3 The consequence score shall be based on information provided by all stakeholders and the expert judgement of the team and shall draw qualitatively from the scale and intensity scores.
8.7.3.1 In the absence of agreement or information, the highest risk score considered plausible shall be used.
8.7.4 The consequence of the activity shall be scored using the SICA consequence Table 22.
8.7.5 The team shall record the consequence score as Below Minimum if the consequence of the activity is determined not to meet the performance levels in Minimum consequence category.
8.7.6 When assessing “changes” to subcomponents, only changes due to harvesting/farming activities shall be considered.
8.7.7 The consequence score shall be recorded in the SICA scoring template and the rationale documented.
Table 22: SICA consequence score
Consequence category
Subcomponent Target Minimum Below Minimum
Species composition
Interactions may be occurring that affect the internal dynamics of communities, leading to change in species composition not detectable against natural variation, Or
Detectable changes to the community species composition without a major change in function (no loss of function). Changes to species composition up to 10%. Time to recover from
Consequence is higher-risk than the minimum level.
Guidance 8.7.2
Subcomponents are indicators of health. Selecting the subcomponent to score should reflect which of the subcomponents have been the most affected by the harvesting/farming activity.
When choosing which subcomponent to score, the team shall recognise that different subcomponents may be proxies for measuring the same effect but are much easier to observe and score on a qualitative basis.
Guidance 8.7.3
If the scale and intensity are scored as medium or high risk, additional information would need to be used to rationalise a low or medium risk score for consequence.
Stakeholder perception should be combined with additional qualitative and quantitative information to support the consequence score. Without such information, the consequence score should be scored as high risk, and the UoA would fail in such instances.
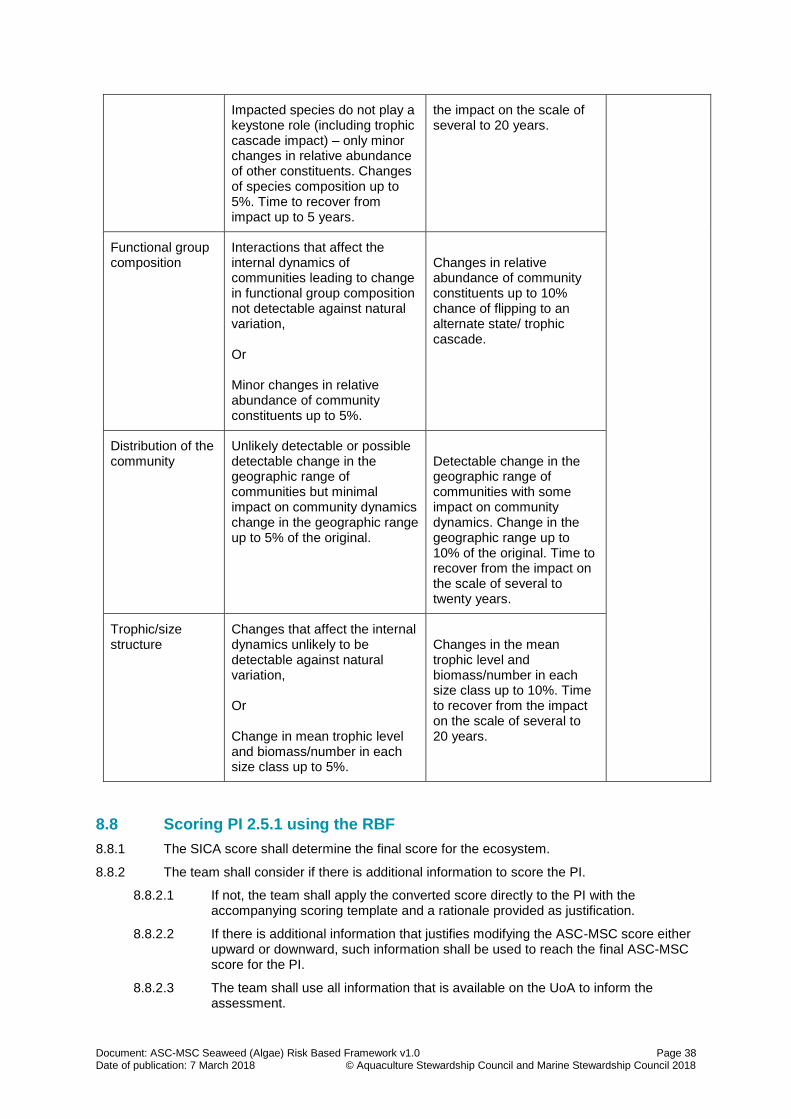
Document: ASC-MSC Seaweed (Algae) Risk Based Framework v1.0 Page 38 Date of publication: 7 March 2018 © Aquaculture Stewardship Council and Marine Stewardship Council 2018
Impacted species do not play a keystone role (including trophic cascade impact) – only minor changes in relative abundance of other constituents. Changes of species composition up to 5%. Time to recover from impact up to 5 years.
the impact on the scale of several to 20 years.
Functional group composition
Interactions that affect the internal dynamics of communities leading to change in functional group composition not detectable against natural variation, Or Minor changes in relative abundance of community constituents up to 5%.
Changes in relative abundance of community constituents up to 10% chance of flipping to an alternate state/ trophic cascade.
Distribution of the community
Unlikely detectable or possible detectable change in the geographic range of communities but minimal impact on community dynamics change in the geographic range up to 5% of the original.
Detectable change in the geographic range of communities with some impact on community dynamics. Change in the geographic range up to 10% of the original. Time to recover from the impact on the scale of several to twenty years.
Trophic/size structure
Changes that affect the internal dynamics unlikely to be detectable against natural variation, Or Change in mean trophic level and biomass/number in each size class up to 5%.
Changes in the mean trophic level and biomass/number in each size class up to 10%. Time to recover from the impact on the scale of several to 20 years.
8.8 Scoring PI 2.5.1 using the RBF
8.8.1 The SICA score shall determine the final score for the ecosystem.
8.8.2 The team shall consider if there is additional information to score the PI.
8.8.2.1 If not, the team shall apply the converted score directly to the PI with the accompanying scoring template and a rationale provided as justification.
8.8.2.2 If there is additional information that justifies modifying the ASC-MSC score either upward or downward, such information shall be used to reach the final ASC-MSC score for the PI.
8.8.2.3 The team shall use all information that is available on the UoA to inform the assessment.

Document: ASC-MSC Seaweed (Algae) Risk Based Framework v1.0 Page 39 Date of publication: 7 March 2018 © Aquaculture Stewardship Council and Marine Stewardship Council 2018
8.8.2.4 The team shall provide the justification for any score modification.
8.8.2.5 The team shall record all changes to the score and justification for the changes.
8.8.3 The team shall record the final PI score in the SICA table within the “ASC-MSC Seaweed (Algae) RBF Worksheets”.
8.9 Setting conditions using the RBF
8.9.1 Where any score is less than target/minimum level, the team shall set a condition/critical on that PI.
8.9.1.1 If a condition/critical condition is triggered when assessing a PI using the SICA, the team shall make sure that the Client Action Plan proposed by the production unit is capable of raising the score to the target level.
8.9.1.2 If the action plan is not capable of raising the SICA score to the target level within a suitable timeframe, the team shall not allow a production unit to use the RBF for this PI in subsequent MSC assessments.
a. In such cases, the team shall raise a condition on the PI that there shall be information collected to support an analysis of the impact of the production unit on the ecosystem by the time of re-assessment.
Document: ASC-MSC Seaweed (Algae) Risk Based Framework v1.0 Page 40 Date of publication: 7 March 2018 © Aquaculture Stewardship Council and Marine Stewardship Council 2018
A.1 Annex A: Scoring Group of Species using the PSA
A.1.1 List all species and group them according to similar taxonomy.
A.1.2 Identify at least the two most at-risk species within each taxonomic group.
A.1.3 The decision which of the species are most at risk shall be determined by:
a. Selecting the species with the highest risk score when scoring the productivity part of the PSA for all species.
b. Working with stakeholders to identify qualitatively which species are most at risk within each group.
A.1.4 If there are several species that appear to have a similar level of risk and the team and majority of stakeholders cannot agree on which one is most at-risk for a given PI, the team shall conduct a PSA on all species.
A.1.5 The process of grouping species and choosing the species most at risk within each group shall be well documented and the choice justified in the assessment documentation.
A.1.6 The representative most at-risk species shall be included in the PSA and will determine the score for the species group.
Guidance A.1.2–3
The determination of which species is most at risk is made qualitatively based on knowledge about inherent species vulnerability, as well as the frequency of interaction with the production unit, and level of damage done (e.g. released alive vs. always killed).
More than two species can be scored as appropriate.
End of document
Related Documents


