Portland Community College CASCADE CAMPUS Transportation Demand Management Plan Portland, Oregon Prepared For: Portland Community College PO Box 19000 Portland, OR 97280 (971) 722-6111 Prepared By: Rick Williams Consulting 610 SW Alder, Suite 1221 Portland, OR 97205 (503) 236-6441 With: Kittelson & Associates, Inc. 610 SW Alder, Suite 700 Portland, OR 97205 (503) 228-5230 Project Manager: Rick Williams (RWC) Project Manager: Phill Worth (KAI) April, 2012

Welcome message from author
This document is posted to help you gain knowledge. Please leave a comment to let me know what you think about it! Share it to your friends and learn new things together.
Transcript
Portland Community College
CASCADE CAMPUS Transportation Demand Management Plan Portland, Oregon
Prepared For:
Portland Community College PO Box 19000 Portland, OR 97280 (971) 722-6111
Prepared By: Rick Williams Consulting 610 SW Alder, Suite 1221 Portland, OR 97205 (503) 236-6441 With: Kittelson & Associates, Inc. 610 SW Alder, Suite 700 Portland, OR 97205 (503) 228-5230
Project Manager: Rick Williams (RWC) Project Manager: Phill Worth (KAI)
April, 2012
Table of Contents
I. Introduction and Purpose ............................................................................................ 1
II. Existing Conditions ....................................................................................................... 2
III. Future Conditions ....................................................................................................... 12
IV. Defining the Problem – Neighborhood Infiltrations .................................................. 13
V. Evaluation Criteria ...................................................................................................... 16
VI. Demand Management Program Actions ................................................................... 25
VII. Forecasting TDM Impacts .......................................................................................... 41
VIII. Summary .................................................................................................................... 43
APPENDICES
A. Summary of Tiered Strategies B. Sample: Performance Reporting “Diagnostic Dashboard”
PCC - CASCADE CAMPUS
TRANSPORTATION DEMAND MANAGEMENT PLAN (TDMP)
April 2012
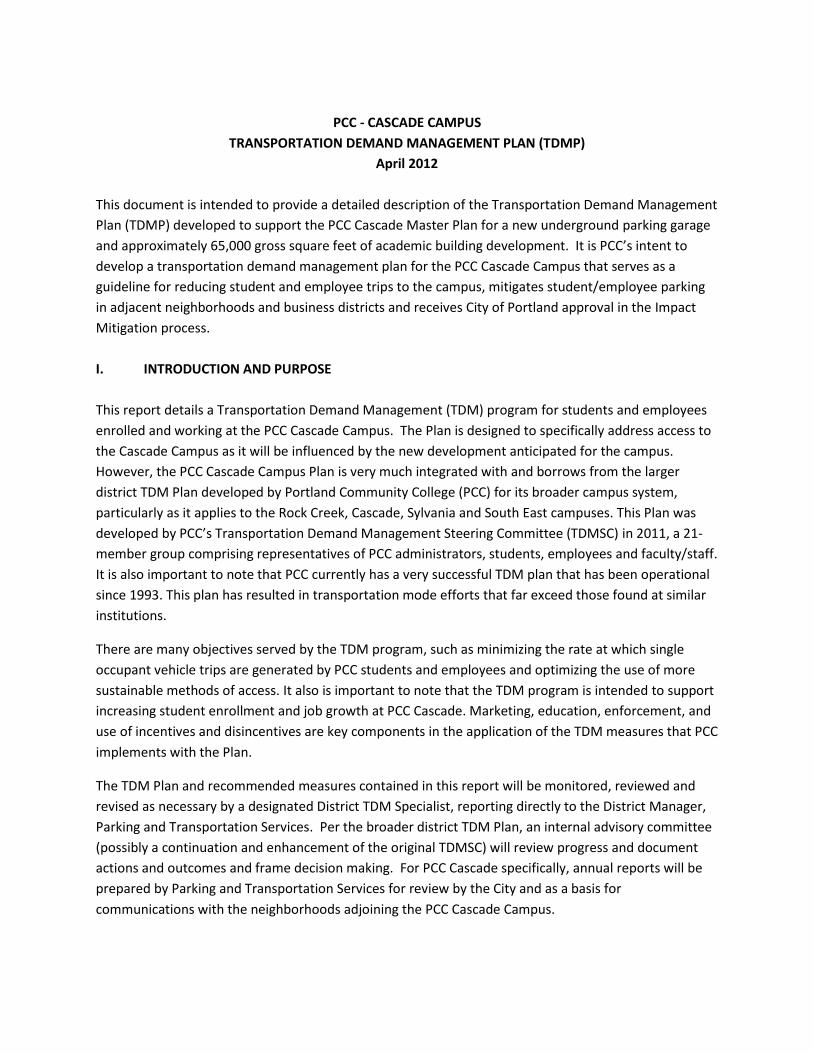
This document is intended to provide a detailed description of the Transportation Demand Management
Plan (TDMP) developed to support the PCC Cascade Master Plan for a new underground parking garage
and approximately 65,000 gross square feet of academic building development. It is PCC’s intent to
develop a transportation demand management plan for the PCC Cascade Campus that serves as a
guideline for reducing student and employee trips to the campus, mitigates student/employee parking
in adjacent neighborhoods and business districts and receives City of Portland approval in the Impact
Mitigation process.
I. INTRODUCTION AND PURPOSE
This report details a Transportation Demand Management (TDM) program for students and employees
enrolled and working at the PCC Cascade Campus. The Plan is designed to specifically address access to
the Cascade Campus as it will be influenced by the new development anticipated for the campus.
However, the PCC Cascade Campus Plan is very much integrated with and borrows from the larger
district TDM Plan developed by Portland Community College (PCC) for its broader campus system,
particularly as it applies to the Rock Creek, Cascade, Sylvania and South East campuses. This Plan was
developed by PCC’s Transportation Demand Management Steering Committee (TDMSC) in 2011, a 21-
member group comprising representatives of PCC administrators, students, employees and faculty/staff.
It is also important to note that PCC currently has a very successful TDM plan that has been operational
since 1993. This plan has resulted in transportation mode efforts that far exceed those found at similar
institutions.
There are many objectives served by the TDM program, such as minimizing the rate at which single
occupant vehicle trips are generated by PCC students and employees and optimizing the use of more
sustainable methods of access. It also is important to note that the TDM program is intended to support
increasing student enrollment and job growth at PCC Cascade. Marketing, education, enforcement, and
use of incentives and disincentives are key components in the application of the TDM measures that PCC
implements with the Plan.
The TDM Plan and recommended measures contained in this report will be monitored, reviewed and
revised as necessary by a designated District TDM Specialist, reporting directly to the District Manager,
Parking and Transportation Services. Per the broader district TDM Plan, an internal advisory committee
(possibly a continuation and enhancement of the original TDMSC) will review progress and document
actions and outcomes and frame decision making. For PCC Cascade specifically, annual reports will be
prepared by Parking and Transportation Services for review by the City and as a basis for
communications with the neighborhoods adjoining the PCC Cascade Campus.
PCC Cascade Campus Transportation Demand Management Plan
Page 2
Though this Plan is developed for the PCC Cascade campus, the intent is to actively coordinate its implementation with many external partners, such as TriMet, the City of Portland and affected neighborhoods. II. EXISTING CONDITIONS
This section summarizes the most recent Kittleson & Associates, Inc. (KAI) traffic, circulation and parking
studies conducted for the PCC Cascade Campus Impact Mitigation Plan update.1 Elements included in
this section will be particularly focused on outlining and describing existing parking conditions and
current levels of infiltration of PCC cars in the neighborhood. This section will also provide a summary of
current TDM programs at the Cascade Campus, to underscore the strong efforts at trip reduction
already in place in the area of student transit, shuttles and biking.
This section is organized into the following elements:
A. Travel to and from PCC Cascade
Geographic Distribution of Student Enrollment
Mode Split of students and employees
Transportation Facilities
B. Existing TDM Programs
C. Parking Conditions
Parking Supply
Peak Parking Utilization
Neighborhood Infiltration
Peak Parking Demand
A. Existing Travel to and from PCC Cascade
Geographic Distribution of Cascade Campus Student Enrollment
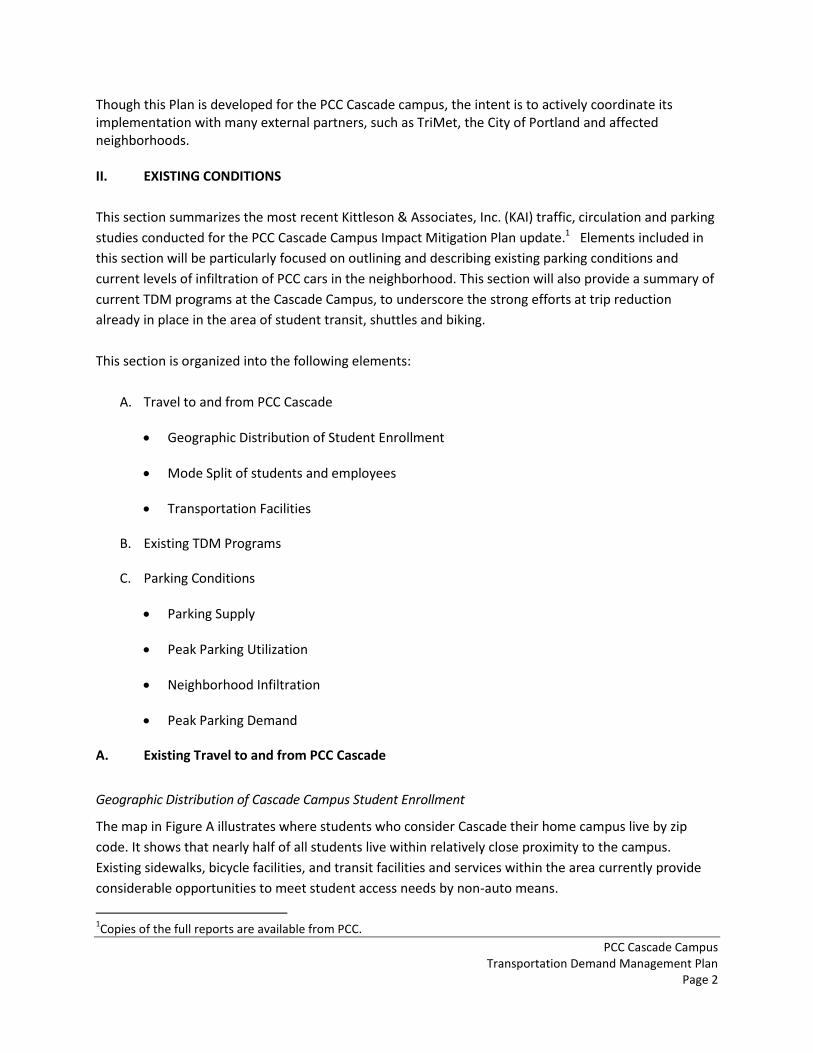
The map in Figure A illustrates where students who consider Cascade their home campus live by zip
code. It shows that nearly half of all students live within relatively close proximity to the campus.
Existing sidewalks, bicycle facilities, and transit facilities and services within the area currently provide
considerable opportunities to meet student access needs by non-auto means.
1Copies of the full reports are available from PCC.
PCC Cascade Campus Transportation Demand Management Plan
Page 3
Figure A
Students coming from zip codes in central Washington County must travel a distance much greater than
the regional average for a commute-to-school trip.
Existing Mode Split
PCC conducted a survey in early 2011 to better understand the transportation needs and preferences of
its students. The online survey received 4,877 responses college-wide, with a margin of error of ±2.7% at
the 95% confidence level. A total of 1,202 students at the Cascade campus responded. The survey
included basic questions about transportation habits and choices, as well as a conjoint analysis. PCC
administers the Employee Commute Options (ECO) Survey every two years, as required by the Oregon
Department of Environmental Quality. The ECO survey tracks the mode split of employees in order to
assess progress towards auto trip reduction goals. The current mode splits for students and employees,
as reported by these surveys, is provided in Table 1.
PCC Cascade Campus Transportation Demand Management Plan
Page 4
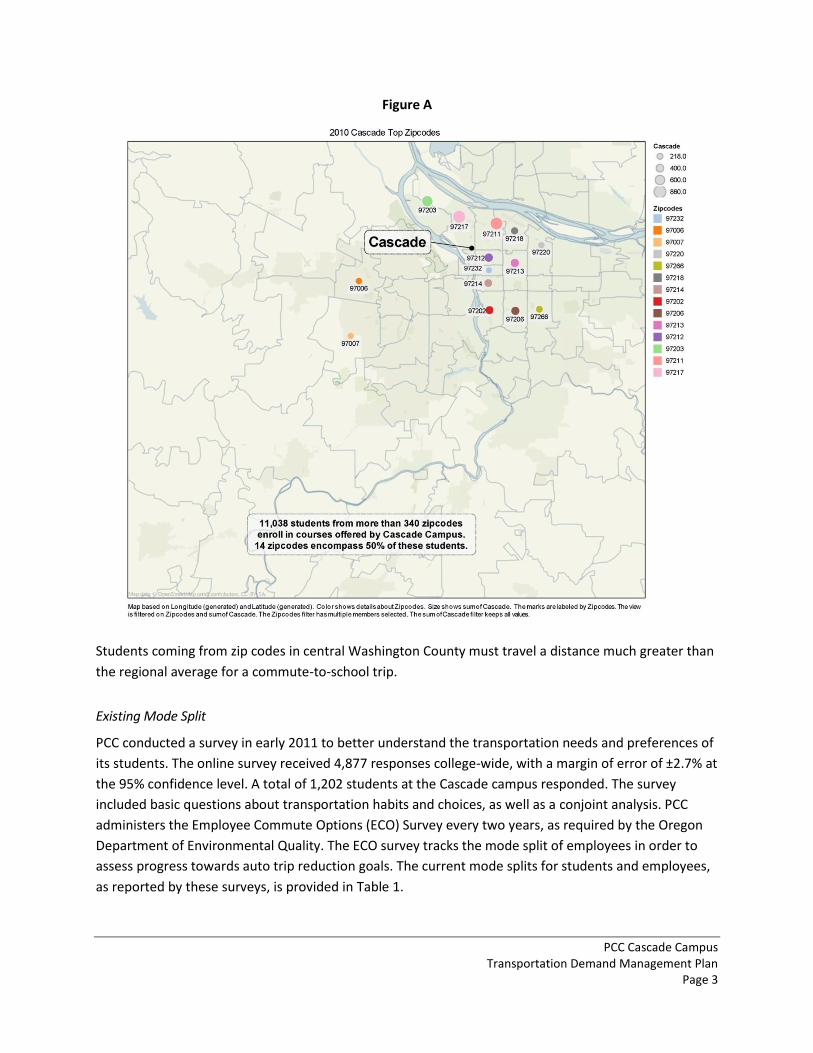
Table 1 Existing Mode Split (Cascade Campus)
MODE Student1 Employee
2
Drive Alone 61% 75%
Rideshare 5% 4%
Transit 16% 8%
PCC Shuttle 1% 3%
Bike 11% 3%
Walk 3% 2%
Other 3% 5%
Source: DHM, ECO Survey
As shown in the table, the majority of trips made to the campus come via drive alone auto. It is also
notable that the portion of students that drive alone to/from the PCC Cascade campus is substantially
less than the portion of employees that drive alone. After driving alone, transit is the second most used
option among both students and employees. The existing transportation facilities in the vicinity of the
Cascade campus are described in the following sections.
Roadway Facilities
Access to the Cascade campus is currently provided by several collector streets including N Killingsworth
Street, N Interstate Avenue, N Albina Avenue, N Vancouver Avenue, and N Williams Avenue. N
Killingsworth Street is located along the southern boundary of the campus and provides connections
between N Willamette Boulevard and NE Martin Luther King Jr. Boulevard to the west, and US 30 and
Interstate 205 to the east. N Killingsworth Street also provides connections to Interstate 5, a major
regional freeway located approximately two blocks west of campus. TriMet’s Yellow Line is located
along N Interstate Avenue which ties into several additional transit services provide by TriMet, including
TriMet’s Red, Blue, and Green Lines. N Albina Street provides additional north-south connections to the
campus, while N Vancouver Avenue and N Williams Avenue are popular north-south bicycle routes.
Table 2 summarizes the physical characteristics of the major roadways within the vicinity of the campus,
including their respective, functional classifications, cross sectional elements, posted travel speeds, and
whether they currently serve as a transit route.
PCC Cascade Campus Transportation Demand Management Plan
Page 5
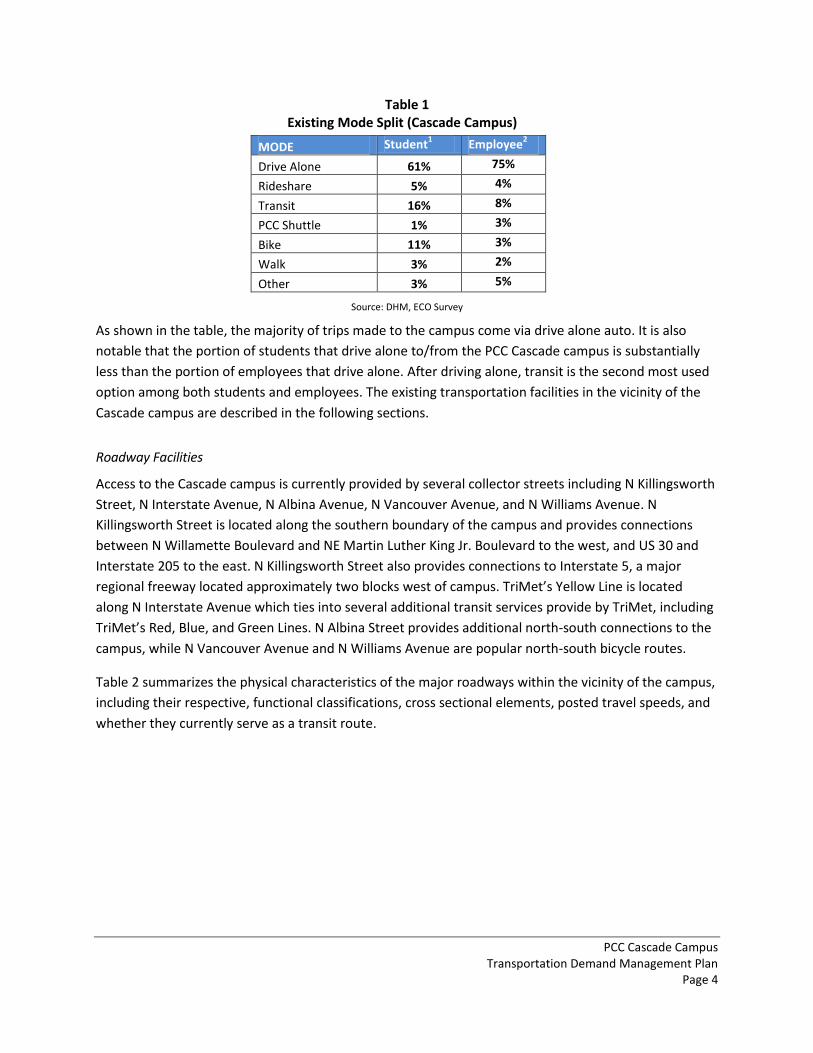
Table 2 Major Access Roadway Characteristics (PCC Cascade)
Roadway Street
Classification
Cross Section
Posted Speed Transit
Travel Lanes
Bike Lanes Parking
Sidewalks
N Killingsworth Street District Collector 2 No Yes Yes 30 Yes
N Interstate Avenue District Collector 2 Yes Yes1 Yes 30 Yes
N Albina Avenue Local Service Street 2 No Yes Yes 25/302 Yes
N Vancouver Avenue Neighborhood
Collector 2 (SB) Yes Yes Yes 30
Yes
N Williams Avenue Neighborhood
Collector 2 (NB) Yes Yes Yes 25
Yes3
1.On-street parking along N Interstate is in select locations only. 2. Posted speed limit on Albina Avenue: 25 mph north of Killingsworth, 30 mph south of Killingsworth. 3. Transit is currently provided along N Williams Street south of N Killingsworth Street.
As referenced in the City of Portland’s Transportation System Plan (TSP), the functional purpose of a
District Collector (e.g. Killingsworth Street) is to distribute traffic from Major City Traffic Streets to lower-
level streets, to provide access to district activity centers, and to serve trips that start and end in a City
transportation district (such as the Northeast District in which the Cascade campus is located).
Neighborhood Collectors (e.g. Vancouver Avenue and Williams Avenue) distribute traffic from Major
City Traffic Streets and District Collectors. Local Service Streets provide local access to residences and
businesses and provide for pedestrian circulation.
The City of Portland has several additional classifications for each roadway under its jurisdiction. Table 3
summarizes these functional classifications for pedestrian, bicycle, and transit use per the City’s TSP.
Table 3 City of Portland Street Designations
Roadway Pedestrian4 Bicycle Transit
N Killingsworth Street City Walkway Local Service Bikeway Major City Transit Street
N Interstate Avenue City Walkway City Bikeway Regional Transitway
N Albina Avenue City Walkway Local Service Bikeway Major City Transit Street
N Vancouver Avenue City Walkway City Bikeway Minor Transit Street
N Williams Avenue City Walkway City Bikeway Minor Transit Street
1. The Cascade campus is entirely within the Killingsworth Pedestrian District.
PCC Cascade Campus Transportation Demand Management Plan
Page 6
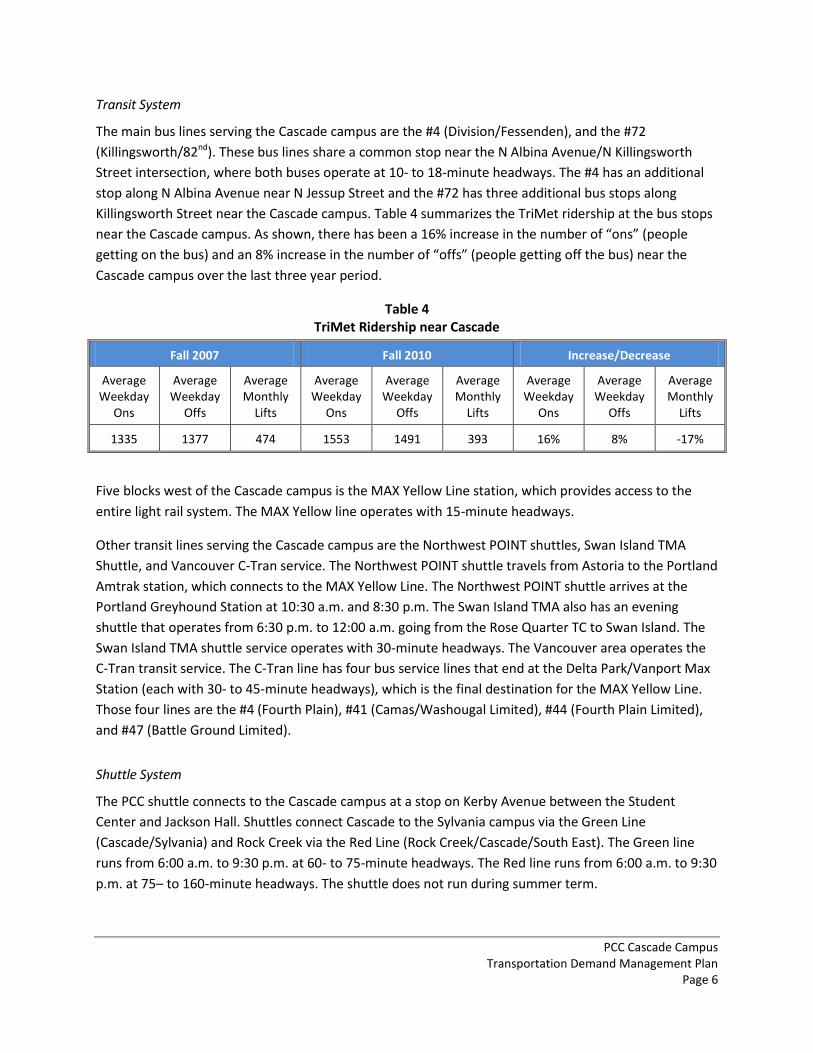
Transit System
The main bus lines serving the Cascade campus are the #4 (Division/Fessenden), and the #72
(Killingsworth/82nd). These bus lines share a common stop near the N Albina Avenue/N Killingsworth
Street intersection, where both buses operate at 10- to 18-minute headways. The #4 has an additional
stop along N Albina Avenue near N Jessup Street and the #72 has three additional bus stops along
Killingsworth Street near the Cascade campus. Table 4 summarizes the TriMet ridership at the bus stops
near the Cascade campus. As shown, there has been a 16% increase in the number of “ons” (people
getting on the bus) and an 8% increase in the number of “offs” (people getting off the bus) near the
Cascade campus over the last three year period.
Table 4 TriMet Ridership near Cascade
Fall 2007 Fall 2010 Increase/Decrease
Average Weekday
Ons
Average Weekday
Offs
Average Monthly
Lifts
Average Weekday
Ons
Average Weekday
Offs
Average Monthly
Lifts
Average Weekday
Ons
Average Weekday
Offs
Average Monthly
Lifts
1335 1377 474 1553 1491 393 16% 8% -17%
Five blocks west of the Cascade campus is the MAX Yellow Line station, which provides access to the
entire light rail system. The MAX Yellow line operates with 15-minute headways.
Other transit lines serving the Cascade campus are the Northwest POINT shuttles, Swan Island TMA
Shuttle, and Vancouver C-Tran service. The Northwest POINT shuttle travels from Astoria to the Portland
Amtrak station, which connects to the MAX Yellow Line. The Northwest POINT shuttle arrives at the
Portland Greyhound Station at 10:30 a.m. and 8:30 p.m. The Swan Island TMA also has an evening
shuttle that operates from 6:30 p.m. to 12:00 a.m. going from the Rose Quarter TC to Swan Island. The
Swan Island TMA shuttle service operates with 30-minute headways. The Vancouver area operates the
C-Tran transit service. The C-Tran line has four bus service lines that end at the Delta Park/Vanport Max
Station (each with 30- to 45-minute headways), which is the final destination for the MAX Yellow Line.
Those four lines are the #4 (Fourth Plain), #41 (Camas/Washougal Limited), #44 (Fourth Plain Limited),
and #47 (Battle Ground Limited).
Shuttle System
The PCC shuttle connects to the Cascade campus at a stop on Kerby Avenue between the Student
Center and Jackson Hall. Shuttles connect Cascade to the Sylvania campus via the Green Line
(Cascade/Sylvania) and Rock Creek via the Red Line (Rock Creek/Cascade/South East). The Green line
runs from 6:00 a.m. to 9:30 p.m. at 60- to 75-minute headways. The Red line runs from 6:00 a.m. to 9:30
p.m. at 75– to 160-minute headways. The shuttle does not run during summer term.
PCC Cascade Campus Transportation Demand Management Plan
Page 7
Pedestrian Facilities
The Cascade campus falls entirely within the Killingsworth Pedestrian District, which is bounded by
Ainsworth Street, Interstate 5, Emerson Street, Kerby Avenue, Jessup Street, Williams Avenue, and
Alberta Street. Pedestrian Districts are areas with frequent pedestrian activity where pedestrian access
is prioritized and all streets are of equal significance in serving pedestrian trips. Sidewalks in Pedestrian
Districts should be separated from vehicle traffic by landscaping or on-street parking, and crosswalks,
signalized crossings, curb extensions, and pedestrian refuges are appropriately used. According to the
Transportation Element, protected crossings should be considered at every corner or every 400 feet,
whichever is less.
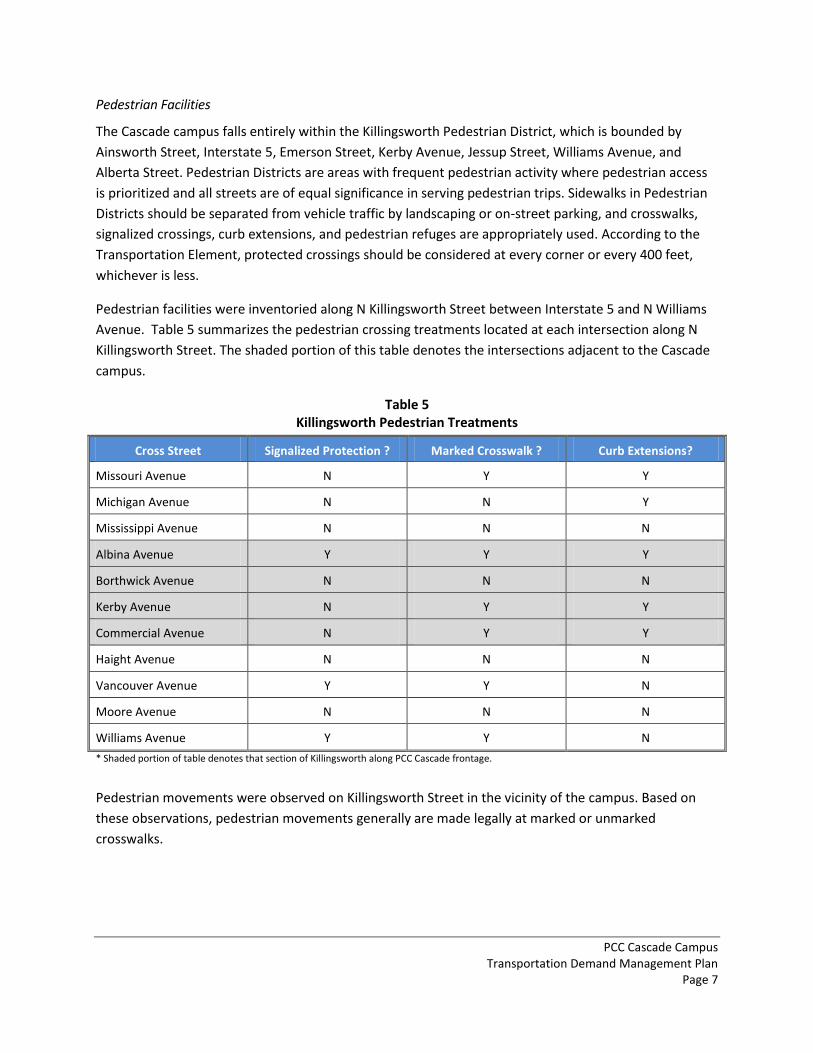
Pedestrian facilities were inventoried along N Killingsworth Street between Interstate 5 and N Williams
Avenue. Table 5 summarizes the pedestrian crossing treatments located at each intersection along N
Killingsworth Street. The shaded portion of this table denotes the intersections adjacent to the Cascade
campus.
Table 5 Killingsworth Pedestrian Treatments
Cross Street Signalized Protection ? Marked Crosswalk ? Curb Extensions?
Missouri Avenue N Y Y
Michigan Avenue N N Y
Mississippi Avenue N N N
Albina Avenue Y Y Y
Borthwick Avenue N N N
Kerby Avenue N Y Y
Commercial Avenue N Y Y
Haight Avenue N N N
Vancouver Avenue Y Y N
Moore Avenue N N N
Williams Avenue Y Y N
* Shaded portion of table denotes that section of Killingsworth along PCC Cascade frontage.
Pedestrian movements were observed on Killingsworth Street in the vicinity of the campus. Based on
these observations, pedestrian movements generally are made legally at marked or unmarked
crosswalks.
PCC Cascade Campus Transportation Demand Management Plan
Page 8
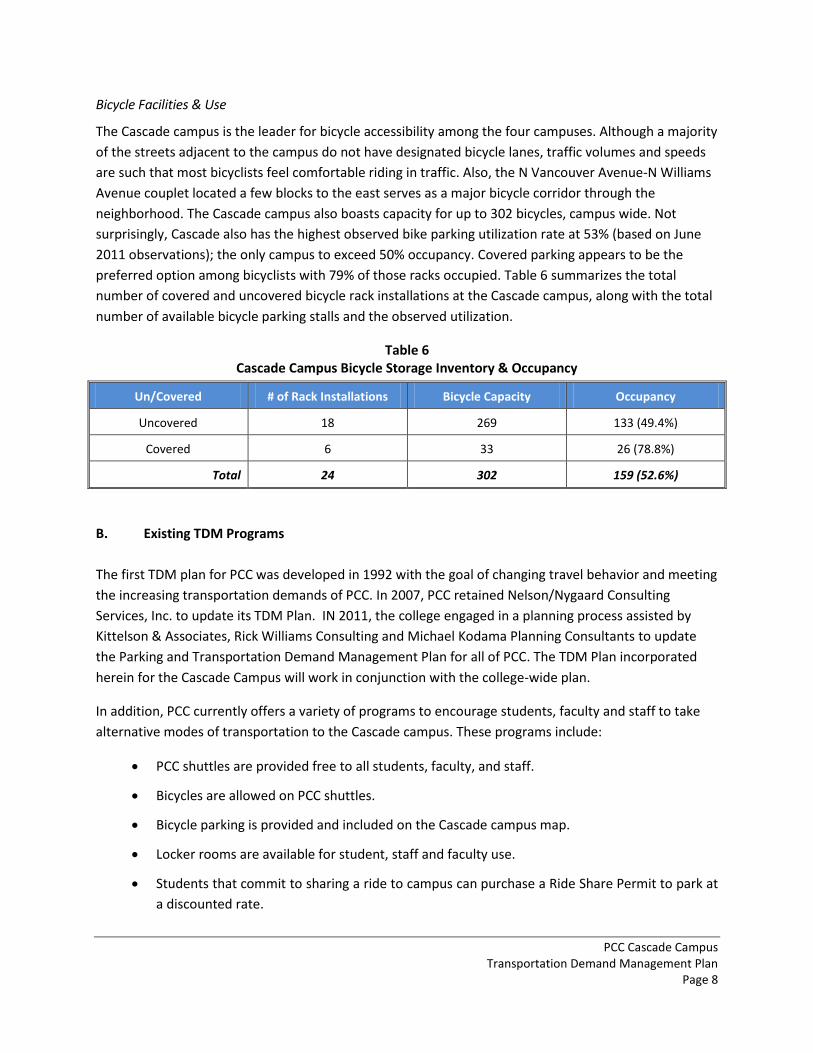
Bicycle Facilities & Use
The Cascade campus is the leader for bicycle accessibility among the four campuses. Although a majority
of the streets adjacent to the campus do not have designated bicycle lanes, traffic volumes and speeds
are such that most bicyclists feel comfortable riding in traffic. Also, the N Vancouver Avenue-N Williams
Avenue couplet located a few blocks to the east serves as a major bicycle corridor through the
neighborhood. The Cascade campus also boasts capacity for up to 302 bicycles, campus wide. Not
surprisingly, Cascade also has the highest observed bike parking utilization rate at 53% (based on June
2011 observations); the only campus to exceed 50% occupancy. Covered parking appears to be the
preferred option among bicyclists with 79% of those racks occupied. Table 6 summarizes the total
number of covered and uncovered bicycle rack installations at the Cascade campus, along with the total
number of available bicycle parking stalls and the observed utilization.
Table 6 Cascade Campus Bicycle Storage Inventory & Occupancy
Un/Covered # of Rack Installations Bicycle Capacity Occupancy
Uncovered 18 269 133 (49.4%)
Covered 6 33 26 (78.8%)
Total 24 302 159 (52.6%)
B. Existing TDM Programs
The first TDM plan for PCC was developed in 1992 with the goal of changing travel behavior and meeting
the increasing transportation demands of PCC. In 2007, PCC retained Nelson/Nygaard Consulting
Services, Inc. to update its TDM Plan. IN 2011, the college engaged in a planning process assisted by
Kittelson & Associates, Rick Williams Consulting and Michael Kodama Planning Consultants to update
the Parking and Transportation Demand Management Plan for all of PCC. The TDM Plan incorporated
herein for the Cascade Campus will work in conjunction with the college-wide plan.
In addition, PCC currently offers a variety of programs to encourage students, faculty and staff to take
alternative modes of transportation to the Cascade campus. These programs include:
PCC shuttles are provided free to all students, faculty, and staff.
Bicycles are allowed on PCC shuttles.
Bicycle parking is provided and included on the Cascade campus map.
Locker rooms are available for student, staff and faculty use.
Students that commit to sharing a ride to campus can purchase a Ride Share Permit to park at
a discounted rate.
PCC Cascade Campus Transportation Demand Management Plan
Page 9
Access to a rideshare matching program that includes a PCC network.
Faculty and staff may purchase a monthly Tri-Met bus pass on a pre-tax basis.
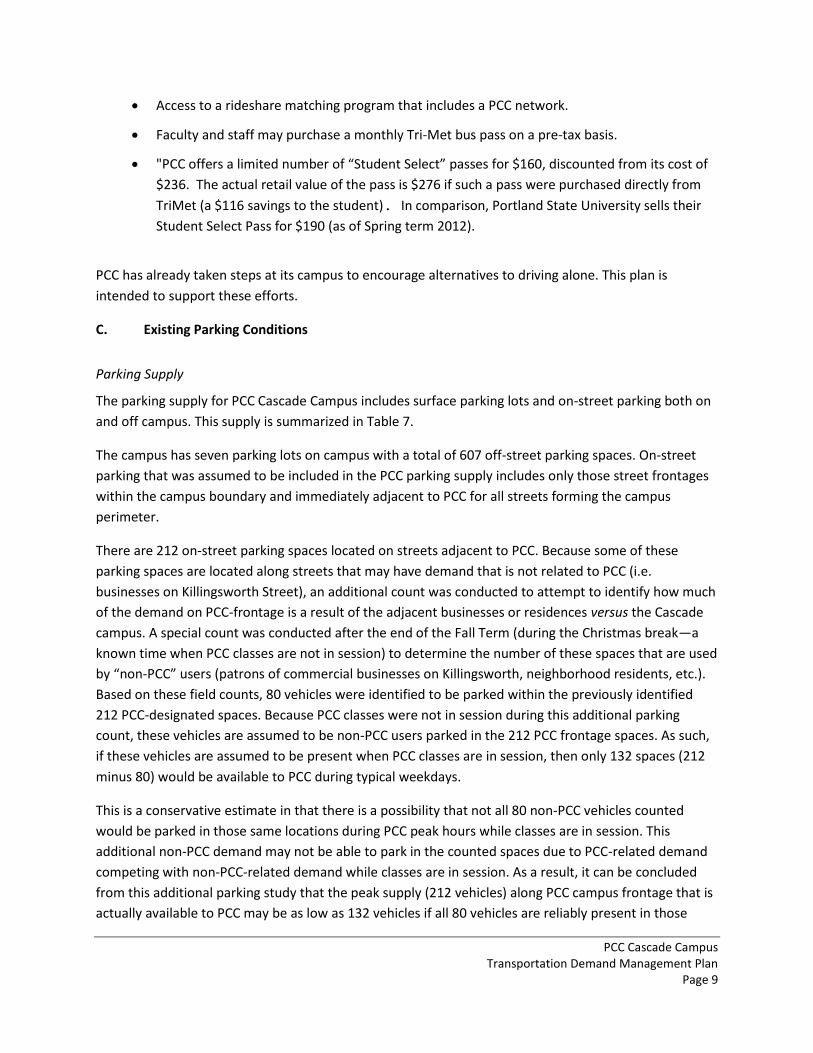
"PCC offers a limited number of “Student Select” passes for $160, discounted from its cost of
$236. The actual retail value of the pass is $276 if such a pass were purchased directly from
TriMet (a $116 savings to the student). In comparison, Portland State University sells their
Student Select Pass for $190 (as of Spring term 2012).
PCC has already taken steps at its campus to encourage alternatives to driving alone. This plan is
intended to support these efforts.
C. Existing Parking Conditions
Parking Supply
The parking supply for PCC Cascade Campus includes surface parking lots and on-street parking both on
and off campus. This supply is summarized in Table 7.
The campus has seven parking lots on campus with a total of 607 off-street parking spaces. On-street
parking that was assumed to be included in the PCC parking supply includes only those street frontages
within the campus boundary and immediately adjacent to PCC for all streets forming the campus
perimeter.
There are 212 on-street parking spaces located on streets adjacent to PCC. Because some of these
parking spaces are located along streets that may have demand that is not related to PCC (i.e.
businesses on Killingsworth Street), an additional count was conducted to attempt to identify how much
of the demand on PCC-frontage is a result of the adjacent businesses or residences versus the Cascade
campus. A special count was conducted after the end of the Fall Term (during the Christmas break—a
known time when PCC classes are not in session) to determine the number of these spaces that are used
by “non-PCC” users (patrons of commercial businesses on Killingsworth, neighborhood residents, etc.).
Based on these field counts, 80 vehicles were identified to be parked within the previously identified
212 PCC-designated spaces. Because PCC classes were not in session during this additional parking
count, these vehicles are assumed to be non-PCC users parked in the 212 PCC frontage spaces. As such,
if these vehicles are assumed to be present when PCC classes are in session, then only 132 spaces (212
minus 80) would be available to PCC during typical weekdays.
This is a conservative estimate in that there is a possibility that not all 80 non-PCC vehicles counted
would be parked in those same locations during PCC peak hours while classes are in session. This
additional non-PCC demand may not be able to park in the counted spaces due to PCC-related demand
competing with non-PCC-related demand while classes are in session. As a result, it can be concluded
from this additional parking study that the peak supply (212 vehicles) along PCC campus frontage that is
actually available to PCC may be as low as 132 vehicles if all 80 vehicles are reliably present in those
PCC Cascade Campus Transportation Demand Management Plan
Page 10
spaces year-round. However, a more realistic conclusion is that a range of PCC-available supply between
132 and 212 is present during the peak hours, and any on-street parking designation given to spaces
adjacent to the campus, particularly on Killingsworth Street near businesses, should be considered
carefully when implementing an enforcement policy.
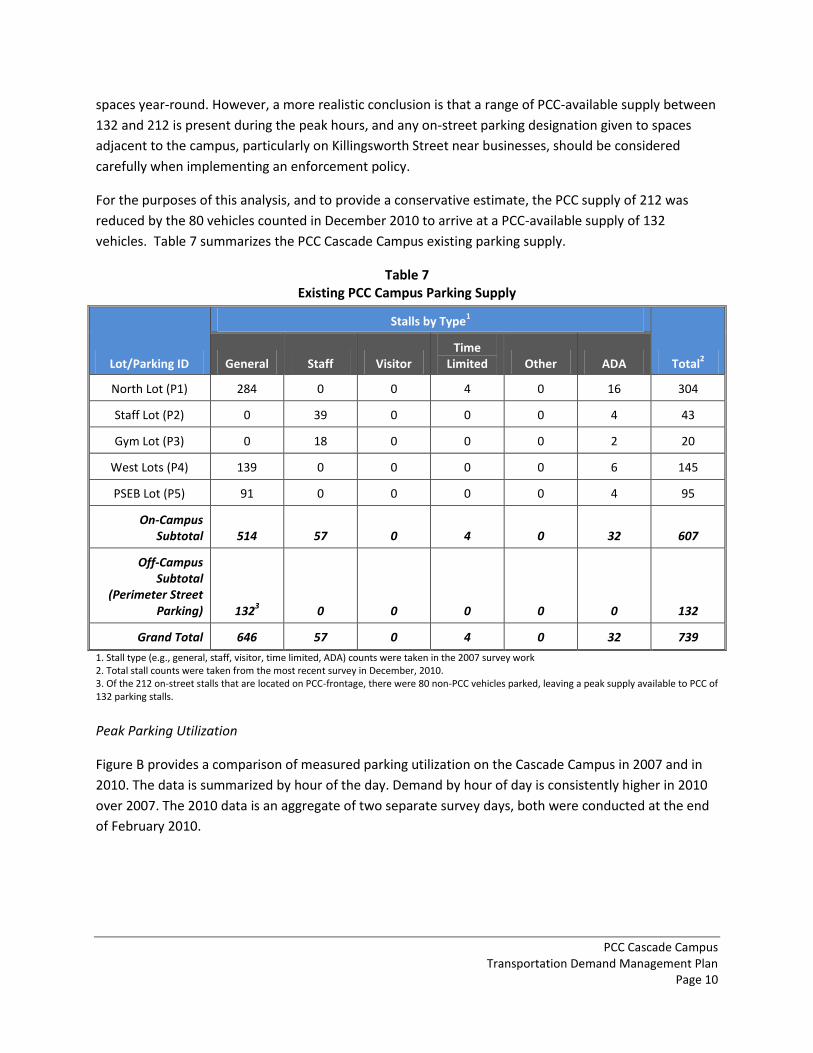
For the purposes of this analysis, and to provide a conservative estimate, the PCC supply of 212 was
reduced by the 80 vehicles counted in December 2010 to arrive at a PCC-available supply of 132
vehicles. Table 7 summarizes the PCC Cascade Campus existing parking supply.
Table 7 Existing PCC Campus Parking Supply
Lot/Parking ID
Stalls by Type1
Total2 General Staff Visitor
Time Limited Other ADA
North Lot (P1) 284 0 0 4 0 16 304
Staff Lot (P2) 0 39 0 0 0 4 43
Gym Lot (P3) 0 18 0 0 0 2 20
West Lots (P4) 139 0 0 0 0 6 145
PSEB Lot (P5) 91 0 0 0 0 4 95
On-Campus Subtotal 514 57 0 4 0 32 607
Off-Campus Subtotal
(Perimeter Street Parking) 132
3 0 0 0 0 0 132
Grand Total 646 57 0 4 0 32 739
1. Stall type (e.g., general, staff, visitor, time limited, ADA) counts were taken in the 2007 survey work 2. Total stall counts were taken from the most recent survey in December, 2010. 3. Of the 212 on-street stalls that are located on PCC-frontage, there were 80 non-PCC vehicles parked, leaving a peak supply available to PCC of 132 parking stalls.
Peak Parking Utilization
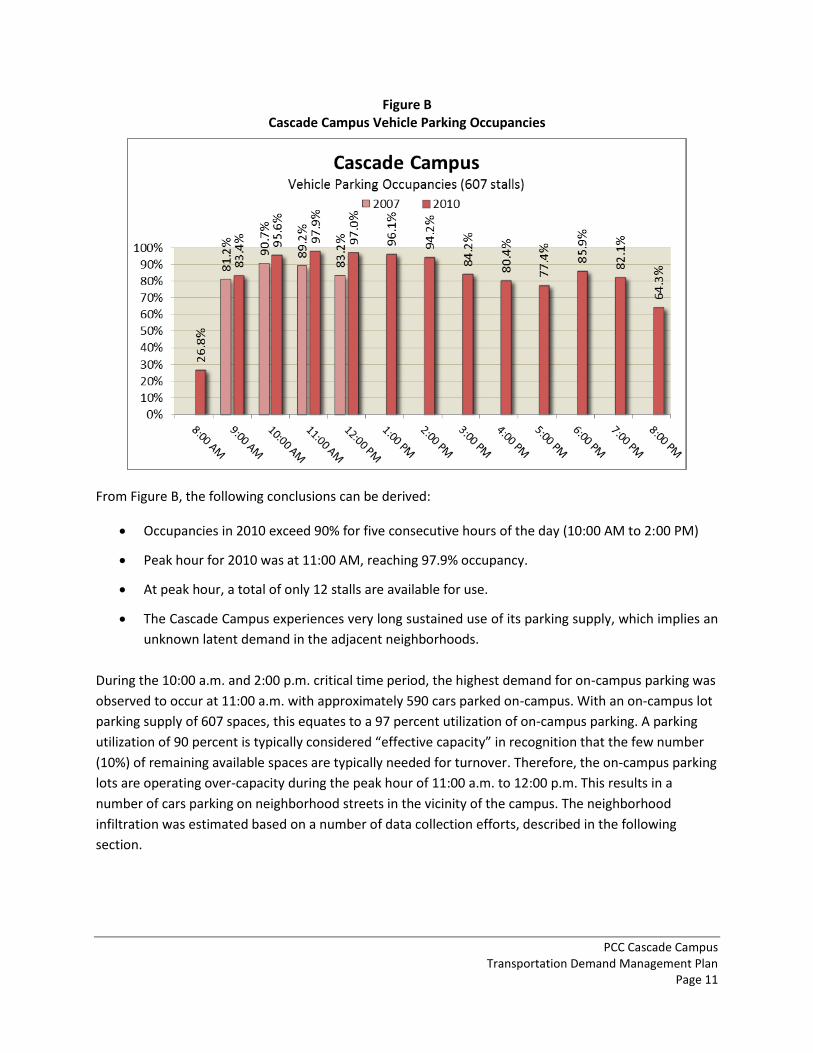
Figure B provides a comparison of measured parking utilization on the Cascade Campus in 2007 and in
2010. The data is summarized by hour of the day. Demand by hour of day is consistently higher in 2010
over 2007. The 2010 data is an aggregate of two separate survey days, both were conducted at the end
of February 2010.
PCC Cascade Campus Transportation Demand Management Plan
Page 11
Figure B Cascade Campus Vehicle Parking Occupancies
From Figure B, the following conclusions can be derived:
Occupancies in 2010 exceed 90% for five consecutive hours of the day (10:00 AM to 2:00 PM)
Peak hour for 2010 was at 11:00 AM, reaching 97.9% occupancy.
At peak hour, a total of only 12 stalls are available for use.
The Cascade Campus experiences very long sustained use of its parking supply, which implies an
unknown latent demand in the adjacent neighborhoods.
During the 10:00 a.m. and 2:00 p.m. critical time period, the highest demand for on-campus parking was
observed to occur at 11:00 a.m. with approximately 590 cars parked on-campus. With an on-campus lot
parking supply of 607 spaces, this equates to a 97 percent utilization of on-campus parking. A parking
utilization of 90 percent is typically considered “effective capacity” in recognition that the few number
(10%) of remaining available spaces are typically needed for turnover. Therefore, the on-campus parking
lots are operating over-capacity during the peak hour of 11:00 a.m. to 12:00 p.m. This results in a
number of cars parking on neighborhood streets in the vicinity of the campus. The neighborhood
infiltration was estimated based on a number of data collection efforts, described in the following
section.
PCC Cascade Campus Transportation Demand Management Plan
Page 12
Neighborhood Infiltration
In order to estimate the number of PCC related vehicles that park on neighborhood streets during the
peak parking demand, several data collection efforts were conducted within the study area, shown in
Table 8. Counts were taken of vehicles parked on the streets in the study area between the peak hours
of 10:00 a.m. and 2:00 p.m. To estimate the number of these cars that were PCC related, counts and
license plate surveys were conducted at 6:00 a.m. to identify resident vehicles. All vehicles parked in the
surrounding neighborhood at 10:00 a.m. that were not present at 6:00 a.m. were considered PCC-
affiliated. This methodology may overestimate PCC-related parking demand, in that it assumes all new
cars present on neighborhood streets after 10:00 a.m. are associated with PCC. These counts have been
repeated several times. Based on counts conducted on Tuesday, October 6, 2011 (the third Tuesday of
fall term), there are currently 347 PCC-related vehicles parked in the neighborhood. This data confirms
the counts that had been collected the previous Spring 2011 term (within ten vehicles). Therefore, the
neighborhood infiltration is assumed to be 347 vehicles.
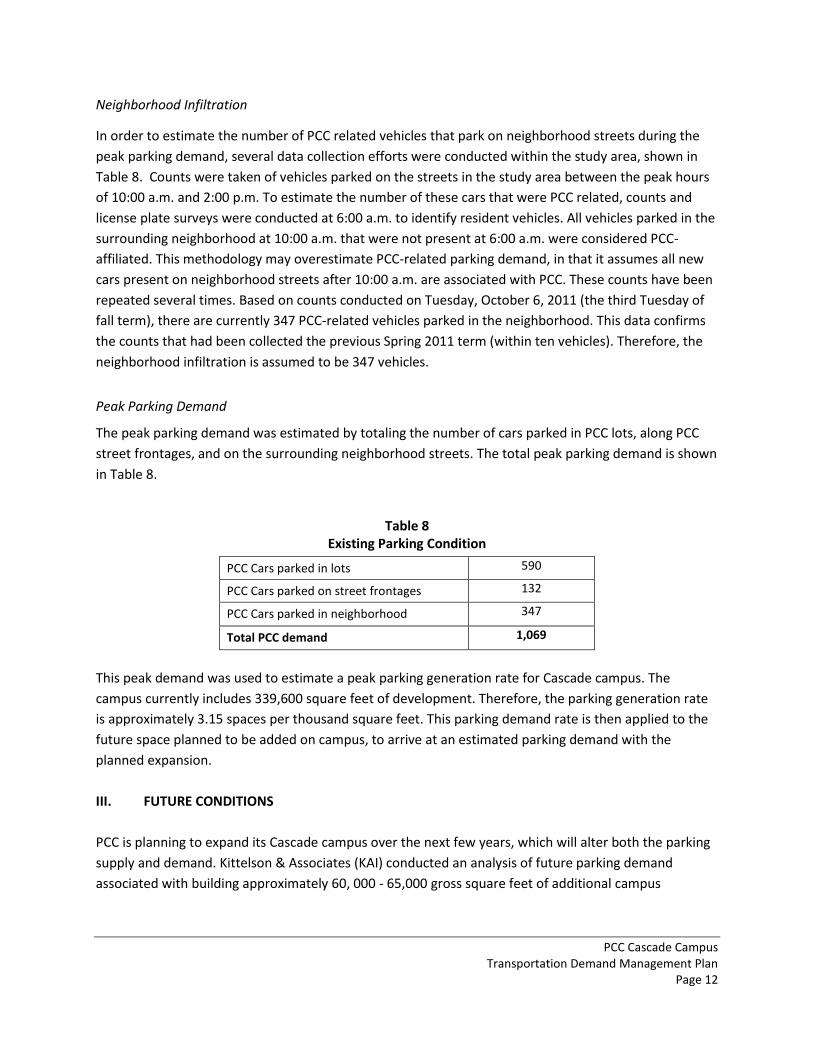
Peak Parking Demand
The peak parking demand was estimated by totaling the number of cars parked in PCC lots, along PCC
street frontages, and on the surrounding neighborhood streets. The total peak parking demand is shown
in Table 8.
Table 8
Existing Parking Condition
PCC Cars parked in lots 590
PCC Cars parked on street frontages 132
PCC Cars parked in neighborhood 347
Total PCC demand 1,069
This peak demand was used to estimate a peak parking generation rate for Cascade campus. The
campus currently includes 339,600 square feet of development. Therefore, the parking generation rate
is approximately 3.15 spaces per thousand square feet. This parking demand rate is then applied to the
future space planned to be added on campus, to arrive at an estimated parking demand with the
planned expansion.
III. FUTURE CONDITIONS
PCC is planning to expand its Cascade campus over the next few years, which will alter both the parking
supply and demand. Kittelson & Associates (KAI) conducted an analysis of future parking demand
associated with building approximately 60, 000 - 65,000 gross square feet of additional campus
PCC Cascade Campus Transportation Demand Management Plan
Page 13
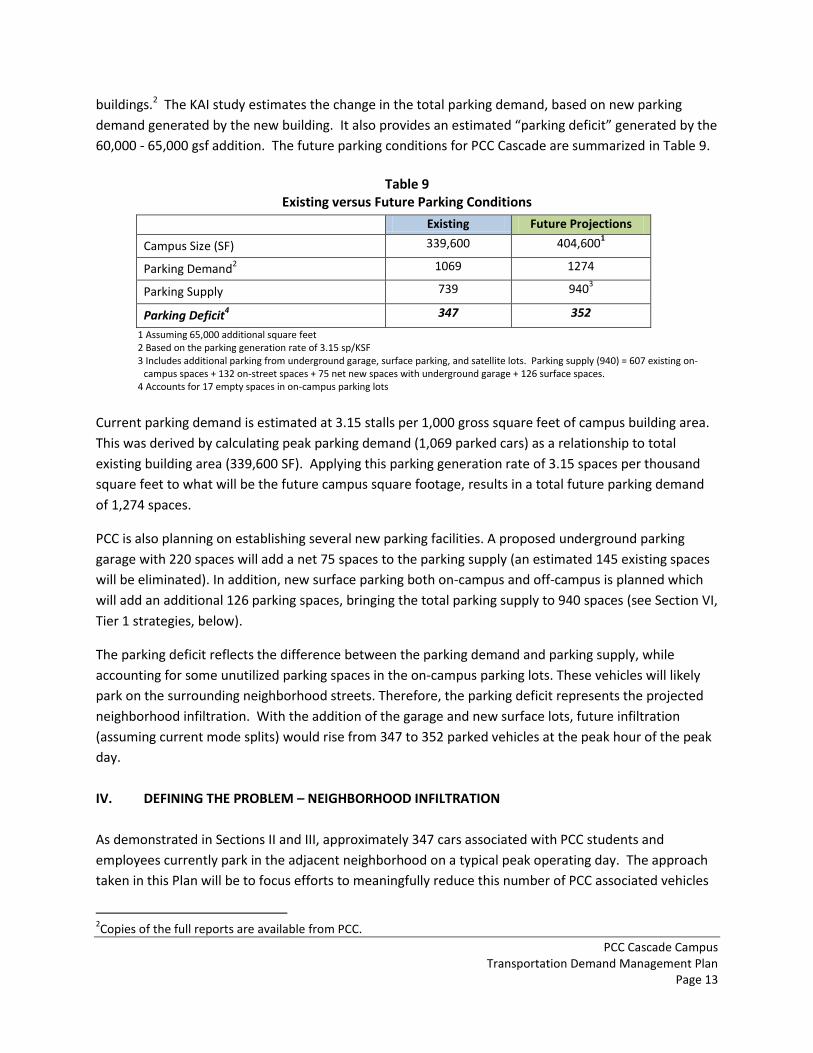
buildings.2 The KAI study estimates the change in the total parking demand, based on new parking
demand generated by the new building. It also provides an estimated “parking deficit” generated by the
60,000 - 65,000 gsf addition. The future parking conditions for PCC Cascade are summarized in Table 9.
Table 9
Existing versus Future Parking Conditions
Existing Future Projections
Campus Size (SF) 339,600 404,6001
Parking Demand2 1069 1274
Parking Supply 739 940
3
Parking Deficit4 347 352
1 Assuming 65,000 additional square feet 2 Based on the parking generation rate of 3.15 sp/KSF
3 Includes additional parking from underground garage, surface parking, and satellite lots. Parking supply (940) = 607 existing on- campus spaces + 132 on-street spaces + 75 net new spaces with underground garage + 126 surface spaces. 4 Accounts for 17 empty spaces in on-campus parking lots
Current parking demand is estimated at 3.15 stalls per 1,000 gross square feet of campus building area.
This was derived by calculating peak parking demand (1,069 parked cars) as a relationship to total
existing building area (339,600 SF). Applying this parking generation rate of 3.15 spaces per thousand
square feet to what will be the future campus square footage, results in a total future parking demand
of 1,274 spaces.
PCC is also planning on establishing several new parking facilities. A proposed underground parking
garage with 220 spaces will add a net 75 spaces to the parking supply (an estimated 145 existing spaces
will be eliminated). In addition, new surface parking both on-campus and off-campus is planned which
will add an additional 126 parking spaces, bringing the total parking supply to 940 spaces (see Section VI,
Tier 1 strategies, below).
The parking deficit reflects the difference between the parking demand and parking supply, while
accounting for some unutilized parking spaces in the on-campus parking lots. These vehicles will likely
park on the surrounding neighborhood streets. Therefore, the parking deficit represents the projected
neighborhood infiltration. With the addition of the garage and new surface lots, future infiltration
(assuming current mode splits) would rise from 347 to 352 parked vehicles at the peak hour of the peak
day.
IV. DEFINING THE PROBLEM – NEIGHBORHOOD INFILTRATION
As demonstrated in Sections II and III, approximately 347 cars associated with PCC students and
employees currently park in the adjacent neighborhood on a typical peak operating day. The approach
taken in this Plan will be to focus efforts to meaningfully reduce this number of PCC associated vehicles
2Copies of the full reports are available from PCC.
PCC Cascade Campus Transportation Demand Management Plan
Page 14
parking in the neighborhood over the next 10 years. In numerous meetings with neighborhood
representatives, the greatest concern expressed is that associated with growth at the campus and the
infiltration of PCC-related vehicles into neighborhood parking areas. As such, the Plan tracks PCC’s
performance through routine and quantitative assessment of progress toward reducing the impact of
PCC weekday vehicles in the neighborhood from a 2011 baseline (once a Term during the third week of
each term). Measureable progress toward reducing PCC-related vehicles parking in the neighborhood
will be the key measure of performance in this Plan.
Over the past several years, PCC has routinely surveyed vehicles within a “spillover” area to measure the
impact of neighborhood infiltration. Kittelson & Associates (KAI) has collected the data for PCC, with a
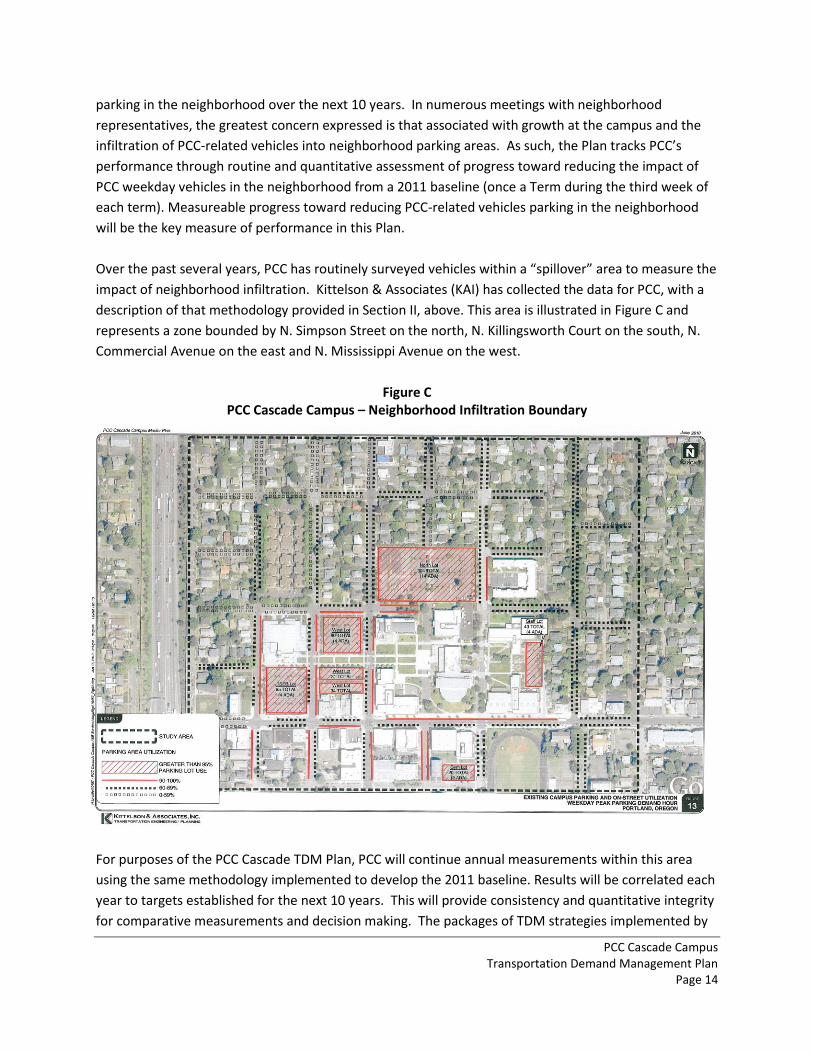
description of that methodology provided in Section II, above. This area is illustrated in Figure C and
represents a zone bounded by N. Simpson Street on the north, N. Killingsworth Court on the south, N.
Commercial Avenue on the east and N. Mississippi Avenue on the west.
Figure C PCC Cascade Campus – Neighborhood Infiltration Boundary
For purposes of the PCC Cascade TDM Plan, PCC will continue annual measurements within this area
using the same methodology implemented to develop the 2011 baseline. Results will be correlated each
year to targets established for the next 10 years. This will provide consistency and quantitative integrity
for comparative measurements and decision making. The packages of TDM strategies implemented by
PCC Cascade Campus Transportation Demand Management Plan
Page 15
PCC to contribute to reductions in student and employee vehicle trips will transpire over “tiers,” which
are generally 3 years in duration and become incrementally more aggressive based on success or lack of
success in meeting goal set for reducing vehicles parked in the neighborhood. The tiered strategy
approach is detailed in Section VI of this report and infiltration reduction targets are summarized in
Table 10.
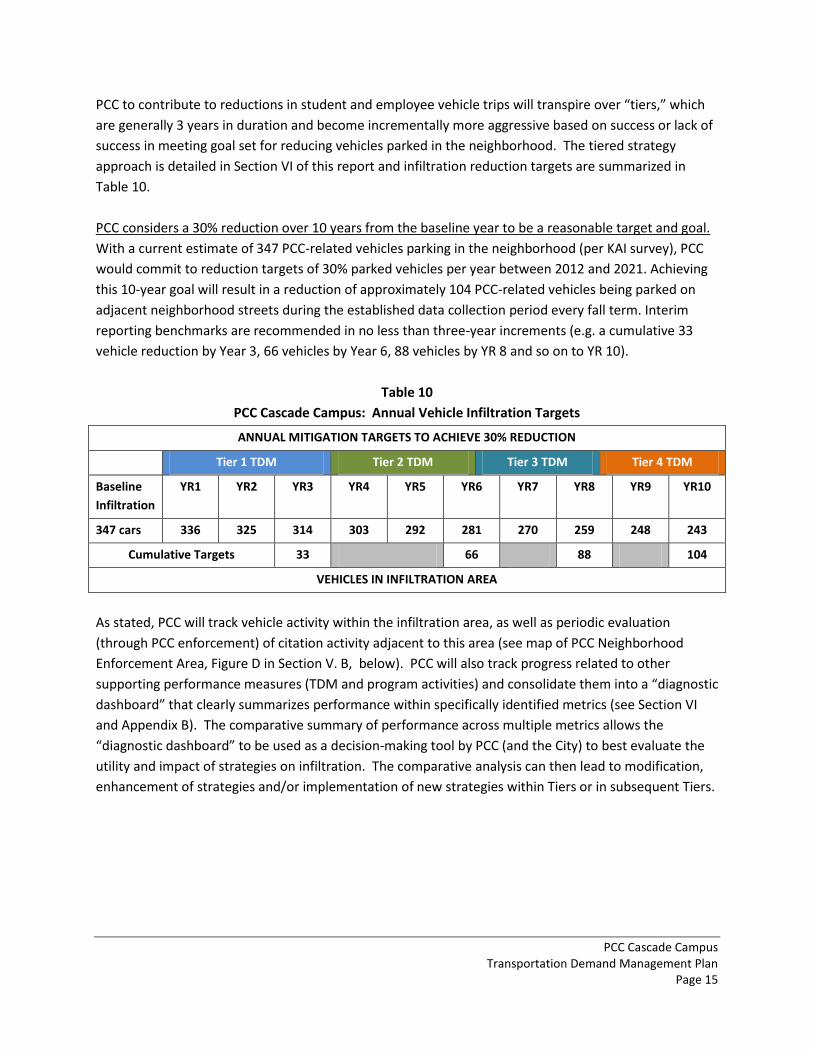
PCC considers a 30% reduction over 10 years from the baseline year to be a reasonable target and goal.
With a current estimate of 347 PCC-related vehicles parking in the neighborhood (per KAI survey), PCC
would commit to reduction targets of 30% parked vehicles per year between 2012 and 2021. Achieving
this 10-year goal will result in a reduction of approximately 104 PCC-related vehicles being parked on
adjacent neighborhood streets during the established data collection period every fall term. Interim
reporting benchmarks are recommended in no less than three-year increments (e.g. a cumulative 33
vehicle reduction by Year 3, 66 vehicles by Year 6, 88 vehicles by YR 8 and so on to YR 10).
Table 10
PCC Cascade Campus: Annual Vehicle Infiltration Targets
ANNUAL MITIGATION TARGETS TO ACHIEVE 30% REDUCTION
Tier 1 TDM Tier 2 TDM Tier 3 TDM Tier 4 TDM
Baseline
Infiltration
YR1 YR2 YR3 YR4 YR5 YR6 YR7 YR8 YR9 YR10
347 cars 336 325 314 303 292 281 270 259 248 243
Cumulative Targets 33 66 88 104
VEHICLES IN INFILTRATION AREA
As stated, PCC will track vehicle activity within the infiltration area, as well as periodic evaluation
(through PCC enforcement) of citation activity adjacent to this area (see map of PCC Neighborhood
Enforcement Area, Figure D in Section V. B, below). PCC will also track progress related to other
supporting performance measures (TDM and program activities) and consolidate them into a “diagnostic
dashboard” that clearly summarizes performance within specifically identified metrics (see Section VI
and Appendix B). The comparative summary of performance across multiple metrics allows the
“diagnostic dashboard” to be used as a decision-making tool by PCC (and the City) to best evaluate the
utility and impact of strategies on infiltration. The comparative analysis can then lead to modification,
enhancement of strategies and/or implementation of new strategies within Tiers or in subsequent Tiers.
PCC Cascade Campus Transportation Demand Management Plan
Page 16
V. EVALUATION CRITERIA
A. Guiding Themes & Principles3
Underpinning PCC’s TDM approach for the Cascade Campus is a unique set of Guiding Themes and
Principles developed by the all campus Transportation Demand Management Steering Committee
(TDMSC). These Themes and Principles serve a vital purpose in the overall process of determining what
specific strategy and program actions to consider and ultimately take, based on reported transportation
conditions at a PCC campus. In fact, they are so important that the TDMSC is recommending that the
College adopted them as policy to guiding parking and TDM decision-making. It is expected that any
individual involved in decision-making related to parking and TDM at PCC will review and agree to follow
these themes and principles. This is particularly true of any standing committee charged with overseeing
parking and TDM, as well as the technical staff charged with administering, managing, and delivering the
parking and TDM programs, which in this case would be for the PCC Cascade Campus.
Strategically, the principles encourage (1) the college to continue providing a variety of access methods
and (2) people to use them in a manner that inherently supports the overarching PCC goals that have
been established for the Cascade campus and the larger campus network. Access should continue to
include walking, biking, ridesharing, driving, and riding transit and shuttle, as well as technology (i.e.
telephone and internet). People seeking to access the Cascade campus should be cognizant of the
available access options and the full costs of using any particular method. The Guiding Principles shape
the ways in which PCC provides access and shares the costs with the people that use it.
The Guiding Principles reflect PCC’s commitment to changing the access environment; moving to
strategic outcomes for access that actually support more than just arrival, but the college itself as a
unique place and experience. The provision of access and the management of parking are keys to the
success of the PCC Cascade campus Plan.
The Guiding Principles outlined here begin with an Objective Statement and are organized under theme
categories, serving as a foundation for continuing discussions with PCC stakeholders. Ideally, these
Guiding Principles give direction to near- and long-term decisions for parking management and access
strategies for PCC at the Cascade campus.
Objective Statement
It is PCC’s goal to sustainably and cost effectively provide sufficient physical and technological access to
its academic system to meet the educational and vocational needs of the population it serves. To achieve
this, PCC will need to create and implement an efficient and adaptable access management plan that
balances cost and convenience between travel modes; strategically accommodates growth; and,
3 Much of this section on Themes and Principles is derived from the broader and more comprehensive PCC Parking
and Transportation Demand Management Plan Update (February 2012), prepared for PCC by Kittelson & Associates, Rick Williams Consulting and Michael Kodama Planning Consultants.
PCC Cascade Campus Transportation Demand Management Plan
Page 17
supports the PCC Mission, Vision, and Sustainability Initiative. The key objective is to transition each
campus to a place that values sustainability, provides expanded options for access, and ensures the long-
term educational and vocational success of its students, faculty, and staff.
Guiding Themes & Principles
Substantial input was provided through the TDM Steering Committee process, which also included on-
campus open houses, and meetings with PCC staff. Topics of discussion have included the PCC
mission/vision, goals and desires for the future, current access issues and ideas, and the challenges of
providing access. This input was summarized into seven (7) organizing themes and twenty (20) Guiding
Principles.
1. Multi-Modal and Technological Access
Assure that PCC can be accessed in a variety of ways to meet the needs of users (students,
employees [faculty and staff], and visitors).
Ensure that existing and any new parking enhances the campus experience and supports PCC’s
sustainability goals.
Reduce employee, student, and visitor reliance on automobile-based trips to PCC through a
transition into other modes (e.g., transit, bike, walk, rideshare, technology). PCC should
establish alternative mode targets for all employees and students, both system-wide and by
campus.
2. Equity & Affordability
Through the use of pricing, subsidies and other measures, ensure that affordable options for
access are available and manage access choices to avoid or at least minimize the need to
expand vehicle parking supplies.
Recognize that parking supply is a limited and expensive resource that will need to be
evaluated and managed in a manner that reflects that value.
Ensure that all users are equitably served through the provision of access.
3. Efficiency
Optimize the utility and benefit of existing access resources.
Leverage relationships with external partners.
4. Safe & Convenient
Provide access that is of the highest quality to create a safe and positive experience.
PCC Cascade Campus Transportation Demand Management Plan
Page 18
Make access user-friendly and easy to understand.
Provide safe, secure and well-lit access to allow a sense of security at all times.
5. Sustainable
Environmental: Ensure that access contributes to the broader vision that values sustainability,
reduces greenhouse gas (GHG) emissions, and contributes to the environmental well-being of
the College and the communities it serves.
Fiscal: Provide viable access options that are financially sustainable and cost-effective.
Health: Provide access programs and products that support individual and community health
and well-being.
6. Communication
Provide a clear and consistent message about the access system via the PCC public
information system.
Develop and/or improve educational and communications programs that communicate PCC’s
commitment to access options and support these principles, under a common brand.
7. Coordination
Provide clear, strategic and consensus-based direction to assure that growth is
accommodated in a manner that enhances the overall “PCC experience,” while expanding
options for access to all campuses.
Coordinate access strategies to complement surrounding land uses while meeting user
needs.
Coordinate with local, regional, and state agencies to construct, provide, and maintain
methods of access that are sustainable, available, safe, efficient, convenient, comfortable,
and affordable and meet user needs.
Implement measurements and reporting that assures Guiding Principles are supported and
achieved.
Managing the program that supports multiple uses is challenging and requires fully utilizing the entire
access system to provide convenient, safe, reliable options for students, visitors, and employees of the
Cascade campus. The Guiding Principles serve as a solid foundation for coordinating transportation
demand management decision-making. Their intent and purpose is to generate access strategies and
programs that will complement PCC’s efforts in attaining its long-term growth and development vision,
while balancing academic needs with community partnership.
PCC Cascade Campus Transportation Demand Management Plan
Page 19
B. Performance Measures – Supporting Forward Progress
Successful implementation of the PCC Transportation Demand Management Plan (TDMP) is best
supported by objective, quantifiable and measurable performance measures. Developing and
monitoring a clear set of performance standards will provide PCC and its stakeholders, understandable
information to assess success, program and resource need and a solid foundation for decision-making.
The Guiding Themes and Principles developed and recommended by the TDMSC provide clear direction
in this regard. Two Principles in particular call for targets and performance measures:
MULTI-MODAL AND TECHNOLOGICAL ACCESS
Reduce employee, student, and visitor reliance on automobile-based trips to PCC through a transition
into other modes (e.g., transit, bike, walk, rideshare, technology). PCC should establish alternative mode
targets for all employees and students, both system-wide and by campus.
COORDINATION
Implement measurements and reporting that assures Guiding Principles are supported and achieved.
This section outlines metrics that PCC will track on a routine basis to show effectiveness of this plan in
mitigating neighborhood infiltration. Progress within these metrics will also be tied to the Tiered
Strategy approach (Section VI) and infiltration targets summarized earlier in Table 10. Tracking
performance measures will provide PCC with a “diagnostic approach” to its TDM efforts, comparing and
contrasting a variety of variables that influence behavior and success. A diagnostic approach, keyed to
neighborhood infiltration, creates an iterative and strategic guide to program decision-making. As an
example, if progress on reducing vehicle infiltration was not made in a given year, and the diagnostic
dashboard showed low occupancies in one or more off-street parking facilities, then a decision to adjust
rates downward on those lots, and/or strategies that would assign parkers to lots and increase
enforcement would be reasonably made, based on objective data derived from the diagnostic
assessment.
Commitment to TDM
PCC’s is committed to TDM campus-wide and at the Cascade campus. PCC is also committed to work
strategically and meaningfully over time to reduce neighborhood infiltration, which will require new
programs, approaches and, importantly, partnership with the neighborhoods. In short, PCC has
demonstrated its commitment to TDM through its track record over time. Programs are already in place
to support alternative modes, distance education, outreach, communications and investment in
infrastructure. PCC also subscribes to the larger TDM Plan recently developed for all PCC campuses,
which can provide leverage and depth to the Cascade TDM Plan, recognizing the significant overlap of
trip activities for students and employees of a multi-campus college system. At bottom, PCC will
endeavor through the PCC Cascade Campus TDM plan to:
PCC Cascade Campus Transportation Demand Management Plan
Page 20
Ensure the long-term implementation and success of the TDM Plan for the Cascade campus.
Routinely assess success of the Plan and report to City and community.
Provide sufficient staffing to organize, manage and coordinate program implementation at PCC Cascade.
PCC will commit to an annual summary progress report that will be submitted to the City, other PCC
stakeholders, and/or neighbors. A schedule for reporting will be developed with PCC and the City in the
formation of this Plan. The diagnostic dashboard provides proposed timing for reporting and gathering
metrics.
A sample reporting summary and “dashboard” is included in Appendix B, attached.
A number of performance measures have been developed for this Plan, recognizing the need to create
measures that are understandable, easy and cost effective to track and monitor and provide a
meaningful measure of impact and success in achieving mode choice change. Measures to consider
include:
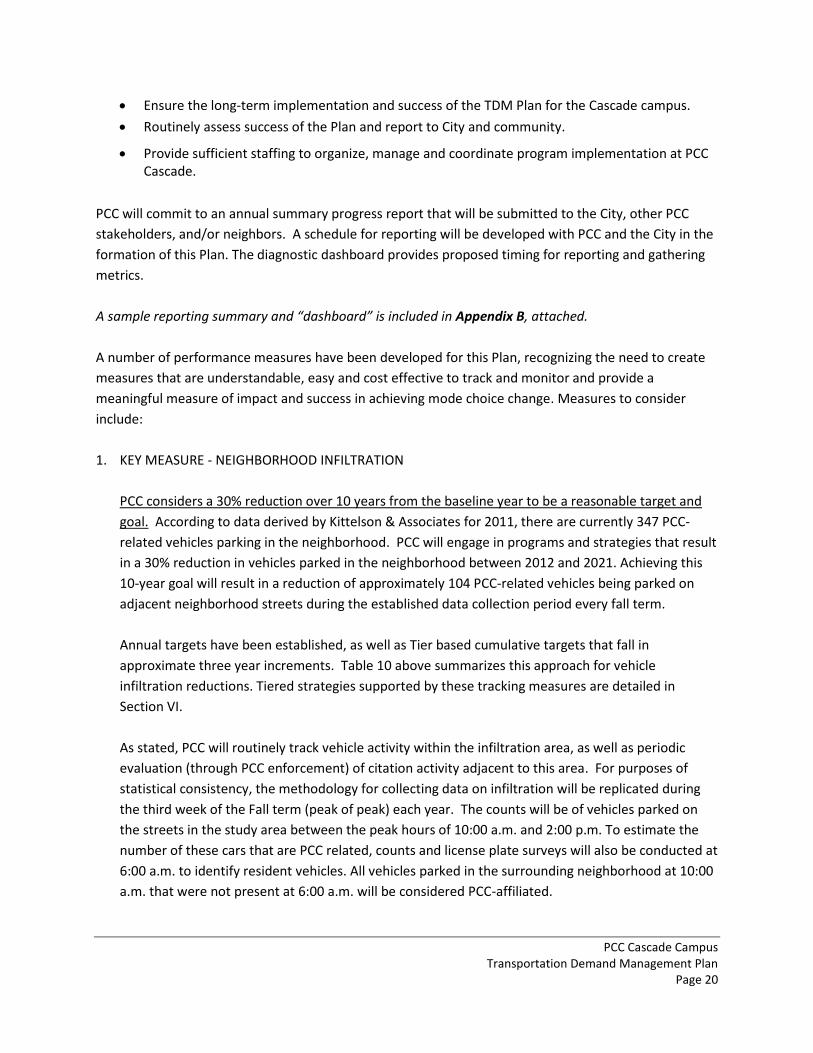
1. KEY MEASURE - NEIGHBORHOOD INFILTRATION
PCC considers a 30% reduction over 10 years from the baseline year to be a reasonable target and
goal. According to data derived by Kittelson & Associates for 2011, there are currently 347 PCC-
related vehicles parking in the neighborhood. PCC will engage in programs and strategies that result
in a 30% reduction in vehicles parked in the neighborhood between 2012 and 2021. Achieving this
10-year goal will result in a reduction of approximately 104 PCC-related vehicles being parked on
adjacent neighborhood streets during the established data collection period every fall term.
Annual targets have been established, as well as Tier based cumulative targets that fall in
approximate three year increments. Table 10 above summarizes this approach for vehicle
infiltration reductions. Tiered strategies supported by these tracking measures are detailed in
Section VI.
As stated, PCC will routinely track vehicle activity within the infiltration area, as well as periodic
evaluation (through PCC enforcement) of citation activity adjacent to this area. For purposes of
statistical consistency, the methodology for collecting data on infiltration will be replicated during
the third week of the Fall term (peak of peak) each year. The counts will be of vehicles parked on
the streets in the study area between the peak hours of 10:00 a.m. and 2:00 p.m. To estimate the
number of these cars that are PCC related, counts and license plate surveys will also be conducted at
6:00 a.m. to identify resident vehicles. All vehicles parked in the surrounding neighborhood at 10:00
a.m. that were not present at 6:00 a.m. will be considered PCC-affiliated.
PCC Cascade Campus Transportation Demand Management Plan
Page 21
2. SUPPORTING MEASURES
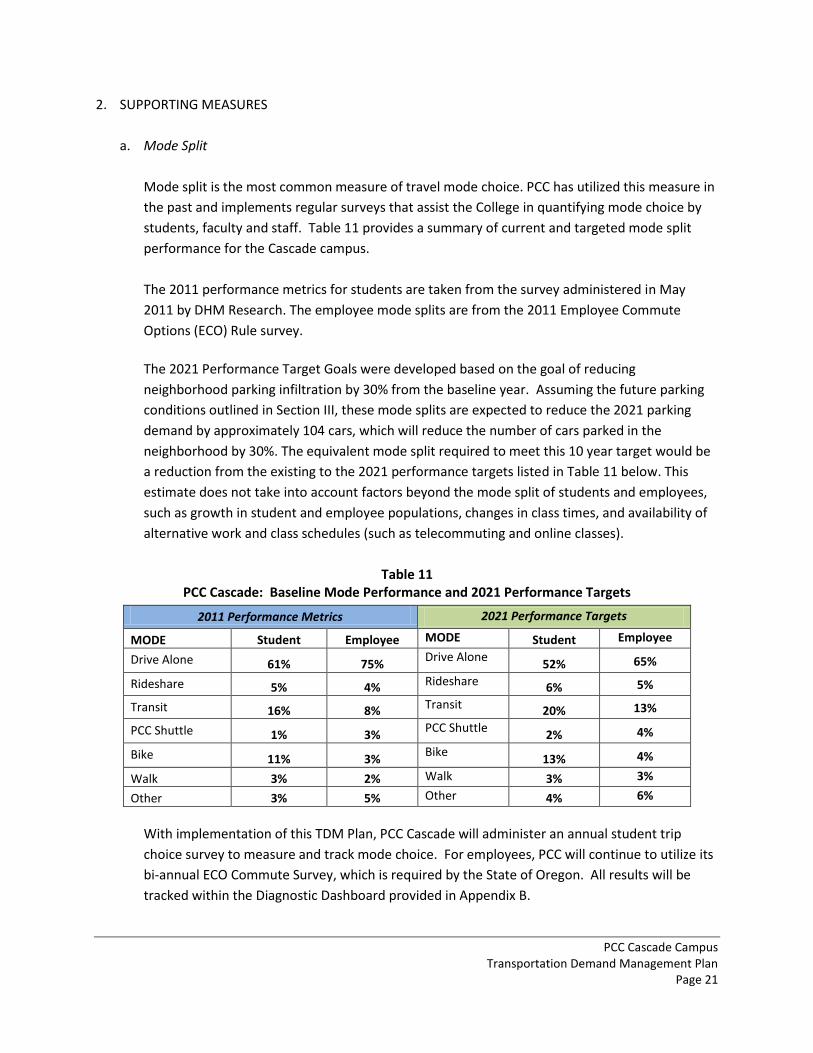
a. Mode Split
Mode split is the most common measure of travel mode choice. PCC has utilized this measure in
the past and implements regular surveys that assist the College in quantifying mode choice by
students, faculty and staff. Table 11 provides a summary of current and targeted mode split
performance for the Cascade campus.
The 2011 performance metrics for students are taken from the survey administered in May
2011 by DHM Research. The employee mode splits are from the 2011 Employee Commute
Options (ECO) Rule survey.
The 2021 Performance Target Goals were developed based on the goal of reducing
neighborhood parking infiltration by 30% from the baseline year. Assuming the future parking
conditions outlined in Section III, these mode splits are expected to reduce the 2021 parking
demand by approximately 104 cars, which will reduce the number of cars parked in the
neighborhood by 30%. The equivalent mode split required to meet this 10 year target would be
a reduction from the existing to the 2021 performance targets listed in Table 11 below. This
estimate does not take into account factors beyond the mode split of students and employees,
such as growth in student and employee populations, changes in class times, and availability of
alternative work and class schedules (such as telecommuting and online classes).
Table 11 PCC Cascade: Baseline Mode Performance and 2021 Performance Targets
2011 Performance Metrics 2021 Performance Targets
MODE Student Employee MODE Student Employee
Drive Alone 61% 75% Drive Alone
52% 65%
Rideshare 5% 4% Rideshare 6% 5%
Transit 16% 8% Transit 20% 13%
PCC Shuttle 1% 3% PCC Shuttle
2% 4%
Bike 11% 3% Bike
13% 4%
Walk 3% 2% Walk 3% 3%
Other 3% 5% Other 4% 6%
With implementation of this TDM Plan, PCC Cascade will administer an annual student trip
choice survey to measure and track mode choice. For employees, PCC will continue to utilize its
bi-annual ECO Commute Survey, which is required by the State of Oregon. All results will be
tracked within the Diagnostic Dashboard provided in Appendix B.
PCC Cascade Campus Transportation Demand Management Plan
Page 22
b. Shuttle Ridership
PCC already routinely tracks shuttle ridership throughout the academic year and sorts data for
both student and employee use of the shuttle. This will continue and be reported annually
through the diagnostic dashboards summary.
c. Parking occupancy
Routine parking occupancy counts will be conducted to accurately assess peak hour parking
demand for the campus supply. Data from these counts will be used through the diagnostic
process to (a) assess impacts of other TDM programs on peak hour use of parking supply, (b) to
identify surpluses and constraints within the supply and (c) to inform PCC decisions related to
rate and/or new supply needs.
d. Transit Pass sales
To the highest degree possible, transit pass sales will be tied to mode split trip reduction goals.
As such, the target number of Student Select Passes sold will be correlated to the mode split
target for transit use and/or improvement in non-auto modes (see Table3). PCC already
quantifies and tracks pass sales, and this will continue. This will be recorded in the diagnostic
dashboard.
Should an employee transit pass program be implemented in the future, PCC would similar track
sales against an initial baseline.
e. Transportation Pricing
PCC maintains an extensive menu of pricing options for students and employees related to
parking and transit. PCC will track changes in pricing over time against the baseline year for all
categories where access pricing is in place. Over time, as pricing on individual parking lots might
occur, those changes will also be duly recording. These pricing summaries with be included with
the diagnostic dashboard as part of annual reporting to the City.
f. Bicycle Parking Stalls
The number of bike parking stalls on each campus should correlate to the peak bike mode split
target. Tracking efforts to increase supply to meet the target will be a measure of successful
performance, as well as tracking the actual bicycle mode split. For instance, if there are 1,000
students and 500 employees on a campus at the peak hour (1,500 total) and the bike mode split
target is 10%, then the campus would be striving to place 150 bike parking stalls on campus.
PCC Cascade Campus Transportation Demand Management Plan
Page 23
g. Student and Employee Populations
The number of students and employees on campus will be tracked by quarter, with emphasis on
peak days and hours. This will be contrasted to 2011 baseline data as a means to track increases
or decreases in employee populations, which is instructive when analyzing data related to
neighborhood infiltration.
h. Events and Outreach
In implementing the Cascade Campus TDM Plan, numerous events and outreach efforts will be
coordinated through the District TDM Specialist. A log of transportation events and
individualized outreach efforts specific to the Cascade campus will be developed.
i. Enforcement
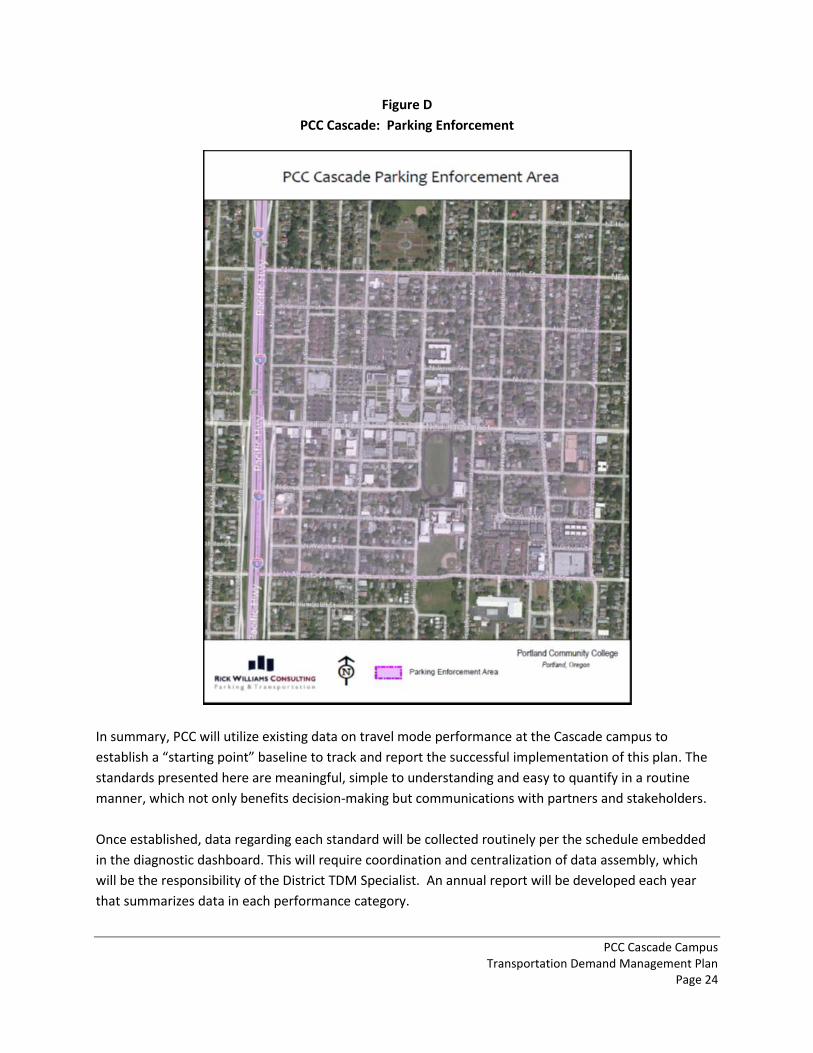
An important element for reducing neighborhood infiltration will be PCC’s continuing efforts at
enforcement, both within the infiltration area (Figure C, above) and within the larger PCC
Parking Enforcement Area (Figure D). PCC will record quarterly citation activity and summarize
that annually within the diagnostic dashboard. Specific metrics recorded will include:
+ Total of all citations in enforcement area
+ Citations issued within infiltration area
+ Citations issued outside of infiltration area
PCC Cascade Campus Transportation Demand Management Plan
Page 24
Figure D
PCC Cascade: Parking Enforcement
In summary, PCC will utilize existing data on travel mode performance at the Cascade campus to
establish a “starting point” baseline to track and report the successful implementation of this plan. The
standards presented here are meaningful, simple to understanding and easy to quantify in a routine
manner, which not only benefits decision-making but communications with partners and stakeholders.
Once established, data regarding each standard will be collected routinely per the schedule embedded
in the diagnostic dashboard. This will require coordination and centralization of data assembly, which
will be the responsibility of the District TDM Specialist. An annual report will be developed each year
that summarizes data in each performance category.
PCC Cascade Campus Transportation Demand Management Plan
Page 25
VI. DEMAND MANAGEMENT PROGRAM ACTIONS
The approach recommended for the PCC Cascade TDM Plan is to utilize a combination of (a) new on-
campus parking supply, (b) satellite (off-campus) parking facilities and (c) TDM strategies drawn from
the larger PCC TDM Plan to address the issue of neighborhood infiltration over time. The Plan commits
PCC to a “tiered” system of strategies that allow for strategic and systematic TDM and parking
management enhancements over time. Actions are timed and correlated to efforts to mitigate
neighborhood infiltration by 30% over 10 years. Neighborhood infiltration will be monitored on a
routine basis (see Section V) with supporting efforts similarly measured and reported against a
documented baseline standard that targets specific reductions in vehicles in the neighborhood in one
year increments and cumulatively every three years (see Table 2).
Tiers are used to organize the range of TDM strategies for two reasons. Some strategies cannot be
immediately implemented due to funding and/or contractual constraints. Others are more aggressive in
nature and/or build on the foundation of earlier strategies. Finally, the tiering of strategies should not
be construed as proscriptive. Flexibility is needed to try various combinations of strategies and to quickly
respond to changing circumstances.
Each Tier has a range of TDM strategies that can/will be implemented separately or in combination,
based on forward progress toward reducing neighborhood infiltration and achieving other College goals
and objectives. The majority of measures identified originate from the PCC district-wide TDM program,
with a more aggressive implementation schedule for the Cascade campus, in some cases.
Regular monitoring and internal/external reporting will compel PCC to continually evaluate the
effectiveness of implemented strategies and the necessity to move forward with additional and/or
refined program/strategy options based on infiltration and progress toward meeting other goals. Some
TDM measures, especially those currently untested at PCC may be initially implemented at Cascade, as
pilot programs to gauge their effectiveness before full implementation on a District-wide basis. The
tiered approach also allows flexibility for PCC to abandon programs that are not achieving reductions in
neighborhood infiltration, to be replaced by new or modified programs with the potential for greater
effectiveness.
The TDM program and reporting will be placed under the purview of a District TDM Specialist (charged
with promoting, facilitating, handling and reporting program performance under the direction of the
District Manager for PCC’s Parking and Transportation Services).
A summary table of all strategies proposed for consideration, by Tier, is included in Appendix A,
attached.
PCC Cascade Campus Transportation Demand Management Plan
Page 26
A. Tiered Strategy Actions
The Cascade Campus TDM Plan will be implemented over a 10 year horizon, flexibly responding to
changes in patterns of access and demand with a varied toolbox of strategies and programs. Actions will
be influenced by performance in reducing neighborhood parking infiltration, supported by activity in a
number of supporting “metrics” that will be routinely traced and reported.
PCC proposes four tiers, which are generally correlated to three year increments. Each tier provides for
actions within a total of seven TDM Element areas. Some tiers include all elements, others a
combination. TDM Elements in this Plan include:
General TDM Support. Activities that support overall implementation of the TDM Plan, including
coordination, communications, marketing and program assistance.
Parking Access. At present, the most common form of access to the Cascade campus is by auto.
Auto access will continue to be an important means of access now and into the future.
However, measures that can be employed to “right size” the number of automobiles
(particularly single occupant vehicles) arriving on campus, can result in lower development costs
for PCC, more options for students and employees and measurable benefits for neighborhood
infiltration.
Transit Access. Increasing the number of students and employees utilizing transit as a primary
mode of access to and from the Cascade campus (and all PCC campuses) is a central element of
success in the TDM Plan and, if successful, can have significant beneficial impacts on issues
related to neighborhood infiltration.
PCC Shuttle Access. PCC’s Parking and Transportation Services operates an extensive shuttle
operation that provides direct and frequent links between its campuses (including Cascade).
The shuttle has experienced significant growth in both infrastructure (number of shuttles
operating) and use by students and employees.
Bike/Walk Access. Programs, strategies and incentives to encourage greater bike and pedestrian
access to the Cascade campus will create an effective and low cost means to reduce auto trips.
Bike/walk not only facilitates mode change, but contributes to health and wellness initiatives as
well.
External Partners. A number of strategies contained in the Cascade Campus TDM Plan will
require coordination with “external partners,” which includes entities that control public rights-
of-way (City of Portland), public transportation (TriMet), remote parking locations (private
sector, TriMet) and/or are impacted by programs PCC delivers (adjacent neighborhoods).
Communication, coordination and (most importantly) partnering with external partners will
strengthen this Plan.
Monitoring and Reporting. Good decision-making comes with accurate, quantifiable and
consistently produced information. This Plan has developed a number of performance metrics
that will be routinely collected using consistently applied methodologies.
PCC Cascade Campus Transportation Demand Management Plan
Page 27
Neighborhood Engagement. As neighborhood infiltration is the key performance metric
underlying this Plan, there will be a need to coordinate communications of progress with the
neighborhoods
PCC Cascade Campus Transportation Demand Management Plan
Page 28
TIER 1 (0 – 3 YEARS)
GENERAL TDM SUPPORT
Establish 1.0 FTE District TDM Specialist, responsible for overall program effectiveness,
including implementation, communication and monitoring. This position will report directly
to the District Manager, Parking and Transportation Services and approximately 25 percent of
the TDM Specialist’s work will be devoted to coordination and implementation of the Cascade
campus TDM Plan.
Expand the provision and promotion of on-campus transportation services that include (at
minimum):
+ An active marketing campaign to raise awareness of the campus TDM program,
methods of reducing vehicle/parking use, and ways to access and interact with the TDM
Specialist.
- Examples include use of existing websites, inclusion of TDM information with
registration and orientation packets, in-person and on-line training on the use of TDM
for campus access, frequent promotions during registration and the early weeks of each
quarter, regular postings and placements of such printed materials as
bulletins/flyers/posters placed in a great many buildings and appropriate sites on
campus, targeted outreach to students and employees with significant vehicle/parking
impacts (e.g. drive alone every day, park for 4 or more hours, park during the peak
period of parking demand, etc.).
+ Mentoring programs for all Cascade students and employees.
- This effort could include developing the mentor program and supporting training
program, soliciting and training volunteers to serve as mentors, promoting participation
in the mentoring program, providing mentor/protégé matching services, and monitoring
and reporting to strengthen program, determine productivity and expand use. It could
also include development and implementation of a “new employee/student” TDM
orientation program pilot. A pilot would allow for the program to be monitored for
performance and possible expansion, if successful, to other campuses.
+ Trip planning services.
- Examples include web-based and in-person services for walking, biking, riding transit,
carsharing/ridesharing (matching), and accessing via on-line services and estimating
PCC Cascade Campus Transportation Demand Management Plan
Page 29
total cost by method of access and total time to travel. This could also include pursuing
the opportunity to integrate trip planning activities within the admissions process.
Increase the prominence, accessibility and ease of use of campus transportation services,
programs and options on the PCC webpage.
+ The broader PCC Parking and Transportation Demand Management Update establishes
a “near-term” action that calls for PCC to unify all access options under a common
umbrella or brand. This would create a recognizable link for users of the system and
reinforce the ease and convenience of access uniformly, at each campus (like Cascade)
and system wide. The District TDM Specialist will play an important role in working with
the district Marketing Department in establishing this “brand” and transferring that, at a
high level, to students and employees at the Cascade campus.
PARKING ACCESS
Build up to 220 new underground parking stalls (a net of 75 new stalls). The garage will be
designed and equipped in a manner that facilitates a “pay-as-you-go” pricing option in the
garage. PCC will utilize the pay-as-you-go option as appropriate and in combination with
other pricing tools and broader TDM strategies to assure (a) effective use of the garage and
(b) attainment of occupancy and mode targets.
Initiate routine program of monitoring lot occupancy to inform parking rate decision-making
(see Section V. b. 3).
Develop 4 surface parking facilities totaling 126 net new parking stalls (see Table 4).
On-campus
PCC/CC plans to build two new parking lots on the campus’ far western block, bound by N.
Killingsworth Street, N. Michigan Avenue, N. Church Street and N. Missouri Avenue. This
includes the new 30-space lot (P-7) an L-shared site that runs up the west side of N. Michigan
Avenue rounding the corner to N. Church Street and a new 21-space lot (P-8) in the
southwestern corner of the block at N. Killingsworth Street and N. Missouri Avenue; all this
property currently is in PCC/CC ownership. The lots lie to the east and west of the Telephone
Exchange Building, an apartment complex owned by PCC/CC. Because the lots are new
construction, they will meet all requirements for perimeter/internal landscaping and storm
water treatment. Detailed plans meeting these requirements will be presented for approval in
the subsequent Type II Design Review application for the new Phase 2 underground parking
structure and buildings.
PCC Cascade Campus Transportation Demand Management Plan
Page 30
Off-campus
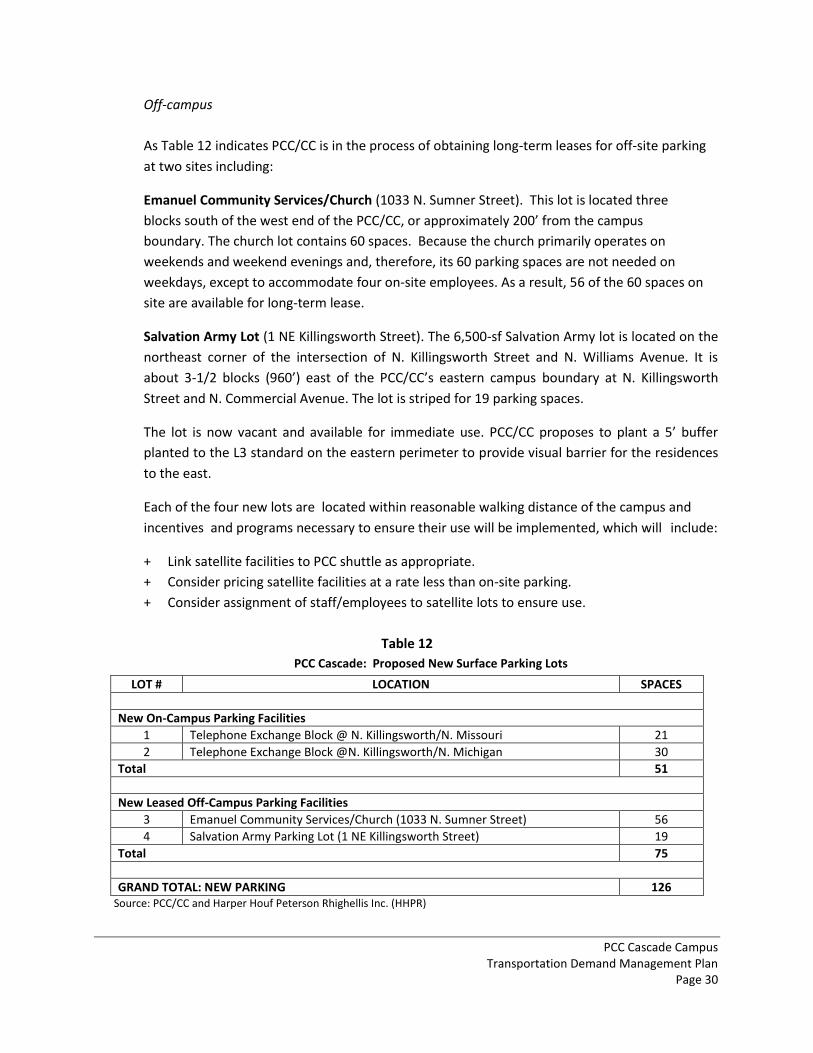
As Table 12 indicates PCC/CC is in the process of obtaining long-term leases for off-site parking
at two sites including:
Emanuel Community Services/Church (1033 N. Sumner Street). This lot is located three
blocks south of the west end of the PCC/CC, or approximately 200’ from the campus
boundary. The church lot contains 60 spaces. Because the church primarily operates on
weekends and weekend evenings and, therefore, its 60 parking spaces are not needed on
weekdays, except to accommodate four on-site employees. As a result, 56 of the 60 spaces on
site are available for long-term lease.
Salvation Army Lot (1 NE Killingsworth Street). The 6,500-sf Salvation Army lot is located on the
northeast corner of the intersection of N. Killingsworth Street and N. Williams Avenue. It is
about 3-1/2 blocks (960’) east of the PCC/CC’s eastern campus boundary at N. Killingsworth
Street and N. Commercial Avenue. The lot is striped for 19 parking spaces.
The lot is now vacant and available for immediate use. PCC/CC proposes to plant a 5’ buffer
planted to the L3 standard on the eastern perimeter to provide visual barrier for the residences
to the east.
Each of the four new lots are located within reasonable walking distance of the campus and
incentives and programs necessary to ensure their use will be implemented, which will include:
+ Link satellite facilities to PCC shuttle as appropriate.
+ Consider pricing satellite facilities at a rate less than on-site parking.
+ Consider assignment of staff/employees to satellite lots to ensure use.
Table 12
PCC Cascade: Proposed New Surface Parking Lots
LOT # LOCATION SPACES
New On-Campus Parking Facilities
1 Telephone Exchange Block @ N. Killingsworth/N. Missouri 21
2 Telephone Exchange Block @N. Killingsworth/N. Michigan 30
Total 51
New Leased Off-Campus Parking Facilities
3 Emanuel Community Services/Church (1033 N. Sumner Street) 56
4 Salvation Army Parking Lot (1 NE Killingsworth Street) 19
Total 75
GRAND TOTAL: NEW PARKING 126 Source: PCC/CC and Harper Houf Peterson Rhighellis Inc. (HHPR)
PCC Cascade Campus Transportation Demand Management Plan
Page 31
Increase the penalty on repeat student and employee parking offenders.
+ The current fine for parking in the neighborhood is $25 which escalates to $50 if not paid
with 30 days. Parking and Transportation Services has recommended that the fine remain
$25 for the first violation and then increase to $50 for the second violation and $75 for the
third violation in any school year.
Increase the rate of collection on parking citations.
Improve communications regarding parking expectations of students and employees, especially
as regards parking infiltration.
+ Work with PCC’s Print Center to develop a new poster that will be distributed at
Cascade to clearly show neighborhood parking boundaries.
+ Develop and place five large A-frame signs strategically around campus reinforcing
parking infiltration message.
+ Add a third neighborhood boundary parking enforcement officer position.
TRANSIT ACCESS
Establish Student Select Pass sales goal directly tied to adopted transit performance targets (See
Section VI. D, Mode Behavior) and assure pricing that increases the attractiveness of the pass to
students and is competitive with campus parking rates.
+ Efforts include targeting transit pass sales to students/employees with higher than
average parking impacts, monitoring pass sales for volume and type of user (e.g.
student/employee, full-time/part-time, frequency of campus access, predominant mode
of access prior to pass purchase, etc.), and objectively correlating pass sales with transit
mode split by user type (if practical).
Strategically locate signs at various campus gathering points and promote the availability of a
Tri-Met Bus connection with Interstate Max (every 6 min <rush hour> to 15 min), the bus
number (72).
PCC SHUTTLE ACCESS
Coordinate the provision of satellite parking facilities with existing or expanded PCC Shuttle
connections and/or along TriMet routes.
PCC Cascade Campus Transportation Demand Management Plan
Page 32
BIKE/WALK
Equip campus with quality bike parking racks and facilities at a rate equal to the 2021bicycle
mode split goal (See Section VI. D, Mode Behavior).
+ The PCC Cascade campus bike system should provide access at a level equal to target goals
for biking. The bike parking system will be of a uniform design and quality to create a
consistent and recognizable presentation of type, location (where possible), means of
access, signage and communication.
Provide access to shower and locker facilities to support bicycling and walking as an access
option for students and employees during all campus operating hours.
+ Research indicates that convenient access to shower and locker facilities significantly
increase the attractiveness of biking and walking as a trip choice. Over the course of Tier 1,
PCC will explore a program that communicates availability, protocols and hours of use.
Support ASPCC bike rental program; including a partnership to establish facilities for self-repair
of bicycles.
Support city in attracting commercial bike rental firms that allow pick-up and drop-off at a
variety of locations (e.g., Bike Share), with a potential location on the PCC Cascade campus,
coordinated with the City’s Bike Share project launching in Spring 2013.
Sign and market a direct connection to MAX Yellow Line at Killingsworth Station as a linked
trip commute option for bicyclists.
EXTERNAL PARTNERS
Partner with TriMet to improve existing bus service/frequencies to PCC Cascade campus.
+ Examples include minimizing transfer delay with MAX Yellow Line, sharing
student/employee geocoding to target transit coverage improvements, and identifying
potentially productive ridership areas that have poor frequency and/or hours of service to
meet student/employee needs.
PCC Cascade Campus Transportation Demand Management Plan
Page 33
MONITORING AND REPORTING
Initiate performance measurements as outlined in Section V. Reporting will be consolidated
into an annual report for submittal to the City of Portland using the “diagnostic dashboard” as
a basis for structuring the report (see Appendix B).
NEIGHBORHOOD ENGAGEMENT
PCC will coordinate an annual meeting with the neighborhoods to review progress toward
meeting neighborhood infiltration goals, to discuss options and strategies, liaison
partnerships and inform the on-going TDM Plan implementation. The meeting will be
scheduled within 60 days of submittal of the annual performance report to the City of
Portland.
PCC Cascade Campus Transportation Demand Management Plan
Page 34
TIER 2 (4 – 6 YEARS)
Tier 2 assumes PCC would move to continue Tier 1 efforts determined to be successful with additional
enhancements of programs with Tier 2 strategies.
GENERAL TDM SUPPORT
Expand on-line and hybrid (combination of on-line and on-campus) options for classes,
registration, and other means of accessing PCC Cascade without traveling or traveling less.
+ With growth (student and employee), access systems will become more constrained and
costly. PCC’s current on-line programs and hybrid classes are very effective and may
have potential for greater use and are viewed here as a Tier 2 option. A critical key for
PCC, in potential efforts to expand on-line learning, will be protecting excellence in
curriculum.
PARKING ACCESS
Implement a performance-based pricing strategy through the following steps:
+ Performance-based parking pricing informs parking pricing decisions based on the
correlation of parking rate to actual utilization of parking capacity. As demand for parking
access exceeds established capacity triggers (see Section V.B.3), parking rates would be
adjusted accordingly. Similarly, as demand falls significantly below capacity triggers, rates
would be adjusted accordingly. Commitment to a performance-based parking pricing
strategy, coupled with other TDM elements of this Plan, will provide PCC a decision- making
framework that is both strategic and flexible.
Elements of performance based pricing will be evaluated in Tier 2 using a range of metrics
provided within the diagnostic dashboard. Over time (in this and subsequent Tiers),
performance-based pricing strategies may include (but not be limited to):
- Adjusting the fee(s) for parking based on the results of data derived from the diagnostic
dashboard and uniformly applied to all Cascade lots.
- Adjusting the fee(s) for parking based on the performance of individual parking lots. This
may, for instance, create a situation where parking rates would vary between lots, as
opposed to the uniform pricing that characterizes the current parking rate structure.
- Consideration of elimination of term parking passes and institution of “pay-as-you-go”
parking pricing in specific facilities (e.g., new garages) based on the unique access
constraints of any one facility.
PCC Cascade Campus Transportation Demand Management Plan
Page 35
The variety of performance based pricing options is very large. Rates could vary by location, by
time of year/term, or by day. The right strategy for PCC Cascade will also need to be coordinated
with the entire package of TDM options and programs available to manage capacity in the
system and assist in meeting infiltration targets established.
Place lot-based counter systems and other data collection technology in parking areas to more
effectively track parking utilization.
+ Current lot technologies in place on PCC parking facilities do not include lot-based counter
systems or technologies that would provide “real time” or routine capacity monitoring. A
counter system would provide frequent data on lot usage by time of day, day of week and
time of year. This type of information would greatly facilitate decision-making, particularly
in the areas of rate and lot management. PCC will include installation of such systems in its
new garage and as appropriate in its near and long- term capital facilities planning for
existing facilities (i.e., surface lots). These types of technologies can streamline the current
system that requires manual counting and enhance the data base and monitoring actions
called for in the Plan.
TRANSIT ACCESS
Price Student Select Pass at a rate that is competitive with the term fee for student parking.
+ The current Student Select Pass was priced to the student at $170 per term in 2011. Parking
and Transportation Services reduced this to $160 beginning Winter term 2012. Even with
that reduction in cost to students, the pass could still be considered uncompetitive with
parking, which is priced at $50 per term. Information derived from the 2011 DHM PCC
Transportation Preferences Survey conjoint study of PCC students (and employees) indicates
that there is a very direct relationship between the competitive rate of transit pricing (and
transit use) and the cost of parking. In Tier 2 the strategy recommends establishing a clear
link between transit and parking pricing at PCC Cascade.
The District Transportation Specialist will work with PTS and other affected entities within
PCC to determine the most reasonable critical path to the most competitive rate for the
Student Select Pass and supporting funding streams to support its pricing and increased
sales.
PCC SHUTTLE
Improve frequency on shuttle routes that are most conducive to ridership growth associated
with increased parking pricing.
PCC Cascade Campus Transportation Demand Management Plan
Page 36
BIKE/WALK
Develop and fund an on-going program of bike/walk incentives for the Cascade campus.
+ Incentive programs range from bike educations events, raffles, challenges to equipment
purchase programs. The range of incentives will be coordinated by the District
Transportation Specialist and with Parking and Transportation Services. There may be
restrictions on the type of incentives the College can provide, which should be understood
and reviewed. Nonetheless, an on-going program designed to actively encourage, incent
and support bike and walking as a trip choice will be developed in Tier 2.
EXTERNAL PARTNERS
Negotiate with TriMet and provide UPASS transit program for all campus employees.
+ Currently, the only employee transit incentive offered by PCC is the opportunity to purchase
a TriMet transit pass on a pre-tax basis, but with no subsidy. According to the District-wide
transportation survey conducted during the spring of 2011, the faculty and staff have a
transit mode split of less than 10%, indicating a potential opportunity to reduce auto trips
within this combined user group. For instance, PCC, as a major employer, could negotiate a
UPASS annual transit program pass for its employees. It is expected that the rate negotiated
with TriMet will be calibrated to current transit usage within PCC’s regional system (i.e. if
PCC’s employee transit mode split is at 10%, then PCC would pay only 10% of the face value
of an annual UPASS transit pass for every employee pass that is purchased from TriMet), as
a means to reduce the overall cost of a transit pass per employee.
Support City of Portland’s recommendation for establishing on-street time zones and/or
metering (as appropriate with other strategies) on all streets that abut the Cascade campus (at
minimum).
+ The City of Portland has indicated to PCC that it would like to see a more strategic
distribution of parking time zones and, potentially, parking metering implemented within
the on-street system (most notably the area directly adjacent to the Cascade campus). PCC
is not adverse to this type of strategy, but has no jurisdiction over the public on-street
parking system. However, discussions and planning focuses on the most effective way to
manage the on-street system to the benefit of the community and PCC is something that
PCC is very interested in pursuing.
MONITORING AND REPORTING
Continue performance measurements as outlined in Section V.
PCC Cascade Campus Transportation Demand Management Plan
Page 37
NEIGHBORHOOD ENGAGEMENT
PCC will coordinate an annual meeting with the neighborhoods to review progress toward
meeting neighborhood infiltration goals, to discuss options and strategies, liaison
partnerships and inform the on-going TDM Plan implementation. The meeting will be
scheduled within 60 days of submittal of the annual performance report to the City of
Portland.
+ On-going communications with the neighborhoods is essential, both as a means for PCC
to report on its progress (through findings within the diagnostic dashboard) and to
receive input that can lead to refinements in program design and delivery and
partnerships. PCC believes communications with the neighborhoods will be on-going,
but recommends the annual meeting to assure a specifically focused meeting on
progress with infiltration and review and understanding of the dashboard metrics being
tracked and monitored.
PCC Cascade Campus Transportation Demand Management Plan
Page 38
TIER 3 (6 – 8 YEARS)
Tier 3 assumes PCC would move to continue Tier 1 and 2 efforts determined to be successful with
additional enhancements of programs with Tier 3 strategies.
GENERAL TDM SUPPORT
Consider development and promotion of incentive programs (e.g., lower tuition rates for
off-peak classes).
+ Moving more students to off-peak periods for parking demand will reduce overall need
for parking as employee and student growth takes place.
PARKING ACCESS
Consider elimination of term parking passes at Cascade campus and replace with “pay as you
go” parking pricing.
+ Tier 3 would increase parking pricing strategies employed within the campus system,
augmenting analysis and evaluation of performance based pricing conducted in Tier 2.
TRANSIT ACCESS
Reduce rate of Student Select Pass below rate for standard term parking pass.
+ Tier 3 would augment transit pricing strategies employed within the campus system,
augmenting the Tier 2 analysis and evaluation conducted by the District Transportation
Specialist and PTS designed to determine the most reasonable critical path to the most
competitive rate for the Student Select Pass.
BIKE/WALK ACESS
Initiate Bike Purchase program for faculty/employees to complement bike outreach/marketing
and incentives initiated in Tier 2.
EXTERNAL PARTNERS
Work with the City and affected neighborhoods and business districts in advocacy for and
initiation of an Area Parking Permit Program (APPP); possibly starting with a pilot effort.
PCC Cascade Campus Transportation Demand Management Plan
Page 39
+ The City has expressed high interest to PCC as regards initiation of and Area Parking Permit
Program within neighborhoods abutting the Cascade campus. PCC believes that efforts in
Tier 1 and Tier 2 should be developed and evaluated first, give input by the neighborhoods
skeptical of APPP’s. As a Tier 3 strategy, an APPP will be a key tool to (a) mitigate parking
impacts from PCC users in adjacent areas if infiltration targets are not met and (b)
complement new access and pricing strategies implemented to meaningfully facilitate mode
change. These conversations will require a strategic partnership between PCC, the City of
Portland (Bureau of Transportation) and the affected neighborhoods.
MONITORING AND REPORTING
Continue performance measurements as outlined in Section V.
NEIGHBORHOOD ENGAGEMENT
PCC will coordinate an annual meeting with the neighborhoods to review progress toward
meeting neighborhood infiltration goals, to discuss options and strategies, liaison
partnerships and inform the on-going TDM Plan implementation. The meeting will be
scheduled within 60 days of submittal of the annual performance report to the City of
Portland.
PCC Cascade Campus Transportation Demand Management Plan
Page 40
TIER 4 (8 – 10 YEARS)
Tier 4 assumes PCC would move to continue Tier 1, 2, and 3 efforts determined to be successful with
additional enhancements of programs with Tier 4 strategies. If Tier 4 measures are required, PCC may
also begin exploring and planning for the development of more parking supply, among other strategic
options.
GENERAL TDM SUPPORT
Commit up to 1.0 FTE campus TDM Specialist (expanding role, time commitment and
resources to Cascade specific TDM).
+ If successful, the full range and package of TDM strategies at the Cascade campus may
require an expanded commitment of time and resources. At this time, the position
would be reassessed, with a “recalibration” of FTE to assure adequate and meaningful
support for the campus TDM Plan.
Consider offering departments financial incentives to provide classes at off-peak parking
times.
+ This effort would be an augmentation of Tier 2 and Tier 3 strategies targeting “incentives” that
would move greater numbers of students out of the peak parking hour and into off-peak times
of day to reduce overall peak parking demand.
PARKING
Implement “pay as you go” parking pricing (if not already in place).
+ Tier 4 would move to full implementation of performance based pricing, leveraging efforts
initiated in Tiers 2 & 3.
Develop options for further strategic investment by PCC in the event performance goals are
not being met, possibly including construction of new parking, a N/NE satellite campus,
redevelopment of PMWTC, Cascade instructional downsizing and others.
TRANSIT
Greater discounting of Student Select transit pass to all students
PCC Cascade Campus Transportation Demand Management Plan
Page 41
+ Tier 4 would expand transit pricing strategies employed within the campus system,
augmenting Tier 3 pricing.
EXTERNAL PARTNERS
Partially subsidize the cost of an Area Parking Permit Program.
+ PCC would enter into a partnership with the City and the neighborhoods to establish an
APPP. PCC would serve as not only a financial partner, through a partial subsidy contribution,
but would consider assistance in administration and distribution of area permits through the
Transportation Specialist. As with Tier 3 efforts in this regard, these conversations will require a
strategic partnership between PCC, the City of Portland (Bureau of Transportation) and the
affected neighborhoods.
MONITORING AND REPORTING
Continue performance measurements as outlined in Section V.
NEIGHBORHOOD ENGAGEMENT
PCC will coordinate an annual meeting with the neighborhoods to review progress toward
meeting neighborhood infiltration goals, to discuss options and strategies, liaison partnerships
and inform the on-going TDM Plan implementation. The meeting will be scheduled within 60
days of submittal of the annual performance report to the City of Portland.
VII. FORECASTING TDM IMPACTS
The expected effectiveness of the TDM strategies outlined in Section VI was assessed by Kittelson &
Associates to better understand the mode splits that PCC Cascade campus could potentially reach by
2021. Analysis is based on research of TDM programs across the country, surveying of students at PCC
Cascade, and an assessment of the TDM strategies outlined in Section VI. The potential proportion of
students and employees that are likely to take each mode to the Cascade Campus in the future is
estimated in Table 13.
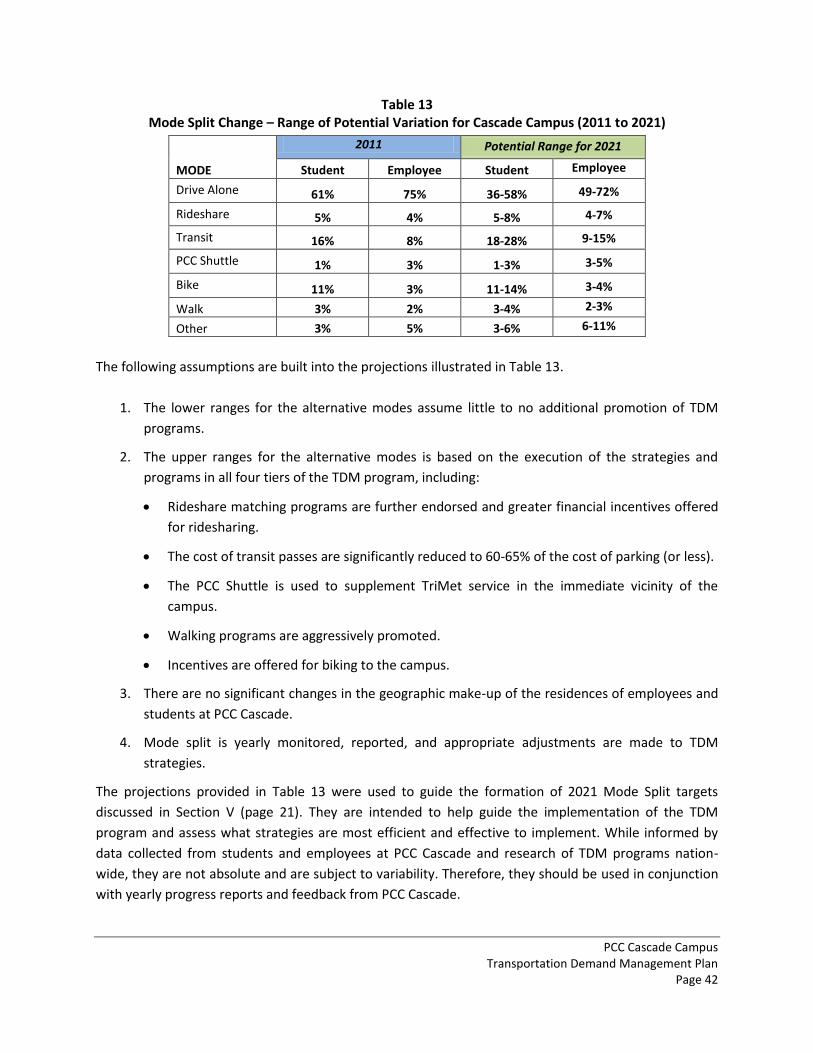
PCC Cascade Campus Transportation Demand Management Plan
Page 42
Table 13 Mode Split Change – Range of Potential Variation for Cascade Campus (2011 to 2021)
MODE
2011 Potential Range for 2021
Student Employee Student Employee
Drive Alone 61% 75% 36-58% 49-72%
Rideshare 5% 4% 5-8% 4-7%
Transit 16% 8% 18-28% 9-15%
PCC Shuttle 1% 3% 1-3% 3-5%
Bike 11% 3% 11-14% 3-4%
Walk 3% 2% 3-4% 2-3%
Other 3% 5% 3-6% 6-11%
The following assumptions are built into the projections illustrated in Table 13.
1. The lower ranges for the alternative modes assume little to no additional promotion of TDM
programs.
2. The upper ranges for the alternative modes is based on the execution of the strategies and
programs in all four tiers of the TDM program, including:
Rideshare matching programs are further endorsed and greater financial incentives offered
for ridesharing.
The cost of transit passes are significantly reduced to 60-65% of the cost of parking (or less).
The PCC Shuttle is used to supplement TriMet service in the immediate vicinity of the
campus.
Walking programs are aggressively promoted.
Incentives are offered for biking to the campus.
3. There are no significant changes in the geographic make-up of the residences of employees and
students at PCC Cascade.
4. Mode split is yearly monitored, reported, and appropriate adjustments are made to TDM
strategies.
The projections provided in Table 13 were used to guide the formation of 2021 Mode Split targets
discussed in Section V (page 21). They are intended to help guide the implementation of the TDM
program and assess what strategies are most efficient and effective to implement. While informed by
data collected from students and employees at PCC Cascade and research of TDM programs nation-
wide, they are not absolute and are subject to variability. Therefore, they should be used in conjunction
with yearly progress reports and feedback from PCC Cascade.
PCC Cascade Campus Transportation Demand Management Plan
Page 43
V. SUMMARY
The Transportation Demand Management Plan proposed for the PCC Cascade Campus provides for a
meaningful and strategic approach to reducing student and employee auto vehicle trips over time. This
will result in a balanced approach to access demand and measurable reductions in vehicles parked in the
neighborhoods. Key elements of the plan include:
• Parking management and TDM that exceeds current status quo.
• Decision-making based on measured performance.
• New programs in all mode categories.
• A support structure on campus to guide, facilitate and respond to changing access dynamics.
• Action tiers that ensure quick response and programs pre-committed as triggers are tripped.
• Objective and thorough reporting.
• Engagement with the community.
The tiered approach to TDM creates flexible “packages” of strategies that can be implemented and
measured to ascertain their effectiveness in meeting targets. The infiltration targets provide useful
milestones and reasonable triggers for more progressive action as demand or progress requires. Finally,
the commitment to measurement and reporting provides objective data to inform decision-making and
assures on-going collaborative communication between PCC, the City and other stakeholders and
partners.
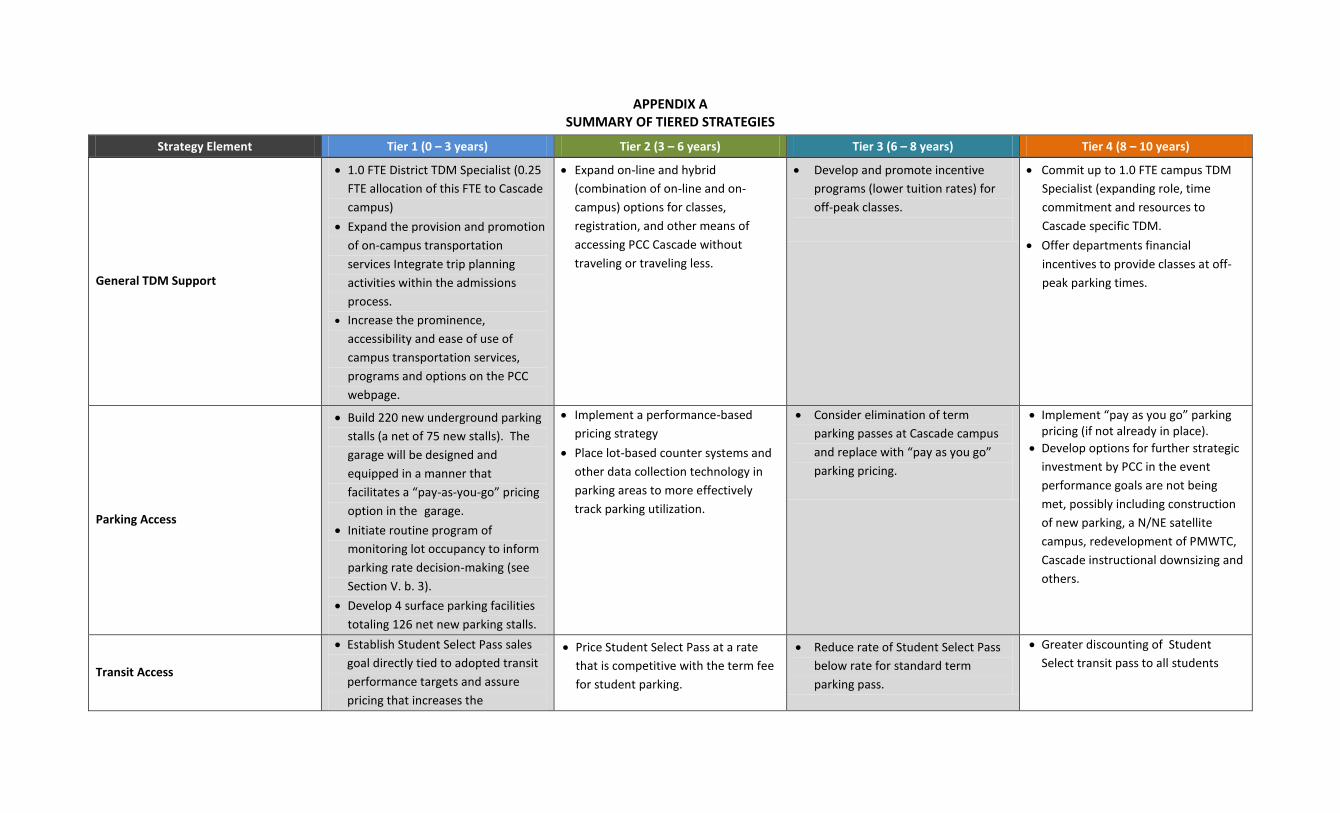
APPENDIX A SUMMARY OF TIERED STRATEGIES
Strategy Element Tier 1 (0 – 3 years) Tier 2 (3 – 6 years) Tier 3 (6 – 8 years) Tier 4 (8 – 10 years)
General TDM Support
1.0 FTE District TDM Specialist (0.25
FTE allocation of this FTE to Cascade
campus)
Expand the provision and promotion
of on-campus transportation
services Integrate trip planning
activities within the admissions
process.
Increase the prominence,
accessibility and ease of use of
campus transportation services,
programs and options on the PCC
webpage.
Expand on-line and hybrid
(combination of on-line and on-
campus) options for classes,
registration, and other means of
accessing PCC Cascade without
traveling or traveling less.
Develop and promote incentive
programs (lower tuition rates) for
off-peak classes.
Commit up to 1.0 FTE campus TDM
Specialist (expanding role, time
commitment and resources to
Cascade specific TDM.
Offer departments financial
incentives to provide classes at off-
peak parking times.
Parking Access
Build 220 new underground parking
stalls (a net of 75 new stalls). The
garage will be designed and
equipped in a manner that
facilitates a “pay-as-you-go” pricing
option in the garage.
Initiate routine program of
monitoring lot occupancy to inform
parking rate decision-making (see
Section V. b. 3).
Develop 4 surface parking facilities
totaling 126 net new parking stalls.
Implement a performance-based
pricing strategy
Place lot-based counter systems and
other data collection technology in
parking areas to more effectively
track parking utilization.
Consider elimination of term
parking passes at Cascade campus
and replace with “pay as you go”
parking pricing.
Implement “pay as you go” parking pricing (if not already in place).
Develop options for further strategic
investment by PCC in the event
performance goals are not being
met, possibly including construction
of new parking, a N/NE satellite
campus, redevelopment of PMWTC,
Cascade instructional downsizing and
others.
Transit Access
Establish Student Select Pass sales
goal directly tied to adopted transit
performance targets and assure
pricing that increases the
Price Student Select Pass at a rate
that is competitive with the term fee
for student parking.
Reduce rate of Student Select Pass
below rate for standard term
parking pass.
Greater discounting of Student
Select transit pass to all students
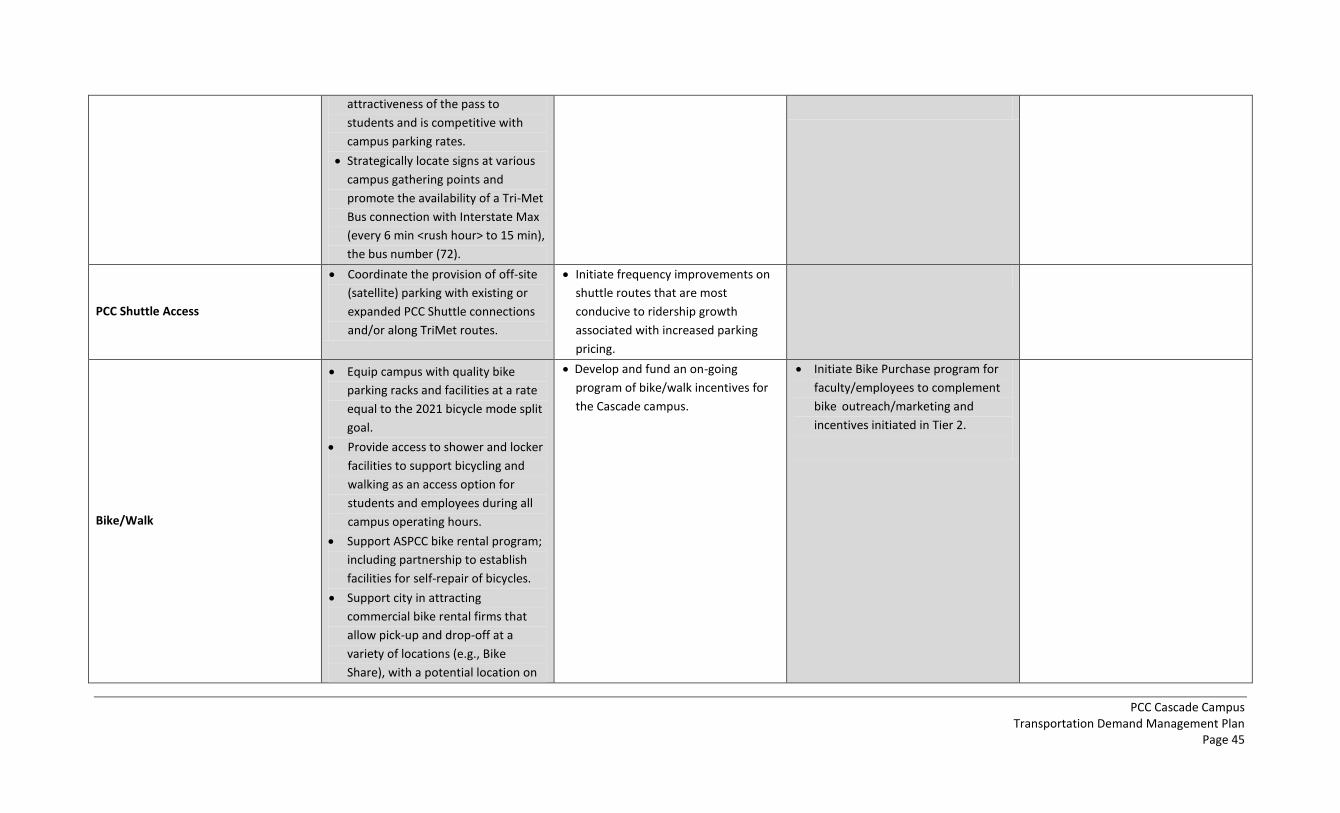
PCC Cascade Campus Transportation Demand Management Plan
Page 45
attractiveness of the pass to
students and is competitive with
campus parking rates.
Strategically locate signs at various
campus gathering points and
promote the availability of a Tri-Met
Bus connection with Interstate Max
(every 6 min <rush hour> to 15 min),
the bus number (72).
PCC Shuttle Access
Coordinate the provision of off-site
(satellite) parking with existing or
expanded PCC Shuttle connections
and/or along TriMet routes.
Initiate frequency improvements on
shuttle routes that are most
conducive to ridership growth
associated with increased parking
pricing.
Bike/Walk
Equip campus with quality bike
parking racks and facilities at a rate
equal to the 2021 bicycle mode split
goal.
Provide access to shower and locker
facilities to support bicycling and
walking as an access option for
students and employees during all
campus operating hours.
Support ASPCC bike rental program;
including partnership to establish
facilities for self-repair of bicycles.
Support city in attracting
commercial bike rental firms that
allow pick-up and drop-off at a
variety of locations (e.g., Bike
Share), with a potential location on
Develop and fund an on-going
program of bike/walk incentives for
the Cascade campus.
Initiate Bike Purchase program for
faculty/employees to complement
bike outreach/marketing and
incentives initiated in Tier 2.
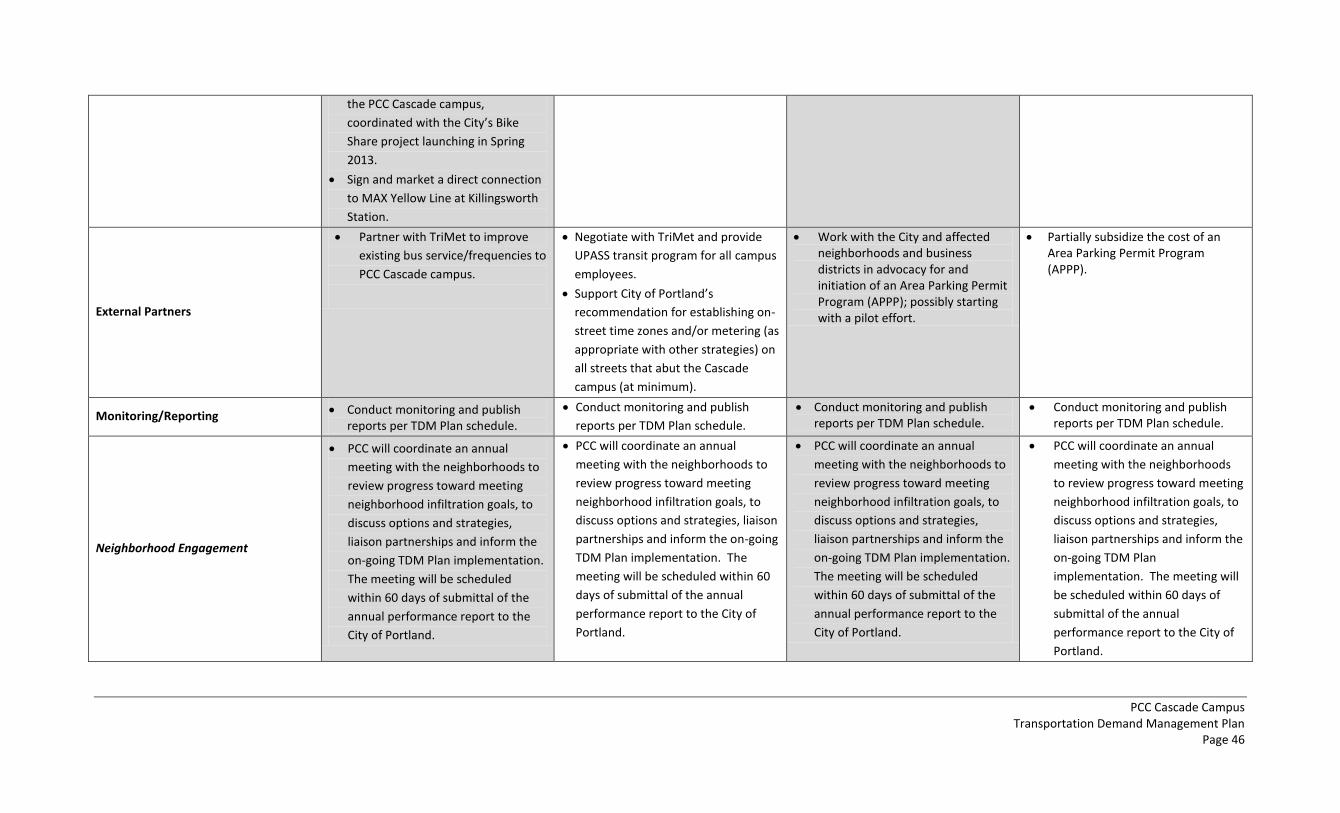
PCC Cascade Campus Transportation Demand Management Plan
Page 46
the PCC Cascade campus,
coordinated with the City’s Bike
Share project launching in Spring
2013.
Sign and market a direct connection
to MAX Yellow Line at Killingsworth
Station.
External Partners
Partner with TriMet to improve
existing bus service/frequencies to
PCC Cascade campus.
Negotiate with TriMet and provide
UPASS transit program for all campus
employees.
Support City of Portland’s
recommendation for establishing on-
street time zones and/or metering (as
appropriate with other strategies) on
all streets that abut the Cascade
campus (at minimum).
Work with the City and affected neighborhoods and business districts in advocacy for and initiation of an Area Parking Permit Program (APPP); possibly starting with a pilot effort.
Partially subsidize the cost of an Area Parking Permit Program (APPP).
Monitoring/Reporting Conduct monitoring and publish reports per TDM Plan schedule.
Conduct monitoring and publish
reports per TDM Plan schedule.
Conduct monitoring and publish reports per TDM Plan schedule.
Conduct monitoring and publish reports per TDM Plan schedule.
Neighborhood Engagement
PCC will coordinate an annual
meeting with the neighborhoods to
review progress toward meeting
neighborhood infiltration goals, to
discuss options and strategies,
liaison partnerships and inform the
on-going TDM Plan implementation.
The meeting will be scheduled
within 60 days of submittal of the
annual performance report to the
City of Portland.
PCC will coordinate an annual
meeting with the neighborhoods to
review progress toward meeting
neighborhood infiltration goals, to
discuss options and strategies, liaison
partnerships and inform the on-going
TDM Plan implementation. The
meeting will be scheduled within 60
days of submittal of the annual
performance report to the City of
Portland.
PCC will coordinate an annual
meeting with the neighborhoods to
review progress toward meeting
neighborhood infiltration goals, to
discuss options and strategies,
liaison partnerships and inform the
on-going TDM Plan implementation.
The meeting will be scheduled
within 60 days of submittal of the
annual performance report to the
City of Portland.
PCC will coordinate an annual
meeting with the neighborhoods
to review progress toward meeting
neighborhood infiltration goals, to
discuss options and strategies,
liaison partnerships and inform the
on-going TDM Plan
implementation. The meeting will
be scheduled within 60 days of
submittal of the annual
performance report to the City of
Portland.
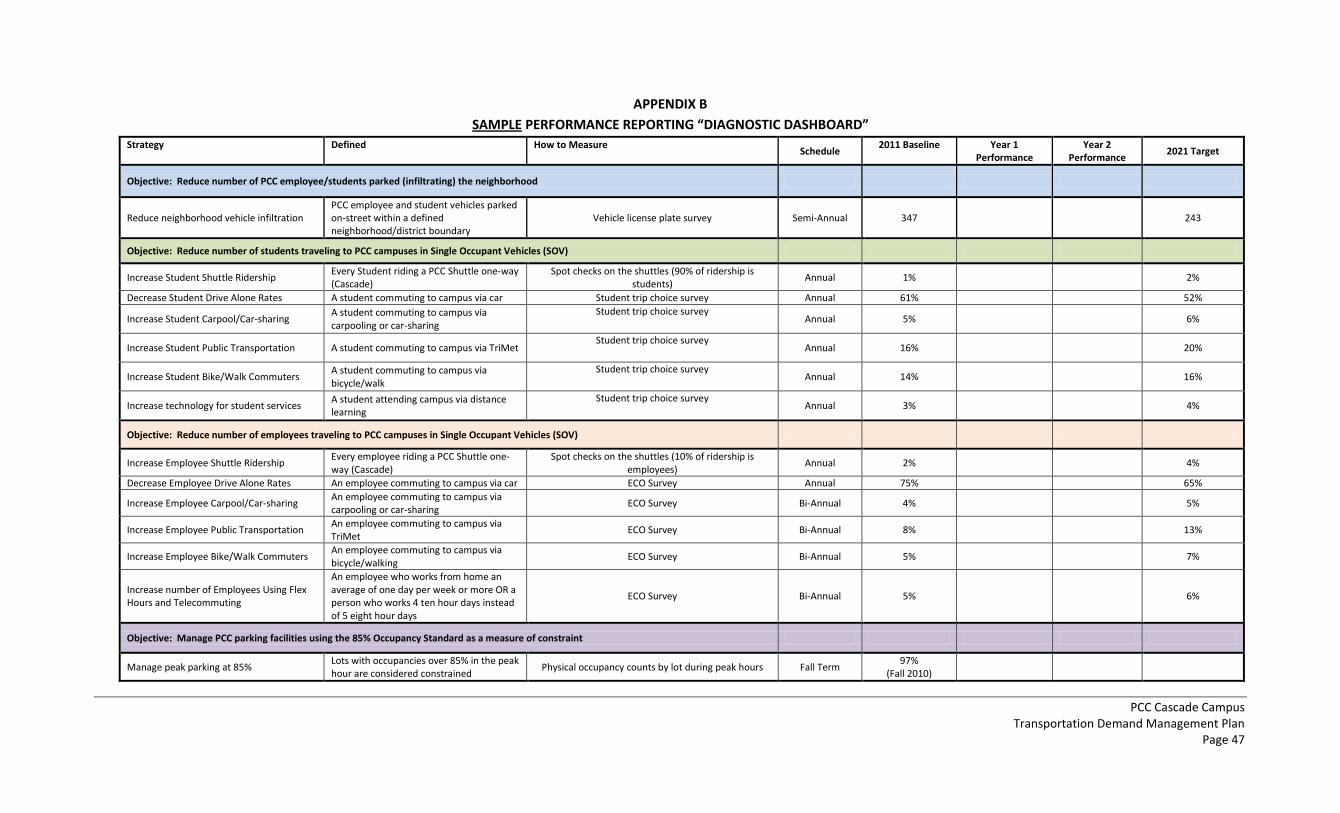
PCC Cascade Campus Transportation Demand Management Plan
Page 47
APPENDIX B
SAMPLE PERFORMANCE REPORTING “DIAGNOSTIC DASHBOARD”
Strategy Defined How to Measure Schedule
2011 Baseline Year 1 Performance
Year 2 Performance
2021 Target
Objective: Reduce number of PCC employee/students parked (infiltrating) the neighborhood
Reduce neighborhood vehicle infiltration PCC employee and student vehicles parked on-street within a defined neighborhood/district boundary
Vehicle license plate survey Semi-Annual 347 243
Objective: Reduce number of students traveling to PCC campuses in Single Occupant Vehicles (SOV)
Increase Student Shuttle Ridership Every Student riding a PCC Shuttle one-way (Cascade)
Spot checks on the shuttles (90% of ridership is students)
Annual 1% 2%
Decrease Student Drive Alone Rates A student commuting to campus via car Student trip choice survey Annual 61% 52%
Increase Student Carpool/Car-sharing A student commuting to campus via carpooling or car-sharing
Student trip choice survey Annual 5% 6%
Increase Student Public Transportation A student commuting to campus via TriMet Student trip choice survey
Annual 16% 20%
Increase Student Bike/Walk Commuters A student commuting to campus via bicycle/walk
Student trip choice survey Annual 14% 16%
Increase technology for student services A student attending campus via distance learning
Student trip choice survey Annual 3% 4%
Objective: Reduce number of employees traveling to PCC campuses in Single Occupant Vehicles (SOV)
Increase Employee Shuttle Ridership Every employee riding a PCC Shuttle one-way (Cascade)
Spot checks on the shuttles (10% of ridership is employees)
Annual 2% 4%
Decrease Employee Drive Alone Rates An employee commuting to campus via car ECO Survey Annual 75% 65%
Increase Employee Carpool/Car-sharing An employee commuting to campus via carpooling or car-sharing
ECO Survey Bi-Annual 4% 5%
Increase Employee Public Transportation An employee commuting to campus via TriMet
ECO Survey Bi-Annual 8% 13%
Increase Employee Bike/Walk Commuters An employee commuting to campus via bicycle/walking
ECO Survey Bi-Annual 5% 7%
Increase number of Employees Using Flex Hours and Telecommuting
An employee who works from home an average of one day per week or more OR a person who works 4 ten hour days instead of 5 eight hour days
ECO Survey Bi-Annual 5% 6%
Objective: Manage PCC parking facilities using the 85% Occupancy Standard as a measure of constraint
Manage peak parking at 85% Lots with occupancies over 85% in the peak hour are considered constrained
Physical occupancy counts by lot during peak hours Fall Term 97%
(Fall 2010)
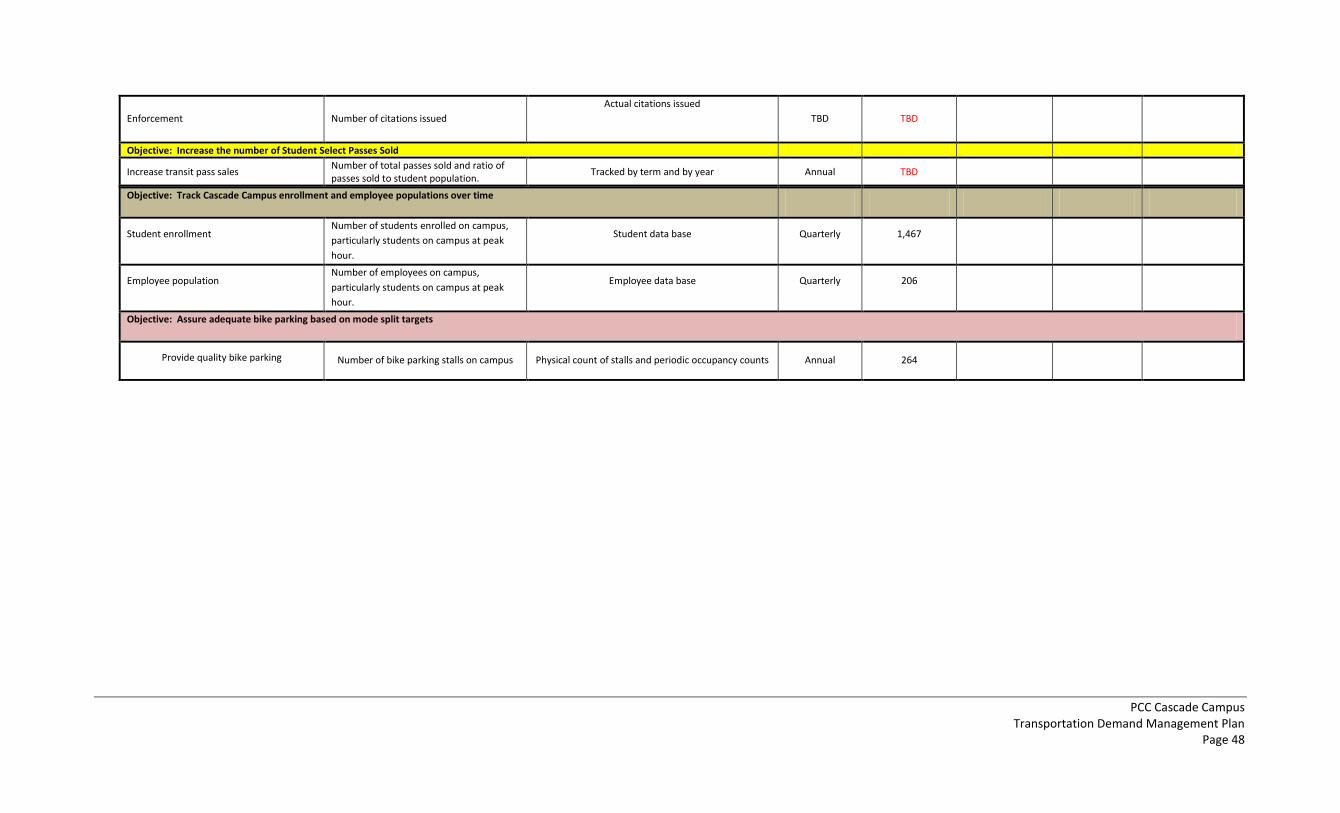
PCC Cascade Campus Transportation Demand Management Plan
Page 48
Enforcement Number of citations issued
Actual citations issued
TBD TBD
Objective: Increase the number of Student Select Passes Sold
Increase transit pass sales Number of total passes sold and ratio of passes sold to student population.
Tracked by term and by year Annual TBD
Objective: Track Cascade Campus enrollment and employee populations over time
Student enrollment Number of students enrolled on campus,
particularly students on campus at peak
hour.
Student data base Quarterly 1,467
Employee population Number of employees on campus,
particularly students on campus at peak
hour.
Employee data base Quarterly 206
Objective: Assure adequate bike parking based on mode split targets
Provide quality bike parking Number of bike parking stalls on campus Physical count of stalls and periodic occupancy counts Annual 264

Related Documents