ASA 1/26/2006 ACHIEVING THE DREAM SM Student Success February 1, 2006 Integrating the Project into the Core College Operations

ASA 1/26/2006 A CHIEVING THE D REAM SM Student Success February 1, 2006 Integrating the Project into the Core College Operations.
Dec 28, 2015
Welcome message from author
This document is posted to help you gain knowledge. Please leave a comment to let me know what you think about it! Share it to your friends and learn new things together.
Transcript

ASA 1/26/2006
ACHIEVING THE DREAMSM
Student Success
February 1, 2006
Integrating the Project into the
Core College Operations
QEP Components
• It must target the improvement of student learning
• It should have specific, well-defined goals that lead to measurable results
• It should address critical issues essential to the institution

QEP Components
• It should include evidence of careful analysis of the institutional context
• It should include a viable implementation plan that includes the necessary resources
• It should include a fully developed evaluation plan

Why course completion?
• Basic student retention data must account for at least 2 important variables:– Student intent to persist– Environmental variables
• Course completion data accounts for student intent.
• Course completion leads to retention which leads to graduation.

How the data were analyzed
• Student success rate
• Withdrawal rate
• Compare student success by:– Courses taught by full-time faculty vs adjunct– By campus– Online vs traditional– “Early-term” vs “Longer-term” students– Student age groups, gender, race
Data analysis - continued
• Institution-wide
• By campus
• Developmental English and Math
• Gatekeeper English and Math
• Online
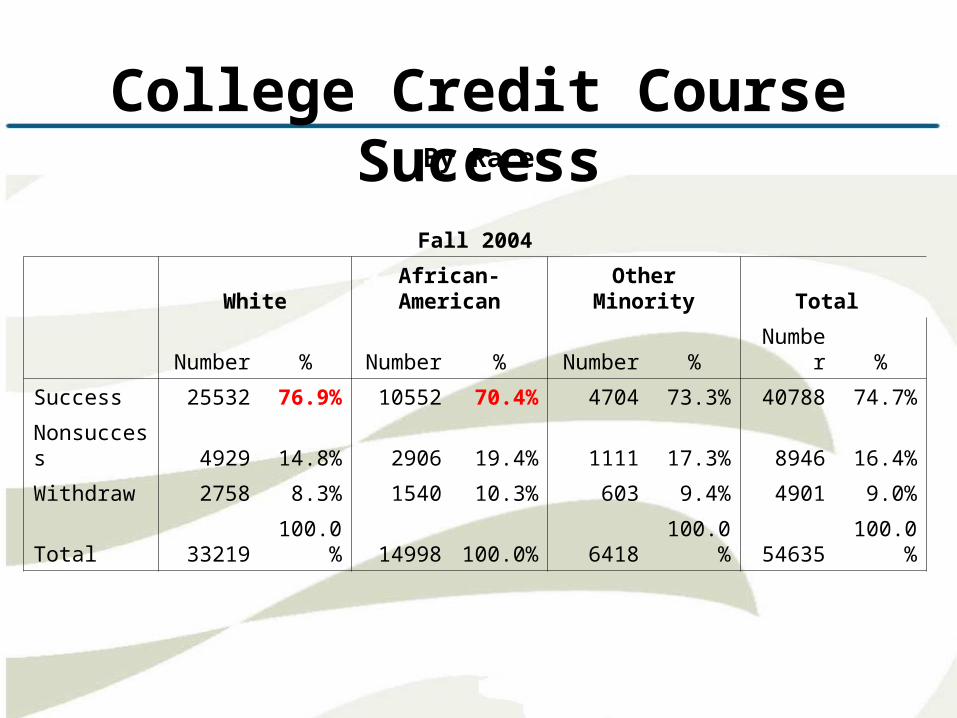
College Credit Course SuccessBy Race
Fall 2004
White African-American Other Minority Total
Number % Number % Number % Number %
Success 25532 76.9% 10552 70.4% 4704 73.3% 40788 74.7%
Nonsuccess 4929 14.8% 2906 19.4% 1111 17.3% 8946 16.4%
Withdraw 2758 8.3% 1540 10.3% 603 9.4% 4901 9.0%
Total 33219 100.0% 14998 100.0% 6418 100.0% 54635 100.0%
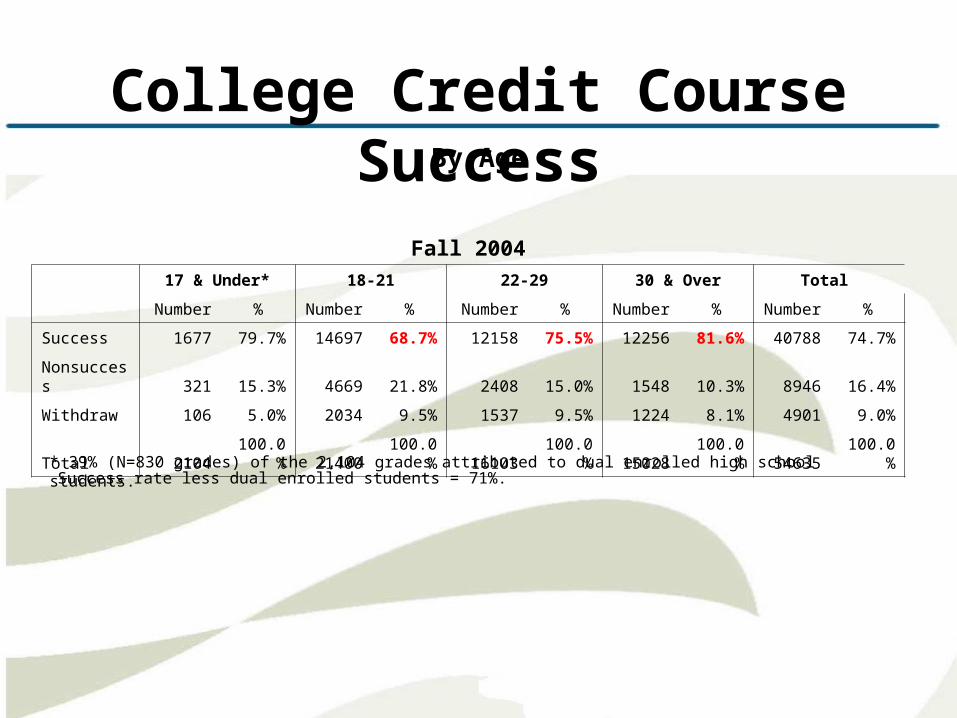
College Credit Course Success
Fall 2004
17 & Under* 18-21 22-29 30 & Over Total
Number % Number % Number % Number % Number %
Success 1677 79.7% 14697 68.7% 12158 75.5% 12256 81.6% 40788 74.7%
Nonsuccess 321 15.3% 4669 21.8% 2408 15.0% 1548 10.3% 8946 16.4%
Withdraw 106 5.0% 2034 9.5% 1537 9.5% 1224 8.1% 4901 9.0%
Total 2104 100.0% 21400 100.0% 16103 100.0% 15028 100.0% 54635 100.0%
By Age
* 39% (N=830 grades) of the 2,104 grades attributed to dual enrolled high school students.Success rate less dual enrolled students = 71%.

ObservationsCollege Credit Courses
• The success rate for adjuncts (77%) is slightly higher than that of FT
instructors (71%).
• The success rate for online courses (67%) is lower than that of traditional
courses (76%).
• The withdrawal rate for online courses (14%) is higher than that of
traditional courses (8%).
• The success rate for 18-21 year old students (69%) is less than that of
22-29 (76%) and students 30 and older (82%).
• The success rate for African-American students (70%) is lower than that
of white students (77%).
• The fewer credits accumulated, the lower the success rate. Students with
less than 16 accumulated credits have the lowest success rate m (70%)
compared to 16-30 credits (77%) and 31+ credits (81%).

By Campus
Developmental ENG
Fall 2004
Chesapeake Norfolk Portsmouth Va Beach Total
Number % Number % Number % Number % Number %
Success 376 80.2% 415 59.4% 270 56.8% 829 67.3% 1890 65.7%
Nonsuccess 74 15.8% 192 27.5% 147 30.9% 310 25.2% 723 25.1%
Withdraw 19 4.1% 92 13.2% 58 12.2% 93 7.5% 262 9.1%
Total 469100.0
% 699100.0
% 475100.0
% 1232100.0
% 2875100.0
%
Developmental MTH
Fall 2004
Chesapeake Norfolk Portsmouth Va Beach Total
Number % Number % Number % Number % Number %
Success 371 55.1% 497 51.5% 388 67.8% 1502 49.9% 2758 52.9%
Nonsuccess 236 35.1% 317 32.8% 153 26.7% 1261 41.9% 1967 37.7%
Withdraw 66 9.8% 151 15.6% 31 5.4% 245 8.1% 493 9.4%
Total 673100.0
% 965100.0
% 572100.0
% 3008100.0
% 5218100.0
%
Developmental Course Success
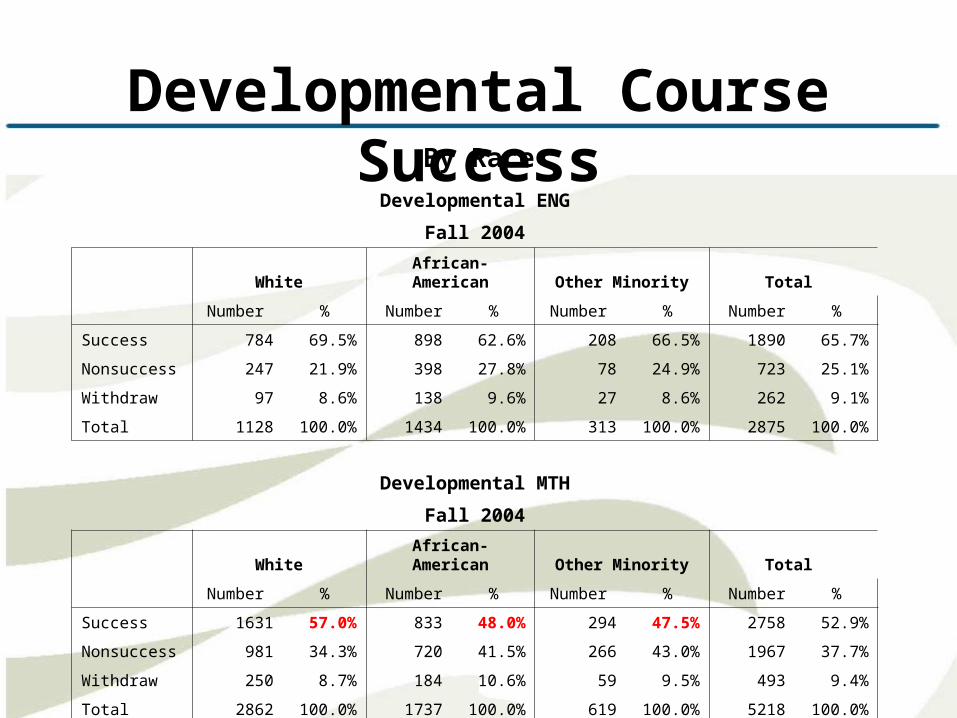
By Race
Developmental ENG
Fall 2004
White African-American Other Minority Total
Number % Number % Number % Number %
Success 784 69.5% 898 62.6% 208 66.5% 1890 65.7%
Nonsuccess 247 21.9% 398 27.8% 78 24.9% 723 25.1%
Withdraw 97 8.6% 138 9.6% 27 8.6% 262 9.1%
Total 1128 100.0% 1434 100.0% 313 100.0% 2875 100.0%
Developmental MTH
Fall 2004
White African-American Other Minority Total
Number % Number % Number % Number %
Success 1631 57.0% 833 48.0% 294 47.5% 2758 52.9%
Nonsuccess 981 34.3% 720 41.5% 266 43.0% 1967 37.7%
Withdraw 250 8.7% 184 10.6% 59 9.5% 493 9.4%
Total 2862 100.0% 1737 100.0% 619 100.0% 5218 100.0%
Developmental Course Success
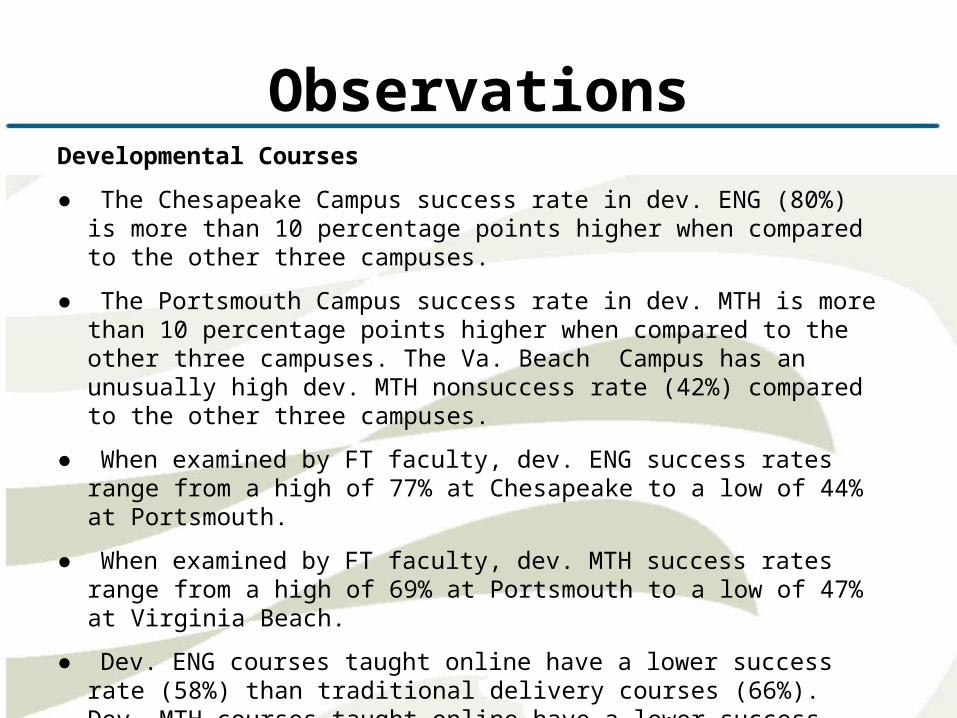
ObservationsDevelopmental Courses
● The Chesapeake Campus success rate in dev. ENG (80%) is more than 10 percentage points higher when compared to the other three campuses.
● The Portsmouth Campus success rate in dev. MTH is more than 10 percentage points higher when compared to the other three campuses. The Va. Beach Campus has an unusually high dev. MTH nonsuccess rate (42%) compared to the other three campuses.
● When examined by FT faculty, dev. ENG success rates range from a high of 77% at Chesapeake to a low of 44% at Portsmouth.
● When examined by FT faculty, dev. MTH success rates range from a high of 69% at Portsmouth to a low of 47% at Virginia Beach.
● Dev. ENG courses taught online have a lower success rate (58%) than traditional delivery courses (66%). Dev. MTH courses taught online have a lower success rate (45%) than traditional delivery courses (53%).

ObservationsDevelopmental Courses – continued
● The withdrawal rate for online dev. ENG courses (17%) is about twice that of traditional dev. ENG courses (9%), and the online dev. MTH withdrawal rate (27%) is three times the rate of traditional courses (8%).
● Less than 50% of minority students enrolled in dev. MTH are successful.
● For males, the success rate (46%) and nonsuccess rate (45%) are almost identical in dev. MTH.
● The success rates for dev. ENG (64%) and dev. MTH (48%) are lowest among the 18-21 year age group and highest for those 30 and older.
● The success rate for developmental courses is lowest for students with 15 or fewer accumulated credits.

Gatekeeper Course SuccessBy Campus
Gatekeeper ENG* Course Success Rate By Campus
Fall 2004
Chesapeake Norfolk Portsmouth Va Beach Total
Number % Number % Number % Number % Number %
Success 442 74.5% 208 63.4% 224 55.9% 1345 73.9% 2219 70.6%
Nonsuccess 113 19.1% 71 21.6% 121 30.2% 318 17.5% 623 19.8%
Withdraw 38 6.4% 49 14.9% 56 14.0% 157 8.6% 300 9.5%
Total 593 100.0% 328 100.0% 401 100.0% 1820 100.0% 3142 100.0%
*Gatekeeper ENG = ENG 111
Gatekeeper MTH* Course Success Rate By Campus
Fall 2004
Chesapeake Norfolk Portsmouth Va Beach Total
Number % Number % Number % Number % Number %
Success 156 53.8% 138 60.3% 129 70.1% 521 59.9% 944 60.0%
Nonsuccess 88 30.3% 65 28.4% 43 23.4% 224 25.7% 420 26.7%
Withdraw 46 15.9% 26 11.4% 12 6.5% 125 14.4% 209 13.3%
Total 290 100.0% 229 100.0% 184 100.0% 870 100.0% 1573 100.0%
* Gatekeeper MTH = MTH 158, MTH 163

Observations
Gatekeeper Courses
● Similar to statistics for developmental ENG and MTH, the Chesapeake Campus has the highest success rate for gatekeeper ENG (75%) and the Portsmouth Campus has the highest success rate for gatekeeper MTH (70%).
● The gatekeeper ENG success rate is lowest for the 18-21 year age group (64%) and those with less than 16 accumulated credits (70%).
● About 27% of students enrolled in gatekeeper MTH courses are unsuccessful, and 13% withdraw.
● The gatekeeper MTH success rate for males (53%) is much lower than for females (65%).
● The gatekeeper MTH success rate is lowest for the 18-21 year age group (56%) and those with less than 16 accumulated credits (57%).

Common Threads
● Students with less than 16 accumulated credits and in the 18-21 year age group tend to have a lower success rate.
● Online courses tend to have higher withdrawal rates, particularly in dev. MTH and ENG.
● Males and minorities tend to have a lower success rate in MTH (both dev. and gatekeeper).
Observations
Related Documents