TALLINNA KAUBAMAJA AS Consolidated Interim Report for the fourth quarter and twelve months 2011 (unaudited)

Welcome message from author
This document is posted to help you gain knowledge. Please leave a comment to let me know what you think about it! Share it to your friends and learn new things together.
Transcript
TALLINNA KAUBAMAJA AS
Consolidated Interim Report
for the fourth quarter and twelve months 2011
(unaudited)
Tallinna Kaubamaja AS
Consolidated Interim Report for the fourth quarter and twelve months 2011 (unaudited)
2
Table of contents
MANAGEMENT REPORT ............................................................................................................................................ 4 CONSOLIDATED FINANCIAL STATEMENTS ........................................................................................................... 11
MANAGEMENT BOARD’S CONFIRMATION TO THE CONSOLIDATED FINANCIAL STATEMENTS ....... 11 CONSOLIDATED STATEMENT OF FINANCIAL POSITION ....................................................................... 12 CONSOLIDATED STATEMENT OF COMPREHENSIVE INCOME ............................................................. 13 CONSOLIDATED CASH FLOW STATEMENT ............................................................................................. 14 CONSOLIDATED STATEMENT OF CHANGES IN OWNERS’ EQUITY ...................................................... 15 NOTES TO THE CONSOLIDATED INTERIM ACCOUNTS ......................................................................... 16
Note 1. Accounting Principles Followed upon Preparation of the Consolidated Interim Accounts ........ 16
Note 2. Cash and Bank ................................................................................................................................... 17
Note 3. Trade Receivables .............................................................................................................................. 17
Note 4. Other Short Term Receivables .......................................................................................................... 17
Note 5. Prepayments ....................................................................................................................................... 17
Note 7. Shares in Subsidiaries ....................................................................................................................... 18
Note 8. Investments in associates ................................................................................................................. 19
Note 9. Investment property ........................................................................................................................... 19
Note 10. Tangible Fixed Assets...................................................................................................................... 20
Note 11. Intangible Fixed Assets ................................................................................................................... 21
Note 12. Interest bearing borrowings ............................................................................................................ 22
Note 13. Taxes, other short- and long-term payables, and provisions ....................................................... 22
Note 14. Share Capital .................................................................................................................................... 23
Note 15. Segment Reporting .......................................................................................................................... 23
Note 16. Other operating income ................................................................................................................... 26
Note 17. Other operating expenses ............................................................................................................... 27
Note 18. Staff Costs ........................................................................................................................................ 27
Note 19. Other expenses ................................................................................................................................ 27
Note 20. Finance income and costs............................................................................................................... 28
Note 21. Earnings per share ........................................................................................................................... 28
Note 22. Transactions with Related Parties .................................................................................................. 28
Note 23 Events after the balance sheet date ................................................................................................ 30
Tallinna Kaubamaja AS
Consolidated Interim Report for the fourth quarter and twelve months 2011 (unaudited)
3
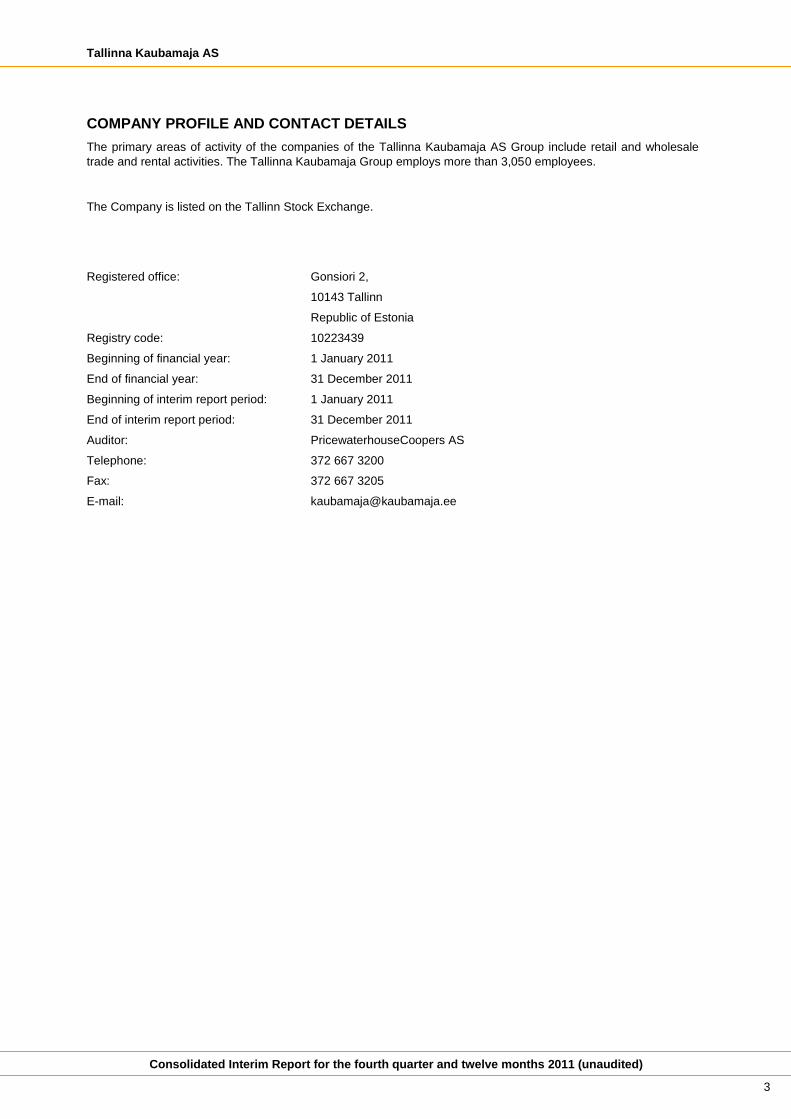
COMPANY PROFILE AND CONTACT DETAILS
The primary areas of activity of the companies of the Tallinna Kaubamaja AS Group include retail and wholesale
trade and rental activities. The Tallinna Kaubamaja Group employs more than 3,050 employees.
The Company is listed on the Tallinn Stock Exchange.
Registered office: Gonsiori 2,
10143 Tallinn
Republic of Estonia
Registry code: 10223439
Beginning of financial year: 1 January 2011
End of financial year: 31 December 2011
Beginning of interim report period: 1 January 2011
End of interim report period: 31 December 2011
Auditor: PricewaterhouseCoopers AS
Telephone: 372 667 3200
Fax: 372 667 3205
E-mail: [email protected]
Tallinna Kaubamaja AS
Consolidated Interim Report for the fourth quarter and twelve months 2011 (unaudited)
4
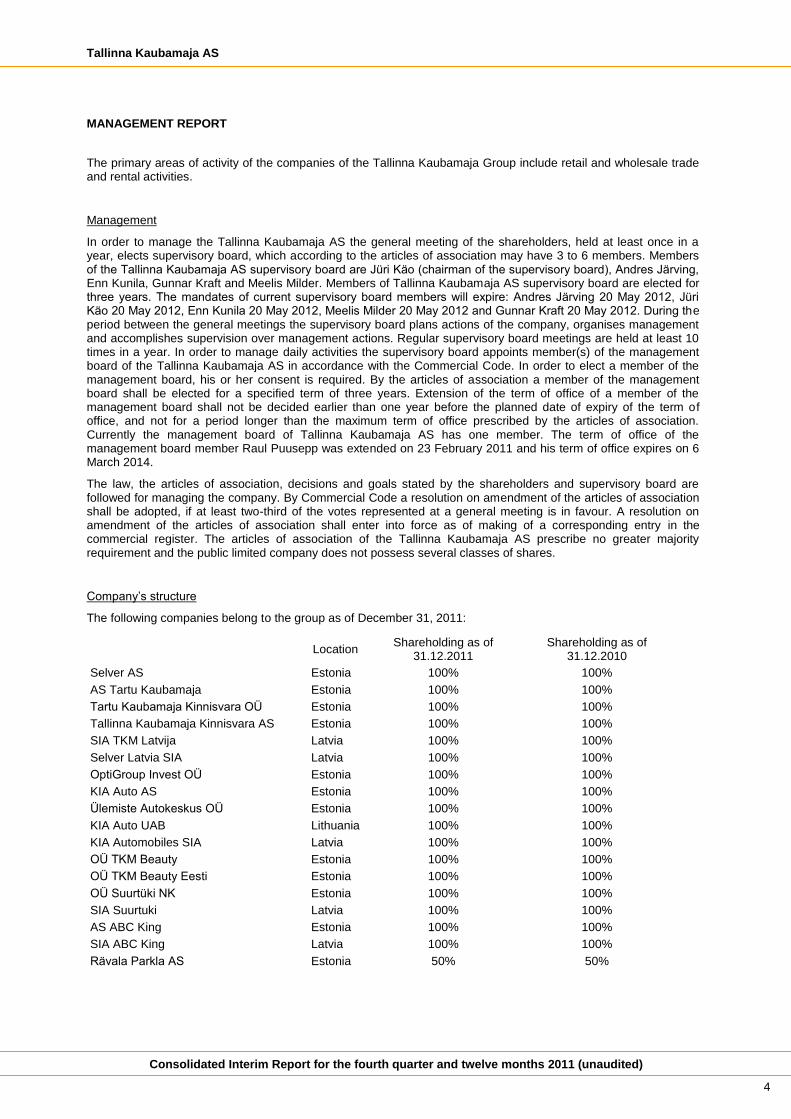
MANAGEMENT REPORT
The primary areas of activity of the companies of the Tallinna Kaubamaja Group include retail and wholesale trade and rental activities.
Management
In order to manage the Tallinna Kaubamaja AS the general meeting of the shareholders, held at least once in a year, elects supervisory board, which according to the articles of association may have 3 to 6 members. Members of the Tallinna Kaubamaja AS supervisory board are Jüri Käo (chairman of the supervisory board), Andres Järving, Enn Kunila, Gunnar Kraft and Meelis Milder. Members of Tallinna Kaubamaja AS supervisory board are elected for three years. The mandates of current supervisory board members will expire: Andres Järving 20 May 2012, Jüri Käo 20 May 2012, Enn Kunila 20 May 2012, Meelis Milder 20 May 2012 and Gunnar Kraft 20 May 2012. During the period between the general meetings the supervisory board plans actions of the company, organises management and accomplishes supervision over management actions. Regular supervisory board meetings are held at least 10 times in a year. In order to manage daily activities the supervisory board appoints member(s) of the management board of the Tallinna Kaubamaja AS in accordance with the Commercial Code. In order to elect a member of the management board, his or her consent is required. By the articles of association a member of the management board shall be elected for a specified term of three years. Extension of the term of office of a member of the management board shall not be decided earlier than one year before the planned date of expiry of the term of office, and not for a period longer than the maximum term of office prescribed by the articles of association. Currently the management board of Tallinna Kaubamaja AS has one member. The term of office of the management board member Raul Puusepp was extended on 23 February 2011 and his term of office expires on 6 March 2014.
The law, the articles of association, decisions and goals stated by the shareholders and supervisory board are followed for managing the company. By Commercial Code a resolution on amendment of the articles of association shall be adopted, if at least two-third of the votes represented at a general meeting is in favour. A resolution on amendment of the articles of association shall enter into force as of making of a corresponding entry in the commercial register. The articles of association of the Tallinna Kaubamaja AS prescribe no greater majority requirement and the public limited company does not possess several classes of shares.
Company’s structure
The following companies belong to the group as of December 31, 2011:
Location Shareholding as of
31.12.2011 Shareholding as of
31.12.2010
Selver AS Estonia 100% 100%
AS Tartu Kaubamaja Estonia 100% 100%
Tartu Kaubamaja Kinnisvara OÜ Estonia 100% 100%
Tallinna Kaubamaja Kinnisvara AS Estonia 100% 100%
SIA TKM Latvija Latvia 100% 100%
Selver Latvia SIA Latvia 100% 100%
OptiGroup Invest OÜ Estonia 100% 100%
KIA Auto AS Estonia 100% 100%
Ülemiste Autokeskus OÜ Estonia 100% 100%
KIA Auto UAB Lithuania 100% 100%
KIA Automobiles SIA Latvia 100% 100%
OÜ TKM Beauty Estonia 100% 100%
OÜ TKM Beauty Eesti Estonia 100% 100%
OÜ Suurtüki NK Estonia 100% 100%
SIA Suurtuki Latvia 100% 100%
AS ABC King Estonia 100% 100%
SIA ABC King Latvia 100% 100%
Rävala Parkla AS Estonia 50% 50%
Tallinna Kaubamaja AS
Consolidated Interim Report for the fourth quarter and twelve months 2011 (unaudited)
5
Economic development
In 2011, Estonian economy grew fast, mainly propelled by export. Both investments and employment increased, as
did internal demand. According to the initial data of Statistics Estonia, in the 4th quarter the Estonian gross
domestic product had grown by 4.0%, as compared to the year before. In 2011, the annual GDP grew by 7.5%
compared to the previous year. Analysts estimate that the growth will become slower, but according to prognosis,
Estonian economy will continue to flourish in 2012 as well. Compared to 2010, the consumer price index has grown
by an average of 5.0%. Juxtaposing it to the last year, the index was most affected by the 9.7% increase in the
price of food and non-alcoholic beverages, which did however slow down considerably by the end of the year. After
a long period of time, households’ demand has started to rise. The decrease in unemployment and the increase in
wages are additional positive indicators.
Compared to last year, the total volume of retail sales has indicated a strong steady development. Compared to the
same period of the previous year, the 2011 retail sales of retail companies goods (motor vehicles and motorbikes
not included) increased by 10.3% at current prices, and showed a growth of 9.6% in the 4th quarter. The volume of
sales increased in most areas of activity – only in pharmacies and beauty stores were the retail sales down by 8.6%
compared to the previous year. Compared to other areas of retail sale, the annual increase in the sales of textile
products, clothes, footwear and leather goods remained weak at 4.6%. The most remarkable rise could be seen in
the sales of used goods (37.8%); in addition, retail sales by post or over the Internet grew rapidly (26.9%), as did
the retail sales of food products, beverages and tobacco products in specialised stores (26.9%).
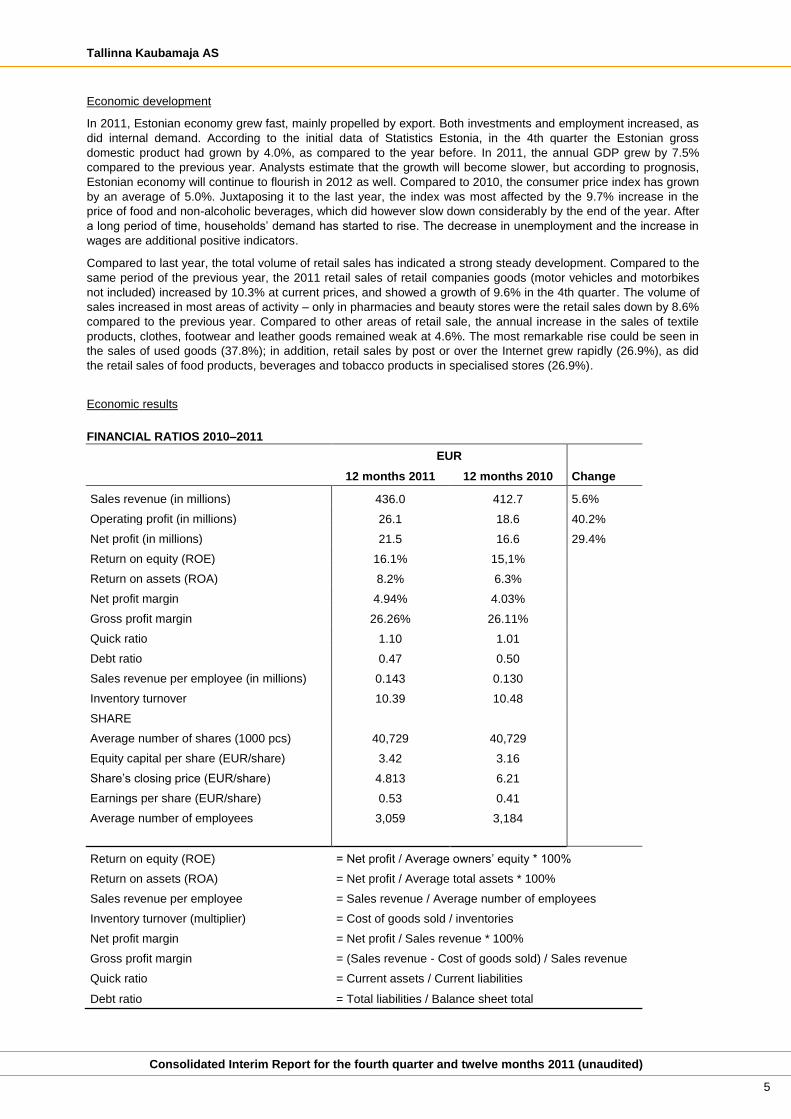
Economic results
FINANCIAL RATIOS 2010–2011
EUR
12 months 2011 12 months 2010 Change
Sales revenue (in millions) 436.0 412.7 5.6%
Operating profit (in millions) 26.1 18.6 40.2%
Net profit (in millions) 21.5 16.6 29.4%
Return on equity (ROE) 16.1% 15,1%
Return on assets (ROA) 8.2% 6.3%
Net profit margin 4.94% 4.03%
Gross profit margin 26.26% 26.11%
Quick ratio 1.10 1.01
Debt ratio 0.47 0.50
Sales revenue per employee (in millions) 0.143 0.130
Inventory turnover 10.39 10.48
SHARE
Average number of shares (1000 pcs) 40,729 40,729
Equity capital per share (EUR/share) 3.42 3.16
Share’s closing price (EUR/share) 4.813 6.21
Earnings per share (EUR/share) 0.53 0.41
Average number of employees 3,059 3,184
Return on equity (ROE) = Net profit / Average owners’ equity * 100%
Return on assets (ROA) = Net profit / Average total assets * 100%
Sales revenue per employee = Sales revenue / Average number of employees
Inventory turnover (multiplier) = Cost of goods sold / inventories
Net profit margin = Net profit / Sales revenue * 100%
Gross profit margin = (Sales revenue - Cost of goods sold) / Sales revenue
Quick ratio = Current assets / Current liabilities
Debt ratio = Total liabilities / Balance sheet total
Tallinna Kaubamaja AS
Consolidated Interim Report for the fourth quarter and twelve months 2011 (unaudited)
6
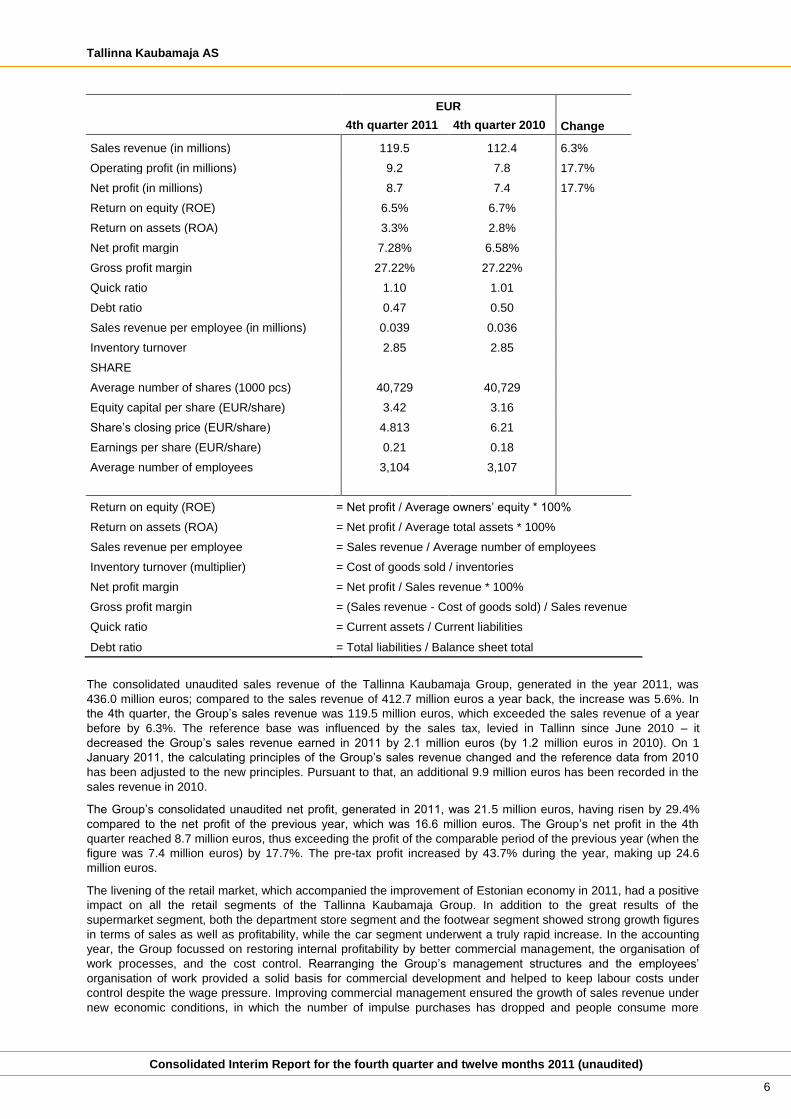
EUR
4th quarter 2011 4th quarter 2010 Change
Sales revenue (in millions) 119.5 112.4 6.3%
Operating profit (in millions) 9.2 7.8 17.7%
Net profit (in millions) 8.7 7.4 17.7%
Return on equity (ROE) 6.5% 6.7%
Return on assets (ROA) 3.3% 2.8%
Net profit margin 7.28% 6.58%
Gross profit margin 27.22% 27.22%
Quick ratio 1.10 1.01
Debt ratio 0.47 0.50
Sales revenue per employee (in millions) 0.039 0.036
Inventory turnover 2.85 2.85
SHARE
Average number of shares (1000 pcs) 40,729 40,729
Equity capital per share (EUR/share) 3.42 3.16
Share’s closing price (EUR/share) 4.813 6.21
Earnings per share (EUR/share) 0.21 0.18
Average number of employees 3,104 3,107
Return on equity (ROE) = Net profit / Average owners’ equity * 100%
Return on assets (ROA) = Net profit / Average total assets * 100%
Sales revenue per employee = Sales revenue / Average number of employees
Inventory turnover (multiplier) = Cost of goods sold / inventories
Net profit margin = Net profit / Sales revenue * 100%
Gross profit margin = (Sales revenue - Cost of goods sold) / Sales revenue
Quick ratio = Current assets / Current liabilities
Debt ratio = Total liabilities / Balance sheet total
The consolidated unaudited sales revenue of the Tallinna Kaubamaja Group, generated in the year 2011, was
436.0 million euros; compared to the sales revenue of 412.7 million euros a year back, the increase was 5.6%. In
the 4th quarter, the Group’s sales revenue was 119.5 million euros, which exceeded the sales revenue of a year
before by 6.3%. The reference base was influenced by the sales tax, levied in Tallinn since June 2010 – it
decreased the Group’s sales revenue earned in 2011 by 2.1 million euros (by 1.2 million euros in 2010). On 1
January 2011, the calculating principles of the Group’s sales revenue changed and the reference data from 2010
has been adjusted to the new principles. Pursuant to that, an additional 9.9 million euros has been recorded in the
sales revenue in 2010.
The Group’s consolidated unaudited net profit, generated in 2011, was 21.5 million euros, having risen by 29.4%
compared to the net profit of the previous year, which was 16.6 million euros. The Group’s net profit in the 4th
quarter reached 8.7 million euros, thus exceeding the profit of the comparable period of the previous year (when the
figure was 7.4 million euros) by 17.7%. The pre-tax profit increased by 43.7% during the year, making up 24.6
million euros.
The livening of the retail market, which accompanied the improvement of Estonian economy in 2011, had a positive
impact on all the retail segments of the Tallinna Kaubamaja Group. In addition to the great results of the
supermarket segment, both the department store segment and the footwear segment showed strong growth figures
in terms of sales as well as profitability, while the car segment underwent a truly rapid increase. In the accounting
year, the Group focussed on restoring internal profitability by better commercial management, the organisation of
work processes, and the cost control. Rearranging the Group’s management structures and the employees’
organisation of work provided a solid basis for commercial development and helped to keep labour costs under
control despite the wage pressure. Improving commercial management ensured the growth of sales revenue under
new economic conditions, in which the number of impulse purchases has dropped and people consume more
Tallinna Kaubamaja AS
Consolidated Interim Report for the fourth quarter and twelve months 2011 (unaudited)
7
rationally.
During the accounting year, the Group paid much attention to the efficiency of floor spaces. Less effective stores
were closed, including the Soldino Selver in Narva, the youth department in Kaubamaja and several footwear
stores. In terms of the footwear segment, the concept renewal of Suurtüki NK OÜ came to an end, the last Suurtüki
store was closed and the Group continues with 3 concepts – ABC, Shu and Nero. In 2011, Selver renovated four
stores. In 2012, Selver plans to open several new stores, the first of which, Saku Selver, will be opened in May.
The volume of the assets of the Tallinna Kaubamaja Group as of 31 December 2011 was 262.5 million euros,
having grown 2.3 million euros compared to the end of 2010, i.e. 0.9%.
At the end of the accounting period, the Group had more than 487.6 thousand loyal customers – a figure that had
increased by 11.0% in a year. The share of purchases made by loyal customers from the 2011 sales revenue of the
Group was 77.6%. More than 7.9 thousand Partner Credit Cards had been issued by the end of the year.
Share market
Since 19 August 1997, the shares of AS Tallinna Kaubamaja have been listed in the main list of securities of the
Tallinn Stock Exchange. Tallinna Kaubamaja AS has issued 40,729.2 thousand registered shares, each with the
nominal value of 0.60 euros. The shares are freely transferable, no statutory restrictions apply. There are no
restrictions on transfer of securities to the company as provided by contracts between the company and its
shareholders. We do not have information about contracts between the shareholders restricting the transfer of
securities. NG Investeeringud OÜ has direct significant participation. Shares granting special rights to their owners
have not been issued.
The members of the management board of Tallinna Kaubamaja AS have no right to issue or buy back shares. In
addition, there are no commitments between the company and its employees providing for compensation in
mergers and acquisitions under article 19’ of Stock Market Trade Act.
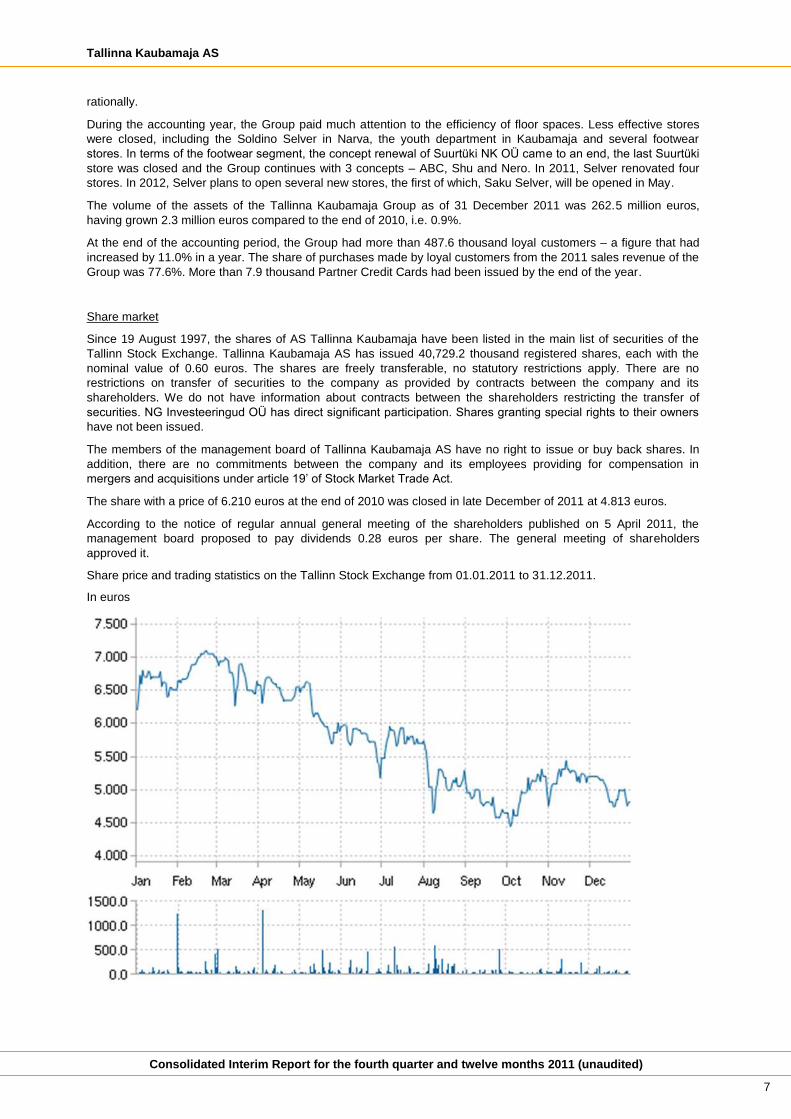
The share with a price of 6.210 euros at the end of 2010 was closed in late December of 2011 at 4.813 euros.
According to the notice of regular annual general meeting of the shareholders published on 5 April 2011, the
management board proposed to pay dividends 0.28 euros per share. The general meeting of shareholders
approved it.
Share price and trading statistics on the Tallinn Stock Exchange from 01.01.2011 to 31.12.2011.
In euros
Tallinna Kaubamaja AS
Consolidated Interim Report for the fourth quarter and twelve months 2011 (unaudited)
8
Department stores
The 2011 sales revenue of the department store business segment was 80.5 million euros, which had increased by
7.9% compared to the same period of the previous year. Of this, the sales revenue of the 4th quarter was 25.3
million euros, which was 11.6% higher than the revenue of the 4th quarter of 2010. The profit earned by department
stores in 2011 was 2.8 million euros, which had improved by 1.4 million euros compared to the year before. In the
4th quarter, profit was earned in the amount of 2.3 million euros, which was 0.3 million euros better than the result
of the corresponding period of the previous year. The operating profit of the department store segment had grown
by 1.5 million euros in a year (from 1.0 million euros in 2010 to 2.5 million euros in 2011). The operating profit was
influenced by the successful sales campaign Osturalli and the closing campaign of the digital and sports
departments that began in the 4th quarter. The average sales revenue of Kaubamaja per a square metre of selling
space in 2011 was 0.26 thousand euros, which is 8.3% higher than the average sales revenue of 2010. In August,
the selling space of Kaubamaja grew smaller by 525 m2 in connection with the closing of the Kaubamaja youth
department at the end of July. The 2011 operating profit of the department store segment was also boosted by the
higher sales margin achieved thanks to successful purchases and the improved management of stock. In 2012, the
Group will aim at giving a clear, comprehensive and wide-ranging content to the existing department store format in
order to maintain its market segment and competitiveness on the local trade landscape.
The 2011 sales revenue of OÜ TKM Beauty Eesti operating the I.L.U. beauty stores was 3.2 million euros, which
had increased by 43.2% compared to the same period of the previous year. Of this, the sales revenue of the 4th
quarter was 1.2 million euros, which was higher than the revenue of the corresponding period of 2010 by 45.7%.
The net loss suffered by the I.L.U. chain in 2011 was 0.5 million euros, which was 0.1 million euros greater than in
2010 due to the costs of launching a new store. In the 4th quarter, the net loss was 0.03 million euros, dropping by
0.04 million euros compared to the loss of the year 2010. The I.L.U. chain opened its fourth store in September
2010 (located in Kristiine Centre in Tallinn), and its fifth store in April 2011 (located in Ülemiste Centre in Tallinn).
The goal for 2012 is to continue work in finding possibilities for the I.L.U. chain’s expansion and to significantly
increase the chain’s profitability.
Selver supermarkets
The consolidated sales revenue of the supermarket business segment in 2011 and its sales revenue in Estonia
were 317.9 million euros, which means an increase of 2.9% compared to the period of a year before. The
consolidated sales revenue of the 4th quarter and the sales revenue in Estonia were 83.0 million euros, having
grown by 1.8% compared to the same period of the previous year. The monthly average sales revenue of goods
per one square metre of selling space in 2011 was 0.37 thousand euros, displaying a yearly growth of 3.2% in the
consolidated view and 2.8% in the view of the Estonian market. In the 4th quarter, the average sales revenue of
goods per one square metre of selling space was 0.39 thousand euros, thus showing a growth of 2.8% both in the
view of consolidated data and in the view of the Estonian market. The sales revenue per a square metre of selling
space in comparable stores was an average of 0.38 thousand euros in 2011 and 0.40 thousand euros in the 4th
quarter, having increased by 3.7% and 3.8%, respectively.
The increase in Selver’s sales revenue is the result of continuously successful sales campaigns, which meet the
target customers’ expectations, and the good sales of the holiday season in December. In addition, the constant
work done to adjust the selection of goods according to changes in demand, and to ensure the availability of goods.
The growth of the sales revenue of goods is influenced by the general rise in the prices of food products in Estonia,
which has resulted in a decline of bulk sales. Since October, the increase in consumer prices has slowed down and
a growth in bulk sales can be detected. Compared to last year, the increase in the sales revenue has been
negatively influenced by the continued intense competition on the retail business market and the sales tax levied in
Tallinn. In addition, the sales revenue was affected by the closing of the now renovated stores for a period of repair
works lasting 2–4 weeks. In 2011, people made 33.1 million purchases from the Selvers located in Estonia – 0.6%
less than the number of purchases made the year before. Selver’s share among the retail sales of the republic’s
unspecialised stores, which are dominated by food products, beverages, and tobacco products, was 17.5% in the
year 2011.
The consolidated pre-tax profit of the supermarket segment in 2011 was 14.1 million euros, which means a growth
of 4.7 million euros, i.e. 50.7% compared to 2010. The consolidated net profit in 2011 was 11.0 million euros, thus
displaying an increase of 2.1 million euros, i.e. 24.2% compared to the period of a year before. The consolidated
pre-tax and net profit in the 4th quarter was 4.4 million euros, having increased by 1.0 million euros, i.e. 30.2%
compared to the year before.
The pre-tax profit earned in Estonia in the year 2011 was 16.4 million euros, 5.0 million euros of which was
generated in the last quarter. Compared to last year’s periods, profits grew by 32.9% and 21.6%, respectively. The
net profit generated by supermarkets in Estonia in 2011 was 13.4 million euros, which means the profit grew by
12.5% in a year. The substantial difference between the growths of the pre-tax profit and net profit was caused by
the income tax paid on dividends, which was 6.7 times greater than the income tax of a year before.
Tallinna Kaubamaja AS
Consolidated Interim Report for the fourth quarter and twelve months 2011 (unaudited)
9
The increase in the profit earned in Estonia was chiefly caused by the revision of the employees' work processes
and the implementation of a multifunctional work organisation – as a result, labour efficiency was enhanced and
labour costs decreased by 8.4% in the view of the year. Throughout the year, constant attention has been paid to
the efficiency of operational expenditure. In addition, a drop in depreciation costs had a significant impact on the
profit formation.
Due to the closing of Latvian stores, no sales revenue from goods was generated in Latvia in 2011. The total sales
revenue of Selver in Latvia was 1.7 thousand euros in 2011 and 31.5 thousand euros in 2010. The loss sustained
by SIA Selver Latvia in 2011 was 2.3 million euros, having decreased by 0.7 million euros compared to the previous
year. The loss incurred in the 4th quarter was 0.6 million euros, having decreased by 0.1 million euros compared to
the same period of the year before. Economic activities in Latvia have been brought to a halt.
In the year 2011, Selver renovated four stores – Kadaka in Tallinn, Mai in Pärnu, Männimäe in Viljandi and Vilja in
Võru. The renewed Kadaka Selver was opened in April, while the other stores were renovated in the 4th quarter.
The renovation of the stores was guided by Selver’s new sales area concept, which was developed in 2011. In
addition, the SelveEkspress purchase system, which is innovative in Estonia, was introduced at the Kadaka Selver.
In July, Selver closed the Soldino Selver in Narva due to the store’s unsatisfactory profitability. At the moment,
Selver is continuing business in Narva with one store. 2012 is envisaged to be the year of Selver’s active
expansion. In January, lease contracts for three new stores were entered into. The first new store to be opened in
May is the Saku Selver, which will have 1,764 square metres of selling space and will employ 39 people. In the
Rapla Selver to be opened in November, the size of the sales area is planned to be 1,630 square metres, and the
store will provide jobs for 45 people. At the moment, Rapla County is also the only county where Selver has not
been represented so far. In mid-December, a Selver store will be opened in Tartu, Vahi quarter. The size of its
sales area will be 1,010 square metres and the store will provide work for 30 people. According to plans, in 2012
Selver will open other new stores in addition to the three referred to. At the end of 2011, Selver’s total selling space
was 69.1 thousand square metres and Selver stores employed 2,269 people.
Real Estate
The external sales revenue of the real estate business segment for 2011 was 2.8 million euros, having increased by
1.1% compared to the previous year. The sales revenue of the 4th quarter of the accounting year was 0.7 million
euros, exceeding the result of the 4th quarter of 2010 by 6.6%.
The profit earned in the segment in 2011 was 6.6 million euros, which remained on the same level as in 2010. In
the 4th quarter, the segment achieved a profit of 1.5 million euros, which was 12.0% lower than the profit of the 4th
quarter of the previous year due to an increase in the intra-group financial costs at the end of the year.
Car Trade
In 2011, the car trade segment experienced substantial growth, although the sales of new cars in the Baltics are yet
to reach the pre-crisis level. The segment’s sales revenue without inter-segment transactions was 20.8 million
euros, exceeding the sales revenue of the same period of the previous year by 60.9%. The sales revenue of the 4th
quarter, which was 6.6 million euros, was 89.0% greater than the sales revenue of a year earlier. Thanks to strong
sales results, the 2011 profit of the car trade segment was 1.3 million euros, and thus exceeded the result of a year
before by nearly five times. In the 4th quarter, the car segment earned a profit of 0.3 million euros. The profit of the
last quarter of 2010 was 0.1 million euros.
Thanks to an advantageous market and the addition of new models, the vehicle trade segment underwent a
significant increase in 2011. In a year, a total of 1,128 new cars were sold – of that, 370 vehicles were sold in the
4th quarter. Compared to a year before, the growths were 56% and 71%, respectively. The profit increase was
chiefly brought about by the successful sales of the new crossover SUV KIA Sportage, which made up 46% of total
sales, but also by the two new models added to the selection – KIA Picanto and KIA Rio. The remarkable growth
was supported by the fact that the entire market for new vehicles in the Baltics was extremely active in 2011,
increasing by nearly 70% during the year. In a year, KIA’s market share went from 2.9% to 3.2%. Substantial
growth is also expected for 2012 thanks to the new generation KIA Cee’d, which will reach the market in spring, and
the mid-range sedan KIA Optima. The growth is sure to be positively influenced by the third shift that started work in
the Slovakia plant – this should considerably improve the availability of the popular crossover SUV KIA Sportage.
Footwear trade
The 2011 sales revenue of the footwear trade segment was 14.0 million euros, thus having grown by 3.9% in a
year. In the 4th quarter, the sales revenue was 4.0 million euros – less by 2.7% than in 2010. The sales results of
the footwear segment in the 4th quarter were influenced by the closing of ineffective stores (compared to the 4th
Tallinna Kaubamaja AS
Consolidated Interim Report for the fourth quarter and twelve months 2011 (unaudited)
10
quarter of 2010, leaving the number of stores smaller by 3; the sales of comparable stores increased by 2.5%), the
closing of the store located in the Pärnu Kaubamajaka centre in connection with the concept renewal, and the
weather, which hindered the sales of winter footwear in October and November. The net loss of 2011 was 0.2
million euros, while the loss of 2010 was 0.5 million euros; thus, losses decreased by 63.0%. In the 4th quarter,
footwear stores achieved a profit of 0.2 million euros, with the profit of the 4th quarter of 2010 also being 0.2 million
euros. The drop in the annual loss was caused by the closing of ineffective stores and a higher gross margin, which
was achieved thanks to improved stock management.
In the beginning of December, the first Shu store was opened in the Pärnu Kaubamajaka centre on the area thus
far rented by ABC King; there are plans to reopen the ABC King store in the Pärnu Kaubamajaka centre in the 2nd
quarter of 2012. At the end of December, Suurtüki NK OÜ owned 14 stores in Estonia, ABC King AS owned 9
stores in Estonia, and ABC King SIA owned 3 stores in Latvia. After the balance sheet date, the Nero store
(operated by SIA ABC King) in Riga in the Galerija Centrs centre was closed on 20 January 2012.
Personnel
In 2011, the average number of employees in the Tallinna Kaubamaja Group was 3,059, which means a decrease
of 3.9% compared to 2010. Total labour costs (wages and social tax) in 2011 were 34.1 million euros, decreasing
by 1.8% compared to the previous year. In the 4th quarter, labour costs increased by 6.9% compared to a year
before; the average number of employees decreased by 0.1% in the 4th quarter. The labour costs of the 4th quarter
were increased due to the fact that the performance pay paid to employees for good economic results were
recorded in the costs of the last quarter. The monthly average wage cost per employee had increased during the
year – a total of 2.4% compared to the average wages of 2010.
Approval of the chairman of the management board and signature to the report
The chairman of the management board confirms that the management report gives a true and fair overview of the most important events during the reporting period and their effects on the accounting report; it includes a description of the main risks and uncertainties during the remaining financial year and expresses the relevant contracts with partners.
__________________________
Raul Puusepp
Chairman of the Management Board
Tallinn, 15th
February 2012
Tallinna Kaubamaja AS
Consolidated Interim Report for the fourth quarter and twelve months 2011 (unaudited)
11
CONSOLIDATED FINANCIAL STATEMENTS
MANAGEMENT BOARD’S CONFIRMATION TO THE CONSOLIDATED FINANCIAL STATEMENTS
The Chairman of the Management Board confirms the correctness and completeness of Tallinna Kaubamaja AS consolidated interim financial statements (unaudited) as at and for the period of fourth quarter and twelve months 2011, presented on pages 11 to 30.
The Chairman of the Management Board confirms that:
1. the accounting principles used in preparing the financial statements are in compliance with the International Financial Reporting Standards;
2. the financial statements give a true and fair view of the financial position of the parent company and the group, as well as the results of their operations and cash flows;
3. Tallinna Kaubamaja AS and its subsidiaries are able to continue as a going concern.
__________________________
Raul Puusepp
Chairman of the Management Board
Tallinn, 15th
February 2012
Tallinna Kaubamaja AS
Consolidated Interim Report for the fourth quarter and twelve months 2011 (unaudited)
12
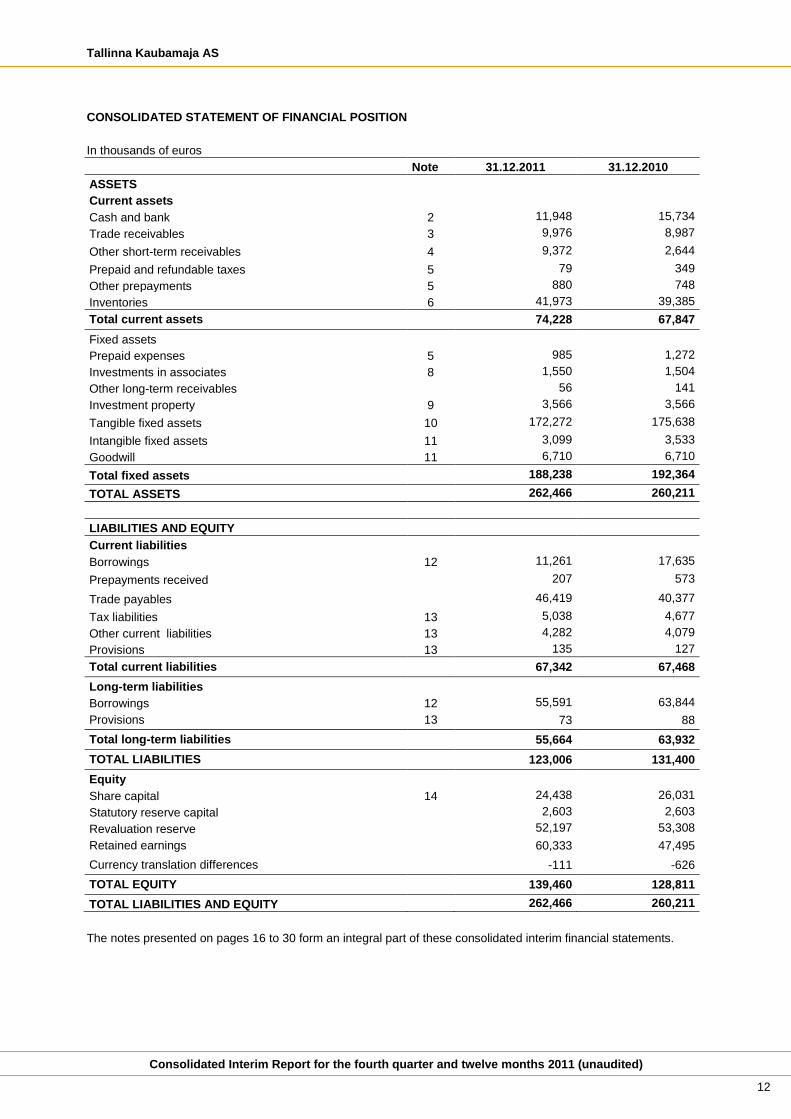
CONSOLIDATED STATEMENT OF FINANCIAL POSITION
In thousands of euros
Note 31.12.2011 31.12.2010
ASSETS
Current assets
Cash and bank 2 11,948 15,734
Trade receivables 3 9,976 8,987
Other short-term receivables 4 9,372 2,644
Prepaid and refundable taxes 5 79 349
Other prepayments 5 880 748
Inventories 6 41,973 39,385
Total current assets 74,228 67,847
Fixed assets
Prepaid expenses 5 985 1,272
Investments in associates 8 1,550 1,504
Other long-term receivables 56 141
Investment property 9 3,566 3,566
Tangible fixed assets 10 172,272 175,638
Intangible fixed assets 11 3,099 3,533
Goodwill 11 6,710 6,710
Total fixed assets 188,238 192,364
TOTAL ASSETS 262,466 260,211
LIABILITIES AND EQUITY
Current liabilities
Borrowings 12 11,261 17,635
Prepayments received 207 573
Trade payables 46,419 40,377
Tax liabilities 13 5,038 4,677
Other current liabilities 13 4,282 4,079
Provisions 13 135 127
Total current liabilities 67,342 67,468
Long-term liabilities
Borrowings 12 55,591 63,844
Provisions 13 73 88
Total long-term liabilities 55,664 63,932
TOTAL LIABILITIES 123,006 131,400
Equity
Share capital 14 24,438 26,031
Statutory reserve capital 2,603 2,603
Revaluation reserve 52,197 53,308
Retained earnings 60,333 47,495
Currency translation differences -111 -626
TOTAL EQUITY 139,460 128,811
TOTAL LIABILITIES AND EQUITY 262,466 260,211
The notes presented on pages 16 to 30 form an integral part of these consolidated interim financial statements.
Tallinna Kaubamaja AS
Consolidated Interim Report for the fourth quarter and twelve months 2011 (unaudited)
13
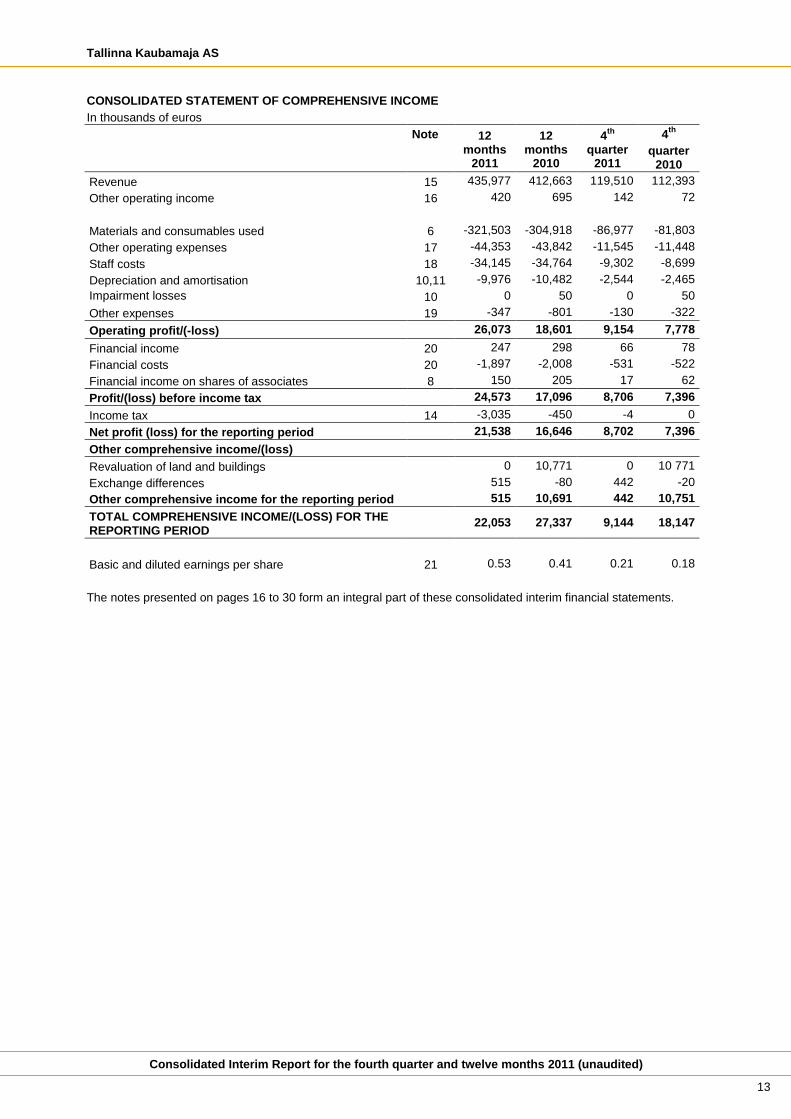
CONSOLIDATED STATEMENT OF COMPREHENSIVE INCOME
In thousands of euros
Note 12 months
2011
12 months
2010
4th
quarter
2011
4th
quarter 2010
Revenue 15 435,977 412,663 119,510 112,393
Other operating income 16 420 695 142 72
Materials and consumables used 6 -321,503 -304,918 -86,977 -81,803
Other operating expenses 17 -44,353 -43,842 -11,545 -11,448
Staff costs 18 -34,145 -34,764 -9,302 -8,699
Depreciation and amortisation 10,11 -9,976 -10,482 -2,544 -2,465
Impairment losses 10 0 50 0 50
Other expenses 19 -347 -801 -130 -322
Operating profit/(-loss) 26,073 18,601 9,154 7,778
Financial income 20 247 298 66 78
Financial costs 20 -1,897 -2,008 -531 -522
Financial income on shares of associates 8 150 205 17 62
Profit/(loss) before income tax 24,573 17,096 8,706 7,396
Income tax 14 -3,035 -450 -4 0
Net profit (loss) for the reporting period 21,538 16,646 8,702 7,396
Other comprehensive income/(loss)
Revaluation of land and buildings 0 10,771 0 10 771
Exchange differences 515 -80 442 -20
Other comprehensive income for the reporting period 515 10,691 442 10,751
TOTAL COMPREHENSIVE INCOME/(LOSS) FOR THE REPORTING PERIOD
22,053 27,337 9,144 18,147
Basic and diluted earnings per share 21 0.53 0.41 0.21 0.18
The notes presented on pages 16 to 30 form an integral part of these consolidated interim financial statements.
Tallinna Kaubamaja AS
Consolidated Interim Report for the fourth quarter and twelve months 2011 (unaudited)
14
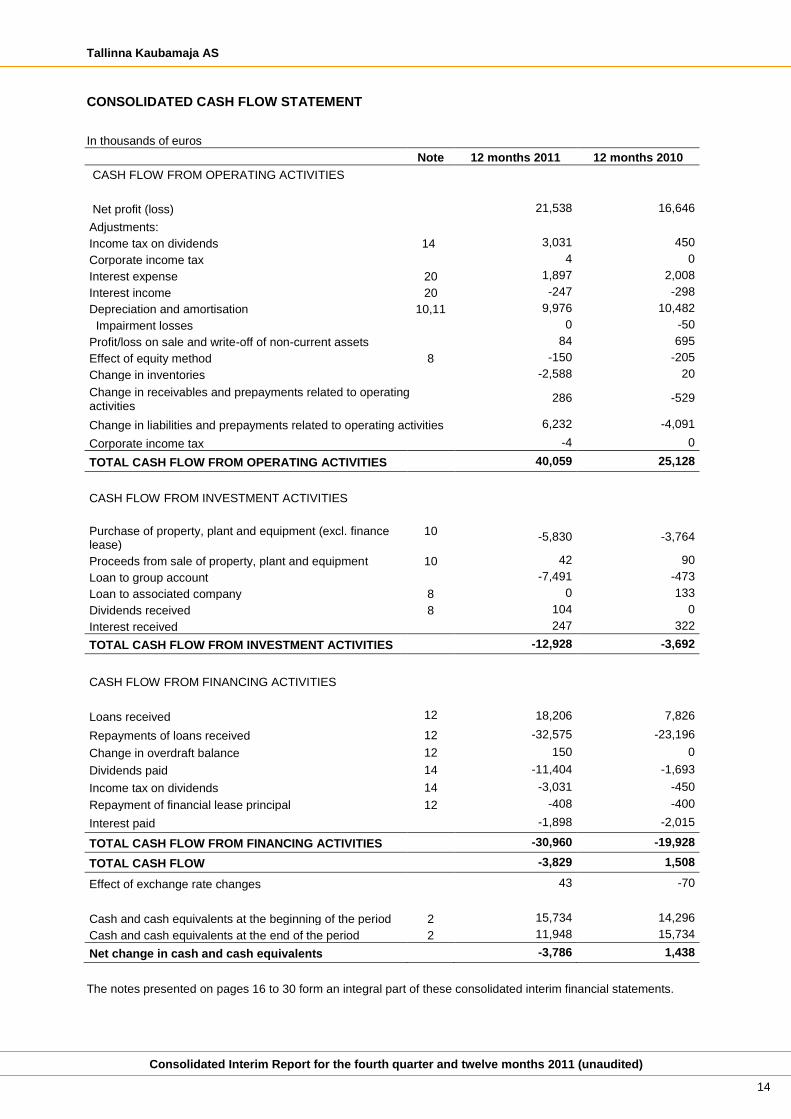
CONSOLIDATED CASH FLOW STATEMENT
In thousands of euros
Note 12 months 2011 12 months 2010
CASH FLOW FROM OPERATING ACTIVITIES
Net profit (loss) 21,538 16,646
Adjustments:
Income tax on dividends 14 3,031 450
Corporate income tax 4 0
Interest expense 20 1,897 2,008
Interest income 20 -247 -298
Depreciation and amortisation 10,11 9,976 10,482
Impairment losses 0 -50
Profit/loss on sale and write-off of non-current assets 84 695
Effect of equity method 8 -150 -205
Change in inventories -2,588 20
Change in receivables and prepayments related to operating activities
286 -529
Change in liabilities and prepayments related to operating activities 6,232 -4,091
Corporate income tax -4 0
TOTAL CASH FLOW FROM OPERATING ACTIVITIES 40,059 25,128
CASH FLOW FROM INVESTMENT ACTIVITIES
Purchase of property, plant and equipment (excl. finance lease)
10 -5,830 -3,764
Proceeds from sale of property, plant and equipment 10 42 90
Loan to group account -7,491 -473
Loan to associated company 8 0 133
Dividends received 8 104 0
Interest received 247 322
TOTAL CASH FLOW FROM INVESTMENT ACTIVITIES -12,928 -3,692
CASH FLOW FROM FINANCING ACTIVITIES
Loans received 12 18,206 7,826
Repayments of loans received 12 -32,575 -23,196
Change in overdraft balance 12 150 0
Dividends paid 14 -11,404 -1,693
Income tax on dividends 14 -3,031 -450
Repayment of financial lease principal 12 -408 -400
Interest paid -1,898 -2,015
TOTAL CASH FLOW FROM FINANCING ACTIVITIES -30,960 -19,928
TOTAL CASH FLOW -3,829 1,508
Effect of exchange rate changes 43 -70
Cash and cash equivalents at the beginning of the period 2 15,734 14,296
Cash and cash equivalents at the end of the period 2 11,948 15,734
Net change in cash and cash equivalents -3,786 1,438
The notes presented on pages 16 to 30 form an integral part of these consolidated interim financial statements.
Tallinna Kaubamaja AS
Consolidated Interim Report for the fourth quarter and twelve months 2011 (unaudited)
15
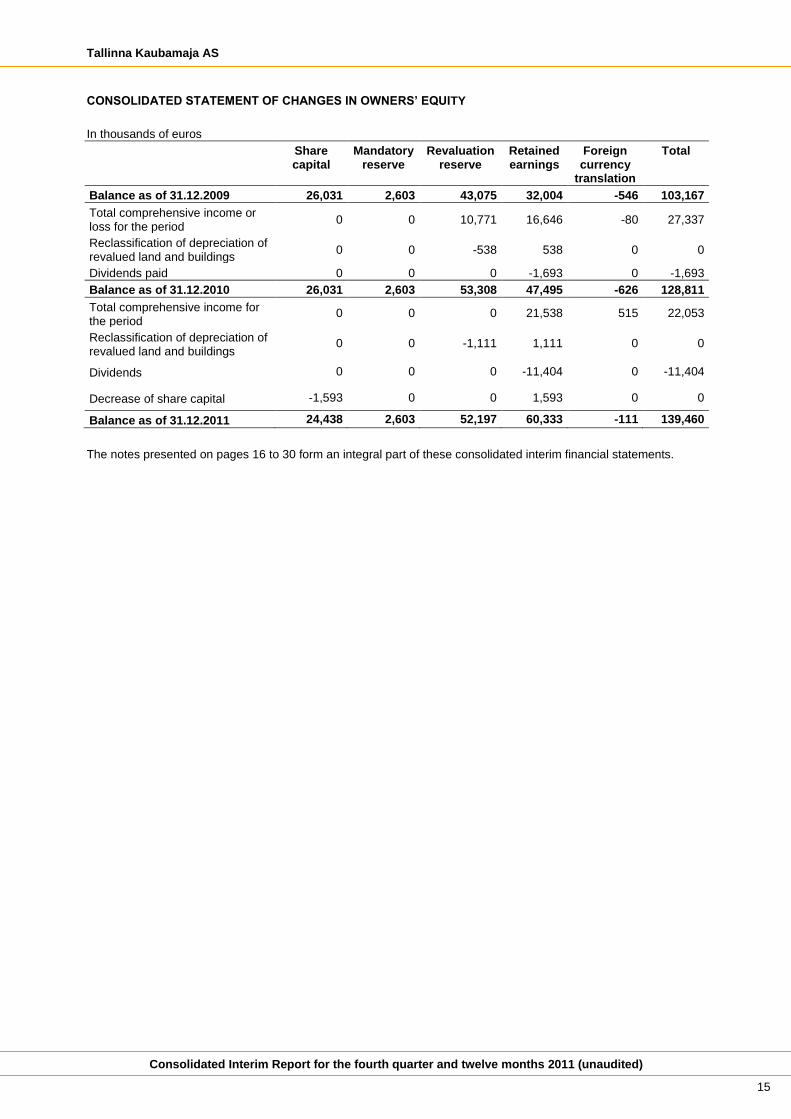
CONSOLIDATED STATEMENT OF CHANGES IN OWNERS’ EQUITY
In thousands of euros
Share capital
Mandatory reserve
Revaluation reserve
Retained earnings
Foreign currency
translation
Total
Balance as of 31.12.2009 26,031 2,603 43,075 32,004 -546 103,167
Total comprehensive income or loss for the period
0 0 10,771 16,646 -80 27,337
Reclassification of depreciation of revalued land and buildings
0 0 -538 538 0 0
Dividends paid 0 0 0 -1,693 0 -1,693
Balance as of 31.12.2010 26,031 2,603 53,308 47,495 -626 128,811
Total comprehensive income for the period
0 0 0 21,538 515 22,053
Reclassification of depreciation of revalued land and buildings
0 0 -1,111 1,111 0 0
Dividends 0 0 0 -11,404 0 -11,404
Decrease of share capital -1,593 0 0 1,593 0 0
Balance as of 31.12.2011 24,438 2,603 52,197 60,333 -111 139,460
The notes presented on pages 16 to 30 form an integral part of these consolidated interim financial statements.
Tallinna Kaubamaja AS
Consolidated Interim Report for the fourth quarter and twelve months 2011 (unaudited)
16
NOTES TO THE CONSOLIDATED INTERIM ACCOUNTS
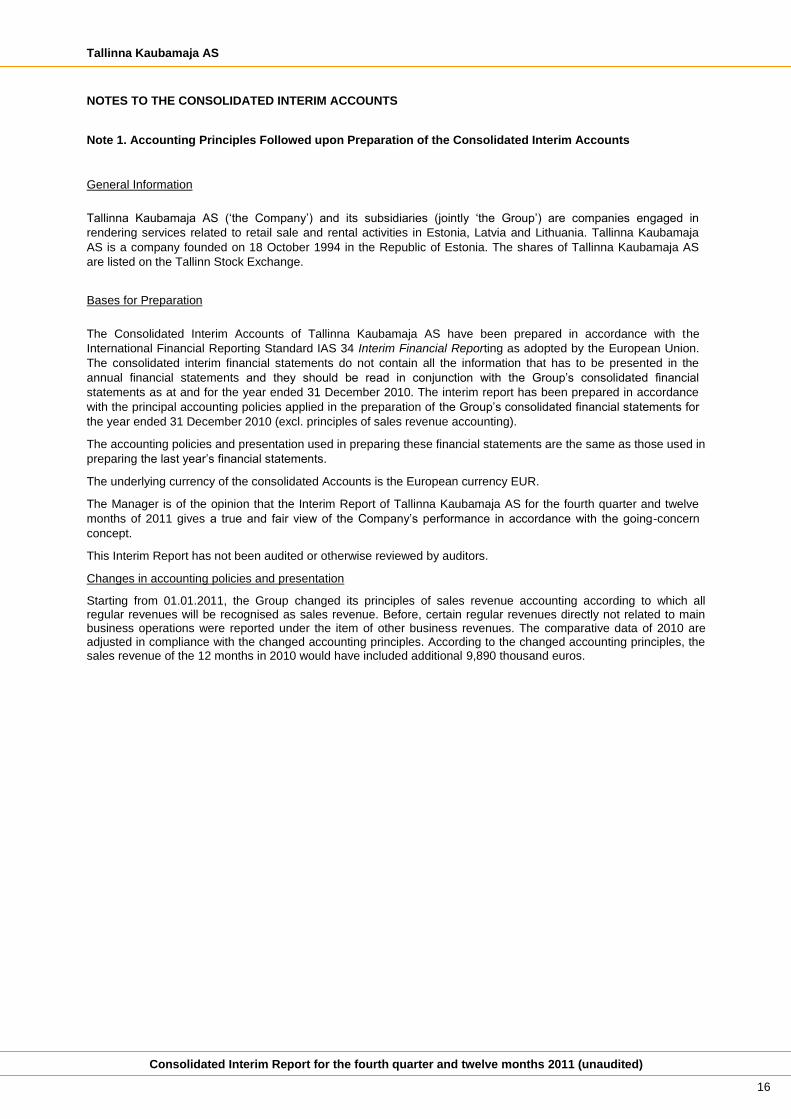
Note 1. Accounting Principles Followed upon Preparation of the Consolidated Interim Accounts
General Information
Tallinna Kaubamaja AS (‘the Company’) and its subsidiaries (jointly ‘the Group’) are companies engaged in
rendering services related to retail sale and rental activities in Estonia, Latvia and Lithuania. Tallinna Kaubamaja
AS is a company founded on 18 October 1994 in the Republic of Estonia. The shares of Tallinna Kaubamaja AS
are listed on the Tallinn Stock Exchange.
Bases for Preparation
The Consolidated Interim Accounts of Tallinna Kaubamaja AS have been prepared in accordance with the
International Financial Reporting Standard IAS 34 Interim Financial Reporting as adopted by the European Union.
The consolidated interim financial statements do not contain all the information that has to be presented in the
annual financial statements and they should be read in conjunction with the Group’s consolidated financial
statements as at and for the year ended 31 December 2010. The interim report has been prepared in accordance
with the principal accounting policies applied in the preparation of the Group’s consolidated financial statements for
the year ended 31 December 2010 (excl. principles of sales revenue accounting).
The accounting policies and presentation used in preparing these financial statements are the same as those used in
preparing the last year’s financial statements.
The underlying currency of the consolidated Accounts is the European currency EUR.
The Manager is of the opinion that the Interim Report of Tallinna Kaubamaja AS for the fourth quarter and twelve
months of 2011 gives a true and fair view of the Company’s performance in accordance with the going-concern
concept.
This Interim Report has not been audited or otherwise reviewed by auditors.
Changes in accounting policies and presentation
Starting from 01.01.2011, the Group changed its principles of sales revenue accounting according to which all regular revenues will be recognised as sales revenue. Before, certain regular revenues directly not related to main business operations were reported under the item of other business revenues. The comparative data of 2010 are adjusted in compliance with the changed accounting principles. According to the changed accounting principles, the sales revenue of the 12 months in 2010 would have included additional 9,890 thousand euros.
Tallinna Kaubamaja AS
Consolidated Interim Report for the fourth quarter and twelve months 2011 (unaudited)
17
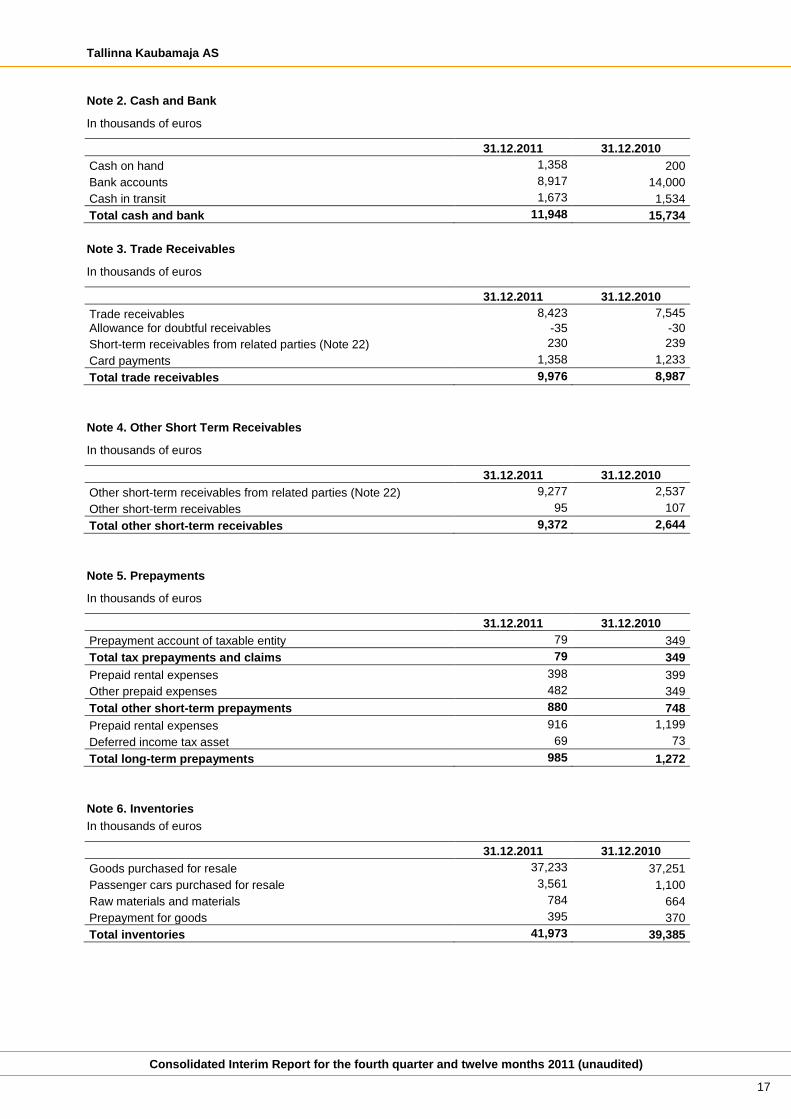
Note 2. Cash and Bank
In thousands of euros
31.12.2011 31.12.2010
Cash on hand 1,358 200
Bank accounts 8,917 14,000
Cash in transit 1,673 1,534
Total cash and bank 11,948 15,734
Note 3. Trade Receivables
In thousands of euros
31.12.2011 31.12.2010
Trade receivables 8,423 7,545
Allowance for doubtful receivables -35 -30
Short-term receivables from related parties (Note 22) 230 239
Card payments 1,358 1,233
Total trade receivables 9,976 8,987
Note 4. Other Short Term Receivables
In thousands of euros
31.12.2011 31.12.2010
Other short-term receivables from related parties (Note 22) 9,277 2,537
Other short-term receivables 95 107
Total other short-term receivables 9,372 2,644
Note 5. Prepayments
In thousands of euros
31.12.2011 31.12.2010
Prepayment account of taxable entity 79 349
Total tax prepayments and claims 79 349
Prepaid rental expenses 398 399
Other prepaid expenses 482 349
Total other short-term prepayments 880 748
Prepaid rental expenses 916 1,199
Deferred income tax asset 69 73
Total long-term prepayments 985 1,272
Note 6. Inventories
In thousands of euros
31.12.2011 31.12.2010
Goods purchased for resale 37,233 37,251
Passenger cars purchased for resale 3,561 1,100
Raw materials and materials 784 664
Prepayment for goods 395 370
Total inventories 41,973 39,385
Tallinna Kaubamaja AS
Consolidated Interim Report for the fourth quarter and twelve months 2011 (unaudited)
18
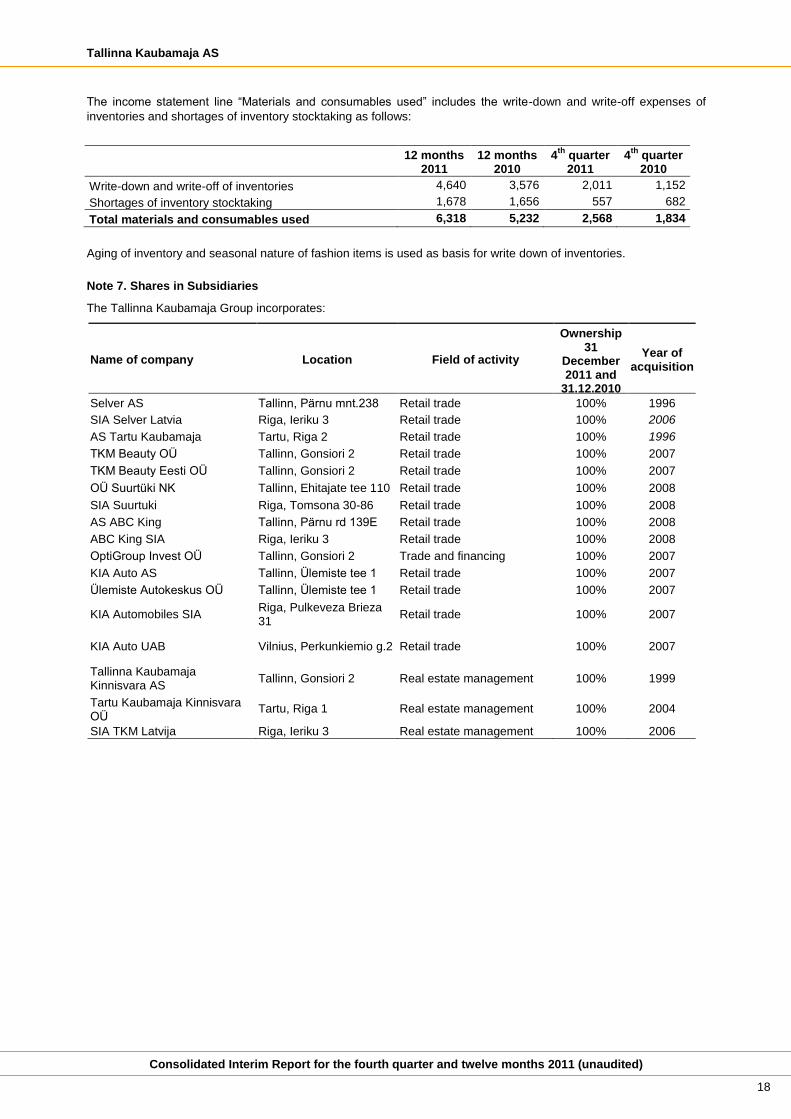
The income statement line “Materials and consumables used” includes the write-down and write-off expenses of
inventories and shortages of inventory stocktaking as follows:
12 months 2011
12 months 2010
4th
quarter 2011
4th
quarter 2010
Write-down and write-off of inventories 4,640 3,576 2,011 1,152
Shortages of inventory stocktaking 1,678 1,656 557 682
Total materials and consumables used 6,318 5,232 2,568 1,834
Aging of inventory and seasonal nature of fashion items is used as basis for write down of inventories.
Note 7. Shares in Subsidiaries
The Tallinna Kaubamaja Group incorporates:
Name of company Location Field of activity
Ownership 31
December 2011 and
31.12.2010
Year of acquisition
Selver AS Tallinn, Pärnu mnt.238 Retail trade 100% 1996
SIA Selver Latvia Riga, Ieriku 3 Retail trade 100% 2006
AS Tartu Kaubamaja Tartu, Riga 2 Retail trade 100% 1996
TKM Beauty OÜ Tallinn, Gonsiori 2 Retail trade 100% 2007
TKM Beauty Eesti OÜ Tallinn, Gonsiori 2 Retail trade 100% 2007
OÜ Suurtüki NK Tallinn, Ehitajate tee 110 Retail trade 100% 2008
SIA Suurtuki Riga, Tomsona 30-86 Retail trade 100% 2008
AS ABC King Tallinn, Pärnu rd 139E Retail trade 100% 2008
ABC King SIA Riga, Ieriku 3 Retail trade 100% 2008
OptiGroup Invest OÜ Tallinn, Gonsiori 2 Trade and financing 100% 2007
KIA Auto AS Tallinn, Ülemiste tee 1 Retail trade 100% 2007
Ülemiste Autokeskus OÜ Tallinn, Ülemiste tee 1 Retail trade 100% 2007
KIA Automobiles SIA Riga, Pulkeveza Brieza 31
Retail trade 100% 2007
KIA Auto UAB Vilnius, Perkunkiemio g.2 Retail trade 100% 2007
Tallinna Kaubamaja Kinnisvara AS
Tallinn, Gonsiori 2 Real estate management 100% 1999
Tartu Kaubamaja Kinnisvara OÜ
Tartu, Riga 1 Real estate management 100% 2004
SIA TKM Latvija Riga, Ieriku 3 Real estate management 100% 2006
Tallinna Kaubamaja AS
Consolidated Interim Report for the fourth quarter and twelve months 2011 (unaudited)
19
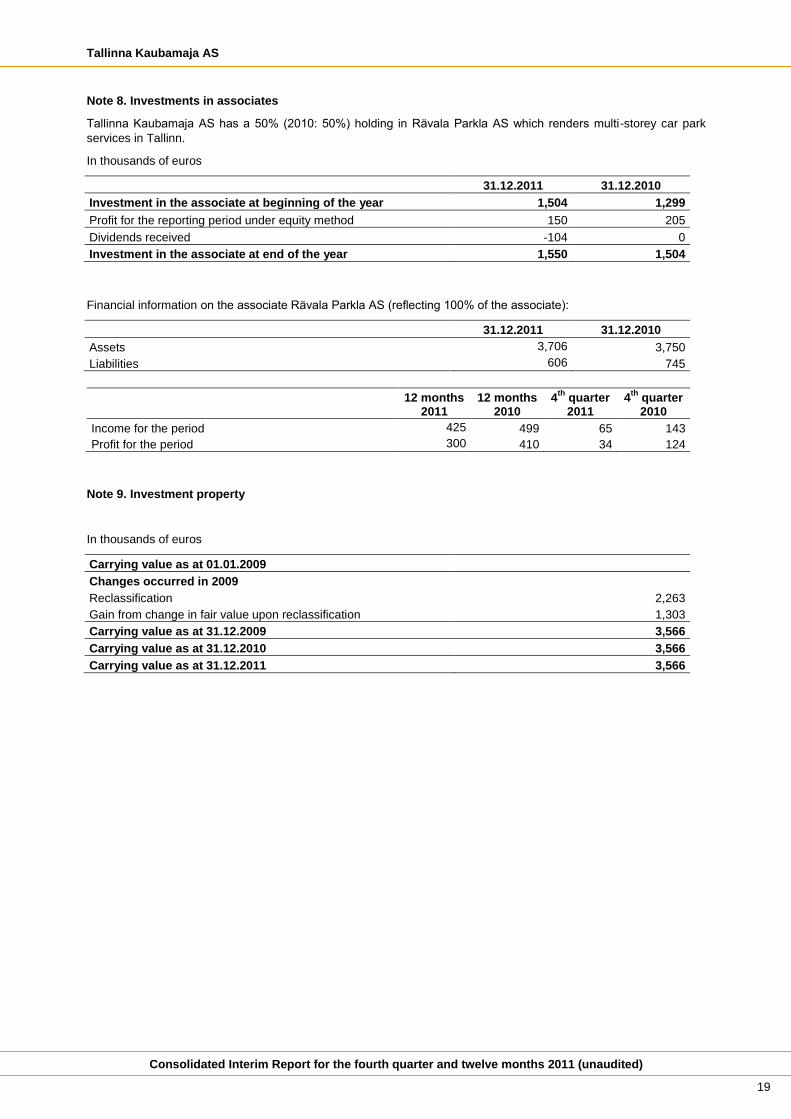
Note 8. Investments in associates
Tallinna Kaubamaja AS has a 50% (2010: 50%) holding in Rävala Parkla AS which renders multi-storey car park
services in Tallinn.
In thousands of euros
31.12.2011 31.12.2010
Investment in the associate at beginning of the year 1,504 1,299
Profit for the reporting period under equity method 150 205
Dividends received -104 0
Investment in the associate at end of the year 1,550 1,504
Financial information on the associate Rävala Parkla AS (reflecting 100% of the associate):
31.12.2011 31.12.2010
Assets 3,706 3,750
Liabilities 606 745
12 months 2011
12 months 2010
4th
quarter 2011
4th
quarter 2010
Income for the period 425 499 65 143
Profit for the period 300 410 34 124
Note 9. Investment property
In thousands of euros
Carrying value as at 01.01.2009
Changes occurred in 2009
Reclassification 2,263
Gain from change in fair value upon reclassification 1,303
Carrying value as at 31.12.2009 3,566
Carrying value as at 31.12.2010 3,566
Carrying value as at 31.12.2011 3,566
Tallinna Kaubamaja AS
Consolidated Interim Report for the fourth quarter and twelve months 2011 (unaudited)
20
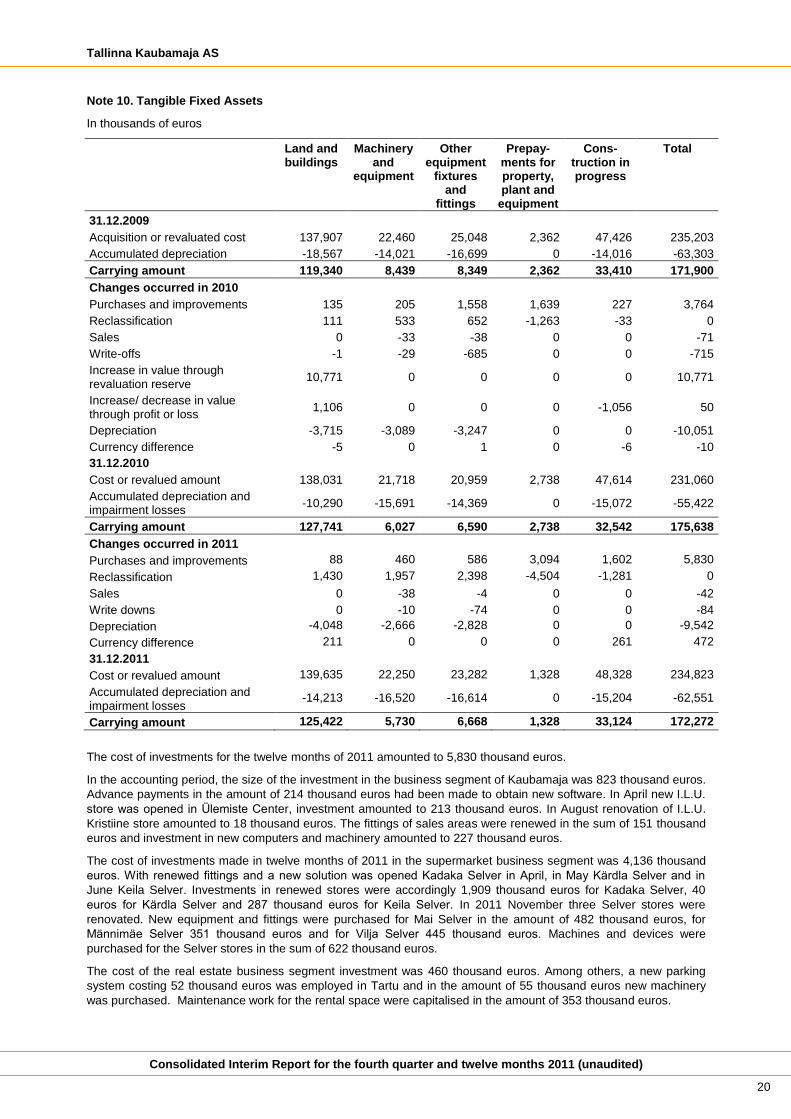
Note 10. Tangible Fixed Assets
In thousands of euros
Land and buildings
Machinery and
equipment
Other equipment
fixtures and
fittings
Prepay-ments for property, plant and
equipment
Cons-truction in progress
Total
31.12.2009
Acquisition or revaluated cost 137,907 22,460 25,048 2,362 47,426 235,203
Accumulated depreciation -18,567 -14,021 -16,699 0 -14,016 -63,303
Carrying amount 119,340 8,439 8,349 2,362 33,410 171,900
Changes occurred in 2010
Purchases and improvements 135 205 1,558 1,639 227 3,764
Reclassification 111 533 652 -1,263 -33 0
Sales 0 -33 -38 0 0 -71
Write-offs -1 -29 -685 0 0 -715
Increase in value through revaluation reserve
10,771 0 0 0 0 10,771
Increase/ decrease in value through profit or loss
1,106 0 0 0 -1,056 50
Depreciation -3,715 -3,089 -3,247 0 0 -10,051
Currency difference -5 0 1 0 -6 -10
31.12.2010
Cost or revalued amount 138,031 21,718 20,959 2,738 47,614 231,060
Accumulated depreciation and impairment losses
-10,290 -15,691 -14,369 0 -15,072 -55,422
Carrying amount 127,741 6,027 6,590 2,738 32,542 175,638
Changes occurred in 2011
Purchases and improvements 88 460 586 3,094 1,602 5,830
Reclassification 1,430 1,957 2,398 -4,504 -1,281 0
Sales 0 -38 -4 0 0 -42
Write downs 0 -10 -74 0 0 -84
Depreciation -4,048 -2,666 -2,828 0 0 -9,542
Currency difference 211 0 0 0 261 472
31.12.2011
Cost or revalued amount 139,635 22,250 23,282 1,328 48,328 234,823
Accumulated depreciation and impairment losses
-14,213 -16,520 -16,614 0 -15,204 -62,551
Carrying amount 125,422 5,730 6,668 1,328 33,124 172,272
The cost of investments for the twelve months of 2011 amounted to 5,830 thousand euros.
In the accounting period, the size of the investment in the business segment of Kaubamaja was 823 thousand euros.
Advance payments in the amount of 214 thousand euros had been made to obtain new software. In April new I.L.U.
store was opened in Ülemiste Center, investment amounted to 213 thousand euros. In August renovation of I.L.U.
Kristiine store amounted to 18 thousand euros. The fittings of sales areas were renewed in the sum of 151 thousand
euros and investment in new computers and machinery amounted to 227 thousand euros.
The cost of investments made in twelve months of 2011 in the supermarket business segment was 4,136 thousand
euros. With renewed fittings and a new solution was opened Kadaka Selver in April, in May Kärdla Selver and in
June Keila Selver. Investments in renewed stores were accordingly 1,909 thousand euros for Kadaka Selver, 40
euros for Kärdla Selver and 287 thousand euros for Keila Selver. In 2011 November three Selver stores were
renovated. New equipment and fittings were purchased for Mai Selver in the amount of 482 thousand euros, for
Männimäe Selver 351 thousand euros and for Vilja Selver 445 thousand euros. Machines and devices were
purchased for the Selver stores in the sum of 622 thousand euros.
The cost of the real estate business segment investment was 460 thousand euros. Among others, a new parking
system costing 52 thousand euros was employed in Tartu and in the amount of 55 thousand euros new machinery
was purchased. Maintenance work for the rental space were capitalised in the amount of 353 thousand euros.
Tallinna Kaubamaja AS
Consolidated Interim Report for the fourth quarter and twelve months 2011 (unaudited)
21
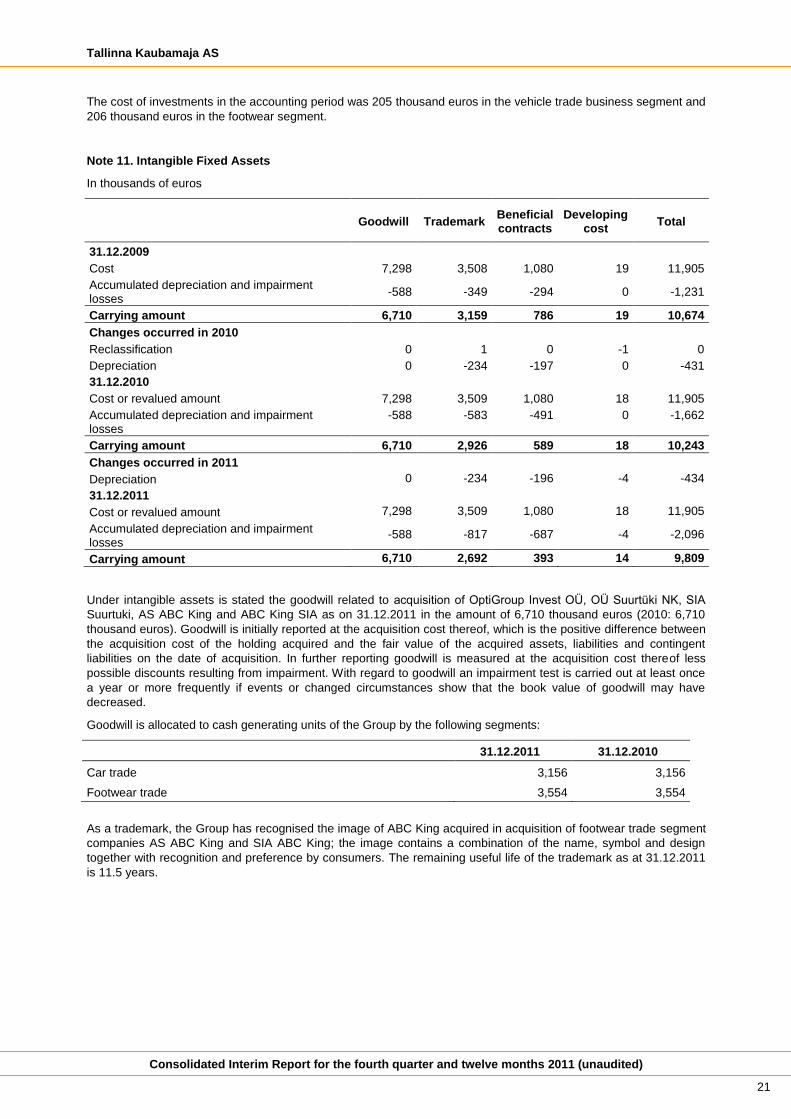
The cost of investments in the accounting period was 205 thousand euros in the vehicle trade business segment and
206 thousand euros in the footwear segment.
Note 11. Intangible Fixed Assets
In thousands of euros
Goodwill Trademark Beneficial contracts
Developing cost
Total
31.12.2009
Cost 7,298 3,508 1,080 19 11,905
Accumulated depreciation and impairment losses
-588 -349 -294 0 -1,231
Carrying amount 6,710 3,159 786 19 10,674
Changes occurred in 2010
Reclassification 0 1 0 -1 0
Depreciation 0 -234 -197 0 -431
31.12.2010
Cost or revalued amount 7,298 3,509 1,080 18 11,905
Accumulated depreciation and impairment losses
-588 -583 -491 0 -1,662
Carrying amount 6,710 2,926 589 18 10,243
Changes occurred in 2011
Depreciation 0 -234 -196 -4 -434
31.12.2011
Cost or revalued amount 7,298 3,509 1,080 18 11,905
Accumulated depreciation and impairment losses
-588 -817 -687 -4 -2,096
Carrying amount 6,710 2,692 393 14 9,809
Under intangible assets is stated the goodwill related to acquisition of OptiGroup Invest OÜ, OÜ Suurtüki NK, SIA
Suurtuki, AS ABC King and ABC King SIA as on 31.12.2011 in the amount of 6,710 thousand euros (2010: 6,710
thousand euros). Goodwill is initially reported at the acquisition cost thereof, which is the positive difference between
the acquisition cost of the holding acquired and the fair value of the acquired assets, liabilities and contingent
liabilities on the date of acquisition. In further reporting goodwill is measured at the acquisition cost thereof less
possible discounts resulting from impairment. With regard to goodwill an impairment test is carried out at least once
a year or more frequently if events or changed circumstances show that the book value of goodwill may have
decreased.
Goodwill is allocated to cash generating units of the Group by the following segments:
31.12.2011 31.12.2010
Car trade 3,156 3,156
Footwear trade 3,554 3,554
As a trademark, the Group has recognised the image of ABC King acquired in acquisition of footwear trade segment
companies AS ABC King and SIA ABC King; the image contains a combination of the name, symbol and design
together with recognition and preference by consumers. The remaining useful life of the trademark as at 31.12.2011
is 11.5 years.
Tallinna Kaubamaja AS
Consolidated Interim Report for the fourth quarter and twelve months 2011 (unaudited)
22
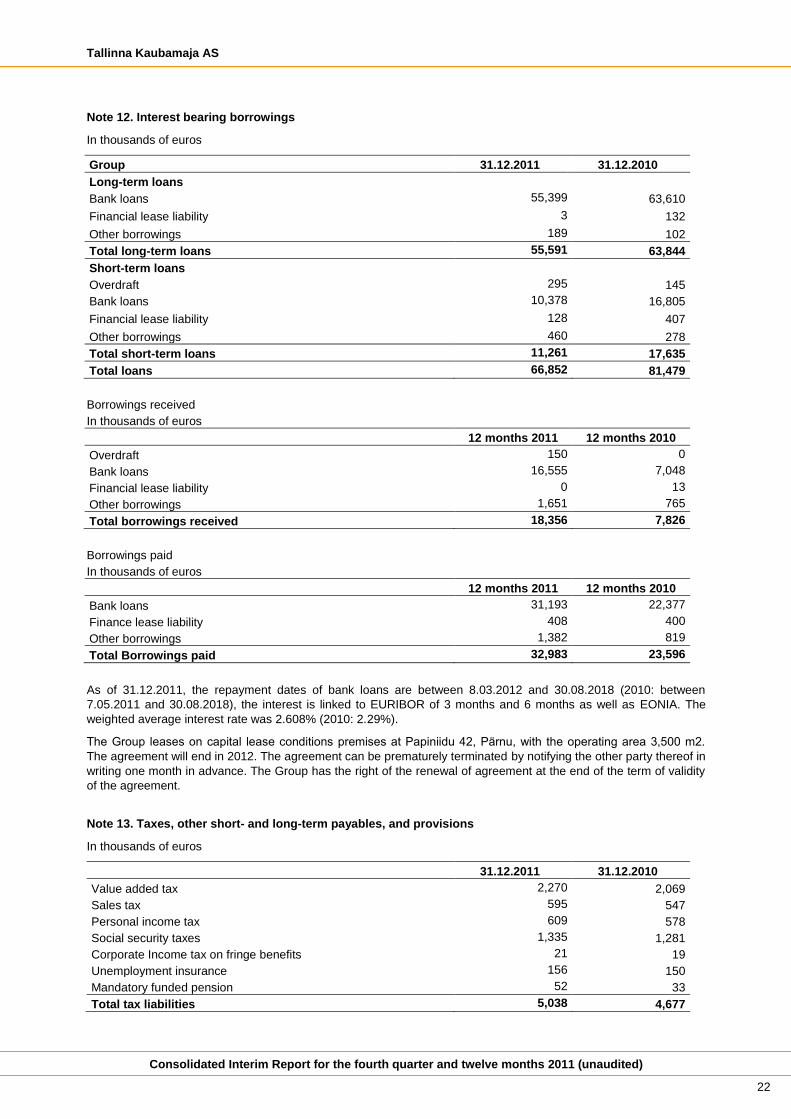
Note 12. Interest bearing borrowings
In thousands of euros
Group 31.12.2011 31.12.2010
Long-term loans
Bank loans 55,399 63,610
Financial lease liability 3 132
Other borrowings 189 102
Total long-term loans 55,591 63,844
Short-term loans
Overdraft 295 145
Bank loans 10,378 16,805
Financial lease liability 128 407
Other borrowings 460 278
Total short-term loans 11,261 17,635
Total loans 66,852 81,479
Borrowings received
In thousands of euros
12 months 2011 12 months 2010
Overdraft 150 0
Bank loans 16,555 7,048
Financial lease liability 0 13
Other borrowings 1,651 765
Total borrowings received 18,356 7,826
Borrowings paid
In thousands of euros
12 months 2011 12 months 2010
Bank loans 31,193 22,377
Finance lease liability 408 400
Other borrowings 1,382 819
Total Borrowings paid 32,983 23,596
As of 31.12.2011, the repayment dates of bank loans are between 8.03.2012 and 30.08.2018 (2010: between
7.05.2011 and 30.08.2018), the interest is linked to EURIBOR of 3 months and 6 months as well as EONIA. The
weighted average interest rate was 2.608% (2010: 2.29%).
The Group leases on capital lease conditions premises at Papiniidu 42, Pärnu, with the operating area 3,500 m2.
The agreement will end in 2012. The agreement can be prematurely terminated by notifying the other party thereof in
writing one month in advance. The Group has the right of the renewal of agreement at the end of the term of validity
of the agreement.
Note 13. Taxes, other short- and long-term payables, and provisions
In thousands of euros
31.12.2011 31.12.2010
Value added tax 2,270 2,069
Sales tax 595 547
Personal income tax 609 578
Social security taxes 1,335 1,281
Corporate Income tax on fringe benefits 21 19
Unemployment insurance 156 150
Mandatory funded pension 52 33
Total tax liabilities 5,038 4,677
Tallinna Kaubamaja AS
Consolidated Interim Report for the fourth quarter and twelve months 2011 (unaudited)
23
31.12.2011 31.12.2010
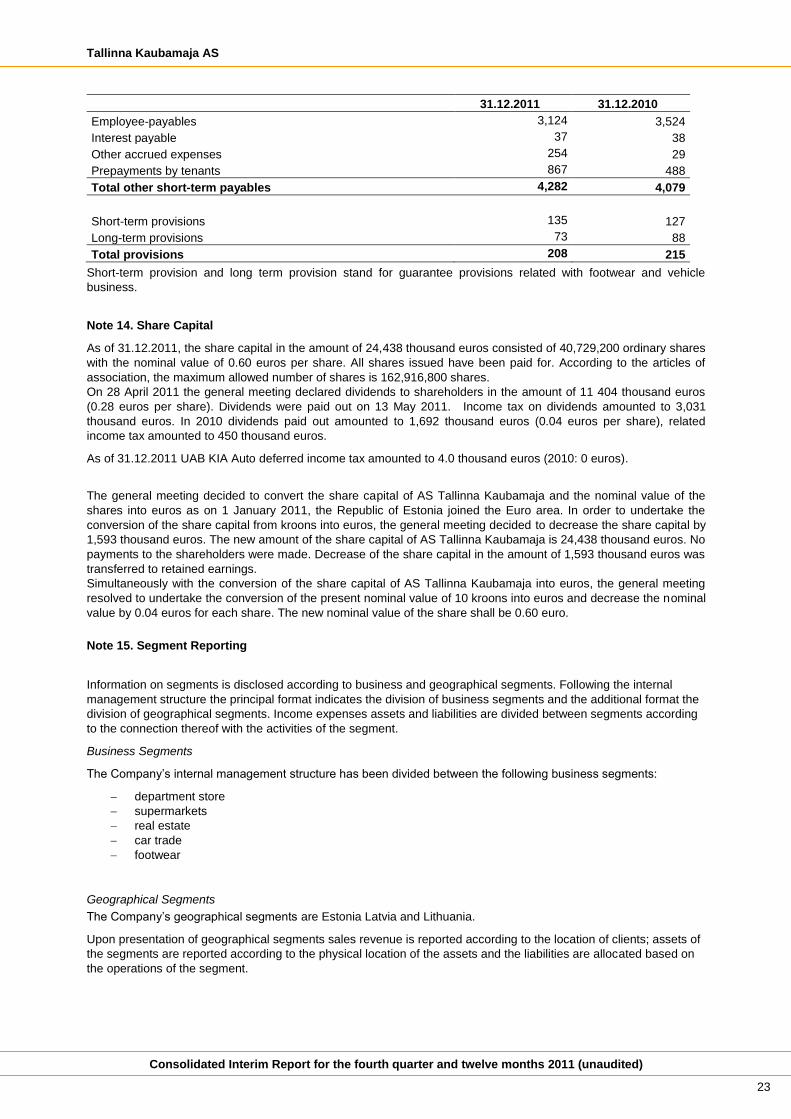
Employee-payables 3,124 3,524
Interest payable 37 38
Other accrued expenses 254 29
Prepayments by tenants 867 488
Total other short-term payables 4,282 4,079
Short-term provisions 135 127
Long-term provisions 73 88
Total provisions 208 215
Short-term provision and long term provision stand for guarantee provisions related with footwear and vehicle
business.
Note 14. Share Capital
As of 31.12.2011, the share capital in the amount of 24,438 thousand euros consisted of 40,729,200 ordinary shares
with the nominal value of 0.60 euros per share. All shares issued have been paid for. According to the articles of
association, the maximum allowed number of shares is 162,916,800 shares.
On 28 April 2011 the general meeting declared dividends to shareholders in the amount of 11 404 thousand euros
(0.28 euros per share). Dividends were paid out on 13 May 2011. Income tax on dividends amounted to 3,031
thousand euros. In 2010 dividends paid out amounted to 1,692 thousand euros (0.04 euros per share), related
income tax amounted to 450 thousand euros.
As of 31.12.2011 UAB KIA Auto deferred income tax amounted to 4.0 thousand euros (2010: 0 euros).
The general meeting decided to convert the share capital of AS Tallinna Kaubamaja and the nominal value of the
shares into euros as on 1 January 2011, the Republic of Estonia joined the Euro area. In order to undertake the
conversion of the share capital from kroons into euros, the general meeting decided to decrease the share capital by
1,593 thousand euros. The new amount of the share capital of AS Tallinna Kaubamaja is 24,438 thousand euros. No
payments to the shareholders were made. Decrease of the share capital in the amount of 1,593 thousand euros was
transferred to retained earnings.
Simultaneously with the conversion of the share capital of AS Tallinna Kaubamaja into euros, the general meeting
resolved to undertake the conversion of the present nominal value of 10 kroons into euros and decrease the nominal
value by 0.04 euros for each share. The new nominal value of the share shall be 0.60 euro.
Note 15. Segment Reporting
Information on segments is disclosed according to business and geographical segments. Following the internal
management structure the principal format indicates the division of business segments and the additional format the
division of geographical segments. Income expenses assets and liabilities are divided between segments according
to the connection thereof with the activities of the segment.
Business Segments
The Company’s internal management structure has been divided between the following business segments:
department store
supermarkets
real estate
car trade
footwear
Geographical Segments
The Company’s geographical segments are Estonia Latvia and Lithuania.
Upon presentation of geographical segments sales revenue is reported according to the location of clients; assets of
the segments are reported according to the physical location of the assets and the liabilities are allocated based on
the operations of the segment.
Tallinna Kaubamaja AS
Consolidated Interim Report for the fourth quarter and twelve months 2011 (unaudited)
24
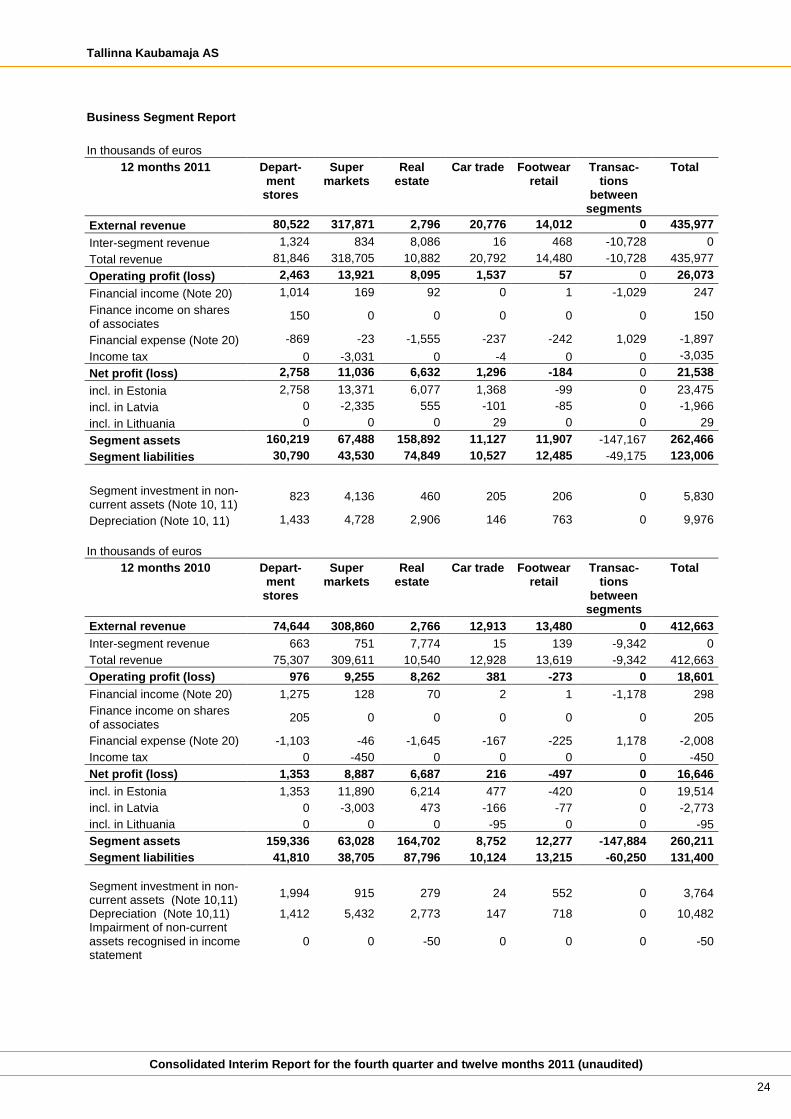
Business Segment Report
In thousands of euros
12 months 2011 Depart-ment
stores
Super markets
Real estate
Car trade Footwear retail
Transac- tions
between segments
Total
External revenue 80,522 317,871 2,796 20,776 14,012 0 435,977
Inter-segment revenue 1,324 834 8,086 16 468 -10,728 0
Total revenue 81,846 318,705 10,882 20,792 14,480 -10,728 435,977
Operating profit (loss) 2,463 13,921 8,095 1,537 57 0 26,073
Financial income (Note 20) 1,014 169 92 0 1 -1,029 247
Finance income on shares of associates
150 0 0 0 0 0 150
Financial expense (Note 20) -869 -23 -1,555 -237 -242 1,029 -1,897
Income tax 0 -3,031 0 -4 0 0 -3,035
Net profit (loss) 2,758 11,036 6,632 1,296 -184 0 21,538
incl. in Estonia 2,758 13,371 6,077 1,368 -99 0 23,475
incl. in Latvia 0 -2,335 555 -101 -85 0 -1,966
incl. in Lithuania 0 0 0 29 0 0 29
Segment assets 160,219 67,488 158,892 11,127 11,907 -147,167 262,466
Segment liabilities 30,790 43,530 74,849 10,527 12,485 -49,175 123,006
Segment investment in non-current assets (Note 10, 11)
823 4,136 460 205 206 0 5,830
Depreciation (Note 10, 11) 1,433 4,728 2,906 146 763 0 9,976
In thousands of euros
12 months 2010 Depart-ment
stores
Super markets
Real estate
Car trade Footwear retail
Transac- tions
between segments
Total
External revenue 74,644 308,860 2,766 12,913 13,480 0 412,663
Inter-segment revenue 663 751 7,774 15 139 -9,342 0
Total revenue 75,307 309,611 10,540 12,928 13,619 -9,342 412,663
Operating profit (loss) 976 9,255 8,262 381 -273 0 18,601
Financial income (Note 20) 1,275 128 70 2 1 -1,178 298
Finance income on shares of associates
205 0 0 0 0 0 205
Financial expense (Note 20) -1,103 -46 -1,645 -167 -225 1,178 -2,008
Income tax 0 -450 0 0 0 0 -450
Net profit (loss) 1,353 8,887 6,687 216 -497 0 16,646
incl. in Estonia 1,353 11,890 6,214 477 -420 0 19,514
incl. in Latvia 0 -3,003 473 -166 -77 0 -2,773
incl. in Lithuania 0 0 0 -95 0 0 -95
Segment assets 159,336 63,028 164,702 8,752 12,277 -147,884 260,211
Segment liabilities 41,810 38,705 87,796 10,124 13,215 -60,250 131,400
Segment investment in non-current assets (Note 10,11)
1,994 915 279 24 552 0 3,764
Depreciation (Note 10,11) 1,412 5,432 2,773 147 718 0 10,482 Impairment of non-current assets recognised in income statement
0 0 -50 0 0 0 -50
Tallinna Kaubamaja AS
Consolidated Interim Report for the fourth quarter and twelve months 2011 (unaudited)
25
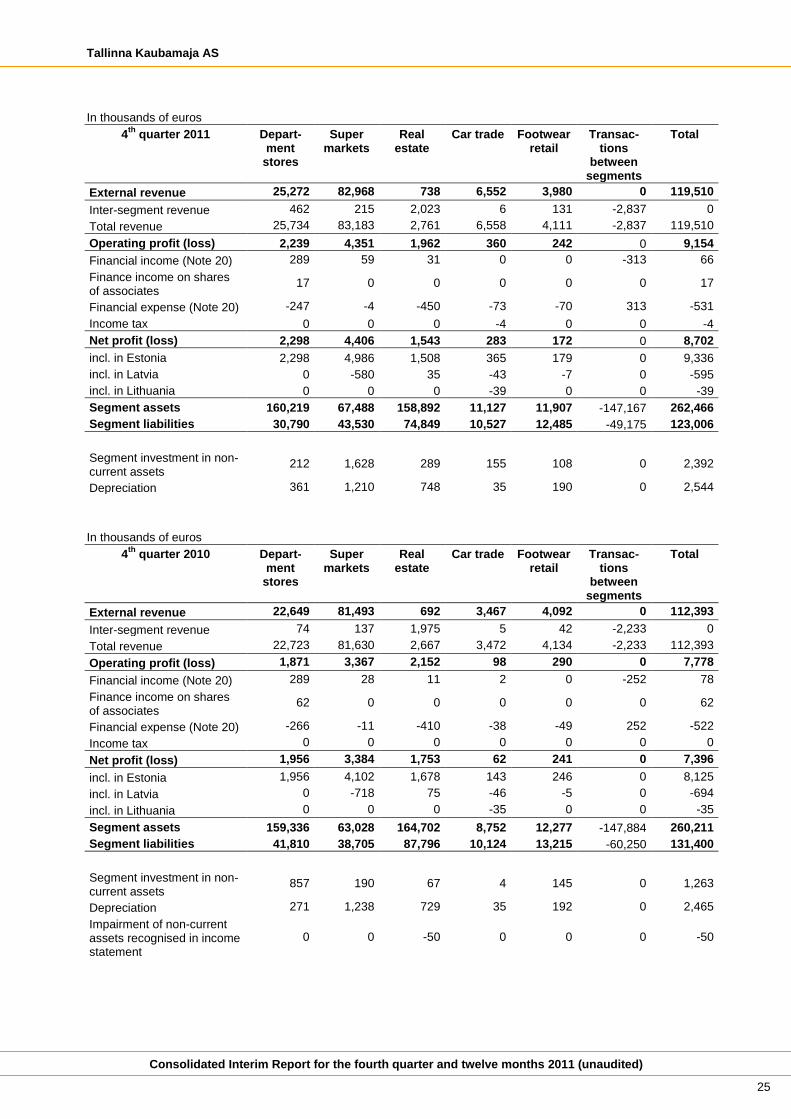
In thousands of euros
4th
quarter 2011 Depart-ment
stores
Super markets
Real estate
Car trade Footwear retail
Transac- tions
between segments
Total
External revenue 25,272 82,968 738 6,552 3,980 0 119,510
Inter-segment revenue 462 215 2,023 6 131 -2,837 0
Total revenue 25,734 83,183 2,761 6,558 4,111 -2,837 119,510
Operating profit (loss) 2,239 4,351 1,962 360 242 0 9,154
Financial income (Note 20) 289 59 31 0 0 -313 66
Finance income on shares of associates
17 0 0 0 0 0 17
Financial expense (Note 20) -247 -4 -450 -73 -70 313 -531
Income tax 0 0 0 -4 0 0 -4
Net profit (loss) 2,298 4,406 1,543 283 172 0 8,702
incl. in Estonia 2,298 4,986 1,508 365 179 0 9,336
incl. in Latvia 0 -580 35 -43 -7 0 -595
incl. in Lithuania 0 0 0 -39 0 0 -39
Segment assets 160,219 67,488 158,892 11,127 11,907 -147,167 262,466
Segment liabilities 30,790 43,530 74,849 10,527 12,485 -49,175 123,006
Segment investment in non-current assets
212 1,628 289 155 108 0 2,392
Depreciation 361 1,210 748 35 190 0 2,544
In thousands of euros
4th
quarter 2010 Depart-ment
stores
Super markets
Real estate
Car trade Footwear retail
Transac- tions
between segments
Total
External revenue 22,649 81,493 692 3,467 4,092 0 112,393
Inter-segment revenue 74 137 1,975 5 42 -2,233 0
Total revenue 22,723 81,630 2,667 3,472 4,134 -2,233 112,393
Operating profit (loss) 1,871 3,367 2,152 98 290 0 7,778
Financial income (Note 20) 289 28 11 2 0 -252 78
Finance income on shares of associates
62 0 0 0 0 0 62
Financial expense (Note 20) -266 -11 -410 -38 -49 252 -522
Income tax 0 0 0 0 0 0 0
Net profit (loss) 1,956 3,384 1,753 62 241 0 7,396
incl. in Estonia 1,956 4,102 1,678 143 246 0 8,125
incl. in Latvia 0 -718 75 -46 -5 0 -694
incl. in Lithuania 0 0 0 -35 0 0 -35
Segment assets 159,336 63,028 164,702 8,752 12,277 -147,884 260,211
Segment liabilities 41,810 38,705 87,796 10,124 13,215 -60,250 131,400
Segment investment in non-current assets
857 190 67 4 145 0 1,263
Depreciation 271 1,238 729 35 192 0 2,465
Impairment of non-current assets recognised in income statement
0 0 -50 0 0 0 -50
Tallinna Kaubamaja AS
Consolidated Interim Report for the fourth quarter and twelve months 2011 (unaudited)
26
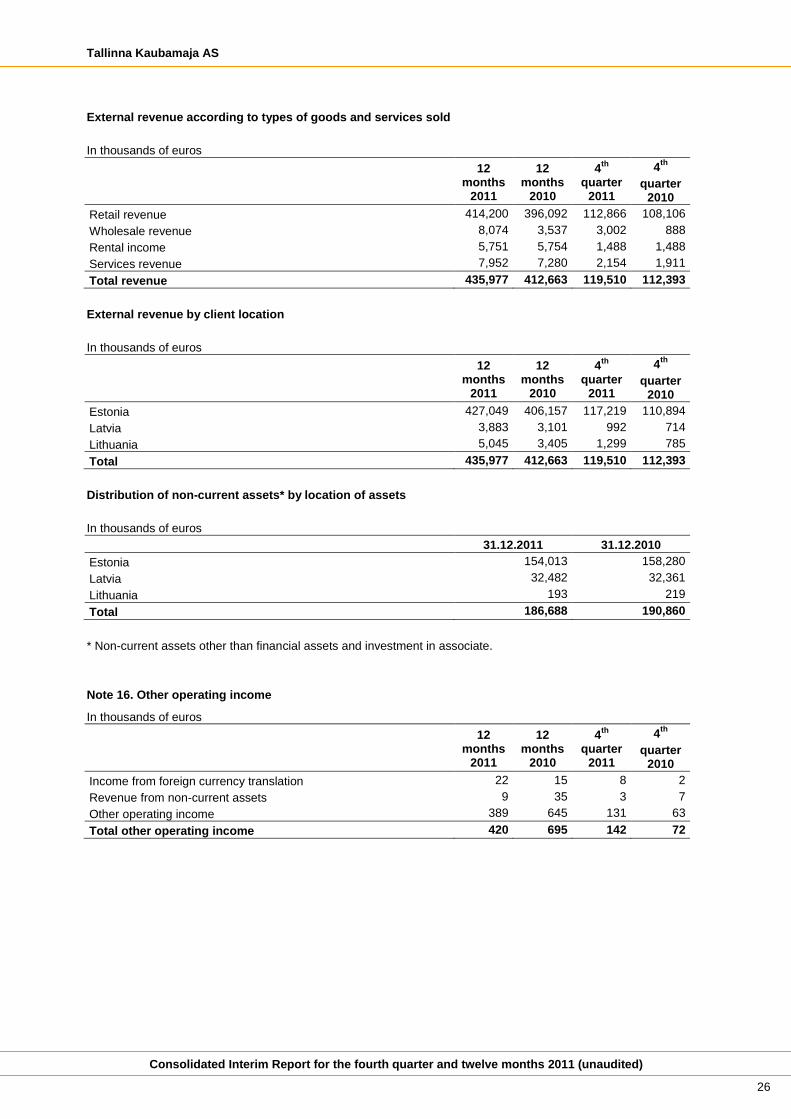
External revenue according to types of goods and services sold
In thousands of euros
12 months
2011
12 months
2010
4th
quarter
2011
4th
quarter 2010
Retail revenue 414,200 396,092 112,866 108,106
Wholesale revenue 8,074 3,537 3,002 888
Rental income 5,751 5,754 1,488 1,488
Services revenue 7,952 7,280 2,154 1,911
Total revenue 435,977 412,663 119,510 112,393
External revenue by client location
In thousands of euros
12 months
2011
12 months
2010
4th
quarter
2011
4th
quarter 2010
Estonia 427,049 406,157 117,219 110,894
Latvia 3,883 3,101 992 714
Lithuania 5,045 3,405 1,299 785
Total 435,977 412,663 119,510 112,393
Distribution of non-current assets* by location of assets
In thousands of euros
31.12.2011 31.12.2010
Estonia 154,013 158,280
Latvia 32,482 32,361
Lithuania 193 219
Total 186,688 190,860
* Non-current assets other than financial assets and investment in associate.
Note 16. Other operating income
In thousands of euros
12 months
2011
12 months
2010
4th
quarter
2011
4th
quarter 2010
Income from foreign currency translation 22 15 8 2
Revenue from non-current assets 9 35 3 7
Other operating income 389 645 131 63
Total other operating income 420 695 142 72
Tallinna Kaubamaja AS
Consolidated Interim Report for the fourth quarter and twelve months 2011 (unaudited)
27
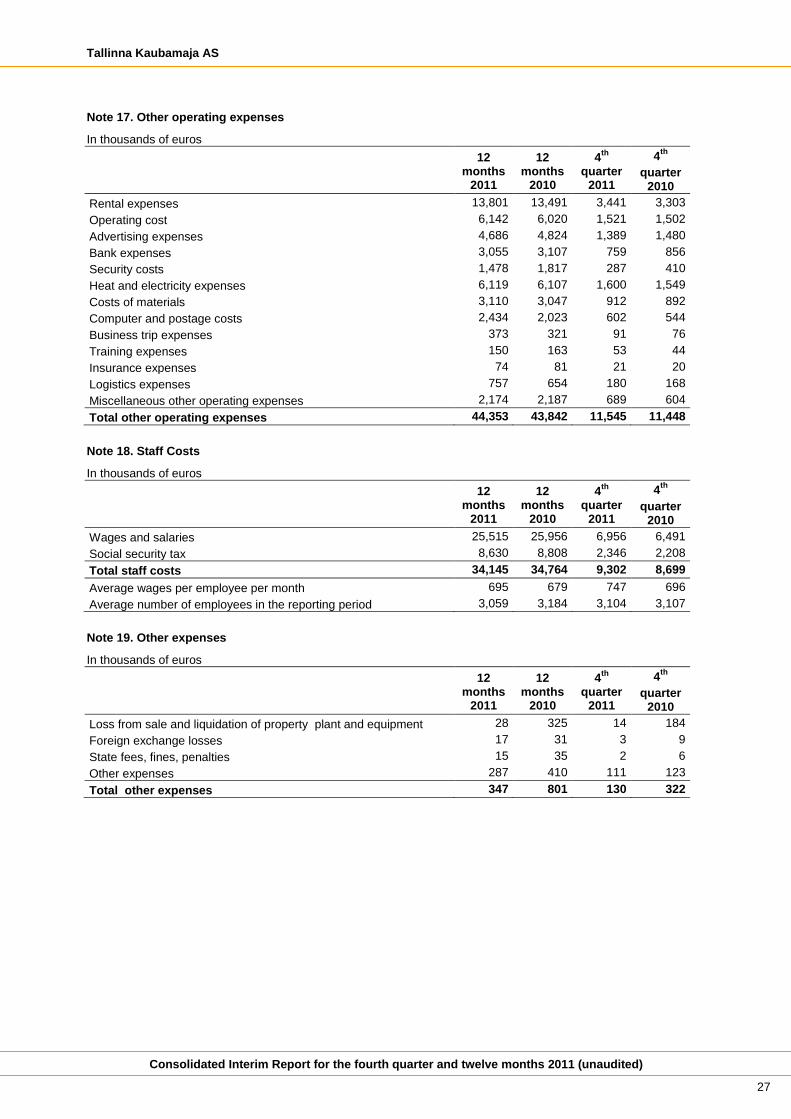
Note 17. Other operating expenses
In thousands of euros
12 months
2011
12 months
2010
4th
quarter
2011
4th
quarter 2010
Rental expenses 13,801 13,491 3,441 3,303
Operating cost 6,142 6,020 1,521 1,502
Advertising expenses 4,686 4,824 1,389 1,480
Bank expenses 3,055 3,107 759 856
Security costs 1,478 1,817 287 410
Heat and electricity expenses 6,119 6,107 1,600 1,549
Costs of materials 3,110 3,047 912 892
Computer and postage costs 2,434 2,023 602 544
Business trip expenses 373 321 91 76
Training expenses 150 163 53 44
Insurance expenses 74 81 21 20
Logistics expenses 757 654 180 168
Miscellaneous other operating expenses 2,174 2,187 689 604
Total other operating expenses 44,353 43,842 11,545 11,448
Note 18. Staff Costs
In thousands of euros
12 months
2011
12 months
2010
4th
quarter
2011
4th
quarter 2010
Wages and salaries 25,515 25,956 6,956 6,491
Social security tax 8,630 8,808 2,346 2,208
Total staff costs 34,145 34,764 9,302 8,699
Average wages per employee per month 695 679 747 696
Average number of employees in the reporting period 3,059 3,184 3,104 3,107
Note 19. Other expenses
In thousands of euros
12 months
2011
12 months
2010
4th
quarter
2011
4th
quarter 2010
Loss from sale and liquidation of property plant and equipment 28 325 14 184
Foreign exchange losses 17 31 3 9
State fees, fines, penalties 15 35 2 6
Other expenses 287 410 111 123
Total other expenses 347 801 130 322
Tallinna Kaubamaja AS
Consolidated Interim Report for the fourth quarter and twelve months 2011 (unaudited)
28
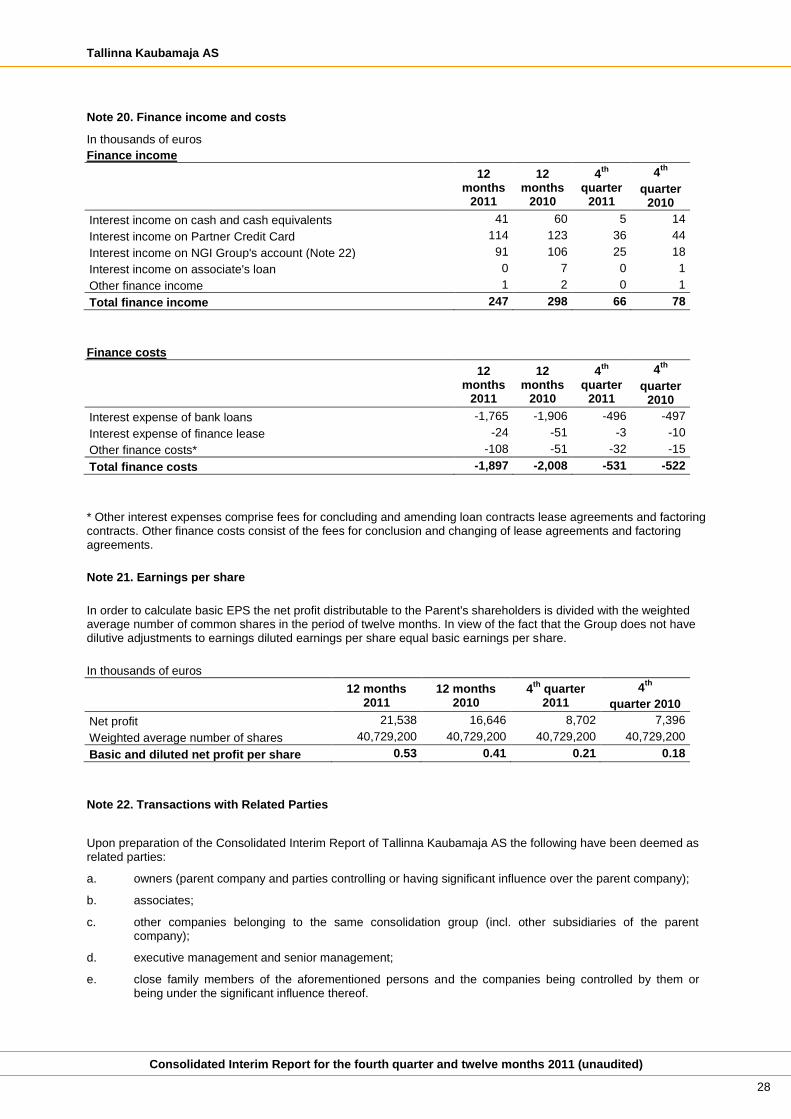
Note 20. Finance income and costs
In thousands of euros
Finance income
12 months
2011
12 months
2010
4th
quarter
2011
4th
quarter 2010
Interest income on cash and cash equivalents 41 60 5 14
Interest income on Partner Credit Card 114 123 36 44
Interest income on NGI Group's account (Note 22) 91 106 25 18
Interest income on associate's loan 0 7 0 1
Other finance income 1 2 0 1
Total finance income 247 298 66 78
Finance costs
12 months
2011
12 months
2010
4th
quarter
2011
4th
quarter 2010
Interest expense of bank loans -1,765 -1,906 -496 -497
Interest expense of finance lease -24 -51 -3 -10
Other finance costs* -108 -51 -32 -15
Total finance costs -1,897 -2,008 -531 -522
* Other interest expenses comprise fees for concluding and amending loan contracts lease agreements and factoring contracts. Other finance costs consist of the fees for conclusion and changing of lease agreements and factoring agreements.
Note 21. Earnings per share
In order to calculate basic EPS the net profit distributable to the Parent's shareholders is divided with the weighted average number of common shares in the period of twelve months. In view of the fact that the Group does not have dilutive adjustments to earnings diluted earnings per share equal basic earnings per share.
In thousands of euros
12 months 2011
12 months 2010
4th
quarter 2011
4th
quarter 2010
Net profit 21,538 16,646 8,702 7,396
Weighted average number of shares 40,729,200 40,729,200 40,729,200 40,729,200
Basic and diluted net profit per share 0.53 0.41 0.21 0.18
Note 22. Transactions with Related Parties
Upon preparation of the Consolidated Interim Report of Tallinna Kaubamaja AS the following have been deemed as related parties:
a. owners (parent company and parties controlling or having significant influence over the parent company);
b. associates;
c. other companies belonging to the same consolidation group (incl. other subsidiaries of the parent company);
d. executive management and senior management;
e. close family members of the aforementioned persons and the companies being controlled by them or being under the significant influence thereof.
Tallinna Kaubamaja AS
Consolidated Interim Report for the fourth quarter and twelve months 2011 (unaudited)
29
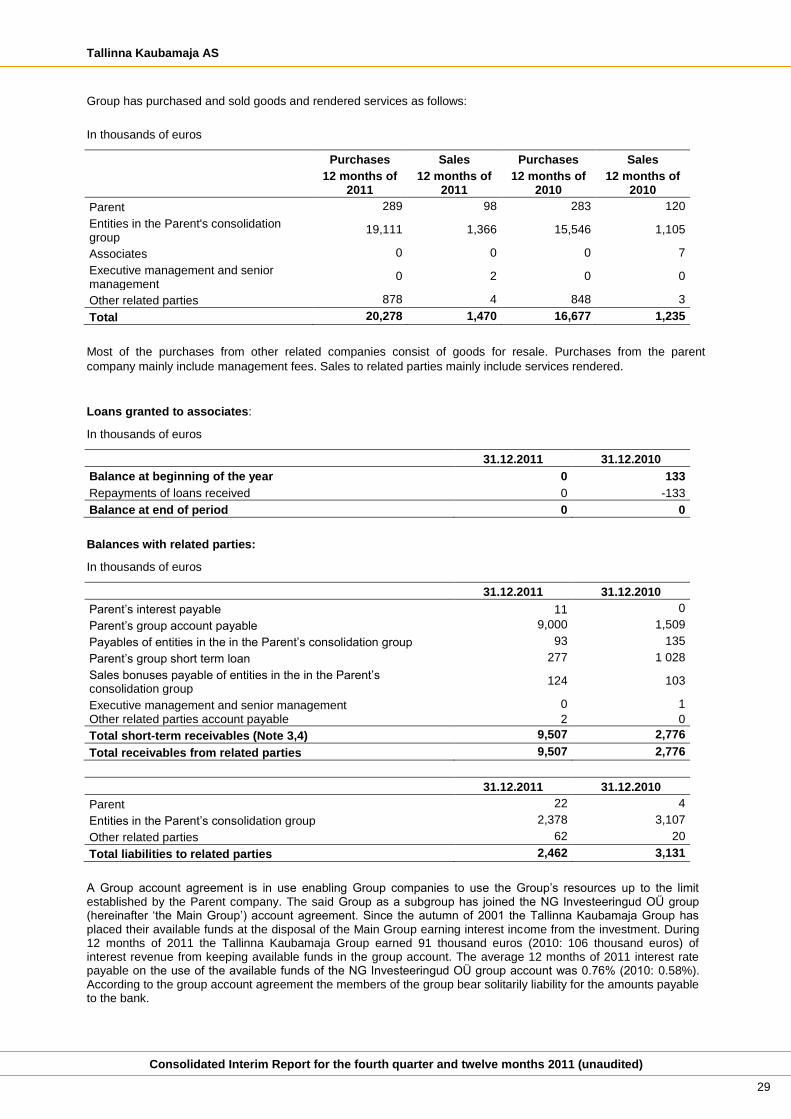
Group has purchased and sold goods and rendered services as follows:
In thousands of euros
Most of the purchases from other related companies consist of goods for resale. Purchases from the parent
company mainly include management fees. Sales to related parties mainly include services rendered.
Loans granted to associates:
In thousands of euros
31.12.2011 31.12.2010
Balance at beginning of the year 0 133
Repayments of loans received 0 -133
Balance at end of period 0 0
Balances with related parties:
In thousands of euros
31.12.2011 31.12.2010
Parent’s interest payable 11 0
Parent’s group account payable 9,000 1,509
Payables of entities in the in the Parent’s consolidation group 93 135
Parent’s group short term loan 277 1 028
Sales bonuses payable of entities in the in the Parent’s consolidation group
124 103
Executive management and senior management 0 1
Other related parties account payable 2 0
Total short-term receivables (Note 3,4) 9,507 2,776
Total receivables from related parties 9,507 2,776
31.12.2011 31.12.2010
Parent 22 4
Entities in the Parent’s consolidation group 2,378 3,107
Other related parties 62 20
Total liabilities to related parties 2,462 3,131
A Group account agreement is in use enabling Group companies to use the Group’s resources up to the limit established by the Parent company. The said Group as a subgroup has joined the NG Investeeringud OÜ group (hereinafter ‘the Main Group’) account agreement. Since the autumn of 2001 the Tallinna Kaubamaja Group has placed their available funds at the disposal of the Main Group earning interest income from the investment. During 12 months of 2011 the Tallinna Kaubamaja Group earned 91 thousand euros (2010: 106 thousand euros) of interest revenue from keeping available funds in the group account. The average 12 months of 2011 interest rate payable on the use of the available funds of the NG Investeeringud OÜ group account was 0.76% (2010: 0.58%). According to the group account agreement the members of the group bear solitarily liability for the amounts payable to the bank.
Purchases
12 months of 2011
Sales
12 months of 2011
Purchases
12 months of 2010
Sales
12 months of 2010
Parent 289 98 283 120
Entities in the Parent's consolidation group
19,111 1,366 15,546 1,105
Associates 0 0 0 7
Executive management and senior management
0 2 0 0
Other related parties 878 4 848 3
Total 20,278 1,470 16,677 1,235
Tallinna Kaubamaja AS
Consolidated Interim Report for the fourth quarter and twelve months 2011 (unaudited)
30
The management of Tallinna Kaubamaja AS is of the opinion that prices used in transactions with related parties do not differ significantly from market prices.
Remuneration paid to the members of the management and supervisory boards
Short term employee benefits which include wages, social security contributions, bonuses and non-monetary benefits as car costs paid to the members of management boards of the entities of Tallinna Kaubamaja Group amounted to 966 thousand euros in twelve months of 2011, (2010: 657 thousand euros) and the remuneration paid to the members of the supervisory boards amounted to 218 thousand euros (2010: 217 thousand euros).
Note 23 Events after the balance sheet date
Tallinna Kaubamaja Group companies had no significant events after the balance sheet date and there were no changes in contingent liabilities that should have been disclosed in Interim Report between 31.12.2011 and 15.02.2012.
Related Documents