AN ASSESSMENT OF PEOPLE WILDLIFE CONFLICT IN LWANG SECTOR OF ANNAPURNA CONSERVATION AREA A Report Submitted to KING MAHENDRA TRUST FOR NATURE CONSERVATION'S ANNAPURNA CONSERVATION AREA PROJECT Karun Pandit July 2003

Welcome message from author
This document is posted to help you gain knowledge. Please leave a comment to let me know what you think about it! Share it to your friends and learn new things together.
Transcript
AN ASSESSMENT OF PEOPLE WILDLIFE CONFLICT
IN LWANG SECTOR OF ANNAPURNA CONSERVATION AREA
A Report Submitted to
KING MAHENDRA TRUST FOR NATURE CONSERVATION'S
ANNAPURNA CONSERVATION AREA PROJECT
Karun Pandit
July 2003
i
ACKNOWLEDGEMENTS
In the first place, I am grateful to Annapurna Conservation Area Project for providing me
with the fund and opportunity to carry out this research. In this connection, I should
extend my heartfelt thanks to Mr. Gehendra Bahadur Gurung for his help as the director
of the project. Similarly, I am very much grateful to Mr. Roshan Sherchan, natural
Resource Conservation Officer, for his enormous guidance and help throughout the
research works and report writing. I am equally thankful to Mr. Nawaraj Chapagain, GIS
officer for his help and encouragement to do this work.
I would like to express by sincere thanks to all the ACAP staffs at the Lwang Sector for
their kind cooperation. Mr. Kirti Nath Paudel, Conservation Officer and Mr. Bhim
Poudel, Conservation Assistant deserve special thanks for their support and help in the
field without which I would not have been able to carry out my works in this way. I am
thankful to IOF faculties for their valuable guidance in the preparation of the report. My
colleagues who have always helped and inspired me throughout the field works to report
writing also deserve sincere thanks.
Last but not the least, I am sincerely thankful to all the village people whilom I met in
the study are during my field visit who not only provided me with their invaluable time
but also helped me by sharing their data, their experiences and many more information
during my field days.
Karun Pandit
July, 2003
ii
ABSTRACT
The study deals with the assessment of people wildlife conflict in Annapurna
Conservation Area (ACA). For the purpose of the study five villages from three different
VDCs of Lwang Sector in ACA were selected. Data collection method included
primarily questionnaire survey, key informant interview and group discussions.
Questionnaire was focused on damage made by problem animals in terms of crops,
livestock and human lives. Data analysis was done using descriptive and inferential
methods with the help of statistical software MS Excel and SPSS.
All five villages under the study are found to be seriously affected by the wildlife.
Common leopard is the major threat for the larger livestock while jackal is closely
associated with the smaller livestock. Total loss due to depredation per year per HH is
NRs. 1992.82 on an average, out of which NRs. 1861.54 is lost only by leopard. The
most vulnerable crop is the maize with highest degree of annual loss. Average total loss
of crops per year per HH is NRs. 1447.68 and the lost of maize only is NRs. 1102.00. No
losses of human lives are reported in the village though there were occasional attacks
made by bear and monkey that have resulted in human injuries.
Besides, preference ranking was also carried out to know how the people perceived the
differences between different wildlife species regarding their role in livestock
depredation and crop raiding. Leopard is ranked at the top for livestock depredation
followed by jackal, marten, jungle cat and squirrel. Monkey is ranked at the top for crop
raiding which is followed by Porcupine, Goral, Bear and other animals.
People are already adopting a variety of options to minimize the loss due to wild animals
however they could get rid of them. Some options suggested for reducing the livestock
depredation are; good arrangement of shepherd, construction of safe pen (Khor) and
allocation of relatively safer area for the domestic animals to graze in. In the case of crop
raiding, keeping guard dogs, changing in crop pattern and arrangements of Heralu are
the possible options. For the remedial measures, providing financial compensation for
the loss, supporting in community deveopement activities and in IGAs are the good
solutions.
iii
TABLE OF CONTENTS
ACKNOWEDGEMENTS………………………………………………………….…............. i
ABSTRACT……………………………………………………………………………………. ii
TABLE OF CONTENTS……………………………………………………………………… iii
ACRONYMS…………………………………………………………………………………... v
1. INTRODUCTION…………………………………………………………………………... 1
1.1 Background…………………………………………………………………………… 1
1.2 Objectives…………………………………………………………………………….. 2
1.2.1 General Objective…………………………………………………………… 2
1.2.2 Specific Objectives………………………………………………………….. 2
1.3 Research Assumptions………………………………………………………………... 3
1.4 Research Limitations…………………………………………………………………. 3
2. METHODOLOGY……………………………………………………………………..…… 4
2.1 Study Area……………………………………………………………………………. 4
2.2 Conceptual Framework………………………………………………………………. 4
2.3 Primary Data…………………………………………………………………………. 5
2.3.1 Household Selection………………………………………………………… 5
2.3.2 Questionnaire Format……………………………………………………….. 5
2.3.3 Variables Studied…………………………………………………………… 6
2.3.4 Group Discussions and Key Informant Interview…………………………... 6
2.4 Secondary Data……………………………………………………………………….. 6
2.5 Data Analysis…………………………………………………………………………. 7
2.6 Preference Ranking…………………………………………………………………... 7
3. RESULTS AND DISCUSSION……………………………………………………………. 8
3.1 General Information………………………………………………………………….. 8
3.1.1 Private Landholding………………………………………………………… 8
3.1.2 Livestock Farming………………………………………………………….. 9
3.1.3 Trend of Livestock Farming………………………………………………… 10
3.1.4 Sources of Income…………………………………………………………... 10
3.2 Extent and Nature of Livestock Depredation………………………………………… 11
3.2.1 Village Wise Depredation………………………………………………….. 11
3.2.2 Damage Made by Each Wildlife……………………………........................ 12
3.2.3 Domestic Animals Killed by Different Wildlife……………........................ 12
3.2.4 Season of Depredation………………………………………....................... 13
3.2.5 Time of Depredation……………………….……………………………….. 14
3.2.6 Location of Depredation ……………………………………………………. 15
3.2.7 Trend of Livestock Depredation ……….……………………….………….. 15
iv
3.3 Extent and Nature of Crop Raiding…………………………………...……………… 17
3.3.1 Village Wise Crop Raiding………………………………………………..... 17
3.3.2 Damage made to Crops by Each Wildlife………………………………….. 18
3.3.3 Vulnerable Stages of Each Crop……………………………………………. 18
3.4 Human Injuries……………………………………………………………………….. 19
3.5 Preference Ranking of Wildlife……………………………………………………… 20
3.5.1 Wildlife Responsible for Livestock Depredation………………………….. 20
3.5.2 Wildlife Responsible for Crop Raiding…………………………………….. 20
3.6 Measures adopted by Villagers……………………………………………………… 23
4. CONCLUSIONS AND MANAGEMENT OPTIONS……………………………………. 24
4.1 Conclusions…………………………………………………………………………... 24
4.2 Management Options to Minimize Conflicts………………………………………… 25
4.2.1 Preventive Measures………………………………………………………... 25
4.2.2 Remedial Measures…………………………………………......................... 27
REFERENCES………………………………………………………………………………… 29
Appendices……………………………………………………………………………………… 30
Appendix 1. Questionnaire used in the Study…………….……………………………………. 30
Appendix 2. Checklist used for Key Informant Interview…..…………………………………. 37
List of Tables
1. Private Landholding and Family Size per HH……………………………………………..… 8
2. Average Number of Different Livestock per HH……………………………......................... 9
3. Percentage of Domestic Animals Killed by Different Wildlife……………………………… 11
4. Loss in NRs. by Each Wildlife per HH………………………………………………………. 12
5. Livestock Depredation in Different Seasons………………………………………………… 13
6. Annual Loss of Different Crops per HH in NRs……………………………………………... 17
7. Percentage of Different Crops Damaged by Different Wildlife……………………………... 18
8. Percentage of Vulnerable Stages of Different Crops………………………………………… 19
9. Preference Ranking of Wildlife Responsible for Livestock Depredation…………………… 21
10. Preference Ranking of Wildlife Responsible for Crop Raiding …………………………… 22
List of Figures
1. Interface Between Conservation Area and Local People…………………………………..... 4
2. Distribution of Male and Female Livestock…………………………………........................ 9
3. Percentage of Domestic Animals Killed by Leopard and Jackal…………………………...... 13
4. Time of Livestock Depredation……………………………………………………………… 14
5. Location of Livestock Depredation …………………………………………........................ 15
6. Trend of Wildlife Depredation ……………………………..……………………………….. 16
v
ACRONYMS
ACA Annapurna Conservation Area
ACAP Annapurna Conservation Area Project
ANOVA Analysis of Variance
CA Conservation Area
CAMC Conservation Area Management Committee
DAG Disadvantaged Group
FUG Forest User Group
HH Household
HMG/N His Majesty's Government of Nepal
IGA Income Generation Activity
IOF Institute of Forestry
SPSS Statistical Package for Social Science
VDC Village Development Committee
1
1. INTRODUCTION
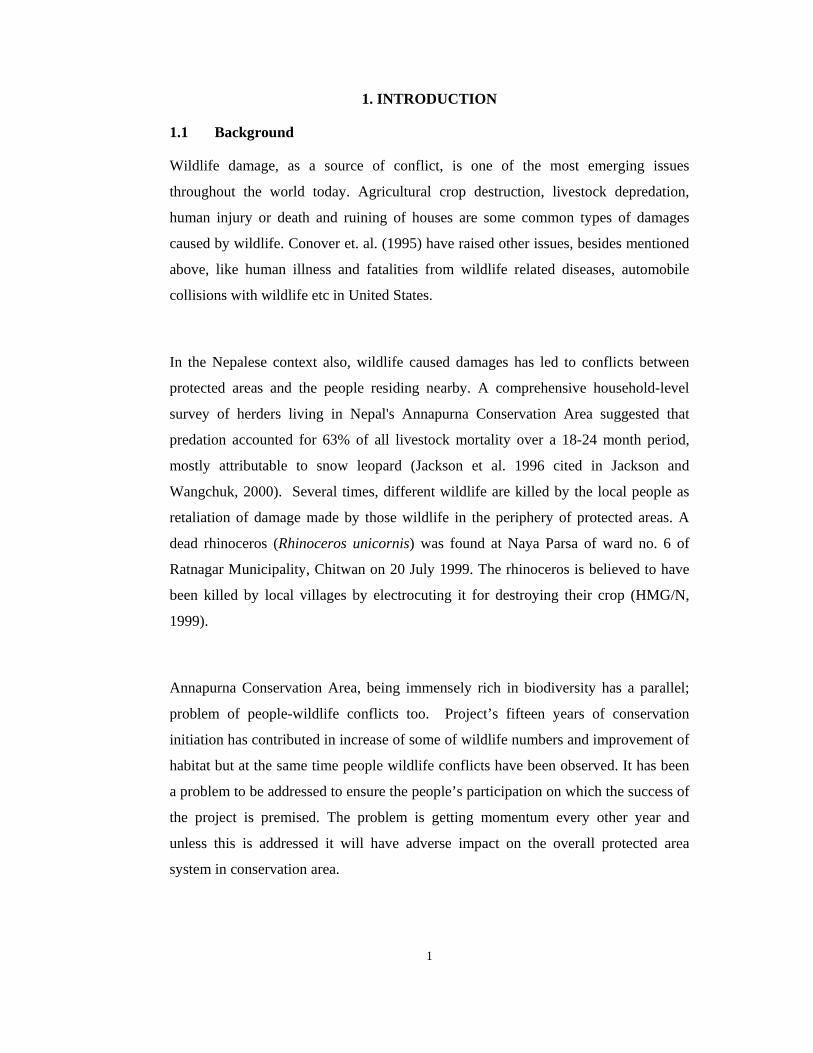
1.1 Background
Wildlife damage, as a source of conflict, is one of the most emerging issues
throughout the world today. Agricultural crop destruction, livestock depredation,
human injury or death and ruining of houses are some common types of damages
caused by wildlife. Conover et. al. (1995) have raised other issues, besides mentioned
above, like human illness and fatalities from wildlife related diseases, automobile
collisions with wildlife etc in United States.
In the Nepalese context also, wildlife caused damages has led to conflicts between
protected areas and the people residing nearby. A comprehensive household-level
survey of herders living in Nepal's Annapurna Conservation Area suggested that
predation accounted for 63% of all livestock mortality over a 18-24 month period,
mostly attributable to snow leopard (Jackson et al. 1996 cited in Jackson and
Wangchuk, 2000). Several times, different wildlife are killed by the local people as
retaliation of damage made by those wildlife in the periphery of protected areas. A
dead rhinoceros (Rhinoceros unicornis) was found at Naya Parsa of ward no. 6 of
Ratnagar Municipality, Chitwan on 20 July 1999. The rhinoceros is believed to have
been killed by local villages by electrocuting it for destroying their crop (HMG/N,
1999).
Annapurna Conservation Area, being immensely rich in biodiversity has a parallel;
problem of people-wildlife conflicts too. Project’s fifteen years of conservation
initiation has contributed in increase of some of wildlife numbers and improvement of
habitat but at the same time people wildlife conflicts have been observed. It has been
a problem to be addressed to ensure the people’s participation on which the success of
the project is premised. The problem is getting momentum every other year and
unless this is addressed it will have adverse impact on the overall protected area
system in conservation area.
2
The documentation of the views and perception of people towards nature and
conservation are very important in the context of linking conservation and
development. It is also sensible and useful to understand the socio-economic
processes which influence wildlife and human activities, along with the impact of the
establishment of the park and related conservation policies on the livelihood of the
local people (Nepal and Weber, 1993).
The resource conflicts between people and wildlife that occur in the vicinity of
conservation area have affected to the national economy. Any conservation strategies
may fail if they do not address such issues that cause environmental as well as socio-
economic impact. This makes understanding of the causes and effects of such
resource conflicts, particularly in and around conservation area. This field based
research may be valuable tools for consensus building in settling such disputes and
problems. The broad based information can be utilized in planning strategies for
conflict resolution.
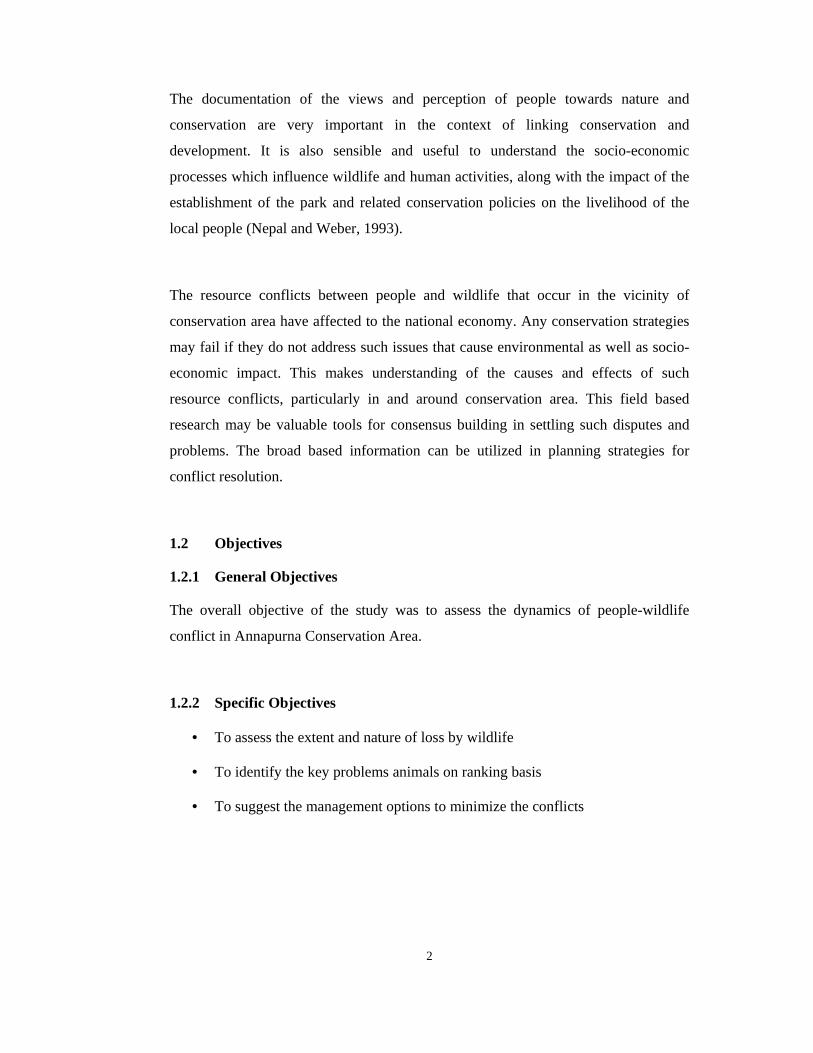
1.2 Objectives
1.2.1 General Objectives
The overall objective of the study was to assess the dynamics of people-wildlife
conflict in Annapurna Conservation Area.
1.2.2 Specific Objectives
• To assess the extent and nature of loss by wildlife
• To identify the key problems animals on ranking basis
• To suggest the management options to minimize the conflicts
3
1.3 Research Assumptions:
a. The attitude and perception of local people towards conservation is governed
by socio-economic status, distance between household and the conservation
area, facilities/service obtained from the project, crop and animal damage by
wildlife.
b. Resource conflict -issues vary with its nature, degree and intensity that can be
valued and priorities
c. Access to resources and equitable benefit sharing help in motivating people to
manage the conflicts,
d. Provision of compensation in wildlife damage and assurance of people’s
wealth with community development minimize the level and extent of
conflict
1.4 Research Limitation
Research was solely based on socio-economic information gathered through
household survey and group discussion. It would have been better if these data were
complemented by the ones from direct field observation. The data on crop raiding and
depredation in the village for the last five years was influenced to some extent
peoples’ memory. At the same time, conversion of local units to standard ones might
have resulted in some distortions in the results. Research was focused on the damage
made by the wild animals to the local people. It did not take into consideration, in
explicit ways, the negative impacts of peoples’ several activities towards the wild
animals.
4
2. METHODOLOGY
2.1 Study Area
The study was carried out in Lwang sector of Annapurna Conservation Area. The
exact locations were determined after consultation with the ACAP officials. Based on
the records of incidents in the sector office and after a discussion with the staffs, some
of the problem areas were identified. Five villages were selected purposively so as to
represent different types and extents of the problem and to obtain the inference of the
Lwang sector as a whole at the same time.
Five villages selected for the study lie under three different VDCs in Lwang Sector.
Prumdung, Kalimati and Ghalel from Lwang; Meprang from Sardikhola and Rumja
from Machhapuchhre VDC were selected.
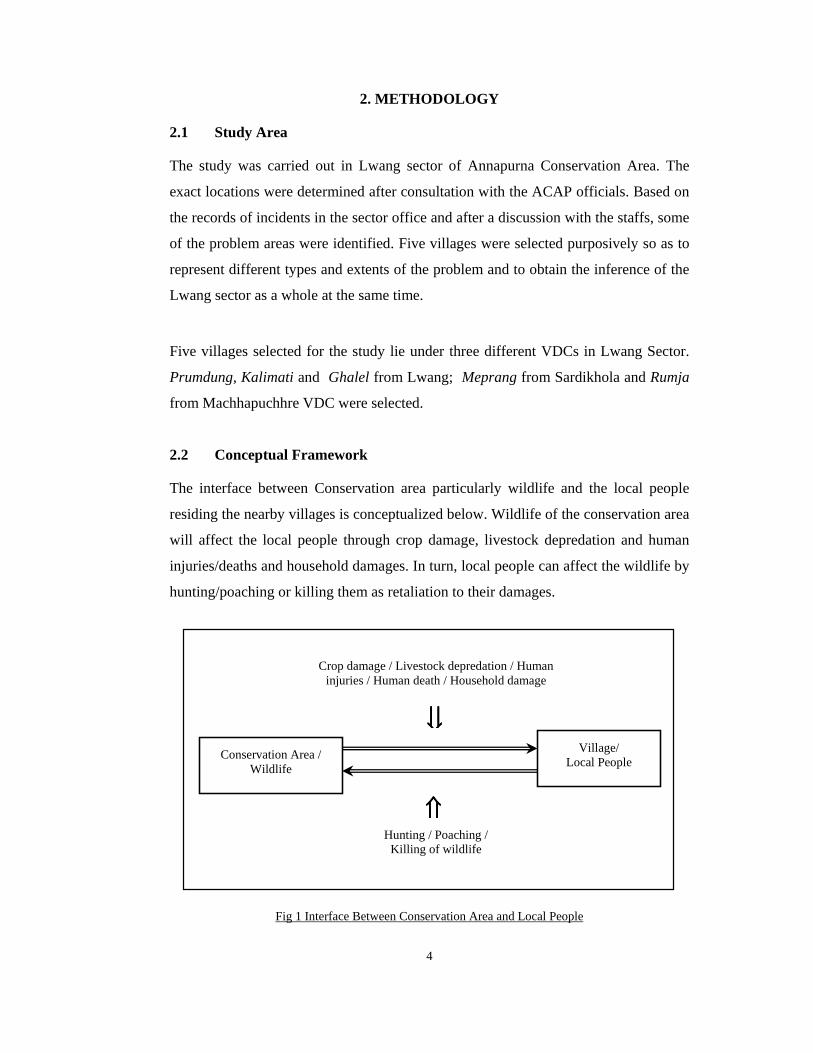
2.2 Conceptual Framework
The interface between Conservation area particularly wildlife and the local people
residing the nearby villages is conceptualized below. Wildlife of the conservation area
will affect the local people through crop damage, livestock depredation and human
injuries/deaths and household damages. In turn, local people can affect the wildlife by
hunting/poaching or killing them as retaliation to their damages.
Fig 1 Interface Between Conservation Area and Local People
Conservation Area / Wildlife
Village/ Local People
Crop damage / Livestock depredation / Human injuries / Human death / Household damage
Hunting / Poaching / Killing of wildlife
⇓⇓⇓⇓
⇑⇑⇑⇑
5
2.3 Primary Data
2.3.1 Household Selection
Total household in each of the village of the study area constituted the sampling frame
for the respective village. Sample size was determined by the Cochran formula below
(Cochran 1977).
n = N t2pq/Nd2 + t2pq
Where ,
n = Sample Size
N = Total HHs
t = Abscissa of the normal curve
p = Proportion of sample of population estimated
q = 1 - p
d = Margin of error
Then, a simple random sampling was employed to identify households to be surveyed.
Each household was assigned a random number and drawing using random number
table. The selected household was surveyed using the questionnaire prepared for the
purpose.
2.3.2 Questionnaire Format
Questionnaire was focused to solicit information on the extent and nature of several
types of damage made by different wildlife for the last five years. Primary
information collected from the survey was:
a. Crop damage: It included type of wildlife, type of crop or cropping pattern,
quantity of crop damaged, most affected season/s and the distance of
household from the forest.
6
b. Livestock damage: It included type of wildlife, type of vulnerable livestock,
no. of livestock depredated.
c. Impact on human and household: It included type of wildlife, number of
injuries to human, number of human death, number of household damaged.
Other information on socioeconomic characteristics of the household was also sought
from the format.
2.3.3 Variables Studied
The study tried to focus in the variables below.
• Type of wildlife species that are problematic
• Domestic livestock being damaged.
• Crops being damaged.
• Season, time and location of livestock depredation
• Vulnerable stage of crops
2.3.4 Group Discussions and Key Informant Interview
Group discussions with the people in all the villages including the elder people,
women and DAGs were done. Key informant interview was carried out with selected
people from different aspects to gather more information in the concerned subject.
2.4 Secondary Data
Secondary data relevant for the study was obtained from the literatures and documents
available in related organizations like ACAP headquarter and field offices, VDCs
office of the study area, IOF Pokhara library, Forest research library Kathmandu.
7
2.5 Data Analysis
Data was analysed in two different ways; particularly in descriptive and inferential
way. Primary data obtained from the field were fed into softwares like SPSS and MS
Excel. Results from the descriptive analysis have been presented in tabular, chart and
bar formats to get better visual interpretation. Inferential statistics have been applied
to test the relationships between the variables (distance, season, crop type, livestock
type etc) under the study.
2.6 Preference Ranking
Preference ranking of wildlife responsible for livestock depredation and crop raiding
will be ranked based on the perception of the local people. Each of the respondents
was asked to list the most damaging three wildlife species responsible for livestock
depredation and separately for crop raiding. The three wildlife were ranked as most
damaging, second most damaging and third most damaging. The ranking of most
damaging species was done based on the combined rule of preference ranking as
described by Kapali, 1993.
• Listing of all the species mentioned was done.
• Values were given for the ranks from 1 to 3 for least preferred to most
preferred species.
• Adding the rank sums of all the respondents for each of the species.
• Arranging all species in descending order of rank sums.
• In the case where two or more species had equal rank sums a species with
higher number of response frequency had a higher rank.
The validity of the new rankings was tested by using Friedman chi-square test by
feeding the data to the SPSS software. The assumption before using the test here is
that each of the respondents was aware of all the species in the rank but due to the
limitation of mentioning only three they could not list all those. Hence, the value of
those that were not in the list was given zero value.
8
3. RESULTS AND DISCUSSION
The study carried out in the selected household of different villages in the Lwang
Sector of ACA provided with different types of information which are discussed
below under different headings.
3.1 General Information
3.1.1 Private Landholding
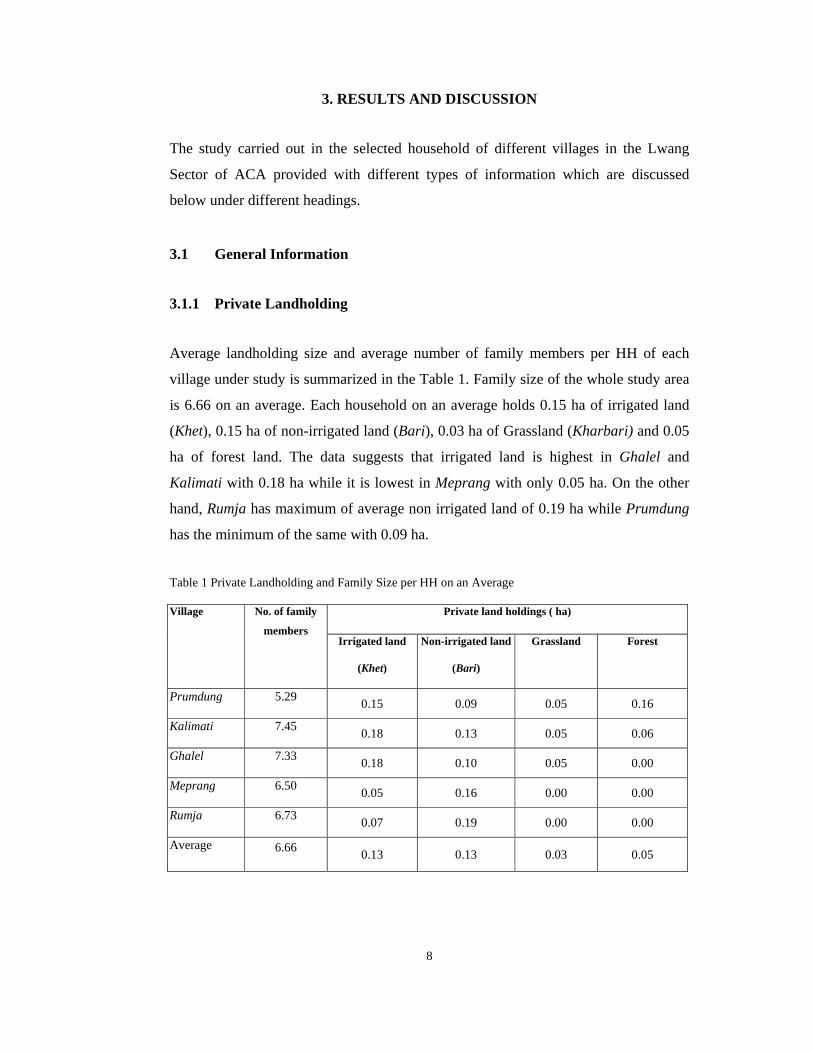
Average landholding size and average number of family members per HH of each
village under study is summarized in the Table 1. Family size of the whole study area
is 6.66 on an average. Each household on an average holds 0.15 ha of irrigated land
(Khet), 0.15 ha of non-irrigated land (Bari), 0.03 ha of Grassland (Kharbari) and 0.05
ha of forest land. The data suggests that irrigated land is highest in Ghalel and
Kalimati with 0.18 ha while it is lowest in Meprang with only 0.05 ha. On the other
hand, Rumja has maximum of average non irrigated land of 0.19 ha while Prumdung
has the minimum of the same with 0.09 ha.
Table 1 Private Landholding and Family Size per HH on an Average
Private land holdings ( ha) Village No. of family
members Irrigated land
(Khet)
Non-irrigated land
(Bari)
Grassland Forest
Prumdung 5.29 0.15 0.09 0.05 0.16
Kalimati 7.45 0.18 0.13 0.05 0.06
Ghalel 7.33 0.18 0.10 0.05 0.00
Meprang 6.50 0.05 0.16 0.00 0.00
Rumja 6.73 0.07 0.19 0.00 0.00
Average 6.66 0.13 0.13 0.03 0.05
9
3.1.2 Livestock Farming
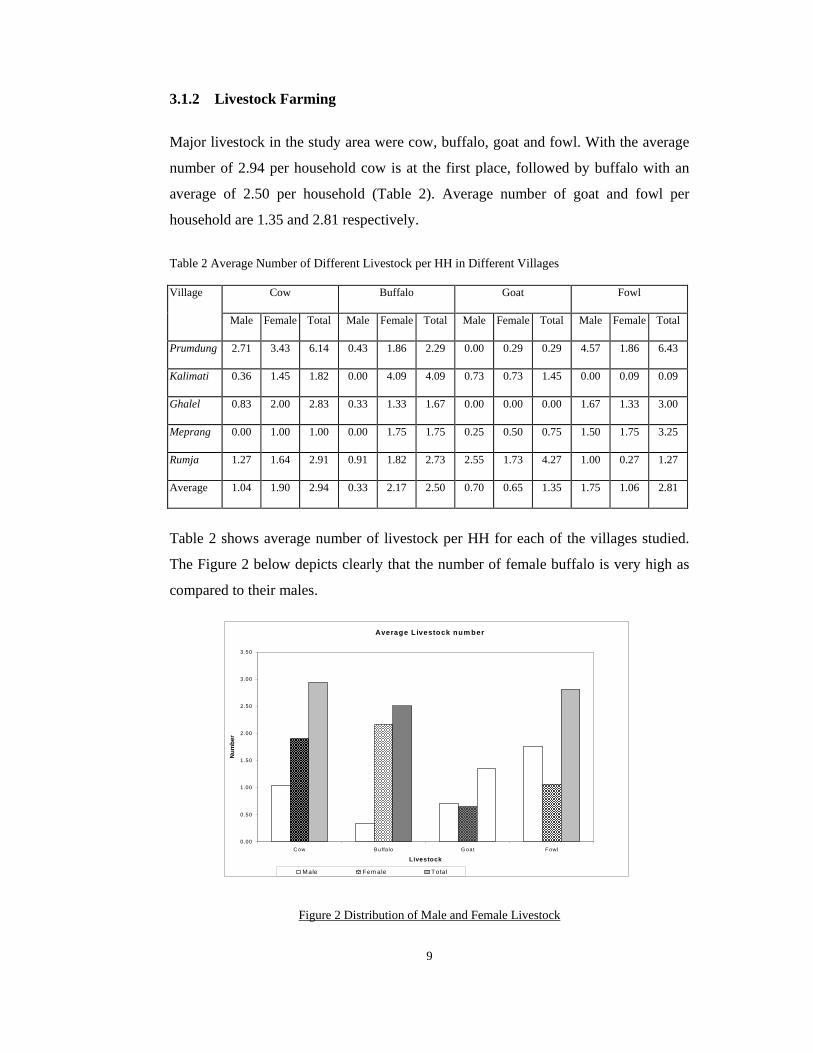
Major livestock in the study area were cow, buffalo, goat and fowl. With the average
number of 2.94 per household cow is at the first place, followed by buffalo with an
average of 2.50 per household (Table 2). Average number of goat and fowl per
household are 1.35 and 2.81 respectively.
Table 2 Average Number of Different Livestock per HH in Different Villages
Cow Buffalo Goat Fowl Village
Male Female Total Male Female Total Male Female Total Male Female Total
Prumdung 2.71 3.43 6.14 0.43 1.86 2.29 0.00 0.29 0.29 4.57 1.86 6.43
Kalimati 0.36 1.45 1.82 0.00 4.09 4.09 0.73 0.73 1.45 0.00 0.09 0.09
Ghalel 0.83 2.00 2.83 0.33 1.33 1.67 0.00 0.00 0.00 1.67 1.33 3.00
Meprang 0.00 1.00 1.00 0.00 1.75 1.75 0.25 0.50 0.75 1.50 1.75 3.25
Rumja 1.27 1.64 2.91 0.91 1.82 2.73 2.55 1.73 4.27 1.00 0.27 1.27
Average 1.04 1.90 2.94 0.33 2.17 2.50 0.70 0.65 1.35 1.75 1.06 2.81
Table 2 shows average number of livestock per HH for each of the villages studied.
The Figure 2 below depicts clearly that the number of female buffalo is very high as
compared to their males.
Figure 2 Distribution of Male and Female Livestock
Average L ivestock num ber
0.00
0.50
1.00
1.50
2.00
2.50
3.00
3.50
C ow Buffa lo G oat Fowl
Livestock
Nu
mb
er
Male Fem ale Total
10
Similarly, though not in the same ratio as that of buffalo, the number of female cow is
also higher than the males. In the case of goat there is only a slight difference among
male and female while in the case of fowl male number is higher.
3.1.3 Trend of Livestock Farming
From the group discussion with the villagers, it is found that the general trend in
livestock keeping has changed a lot. There are lesser livestock in the area at present as
compared to that of 15 years ago. There has been variation in the types of livestock as
well. Tendency of keeping cow has decreased sharply. Unlike cow, the number of
goats is more or less similar with that in the past. 92% of the households practice
partial stall feeding system while only 8% of households practice complete stall
feeding system. There is trend of shift from free grazing to partial stall feeding and
from partial stall feeding to complete stall feeding system. Practice of keeping Goth in
the forest and grazing land has been largely reduced. For instance, there are only two
Goths in the whole Meprang village.
3.1.4 Sources of Income
The major source of income in the area is agriculture and livestock farming which
covers 93.75 % of household under study followed by jobs in foreign country with
4.17 % while service and wage labor carries only 2.08%. The alternative source of
income is dominated by foreign jobs. 18.75% of household surveyed have their
alternative sources of income from foreign jobs. One or two members of the
households have been to different parts of world in search of jobs. 4.17 % of
household have their alternative source of income of service and wage labor.
11
3.2 Extent and Nature of Livestock Depredation
3.2.1 Village Wise Depredation
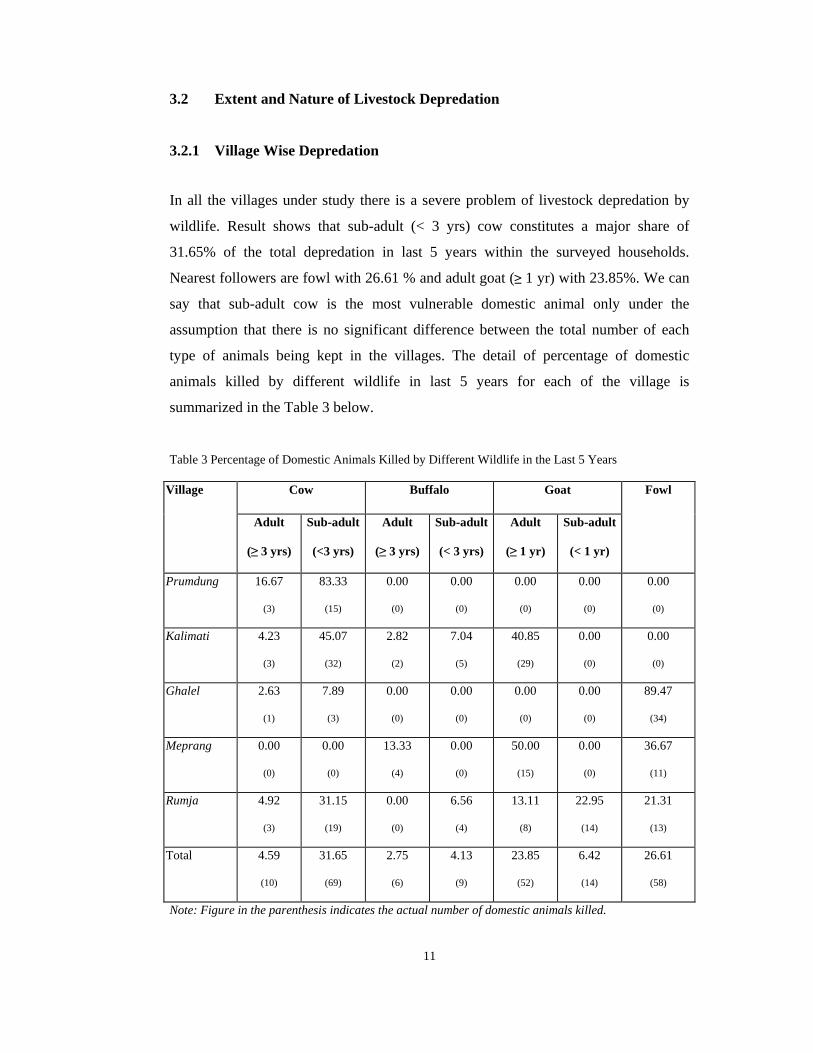
In all the villages under study there is a severe problem of livestock depredation by
wildlife. Result shows that sub-adult (< 3 yrs) cow constitutes a major share of
31.65% of the total depredation in last 5 years within the surveyed households.
Nearest followers are fowl with 26.61 % and adult goat (≥ 1 yr) with 23.85%. We can
say that sub-adult cow is the most vulnerable domestic animal only under the
assumption that there is no significant difference between the total number of each
type of animals being kept in the villages. The detail of percentage of domestic
animals killed by different wildlife in last 5 years for each of the village is
summarized in the Table 3 below.
Table 3 Percentage of Domestic Animals Killed by Different Wildlife in the Last 5 Years
Village Cow Buffalo Goat Fowl
Adult
(≥ 3 yrs)
Sub-adult
(<3 yrs)
Adult
(≥ 3 yrs)
Sub-adult
(< 3 yrs)
Adult
(≥ 1 yr)
Sub-adult
(< 1 yr)
Prumdung 16.67
(3)
83.33
(15)
0.00
(0)
0.00
(0)
0.00
(0)
0.00
(0)
0.00
(0)
Kalimati 4.23
(3)
45.07
(32)
2.82
(2)
7.04
(5)
40.85
(29)
0.00
(0)
0.00
(0)
Ghalel 2.63
(1)
7.89
(3)
0.00
(0)
0.00
(0)
0.00
(0)
0.00
(0)
89.47
(34)
Meprang 0.00
(0)
0.00
(0)
13.33
(4)
0.00
(0)
50.00
(15)
0.00
(0)
36.67
(11)
Rumja 4.92
(3)
31.15
(19)
0.00
(0)
6.56
(4)
13.11
(8)
22.95
(14)
21.31
(13)
Total 4.59
(10)
31.65
(69)
2.75
(6)
4.13
(9)
23.85
(52)
6.42
(14)
26.61
(58)
Note: Figure in the parenthesis indicates the actual number of domestic animals killed.
12
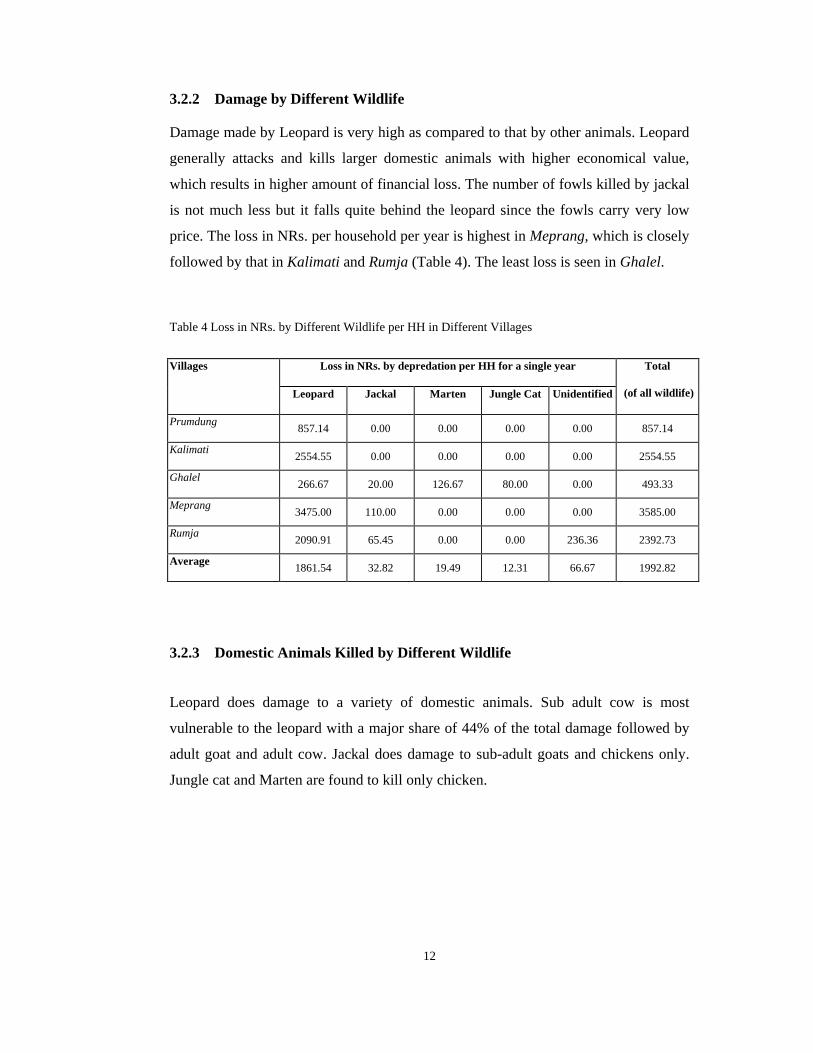
3.2.2 Damage by Different Wildlife
Damage made by Leopard is very high as compared to that by other animals. Leopard
generally attacks and kills larger domestic animals with higher economical value,
which results in higher amount of financial loss. The number of fowls killed by jackal
is not much less but it falls quite behind the leopard since the fowls carry very low
price. The loss in NRs. per household per year is highest in Meprang, which is closely
followed by that in Kalimati and Rumja (Table 4). The least loss is seen in Ghalel.
Table 4 Loss in NRs. by Different Wildlife per HH in Different Villages
Villages Loss in NRs. by depredation per HH for a single year
Leopard Jackal Marten Jungle Cat Unidentified
Total
(of all wildlife)
Prumdung 857.14 0.00 0.00 0.00 0.00 857.14
Kalimati 2554.55 0.00 0.00 0.00 0.00 2554.55
Ghalel 266.67 20.00 126.67 80.00 0.00 493.33
Meprang 3475.00 110.00 0.00 0.00 0.00 3585.00
Rumja 2090.91 65.45 0.00 0.00 236.36 2392.73
Average 1861.54 32.82 19.49 12.31 66.67 1992.82
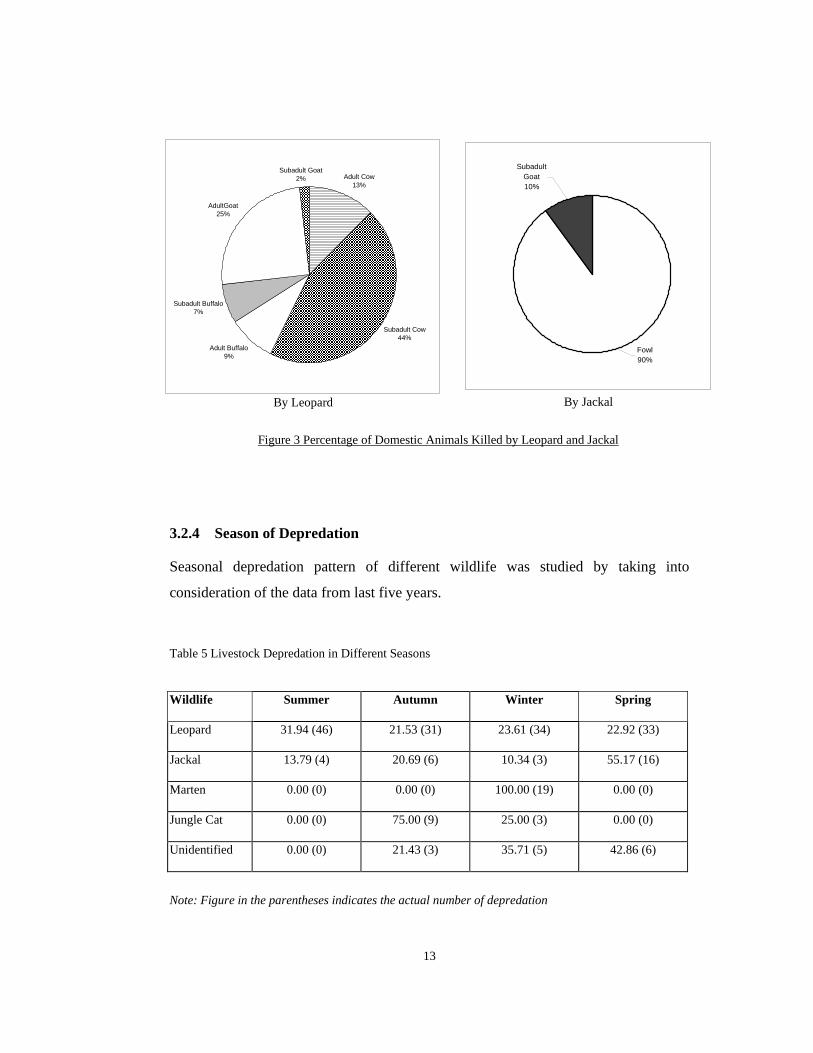
3.2.3 Domestic Animals Killed by Different Wildlife
Leopard does damage to a variety of domestic animals. Sub adult cow is most
vulnerable to the leopard with a major share of 44% of the total damage followed by
adult goat and adult cow. Jackal does damage to sub-adult goats and chickens only.
Jungle cat and Marten are found to kill only chicken.
13
3.2.4 Season of Depredation
Seasonal depredation pattern of different wildlife was studied by taking into
consideration of the data from last five years.
Table 5 Livestock Depredation in Different Seasons
Wildlife Summer Autumn Winter Spring
Leopard 31.94 (46) 21.53 (31) 23.61 (34) 22.92 (33)
Jackal 13.79 (4) 20.69 (6) 10.34 (3) 55.17 (16)
Marten 0.00 (0) 0.00 (0) 100.00 (19) 0.00 (0)
Jungle Cat 0.00 (0) 75.00 (9) 25.00 (3) 0.00 (0)
Unidentified 0.00 (0) 21.43 (3) 35.71 (5) 42.86 (6)
Note: Figure in the parentheses indicates the actual number of depredation
Adult Cow13%
Subadult Cow44%
Adult Buffalo9%
Subadult Buffalo7%
AdultGoat25%
Subadult Goat2%
By Leopard
Fowl90%
Subadult Goat10%
By Jackal
Figure 3 Percentage of Domestic Animals Killed by Leopard and Jackal
14
The variation of livestock depredation between different seasons, irrespective of types
of wildlife, is not significant at 5% or 10% level of significance. From the one-way
ANOVA run between different seasons the F-value calculated viz. 0.129 is very low
as compared to the critical values at 5% or 10% level of significance. The variation
between seasons is not significant for the depredation by leopard or jackal only. The
F-value calculated for leopard and jackal were 0.60 and 0.64 respectively which are
again very low in comparison to the critical F value at even 10% level of significance.
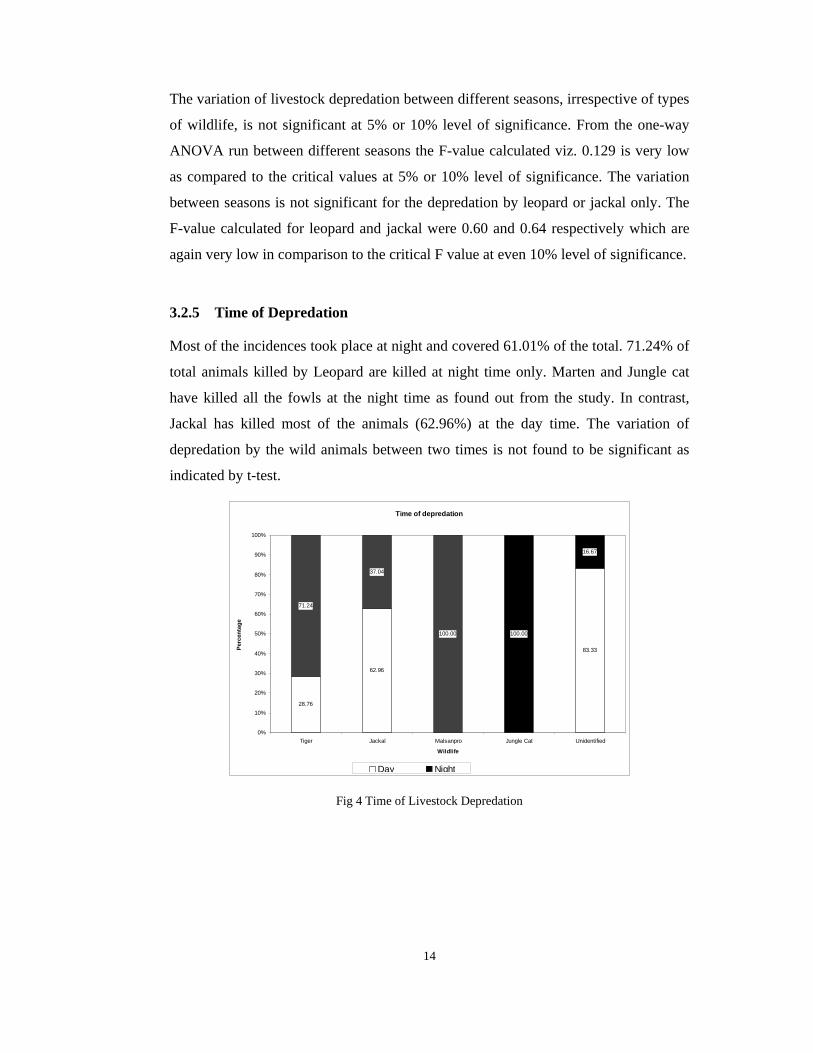
3.2.5 Time of Depredation
Most of the incidences took place at night and covered 61.01% of the total. 71.24% of
total animals killed by Leopard are killed at night time only. Marten and Jungle cat
have killed all the fowls at the night time as found out from the study. In contrast,
Jackal has killed most of the animals (62.96%) at the day time. The variation of
depredation by the wild animals between two times is not found to be significant as
indicated by t-test.
Time of depredation
28.76
62.96
83.33
71.24
37.04
100.00 100.00
16.67
0%
10%
20%
30%
40%
50%
60%
70%
80%
90%
100%
Tiger Jackal Malsanpro Jungle Cat Unidentified
Wildlife
Per
cen
tag
e
Day Night
Fig 4 Time of Livestock Depredation
15
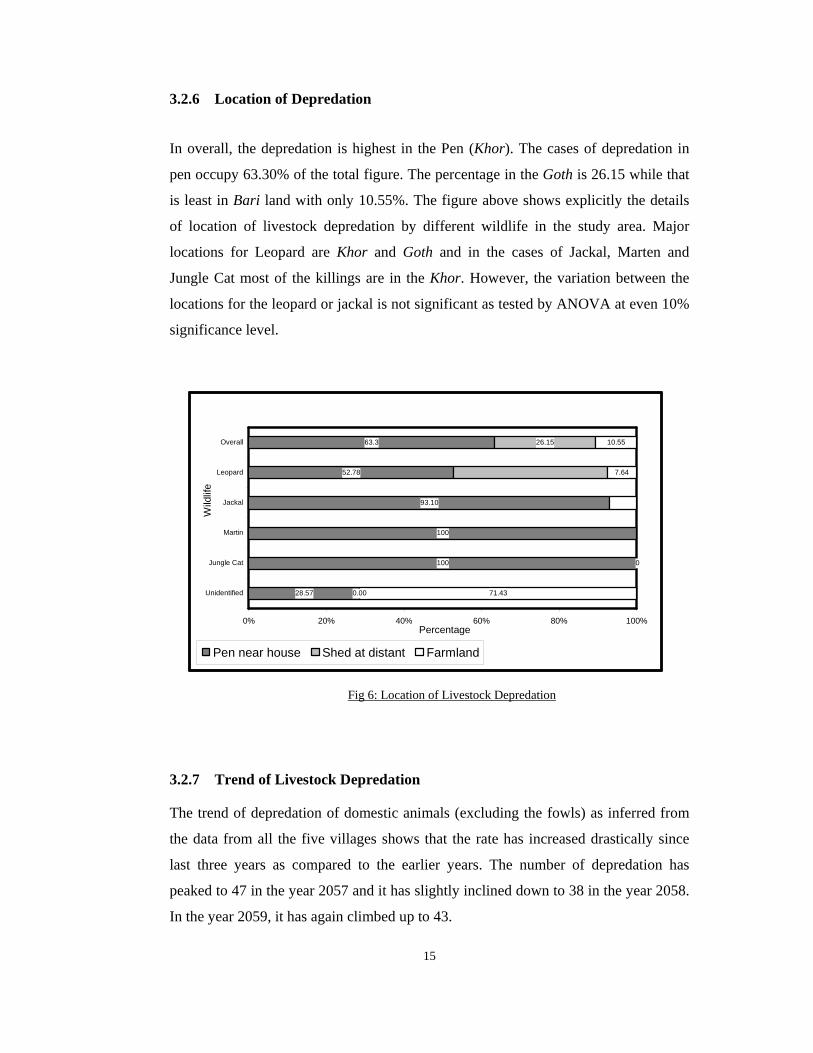
3.2.6 Location of Depredation
In overall, the depredation is highest in the Pen (Khor). The cases of depredation in
pen occupy 63.30% of the total figure. The percentage in the Goth is 26.15 while that
is least in Bari land with only 10.55%. The figure above shows explicitly the details
of location of livestock depredation by different wildlife in the study area. Major
locations for Leopard are Khor and Goth and in the cases of Jackal, Marten and
Jungle Cat most of the killings are in the Khor. However, the variation between the
locations for the leopard or jackal is not significant as tested by ANOVA at even 10%
significance level.
28.57
100
100
93.10
52.78
63.3
0.00
26.15
71.43
7.64
10.55
0
0% 20% 40% 60% 80% 100%
Unidentified
Jungle Cat
Martin
Jackal
Leopard
Overall
Wild
life
Percentage
Pen near house Shed at distant Farmland
Fig 6: Location of Livestock Depredation
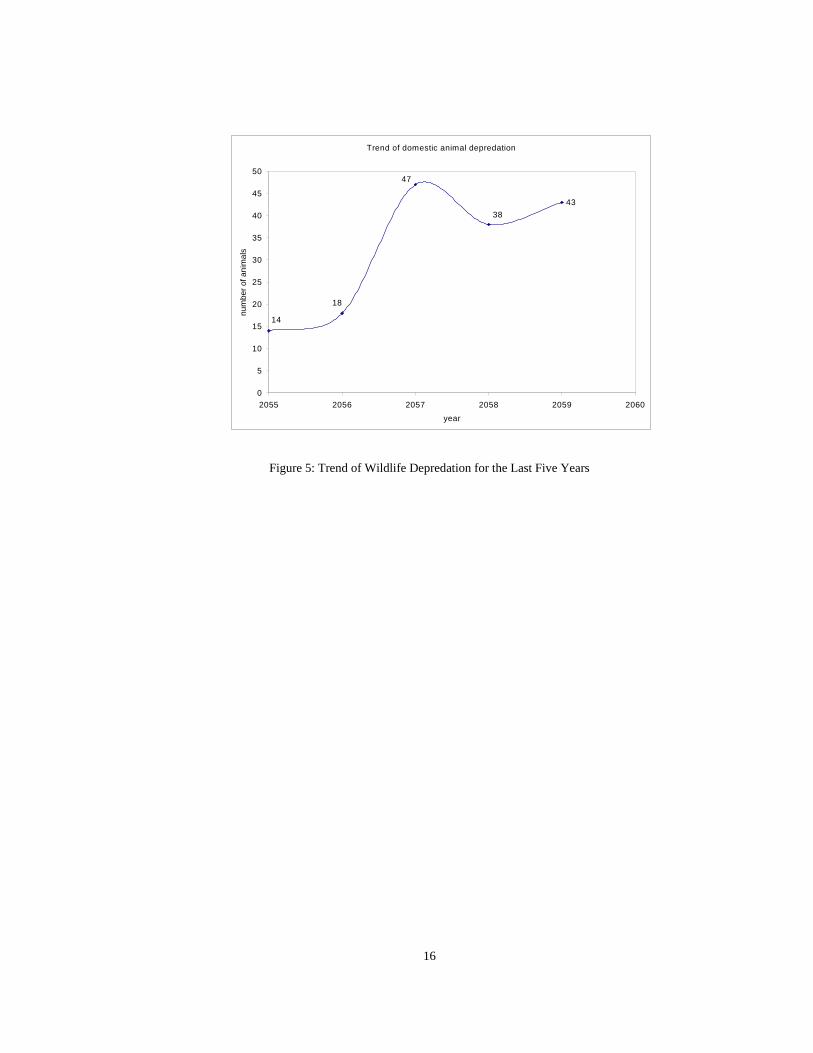
3.2.7 Trend of Livestock Depredation
The trend of depredation of domestic animals (excluding the fowls) as inferred from
the data from all the five villages shows that the rate has increased drastically since
last three years as compared to the earlier years. The number of depredation has
peaked to 47 in the year 2057 and it has slightly inclined down to 38 in the year 2058.
In the year 2059, it has again climbed up to 43.
16
Figure 5: Trend of Wildlife Depredation for the Last Five Years
Trend of domestic animal depredation
43
14
18
38
47
0
5
10
15
20
25
30
35
40
45
50
2055 2056 2057 2058 2059 2060
year
num
ber
of a
nim
als
17
3.3 Extent and Nature of Crop Raiding
3.3.1 Village Wise Crop Raiding
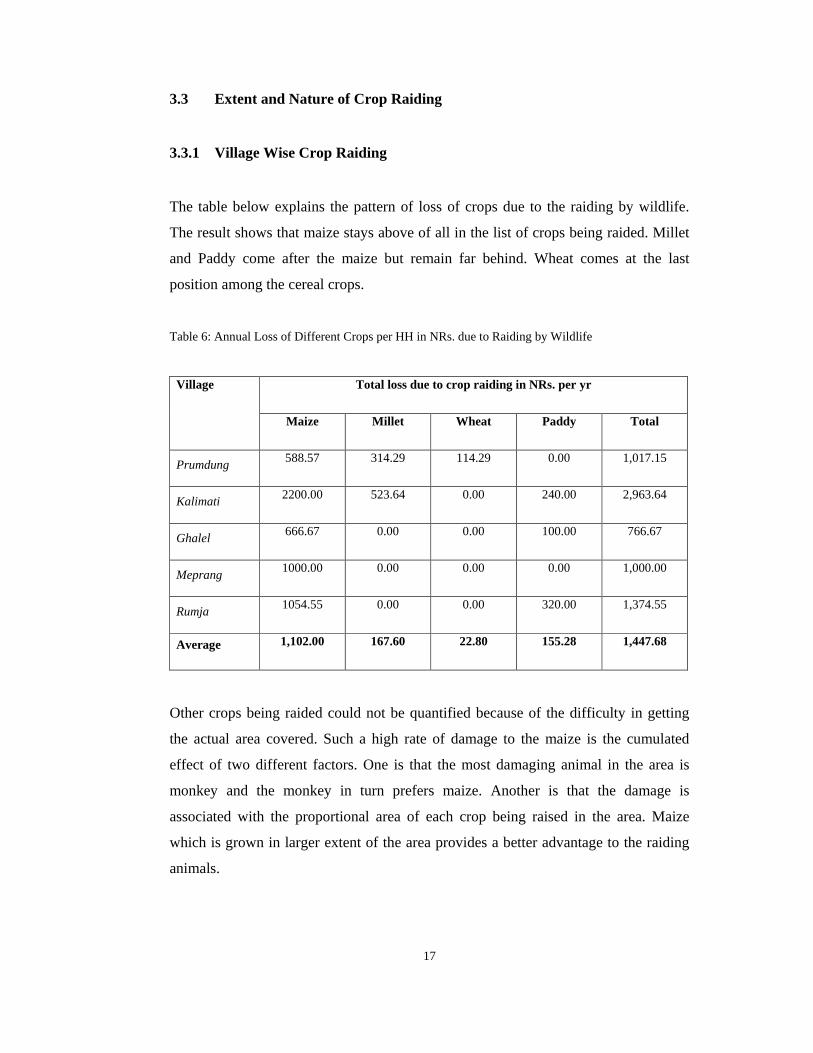
The table below explains the pattern of loss of crops due to the raiding by wildlife.
The result shows that maize stays above of all in the list of crops being raided. Millet
and Paddy come after the maize but remain far behind. Wheat comes at the last
position among the cereal crops.
Table 6: Annual Loss of Different Crops per HH in NRs. due to Raiding by Wildlife
Total loss due to crop raiding in NRs. per yr Village
Maize Millet Wheat Paddy Total
Prumdung 588.57 314.29 114.29 0.00 1,017.15
Kalimati 2200.00 523.64 0.00 240.00 2,963.64
Ghalel 666.67 0.00 0.00 100.00 766.67
Meprang 1000.00 0.00 0.00 0.00 1,000.00
Rumja 1054.55 0.00 0.00 320.00 1,374.55
Average 1,102.00 167.60 22.80 155.28 1,447.68
Other crops being raided could not be quantified because of the difficulty in getting
the actual area covered. Such a high rate of damage to the maize is the cumulated
effect of two different factors. One is that the most damaging animal in the area is
monkey and the monkey in turn prefers maize. Another is that the damage is
associated with the proportional area of each crop being raised in the area. Maize
which is grown in larger extent of the area provides a better advantage to the raiding
animals.
18
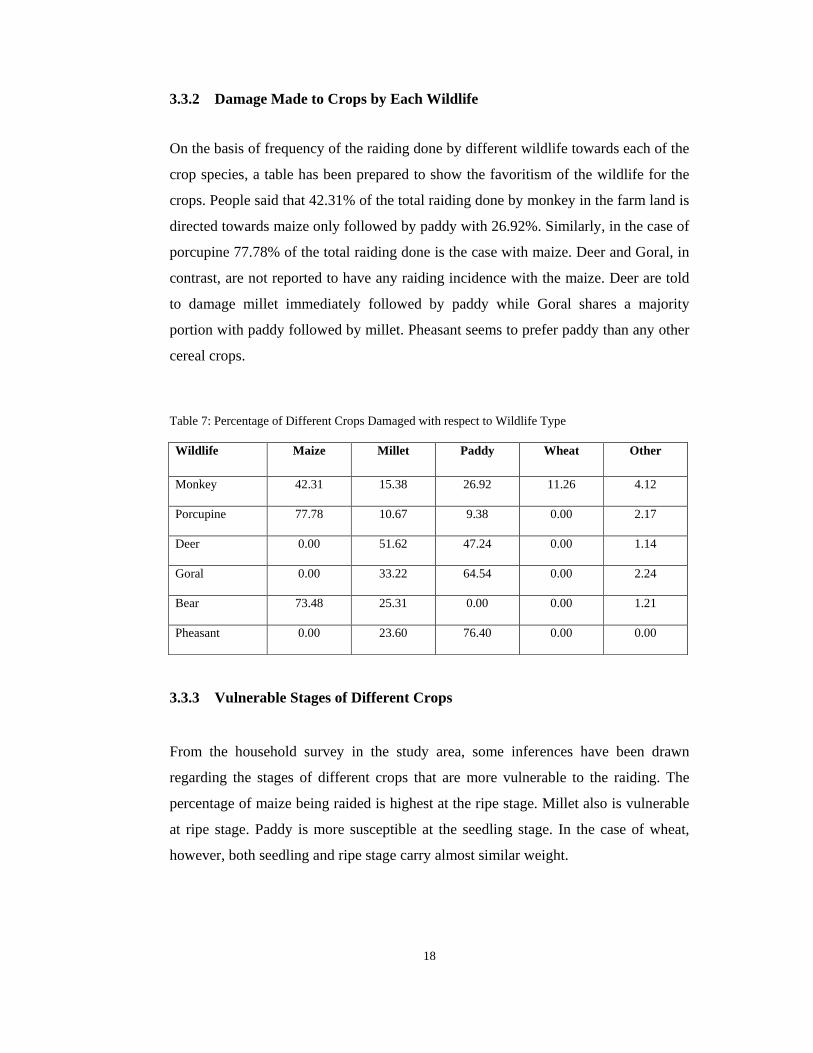
3.3.2 Damage Made to Crops by Each Wildlife
On the basis of frequency of the raiding done by different wildlife towards each of the
crop species, a table has been prepared to show the favoritism of the wildlife for the
crops. People said that 42.31% of the total raiding done by monkey in the farm land is
directed towards maize only followed by paddy with 26.92%. Similarly, in the case of
porcupine 77.78% of the total raiding done is the case with maize. Deer and Goral, in
contrast, are not reported to have any raiding incidence with the maize. Deer are told
to damage millet immediately followed by paddy while Goral shares a majority
portion with paddy followed by millet. Pheasant seems to prefer paddy than any other
cereal crops.
Table 7: Percentage of Different Crops Damaged with respect to Wildlife Type
Wildlife Maize Millet Paddy Wheat Other
Monkey 42.31 15.38 26.92 11.26 4.12
Porcupine 77.78 10.67 9.38 0.00 2.17
Deer 0.00 51.62 47.24 0.00 1.14
Goral 0.00 33.22 64.54 0.00 2.24
Bear 73.48 25.31 0.00 0.00 1.21
Pheasant 0.00 23.60 76.40 0.00 0.00
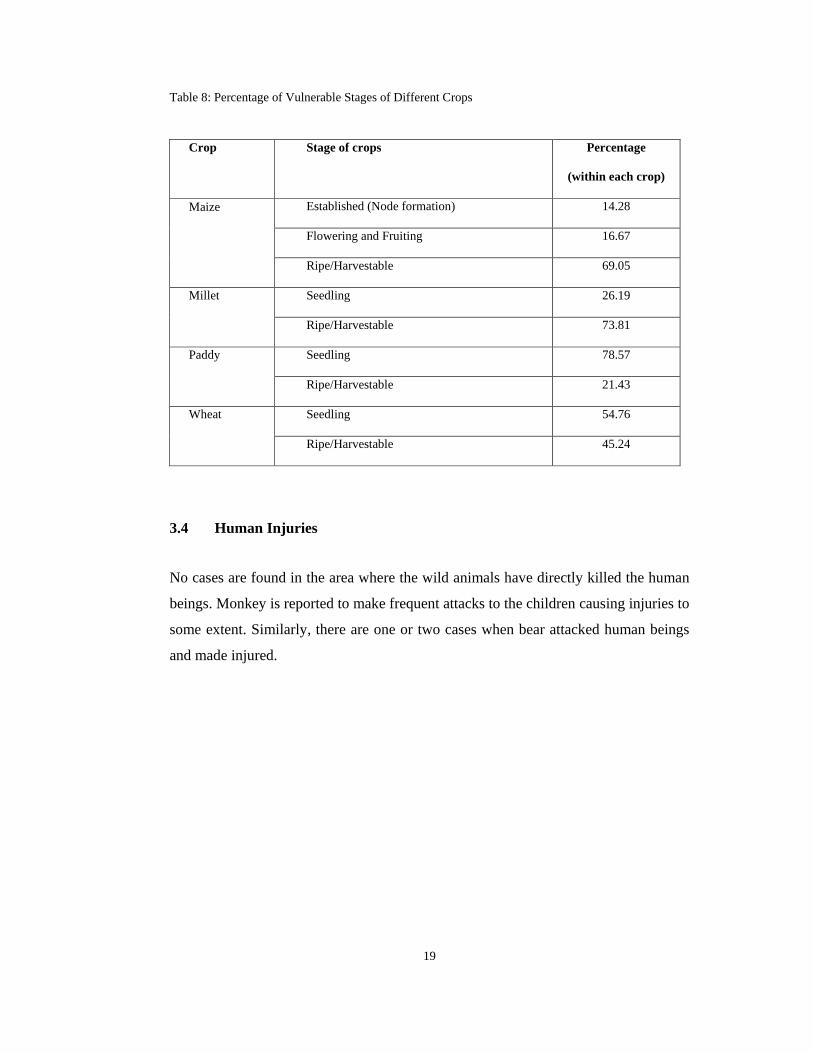
3.3.3 Vulnerable Stages of Different Crops
From the household survey in the study area, some inferences have been drawn
regarding the stages of different crops that are more vulnerable to the raiding. The
percentage of maize being raided is highest at the ripe stage. Millet also is vulnerable
at ripe stage. Paddy is more susceptible at the seedling stage. In the case of wheat,
however, both seedling and ripe stage carry almost similar weight.
19
Table 8: Percentage of Vulnerable Stages of Different Crops
Crop Stage of crops Percentage
(within each crop)
Established (Node formation) 14.28
Flowering and Fruiting 16.67
Maize
Ripe/Harvestable 69.05
Seedling 26.19 Millet
Ripe/Harvestable 73.81
Seedling 78.57 Paddy
Ripe/Harvestable 21.43
Seedling 54.76 Wheat
Ripe/Harvestable 45.24
3.4 Human Injuries
No cases are found in the area where the wild animals have directly killed the human
beings. Monkey is reported to make frequent attacks to the children causing injuries to
some extent. Similarly, there are one or two cases when bear attacked human beings
and made injured.
20
3.5 Preference Ranking of Wildlife
3.5.1 Wildlife Responsible for Livestock Depredation
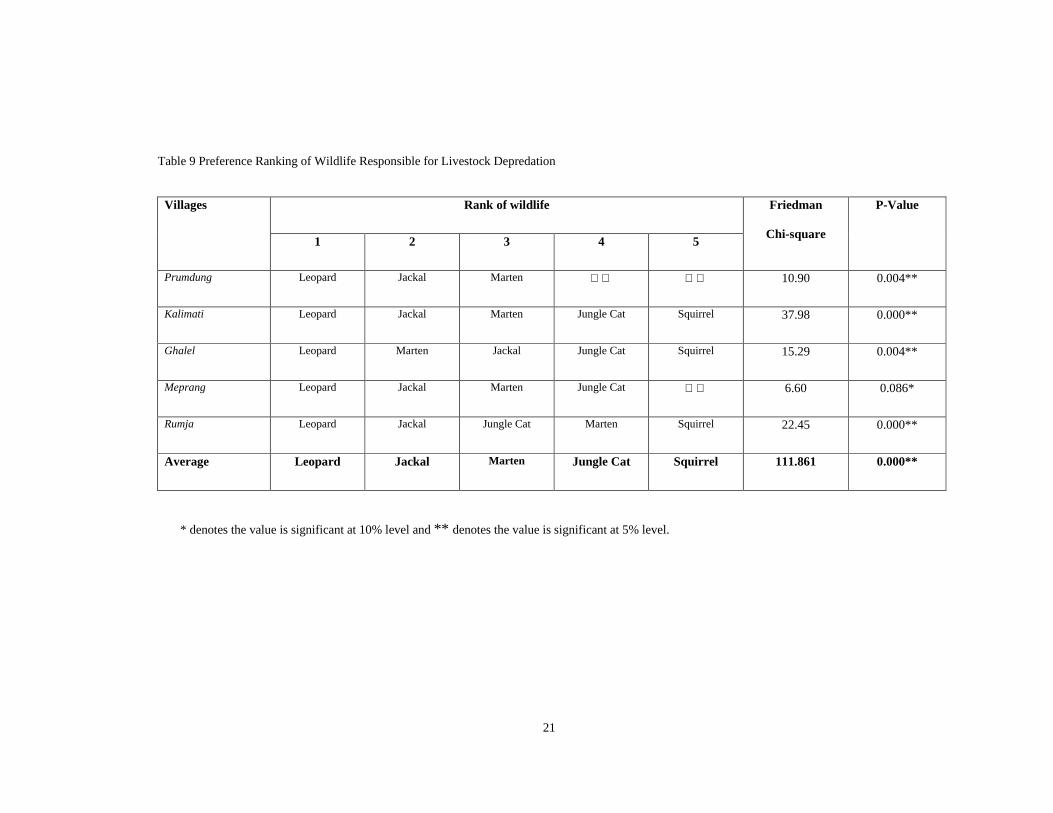
Based on the peoples’ perception wildlife those are responsible for depredation have
been ranked as shown in the table for each village and also for the overall area.
Leopard is ranked number 1 in all the villages so it comes at rank one in overall.
Jackal is ranked 2 in four of the villages and 3 in the remaining one village with
overall second rank. Marten has been ranked in third number as it came in second
place in one, third number in three and fourth number in one of the village. In the
same way, Jungle cat has been placed in rank four while in the fifth rank is Squirrel.
Since, the Friedman chi-square values for the ranking were significant for all the
villages and overall area we can say that the ranking is valid.
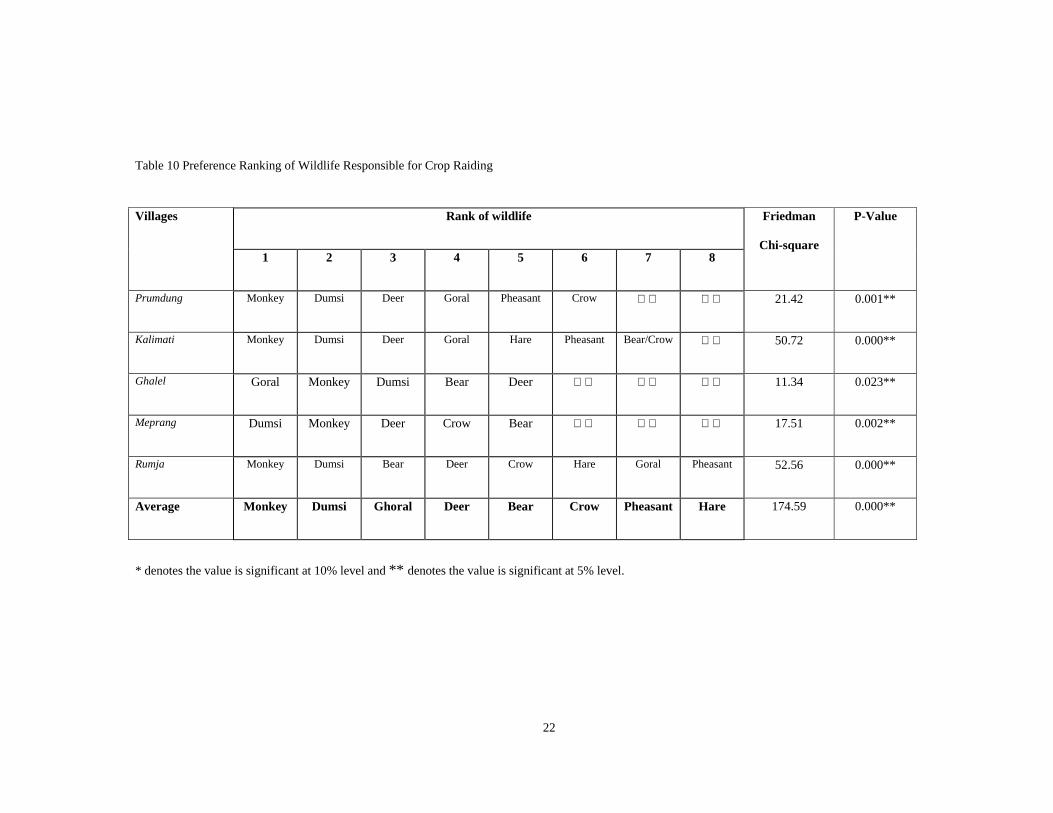
3.5.2 Wildlife Responsible for Crop Raiding
The wildlife responsible for crop raiding have also been ranked on the basis of
peoples perception and preference. In crop raiding, monkey is at the foremost position
in three villages while it is at the second position in the remaining two villages. Goral
is at the topmost rank of damaging wildlife in Ghalel. People told that the steep
sloppy terrain in the village is much favourable to the Goral that is why their number
is growing rapidly. Different to the monkey they are rather sedentary. In Meprang,
Porcupine is found as the most damaging animal. Again, this ranking is also valid, as
the Friedman chi-square values are significant.
21
Table 9 Preference Ranking of Wildlife Responsible for Livestock Depredation
Rank of wildlife Villages
1 2 3 4 5
Friedman
Chi-square
P-Value
Prumdung Leopard Jackal Marten 10.90 0.004**
Kalimati Leopard Jackal Marten Jungle Cat Squirrel 37.98 0.000**
Ghalel Leopard Marten Jackal Jungle Cat Squirrel 15.29 0.004**
Meprang Leopard Jackal Marten Jungle Cat 6.60 0.086*
Rumja Leopard Jackal Jungle Cat Marten Squirrel 22.45 0.000**
Average Leopard Jackal Marten Jungle Cat Squirrel 111.861 0.000**
* denotes the value is significant at 10% level and ** denotes the value is significant at 5% level.
22
Table 10 Preference Ranking of Wildlife Responsible for Crop Raiding
Rank of wildlife Villages
1 2 3 4 5 6 7 8
Friedman
Chi-square
P-Value
Prumdung Monkey Dumsi Deer Goral Pheasant Crow 21.42 0.001**
Kalimati Monkey Dumsi Deer Goral Hare Pheasant Bear/Crow 50.72 0.000**
Ghalel Goral Monkey Dumsi Bear Deer 11.34 0.023**
Meprang Dumsi Monkey Deer Crow Bear 17.51 0.002**
Rumja Monkey Dumsi Bear Deer Crow Hare Goral Pheasant 52.56 0.000**
Average Monkey Dumsi Ghoral Deer Bear Crow Pheasant Hare 174.59 0.000**
* denotes the value is significant at 10% level and ** denotes the value is significant at 5% level.
23
3.6 Measures Adopted by Villagers
Before the establishment of the conservation area, people used to give time, as per
necessary, to kill the monkey and this activity is commonly known as Jhara Laune.
Besides, people used to keep dogs, which would help to whip the monkey away and
to kill the deer. But such practices are no more in use at present.
Villagers are using very few measures to cope with the livestock depredation and crop
raiding by the wildlife. To protect their domestic animals people look after them while
grazing. But enough manpower is not deployed for the large herd of livestock.
To get rid of crop raiding, people should give their time to look after the crops. At
least, one adult person is required to stay in the farm in the season when the maize
ripens. Even in this situation there is crop raiding all the time, as the local people
coded. Whipping away the wildlife is also in practice to make those animals escape
away. Somewhere, special structures are placed in the field to fright the animals.
Mukhundo is used to frighten the monkey. To stop the nuisance activities of
porcupine, options like fencing, trapping and smoking at holes are being tried by the
local people but none of them are effective according to them.
Change or modification in cropping pattern is found almost nil in the area. Any
departure from the prevailing pattern and structure of cropping style demands a
certain degree of economic risk. Poor people who are dependent on agriculture solely
can not afford such risk and are thus forced not to adopt any innovative type of
cropping system. Rather, some people are compelled to leave their raiding prone area
barren while others have no option than to migrate to other places due to the problem.
24
4. CONCLUSIONS AND MANAGEMENT OPTIONS
4.1 Conclusions
The problem of wildlife damage prevails in all the villages under study. There are
severe problems related to livestock depredation and crop raiding while there are only
few cases of human injuries by the wildlife attacks. People feel that after the
establishment of ACAP there has been a significant increase in the number of wild
animals and the trend of wildlife damage is increasing. The result obtained from the
actual loss confirms people's preference ranking of different wild animals for
livestock depredation and crop raiding separately.
Common leopard and Jackal are the major actors in the livestock depredation. The
leopard mostly attacks larger animals like cow and buffalo while Jackal is more
associated with goat and fowl. Subadult cow are found most vulnerable to the leopard.
Slight differences in livestock depredation by wildlife with respect to seasons, time
and location, are observed but are not valid statistically even at 10% confidence
interval.
Monkey, Porcupine, Deer, Goral, Bear and Pheasants are the major threats to the
crops. Among them monkey comes at the first place, which has comparatively higher
rate of damage. From the vulnerability point of view maize comes above all the cereal
crops followed by millet and paddy. Most of these are crops are vulnerable at the time
of seedling and later when they are ripe.
People say they are almost helpless against the leopard and no significant efforts are
being undertaken by the people to reduce its impact. People, however, are applying a
variety of preventive measures to control the crop damage. They look after the crop in
the field at the susceptible seasons, they whip and escape away the raiders, and they
have created frightening structures in the field. Still, they are not able to completely
check the damage and there is a certain degree of damage every year. People perceive
monkey as their closest enemy and when asked about the possible solutions they see
no other option than to kill them. Few management options are recommended
hereafter so that there could be a decrease in the rate of wildlife damage.
25
4.2 Management Options to Minimize the Conflicts
4.2.1 Preventive Measures
A. For Livestock Depredation
i. Shepherd
There is no good mechanism of looking after the domestic animals by the shepherd
while grazing them. In some cases, people do show little care in this matter. While in
most of the cases, large herd of animals should be looked after by a single person
where the effectiveness of the work is under question. People felt that looking after
the animals against leopard is not a good solution.
ii. Safe Pens (Khor)
The result from the study shows that most of the incidences took place in the Khor,
even the statement is true for leopard. In some cases, even there were surplus killings
by the wildlife due to the lack of safe pens. Hence, the recommendation to come out
with predator proof pens seems pretty rational in these circumstances.
iii. Allocating Safer Grazing Area for the Domestic Animals
ACA authorities should ponder the option of allocating safe area for grazing the
domestic animals. In the case, different areas will be distinguished; people will not
graze their animals in the core areas where there will be higher chances of
confrontation with the wild animals. Jackson et. al. (1996) had also recommended to
create core areas for snow leopard and blue sheep as an option in reducing livestock
depredation. Simailarly, Kharel (1997), has recommended land-use zoning in the
Langtang National Park, Nepal to establish ecological barriers between the core
wildlife habitat and human settlements, thereby reducing tensions.
26
B. For Crop Raiding
In all the villages, most of people told that the only option to get rid of the monkey is
to kill them. From their perception, it seems reasonable because they have already
applied different sorts of options and still could not get out of this nuisance
disturbances.
Porcupine which is the next damaging animal has also harassed the people almost at
the level the monkey does. People couldn’t find any solution to keep the animal under
control that is why people were all the time asking if the ACA personnel have any
technique to solve the problem.
i. Guard Dogs
As people told, they used to keep the guard dogs in the early days, to care their
animals against the crop raiders. The revival of the same practice once again will be
helpful in the reduction in crop raiding. Improved breeds of guard dogs can be useful
even to check the livestock depredation to some extent.
ii. Change in Cropping Pattern
Changing of cropping pattern from more palatable species or varieties to less
palatable types will be a major preventive measure in crop raiding. As mentioned
above, people are not in the condition to take any risk for the adoption of new ways in
cropping. Intervention by the ACA to help people in this regard seems a good option.
Experience of the local people says that some varieties of crops (especially the paddy)
are more favored by the wild animals than the others. Likewise, mustard is the least
preferred crop amongst the crops being planted currently. Raising of unpalatable
crops at the edges of the cultivated land will distract the animals from entering the
area. The mixture of soyabean with paddy has resulted in disastrous consequences.
Therefore, a shift from cropping mixture and cropping pattern might also work, but it
should be recommended only after a good deal of researches and studies.
27
iii. Arrangements of People (heralu)
People are doing hard effort to look after the crops, especially when they are ripe. To
look after the monkey only they have to deploy at least one person for almost 18
hours a day in the farmland for more than one month. Even though, they are unable to
protect their crops at the utmost level and every year there is damage to some extent.
People who have their parcels of lands at the middle of the arable land show little
concern for the others who suffer more just because their lands fall at the edges of
forest or grassland. A community effort is necessary to look after the crops in an
efficient way and there should be such arrangements that everybody in the village will
feel his/her responsibility in minimizing the crop loss.
iv. Others
There are some ways to escape away the animals, which are rather supplementary to
the previous options. Making special structures or fabrications by plastics, old clothes
etc that resembles to human being and other animals will frighten the raiding animals
especially the birds. Similarly, use of some musical instruments can make the wild
animals afraid. Use of Madal (a musical instrument) is said to be quite helpful to whip
away the monkey.
4.2.2 Remedial Measures
i. Compensation for Loss
People were inquisitive if the ACA authority will bring any system of compensation
for them and they will feel relieved. Every time they mentioned the amount of loss to
their livestock and crops they expressed their hopes that they will be compensated
with the money. The logic behind claiming the compensation sounds real if there is
not any mistake from the people’s part viz. they had adopted all the safety measures
against predation or crop raiding and the sole responsibility is of the ACA.
28
ii. Community Development and IGAs
The indirect method of resolving the conflict may be through the community
development and Income Generation Activities (IGAs). The ACA management can
provide supports for the development of different sectors in the villages. On the other
hand, programs and trainings on IGAs could be launched so that people will be
benefited. Alternative sources of income will make the people relieve from the
problems of damaging animals. This will also help to minimize the attack made to the
wild animals by people as retaliation for their damage.
29
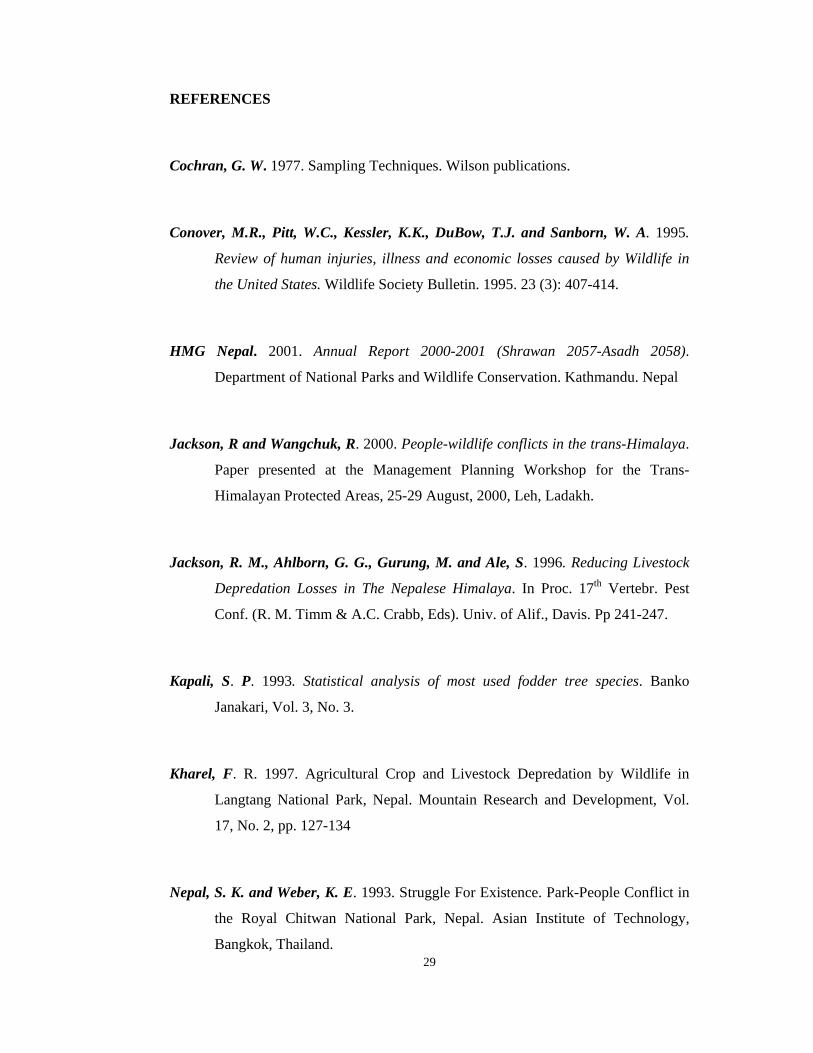
REFERENCES
Cochran, G. W. 1977. Sampling Techniques. Wilson publications.
Conover, M.R., Pitt, W.C., Kessler, K.K., DuBow, T.J. and Sanborn, W. A. 1995.
Review of human injuries, illness and economic losses caused by Wildlife in
the United States. Wildlife Society Bulletin. 1995. 23 (3): 407-414.
HMG Nepal. 2001. Annual Report 2000-2001 (Shrawan 2057-Asadh 2058).
Department of National Parks and Wildlife Conservation. Kathmandu. Nepal
Jackson, R and Wangchuk, R. 2000. People-wildlife conflicts in the trans-Himalaya.
Paper presented at the Management Planning Workshop for the Trans-
Himalayan Protected Areas, 25-29 August, 2000, Leh, Ladakh.
Jackson, R. M., Ahlborn, G. G., Gurung, M. and Ale, S. 1996. Reducing Livestock
Depredation Losses in The Nepalese Himalaya. In Proc. 17th Vertebr. Pest
Conf. (R. M. Timm & A.C. Crabb, Eds). Univ. of Alif., Davis. Pp 241-247.
Kapali, S. P. 1993. Statistical analysis of most used fodder tree species. Banko
Janakari, Vol. 3, No. 3.
Kharel, F. R. 1997. Agricultural Crop and Livestock Depredation by Wildlife in
Langtang National Park, Nepal. Mountain Research and Development, Vol.
17, No. 2, pp. 127-134
Nepal, S. K. and Weber, K. E. 1993. Struggle For Existence. Park-People Conflict in
the Royal Chitwan National Park, Nepal. Asian Institute of Technology,
Bangkok, Thailand.
30
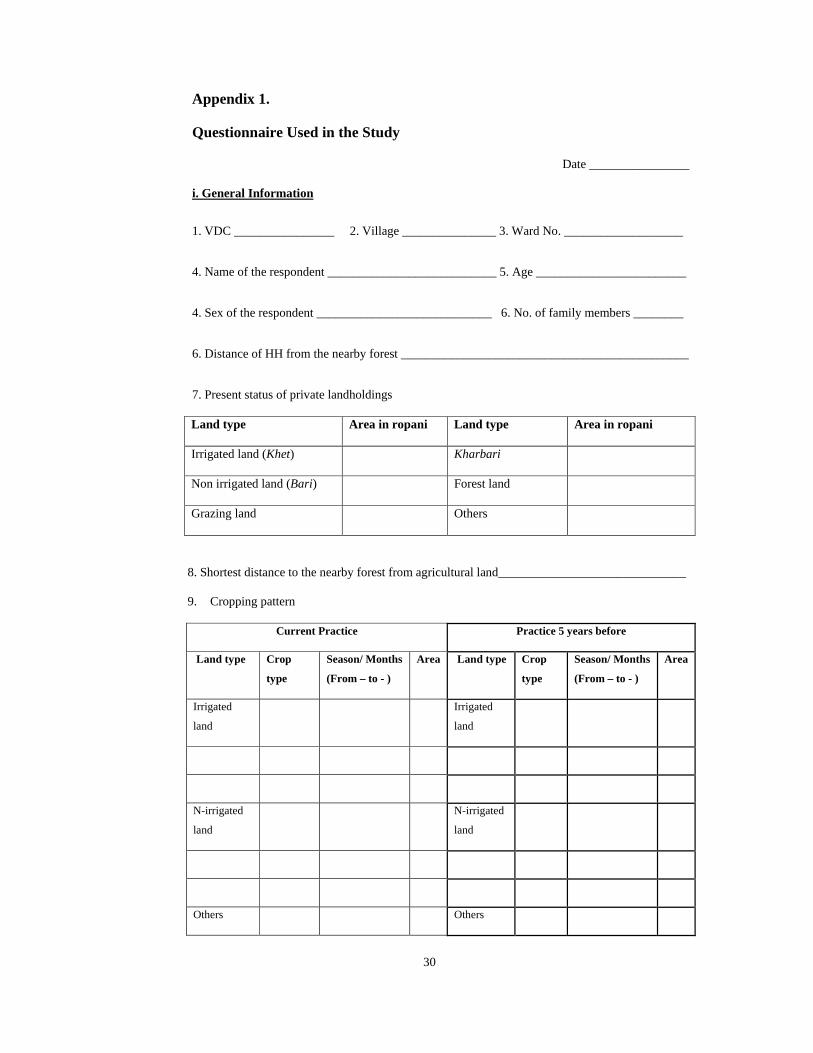
Appendix 1.
Questionnaire Used in the Study
Date ________________
i. General Information
1. VDC ________________ 2. Village _______________ 3. Ward No. ___________________
4. Name of the respondent ___________________________ 5. Age ________________________
4. Sex of the respondent ____________________________ 6. No. of family members ________
6. Distance of HH from the nearby forest ______________________________________________
7. Present status of private landholdings
Land type Area in ropani Land type Area in ropani
Irrigated land (Khet) Kharbari
Non irrigated land (Bari) Forest land
Grazing land Others
8. Shortest distance to the nearby forest from agricultural land______________________________
9. Cropping pattern
Current Practice Practice 5 years before
Land type Crop
type
Season/ Months
(From – to - )
Area Land type Crop
type
Season/ Months
(From – to - )
Area
Irrigated
land
Irrigated
land
N-irrigated
land
N-irrigated
land
Others Others
31
10. Other sources of income
__________________________________
__________________________________
ii. Livestock Farming
1. Livestock Ownership at present
Age distribution Type of Livestock Sex
< 1 yr 1-2 yr 2-3 yr > 3 yr
Total
Male
Female
Male
Female
Male
Female
Male
Female
2. Livestock Ownership 5 years ago
Age distribution Type of Livestock Sex
< 1 yr 1-2 yr 2-3 yr > 3 yr
Total
Male
Female
Male
Female
Male
Female
Male
Female
32
3. What type of livestock farming system do you practice, currently?
a. Stall feeding b. Partial Stall feeding c. Free grazing d. Others__________
4. What type of livestock farming system did you practice, five years ago?
a. Stall feeding b. Partial Stall feeding c. Free grazing d. Others__________
iii. Livestock Depredation and Crop Raiding
1. Which is the most damaging wildlife? Rank if more than one.
Livestock depredation Crop raiding
a. ___________________ a. ___________________
b. ___________________ b. ___________________
c. ___________________ c. ___________________
2. Which livestock/crop is/are the most vulnerable? List if more than one in decreasing intensity.
Vulnerable Livestock Vulnerable Crop
a. ___________________ a. ___________________
b. ___________________ b. ___________________
c. ___________________ c. ___________________
3. Which is the most vulnerable season? List if more than one in descending order.
Livestock depredation Crop raiding
a. ___________________ a. ___________________
b. ___________________ b. ___________________
c. ___________________ c. ___________________
4. Do you think there is any specific location/s for livestock depredation and crop raiding? If yes,
where?
Livestock depredation Crop raiding
a. ___________________ a. ___________________
b. ___________________ b. ___________________
5. Do you practice keeping livestock in Goth?
__________________________________________
33
6. What is the rate of livestock depredation in Goth as compared to others?
a. High b. Low c. Same d. don’t know
7. If different, what might be the probable reasons?
8. How is the general trend of livestock depredation and crop raiding, in your locality/area?
Livestock depredation Crop raiding
a. Increasing a. Increasing
b. Decreasing b. Decreasing
c. Same c. Same
9. What do you think is/are major responsible factor/s for such trend?
Livestock depredation Crop raiding
a. ___________________ a. ___________________
b. ___________________ b. ___________________
10. Measures adopted by you to control livestock depredation, if any.
Livestock depredation Crop raiding
a. ___________________ a. ___________________
b. ___________________ b. ___________________
11. Measures adopted by others in your village, as far as you know
Livestock depredation Crop raiding
a. ___________________ a. ___________________
b. ___________________ b. ___________________
34
iv. Miscellaneous
1. Do you feel any change in number of wildlife in this area? If yes, please enter the table below.
Wildlife Increased/ Decreased Reason
2. Please rank the possible ways to minimize the livestock depredation and crop raiding by wildlife.
Give number 1 for best option, number 2 for next best option and so on.
Possible ways Ranking Possible ways Ranking
Use of household shepherd Use of community hired shepherd
Use of guard dogs Avoiding areas with high predation risk
Trapping/killing of problem animal Others _________________________
Others __________________ Others _________________________
3. Have you any suggestions to minimize the prevailing conflict between conservation area
authority and local people.
1. ___________________________________________________________________________
2. ___________________________________________________________________________
3. ___________________________________________________________________________
35
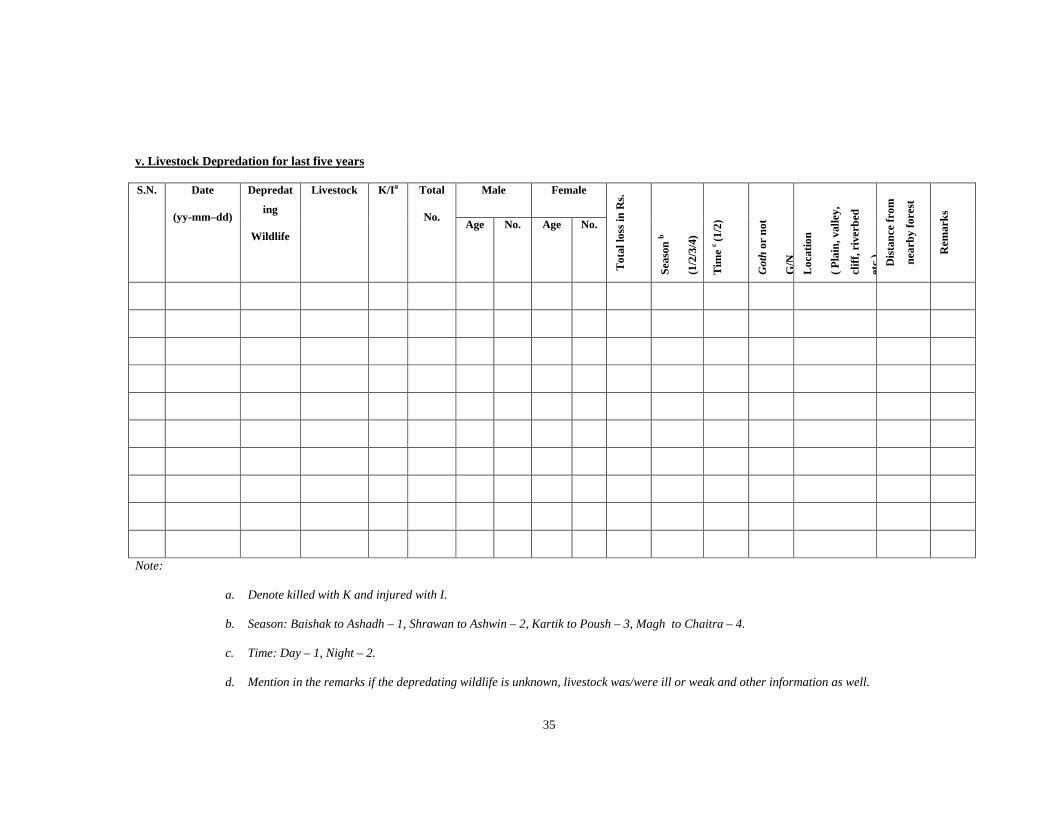
v. Livestock Depredation for last five years
Male Female S.N. Date
(yy-mm–dd)
Depredat
ing
Wildlife
Livestock K/Ia Total
No. Age No. Age No.
Tot
al lo
ss in
Rs.
Sea
son b
(1/2
/3/4
)
Tim
e c (1
/2)
Got
h or
not
G/N
Loca
tion
( P
lain
, val
ley,
cliff
, riv
erbe
d
etc.
) D
ista
nce
from
near
by fo
rest
Rem
arks
Note:
a. Denote killed with K and injured with I.
b. Season: Baishak to Ashadh – 1, Shrawan to Ashwin – 2, Kartik to Poush – 3, Magh to Chaitra – 4.
c. Time: Day – 1, Night – 2.
d. Mention in the remarks if the depredating wildlife is unknown, livestock was/were ill or weak and other information as well.
36
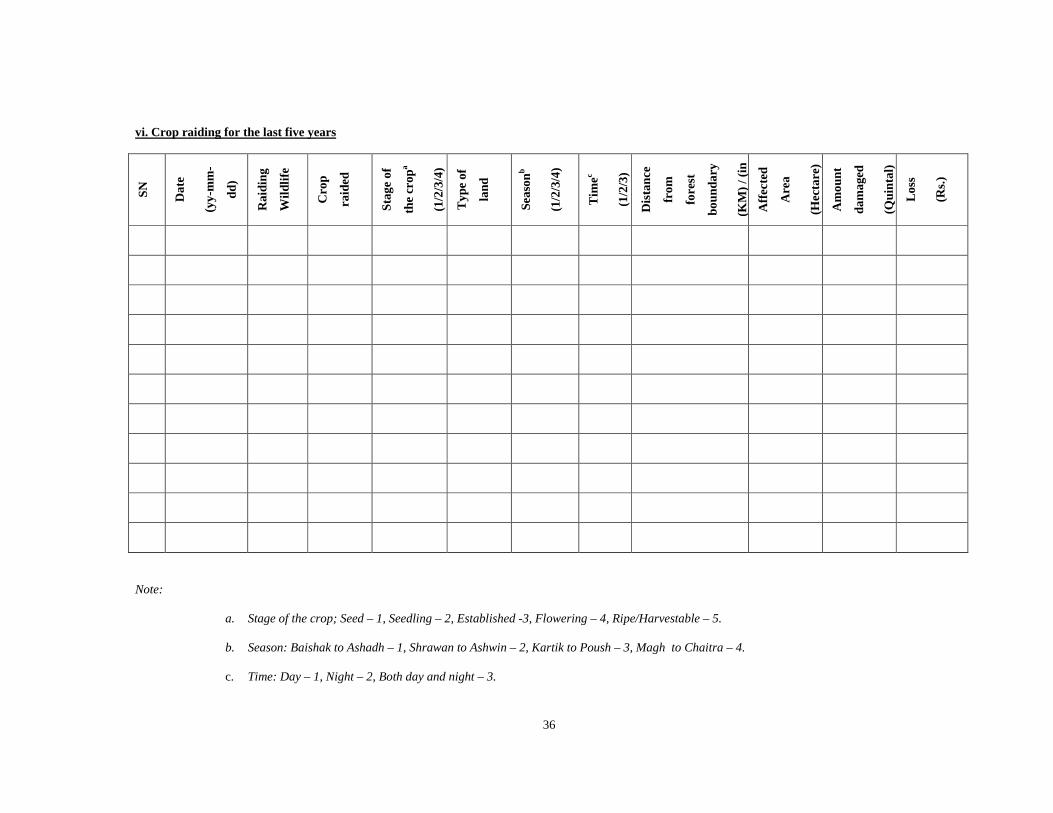
vi. Crop raiding for the last five years S
N
Dat
e
(yy-
mm
-
dd)
Rai
ding
Wild
life
Cro
p
raid
ed
Sta
ge o
f
the
crop
a
(1/2
/3/4
)
Typ
e of
land
Sea
sonb
(1/2
/3/4
)
Tim
ec
(1/2
/3)
Dis
tanc
e
from
fore
st
boun
dary
(KM
) / (
in
Affe
cted
Are
a
(Hec
tare
)
Am
ount
dam
aged
(Qui
ntal
)
Loss
(Rs.
)
Note:
a. Stage of the crop; Seed – 1, Seedling – 2, Established -3, Flowering – 4, Ripe/Harvestable – 5.
b. Season: Baishak to Ashadh – 1, Shrawan to Ashwin – 2, Kartik to Poush – 3, Magh to Chaitra – 4.
c. Time: Day – 1, Night – 2, Both day and night – 3.
37
Appendix 2.
Checklist for Key Informant Interview
1. Trend of livestock and crop depredation
a. Trend of livestock depredation
b. Trend of crop depredation
c. Problem animal
2. Wildlife Status and Trend
a. Wildlife population
b. Habitat change
c. Change in food behavior
3. Impact of local people and their livestock farming on wildlife
a. Grazing pattern of livestock
b. Illegal hunting and poaching of wildlife by local people
c. Trapping/Killing as retaliation
4. Practice of Goth
a. Rate of livestock depredation in Goth
b. Trend of livestock keeping in the Goth
c. Seasonal/Year round
5. Measures taken by conservation area to minimize the livestock and crop depredation
a. Measures undertaken
b. Efficiency of such measures
c. Plan for future
6. Measures taken to minimize the park people conflict generated by livestock and crop depredation
a. Measures taken (Financial compensation, Income generation activities etc.)
b. Efficiency of such measures
c. Future plan
7. Involvement of any CBOs in this concern
a. Name of CBOs
b. Coverage, Working field and Duration
c. Major activities and involvement in this concern
8. Management options should be
a. Problem animal specific
b. Victim area specific ie. Close distance to the forest
Related Documents