arXiv:astro-ph/0605186v1 6 May 2006 Oscillator Strengths and Predissociation Rates for Rydberg Transitions in 12 C 16 O, 13 C 16 O, and 13 C 18 O Involving the E 1 Π, B 1 Σ + , and W 1 Π States M. Eidelsberg 1 , Y. Sheffer 2 , S.R. Federman 2 , J.L. Lemaire 1 , 3 , J.H. Fillion 1, 3 , F. Rostas 1 , and J. Ruiz 4 ABSTRACT One of the processes controlling the interstellar CO abundance and the ratio of its isotopologues is photodissociation. Accurate oscillator strengths and predis- sociation rates for Rydberg transitions are needed for modeling this process. We present results on absorption from the E 1 Π - X 1 Σ + (1-0) and B 1 Σ + - X 1 Σ + (6-0) bands at 1051 and 1002 ˚ A, respectively, and the vibrational progression W 1 Π - X 1 Σ + (v ′ -0) bands with v ′ = 0 to 3 at 972, 956, 941, and 925 ˚ A, respectively. The corresponding spectra were acquired at the high resolution (R ≈ 30,000) SU5 beam line at the Super ACO Synchrotron in Orsay, France. Spectra were obtained for the 12 C 16 O, 13 C 16 O, and 13 C 18 O isotopologues. These represent the most complete set of measurements available. Comparison is made with earlier results, both empirical and theoretical. While earlier determinations of oscillator strengths based on absorption from synchrotron radiation tend to be somewhat smaller than ours, the suite of measurements from a variety of techniques agree for the most part considering the mutual uncertainties. For the bands studied here, their relative weakness, or their significant line widths arising from predissociation, minimizes potential problems from large optical depths at line center in absorption measurements. Predissociating line widths could gener- ally be extracted from the spectra thanks to the profile simulations used in the analysis. In many cases, these simulations allowed us to consider e and f parity levels separately and to determine the dependence of the width on rotational quantum number, J . Our results are consistent with earlier determinations, es- pecially the widths inferred from laser experiments. 1 Observatoire de Paris-Meudon, LERMA UMR8112 du CNRS, France; [email protected]; [email protected]; Jean-Hugues.fi[email protected]; [email protected]. 2 Department of Physics and Astronomy, University of Toledo, Toledo, OH 43606; ysheff[email protected]; [email protected]. 3 Universit´ e de Cergy-Pontoise, LERMA UMR8112 du CNRS, France. 4 Department of Applied Physics I, Universidad de M´ alaga, 29071-M´alaga,Spain; [email protected].

Welcome message from author
This document is posted to help you gain knowledge. Please leave a comment to let me know what you think about it! Share it to your friends and learn new things together.
Transcript
arX
iv:a
stro
-ph/
0605
186v
1 6
May
200
6
Oscillator Strengths and Predissociation Rates for Rydberg
Transitions in 12C16O, 13C16O, and 13C18O Involving the E 1Π,
B 1Σ+, and W 1Π States
M. Eidelsberg1, Y. Sheffer2, S.R. Federman2, J.L. Lemaire1,3, J.H. Fillion1,3, F. Rostas1,
and J. Ruiz4
ABSTRACT
One of the processes controlling the interstellar CO abundance and the ratio
of its isotopologues is photodissociation. Accurate oscillator strengths and predis-
sociation rates for Rydberg transitions are needed for modeling this process. We
present results on absorption from the E 1Π−X 1Σ+ (1-0) and B 1Σ+−X 1Σ+
(6-0) bands at 1051 and 1002 A, respectively, and the vibrational progression
W 1Π − X 1Σ+ (v′-0) bands with v′ = 0 to 3 at 972, 956, 941, and 925 A,
respectively. The corresponding spectra were acquired at the high resolution
(R ≈ 30,000) SU5 beam line at the Super ACO Synchrotron in Orsay, France.
Spectra were obtained for the 12C16O, 13C16O, and 13C18O isotopologues. These
represent the most complete set of measurements available. Comparison is made
with earlier results, both empirical and theoretical. While earlier determinations
of oscillator strengths based on absorption from synchrotron radiation tend to
be somewhat smaller than ours, the suite of measurements from a variety of
techniques agree for the most part considering the mutual uncertainties. For the
bands studied here, their relative weakness, or their significant line widths arising
from predissociation, minimizes potential problems from large optical depths at
line center in absorption measurements. Predissociating line widths could gener-
ally be extracted from the spectra thanks to the profile simulations used in the
analysis. In many cases, these simulations allowed us to consider e and f parity
levels separately and to determine the dependence of the width on rotational
quantum number, J . Our results are consistent with earlier determinations, es-
pecially the widths inferred from laser experiments.
1Observatoire de Paris-Meudon, LERMA UMR8112 du CNRS, France; [email protected];
[email protected]; [email protected]; [email protected].
2Department of Physics and Astronomy, University of Toledo, Toledo, OH 43606;
[email protected]; [email protected].
3Universite de Cergy-Pontoise, LERMA UMR8112 du CNRS, France.
4Department of Applied Physics I, Universidad de Malaga, 29071-Malaga, Spain; [email protected].
– 2 –
Subject headings: ISM: molecules − molecular data − ultraviolet:ISM − tech-
niques: spectroscopic
1. Introduction
The photochemistry of CO plays an important role in photon dominated regions (PDRs)
of interstellar clouds, circumstellar shells surrounding AGB stars, planetary nebulae, circum-
stellar disks around young stars, and comets. Models of these regions (e.g., van Dishoeck &
Black 1988; Sternberg & Dalgarno 1995; Hollenbach & Tielens 1997, and references therein)
use observational data on CO transitions to extract physical conditions. The models rely on
oscillator strengths for dissociating transitions (e.g., Letzelter et al. 1987; Eidelsberg et al.
1991; Chan, Cooper, & Brion 1993; Federman et al. 2001; Sheffer, Federman, & Andersson
2003; Eidelsberg et al. 2004a). While a consensus is emerging for oscillator strengths per-
taining to many of the important electronic transitions (Federman et al. 2001; Eidelsberg et
al. 2004a), the large number of transitions leading to photodissociation warrants a careful as-
sessment of as many measurements as possible. Here we present results on the E 1Π−X 1Σ+
(1-0), B 1Σ+− X 1Σ+ (6-0), and core excited W (A2Π+) 1Π −X 1Σ+ (v′-0) bands with v′
= 0 to 3 for 12C16O, 13C16O, and 13C18O acquired at the Super ACO synchrotron source in
Orsay, France.
These results are a continuation of our earlier efforts. Federman et al. (2001) studied
Rydberg transitions from the ground vibrational level in 12C16O between 1150 A and about
1075 A. The limitation on the short wavelength end was the presence of LiF windows for the
gas cell. More recently, a system without windows based on differential pumping allowed
us to measure CO absorption from bands with wavelengths approaching 912 A, the Lyman
limit. Eidelsberg et al. (2004a) analyzed the strongly interacting bands [K − X (0-0),
L′−X (1-0), and L−X (0-0)] near 970 A in 12C16O, 13C16O, and 13C18O. We now turn our
attention to the other transitions involving Rydberg states that were acquired during the
same synchrotron runs. The transitions discussed in the present paper are seen in interstellar
spectra (Sheffer et al. 2003) and are important for CO photodissociation (van Dishoeck &
Black 1988).
2. Experimental Details and Data Analysis
Since our spectra were acquired during the runs described by Eidelsberg et al. (2004a),
we only provide a brief overview here. The measurements were obtained on the Super ACO
– 3 –
synchrotron ring using the high spectral resolution SU5 beam line (Nahon et al. 2001a, b).
The spectrometer consisted of a 2400 lines mm−1 SiC grating blazed at 13 eV. The entrance
and exit slits were set at 35 or 25 µm, yielding respective instrumental widths of 30 or 20
mA, as deduced from the analysis based on profile simulation described below. The vacuum
ultraviolet (VUV) light emerged from the spectrometer and passed through a windowless gas
cell; differential pumping maintained the ultra-high vacuum in the spectrometer and storage
ring. High purity CO gas (12C16O − Alphagaz, 99.997%; 13C16O − Eurisotop, 99.1% 13C,
99.95% 16O; 13C18O − Isotech, 98.8% 13C, 94.9% 18O) continuously flowed through the cell.
The pressure in the cell, typically 1 to 10 mTorr except for the weakest bands, was measured
with a capacitance gauge whose full scale was 10 Torr. The stability of the pressure was
checked by monitoring a cold cathode ionization gauge in the differentially pumped section
where typical pressures were 10−6 Torr. The VUV flux exiting the gas cell was detected
with a photomultiplier tube (EMI 9558QB) placed after a sodium salicylate coated window
acting as a scintillator. The digitized signal from the PMT was recorded on a PC.
Oscillator strengths (f -values) were derived through syntheses of the measured absorp-
tion bands. As noted in Eidelsberg et al. (2004a), two independent codes were used to check
for consistency, where agreement at the 2% level was achieved. Previous analyses of ab-
sorption from Rydberg bands of CO with the Toledo-based code included the experimental
work of Federman et al. (2001) and the interstellar study of Sheffer et al. (2003). The code
developed in Meudon was used on A − X bands (Eidelsberg et al. 1999) and intersystem
transitions (Rostas et al. 2000). The synthetic spectra were based on tabulated spectroscopic
data (Eidelsberg et al. 1991). Each synthetic spectrum was adjusted to match the experi-
mental one in a non-linear least-squares fitting procedure with band oscillator strength, line
width (instrumental, thermal, and predissociation), and wavelength offset as free parame-
ters. Initial fits revealed that the thermal width was consistent with Doppler broadening at
295 K and was held constant in subsequent syntheses. Predissociation widths of 0.34 mA
for the E−X (1-0) band in 12C16O, 0.27 mA in 13C16O, and 0.18 mA for 13C18O were taken
from Ubachs, Velchev, and Cacciani (2000). (Hereafter we use the shorthand E1 because
absorption examined in the present paper always involves the ground vibrational level.) For
the W0, W2, and W3 bands, a J-dependent width had to be introduced in the synthetic
spectra in order to reproduce the observations, in keeping with the results of Drabbels et al.
(1993) and Eikema, Hogervorst, and Ubachs (1994).
The situation for theW2 bands required special care. According to Eikema et al. (1994),
the predissociation width is independent of J until J = 6, but dependent on J for J > 6
for e and f components in all isotopologues. We first determined the J-independent part
of the width from lines up to Q(6) and P(3), and then fitted the whole band to derive the
J-dependent part and the f -value.
– 4 –
The first step in the analysis was to obtain an accurate measure of the CO column in
the differentially-pumped system. This was achieved through profile fits of the E0 band
near 1075 A for each isotopologue. Since the 3pπ (v′ = 0) state is relatively isolated and
can be considered essentially free of perturbations, the band f -value was assumed to be
the same for the three isotopologues. Predissociation widths of 0.067 mA for 12C16O, 0.049
mA for 13C16O, and 0.047 mA for 13C18O (Cacciani et al. 1998) were used as input. The
pressure deduced from the fit to the E0 band was typically within 10% of the value given
by the pressure gauge. The deduced pressure was then adopted in syntheses of the bands
of primary interest scanned with the same set of conditions. For the high pressures needed
to measure absorption from the E1 band of 13C18O – 24 to 58 mTorr, the values from the
pressure gauge were used.
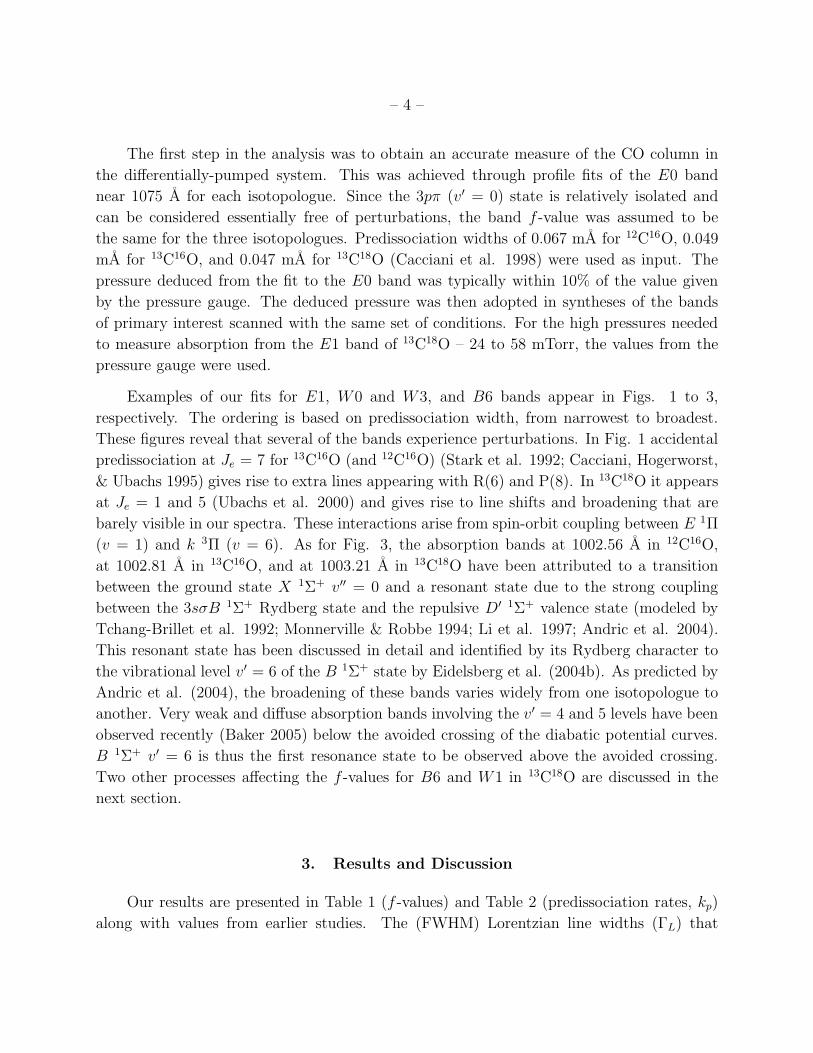
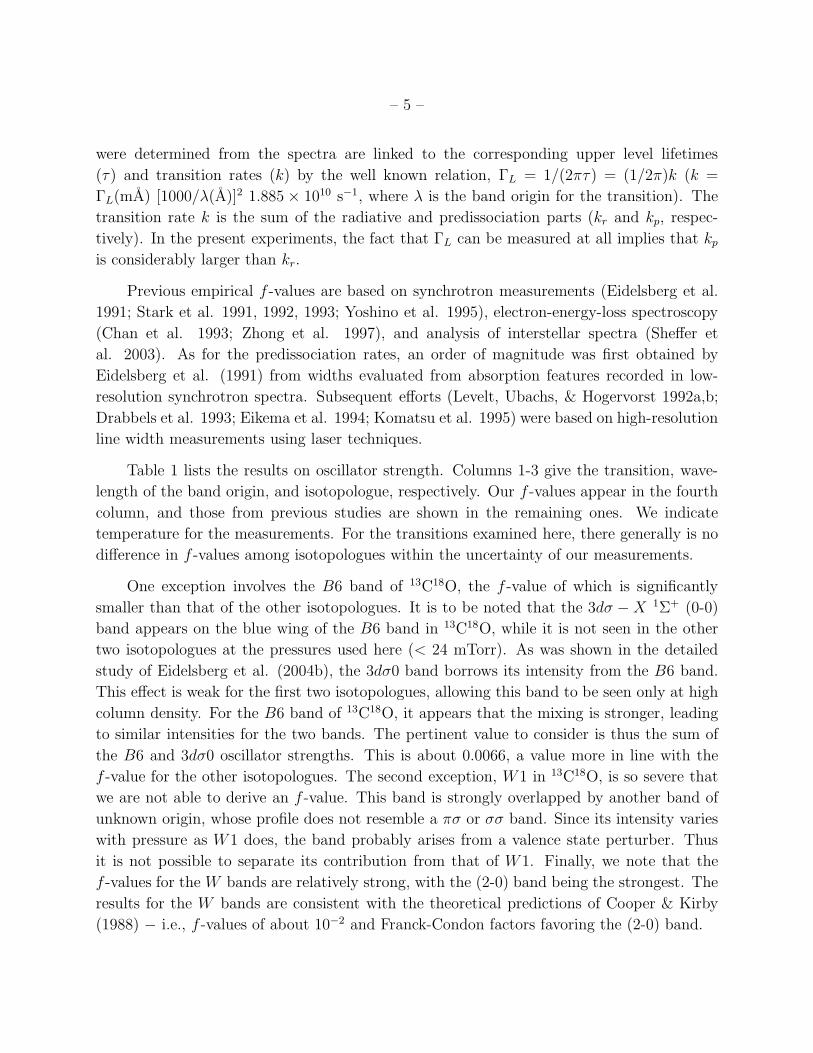
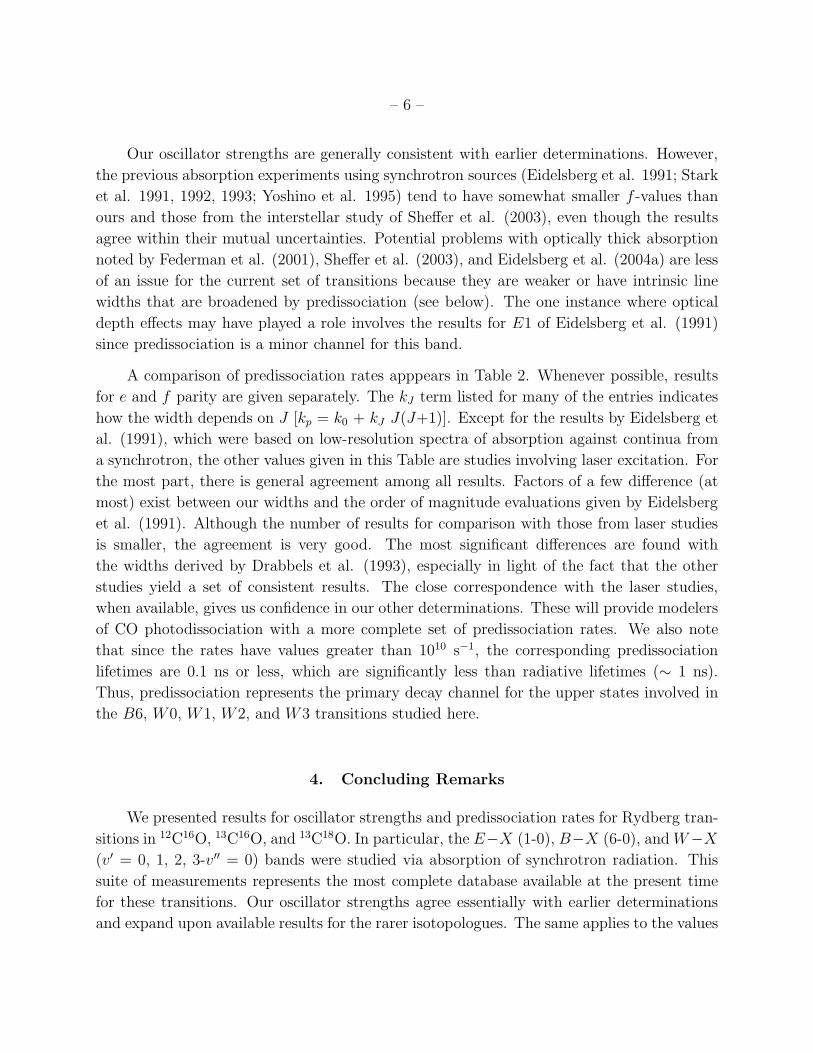
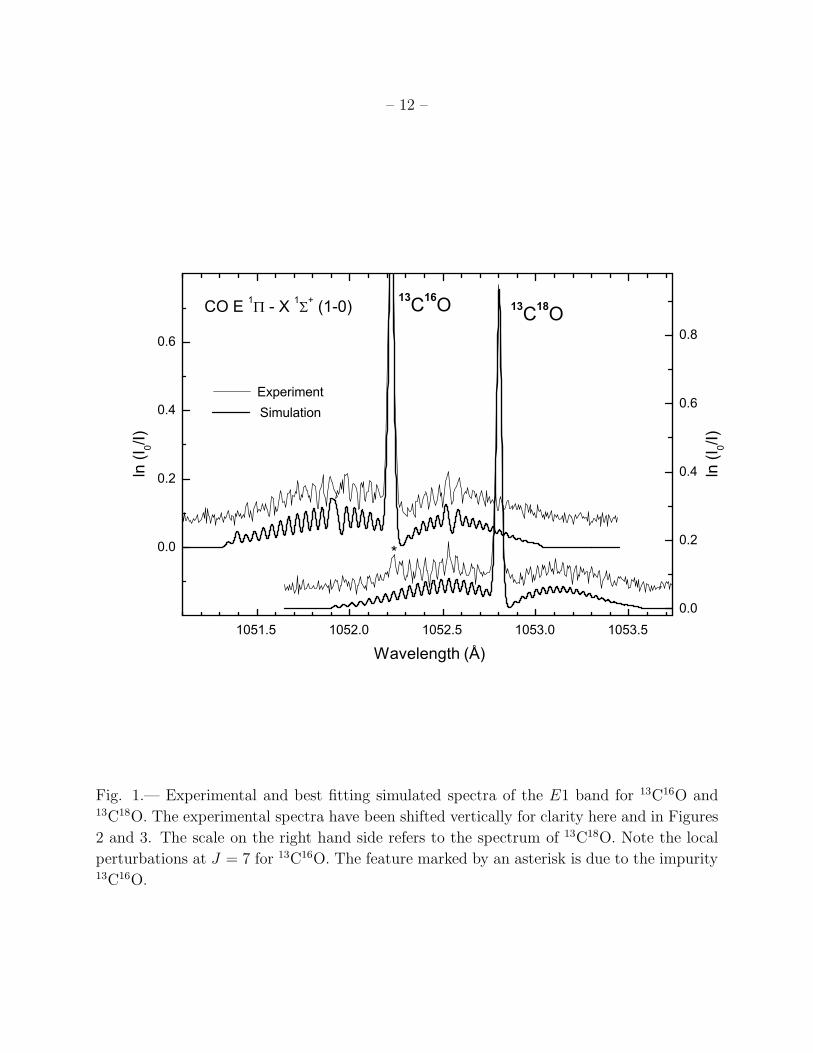
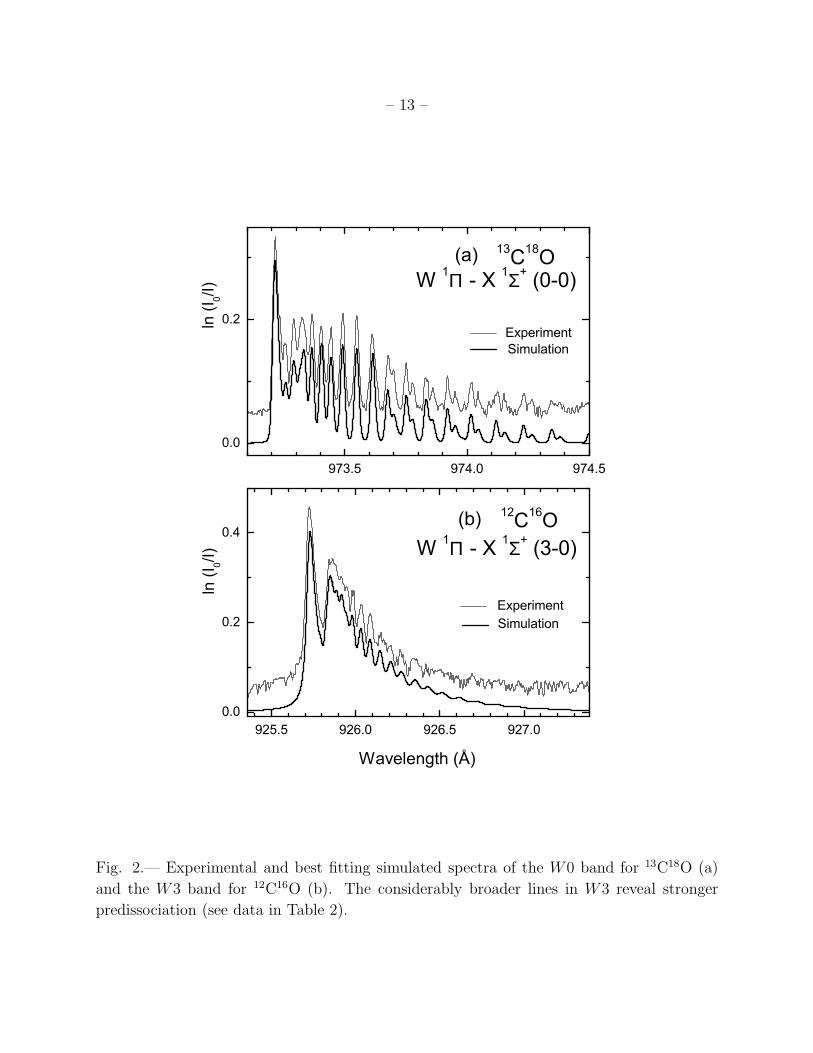
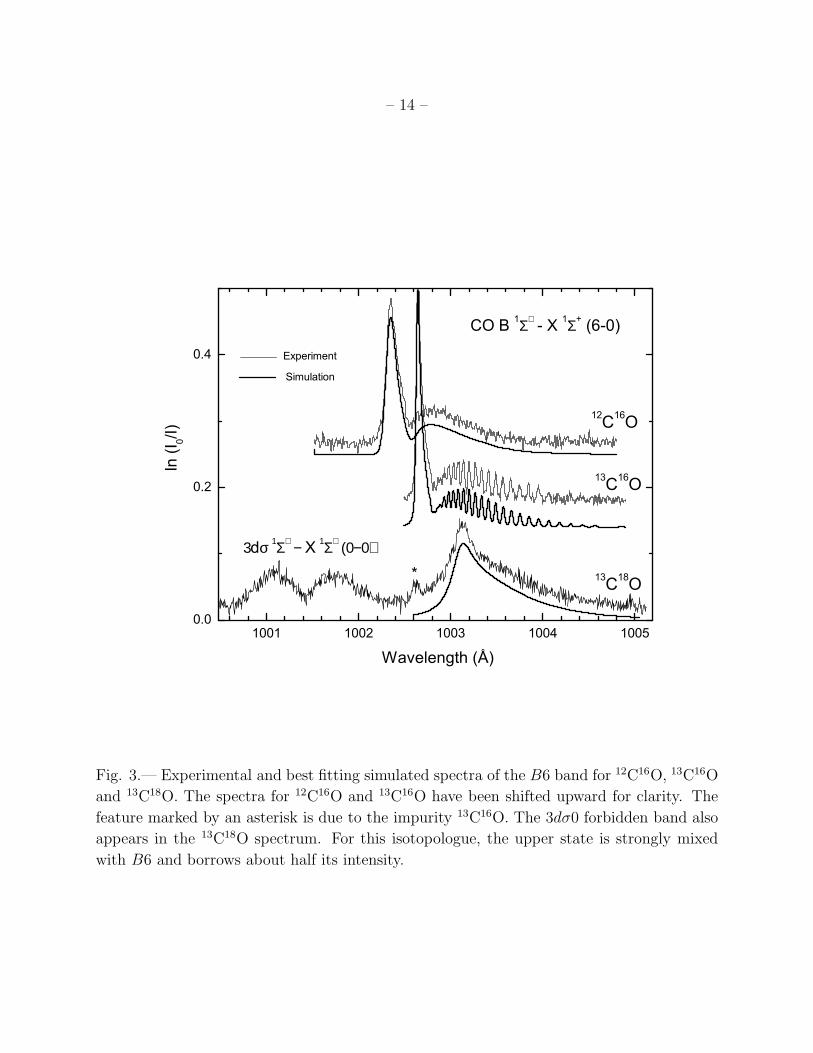
Examples of our fits for E1, W0 and W3, and B6 bands appear in Figs. 1 to 3,
respectively. The ordering is based on predissociation width, from narrowest to broadest.
These figures reveal that several of the bands experience perturbations. In Fig. 1 accidental
predissociation at Je = 7 for 13C16O (and 12C16O) (Stark et al. 1992; Cacciani, Hogerworst,
& Ubachs 1995) gives rise to extra lines appearing with R(6) and P(8). In 13C18O it appears
at Je = 1 and 5 (Ubachs et al. 2000) and gives rise to line shifts and broadening that are
barely visible in our spectra. These interactions arise from spin-orbit coupling between E 1Π
(v = 1) and k 3Π (v = 6). As for Fig. 3, the absorption bands at 1002.56 A in 12C16O,
at 1002.81 A in 13C16O, and at 1003.21 A in 13C18O have been attributed to a transition
between the ground state X 1Σ+ v′′ = 0 and a resonant state due to the strong coupling
between the 3sσB 1Σ+ Rydberg state and the repulsive D′ 1Σ+ valence state (modeled by
Tchang-Brillet et al. 1992; Monnerville & Robbe 1994; Li et al. 1997; Andric et al. 2004).
This resonant state has been discussed in detail and identified by its Rydberg character to
the vibrational level v′ = 6 of the B 1Σ+ state by Eidelsberg et al. (2004b). As predicted by
Andric et al. (2004), the broadening of these bands varies widely from one isotopologue to
another. Very weak and diffuse absorption bands involving the v′ = 4 and 5 levels have been
observed recently (Baker 2005) below the avoided crossing of the diabatic potential curves.
B 1Σ+ v′ = 6 is thus the first resonance state to be observed above the avoided crossing.
Two other processes affecting the f -values for B6 and W1 in 13C18O are discussed in the
next section.
3. Results and Discussion
Our results are presented in Table 1 (f -values) and Table 2 (predissociation rates, kp)
along with values from earlier studies. The (FWHM) Lorentzian line widths (ΓL) that
– 5 –
were determined from the spectra are linked to the corresponding upper level lifetimes
(τ) and transition rates (k) by the well known relation, ΓL = 1/(2πτ) = (1/2π)k (k =
ΓL(mA) [1000/λ(A)]2 1.885 × 10¹⁰ s−1, where λ is the band origin for the transition). The
transition rate k is the sum of the radiative and predissociation parts (kr and kp, respec-
tively). In the present experiments, the fact that ΓL can be measured at all implies that kpis considerably larger than kr.
Previous empirical f -values are based on synchrotron measurements (Eidelsberg et al.
1991; Stark et al. 1991, 1992, 1993; Yoshino et al. 1995), electron-energy-loss spectroscopy
(Chan et al. 1993; Zhong et al. 1997), and analysis of interstellar spectra (Sheffer et
al. 2003). As for the predissociation rates, an order of magnitude was first obtained by
Eidelsberg et al. (1991) from widths evaluated from absorption features recorded in low-
resolution synchrotron spectra. Subsequent efforts (Levelt, Ubachs, & Hogervorst 1992a,b;
Drabbels et al. 1993; Eikema et al. 1994; Komatsu et al. 1995) were based on high-resolution
line width measurements using laser techniques.
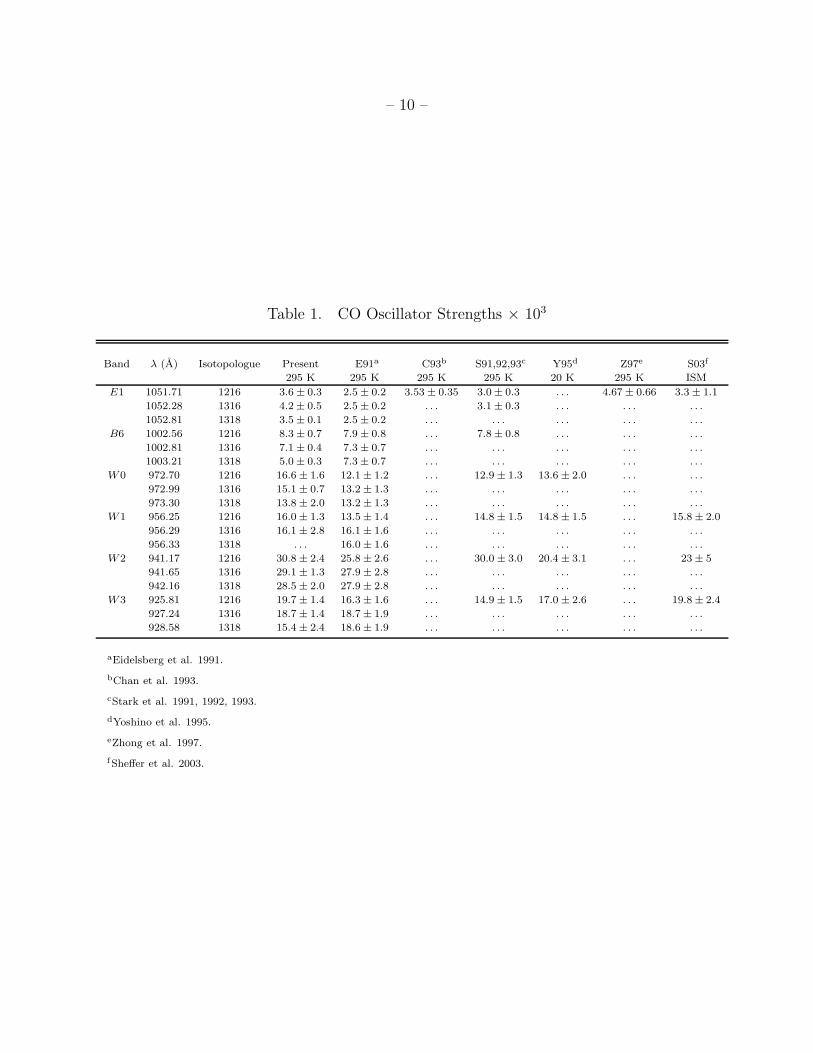
Table 1 lists the results on oscillator strength. Columns 1-3 give the transition, wave-
length of the band origin, and isotopologue, respectively. Our f -values appear in the fourth
column, and those from previous studies are shown in the remaining ones. We indicate
temperature for the measurements. For the transitions examined here, there generally is no
difference in f -values among isotopologues within the uncertainty of our measurements.
One exception involves the B6 band of 13C18O, the f -value of which is significantly
smaller than that of the other isotopologues. It is to be noted that the 3dσ −X 1Σ+ (0-0)
band appears on the blue wing of the B6 band in 13C18O, while it is not seen in the other
two isotopologues at the pressures used here (< 24 mTorr). As was shown in the detailed
study of Eidelsberg et al. (2004b), the 3dσ0 band borrows its intensity from the B6 band.
This effect is weak for the first two isotopologues, allowing this band to be seen only at high
column density. For the B6 band of 13C18O, it appears that the mixing is stronger, leading
to similar intensities for the two bands. The pertinent value to consider is thus the sum of
the B6 and 3dσ0 oscillator strengths. This is about 0.0066, a value more in line with the
f -value for the other isotopologues. The second exception, W1 in 13C18O, is so severe that
we are not able to derive an f -value. This band is strongly overlapped by another band of
unknown origin, whose profile does not resemble a πσ or σσ band. Since its intensity varies
with pressure as W1 does, the band probably arises from a valence state perturber. Thus
it is not possible to separate its contribution from that of W1. Finally, we note that the
f -values for the W bands are relatively strong, with the (2-0) band being the strongest. The
results for the W bands are consistent with the theoretical predictions of Cooper & Kirby
(1988) − i.e., f -values of about 10−2 and Franck-Condon factors favoring the (2-0) band.
– 6 –
Our oscillator strengths are generally consistent with earlier determinations. However,
the previous absorption experiments using synchrotron sources (Eidelsberg et al. 1991; Stark
et al. 1991, 1992, 1993; Yoshino et al. 1995) tend to have somewhat smaller f -values than
ours and those from the interstellar study of Sheffer et al. (2003), even though the results
agree within their mutual uncertainties. Potential problems with optically thick absorption
noted by Federman et al. (2001), Sheffer et al. (2003), and Eidelsberg et al. (2004a) are less
of an issue for the current set of transitions because they are weaker or have intrinsic line
widths that are broadened by predissociation (see below). The one instance where optical
depth effects may have played a role involves the results for E1 of Eidelsberg et al. (1991)
since predissociation is a minor channel for this band.
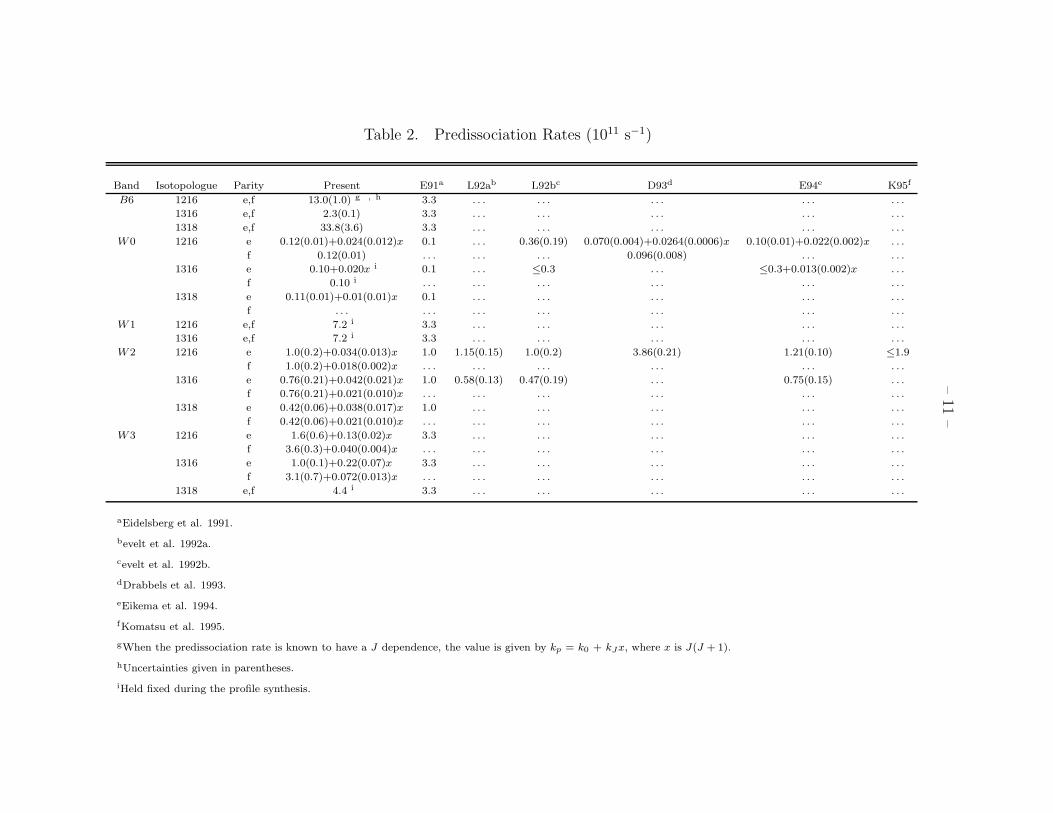
A comparison of predissociation rates apppears in Table 2. Whenever possible, results
for e and f parity are given separately. The kJ term listed for many of the entries indicates
how the width depends on J [kp = k0 + kJ J(J+1)]. Except for the results by Eidelsberg et
al. (1991), which were based on low-resolution spectra of absorption against continua from
a synchrotron, the other values given in this Table are studies involving laser excitation. For
the most part, there is general agreement among all results. Factors of a few difference (at
most) exist between our widths and the order of magnitude evaluations given by Eidelsberg
et al. (1991). Although the number of results for comparison with those from laser studies
is smaller, the agreement is very good. The most significant differences are found with
the widths derived by Drabbels et al. (1993), especially in light of the fact that the other
studies yield a set of consistent results. The close correspondence with the laser studies,
when available, gives us confidence in our other determinations. These will provide modelers
of CO photodissociation with a more complete set of predissociation rates. We also note
that since the rates have values greater than 1010 s−1, the corresponding predissociation
lifetimes are 0.1 ns or less, which are significantly less than radiative lifetimes (∼ 1 ns).
Thus, predissociation represents the primary decay channel for the upper states involved in
the B6, W0, W1, W2, and W3 transitions studied here.
4. Concluding Remarks
We presented results for oscillator strengths and predissociation rates for Rydberg tran-
sitions in 12C16O, 13C16O, and 13C18O. In particular, the E−X (1-0), B−X (6-0), andW−X
(v′ = 0, 1, 2, 3-v′′ = 0) bands were studied via absorption of synchrotron radiation. This
suite of measurements represents the most complete database available at the present time
for these transitions. Our oscillator strengths agree essentially with earlier determinations
and expand upon available results for the rarer isotopologues. The same applies to the values
– 7 –
for predissociation rates, but now our larger set of measurements provides J-dependent rates
for most of the transitions in the present study.
Our measurements are especially useful for chemical models that incorporate details
of CO photodissociation. Oscillator strengths and predissociation rates are now available
to examine selective isotope photodissociation with greater precision. We note that the
significant line widths for the B−X (6-0) and W −X (v′ = 0, 1, 2, 3-0) bands minimize the
importance of these transitions to selective self shielding, where the more abundant forms of
CO are protected from dissociation, because optical depths at line center cannot reach large
values.
With the tools now available to us, we plan to extend our set of measurements to other
transitions below 1000 A. We will utilize the high-resolution beam line on SOLEIL, the
next-generation synchrotron in France, which is nearing completion with first light expected
in 2007. High resolution is necessary to extract predissociation widths for the transitions
important for modeling CO photodissociation in PDRs.
This work was supported by NASA grant NAG5-11440 to the University of Toledo and
by the CNRS-PCMI program. The authors acknowledge the support of the LURE-Super
ACO facility and the SU5 beam line team. We thank Chris McKee for insightful comments
about the value of our measurements.
REFERENCES
Andric, L., Bouakline, F., Grozdanov, T. P., McCarroll, R. 2004, A&A, 421, 381
Baker, J. 2005, Chem. Phys. Lett., 408, 312
Cacciani, P., Hogervorst, W., & Ubachs, W. 1995, J. Chem. Phys., 102, 8308
Cacciani, P., Ubachs, W., Hinnen, P. C., Lynga, C., L’Huillier, A., & Wahlstrom, C.-G.
1998, ApJ, 499, L223
Chan, W. F., Cooper, G., & Brion, C. E. 1993, Chem. Phys., 170, 123
Cooper, D. L., & Kirby, K. 1988, Chem. Phys. Lett., 152, 393; erratum, 155, 624
Drabbels, M., Heinze, J., ter Meulen, J. J., & Meerts, W. 1993, J. Chem. Phys., 99, 5701
Eidelsberg, M., Benayoun, J. J., Viala, Y. P., & Rostas, F. 1991, A&AS, 90, 231
– 8 –
Eidelsberg, M., Jolly, A., Lemaire, J. L., Tchang-Brillet, W.-UL., Breton, J., & Rostas, F.
1999, A&A, 346, 705
Eidelsberg, M., Lemaire, J. L., Fillion, J. H., Rostas, F., Federman, S. R., & Sheffer, Y.
2004a, A&A, 424, 355
Eidelsberg, M., Launay, F., Ito, K., Matsui, T., Hinnen, P. C., Reinhold, E., Ubachs, W.,
Huber, K. P. 2004b, J. Chem. Phys., 121, 292
Eikema, K. S. E., Hogervorst, W., & Ubachs, W. 1994, Chem. Phys., 181, 217
Federman, S. R., Fritts, M., Cheng, S., Menningen, K. L., Knauth, D. C., & Fulk, K. 2001,
ApJS, 134, 133
Hollenbach, D. J., & Tielens, A. G. G. M. 1997, ARA&A, 35, 179
Komatsu, M., Ebata, T., Maeyama, T., & Mikami, N. 1995, J. Chem. Phys., 103, 2420
Letzelter, C., Eidelsberg, M., Rostas, F., Breton, J., & Thieblemont, B. 1987, Chem. Phys.,
114, 273
Levelt, P. F., Ubachs, W., & Hogervorst, W. 1992a, J. Phys. II France, 2, 801
1992b, J. Chem. Phys., 97, 7160
Li, Y., Bludsky, O., Hirsch, G., & Buenker, R. J. 1997, J. Chem. Phys., 107, 3014
Monnerville, M., & Robbe, J. M. 1994, J. Chem. Phys., 101, 7580
Nahon, L., Alcaraz, C., Marlats, J. L., Lagarde, B., Polack, F., Thissen, R., Lepere, D., &
Ito, K. 2001a, Rev. Sci. Instr., 72, 1320
Nahon, L., Polack, F., Lagarde, B., Thissen, R., Alcaraz, C., Dutuit, O., & Ito, K. 2001b,
NIMPA, 467, 453
Rostas, F., Eidelsberg, M., Jolly, A., Lemaire, J. L., Le Floch, A., & Rostas, J. 2000, J.
Chem. Phys., 112, 4591
Sheffer, Y., Federman, S. R., & Andersson, B.-G. 2003, ApJ, 597, L29
Stark, G., Smith, P. L., Ito, K., & Yoshino, K. 1992, ApJ, 395, 705
Stark, G., Yoshino, K., Smith, P. L., Esmond, J. R., Ito, K., & Stevens, M. H. 1993, ApJ,
410, 837
– 9 –
Stark, G., Yoshino, K., Smith, P. L., Ito, K., & Parkinson, W. H. 1991, ApJ, 369, 574
Sternberg, A., & Dalgarno, A. 1995, ApJS, 99, 565
Tchang-Brillet, W.-UL., Julienne, P. S., Robbe, J.-M., Letzelter, C., & Rostas, F. 1992, J.
Chem. Phys., 96, 6735
Ubachs, W., Velchev, I., & Cacciani, P. 2000, J. Chem. Phys., 113, 547
van Dishoeck, E. F., & Black, J. H. 1988, ApJ, 334, 771
Yoshino, K., Stark, G., Esmond, J. R., Smith, P. L., Ito, K., & Matsui, T. 1995, ApJ, 438,
1013
Zhong, Z. P., Feng, R. F., Xu, K. Z., Wu, S. L., Zhu, L. F., Zhang, X. J., Ji, Q., & Shi, Q.
C. 1997, Phys. Rev. A, 55, 1799
This preprint was prepared with the AAS LATEX macros v5.2.
– 10 –
Table 1. CO Oscillator Strengths × 103
Band λ (A) Isotopologue Present E91a C93b S91,92,93c Y95d Z97e S03f
295 K 295 K 295 K 295 K 20 K 295 K ISM
E1 1051.71 1216 3.6± 0.3 2.5± 0.2 3.53± 0.35 3.0± 0.3 . . . 4.67± 0.66 3.3± 1.1
1052.28 1316 4.2± 0.5 2.5± 0.2 . . . 3.1± 0.3 . . . . . . . . .
1052.81 1318 3.5± 0.1 2.5± 0.2 . . . . . . . . . . . . . . .
B6 1002.56 1216 8.3± 0.7 7.9± 0.8 . . . 7.8± 0.8 . . . . . . . . .
1002.81 1316 7.1± 0.4 7.3± 0.7 . . . . . . . . . . . . . . .
1003.21 1318 5.0± 0.3 7.3± 0.7 . . . . . . . . . . . . . . .
W0 972.70 1216 16.6± 1.6 12.1± 1.2 . . . 12.9± 1.3 13.6 ± 2.0 . . . . . .
972.99 1316 15.1± 0.7 13.2± 1.3 . . . . . . . . . . . . . . .
973.30 1318 13.8± 2.0 13.2± 1.3 . . . . . . . . . . . . . . .
W1 956.25 1216 16.0± 1.3 13.5± 1.4 . . . 14.8± 1.5 14.8 ± 1.5 . . . 15.8± 2.0
956.29 1316 16.1± 2.8 16.1± 1.6 . . . . . . . . . . . . . . .
956.33 1318 . . . 16.0± 1.6 . . . . . . . . . . . . . . .
W2 941.17 1216 30.8± 2.4 25.8± 2.6 . . . 30.0± 3.0 20.4 ± 3.1 . . . 23± 5
941.65 1316 29.1± 1.3 27.9± 2.8 . . . . . . . . . . . . . . .
942.16 1318 28.5± 2.0 27.9± 2.8 . . . . . . . . . . . . . . .
W3 925.81 1216 19.7± 1.4 16.3± 1.6 . . . 14.9± 1.5 17.0 ± 2.6 . . . 19.8± 2.4
927.24 1316 18.7± 1.4 18.7± 1.9 . . . . . . . . . . . . . . .
928.58 1318 15.4± 2.4 18.6± 1.9 . . . . . . . . . . . . . . .
aEidelsberg et al. 1991.
bChan et al. 1993.
cStark et al. 1991, 1992, 1993.
dYoshino et al. 1995.
eZhong et al. 1997.
fSheffer et al. 2003.
–11
–
Table 2. Predissociation Rates (1011 s−1)
Band Isotopologue Parity Present E91a L92ab L92bc D93d E94e K95f
B6 1216 e,f 13.0(1.0) g , h 3.3 . . . . . . . . . . . . . . .
1316 e,f 2.3(0.1) 3.3 . . . . . . . . . . . . . . .
1318 e,f 33.8(3.6) 3.3 . . . . . . . . . . . . . . .
W0 1216 e 0.12(0.01)+0.024(0.012)x 0.1 . . . 0.36(0.19) 0.070(0.004)+0.0264(0.0006)x 0.10(0.01)+0.022(0.002)x . . .
f 0.12(0.01) . . . . . . . . . 0.096(0.008) . . . . . .
1316 e 0.10+0.020x i 0.1 . . . ≤0.3 . . . ≤0.3+0.013(0.002)x . . .
f 0.10 i . . . . . . . . . . . . . . . . . .
1318 e 0.11(0.01)+0.01(0.01)x 0.1 . . . . . . . . . . . . . . .
f . . . . . . . . . . . . . . . . . . . . .
W1 1216 e,f 7.2 i 3.3 . . . . . . . . . . . . . . .
1316 e,f 7.2 i 3.3 . . . . . . . . . . . . . . .
W2 1216 e 1.0(0.2)+0.034(0.013)x 1.0 1.15(0.15) 1.0(0.2) 3.86(0.21) 1.21(0.10) ≤1.9
f 1.0(0.2)+0.018(0.002)x . . . . . . . . . . . . . . . . . .
1316 e 0.76(0.21)+0.042(0.021)x 1.0 0.58(0.13) 0.47(0.19) . . . 0.75(0.15) . . .
f 0.76(0.21)+0.021(0.010)x . . . . . . . . . . . . . . . . . .
1318 e 0.42(0.06)+0.038(0.017)x 1.0 . . . . . . . . . . . . . . .
f 0.42(0.06)+0.021(0.010)x . . . . . . . . . . . . . . . . . .
W3 1216 e 1.6(0.6)+0.13(0.02)x 3.3 . . . . . . . . . . . . . . .
f 3.6(0.3)+0.040(0.004)x . . . . . . . . . . . . . . . . . .
1316 e 1.0(0.1)+0.22(0.07)x 3.3 . . . . . . . . . . . . . . .
f 3.1(0.7)+0.072(0.013)x . . . . . . . . . . . . . . . . . .
1318 e,f 4.4 i 3.3 . . . . . . . . . . . . . . .
aEidelsberg et al. 1991.
bevelt et al. 1992a.
cevelt et al. 1992b.
dDrabbels et al. 1993.
eEikema et al. 1994.
fKomatsu et al. 1995.
gWhen the predissociation rate is known to have a J dependence, the value is given by kp = k0 + kJx, where x is J(J + 1).
hUncertainties given in parentheses.
iHeld fixed during the profile synthesis.
– 12 –
1051.5 1052.0 1052.5 1053.0 1053.5
0.0
0.2
0.4
0.6
0.0
0.2
0.4
0.6
0.8
Simulation
Wavelength (Å)
13C18O13C16O
ln (I
0/I)
CO E 1 - X 1 + (1-0)
*
Experiment
ln (I
0/I)
Fig. 1.— Experimental and best fitting simulated spectra of the E1 band for 13C16O and13C18O. The experimental spectra have been shifted vertically for clarity here and in Figures
2 and 3. The scale on the right hand side refers to the spectrum of 13C18O. Note the local
perturbations at J = 7 for 13C16O. The feature marked by an asterisk is due to the impurity13C16O.
– 13 –
925.5 926.0 926.5 927.00.0
0.2
0.4
973.5 974.0 974.5
0.0
0.2
W 1Π - X 1Σ+ (3-0)(b)
Wavelength (Å)
12C16O
SimulationExperiment
ln (I
0/I)
W 1Π - X 1Σ+ (0-0)13C18O
ln (I
0/I)
(a)
SimulationExperiment
Fig. 2.— Experimental and best fitting simulated spectra of the W0 band for 13C18O (a)
and the W3 band for 12C16O (b). The considerably broader lines in W3 reveal stronger
predissociation (see data in Table 2).
– 14 –
1001 1002 1003 1004 10050.0
0.2
0.4
CO B 1Σ+ - X 1Σ+ (6-0)
13C18O
13C16O
ln (I
0/I)
Wavelength (Å)
3dσ 1Σ+ − X 1Σ+ (0−0)
12C16O
*
Experiment
Simulation
Fig. 3.— Experimental and best fitting simulated spectra of the B6 band for 12C16O, 13C16O
and 13C18O. The spectra for 12C16O and 13C16O have been shifted upward for clarity. The
feature marked by an asterisk is due to the impurity 13C16O. The 3dσ0 forbidden band also
appears in the 13C18O spectrum. For this isotopologue, the upper state is strongly mixed
with B6 and borrows about half its intensity.
Related Documents