Prof. dr Zikrija Avdagić, dipl.ing.el. University of Sarajevo Faculty of Electrical Engineering Department for Computer Science Bosnia and Herzegovina [email protected] Artificial Neural Networks in Prediction of Secondary Protein Structure Using CB513 Database S T A N F O R D UNIVERSITY

Artificial Neural Networks in Prediction of Secondary Protein Structure Using CB513 Database S T A N F O R D UNIVERSITY.
Dec 29, 2015
Welcome message from author
This document is posted to help you gain knowledge. Please leave a comment to let me know what you think about it! Share it to your friends and learn new things together.
Transcript
Prof. dr Zikrija Avdagić, dipl.ing.el.
University of Sarajevo
Faculty of Electrical Engineering
Department for Computer Science
Bosnia and Herzegovina
Artificial Neural Networks in Prediction of Secondary
Protein Structure Using CB513 Database
S T A N F O R D UNIVERSITY


GENETIC PARADIGMDNA WATSON-CRICK MODEL GENETIC CODE
The answer comes from the knowledge of three concepts : DNA-WC, GP, GC.
The living systems can not be imagined without biological molecule DNA and protein.
DNA is in nucleus and consists from two strands linked with complementary bases.
Proteins are suited in cytoplasm and are formed from codons made from 3 DNA
bases.
Looking at GC one codon is one AA, and these AAc produce peptide chain.
Before the explanation of our algorithm we must answer the next question:
Why do we need secondary protein structure prediction ?

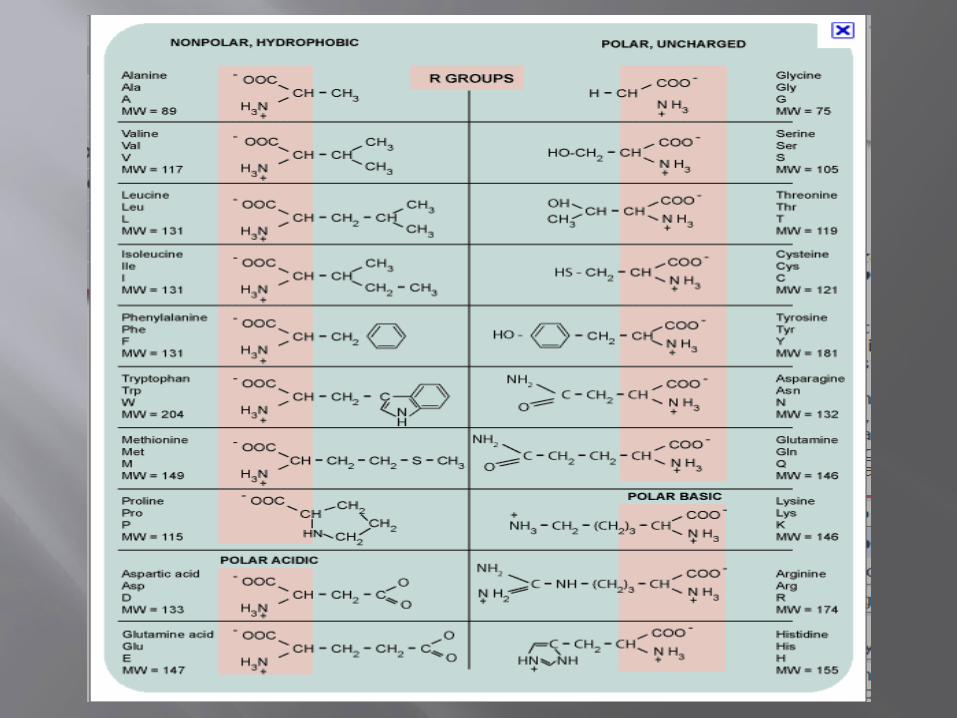
PRIMARY AMINO ACID SEQUENCES

PRINCIPLE OF AMINO ACIDS CODINGAmino Acids 1-letter symbol Code Binary representation
Alanine A 01 10000000000000000000
Cysteine C 02 01000000000000000000
Aspartate D 03 00100000000000000000
Glutamate E 04 00010000000000000000
Phenylalanine F 05 00001000000000000000
Glycine G 06 00000100000000000000
Histidine H 07 00000010000000000000
Isolecine I 08 00000001000000000000
Lysine K 09 00000000100000000000
Leucine L 10 00000000010000000000
Methionine M 11 00000000001000000000
Asparagine N 12 00000000000100000000
Proline P 13 00000000000010000000
Glutamine Q 14 00000000000001000000
Arginine R 15 00000000000000100000
Serine S 16 00000000000000010000
Threonine T 17 00000000000000001000
Valine V 18 00000000000000000100
Tryptophan W 19 00000000000000000010
Threonine Y 20 00000000000000000001


DSSP Code

PROTEIN TERTIARY STRUCTURES

TERTIARY PROTEIN STRUCTURE
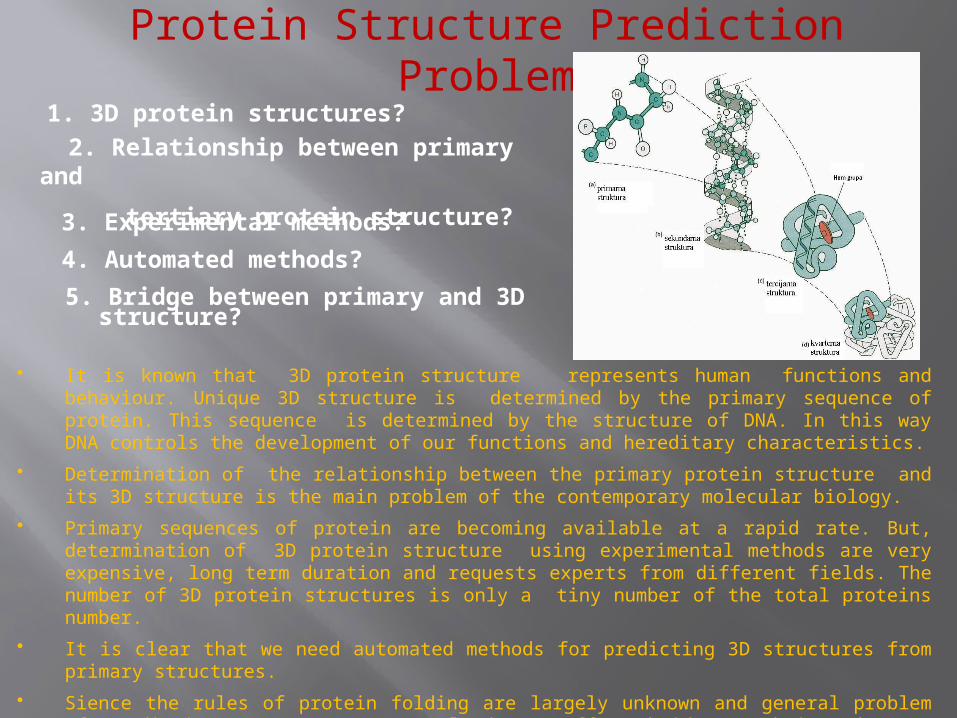
Protein Structure Prediction Problem
4. Automated methods?
5. Bridge between primary and 3D structure?
3. Experimental methods?
1. 3D protein structures?
2. Relationship between primary and
tertiary protein structure?
• It is known that 3D protein structure represents human functions and behaviour. Unique 3D structure is determined by the primary sequence of protein. This sequence is determined by the structure of DNA. In this way DNA controls the development of our functions and hereditary characteristics.
• Determination of the relationship between the primary protein structure and its 3D structure is the main problem of the contemporary molecular biology.
• Primary sequences of protein are becoming available at a rapid rate. But, determination of 3D protein structure using experimental methods are very expensive, long term duration and requests experts from different fields. The number of 3D protein structures is only a tiny number of the total proteins number.
• It is clear that we need automated methods for predicting 3D structures from primary structures.
• Sience the rules of protein folding are largely unknown and general problem of predicting 3D structures unsolved, AI offers bridge to bring the gap between primaray structure and 3D structure in order to satisfy but only part of our need.
What is the bridge which AI offers?

• Secondary protein structure = Bridge between primary protein sequence i 3D protein structure
• Primary protein structure? Thanks to Human Genome Project primary protein sequences become more available
• Tertiary protein structure? Today, it is impossible to predict tertiary protein structure reliable
Other structures
Beta strand
Alpha helix
Secondary structures
B, I, S, T, C, L
E
H,G
CodeGraphic dictionary
SEQUENCE ALPHA AMYLASE AND CORRESPONDING SECONDARY STRUCTURE
3D structure alpha amylase

BRIDGE BETWEEN PRIMARY AND SECONDARY PROTEIN STRUCTURES

THE CONCEPT OF THE ALGORITHM FOR PREDICTION OF SECONDARY PROTEIN STRUCTURE
11
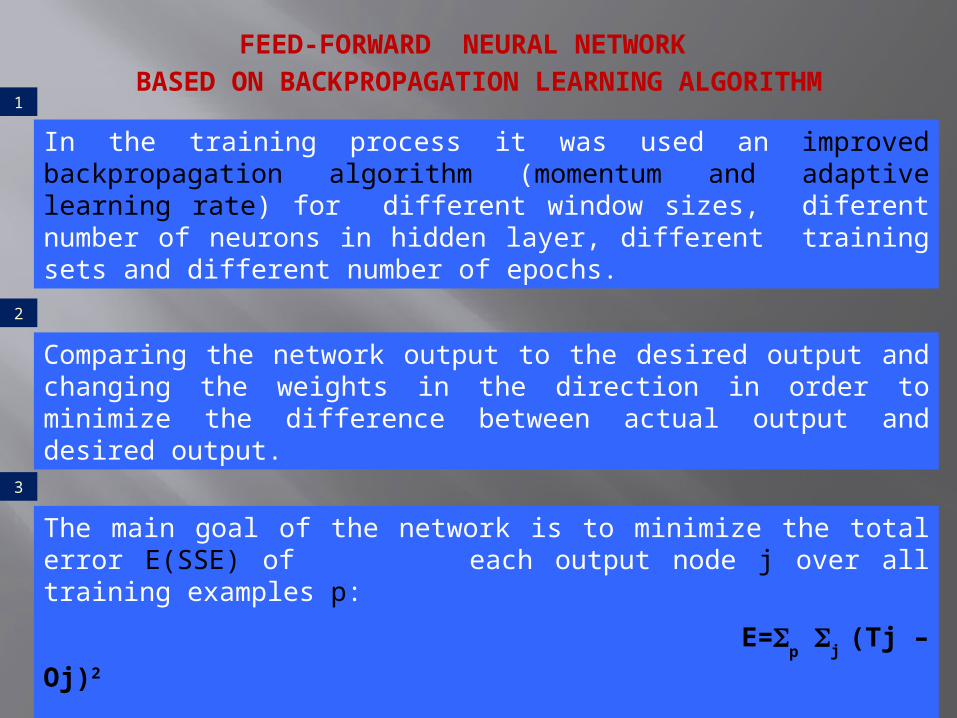
FEED-FORWARD NEURAL NETWORK
BASED ON BACKPROPAGATION LEARNING ALGORITHM
In the training process it was used an improved backpropagation algorithm (momentum and adaptive learning rate) for different window sizes, diferent number of neurons in hidden layer, different training sets and different number of epochs.
Comparing the network output to the desired output and changing the weights in the direction in order to minimize the difference between actual output and desired output.
The main goal of the network is to minimize the total error E(SSE) of each output node j over all training examples p:
E=p
j (Tj –Oj)2
3
1
2
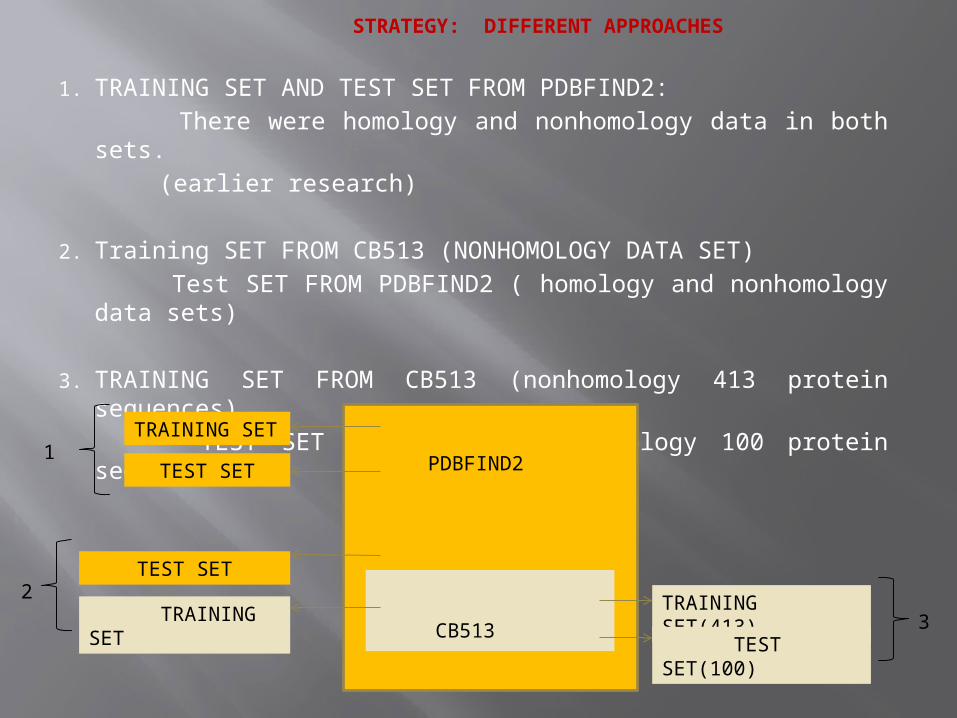
1. TRAINING SET AND TEST SET FROM PDBFIND2:
There were homology and nonhomology data in both sets.
(earlier research)
2. Training SET FROM CB513 (NONHOMOLOGY DATA SET)
Test SET FROM PDBFIND2 ( homology and nonhomology data sets)
3. TRAINING SET FROM CB513 (nonhomology 413 protein sequences)
TEST SET FROM CB513 (nonhomology 100 protein sequences)
STRATEGY: DIFFERENT APPROACHES
PDBFIND2
CB513 TRAINING SET
TRAINING SET
TEST SET
TEST SET
TRAINING SET(413)
TEST SET(100)
1
2
3

http://www.paraschorpa.com/project/evoca_prot/index.php
PDBFIND2
Elimination of unimportant parts of aminoacidsequences and related
secondary structures
Separation of input data
and output data
Prim Patterns.txt
SekCPaterns.txt
Encodingof extracted data into a numeric patterns
Encoded
paterns
1. TRAINING SET AND TEST SET FROM PDBFIND2:
there were homology and nonhomology data in both sets ( first research)
APLICATION INTERFACE USED FOR
EXTRACTING,
PREPARING
AND
ENCODING
(API_EPE1)

prepare_data
vector
prepare _data
string
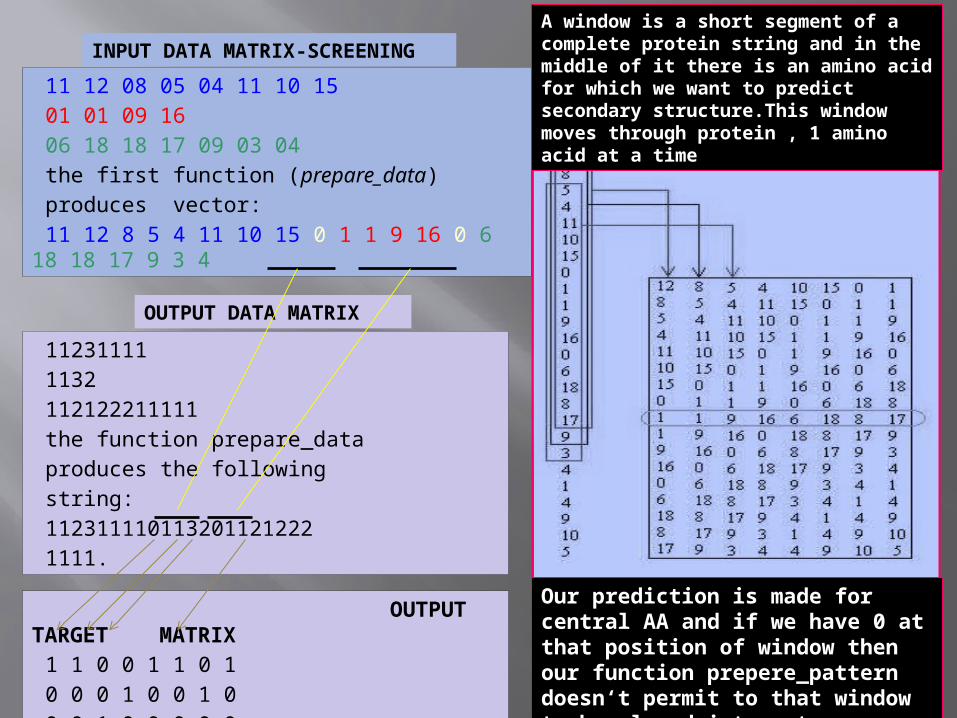
11 12 08 05 04 11 10 15
01 01 09 16
06 18 18 17 09 03 04
the first function (prepare_data)
produces vector:
11 12 8 5 4 11 10 15 0 1 1 9 16 0 6
18 18 17 9 3 4
11231111
1132
112122211111
the function prepare_data
produces the following
string:
112311110113201121222
1111.
prepare_pattern prepare_target
OUTPUT TARGET
MATRIXINPUT PATTERN
MATRIX
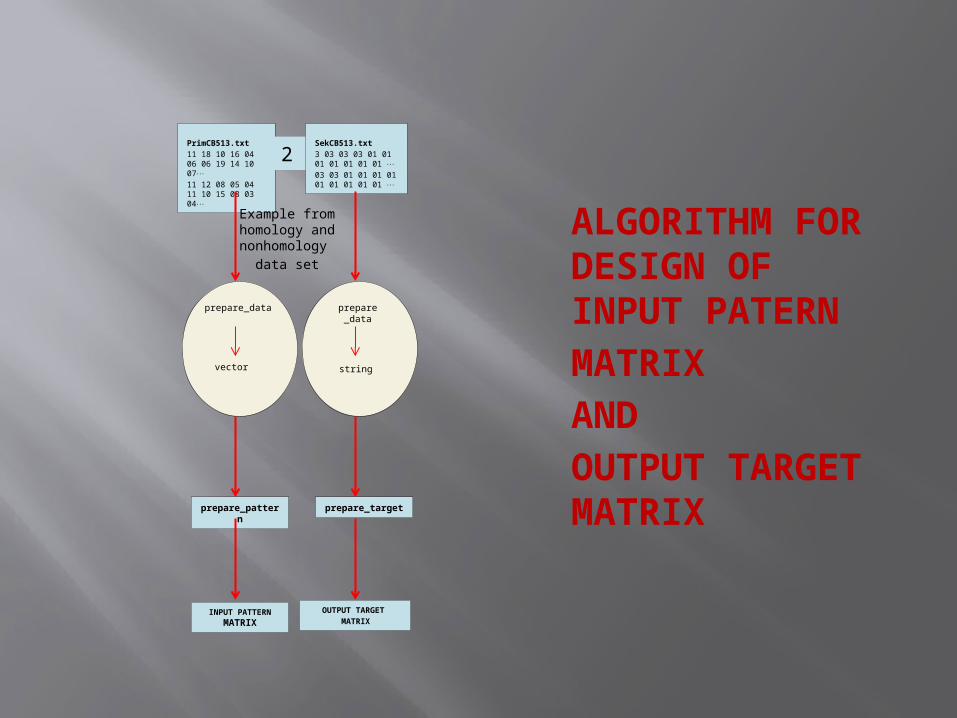
ALGORITHM FOR DESIGN OF INPUT PATERN
MATRIX
AND
OUTPUT TARGET MATRIX
Example from homology and nonhomology
data set
1
11 12 08 05 04 11 10 15
01 01 09 16
06 18 18 17 09 03 04
the first function (prepare_data)
produces vector:
11 12 8 5 4 11 10 15 0 1 1 9 16 0 6 18 18 17 9 3 4
INPUT DATA MATRIX-SCREENING
OUTPUT DATA MATRIX
11231111
1132
112122211111
the function prepare_data
produces the following
string:
112311110113201121222
1111.
OUTPUT TARGET MATRIX
1 1 0 0 1 1 0 1
0 0 0 1 0 0 1 0
0 0 1 0 0 0 0 0
A window is a short segment of a complete protein string and in the middle of it there is an amino acid for which we want to predict secondary structure.This window moves through protein , 1 amino acid at a time
Our prediction is made for central AA and if we have 0 at that position of window then our function prepere_pattern doesn‘t permit to that window to be placed into patern matrix
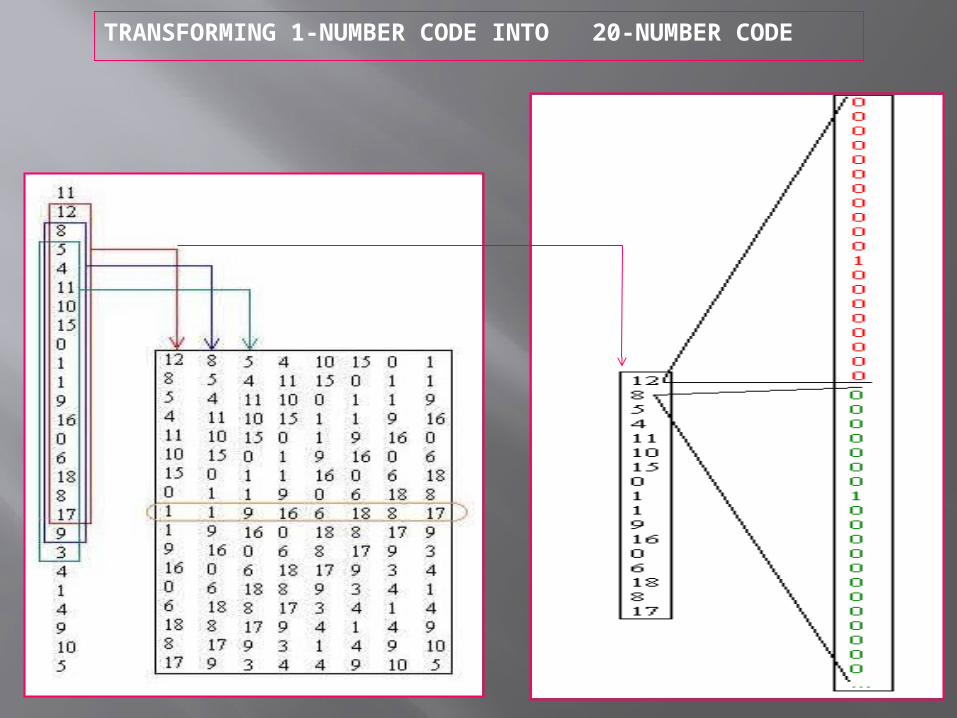
TRANSFORMING 1-NUMBER CODE INTO 20-NUMBER CODE

Algorithm parametersDefault values
Window size 17Number of hidden layer neurons 8Training set size 200Number of training epochs 2000
Parameter values achieving the best accuracy of protein
secondary structure prediction
Q3 = 63,6261%

// When using this database, please cite: // PDBFinderII - a database for protein structure analysis and prediction // Krieger,E., Hooft,R.W.W., Nabuurs,S., Vriend.G. (2004) Submitted// ID : 101M // Header : OXYGEN TRANSPORT // Date : 1998-04-08 Compound : myoglobin // Compound : Mutant Source : (physeter catodon) // Source : sperm whale // Water-Mols : 138 // Sequence : MVLSEGEWQLVLHVWAKVEADVAGHGQD I L I // DSSP : CCCCHHHHHHHHHHHHHHGGGHHHHHHHHHH // Nalign : 4 5 9 9 9 9 9 9 9 9 9 9 9 9 9 9 9 9 9 9 9 9 9 9 9 9 9 9 9 9 9
http://www.paraschorpa.com/project/evoca_prot/index.php
PDBFIND2
Elimination of unimportant parts of aminoacidsequences and related
secondary structures
CB513.txt MVLSEGEWQLVLHVWAKVEADVAGHGQDILI
CCCCHHHHHHHHHHHHHHGGGHHHHHHHHHH
MNIFEMLRIDEGLRLKIYKDTEGYYTIGIGH
CCHHHHHHHHHCCEEEEEECTTSCEEEETTE
Separation of input data
and output data
PrimCB513.txt
11 18 10 16 04 06 06 19 14 10 07 11 12 08 05 04 11 10 15 08 03 04
SekCB513.txt
3 03 03 03 01 01 01 01 01 01 01 03 03 01 01 01 01 01 01 01 01 01
Encoded of extracted data into a numeric patterns
CB513.all
Encoded
CB513.txt
2
2. Training SET FROM CB513 (NONHOMOLOGY DATA SET)
Test SET FROM PDBFIND2 ( homology and nonhomology data sets)
APLICATION
INTERFACE
USED FOR
EXTRACTING,
PREPARING
AND
ENCODING
(API_EPE2)
PrimCB513.txt
11 18 10 16 04 06 06 19 14 10 0711 12 08 05 04 11 10 15 08 03 04
SekCB513.txt
3 03 03 03 01 01 01 01 01 01 01 03 03 01 01 01 01 01 01 01 01 01
prepare_data
vector
prepare _data
string
prepare_pattern prepare_target
OUTPUT TARGET
MATRIXINPUT PATTERN
MATRIX
ALGORITHM FOR DESIGN OF INPUT PATERN
MATRIX
AND
OUTPUT TARGET MATRIX
Example from homology and nonhomology
data set
2

DESIGN AND LEARNING OF NEURAL NETWORK IN MATLAB – NN TOOLBOX
Tab3
Tab4Tab5 Tab6
Instruction creatennw is used for designing neural networks with different sizes of windows (11, 13, 15, 17, and 19); instruction createCB513w is used for creation of training set, and training of neural network is started with instruction trainw.
createCB513w
trainw
PDBFIND2
We did not
consider homology between protein sequences in the test set taken from PDBFIND2 data base.

3.TRAINING SET FROM CB513 (nonhomology 413 protein sequences)
TEST SET FROM CB513 (nonhomology 100 protein sequences)
CB513, DATA SET IN WHICH THERE IS NO SEQUENCE SIMILARITY BETWEEN PROTEIN SEQUENCES, WAS DIVIDED INTO TWO SETS:
413 training protein sequences (stored in PrimTest413.txt and
SekTrain413.txt data file), and 100 test protein sequences
(stored in PrimTest100.txt and SekTest100.txt data file).
In MATLAB a software package nonhomtest was created with the following functions:
design of input data (samples) matrix using PrimTrain413.txt data file, and design of output data matrix using SekTrain413 data file,
design of neural network based on 5 neurons in hidden layer, and using window size 19,
training of designed neural network in time interval
of 2000 epochs,
design of input data (samples) matrix using PrimTest100.txt data file, and design of output data matrix using SekTest100 data file, and accuracy evaluation of our neural networks using .
Accuracy of a neural network prediction evaluated with non-homologous test set is 62.7253.

Comparison with other methods
Method Q3%
Chou & Fasman (1978) 50
Lim (1974) 50
Robson (1978) 53
Levin (1986) 59.7
Sejnovski (1988), net1 62.7
Qian & Sejnovski (1988), net2 64.3
Chandonia & Korplus (1995) 73.9
Chandonia & Korplus (1996) 80.2
Avdagic&Purisevic
Q3
62.7253 %
COMPARISON WITH OTHER METHODS

SUMMARY OF CONCLUSIONS
In our earlier research: approach 1, neural network was evaluated with a protein set without consideration of homology and nonhomology between protein sequences. The result of prediction was correct in 63.6261% of Q3 test cases.
In the current study: approach 2,we used a training set (CB513), in which there are no sequence similarities between protein sequences. However, we did not consider homology between protein sequences in the test set taken from PDBFIND2 data base. The result of prediction was 62.8776%. Due to homology of protein sequences these results are not fully objective.
In the current study: approach 3, the solution in this study is based on division of CB513 non-homologous data set into two subsets. The first subset consists of 413 nonhomologous protein sequences and was used for training of our neural network. The second subset consists of 100 nonhomologous protein sequences and was used for testing of our neural network. Accuracy of the neural network prediction evaluated with non-homologous test set was 62.7253% and we conclude that this is objective. The achieved exactness is relatively small compared to the study which used neural network training and test sets without verification of protein homology.

CONSENSUS METHOD FOR SECONDARY PROTEIN STRUCTURE PREDICTION
The SS determines how groups of Aas form sub-structures such as coil, helix or extended strand. The correct derivation of SS provides vital information as to the tertiary structures and therefore the function of the protein.
There are various methods which can be used to predict secondary structure, including:DSSP approach(which uses hydrogen and bond patterns as predictors),DEFINE algorithm(which uses the distance between C-alpha atoms), and P-CURVE method (which finds regularites along a helocoidal axis).
As might expected, these disparate approaches do not necessarily agree with each other when given the same problem, this can create problems for researchers.
The work by Selbig, Mevissen, and Lengauer (1999) develops the DECISSION TREE as a method for achieving CONSENSUS between these approaches by creating a dataset of predicted structures from a number of prediction methods for the same data set.The correct structures for each of the protein elements in the training set is known and this forms classification for each of the records in the training set.
The IDENTIFICATION TREE therefore creates rules of the form:
IF Method1 = Helix AND Method2 = Helix THEN Consensus = Helix.
This methodology ensures that prediction performance is at worst the same as the best prediction methods and in the best case should perform better than that.
Intelligent Bioinformatics 169

INITIAL PARAMETERS OF NEURAL NETWORK
Prediction of secondary structure was implemented using non-linear neural network with three layers based on feed-forward supervised learning and back-propagation error algorithm [8][10]. Default values for window size, number of neurons in hidden layer and number of training epochs are presented in the next Table.
Algorithm parameters Initial values
Window sizes 13
Number of neurons in hidden layer
5
Number of training epochs 250
Instruction creatennw is used for designing neural networks with different sizes of windows (11, 13, 15, 17, and 19); instruction createCB513w is used for creation of training set, and training of neural network is started with instruction trainw.
Tab3

DIFFERENT SIZE OF WINDOWS
After that, we evaluated performances of neural networks using testing sets stored in files PrimStrTestB.txt and SekStrTestB.txt. Results are shown in the next Table.
training/testingsets
window
size(11-19)
Evaluated results
Q3% (train.s
et)
Q3% (test set)
1 trainsetw11/testsetw11 11 62,2150 60,9910
2 trainsetw13/testsetw13 13 62,4055 61,1011
3 trainsetw15/testsetw15 15 57,0756 54,7338
4 trainsetw17/testsetw17 17 62,5809 61,7053
5 trainsetw19/testsetw19 19 63,5312 62,5160
Average value Q3 61,5616 60,2094
Tab4

DIFFERENT NUMBER OF NEURONS IN HIDDEN LAYER
For this purpose we use the following instructions:
creatennhn (to design neural networks with different number of neurons in hidden layer),
trainhn (to train neural networks), and accuracyhn (for performance evaluation). Results
are shown in the next Table.
Numberof neuronsin hidden
layer
Test
Q3% (training set)
Q3% (testset)
1 2 44.1607 41.97362 3 63.2946 61.55933 4 63.2101 62.23734 5 63.5312 62.51605 6 62.8499 61.46896 7 63.6632 62.15447 8 63.6323 62.33528 9 63.6168 62.16959 10 63.4052 61.853110 11 63.5086 62.154411 12 63.4111 62.086612 13 63.7809 62.3051Average value Q3 61,8387 60,4011
Tab5

DIFFERENT NUMBER OF EPOCHS
At the end we used five neurons in hidden layer, window size 19 and different number of epochs using instructions traine. Results are shown in the next Table.
0
Number of training epochs
Test
Q3% (training set)
Q3% (test set)
1 100 44.5602 43.05082 150 57.8345 56.15823 200 63.0461 61.99624 250 63.5312 62.51605 300 63.5229 62.38796 500 63.5550 62.46337 1000 63.7357 62.38798 2000 64.3885 62.58389 3000 64.7369 62.817310 4000 64.8546 62.877611 5000 64.8914 62.839912 10000 64.5740 61.9736
Average value Q3 61.9539 60.3377
Tab6

PDBFIND2.txtftp://ftp.cmbi.kun.nl/pub/molbio/data/pdbfinder2/

Sarajevo, juni 2006
ExtrData.txt

Sarajevo, juni 2006
RefData.txt Amino acids One letter code
Number coding
Alanine A 01
Cysteine C 02
Aspartate D 03
Glutamate E 04
Phenylalanine F 05
Glycine G 06
Histidine H 07
Isolecine I 08
Lysine K 09
Leucine L 10
Methionine M 11
Asparagine N 12
Proline P 13
Glutamine Q 14
Arginine R 15
Serine S 16
Threonine T 17
Valine V 18
Tryptophan W 19
Threonine Y 20
Secondary structure DSSP classes
Numbercoding
Alpha helix H,G 1Beta strand E 2Other structure B, I, S, T, C, L 3

Sarajevo, juni 2006
CodData.txt

Sarajevo, juni 2006
PrimStr.txt i SekStr.txt
'PrimStr.txt' (coding potein sequnceces file)
'SecStr.txt' (secondary structure file)

Sarajevo, juni 2006
Design of neural network arhitecture

39


Related Documents