ORIGINAL PAPER Artificial neural network models of relationships between Alternaria spores and meteorological factors in Szczecin (Poland) Agnieszka Grinn-Gofroń & Agnieszka Strzelczak Received: 2 April 2008 / Revised: 19 August 2008 / Accepted: 29 August 2008 # ISB 2008 Abstract Alternaria is an airborne fungal spore type known to trigger respiratory allergy symptoms in sensitive patients. Aiming to reduce the risk for allergic individuals, we constructed predictive models for the fungal spore circulation in Szczecin, Poland. Monthly forecasting mod- els were developed for the airborne spore concentrations of Alternaria, which is one of the most abundant fungal taxa in the area. Aerobiological sampling was conducted over 2004–2007, using a Lanzoni trap. Simultaneously, the following meteorological parameters were recorded: daily level of precipitation; maximum and average wind speed; relative humidity; and maximum, minimum, average, and dew point temperature. The original factors as well as with lags (up to 3 days) were used as the explaining variables. Due to non-linearity and non-normality of the data set, the modelling technique applied was the artificial neural network (ANN) method. The final model was a split model with classification (spore presence or absence) followed by regression for spore seasons and log(x+1) transformed Alternaria spore concentration. All variables except max- imum wind speed and precipitation were important factors in the overall classification model. In the regression model for spore seasons, close relationships were noted between Alternaria spore concentration and average and maximum temperature (on the same day and 3 days previously), humidity (with lag 1) and maximum wind speed 2 days previously. The most important variable was humidity recorded on the same day. Our study illustrates a novel approach to modelling of time series with short spore seasons, and indicates that the ANN method provides the possibility of forecasting Alternaria spore concentration with high accuracy. Keywords Alternaria . Artificial neural networks . Meteorological parameters . Szczecin (Poland) Introduction The air is seldom free of fungal spores (Lacey 1981). Spore concentrations measured in the atmosphere are the result of a wide range of complex interrelated environmental and biological factors such as the growth and differentiation of spores. The concentration of fungal spores in the atmo- sphere at any particular moment is influenced by the processes involved in their production, release, and depo- sition. The eventual rate of spore deposition and resuspen- sion depends mainly on meteorological factors and on the size and shape of the spores (Lyon et al. 1984). A better understanding of the relative importance of these factors and their interrelationships would help determine the role of spore dispersal in allergies to airborne fungal spores. However, there are comparatively few advanced forecasting models of airborne fungal spore circulation (Katial et al. 1997), and most of these usually display low predictability (Angulo-Romero et al. 1999; Mitakakis et al. 2001; Troutt and Levetin 2001; Stennett and Beggs 2004). Problems in the modelling of airborne Int J Biometeorol DOI 10.1007/s00484-008-0182-3 A. Grinn-Gofroń (*) Department of Plant Taxonomy and Phytogeography, University of Szczecin, Wąska 13, 71-415 Szczecin, Poland e-mail: [email protected] A. Strzelczak Institute of Chemistry and Environmental Protection, Szczecin University of Technology, Aleja Piastów 42, 71-065 Szczecin, Poland e-mail: [email protected]

Welcome message from author
This document is posted to help you gain knowledge. Please leave a comment to let me know what you think about it! Share it to your friends and learn new things together.
Transcript
ORIGINAL PAPER
Artificial neural network models of relationshipsbetween Alternaria spores and meteorological factorsin Szczecin (Poland)
Agnieszka Grinn-Gofroń & Agnieszka Strzelczak
Received: 2 April 2008 /Revised: 19 August 2008 /Accepted: 29 August 2008# ISB 2008
Abstract Alternaria is an airborne fungal spore typeknown to trigger respiratory allergy symptoms in sensitivepatients. Aiming to reduce the risk for allergic individuals,we constructed predictive models for the fungal sporecirculation in Szczecin, Poland. Monthly forecasting mod-els were developed for the airborne spore concentrations ofAlternaria, which is one of the most abundant fungal taxain the area. Aerobiological sampling was conducted over2004–2007, using a Lanzoni trap. Simultaneously, thefollowing meteorological parameters were recorded: dailylevel of precipitation; maximum and average wind speed;relative humidity; and maximum, minimum, average, anddew point temperature. The original factors as well as withlags (up to 3 days) were used as the explaining variables.Due to non-linearity and non-normality of the data set, themodelling technique applied was the artificial neuralnetwork (ANN) method. The final model was a split modelwith classification (spore presence or absence) followed byregression for spore seasons and log(x+1) transformedAlternaria spore concentration. All variables except max-imum wind speed and precipitation were important factorsin the overall classification model. In the regression modelfor spore seasons, close relationships were noted between
Alternaria spore concentration and average and maximumtemperature (on the same day and 3 days previously),humidity (with lag 1) and maximum wind speed 2 dayspreviously. The most important variable was humidityrecorded on the same day. Our study illustrates a novelapproach to modelling of time series with short sporeseasons, and indicates that the ANN method provides thepossibility of forecasting Alternaria spore concentrationwith high accuracy.
Keywords Alternaria . Artificial neural networks .
Meteorological parameters . Szczecin (Poland)
Introduction
The air is seldom free of fungal spores (Lacey 1981). Sporeconcentrations measured in the atmosphere are the result ofa wide range of complex interrelated environmental andbiological factors such as the growth and differentiation ofspores. The concentration of fungal spores in the atmo-sphere at any particular moment is influenced by theprocesses involved in their production, release, and depo-sition. The eventual rate of spore deposition and resuspen-sion depends mainly on meteorological factors and on thesize and shape of the spores (Lyon et al. 1984).
A better understanding of the relative importance ofthese factors and their interrelationships would helpdetermine the role of spore dispersal in allergies to airbornefungal spores. However, there are comparatively fewadvanced forecasting models of airborne fungal sporecirculation (Katial et al. 1997), and most of these usuallydisplay low predictability (Angulo-Romero et al. 1999;Mitakakis et al. 2001; Troutt and Levetin 2001; Stennettand Beggs 2004). Problems in the modelling of airborne
Int J BiometeorolDOI 10.1007/s00484-008-0182-3
A. Grinn-Gofroń (*)Department of Plant Taxonomy and Phytogeography,University of Szczecin,Wąska 13,71-415 Szczecin, Polande-mail: [email protected]
A. StrzelczakInstitute of Chemistry and Environmental Protection,Szczecin University of Technology,Aleja Piastów 42,71-065 Szczecin, Polande-mail: [email protected]
fungal spore circulation result partly from the limitations ofstatistical methods. Many widely used methods of dataanalysis, such as linear or multiple regressions, are based onassumptions of linearity and normality. Such requirementsoften cannot be fulfilled even after variable transformations,and the performance models thus obtained can be insuffi-cient. This situation is particularly typical for time serieswith short spore seasons, where no airborne fungal sporesare present during most of the year. Therefore, there is aneed to verify other statistical techniques for application inthe field of biometeorology to try to overcome the abovementioned problems.
One methods that has recently turned out to be useful inecological modelling is the artificial neural network (ANN)technique. Neural networks function as a universal approx-imating system with the ability to learn, adapt andgeneralise the knowledge acquired. The ANN method isespecially applicable to multivariate data sets with non-linear dependencies, and it does not require variables to fitany theoretical distribution (Carling 1992; Fausett 1994;Tadeusiewicz 2001; Osowski 1996; Lek and Guegan 1999).Therefore, ANNs might be useful as advanced forecastingmodels of airborne fungal spore circulation.
Alternaria has been considered one of the most prevalentmould allergens (Budd 1986). It has been described as oneof the major fungi responsible for inhalation allergies inhumans (Caretta 1992), thus explaining why Alternariaspores are counted in many aerobiological stations alongwith airborne pollen. Climatic information is of greatimportance in the management and/or prevention ofrespiratory allergic diseases (Hasnain 1993).
The aim of this study was to examine the relationshipbetween the atmospheric Alternaria spore content and theprevailing meteorological parameters in the area of Szczecin,Poland using a novel data analysis technique—ANNs. Nopredictive modelling of the aeroallergen circulation seasonhas been developed in Poland before. Our ultimate goal wasto create forecasting models of high predictability that mightbe applicable also to other regions.
Materials and methods
Aerobiological monitoring was performed in Szczecin from1 January 2004 to 31 December 2007. Szczecin is situatedin the Odra river valley in north-west Poland, approximate-ly 60 m above sea level, 53°26′26″ N, 14°32′50″ E. Thevolumetric method using a Lanzoni 7 Day Recording Trapwas employed in this study. The trap was installed on arooftop in the Szczecin city district of Śródmieście, at aheight of 21 m above ground level. Meteorological datacovering the 4 years of the study were provided by anAutomatic Weather Station (Vaisala, Finland). The meteo-
rological parameters taken into account for the assessmentof the effect of meteorological conditions on airbornefungal spores were: daily level of precipitation; maximumwind speed; average wind speed; relative humidity;maximum, minimum and average air temperature; anddew point temperature. The daily values of particularparameters were taken as totals, arithmetic means ormaxima and minima. Additionally meteorological variableswith 1-, 2- and 3-day lags were introduced into the data set.
Spore data were analysed to determine the start, end andduration of the season using the 90% method. The start ofthe season was defined as the date on which 5% of theseasonal cumulative spore count was trapped, and the endof the season as the date on which 95% of the seasonalcumulative spore count was reached.
Data analysis
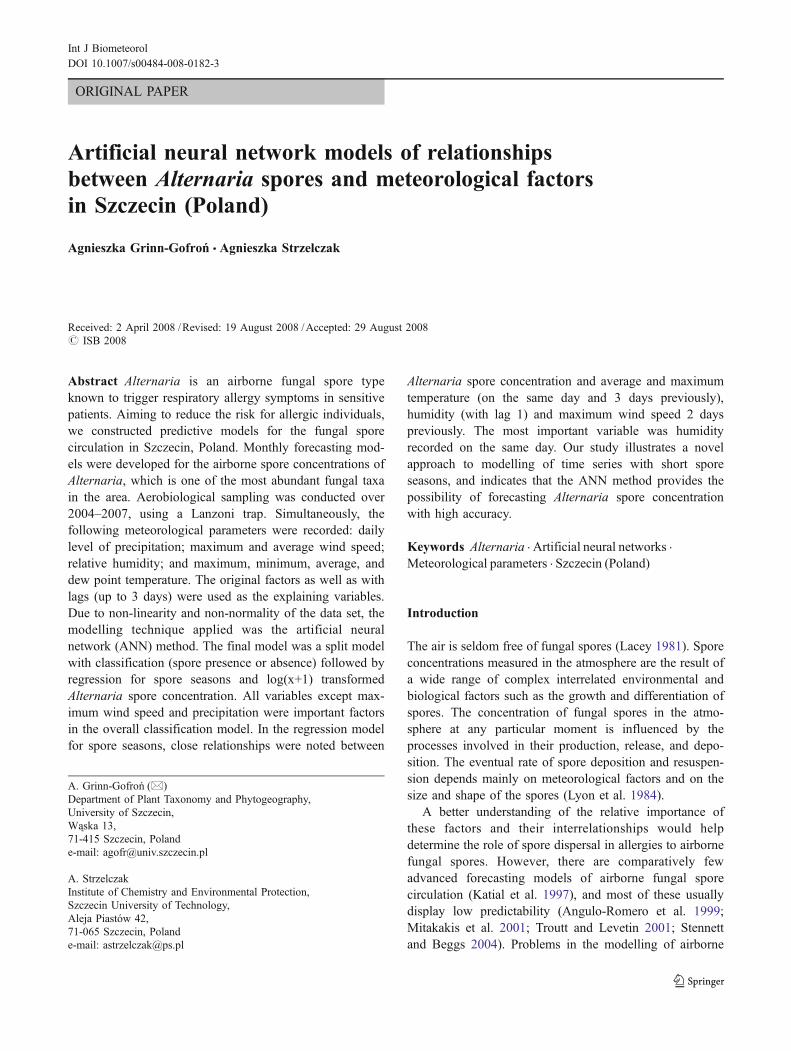
The spore seasons were relatively short, and zero valuesprevailed in the Alternaria time series (Fig. 1). As shown inFig. 2, the Alternaria spore data approximated an expo-nential distribution. Meteorological parameters mostlyapproximated a normal distribution; however, the Shapiro-Wilk test confirmed significant deviations from normality(results not shown). Scatter plots for variables without lagsindicated non-linear dependencies between Alternaria sporeconcentration and meteorological parameters.
Due to non-linearity and non-normality, neither thePearson’s correlation coefficient nor multiple regressioncould be used. Therefore, Spearman’s rank correlation andANN models were applied in order to examine the studiedrelationships. Meteorological parameters (original and withlags) were used as input variables while the Alternaria
Fig. 1 Alternaria spore time series. Szczecin (Poland) 2004–2007
Int J Biometeorol

spore concentration was the output variable. The followingmodels were created:
1. Overall regression model, raw variables.2. Overall regression model, log(x+1) transformed Alter-
naria spore concentration. Log(x+1) transformationwas applied to the Alternaria spore concentration. Theaim was to dampen the effect of many zero values and
rapid changes in spore concentration in the originalvariable.
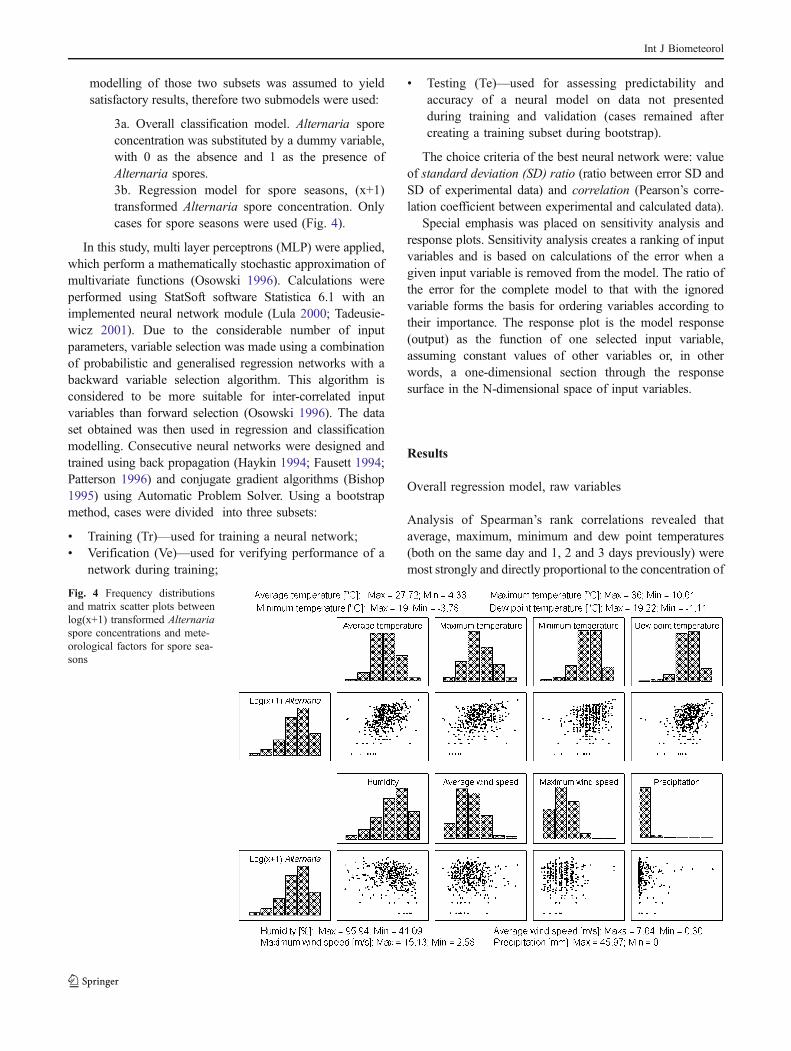
3. Split models. The transformation used in model 2 didnot normalise the Alternaria spore concentration;furthermore, a division into two subsets was visible inthe scatter plots—zero and higher than zero values ofAlternaria spore concentrations (Fig. 3). Separate
Fig. 2 Frequency distributionsand matrix scatter plots betweenAlternaria spore concentrationand meteorological factors (rawdata)
Fig. 3 Frequency distributionsand matrix scatter plots betweenlog(x+1) transformed Alternariaspore concentration and meteo-rological factors
Int J Biometeorol
modelling of those two subsets was assumed to yieldsatisfactory results, therefore two submodels were used:
3a. Overall classification model. Alternaria sporeconcentration was substituted by a dummy variable,with 0 as the absence and 1 as the presence ofAlternaria spores.3b. Regression model for spore seasons, (x+1)transformed Alternaria spore concentration. Onlycases for spore seasons were used (Fig. 4).
In this study, multi layer perceptrons (MLP) were applied,which perform a mathematically stochastic approximation ofmultivariate functions (Osowski 1996). Calculations wereperformed using StatSoft software Statistica 6.1 with animplemented neural network module (Lula 2000; Tadeusie-wicz 2001). Due to the considerable number of inputparameters, variable selection was made using a combinationof probabilistic and generalised regression networks with abackward variable selection algorithm. This algorithm isconsidered to be more suitable for inter-correlated inputvariables than forward selection (Osowski 1996). The dataset obtained was then used in regression and classificationmodelling. Consecutive neural networks were designed andtrained using back propagation (Haykin 1994; Fausett 1994;Patterson 1996) and conjugate gradient algorithms (Bishop1995) using Automatic Problem Solver. Using a bootstrapmethod, cases were divided into three subsets:
& Training (Tr)—used for training a neural network;& Verification (Ve)—used for verifying performance of a
network during training;
& Testing (Te)—used for assessing predictability andaccuracy of a neural model on data not presentedduring training and validation (cases remained aftercreating a training subset during bootstrap).
The choice criteria of the best neural network were: valueof standard deviation (SD) ratio (ratio between error SD andSD of experimental data) and correlation (Pearson’s corre-lation coefficient between experimental and calculated data).
Special emphasis was placed on sensitivity analysis andresponse plots. Sensitivity analysis creates a ranking of inputvariables and is based on calculations of the error when agiven input variable is removed from the model. The ratio ofthe error for the complete model to that with the ignoredvariable forms the basis for ordering variables according totheir importance. The response plot is the model response(output) as the function of one selected input variable,assuming constant values of other variables or, in otherwords, a one-dimensional section through the responsesurface in the N-dimensional space of input variables.
Results
Overall regression model, raw variables
Analysis of Spearman’s rank correlations revealed thataverage, maximum, minimum and dew point temperatures(both on the same day and 1, 2 and 3 days previously) weremost strongly and directly proportional to the concentration of
Fig. 4 Frequency distributionsand matrix scatter plots betweenlog(x+1) transformed Alternariaspore concentrations and mete-orological factors for spore sea-sons
Int J Biometeorol
Alternaria spores (Table 1). Highly significant negativecorrelations of a rather low level were observed in the caseof humidity, and average and maximum wind speed, with theexception of relative humidity with a 2-day lag. Associationwith precipitation turned out to be weak and insignificant.
Backward variable selection using the ANN moduleindicated the following parameters as the optimal set ofinput factors: average temperature, average temperature2 days previously, maximum temperature, maximumtemperature 1 day previously, maximum temperature 2 dayspreviously, and dew point temperature 2 days previously.This result is consistent with the Spearman’s correlationanalysis.
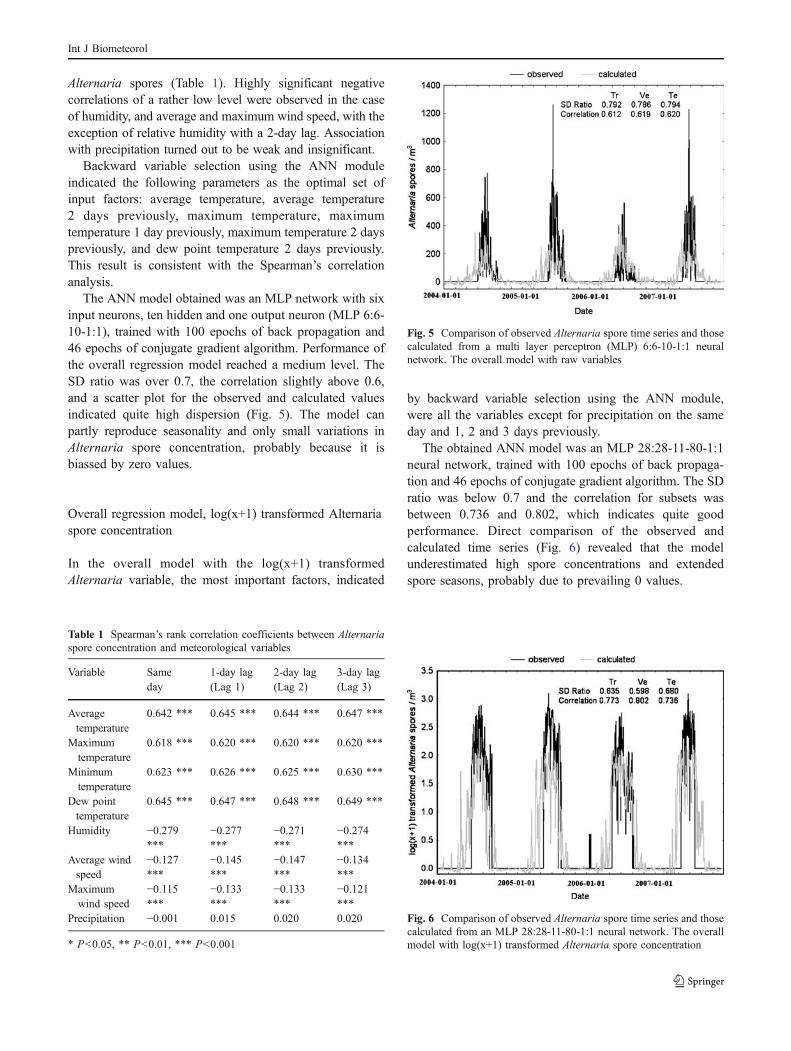
The ANN model obtained was an MLP network with sixinput neurons, ten hidden and one output neuron (MLP 6:6-10-1:1), trained with 100 epochs of back propagation and46 epochs of conjugate gradient algorithm. Performance ofthe overall regression model reached a medium level. TheSD ratio was over 0.7, the correlation slightly above 0.6,and a scatter plot for the observed and calculated valuesindicated quite high dispersion (Fig. 5). The model canpartly reproduce seasonality and only small variations inAlternaria spore concentration, probably because it isbiassed by zero values.
Overall regression model, log(x+1) transformed Alternariaspore concentration
In the overall model with the log(x+1) transformedAlternaria variable, the most important factors, indicated
by backward variable selection using the ANN module,were all the variables except for precipitation on the sameday and 1, 2 and 3 days previously.
The obtained ANN model was an MLP 28:28-11-80-1:1neural network, trained with 100 epochs of back propaga-tion and 46 epochs of conjugate gradient algorithm. The SDratio was below 0.7 and the correlation for subsets wasbetween 0.736 and 0.802, which indicates quite goodperformance. Direct comparison of the observed andcalculated time series (Fig. 6) revealed that the modelunderestimated high spore concentrations and extendedspore seasons, probably due to prevailing 0 values.
Table 1 Spearman’s rank correlation coefficients between Alternariaspore concentration and meteorological variables
Variable Sameday
1-day lag(Lag 1)
2-day lag(Lag 2)
3-day lag(Lag 3)
Averagetemperature
0.642 *** 0.645 *** 0.644 *** 0.647 ***
Maximumtemperature
0.618 *** 0.620 *** 0.620 *** 0.620 ***
Minimumtemperature
0.623 *** 0.626 *** 0.625 *** 0.630 ***
Dew pointtemperature
0.645 *** 0.647 *** 0.648 *** 0.649 ***
Humidity −0.279***
−0.277***
−0.271***
−0.274***
Average windspeed
−0.127***
−0.145***
−0.147***
−0.134***
Maximumwind speed
−0.115***
−0.133***
−0.133***
−0.121***
Precipitation −0.001 0.015 0.020 0.020
* P<0.05, ** P<0.01, *** P<0.001
Fig. 5 Comparison of observed Alternaria spore time series and thosecalculated from a multi layer perceptron (MLP) 6:6-10-1:1 neuralnetwork. The overall model with raw variables
Fig. 6 Comparison of observed Alternaria spore time series and thosecalculated from an MLP 28:28-11-80-1:1 neural network. The overallmodel with log(x+1) transformed Alternaria spore concentration
Int J Biometeorol
Split models
Overall classification model
In the overall classification model, the most importantfactors, indicated by backward variable selection using theANN module, were all the variables except for maximumwind speed and precipitation on the same day and 1, 2 and3 days previously. The obtained network was an MLP27:27-11-80-1:1 neural network, trained with 100 epochs ofback propagation and 46 epochs of conjugate gradientalgorithm. Good performance was obtained—92.97% of“0” cases and 71.88% of “1” cases were predicted correctly.
Sensitivity analysis indicated dew point temperatures(1 day previously, on the same day and 3 days previously)as the most important variables (Table 2). All the remainingvariables were less important although some also contrib-
uted to improvement of model performance (ratio slightlyabove 1).
Regression model for spore seasons, log(x+1) transformedAlternaria spore concentration
Spearman’s rank correlations were calculated for the sporeseason data set (Table 3). As for the original data set,directly proportional and highly significant dependenciesbetween the Alternaria spore concentration and meteoro-logical factors were observed in the case of average,maximum, minimum and dew point temperatures. Howev-er, those correlations became weaker as the lag increased.Quite high positive correlation was also observed forhumidity recorded on the same or the previous day.Average and maximum wind speed revealed moderateinversely proportional correlations, but these were signifi-cant only for 1 or 2 days of lag and 1 day of lag,respectively. No significant correlation was observedbetween precipitation and Alternaria spore concentrations.
Backward variable selection using the ANN moduleexcluded the following variables from the model: averagewind speed, maximum wind speed, maximum wind speed3 days previously, precipitation, precipitation 2 days previ-ously and precipitation 3 days previously. This result isconsistent with the Spearman’s rank correlations.
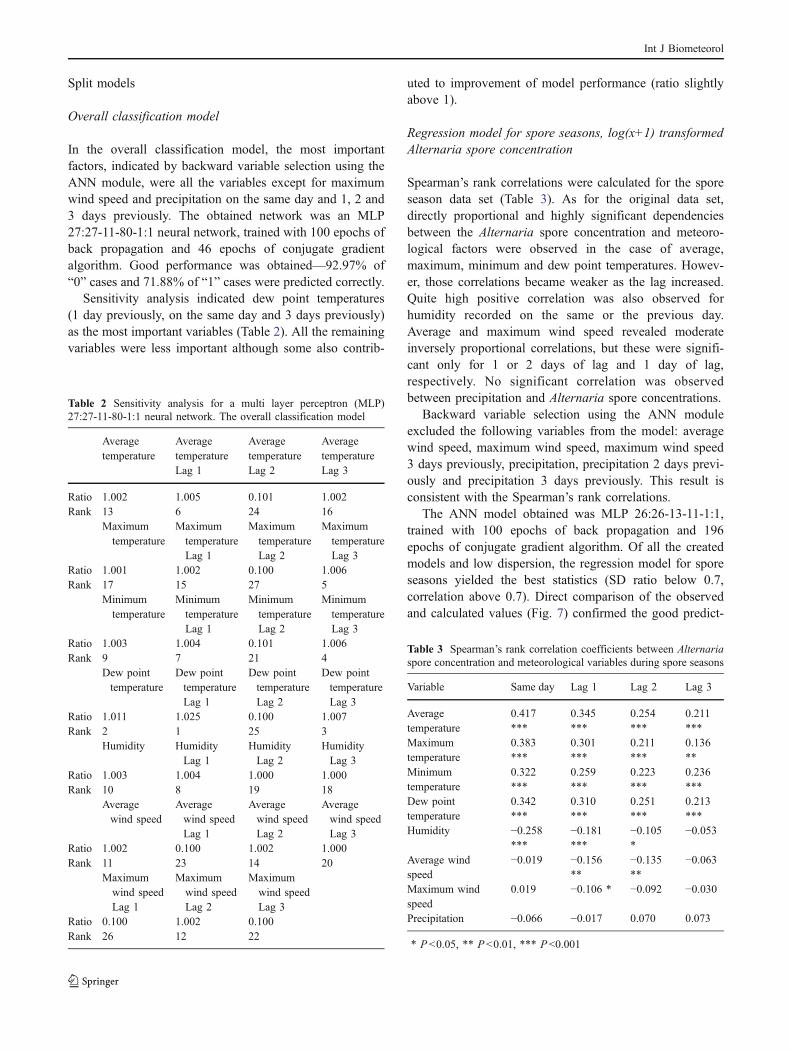
The ANN model obtained was MLP 26:26-13-11-1:1,trained with 100 epochs of back propagation and 196epochs of conjugate gradient algorithm. Of all the createdmodels and low dispersion, the regression model for sporeseasons yielded the best statistics (SD ratio below 0.7,correlation above 0.7). Direct comparison of the observedand calculated values (Fig. 7) confirmed the good predict-
Table 2 Sensitivity analysis for a multi layer perceptron (MLP)27:27-11-80-1:1 neural network. The overall classification model
Averagetemperature
AveragetemperatureLag 1
AveragetemperatureLag 2
AveragetemperatureLag 3
Ratio 1.002 1.005 0.101 1.002Rank 13 6 24 16
Maximumtemperature
MaximumtemperatureLag 1
MaximumtemperatureLag 2
MaximumtemperatureLag 3
Ratio 1.001 1.002 0.100 1.006Rank 17 15 27 5
Minimumtemperature
MinimumtemperatureLag 1
MinimumtemperatureLag 2
MinimumtemperatureLag 3
Ratio 1.003 1.004 0.101 1.006Rank 9 7 21 4
Dew pointtemperature
Dew pointtemperatureLag 1
Dew pointtemperatureLag 2
Dew pointtemperatureLag 3
Ratio 1.011 1.025 0.100 1.007Rank 2 1 25 3
Humidity HumidityLag 1
HumidityLag 2
HumidityLag 3
Ratio 1.003 1.004 1.000 1.000Rank 10 8 19 18
Averagewind speed
Averagewind speedLag 1
Averagewind speedLag 2
Averagewind speedLag 3
Ratio 1.002 0.100 1.002 1.000Rank 11 23 14 20
Maximumwind speedLag 1
Maximumwind speedLag 2
Maximumwind speedLag 3
Ratio 0.100 1.002 0.100Rank 26 12 22
Table 3 Spearman’s rank correlation coefficients between Alternariaspore concentration and meteorological variables during spore seasons
Variable Same day Lag 1 Lag 2 Lag 3
Averagetemperature
0.417***
0.345***
0.254***
0.211***
Maximumtemperature
0.383***
0.301***
0.211***
0.136**
Minimumtemperature
0.322***
0.259***
0.223***
0.236***
Dew pointtemperature
0.342***
0.310***
0.251***
0.213***
Humidity −0.258***
−0.181***
−0.105*
−0.053
Average windspeed
−0.019 −0.156**
−0.135**
−0.063
Maximum windspeed
0.019 −0.106 * −0.092 −0.030
Precipitation −0.066 −0.017 0.070 0.073
* P<0.05, ** P<0.01, *** P<0.001
Int J Biometeorol
ability of the obtained model as well as the ability torecreate most of the variations.
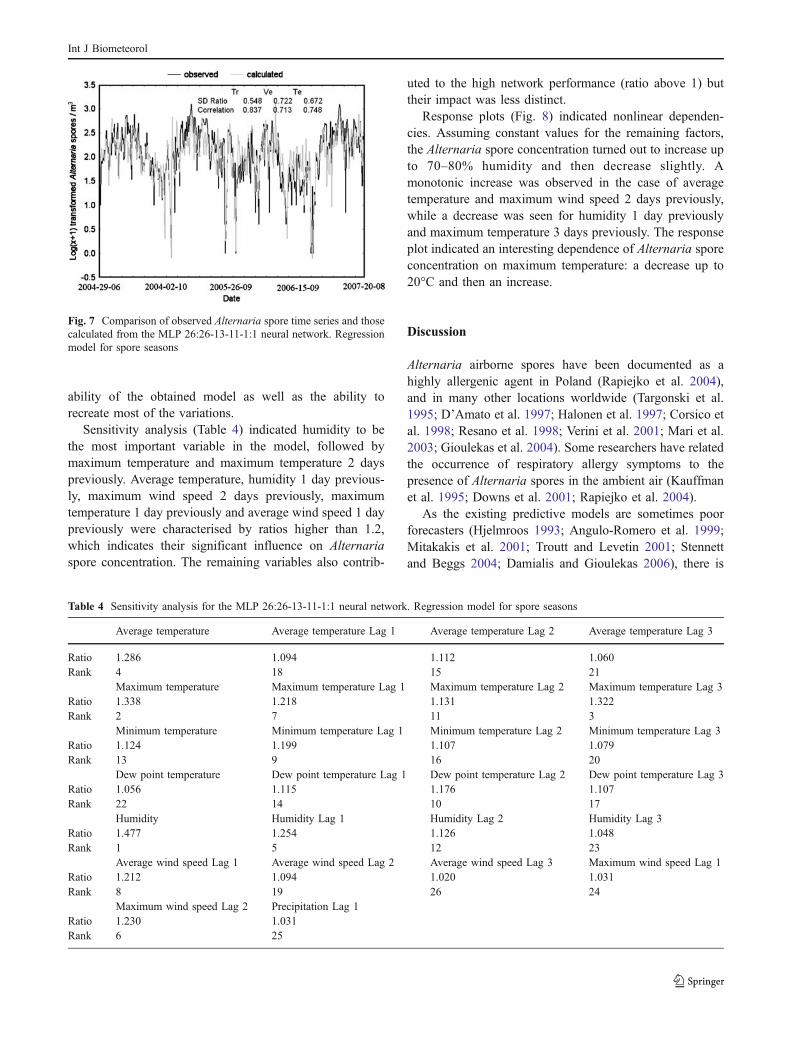
Sensitivity analysis (Table 4) indicated humidity to bethe most important variable in the model, followed bymaximum temperature and maximum temperature 2 dayspreviously. Average temperature, humidity 1 day previous-ly, maximum wind speed 2 days previously, maximumtemperature 1 day previously and average wind speed 1 daypreviously were characterised by ratios higher than 1.2,which indicates their significant influence on Alternariaspore concentration. The remaining variables also contrib-
uted to the high network performance (ratio above 1) buttheir impact was less distinct.
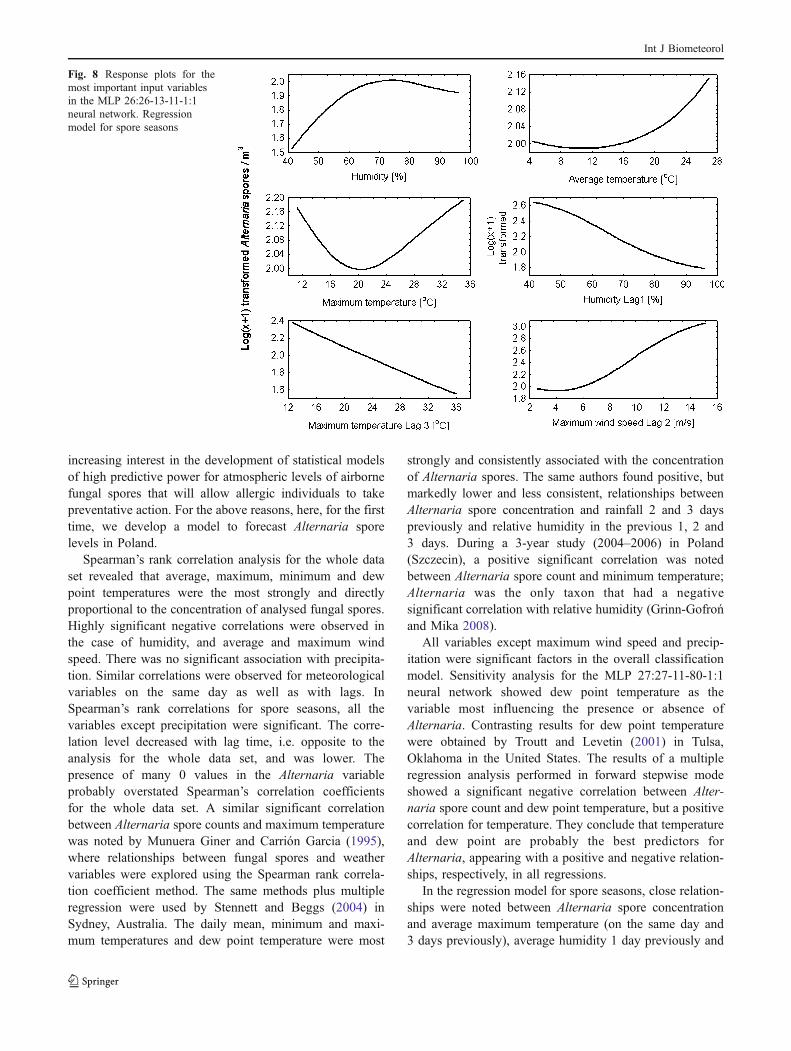
Response plots (Fig. 8) indicated nonlinear dependen-cies. Assuming constant values for the remaining factors,the Alternaria spore concentration turned out to increase upto 70–80% humidity and then decrease slightly. Amonotonic increase was observed in the case of averagetemperature and maximum wind speed 2 days previously,while a decrease was seen for humidity 1 day previouslyand maximum temperature 3 days previously. The responseplot indicated an interesting dependence of Alternaria sporeconcentration on maximum temperature: a decrease up to20°C and then an increase.
Discussion
Alternaria airborne spores have been documented as ahighly allergenic agent in Poland (Rapiejko et al. 2004),and in many other locations worldwide (Targonski et al.1995; D’Amato et al. 1997; Halonen et al. 1997; Corsico etal. 1998; Resano et al. 1998; Verini et al. 2001; Mari et al.2003; Gioulekas et al. 2004). Some researchers have relatedthe occurrence of respiratory allergy symptoms to thepresence of Alternaria spores in the ambient air (Kauffmanet al. 1995; Downs et al. 2001; Rapiejko et al. 2004).
As the existing predictive models are sometimes poorforecasters (Hjelmroos 1993; Angulo-Romero et al. 1999;Mitakakis et al. 2001; Troutt and Levetin 2001; Stennettand Beggs 2004; Damialis and Gioulekas 2006), there is
Fig. 7 Comparison of observed Alternaria spore time series and thosecalculated from the MLP 26:26-13-11-1:1 neural network. Regressionmodel for spore seasons
Table 4 Sensitivity analysis for the MLP 26:26-13-11-1:1 neural network. Regression model for spore seasons
Average temperature Average temperature Lag 1 Average temperature Lag 2 Average temperature Lag 3
Ratio 1.286 1.094 1.112 1.060Rank 4 18 15 21
Maximum temperature Maximum temperature Lag 1 Maximum temperature Lag 2 Maximum temperature Lag 3Ratio 1.338 1.218 1.131 1.322Rank 2 7 11 3
Minimum temperature Minimum temperature Lag 1 Minimum temperature Lag 2 Minimum temperature Lag 3Ratio 1.124 1.199 1.107 1.079Rank 13 9 16 20
Dew point temperature Dew point temperature Lag 1 Dew point temperature Lag 2 Dew point temperature Lag 3Ratio 1.056 1.115 1.176 1.107Rank 22 14 10 17
Humidity Humidity Lag 1 Humidity Lag 2 Humidity Lag 3Ratio 1.477 1.254 1.126 1.048Rank 1 5 12 23
Average wind speed Lag 1 Average wind speed Lag 2 Average wind speed Lag 3 Maximum wind speed Lag 1Ratio 1.212 1.094 1.020 1.031Rank 8 19 26 24
Maximum wind speed Lag 2 Precipitation Lag 1Ratio 1.230 1.031Rank 6 25
Int J Biometeorol
increasing interest in the development of statistical modelsof high predictive power for atmospheric levels of airbornefungal spores that will allow allergic individuals to takepreventative action. For the above reasons, here, for the firsttime, we develop a model to forecast Alternaria sporelevels in Poland.
Spearman’s rank correlation analysis for the whole dataset revealed that average, maximum, minimum and dewpoint temperatures were the most strongly and directlyproportional to the concentration of analysed fungal spores.Highly significant negative correlations were observed inthe case of humidity, and average and maximum windspeed. There was no significant association with precipita-tion. Similar correlations were observed for meteorologicalvariables on the same day as well as with lags. InSpearman’s rank correlations for spore seasons, all thevariables except precipitation were significant. The corre-lation level decreased with lag time, i.e. opposite to theanalysis for the whole data set, and was lower. Thepresence of many 0 values in the Alternaria variableprobably overstated Spearman’s correlation coefficientsfor the whole data set. A similar significant correlationbetween Alternaria spore counts and maximum temperaturewas noted by Munuera Giner and Carrión Garcia (1995),where relationships between fungal spores and weathervariables were explored using the Spearman rank correla-tion coefficient method. The same methods plus multipleregression were used by Stennett and Beggs (2004) inSydney, Australia. The daily mean, minimum and maxi-mum temperatures and dew point temperature were most
strongly and consistently associated with the concentrationof Alternaria spores. The same authors found positive, butmarkedly lower and less consistent, relationships betweenAlternaria spore concentration and rainfall 2 and 3 dayspreviously and relative humidity in the previous 1, 2 and3 days. During a 3-year study (2004–2006) in Poland(Szczecin), a positive significant correlation was notedbetween Alternaria spore count and minimum temperature;Alternaria was the only taxon that had a negativesignificant correlation with relative humidity (Grinn-Gofrońand Mika 2008).
All variables except maximum wind speed and precip-itation were significant factors in the overall classificationmodel. Sensitivity analysis for the MLP 27:27-11-80-1:1neural network showed dew point temperature as thevariable most influencing the presence or absence ofAlternaria. Contrasting results for dew point temperaturewere obtained by Troutt and Levetin (2001) in Tulsa,Oklahoma in the United States. The results of a multipleregression analysis performed in forward stepwise modeshowed a significant negative correlation between Alter-naria spore count and dew point temperature, but a positivecorrelation for temperature. They conclude that temperatureand dew point are probably the best predictors forAlternaria, appearing with a positive and negative relation-ships, respectively, in all regressions.
In the regression model for spore seasons, close relation-ships were noted between Alternaria spore concentrationand average maximum temperature (on the same day and3 days previously), average humidity 1 day previously and
Fig. 8 Response plots for themost important input variablesin the MLP 26:26-13-11-1:1neural network. Regressionmodel for spore seasons
Int J Biometeorol

average maximum wind speed 2 days previously. The mostimportant variable was humidity recorded on the same day.We found no dependence between precipitation and thepresence of Alternaria spores. The ANN model revealedactual non-linear relationships.
A similar importance of maximum temperature and windspeed was observed by Herrero et al. (1996) in Palencia(Spain). They also noted a positive significant correlation forprecipitation using two statistical analyses: multiple regres-sion and Duncan's multiple range test. Lyon et al. (1984; inManhattan, KA), using multiple regression analysis, alsonoted that the maximum and minimum temperatures aresignificantly correlated with concentrations of Alternaria.Using autoregressive predictive models , Damialis andGioulekas (2006) observed that Alternaria spores werestrongly related to air temperature in Thessaloniki (Greece).The interaction effects of rainfall and wind were alsoconsidered necessary for long-term (annual) predictions ofairborne fungal concentrations.
In contrast to the results presented above, Hjelmroos(1993; in Stockholm, Sweden) and Katial et al. (1997; inDenver, CO) noted no statistically significant correlationbetween Alternaria spore count and weather variables, andconsidered that no statistical model can be proposed forAlternaria spore concentrations in relation to climate.
Our study shows that the ANN method provides thepossibility of satisfactory forecasting of Alternaria sporeconcentrations. Time series with many 0 values of Alter-naria spore concentration turned out to be quite hard topredict, since they actually consist of two subsets (equal to0 and higher than 0). In this case, the most suitable tool isthe split model with classification (spore presence orabsence), followed by regression for spore seasons andlog(x+1) transformed output variables, in order to dampenthe effect of rapid changes in spore concentrations. Ourresults indicate that precise ANN modelling of Alternariaspore concentration with non-normality and non-linearityrequires a basic set of meteorological variables widened byvariables with lags. We believe that our forecasting modelscould be still further improved, and could be focussed moreprofoundly on seasonal variations in spore–meteorologicalvariable time series.
References
Angulo-Romero J, Mediavilla-Molina A, Dominquez-Vilches E(1999) Conidia of Alternaria in the atmosphere of the city ofCordoba, Spain in relation to meteorological parameters. Int JBiometeorol 43:45–49 doi:10.1007/s004840050115
Bishop C (1995) Neural networks for pattern recognition. OxfordUniversity Press
Budd TW (1986) Allergens of Alternaria. Grana 25:147–154
Caretta G (1992) Epidemiology of allergenic disease the fungi.Aerobiologia 8:439–445 doi:10.1007/BF02272913
Carling A (1992) Introducing neural networks. Sigma, Wilmslow, UKCorsico R, Cinti B, Feliziani V, Gallesio MT, Liccardi G, Loreti A
(1998) Prevalence of sensitization to Alternaria in allergicpatients in Italy. Ann Allergy Asthma Immunol 80:71–76
D’Amato G, Chatzigeorgiou G, Corsico R, Gioulekas D, Jäger L,Jäger S (1997) Evaluation of the prevalence of skin prick testpositivity to Alternaria and Cladosporium in patients withsuspected respiratory allergy—a European multicenter studypromoted by the Subcommittee on Aerobiology and Environ-mental Aspects of Inhalant Allergens of the European academyof Allergology and Clinical Immunology. Allergy 52:711–716doi:10.1111/j.1398-9995.1997.tb01227.x
Damialis A, Gioulekas D (2006) Airborne allergenic fungal sporesand meteorological factors in Greece: forecasting possibilities.Grana 45:122–129 doi:10.1080/00173130600601005
Downs SH, Mitakakis TZ, Marks GB, Car NG, Belousova EG,Leuppi JD (2001) Clinical importance of Alternaria exposure inchildren. Am J Respir Crit Care Med 164:455–459
Fausett L (1994) Fundamentals of neural networks. Prentice Hall,New York
Gioulekas D, Damialis A, Papakosta D, Spieksma FTM, Gioulekas P,Patakas D (2004) Allergenic fungi spore records (15 years) andsensitization In patients with respiratory allergy In Thessaloniki-Greece. J Investig Allergol Clin Immunol 14:225–231
Grinn-Gofroń A, Mika A (2008) Selected airborne allergenicfungal spores and meteorological factors in Szczecin, Poland,2004–2006. Aerobiologia 24:89–97 doi:10.1007/s10453-008-9088-0
Halonen M, Stern DA, Wright AL, Taussing LM, Martinez FD (1997)Alternaria as a major allergen for asthma in children raised in adesert environment. Am J Respir Crit Care Med 155:1356–1361
Hasnain SM (1993) Influence of meteorological factors in theairspora. Grana 32:182–187
Haykin S (1994) Neural networks: a comprehensive foundation.Macmillan, New York
Herrero B, Fombella-Blanco MA, Fernández-González D, Valencia-Barrera RM (1996) The role of meteorological factors indetermining the annual variation of Alternaria and Cladosporiumspores in the atmosphere of Palencia, 1990–1992. Int JBiometeorol 39:139–142 doi:10.1007/BF01211226
Hjelmroos M (1993) Relationships between airborne fungal sporepresence and weather variables. Cladosporium and Alternaria.Grana 32:40–47
Katial RK, Zhang YM, Jones RH, Dyer PD (1997) Atmospheric moldspore counts in relation to meteorological parameters. Int JBiometeorol 41:17–22 doi:10.1007/s004840050048
Kauffman HF, Tomee JFC, Van Der Werf TS, De Monchy JGR,Koeter GK (1995) Review of fungus induced asthmatic reactions.Am J Respir Crit Care Med 151:2109–2116
Lacey J (1981) The aerobiology of conidial fungi. In: Cole GT,Kendrick B (eds) Biology of conidial fungi, vol I. Academic,New York, pp 373–415
Lek S, Guegan JF (1999) Artificial neural networks as a tool inecological modeling, an introduction. Ecol Modell 120:65–73doi:10.1016/S0304-3800(99)00092-7
Lula P (2000) Selected applications of artificial neural networks usingSTATISTICA Neural Networks (in Polish). StatSoft Polska,Kraków, Poland
Lyon FL, Kramer CL, Eversmeyer MG (1984) Vertical variation ofairspora concentrations in the atmosphere. Grana 23:123–126
Mari A, Schneider P, Wally V, Breitenbach M, Simon-Nobbe B (2003)Sensitization to fungi: epidemiology, comparative skin tests, andige reactivity of fungal extracts. Clin Exp Allergy 33:1429–1438doi:10.1046/j.1365-2222.2003.01783.x
Int J Biometeorol

Mitakakis TZ, Clift A, McGee PA (2001) The effect of local croppingactivities and weather on the airborne concentration of allergenicof Alternaria spores in rural Australia. Grana 40:230–239doi:10.1080/001731301317223268
Munuera Giner M, Carrión Garcia JS (1995) Daily variations ofAlternaria spores in the city of Murcia (semi-arid south-easternSpain). Int J Biometeorol 38:176–179 doi:10.1007/BF01245385
Osowski S (1996) Algorithmic approach to artificial neural networks(in Polish). WNT, Warszawa, Poland
Patterson D (1996) Artificial neural networks. Prentice Hall, SingaporeRapiejko P, Lipiec A, Wojdas A, Jurkiewicz D (2004) Threshold
pollen concentration necessary to evoke allergic symptoms. IntRev Allergol Clin Immunol 10(3):91–94
Resano A, Sanz ML, Oehling A (1998) sensitization to Alternaria andCladosporium in asthmatic patients and its in vitro diagnosticconfirmation. J Investig Allergol Clin Immunol 8:353–358
Stennett PJ, Beggs PJ (2004) Alternaria spores in the atmosphere ofSydney, Australia, and relationships with meteorological factors.Int J Biometeorol 49:98–105 doi:10.1007/s00484-004-0217-3
Tadeusiewicz R (2001) Introduction to neural networks (in Polish).Statsoft Polska, Kraków, Poland
Targonski PV, Persky VW, Ramakrishnan V (1995) Effect ofenvironmental molds on risk of death from asthma during thepollen season. J Allergy Clin Immunol 95:955–961 doi:10.1016/S0091-6749(95)70095-1
Troutt C, Levetin E (2001) Correlation of spring spore concentrationsand meteorological conditions in Tulsa, Oklahoma. Int JBiometeorol 45:64–74 doi:10.1007/s004840100087
Verini M, Rossi N, Verrotti A, Pelaccia G, Nicodemo A, Chiarellui F(2001) Sensitization to environmental antigens in asthmaticchildren from a central Italian area. Sci Total Environ 270:63–69 doi:10.1016/S0048-9697(00)00798-1
Int J Biometeorol
Related Documents