Welcome message from author
This document is posted to help you gain knowledge. Please leave a comment to let me know what you think about it! Share it to your friends and learn new things together.
Transcript

PraiseforArtificialIntelligenceMarketingandPredictingConsumerChoice
‘Fullofhard-wonpracticalwisdom,thisisacomprehensiveguidetonavigatingthecomplexityofmarketforecasting.Foregoingthehyperbolethatsooftencharacterizesdiscussionsofartificialintelligence,DrStruhlthoroughlyexplainsawiderangeofmethods,wheretheirdifficultieslieandhowtogetthebestinsightsfromeach.’PeterGoldstein,SoftwareEngineer,Google
‘DrStruhl’snewbookisararejewelamongmarketingsciencetomes–informative,easytounderstandand,dareIsay,evenentertaining.DrStruhlsurveysseveralmajoranalytictechniquesinplainEnglish,introducingthenovicetofoundationalconceptswhileatthesametimeremindingtheseasonedanalystofbestpracticesoftenforgotten,allwhilesprinklinghiswryhumourlikeaspoonfulofsugartohelpthemedicinegodown.Fortechniquesalreadyfamiliar,it’sanenjoyablerefresher;fortechniquesunfamiliar,anexcellentintroduction.Avaluableresourceforbeginnerandexpertalike.’DrRichardMcCullough,President,MacroConsultingInc
‘Thisbookcoverslucidlyanumberofresearchmethodologiesthatcommonlysupportveryimportantnewproductdevelopmentandmarketingstrategydecisions.DrStruhlshouldbecommendedformakingthematerialsaccessibletoawiderangeofaudiencesbyemphasizingthepracticality,appropriateness,andprosandconsofthevariousmethodologies.’JehoshuaEliashberg,SebastianSKresgeProfessorofMarketing,andProfessorofOperations,InformationandDecisions,TheWhartonSchool
‘DrStruhlhaswrittenanotherhighlyinformativebook.Itoffersaneasy-to-understandwayofthinkingabouthowtobestusedatatoanswerbiggermarketingquestions.Hisexplanationsareclearandrelatable,makingthisbookaninvaluabletoolforanyoneinvolvedincommercialdecisionmaking,especiallymarketersandresearchers.’KatieSzelc,Manager,CustomerInsights,GlobalBusinessInsights,Johnson&JohnsonMedicalDevices
‘Anexcellentall-in-oneprimerfortoday’smarketerandresearcher.Thisisclear,tothepointandacomprehensiveguidetothiscomplexfield.’LouisATucciPhD,AssociateProfessorofMarketing,TheCollegeofNewJersey
‘DrStruhldoesanexcellentjobofexplainingthestrengthsandweaknessesofmethodsofpredictingconsumerbehaviour.Thisbookisthoughtful,well-written,andalsoapracticalbookformarketers,marketingresearchersandbusinessconsultants.Ifyouhelporganizationsmakedecisions,thebestdecisionyoucanmakerightnowistoreadthisbook.’DavidFHarris,authorofTheCompleteGuidetoWritingQuestionnaires:Howtogetbetterinformationforbetterdecisions
‘ArtificialIntelligenceMarketingandPredictingConsumerChoiceclearlyexplainsthetoolsthatdrivesophisticatedmarketresearch.Iheartilyrecommendthisbookforanyonelookingforgreaterinsightandsuccesswithcutting-edgetechniques.’RobertKaminsky,President,MedSpanResearch
‘Forresearcherswhowanttotacklethecomplextasksofpredictingconsumerchoicesandcreatingmarketsimulations,thisbookisagreatone-stopreference.Ineasy-to-readstylewithplentyofusefulexamples,theauthorcoversconventionalmultivariatedataanalysistechniques(conjoint,discretechoice,CHAID,regression)aswellasthelatestones(HierarchicalBayesiananalysis).Thebookalsoincludesmanykeyconceptsanddefinitionsusefulforanyquantitativeresearcher,suchasstatisticalsignificance,sampling,andmore.’KathrynKorostoff,LeadInstructorand
Founder,ResearchRockstarLLC
‘Thisbookcoversanextensivesetofmethodsforpredictingconsumerchoices,includingconjointanalysis,discretechoicemodelling,neuralnetworks,classificationtrees,Bayesianmethods,andsomuchmore.DrStruhlhaswrittenagenuinelypracticalguidetopredictiveanalyticsthatissoeasy,itreadslikeabedtimereader.Havingbeenapractitionerinthisareaforover20years,Ifoundthisbooktonotonlybeinformativeforapertinent21stcenturytopic,butalsoafunread.’DonMeyer,ClientDirector,Analytics,ACNielsen
‘I’vebeenworkingwithDrStruhlforthepasttwoandahalfyearsandamtrulyimpressedbyhisexpertise.Hisbookcoversatrulyexpansiverangeofmethodsforpredictingconsumerchoices.Theseincludeneuralnetworks,ensembles,BayesianNetworksandclassificationtrees.Healsotalksabouthowmoreestablishedmethodssuchasconjointanalysisanddiscretechoicemodellinghavebenefitedfrommachinelearningmethods.Hereyouwillfindthebestapplicationsofeachapproach,withplentyofexamplesfromreallife,showingwhatworksandwhatdoesnot.Theonline,downloadablesimulatorprogramsareincrediblyimpressiveandshowyoutheamazingthingsthatcanbedoneintherealmofpredictions.’SungLee,President,TheResearchAssociates
‘Thisbookcoversatrulyexpansiverangeofmethodsforpredictingconsumerchoices.Someoftheseincludeconjointanalysis,discretechoicemodelling,neuralnetworks,classificationtrees,andBayesiannetworks.Withpracticaltipsandexamples,andawelcomeuseofhumour,thisisaclear,easy-to-readanddefinitiveguideforexpertsandnovicesalike.’PaulNisbetPhD,President,OneResearch
‘StevenStruhl’sdecadesofexperienceasananalyticsguruinreal-worldmarketingapplicationsshinethroughinthishighlyreadableguidetomodernanalysesandmodelsofconsumerchoices.Inengagingandentertainingstyle,brimmingwithpracticalexamples,withoutabstrusetheoryorsaleshype,hisbookisadown-to-earthandmuch-neededguide
thatclearsupthemysteriesofthesemethods.’DaveLyon,Principal,AuroraMarketModeling
‘DrStruhlhasdoneitagain!He’stakenacutting-edgetopicandgroundeditinveryaccessibleprose,usingreal-lifesituationssothatmarketingandmarketresearchpractitionerscanimmediatelyactuponArtificialIntelligenceanditsabilitytopredictconsumerchoice.IstronglyrecommendthisbookforanyonewantingtobetterunderstandhowtousethegrowingpresenceofArtificialIntelligenceandmachinelearninginourday-to-dayresponsibilities.’DarrinHelsel,PastResearchChair,AmericanMarketingAssociation,Portland
‘DrStruhl’slatestbook,ArtificialIntelligenceMarketingandPredictingConsumerChoice,providesconcreteandeasy-to-understandinformationaboutasetofanalysesthatcanbeintimidatingforresearchersandclientsalike.Hisexamplesareclearandapplicabletotheconceptsbeingdiscussedandprovideexcellentinsightsintohowthesevaluableanalyticaltechniquescanbeusedtoanswerreal-lifebusinessquestions.Inaddition,DrStruhlalsowriteswithasenseofhumourwhichhelpstomakereaderscomfortableandthematerialevenmorereadilyunderstandable.Thisbookisanexcellentresourceforbothmarketresearchsuppliersandclients!’JulieWorwaMBA,ResearchandMarketingConsultant
‘StevenStruhlhasagiftfortakingcomplexmethodologicalissuesandexplainingtheminaccessible,meaningfullanguage.Hiswritingisthought-provokingandentertaining.ArtificialIntelligenceMarketingandPredictingConsumerChoicetacklesmanyofthecontemporarychallengesofturninganabundanceofdataintocrucialinsights.Itisamust-readforanyonewhoisexploringtheuseofartificialintelligencemethodstoinformmarketingtacticsandstrategies.’LarryDurkin,SeniorConsultant,MSPAnalytics

ArtificialIntelligenceMarketingandPredictingConsumerChoiceAnoverviewoftoolsandtechniques
StevenStruhl

CONTENTS
CoverTitlePageCopyrightContentsListofFiguresListofTablesPreface
01Whoshouldreadthisbookandwhy?WhatwecoverinthisbookWhatcanyouexpectinthisbook?DataversusinformationWhatisimportant?ThemethodswewillbediscussingImplicitviewsofpeopleandbiasesOnewayofcomparingthesemethodsSenseandsensibilitywithpredictionsWherewewillnotbegoingSummaryofkeypoints
02GettingtheprojectgoingAtthebeginningKnowwhoyouaretalkingaboutortalkingtoWhatisthemostyoucanexpectfromeachmethod?Howdoyoujudgetheresult?Whatissignificant?OntocorrelationsHowdoIplantoevaluatetheresults?Knowwhatsensiblegoalsmightlooklike
Summaryofkeypoints
03Conjoint,discretechoiceandothertrade-offs:let’sdoanexperiment
ThereasonsweneedthesemethodsThebasicthinkingbehindtheexperimentally
designedmethodsWhatthemethodsask–andgetWhatisadesignedexperiment?ThegreatmeasurementpowerofexperimentsGettingmorefromexperiments:HBtotherescueAbrieftalkaboutoriginsApplicationsinbriefSummaryofkeypoints
04Creatingthebest,newestthing:discretechoicemodellingKeyfeaturesThinkingthroughandsettinguptheproblemHowmanypeopleyouneedUtilityandshareMarketsimulationsMakingmorethanonechoice:allocatingpurchasesUsingthesimulatorprogramintheonlineresourcesRoundingoutthepictureSummaryofkeypoints
05ConjointanalysisanditsusesThinkinginconjointversusthinkinginchoicesConjointanalysisforsingle-productoptimizationUsingthesingleproductsimulatorintheonline
resourcesConjointremainsanexcellentmethodformessagesConjointanalysisforthebestservicedeliveryUsingthemessageoptimizationsimulatorinthe
onlineresources

ConjointanalysisandinteractionsVariantsofconjointanalysisSummaryofkeypoints
06Predictivemodels:viaclassificationsthatgrowontreesClassificationtrees:understandinganamazing
analyticalmethodSeeinghowtreeswork,stepbystepStrong,yetweakAcasestudy:let’stakeacruiseCHAIDandCART(andCRT,C&RT,QUEST,J48and
others)Summary:applicationsandcautions
07RemarkablepredictivemodelswithBayesNetsWhatareBayesNetsandhowdotheycomparewith
othermethods?Let’smakeadealOurfirstexample:BayesNetslinkingsurvey
questionsandbehaviourBayesNetsconfirmatheoreticalmodel,mostlyWhatisimportanttobuyersofchildren’sapparelSummaryandconclusions
08Puttingittogether:whattousewhenThetasksthemethodsdoThinkingaboutthinking
BibliographyIndexBackcover
ListofFigures
FIGURE1.1Onewaytocategorizethemethodswewilldiscuss
FIGURE2.1Gettingtheframerightiscritical
FIGURE2.2Samplepercentages’errorsatdifferentsamplesizes
FIGURE2.3Noteverythingfallsintoastraightline
FIGURE2.4Correctclassificationtable–63percentcorrectoverall
FIGURE3.1Ratingthefeaturesofafloor-standingwinecooler
FIGURE3.2Asamplemarketplacescenariofordiscretechoicemodelling
FIGURE3.3Aprofileofaserviceforconjointanalysis
FIGURE3.4Asimplesimulatorforoneproduct
FIGURE3.5Asurveytaskformaximumdifferencescaling(MaxDiff)
FIGURE3.6AsurveytaskforaQ-Sort/Case5
FIGURE3.7Asmallandwrongwaytomeasureandalargercorrectway
FIGURE3.8Elementsofadesignedexperiment
FIGURE3.9Showingthattherearenocorrelationsamongattributes
FIGURE3.10Ourguestfictionalstudyparticipantrankscarsontwofeatures
FIGURE3.11Awin-lossmatrix
FIGURE4.1Aportionofamarketsimulator
FIGURE4.2Discretechoicetreatsbrandaslikeacontainerforfeatures
FIGURE4.3Aself-effectscurveforshareversusprice
FIGURE4.4Differentresponsesofsharetopricechanges
FIGURE4.5HowvalueschangeasHBanalysisruns
FIGURE4.6Errorsindiscretechoiceversusmanyothermethods
FIGURE4.7ComparingtheS-shapedresponsecurvetoprospecttheory
FIGURE4.8Thecurrentcasesideofthesimulator
FIGURE4.9Thereferencecasesideofthesimulator
FIGURE4.10Basecaseandtwosimulationsshowingthedangerofapricewar
FIGURE4.11Changesinrevenuesfromthesimulationsunderlinethedangers
FIGURE4.12Resultsfromthreemoresimulations
FIGURE4.13Pagedisplaycontrolsinthedownloadablesimulator
FIGURE4.14Theleftsideofthedownloadablesimulator
FIGURE4.15Therightsideofthedownloadablesimulator
FIGURE5.1Attributesindiscretechoiceversusattributesinconjoint
FIGURE5.2Differencesinhowdiscretechoiceandconjointtreatutility
FIGURE5.3Samplebasic-oneproductconjointsimulator
FIGURE5.4Detailsofhowutilitybecomesshareofpreference
FIGURE5.5Elementsvariedinthedirectmailoffering
FIGURE5.6Responsestotheelementsofthedirectmailoffer
FIGURE5.7Alternativestobetestedintheprintadvertisement
FIGURE5.8Oneoftheadstested
FIGURE5.9Thesimulatorusedforoptimizingthead
FIGURE5.10Elementsonawebpagevariedfortesting
FIGURE5.11Effectsofchangingelementsofthewebpage
FIGURE5.12Aserviceprofileforconjoint-basedoptimization
FIGURE5.13Priorities’placeonserviceareasfromtheanalysis
FIGURE5.14Effectsfromchangingthefrequencyofthe
newsletter
FIGURE5.15Howfrequencyofsamplingisoverdeliveredandunderdelivered
FIGURE5.16Thedownloadableadvertisingoptimizationsimulator
FIGURE5.17Averageresponsetochangesinpriceversuseachbrand’schanges
FIGURE5.18AnexampleofCBC-styleconjointanalysis
FIGURE6.1Thedatabase‘population’
FIGURE6.2Thetree’sfirstsplit
FIGURE6.3Resplittingthefirstsubgroup
FIGURE6.4Splittingofgroupsshownasaclassificationtree
FIGURE6.5Importancesfromrandomforests
FIGURE6.6Theelementsinatreediagram
FIGURE6.7Thefirstsplit,basedonupgrades
FIGURE6.8Thefirstsectionofthetree
FIGURE6.9Splittingvariablesforthoseupgradingonce
FIGURE6.10Mostlythebestprospects,thoseupgradingmorethanonce
FIGURE6.11Thewholeclassificationtree
FIGURE6.12Thegainschartsimplified
FIGURE6.13Decisionstumplinkingscoresandshare
FIGURE6.14Outputfromboosting
FIGURE7.1Aregressionlineshowingthebestprediction
FIGURE7.2Asplitfromaclassificationtree
FIGURE7.3Relationshipsinnetworks
FIGURE7.4Thenetworkforthethree-doorproblem
FIGURE7.5Insidethefirsttwonodesofthenetwork
FIGURE7.6Partofthethirdnode–whenyouchooseDoor1
FIGURE7.7Allofthethirdnode
FIGURE7.8Howlikelytheprizeistohidebehindeachdoor
FIGURE7.9S-shapedrelationshipfoundbyaBayesNet,butnotaregression
FIGURE7.10Asimplenetworklinkingshareandratings
FIGURE7.11Effectsrelativetothetargetandindexedversustheaverage
FIGURE7.12Aclassichierarchicalmodel
FIGURE7.13BayesNetsdiscoverahierarchy
FIGURE7.14Importancesfor46(disguised)attributes
FIGURE7.15Importanceoftrustandfashionbyageofchild

ListofTables
TABLE4.1Settingupcontingentpricing
TABLE6.1Thefirstfourclassificationrules
TABLE6.2Gainschartshowingthefivegroupswiththehighestindexvalues

Bonusonline-onlymaterialsareavailableatthefollowingurl:
www.koganpage.com/AI-Marketing
Bonusonline-onlyChapter1:Finishingexperimentsandontothenon-experimentalworld
Bonusonline-onlyChapter2:Artificialintelligence,ensemblesandneuralnets
Online-onlySimulators:threedifferentsimulatorsinExcelformat,oneinPowerPointformatandoneinPDF(AdobeAcrobat)format,allowingyoutointeractivelyoptimizeproductsandmessages.(YouwillneedFlashPlayerinstalledonyourcomputerforthePowerPointformatandPDF(AdobeAcrobat)formatsimulatorstowork.)

PREFACE
Newsandarticlesonartificialintelligenceseemtobeeverywhere.Atleasttheydoifyouarewritingabookwiththewords‘artificialintelligence’inthetitle.Butwhatisartificialintelligence?Criticalasthisfieldis,itappearsthatthereisnocleardefinition.
A reporter went to Alphabet (formerly Google), the epicentre ofartificial intelligence, and asked people working there for anexplanation.Herearesomeoftheanswers:
‘Iwoulddefinitelyinterviewsomeoneelse.’
‘Nothanks.Sorry.Goodluck.’
‘Idon’tknow.I’llpass.’
‘It’smachinelearning.’
‘IworkatYahoo…’
Still, this topic is vitally important for you and for answering theincreasingly difficult questions you are likely to encounter. Thisbook will give you the practical information and pointers onapplications thatyouneedtoknowtosucceed.But this isvital foryourfuturecampaigns,andthisbookwilltellyouwhatyouneedtoknowtogetahead.In Chapter 1, we propose a working definition. There is no
question thatartificial intelligence andmachine learning, ifnotin fact the same, overlap substantially. This of course raises thequestionofwhatmachinelearningmeans.This definition also varies depending on who you ask, just like
asking about the height of PT Barnum’s elephant, Jumbo. (Jumbowas twelve foot six incheshigh if you askedMrBarnum, and tenfootnineifyouaskedsomeonewithatapemeasure.)

An online article purporting to teach about machine learningincluded regression and clustering among advanced machinelearning methods. These are two of the most august and long-standingofanalyticalapproaches.Regressionwaswidelyusedwellbeforecomputersexisted.Even taking a less expansive definition, machine learning has
beenwithusfordecades.Ithasbeenworkinginthebackgroundasoftenasintheforeground,solvingproblemsthatwouldhavebeenimpossibletoapproachwithoutit.Thisisworthnotingseparately.

Hidinginplainsight
Wehavebeenusingmachineartificialintelligence/learningmethodsforyears.Ithasbeenanessentialpartofmanymethodsusedtopredictconsumerchoices.Wewillbelayingoutsomekeyapplicationsandhowtheyrelatetoartificialintelligencethroughoutthisbook.
Nowthatwehaveestablishedthat,oratleastsaidit,weshouldgiveyou some basic information so you know if you are about to sitdown in themovie youwanted to see.Wewould like to give yousome sense of who this author is anyhow, who is asking you tosoldier through territories that are fraught with complexity, andoftendescribedwithobscurityandobfuscation.Ifyouarepeekinginsideanonlinepreview,or(rarityofrarities)
lookingat this inabookstore, thiscouldbeyourspot todecide ifyou want to continue to the next glance. If you looked here bymistake, then now could be the time to realize this was a luckystrokeafterall.Thisbookaims tocut throughmuchof themurky language, the
jargon, recondite formulations, and even utter nonsensesurroundingthisfield.Wewillhavetogoovervocabulary.Butwewilldothisonlysoyouwillbepreparedwhenyouencountersuchtermsasorthogonaldesignandknowthattheyarenothingtofear.Wewill steeraroundequations, subscriptednotationandGreek
letters whenever possible. If youwere hoping to see all of those,thenthiscouldbeyourcuetoinvestigateelsewhere.This book is not a guide to the types of services that vendors
supply. Rather,we aim to describe enough about eachmethod sothatyougetanideaofhowitworks–and,moreimportantly,howyou best apply it. Reading this book will help you to deal withsellers as they approach youwith their newest, latest things. Theinformationyougetherewillenableyoutoevaluatetheirclaimsinaninformedandsuitablyinquiringway.Lookingatotherprefaces,thisseemstobetheplacewhereItake

aturntothefirstperson,andtellyoualittleaboutmyself.YoumaybequestioninghowandwhyIcametowriteabooklikethisinthefirstplace.Here’swhatIcancomeupwith.Ihavebeenworkinginapplyingdataanalysis topracticalproblemsforover30years.MyclientshaveincludedmanyFortune100companies,butalsoahostofmid-sizeandsmallerentities,alongwithcharitable,educationalandnon-profitorganizations.Irunaconsultingcompany,ConvergeAnalytic,specializinginadvancedanalytics.Ihavewrittenover25articlesandtwootherbooks,oneofwhich
hasbeen inprint for over 20 years. You can seebothonAmazon(and even buy them, not that I am hinting at anything). You canevenorderthenewerone,PracticalTextAnalytics,directlyfromtheKoganPagewebsite.Ihavetaughtadvancedstatisticstoboredgraduatestudentswho
had to take it to get their degrees, given numerous other coursesandseminars,andcontinuetoteachcertificationcoursesonline.Aboutmy own education, I started as an undergraduate in the
sciences. Beyond this, I have an MBA (University of Chicago), adoctorateinpsychology(ChicagoSchoolofProfessionalPsychology)and an MA in language and linguistics (Boston University). Thiscombination does at least seem congruous with the topic of thebook.Italsogivesrisetothequestionofwhy,whenIwasyounger,Ididn’tjustgetajob.Concerningthemethodsthatwewillreview,Ihavebeenworking
withmost forat least20yearsandsomeforover30.Everything Iwrite about has worked in real applications for at least severalyears. Therefore, everything you see here will have a solid trackrecordinrealapplications.Manythanksareinorderhere.WeshouldstartwithJennyVolich
and AnnaMoss at Kogan Page formaking this book possible.Myparticular thanks toCharlotteOwenandRajveerRo’isin Singh fortheirhelpfuleditingandencouragingcomments.Ialsowouldliketogiveaheartfelt‘thankyou’tomywifeDebra,

for again tolerating latenights andworkingweekends. Especially,mythankstoherforsteppingfaroutsideherfieldandactingasakindofroyalfoodtasterforyou,thereaders.Shetriedoutvarioussections of the book to find out whether they were particularlyindigestible.Twoquotesaboutexpertisehelpdefinetheaimsofthisbook.One
oftenattributedtoEdwarddeBonosays,‘Anexpertissomeonewhohassucceededinmakingdecisionsandjudgementssimplerthroughknowing what to pay attention to and what to ignore.’ Another,reportedly saidbyNielsBohr, defines an expert as aperson ‘whohas foundoutbyhisownpainfulexperienceall themistakes thatonecanmakeinaverynarrowfield’.Totheextent that thisbookcanmakedecisionssimplerandhelpyoutoavoidsomeharrowingslipups,itwillhaveserveditspurpose.

TomywifeDebraandmymotherLydia

01

Whoshouldreadthisbookandwhy?
Thischapterexplainswhoshouldreadthisbook,practitionerswhoneed to dealwith predicting consumer choices, and studentswhowant to understand what is involved. It discusses the issuesinvolved in trying to predict these choices. Here we also explainwhat makes up data itself and what makes up information,introducethetypesofanalysesandtheirnatures,andoutlinewhatyoucanexpecttogetoncealltheworkhasbeendone.In thischapter,wealso introduceacriticalguidelineweseek to
follow throughout our discussion, as delineated by Lewis Carroll:‘Beginat thebeginning…andgoon tillyoucome to theend: thenstop.’ We also need first to consider exactly what we want toanalyse,whatwehopetogetfromitandwhy.Thischapterstartsusonthisprocess.
WhatwecoverinthisbookWegiveyoupracticalpointersandsuccessfulstrategiestodealwithmany situations involving the prediction of consumer choices.Thinkingaboutthefollowingshouldclarifywherewearegoing.Iffacedwithanyofthefollowing,whatwouldyoudo?
✔Makingthebestpossiblenewdeviceorservice,includingthebestfeaturesandsettingthebestprice.
✔Understandinghowmuchtochargeforthefineproductorserviceyoualreadyoffer.
✔Counteringacompetitorcomingintothemarketplacewithanewofferingbyrevampingyourproductoryourclaims.
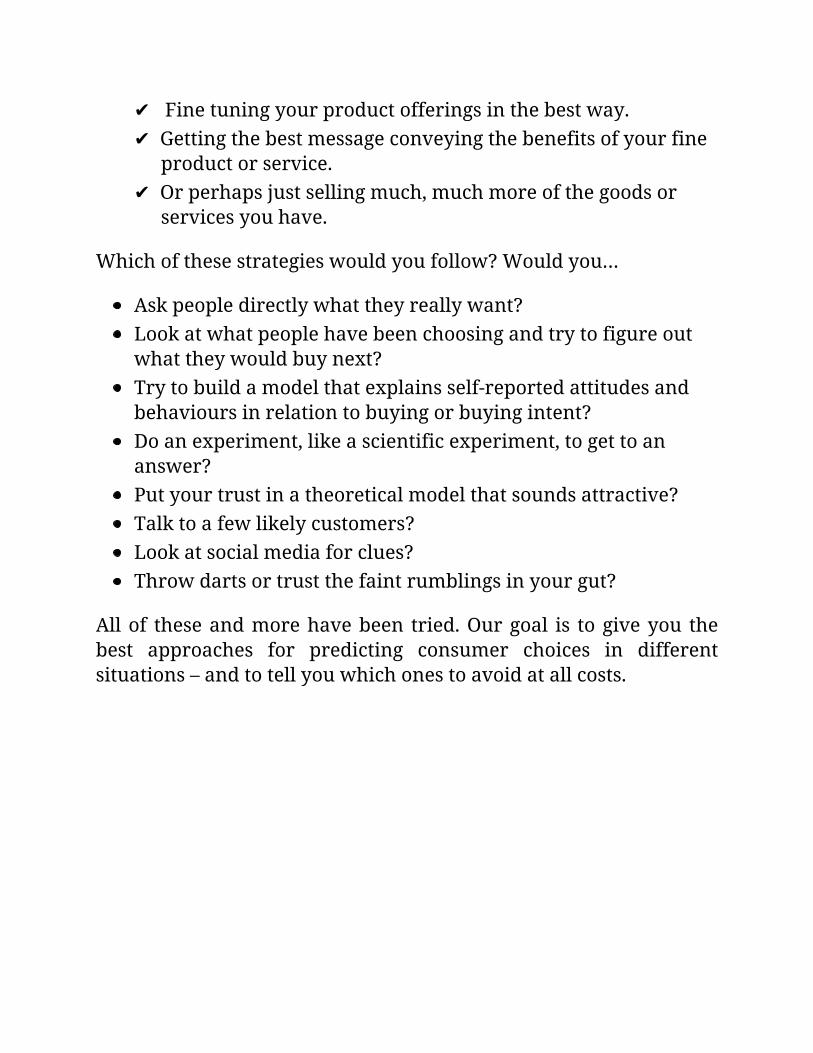
✔Finetuningyourproductofferingsinthebestway.✔Gettingthebestmessageconveyingthebenefitsofyourfine
productorservice.✔Orperhapsjustsellingmuch,muchmoreofthegoodsor
servicesyouhave.
Whichofthesestrategieswouldyoufollow?Wouldyou…
Askpeopledirectlywhattheyreallywant?Lookatwhatpeoplehavebeenchoosingandtrytofigureoutwhattheywouldbuynext?Trytobuildamodelthatexplainsself-reportedattitudesandbehavioursinrelationtobuyingorbuyingintent?Doanexperiment,likeascientificexperiment,togettoananswer?Putyourtrustinatheoreticalmodelthatsoundsattractive?Talktoafewlikelycustomers?Lookatsocialmediaforclues?Throwdartsortrustthefaintrumblingsinyourgut?
Allof theseandmorehavebeen tried.Ourgoal is togiveyou thebest approaches for predicting consumer choices in differentsituations–andtotellyouwhichonestoavoidatallcosts.
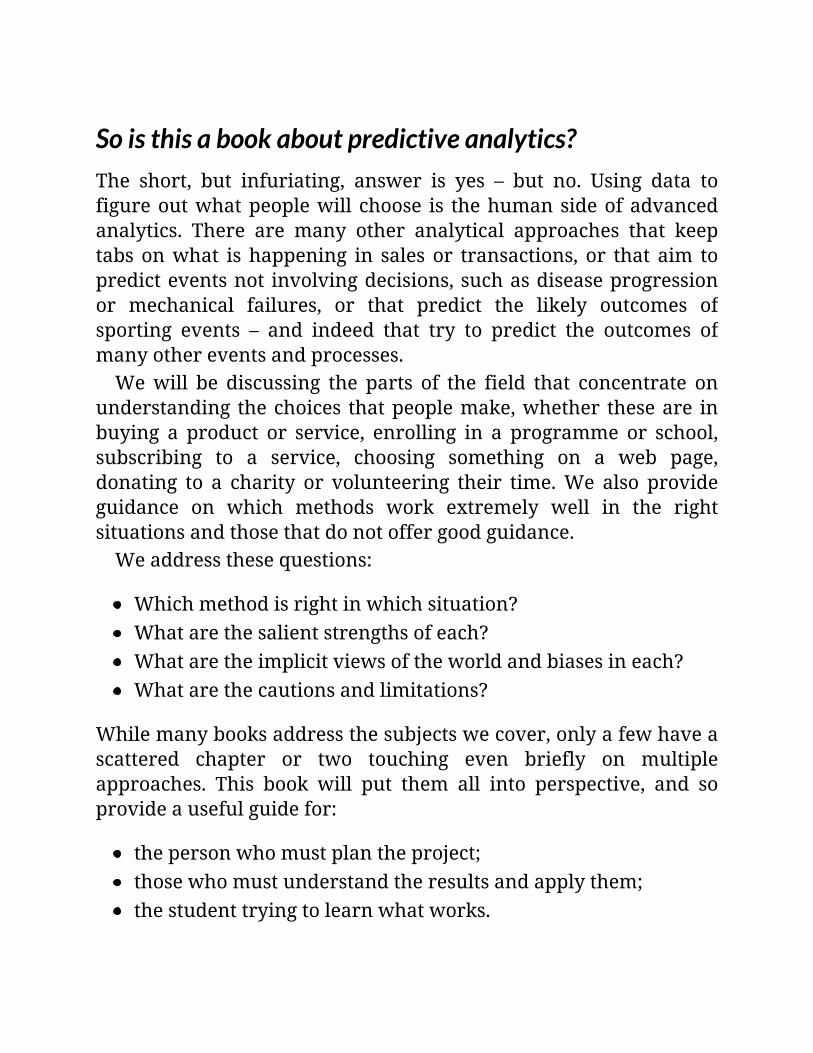
Soisthisabookaboutpredictiveanalytics?The short, but infuriating, answer is yes – but no. Using data tofigureoutwhatpeoplewill choose is thehumansideofadvancedanalytics. There are many other analytical approaches that keeptabs onwhat is happening in sales or transactions, or that aim topredicteventsnot involvingdecisions,suchasdiseaseprogressionor mechanical failures, or that predict the likely outcomes ofsporting events – and indeed that try to predict the outcomes ofmanyothereventsandprocesses.Wewill be discussing the parts of the field that concentrate on
understanding thechoices thatpeoplemake,whether theseare inbuying a product or service, enrolling in a programme or school,subscribing to a service, choosing something on a web page,donating to a charity or volunteering their time.We also provideguidance on which methods work extremely well in the rightsituationsandthosethatdonotoffergoodguidance.Weaddressthesequestions:
Whichmethodisrightinwhichsituation?Whatarethesalientstrengthsofeach?Whataretheimplicitviewsoftheworldandbiasesineach?Whatarethecautionsandlimitations?
Whilemanybooksaddressthesubjectswecover,onlyafewhaveascattered chapter or two touching even briefly on multipleapproaches. This book will put them all into perspective, and soprovideausefulguidefor:
thepersonwhomustplantheproject;thosewhomustunderstandtheresultsandapplythem;thestudenttryingtolearnwhatworks.
Whatcanyouexpectinthisbook?Wewill focus on theplanning,execution andapplication of thewidelydiversemethodsusedtopredictwhatpeoplewillchoose.Wewilltalkaboutseveralprimaryareas,including:
thebasics,suchasreasonsfordoingtheanalysesandcoretaskssuchasselectingdataorselectingasample,framingtherightquestionandfocusingonwhatmattersmost;thedifferenttypesofmodelsandwhattheyreallypredictaboutchoices;differentkindsofoutputandhowtheybestcanbeused.
Wewillbeexplainingsomeadvancedtopics,butyouwillneedlittlemore than a passing acquaintance with statistics or analyticalmethodstograpplewiththeseideas.Anytimeweintroduceanewterm (and given the nature of practitioners in the field, these arenot in short supply) there will be an explanation. Those of youhopingforsubscripts,Greeklettersandmulti-tieredequationshavedefinitelysatdowninthewrongtheatre.
LookforordinaryEnglish,notequations
Everyonecanbreatheasighofrelief.Wewillnotberesortingtoequationsfilledwithreconditesymbolsanddonotexpectyoutohavemasteredadvancedstatisticsormaths.Wewillbeaddressingcomplextopics,buteverythingwillbeexplainedinplainEnglish.
Somedefinitionsweneed
Predictionversusforecasting
Prediction isaconceptgroundingallourdiscussions.Thistermisjustconvenientshorthand,followingthecommonusagethatweseeinsuchtermsaspredictiveanalytics.Actually,noonecanpredictanything.Ifthatweretrue,yourauthorwouldnowbesittingonthedeck of his J-Class yacht with a cool drink. Writing this book, ofcourse,butstillontheyacht.Themorecorrecttermisforecasting,somethinglikeforecasting
theweather.Someofourforecastscanbeincrediblyaccurate–andindeedcan look likepredicting.Someotherapproachesarenotasfortunate–andwewill talkabout those.Sadly, though,wedonothave the advantage of weather forecasters, who can stick theirhands out of the window and solemnly ‘forecast’ that it is nowraining. Everything we discuss will go beyond just taking thecurrenttemperatureandreportingit.
Artificialintelligence
Movingtoanotherkeytopic,let’stalkaboutartificialintelligence.One often-seen definition: anything done by a machine thatresponds to its environment and takes actions that maximize itssuccess. The machines we will discuss are computers. Theirenvironmentisdata.Theirsuccesscriterionliesinfindingpatternsinthedatathatwecannotperceive–andthathelpustotakemoreeffectiveactions.

We are not talking about robots that can do our work for us(sorry if you were expecting this). As penetrating as a machine’sanalysismaybe,youmustmakethefinaldecisions,andyoumustdecidehowtoputtheinformationgarneredintoaction.
Practicalartificialintelligence
Artificialintelligencebroadlymeansanythingamachinedoestorespondtoitsenvironmenttomaximizeitschancesofsuccess.Themachinesweusearecomputersandwesettheirgoalasdetectingcomplexpatternsthatwecannotinordertoaidinourmakingbetterdecisions.Forthoseexpectingrobotstodoourworkforus–sorry,notyet.Somesystemswithlow-levelintelligenceareautomated.Otherwiseyouaretheonewhoneedstodecidehowtousetheinformationthatthemachinesprovide.
Evenifwearenottreadingintherealmofsciencefiction,wewillsee how remarkablymachines can parse and understand data inwaysthatwecannot,andseepatternsthatwenevercould.Thereismuchthatisamazinginthisarena–aswewilldiscussthroughoutthis book. Also, some systems do make autonomous, low-leveldecisions based on rules that we devise. And we will talk aboutthose.
Whoisaconsumer?
This is our last major definition. Of course, the term consumerincludes ordinary shoppers dealing with the often bewilderingarrayofchoicesweencounterinmodernlife.However,aconsumercouldalsobeanyofthese:
adoctorchoosingmedicationsforpatients;apurchasingagentchoosingwhichtypeofrubberbushingswillfillthestockroom;adonorchoosingwheretopledge;astudentchoosingwheretomatriculate;anexecutivetryingtochoosewhichmanufacturerofmobilephonetowerswillgetthebid.
Bytheway,mobilephonetowersarethosetallandoftenunsightlyobjectsthatallowustoenjoythewonderfulworldofsmartphoneseverywherewego.Theyareveryexpensive, andvery fewpeople
on the entire earth decide about buying them. These towers (andtheirbuyers)appearinoneofourexamplesaboutpricing.
And,finally,whatisamathematicalmodel?
Wewill be discussing these throughout. By this, we simplymeananytypeofregularmanipulationofasetofvariablestoforecastorpredict thevaluesofsometargetvariable.Thiscouldbeassimpleas adding or multiplication, or as complex as some of the mind-bendingly difficult approaches that we discuss later in the book.Thesevariablescanbeanyquantityorqualitythatvariesfromonepersontothenext,andcanincludepersonalcharacteristics,ratings,consumptionpatterns,choicesmade,statedbeliefsandsoon.
MovingforwardStay tuned as we discuss, and try to make sense of, work fromcommunities that rarely makemuchmention of each other. ThiswillbeaninterestingjourneyandthroughoutwewilltrytofollowtheadviceputforthbyLewisCarroll: ‘Beginatthebeginning?andgoontillyoucometotheend:thenstop.’
DataversusinformationWehearalotaboutdataandevenhaveentirecareersnamedafterit,suchasdatascientist.Oneofthefirstthingsweneedtosettleisthedifferencebetweendataandinformation.Datasimplymeansanythingthatcanbemeasuredinanyway:
Measurementsofthehumgivenoffbyneonlightsaredata.Exaggerations,conflations,misrepresentationsanddownrightliesaredata.Collectionsofvideosrecordinginactivityonemptystreetsatnightaredata.
Information isdata thathasbeengatheredandprocessed togiveyouinsightssothatyoucandealwithasituation–inparticularanunexpectedone:
Reportsthatatruckisstalledonthehighwayandyourexpectedroutehasbeendelayedareinformation.Analysesoffactorsinfluencingtrendsinenrolmentatyourschoolareinformation.Analysesofwhatpeoplehaveboughtsothatyoucansellthemmoreoftherightitemsareinformation.Linkingconsumerinterestinspecificproductfeaturestolevelsofpurchasingprovidesinformation.
Acriticaldifference:dataisnotinformation
Dataisanythingthatcanbemeasuredinanyway.Informationisdatathathasbeengatheredandprocessedsothatyoucanuseittodealwithasituation–inparticularoneyoudonotexpect.Datadoesnotdoanythingbyitself.Youmustfindhowtoturnitintoinformation,thenknowledge,andfinallyactions.
Authors Clifford Stoll and Gary Schubert take this a few stepsfurtherwhentheysay thatdata isnot information, information isnot knowledge, knowledge is not understanding, understanding isnotwisdom.Themethodswedescribeherecangetyouallthewaytoknowledge.Therestisuptoyou.
FallaciesabouthavinglotsofdataAbeliefthatstilllingersisthathavingmoredatamightjustsolveallproblems.Ifwerecallthatdataisjustbasicallybitsandpieces,wecanseethatthisiswrong.Yetweencounterthiserroneousideainmanyplacesontheweb,andeveninsome(bad)books.Weshouldknowbetter.Theauthorofonesuchbookmadesuchaclaimwhilespeaking at a conference (and right before your author spoke,whichdidnotstartthingsoffverywell).Thispersonevensaidthatmoredataisalwaysbetter,evenifyouareaddingbaddata.The audience, mostly people with long experience in direct
marketing,satwitheitheramusedorannoyedexpressions.Onthewayout,onepersonsaid,‘Well,he’sanacademic.Hemustnothavepractical experience.’ This comment captures an important point.Manyideasaboutdataseemattractivebutdonotsurviveexposuretoreality.More data of thewrong type actually is bad for you. If you are
lookingforaneedleinahaystackitdoesnothelptohavealargerhaystack.Whileitisaworthwhilegoaltocollectasmuchdataaspossible,
dataquality, andknowingwhichdatawilladdressyourneeds,
remainparamount.Somefrustrationwithhavinghugerepositories,and yet finding no useful purpose in them, can be seen in therelativelynewtermdataswamp.Thisisadatalakethathasgonebad(orwasnevergood).Adata lake is also a new idea, basically a gathering of various
data sources thatarekept in theirnative formatswith little tonoupfront attempt to integrate them (the earlier data warehousesattempted to do at least some integration). The hope with a datalake is that some newer software, such as the often-mentionedHadoop, will do the magic that allows the data to get called up,aligned,cleanedandintegrated–allofwhichthenjustmight leadtoananalysisthatprovidessomethinguseful.Cleaningupdataandgetting it to match with data in other formats in themselves areformidabletasks.Toooften,evengettingthisfarcanconsumegreatamountsoftimeandeffort.

Trytoavoidthismisconception
Data,andespeciallygreatmassesofdata,getplayedupastheanswerinthepress,onthewebandeveninsomebooks.Simplyhavingalotofdatadoesnothelpsolveproblems.Datathathasnotbeencollectedforthepurposesofaspecificsetofanalysesmayneveryieldananswer,regardlessofhowmuchdatayouhave.Addingmoredataunconnectedtoyourquestionswillmakeyourtaskharder,noteasier.Thelargerthehaystack,themoredifficultitbecomestofindtheneedle.
Whatisimportant?Ifwecouldcounteverythingthatpeoplechose,thenanyeventthatcausedachangeinourcountwouldbeimportant.Supposeyouarerunninganon-profitradiostation,andyoustartaso-calledpledgedrive asking for donations, and after days of begging, you raisemoney.Youcan, therefore,saythat thisendlesswheedlinghadanimportanteffect.Similarly,ifyouwanttoseeifaproductwillsell,youmayputitoutonshelvesandwatchwhathappens.However,inneithercasecanyousayyouhavedonethebestyou
could.With the radio station, you cannot answer the question ofhow much money you could have raised by other means. Forinstance,youmightsimplyremindpeoplethatyouneeddonationstocontinue(thishasbeencalleda‘silentdonationdrive’).Withtheproduct,youcannottellhowmuchyoumighthavesold
if you configured it differently or charged some other price. Bysimply putting the product on the shelf you also have incurrednumerous expenses. These include distribution and presumablypromotion(sothatpeopleknowitisontheshelfwaitingforthem).Failingthiswaycostsagreatdeal.
Measurementisnotinsight
While direct measurements of behaviour have the advantage ofbeingrealdata,theydonotgiveusanyinsightsintoalternativeswe

mighthavetried,orintothereasonsforpeoplemakingadecision.Directmeasurements also canprove to be surprisingly difficult.
Suppose you run a bank. Clearly, you would like to attract moredeposits,more loanbusiness andperhapsmore financial-advisingbusiness.However,whileyoucouldseesomeimmediatereturnstoyourpromotional efforts, some consumerdecisions in these areastakemoreconsiderationandmighthappenoverweeksormonths.Waiting this long to see if your promotion has had the desired
effect has numerous disadvantages. First andmost obvious is thespan of time itself.We also encounter the problem of events thatcouldinterveneduringthattime.Whatifsomethingintheexternalconditions changes, as a resultmaking your productmore or lessattractive?Whatifacompetitordrawsbusinessawaybycopying–orworse,outdoing–yourpromotion?If we can sum up, if you rely just onwhat you can observe in
behaviour, you may sell more of your fine product, enrol morestudents,getmorecharitablepledges–andsoon.Butyouwillnotknow how much better you could have done by altering yourapproach.
Thelimitationsofdirectmeasurement
Measuringbehaviourdirectlygivesyourealdata.However,itdoesnotallowyoutodetermineifyoucouldhavedonesomethingbetter.Italsodoesnotgiveyouanyinsightintoconsumers’impressionsormotivations.Evenifyoumeasureresponsestoseveralalternativessimultaneously,youstillareseverelylimitedinwhatyoucantestcomparedwiththeexperimentalmethodsthatwewilldiscuss,anddonothaveinformationaboutwhypeoplearerespondingastheydo.
UsingprecursorsorsurrogatesforbehaviourAll these factors lead to the use of other methods, includinginterviewing and measuring variables that are supposed to beprecursors to or surrogates forbehaviour. Someof the surrogateswidely regarded as suggesting what might happen when peoplechooseare:
awarenessoftheproductorservice;ratings,forinstancesatisfactionratingsona1to10scale;associationswithdesiredcharacteristicsfortheproduct;buyingintentions;preference.
Therearenumerousothers,but thesewillgiveusastart. Insomecases, these measures are treated as outcomes – for instance,measuringawareness,likingand/orratingsofaproduct(orservice)markstheendoftheexercise.Again, thepresumptionhereis thatthese measures are precursors to behaviour. In some instances,thesemeasureshaverealconsequencesinthemselves,forinstance,whereemployeecompensationgetstiedtoscoresinsatisfaction.Veryoften thesemeasures, andothers suchasdemographicsor
past purchases, get rolled into mathematical models of varioussorts.Andindeed,wewillbediscussinghowmodelsliketheseworkandshowingexamplesthroughoutthisbook.
ThemethodswewillbediscussingThemethodswewillbediscussingfallintofourbroadclasses:
experimentalortrade-offmethods;questionsandanswers;modelsbasedonstoredorhistoricdata,machinelearning,artificialintelligence;varioustheoreticalmodels.
Someofthesemaysoundmysteriousnow.Weaimtoclearupanyuncertaintyaswediscusseach.Let’stalkabouteachbriefly.
ExperimentalmethodsTheseweredesignedtodevelopnewproducts,serviceofferingsorcommunications. They involve interviewing people. These includeextremelypowerfulapproaches,inthattheycanestimateresponsestomanythousandsofproduct/serviceconfigurationsormessagesinmarket simulations – including themarket simulator programsthatwewillshowyou.Ifdonewell,theirpredictionscanbehighlyprecise. These methods have track records of over 30 years andextensiveacademicsupport.Workdevelopingoneofthesemethods– discrete choice modelling – won a Nobel Prize in economics in2000.Thesemethodshavebeenextendedandstrengthenedbytheuseofmachinelearningapproaches.
Questionsandanswers
The name itself explains the next set of approaches. People getinterviewedandaskedavarietyofquestions.Methodsavailableforanalysingtheseanswershaveadvancedconsiderably.Infact,herewe will also encounter artificial intelligence, in at least oneunexpectedplace.
Manytypesofoutputcomefromquestionsandanswers,rangingfromsimpledescriptions topowerfulmodels thatshowtheeffectsof different variables on some outcome (or even multipleoutcomes).Someoutcomesthatyoucanseepredictedincludelevelsof satisfaction, degree of preference, and even (with some newermethods) market share. We will bring you up to date on whatexpertsaretalkingaboutanddoing.
ModelsbasedonstoredorhistoricdataThese can go deeply into machine learning and artificialintelligence, and appear to make up much of marketing science.Manytimes,datathathasbeencollectedforpurposesotherthanaspecific analysis get assembled, probed and examined. Outputsinclude models for scoring customers and prospects, and evenalgorithmsforquickdecisionssuchaswhethertoshowaparticularpersonanadvertisementonagivenwebpage.This is the arena that gains the most attention and causes the
most concern about breaches of privacy. Perhaps surprisingly, allthemethodsthatgetusedhere(exceptingcomputer-basedonesthatassemblesourcesofdata)alsogetusedinanalysingquestionsandanswers.
TheoreticalmodelsThese are important because they influence somuch of theworkthat gets done in investigating data. These models attempt toexplainwhich factors lead to behaviour, andwhich often unseenunderlyingcausescanchangewhatapersonchooses.
Implicitviewsofpeopleandbiases
Modelsbasedonstoredorhistoricdata
Thesehaveat least these two implicit viewsofpeople.First is thelogical-seemingideathatwecanforecastwhatapersonislikelytodobyobservingwhattheyhavedone.So,forinstance,ifyouhaveboughtaboxofthewonderfulbreakfast-likesubstanceKardboardKrunchieseveryweek,itseemsreasonabletoassumeyouwillbuyonenextweek.Anotherimplicitviewisthatyouasaconsumerarelikelytobuy
whatpeoplesomehowsimilartoyouhavebought.Soifwomeninthe last trimester of pregnancy buy a lot of cotton balls, thenwemight assume that Thisbe,whoalso is in the last trimester of herpregnancy,islikelytobuycottonballs.These assumptions can work effectively, but also can lead to
problems, as we will discuss. A great deal of effort in marketingsciencesgoesintofindingcohortsandobservingwhattheyaremostlikelytodo.Thistypeofalignmentofindividualwithagroupisonebasis forcertainsystemsthatshowlow-levelartificial intelligence,includingtherecommendationengineswewilldiscusslater.
AnalysisofquestionsandanswersThe obvious but critical assumption here is that if you ask fairlydirect questions, whatever people tell you will provide valuableinformation. Direct questions asking for ratings of importance inparticularhavenumerousproblems,includingpeoplegivingoverlypositive ratings (acquiescence bias), people giving the sameanswer repeatedly (straight lining), cultural and personaldifferencesinhowscalesareused,andinaccurateresponsesduetothecommondesiretogivesociallydesirableanswers.Trying to minimize these problems, methods of more indirect
questioning have been devised. It is the experimental methods,though, that go furthest to overcome these pitfalls of directquestioning.
Theexperimentalmethods
TheexperimentalmethodsThis set of approaches arose due to the realization that peoplecannotorwillnottellyoudirectlybyratingswhattheymostvalueinaproductorservice.Thesemethodsaskpeopletomakechoicesin various ways and so reveal the true hierarchies in what theyvalue.Powerfulastheseexperimentalmethodscanbe,theyhavetheir
own implicit assumptions. They are based on the belief that aproduct, service or message can be broken down into discretefeatures that can be tested and compared. It is true that nearlyeverything we encounter has at least one measurable feature.However,withsomeproducts,servicesormessages,thefeatureswecanmeasuremaynotbethemostimportantones.Therealsohavebeensomeobjectionstothesemethodsbasedon
various notions about howpeople think and process information,andwhether thesemethods trulycapture that.Aswewilldiscuss,thesecavilsarelargelybesidethepoint.
Andfinally,thetheoreticalmodelsTheseobviouslyareideasabouthowpeoplethink,feelandbehave– and often came into existence without any firm empiricalevidence. Still, these inform a great deal of what marketers andevenmarketingscience typesdo, so it is important toknowaboutthem.
OnewayofcomparingthesemethodsWecanarrangethesemethodscomparativelyinanumberofways.Figure 1.1 shows one of these, based on how much effort ofdifferenttypeseachrequires.Thetwoaxesrepresent:
howmuchisrequiredinplanningtointeractwithconsumerstogettheneededinformation;

howmuchanalyticalcomplexitycouldbeinvolved.
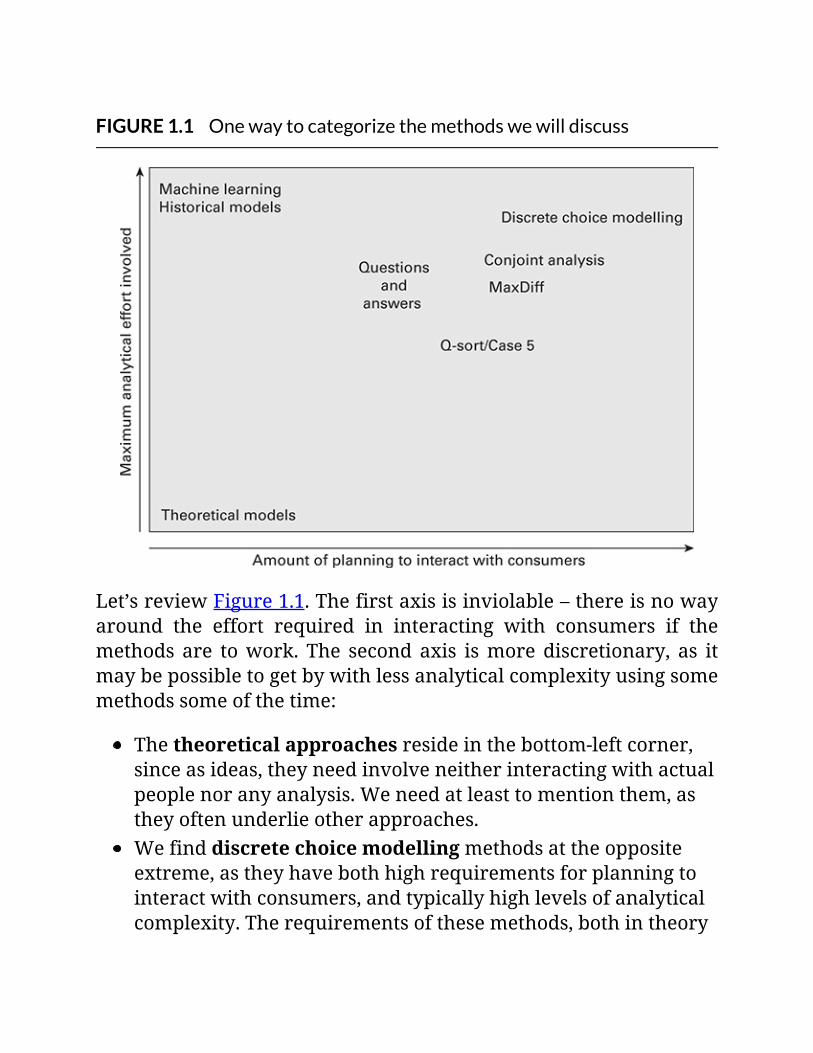
FIGURE1.1Onewaytocategorizethemethodswewilldiscuss
Let’sreviewFigure1.1.Thefirstaxisisinviolable–thereisnowayaround the effort required in interacting with consumers if themethods are towork. The second axis ismore discretionary, as itmaybepossibletogetbywithlessanalyticalcomplexityusingsomemethodssomeofthetime:
Thetheoreticalapproachesresideinthebottom-leftcorner,sinceasideas,theyneedinvolveneitherinteractingwithactualpeoplenoranyanalysis.Weneedatleasttomentionthem,astheyoftenunderlieotherapproaches.Wefinddiscretechoicemodellingmethodsattheoppositeextreme,astheyhavebothhighrequirementsforplanningtointeractwithconsumers,andtypicallyhighlevelsofanalyticalcomplexity.Therequirementsofthesemethods,bothintheory
andexecution,canseemdaunting.Wehopetoclearupthedifficultieshere.Approachesbasedonhistoricalortransactiondatatypicallyinvolvegreatanalyticalcomplexitybutlittleornointeractionwithconsumers.Thesemethodsrelyondatathathasbeenstoredbyanorganization,oftenoverlaidwithotherinformationgatheredfromvarioussecondarysources.IntheUnitedStates,vastamountsofdatacanbeappendedtonearlyanyperson,someofitattheindividuallevel,somehousehold,andsomeattheblockorneighbourhoodlevel.The amount of data that has been ferreted out about nearlyeveryoneisstaggering–oneservice,forinstance,offerstogetaname,address,age,ethnicityandgenderfromasimplee-mailaddress–andforover90percentofUShouseholds.Then,oncethe address is in hand, other services can provide literallyhundredsofitems.As follows, privacy concerns have been most strongly voicedabout data mining investigations. After all, much of thisinformation was gleaned without the person’s knowledge ofconsent. This also is far more information than most peoplerealizeanyorganizationcouldhaveaboutthem.Questionsandanswersprecededthemoreanalyticallydrivenapproaches–andinsomeformprobablygoallthewaybackinhumanhistory.Theirpre-techrootsremainhighlyvisibleinmanyplaces.Youmayencounterrudimentaryorevennoanalysisinreportsaboutquestionsandanswers.Simplecountingisastapleonthenightlynews,whereforinstanceyoucanhearsolemnannouncementstotheeffectthat,‘14percentlessBritsaredrinkingteathisyearthansixyearsago.’Thisshouldleadtotheinevitablequestion‘Sowhat?’–aswehaveafactoiddisconnectedfromanyideathatitiscausativeofanythingelse.Nonetheless, scaledmeasures, selections of appropriate itemsand rankings allmight lead to sophisticatedmodels that help
guidedecisionsandactions–ifsetupandanalysedreasonablywell.Wewill showyouhow this canwork later in this book.Even verbatim comments collected in interviews can showconsiderable predictive power. This is discussed in anothervolume(PracticalTextAnalytics).
SenseandsensibilitywithpredictionsFirst, it isworthrestatingthatwedonotpredict–popularasthisword may be – we more accurately forecast. The methods wediscuss have greater and lesser degrees of accuracy in makingforecasts. With each, endless possibilities exist to make seriousmistakes. Experience with these methods in the marketplace canhelpus toovercomemanyof these.Sadly, theseareoften learnedbyactuallymakingthemistakes.Forecastsarenotprojectionstothemarketplace.Thisisacritical
difference.Infact,goingfromaforecasttoaprojectionoftenprovesto be far more difficult than imagined, and so becomes a veryhumblingexperience.
SomeofthedifficultiesinprojectionsSuppose you generate a model based on your customers’transactionsthatsaysthatyouwillattaina15percentlikelihoodofthembuyingyour fineproduct ifyourunacoupon.Thisdoesnotmean that15percentof themarketplacewillbuy it,or thatyoursales will go up by 15 per cent – or in fact that 15 per cent ofcustomerswillfinallymakethepurchase.Your customers cannot make up the entire market, and
determining what percentage of the marketplace your customersmake up can be terrifically difficult. You must answer thesequestions,justtogetstarted:
Whatpercentageofthetotalmarketplacedoyourcustomers

represent?Whatpercentageofyourcustomersareactuallyawareofyourfineproduct?Ofthosewhoareaware,whatpercentageunderstandwhatitactuallyisanddoes?Howwellistheproductdistributed?Whatpercentageofyourcustomerscanactuallyfindyourproduct?Ifyouareontheweb,canpeoplefindyourproductandsucceedinbuyingit?Canyourproductionkeepupwithnewdemand?Ifyouareonawebsite,canitkeepupwithtraffic?Andhowmanynon-customersaregoingtojoininandpurchasewhateveryouhavetooffer?
Finally,togettofiguresforthetotalmarketplace,youhavetoknowitstruesize.Thismayseemobviousbutcanprovehighlydifficult.Withanyconceivableproductorservice,thisisnotjustacountofthe general population. You need to start with peoplewhomightpossibly have a use for your product (even if a faint possibility).This will be more than your customer base. And while you mayhave a count of your customers, this also could be less accuratethan you imagine. Unfortunately, it is a rare organization of anytypethathasanexactcustomerlist.

Acautionarytaleaboutcustomerlists
Alargebanksetupamassivecomputerizeddatabasetokeeptrackofitscommercialcustomers.Becausetheyhadmanythousandsofcustomersandprospects,andwereconstantlyupdatingthisinformation,theyhadalargecomputerandalargestaffbusilyatwork.Thiswasanumberofyearsago,sothecomputersystemwasstillahulkingandintimidatingpresenceononefloorofthebank.Theirsalespeople(whotheycalledaccountexecutives)weresupposedtosupply
informationontheircustomerstothestaff.Thatis,theyweresupposedtohandoversheetswithcustomernames,locationsandfacts.Intime,thebankdecidedtodoasurveytestinginterestinanewproductforcommercial
customers.Itseemedentirelylogicaltousethiscustomerdatabaseasonesourceofcompaniestocontact.Othercontactswouldcomefromoutsidelistsofcompaniesinthearea.Muchtoeveryone’sconsternation,thesurveyfoundthat60percentofthecustomer
namescontactedwerenotgood–thatis,theyhadnoworkingrelationshipwiththebank,orwereoutofbusinessentirely.Some25percentofthenameslistedascontactsactuallyweredead.Thesefactsupseteveryoneinvolved,andparticularlythepersonheadingthecomputerdatabaseoperation.Howcouldsuchathinghappen?Twofactorscontributedstrongly:
Theinputgivenbythesalespeoplewassimplyenteredintothedatabaseandnotcompletelyverified.Thetaskofjustkeepingupwithwhatthesalespeopleprovidedalreadytookeightstaff.Thebankbaulkedattheprospectofaddingyetmorestafftovalidatemorethanthecompany’snameandlocationbeingcorrect.Noonefromthebankcalledupthepurportedcontactjusttocheckonwhateverwasentered.
Thesalespeoplehadastrongmotivationnottoenterallthenamesoftheirbestclients,andtomakeupanyquotasforcallsthattheymissedwithspuriousinformation.Iftheykeptsomenamestothemselves,andthetimecameforthemtogoandworkelsewhere,theycouldtakeabaseofvaluablecustomers.Bankruleswouldpreventthemfromtakingactivecustomersknowntothebank.However,ifthesecustomers’namesnevermadeitintothecentraldatabase,thenthesalespeoplecoulddoastheypleased.Andinmanycases,thatispreciselywhattheydid.
Thereareseveralimportantlessonsinthisstory.Theoneweneedtotakeawayhereisthatcustomerdatabasesoftenarenotasgoodaswewouldlike.Theytypicallydonotfailinasspectacularawayasthis,buttheirlackofreliabilitycanbequitesurprising.Customersurveysbasedonthesedatabasesfrequentlyturnupraftsofincorrectnames,addresses,companyaffiliationsandpostalorZIPcodes.Anerrorinanyoneofthese,ofcourse,couldmakethelistinguseless.
Difficultiesinprojectingfromsurveys
Survey-basedforecastsencounteralltheproblemsofstartingfrominaccuratedatabases,andaddmore.Weencountertheproblemofwhether the sample used had usable names but names that stillmisrepresented the entire population sought. We also run intoproblemswhen studyparticipants are screened (allowed into thesurveyornot)basedonmanycriteria.Projectingafterstudyparticipantshavegonethroughthistypeof
screening is one bane of all survey-based research. We do thisscreening because we at least want to find people with somepossible use for or interest in the product in question. But then,once, we have them, just how many people do they actuallyrepresent? Even if we apply the best survey-related method forforecasting,discretechoicemodelling,wecanrunintosignificantproblemsmakingmarketplaceprojections.Surveysalsomayhaveproblemswithnot findingenoughof the
right people, with people who do not answer thoughtfully, withsurvey participants not following directions, with people typinganswerssuchas‘asdhfakjdhgajghad’whenaskedfortheiropinions,and so on. These may happen even with surveys that are puttogetherwell.
Case:problemsprojectingduetooverlyspecificscreening
Amajorsoftwaremakerwantedtotestresponsestovariousconfigurationsofitsnewproduct,anddosoconsideringvariouslikelycompetitiveresponses.Todeterminethelikelyoutcomes,theycorrectlychosediscretechoicemodelling,whichhasanoutstandingtrackrecordforaddressingthistypeofproblem.However(andagainstallobjectionsofthoseworkingwiththem),theydecidedthattheir
samplehadtoconsistofsoftwareengineerswithmorethanacertainamountofexperience,whohadatleastfivecomputersrunningtheiroperatingsystem,atleasttwocomputersrunninganotheroperatingsystem,andatleastoneonabackbenchsomewhererunningyetanotheroperatingsystem.Theysetsomanyconditionsthattherewasnowaytoestimatehowlargethispopulation
mightbeinthemarketplace.Nosourcesexistedwheresomeonecouldlookupthesizeofthistightlydefinedgroup.Astheyaddedeachconditionforincludingapersoninthesurvey,errorsintheirestimateswerecompounded–andprojectionsbecamelessaccurate.Theyalsohadnowayofknowinghowthebroaderpopulation–peoplenotexactlylikethosetheysurveyed–mightact.Sincetheirproductwasoverwhelminglyprevalent,itwassafetoassumethatpeopleoutsidethesmallcohorttheyinterviewedwerelikelytobuythisnewproductaswell.Intheend,theoutcomewasamixtureofsuccessandfailure.Theymanagedtoconfigurea
productthatsoldterrificallywell,sincethediscretechoicemodelwaswellexecutedanddidindeedshowthemahighlydesirablecombinationoffeaturesandpricing.However,theygrosslyunderestimateddemand,byafactorofaboutthree.Theycouldnotkeepproductionupwithsales,resultinginproductdelays,angrycustomers,mockeryinthepress,andordercancellations.
Unfortunately, far too many surveys end up not asking the rightquestions or not analysing data correctly to get useful answers.Overall,itisnotaseasytoputtogetherasurveyprovidingtherightinformation as it may seem. As a result of many subpar efforts,researchingeneralhassufferedablackeye,ormaybetwo.
ModelsoftenaimjusttoincreaselikelihoodsofbehaviourInmanycases, thesemethodsdonot forecast asmuchas suggestways to increase the odds of something happening. An estimatelike this could come from looking at similaritieswith peoplewhohave already bought, or could be an estimate of odds of buying
basedonagroup’sotherpurchasingbehaviour.Increasing your chances of getting a desired result, or reducing
your chances of failure, are of course highly worthwhileendeavours. However, if the output shows increased odds ofsuccess,youhaveneither forecastnorprojection.Youmayhaveausefulguidepost,butnoreal ideaofhowmuchbetteryouwilldoonceyoureachyourdestination.
ForecastsarenecessarilyshorttermNo matter what the forecast, it becomes invalid with sufficientchangeinthemarketplace.Anunexpectednewproductorserviceentering themarketcandisrupteverything.Whensomethingnewshakes up the market, methods based on stored data, such ascustomertransactions,canfailentirely.Oneoftheexperimentalmethods,discretechoicemodelling,can
address the likely effects of new products or services, evendisruptive ones, entering the market. One example involves anestablishedcancerdrug thatwas facing twonewentrants,bothofwhichwerefarmoreeffective.Forecastsforwhatmighthappentothis drug as it faced this major change were borne out in themarketplace.Infact,whenusingthismethod, it isalwaysbesttotestpossible
competitive actions in response to changes in your product orservice.Thismaybethepointatwhichthemarketingteamtellsyouthat you are giving them a headache. However, even afterdeveloping severe sorenessaround the temples fromall thathardthinking, anticipating what competitors might do poses quite achallenge.Also, any forecasts you havemade likelywill become invalid if
your organization runs into problems with communications,distribution or production. Similarly, even the best forecasts canbecome worthless quickly if something unexpected happens thatcausesproblemsinpublicperceptionsofyourproductorservice.
Wherewewillnotbegoing
Toomanymethods!We will explain how a number of advanced methods work inpracticeandshowtheirapplicationswithactualmarketplacedata(which does have to be disguised, though). However, we have anoverabundance ofmethods that could be discussed. For instance,the freeanalyticalprogramWeka listsover100methods,manyofthemusingadvancedmachinelearning–andmorethanafewwithnames likely to be highly unfamiliar, such as J48, LibSVM,HyperPipes, CLOPE, Tertius, etc. Anyhow, we might possibly notmentiononeofyourfavourites.
Notsubstantiated=nothereAplethoraofunsubstantiatedmethodsandsystemsnowsurroundus.Any timeon thewebwill turnup largenumbers.Wewill notreview anymethod supported just by a vendor’s website, even ifthatvendorhasputplentyoftheirownpapersthere.Everythingwediscuss will be backed by both a strong track record in practicalapplicationsand strong theoretical foundations,meaningmethodsthat have passed academic scrutiny in peer-reviewed papers, andmore than just one of those. Either one alone – either anecdotesbased on practical experience or publication in a journal – is notsufficient.Proprietarysystems thatare largely ‘blackbox’alsoareoffourmenu,asfascinatingassomeofthesemayseem.
NorecommendationsforspecificsoftwareorsolutionsManyfinesoftwarepackageshavebeendeveloped,somanythatishas become impossible to review and test them all. Statisticalanalysis software almost invariably is complex, and even therelatively easiest requires some learning and adaptation by the
user. The larger statistical packages, such as SPSS, SAS, Stat,Statistica, Systat and NCSS all make some implicit assumptionsaboutusersknowingwhattheyaredoing,moreorless–andwhythey are doing it. The more complex analyses often involveprograms that can be quite abstruse and require considerablelearning.Allthismeansthatifyouhaveafavouritesoftwareapplication,it
may not appear here. And while we discuss specific softwareprograms, this shouldnotbe takenas giving recommendationsorendorsements.Anyprogramthatappearsheresimplyissomethingthattheauthorhasusedandfindsuseful.Thisdoesnotmeanthatwhateveryouseeistheonlywayorthebestwaytogetananalysisdone. These are just products that haveworkedwell, have strongacademiccredentialsandseemhighlyreliable.Prices range from astronomical (often called enterprise class
software) to completely free. Free does not mean puny. No-costoptionsincludetheredoubtableRandtheamazingWeka.TheprogramRactuallyisavastcollectionofproblem-solvingand
statisticalroutinesthatyoudownloadtoyourcomputerfromonlinerepositories. That is, if you get and start R, you can then load adizzyingassortmentofanalyticalchoices.Thisprogramismadebyandlargelyforacademics.Itrunsbased
oncomputersyntax,meaninginstructionsthatyouwrite,andit iswhollyunforgivingaboutmistakes.Initsmostusualincarnations,itposesfiendishdifficultiesformostusers.Weka comes with four different interfaces, three of them
involvinggraphicaluserinterfaces (GUIs)–thesystemofmenusandvisualdisplayswefindinmanyfamiliarprograms.Itincludesmanyroutinesthatfallundertheheadingofmachinelearning.Itsstylefavoursvisualizingdatawheneverpossible.Andithasquirksof its own – for example, a colleague who is a former rocketscientistfindsitpuzzling,butothershavetakentoitrightaway.We will be talking more about software throughout this book.
Whilewedonot spell out thedetails ofwriting specific syntaxortake you step-by-step through routines,wewill keep you filled inaboutwhich applications seem particularlywell-suited to a giventask.
SummaryofkeypointsThis is a book for practitionerswho need to dealwith predictingconsumerchoices,andforstudentswhowanttounderstandwhatisinvolved.Onekeygoalistowinnowthroughthemanyapproachesto predicting these choices, giving you the best ones to apply indifferentsituations–andtellingyouwhichonestoavoid.Wewilltalkaboutthehumansideofpredictiveanalytics,thepart
thataimstoforecastwhatpeoplewillchoose–andinsomecases,whytheymakethosedecisions. It isnotaboutpredictiveanalyticsasawhole.Forinstance,wecouldotherwisetrytopredictwhenapipewill burst,whereadiseasewill progress, orwhich teamwillwin at a sporting event – attempts to model such processes oroutcomesfalloutsideourscope.Thetermconsumerscanmeanpeopledealingwiththeconfusing
arrayofeverydayproductsandservicesthatwefindallaroundus,includingsmallandlargepurchases, financialservices, technologyand telecommunications. But we also take consumers to meandoctorsmakingdecisionsaboutwhichfinepharmaceutical tobuy,purchasingagentslookingatthewidearrayofindustrialbushingstofilltheirwarehouses,andsoon.This book takes the approach that we can discuss concepts,
methodsandresults inplainEnglish.Whilewewillbegoingoversome advanced topics, and talking about howmethods work, wewill be avoiding subscripted notation, matrix algebra, statisticalproofs and Greek letters. Therewill be nomulti-tiered equations.Anyone expecting any of those will be sorely disappointed. Ourfocusisonunderstanding,planning,executionandapplication.
We explain awide array ofmethods that rarely get consideredtogether, compare their applications and put them into context.Each approach has its best uses and limitations, and we beganconsideringthoseinthischapter.Somekeydefinitionsgetcoveredbeforewegettothemethods,as
these are important for later discussions. First, and perhapsmostimportant, is theunderstanding thatdata is (are)not information.Data rather means anything that can be measured in any way,whetherornotithasanymeaningoruse.Informationisdatathathasbeenprocessedandanalysedsothatitcanbeusedtodealwithasituation,particularlyanovelorunexpectedone.Datadoesnotdoanythingby itself.As several authoritieshavepointedout, data isnot information, and information is not knowledge. Some take itfurther and remindus that knowledge in turn is notwisdom.Wewillshowyouhowtogettoinformation,buttherestwillbeuptoyou.There are some prevalent fallacies about data that we hope to
dispel.Foremostamongtheseisthemistakenbeliefthatmoredatais always better. There is a strong undercurrent in the literatureandonthewebsayingthatifyouhaveenoughdata,perhapsatthemagicalpointwhereitturnsbig,thenyouwillsolveyourproblems.Moreof thewrongkindsofdataactuallycausesproblems.Youdonotfindaneedlemoreeasilybyhavingabiggerhaystack.Data quality, and knowing what your data can be used to do,
remainparamount.Anyonesayingotherwise isprobably trying tosellyousomething–andyoudonotwantit.If we could count everything that people chose, anything that
caused a change in our count would be important. However,counting definitely is not predictive, as it of course only happensafter you have done something – and even then the act ofmeasuring can prove surprisingly difficult. Therefore, variousprecursorstobehaviourhavebeenproposed,withthetheorybeingthat seeing changes in these can be predictive of changes inbehaviour. Some of these include measuring awareness of a
product or service, ratings, associations, buying intentions andpreferences. Sometimes, these are treated as outcomes inthemselves,asinwhenmeasurementsofcustomersatisfactionaretieddirectlytocompensation.
ClassifyingthemethodsThemethodswewill be discussing fall into four broad classes: 1)experimental or trade-off methods; 2) questions and answers; 3)modelsbasedonstoredorhistoricdata,machinelearning,artificialintelligence;and4)varioustheoreticalmodels:
Experimentalortrade-offmethodsweredesignedtodevelopnewproducts,serviceofferingsorcommunications.Theyinvolveinterviewingpeople.Theseincludeextremelypowerfulapproachesinthattheycanestimateresponsestomanythousandsofproduct/serviceconfigurationsormessagesinmarketsimulations–includingthemarketsimulatorprograms.Machinelearningmethodshaveexpandedthecapabilitiesofthesemethods–aswewillshow.Questionsandanswers,asthenameimplies,involvepeoplegettinginterviewedandaskedavarietyofquestions.Methodsavailableforanalysingtheseanswershaveadvancedconsiderably.Infact,herewewillencounterartificialintelligence,inatleastoneunexpectedplace.Modelsbasedonstoredorhistoricdatacangodeeplyintomachinelearningandearlyusesofartificialintelligence,andappeartomakeupmuchofmarketingscience.Manytimes,datathathasbeencollectedforpurposesotherthanaspecificanalysisgetsassembled,probedandexamined.Outputsincludemodelsforscoringcustomersandprospects,andevenalgorithmsforquickdecisionssuchaswhethertoshowaparticularpersonanadvertisementonagivenwebpage.Theoreticalmodelsareimportantbecausetheyinfluenceso
muchoftheworkthatgetsdoneininvestigatingdata.Thesemodelsattempttoexplainwhichfactorsleadtobehaviourandwhichoftenunseenunderlyingcausescanchangewhatapersonchooses.
Eachofthesemethodshasitsownimplicitviewsofpeople.Modelsbasedonstoredorhistoricdatahaveatleasttwoimplicitviewsofpeople.Firstisthelogical-seemingideathatwecanforecastwhataperson is likely todobyobservingwhat theyhavedone.Anotherimplicit view is that you as a consumer are likely to buy whatpeople somehow similar to you have bought. These assumptionscanworkeffectively,butalsocanleadtoproblems–inparticular,thesecond,ifapersongetsassignedtothewronggroup.Andthesemethodsgenerallydonotprovideusefulguidancewhensituationschangeorwhenyouwanttodevelopnewproductsorservices.Analysis of questions and answers rests on the obvious but
criticalassumptionthatifyouaskfairlydirectquestions,whateverpeopletellyouwillprovidevaluableinformation.Thiscanworkifthe questions are asked in the rightway.However, asking peopledirectly about what they think is important has been shown toprovidemisleadinganswers.Theexperimentalmethods in fact arose due to the realization
thatpeoplecannotorwillnottellyoudirectlybyratingswhattheymost value in a product or service. Thesemethods ask people tomakechoicesinvariouswaysandsorevealthetruehierarchiesinwhattheyvalue.Powerfulas theseexperimentalmethodscanbe, theyhavetheir
own implicit assumptions. They are based on the belief that aproduct, service or message can be broken down into discretefeatures that can be tested and compared. It is true that nearlyeverythingweencounterhasatleastonemeasurablefeature.Andfinally,thetheoreticalmodelsaresimplyideasabouthow
people think, feel and behave – and often came into existencewithoutanyfirmempiricalevidence.Still,theseinformagreatdeal
of what marketers and even marketing science types do, so it isimportanttoknowaboutthem.
Onepossiblearrangement
Wecanarrangethesemethodscomparativelyinanumberofways.One useful way to do this is based on howmuch effort of twodifferent types each requires. These are: 1) how much work isrequiredinplanningto interactwithconsumerstoget theneededinformation; and 2) how much analytical complexity could beinvolved.Notallusefulanalysesneedreachtheirmaximumlevelofanalyticalcomplexity,buttheamountofeffortinvolvedinplanningtointeractisinviolable.Theexperimentalmethods require themosteffort inplanning
to interact with consumers, and among these discrete choicemodellingrequiresthemostanalyticaleffort.Questions and answers preceded themore analytically driven
approaches – and in some form probably go all the way back inhumanhistory.Theirpre-techrootsremainhighlyvisibleinmanyplaces. You may encounter rudimentary or even no analysis inreports about questions and answers. However, they can be usedwithmorerigorousandinvolvedanalytics,aswewillshow.Approaches based on historical or transaction data typically
involvegreatanalyticalcomplexitybutlittleornointeractionwithconsumers.Thesemethodsrelyondatathathasbeenstoredbyanorganization,oftenoverlaidwithother informationgatheredfromvarioussecondarysources.The theoretical approaches, as ideas, need involve neither
interactingwithactualpeoplenoranyanalysis.Weneedtoreviewthem,astheyoftenunderlieotherapproaches.
KeepingsensiblewithpredictionsWe rounded out what we will cover by discussing sensible

approachestoprediction,startingwiththereminderthatwedonotactually predict anything. We make forecasts, like weatherforecasts, rather than consulting our crystal ball and coming upwiththewinningnumber.Forecasts are not projections, and in fact any projections are
fraught with difficulties as we try to estimate how the data (orinformation) we have at hand relates to the entire marketplace.Eventhebestdatagatheringcanleaveusuncertainabouthowwellwehave captured everything in the outsideworld.And too often,datathatwehaveonhandturnsouttobelowerinqualitythanwehadsuspected.Finally,eventhebestofforecastsshouldnotbeexpectedtohold
up indefinitely. Changes in the marketplace or the externalenvironment will lead to a need for new analyses and newestimates.

02Gettingtheprojectgoing
Herewediscussthekeyfirststepsinplanningforaprojectthatyouwant toconcludewithapredictionofwhatpeoplewill choose.Aswithanyin-depthanalysis,youneedbothtoplancarefullyandgettherightdata.Herearesomeofthestepsthatneedtobetaken.Thischapteralsointroducessomeofthekeyconceptsandlanguagethatwemust learn (alas) to plan the analysis and understandwhat ishappeninginit.
AtthebeginningYoucanfindagreatmanyarticlesandbooksthatadviseyouaboutwhat todowhen starting aproject.Whilewehesitate topile intothisparticularfray,therearejustafewkeyissuesthatcouldstandareview,andafewquestionstoconsider.Theseareseveralquestionstokeepinmindbeforeanyproject:
Whatcanchange,basedondoingthisanalysis?WhatdoIreallyneedtoknowtohelpthatchangehappen?WhatdatadoIneedtoanalyseand/orwhichpeopledoIneedtointerviewsoIgettheanswer?WhatisthemostIcanexpecttogetbasedondoingthis?HowwillIknowifIreachedagoodanswer?Anddothepeoplewhoneedtousethisunderstandwhattheywillgetfromthis?
KnowwhoyouaretalkingaboutortalkingtoLet’s give everyone the benefit of the doubt and assume that thefirst key first question has been answered. All work should startwith some understanding ofwhat can change as a result. Still, inplanning for some kinds of analyses, deciding what you want toknow can take up as much time as everything else you do. Forinstance,ifyouwanttooptimizeanewproductorservicewithoneof the experimental methods (conjoint or discrete choice, inparticular),gettingtothefinallistoffeaturestovaryandmeasuretypicallytakesconsiderablethoughtandeffort.Youalsomustfigureoutwhereyouwillgetyourbasicdataand
what limitations you have in your sources. In Chapter 1, wedescribedafewpossiblepitfallsindealingwithinternaldata.Whatabout data that you gather from the web or from interviews? Ineither realm, it is remarkablyeasy togatherdata from thewrongplacesoraboutthewrongpeople–andsodatathatwillnotprovidereliableguidance.
Unfortunately,errorspersistSometimesitcanbequitetemptingtotakeashortcutandrunwithdatathatdoesnotquitematchthequestionathand.And,ofcourse,this almost inevitably will sabotage your results no matter howmuchof the incorrect data youhave. Thanks to theweb,wenowhaveaccess tomoreof thewrongdata thanwaseverpossible. Sothiscautionhasbecomecritical.Sadly, when you get the basic data incorrect, your conclusions
might benearly right,more or less right, or terriblywrong – andyou will have no way of knowing unless you can check withanothersource.Inmanycases,thereisnoothersource.
Poorresultsfromoverconfidenceindata
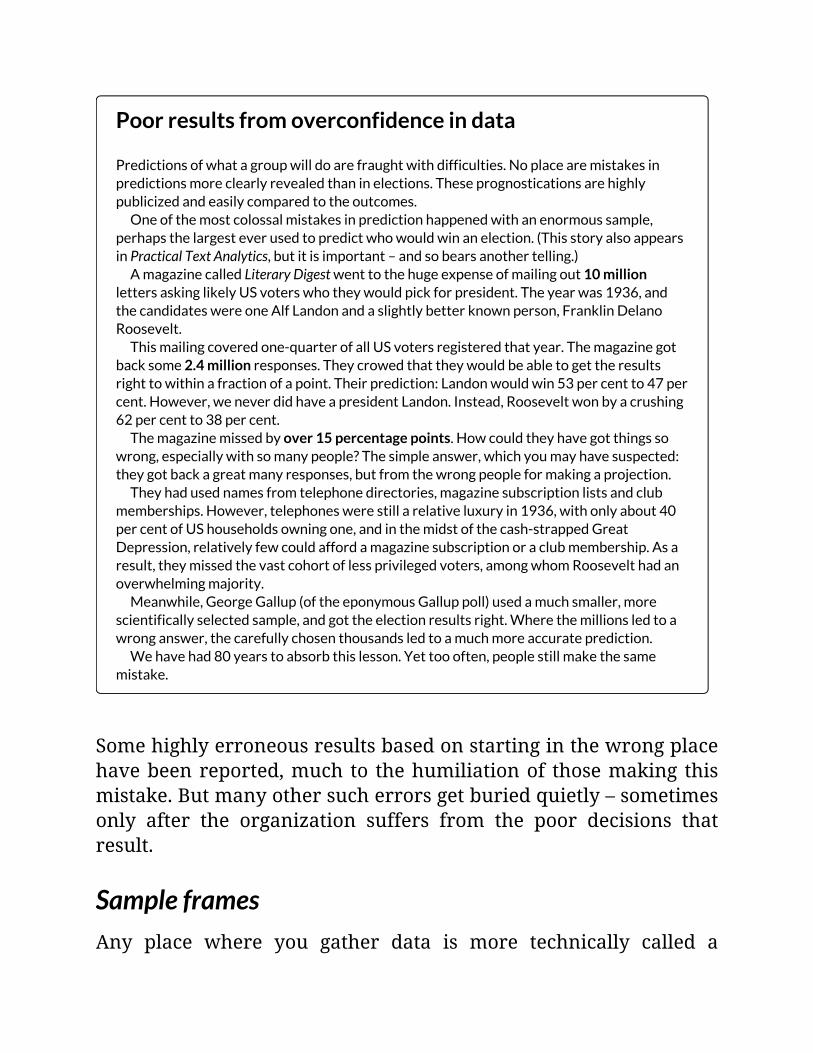
Predictionsofwhatagroupwilldoarefraughtwithdifficulties.Noplacearemistakesinpredictionsmoreclearlyrevealedthaninelections.Theseprognosticationsarehighlypublicizedandeasilycomparedtotheoutcomes.Oneofthemostcolossalmistakesinpredictionhappenedwithanenormoussample,
perhapsthelargesteverusedtopredictwhowouldwinanelection.(ThisstoryalsoappearsinPracticalTextAnalytics,butitisimportant–andsobearsanothertelling.)AmagazinecalledLiteraryDigestwenttothehugeexpenseofmailingout10million
lettersaskinglikelyUSvoterswhotheywouldpickforpresident.Theyearwas1936,andthecandidateswereoneAlfLandonandaslightlybetterknownperson,FranklinDelanoRoosevelt.Thismailingcoveredone-quarterofallUSvotersregisteredthatyear.Themagazinegot
backsome2.4millionresponses.Theycrowedthattheywouldbeabletogettheresultsrighttowithinafractionofapoint.Theirprediction:Landonwouldwin53percentto47percent.However,weneverdidhaveapresidentLandon.Instead,Rooseveltwonbyacrushing62percentto38percent.Themagazinemissedbyover15percentagepoints.Howcouldtheyhavegotthingsso
wrong,especiallywithsomanypeople?Thesimpleanswer,whichyoumayhavesuspected:theygotbackagreatmanyresponses,butfromthewrongpeopleformakingaprojection.Theyhadusednamesfromtelephonedirectories,magazinesubscriptionlistsandclub
memberships.However,telephoneswerestillarelativeluxuryin1936,withonlyabout40percentofUShouseholdsowningone,andinthemidstofthecash-strappedGreatDepression,relativelyfewcouldaffordamagazinesubscriptionoraclubmembership.Asaresult,theymissedthevastcohortoflessprivilegedvoters,amongwhomRoosevelthadanoverwhelmingmajority.Meanwhile,GeorgeGallup(oftheeponymousGalluppoll)usedamuchsmaller,more
scientificallyselectedsample,andgottheelectionresultsright.Wherethemillionsledtoawronganswer,thecarefullychosenthousandsledtoamuchmoreaccurateprediction.Wehavehad80yearstoabsorbthislesson.Yettoooften,peoplestillmakethesame
mistake.
Somehighlyerroneousresultsbasedonstartinginthewrongplacehavebeenreported,much to thehumiliationof thosemaking thismistake.Butmanyothersucherrorsgetburiedquietly–sometimesonly after the organization suffers from the poor decisions thatresult.
SampleframesAny place where you gather data is more technically called a

sample frame. Whether you gather data by interviewing, bycollectingdataonlineorfromdatawarehouses(orlakes)thatyourorganizationmaintains,you likelywillbedealingwithasamplingofallpossibledata.Ofcourse,doing interviews, theodds thatyouhaveasampleapproaches100percent.Liketheframeforapicture,ifthesampleframedoesnotfit,you
will not see the picture correctly. Figure 2.1 first shows the rightframe,andthenwhathappenswhenframesareoffintwodifferentways.
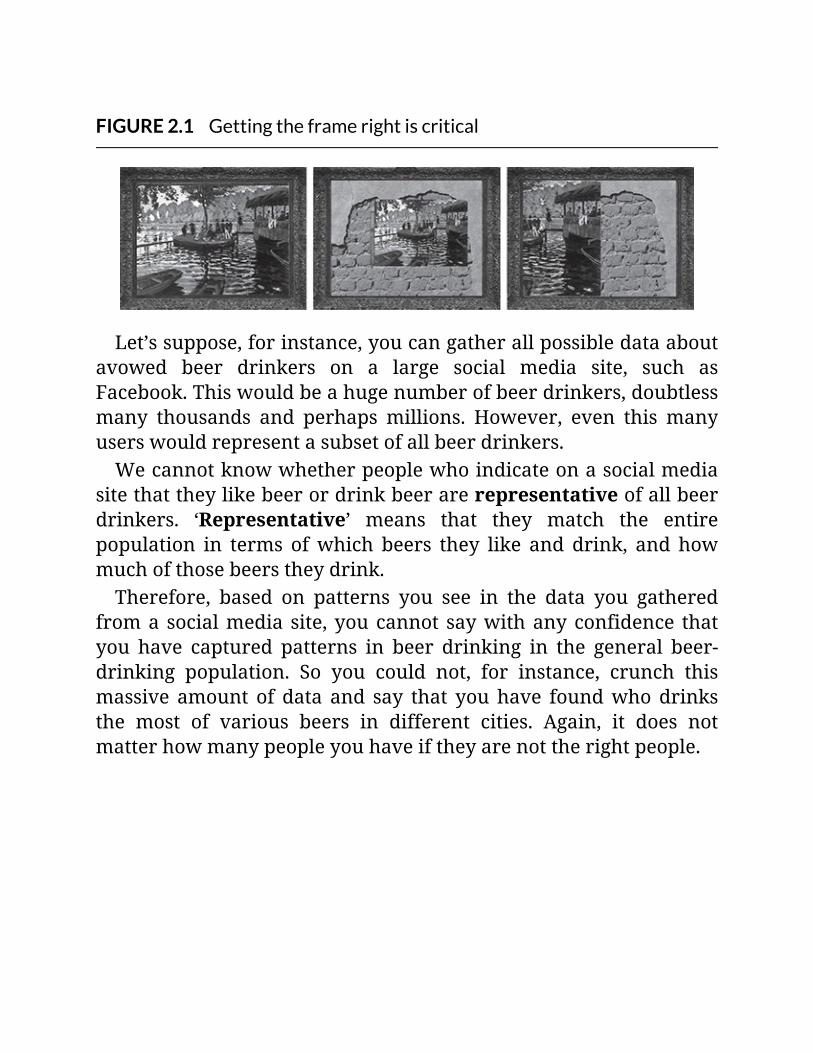
FIGURE2.1Gettingtheframerightiscritical
Let’ssuppose,forinstance,youcangatherallpossibledataaboutavowed beer drinkers on a large social media site, such asFacebook.Thiswouldbeahugenumberofbeerdrinkers,doubtlessmany thousands and perhapsmillions. However, even this manyuserswouldrepresentasubsetofallbeerdrinkers.Wecannotknowwhetherpeoplewhoindicateonasocialmedia
sitethattheylikebeerordrinkbeerarerepresentativeofallbeerdrinkers. ‘Representative’ means that they match the entirepopulation in terms ofwhich beers they like and drink, and howmuchofthosebeerstheydrink.Therefore, based on patterns you see in the data you gathered
froma socialmedia site, youcannot saywithanyconfidence thatyou have captured patterns in beer drinking in the general beer-drinking population. So you could not, for instance, crunch thismassive amount of data and say that youhave foundwhodrinksthe most of various beers in different cities. Again, it does notmatterhowmanypeopleyouhaveiftheyarenottherightpeople.
Careingettingdataandmorecareinprojections
Overall,weneedtobeverycarefulastowherewegetourdata.Andifwewanttomakeaprojectionfromourdatatothegeneralpopulation,wehavetobeevenmorecareful.Usingwhatyouhaveathandandtryingtoestimatewhatwillhappeninthemarketplaceisfraughtwithproblemsandpitfalls.
Whatisthemostyoucanexpectfromeachmethod?Weareoptimisticthatnooneouttherewillbemakingupthegoalsofaprojectastheygoalong.InChapter1,wetalkedbrieflyaboutthekeyoutputsyougetfromeachbroadclassofmethods.Wewillbe talking more about the specifics in each section. Let’s take aminutetotalkaboutthemostyoucanexpector,putanotherway,someofthelimitationsofeachtypeofmethod.
Themostfromhistoricalortransactiondata
Thesemethodsobviouslycangiveyouthebestpossiblefixonhowwell a given promotion ormarketing effort influenced short-termsales.Butwithoutaddedquestioning,thesemethodscannottellyouhoweffortsareinfluencingimpressions,perceptionsandreactionstoagivenbrand,serviceorinstitution.An example can be seen in what happens to a brand after
running a great many coupons and promotions. These can boostsales in the short term. But they can also position a brand veryfirmlyasnotbeingworthfullprice.Ignoringunderlyingperceptionsandassociationscanhavehighly
negative consequences. For instance, for many years thedepartment-store chain JCPenney engaged in an intricate schemeofheavydiscounting.Thenthemanagementdecidedto‘reposition’thestoreasanexclusivebrand,broughtinanexecutivefromApple
computers (presumably for his expertise with higher-priced,heavilybrandedmerchandise)andcutthediscounts.This effort failedmiserably. It did not accordwithwhat people
saw as Penney’s identity. The store even took to advertising anapology for turning its back on what it truly was. Many of thediscountsreturned.Thestoreclearlyhadatlastaskeditscustomerssomeoftherightquestions,buttoolate.Thedamagehaslingered.
Limitedabilitytoexperimentwithtransactionaldata
Thesemethodscannottellyouanythingaboutwhatelseyoumighthavetried.Abilitytoexperimentandtoanticipatenewturnsinthemarketplaceremainsextremelylimitednomatterhowpenetratingtheanalysis.Youcannotanswer‘whatif’questionswithtacticsyouhavenottried–asyoucanwiththeexperimentalmethods.
Donotexpecttheunexpected
Astreamofcommentaryrunningthroughthepopularpresskeepscirculatingthenotionthatinsightscanarrivealmostspontaneouslyfrom‘patterns’inthedata.Thistiesinwiththebeliefthatbecauseyouhaveagreatdealofsomething,youmustbeabletodoamazingthingswithit.Thisstorylineactuallystartedgainingcurrencyintheearly1990s,
whendatawarehousingandminingwereintheirformativestages.(Datawarehousingwastheprecursortobigdata,differinginthatittypicallyinvolvesdatathathasbeenorganizedaswellasstored.)
Beliefinthemysticpowerofdata
One widespread story supposedly supporting the near magicalpowers of data concerned a ‘major store’ that was said to havediscoveredyoucouldincreasebeersalesbypromotingthisproductalongwithdiapers,andpreferablyleadinguptotheweekend.Thesupposed logicwas thatyoung fatherswouldbedispatched to thestore to buydiapers for Saturday and Sunday, and of course, this
madethemthinkofbeer.Thiswas in fact anurban legendaboutdatamining. Its legend-
like statuswas underlined by theway that the name of the storechanged in different accounts, and by the way in which thepurported sales increases from this joint promotion increased bydifferingbutalwaysverypreciseamounts,suchas‘224percent’.Afteranumberofyears,thefellowwhomadeupthisstorycame
forward and confessed. He had done it, he said, to show howridiculousanecdotesabout findingserendipitous ‘patterns’ indatacouldbecome.By the time the truth emerged, this tall talehadbeen reprinted
innumerable times in support of themystical potential of data. Ithad even appeared in a textbook about data mining. Thisunderscorestheallureofgettingasolutioneasily,buttherereallyisnosubstitute foradvance thinkingabout theproblemyouneed tosolve.
ThemostfromquestionsandanswersWe can do much more with survey-based questions involvingscaled ratingsand selectionsof answers thanwaspossible evenafew years ago. For instance, thanks to newer andmore powerfulmethods of analysis, such as the Bayesian networks discussed inChapter7,wenowcansuccessfully linkquestions insurveyswithexternaldata,suchasmarketshareorshareofwallet.(Thiskindoflinkage was almost never possible with well-established methodsbasedonvariousformsofregression.)However, even with these powerful new methods, we rarely
arriveatdetailedprescriptionsforaction.Forinstance,ananalysisofasurveymaytellyouthatyoucouldgainupto10sharepointsfromdoingmoretotrainpeopleworkinginyourinboundcustomercall centre – but it likely will not tell you just what you need toimprove in that training.Therefore, you likelywill reachonly thefirst steps in understanding what needs to get more attention.
However,youcouldturntooneoftheexperimentalmethodsifyouneedmuchclearerdirection.WegiveanexampleoffindingspecificactionstoimprovecustomersatisfactioninChapter5.
ThemostfromtheexperimentalmethodsAmong these approaches, discrete choice and conjoint analysiscangiveyouveryprecisefixesonhowmuchagivenchangeinyourproduct or servicewill increaseshareofpreference. The correctterm is share of preference because you must add morecalculationstothebasicoutputtodeterminethetrueshareofsalesinthemarketplace.Two important factors are missing from share of preference:
how many are aware of the product or service and how welldistributed the product is. Everyone involved in an experimentalstudy becomes 100 per cent aware of all the choices they areevaluating – so responses can be overstated versus the actualmarketplace.And,asshouldbeapparent,theproductcannotsellifpeoplecannotfindit.Other factors that can cause share in themarketplace to differ
fromshareinasurveyarehoweffectivelymessagespromotingtheproductperform,andhowwelltheproductispresentedwhereitisavailable. Expect strong adverse effects on performance in themarketplace from either garbled messages, fostering the wrongassociationswith theproduct or itsusers, orpoorpresentation instores.
Anexampleofadjustingforawarenessanddistribution
Inastudyofpricingformen’scasualslacks,asponsoringcompanyinvested considerable time and effort in inviting hundreds ofpeople to survey locations where their brand and competitors’brandswere displayed and could be examined (but not tried on).These brands were shown at different prices, and then reshownwithpricesvariedaccordingtoanexperimentalmethod–andthis
wasrepeatedanumberof times.Peopleparticipating in thestudywereaskedwhichbrandtheywouldchoose,giventhatthebrandswereatthespecificpricesshown.(Wewilldiscussthedetailsofthismethod,discretechoicemodelling,inChapter4.)One brand that did not sell well in themarketplace performed
stronglyinthistest.Thisapparentlypuzzlingresultwasexplainedby the detailed figures the sponsoring company had about howaware shoppers were of the various brands and how extensivelyeach brand was distributed. The one brand that stronglyoverperformed in the test was neither well known nor widelyavailable.When the figures for awareness and distribution of this brand
were factored in along with its average in-market pricing, thestudy’s estimates of its share fell into linewith the best availablemarketplacesales figures.Currentconditionscouldbematched inthemarket simulation because, of the several alternative pricesthat were tested for each brand, one price was the marketplaceaverage.Thisgavestrongconfidence inprojectionsofwhatwouldhappenifpricesweretochange.Theseexpectedeffectswereshownby a special market simulator program created to run underMicrosoftExcel, allowingprices tobechangedandsaleseffects tobe seen in real time. (Thismay seemsomewhatabstractnow,butwill be shown in detailed examples in Chapters 4 and 5.) Thesponsoringcompanywasabletoembarkonanewpricingschemethathelpedincreasesalesandprofitability.
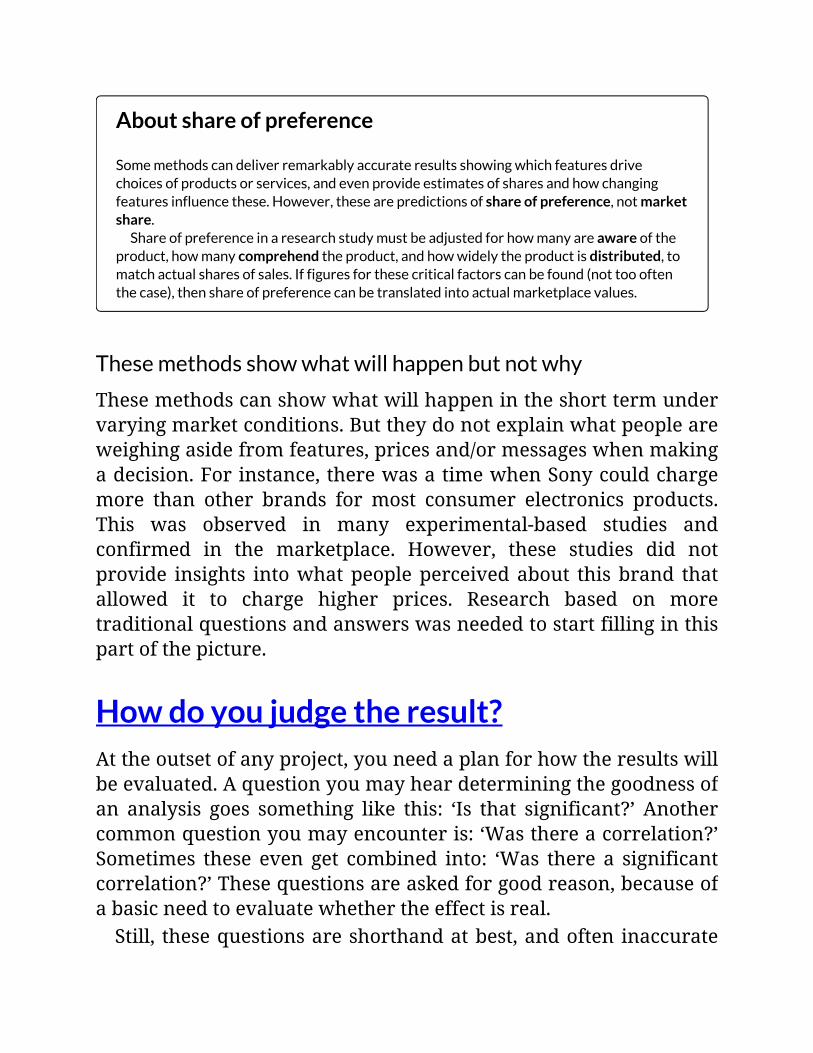
Aboutshareofpreference
Somemethodscandeliverremarkablyaccurateresultsshowingwhichfeaturesdrivechoicesofproductsorservices,andevenprovideestimatesofsharesandhowchangingfeaturesinfluencethese.However,thesearepredictionsofshareofpreference,notmarketshare.Shareofpreferenceinaresearchstudymustbeadjustedforhowmanyareawareofthe
product,howmanycomprehendtheproduct,andhowwidelytheproductisdistributed,tomatchactualsharesofsales.Iffiguresforthesecriticalfactorscanbefound(nottoooftenthecase),thenshareofpreferencecanbetranslatedintoactualmarketplacevalues.
Thesemethodsshowwhatwillhappenbutnotwhy
Thesemethodscanshowwhatwillhappenintheshorttermundervaryingmarketconditions.Buttheydonotexplainwhatpeopleareweighingasidefromfeatures,pricesand/ormessageswhenmakingadecision.Forinstance,therewasatimewhenSonycouldchargemore than other brands for most consumer electronics products.This was observed in many experimental-based studies andconfirmed in the marketplace. However, these studies did notprovide insights intowhatpeopleperceivedabout thisbrand thatallowed it to charge higher prices. Research based on moretraditionalquestionsandanswerswasneededtostartfillinginthispartofthepicture.
Howdoyoujudgetheresult?Attheoutsetofanyproject,youneedaplanforhowtheresultswillbeevaluated.Aquestionyoumayheardeterminingthegoodnessofan analysis goes something like this: ‘Is that significant?’ Anothercommonquestionyoumayencounteris:‘Wasthereacorrelation?’Sometimes these even get combined into: ‘Was there a significantcorrelation?’Thesequestionsareaskedforgoodreason,becauseofabasicneedtoevaluatewhethertheeffectisreal.Still, thesequestionsareshorthandatbest,andoften inaccurate
ormisleading.Let’sseeifsomeoftheissuessurroundingthesecanbeclarified.
Whatissignificant?Weneed to talkbrieflyaboutstatistical significance.Wait, comeback!Wepromisenottodrivearoundthisinendlesscircles.Thoseofuswithmoreacademic experiencehavehearda great
deal about this topic. This gets frequent use in reporting aboutresearch,ofthescientificandmarketvarieties.Yetthistermisnotwellunderstood.Solet’sgettotheessentials.
GettingpastsometerminologyPerhaps you recall the term null hypothesis, with more or lessdread. Less formally, this means the belief that nothing ishappening.Thatisall.Wego from there torejecting thenullhypothesis. Thismeans
youarenotsayingthatnothinghashappened.Thatconvoluted-seeming formulation is at the heart of significance testing.Statisticians want to be sure that they are not falsely claimingsomethingishappeningwhenitisnot.Making that kind of false claim is sometimes called a Type I
error.AsthenameTypeIimplies,statisticiansstartfromapositionofextremecaution.Thefirstruleisnotsayingsomethingmistaken.Aconventionhasarisenthataneffectissignificantonlyifweare
atleast95percentcertainwearenotmakingafalseclaim.(Thisisalso called 95 per cent confidence.)Why is the threshold 95 percent?Thebestanswerthatseemsavailableis: justbecause.Thisisjustaconvention,ifalongestablishedone.Based on the number of scientific papers that go through
incredible contortions to reach this 95 per cent level, you mightthinkthereissomemagicbehindit.Butthereisnot.
Powerversussignificance
PowerversussignificanceStatistical power tests whether you are really seeing somethinghappening.Weshouldseefrequentmentionsofthis,butthatisnothappening. The higher the level of statistical significance wedemand – say going from 90 per cent confident to 95 per centconfidentto99percentconfident–themorestatisticalpowergoesdown.Thatis,themorewewanttobecertainwearenotmakingafalse
claim,themorelikelywearetomisssomethingreal.Let’sillustratethis.Supposewearebirdwatchingandwecanseethebirdsfairlywell,butwearenot100percentcertainwhichbirdsweareseeing.For instance, ifwewantedto identifyaduckflyingoverhead,andweneededtobe95percentcertainthatarandombirdwesawwasaduck,someactualduckswouldflybyandwewouldnotbesureenough to call them correctly. If we needed to be 99 per centcertain, even more actual ducks would get by without usexclaiming,‘Duck!’Missingsomethingthatactuallyishappeningisthatothertypeoferrormentionedinstatisticsclass,TypeIIerror.

Statisticalsignificanceisoftenmentioned,butitsmeaningisnotwellunderstood.Whenaresultissignificant,itmeansyouarehighlyconfidentthatyouarenotmakingafalseclaim.Significancedoesnotmeasurehowlikelyyouaretobemissingsomethingreal,whichisdeterminedbythemuchlessusedstatisticalpower.
Traditionalsignificance testing alsobreaksdownwithvery largesamples. Ifyouhaveenoughdata,everydifferenceoreffectstartsseeming significant. This problem occurs well below today’sthresholdforbigdata.Forinstance,investigatingopinionsofabout12,000peoplewho answered theNORCGeneral Social Survey,wefound that people with the astrological sign Leo watchedsignificantlymore television than anyone else. However, don’t goandchideyourLeofriends.Thisissimplyanartefactoftestingforsignificance with a large sample – you can find random-seemingitemspassingthetest.
Significancetestingcanbreakdownwithhugesamplesorwithhundredsorthousandsorcomparisons.Alternativemethodsoftestingmodelsareusedbysomeprocedures.Theseothermethodsinvolvefindinghowwellthemodelworksonnewdata,orondataputtoonesidebeforethemodelhasbeenmade.Youneedtousethetestofwhatissensiblealongwithstatisticalsignificancetesting.
Traditionalsignificancetestingalsocanstretchpastitslimitswhiledoing dozens or hundreds of comparisons, trying to find whicheffects or values are larger. Somemethods, such as the BayesianNetworkswediscussinChapter7,mayuseavalueofinformationapproachratherthantraditionalstatisticaltestingtoovercomethisproblem. (We will get to this definition in Chapter 7.) Othermethods, such as the classification trees we discuss in Chapter 6,can deal with this issue by using highly sophisticated testing,advancedenoughtobecalledartificialintelligence.
Somesayforgetsignificancetestingentirely
A few authors have even advocated abandoning statisticalsignificance in favour of what they call searching for ‘repeatablepatterns’,whichboilsdowntoseeinghowwellthemodelholdsuponotherdata,orperhapssomepartofthedatathatyouhavesettoone side before youmade themodel. Testing on other data, evendatayouhaveputtoonesidebeforemakingthemodel,isasoundidea – but it also is worth keeping the extra guidance thatsignificance testingcangiveyouonwhatdefinitelyshouldnotgointoamodel.
SignificancetestingneedstomakesenseStatisticaltestsofanykindcannotdetermineifwhatyouseemtobeseeingmakessense.Forinstance,inChapter6,weusesignificancetestingbutdonotautomaticallyacceptalltheresultsthecomputeridentifiesaspassingthetest–becauseitdidnotmakesensetousethem. (This problem arose partly due to using a large sample.)
Especiallywithhugeswathsofdata,youwouldbemostprudenttouse statistical significance testing as suggesting a threshold belowwhich you do not want to go, rather than as forming the finaldecision.
MistakesonthesmallsideofsamplingOddly, in this timewhen ‘big’ data gets somuch attention,manydecisionsstillgetmadeusinglittleornodata.Whilethereisnowaytocounthowmany,oftenmajororganizationaldecisionsinvolvenomorethancheckingtherumblingsofagut.Youevencanfindentirebooks giving advice about decisionmaking that barelymake anymentionofhowtoanalyseandinterpretinformation.Numerous other decisions appear to rest on interviewing small
numbers of consumers. You will encounter this in two popularforms of research, focus groups and in-depth interviews. Thesemethods have good uses, but using either to make a finaldeterminationrarelyisoneofthem.
Allsampleshaveerror
All samples, that is using anything less than 100 per cent of allpossibledata,introducessomeerrorintoourmeasurement.Thatis,wecannotbecertainthatoursampleaccuratelyreflectstheentirepopulation. This uncertainty somewhat more formally is calledsamplingerror.Usingsmallgroupsofpeople(orsmallsamples)wetypicallyrun
intorealproblemsduetothistypeoferror.Thesmallerthesampleyou use, the less likely it is to match or represent the largerpopulationaccurately.Buthowdoyouknowhowmucherror?Moststatisticstextbooks
talk about this problem by discussing a giant barrel filled withdifferent-coloured balls – which is fine, but a little boring. Let’sinsteadsupposewehada largedumpster filledwithboxesof two

fine breakfast-like substances, KardboardKrunchies and SoggyOs.Suppose it is a huge dumpster, say, about a city block long. Howmanyboxeswouldyouhavetopullouttoestimatetheproportionofeachoftheseinthedumpsteraccurately?Andhowaccurately?
Wecandoadvanceestimatesforsometypesofsampleerror
Fortunately, some exceedingly smart people determined exactlyhowmucherroryouarelikelytohaveinasamplewherethereareonly twochoices (that is,as inourexample,KardboardKrunchiesversus SoggyOs, but also yes versus no, and blue versus white –wherethoseare theonlycolourspresent,andsoon).Thechart inFigure2.2showsyouthesizesoftheerrorsfordifferentsamplesifyouarefacingthistypeofproblem.
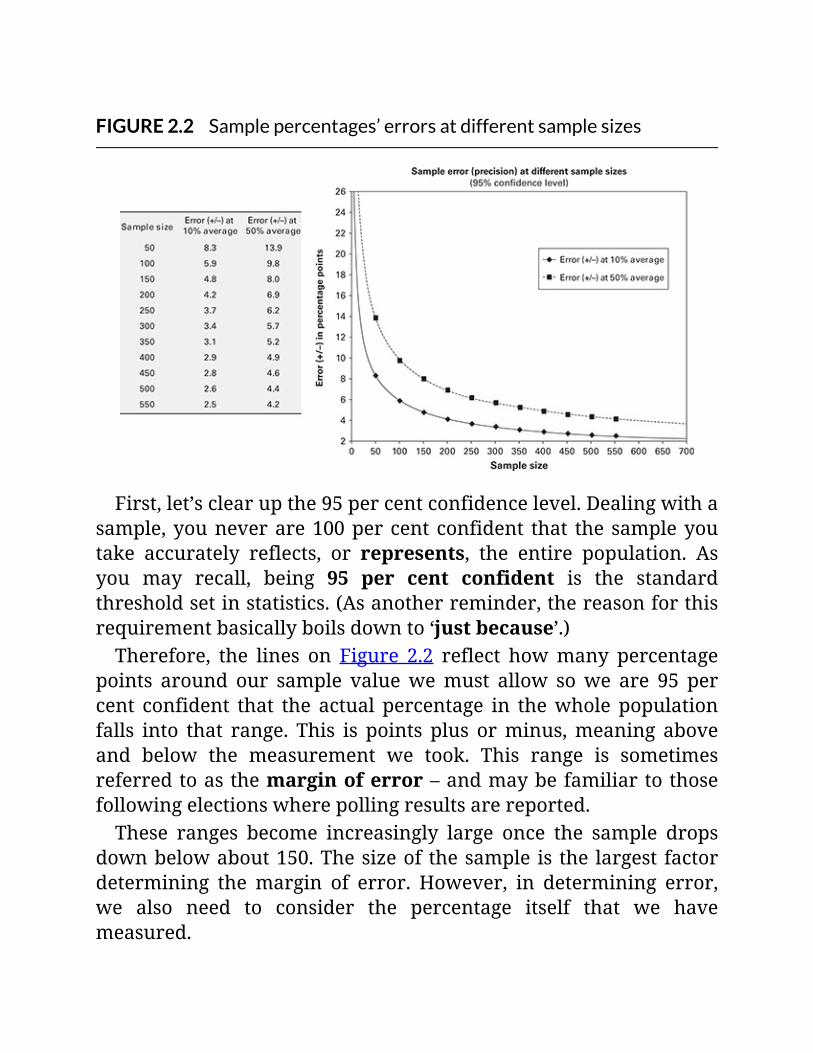
FIGURE2.2Samplepercentages’errorsatdifferentsamplesizes
First,let’sclearupthe95percentconfidencelevel.Dealingwithasample,youneverare100percentconfident that the sampleyoutake accurately reflects, or represents, the entire population. Asyou may recall, being 95 per cent confident is the standardthresholdsetinstatistics.(Asanotherreminder,thereasonforthisrequirementbasicallyboilsdownto‘justbecause’.)Therefore, the lines on Figure 2.2 reflect howmany percentage
points around our sample valuewemust allow sowe are 95 percent confident that the actual percentage in thewhole populationfalls into that range. This is points plus orminus,meaning aboveand below the measurement we took. This range is sometimesreferredtoasthemarginoferror–andmaybefamiliartothosefollowingelectionswherepollingresultsarereported.These ranges become increasingly large once the sample drops
downbelowabout150.Thesizeof thesample is the largest factordetermining themargin of error. However, in determining error,we also need to consider the percentage itself that we havemeasured.
At a percentage of 50 per cent, or going down the middle, theerror is largest.Asweapproach theextremesofzeroand100percent,theerrorgetssmaller.Theerroraroundapercentageof90percent is the sameas theerrorarounda sampleof10percent.Theerror around a sample of 80 per cent is the same as the erroraroundasampleof20percent,andsoon.Backtoourbreakfast-likesubstances,ifyoupulledout400boxes
andexactlyhalfofthemwereKardboardKrunchies,youwouldbe95 per cent certain that the entire bin contained somewherebetween45.1percentand54.9percentofthisfineproduct.
WhytinysamplesdonotworkforestimationIf you think aboutwhat an error of +/- (plus orminus) 14 pointsmeans, you realize that the actual value for thewholepopulationcouldbeanywherewithina28-pointrangeofwhatwasmeasured.For instance, when the sample’s value is 50 per cent, the actualvaluecouldbeanywherebetween36percentand64percent,ifthewhole population could be measured. Few would argue that thiswidearangeformsanacceptablebasisformakingadecision.Yet,thatisallyougetwithasampleof50.If the sample is below 30, this formula breaks down, and we
actuallyneedasomewhatdifferentsetofcalculations.However,asFigure2.2shows,errorsballoonwithsmallsamples.
Therisksinestimatingbasedonsmallgroups
Asmentioned,gatheringsofsmallgroupsforinterviewing,orfocusgroups, typicallyrangebetween5and15people. Inoneortwoofthese, a total of anywherebetween 5 and 30 or so people in totalhave offered their opinions. Unless the item being discussed is acomplete and unmitigated disaster (as can happen) or anastronomical, unprecedented success (aswe have yet to see), youneedfarmorepeopletomakeasoundfinaldecision.
Sowhydofocusgroups?

Sowhydofocusgroups?
Aside fromdetectingdisasters, thesegroupshaveseveralvaluableapplications. You learn about the language that people use indiscussingtheproduct,andinparticulartheterminologythattheycan understand. You can find out if what you are saying ishopelessly confusing from the perspective of peoplewho actuallyuse theproduct.Youcanopenupunexpectedavenues for furtherquestioning.Youcanlearnsomehumblinglessonsabouthowmuchthepeoplewhouseyourfineproduct thinkabout it (generally farlessthanonewouldimagine).
Ataleofmisleadingsmallsamples
Thisisastoryaboutadecisionthatwasmadeinentirelythewrongway.Itappearedinatrainingvideo,andevenbrieflyontelevision.Thiswasquiteafewyearsago,andthetapeseemstohavevanishedintothemistsoftime.Nonetheless,ithasbeendocumentedandstandsasaclearexampleofwhatnottodo.Thoseinvolvedwereamarketingteamfromamajormanufacturerofmen’sjeans.They
wantedtoevaluateanewproduct,men’ssuitsbearingtheirbrandname.Theystartedtheirinvestigationwithamassivequantitativeresearchstudy,almostsociologicalinnature.Thequestionsdelveddeeplyintobasicneedsforclothing,forsocialapprovalandsoon.Thispartoftheprogrammecostinexcessof$800,000incurrentdollars.Followingthis,theyconcludedwithafewfocusgroupstoevaluatetheirnewproductidea.
Theyhadprototypesuitsmadeandaskedafewsmallgroupsofmentogivetheirreactions,inparticulartothequestion,‘Wouldyoubuythese?’Usingthesefewresponsesasthebasisoftheirdecision,theyputthesuitsinto
production,distributedthemtostoresandpromotedthemthroughnationaladvertising.Ifyoucannotthinkofabrandofmen’ssuitsmadebyamanufacturerofmen’sjeans,thisisnotbecauseyoumissedsomething.Thisventurewasanabjectandexpensivefailure.Theycouldnothavemadesuchamistakehadtheyusedadequatenumbersandmethodstoinformtheirdecision.
AsuggestionforsmallversuslargenumbersUsing small numbers, you can get an overview, something likelooking at a general view of a landscape that you will traverse.Largernumbersarelikethedetaileddirectionsaboutwhereexactlyyouwill be going.Having both gives you themost assurance thatyouwillgetwhereyouneedtogoasefficientlyaspossible.
ConcludingourtalkaboutsignificanceFiguring out how much error you find in a percentage is thesimplest form of significance testing. The formulas get morecomplexforcomparingmorethantwosamples,forfiguringouttheerrorinasampleaverage(suchastheaverageratingona10-pointscale),forcomparingscoresinagrouptootherscoresinthesamegroup,andinahostofotherstatisticalprocedures.By the way, all these formulas work correctly only for what is
called a random sample – meaning that you do not have anylinkages among the people or items you are sampling. If you aredealing with, say, doctors together in a given hospital, and evenhospitals together in a given geography, more complexformulationsfortestingareneededtogetaccurateresults.Thatsaid,moststatisticaltestingproceduresinvolvedetermining
how large the error in the measurement (or the effect) is andcomparing that to the measurement itself. Getting the effect just1.96timesaslargeasitscalculatederrorisenoughtopassinmanyprocedures. (We will not be going into all the maths behind thisnumber,fortunately.)Thismayseemlikenotmuchtodemand,butthishasbeenthestandardformanyyears.
OntocorrelationsIn casual conversation, correlation can stand for almost anyrelationship.Instatistics,though,correlationonlymeansasimplesummary measure of how well two variables fit a straight line.Correlation can range fromahigh of +1,where the twovariablesrise and fall in a perfect straight-line relationship, down to –1,where the two variables have a perfect inverse relationship (onefallspreciselyastheotheronerises).Thecorrelation statistic is calledR. This shouldnotbe confused
withR,thefreestatisticalsoftwarepackage.(Apparently,thosewhoinventedRwerethinkingprimarilyofanearliersoftwareprogramcalledS.Thisisreallytrue.)However, theR statistic is the underpinning of theR-squared
value that may be familiar from regression. Regression in itsordinary version (also called ordinary least squares regression)doesindeedlookforstraight-linerelationships.Correlationalso isstrictlyforapairofvariables. Ifweheartalk
about four variables being correlated, either we are listening tosomeslightlysloppylanguage,orsomeonehascheckedalltheways

inwhichthesefourvariablescanbecomparedtwoatatime.
NotalltheworldfallsintoalineManyregular,predictablerelationshipsdonotfallinastraightline,or are not linear. Figure 2.3 shows three examples. In each, wefollow the standard practice of indicating the value of the firstvariablealongthehorizontalaxisandthesecondalongthevertical.
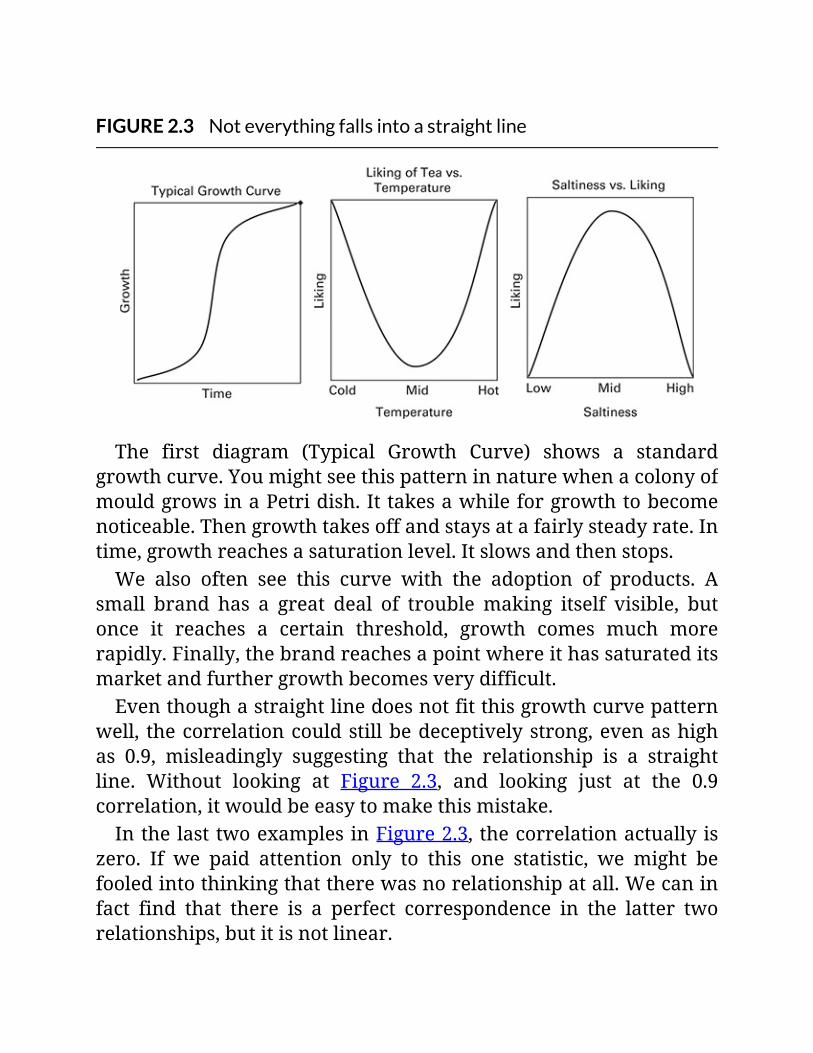
FIGURE2.3Noteverythingfallsintoastraightline
The first diagram (Typical Growth Curve) shows a standardgrowthcurve.YoumightseethispatterninnaturewhenacolonyofmouldgrowsinaPetridish.Ittakesawhileforgrowthtobecomenoticeable.Thengrowthtakesoffandstaysatafairlysteadyrate.Intime,growthreachesasaturationlevel.Itslowsandthenstops.We also often see this curve with the adoption of products. A
small brand has a great deal of troublemaking itself visible, butonce it reaches a certain threshold, growth comes much morerapidly.Finally,thebrandreachesapointwhereithassaturateditsmarketandfurthergrowthbecomesverydifficult.Eventhoughastraightlinedoesnotfitthisgrowthcurvepattern
well, thecorrelationcouldstillbedeceptivelystrong,evenashighas 0.9, misleadingly suggesting that the relationship is a straightline. Without looking at Figure 2.3, and looking just at the 0.9correlation,itwouldbeeasytomakethismistake.InthelasttwoexamplesinFigure2.3,thecorrelationactuallyis
zero. If we paid attention only to this one statistic, we might befooledintothinkingthattherewasnorelationshipatall.Wecaninfact find that there is a perfect correspondence in the latter tworelationships,butitisnotlinear.

Wehopethatthereisnolongeranyquestionaboutneedingtosetsightsonsomethingotherthana ‘significantcorrelation’.Weneedsomething stronger and more focused. And, as a reminder, wetypically cannot spend the time and money involved in simplyputtingaproductorserviceoutinthemarketplaceandseeinghowitdoes.Insomeplaces,wecandoalimitedmarketplacetest(suchastestingoutapromotionontheweb),butagain,thesedonotgiveusmuchchancetoexperimentwithalternatives.Sowhenplanningaproject,whatshouldwehaveinmindasourcriteriafordecidingiftheapproachwehavechosenshouldsucceed?
Correlationisasimplesummarymeasureofhowcloselytwovariablesfallcomparedtoaperfectstraight-linerelationship.CorrelationisknownasRinstatistics.R-squaredisindeedthecorrelationvaluesquared,andisthemostwidelyusedmeasureshowinghowwellaregressionmodelperformsinfittingvaluestoastraightline.
HowdoIplantoevaluatetheresults?Some measures have been used for many years in judging thegoodness of statistical models. Correct classification andexplained variance are likely to be the most familiar. Newermeasures include information criteria such as the AkaikeInformation Criterion (AIC) and Bayesian Information Criterion(BIC).Youmaycomeacrossmanyothermeasuresifyouspendtimearoundstatisticaltypes,buttheseareastart.Correctclassificationseemsintuitivelymostapproachable.This
measureisusedforcategoricaldataanddatathatcantake justafewvalues,suchasratingsona1–5scale.Weneedtousedifferenttypes of testing for different types of data. Before we go muchfurther,weshouldprobablyreviewthebasictypesofdata.
Thebasictypesofdata
Categoricaldatausesnumbersasplaceholdersfornon-numericalvalues.Forinstance,youcouldusethenumbers1,2,3and4tostandforfourregionsofthecountry,suchasnorth,south,eastandwest.Clearly‘west’isnotworthfourtimesasmuchas‘north’(eventhoughthismightbedisputedbypeoplelivinginthewest).Herewearesimplyputtingthecategoriesintoanumericformthatiseasierforthecomputertomanipulateandstorethanitstextequivalent.Ordinaldatashowswhichvaluesarelargerthanwhichothers,andsoprovidesanordertothevalues.Butitdoesnotshowhowmuchlargeronevalueisthananother.Forinstance,ifwe
havethreecontestantsinfirst,secondandthirdplace,weknowonlytheorderinwhichtheyareplaced,andnothowmuchbetterfirstdidthansecondorseconddidthanthird.Interval-leveldatagivesusasetdistancebetweenthevalues,butdoesnotallowustosaythatonevalueisacertainmultipleofanother.Temperature is an example of this kind of measure. Forinstance,ifitis40degreesoutside,wecannotsaythatitistwiceashotas20degrees.Wecansaythat40degrees is20degreesmore,and60is20morethan40,andsoon.Ratio-leveldatagivesusthemostcomparativeinformation.Weightisanexampleofthistypeofmeasure.WecanindeedsaythatifHanshas20kilosofsausages,hehastwiceasmanysausagesasFritz,whohasonly10.(WealsocansayHanshas10kilosmore,theluckyfellow.)Ratio-leveldataandinterval-leveldatacanbelumpedtogetheras continuous data, that is, data that can take any value,includingfractionalordecimalvalues.Ifyouhaveafive-pointscale, there is no value between (for instance) four and five.Similarly,therearenovaluesbetweenthe‘1’assignedto‘north’andthe‘2’assignedto‘south’inournominaldataexample.
There have been, and probably continue to be, many argumentsaboutwhether the scales used inmany surveys are justordinal-leveldataoriftheyareinterval-level.Thatis,youcanarguethat‘5’onafive-pointratingscaleisthesamedistancefrom‘4’as‘4’isfrom ‘3’. That would make the scale interval-level if true.(However,thisscaleisdefinitelynotratio-level:youcannotsaythataratingof‘4’istwiceasgoodasaratingof‘2’,andsoon.)At times you will see scaled ratings treated as if they were
interval data or ratio data. For instance, youwill see the averageratingona five-point ratingscale shownas (say)4.3,even thoughnoonecouldpossiblyhavegiventhatexactresponse.Inspiteofthefactthattreatingscaledratingsinthiswayviolatesbasicrulesand
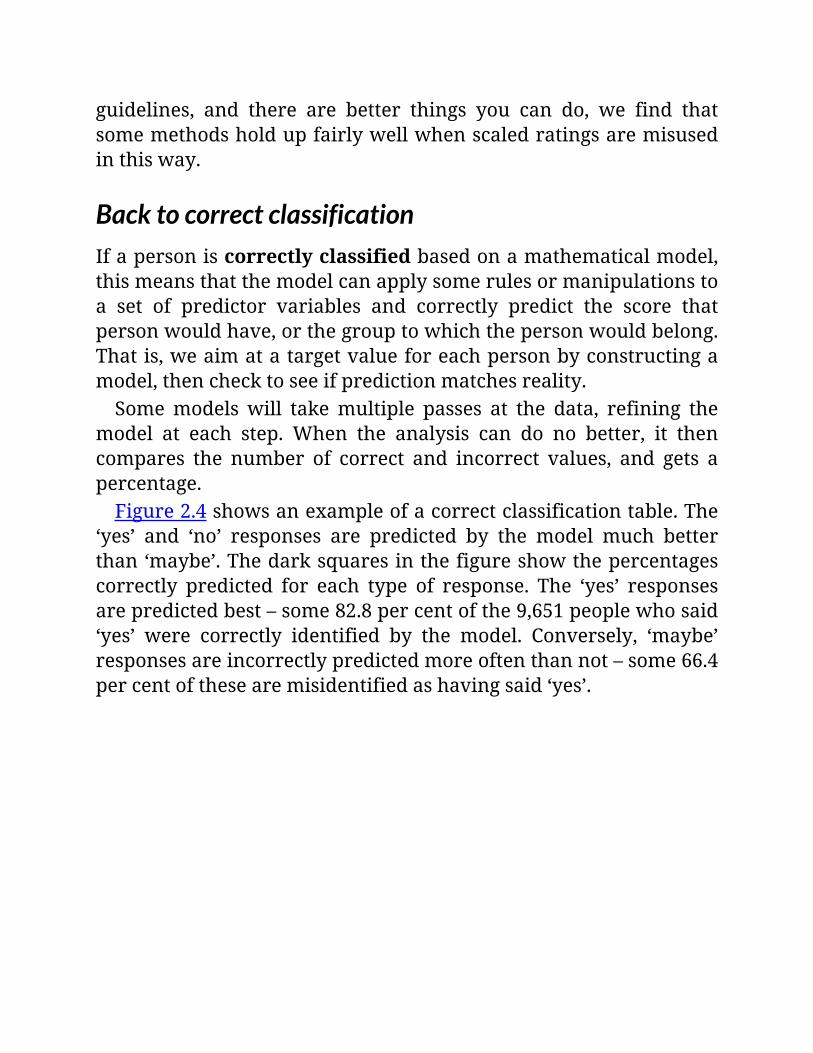
guidelines, and there are better things you can do, we find thatsomemethodsholdupfairlywellwhenscaledratingsaremisusedinthisway.
BacktocorrectclassificationIfapersoniscorrectlyclassifiedbasedonamathematicalmodel,thismeansthatthemodelcanapplysomerulesormanipulationstoa set of predictor variables and correctly predict the score thatpersonwouldhave,orthegrouptowhichthepersonwouldbelong.Thatis,weaimatatargetvalueforeachpersonbyconstructingamodel,thenchecktoseeifpredictionmatchesreality.Somemodelswill takemultiple passes at the data, refining the
model at each step. When the analysis can do no better, it thencompares the number of correct and incorrect values, and gets apercentage.Figure2.4showsanexampleofacorrectclassificationtable.The
‘yes’ and ‘no’ responses are predicted by the model much betterthan‘maybe’.Thedarksquaresinthefigureshowthepercentagescorrectly predicted for each type of response. The ‘yes’ responsesarepredictedbest–some82.8percentofthe9,651peoplewhosaid‘yes’ were correctly identified by the model. Conversely, ‘maybe’responsesareincorrectlypredictedmoreoftenthannot–some66.4percentofthesearemisidentifiedashavingsaid‘yes’.
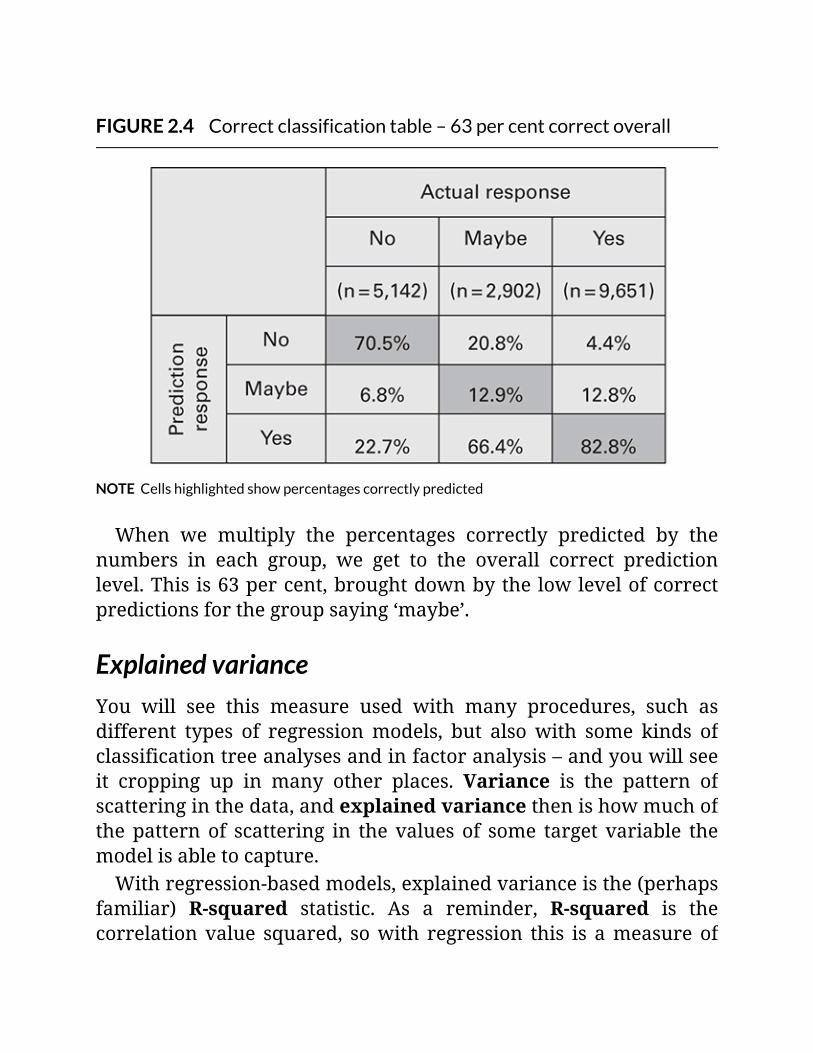
FIGURE2.4Correctclassificationtable–63percentcorrectoverall
NOTECellshighlightedshowpercentagescorrectlypredicted
When we multiply the percentages correctly predicted by thenumbers in each group, we get to the overall correct predictionlevel.Thisis63percent,broughtdownbythelowlevelofcorrectpredictionsforthegroupsaying‘maybe’.
ExplainedvarianceYou will see this measure used with many procedures, such asdifferent types of regressionmodels, but alsowith some kinds ofclassificationtreeanalysesandinfactoranalysis–andyouwillseeit cropping up in many other places. Variance is the pattern ofscatteringinthedata,andexplainedvariancethenishowmuchofthepattern of scattering in the values of some target variable themodelisabletocapture.Withregression-basedmodels,explainedvarianceisthe(perhaps
familiar) R-squared statistic. As a reminder, R-squared is thecorrelationvalue squared, sowith regression this is ameasure of
howwellthepredictionfromthemodelandtheactualvaluesofthetargetvariablefallintoastraightline.Explainedvarianceisalwayspositiveandcanrangefromzerotoone(oralternativelyfrom0percentto100percent).
Information-basedcriteriaYou may encounter these with some of the newer methods. Forinstance,thestatisticsprogramSPSShasanewerclusteringmethodthat they call TwoStep, and it shows the AIC and BIC statistics.These measures are good for comparing statistical models. Asmallerscoreisbetter.Howmuchsmallerisopentointerpretation,but an often-cited standard for theBIC is that a difference of twogivesweakevidence that onemodel is better thananother, andadifference of six gives strong evidence. There are no absolutestandards for either of these tests, though. Also, many otherinformation-based tests exist, but donot seem to getmuchuse inthemethodsweusuallyencounter.
Onemorecriterion:theRMSE
YoualsomayseementionsoftheRMSE,whichstandsfortheroot-mean-squarederror.Liketheinformation-basedcriteria,itisusefulfor comparingmodels.However, it isdifficult to interpretdirectlyasitdoesnotfallintoafixedrange,likeexplainedvariance.Ratherit is in the units of the basic measurement you are making. Forinstance, an RMSE value of 0.7 is good if the basic measurementgoesupto1,000,butnotgoodifitgoesupto1.
Whataregoodresults?‘Allmodelsarewrongbutsomeareuseful’–GEORGEEBOX
George Box was talking about the fact that any mathematicalrepresentation of the real world, even the best, leaves out some
aspects. This is of course correct. Mr Box was an eminentstatistician, and an excellent source of guidance on matters ofinterpretingdata.Knowing thatweare shooting foramodel that is ‘goodenough’
anduseful,westeerdirectlyintosomedisagreement.Nohardandfast ruleexists forwhatmakes fora ‘goodenough’ scorewith theevaluativecriteriawearediscussing.Fewarguethatanythinglessthan50percentcorrectcouldcount
as good. But beyond this, it becomes a matter of personalpreference. Still, more than a fewmodels have been accepted asuseful,evenwithlowerlevelsofbeing‘correct’.Sometimesonegoalofananalysisistodeterminejusthowwellaspecificquestioncanbe answered. In that case, a low level of performance is itselfinformational,showingthataspecificapproachordatasetcannotprovidestrongguidance.
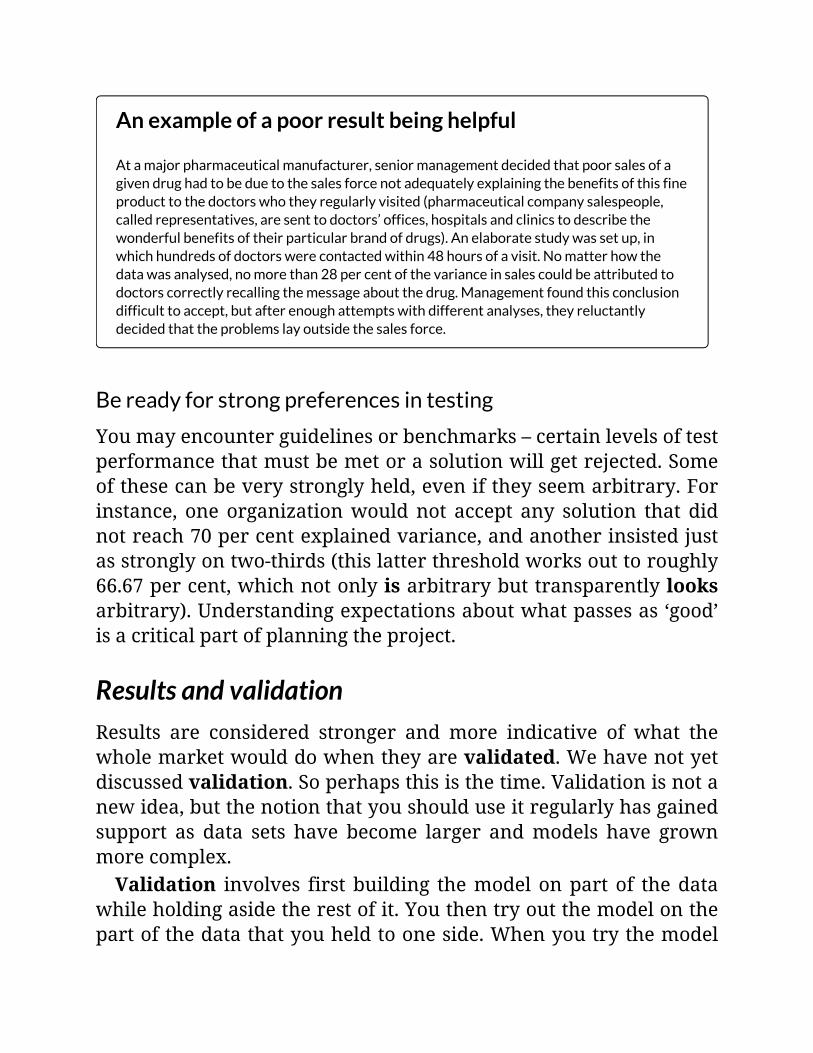
Anexampleofapoorresultbeinghelpful
Atamajorpharmaceuticalmanufacturer,seniormanagementdecidedthatpoorsalesofagivendrughadtobeduetothesalesforcenotadequatelyexplainingthebenefitsofthisfineproducttothedoctorswhotheyregularlyvisited(pharmaceuticalcompanysalespeople,calledrepresentatives,aresenttodoctors’offices,hospitalsandclinicstodescribethewonderfulbenefitsoftheirparticularbrandofdrugs).Anelaboratestudywassetup,inwhichhundredsofdoctorswerecontactedwithin48hoursofavisit.Nomatterhowthedatawasanalysed,nomorethan28percentofthevarianceinsalescouldbeattributedtodoctorscorrectlyrecallingthemessageaboutthedrug.Managementfoundthisconclusiondifficulttoaccept,butafterenoughattemptswithdifferentanalyses,theyreluctantlydecidedthattheproblemslayoutsidethesalesforce.
Bereadyforstrongpreferencesintesting
Youmayencounterguidelinesorbenchmarks–certainlevelsoftestperformancethatmustbemetorasolutionwillgetrejected.Someofthesecanbeverystronglyheld,eveniftheyseemarbitrary.Forinstance, one organizationwouldnot accept any solution that didnotreach70percentexplainedvariance,andanotherinsistedjustasstronglyontwo-thirds(thislatterthresholdworksouttoroughly66.67percent,whichnotonlyisarbitrarybuttransparentlylooksarbitrary).Understandingexpectationsaboutwhatpassesas‘good’isacriticalpartofplanningtheproject.
ResultsandvalidationResults are considered stronger and more indicative of what thewholemarketwoulddowhentheyarevalidated.Wehavenotyetdiscussedvalidation.Soperhapsthisisthetime.Validationisnotanewidea,butthenotionthatyoushoulduseitregularlyhasgainedsupport as data sets have become larger andmodels have grownmorecomplex.Validation involves firstbuilding themodel onpart of thedata
whileholdingasidetherestofit.Youthentryoutthemodelonthepartofthedatathatyouheldtooneside.Whenyoutrythemodel

on this so-called hold-out sample, predictive accuracy usuallycomesinatalowerlevelthanwhenyousimplylookatthehowthemodelperformedwhereitwasmade.Even the best predictive modelling technique will fit some
randombumpsandfluctuationsthatarefoundonlyinthedatasetonwhichamodelwasbuilt.Tryingoutthemodelelsewhere,evenonanotherpartofthesamedatathatyousetaside,givesyousomesafeguardsagainstoverfittingtoseemingpatternsthatyouwillnotfindintheoutsideworld.Validation typically comes built in by default only in newer
statisticalroutines,suchasthosethatdotheBayesNetsanalyseswediscuss in Chapter 7. More traditional methods, such as linearregression, often do not include validationmethods, as they grewupinatimewhencomputingpowerwasnotuptodoingthistypeoftestingasamatterofcourse.
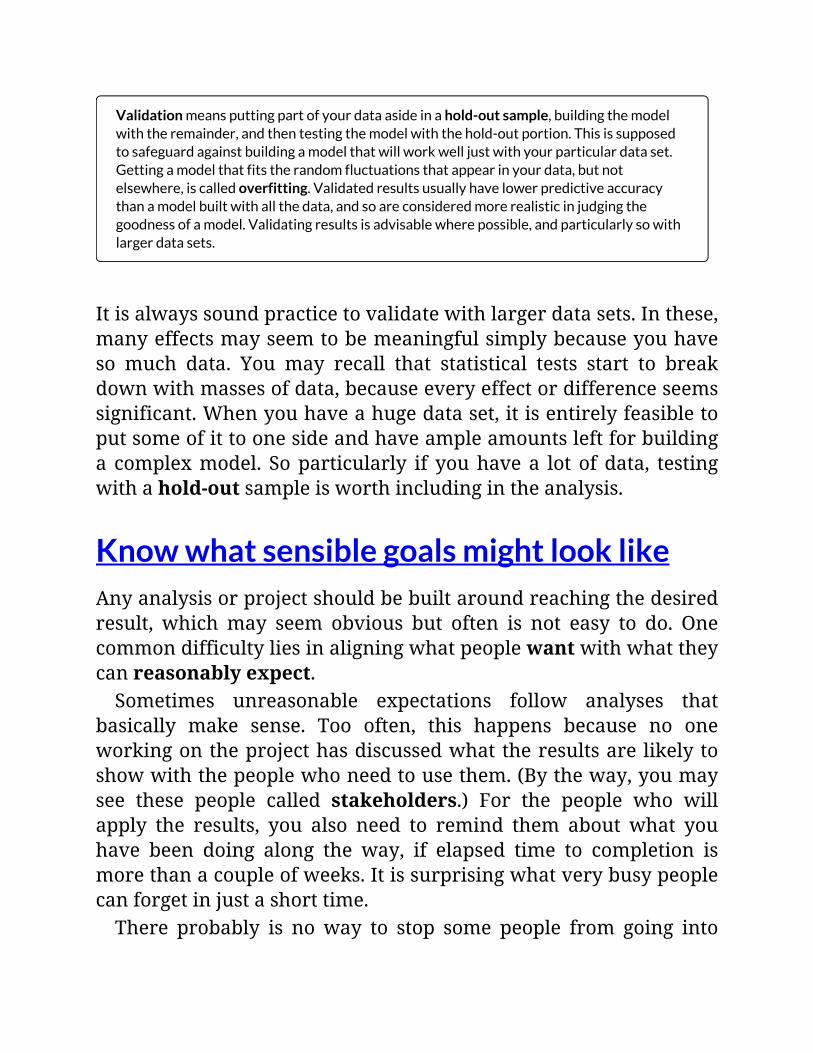
Validationmeansputtingpartofyourdataasideinahold-outsample,buildingthemodelwiththeremainder,andthentestingthemodelwiththehold-outportion.Thisissupposedtosafeguardagainstbuildingamodelthatwillworkwelljustwithyourparticulardataset.Gettingamodelthatfitstherandomfluctuationsthatappearinyourdata,butnotelsewhere,iscalledoverfitting.Validatedresultsusuallyhavelowerpredictiveaccuracythanamodelbuiltwithallthedata,andsoareconsideredmorerealisticinjudgingthegoodnessofamodel.Validatingresultsisadvisablewherepossible,andparticularlysowithlargerdatasets.
Itisalwayssoundpracticetovalidatewithlargerdatasets.Inthese,manyeffectsmayseemtobemeaningfulsimplybecauseyouhaveso much data. You may recall that statistical tests start to breakdownwithmassesofdata,becauseeveryeffectordifferenceseemssignificant.Whenyouhaveahugedataset,itisentirelyfeasibletoputsomeofittoonesideandhaveampleamountsleftforbuildinga complexmodel. Soparticularly if youhavea lot ofdata, testingwithahold-outsampleisworthincludingintheanalysis.
KnowwhatsensiblegoalsmightlooklikeAnyanalysisorprojectshouldbebuiltaroundreachingthedesiredresult, whichmay seem obvious but often is not easy to do. Onecommondifficultyliesinaligningwhatpeoplewantwithwhattheycanreasonablyexpect.Sometimes unreasonable expectations follow analyses that
basically make sense. Too often, this happens because no oneworkingontheprojecthasdiscussedwhattheresultsarelikelytoshowwiththepeoplewhoneedtousethem.(Bytheway,youmaysee these people called stakeholders.) For the people who willapply the results, you also need to remind them about what youhave been doing along the way, if elapsed time to completion ismorethanacoupleofweeks.Itissurprisingwhatverybusypeoplecanforgetinjustashorttime.There probably is noway to stop some people from going into

projects with unrealistic expectations. When considering whatmight be reasonable, the first question iswhether your source ofdatacanaddressthequestionathand.Forinstance,itisrationaltolookatcustomertransactionstoestimatehowmanywillrespondtoanewoffer similar to a recent one.However, it is not sensible toturntothisdatasourceandexpecttogleanideasfordevelopingasplendid new product. (In the following chapterswewill go oversubtler problems that can arise from starting with the wrongsources.)
Summaryofkeypoints
StartingconsiderationsThis chapter talks about first steps in planning a project. Severalconsiderations are key at the outset, and while some may seemapparent, it seems many a project has lurched into life withoutconsideringallof them.Keyamong thequestions toaskarewhatcan change based on the analysis.And, as follows, youmust alsodetermine what you really need to know to help that changehappen. You alsomust understandwho you are talking about ortalkingto–andavoidthetrapofjustrunningwithwhatevercomeseasilytohand.Thankstotheweb,thereismoredatathatwillproveto bewrong for answering your question than ever – so this is aparticularlykeycaution.Theplace fromwhichyoudrawyourdatamore technicallycan
be called a sample frame. Aswith the frame for a picture, if youpickonethatisthewrongsizeorthatobscuresthepictureinpart,youwillnotbeseeingwhatyoushould.
ThemosttoexpectYouneed to consider themost you can expect fromyourdata, or
less positively put, the limitations of different kinds of analyses.Withhistoricalortransactiondata,youcanreasonablyexpecttoforecastwhatwillhappenifyoudosomethingsimilartowhatyouhavealreadybeendoing.Youshouldnotexpecttomakeafantasticnewproductwiththis,though.With standard questions and answers from surveys, you can
predict more than you might have suspected, particularly withsomeneweranalyticalmethods (whichwewilldiscuss).However,youaremorelikelytogetoverallguidanceaboutwhatyouneedtoaddress, rather thanspecificdirection.For instance,youmay findthatyoucanincreasesharebyimprovingcustomerservice,butnotprecisely in which ways or by how much. The experimentalmethods,particularlyconjointanddiscretechoice,canprovidethatspecificlevelofinformation.Theselattermethods,alsocalledtrade-offmethods,arethebest
suitedfordeterminingtheextenttowhichspecificchangeswillleadto changes in marketplace behaviour. Even discrete choicemodelling, themost realistic and powerful of thesemethods, stillwillonly forecastshareofacceptance (rather thanactualmarketshare) unless you can adjust at a minimum for how many areaware of the product in the marketplace and how widely theproductisdistributed.Theothertrade-offmethods,MaxDiffandQ-Sort/Case5,provide
clearlydifferentiatedimportancesfor listsof itemssuchasclaims,messages, or specific sets of product or service features. Theycannottesttheeffectsofchangesinfeaturesonwholeproductsorservices. Both of them provide information at the ratio level,meaning you can say (for instance) that one feature is twice asimportant at the other. MaxDiff provides importances for everyperson,whileQ-Sortdoes soonly forgroups.Q-Sort canprioritizemanymoreitemsthanMaxDiff,though,upto100(versusupto35).
Settinguptojudgetheresults
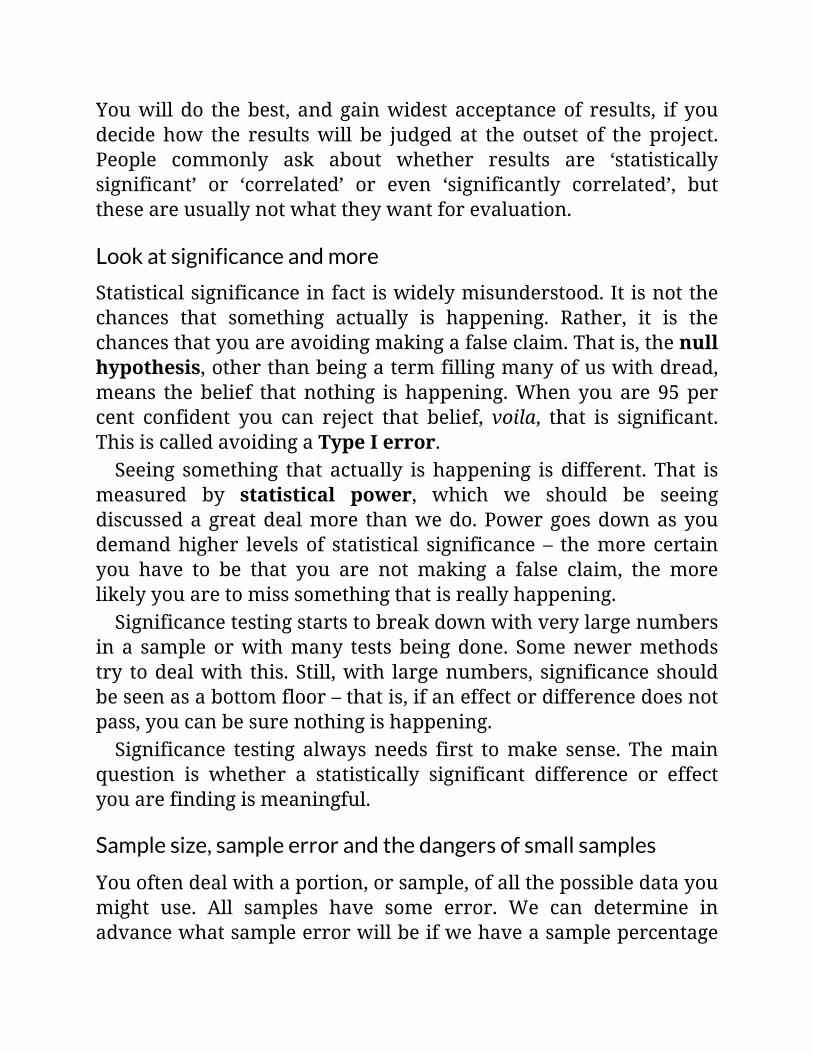
Youwill do thebest, andgainwidest acceptanceof results, if youdecide how the resultswill be judged at the outset of the project.People commonly ask about whether results are ‘statisticallysignificant’ or ‘correlated’ or even ‘significantly correlated’, buttheseareusuallynotwhattheywantforevaluation.
Lookatsignificanceandmore
Statisticalsignificanceinfactiswidelymisunderstood.Itisnotthechances that something actually is happening. Rather, it is thechancesthatyouareavoidingmakingafalseclaim.Thatis,thenullhypothesis,otherthanbeingatermfillingmanyofuswithdread,means thebelief thatnothing is happening.Whenyouare 95percent confident you can reject that belief, voila, that is significant.ThisiscalledavoidingaTypeIerror.Seeing something that actually is happening is different. That is
measured by statistical power, which we should be seeingdiscussedagreatdealmore thanwedo.Powergoesdownasyoudemandhigher levels of statistical significance – themore certainyou have to be that you are not making a false claim, the morelikelyyouaretomisssomethingthatisreallyhappening.Significancetestingstartstobreakdownwithverylargenumbers
in a sample orwithmany tests beingdone. Somenewermethodstry todealwith this. Still,with largenumbers, significance shouldbeseenasabottomfloor–thatis,ifaneffectordifferencedoesnotpass,youcanbesurenothingishappening.Significance testing always needs first tomake sense. Themain
question is whether a statistically significant difference or effectyouarefindingismeaningful.
Samplesize,sampleerrorandthedangersofsmallsamples
Youoftendealwithaportion,orsample,ofallthepossibledatayoumight use. All samples have some error. We can determine inadvancewhatsampleerrorwillbeifwehaveasamplepercentage
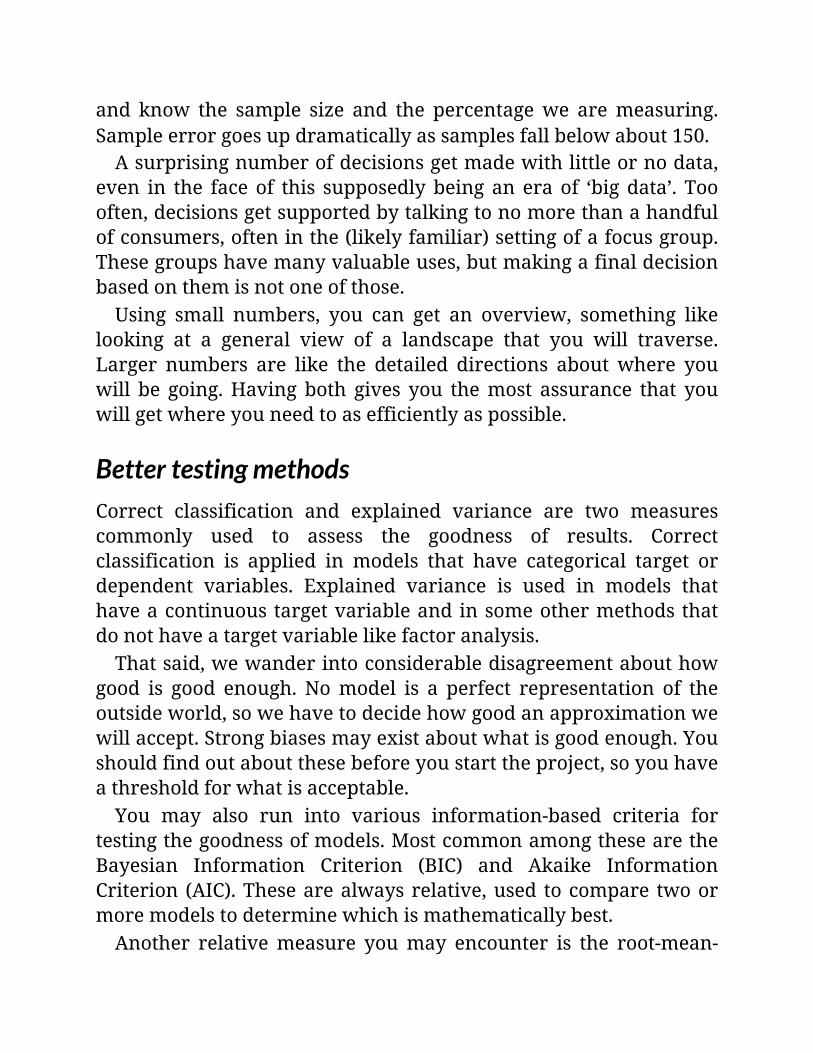
and know the sample size and the percentagewe aremeasuring.Sampleerrorgoesupdramaticallyassamplesfallbelowabout150.Asurprisingnumberofdecisionsgetmadewithlittleornodata,
even in the faceof this supposedlybeingan eraof ‘bigdata’. Toooften,decisionsgetsupportedbytalkingtonomorethanahandfulofconsumers,ofteninthe(likelyfamiliar)settingofafocusgroup.Thesegroupshavemanyvaluableuses,butmakingafinaldecisionbasedonthemisnotoneofthose.Using small numbers, you can get an overview, something like
looking at a general view of a landscape that you will traverse.Larger numbers are like the detailed directions about where youwill be going.Having both gives you themost assurance that youwillgetwhereyouneedtoasefficientlyaspossible.
BettertestingmethodsCorrect classification and explained variance are two measurescommonly used to assess the goodness of results. Correctclassification is applied in models that have categorical target ordependent variables. Explained variance is used in models thathaveacontinuoustargetvariableandinsomeothermethodsthatdonothaveatargetvariablelikefactoranalysis.Thatsaid,wewanderintoconsiderabledisagreementabouthow
good is good enough. Nomodel is a perfect representation of theoutsideworld,sowehavetodecidehowgoodanapproximationwewillaccept.Strongbiasesmayexistaboutwhatisgoodenough.Youshouldfindoutaboutthesebeforeyoustarttheproject,soyouhaveathresholdforwhatisacceptable.You may also run into various information-based criteria for
testingthegoodnessofmodels.MostcommonamongthesearetheBayesian Information Criterion (BIC) and Akaike InformationCriterion (AIC).Thesearealwaysrelative,used tocompare twoormoremodelstodeterminewhichismathematicallybest.Another relativemeasure youmay encounter is the root-mean-
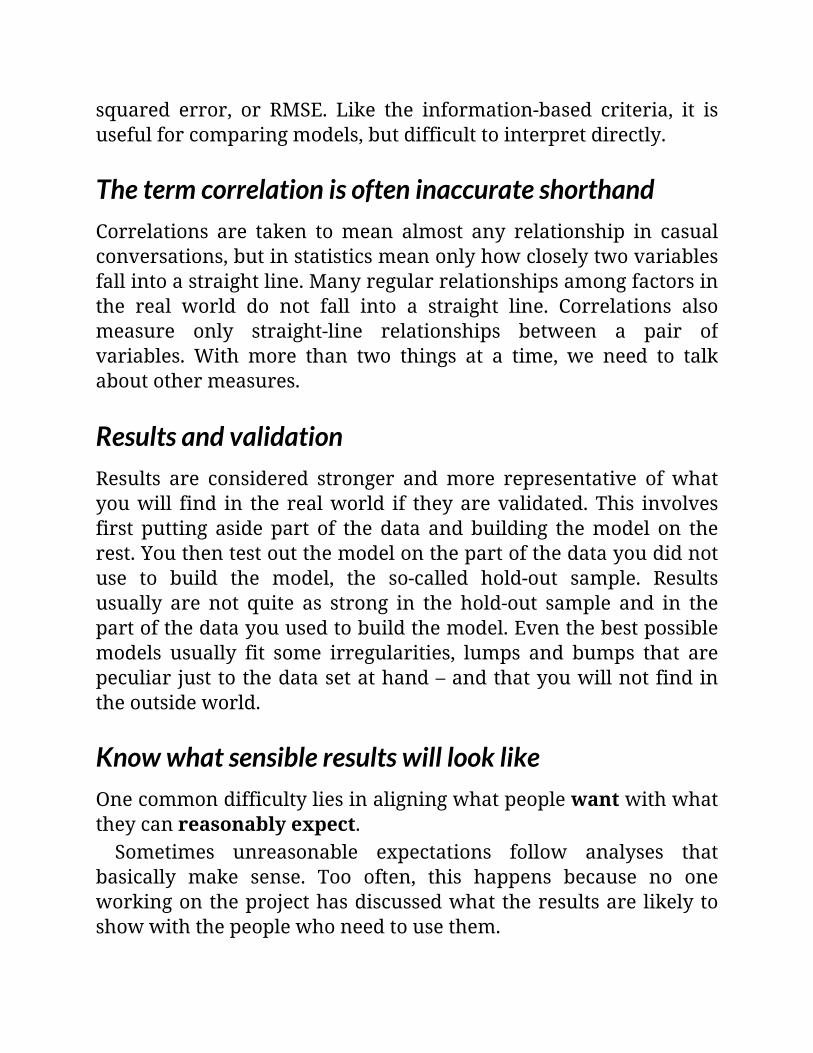
squared error, or RMSE. Like the information-based criteria, it isusefulforcomparingmodels,butdifficulttointerpretdirectly.
ThetermcorrelationisofteninaccurateshorthandCorrelations are taken tomean almost any relationship in casualconversations,butinstatisticsmeanonlyhowcloselytwovariablesfallintoastraightline.Manyregularrelationshipsamongfactorsinthe real world do not fall into a straight line. Correlations alsomeasure only straight-line relationships between a pair ofvariables. With more than two things at a time, we need to talkaboutothermeasures.
ResultsandvalidationResults are considered stronger andmore representative of whatyouwill find in the realworld if theyarevalidated.This involvesfirst putting aside part of the data and building themodel on therest.Youthentestoutthemodelonthepartofthedatayoudidnotuse to build the model, the so-called hold-out sample. Resultsusually are not quite as strong in the hold-out sample and in thepartofthedatayouusedtobuildthemodel.Eventhebestpossiblemodels usually fit some irregularities, lumps and bumps that arepeculiarjusttothedatasetathand–andthatyouwillnotfindintheoutsideworld.
KnowwhatsensibleresultswilllooklikeOnecommondifficultyliesinaligningwhatpeoplewantwithwhattheycanreasonablyexpect.Sometimes unreasonable expectations follow analyses that
basically make sense. Too often, this happens because no oneworkingontheprojecthasdiscussedwhattheresultsarelikelytoshowwiththepeoplewhoneedtousethem.

Youmayattimesencounterunrealisticexpectations.Agoodwaytodealwith these is consideringcarefullywhetheryour sourceofdata can address the question at hand. Then explain howreasonableoutcomesmightlook.
03Conjoint,discretechoiceandothertrade-offsLet’sdoanexperiment
This chapteraddressesbestmethods fordevelopingnewproductsor servicesor combinationsofmessages –allowingyou topredictresponsestomanyhundredsorthousandsofalternativesbytestinga small, scientifically selected fraction of them. These are theexperimentally designed approaches, also called the trade-offmethods.Attheirsimplest,theycanprovidecleardifferentiationinpreferences. At their most complex, they can accurately simulatewhatwillhappenundernewcircumstancesintherealworld.Thesefall into threebroadclasses:discretechoice, conjointanalysisandotherforcedtrade-offexercises.Theseallfalltowardstheendofthecontinuumofmethods that requirehighplanning forengagementwith consumers and have high analytical requirements. We willdiscussbrieflyhoweachmethodevolvedanditsrelativestrengthsandweaknesses. Thesemethods have been greatly expanded andstrengthened bymachine learning approaches. The next chapterswillshowhow.
ThereasonsweneedthesemethodsThesemethodswere developed to address a salient problemwithquestions asking about what is important. We cannot get at theright answer by simply asking people to give us ratings such as‘Howimportantisthistoyouonascaleofonetofive?’Whenthistype of direct question is posed, people cannot or will not give

answersthatreflectwhattheytrulyvaluethemost.Forinstance,supposeyouwantedtodevelopanewfloor-standing
wine cooler, and your product team came up with a variety ofpossiblefeatures,includingsomethatwerejustslightlyfar-fetched.Ifwe asked anaverage consumerquestions abouthow importantthese features were using a standard set of importance ratingscales,wewouldgetapatternliketheoneshowninFigure3.1.
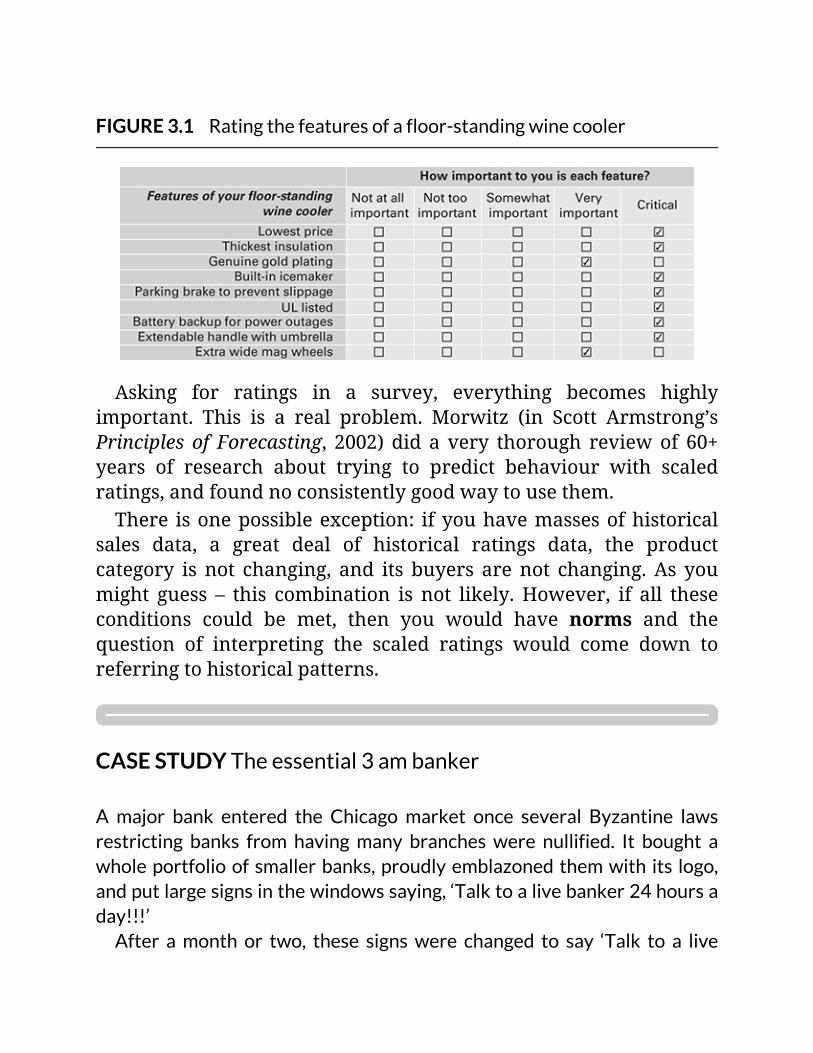
FIGURE3.1Ratingthefeaturesofafloor-standingwinecooler
Asking for ratings in a survey, everything becomes highlyimportant. This is a real problem. Morwitz (in Scott Armstrong’sPrinciples of Forecasting, 2002) did a very thorough reviewof 60+years of research about trying to predict behaviour with scaledratings,andfoundnoconsistentlygoodwaytousethem.There isonepossibleexception: ifyouhavemassesofhistorical
sales data, a great deal of historical ratings data, the productcategory is not changing, and its buyers arenot changing.As youmight guess – this combination is not likely.However, if all theseconditions could be met, then you would have norms and thequestion of interpreting the scaled ratings would come down toreferringtohistoricalpatterns.
CASESTUDYTheessential3ambanker
A major bank entered the Chicago market once several Byzantine lawsrestricting banks from having many branches were nullified. It bought awholeportfolioof smallerbanks,proudlyemblazonedthemwith its logo,andputlargesignsinthewindowssaying,‘Talktoalivebanker24hoursaday!!!’After amonth or two, these signs were changed to say ‘Talk to a live
bankeruntil1am!!’Notlongafterwardstheychangedagain–toread‘Talkto a live banker until midnight!’ Before the seasons changed, the signschangedagain–toread‘Talktoalivebankeruntil10pm’.Afterthat,thesignscamedown,orperhapsfelldownduetotheweight
ofallthepatcheswithrevisedtimesthathadbeenplacedonthem.Clearly,not many people actually woke up at 3 am, slapped themselves on theforehead,andsaid,‘Ohmy,Ireallyneedtotalktoabanker!’Yetthebankhadbehavedasiftheyexpectedpeopletodothis.Whydid
this happen? Conversations with those involved revealed that they hadaskedpeople,usingscaledimportanceratings,whatwouldbeimportantinashinynewbankbearingtheircorporatename.Whenpeopleweregiventhe chance toprovide thesedirect ratings, theyoften ticked ‘talking to alivebanker’ascritical.Yetitclearlywasnotcrucialintheiractualbanking.Itwasjustthattheycouldnotsay‘no’towhatlookedlikeafreeoffer.Thepeoplewho framedthequestionswereruefulabout this, referring
to organizational pressures, not having enough time – and that, besides,someoneelsemadethefinaldecisionaboutthesurvey.Excusesaside,theygot useless answers andwasted a chance to enter a newmarket with amorevaluableoffer.Theywouldhavedonemuchbetterusingoneofthetrade-offmethods
wearediscussing.Infutureeffortstheydid,avoidingthemistakeofactingas if bankers were essential at 3 am. Their later offerings weresubstantiallybetterreceived.
ShortcomingsinscaledimportanceratingsIn the typical situation, where you do not have a long andapplicablehistory,scaledimportanceratingssufferfromnumerouswell-documentedproblems.Salientamongthemarethese:
acquiescencebias;straight-lineandextremeresponses;
sociallydesirableresponses;culturalskew.
Acquiescence bias means the tendency of people to respond toquestions with positive responses. That is, most people arepredisposed to avoid negatives and will choose a more flatteringresponseifpossible.Forinstance,thevastmajorityofresponsesonafive-pointimportanceratingscaledoindeedfallintothetoptwopoints of the scale (the ratings corresponding to the mostimportance).Straight-lineorextremeresponsesarisefromlimitedcognitive
effortbeingputintotheinterviewtask.Someindividualswillagreeto do the interview but then repeatedly check either end of theratingscale(highestorlowest),ratherthanthinkingofmoresubtlydifferentiatedresponses.Onealternativepatternofgivingstraight-line response that is fairly common is a person’s repeatedlychecking thesecondhighestboxonaratingscale,suchas ‘4’onafive-pointscale.Sociallydesirableresponsesreflectwhatpeoplebelieveshould
besaid,ratherthanwhattheyactuallybelieve.Forinstance, ifweweretoaskfordirectratingsoftheimportanceofsafetyfeaturesinanewcar,nearlyallpeoplewouldratethemas‘essential’.Yetmanycarsinthemarketplacecontinuetosellwell inspiteof indifferentorevenbelow-averagesafetyratings.Culturalskewreflectsthewell-documenteddifferencesfoundin
ratings among people with different cultural backgrounds. Forinstance, doctors in Japan are notoriously hard in ratings. Theymightratetheirfavouriteproductat‘7’ona10-pointscale.DoctorsinLatinAmerica, conversely,might rateallproductsat ‘9’ or ‘10’,even products that they would never use. Sometimes, even finergeographic differences matter. For instance, people in largenortherncitiesintheUnitedStatestendtogivelowerratingsthanpeopleinsouthern,lessurbanareas.
Theseproblemsledtoadoptionofnewmethods

Theseproblemsledtoadoptionofnewmethods
The inherentunreliability of rating scales led to a search for, andcommonadoptionof,newmethods.Thesehavebeenputunderthebroadheadingoftrade-offmethods–mostalsoaredesigned likescientific experiments. All of these methods ask respondents toweigh specific elementsor featuresofaproduct, service, claimormessageagainsteachother.
Problemswithtraditionalscaledimportanceratingsarenumerous,wellknownandthoroughlydocumented.Allofthesetogetherleadtoratingsofthistypeprovidingunreliableresultsforpredictingbehaviour.Salientamongthefactorsthatmaketheseratingsnon-usefulinclude:acquiescencebias(tendencytoratepositively);straight-lineorextremeresponses(frompeoplewhodonotputineffortansweringquestions);sociallydesirableresponses(orthecommontendencytosaywhatitseemsshouldbesaid,ratherthanreallyanswering);andculturalskew(differentuseofscaledratingsdependingonsocialbackground).Practicallyspeaking,nearlyeverythingratedtendstobecomehighlyimportantorcritical,
becauseitcostsnothinginasurveytosaythateverythingisimportant.Theseproblemsledtothewidespreadadoptionofvarioustrade-offmethods,inparticular,theexperimentallydesignedoneswediscussinthissectionofthebook.
It is entirely possible that the severe problems with scaledimportanceratingsforuseinpredictionledtoadevaluationoftheentirefieldofsurvey-basedresearch.Manypractitionersstillhavenot accepted the idea that these trade-off methods, if donereasonablywell,canovercometheselimitations.
ThebasicthinkingbehindtheexperimentallydesignedmethodsThese methods, as a reminder, also are called trade-off studies.Theymeasureresponsestodistinctfeaturesordistinctvariationsofdefinite features. That is, products, services and messages areassumed to be collections of features that are measurable andcomparable. These methods also assume that the value of eachfeaturecanbetradedversusthevalueofotherfeatures.This is as far into the psychology of decision making as these
methods go. They do not address the underlying intricacies ofdecisionmaking–itseemsmoreaccuratetoconsiderthattheyareaiming to capture the outcome of the decisions rather than theirinnerworkings.
Featurescanbebrokenintodiscretevariationsorlevels

Anotherimplicitassumptionisthatfeaturesthatvarycontinuouslyin the real world can be measured at specific fixed values. Eachdistinctvariationofanattributeiscalledalevel.For instance, suppose a course of medical treatment could be
pricedanywherebetween£2,000and£9,000.Severaldistinctpriceswouldbechosen tomeasure in thisrange,suchas:£2,000,£4,500,£6,800 and £9,000. These and only these get measured directly.Otherpointsinbetweenareestimatedbyinterpolation.Aswewillsee,inanyofthesemethods,choosingtherightpoints
tomeasure is critical. Youalsoneed to keep to as fewaspossiblethat measure what you need to know. This all arises from therequirementsofdesignedexperiments.
ThefeaturelevelwiththemostutilitywinsThe values of the various attributes and their variations or levelsaremeasuredinabstractunitscalledutilities.Theseareusedasakindofbookkeeping,asawayofmeasuringeverythingonthesamefooting.Thisleadstoanotherassumptionofthesemethods:thatthelevelofeachattributewiththehighestutilitywillwin inachoice.Thisdoesnotmeanthatpeoplelookatalltheattributes,orchoosecarefully.Italsodoesnotmeanthattheycognitivelyfollowautility-baseddecisionprocess.These methods are more usefully seen as aiming to match the
outcome of the decision process, rather than trying to decipherinnerworkings.Theydoassume,though,thatdecisionsatleastaregenerally consistent. Some methods provide measures of howconsistent people are when answering. Answers will passthresholds for being consistent in trade-off studies – if thoseinvolved understand what they need to do. Making these studiescleariscritical.
Whatthemethodsask–andget
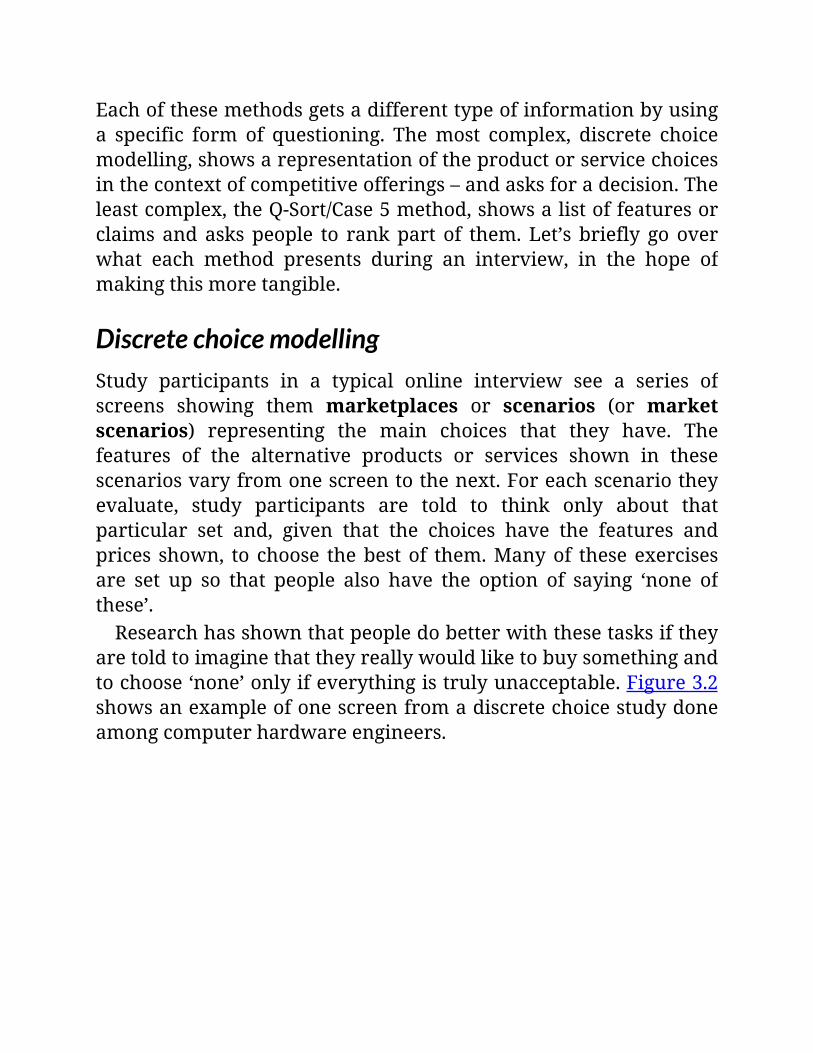
Eachofthesemethodsgetsadifferenttypeofinformationbyusinga specific form of questioning. Themost complex, discrete choicemodelling,showsarepresentationoftheproductorservicechoicesinthecontextofcompetitiveofferings–andasksforadecision.Theleastcomplex,theQ-Sort/Case5method,showsalistoffeaturesorclaimsandaskspeople to rankpart of them.Let’s briefly go overwhat each method presents during an interview, in the hope ofmakingthismoretangible.
DiscretechoicemodellingStudy participants in a typical online interview see a series ofscreens showing them marketplaces or scenarios (or marketscenarios) representing the main choices that they have. Thefeatures of the alternative products or services shown in thesescenariosvaryfromonescreentothenext.Foreachscenariotheyevaluate, study participants are told to think only about thatparticular set and, given that the choices have the features andprices shown, to choose thebestof them.Manyof theseexercisesare set up so that people also have the option of saying ‘none ofthese’.Researchhasshownthatpeopledobetterwiththesetasksifthey
aretoldtoimaginethattheyreallywouldliketobuysomethingandtochoose‘none’onlyifeverythingistrulyunacceptable.Figure3.2showsanexampleofonescreenfromadiscretechoicestudydoneamongcomputerhardwareengineers.
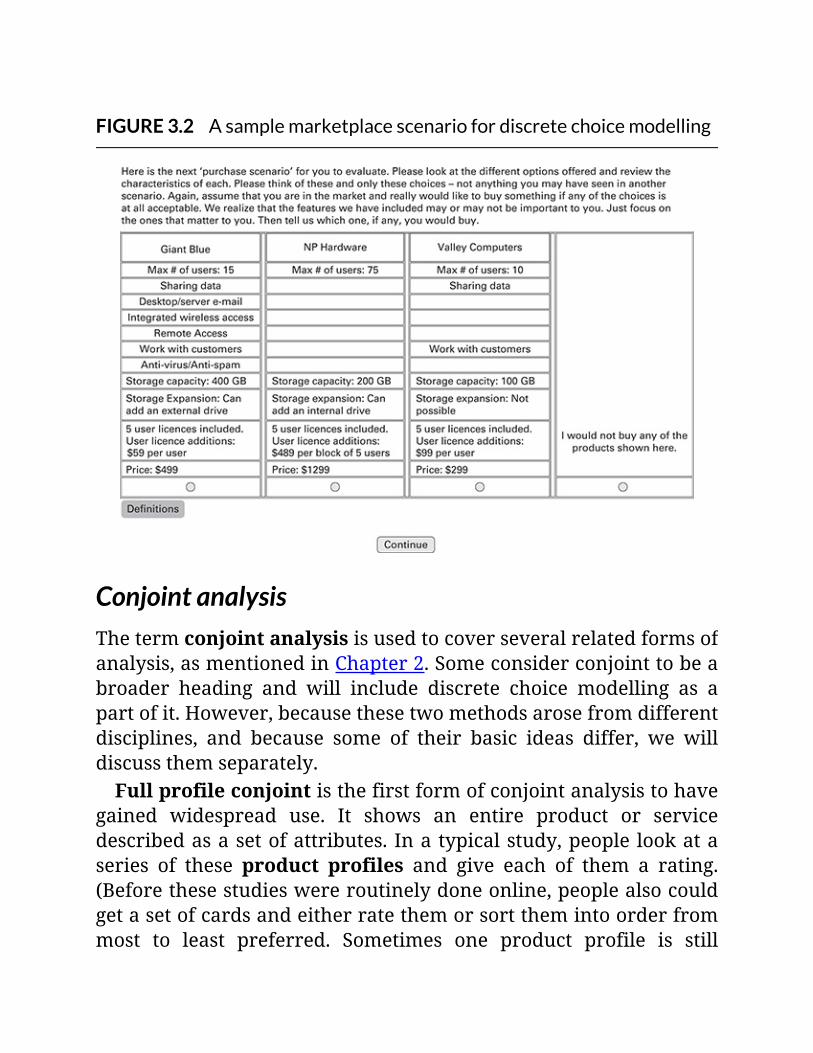
FIGURE3.2Asamplemarketplacescenariofordiscretechoicemodelling
ConjointanalysisThetermconjointanalysisisusedtocoverseveralrelatedformsofanalysis,asmentionedinChapter2.Someconsiderconjointtobeabroader heading and will include discrete choice modelling as apartofit.However,becausethesetwomethodsarosefromdifferentdisciplines, and because some of their basic ideas differ, we willdiscussthemseparately.Fullprofileconjointisthefirstformofconjointanalysistohave
gained widespread use. It shows an entire product or servicedescribedasasetofattributes. Inatypicalstudy,people lookataseries of these product profiles and give each of them a rating.(Beforethesestudieswereroutinelydoneonline,peoplealsocouldgetasetofcardsandeitherratethemorsortthemintoorderfrommost to least preferred. Sometimes one product profile is still

referredtoasonecard.)Figure3.3showsonescreenused ina fullprofileconjointstudy
aboutservicefromatelecomcompany.Thisstudydiagnosedwhichlevelsof service invariousareaswouldbeassociatedwithhigherlevelsofoverallcustomersatisfaction–andbyhowmuch.
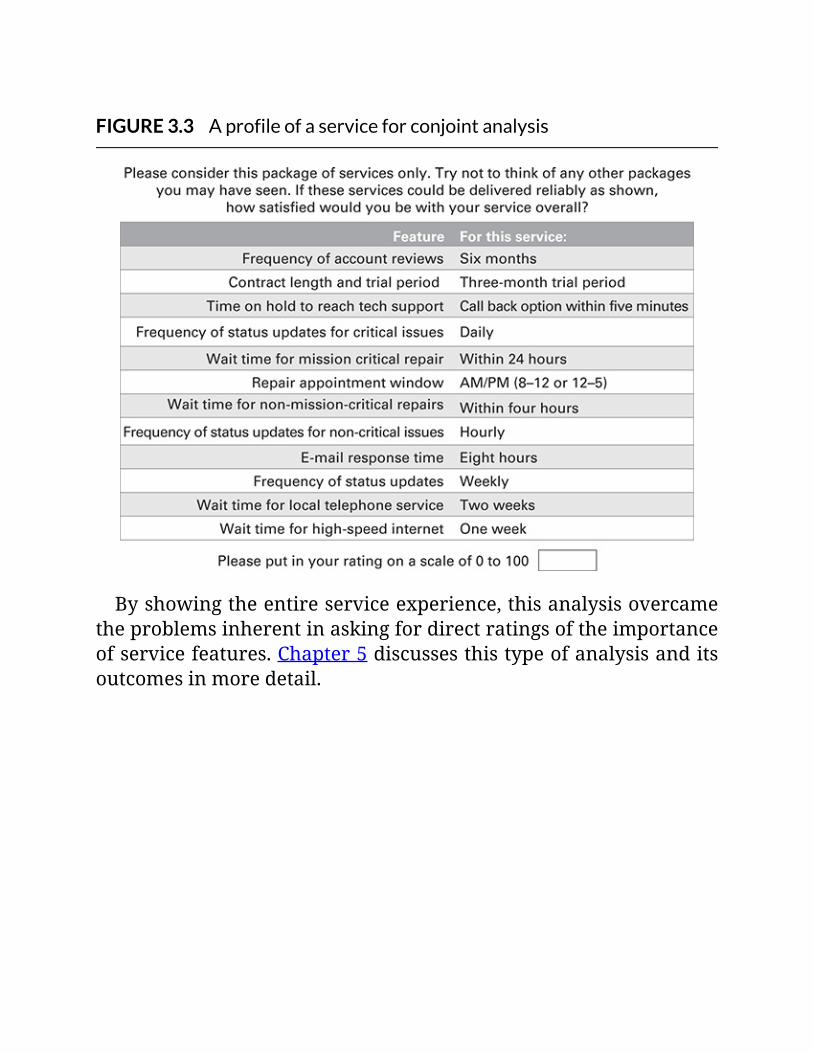
FIGURE3.3Aprofileofaserviceforconjointanalysis
Byshowingtheentireserviceexperience,thisanalysisovercametheproblemsinherentinaskingfordirectratingsoftheimportanceofservicefeatures.Chapter5discussesthistypeofanalysisanditsoutcomesinmoredetail.
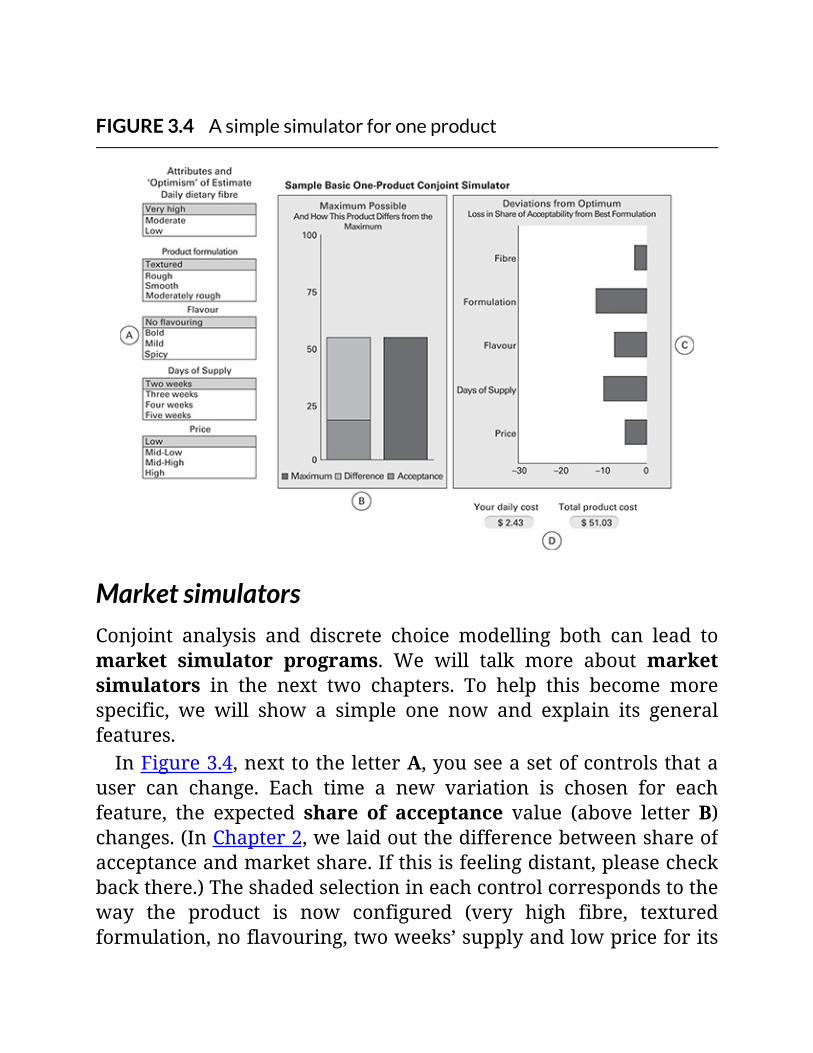
FIGURE3.4Asimplesimulatorforoneproduct
MarketsimulatorsConjoint analysis and discrete choice modelling both can lead tomarket simulator programs. We will talk more about marketsimulators in the next two chapters. To help this become morespecific, we will show a simple one now and explain its generalfeatures.InFigure3.4,nexttotheletterA,youseeasetofcontrolsthata
user can change. Each time a new variation is chosen for eachfeature, the expected share of acceptance value (above letterB)changes.(InChapter2,welaidoutthedifferencebetweenshareofacceptanceandmarketshare.Ifthisisfeelingdistant,pleasecheckbackthere.)Theshadedselectionineachcontrolcorrespondstotheway the product is now configured (very high fibre, texturedformulation,noflavouring,twoweeks’supplyandlowpriceforits
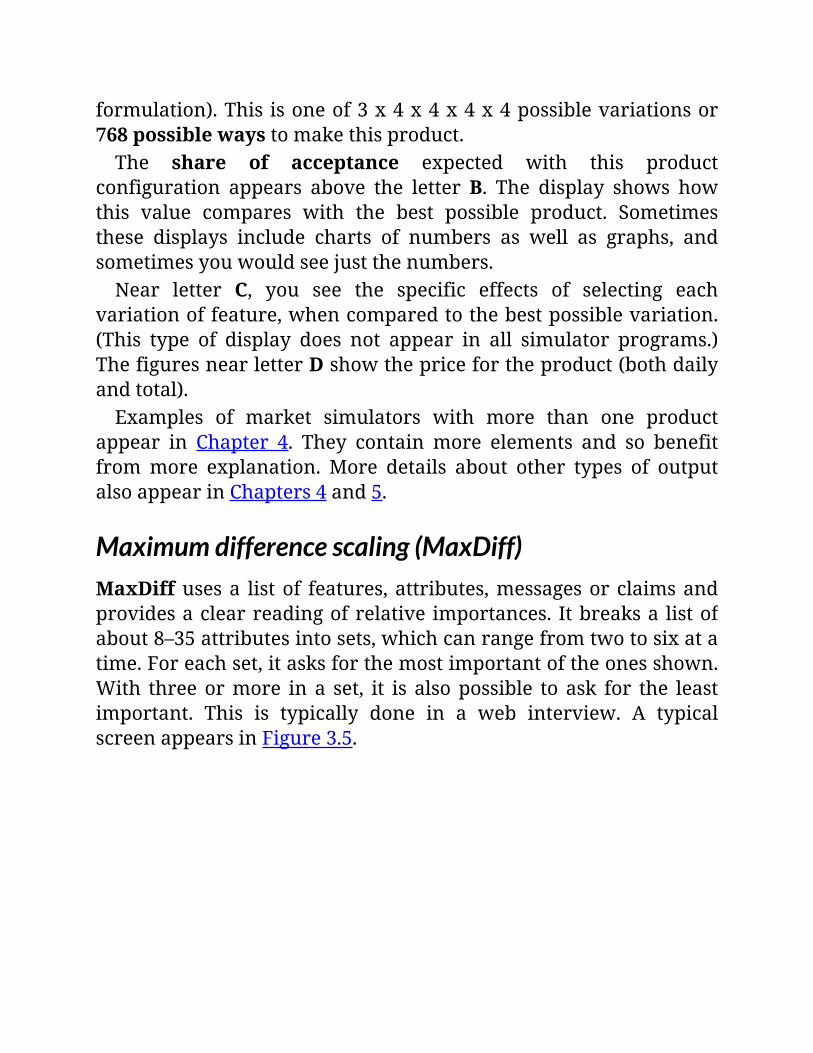
formulation).This isoneof3x4x4x4x4possiblevariationsor768possiblewaystomakethisproduct.The share of acceptance expected with this product
configuration appears above the letterB. The display shows howthis value compares with the best possible product. Sometimesthese displays include charts of numbers as well as graphs, andsometimesyouwouldseejustthenumbers.Near letter C, you see the specific effects of selecting each
variationoffeature,whencomparedtothebestpossiblevariation.(This type of display does not appear in all simulator programs.)ThefiguresnearletterDshowthepricefortheproduct(bothdailyandtotal).Examples of market simulators with more than one product
appear in Chapter 4. They containmore elements and so benefitfrommore explanation. More details about other types of outputalsoappearinChapters4and5.
Maximumdifferencescaling(MaxDiff)MaxDiffusesa listof features,attributes,messagesor claimsandprovidesaclearreadingofrelative importances. Itbreaksa listofabout8–35attributesintosets,whichcanrangefromtwotosixatatime.Foreachset,itasksforthemostimportantoftheonesshown.With threeormore in a set, it is alsopossible to ask for the leastimportant. This is typically done in a web interview. A typicalscreenappearsinFigure3.5.
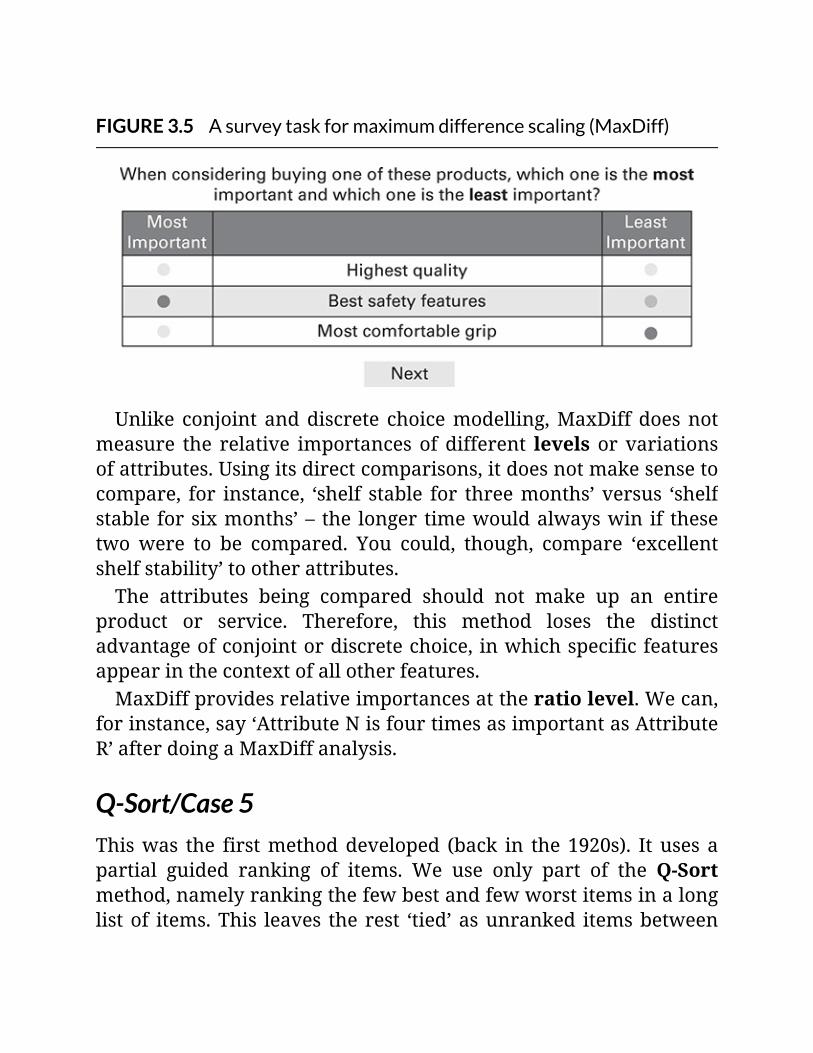
FIGURE3.5Asurveytaskformaximumdifferencescaling(MaxDiff)
Unlike conjoint anddiscrete choicemodelling,MaxDiffdoesnotmeasure the relative importances of different levels or variationsofattributes.Usingitsdirectcomparisons,itdoesnotmakesensetocompare, for instance, ‘shelf stable for threemonths’versus ‘shelfstable forsixmonths’– the longer timewouldalwayswin if thesetwo were to be compared. You could, though, compare ‘excellentshelfstability’tootherattributes.The attributes being compared should not make up an entire
product or service. Therefore, this method loses the distinctadvantageofconjointordiscretechoice,inwhichspecificfeaturesappearinthecontextofallotherfeatures.MaxDiffprovidesrelativeimportancesattheratiolevel.Wecan,
forinstance,say‘AttributeNisfourtimesasimportantasAttributeR’afterdoingaMaxDiffanalysis.
Q-Sort/Case5Thiswas the firstmethoddeveloped (back in the 1920s). It uses apartial guided ranking of items. We use only part of the Q-Sortmethod,namelyrankingthefewbestandfewworstitemsinalonglistof items.This leaves therest ‘tied’asunranked itemsbetween
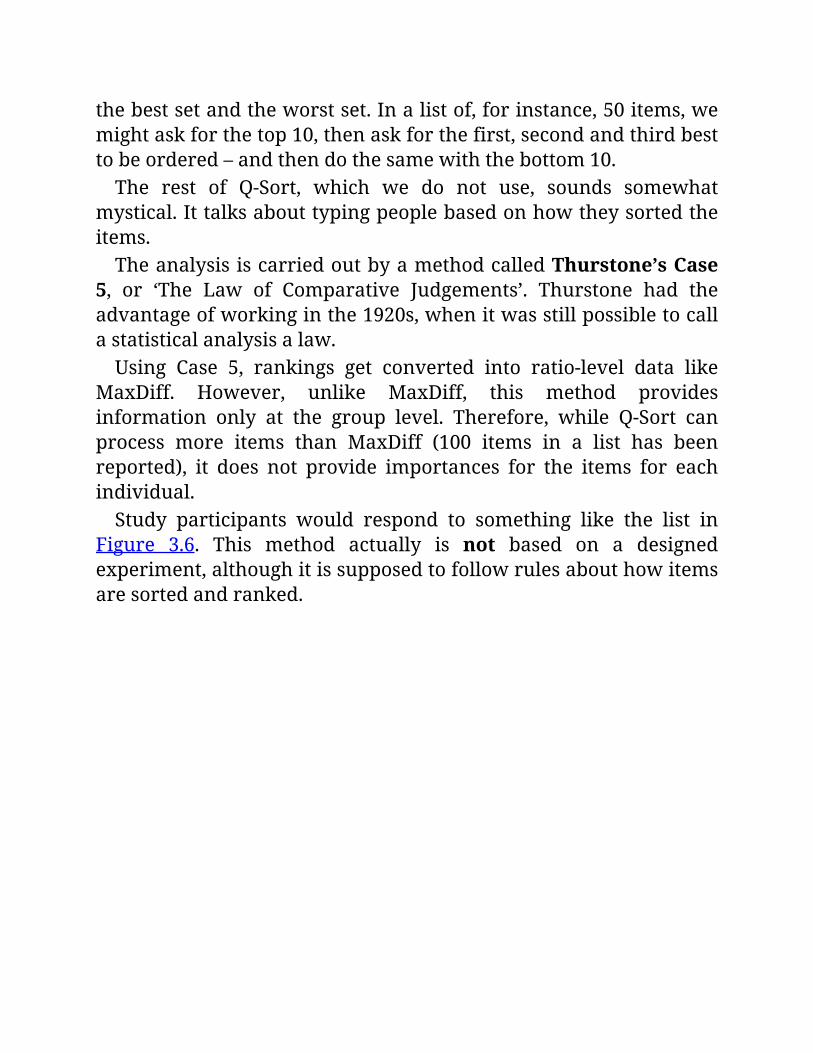
thebestsetandtheworstset.Inalistof,forinstance,50items,wemightaskforthetop10,thenaskforthefirst,secondandthirdbesttobeordered–andthendothesamewiththebottom10.The rest of Q-Sort, which we do not use, sounds somewhat
mystical.Ittalksabouttypingpeoplebasedonhowtheysortedtheitems.TheanalysisiscarriedoutbyamethodcalledThurstone’sCase
5, or ‘The Law of Comparative Judgements’. Thurstone had theadvantageofworkinginthe1920s,whenitwasstillpossibletocallastatisticalanalysisalaw.Using Case 5, rankings get converted into ratio-level data like
MaxDiff. However, unlike MaxDiff, this method providesinformation only at the group level. Therefore, while Q-Sort canprocess more items than MaxDiff (100 items in a list has beenreported), it does not provide importances for the items for eachindividual.Study participants would respond to something like the list in
Figure 3.6. This method actually is not based on a designedexperiment,althoughitissupposedtofollowrulesabouthowitemsaresortedandranked.
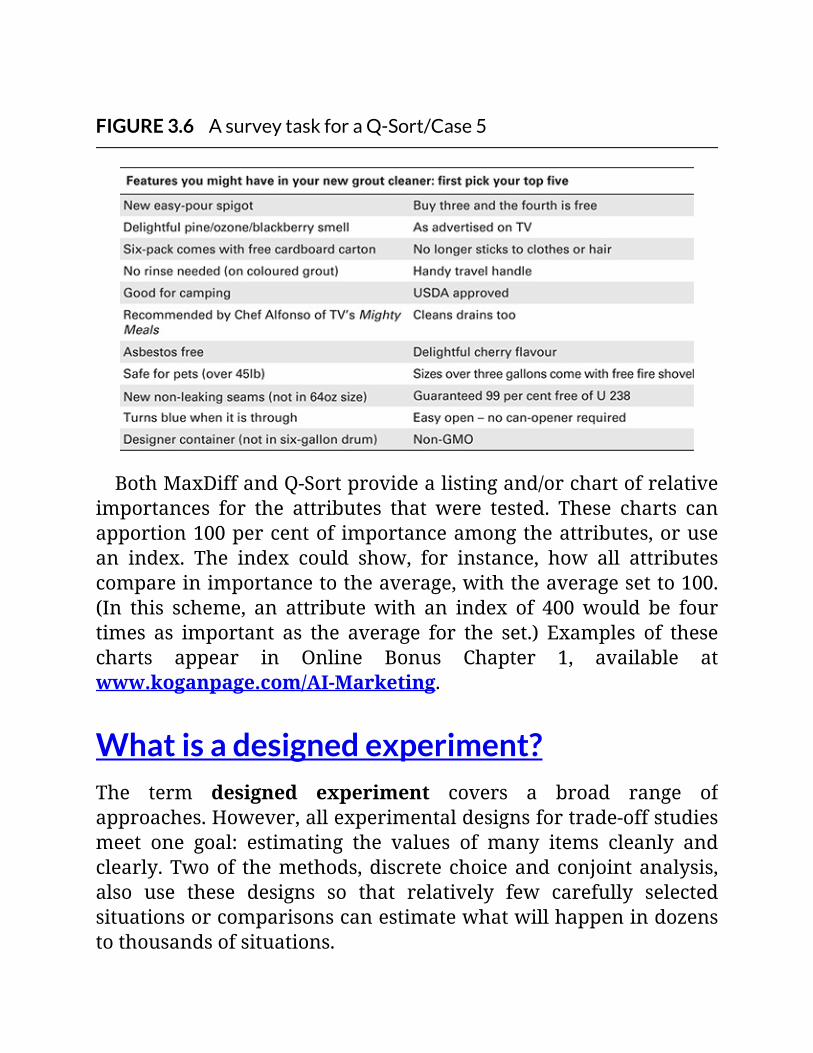
FIGURE3.6AsurveytaskforaQ-Sort/Case5
BothMaxDiffandQ-Sortprovidealistingand/orchartofrelativeimportances for the attributes that were tested. These charts canapportion100percentof importanceamongtheattributes,orusean index. The index could show, for instance, how all attributescompareinimportancetotheaverage,withtheaveragesetto100.(In this scheme, an attributewith an index of 400would be fourtimes as important as the average for the set.) Examples of thesecharts appear in Online Bonus Chapter 1, available atwww.koganpage.com/AI-Marketing.
Whatisadesignedexperiment?The term designed experiment covers a broad range ofapproaches.However,allexperimentaldesignsfortrade-offstudiesmeet one goal: estimating the values of many items cleanly andclearly.Twoof themethods,discretechoiceandconjointanalysis,also use these designs so that relatively few carefully selectedsituationsorcomparisonscanestimatewhatwillhappenindozenstothousandsofsituations.
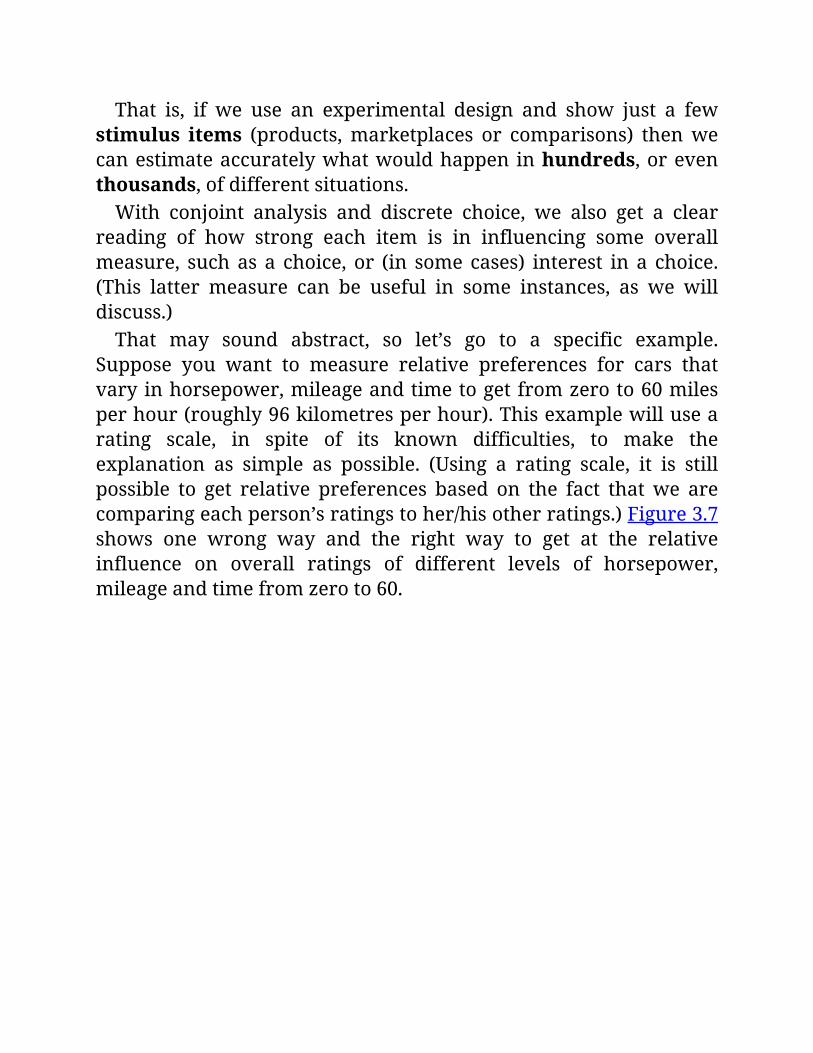
That is, if we use an experimental design and show just a fewstimulus items (products,marketplaces or comparisons) thenwecanestimateaccuratelywhatwouldhappeninhundreds,oreventhousands,ofdifferentsituations.With conjoint analysis and discrete choice, we also get a clear
reading of how strong each item is in influencing some overallmeasure, suchas a choice, or (in some cases) interest in a choice.(This latter measure can be useful in some instances, as we willdiscuss.)That may sound abstract, so let’s go to a specific example.
Suppose you want to measure relative preferences for cars thatvaryinhorsepower,mileageandtimetogetfromzeroto60milesperhour(roughly96kilometresperhour).Thisexamplewillusearating scale, in spite of its known difficulties, to make theexplanation as simple as possible. (Using a rating scale, it is stillpossible to get relative preferences based on the fact thatwe arecomparingeachperson’sratingstoher/hisotherratings.)Figure3.7shows one wrong way and the right way to get at the relativeinfluence on overall ratings of different levels of horsepower,mileageandtimefromzeroto60.
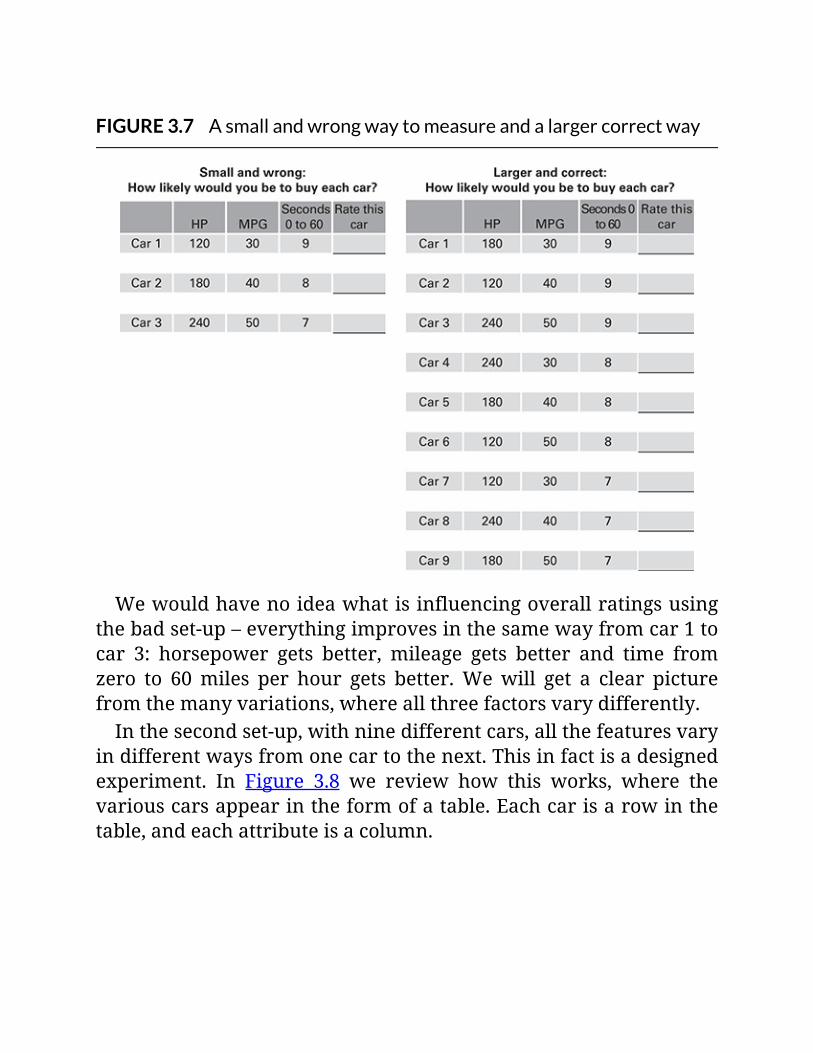
FIGURE3.7Asmallandwrongwaytomeasureandalargercorrectway
Wewouldhavenoideawhatisinfluencingoverallratingsusingthebadset-up–everythingimprovesinthesamewayfromcar1tocar 3: horsepower gets better, mileage gets better and time fromzero to 60miles per hour gets better.Wewill get a clear picturefromthemanyvariations,whereallthreefactorsvarydifferently.Inthesecondset-up,withninedifferentcars,allthefeaturesvary
indifferentwaysfromonecartothenext.Thisinfactisadesignedexperiment. In Figure 3.8 we review how this works, where thevariouscarsappearintheformofatable.Eachcarisarowinthetable,andeachattributeisacolumn.
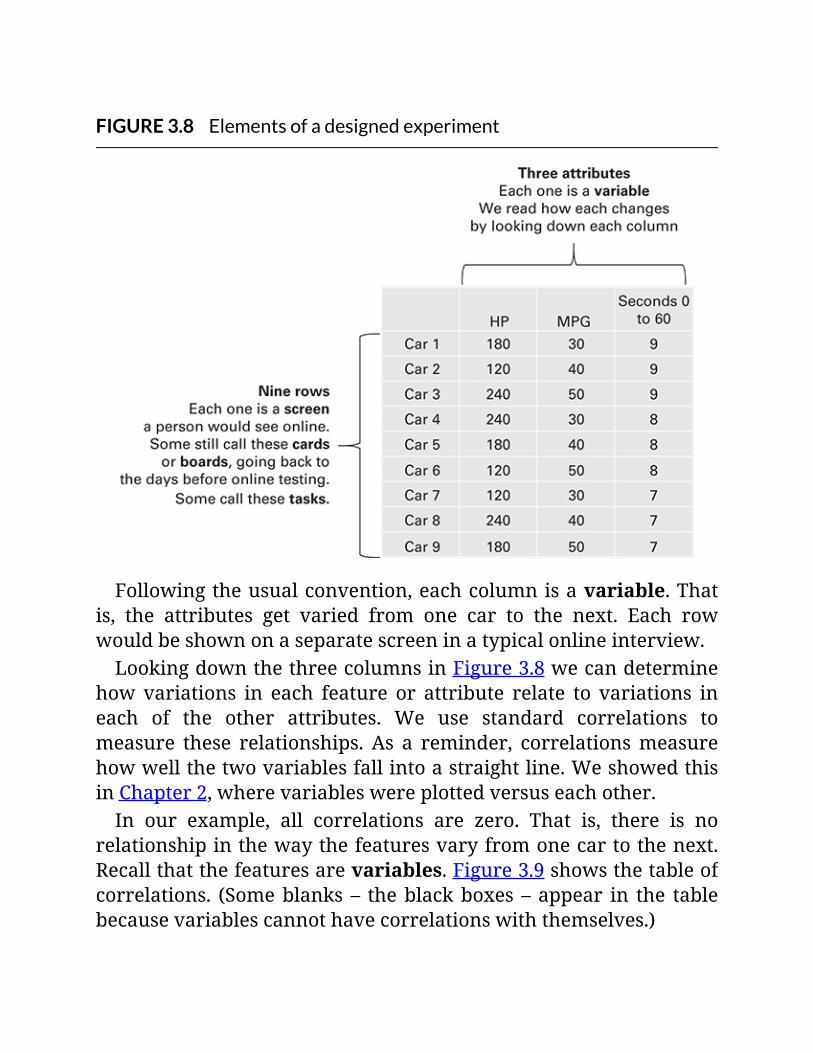
FIGURE3.8Elementsofadesignedexperiment
Followingtheusualconvention,eachcolumnisavariable.Thatis, the attributes get varied from one car to the next. Each rowwouldbeshownonaseparatescreeninatypicalonlineinterview.LookingdownthethreecolumnsinFigure3.8wecandetermine
howvariations in each feature or attribute relate to variations ineach of the other attributes. We use standard correlations tomeasure these relationships. As a reminder, correlationsmeasurehowwellthetwovariablesfallintoastraightline.WeshowedthisinChapter2,wherevariableswereplottedversuseachother.In our example, all correlations are zero. That is, there is no
relationshipinthewaythefeaturesvaryfromonecartothenext.Recallthatthefeaturesarevariables.Figure3.9showsthetableofcorrelations. (Someblanks – theblackboxes –appear in the tablebecausevariablescannothavecorrelationswiththemselves.)
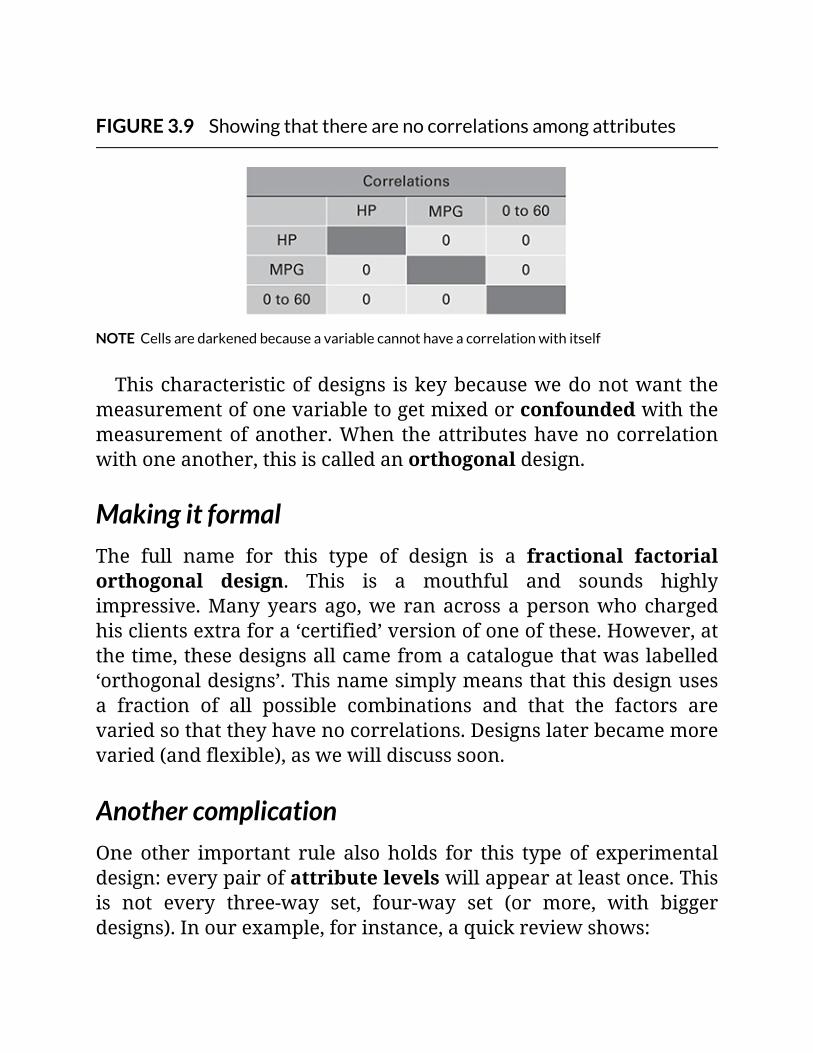
FIGURE3.9Showingthattherearenocorrelationsamongattributes
NOTECellsaredarkenedbecauseavariablecannothaveacorrelationwithitself
Thischaracteristicofdesigns iskeybecausewedonotwant themeasurementofonevariabletogetmixedorconfoundedwiththemeasurementofanother.When theattributeshavenocorrelationwithoneanother,thisiscalledanorthogonaldesign.
MakingitformalThe full name for this type of design is a fractional factorialorthogonal design. This is a mouthful and sounds highlyimpressive.Manyyearsago,we ranacrossapersonwhochargedhisclientsextrafora‘certified’versionofoneofthese.However,atthetime,thesedesignsallcamefromacataloguethatwaslabelled‘orthogonaldesigns’.Thisnamesimplymeansthatthisdesignusesa fraction of all possible combinations and that the factors arevariedsothattheyhavenocorrelations.Designslaterbecamemorevaried(andflexible),aswewilldiscusssoon.
AnothercomplicationOne other important rule also holds for this type of experimentaldesign:everypairofattributelevelswillappearatleastonce.Thisis not every three-way set, four-way set (or more, with biggerdesigns).Inourexample,forinstance,aquickreviewshows:

120HPappearswith30,40and50MPGeachatleastonce;thesameholdsfor150HPand180HP–eachappearswitheachMPGatleastonce;also,120HPappearsatleastoncewith7,8or9secondsto60;andthesameholdsfor150HPand180HPversuseachtimeto60–andsoon.
Gettingeverythingrighttakesalotofwork.Atonetime,thiskeptalotofgraduatestudentsfullyoccupiedastheyworkedtowardstheirdegrees. These designs went into catalogues, which had to besearched forbestdesign for the taskathand. (Wewill get tohowyou decide on a design shortly.) Fortunately, any relatively newcomputercaneasilycrankoutthesedesigns,makingcustomonestofitnewsituations.
ThegreatmeasurementpowerofexperimentsTwo examples will show why we bother with experiments. Forinstance, suppose you had a product with six attributes, eachhaving three levels, and one attribute with six levels. This wouldmeanthatyoucouldhave:3x3x3x3x3x3x6orsome4,374possiblevariationsonthisproduct.Using an experimental design, we can accurately estimate the
value of all 4,374 possible variations using only 18 productdescriptions.Next, suppose you have a product with 18 two-level attributes
(thesecouldbe‘featureisthere’versus‘featureisabsent’or‘colourisred’versus‘colourisblue’,forinstance).Thiswouldgiveyou218
(2tothe18thpower)or262,144combinations.Youcanmeasureallthese possible combinations using only 20 carefully selectedproductdescriptions.

Evenmorecombinationscanbetestedandcomparedinrealtimeusing amarket simulator program. These run under MicrosoftExcel(ormorerarely,PowerPointorinAdobeAcrobatPDFformat)andfeatureeasy-to-usecontrols.(YourcomputeralsoneedstohaveFlash Player installed for the PowerPoint and PDF versions towork.)WediscusssimulatorsinChapters4and5.
Designedexperimentsallowyoutomeasuretheeffectsofvaryingmanyattributesaccuratelyandcleanly.Usedwithdiscretechoicemodellingandconjoint,theyalsoallowyoutoaccuratelyforecastresponsestodozensoreventhousandsofalternativeproduct/serviceconfigurationsbyshowingjustasmallscientificallyselectedsubset.Designedexperimentshavetremendouspower.Forinstance,with18two-levelattributes,youcandeterminetheworthof262,144possiblecombinationsusingonly20experimentallydesignedproductconfigurations.
WhatyoumeasureandthesizeofexperimentsThemoreattributesandvariationsofattributes(orlevels)thatyouneedtomeasure,thelargeryourexperimentneedstobecome.Thatis, as you varymore attributes and levels, youwill need to showpeople more screens or pages with varying products. But howmany?Thisisaroughruleofthumb–theexactformulaisalittlemore
complicated.AswedidinFigure3.8,belowweexpressthisbothasrowsinadesignorasscreensthatyouneedtoshowwithdifferentproducts:
two-levelattribute:onerowinadesignorscreenshown;three-levelattribute:tworowsorscreensshown;four-levelattribute:threerowsorscreensshown;five-levelattribute:fourrowsorscreensshown;six-levelattribute:fiverowsorscreensshown.
Andthenweneedtoconsiderabitmore.Weneedtwomorerowsorscreens:
Oneformeasuringtheerrorinthemodel.Thisallowsustoknowhowwellwearemeasuring–basicallyhowconsistenteachpersonwasinanswering.Otherwise,whenwerunthemodel,thiswillbereportedas100percentregardlessofhowwellpeopledidwhenanswering.Oneforaveryusefultermcalledtheconstant.Thishas
mathematicalmeaning,butwecanuseittomeasurethevalueofthebrandorthechoiceoutsidetheattributesbeingtested.
Onelastwrinkle
Youmustcountthenumberofvariationsorlevelsineachattributeandcheck thedesignagainst these.Thedesignmustbeat leastasbigastheproductorthetwoattributeswiththemostlevels.Inourexample,threethree-levelattributeswouldsuggestthatweneed3x2 or six screens, plus our two extra formeasuring error and theconstant, or eight. However, we must have at least 3 x 3 (theproductofthetwoattributeswiththemostlevels)orninescreens.
Gettingmorefromexperiments:HBtotherescueIt is a sad but definite fact that people tire quickly of evaluatingalternativeproducts ormarketplaces.Depending on the audience,this could start as soon as six or eight being shown. (When studyparticipantsareveryinvolvedwiththeproductorservice,andhavegoodabilitytoconcentrate,theycancompleteupto21orsobeforetheygettootired.Engineersandfarmershavedoneverywellwithevaluatingagreatmanyalternatives.)Whenexperimentsgottoolarge,measuringmanyattributesand
levels, one strategywas to splitup thedesign, givinga fraction toeach person, and then adding more people to compensate. Forinstance,aclientgoesnearlycrazyandwantsthis:
sixfour-levelattributes;sixthree-levelattributes;twelvetwo-levelattributes.
Wewouldneed48screenstomeasurethis.Thisofcourseisfartoomany to show in its entirety to one person without some illegal
stimulativesubstances.Theoldsolutionwastoshoweachpersonafraction of these, for instance 12 of the 48 required, and thenmultiply the number of study participants to make up for it.Showingone-quarterofall thescreenstoeach,wewouldmultiplystudyparticipantbyfour.That is,eachpersoncountedasone-fourthofatotalexperiment
or replication. To get to the right number of experiments toanalyse,wejustincreasedthecountofpeople.InChapter4wetalkabouthowmanypeopleyouneedtomeasure.Withchoicemodels,addingmorepeoplelikethisworked!But it
madeformuchbiggerandcostlierstudies.Splittingupdesignsfortraditional full-profile conjoint was highly messy and likely toexplode. Clearly, as demand increased for more complex andrealistic representations of products and services, we neededsomethingbetter.
EnterHBanalysisHierarchicalBayesian(HB)analysiswasdevelopedinthe1990stoaddress the above problem. It is amachine learningmethod thatstretches howmuch we canmeasure in trade-off studies, relyingupon immense numbers of calculations and some fairly mind-bogglingconcepts.Fortunately, ithasbeenprovenunderfire–forover25years.WithHB,wecanmeasureuptofourtimesasmanyattributesin
choice models/conjoint as we could before this method wasdeveloped.Wecould,forinstance,reasonablysplita48-screentaskinto12-tasksets,showeachpersonone12-tasksetandnotincreasethe sample. (Pleasenote that someauthorities say you shouldnottryformorethanatwofoldincreaseorthree-foldincreaseinwhatyoumeasurebeforeyoucompensateby increasing thenumberofpeopleyouinterview.)As a big bonus, we also could get data for individuals from
discrete choice models (and MaxDiff studies). That was never
possible before HB. All answers could be only for groups. Thosewerethebadolddays.
ButwhatisHBanalysis?
Briefly, HB analysis fills in data that is scant or missing for arespondent by repeatedly borrowing estimates from otherrespondents. That is, it keeps sampling other respondents andstoringvalues fromthosewhohave themissing information, thenrunningcalculations. Itusuallydoes this20,000ormore times foreachattributelevelforeachrespondent,keepingarunningaverageofitsestimates.It may or may not compare the respondent to the sample it is
drawing and make adjustments based on their similarities.Estimates will settle down to steady values (or converge) if youhavesetuptheproblemcorrectly.Ifyouhavenot,thenmaybetheywillnot–andyouneedtorootoutproblems.Asolutionthatdoesnot converge usually means errors in set-up, data collection orcodingofvalues.This method gives your PC (or Mac) more of a workout than
almostanythingelseyoumightaskittodo.Unlikenearlyanyothertaskwethrowatacomputer,theseanalyseswillleaveyouwaiting.It could take many minutes for a complicated discrete choicemodellingruntofinish,evenhours.
HBanalysis:itworksandit’snotmagic
HierarchicalBayesian(HB)analysisisamachinelearningmethodthatallowsustogeneratefarmoreinformationfromadesignedexperimentthanformerlywaspossible.Thisallowsustomeasuremoreattributesandattributelevelsthanusedtobepossibleforaspecificnumberofmarketplaces(orproducts)showninastudy.Someexpertssaythisisabouttwiceasmuch,butabout25years’experienceshowsthatwecansafelymeasurethreetofourtimesasmanyasusedtobepossible.Inthebadolddays,ifweneededtorunanexperimentrequiringustoshow48screensof
marketplacesintotal,wewouldhaveneededtoboostoursamplebythreetimesifweshowedeachperson16ofthese.WithHB,wegetalmostexactlythesameresultwithnoincreaseinsample.Andwegetdataforeachindividual.Thissoundslikesorcery,butitworks,relyingonthepowerofthecomputerdoingmany
millionsofcalculationstoreachananswer.
Amazingly, all this borrowing of informationworks – andwe gethighly accurate estimates. It seems almost supernatural and evensomewhatsuspect,butwithHBanalysisweencounteronesituationwherewecangetmuchmorethankstothegreatpowerofmoderncomputers.Wecouldargueaboutcounting thisasartificial intelligence,but
youwillnote thatwehave called it amachine learningmethod.Thatis,thecomputerstorescalculationsandincorporatesthemintolater ones, thus learning fromwhat it has done.Wewill get intowhatmakesanalysesBayesianinmoredetailinlaterchapters.Fornow, this has to dowith theway that later estimates incorporateandmodifyearlierones.
Abrieftalkaboutorigins
TheoriginsandevolutionofdiscretechoicemodellingWork on discrete choice modelling started in the 1960s. DanielMcFaddeneventuallywonaNobelPrizeineconomicsforthiswork.(This appears to be the onlymethodwe discuss anywhere in this
bookthathasthisdistinction.)The first widely cited application of discrete choice modelling,
published around 1980, answered this question: How we canpredictchoiceswhenthealternativesdonothaveanyattributesincommon? This was in transportation, where the choices weretakingatrain,busorcartowork.Theauthorsaimedtodeterminethe factors thatwould inclinepeoplemore towardschoosingeachtypeoftransportation.The three choiceshavenocommonattributesexcept timedoor-
to-door. For instance, you do not care about the cost of parkingdowntownifyoutakethetraintowork,orthefareonatrainifyouaretakingabus–andsoon.Analysingchoiceswithoutcommonattributesposedmanythorny
problems,involvingdifficultiesthatcanscarcelybeimagineduntilyouseetheproofsinvolved.Fortunatelyforallofus,themethodisonasolidfooting.Andthestudyworked!Andindeed,thismethodhasaremarkablystrongtrackrecordas
well as excellent theoretical underpinnings. It remains the mostrealistic andmost predictivemethod for determining the specificattributes and variations in attributes that influence consumerdecisions–andhowmuchinfluencethoseattributeshave.
ConjointanalysisfromstarttoitsmanyvarietiesConjoint analysis was developed in the 1970s by marketresearchers, largely due to frustration with the poor predictiveabilityofscaledimportanceratings.Aswementioned,theseratingsdonotworkwellaspredictorsofbehaviourinnearlyallinstances.They are generally unreliable, in that their connection to whatpeoplewillactuallychooseistenuousatbest.One possible exception, just to remain fair, would occur if you
havea lotofhistoricalsalesdata,a lotofhistoricalratingsdata,aproduct or service category that is not changing, and consumerswhoarenotchanging.Asyoumightguess–thisisnottoolikely.

Conjoint proved it was better than scaled ratings in real-worldapplications, even in its earliest incarnations. It was rapidly andwidely adopted. Early conjoint (before about 1970) looked a littlelikemagicsquares–peopleputnumbersinboxesrankingpairsofattributelevelsasinthesampleinFigure3.10.
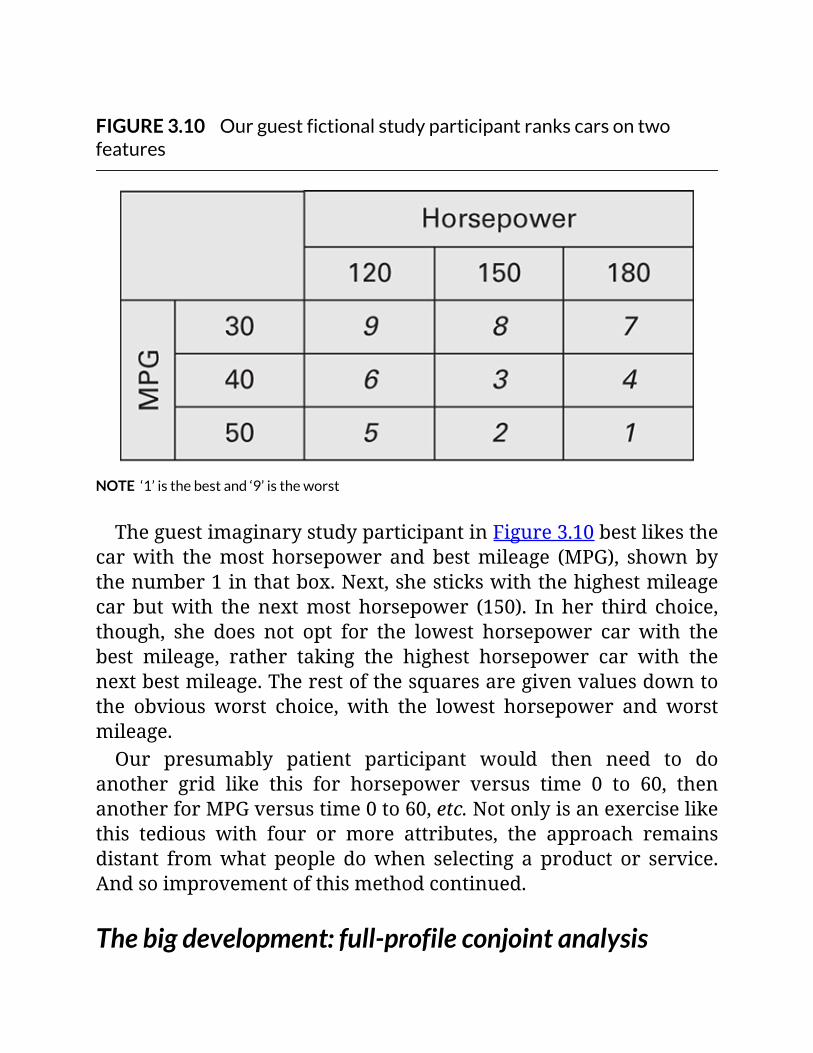
FIGURE3.10Ourguestfictionalstudyparticipantrankscarsontwofeatures
NOTE‘1’isthebestand‘9’istheworst
TheguestimaginarystudyparticipantinFigure3.10bestlikesthecarwith themost horsepower and bestmileage (MPG), shownbythenumber1inthatbox.Next,shestickswiththehighestmileagecar butwith the nextmost horsepower (150). In her third choice,though, she does not opt for the lowest horsepower car with thebest mileage, rather taking the highest horsepower car with thenextbestmileage.Therestofthesquaresaregivenvaluesdowntothe obvious worst choice, with the lowest horsepower and worstmileage.Our presumably patient participant would then need to do
another grid like this for horsepower versus time 0 to 60, thenanotherforMPGversustime0to60,etc.Notonlyisanexerciselikethis tedious with four or more attributes, the approach remainsdistant fromwhat people dowhen selecting a product or service.Andsoimprovementofthismethodcontinued.
Thebigdevelopment:full-profileconjointanalysis
Thisformofconjointarrivedinthemid-1970s.Itshowsaseriesofwhole products or services and asks the study participant toevaluate each in turn. Because it shows full descriptions of aproduct, it has the name full profile. Respondents typically ratetheseproductprofiles,or(veryrarelynow)sortandrankthem.This was immediately hailed as a great advance and gained
widespreadadoption.Itoftenworkedwell,particularlywithwidelyknown brands that were similar to each other. But it also brokedown mysteriously in other situations – and as these wereunderstoodbetter,theuseofdiscretechoicemodellingrose.Also, with standard analytical tools, the ability of conjoint
analysis tomeasurewasquite limited.Moststudiesstucktosixorsevenattributesatmost,withjustafewvariationsofeach.As mentioned above, HB analysis broke the barriers on how
manyattributesandlevelsmightbetested.Beforethismethodwasdeveloped fully (around 1990), a number of alternative forms ofconjointanalysisattemptedtodealwiththeselimitations.Perhapsbestknownamong thesewasasoftwareproductcalled
AdaptiveConjointAnalysis(ACA).Thistookeachpersondownaslightly different route based on what they said about what theyfound acceptable before seeing any product profiles. Thismethodreceived some strong criticism, with some justified complaintsabouttheassumptionsbehindit.Thatis,concernswerevoicedaboutthelackofrealisminvolved
in pulling attributes out of a product and asking forwhich levelswereacceptable,withoutseeinghowtheyfitwiththeotherfeaturesoftheproduct.Forinstance,youmightsayoffthetopofyourheadthatyouwouldneverbuyacondominiumwithabalcony(perhapsfor fear of being mistakenly serenaded at midnight by somewanderingRomeo).However,ifyoufoundacondothatwasperfectinallotherregards,youmight thendecidethatyoucouldput thisfearasideandbuyitafterall.Sotherewerecredibleobjectionsaboutbothcalculationsandthe
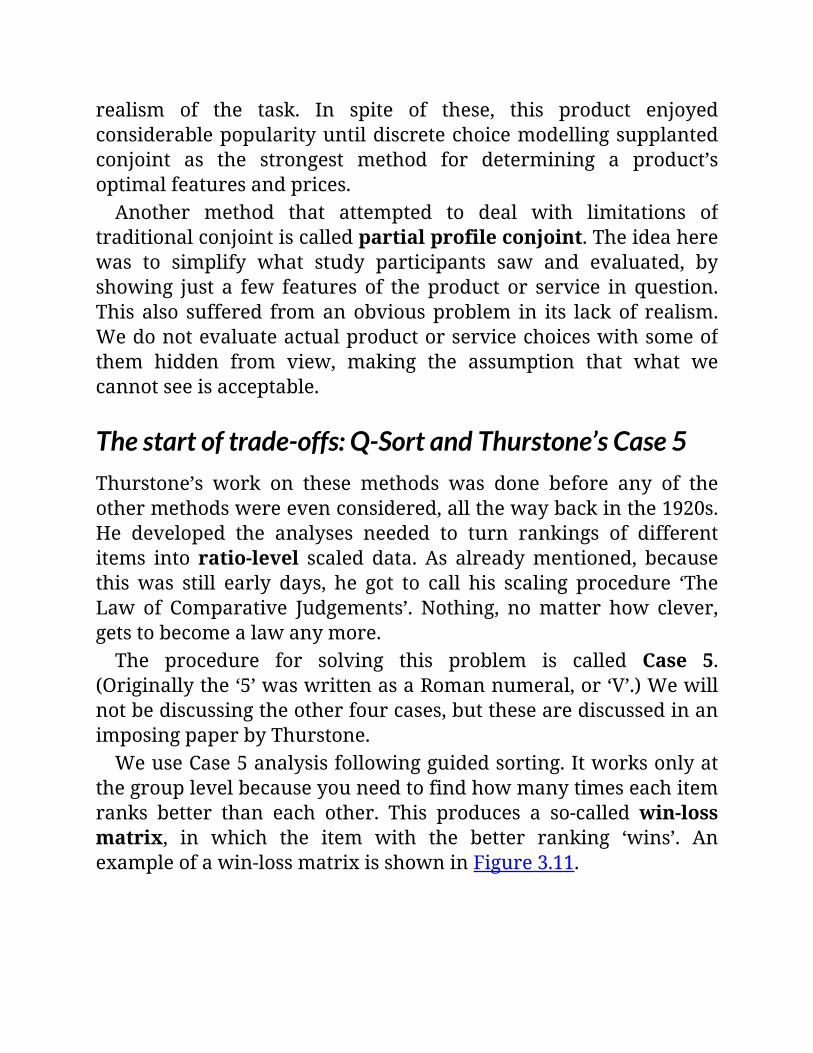
realism of the task. In spite of these, this product enjoyedconsiderablepopularityuntildiscretechoicemodellingsupplantedconjoint as the strongest method for determining a product’soptimalfeaturesandprices.Another method that attempted to deal with limitations of
traditionalconjointiscalledpartialprofileconjoint.Theideaherewas to simplify what study participants saw and evaluated, byshowing just a few features of the product or service in question.This also suffered fromanobviousproblem in its lackof realism.Wedonotevaluateactualproductorservicechoiceswithsomeofthem hidden from view, making the assumption that what wecannotseeisacceptable.
Thestartoftrade-offs:Q-SortandThurstone’sCase5Thurstone’s work on these methods was done before any of theothermethodswereevenconsidered,allthewaybackinthe1920s.He developed the analyses needed to turn rankings of differentitems into ratio-level scaled data. As alreadymentioned, becausethis was still early days, he got to call his scaling procedure ‘TheLaw of Comparative Judgements’. Nothing, nomatter how clever,getstobecomealawanymore.The procedure for solving this problem is called Case 5.
(Originallythe‘5’waswrittenasaRomannumeral,or‘V’.)Wewillnotbediscussingtheotherfourcases,butthesearediscussedinanimposingpaperbyThurstone.WeuseCase5analysisfollowingguidedsorting.Itworksonlyat
thegrouplevelbecauseyouneedtofindhowmanytimeseachitemranks better than each other. This produces a so-calledwin-lossmatrix, in which the item with the better ranking ‘wins’. Anexampleofawin-lossmatrixisshowninFigure3.11.
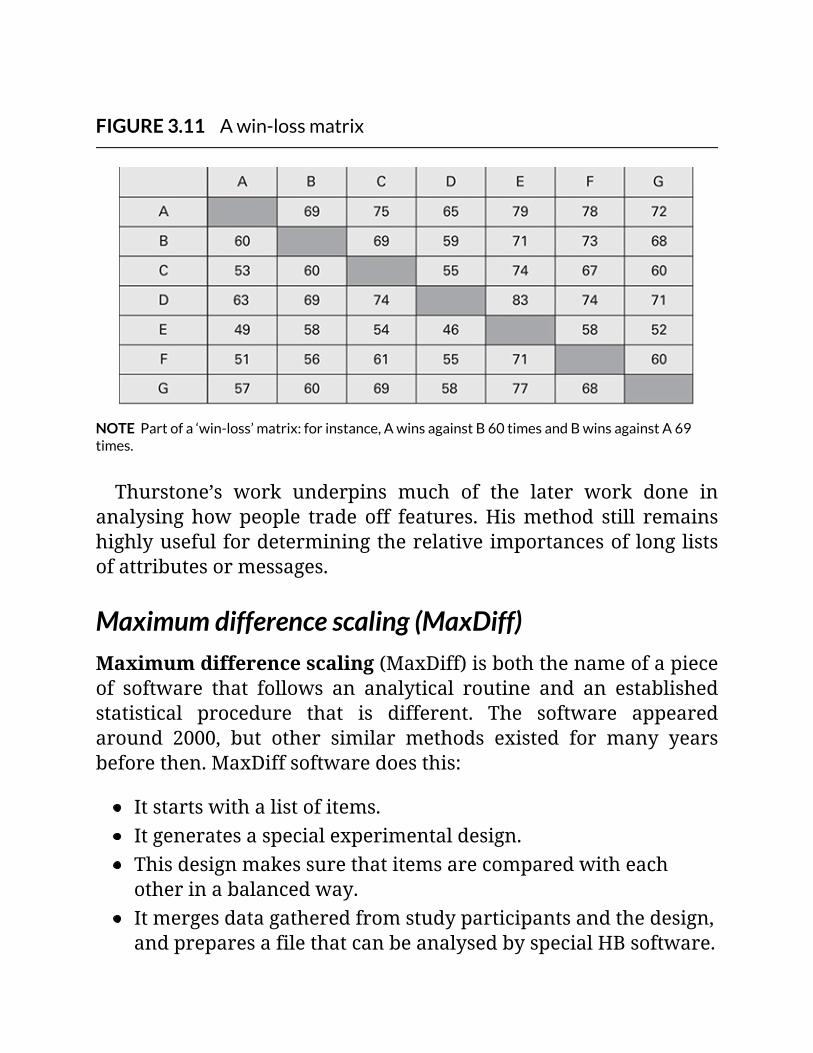
FIGURE3.11Awin-lossmatrix
NOTEPartofa‘win-loss’matrix:forinstance,AwinsagainstB60timesandBwinsagainstA69times.
Thurstone’s work underpins much of the later work done inanalysing howpeople trade off features.Hismethod still remainshighlyusefulfordeterminingtherelativeimportancesoflonglistsofattributesormessages.
Maximumdifferencescaling(MaxDiff)Maximumdifferencescaling(MaxDiff)isboththenameofapieceof software that follows an analytical routine and an establishedstatistical procedure that is different. The software appearedaround 2000, but other similar methods existed for many yearsbeforethen.MaxDiffsoftwaredoesthis:
Itstartswithalistofitems.Itgeneratesaspecialexperimentaldesign.Thisdesignmakessurethatitemsarecomparedwitheachotherinabalancedway.Itmergesdatagatheredfromstudyparticipantsandthedesign,andpreparesafilethatcanbeanalysedbyspecialHBsoftware.
TheHBsoftwarethengeneratesdataontheimportancesoftheitemsforeachperson.
Otherwise,comparisonsofitemsseveralatatimecouldbeanalysedjust as we analyse rankings with Case 5, at the group level. Thesoftware implementation of MaxDiff is a direct outgrowth ofThurstone’smethod.
ApplicationsinbriefWewillhavemuchmoretosayaboutthesemethodsinChapters4,5and6,andinBonusonlineChapter1.However,abriefreviewoftheir best applications might be useful as a way to conclude ourintroductiontothem.Bothconjointanddiscretechoicehaveenjoyedlonghistoriesas
methods for creating thebestpossiblenewproductsand services.MaxDiff andQ-Sort/Case 5 have workedwell formany years inprioritizing specific claims, messages or product features. Givenbelowareafewmorespecifics.
DiscretechoicemodellingThismethoddoesbestatdeterminingthemarketplaceeffectsthatwillfollowifproductsorservicesinacompetitiveenvironmentgetreconfigured, introduced or dropped.Discrete choice modellingexcels in realism, both in theway it represents the choice in themarketplaceand in theway itaskspeople tomakechoices justastheywouldinanactualpurchasedecision.This also is the best method to determine what could happen
followingchangeswhere thereare severalproductsor servicesofthe same brand. These effects include the egregiously namedcannibalization, which refers to the way that changes in oneproductmighttake(or‘eat’)someofthesalesfromanotherproductofferedbythesamebrand.Itcanalsorevealso-calledproductline
synergies, inwhichthepresenceoftwoormoreproductsleadstogreatersalesthanyouwouldexpectfromeachproductseparately.
ConjointanalysisConjointanalysis,initstraditionalfull-profileformat,considersoneproductata time. Therefore, itmakes sense to consider conjointwhen there is no true competitive context for your product.Sometimes products do not get evaluated alongside competitors –forinstance,direct-mailinsuranceofferings.(Peopleindeeddonotkeepfoldersfilledwitholdofferstocompare.)Alternatively, if you have some really special offer on your
website, people may act on it without doing any furthercomparisons.Conjointdoeswellat creating thebestalternative todisplayforthisapplication.Conjoint analysis also canwork highly effectively in optimizing
anytypeofmessage,determiningthebestcombinationofelementstoinclude.Ifyouhave,forinstance,amessagewhereyouwanttotestsevenelements(suchasheadline,headlineplacement,contentsof text,graphicsandsoon)andeachcanvary in threeways, thatwould make for 2,187 possible ways of varying the message.Conjointanalysiscandeterminetheworthofallofthesebytestingonly18 experimentallydesignedvariations.We showanexampleofthisinChapter5.Considerconjointaswellwhenyourproductwillgetchosenonly
infrequently.Sincediscretechoicemodellinguseschoices,itmightnotpickupwhatisdrivingdecisionsifthebrandyouareinterestedinrarelygetschosen.Youalsocouldconsidernarrowingthescopeofcompetitiontoget
abetter answer, if yourbrand is rarely chosen fromawide field.For instance, suppose you are doing a study for everyone’sbreakfastfavourite,SoggyOs.Abrandsuchasthiscouldhavea0.5percentshareoftheentirebreakfast-foodmarketandstillmakealot ofmoney.Lookingat thisbroadermarket, youprobably could
not determine with any accuracy which changes might mostincreasesales–anyeffectwouldbevanishinglysmallinthecontextofallotherpossibleproductchoices.Youcouldinsteadlookonlyatthosespecificbrandsthatareyour
close competitors, that is, other fine shredded cellulose-enrichedfood-likesubstances.Inthatarena,youmighthavea10percentor20percentshare,andsobeabletogetamoreaccuratereadingofhowmuchchangeswillaffectyoursales.
MaxDiffandQ-Sort/Case5Thesemethodsprovideclearreadingsoftherelativeimportancesofindividual features,messages or claims. They do not provide anyreadingofhowvarying featureswill affect acceptanceof awholeproduct or service. They, in fact, do notworkwell with levels orvariationsoffeatures.Youcannotuseeitherof themtoconfigureanentireproductor
service.Rather,youcanweighelementsthatyoumightincludein,for instance, a special-features add-on package (as for a car), orassess the importance of broader claims youmightmake about aproductorservice.Youwillgetratio-levelinformationfromeitherofthesemethods.
Thatis,aftertheanalysis,youcanforinstancesaythat,‘MessageNwas twice as important as message R’. This, and the cleardifferentiation of items into most and least important, providestrongadvantagesovertheuseofscaledratings.MaxDiff is good for evaluatingabout 8–35 items ina list.Q-Sort
can determine relative importances formanymore items – up to100havebeenreportedintheliterature.However,MaxDiffhastheadvantage of providing importances for every person. Q-Sortprovidesanswersonlyforagroupofpeople.Every time you want to analyse another group within your
samplewithQ-Sort,youmustrunanotheranalysis.WithMaxDiff,toanalyseanewgroup,youmerelyneedtoaveragetheindividual
datathatyoualreadyhaveforthepeopleinthatgroup.
SummaryofkeypointsThe experimental or trade-offmethods were developed to dealwitha salientproblemwithscaled importanceratings, that is, theunfortunate fact that these ratings are highly unreliable inpredicting behaviour.When you ask people to rate directly whatthey find important (in a survey), they tend to identify nearlyeverythingascritical.Relianceondirectimportanceratingshasledmany an unsuspecting organization down a wrong path, wastingtimeandresources.Thegreatadvantageofallthetrade-offmethodsisthattheyforce
people to prioritize, just as in real life. They cannot say thateverythingisimportant.The more complex methods, conjoint analysis and discrete
choice modelling, forecast marketplace responses to product orservices (or communications orweb pages)when features and/orprices are varied. There is some confusion about the differencesbetween these two methods, and some treat the term conjointanalysis as a broader heading that includes discrete choice.However, because these two approaches developed in differentdisciplines and work in somewhat different ways, we will betreatingthemseparately.Discretechoicemodellingwasdevelopedbyeconometriciansto
address the question of how we can predict choices when thealternatives do not have features or attributes in common. Thetheoreticalandmathematicalworkgoing into thismethod is trulyimpressive. This appears to be the only approach we discussthroughoutthisbookthatwasawardedaNobelPrize.In a discrete choice study, people are shown products in a
marketplace or market scenario, where the main competitiveofferings are described alongside each other. In a typical web
survey, one hypothetical marketplace is shown on one computerscreen,andpeopleareaskedwhichproducttheywouldchooseifallwereconfiguredasshown.Thentheyareshownanotherscreeninwhichthefeaturesoftheproductshavebeenvariedandareaskedtomakeanotherchoice.Itisalsopossibletoinclude‘noneofthese’as a choice – greatly increasing realism – since people almostalwayscanoptoutifallalternativesaretrulyunacceptable.Peoplemightmakeachoicelikethisintheregionof6–20times.Conjoint was developed by market researchers and originally
focusedonsingleproducts.Initstraditionalform,itshowsawholeproductdescribedasaseriesoffeaturesorattributes,andasksfora rating – hence the name full-profile conjoint. While conjointanalysisdoesaskpeopletoweighfeaturesinthecontextofallotherfeatures,ittypicallyasksforarating.Thisislesscloselytiedtowhatpeople do in the real world than the choices made in a discretechoicemodellingstudy.Bothconjointanalysisanddiscretechoicemodellingcan lead to
powerfulmarket simulator programs, which show in real timehow marketplace responses vary as features and/or prices ofproducts, services or messages are changed. The typicalmarketsimulatorrunsunderMicrosoftExcelandhaseasy-tousecontrols.Maximumdifferencescaling(MaxDiff)andQ-Sort/Case5arethe
simplest of this group of methods. They give us clearlydifferentiatedimportancesforalistofitems,suchasclaimsaboutaproduct, or features that do not make up an entire product orservice. They cannot measure the relative worths of differentvariationsorlevelsoffeatures.Theycan,however,provideaclearreading of the relative importances of features, and at the ratiolevel. That is, we can say, for instance, ‘feature N is twice asimportantasfeatureR’.Wecannotdothiswithscaledimportanceratings.MaxDiffcanprovide importances foreveryperson,whileQ-Sort
doessoonlyforgroupsofpeople.However,Q-SortcangetafixontheimportancesofmanymoreitemsthanMaxDiff,withupto100
reported in the literature for Q-Sort as compared to about 35 forMaxDiff.
DesignedexperimentsThe term designed experiment covers a broad range ofapproaches.However,allexperimentaldesignsfortrade-offstudiesmeet one goal: estimating the values of many items cleanly andclearly.Twoof themethods,discretechoiceandconjointanalysis,also use these designs so that relatively few carefully selectedsituationsorcomparisonscanestimatewhatwillhappenindozenstothousandsofsituations.These designs have great measurement power. For instance, if
youhaveaproductwith18featuresthateachvaryintwoways,thisgives rise to 218 (2 to the 18th power) or 262,144 combinations.Usingadesignedexperiment,youcandeterminethevalueofallofthesewith 20 carefully selected product configurations. Amarketsimulatorprogramwouldallowyoutodeterminethevaluesofallthese combinations (assuming you had the time and patience) inrealtime.Traditionally, all experimental designs used in conjoint analysis
and discrete choice modelling were the orthogonal, fractionalfactorialtype.Thisisamouthfulbutitsimplymeansthatafractionofallpossiblecombinationsiscarefullyselectedandthatthereareno correlations in the ways that the attributes vary from oneproductormarketplacetothenext.
Basicrulesfordesignedexperiments
Themoreattributesandvariationsofattributes(orlevels)thatyouneedtomeasure,thelargeryourexperimentneedstobecome.Thatis, as you varymore attributes and levels, youwill need to showpeoplemorescreensorpageswithvaryingproducts.Inthischapterwegavesomerulesabouthowmuchyouneedtomeasure(thatis
how many screens you need to show with different products ormarketplaces)fordifferentnumbersofattributesandlevels.
HBanalysisgetsmorefromexperimentsIt is a sad but definite fact that people tire quickly of evaluatingalternativeproducts ormarketplaces.Depending on the audience,this could start as soon as six or eight have been shown. (Asmentionnedearlier,whenstudyparticipantsareveryinvolvedwiththe product or service, andhave good ability to concentrate, theycancompleteupto21orsobeforetheygetexhausted.)Wegetmuchmorethanweusedtofromexperimentalmethods
by using a machine learning approach, Hierarchical Bayesian(HB)analysis.Mostexpertsagreewecanmeasuretwiceasmuchaswas traditionally possible, with no accompanying increase in thenumberofstudyparticipants.In theolddays, ifyouconstructedavery largeexperiment,you
simplysplititamongpeopletakingthestudy.Eachpersonmightdoone-third of an entire experiment requiring (for instance) 36marketplaces or products. Then you multiplied the number ofpeopleinthestudybythreetomakeupforthis.Itworked–butledtoconsiderableincreasesintimeandexpensesindoingthestudy.HB has been pushed to get three to four times as much
informationwithoutincreasingthenumberofpeopleinthestudy.Ithasstillreturnedexcellentresults.HB analysis sounds almost magical, and relies on some fairly
mind-bendingconcepts,butithasdefinitelyprovenitselfunderfireforover25years.Itmightnotquitecountasartificialintelligence,but it definitely can be considered machine learning, as thecomputermakesmany thousands of repeated estimates and usestheearlieronestoinformthefinalresult.
Bestapplications
Discretechoicemodellingremainsthebestmethodforpredictingthe effects of changing products in a competitive marketplace. Italsoistheonlymethodthatcantrulyaddresswhathappenswhenthere ismore than one product from a given brand in the set ofcompetitive entries. That is, it can determine when there are so-called product line synergies (effects from two ormore productstogetherthataregreaterthanwewouldexpectfromeitherproductalone). It also can diagnose the awful-named product linecannibalization,whereoneproductcutsinto(or‘eats’)thesalesofanotherproductfromthesamebrand.Conjoint analysis, developing as it didwith a focus on a single
product, remains useful where a product does not have truecompetitors. For instance, this might happen with a direct-mailoffering for an insurance product. (People of course do not keepportfolios of these, waiting for the best one to happen into theirlives.) Also, conjoint can be useful in creating the best productwhere the product has a very small share of the entire market.Sincediscretechoicemodellingisbasedonchoices,ifaproductgetschosen infrequently, you may not get enough data to determinewhich variations in its features are driving levels ofmarketplaceacceptance.MaxDiffandQ-Sortdonotevaluateentireproductsorservices,
but rather are useful for evaluating the relative importances of aseriesofclaims,messageorfeatures.Youmightuseeithermethod,forinstance,tofindthemostimportantitemstoincludeinaspecialfeatures package for a car, or the best absolutely free gift that aperson gets for signing onwith their friendly telecommunicationsprovider. MaxDiff can provide importances for every person ifanalysedusingHBanalysis,whileQ-Sortprovidesinformationonlyfor groups of people. Q-Sort can prioritizemanymore items thanMaxDiff,though–upto100ascomparedtoupto35.
Takeextracarewithprojections

AsareminderfromChapter2,conjointanalysisanddiscretechoicemodelling can get you to share of acceptance. This differs frommarket share in that youmust factor inhowawarepeople areoftheproductandhowwidelydistributeditis(ataminimum)togettoactualmarketplacelevels.Ifyouhopetomakeprojections,youmustalsoknowthesizeoftheentiremarket(generallynoteasytodetermine), and account for any problems in areas such ascommunications, how the product or service is displayed, howsalespeopletreatit,andsoon.Youmustbeextremelywellpreparedtomakeagoodprojection.

04Creatingthebest,newestthingDiscretechoicemodelling
In this chapter we discuss arguably the most powerful of allmethods for determining the best mix of prices and features toincludeinaproductorservice.Discretechoicemodellingcentreson determining exactly what people will choose. We review thebasics, and then tremendously effective outputs, ie marketsimulations and market simulators. We show how they solveproblemsthatareotherwiseimpossibletoaddress.
KeyfeaturesLet’s startwithwhatmay seem an extreme statement – and thenexplain the reasons for making it. Discrete choice modellingarguably is themost powerful of allmethods for determining thebestmix of products and features to include in a newproduct orserviceinacompetitivemarket.Thismethodcentresondetermininghowchangesinthefeatures
ofproductsorservicesinfluencechoices.Ifitissetupandanalysedwell, it has tremendous power to predict how new or modifiedproductsorserviceswillfareintheactualmarketplace.Before we start, it is worth a mention that we will be
metaphoricallytreadingontheedgesofsomedeeptheoreticalandmathematicalwaters.Wewillbemanoeuvringaroundmuchthatisabstruse, instead focusing on explaining clearlywhat youneed inordertomakeeffectiveuseoftheseremarkablemethods.Wehopethatthosewithmoreacademicexperiencedonotfindanyoftheir

favouritetheoriesslighted.
Whywedothis:payoffinmarketsimulationsThegreatestpowerofthismethodresidesinitsabilitytosimulatewhatwill happen in a changingmarketplace over the near term.Later in this chapter, you will encounter an example where theoutcomeofacompetitive response showedsomuchpotential riskthat the sponsoring organization decided to lock up the reports.They actually feared that a leak could undermine their marketposition.Figure4.1showssomeaspectsofaMicrosoft-Excel-basedmarket
simulator program.Not all simulators have these features – someareimportantandyetsometimesomitted,aswewilldiscuss.

FIGURE4.1Aportionofamarketsimulator
Youseeaportionofthesimulatorinthisfigure.Thecontrolsthatadjust the products’ features and prices appear only in part. Therestwouldbereachedbyscrollingdownintheworkbook.This program opens like any Excel workbook. The example
shown in Figure 4.1 is from an actual study done among doctors,determiningwhat theywouldprescribe ifanewdrughadcertainfeaturesandprices.Ithasbeendisguisedbymodifyingnamesandsomenumbers.Thecircled letters in thefigurearenotpartof thesimulator itself, but rather appear to help identify differentfeatures.Near letterA you see a graphical display of the outcome of the
simulation.Thesearethesharesofpreferenceexpectedafterthecontrols for the simulator have been changed to reflect a specificcombination of pricing and features. This information appears intableformnearletterC.Two adjustments for external market conditions appear near
letterB. As wementioned in Chapter 2, without adjustments likethese, you cannot expect the share of preference found by thecalculations behind the simulator to approach actual marketshare. This is because all thosewho responded to the studyweremade 100 per cent aware of the products – and that needs to beadjusted down to reflect marketplace conditions. In this specificsimulation,thepercentageofpatientswhoarenewlydiagnosedwillaffectproductchoices,soanothercontrolwasincludedtoadjustforthat.LettersDandFarerespectivelycontrolsforconfiguringthestate
of the marketplace that you want to estimate, along with areference orbasemarketplace towhich youwill compare. Thisreferencecaseisincludedsothatyoucangetanaccuratefixofhowmuchthechangesyouaretryingwillaffectmarketplaceacceptanceofyournewproductorservice.Thisisanimportantfeaturebecauseofthewaythatutility–the
abstractquantitythismethodassumesistradedoff–getstranslatedinto marketplace behaviour. We will be talking about the wayutility works in more detail. For now, though, we just need tounderstandthat this iskeyforseeingthestrengthsofeffects fromchangingfeaturesandprices.Finally, near letterE, we have some controls that allow you to
modify thebasicExceldisplay.Theprogramopenswith theExcelribbon – the control panel across the top of the screen – hiddenfromviewso thatyoucan seemoreof the simulator.Clicking theupper button restores the Excel ribbon to view, and clicking thelowerbuttonhidesitagain.These are the basic ingredients that make a simulator a
formidableforecastingtool.Nowthatwehaveseenthisincrediblypowerful form of output, let’s go through some of the basics andstepsthatyouneedtogetthere.
AsrealasitgetsDiscrete choice modelling is based on a survey that exposesproducts to study participants in the context of realisticmarketplacesituations.Theproductsthatpeopleevaluatecanhavetheirownfeaturesandtheirownprices.Thisrealism–andthefactthatwe are observing choices – provides a very strong analyticaladvantage. Consumers evaluate alternative products whileconsidering competitive offerings, just as they would in themarketplace.Study participants get a set of tasks or scenarios or market
scenarios, each one describing a set of realistic brandedservice/productalternatives.Theythensimplysaywhichproductineach market scenario – if any – they would choose. They do notneed to rate alternatives, or rank items they would never select.They simply need to pickwhatever theywould choose. They alsocanhave theoptionof saying thatnoneof thealternativeswouldappealtothem.Alternative products from one brand can appear competing
against each other. Market scenarios can be set up preciselyreflecting the important alternatives likely to appear in theactualmarketplace.Therefore,youcandetermineconsumerresponsesinthespecificcompetitivesituationsthatyouwouldneedtotest.
NoneedforunrealisticintrospectionDiscretechoicemodellinghasanotheradvantageoverratings-basedmethods in that it doesnot force buyers to dissect and to explaintheirreasoninginmakingdecisions.Extensiveresearchhasshownthatmostconsumersdonotgiveaccuratedescriptionsofwhatgoes
intotheirdecisions.AswediscussedinChapter3,mostbuyerswillrateallornearly
allproposedfeaturesas ‘highly important’or ‘critical’whenaskedto answer direct importance-rating types of questions. They willfaithfullydothiswhethertheytrulyneedthosefeaturesornot.Similarly,mostpeoplesaylittleaboutwhytheydidnotchoosea
productbeyondobservingthatthey‘don’tlikeit’,‘itwasn’tforme’,or ‘it wasn’t right’. Asking directly about what falls short in aproductcanprovetobeafrustratingtask.Approaches to understandingwhat consumerswill chooseneed
to go beyond these usually inaccurate ratings patterns to discernwhatinfluencesbuyers’behaviour–startingwithessentialfeature-related,provider-relatedandpricing-relatedneeds.Although discrete choice modelling market scenarios present
moreinformationthanmanyotherresearchstudymethods,peoplegenerally have little trouble completing the task – even whenevaluating10–15marketplaces.(Theymaygrumbleafterseeingsixorso,buttypicallykeepworkingwithgoodlevelsofconsistency.)After all, in each market scenario shown, people need only do
somethingthattheydoallthetime–lookatalternativesandmakea choice. Study participants typically report that the task engagestheir attention, and that it sometimes even is fun. That is a rarewordinconnectionwithmostresearchstudies.Thegenerallyhighratesofstudycompletionwiththismethodsupportthisdescription.
AnexperimentallydesignedapproachDiscretechoicemodellingstudiesareconstructedaccordingtostrictexperimental designs, as we described in Chapter 3. The exactnumber of marketplaces or scenarios required in a study willdependupontheprecisenumberofattributesandattributelevels(or variations) to be tested. As the numbers of attributes andattributelevelstobevariedincrease,sodothenumberofscenariosrequiredbythedesign.
Accurate analysis of findings from discrete choice modellingrequiresexperimentaldesigns thatareorthogonal orverynearlyorthogonal (that is, in which there is zero correlation or nearlyzerocorrelationinhowattributesvaryfromonemarketplacetothenext).Zerocorrelationmeansthatthewayonefeaturevaries,goingfrom onemarketplace to another, has no relationship to thewaythatanyotherfeaturevaries.Large experimental designs are difficult to construct properly,
and in thosecasesweneed thecomputer’shelp togenerate them.Larger designs are typically very nearly orthogonal (usually thespecifictypecalledD-optimaldesigns).Thesedesignsworkjustaswellasstandardorthogonalones,butcannotbefoundincataloguesinmostcases.Theyrequirecomputertimetodevelop.Keeping theexperimentareasonable size is important.Onekey
part of any discrete choice modelling study, then, would be athoroughdiscussionofthenumberofattributesandattributelevelstobevaried–andoftheimplicationsthatthesevariationswillhaveon the final studydesign.Measuring justwhat isneeded–andnomore–isacriticalconsideration.
Worthsayingagain:thepayoffinmarketsimulationsThe real power of thismethod is its ability to simulatewhatwillhappen ina changingmarketplaceover thenear term. If you canmanagetothinkaheadtowhatcompetitorsmostlikelywilldo,thenyoucancovernotonlywhatwouldhappenifyouchangeyourownfine product or service, but also what would happen whencompetitorsrespond.Later in this chapter, youwill encounter an examplewhere the
outcome was so revealing – and showed so much potentialvulnerability–thatthesponsoringorganizationdecidedtolockupthereports.Theyactuallyfearedthataleakcouldunderminetheirmarketposition.
Thinkingthroughandsettinguptheproblem
ThinkingintermsofchoicesDiscrete choice modelling, like all trade-off study methods,envisions products or services as a set of distinct features. Indiscrete choice modelling, these definite features have distinctvariationsthatareassumedtobemeasurableandcomparable.Thismeansthatthevalueofeachcanbetradedversusotherfeatures.This is about as far into the psychology of decision making as
thesemethodsgo.Discretechoicemodellingcanbeseenasaimingtoforecasttheoutcomesofdecisions,ratherthanastryingtofollowtheinnerworkingsofthehumanmind.Thismethodisverymuchabout what needs to happen with features and prices to attaingreateracceptanceofaproductorservice,ratherthandiggingintowhypeoplebehaveastheydo.Eachchoiceinadiscretechoicemodellingstudycanhaveitsown
featuresandprices.Comparingchoicesthatdonotshareattributesisonekeyproblemthatthismethodwasdevelopedtosolve.Someof the earliest widely cited applications for this method involvedtransportation, where (for instance) the choices were car, bus ortrain.Theseclearlydonotsharecommonattributesexceptfortimedoor-to-door.For instance, thecostofparkingdowntowndoesnotapply to the trainor thebus, thedistancebetweenbus stopsdoesnot apply to car or train, and how often the trains run does notapplytocarorbus.Theseearlystudiesworked–forecastswereborneoutinthereal
world.Alargebodyofimportantworkinthissubjectisstillrelatedtotransportation. (Youcanlearnmuchmoreaboutthismethodinsome excellent courses from the MIT school of Civil andEnvironmentalEngineering.)
Thefirststepisalargeone

Thefirststepisalargeone
Youmustfirstconsiderhowyourfineproductorservicecanvary,andthenhowcompetitorsmightvaryeitheratthesametimeorinresponse. This first step canprove to be surprisingly difficult andoftentakesasmuchtimeaseverythingelsedoneintheprocess.For instance, working with the marketing team at a major US
insurer,itquicklyemergedthattheyhadnoideaaboutthedetailsoftheircompetitors’products.Worse,whattheyhadimaginedwasavailable among theirproductswasnot allwhat they couldoffer.Afterafewweeksofdigging,oneoftheirteamannouncedthatthewholeprojectwas ‘givingusaheadache’.Fortunately,all involvedtooktheappropriateanalgesics,survivedthisphaseandwentontodoasuccessfulupdateontheirofferings.
Settingupastudy:anexample
Let’sgobackanumberofyearstowhendebitcardswerestillnotubiquitous. The client, here called Quiet Financial Services (QFS),was an extremely wealthy company that only recently hadabandoned the practice of solely serving those who had beenrecommended by other clients. (Their motto could have been, ‘Ifyou have an in, we might be inclined to offer you financialservices’.) Theywanted to develop a high-limit debit card for therightkindofpeople.TheirtwokeycompetitorsinthismarketwereCitibankandAmericanExpress(Amex).Theydidnotwanttoofferallthesamefeaturesinthekeyareas
of interest rate, credit limit and annual fee as the other twocompanies.Theysetouttotestcreditlimitsof$20,000and$80,000,whileAmexoffered$50,000or $120,000andCitibankawhopping$90,000or$120,000.Theyalsowantedtotestthreedifferentinterestratesfromthosetheircompetitorswereoffering,andtoanticipatewhatmighthappeniftheircompetitorschangedtheirinterestratesinresponse.Inaddition,theyhadabsolutelynointentionofofferingthiscard

withnofee.ThiswasCitibank’skeyincentivefortheircustomerstoaccrue a crushing debt. QFS lastly decided to test Amex droppingtheir relatively lofty $50 fee in response toQFS coming inwith alowerone.Figure4.2showseachcompetitorandthefeaturestobetested. The features appear in the boxes over the grey horizontalbars.
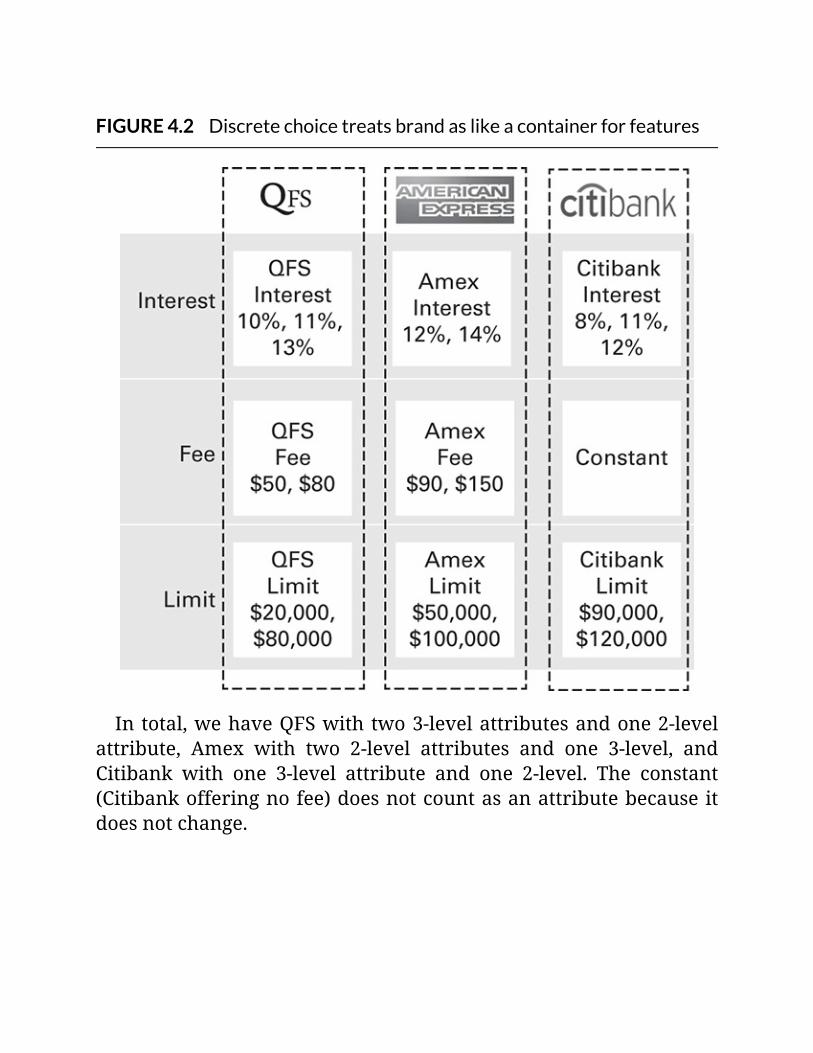
FIGURE4.2Discretechoicetreatsbrandaslikeacontainerforfeatures
Intotal,wehaveQFSwithtwo3-levelattributesandone2-levelattribute, Amex with two 2-level attributes and one 3-level, andCitibank with one 3-level attribute and one 2-level. The constant(Citibankofferingnofee)doesnotcountasanattributebecauseitdoesnotchange.
Nochangemeansnomeasurement
Youcannotmeasuretheimpactofanyfeaturethatdoesnotchange.Thisisconsideredafixedpartoftheproduct.Youmustvaryafeatureinsomewaytomeasureitseffectonchoices.
Somethingmayhaveseemedstrangetothoseofyoufamiliarwithtraditional conjoint analysis: we did not count the brand as anattribute.AswewilldiscussinChapter5,inconjointanalysis(andits conjoint-likedescendant,CBC)brand typicallygets includedasanattributethatgetsvariedalongwithotherattributes.With discrete choice modelling, however, brand works like a
container that holds the attributes. If we include a term in ourmodelcalled theconstant (asdiscussed inChapter3), thatcanbethoughtofastheresidualvalueofthebrandafterweaccountforallthespecificattributesthatwearemeasuring.The idea that attributes can be specific to each choice is a
critical concept that makes discrete choice modelling differentfrom, and superior to, traditional conjoint analysis. We will talkmoreaboutthisdifferenceinChapter5.

Considerbrandasacontainerforfeatures
Withdiscretechoicemodelling,eachchoice(orbrand)canhaveitsownfeatures,varyinginwaysspecifictothatbrand.Branddoesnotneedtobecountedasaproductattribute.Rather,wecanthinkofbrandasbeinglikeacontainerthatholdstheattributes.
LimitsonhowmuchyoucanmeasureTheQFSstudywehavebeendiscussingwouldrequireatotalof12marketplace scenarios. As a reminder, as you measure moreattributes and more attribute levels, you need more marketplacescenariostomeasure.Hereishowmanymarketplacescenarios,orcomputer screens, you need tomeasure for different numbers ofattributelevels:
two-levelattribute:onemarketplacescenarioorscreenshown;three-levelattribute:twomarketplacescenariosorscreensshown;four-levelattribute:threemarketplacescenariosorscreensshown;five-levelattribute:fourmarketplacescenariosorscreensshown;six-levelattribute:fivemarketplacescenariosorscreensshown.
And then we need to consider a bit more. We need two moremarketplacescenariosorscreens:
Oneformeasuringtheerrorinthemodel.Thisallowsustoknowhowwellwearemeasuring–basically,howconsistenteachpersonwasinanswering.Otherwise,whenwerunthemodel,thiswillbereportedas100percentregardlessofhowwellpeopledidwhenanswering.Oneforaveryusefultermcalledtheconstant.Thishas
mathematicalmeaning,butwecanuseittomeasurethevalueofthebrandorthechoiceoutsidetheattributesbeingtested.
You also must count the number of variations or levels in eachattributeandcheckthedesignagainstthese.Thedesignmustbeatleastasbigastheproductorthetwoattributeswiththemostlevels.So if youhave, for instance, a six-level attribute and a three-levelattribute,youneedatleast6x3or18marketplaces.Thisunderlinesthe importance of going for the simplest model that measureseverything you need. Going for the simplest working modelcoveringeverythingisanextremelywell-establishedpracticeinthesciences.ItissometimescalledOckham’srazor.OckhamwasWilliamofOckham,wholivedaround1300,sothis
ideahasagreatdealofhistory.Therazor,goingalongwiththeideathatyoushouldtrimawayeverythingextraneous,apparentlycameintothisaround1840.ItisnotclearwhetherWilliamactuallyevensawarazor.Evenwiththenear-magicofHBanalysis,whichwereviewbelow,
economy in design remains an important principle. You need toknow what to measure and how to measure. Understanding themarketplaceandyourbuyersbeforeyoustartthestudyiscritical.
ReviewingsomebestpracticesThese are important to any study, and while some may seemapparent,wehave encounteredmore thana few instanceswhereoneormorewasnotfollowed.Thesemeritaspecialcall-out.
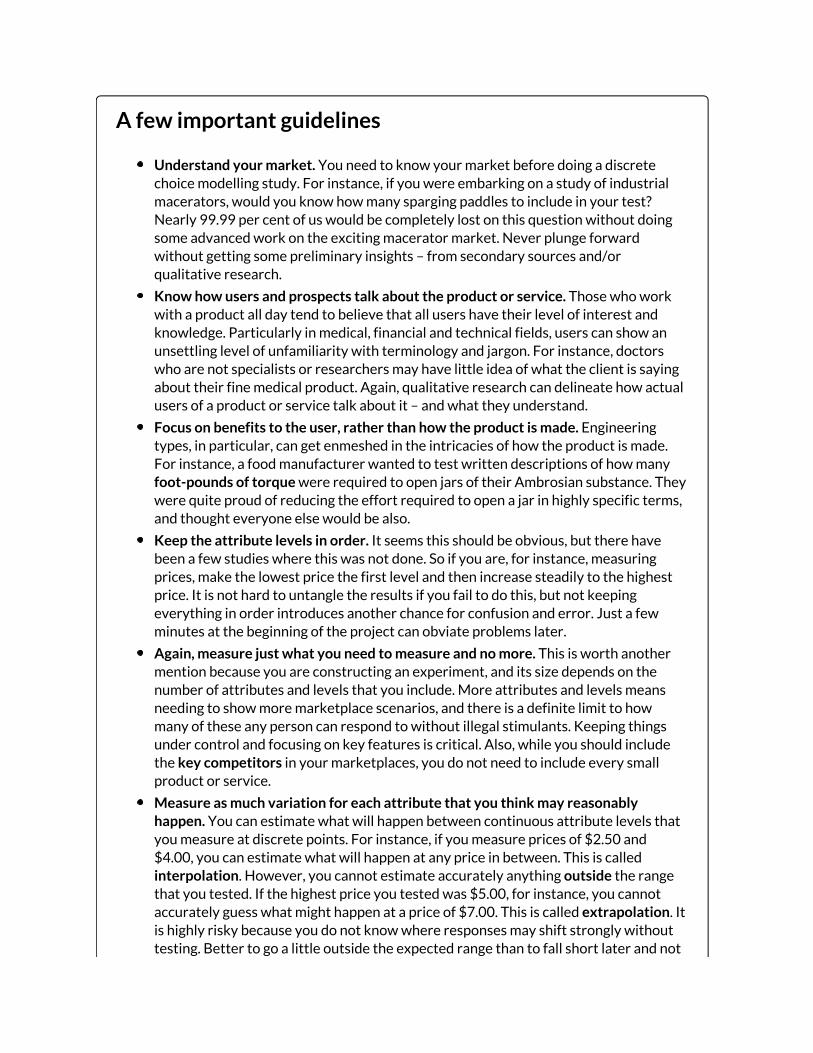
Afewimportantguidelines
Understandyourmarket.Youneedtoknowyourmarketbeforedoingadiscretechoicemodellingstudy.Forinstance,ifyouwereembarkingonastudyofindustrialmacerators,wouldyouknowhowmanyspargingpaddlestoincludeinyourtest?Nearly99.99percentofuswouldbecompletelylostonthisquestionwithoutdoingsomeadvancedworkontheexcitingmaceratormarket.Neverplungeforwardwithoutgettingsomepreliminaryinsights–fromsecondarysourcesand/orqualitativeresearch.
Knowhowusersandprospectstalkabouttheproductorservice.Thosewhoworkwithaproductalldaytendtobelievethatallusershavetheirlevelofinterestandknowledge.Particularlyinmedical,financialandtechnicalfields,userscanshowanunsettlinglevelofunfamiliaritywithterminologyandjargon.Forinstance,doctorswhoarenotspecialistsorresearchersmayhavelittleideaofwhattheclientissayingabouttheirfinemedicalproduct.Again,qualitativeresearchcandelineatehowactualusersofaproductorservicetalkaboutit–andwhattheyunderstand.
Focusonbenefitstotheuser,ratherthanhowtheproductismade.Engineeringtypes,inparticular,cangetenmeshedintheintricaciesofhowtheproductismade.Forinstance,afoodmanufacturerwantedtotestwrittendescriptionsofhowmanyfoot-poundsoftorquewererequiredtoopenjarsoftheirAmbrosiansubstance.Theywerequiteproudofreducingtheeffortrequiredtoopenajarinhighlyspecificterms,andthoughteveryoneelsewouldbealso.
Keeptheattributelevelsinorder.Itseemsthisshouldbeobvious,buttherehavebeenafewstudieswherethiswasnotdone.Soifyouare,forinstance,measuringprices,makethelowestpricethefirstlevelandthenincreasesteadilytothehighestprice.Itisnothardtountangletheresultsifyoufailtodothis,butnotkeepingeverythinginorderintroducesanotherchanceforconfusionanderror.Justafewminutesatthebeginningoftheprojectcanobviateproblemslater.
Again,measurejustwhatyouneedtomeasureandnomore.Thisisworthanothermentionbecauseyouareconstructinganexperiment,anditssizedependsonthenumberofattributesandlevelsthatyouinclude.Moreattributesandlevelsmeansneedingtoshowmoremarketplacescenarios,andthereisadefinitelimittohowmanyoftheseanypersoncanrespondtowithoutillegalstimulants.Keepingthingsundercontrolandfocusingonkeyfeaturesiscritical.Also,whileyoushouldincludethekeycompetitorsinyourmarketplaces,youdonotneedtoincludeeverysmallproductorservice.
Measureasmuchvariationforeachattributethatyouthinkmayreasonablyhappen.Youcanestimatewhatwillhappenbetweencontinuousattributelevelsthatyoumeasureatdiscretepoints.Forinstance,ifyoumeasurepricesof$2.50and$4.00,youcanestimatewhatwillhappenatanypriceinbetween.Thisiscalledinterpolation.However,youcannotestimateaccuratelyanythingoutsidetherangethatyoutested.Ifthehighestpriceyoutestedwas$5.00,forinstance,youcannotaccuratelyguesswhatmighthappenatapriceof$7.00.Thisiscalledextrapolation.Itishighlyriskybecauseyoudonotknowwhereresponsesmayshiftstronglywithouttesting.Bettertogoalittleoutsidetheexpectedrangethantofallshortlaterandnot
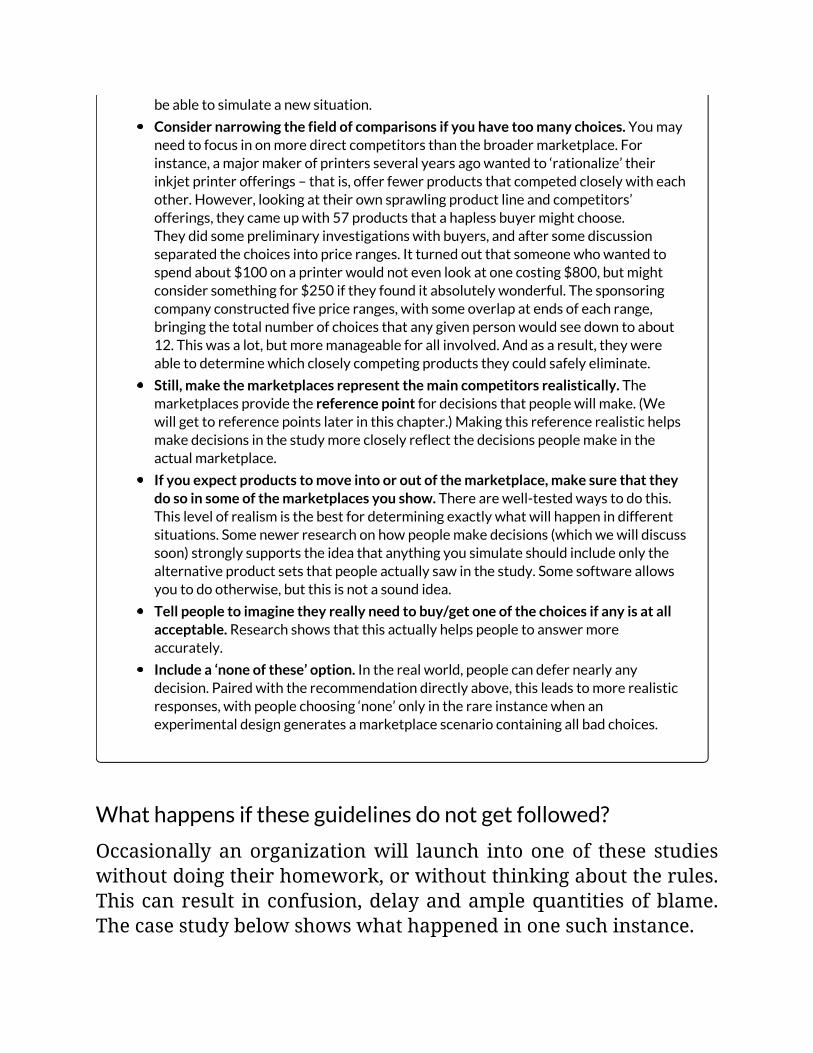
beabletosimulateanewsituation.
Considernarrowingthefieldofcomparisonsifyouhavetoomanychoices.Youmayneedtofocusinonmoredirectcompetitorsthanthebroadermarketplace.Forinstance,amajormakerofprintersseveralyearsagowantedto‘rationalize’theirinkjetprinterofferings–thatis,offerfewerproductsthatcompetedcloselywitheachother.However,lookingattheirownsprawlingproductlineandcompetitors’offerings,theycameupwith57productsthatahaplessbuyermightchoose.Theydidsomepreliminaryinvestigationswithbuyers,andaftersomediscussionseparatedthechoicesintopriceranges.Itturnedoutthatsomeonewhowantedtospendabout$100onaprinterwouldnotevenlookatonecosting$800,butmightconsidersomethingfor$250iftheyfounditabsolutelywonderful.Thesponsoringcompanyconstructedfivepriceranges,withsomeoverlapatendsofeachrange,bringingthetotalnumberofchoicesthatanygivenpersonwouldseedowntoabout12.Thiswasalot,butmoremanageableforallinvolved.Andasaresult,theywereabletodeterminewhichcloselycompetingproductstheycouldsafelyeliminate.
Still,makethemarketplacesrepresentthemaincompetitorsrealistically.Themarketplacesprovidethereferencepointfordecisionsthatpeoplewillmake.(Wewillgettoreferencepointslaterinthischapter.)Makingthisreferencerealistichelpsmakedecisionsinthestudymorecloselyreflectthedecisionspeoplemakeintheactualmarketplace.
Ifyouexpectproductstomoveintooroutofthemarketplace,makesurethattheydosoinsomeofthemarketplacesyoushow.Therearewell-testedwaystodothis.Thislevelofrealismisthebestfordeterminingexactlywhatwillhappenindifferentsituations.Somenewerresearchonhowpeoplemakedecisions(whichwewilldiscusssoon)stronglysupportstheideathatanythingyousimulateshouldincludeonlythealternativeproductsetsthatpeopleactuallysawinthestudy.Somesoftwareallowsyoutodootherwise,butthisisnotasoundidea.
Tellpeopletoimaginetheyreallyneedtobuy/getoneofthechoicesifanyisatallacceptable.Researchshowsthatthisactuallyhelpspeopletoanswermoreaccurately.
Includea‘noneofthese’option.Intherealworld,peoplecandefernearlyanydecision.Pairedwiththerecommendationdirectlyabove,thisleadstomorerealisticresponses,withpeoplechoosing‘none’onlyintherareinstancewhenanexperimentaldesigngeneratesamarketplacescenariocontainingallbadchoices.
Whathappensiftheseguidelinesdonotgetfollowed?
Occasionally anorganizationwill launch into oneof these studieswithoutdoingtheirhomework,orwithoutthinkingabouttherules.Thiscanresult inconfusion,delayandamplequantitiesofblame.Thecasestudybelowshowswhathappenedinonesuchinstance.
CASESTUDYOnethatdidnotstartwell
A company thatmadewinewanted to do a pricing study. They selectednine prices per bottle for use in the study, specified in this order: $9.59,$8.39,$11.99,$10.59,$8.99,$12.49,$9.99,$12.00and$11.00.Theyalsotested three sizes for their beverage, 750 millilitres, 1 litre, and 850milliletres.Theycreated12screens,eachofwhichshowedonepriceandsizecombination.(Theydidnotshowcompetitorsbutsaidthatpricescouldvary from $8 to $14 for a comparable comestible.) Then they collectedtheirdata,butcouldnotmakeanysenseofwhattheygotbackwhentheytriedtoanalyseit.
Whatwentwrong?
Therearetwoprincipalproblemshere,thefirstofwhichhastwoparts.Tostart,theytestedtoomanyprices.Ifyouknowthemostandtheleastyouanticipatecharging,youneedtotestnomorethanfourpricestocapturethemostcomplexpatternsofpriceversusexpectedshare–althoughyoumight possibly go to five (if really not sure, six). You would do this toattemptcapturingsomepriceatwhichresponseschangedrastically.Asareminder,sharesalmostalwaysgodownwithsufficientincreasesinprice.Theremaybesomepriceatwhichthisdeclinebecomesmuchsteeper.Theotherpartofthisfirstproblemwasthatthepriceswerenotinorder
fromlowtohigh.This isoneofthepitfallspointedoutabove,and indeedthis company did not know exactly how to deal with the data got fromdoing this. They needed to be shown how to reorder the results just todeterminewhethertheylookedsensible.The second issue was that they did not have enough data to analyse
correctlywithjust12productsshown(thesecouldnotaccuratelybecalledmarketplacescenarios,withjustoneproduct).Firstcountingtheattributelevels, we find that measurement would require showing eightmarketplacestomeasurethefirstattributeandtwoforthesecond.Thatisless than the 12 they had, but they forgot one other rule. The actual
minimum would be 9 x 3, or 27, due to the need to cover as manymarketplacesasthenumbersofattributelevelsmultipliedbyeachother.This last problemproved to be insolublewithoutmorework. The best
that could be done was to go back and interviewmore people with theremaining price/size combinations. We then relied on our faithful HBanalysistohelpputtogethertheresultsfromthetwogroupsinterviewed.Thismeantdelaysandextracosts(andconsiderablegrumbling),butgoingbackformoreresponsesdidultimatelysavetheproject.
Thepriceisright:priceversuschangeinshareWementionedabovethatfourdifferentpriceswouldbeenoughtocapture even themost complicated pattern of price versus share.Butwhataresomeofthepatternsthatyoumightencounter?Aself-effects curve, as illustrated in Figure 4.3, shows one way aproduct’s share could change as its price, and only its price,changes. We find this by running several simulations and seeinghowshareshifts.
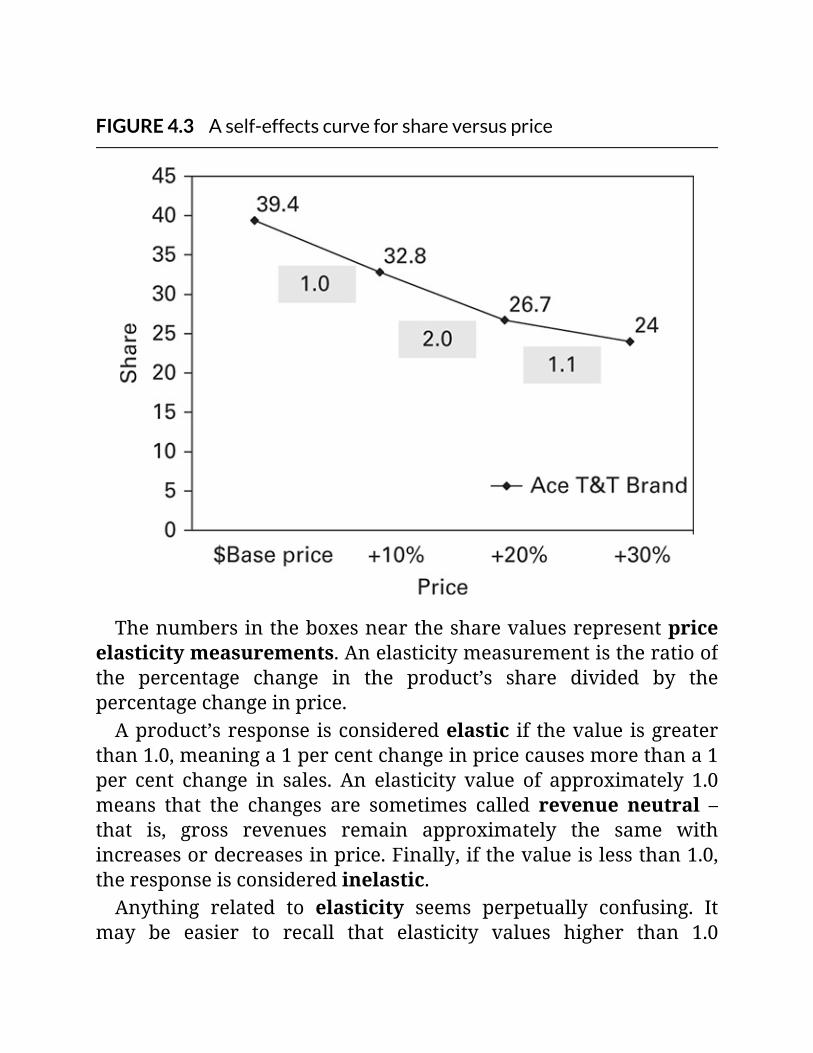
FIGURE4.3Aself-effectscurveforshareversusprice
Thenumbersintheboxesnearthesharevaluesrepresentpriceelasticitymeasurements.Anelasticitymeasurementistheratioofthe percentage change in the product’s share divided by thepercentagechangeinprice.Aproduct’sresponse isconsideredelastic if thevalue isgreater
than1.0,meaninga1percentchangeinpricecausesmorethana1per cent change in sales. An elasticity value of approximately 1.0means that the changes are sometimes called revenue neutral –that is, gross revenues remain approximately the same withincreasesordecreasesinprice.Finally,ifthevalueislessthan1.0,theresponseisconsideredinelastic.Anything related to elasticity seems perpetually confusing. It
may be easier to recall that elasticity values higher than 1.0
correspondtoalossingrossrevenuesbasedonincreasingprice,and those below 1.0 correspond to gains in gross revenues withincreasesinprice.Bytheway,forallthediscussionofpriceelasticity,youlikelywill
avoidconfusionifyouleaveitoutofyourdiscussion.Forinstance,manyyearsago,webroughtastudytoajuniorclientinwhichthedisplays showed how many share points they would lose for adollarincreaseinprice.Thisyoungpersongotincensed,demandingto see the elasticities. Themodified presentation thenwent to theReallyBigBossupstairs.He listened forawhile, thenburstout, ‘Idon’tcareaboutthese[expletive]elasticities!Showmehow[many]salesweloseifweraisethepriceadollar!’Figure4.4showsseveralpriceversussharecurves thatyouwill
commonly encounter. If we know where responses are likely tochange, four price points will cover all these contingencies. Thefigure to the left shows an essentially straight-line response toraisingprices for TinyCo, and a curved (convex) response forAceT&T. The Ace T&T curve shows increasing rates of share loss aspricesrise.
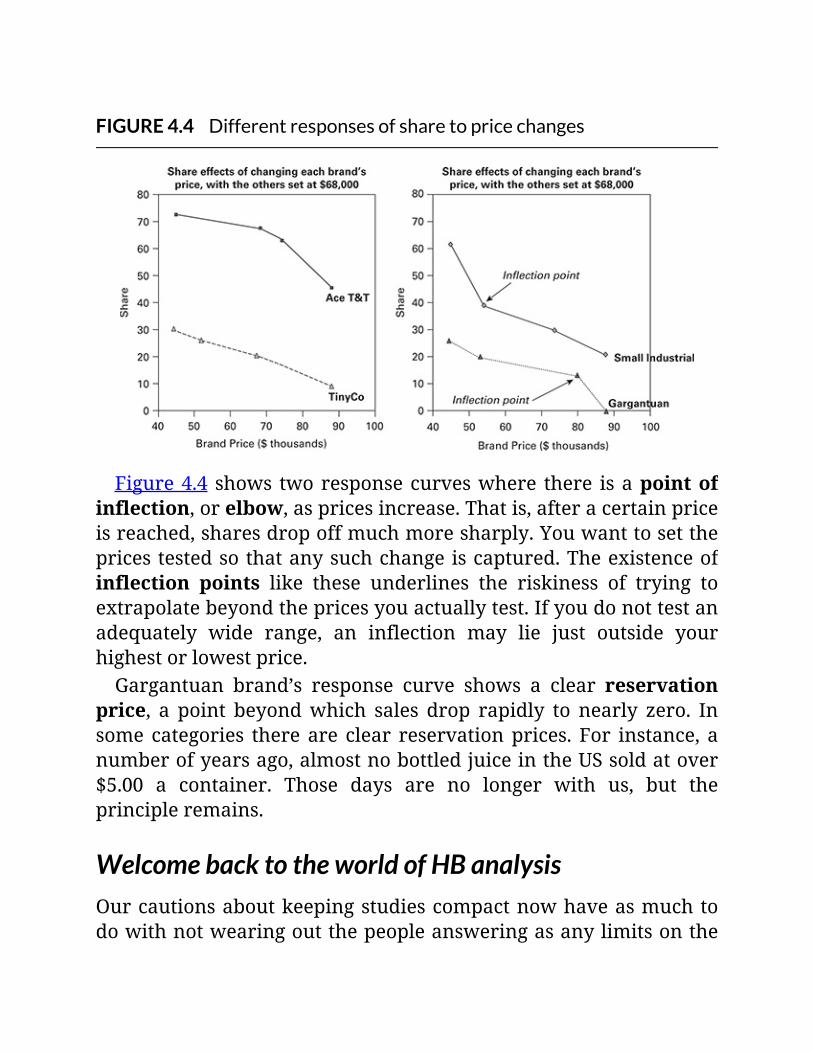
FIGURE4.4Differentresponsesofsharetopricechanges
Figure4.4 shows tworesponsecurveswhere there isapointofinflection,orelbow,aspricesincrease.Thatis,afteracertainpriceisreached,sharesdropoffmuchmoresharply.Youwanttosetthepricestestedsothatanysuchchangeiscaptured.Theexistenceofinflection points like these underlines the riskiness of trying toextrapolatebeyondthepricesyouactuallytest.Ifyoudonottestanadequately wide range, an inflection may lie just outside yourhighestorlowestprice.Gargantuan brand’s response curve shows a clear reservation
price, a point beyondwhich sales drop rapidly to nearly zero. Insome categories thereare clear reservationprices. For instance, anumberofyearsago,almostnobottledjuiceintheUSsoldatover$5.00 a container. Those days are no longer with us, but theprincipleremains.
WelcomebacktotheworldofHBanalysisOurcautionsaboutkeepingstudiescompactnowhaveasmuchtodowithnotwearingoutthepeopleansweringasanylimitsonthe
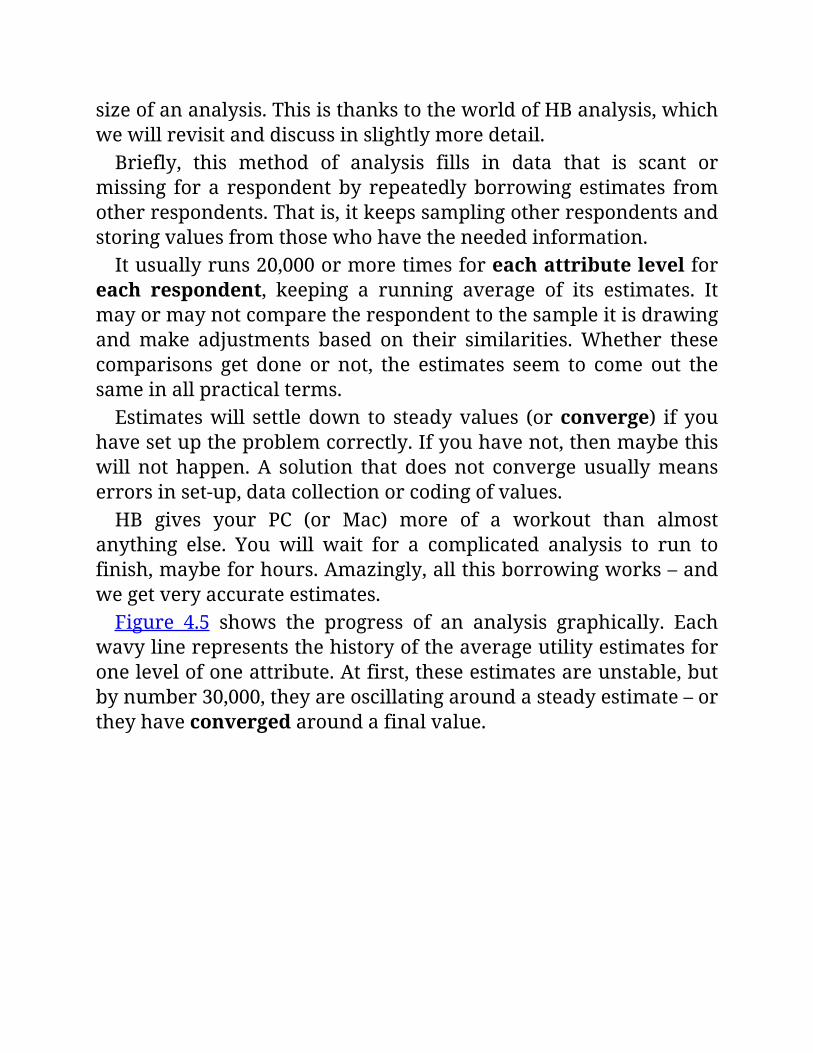
sizeofananalysis.ThisisthankstotheworldofHBanalysis,whichwewillrevisitanddiscussinslightlymoredetail.Briefly, this method of analysis fills in data that is scant or
missing for a respondentby repeatedlyborrowing estimates fromotherrespondents.Thatis,itkeepssamplingotherrespondentsandstoringvaluesfromthosewhohavetheneededinformation.Itusuallyruns20,000ormoretimesforeachattributelevelfor
each respondent, keeping a running average of its estimates. Itmayormaynotcomparetherespondenttothesampleitisdrawingandmake adjustments based on their similarities.Whether thesecomparisons get done or not, the estimates seem to come out thesameinallpracticalterms.Estimateswill settledown to steadyvalues (orconverge) if you
havesetuptheproblemcorrectly.Ifyouhavenot,thenmaybethiswill not happen.A solution that doesnot convergeusuallymeanserrorsinset-up,datacollectionorcodingofvalues.HB gives your PC (or Mac) more of a workout than almost
anything else. You will wait for a complicated analysis to run tofinish,maybeforhours.Amazingly,allthisborrowingworks–andwegetveryaccurateestimates.Figure 4.5 shows the progress of an analysis graphically. Each
wavylinerepresentsthehistoryoftheaverageutilityestimatesforonelevelofoneattribute.Atfirst,theseestimatesareunstable,butbynumber30,000,theyareoscillatingaroundasteadyestimate–ortheyhaveconvergedaroundafinalvalue.
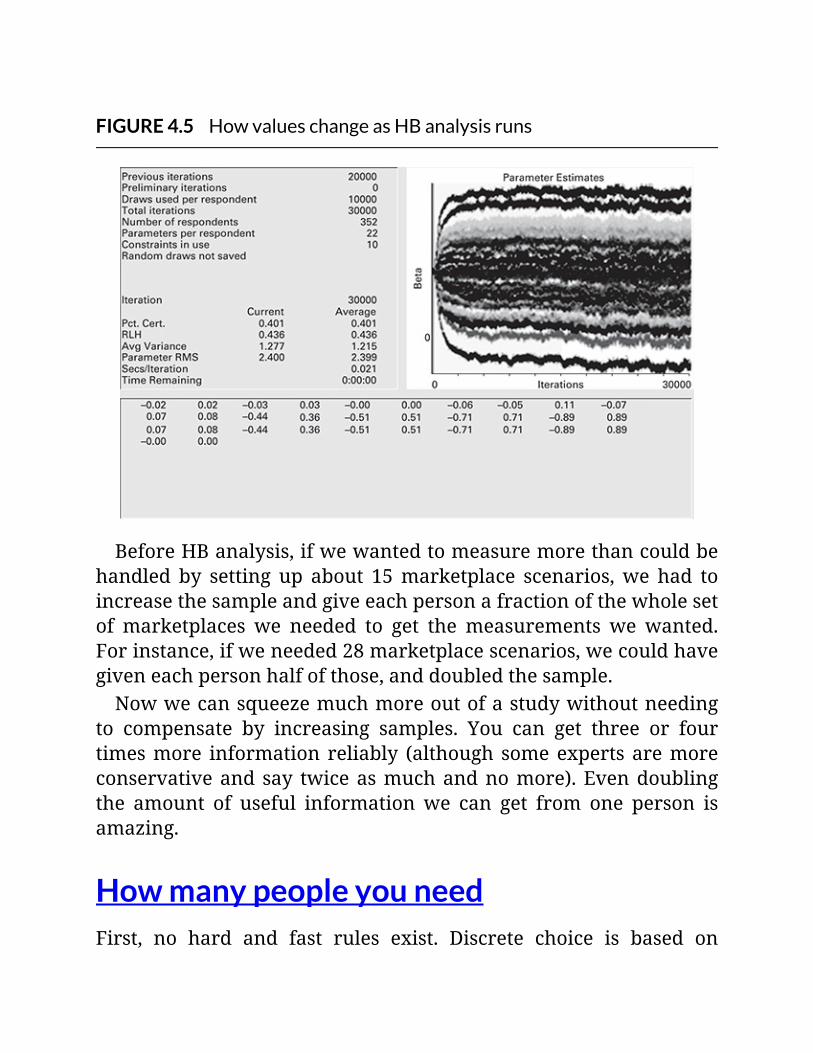
FIGURE4.5HowvalueschangeasHBanalysisruns
BeforeHBanalysis,ifwewantedtomeasuremorethancouldbehandled by setting up about 15marketplace scenarios,we had toincreasethesampleandgiveeachpersonafractionofthewholesetof marketplaces we needed to get themeasurements we wanted.Forinstance,ifweneeded28marketplacescenarios,wecouldhavegiveneachpersonhalfofthose,anddoubledthesample.Nowwecansqueezemuchmoreoutofastudywithoutneeding
to compensate by increasing samples. You can get three or fourtimesmore information reliably (although someexperts aremoreconservativeand say twiceasmuchandnomore).Evendoublingthe amount of useful informationwe can get from one person isamazing.
HowmanypeopleyouneedFirst, no hard and fast rules exist. Discrete choice is based on
approaches in the logistic regression family of methods. Someexperts say you need 10 people per item youmeasure. For mostrelatedmethods,fiveisoftensaidtobesufficient.Experienceshowsthat,forareasonablysizedexperiment,125pergroupyouwanttomeasure separately is safe and reliable. Some are more cautiousandsay200pergroup.Asareminder,allsampleshaveerror.Discretechoicemodelling
maybehelpedsomewhatbecausetheerrorsinthisformofanalysishaveatighterdistributionthanwithmostprocedures.ThisiscalledaGumbeldistribution.WecanseethisinFigure4.6.Smallererrorsmeanthatsamplesindiscretechoicemodellingstudiesmayactlikebiggersampleswithstandardmeasurements.
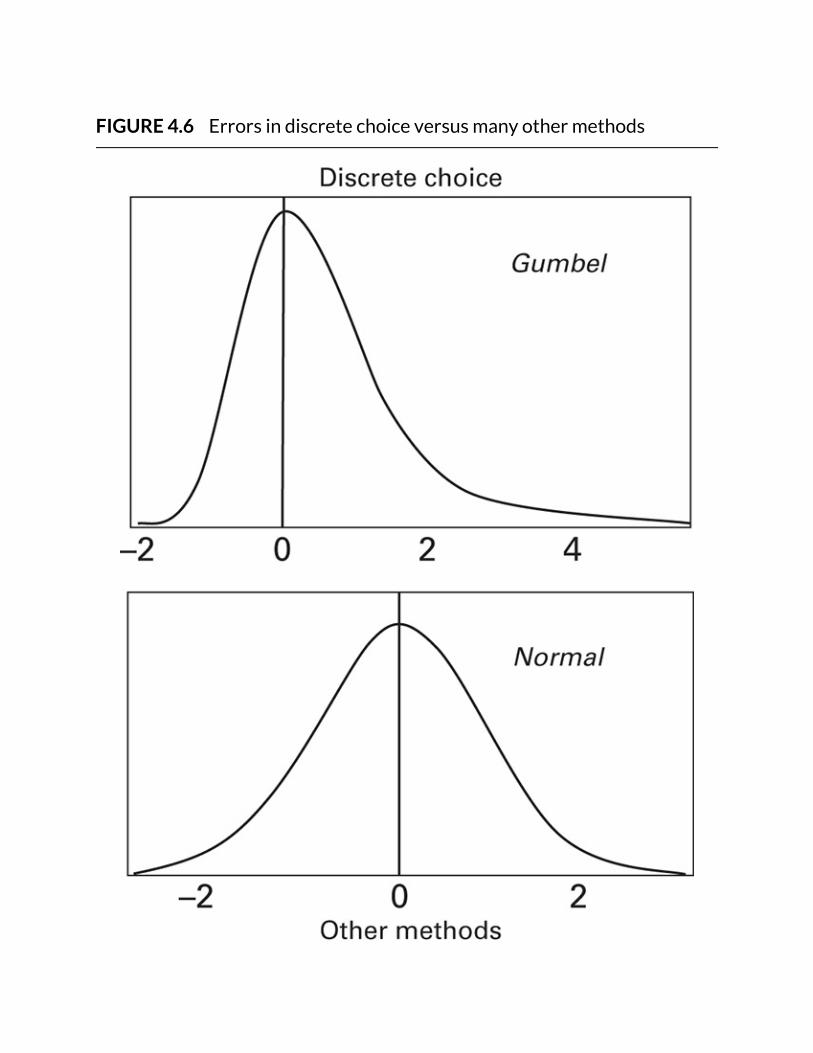
FIGURE4.6Errorsindiscretechoiceversusmanyothermethods
Aboutthosecurves
AboutthosecurvesSomeofyoumaylookatthenormalcurveandsaysomethinglike,‘Oh, yes, that.’ Others might have a vague, if not terror-filled,recollection of something you probably should not have dozedthrough in Statistics 101. So that everyone is up to speed, thenormal distribution appears many times when we measurephysicalphenomena(henceitsname,normal).For instance, the belt sizes ofmen’s pants in the army follow a
normaldistribution.Theheightofthecurverepresentshowmanyitemsorobservationsfallatthatpoint.Wecanseethatthemostfallright at the average. In Figure 4.6, the average is set to zero, anddifferencesfromtheaverageareeitherpositiveornegative.Aswegetfurtherfromtheaverage,therearefewerobservationsoritems.Thiscurveissymmetrical,withasmanybelowbyacertainmarginasabovebythesamemargin.Errors in measurement in mathematical models also often fall
intothesamekindofnormalcurve.NotsotheGumbeldistribution.Bycomparison,itistallerandpinchedintowardsthemiddle,withrelativelymoresmallerrors.Italsoisnotsymmetrical.Itskewsoutfurtheronthepositiveside.Thatpinchingaroundtheaverageis theimportantpart.Smaller
errorsmean thatmeasurement is somewhatmore accurate for agivensamplesizethanwithmanymethodswetypicallyuse.
Backtoourtopic
Recall that with HB analysis you can create a large experiment,varyingmanyattributesandattributelevels,andnotneedtomakea compensating increase in sample. This helps keep the size andcost of studies involving discrete choice modelling in line. Withexceptionallylargeexperiments,youstillmayneedtoincreasethesampletogetenoughformakinggoodmeasurements.This definitely happens when you need more than 48
marketplacescenarios,equalling48screensthatyouwouldneedtoshow. Evendividing this by three, thiswould result in 16 screensperpersonparticipatinginthestudy–aheftyburdenonthepoorstudyparticipant.Someexpertswouldsaythatdividingthedesignbythreeandnot
increasing the sample is stretching too much. Staying moreconservative, any experimental design requiring over 36 marketscenariosmust have an increased sample.With 36 scenarios, thatwouldinvolvedividingthetotaldesignintotwoparts,showingeachperson18.Studies can grow unexpectedly. Not long ago, one became
monstrous,with77 candy choicesappearingona simulated shelf.Thismany is not recommended. The story is tangled, featuring aclient that somehowgot out of control, andan inexperiencedandhighly confused person getting into the middle of the planningprocess.Thisstudysetouttomeasuretheeffectsofcertaincandiesbeing removed from themarket. Some products were consideredessential,itemsthatneverwouldbeoutofstockandsoshouldhavebeenalwayspresent.However,55candychoicescouldbethereornot. This required 60 marketplace scenarios. Since the averagecandy buyer was not expected to remain patient with repeatedlyseeingsimulatedstoreshelves,eachpersonmadechoicesin10outofthe60marketplaces.Thestudyusedasampleof1,000,andthenallowed no more than two-way divisions of the total intosubsamples;500wastheminimumgroupsizeanalysed.Allinvolvedheldtheircollectivebreaths,duetothedifficultiesin
attempting to measure so much in one study. Fortunately, sharepredictionsprovedtobeaccurate,evenforcandieswithsharesthatwereafractionofapercentagepoint.Wecouldmakecomparisonsbecause the sponsoring company had extensive sales data.Whensimulationsweresettocurrentmarketconditions,resultsfittedthemarketplace.
UtilityandshareGoingbacktoearlierchapters,youmayrecall thatdiscretechoicemodelling uses utility as a way of keeping score. This allowsvarious features and prices to be valued on a common footing.However, thismethod does not assume that utility has a straight-linerelationshipwithmoreshare.Rather,discretechoicemodellingusesanS-shapedrelationshiporresponsecurve.This matches how people respond perceptually to their
environment. For instance, suppose a light source is slowlyincreased in brightness from zero. When the light is sufficientlydim, small increases in brightness hardly register as differences.Then when the perceptual threshold is reached, increases inintensity register more strongly. This is themid-portion of the S-curve. Finally, continuing to dial up the illumination, anotherthreshold is reached where the light becomes too bright. Thenfurtherincreasescannotbeperceived.Thiscurvealsomatchesmarketplacebehaviour.Utilitymustpass
a certain threshold to get a noticeable response – that is, smallerproducts tend to get lost in the shuffle.When a product becomessufficiently salient, small increments in utility boost responsesstrongly.Finally,saturationisreached.Atthatpoint,bigchangesinutility are needed to move those strongly committed to otherchoices.Itishardtomovepeoplewithentrenchedpreferencesandsoapproachanearlyunanimousresponselevel.Recent research into decision making, in particular prospect
theory (forwhichDanielKahnemanwonaNobelPrize) is largelyconsistentwith thisviewofutility.Prospect theoryalsousesanS-curve, but one that is less symmetrical. Figure 4.7 showshow theprospect theory S-curve compares with the one hypothesized bydiscretechoicemodelling.
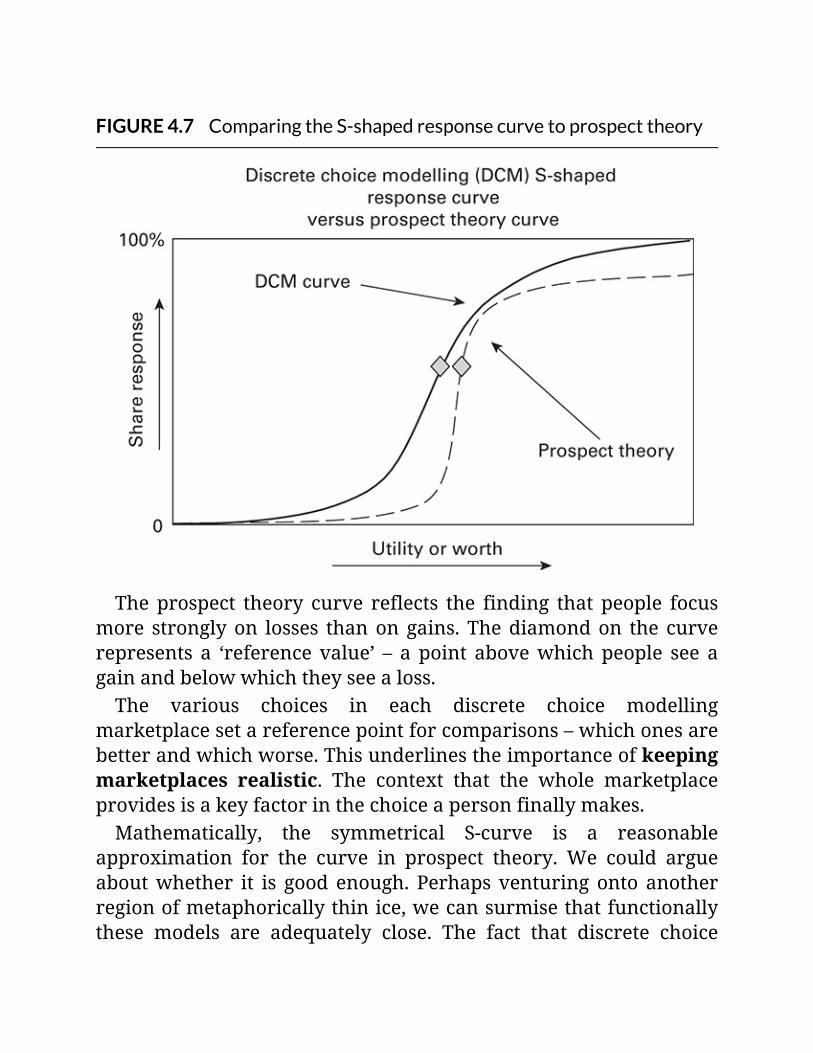
FIGURE4.7ComparingtheS-shapedresponsecurvetoprospecttheory
Theprospect theory curve reflects the finding that people focusmore stronglyon losses thanongains.Thediamondon the curverepresents a ‘reference value’ – a point abovewhichpeople see againandbelowwhichtheyseealoss.The various choices in each discrete choice modelling
marketplacesetareferencepointforcomparisons–whichonesarebetterandwhichworse.Thisunderlinestheimportanceofkeepingmarketplaces realistic. The context that the whole marketplaceprovidesisakeyfactorinthechoiceapersonfinallymakes.Mathematically, the symmetrical S-curve is a reasonable
approximation for the curve in prospect theory. We could argueaboutwhether it is good enough. Perhaps venturing onto anotherregionofmetaphoricallythinice,wecansurmisethatfunctionallythese models are adequately close. The fact that discrete choice
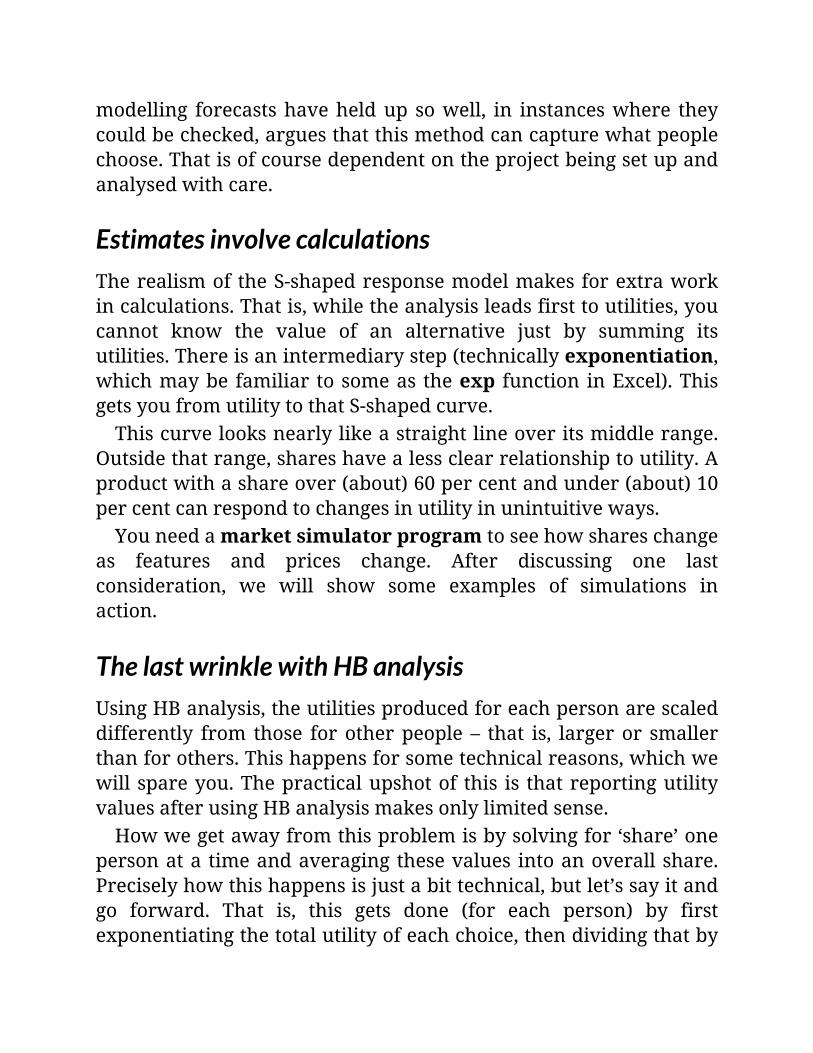
modelling forecastshaveheldup sowell, in instanceswhere theycouldbechecked,arguesthatthismethodcancapturewhatpeoplechoose.Thatisofcoursedependentontheprojectbeingsetupandanalysedwithcare.
EstimatesinvolvecalculationsTherealismoftheS-shapedresponsemodelmakesforextraworkincalculations.Thatis,whiletheanalysisleadsfirsttoutilities,youcannot know the value of an alternative just by summing itsutilities.Thereisanintermediarystep(technicallyexponentiation,whichmaybe familiar tosomeas theexp function inExcel).ThisgetsyoufromutilitytothatS-shapedcurve.Thiscurvelooksnearlylikeastraightlineoveritsmiddlerange.
Outsidethatrange,shareshavealessclearrelationshiptoutility.Aproductwithashareover(about)60percentandunder(about)10percentcanrespondtochangesinutilityinunintuitiveways.Youneedamarketsimulatorprogramtoseehowshareschange
as features and prices change. After discussing one lastconsideration, we will show some examples of simulations inaction.
ThelastwrinklewithHBanalysisUsingHBanalysis,theutilitiesproducedforeachpersonarescaleddifferently from those forotherpeople – that is, largeror smallerthanforothers.Thishappensforsometechnicalreasons,whichwewillspareyou.Thepracticalupshotof this is thatreportingutilityvaluesafterusingHBanalysismakesonlylimitedsense.Howwegetawayfromthisproblemisbysolvingfor‘share’one
personata timeandaveragingthesevalues intoanoverallshare.Preciselyhowthishappensisjustabittechnical,butlet’ssayitandgo forward. That is, this gets done (for each person) by firstexponentiatingthetotalutilityofeachchoice,thendividingthatby
theexponentiatedsumofallthechoices’utilities.Wethenaverageallthesecalculatedresults.In any event, remain cautious if you see a report of utilities.
Instead,youshouldbeusingamarketsimulatorandobservingtheeffectsonshareofchangingfeaturesandprices.Andthisbringsusdirectlytothetopicofmarketsimulations.
MarketsimulationsIn amarket simulation program – perhaps the best thing sinceslicedbread–allthehardworkfinallypaysdividends.Itprovidesapowerfulculminationtoeverythingdoneinselectingattributesandlevels, in getting a good experimental design, in making themarketplaces, indoing theanalysis, ingivingyourpoor computeritsworkoutforthemonth,andintweakingExceluntilitdoeswhatyouneed.
OurfirstsimulatorThefirstsuchprogramwediscussisarelativelysimpleone,fromastudy that has been disguised slightly for use here. It involvedcommercialpurchasersofprinters.Thebasic situationwas this: ifcustomerscommittedtobuyingacertainnumberofprinters, theycould get a cash and/or non-cash incentive. The main questionaddressed was which of these it would be best to offer. Anotherfactormeasuredwas thepriceof theprintermodel thatmightbeusedinconnectionwiththisbulkpurchase.That is, the client wanted to measure how share would be
affected by different prices and different incentives. They alsowanted to knowwhatwouldhappen if competitors respondedbyofferingtheirownincentivesatvariouspricepoints.Study participants chose among these offerings and could also
choose‘noneofthese’ifallthecompetingoffersdidnotmeettheir

needs.Theywere told to imagine that they reallyneeded tomakesuchapurchase,butthattheycouldoptoutifallthechoiceswereunacceptable.Theysawrealbrandnames,whichwehavealteredinthisexample.Figure4.8showsapartofthissimulator.Inthistheusercouldset
thecurrentcase.Thiswouldbetheconfigurationthattheywantedto test in a given simulation. The other part of the simulator, inwhichtheuserwouldsetthereferencecase,appearsinFigure4.9.Together both sections are too large to read comfortably in print.(Excel,wherethissimulatorwasconstructed,allowsuserstoscrollaroundthescreentoseedifferentpartsofagivendisplay.)
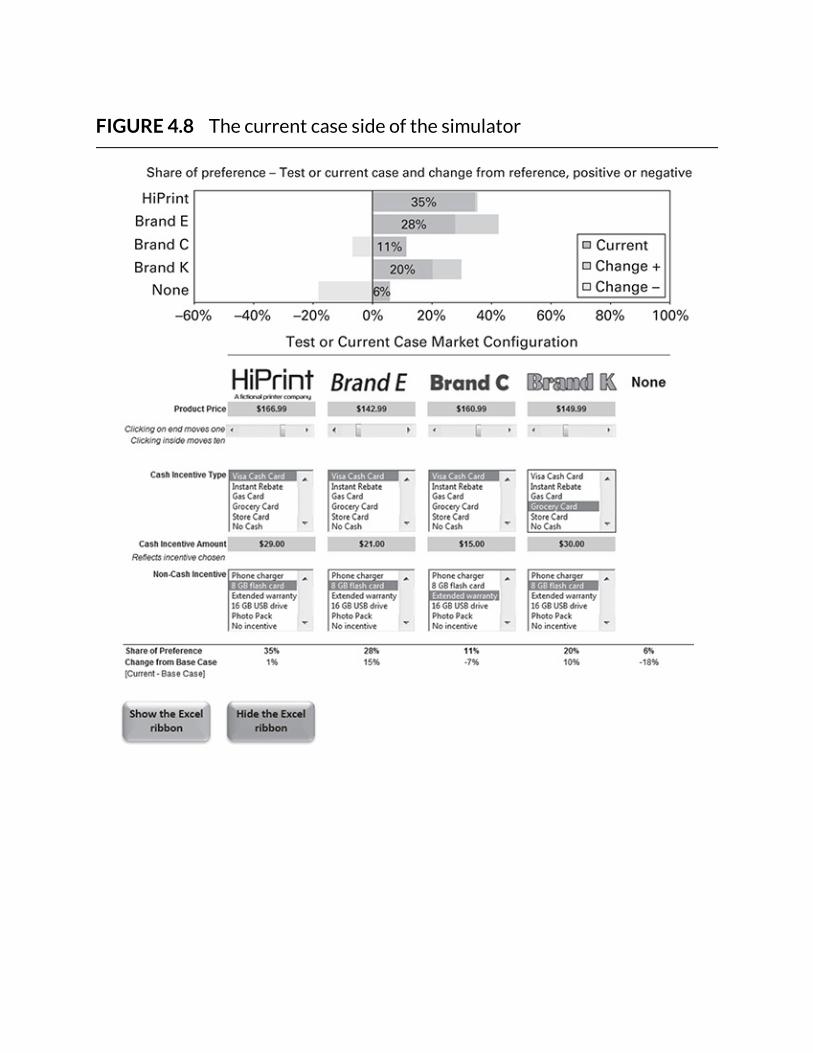
FIGURE4.8Thecurrentcasesideofthesimulator
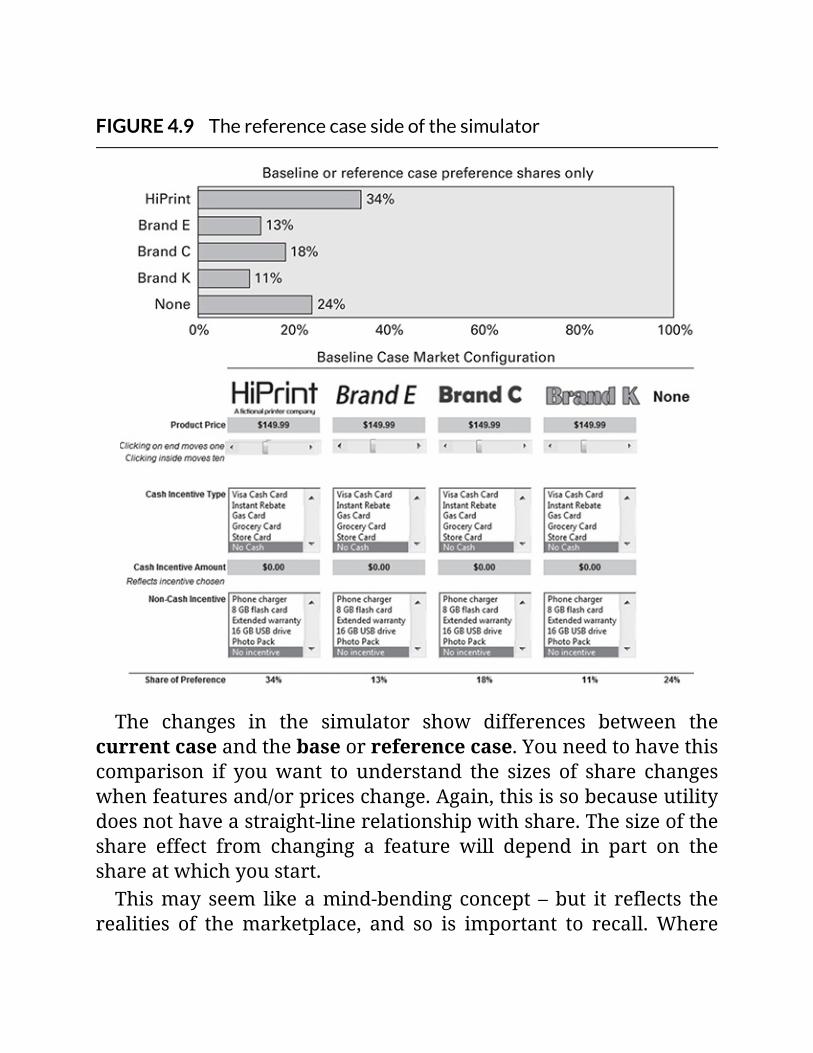
FIGURE4.9Thereferencecasesideofthesimulator
The changes in the simulator show differences between thecurrentcaseandthebaseorreferencecase.Youneedtohavethiscomparison if youwant to understand the sizes of share changeswhenfeaturesand/orpriceschange.Again,thisissobecauseutilitydoesnothaveastraight-linerelationshipwithshare.Thesizeoftheshare effect from changing a feature will depend in part on theshareatwhichyoustart.Thismay seem likeamind-bending concept –but it reflects the
realities of themarketplace, and so is important to recall.Where

you start in the marketplace can influence how strongly themarketplacerespondstowhateveryouarechanging.Startingfroma sufficiently low share can cause the share effects of makingchanges toyourproductor servicestronglynon-linear.Addingagiven amount of utilitymay produce little effect, then adding thesameamountmayincreasesharemuchmore,forinstance.YoucanseethisphenomenonreflectedinFigure4.7.Depending
onwhere you start on that S-curve, effects in share arising fromadding a given amount of utility can vary widely. This definitelymeritsbeingcalledout.Figure 4.9 shows the reference or base case portion of the
simulator. This section can be reconfigured – that is, the featuresand prices can be changed – so that you can still understand theshare effects of any change that youmake, should the current orreferencesituationchange.
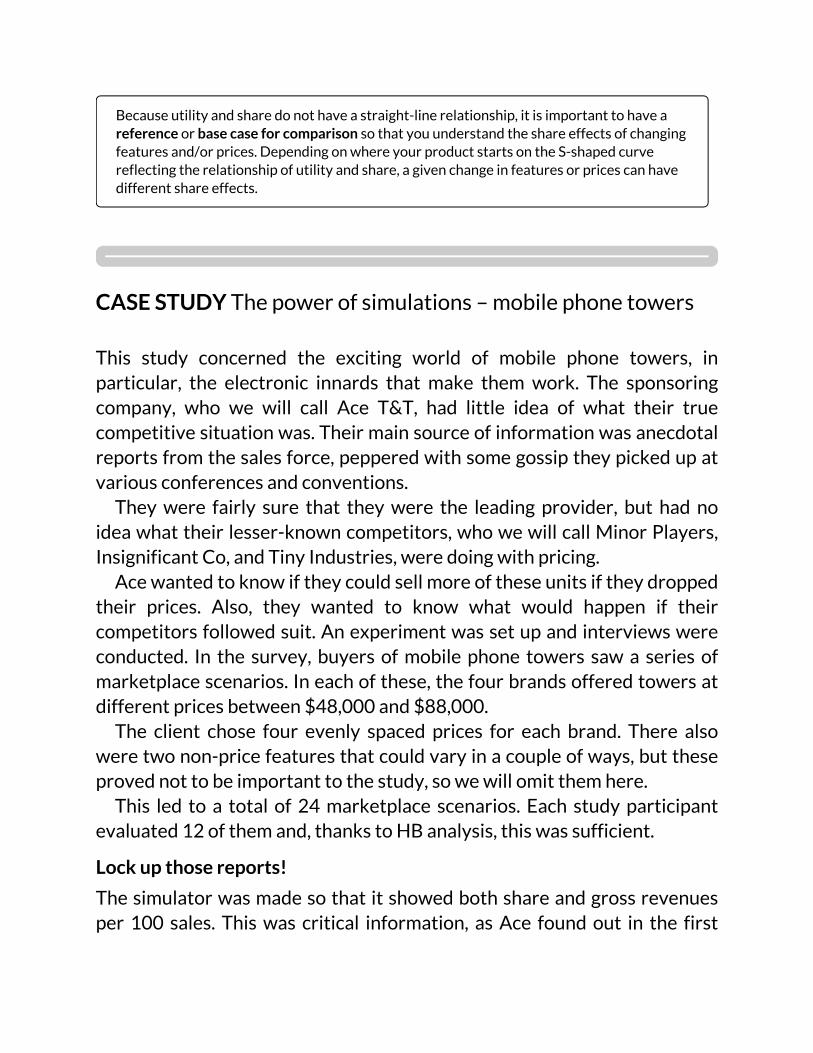
Becauseutilityandsharedonothaveastraight-linerelationship,itisimportanttohaveareferenceorbasecaseforcomparisonsothatyouunderstandtheshareeffectsofchangingfeaturesand/orprices.DependingonwhereyourproductstartsontheS-shapedcurvereflectingtherelationshipofutilityandshare,agivenchangeinfeaturesorpricescanhavedifferentshareeffects.
CASESTUDYThepowerofsimulations–mobilephonetowers
This study concerned the exciting world of mobile phone towers, inparticular, the electronic innards that make them work. The sponsoringcompany, who we will call Ace T&T, had little idea of what their truecompetitivesituationwas.Theirmainsourceofinformationwasanecdotalreportsfromthesalesforce,pepperedwithsomegossiptheypickedupatvariousconferencesandconventions.Theywere fairly sure that theywere the leading provider, but had no
ideawhattheirlesser-knowncompetitors,whowewillcallMinorPlayers,InsignificantCo,andTinyIndustries,weredoingwithpricing.Acewantedtoknowiftheycouldsellmoreoftheseunitsiftheydropped
their prices. Also, they wanted to know what would happen if theircompetitorsfollowedsuit.Anexperimentwassetupandinterviewswereconducted. In the survey, buyersofmobile phone towers sawa series ofmarketplacescenarios.Ineachofthese,thefourbrandsofferedtowersatdifferentpricesbetween$48,000and$88,000.The client chose four evenly spaced prices for each brand. There also
weretwonon-pricefeaturesthatcouldvaryinacoupleofways,buttheseprovednottobeimportanttothestudy,sowewillomitthemhere.This led to a total of 24marketplace scenarios. Each study participant
evaluated12ofthemand,thankstoHBanalysis,thiswassufficient.
Lockupthosereports!
Thesimulatorwasmadesothatitshowedbothshareandgrossrevenuesper 100 sales. Thiswas critical information, asAce foundout in the first

simulations it tried. They set the reference point to the average currentpricerevealedintheresearch:$68,000.Notethat‘noneofthese’wasastudyoptionbutwasnotreported.This
didnotexceed1percentuntilallpriceswereover$82,000.Thesewereboomtimes,ifnotthegoldenage,formobilephonetowers.In any event, in simulations, Ace first set all brands’ prices to that
$68,000average.They thendroppedtheirprice to$52,000.This initiallyseemedgoodforthem,astheirestimatedsharewentfrom38percentto46percent.Thismeantashareincreaseequalto46/38or121percent.However, if the other brands somehow stumbled onto what Ace was
doing andmatched their pricedecrease,Acewould endupnearlywheretheystarted,ata39percentshare.WecanseethisinFigure4.10,wheretheresultsofthesetwosimulationsappearinchartformat.
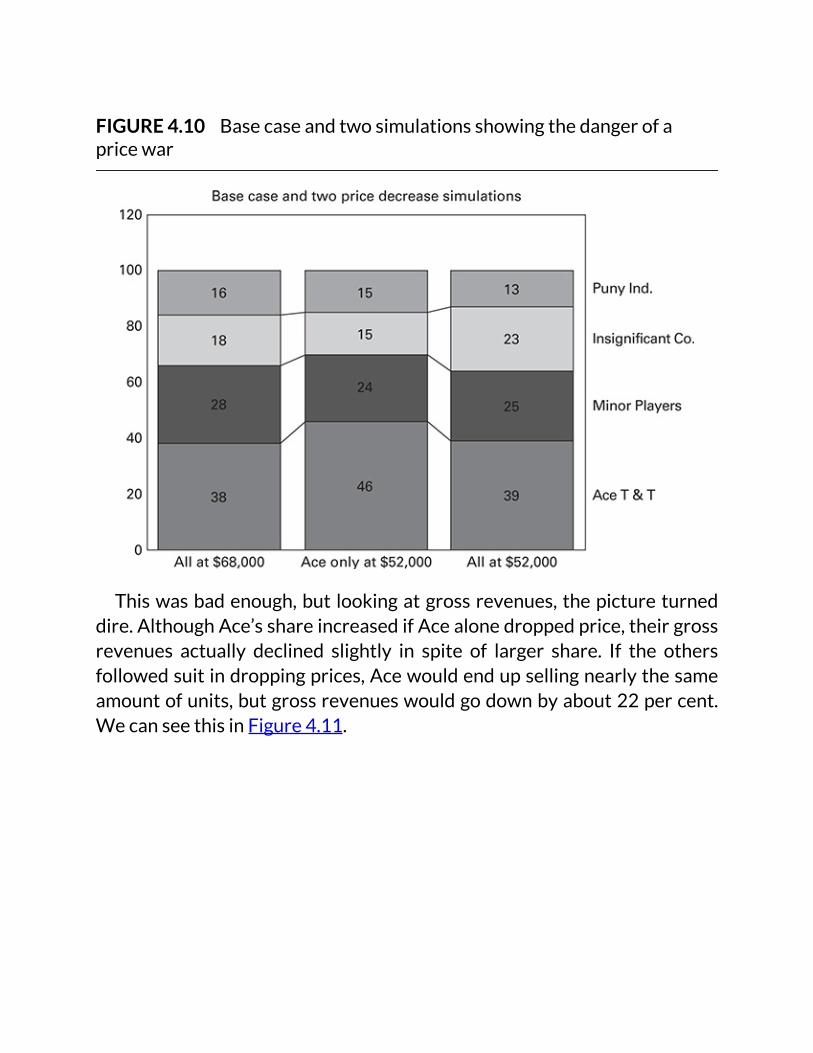
FIGURE4.10Basecaseandtwosimulationsshowingthedangerofapricewar
Thiswasbadenough,but lookingatgrossrevenues,thepictureturneddire.AlthoughAce’sshareincreasedifAcealonedroppedprice,theirgrossrevenues actually declined slightly in spite of larger share. If the othersfollowedsuitindroppingprices,Acewouldendupsellingnearlythesameamountofunits,butgrossrevenueswouldgodownbyabout22percent.WecanseethisinFigure4.11.
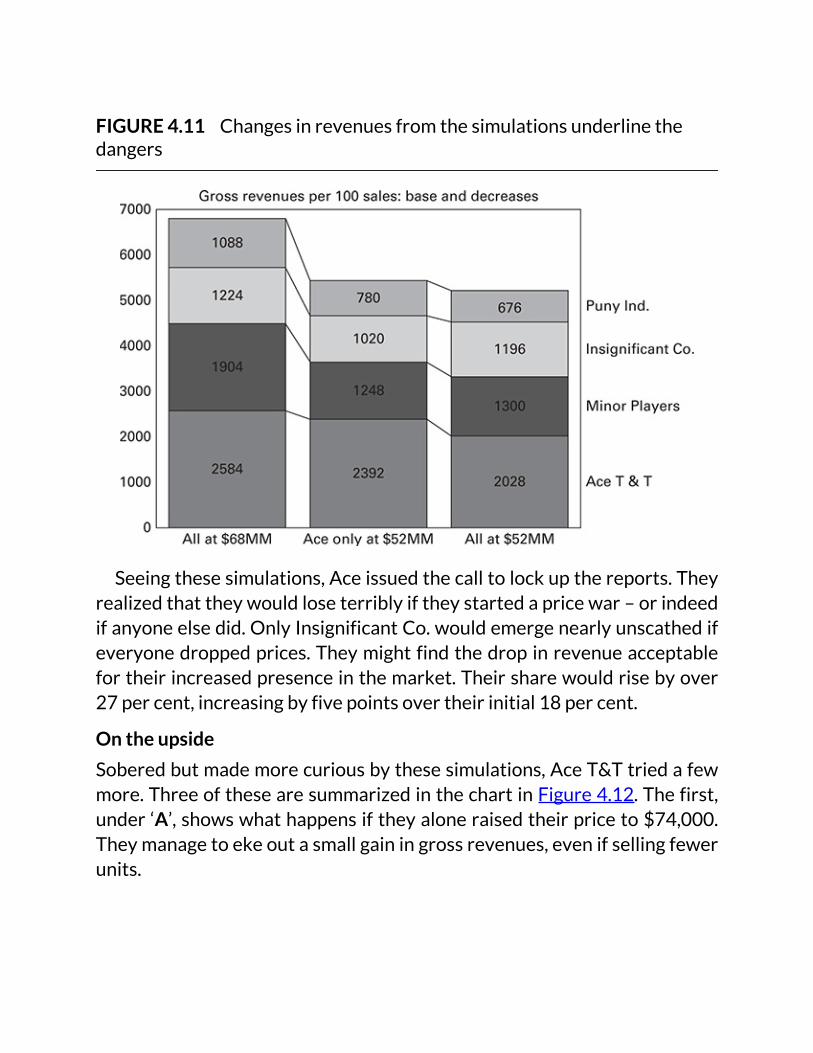
FIGURE4.11Changesinrevenuesfromthesimulationsunderlinethedangers
Seeingthesesimulations,Aceissuedthecalltolockupthereports.Theyrealizedthattheywouldloseterriblyiftheystartedapricewar–orindeedifanyoneelsedid.OnlyInsignificantCo.wouldemergenearlyunscathedifeveryonedroppedprices.Theymightfindthedropinrevenueacceptablefortheirincreasedpresenceinthemarket.Theirsharewouldrisebyover27percent,increasingbyfivepointsovertheirinitial18percent.
Ontheupside
Soberedbutmademorecuriousbythesesimulations,AceT&Ttriedafewmore.ThreeofthesearesummarizedinthechartinFigure4.12.Thefirst,under‘A’,showswhathappensiftheyaloneraisedtheirpriceto$74,000.Theymanagetoekeoutasmallgainingrossrevenues,evenifsellingfewerunits.
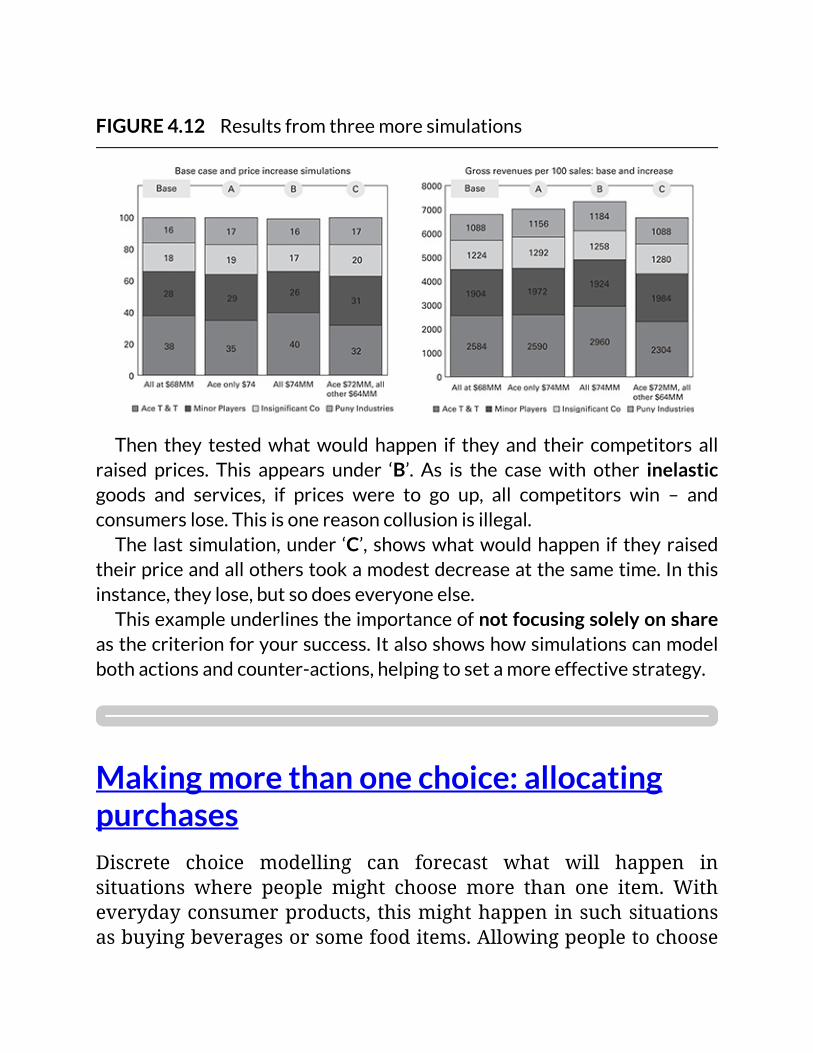
FIGURE4.12Resultsfromthreemoresimulations
Then they testedwhatwould happen if they and their competitors allraised prices. This appears under ‘B’. As is the case with other inelasticgoods and services, if prices were to go up, all competitors win – andconsumerslose.Thisisonereasoncollusionisillegal.The last simulation,under ‘C’, showswhatwouldhappen if they raised
theirpriceandallotherstookamodestdecreaseatthesametime.Inthisinstance,theylose,butsodoeseveryoneelse.Thisexampleunderlinestheimportanceofnotfocusingsolelyonshare
asthecriterionforyoursuccess.Italsoshowshowsimulationscanmodelbothactionsandcounter-actions,helpingtosetamoreeffectivestrategy.
Makingmorethanonechoice:allocatingpurchasesDiscrete choice modelling can forecast what will happen insituations where people might choose more than one item. Witheverydayconsumerproducts, thismighthappeninsuchsituationsasbuyingbeveragesorsomefooditems.Allowingpeopletochoose
morethanoneitemiscalledallocatingpurchases.Allocationoftenmakessensewithbusiness-to-businesspurchase
decisions. As an example, many studies among doctors ask whattheywouldprescribefor10or20typicalpatientsand/orpatientsofspecific types. This makes sense because doctors often prescribeseveraldifferentdrugs for thesamecondition,dependingonsuchfactors as other drugs the patients are taking, diseases anddisordersthattheyhave,thepatient’sageandsoon.Thesimulatorweshowedatthebeginningofthischapterisbased
ondoctorsallocating20patientstothedifferenttherapiesavailable.Theydid twoallocations in eachmarketplace that theyevaluated,oneforallpatientsandonefornewlydiagnosedpatients.While it is possible to allow people to choose asmany items as
they like, this can getmessy to analyse. Asking people to allocateacrossasetnumberofpurchases,suchasthenext10,alwaysworkswell.
UsingthesimulatorprogramintheonlineresourcesDownload the program (available at www.koganpage.com/AI-Marketing) and open it with Microsoft Excel. If Excel is feelingreasonablywell, theprogramwill open and theExcel ribbon (thebar across the top with menus and commands) will temporarilyvanish. Two buttons on each page of the simulator allow you tocontrolwhethertheExcelribbonappearsornot.ThesebuttonsareshowninFigure4.13.Ifyoucannotseethem,andneedtousethem,pleasescrolldownuntiltheyarevisible.

FIGURE4.13Pagedisplaycontrolsinthedownloadablesimulator
If you want to continue working in Excel after using thesimulator,restoretheribbontoview,andthenclosethefileusingthemenu.If thesimulatoris theonlyfileopen,usingthesmall ‘X’thatappearsintheuppermostrightcornerofthescreenwillmakeExcelclose.If Excel is baulkingat opening the simulator, please reassure it,
clickingtheoptionitpresentstosayitisfinetorunmacros.Ifthisstilldoesnotwork,gotothethirdtabinthesimulator,‘SecurityinExcel 2007 and beyond’. Follow the instructions there and Excelshouldatlastcooperate.The first page of the simulator has some general instructions.
Theseareimportanttoincludewithanysimulatorthatwillfinditsway around an organization, or in case someone opens it after afewmonthshavepassed.Thenextsheetistheactualsimulator.Figure4.14showstheleft
sideofthescreenthatyouwillfindonthissheet.Hereyouhaveallthe controls for setting the current case and for establishing areferenceorbasecase.

FIGURE4.14Theleftsideofthedownloadablesimulator
Pricesandamountsofhorsepowerrunusingslidingcontrols.Youeither canpull these to thedesiredvalues or clickon the endsorinside the control. Clicking on an end (arrow) of the horsepowercontrol changes it by one unit; clicking inside it changes it by 10units.Clickingonanendofthepricecontrolchangesitby10units,whileclickinginsidechangesitby100units.All the other features are either present or absent. You choose
whethereachisapartofthefeaturepackagebyclickingeitheron

‘Yes’or‘No’.Atthebottomofthissideofthepageyouwillfindasetofcontrol
buttonsthatallowyoutocontrolwhethertheExcelribbonisvisibleor not. A last set of identical controls also appears at the bottomrightofthepageaboutsecurityinExcel.Figure4.15showsthevariousdisplaysinthesimulatorthatresult
fromthechosenvaluesofthecurrentandreferencecases.Thetopsectionhasnumericalinformation.
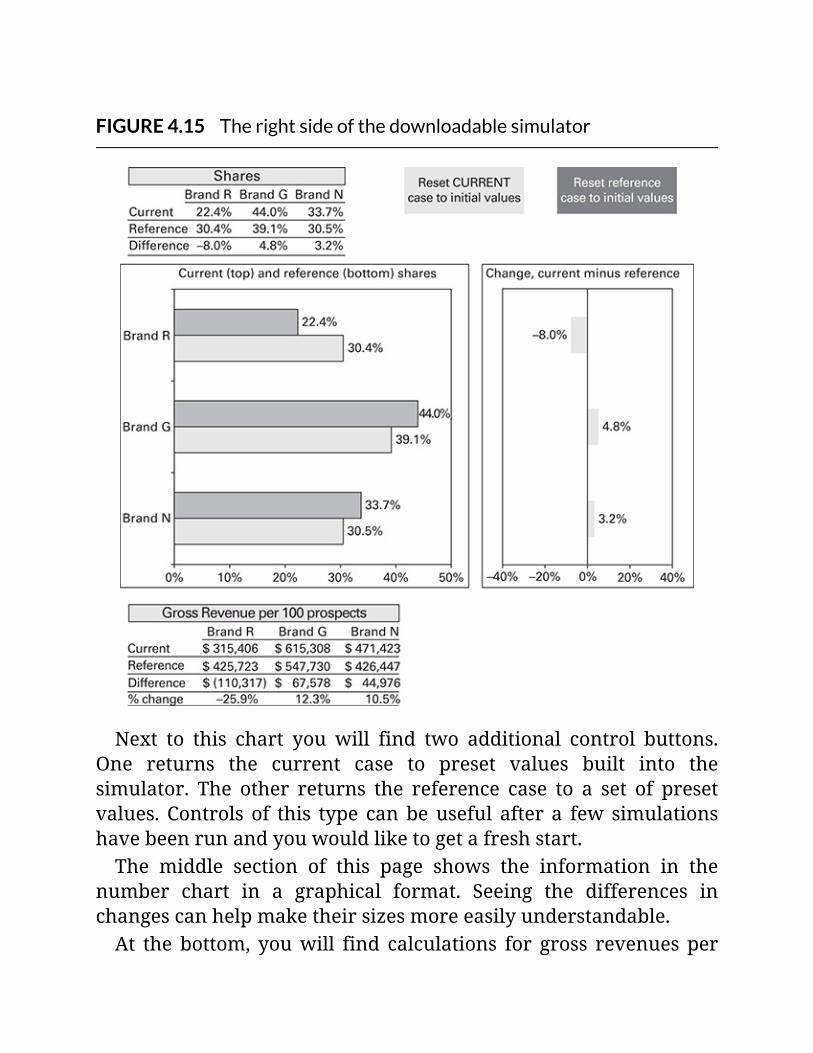
FIGURE4.15Therightsideofthedownloadablesimulator
Next to this chart you will find two additional control buttons.One returns the current case to preset values built into thesimulator. The other returns the reference case to a set of presetvalues. Controls of this type canbeuseful after a few simulationshavebeenrunandyouwouldliketogetafreshstart.The middle section of this page shows the information in the
number chart in a graphical format. Seeing the differences inchangescanhelpmaketheirsizesmoreeasilyunderstandable.At the bottom, youwill find calculations for gross revenues per

100 sales. These are gross revenues because no costs (such asdistribution, advertising or other kinds of overhead) are offsetagainstthem.Again, inmanycases,goingforthelargestsharemaynotbethe
best policy for getting themost revenue. This chart allows you tokeeptrackofbothshareandgrosssales.
UsingExceltooptimizeApowerfuloptimizer is built into Excel itself. This allows you tofindthesimulatorsettingsthatleadtothebestpossibleoutcomeinspecific situations. It is called the ‘solver’. It is not part of thesimulator itself, but runs in conjunction with the simulator’scontrols.You need to load the solver before you use it. The instructions
fromMicrosoft for loading and running this add-onare clear andeasy to follow. You could use the optimizer to answer questionssuchas,‘Whatisthemixofpriceandfeaturesthatwilloptimizemyrevenues if competitors stay as they are now?’ You could thenansweranotherquestion, suchas, ‘Whatwilloptimizerevenues ifmycompetitorsthendroptheirpricesby10percent?’Addressing questions like these can add a new dimension to
predicting changes in share and revenue. Depending on theobjectives of the project, optimization can provide valuablestrategicinsights.
RoundingoutthepictureThischapterhasbecomethelongestandmostcomplexinthisbook.First, congratulations for persevering. We have actually omittedmuch,inparticularvastswathsofamoretechnicalnature.Still,wehavejustafewlasttopicstoconsider.
Compensatoryversusnon-compensatory:whatisthis
Compensatoryversusnon-compensatory:whatisthisallabout?Somecriticismsofdiscretechoicemodellinghavearisenbasedontheories that people do not weigh attributes and sum utilities tomake decisions. These so-callednon-compensatory theories seemperfectlynon-objectionable,asweindeedhavenoclearideaofhowdecisionsgetweighed.However,andletusspeakplainlyhere, theargument that this somehow invalidates choice modelling isnonsense.Someofthesecriticismssaythatpeoplepickcertainfeaturesfirst,
eliminate choicesbasedon those, and thennarrowdown in someway. To these critics, this throws into questionwhat people do inchoicemodels.Weunderstandwhatthesecriticsaresayingandcansympathize
withit,buttheyarewrong.Justbecausechoicemodellingpresentsaproductasasetofattributes,thisdoesnotforcepeopletoweighandbalanceeverything theyareseeing.People indeedcan lookatthemarketplacespresented to themanduseanydecisionstrategythattheywoulduseintheactualmarketplace.We can see by watching how people decide that they have
different strategies.Onepartofmanystudies is sittingwitha fewpeople before the formal interviews start and going through themarketplaces.Duringthisphase,youaskpeopletotalkaboutwhatthey are doing, ask questions and do a great deal of observation.Somepeopledoindeedfocusinonasingleattribute,suchaspriceorbrand, somebalance twoor three of them, and somemake anearnestefforttobalancemultiplefactors.Discrete choice modelling can accommodate and reflect any of
these strategies. The problem with arguments about ‘non-compensatory’ decision making seems to lie in confusing acapability of discrete choice modelling with a requirement ofdiscrete choice modelling. That is, it can model people makingcomplicateddecisionswheretheytrytotradeallattributes.Butthat
does not mean that anyone has to do that. People can makedecisionsaccordingtosimplerrulesandthemethodwillstillworkaccurately.
SomelessfortuitousapplicationsWe have already spoken about the dangers of poorly definedprojects,unclearterminologyandunrealisticrepresentationsofthemarketplace.Earlierwereviewedthepitfallsoftalkingto(orabout)thewrongpeople,andofputtingsomanyrestrictionsonselectingpeople forasurvey thatyou lose trackofwhotheyrepresent.Butwhat if you get all the basics right? When could discrete choicemodellingnotworkwell?We have seen problems with certain types of products or
services.First,let’sconsiderproductsasrangingalongacontinuum,from more cognitive (or having more to think about) to moreaffective or sensory (or more feeling-based). Trade-off methodsworkbestwhereproductshavemorecognitiveelements.Sometimes it is very difficult to get people to trade affective or
sensory elements. For instance, in a trade-off exercise, people donot accurately trade off ‘tastes good’ against other productattributes. We know that in real life, people will consume somefairly awful items in the interest of saving money. For instance,certainstorebrandsofnon-fatcreamcheeseare indistinguishablefromwindowcaulkingexceptthattheydonotholdupaswellasthecaulktotheelements.Yettheseremainonsale.However, you will almost never encounter a person who will
admit in a survey to eating something that tastesworse than thecontainer it comes in, just to save a few pennies. Such a purelysensorytrade-offisarareinstancewherethein-marketexperiencedoesnottranslatewellintothesettingofaninterview.Inanyevent,never try to trade off worse taste, aroma or feel versus otherfeaturesinadiscretechoicemodel.However, people can show that they respond differently to
variousbrands.Forinstance,Sonyoncecommandedahigherpricethanotherbrandsforthesamesetoffeatures.Therefore,featuresonce were worth more with the Sony name. This shows that arather amorphousquantity suchas ‘brand identity’ can in fact bemeasured in a choice study – by the hard-edged metric of whatpeoplechoose.
VariantsofchoicemodellingA number of variants of discrete choice modelling have beenproposed.Someofthebetter-knownonescomefromonecompany,Sawtooth Software. These include menu-based choice basedmodelling,whichaimstoaddressthespecificproblemofmodellingchoicesfromcompaniesthatofferamenuofchoices,suchasphonecompanies on their websites. You can set up a standard discretechoicemodellingstudytogetclosetothis,butnotexactlywhatyouwould see on such awebsite.Another offering is adaptive choice-based modelling, which seemingly chases the chimera of non-compensatorydecisionmaking.Theseareinterestingideas,butsofarhavebeensupportedonly
bypaperspublishedonthecompanywebsite,or insomecasesbypapers from loosely vetted industry conferences. This does notmeanthatthereisanythingwrongwiththeworkinvolved,justthatthesehavenotyetbeenhelduptorigorousacademicstandards.AsmentionedinChapter1,everymethodwediscussindetailhas
topassinboththesphereofpeer-reviewedpapersandinthetestofpractical application. So far, then, these variants have intriguingideas,butnomore.Perhaps the best-known alternative, a software product called
Choice-Based-Conjoint, or CBC, has gained many followers. Tosome, this (wrongly) is seen as the same as synonymous withdiscrete choice modelling. Actually, though, the name of thisproduct ishonest. It ispartly conjointanalysisandpartlydiscretechoicemodelling.

Because of this hybrid nature, CBC will appear in Chapter 5,whereweexplainconjointanalysis.There,youwillbeable to seewhatCBCtakesfromthisapproachandwhatittakesfromdiscretechoicemodelling.
SummaryofkeypointsDiscrete choice modelling is arguably the most powerful andsophisticatedmethodfordeterminingtheexactmixoffeaturesandpricestoincludeinaproductorservice.Itfocusesonwhatpeoplewill choose. Itprovides someof themostpowerfuloutputsofanyanalytical method, in particular interactive market simulatorprograms.These showyoupreciselywhatwillhappen to shareofpreferencewhenproducts’featuresand/orpricesarechanged.Ifyoucanmanagetothinkaheadtowhatcompetitorsmostlikely
will do, then you can cover not only what would happen if youchangeyourownfineproductorservice,butalsowhatwillhappenwhencompetitorsrespond.The method uses a survey that shows people realistic
representationsofthechoicestheyhavetomake.Eachpersonwillsee a series of these marketplace scenarios, and in each theysimplysaywhattheywouldchoose,justastheydoinreallife.Theproblemcanalsobesetupsothattheycansaytheywouldchoose‘none of them’ in each marketplace. This greatly increases therealismoftheexercise.Thereareveryfewsituationsindeedwherepeople cannot sit outmaking a purchase, evenwhen the need isstrong.Discrete choice modelling considers products or services as
collectionsofattributes.Inthestudytheseattributesarevariedinspecific ways. For continuous attributes, such as car horsepower,onlycertainspecificvaluesaretested.Thedifferentvaluesthataretested are called levels. For instance, if the engine could haveanywherefrom150to240horsepower,wemighttest150,180,210
and240asthelevels.Todeterminethevaluesinbetweenwewouldinterpolate.Discretechoicemodellingisbasedonstrictexperimentaldesigns
that govern which level of each attribute appears in a givenmarketplace scenario.As youmeasuremoreattributes and levels,theexperimentmustgrowlargertomeasurethem.Itisimportanttomeasureexactlywhatyouneed–andnomore.
People doing a discrete choice study typically start to tire afterevaluating 6–12marketplaces.Most peoplewill stickwith it for afewmore,butabout21isthelimitevenforhighlyanalyticalstudyparticipants.Therefore, careful discussion of precisely what goes into a
discrete choice modelling study is critical. So is a goodunderstandingofthemarketplaceitselfbeforeyoustartthestudy.Youtrulyneedtozeroinonwhatmatters.Recall that you need to have one marketplace scenario to
measureatwo-levelattribute,forinstance,andthreetomeasureafour-levelattribute.Thisunderlinestheneedforeconomy.
Utilitiesandchoices
Discretechoicemodellingusesabstractquantitiescalledutilitiesasakindofbookkeeping.Theseunitsallowustocomparetheeffectsofdifferentattributesandprices.Thisuseofutilitiesdoesnotmeanthat the method assumes people will look at and weigh all theattributesthattheysee.Peoplecanfocusonasingleattribute,suchasprice,theycanlookatafewofthem,ortheycanmakecareful,exacting decisions. Whatever their strategy, this method willaccommodateit.The aim of thismethod is tomodelwhat peoplewill choose. It
does not delve deeply into psychology or hidden motivations. Itsfocusisalwaysonthevalueoffeaturesandhowchangesaffectthatvalue.
Featuresarespecifictothechoices

Featuresarespecifictothechoices
Eachchoicecanhaveitsownfeaturesandpricesindiscretechoicemodelling.Thebrandorchoiceactsasakindofcontainerforthosefeatures. We can get an idea of the residual value of the brand,asidefromtheattributesthatarevaried,bylookingataterminthemodelcalledtheconstant.Wegetthisaspartofthemodel,ifwesetit up properly. We therefore do not need to specify brand as anattribute.Thisisanimportantconsideration,andonethatmaybepuzzling
topeopleusedtothethinkingbehindconjointanalysis.Inthebasicform of that type of analysis, brand is an attribute rather than aplacewhereotherattributeslive.
BestpracticesHere is abasic outline. Please referback to this chapter formoreabouteach:
Understandyourmarket.Toomanyofthesestudiesfailbeforetheystartbecauseofinadequatepreparation.Measuringthewrongattributesorfocusingoninessentialconcernsinevitablyleadstopoorresults.Knowhowusersandprospectstalkabouttheproductorservice.Makersoftechnical,medicalandprofessionalproductsareparticularlypronetobelievingthatallusersoftheirproductsreallyunderstandthemandknowallthecorporatelingo.Itisbettertoassumethatusersknownosuchthing.Itisbesttofindouthowuserstalkabouttheproductorserviceandusepreciselythatlanguage.Focusonbenefitstotheuser,ratherthanhowtheproductismade.Again,makersofaproductmaybelievethetechnicaldetailsarefascinating,andprovidersofaserviceoftenthinkthateveryoneisengrossedbytheorganizationalprocessesthatunderlietheirwork.Userscareaboutwhataproductdoesfor
them,nothowitisputtogether.Focusonthefunctionalbenefits,notthetechnicalspecifications.Measureasmuchvariationforeachattributethatyouthinkmayreasonablyhappen.Thatis,youwanttomeasureasmuchchangeineachattributeasyouexpecttosee.Supposeyouwanttomeasureresponsestopriceandyourhighestpriceis$5.00.Yetat$5.01,peoplestartconsideringthepricetooexpensiveandsalesfalloffdrastically.Youwillhavenowaytoknow.Youneedtomeasureuptothepointwhereyouthinknosuddenchangesinresponsearelikely.Considernarrowingthefieldofcomparisonsifyouhavetoomanychoices.IfyouarestudyingSoggyOsbreakfastsubstance,forinstance,youlikelywouldnotincludeallthingsapersoncouldhaveforbreakfastasacompetitiveset.Indeed,anyspecificcereal-likesubstancewouldlikelyhaveaminusculeshareofthetotalmarket.Measuringwhatdriveschangesisdifficultforitemsthatrarelygetchosen.Instead,youshouldcomparetotheclosecompetitors.InthecaseofSoggyOsthismightbeotherfinecellulose-enhanced,overlysweetenedbreakfast-liketreats.Still,makethemarketplacesrepresentthemaincompetitorsrealistically.Weknowfromrecentresearchondecisionmakingthatthecontextfordecisionsisveryimportantindeterminingwhatpeoplewillchoose.Themarketplacescenariosprovidethatcontext.Makesureitallowspeopletochoosemuchastheywouldintherealworld.Tellpeopletoimaginetheyreallyneedtobuy/getoneofthechoicesifanyisatallacceptable.Researchandexperienceshowsthatthisleadspeopletomakebetterandmoreconsistentdecisions.Includea‘noneofthese’option.Togetherwiththeinstructiondirectlyabove,thismakestheexerciserealistic.Peoplewillthinkasiftheyareinaframeofmindconducivetobuying,but
theyalsowillknowthattheycansitoutthedecisioniftheexperimentaldesigngeneratesamarketplacewhereallchoicesarenotacceptable.
ThepriceisrightDiscrete choicemodelling is themethodpar excellence for testingresponses to changes in price. This comes from the realism ofshowingproductssidebysideinamarketplace,fromaskingpeopleto choose, and from each choice having its own pricing variable.Thismeansthatthepricescanbefitexactlytoeachchoice.Ifyouhaveagoodsenseofpricinginthemarketplace,fourprices
shouldbeallyoueverneed.Asweshowed inseveralcharts, fourpoints will capture the most complex price versus sharerelationshipsyouwillencounter. Ifyouarenotcertain,youmightgo to five prices or even six, but we have never seen a need formore.
TheBayesianadvantageHierarchical Bayesian (HB) analysis has opened up the world ofdiscrete choice modelling. It is an incredibly complex method ofcalculations, and it will give your computer its workout for theweek–oryear.Wehaveseenmassiveproblemstakehourstorunonthelargestandspeediestcomputers.Itseemsalmostmagicalinhowitworks–andyetitdoeswork.Ithasbeenvalidatedtimeandagainoverthelast20years.It allowsyou todoubleor triple theamountof informationyou
canget froma given studyparticipant. Suppose youhavea studythat requires 24marketplaces based on the experiment you haveset up. You can show each person half of those and get a nearlyperfect reading on all the attributes. In the old days, before HBanalysis,youwouldhavetodoubleyoursampletocompensateforsplittingthetaskinhalf.
Also,yougetdataforeveryperson.Beforethisformofanalysis,you could only get data for a group of people. Data for eachindividualisaremarkableadvance.
UtilityandshareUtility isanabstractquantityanditmustgettranslatedintoshareinsomeway.Discretechoicemodellingusesasophisticatedmodelthat is in line with how we respond perceptually to theenvironment. This model also is at least a reasonableapproximation for the biases in decision making that recentresearchhasrevealed.Thisresponsemodel isanS-shapedcurve.This isrealisticbut it
alsomakestranslatingutilityintosharedifficult.Therelationshipisnot a straight line. This makes sense looking at a marketplace,though.Ifyoubrandhasalowshare,youhavetodomoretostandoutfromthenoise.Ifyourbrandisreasonablyvisible,peoplewillrespondmore readily to changes. Then if you have a really largeshare, it becomes increasingly difficult to convert those who areintenselyloyaltootherbrands.ThatisthetopoftheS-curve,whereyoucanreallypouronextravalueandstillseeonlysmallshiftsinthemarketplace.
Youcannotjustlookandguess
Youmustrunasimulatorprogramtoseehowsharechangeswhena product or service changes. Looking at utilities and guessing isinaccurate.UtilitiesaredoublyinaccurateifyouuseHBanalysis,aseachperson’sutilityvalueswillbelargerorsmallerthaneachotherperson’s.Youneedtogetalltheutilitiesonthesamefootingbyfirstsolvingfor‘share’withineachpersonandthenaveraging.
AllocatingchoicesDiscretechoicemodellingallowsyoutomodelpeoplemakingmore

than one choice at a time. For instance, we can ask doctors toallocatedifferentdrugsto10or20typicalpatients.Wealsodosuchthingsasaskingordinaryconsumers tochoose theirnext10or12softdrinkpurchases.
ContingentattributesWealsocanmakethevaluesofoneattributecontingentonanother.For instance,supposewehavetwosizeclassesofwinebottle,andthreeprices thatweconceptualizeas low,mediumandhigh.Eachsizecanhaveitsownsetoflow,mediumandhighprices(Table4.1).

TABLE4.1Settingupcontingentpricing
Verylow Low Medium High
750mlor850ml $8.39 $9.59 $10.59 $11.99
Onelitre $8.99 $9.99 $11.00 $12.49
We also can make one attribute (or more) disappear entirelybasedonthevalueofanotherattribute.Thewaytodothiswasfirstproposed over 20 years ago. Blanking out attributes in anexperimental design does not introduce correlations or hurt thestatisticalperformanceofthedesign.
CautionsandwherethismaynotworkIt is worth saying again that discrete choicemodelling, for all itsincrediblepower,producesshareofpreference,notmarketshare.To get to market share, you must adjust for marketplace factorssuch as comprehension and awareness of the product and howwidely the product is distributed. To go to projections, you mustknow the size of the entire market, which is often difficult todetermine.Lastly, you must know what part of the total market your
particular sample of study participants represent. This makesdrawing projections extremely difficult. We often include extracontrols in the simulator that the sponsoring company canmanipulate, seeing what projected sales would be under a widerangeofdifferentassumptions.Wealsoneed to recall that forecasts arenecessarily short term.
Oncemarket conditions change, they losemuchof their precisionand power. With sufficient change, they can become highlyinaccurate.These methods seem to break downmost severely with purely
sensory attributes. People do not seem able to trade a product‘tasting worse’, ‘smelling worse’ or ‘feeling worse’ for otherattributes in a discrete choice study. This is so even though theyobviouslydosoroutinelyinreallife.
OverallMarket simulations (andmarket simulator programs)may indeedbe thatelusivebest thingsinceslicedbread.Whendiscretechoicemodelling studies are done with care and understanding, thesemodelscanhaveincrediblepredictivepowerintheshortterm.Thisneed for care, for advance thinking, and for measuredconsideration of the results may work against truly wide-spreadadoption.Thoseseekingaquick fix,or thosewhohopeamachinewillsolvetheproblemforthem,willquicklylookelsewhere.A sample simulator is included in the online resources for this
chapter, available at www.koganpage.com/AI-Marketing – itshould give you an idea of the tremendous power that discretechoice modelling can have. We encourage you to follow theinstructions,useitandseehowitworks.
05Conjointanalysisanditsuses
This chapter addresses the other main method for getting to theoptimal product, service or message. Conjoint analysis has beendescribed as outmoded by some, but in the right applications itremainsapowerfulmethod.Inparticular, itcanworkremarkablywell in optimizing communications, such as advertisements andweb pages. It totally outdistances the traditional A/B testing usedwithwebpages. Italsocanpreciselyoptimizedeliveryofcomplexservices. We will compare and contrast conjoint with discretechoice modelling, showing where this method has uniqueapplications.
ThinkinginconjointversusthinkinginchoicesConjoint analysis developed largely in the market researchcommunity. As you may recall from Chapter 3, its earliestincarnations lookedsomething likemagicsquares,where levelsoftwo features were crossed versus each other and the resultingcombinationswere ranked. Youwill find this back in Figure 3.10,whichshowshowthislooks.Conjoint became a widely used and useful tool with the
development of traditional full-profile conjoint in themid-1970s.Thisshowsaseriesofwholeproductsorservices–hencethenamefullprofile.Studyparticipantstypicallyratetheseproductprofiles.Before online interviewing became so prevalent, people could
alsosortandranktheprofiles,whichappearedoncards.Youwill
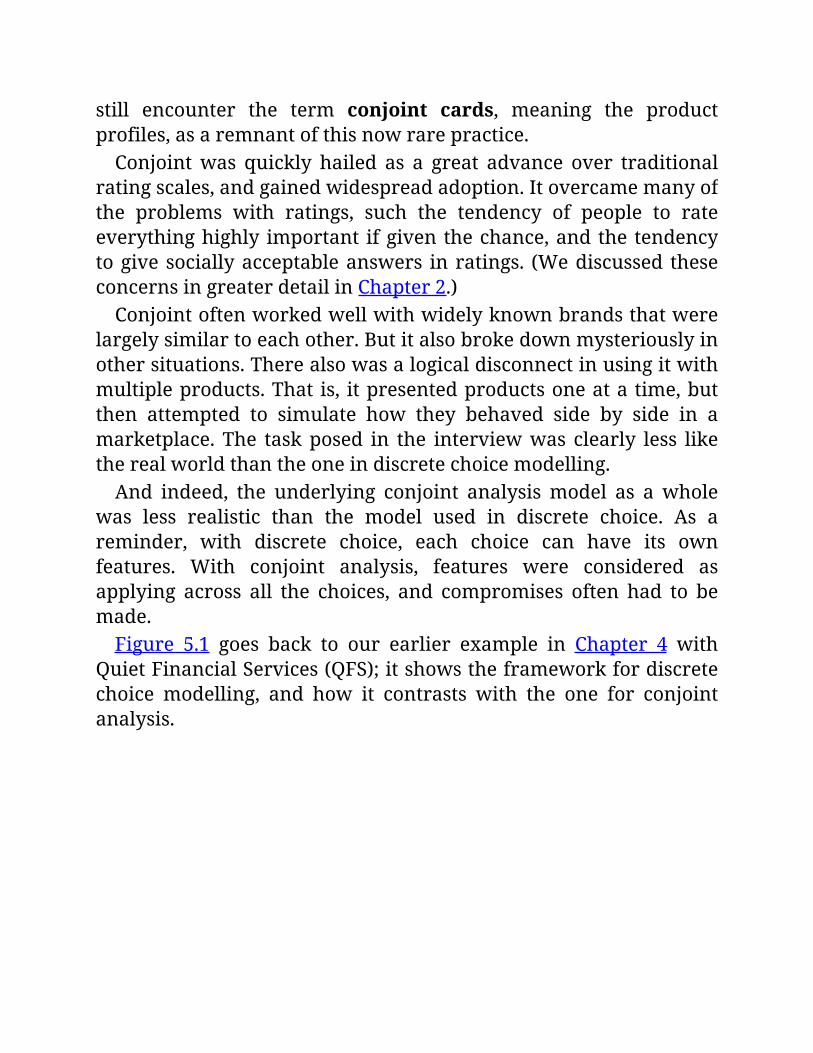
still encounter the term conjoint cards, meaning the productprofiles,asaremnantofthisnowrarepractice.Conjointwas quickly hailed as a great advance over traditional
ratingscales,andgainedwidespreadadoption.Itovercamemanyofthe problems with ratings, such the tendency of people to rateeverythinghighly important ifgiventhechance,andthetendencytogivesociallyacceptableanswers inratings. (Wediscussed theseconcernsingreaterdetailinChapter2.)Conjointoftenworkedwellwithwidelyknownbrandsthatwere
largelysimilartoeachother.Butitalsobrokedownmysteriouslyinothersituations.Therealsowasalogicaldisconnectinusingitwithmultipleproducts.That is, itpresentedproductsoneatatime,butthen attempted to simulate how they behaved side by side in amarketplace. The taskposed in the interviewwas clearly less liketherealworldthantheoneindiscretechoicemodelling.And indeed, the underlying conjoint analysismodel as a whole
was less realistic than the model used in discrete choice. As areminder, with discrete choice, each choice can have its ownfeatures. With conjoint analysis, features were considered asapplying across all the choices, and compromises often had to bemade.Figure 5.1 goes back to our earlier example in Chapter 4 with
QuietFinancialServices(QFS);itshowstheframeworkfordiscretechoice modelling, and how it contrasts with the one for conjointanalysis.
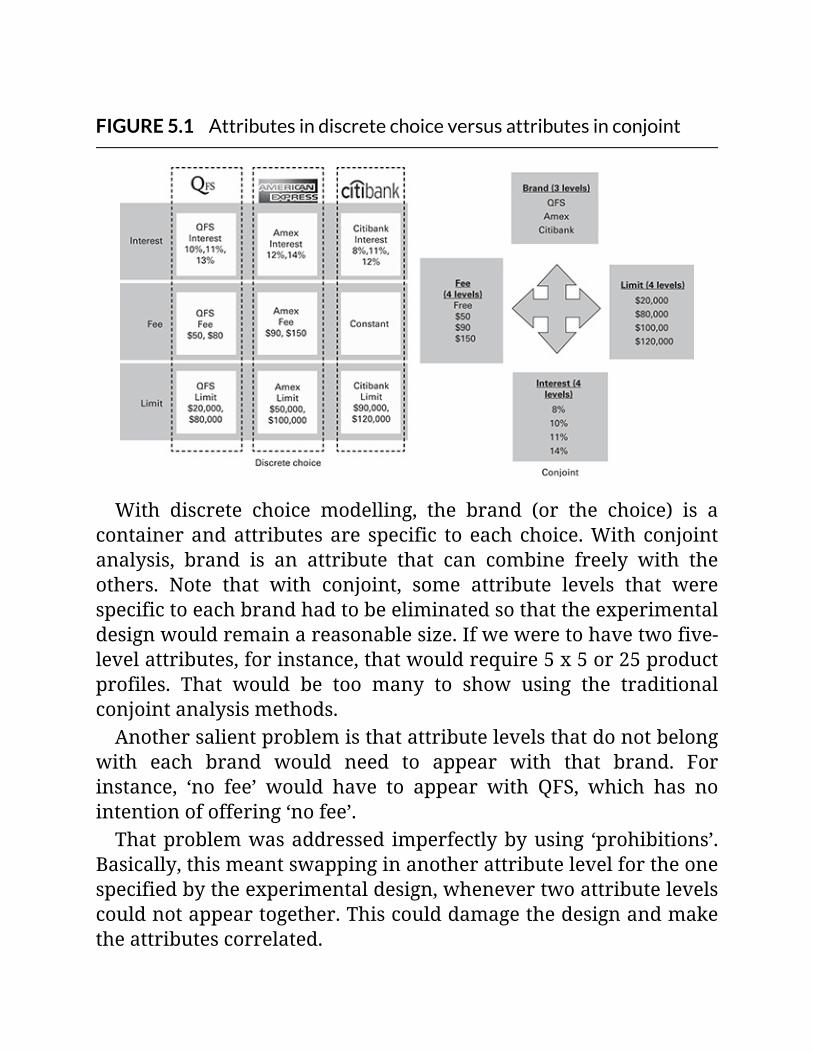
FIGURE5.1Attributesindiscretechoiceversusattributesinconjoint
With discrete choice modelling, the brand (or the choice) is acontainerandattributesare specific to each choice.With conjointanalysis, brand is an attribute that can combine freely with theothers. Note that with conjoint, some attribute levels that werespecifictoeachbrandhadtobeeliminatedsothattheexperimentaldesignwouldremainareasonablesize.Ifweweretohavetwofive-levelattributes,forinstance,thatwouldrequire5x5or25productprofiles. That would be too many to show using the traditionalconjointanalysismethods.Anothersalientproblemisthatattributelevelsthatdonotbelong
with each brand would need to appear with that brand. Forinstance, ‘no fee’ would have to appear with QFS, which has nointentionofoffering‘nofee’.Thatproblemwasaddressed imperfectlybyusing ‘prohibitions’.
Basically,thismeantswappinginanotherattributelevelfortheonespecifiedbytheexperimentaldesign,whenevertwoattributelevelscouldnotappeartogether.Thiscoulddamagethedesignandmaketheattributescorrelated.
If you were lucky, the correlations would still be low, and thedesignwouldnotbeweakenedtoomuch.Butwiththewrongswapor toomany swaps, the experimentwould fall apart, underminedby strong correlations among the attributes. (If this seemsconfusing, please go back and look at the section in Chapter 3 ondesignsandwhytheyneedzeroornear-zerocorrelations.)
LackofrealisminhowconjointtreatsutilitiesConjointanalysisstartedwithanoverlysimpleviewofhowutilitybecomes share in the marketplace. More utility equals morepreference, in a straightline relationship. More formally, therelationship is seen as linear and additive. As we discussed inChapter 4, the S-shaped relationship postulated in discrete choicemodelling closely fits what we know about decision making andhow products fare in themarketplace. Figure 5.2 shows how thetraditional treatment of utility by conjoint compares withrelationshipcapturedbydiscretechoicemodelling.
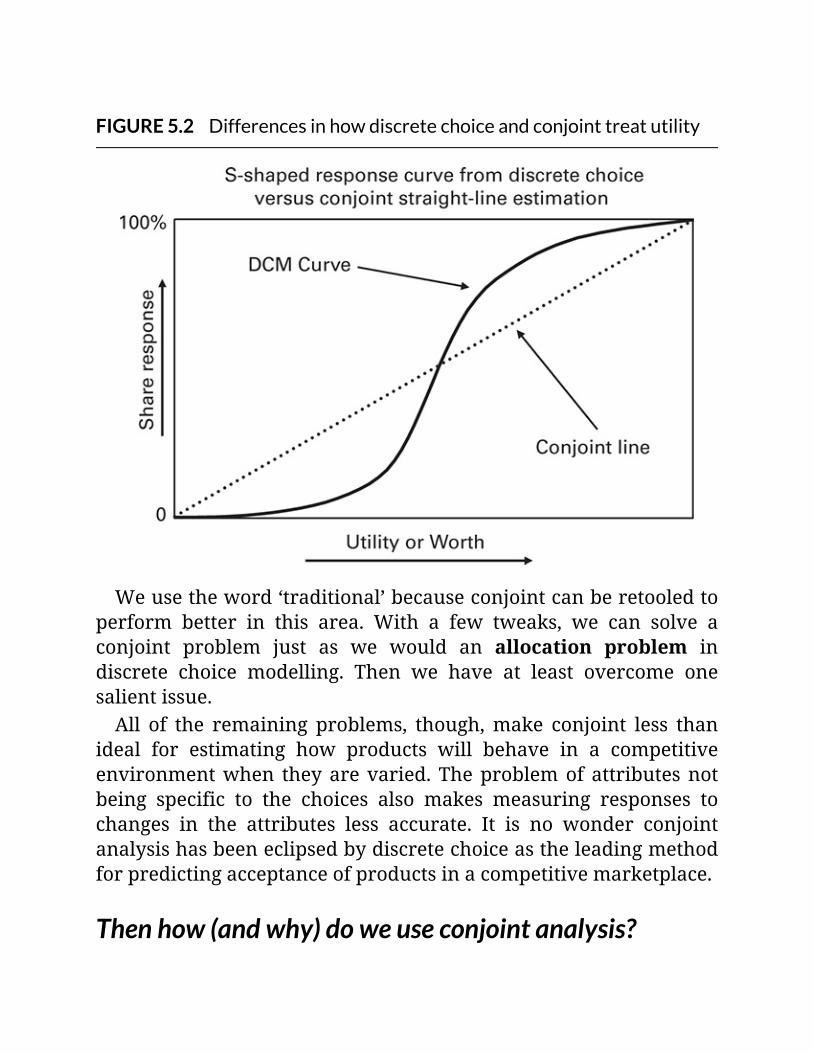
FIGURE5.2Differencesinhowdiscretechoiceandconjointtreatutility
Weusetheword‘traditional’becauseconjointcanberetooledtoperform better in this area. With a few tweaks, we can solve aconjoint problem just as we would an allocation problem indiscrete choice modelling. Then we have at least overcome onesalientissue.All of the remaining problems, though,make conjoint less than
ideal for estimating how products will behave in a competitiveenvironmentwhen theyarevaried.Theproblemof attributesnotbeing specific to the choices also makes measuring responses tochanges in the attributes less accurate. It is no wonder conjointanalysishasbeeneclipsedbydiscretechoiceastheleadingmethodforpredictingacceptanceofproductsinacompetitivemarketplace.
Thenhow(andwhy)doweuseconjointanalysis?

Conjointanalysiscanprovidevaluableinsightsinsituationswheretheproductwouldhaveaminuscule share, and so get completelyswampedbyotherchoiceswhenpeopleareaskedtochoose.Thatis,if a product is rarely chosen, there would not be enoughinformation from the few times it did get selected to determinewhat was driving that choice. Conjoint analysis allows youeffectively to put that infrequently chosen product ‘under amicroscope’anddetermineitsbestpossibleconfiguration.
Traditionalconjointanalysisshowsoneproductatatimeandasksforaratingofthatproduct.Inconjointanalysis,ifyouincludebrand,itbecomesanattributeratherthanacontainerforattributes(whichisthecasewithdiscretechoicemodelling).Sincebrandisanattribute,eachbrandmustappearwitheachlevelofeachotherattribute.Thiscanleadtoimpossiblecombinations.Evenifitdoesnot,theconjointapproachislessrealisticandlessprecisethanoneusedbydiscretechoicemodelling.Discretechoicemodellingisnowstronglypreferredforpredictingacceptanceofproductsinacompetitivemarketplace.
Conjoint also can do remarkably well in optimizingcommunications, inparticularprintadvertisingandwebsites.Youcantesttheequivalentofthousandsofalternativeconfigurationsinone study. It completely overwhelms the more usual A/B testingdonewithwebsites–aswewillsee.In addition, conjoint analysis can do remarkably well in
determiningthespecificlevelsofservicethatneedtobeofferedincomplexcustomerrelationships,suchasthosebetweenautilityandits commercial customers, or a pharmaceutical company and thedoctors and clinics it serves. We will see all three of theseapplications.
Whileconjointanalysisisnotthebestchoicefordetermininghowproductswillbehaveinacompetitivemarketplace,itstillhassomeimportantuses.Thesearethreeprincipalapplications:
Wherecompetitivecontextwouldbeoverwhelming:thiswouldbethecasewhenyouwantedtomakethebestproductandtheproducthadaverylowshare.Becausetheproductwouldgetchosenonlyrarely,patternsofchoiceswouldnotaccuratelyrevealwhichchangesworkedbest.Conjointanalysis,withitssingle-productfocus,canputthatproduct‘underamicroscope’andshowhowtoselectthebestvariationsofitsfeatures.
Foroptimizingcommunications,suchasprintadvertisementsandwebsites.Youcangettherelativeappealofthousandsofalternativeconfigurations,completelysurpassingsuchcurrentmethodsasA/Btesting.
Fordeterminingtheexactlevelsofserviceincomplexcustomerrelationships,suchasbetweenutilitiesandtheircommercialcustomers.Themanyelementsincustomerinteractionscanbecarefullytailored,leadingtothebestmix.
Conjointanalysisforsingle-productoptimizationAnexamplefromagoodnumberofyearsagoinvolvesamakerofdisposablepens.Thesearetheinexpensivepensthateventuallyrunoutofinkandarediscarded,ormysteriouslydisappearforeverandarenotworthretrieving,aswhenyoulendthemtoafriend.There are dozens of alternative brands and models to choose
from,soanewpenenteringthiscrowdedfieldwouldgarneratbesta very small share. This would have posed a problem in testingreactionstothenewpenifithadbeentestedalongsidecompetitors.Itmightbeenchosenrarely –ornever.Zeroing inon theproductitselfwithconjointanalysisthereforemadesense.This approach also worked because of the way that consumers
make purchases. The manufacturer noticed that buyers wouldpurchasemorepensiftheyhadapositiveexperiencewritingwithacertainpen.The companyhad identifiedanumberof factors thatcouldmakethepenbettertouse,includingthebarrelwidth,roller-
ballcomposition,viscosityoftheink,dryingtimeoftheinkandsoon.Theydecidedtotestfivefeaturesthatcouldeachvarythreeways
andonethatcouldvarysixways.Thiswouldbe3x3x3x3x3x6or1,458possibleconfigurations.An experimental design led to 18 different prototype pens. The
makersproducedabatchofthesetobeusedintesting.Peoplewereinvited to interviewing facilities, where they found the pens andplentyofpaper.Theytriedthe18pens,thenputtheminorderfromfavouritetoworst.Theserankingscanbeusedinconjointanalysisjustasnumericalratingscan.Themainoutputofthisstudywasasimulatoraccuratelyshowing
the relative appeal of all 1,458 possible pens. In fact,manymoreconfigurations were possible, because the simulator allowedinterpolation between thevalues tested for continuous variables,such as drying time of the ink. After carefully considering theresults,thecompanywasabletomakeanewpenthatpeoplelikedusingandthatsucceededinthemarket.
UsingthesingleproductsimulatorintheonlineresourcesOurnextexampleconcernsanewtypeofdietaryfibrethatcameinthe form of a large tablet. There aremany products that containdietaryfibre,sothesponsoringcompanywasconcernedthattheirnew invention might get lost in the mix if it were tested inmarketplacescenariosalongsidethemoreestablishedbrands.The study therefore used full-profile conjoint analysis, showing
thisnewproductalone.Studyparticipantsevaluatedaseriesof16hypotheticalnewproducts.Eachproducttheysawdifferedinlevelof dietary fibre, formulation, flavour, numbers of days of supplyandprice.Pricewasshownbothaspriceper tabletandpriceperpackage.

Price per tablet was contingent on the formulation, with fourdifferent prices, depending on how the product was made. Totalprice was contingent on both the price per tablet and days ofsupply.The main results of the study can be seen in the simulator
(availableatwww.koganpage.com/AI-Marketing).Therearethreeversions, one that runs under Excel, one that runs underPowerPoint,andonethatrunsintheAdobeAcrobatPDFformat.Allversionsarefullyinteractive.
PowerPointversionDownload the file and open PowerPoint. The program works inpresentationmode.TogettopresentationmodeonaPC,presstheF5functionkeyat the topof thekeyboard.OnaMac,youneedtopress Option-Return. (You need to have Flash Player on yourcomputerforthePowerPointandPDFversionstorun.)Figure5.3showswhatyouwillseewhenyouopenthissimulator.
Wehaveadded letters thatdonotappear.Thesewill aid inquicklocationofthefeaturesbeingdiscussed.
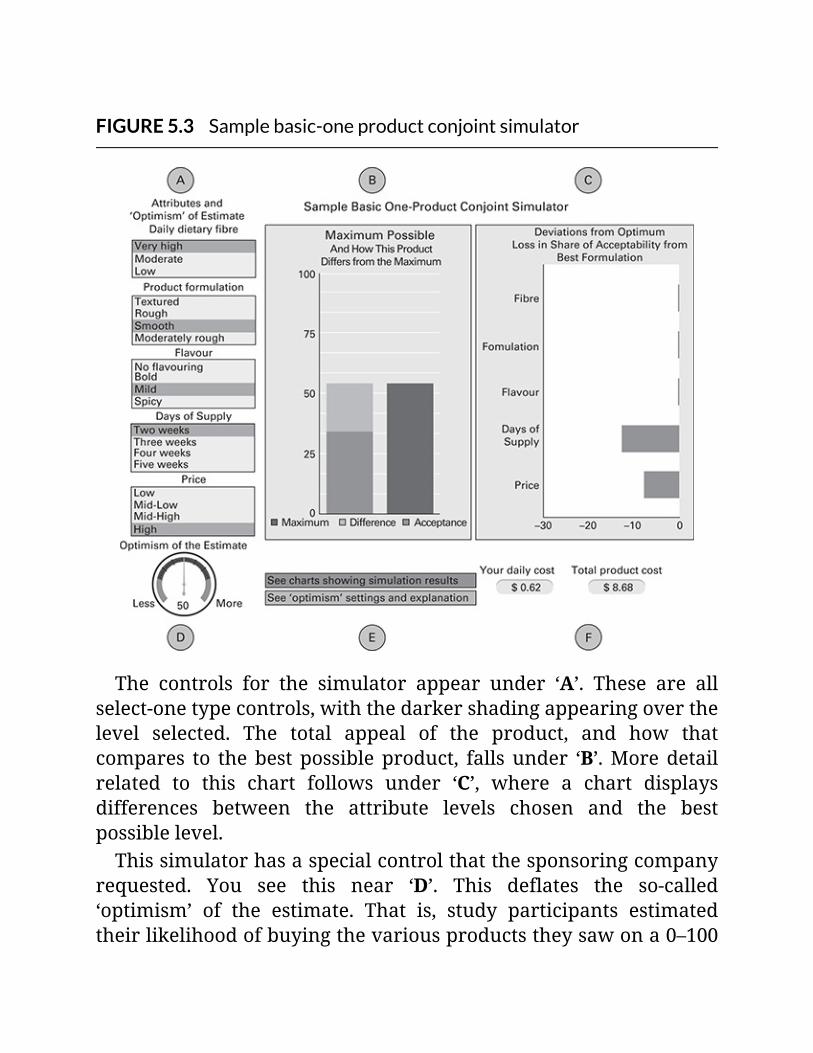
FIGURE5.3Samplebasic-oneproductconjointsimulator
The controls for the simulator appear under ‘A’. These are allselect-onetypecontrols,withthedarkershadingappearingoverthelevel selected. The total appeal of the product, and how thatcompares to thebest possibleproduct, falls under ‘B’.Moredetailrelated to this chart follows under ‘C’, where a chart displaysdifferences between the attribute levels chosen and the bestpossiblelevel.Thissimulatorhasaspecialcontrolthatthesponsoringcompany
requested. You see this near ‘D’. This deflates the so-called‘optimism’ of the estimate. That is, study participants estimatedtheirlikelihoodofbuyingthevariousproductstheysawona0–100
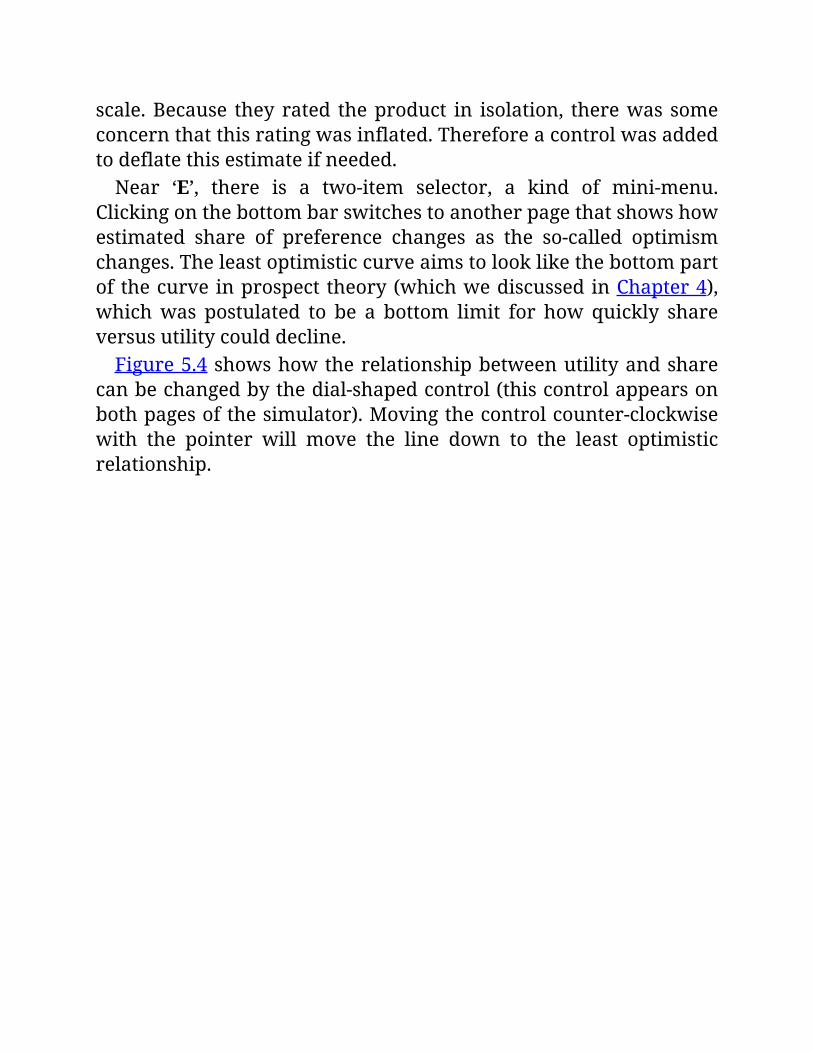
scale.Because they rated theproduct in isolation, therewas someconcernthatthisratingwasinflated.Thereforeacontrolwasaddedtodeflatethisestimateifneeded.Near ‘E’, there is a two-item selector, a kind of mini-menu.
Clickingonthebottombarswitchestoanotherpagethatshowshowestimated share of preference changes as the so-called optimismchanges.Theleastoptimisticcurveaimstolooklikethebottompartofthecurveinprospecttheory(whichwediscussedinChapter4),whichwas postulated to be a bottom limit for how quickly shareversusutilitycoulddecline.Figure5.4showshowtherelationshipbetweenutilityandshare
canbechangedbythedial-shapedcontrol(thiscontrolappearsonbothpagesofthesimulator).Movingthecontrolcounter-clockwisewith the pointer will move the line down to the least optimisticrelationship.
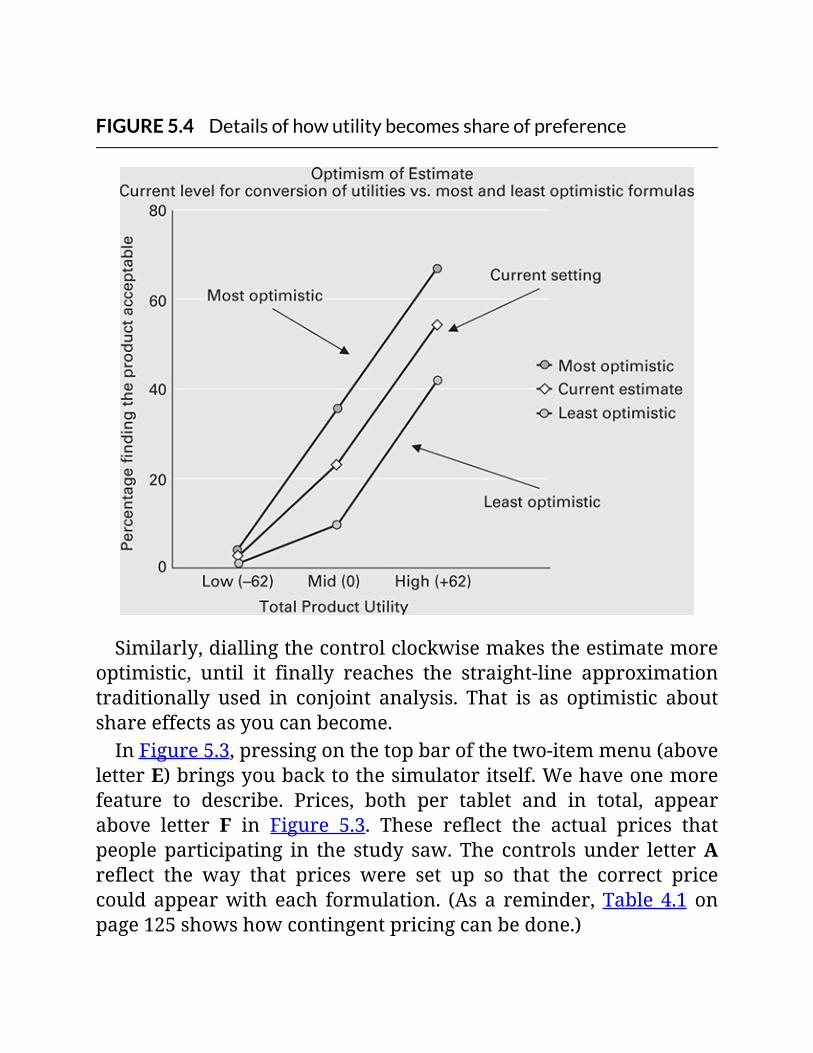
FIGURE5.4Detailsofhowutilitybecomesshareofpreference
Similarly,diallingthecontrolclockwisemakestheestimatemoreoptimistic, until it finally reaches the straight-line approximationtraditionally used in conjoint analysis. That is as optimistic aboutshareeffectsasyoucanbecome.InFigure5.3,pressingonthetopbarofthetwo-itemmenu(above
letterE)bringsyoubacktothesimulatoritself.Wehaveonemorefeature to describe. Prices, both per tablet and in total, appearabove letter F in Figure 5.3. These reflect the actual prices thatpeopleparticipating in the study saw. The controls under letterAreflect the way that prices were set up so that the correct pricecould appearwith each formulation. (As a reminder, Table 4.1 onpage125showshowcontingentpricingcanbedone.)
Excelversion
ExcelversionThis works very much like the PowerPoint version, but due todifferences in how graphics are handled in each program, has aslightlydifferentlookandfeel.Again,youneedtodownloadthefileandopenitwithExcel.IfExcelaskswhetheryoureallywanttorunthe content, answer in theaffirmative. ShouldExcel still refuse tofunction fully, please refer to the instructions on the third sheet,‘SecurityinExcel2007andon’.
Problemswithestimatingactualeffectsinthemarketplace
This simulator underlines the problems inherent inmoving fromratingstomarketshare.Wedonotknowwhichmodelwillforecastchanges most accurately. We must make assumptions, or at theleast test various assumptions as we did with the demonstrationsimulator.Conjoint analysis does particularly well at showing the relative
values of different features, and relative changes that come fromvarying in those features. But again, it is not the best choice forshowingeffectsinthemarketplace.
ConjointremainsanexcellentmethodformessagesFortunately,whenwearedealingwithmessages,weare trying topick the best alternative – so the issue of how utilities becomemarketplace behaviour becomes irrelevant. And with websites,even though we still use a conjoint-style approach, we can godirectlytobehaviour,suchasclicksorstickiness(howlongapersonstayson thepageor site).Usingconjoint,weget theequivalentoftesting hundreds or even thousands of alternative message

configurations,allinonetest.
Ourfirstexample:anunwantedmessageThisisadirectmailpiece,oneofthoseinsuranceofferswealllookforwardsomuchtoreceiving.Thishappenedmanyyearsago,andmay be one of the first applications of conjoint to developing thebestmixofelementsinamessage.Because these insurance offers are designed to workwith very
low level of responses (often under 1 per cent), even a fractionalimprovementcanmakeavastdifference.Ifyoumovefrom0.8percent to1.0percentresponse,youhave increasedyoursalesby25percent(thatis,thisisthe0.2percentincreasedividedbythe0.8percentbaserate).Therearetwocomponentstothisoffering:theenvelopeandthe
letter.Figure5.5showsadisguisedversionof the itemstested.Sixfeatures or attributes were varied. Counting the variations orlevelswegettohowmanymessageprofileswewillneedtoshow.
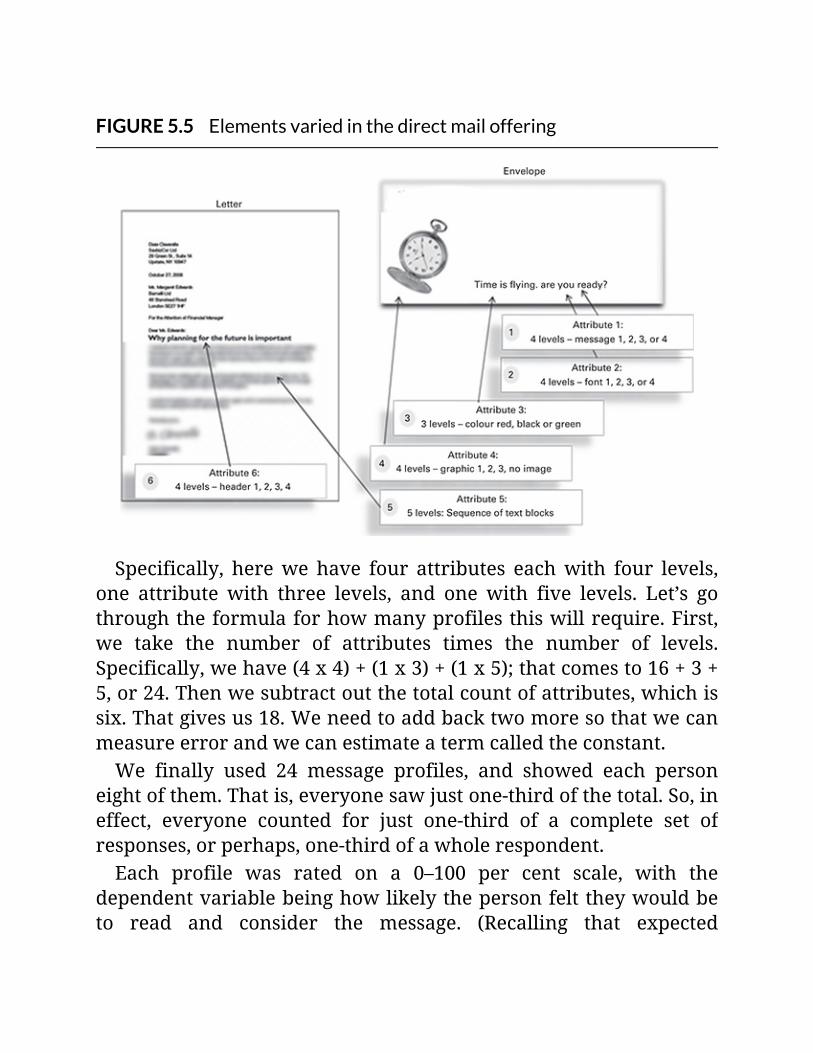
FIGURE5.5Elementsvariedinthedirectmailoffering
Specifically, herewe have four attributes eachwith four levels,one attribute with three levels, and one with five levels. Let’s gothroughtheformulaforhowmanyprofilesthiswillrequire.First,we take the number of attributes times the number of levels.Specifically,wehave(4x4)+(1x3)+(1x5);thatcomesto16+3+5,or24.Thenwesubtractoutthetotalcountofattributes,whichissix.Thatgivesus18.Weneedtoaddbacktwomoresothatwecanmeasureerrorandwecanestimateatermcalledtheconstant.We finally used 24 message profiles, and showed each person
eightofthem.Thatis,everyonesawjustone-thirdofthetotal.So,ineffect, everyone counted for just one-third of a complete set ofresponses,orperhaps,one-thirdofawholerespondent.Each profile was rated on a 0–100 per cent scale, with the
dependentvariablebeinghowlikelythepersonfelttheywouldbeto read and consider the message. (Recalling that expected

purchaseshitabout0.8percentonaverygoodday,thesponsoringcompanydidnotmake‘actuallybuying’thecriterion.)Whenwedidthis many years ago, it required us to triple our sample. As areminder,nowthatwehaveHBanalysis,weactuallycangetmuchmore per respondent. We might possibly even get away with noincreaseinsample.Backtoourmainstory,Figure5.6showsthewaytheeffectson
acceptancelevelslooked.Thisclearlydelineateswhatismostandleastattractivetoprospectivecustomers.
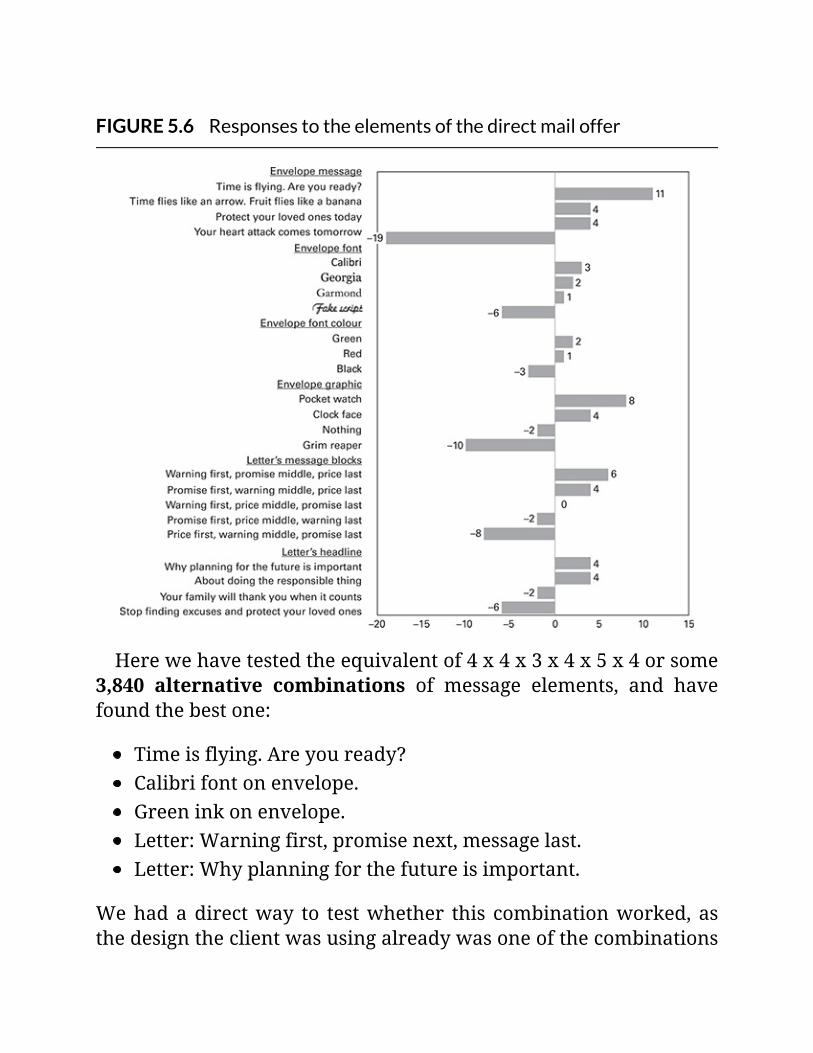
FIGURE5.6Responsestotheelementsofthedirectmailoffer
Herewehavetestedtheequivalentof4x4x3x4x5x4orsome3,840 alternative combinations of message elements, and havefoundthebestone:
Timeisflying.Areyouready?Calibrifontonenvelope.Greeninkonenvelope.Letter:Warningfirst,promisenext,messagelast.Letter:Whyplanningforthefutureisimportant.
Wehadadirectway to testwhether this combinationworked, asthedesigntheclientwasusingalreadywasoneofthecombinations

with lower total utility. By switching they actually improved theirresponseratebysome25percent,justpassingthemagic1percentacceptancemark.Sothiswasanearlysuccessstory.
UsingthismethodwithaprintadvertisementThenextexamplecomesfroma testofaprintadvertisement.Thesameprinciplesholdasinthedirectmailtest.Figure5.7showsourslightlyfictionalizedadandtheelementsvariedinit.
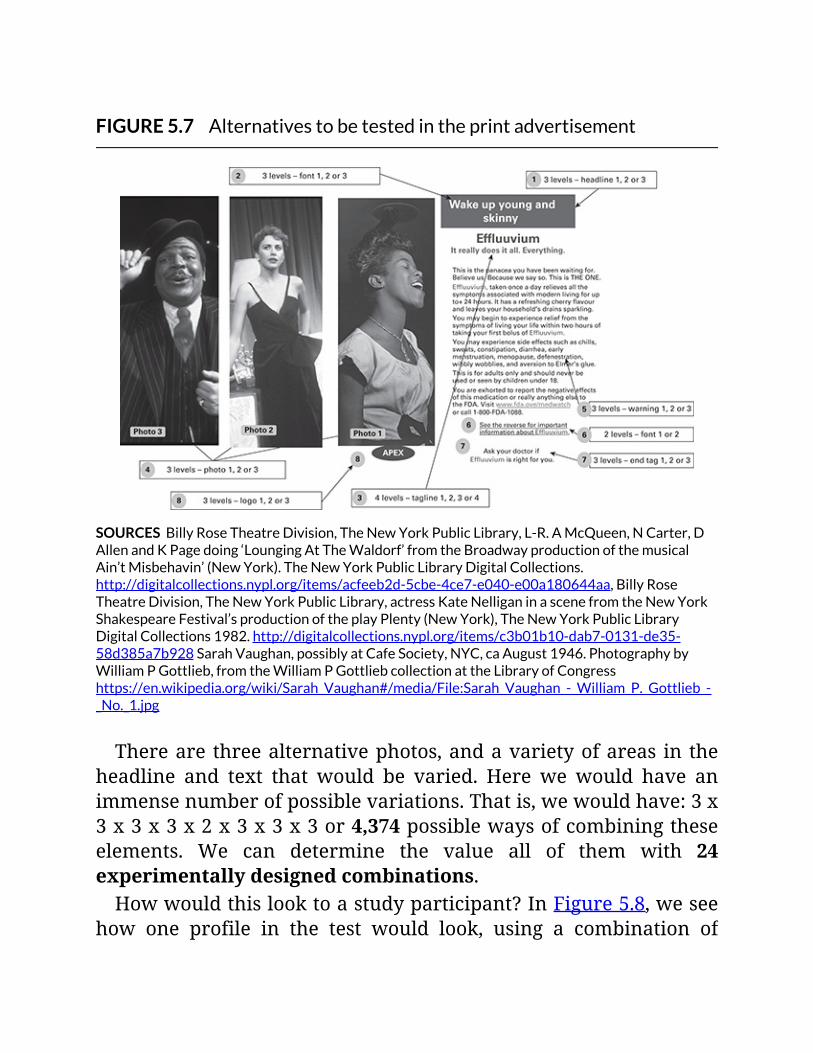
FIGURE5.7Alternativestobetestedintheprintadvertisement
SOURCESBillyRoseTheatreDivision,TheNewYorkPublicLibrary,L-R.AMcQueen,NCarter,DAllenandKPagedoing‘LoungingAtTheWaldorf’fromtheBroadwayproductionofthemusicalAin’tMisbehavin’(NewYork).TheNewYorkPublicLibraryDigitalCollections.http://digitalcollections.nypl.org/items/acfeeb2d-5cbe-4ce7-e040-e00a180644aa,BillyRoseTheatreDivision,TheNewYorkPublicLibrary,actressKateNelliganinascenefromtheNewYorkShakespeareFestival’sproductionoftheplayPlenty(NewYork),TheNewYorkPublicLibraryDigitalCollections1982.http://digitalcollections.nypl.org/items/c3b01b10-dab7-0131-de35-58d385a7b928SarahVaughan,possiblyatCafeSociety,NYC,caAugust1946.PhotographybyWilliamPGottlieb,fromtheWilliamPGottliebcollectionattheLibraryofCongresshttps://en.wikipedia.org/wiki/Sarah_Vaughan#/media/File:Sarah_Vaughan_-_William_P._Gottlieb_-_No._1.jpg
Thereare threealternativephotos,andavarietyofareas in theheadline and text that would be varied. Here we would have animmensenumberofpossiblevariations.Thatis,wewouldhave:3x3x3x3x2x3x3x3or4,374possiblewaysofcombiningtheseelements. We can determine the value all of them with 24experimentallydesignedcombinations.Howwouldthislooktoastudyparticipant?InFigure5.8,wesee
how one profile in the test would look, using a combination of

elementsbasedontheexperimentaldesign.Thiswasanonlinetest,with each person exposed to eight alternative combinations orprofilesoutofatotalof24usedforthetest.

FIGURE5.8Oneoftheadstested

SOURCEPhotofromBillyRoseTheatreDivision,TheNewYorkPublicLibrary,actressKateNelliganinascenefromtheNewYorkShakespeareFestival’sproductionoftheplayPlenty(NewYork),TheNewYorkPublicLibraryDigitalCollections1982.http://digitalcollections.nypl.org/items/c3b01b10-dab7-0131-de35-58d385a7b928
HowthisworkedBasedonthistest,theclientwasabletodetermineeasilywhichofthe over 4,300 possible combinations generated themost interest.Thiswas donewith a chart showing the basic effects of changingeachmeasured attribute, just as we did in the last example. Thisstudy,however,involvedanotherinterestingissue,whichwecouldcall the presence of aHIPPO. AHIPPO is simply theHighestPaidPerson’sOpinion (so,no indeed,wehavenotgonecrazy).TheBigBossreallywantedtoknowhowafewofhisfavouriteideasplayedoutagainstthebestcombination.
Thisseemedtocallforasimulator,similartoamarketsimulator,but in this casewith the overall rating as the outcome. Figure 5.9givesanideaofhowthesimulatorlooked.
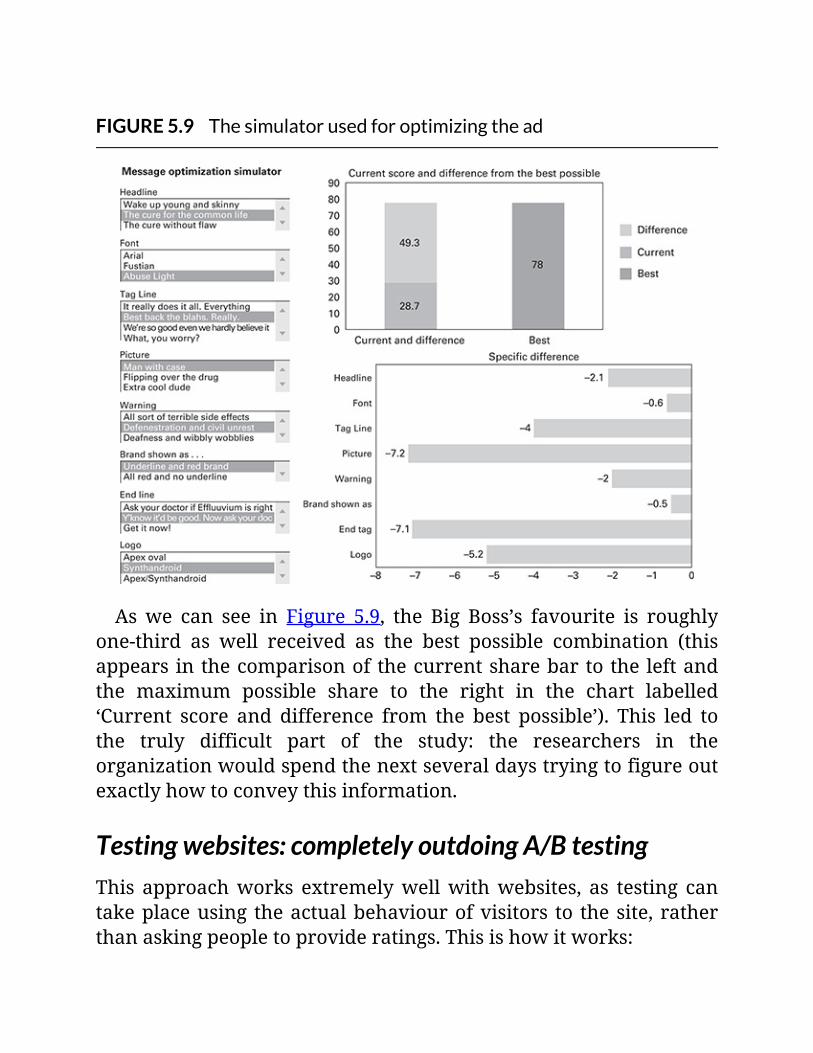
FIGURE5.9Thesimulatorusedforoptimizingthead
Aswe can see in Figure 5.9, the Big Boss’s favourite is roughlyone-third as well received as the best possible combination (thisappearsinthecomparisonofthecurrentsharebartotheleftandthe maximum possible share to the right in the chart labelled‘Current score and difference from the best possible’). This led tothe truly difficult part of the study: the researchers in theorganizationwouldspendthenextseveraldaystryingtofigureoutexactlyhowtoconveythisinformation.
Testingwebsites:completelyoutdoingA/BtestingThis approachworks extremelywellwithwebsites, as testing cantakeplaceusing theactualbehaviourofvisitors to thesite, ratherthanaskingpeopletoprovideratings.Thisishowitworks:

1. Justasforprint,thelistoffeaturestobevariediscreated.2. Thevariationsareputintoanexperimentaldesign.3. Alternativeconfigurationsaremadeup.4. Whenpeoplevisitthesite,theyarerandomlyassignedtooneof
thealternatives.5. Clicksand/or‘stickiness’(amountoftimeapersonspendson
thepage)getmeasured.6. Withextremevaluesremovedorrolledbacktomore
reasonablelevels,wesolveforthetargetvariable(clicksorstickiness).
Gettingridofextremevaluesisimportant–apersonmayappeartostayonawebpageforalongtimeformanyreasons(answeringthephone,doingseveralthingsatonce,puttingoutakitchenfire,andsoon).Also,vanishinglysmalltimessuggestamistakenclickonthesite–andsolikelyarenotareflectionofinterestlevels.InFigure5.10,weseehowadisguisedwebpage lookswithfive
elementsbeingvaried.(Thesuperimposednumbers(1–5)aretherejustforourreference–theywouldnotappearinthetest.)

FIGURE5.10Elementsonawebpagevariedfortesting
SOURCEImageontheright:JamesTissot,Holyday
Thesefiveelementseachvariedinfourways.Thiscomestosome1,024alternativecombinationsofthevariedelements(or4x4x4x4x4).Totestthevalueofallpossiblecombinations,weneededtodevelop and test 20 alternatives in an experimental design to getaccuratemeasurements.Needing20alternativesleadstoacaution:youneedafairlywell
visitedwebsite to do behaviour-based testing of this type. If eachperson sees justone of thosealternatives, then thatperson is just1/20 of a complete set – or that person counts as just 1/20 of acompleterespondent.Sticking with a fairly slender requirement of 125 complete
respondents,wewouldneed2,500visitorstocompleteonetest.So
you do need a relatively busy site to do this kind of testing.However, considering that a recently reported A/B test involvedover1millionvisitorswhowereshowneitherof twoalternatives,perhapsthisisnotaskingthatmuch.Testing by showing an alternative to hundreds of thousands of
viewersseemstohearkenbacktotheolddaysofdirect-mailtesting,before conjoint analysis-based methods of message optimizationweredeveloped.A test then consisted of sending out 700,000 or 1millionpiecesandseeingwhatcameback.Thereisofcourselessdirectcostandeffortinvolvedinpassively
allowing visitors to see the website in alternative configurationsthan in developingmailings and sending them.However, there isstillconsiderablewasteinshowingthatmanypeopleamessagethatislessthanthebest.Certainly,byusingjustafewthousandpeopleandbeingableto
determine responses to 1,000 alternative configurations, conjointmessagetestinghascompletelysurpassedA/Btesting.InFigure5.11,wehavetheoutcomeofthewebtest,withfictional
slogans.(Theactualonesreallywerealittlebetter.)Findingthebestalternative from the 1,000 possible configurations has become asimpletask.
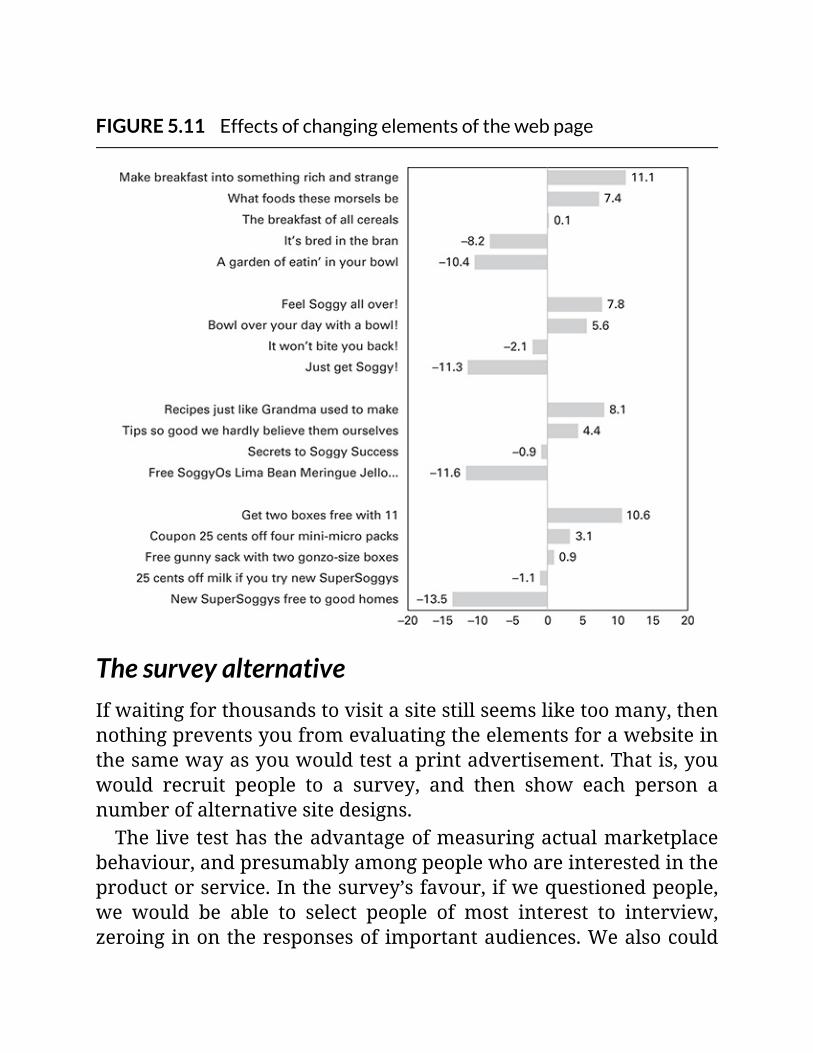
FIGURE5.11Effectsofchangingelementsofthewebpage
ThesurveyalternativeIfwaitingforthousandstovisitasitestillseemsliketoomany,thennothingpreventsyoufromevaluatingtheelementsforawebsiteinthesamewayasyouwouldtestaprintadvertisement.Thatis,youwould recruit people to a survey, and then show each person anumberofalternativesitedesigns.Thelivetesthastheadvantageofmeasuringactualmarketplace
behaviour,andpresumablyamongpeoplewhoareinterestedintheproductorservice.Inthesurvey’sfavour,ifwequestionedpeople,we would be able to select people of most interest to interview,zeroinginontheresponsesofimportantaudiences.Wealsocould
askotherquestionsaboutwhotherespondentsare, theirusageofother products, and so on. We would get a more comprehensivepictureofwhoresponded.
ConjointanalysisforthebestservicedeliveryMany companies have complex service relationships with theircustomers. For instance, consider telecommunications and utilitycompanieswith theircommercialcustomers,cablecompaniesandinsurance companies with their users, and medical device andpharmaceuticalcompanieswithdoctorsandclinics.Allof thesecompaniesdomore thanprovideaproductorbasic
service. They may also instal equipment and maintain it, bringsamples of supplies, provide ongoing education for professionalcertification – and have many other interactions. These differentareasofinteractionaresometimescalledtouchpoints.Giventheoftenvanishinglysmalldifferencebetweencompanies’
basicofferings, theseotherservicescanloomlarge inthedecisionto use one provider, to renew a contract, or simply to continuebuying.
AbetteranswerthanratingsWealreadyhavediscussedatlengththepitfallsofaskingcustomersdirectly what they find important in the services they receive.When asked to provide these ratings, people almost invariablydecideitisbesttoratenearlyeverythingashighlyimportant.Conjoint analysis allows to you show an entire service profile,
withall theelementsinplace.Youaskstudyparticipantstogivearatingreflectinghowsatisfied theywouldfeel if theentireservicepackage could be reliably delivered at that level. Since all thefeatures are evaluated in the context of the whole service
experience,thisavoidstheproblemofnon-essentialfeaturesbeingrated as important. The result is avoiding the dual pitfalls ofunderdelivering and overdelivering in key areas of customerinteractions.
Ourexample:thepharmaceuticalcompanywithnothingspecialPharmaceutical companies often follow a successful competitiveproduct introductionwith their ownoffering that does somethingsimilar.Thisisonereasonthatwehave,forinstance,somanydrugsthat lower cholesterol. Their motivations are understandable,becauseaso-calledblockbusterdrugcangarnerwellover$1billioninsales.Onesuchcompany,whowewillcallNewInnova,hadlargelyused
astrategysometimeslabelled‘metoo’.Mostoftheirproductscameabout from following a market leader into a new and profitablecategory.Thenoneday,theytookalonglookandrealizedthattheyofferednothingdistinctive.Their answer (until such a time as they actually developed
something new), would be to focus on their professionalrelationshipswith theircustomers.Theyhad to takecareful stock.Many once-favoured interactions (that were in fact bribes) havebeenoutlawed.Still, thesecompaniescandoagreatdeal for theircustomers.Theycansendcheeryyoungrepresentativestotalkwithdoctors
aboutwhattheyaredoing,answerquestionsaboutthedrugs,andoutline new research and developments. This is called detailing.They also can drop off numerous samples of their fine products.This is called sampling. Many companies will produce extensivematerials to educate patients and staff members. Some will evensendin-persontrainersforcomplexdevicesandproducts.Companies also offer education, including continuing medical

education(CME),whichintheUnitedStatesisrequiredinordertoretain a medical licence. They offer seminars, conferences and,sometimes, something called medical thought leadershipprogrammes. This last item is new, and seems something like anovel way to offer the now-outlawed bribes. They also send outcolourful newsletters, either on glossy paper or on the web. Andthere are still otherways that they can insinuate themselves intotheircustomers’professionallives.
Thekeyquestionconjointserviceoptimizationaddressed
Thesponsoringcompany,NewInnova,hadthisquestion:giventhattheycouldperformalltheseservices,howshouldtheyofferthem?Forinstance,howmuchshouldtheysample,andhowoftenshouldthey do detailing? To determine the right balance, they turned toconjointoptimizationoftheirserviceofferings.Theylookedinto11serviceareas,ofwhichweshownineinthe
disguisedexamplebelow,inFigure5.12.NewInnovacameupwithenoughvariationstorequirea42-profileexperimentaldesign.Eachpersonsawandevaluated14ofthese.Theyratedhowsatisfiedtheywouldbeona0–100scale,ifservicecouldbedeliveredconsistentlyatthelevelshown.
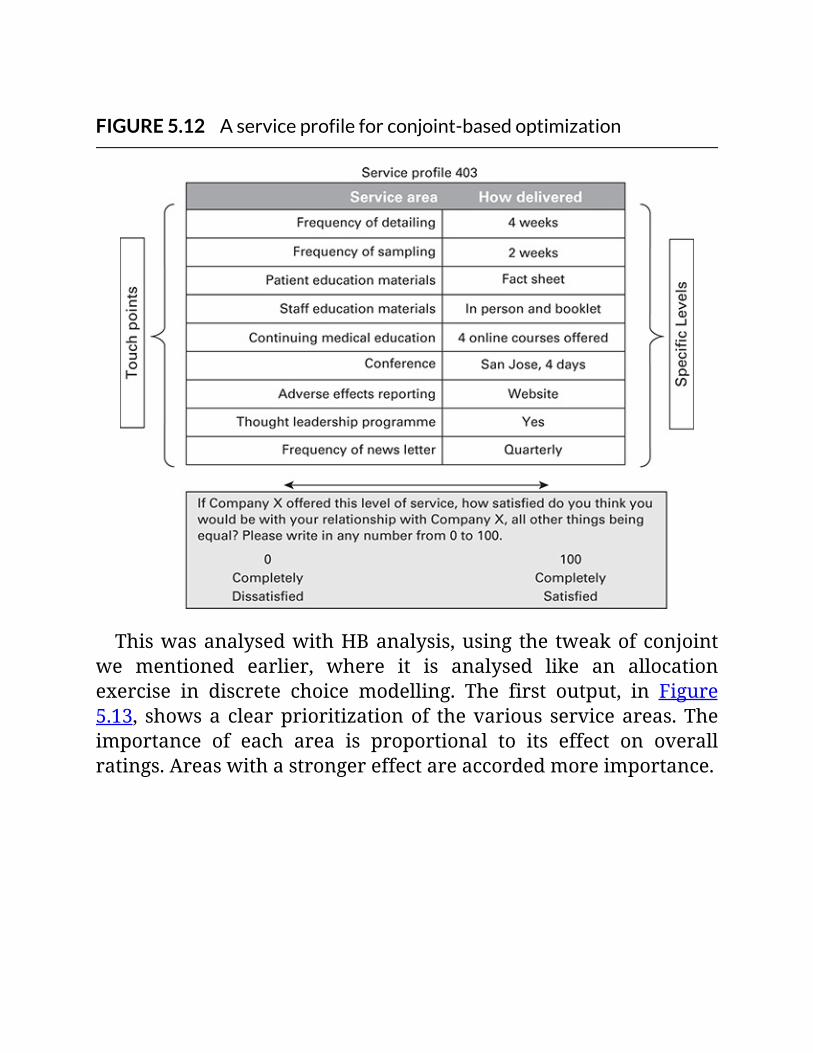
FIGURE5.12Aserviceprofileforconjoint-basedoptimization
ThiswasanalysedwithHBanalysis,using the tweakofconjointwe mentioned earlier, where it is analysed like an allocationexercise in discrete choice modelling. The first output, in Figure5.13, showsa clearprioritizationof thevarious serviceareas.Theimportance of each area is proportional to its effect on overallratings.Areaswithastrongereffectareaccordedmoreimportance.
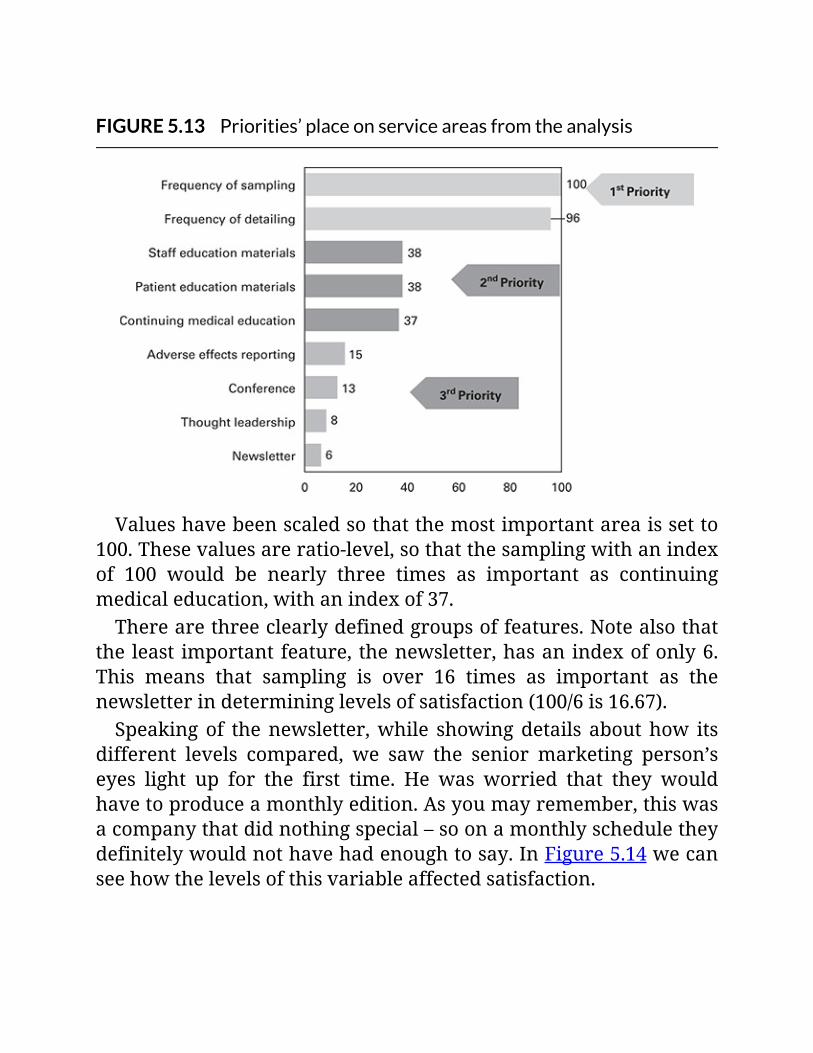
FIGURE5.13Priorities’placeonserviceareasfromtheanalysis
Valueshavebeenscaledsothatthemostimportantareaissetto100.Thesevaluesareratio-level,sothatthesamplingwithanindexof 100 would be nearly three times as important as continuingmedicaleducation,withanindexof37.Therearethreeclearlydefinedgroupsoffeatures.Notealsothat
theleast importantfeature, thenewsletter,hasanindexofonly6.This means that sampling is over 16 times as important as thenewsletterindetermininglevelsofsatisfaction(100/6is16.67).Speakingof thenewsletter,while showingdetails abouthow its
different levels compared, we saw the senior marketing person’seyes light up for the first time. He was worried that they wouldhavetoproduceamonthlyedition.Asyoumayremember,thiswasacompanythatdidnothingspecial–soonamonthlyscheduletheydefinitelywouldnothavehadenoughtosay.InFigure5.14wecanseehowthelevelsofthisvariableaffectedsatisfaction.
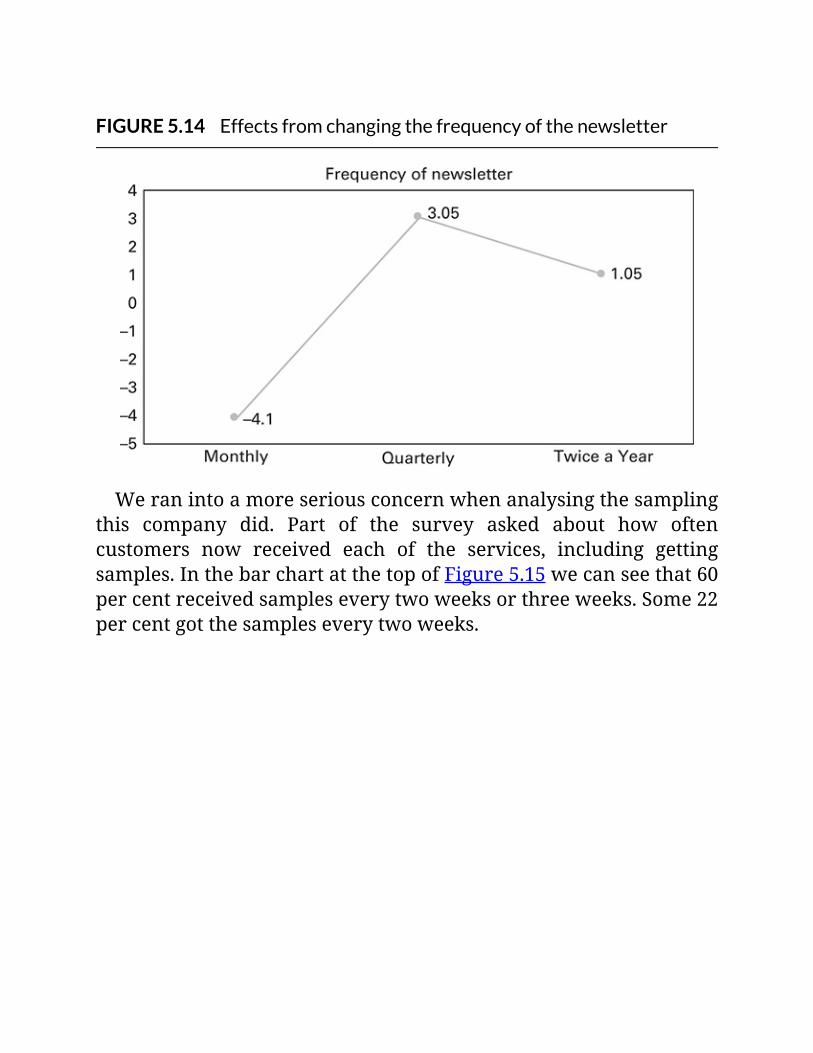
FIGURE5.14Effectsfromchangingthefrequencyofthenewsletter
Weranintoamoreseriousconcernwhenanalysingthesamplingthis company did. Part of the survey asked about how oftencustomers now received each of the services, including gettingsamples.InthebarchartatthetopofFigure5.15wecanseethat60percentreceivedsampleseverytwoweeksorthreeweeks.Some22percentgotthesampleseverytwoweeks.
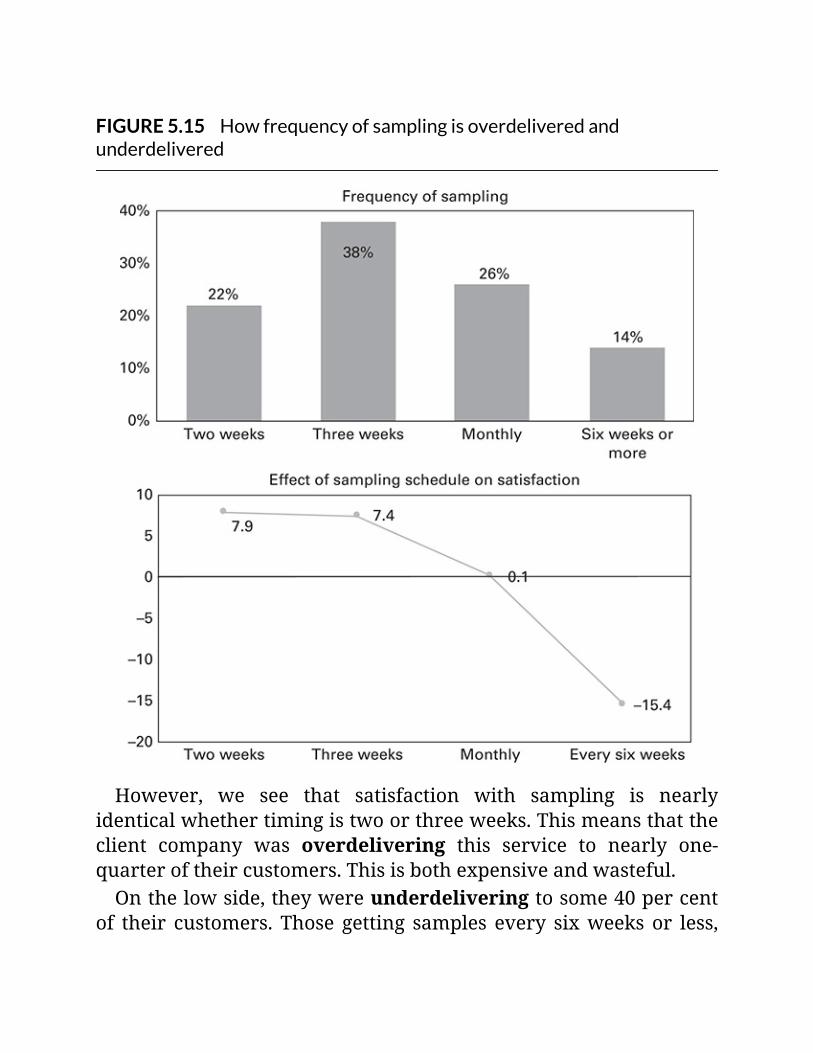
FIGURE5.15Howfrequencyofsamplingisoverdeliveredandunderdelivered
However, we see that satisfaction with sampling is nearlyidenticalwhethertimingistwoorthreeweeks.Thismeansthattheclient company was overdelivering this service to nearly one-quarteroftheircustomers.Thisisbothexpensiveandwasteful.Onthelowside,theywereunderdeliveringtosome40percent
of their customers. Those getting samples every sixweeks or less,
whichemergedashighlydissatisfying,accountforasubstantial14percentofcustomers.Clearly,workneededtobedoneonhowsamplesweregivenout.
This isacriticalareaforboostingcustomersatisfaction,andsomecustomersweregettingneedlessextra sampling,while fouroutof10weregettingsamplestooinfrequently.Because they did this conjoint service optimization, NewInnova
could realign sample delivery and so become a more desiredprovider of all their fabulous ‘me too’ products. They couldsimilarly refine and revise all their other service offerings, trulymeetingcustomers’ serviceneeds.Thiskindofpreciseguidance iswhatmakesthismethodsopowerful.
UsingthemessageoptimizationsimulatorintheonlineresourcesYoucandownloadfromtheonlineresourcesasimplesimulatorforoptimizing messages (available at www.koganpage.com/AI-Marketing). Once you have done this, if Excel asks if you reallywant torunit, say ‘yes’. IfExcelstilldoesnotwant togoforward,please refer to the instructionson the third tab, ‘Security inExcel2007andon’.ThissimulatorwillhidetheExcelribbon(thebarwithcommands
andmenusatthetopofthescreen)whenyouopenit.Twobuttonsoneachpageofthesimulatorcontrolwhethertheribbonisvisibleornot.You will find these buttons on the bottom of the opening
‘Welcome’page andat the right of the simulatorpage.Make sureyourestoretheribbontoviewandexitusingthe‘File’menuifyouwanttocontinueworkinginExcelafterclosingthesimulator.
Thestorybehindthesimulator

The sponsor, amagazinewewill callToday’s Troubles,wanted toshowhowmuchbetteralargeraddidinstimulatinginterestamongreaders. They also were confident that they were a strongerpublication than their similar competitors andverymuchwantedtoshowthataswell.Theytookanadthattheyfeltwasrelativelyneutral,advertisinga
vacation.Theymade16prototypeads,varyinginsizefromspottofull page, with different levels of colour, different imagery anddifferent levelsofdetail in the text.Theyplacedtheprototypeadsalongsidebland‘filler’contentiftheywerenotfullpage.Someadshadanaddedborderandsomedidnot.Most importantly, some of the ads were identified as being in
theirfinepublication,andsomeasbeingineachmaincompetitor’smagazine. This gave them a total of six features to be varied andsome864possibleconfigurations.
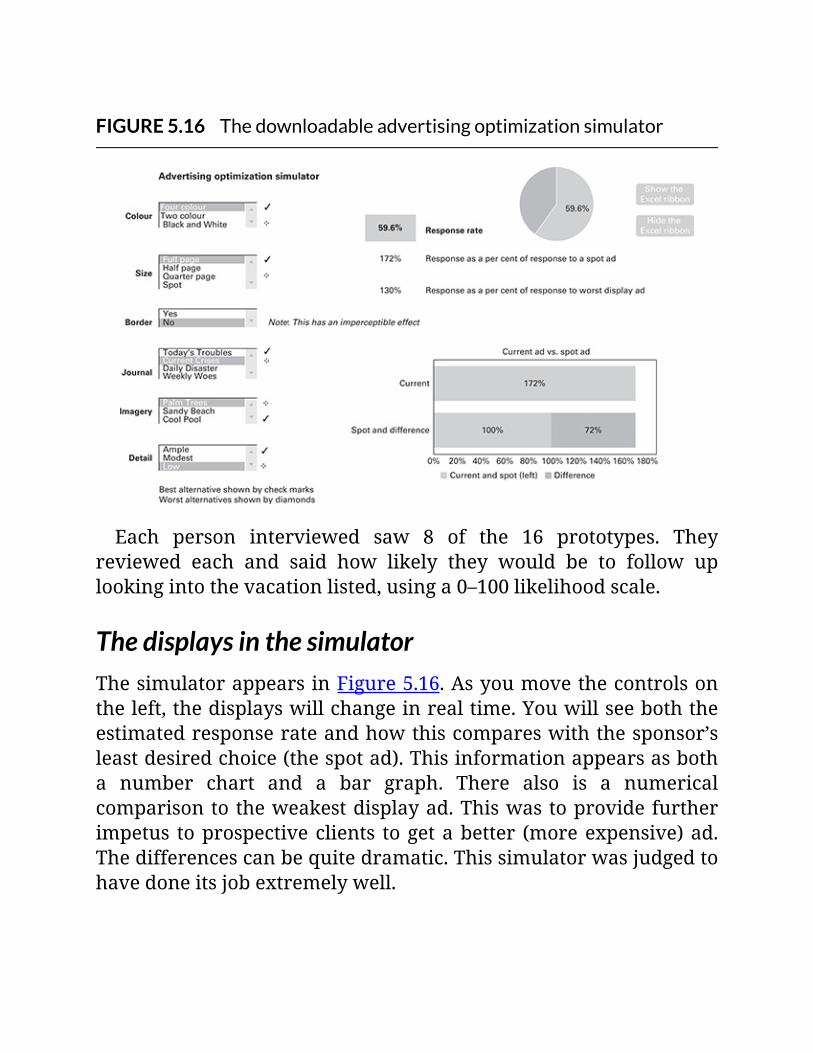
FIGURE5.16Thedownloadableadvertisingoptimizationsimulator
Each person interviewed saw 8 of the 16 prototypes. Theyreviewed each and said how likely they would be to follow uplookingintothevacationlisted,usinga0–100likelihoodscale.
ThedisplaysinthesimulatorThesimulatorappearsinFigure5.16.Asyoumovethecontrolsontheleft,thedisplayswillchangeinrealtime.Youwillseeboththeestimatedresponserateandhowthiscompareswiththesponsor’sleastdesiredchoice(thespotad).Thisinformationappearsasbotha number chart and a bar graph. There also is a numericalcomparisontotheweakestdisplayad.Thiswastoprovidefurtherimpetus toprospectiveclients togetabetter (moreexpensive)ad.Thedifferencescanbequitedramatic.Thissimulatorwasjudgedtohavedoneitsjobextremelywell.

ConjointanalysisandinteractionsNowthatwehavecoveredseveralimportantapplications,itistimeto circlearound todiscussmoreabout theworldofvariablesandhow they behave. The subject of interactions can becomeimportantwithconjointanalysis.Itcertainlyisimportantwheneverbrand is treated as an attribute and allowed to mix and matchfreelywithotherattributes.An interaction occurs when two or more variables together
behave in ways we would not expect from seeing each of themseparately.Forinstance,formenofacertainageandmind-set,redandsportscarinteract.Thatis,aredcarisnice,andasportscarisnice, but put them together into a red sports car and you havesomethingtrulyextraordinary.Itisworthfarmorethanyouwouldsuspect fromtheattractivenessofredcarsor theattractivenessofsportscars.Interactionsmattered a great deal in the early days of conjoint,
because attributes applied evenly to all brands. This wasparticularly problematic when brands responded differently tochangesinprice.An example comes from the golden days of Sony electronics,
whenthisbrandcouldchargemorefortheirproductsbecausetheirnamecarriedaspecialcachet.AswecanseeinFigure5.17,whereweplotsalesversusprice,Sonywouldalwayssellmoreatagivenprice than all their competitors. Their competitor RCA could sellnearlyasmuchbuthadto lowerpricestoattainthesamelevelofsales. Two other brands, the one offered by the store under theirown name, and the mysterious Nonameo (the brand you neverheardof)wouldfareconsiderablyworse.ThisiswhatweseeintheFigure5.17priceversus share curves for small televisionsofferedbythesefourbrands.
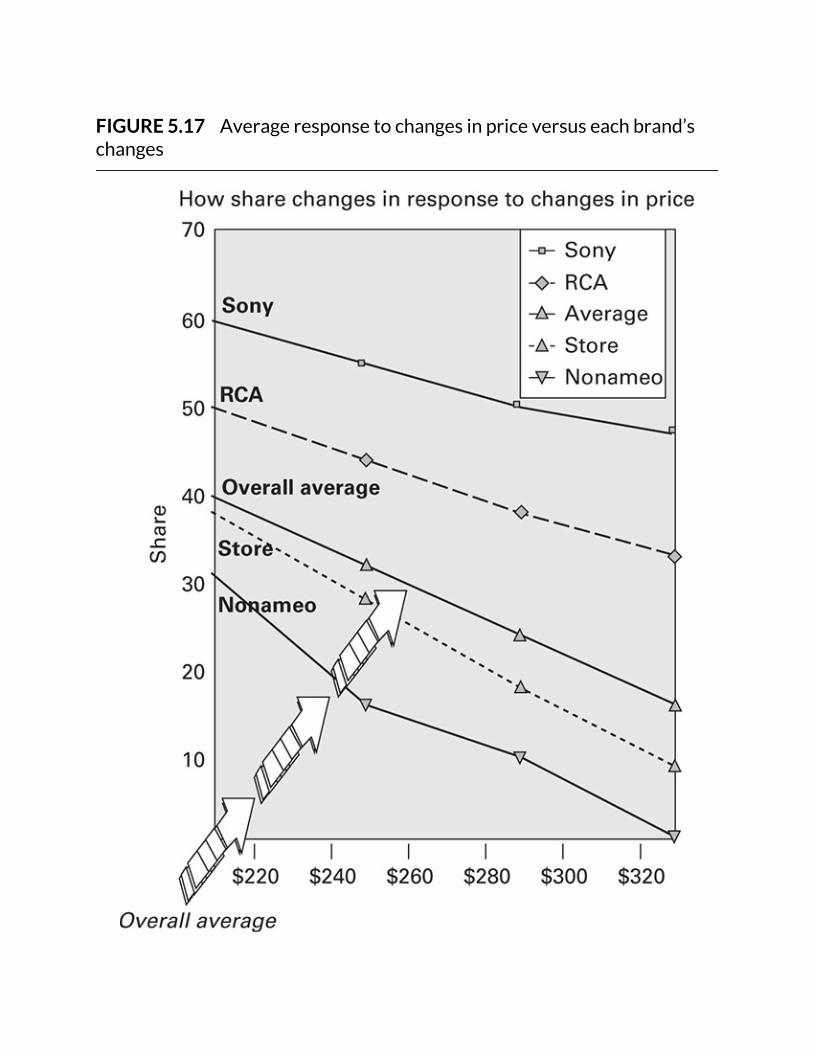
FIGURE5.17Averageresponsetochangesinpriceversuseachbrand’schanges
Ifyouweretouseasinglepriceattributethatappliedacrossallthe brands, your estimates would be wrong for all of them. ThiswouldbetheaveragelineinthemiddleofFigure5.17,pointedoutbythewhitearrows.Errors in estimating price responses probably contributed as
muchasanythingtoconjointfallingoutoffavour.Becauseconjointtreatedbrandasanattributeandpriceasanattribute,youneededtobuildinspecialinteractiontermstogetgoodmeasurements.Yettheexperimentaldesignsusuallyusedwerenotlargeenough
topickup those interactions.For instance, ifyouhad fourbrandsandfourprices,theinteractiontermwouldcontain4x4itemsor16parameters.Thesewouldbeinadditiontothefourbrandsandfourprices,whichtogetheramountedtoeightparameters.Youcouldcreatealargerexperimenttomakesurethatyouwere
measuringthis large16-iteminteractiontermaccurately,butthiskindofplanningdidnotseemtohappenmuchinpractice.Missingthis interaction could have disastrous results. For instance, if youhadfollowedtheaverageprice-responsecurveandweresellingtheNonameobrand,youwouldprobablygooutofbusiness.Attheverybest,youwouldbesittingonmountainsofunsoldinventory,asyouconsistentlyoverestimatedhowmuchyoucouldsell.Interactions usually are not a concern with discrete choice
modelling, because each choice can have its own attributes. Forinstance, if you want to measure responses to changing Sony’spricing,youwouldhaveavariable,Sonyprice,specifictotheSonybrand.Youwouldgetadirectandcleanmeasurementofhowsharechangedbymeasuringthisvariable.However, interactions still matter a great deal with a popular
variant of conjoint called choice-based (CBC), and so it is best toremainawareofthem.Wediscussthisfurtherinthenextsection.
Variantsofconjointanalysis
Manymodificationsofconjointhavebeenproposed.Twoofthebestknown are the so-called partial profile method and a softwareproduct calledAdaptive Conjoint Analysis (ACA). Partial-profileconjoint was designed to shrink the task that study participantsneededtodo.Theideawasthatonlyapartoftheproductwouldbeshown and the rest would be ‘assumed’ to be acceptable. Behinddoing this, there were some arguments about the interviewotherwise imposing too complexa task.Yet these concernsdonotseem well-founded. Research has been published that suggestspeoplecanevaluatequiteafewcomplexmarketplacescenariosorproduct profiles. One careful study showed that people were stillgoing strong after 21 marketplaces. How many you can use inpracticedependsonhowengaged theperson iswith the categoryandtheirnativeskillsinfiguringoutproblems.Engineers and farmers, for instance, do particularly well
evaluatingmanycomplexscenarios.(Farmersmustbeverygoodatcalculating and problem solving to stay in business. They reallymissverylittle.Theideathattheyarenotontopofthingsisdoublyfalse.)Childrenandpeoplewhorarelyreadtendtodopoorlyafterjustafewscenarios.ACAhadaperiodofwideadoption.Italsowasroundlycriticized
anddeservedsomeofit.Itallowspeopletoeliminatesomeattributelevelsbeforetheyseetheminthecontextofthewholeproduct.Aswe have mentioned several times, looking at the entire productoftenleadspeopletorevisetheirideasaboutwhatisacceptable.Inaddition,themathsusedtoscoretheitemsratedunacceptablewassubjectiveandunsubstantiated.Thismethodalsowaspromotedinpartasameansofmakingthe
interview less onerous. However, much of the impetus behind itmayhavebeenincuttingdowntherequiredsizeofexperiments.Inthe early days of conjoint,measuring only a handful of attributeswaspossible.Because we now can use HB analysis, and measure far more
attributes than used to be possible, this reduction is no longer
needed. Indeed, the popularity of the ACAmethod appears to bewaning, although you will still encounter some individuals whowanttouseit.
Choice-basedconjoint(CBC)This is a do-it-yourself software approach. It makes the processrelativelyeasy,butsimplifies theapproachenoughtosapsomeofitspowerandeventoallowmisapplications.However,itappearstobe quite popular. And indeed, to some, it is seen as synonymouswithdiscretechoicemodelling.However, itsname isaccurate. It takes something fromconjoint
and something from discrete choice modelling. (And as you mayhaveguessedfromtheinitialsCBC,itcomesfromthesamepeoplewhoofferustheACAsoftwareproduct.)AsyoucanseeinFigure5.18,itshowsalternativesandasksfora
choice.However,notethatbrandismissing.Itactuallyisofferingachoicebetweenthreevariantsofoneproduct.Thisisnotarealisticrepresentationofwhatconsumerswillfindinthemarketplace.
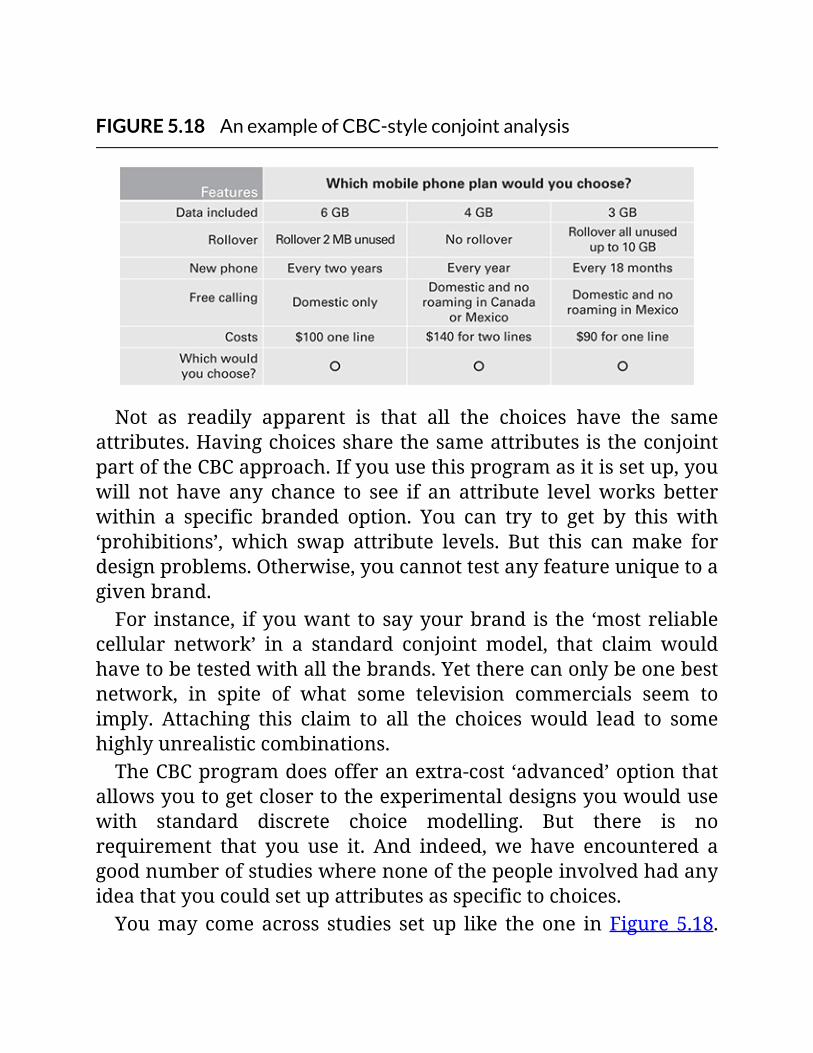
FIGURE5.18AnexampleofCBC-styleconjointanalysis
Not as readily apparent is that all the choices have the sameattributes.HavingchoicessharethesameattributesistheconjointpartoftheCBCapproach.Ifyouusethisprogramasitissetup,youwill not have any chance to see if an attribute levelworks betterwithin a specific branded option. You can try to get by this with‘prohibitions’, which swap attribute levels. But this canmake fordesignproblems.Otherwise,youcannottestanyfeatureuniquetoagivenbrand.For instance, ifyouwant tosayyourbrand is the ‘mostreliable
cellular network’ in a standard conjoint model, that claim wouldhavetobetestedwithallthebrands.Yettherecanonlybeonebestnetwork, in spite of what some television commercials seem toimply. Attaching this claim to all the choices would lead to somehighlyunrealisticcombinations.TheCBCprogramdoesofferanextra-cost ‘advanced’optionthat
allowsyoutogetclosertotheexperimentaldesignsyouwouldusewith standard discrete choice modelling. But there is norequirement that you use it. And indeed, we have encountered agoodnumberofstudieswherenoneofthepeopleinvolvedhadanyideathatyoucouldsetupattributesasspecifictochoices.Youmay comeacross studies setup like theone inFigure 5.18.
However, we can do better. The lack of realism in having threevariantsofaproductcompeteagainsteachother,whenthatwouldneverhappen in theactualmarketplace, isa serious shortcoming.And the absence of branding is another problem. Everything thatwebuy anywhere, except certain ‘generic’medications,will comewithclearbrandidentifications.Also,ifyouincludebrandasanattributeinthisset-up,thatthen
opensuptheneedtoaddinteractionterms.(Youalsocanavoidthisby breaking with the program’s default method of setting upproblems.)Asareminder,interactiontermsarelarge,havingmanyparameters that need to be estimated. You definitely cannotestimate all possible interaction terms in even a small problem –therearetoomanyitemstogetanaccuratefixonallofthem.Therefore,unlesssomeoneisdoingconsiderableextraworkwith
CBC,weshouldnotexpectittoprovidewhollyaccuratereadingsofhowproductsperforminacompetitivemarketplace.Itshouldgiveyouanexcellentreadingoftherelativeappealoffeatureswithinaproduct, just as full-profile conjoint will. However, finding howappealing features are – versus each other – falls far short ofestimatingshare,evenshareofpreference.SouseparticularcareiftheCBCapproachisbeingusedtoestimatemarketplacebehaviour.TocompareCBCtofull-profileconjoint,ontheplussideforCBC,it
asksforachoice.This ismorelikewhatpeopledoeverydaythantheratingsthattraditionalconjointrequires.Onthedownside,CBCaskspeopletoprocessmuchmoreinformationthanconjointdoes.Thatis,eachscreenapersonseeswithCBCcouldcontainthreeorfour product profiles side by side. Full-profile conjoint shows justoneprofile.
Choice-basedconjoint(CBC)isapopularsoftwareapplicationthatmanyseeassynonymouswithdiscretechoicemodelling.However,itsnameisaccurate.Ithassomefeaturesofconjoint,andsomeofdiscretechoice.Itiseasytouse,butunfortunatelyalsomakesiteasytocommitmistakes.Itisnotthebestchoiceforseeinghowproductswillbehaveinacompetitivemarketplace,becauseofthewayitsetsupcomparisonsanditsdefaulthandlingofattributes.Itshoulddoanexcellentjobofdeterminingtherelativeappealofattributes–andofthelevelsofthoseattributes–justastraditionalfull-profileconjointwill.Butbeverycautiousifsomeonehasuseditandisattemptingtoforecastshare.
Which one is better for a conjoint-like task? There is no clearanswer.Somewouldsay that thechoice involved inCBCmakes itmorerealisticandsosuperior.Others(yourauthorincluded)havenoticed thatmostpeopledonot like toreadwhiledoingasurvey.The fact that full-profileconjointshows justoneproductata timehelpsstudyparticipants.Thisallowspeople toseewhat theyneedmoreeasily,andsotorespondmorethoughtfully.Whichonetouseis an area that those disposed to arguing could argue about allnight.Butlet’snot,andlet’sleaveituptoyourpreference.
SummaryofkeypointsConjointanalysis is theothermethodintendedtodevelopthebestpossibleproductsandservices.Whilediscretechoicemodellingwasdeveloped by economists and econometricians, conjoint analysisdevelopedinthemarketresearchcommunity.The first truly useful, and widely adopted form of conjoint
analysis is called full-profile conjoint. This shows an entireproductrepresentedasasetofspecificallydescribedattributes,oraproduct profile. Study participants see a series of these profiles,and in each the levels of the attributes that appear vary. Studyparticipantsratetheseprofiles,orsortandrankthem.(Therankingapproachisrarenowthatinterviewstypicallyaredoneonline.)Likediscretechoice,conjointreliesonstrictexperimentaldesigns
to make sure that the effects of varying one attribute do not get
mixedupwiththeeffectsofvaryinganother.Withoutthedesignedexperiment, attributes can get more or less attractive from oneprofile toanother inhighlysimilarways. If thishappens,we thenhavenoclearwayoftellingwhatisdrivingproductpreferences.
AsimplermodelConjointanalysisisbasedonasimplerviewofattributesandutilitythanisdiscretechoicemodelling.Inconjoint,brandisanattributeandallotherattributesapplyequallytoallbrands.Thiscanleadtounrealisticcombinationsofattributelevelswithagivenbrand,andsoisasalientdrawback.Thisunderlyingconjointmodelalsomakesitmuchmoredifficult
todeterminewhathappenstoaspecificproductwhenitsfeatureschange. This becomes particularly problematic with price, as ineverycategorywehaveeverstudiedat leastoneproductbehavesdifferentlyfromallotherswhenitspricechanges.Assumingallproductsbehaveinthesamewaywhentheirprices
changeactuallymakes itnearly certain thatall estimatesof sharechangeswillbewrong.Youcantrytoavoidthisinconjointanalysisbyaddingalargeinteractiontermtothemodel.Forexample,withpricevariablehavingfourlevelsandabrandattributehavingfourlevels, the interaction term would have 4 x 4 items or 16parameters that need to get estimated. (This is in addition to theeightparametersrepresentedbythefourpricelevelsandthefourbrandlevels.)Estimating all these extra parameters would require making a
bigger experiment. The basic design typically used for conjointanalysiswouldinfactbetoosmalltomeasurealltheseextraitemsaccurately.
AboututilityTraditionally, conjoint analysis took the very simple view that
utility and share have a straight-line relationship. This does notreflect the realities of themarketplace. Fortunately, you now canretoolconjoint,solvingit likeadiscretechoiceallocationproblem.Onceyouhave slightly recast theanalysis, thenyou canhandle itlikediscretechoicebyusingHBanalysis.Thisgivesamorerealisticviewofhowutilitybecomespreferences.
NotbestforestimatingeffectsincompetitivemarketplacesTheremainingproblems,though,makeconjointlessthanidealforestimatinghowproductswillbehaveinacompetitiveenvironmentwhentheyarevaried.Theproblemofattributesnotbeingspecificto the choices alsomakesmeasuring responses to changes in theattributeslessaccurate.It isnowonderconjointanalysishasbeeneclipsed by discrete choice as the leading method for predictingacceptanceofproductsinacompetitivemarketplace.
StillhighlyusefulinthreeimportantapplicationsAlthough we do not recommend conjoint as a replacement fordiscrete choice modelling, it has other highly useful applications.Herearethreecompellinguses:
Wherecompetitivecontextwouldbeoverwhelming:thiswouldbethecasewhenyouwantedtomakethebestproductandtheproductinquestionhadaverylowshare.Becausetheproductwouldgetchosenonlyrarely,patternsofchoiceswouldnotaccuratelyrevealwhichchangesworkedbest.Conjointanalysis,withitssingle-productfocus,canputthatproduct‘underamicroscope’andshowhowtoselectthebestvariationsofitsfeatures.Foroptimizingcommunications:suchasprintadvertisementsandwebsites.Youcangettherelativeappealofthousandsof
alternativeconfigurations,completelysurpassingsuchcurrentmethodsasA/Btesting.Fordeterminingtheexactlevelsofserviceincomplexcustomerrelationships:suchasbetweenutilitiesandtheircommercialcustomers,ortelecommunicationsorinsurancecompaniesandtheirusers.Themanyelementsincustomerinteractionscanbecarefullytailored,leadingtothebestmix.
VariantsofconjointanalysisConjoint has had a number of variants, including most notablychoice-basedconjoint(CBC).Asitsnamesays,ithassomethingfromconjoint and something from discrete choice, and yet is neither.Thismakes itrelativelyeasy tosetupaprobleminvolvingchoice.However, if left in itsdefault settings, it treats the choicesas theywouldbeinatraditionalconjointanalysis.Ifbrandisincluded,itistreatedasanattributeandallowedtocombinefreelywithallotherattributes.(Youcanbuyanextracost‘advanced’modulethatallowsyou to get closer to designs like those used by discrete choicemodelling.)This method also allows you to make highly unrealistic
comparisons, such as comparing three unbranded variants of aproductversuseachother.Thisisnothingyouwouldeverseeintheactualmarketplace,andits lackofrealismmakesanyestimatesofreal-worldbehavioursuspect.Thismethod,liketraditionalfull-profileconjoint,shouldgiveyou
anexcellentpictureof relativepreferencesamongdifferent levelsofthevariousfeatures.However,preferenceisnotchoice.Wehopeyouall recall thestoryabout the littlegirlwho lovedspinach,butnotenoughtoeatit.It is an open question whether CBC is better than full-profile
conjointforthosequestionsthatconjointissuitedtoanswer.SomewouldsaythatthefactCBCasksforachoice,ratherthanarating,makes it superior. Some (your author included) have noticed that
nearly all study participants do not like reading while doing asurvey. Showing them one product at time, as in full-profileconjoint, encouragesmore attention and thought to how featuresarebeingvariedthanseeingthreeorfourproductvariantssidebyside.
OverallAlthough supplanted by discrete choice modelling for forecastinghow products will behave in a competitive marketplace, conjointanalysisstillhasimportantuses.Youcanuseittozeroinonalow-shareproduct thatwouldhardly ever get chosen in a competitivemarketplace.Itsabilitytoputaproduct‘underamicroscope’canbeuseful in any exercise where you want to optimize the user’sexperiencewiththatproduct.We reviewed a successful example of this, in which study
participants evaluated18disposablepens configuredaccording toanexperimentaldesign.Thiscloseattentiontooneproductallowedthemanufacturertocreateapenthathadthebestpossiblewritingcharacteristics.Also,conjointanalysiscandoremarkablywellinfindingthebest
mixofelementstoincludeinamessageoronawebpage.Youcantest the equivalent of hundreds or thousands of alternativeconfigurationsinonesimpletest.ThismethodcompletelysurpassestraditionalA/Bweb testingwhere,atmost, two to fouralternativepagesaretested.Lastly, conjoint can optimize how services are delivered in
complexcustomer relationships.Where therearemanyways thatcompanies interact with their customers, sometimes calledcustomer touch points, conjoint can define the best possibleconfiguration. Companies that have complex service relationshipscan be found in areas such as telecommunications, utilities,insurance socialnetworking, and themedical andpharmaceuticalindustries.

Four simulators are available in the online resources for thischapter (available at www.koganpage.com/AI-Marketing). Theywillgiveyouanideaofthetruepowerinconjointanalysis.Threeofthem are different versions of a single product optimizationsimulator,one inPowerPoint,one in (AdobeAcrobat)PDF format,and one in Excel. The other shows responses to different printadvertisements,revealingtheoptimalconfiguration.Weencourageyoutofollowthe instructions inthischapter,anduseandexploreallofthem.

BonusChapter1:Finishingexperimentsandontothenon-experimentalworld
Thisbonuschaptershowsthebestusesoftheotherkeytrade-offmethods,MaxDiffandQ-Sort/Case5,whichprovideclearlydifferentiatedimportanceforlistsoffeatures,claimsormessages.Itwillgiveyouguidanceonwhenitismostappropriatetouseeachofthesemethods,andwhenyouwouldbebetterservedbyeitherdiscretechoicemodellingorconjointanalysis.Italsoprovidescriticalcontrastsbetweenthesemethodsasagroupandthosethatdealwithlessstructureddata–includinghowtoapplyandinterpreteach.
Accessthisbonuschapteronlinehere:
www.koganpage.com/AI-Marketing
06PredictivemodelsViaclassificationsthatgrowontrees
Thischapterdescribestheclassificationtreemethods,aremarkablesetofapproachesthatuncovercomplexrelationshipsindata.Hereour focus broadens from predicting shares and understandingvariables’relativeimportancestodevelopingmodelsthatboosttheoddsof reachingadesiredoutcome.Several illustrationswill takethemystery out of thesemethods and show how they apply.Wealsodiscussseveralusefulextensionsofbasicclassificationtrees.
Classificationtrees:understandinganamazinganalyticalmethodNow that we have absorbed a great many facts about predictingwhat happens when you change the features of a product (orserviceormessage),itistimeforsomethingcompletelydifferent.Asareminder,throughChapters4and5(andbonusonlineChapter1)we have seen highly powerfulmeans of understanding variables’effects, and other methods that diagnose variables’ importances.Discrete choice and conjoint provide remarkable power inansweringwhat/if-typequestions,andtheMaxDiffandQ-Sort/Case5methodsclearlydelineaterelativeimportances.Hereweshiftfromfocusingontheseareas,expandingtomethods
thatalsocanworktoimprovetheoddsofanoutcome.Marketshareand odds are closely related concerns. Improving the odds of anoutcome is something different. The goals of doing that includereducing uncertainty and waste. Also, as we will see, these
investigations can provide insights that lead to further analyses,andfinallypropelchanges.Classificationtrees,thesubjectofthischapter,arethefirstsetof
methodsthatcanbeturnedtowardsincreasingthelikelihoodofanoutcome.Othermethods that are pressed into service in thiswayinclude the Bayesian networks explained in Chapter 7, and theensembles andneural networks in Bonus online Chapter 2.Manyothermethodsexist.Classificationtreesstartedasmoreofapromisethanasolution.
Manyyearsago(inthe1980s,tobeexact,whichpracticallycountsasancienthistory)precursorsoftoday’smethodsweredismissedasweak and inadequate. Since then, the procedures and computershave developed.Now classification trees have become a powerfulandwell-studiedsetofpredictivemethods.Inthe last fewchapters,wekept theanalyticaldetailsdiscretely
tuckedaway,doubtlesstothereliefofmany.Wewillmentionnowthat discrete choicemodelling and conjoint use variants of eitherregression,multinomiallogitormotherlogit.Theselasttwoareregression-like methods that solve problems where the targetvariableisasetofcategories.(Thedistinctchoiceswearetryingtopredictare thecategories.)Thereareseveralrelatedmethods thatcould be used, but understanding the distinctions does not helpunderstand theusesandoutputof thesemethods.The finedetailsarebestlefttotheexperts.
AhighlyvisualapproachWithclassificationtrees, theanalyticalmethoditself iskey.Seeinghow the analysis progresses is important in understanding theresults. The Bayes Nets we discuss in Chapter 7 also are highlyvisuallyoriented.Eachofthesemethodsisquitedifferentfromallthathavegonebefore.In this chapter we will mostly discuss the classification tree
method called CHAID. There are a host of other, closely related
methods with different names, most notably CART (also calledC&RTandCRT).WewilltalkabouthowCHAIDandCART(andtheothers)compareandcontrastafterwereviewsomeapplications.
Seeinghowtreeswork,stepbystep
SplittingandresplittingCHAID and relatedmethods split the data into groups, seeking tofind some group (or groups) with more of some desiredcharacteristic.Thenitsplitseachofthesegroupsagain.Itcontinuessplitting until it reaches some stopping point you specify.We canthinkofitassomethinglikeasifterthatworksinstages,witheachstagerefiningtheselectedgroupmorefinely.Forinstance,seekingbuyersofaproduct,wemightuseavariable
suchasnumberofchildrenathome to findgroupsbuyingmoreand buying less. Looking at all possible numbers of children athome, from zero to 14,wemight then find the biggest differencebetween thosewith fiveormorechildrenathomeand thosewithfewer than five children. Classification trees zero in on the bestwaystofinddifferencesofthiskind.Oncethesemethodssplitthedata,theythenreturntothesmaller
subgroups formed and split those again – and if possible, again.Eachsplitproducesstill smallergroups.Someof thosegroupswillhaveagreatdealofthedesiredcharacteristic.Supposewegobackto families with five or more children. We might then find thatthoselivinginthesuburbswithinthisgrouparestillmorelikelytobebuyers.Thismaysoundabstract,solet’stakealookathowthisactuallyworks.
CombattingKardboardKrunchiesThe example deals solely with behaviour and demographics. It

starts with a database, which contains household characteristicsanddata aboutpurchasesofbreakfast foods. The client,SoggyOs,has grown concerned about inroads made by their dreadcompetitor, Kardboard Krunchies. These two brands, togetherwith Sorghum Sweeties, dominate the cellulose-enriched, overlysweetenedbreakfast-likesubstanceproductcategory. (Forthoseofyouwhohavenotbeenoutofdoorsmuch, theseare fictionalizedbrandnames.Also,theoutcomehasbeenslightlydisguised,asyouwillsee.)SoggyOs,Inc.hadamassedinformationaboutpurchasersof theircategoryfromscannerdataata largegrocerychain.Theycollected information on some 14,552 households that boughtproducts in their specific category. Some 20 per cent purchasedKardboardKrunchies.Because this was scanner data and the store had a so-called
loyaltyprogramme,theyknewtheaddressofeachpurchaser.(Thepurchaser scanned a tag or held up their smartphone next to ascanningdevicewitheachpurchase.)SoggyOs, Inc. thenmerged thepurchasewith informationabout
the purchaser’s household demographics. An amazing amount ofsuchinformationisavailabletobeadded,orappended,tothedataof any individual whose address is known (at least in the UnitedStates,andnearlyasmuchsointheUK).Hundredsofdemographicandproduct-usageitemsareavailable.Thedaysofprivacyarelongbehindus.Amongthedemographiccharacteristicsappendedtohouseholds
in thisdatabase,we find items suchas the typeof town inwhichthey live, reported household incomes, education levels and thepresence and ages of children – and so on. In total, there are 46demographic characteristics for each household in the database.Figure 6.1 depicts the incidence of Krunchies buyers in thispopulation.
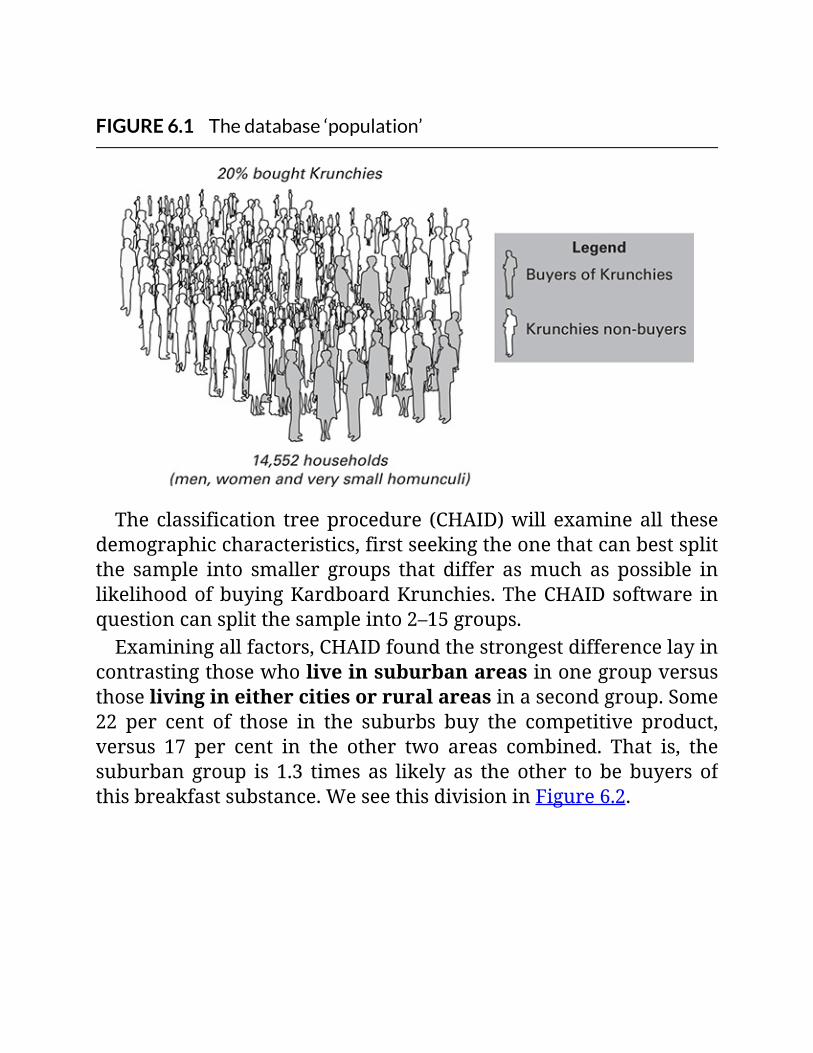
FIGURE6.1Thedatabase‘population’
Theclassification treeprocedure (CHAID)will examineall thesedemographiccharacteristics,firstseekingtheonethatcanbestsplitthe sample into smaller groups that differ asmuch as possible inlikelihoodofbuyingKardboardKrunchies.TheCHAIDsoftware inquestioncansplitthesampleinto2–15groups.Examiningallfactors,CHAIDfoundthestrongestdifferencelayin
contrastingthosewholiveinsuburbanareasinonegroupversusthoselivingineithercitiesorruralareasinasecondgroup.Some22 per cent of those in the suburbs buy the competitive product,versus 17 per cent in the other two areas combined. That is, thesuburbangroup is 1.3 times as likely as the other tobebuyers ofthisbreakfastsubstance.WeseethisdivisioninFigure6.2.
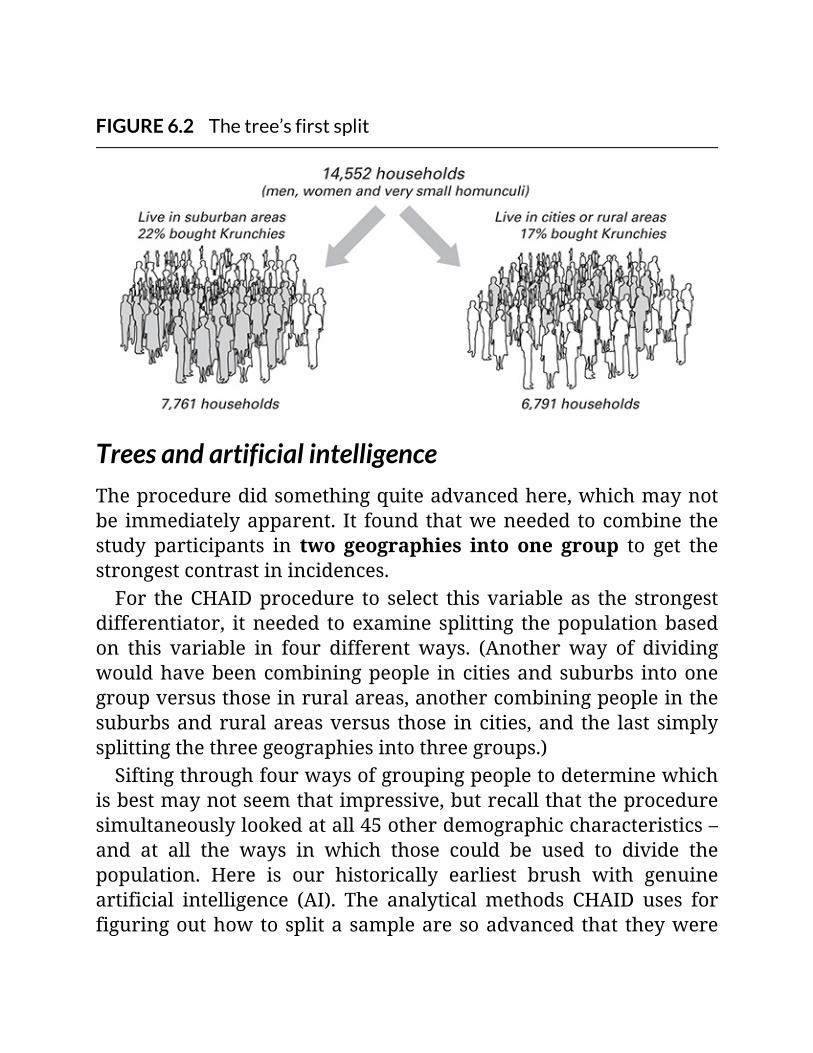
FIGURE6.2Thetree’sfirstsplit
TreesandartificialintelligenceTheproceduredidsomethingquiteadvancedhere,whichmaynotbe immediatelyapparent. It found thatweneeded tocombine thestudy participants in two geographies into one group to get thestrongestcontrastinincidences.For theCHAIDprocedure to select thisvariableas the strongest
differentiator, itneeded to examine splitting thepopulationbasedon this variable in four different ways. (Another way of dividingwouldhavebeencombiningpeople incitiesandsuburbs intoonegroupversusthoseinruralareas,anothercombiningpeopleinthesuburbsandruralareasversus those incities,and the last simplysplittingthethreegeographiesintothreegroups.)Siftingthroughfourwaysofgroupingpeopletodeterminewhich
isbestmaynotseemthatimpressive,butrecallthattheproceduresimultaneouslylookedatall45otherdemographiccharacteristics–and at all the ways in which those could be used to divide thepopulation. Here is our historically earliest brush with genuineartificial intelligence (AI). The analytical methods CHAID uses forfiguringouthowtosplitasamplearesoadvancedthat theywere

firstpresentedatanAIconference.Whattheprogramdoesnextaddsmorevalue(andcomplexity)to
thefindings.Itreturnstothefirstgroupsplitfromthetotal,theonewith7,761householdsthatweseeinFigure6.2.Itthensearchesallthe remainingdemographic characteristics specificallywithin thatgrouptofindtheonethatwillleadtoasubgroupwithastillhigherincidenceofKrunchiesbuyers.Figure6.3 showswhat theprocedure found.This is a three-way
split of the group living in the suburbs, based on number ofchildrenathome.
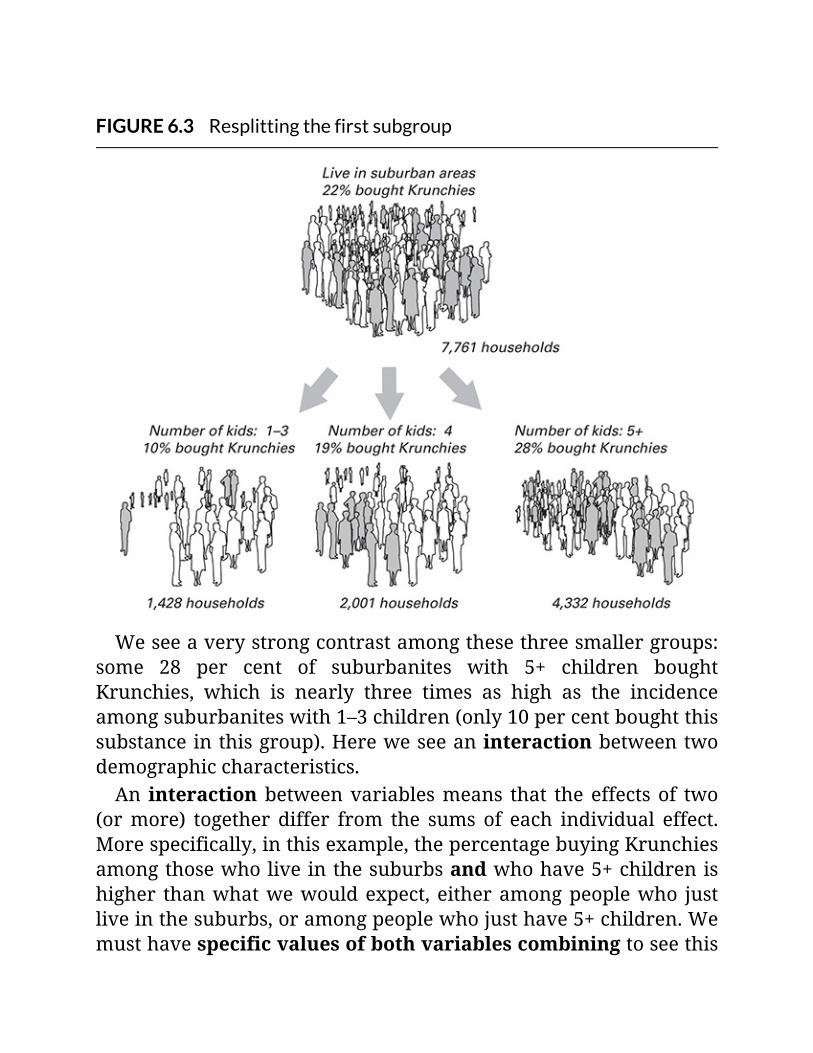
FIGURE6.3Resplittingthefirstsubgroup
Weseeaverystrongcontrastamongthesethreesmallergroups:some 28 per cent of suburbanites with 5+ children boughtKrunchies, which is nearly three times as high as the incidenceamongsuburbaniteswith1–3children(only10percentboughtthissubstanceinthisgroup).Hereweseeaninteractionbetweentwodemographiccharacteristics.An interaction betweenvariablesmeans that the effects of two
(ormore) together differ from the sums of each individual effect.Morespecifically,inthisexample,thepercentagebuyingKrunchiesamongthosewholiveinthesuburbsandwhohave5+childrenishigher thanwhatwewouldexpect, eitheramongpeoplewho justliveinthesuburbs,oramongpeoplewhojusthave5+children.Wemusthavespecificvaluesofbothvariablescombiningtoseethis

highapercentageofSoggyOseaters.In this instance, the variables work together to lead to this
unexpectedlystrongoutcome.Thisisonetimewhenwecanusetheonce-populartermsynergisticandmeanit.
Interactions
Theeffectoftwoormorevariablesworkingtogethertoproduceanoutcomethatisdifferentfromwhatwewouldexpectbasedontheeffectsofthevariablesseparately.Thiseffectcanbelarger,orsynergistic,orsmalleroranti-synergistic(notnearlyasgoodabuzzword).
CHAIDisamazinglygoodatfindinginteractions.ThewordCHAIDis an acronym of chi-squared automatic interaction detector.Classification trees may be unique in that interactions areunmistakable in their output. Interactions do not automaticallyappear in nearly all other statistical procedures. Also,most otherprocedures do not tell you if you are missing an importantinteraction.Clearly, ifyouwanttounderstandeffectsonsomeoutcome,you
should understand if two ormore variables combine to act in anunexpected way. CHAID has unique problem-solving abilities inrevealinganddisplayingthesepatterns.What precisely does this have to do with a tree? The common
displaythatCHAIDproduceslookstree-like.Let’sexamineagainthesplits we just laid out, this time in the standard tree format (seeFigure6.4).
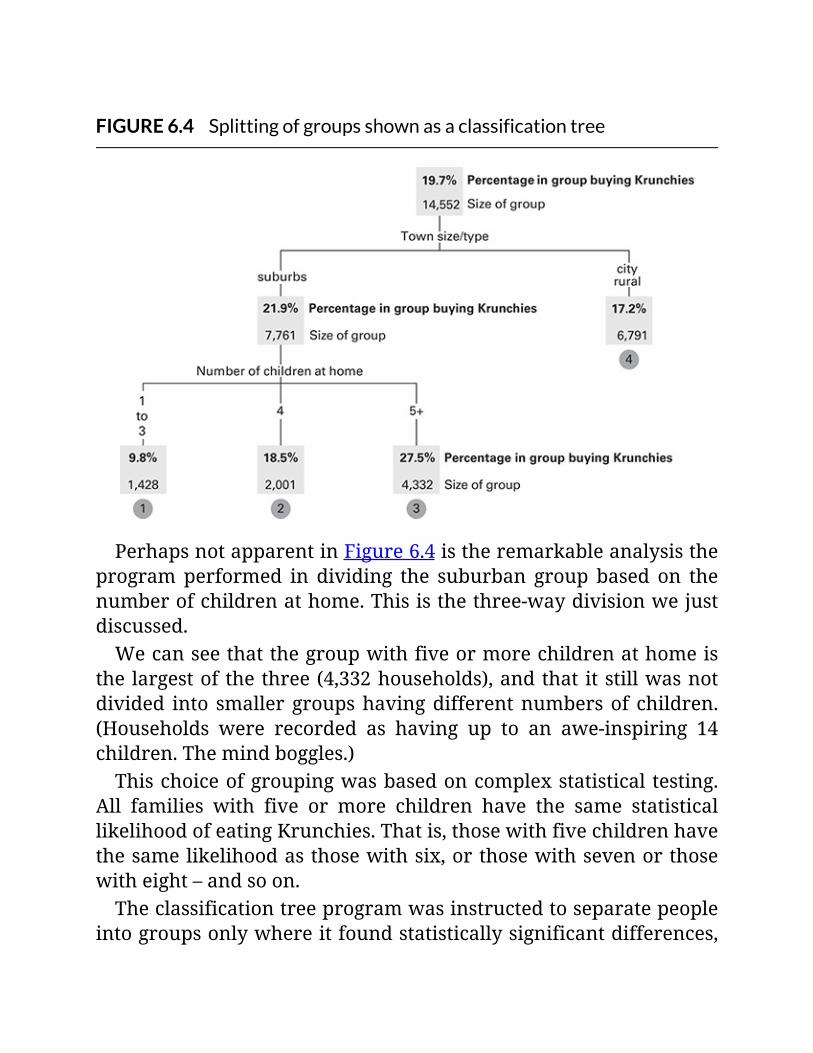
FIGURE6.4Splittingofgroupsshownasaclassificationtree
PerhapsnotapparentinFigure6.4istheremarkableanalysistheprogramperformed in dividing the suburban group based on thenumberofchildrenathome.Thisisthethree-waydivisionwejustdiscussed.Wecanseethatthegroupwithfiveormorechildrenathomeis
thelargestofthethree(4,332households),andthat itstillwasnotdivided into smallergroupshavingdifferentnumbersof children.(Households were recorded as having up to an awe-inspiring 14children.Themindboggles.)Thischoiceofgroupingwasbasedoncomplexstatistical testing.
All families with five or more children have the same statisticallikelihoodofeatingKrunchies.Thatis,thosewithfivechildrenhavethesamelikelihoodasthosewithsix,orthosewithsevenorthosewitheight–andsoon.Theclassificationtreeprogramwasinstructedtoseparatepeople
intogroupsonlywhereitfoundstatisticallysignificantdifferences,
while itsearchedthroughallpossiblewaysofdividingthesampletofindtheonewaythatwasthestrongest.Thisgroupof4,332waslargeenoughtodividefurther,butnodifferencesexistedthatcouldleadtoafurtherdivision.Thiscontrastfoundbytheprogram(basedonnumberofchildren
athome)isverystrongstatistically.Thereisonlya0.00001percentchance that the three groups have the same incidence of buyingKrunchies.This is farbeyond the lowestacceptable threshold (a5percentchanceofthegroupsbeingthesame).Ifyoufeelinneedofarefresheronstatisticalsignificance,pleasecheckbacktoChapter2.Thefullanalysiswouldcontinuepastthispoint,continuingtouse
other characteristics to grow the tree. Thiswould gountilwe ranout of demographic characteristics that led to further significantdifferences, oruntilwedecided that thegroupswere too small tosplitfurther.Wewill saya fond farewell toKrunchiesbynotingagain thata
veryhigh27.5percentofall suburbanfamilieswith fiveormorechildrenbuythisfineproduct.Thisledtoaninsightthatwarrantedfurtherexploration.Namely, SoggyOs, Inc. asked, ‘Could a larger-size package help
attract this group?’ SoggyOs pursued this finding, investigated theappealofthisideausingadiscretechoicemodelandcameupwithan optimal new product. This is their highly popular economygunny-sack size. (US cereal buyers may notice that many brandsnow offer, if not exactly this, a massive multi-large-box special.Theredefinitelyisappealinhavingheapsofone’sfavouritecereal-likesubstanceathome.)
OptimalrecodingClassification trees’ ability to split a variable in the best possibleway, picking the breaking points and the number of groups, is aremarkableanalyticalstrength.This iscalledoptimalrecoding. It

hasparticularvaluewhendealingwithcategoricalvariables.As a reminder, a categorical variable is onewhere thenumeric
codesholdplaces fornon-numericalvalues. Inourexample, towntype/sizewasacategoricalvariable.Theprogramheldthevaluesof1, 2 and 3 for this variable, corresponding respectively to city,suburbanandurban.
Optimalrecoding
Optimalrecodingisclassificationtrees’uniqueabilitytosplitthecodesinavariableinthebestpossiblewaytopredictanoutcomevariable.Codesareautomaticallyarrangedintogroupsandthebestsplittingpointsfound.Thisinvolvesverycomplextesting,sophisticatedenoughtobeclassifiedasartificialintelligence.
Strong,yetweakClearly,everythinginaclassificationtreedependsheavilyonwhichvariablegetschosenfirst.Thevariablewiththestrongeststatisticalsignificance will get the nod, unless you tell the program to dootherwise.Yet,whilethisvariablecouldbethebestatthatspecificpoint, itmight notwork best from the point of view ofmaking agood overallmodel. Trees do not look forward to seewhatmighthappenifanothervariablewerechosen.Technically,treesareanexampleofagreedyalgorithm.Thisisa
methodthatmakesachoiceateachgivenpointandthendealswithwhateveroutcomesariselater.We often find that many variables would pass the test of
significanceatanygivenspotinatreediagram.Therefore,anyoneof them could be chosen as a predictor there. The differences insignificancebetweenthe ‘best’variableandthenext fewbest–oreventhenext20ormore–canbevanishinglysmall.Thebestpredictorcouldbesignificantatsomethinglikethe10-16
level(thatis16zerosafterthedecimalpoint,ortowritethisoutjustonce, 0.0000000000000000). The next few on the list might besignificant at better than the 10–14 level, so the differences instatistical significance are microscopic. Yet putting in differentvariablesatanypointcanleadtoverydifferenttreesbelow.What canwedo toguardagainst thisproblem?Randomforests
canprovidesomeguidance.
Randomforests
Randomforests
This method runs many hundreds of classification trees, in eachtree swapping out people and variables at random. Then all thetrees‘vote’onafinaloutcome.Anexcellentreadingoftruevariableimportancescomesfromobservinghowclassificationlevelschangeas variables and people aremoved into and out ofmanymodels.The analysis also provides diagnostics showing how variables’importances shift as more trees are added. Eventually, afterrunning a few hundred alternative models, we reach stableestimates.‘Random forests’ adds to the list of horrible names beloved of
maths and science types (think of SCSI – pronounced ‘scuzzy’ –drives,boxandwhiskerplots,andp/pplots,forinstance).However,randomforestsillustrateakeyfindingfrommachinelearning.Thatis,theaverageofmanyweakestimatestypicallyisbetterthananyof the individual estimates. This is important enough to call outseparately.Any approach that uses many models, getting an average of
estimates,iscalledanensemblemethod.Withensembles,wehaveventureddeepintomachinelearning.
Ensembles:manymodelsboostaccuracy
Theaverageofmanyindifferentorweakmodelstypicallyperformsbetterthananyoftheindividualmodels.Thisisakeyinsightfrommachinelearning.Randomforestsareanexampleofensemblelearning.
In our examplebelow,wewill run a forestwith 500 treemodels.Having500 trees ispowerful,butposesaproblem.Wecannotseewhat thismethod isdoing.Unlikeamodelbasedona single tree,where we can see how variables split, this method gives usimportances but otherwise remains opaque. We cannot glanceacrossallthemanyanalysesandintuitwhathashappened.In the example, we therefore used variables that were among
thosewiththehighestimportance(acrossthemanydifferenttrees)ascandidatevariables,andbuiltonefinalclassificationtreemodel.Thisonemodel,basedon‘assuredwinners’,wasthenusedtoguidedecisionmaking.
Acasestudy:let’stakeacruiseImperial Admiral Cruise Lines found itself sitting atop a largedatabase of people who might take one of their fanciest cruises.(This is a fictionalized name – please do not look for them in thehopeofbookinga trip.)The familyrunning thisaugustenterprisehad recently married into the one that ran the mighty GermanKöniglich Luxus Boot-Unternehmen (KLBU) fleet. And together,theyhadjustboughtthebankruptPlatinumNigerianPrinceLine.Having records of who had travelled on all these lines, they
wantedtoputthisdatatogooduse.Theywereinterestedinsellingtheirmost luxurious cruise, theAdmiral Deluxe Imperial RoyalDiamondSpecialPlusCruise(orastheyaffectionatelycalledit,theBig-TipsCruise), andwanted to find those in theirdatabasesmostlikelytoindulgeinthisextravagance.
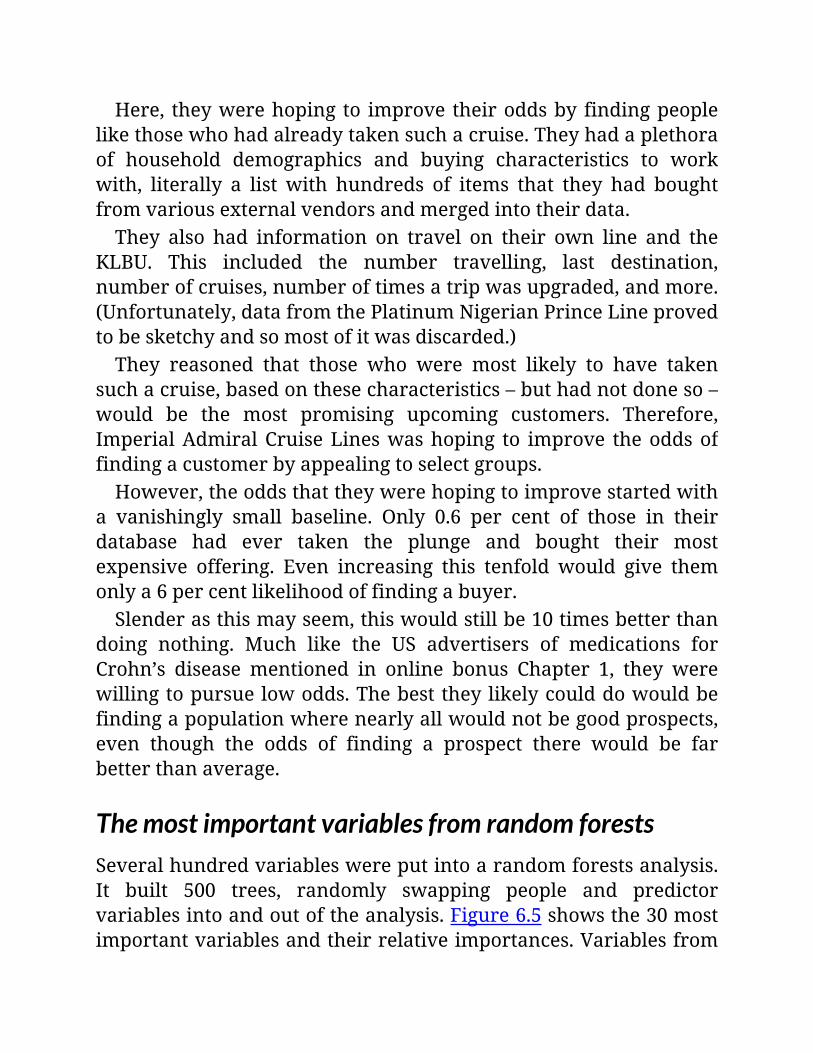
Here, theywerehoping to improve theiroddsby findingpeoplelikethosewhohadalreadytakensuchacruise.Theyhadaplethoraof household demographics and buying characteristics to workwith, literally a list with hundreds of items that they had boughtfromvariousexternalvendorsandmergedintotheirdata.They also had information on travel on their own line and the
KLBU. This included the number travelling, last destination,numberofcruises,numberoftimesatripwasupgraded,andmore.(Unfortunately,datafromthePlatinumNigerianPrinceLineprovedtobesketchyandsomostofitwasdiscarded.)They reasoned that those who were most likely to have taken
suchacruise,basedonthesecharacteristics–buthadnotdoneso–would be the most promising upcoming customers. Therefore,ImperialAdmiralCruiseLineswashoping to improve theoddsoffindingacustomerbyappealingtoselectgroups.However,theoddsthattheywerehopingtoimprovestartedwith
a vanishingly small baseline. Only 0.6 per cent of those in theirdatabase had ever taken the plunge and bought their mostexpensive offering. Even increasing this tenfold would give themonlya6percentlikelihoodoffindingabuyer.Slenderasthismayseem,thiswouldstillbe10timesbetterthan
doing nothing. Much like the US advertisers of medications forCrohn’s disease mentioned in online bonus Chapter 1, they werewillingtopursuelowodds.Thebesttheylikelycoulddowouldbefindingapopulationwherenearlyallwouldnotbegoodprospects,even though the odds of finding a prospect there would be farbetterthanaverage.
ThemostimportantvariablesfromrandomforestsSeveralhundredvariableswereputintoarandomforestsanalysis.It built 500 trees, randomly swapping people and predictorvariablesintoandoutoftheanalysis.Figure6.5showsthe30mostimportantvariablesandtheirrelativeimportances.Variablesfrom

thislistwereusedinconstructingaclassificationtree.Notethatthisstudytookplaceanumberofyearsago,andatthattime,buyingbymailorderwasamorerobustbusiness.Variablesrelatingtobuyingbymailorderappearonthelist.
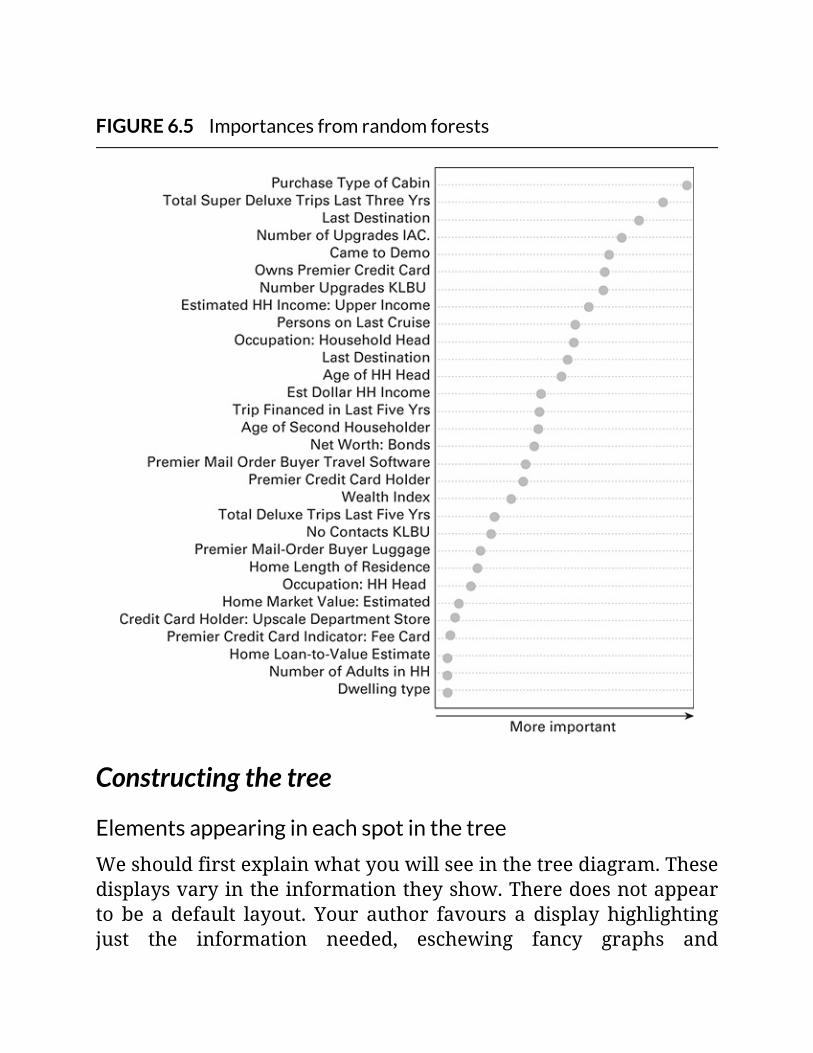
FIGURE6.5Importancesfromrandomforests
Constructingthetree
Elementsappearingineachspotinthetree
Weshouldfirstexplainwhatyouwillseeinthetreediagram.Thesedisplaysvaryintheinformationtheyshow.Theredoesnotappearto be a default layout. Your author favours a display highlightingjust the information needed, eschewing fancy graphs and
flourishes.Asyouwillseewhenwerevealtheentiretree(inFigure6.11),evenanunadornedtreecanbevisuallyimposing.Figure 6.6 explainswhat youwill see at eachpoint, ornode, in
thetree.Thelarge,bold-facednumberisthepercentageofpeopleinthatgroupwhohaveevertakenanAdmiralDeluxeImperialRoyalDiamondSpecial Plus (fondly recalledas theBig-Tips) cruise. Thispercentageisthetargetordependentvariableintheanalysis.Inthefigure, some2.3 per cent of those in the group shownhave takenthistypeoftrip.
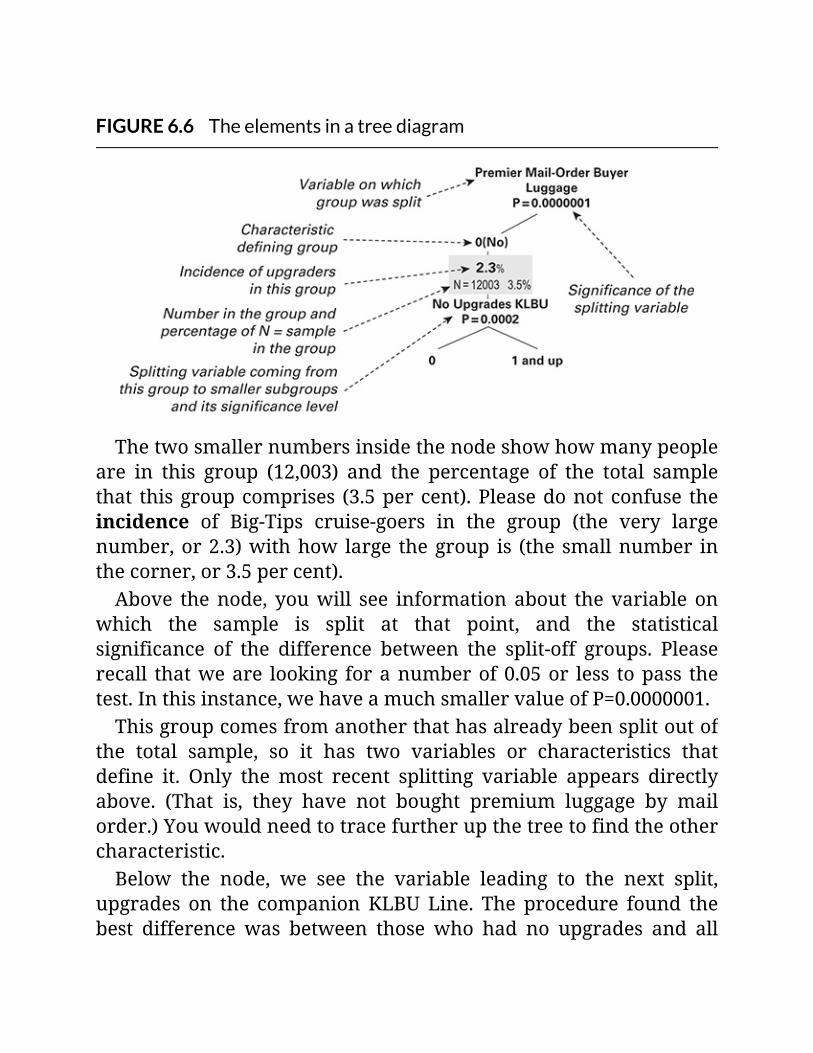
FIGURE6.6Theelementsinatreediagram
Thetwosmallernumbersinsidethenodeshowhowmanypeopleare in this group (12,003) and the percentage of the total samplethat thisgroupcomprises (3.5percent).Pleasedonotconfuse theincidence of Big-Tips cruise-goers in the group (the very largenumber,or2.3)withhow large thegroup is (thesmallnumber inthecorner,or3.5percent).Above thenode, youwill see informationabout thevariable on
which the sample is split at that point, and the statisticalsignificance of the difference between the split-off groups. Pleaserecall thatweare looking foranumberof0.05or less topass thetest.Inthisinstance,wehaveamuchsmallervalueofP=0.0000001.Thisgroupcomesfromanotherthathasalreadybeensplitoutof
the total sample, so it has two variables or characteristics thatdefine it. Only themost recent splitting variable appears directlyabove. (That is, they have not bought premium luggage by mailorder.)Youwouldneedtotracefurtherupthetreetofindtheothercharacteristic.Below the node, we see the variable leading to the next split,
upgrades on the companionKLBU Line. The procedure found thebest difference was between those who had no upgrades and all
otherswhohadeverupgraded.
Tothewholetree:ourfirstsplitofthesample
The first split is based onhowmany times customersupgraded atripwith ImperialAdmiralCruiseLines. Somedebatearoseaboutusing this as a predictor, because the Admiral Deluxe ImperialRoyal Diamond Special Plus (aka Big-Tips) trip itself could havebeen chosen due to upgrading. The data was probed somewhatmore,anditwasdiscoveredthatnearlyalloftheupgradeswenttoexpensive,butstilllesser,cruises–suchasthepopularRegalSuperExtraGoldDeluxepackage.Figure6.7showsushowthisfirstsplitlooked.Notethatthisisa
four-waydivisionofthetotalsample.Thelargestgrouphasdonenoupgrades.This isnearlythree-quartersof thedatabase.Onlysome0.3percentofthisgrouphavetakenIAG’smostextravagantcruise.
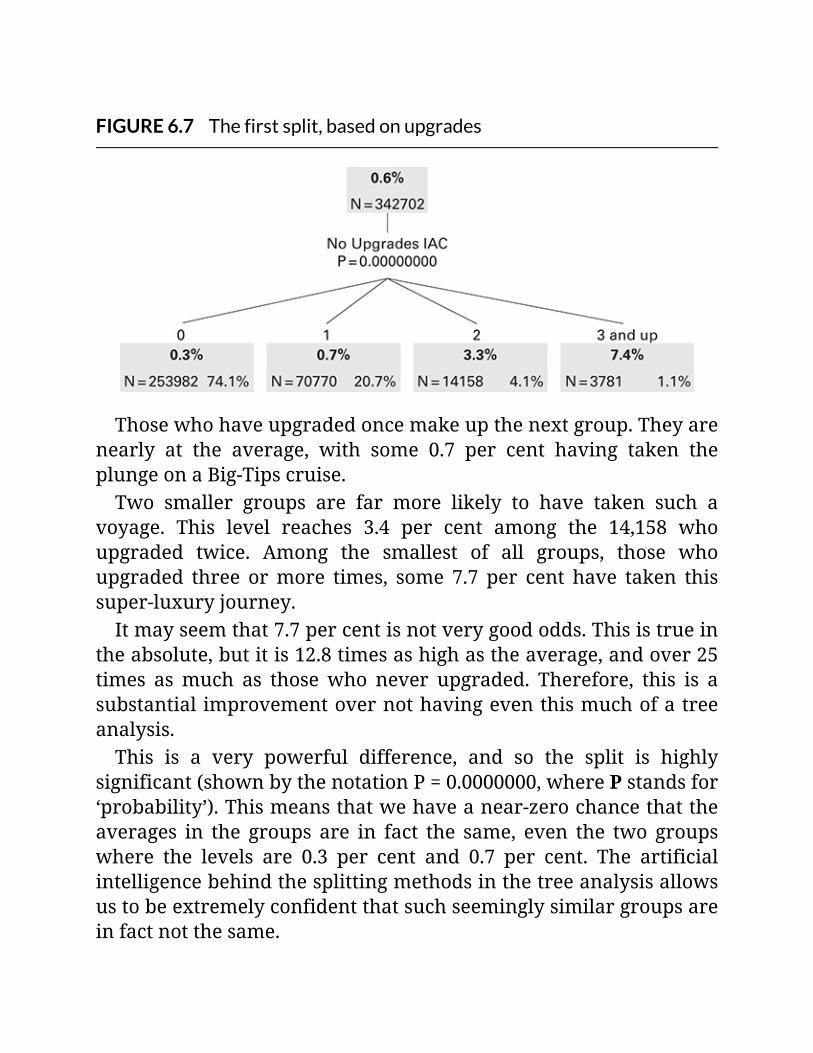
FIGURE6.7Thefirstsplit,basedonupgrades
Thosewhohaveupgradedoncemakeupthenextgroup.Theyarenearly at the average, with some 0.7 per cent having taken theplungeonaBig-Tipscruise.Two smaller groups are far more likely to have taken such a
voyage. This level reaches 3.4 per cent among the 14,158 whoupgraded twice. Among the smallest of all groups, those whoupgraded three ormore times, some 7.7 per cent have taken thissuper-luxuryjourney.Itmayseemthat7.7percentisnotverygoododds.Thisistruein
theabsolute,butitis12.8timesashighastheaverage,andover25times asmuch as thosewho never upgraded. Therefore, this is asubstantialimprovementovernothavingeventhismuchofatreeanalysis.This is a very powerful difference, and so the split is highly
significant(shownbythenotationP=0.0000000,wherePstandsfor‘probability’).Thismeansthatwehaveanear-zerochancethattheaverages in the groups are in fact the same, even the two groupswhere the levels are 0.3 per cent and 0.7 per cent. The artificialintelligencebehindthesplittingmethodsinthetreeanalysisallowsustobeextremelyconfidentthatsuchseeminglysimilargroupsareinfactnotthesame.
Onwardtoourfirstsectionofthetree

Onwardtoourfirstsectionofthetree
We will return to those who had no upgrades. They are notpromising prospects, but perhaps some other characteristic of asubsetofthisgroupwillrevealamorelikelysubgroupamongthem.Thetreewillreachasetoffinal,orterminal,nodes.Thesenodes
willgetnumberedsothatwecanrefertothemmoreeasily.As we see in Figure 6.8, the first split is based on the last
destination. This seems to make sense because IAG cruises tocertainregionscostmorethantoothers.Thissplitdividesthegroupwith no upgrades into two nearly equal parts. However, one ofthosegroups is four timesas likelyas theother tohave taken theexpensivetrip.ThisgroupconsistsofthosewholastdisembarkedinScotlandandPortugal, and the141hearty soulswho took theoneandonlyadventuretouraroundSiberia.
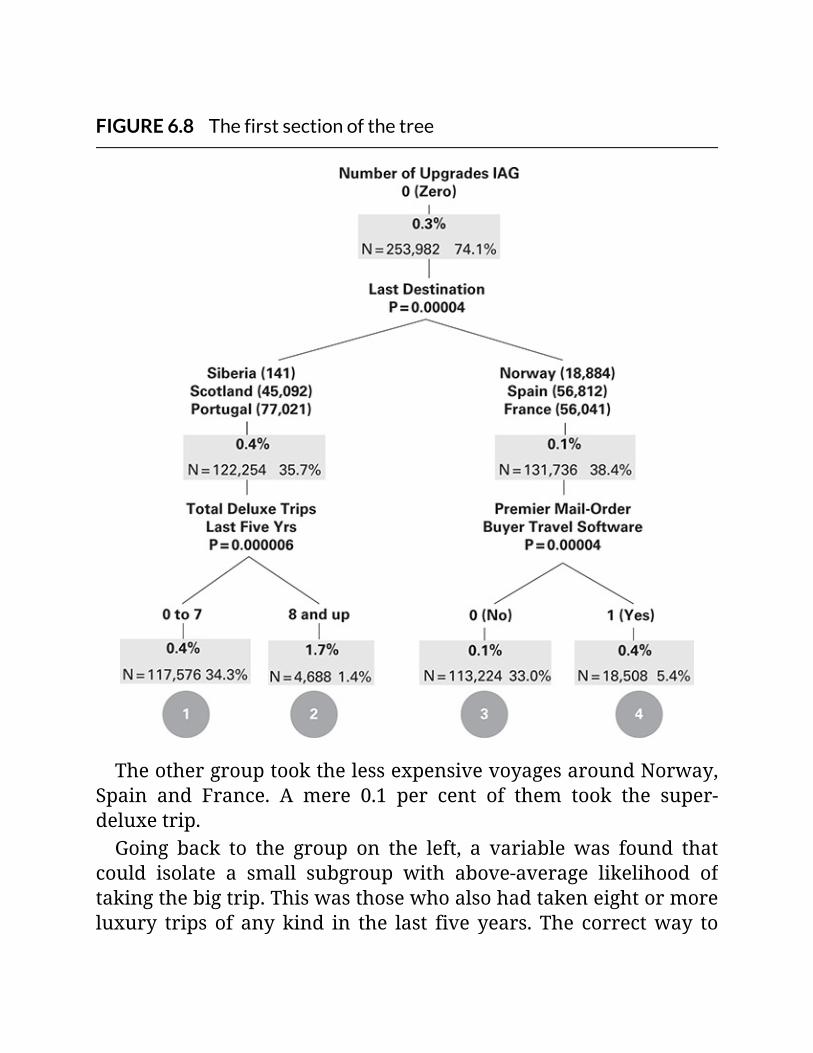
FIGURE6.8Thefirstsectionofthetree
TheothergrouptookthelessexpensivevoyagesaroundNorway,Spain and France. A mere 0.1 per cent of them took the super-deluxetrip.Going back to the group on the left, a variable was found that
could isolate a small subgroup with above-average likelihood oftakingthebigtrip.Thiswasthosewhoalsohadtakeneightormoreluxury trips of any kind in the last five years. The correctway to
define this terminal group, marked with a large ‘2’, would be asfollows: Upgrades on IAG = 0 AND last destination = Scotland,Portugal or Siberia AND took eight ormore luxury cruises in thelastfiveyearsYoumusthaveallthreeofthesetogethertodefinethisgroup.Nooneortwoofthemaloneorincombinationleadstoasubgroupwith this high an incidence of peoplewho took the bigtrip.Terminal group 1,whichmakes upmost of the group above it,
took seven or fewer luxury trips. They remain at 0.4 per centincidence.Rounding out this branch of the tree, the next split within the
group who went to Norway, France or Spain does not lead to asubgroupwith above-average incidence peoplewho took the Big-Tips cruise. Terminal group 3 has a 0.1 per cent likelihood andterminal group 4 remains at 0.4 per cent. The most sharplydifferentiatingcharacteristicfoundherewaswhetherapersonwasamail-orderbuyeroftravelsoftware.
Movingtotheupgraders
Those who upgraded once make up about 21 per cent of thedatabase.Butwithnearly71,000inthisgroup,therewasroomforthetreetobranchseveraltimes.Thisisthemostcomplexportionofthediagram,withseventerminalgroupsornodes,asyoucanseeinFigure6.9.
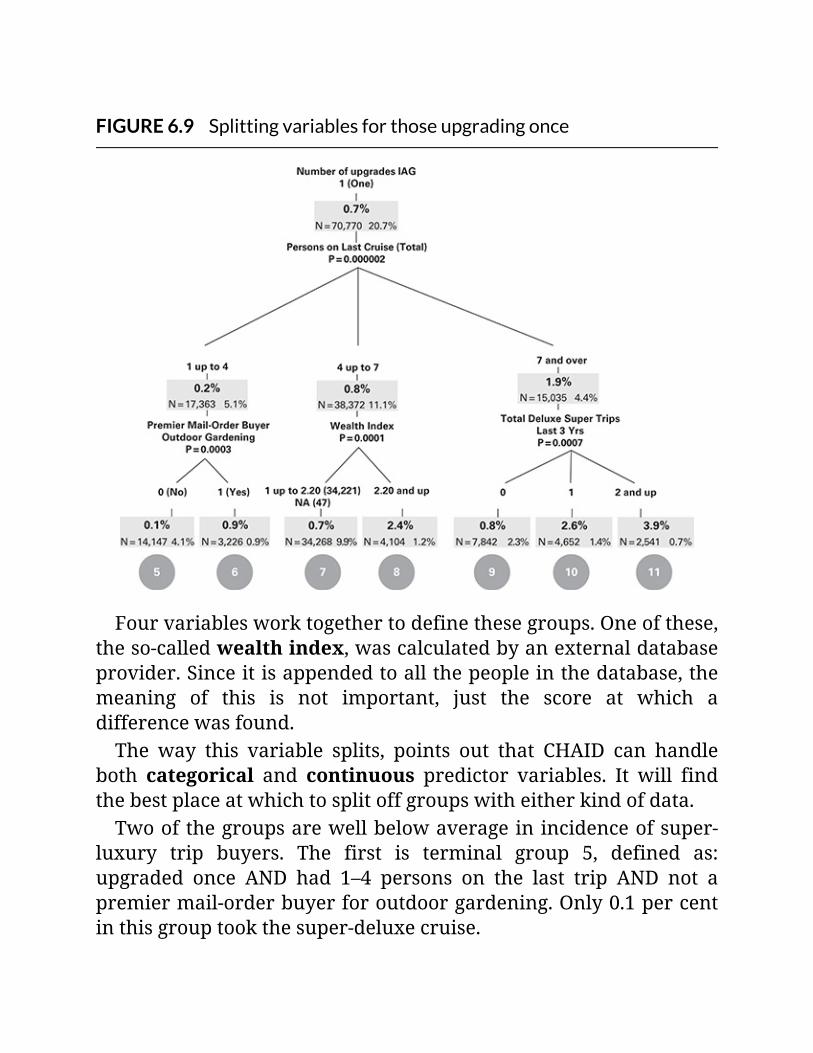
FIGURE6.9Splittingvariablesforthoseupgradingonce
Fourvariablesworktogethertodefinethesegroups.Oneofthese,theso-calledwealthindex,wascalculatedbyanexternaldatabaseprovider.Sinceitisappendedtoallthepeopleinthedatabase,themeaning of this is not important, just the score at which adifferencewasfound.The way this variable splits, points out that CHAID can handle
both categorical and continuous predictor variables. It will findthebestplaceatwhichtosplitoffgroupswitheitherkindofdata.Twoofthegroupsarewellbelowaverageinincidenceofsuper-
luxury trip buyers. The first is terminal group 5, defined as:upgraded once AND had 1–4 persons on the last trip AND not apremiermail-orderbuyerforoutdoorgardening.Only0.1percentinthisgrouptookthesuper-deluxecruise.
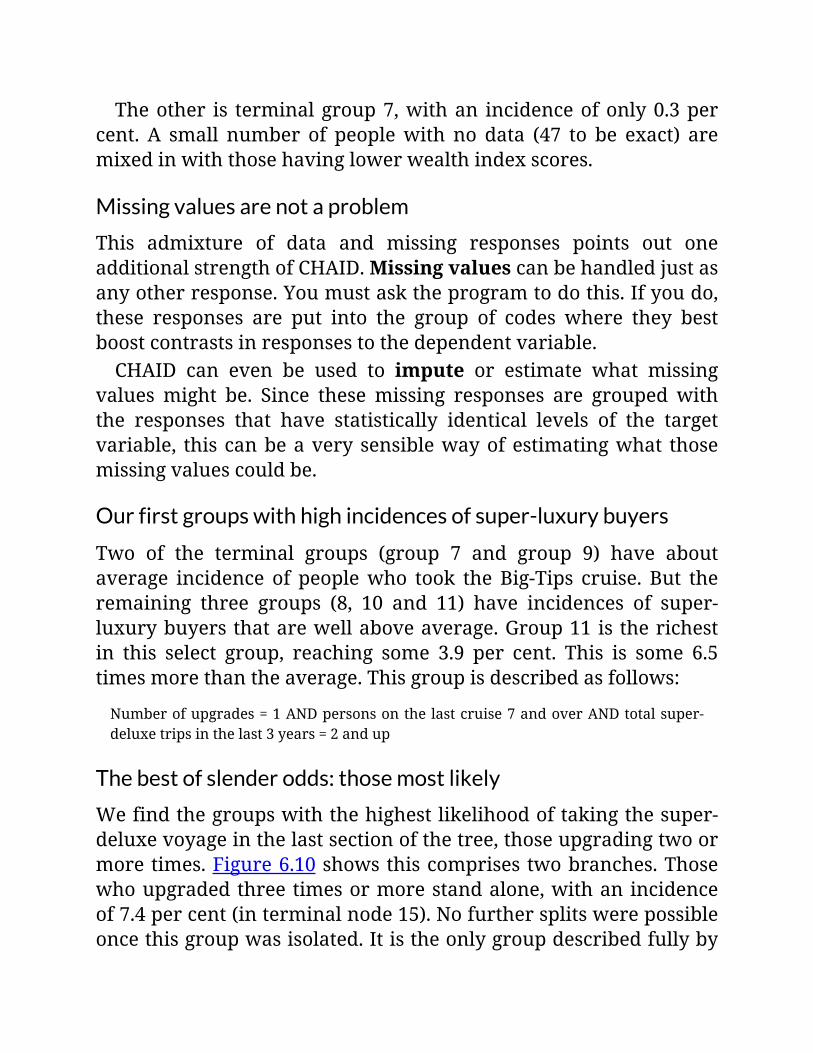
Theother is terminalgroup7,withan incidenceofonly0.3percent. A small number of peoplewith no data (47 to be exact) aremixedinwiththosehavinglowerwealthindexscores.
Missingvaluesarenotaproblem
This admixture of data and missing responses points out oneadditionalstrengthofCHAID.Missingvaluescanbehandledjustasanyotherresponse.Youmustasktheprogramtodothis.Ifyoudo,these responses are put into the group of codes where they bestboostcontrastsinresponsestothedependentvariable.CHAID can even be used to impute or estimate what missing
valuesmight be. Since thesemissing responses are grouped withthe responses that have statistically identical levels of the targetvariable, thiscanbeaverysensiblewayofestimatingwhat thosemissingvaluescouldbe.
Ourfirstgroupswithhighincidencesofsuper-luxurybuyers
Two of the terminal groups (group 7 and group 9) have aboutaverage incidence of peoplewho took the Big-Tips cruise. But theremaining three groups (8, 10 and 11) have incidences of super-luxurybuyersthatarewellaboveaverage.Group11istherichestin this select group, reaching some 3.9 per cent. This is some 6.5timesmorethantheaverage.Thisgroupisdescribedasfollows:
Numberofupgrades=1ANDpersonsonthelastcruise7andoverANDtotalsuper-deluxetripsinthelast3years=2andup
Thebestofslenderodds:thosemostlikely
Wefindthegroupswiththehighestlikelihoodoftakingthesuper-deluxevoyageinthelastsectionofthetree,thoseupgradingtwoormoretimes.Figure6.10showsthiscomprisestwobranches.Thosewhoupgradedthreetimesormorestandalone,withanincidenceof7.4percent(interminalnode15).Nofurthersplitswerepossibleoncethisgroupwasisolated.Itistheonlygroupdescribedfullyby

asinglecharacteristic.
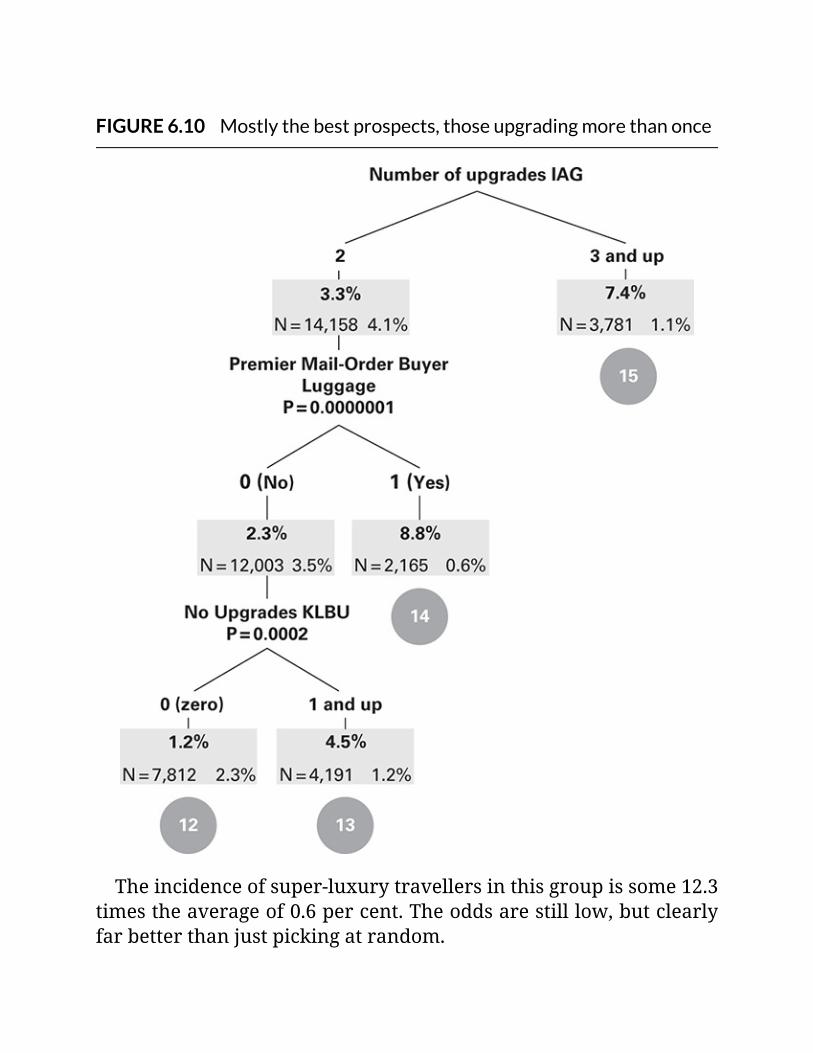
FIGURE6.10Mostlythebestprospects,thoseupgradingmorethanonce
Theincidenceofsuper-luxurytravellersinthisgroupissome12.3timestheaverageof0.6percent.Theoddsarestilllow,butclearlyfarbetterthanjustpickingatrandom.

Thegroupwiththehighestincidenceofallfallsunderthosewhoupgraded twice.Thisgroup (number14) isdefinedbyone furthercharacteristic,namelythattheyweremail-orderbuyersofpremierluggage.Inthisgroup,some8.8percenttookthereallybigcruise.Thiscomestosome14.8timestheoverallaverage,atrulysizeableincrease.
Theentiretreediagram
Figure 6.11 puts all the pieces together. This is not a particularlylargetree,butevenatthissizethedisplayisvisuallyimposing.Thetreehasagreatdealofvaluableinformation,butlookingatitinthisform,itiseasytomissmuchofwhatisshown.
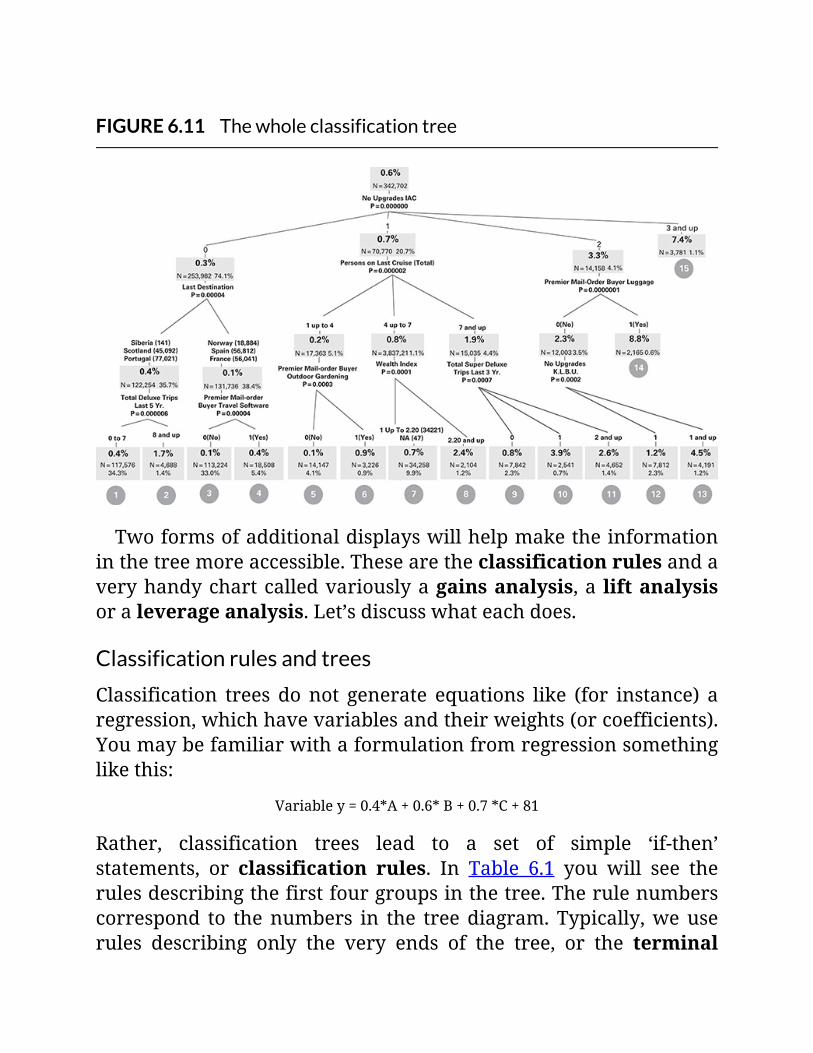
FIGURE6.11Thewholeclassificationtree
Twoformsofadditionaldisplayswillhelpmaketheinformationinthetreemoreaccessible.Thesearetheclassificationrulesandaveryhandychartcalledvariouslyagainsanalysis,a liftanalysisoraleverageanalysis.Let’sdiscusswhateachdoes.
Classificationrulesandtrees
Classification trees do not generate equations like (for instance) aregression,whichhavevariablesandtheirweights(orcoefficients).Youmaybefamiliarwithaformulationfromregressionsomethinglikethis:
Variabley=0.4*A+0.6*B+0.7*C+81
Rather, classification trees lead to a set of simple ‘if-then’statements, or classification rules. In Table 6.1 you will see therulesdescribingthefirstfourgroupsinthetree.Therulenumberscorrespond to thenumbers in the treediagram.Typically,weuserules describing only the very ends of the tree, or the terminal

nodes. Groups or nodes inside the tree lead to only a partialdescriptionofanygroupformed.

TABLE6.1Thefirstfourclassificationrules
RULE1IF
TotalDeluxeTripsLast5Yrs=0to7ANDLastCruiseDestination=Siberia,ScotlandorPortugalANDNo.UpgradesIAC=0
THENTooktheBig-TipsCruise=0.4%
RULE2IF
TotalDeluxeTripsLast5Yrs=8andupANDLastCruiseDestination=Siberia,ScotlandorPortugalANDNo.UpgradesIAC=0
THENTooktheBig-TipsCruise=1.7%
RULE3IF
PremierMail-OrderBuyerTravelSoftware=0(No)ANDLastCruiseDestination=Norway,SpainorFranceANDNo.UpgradesIAC=0
THENTooktheBig-TipsCruise=0.1%
RULE4IF
PremierMail-OrderBuyerTravelSoftware=1(Yes)ANDLastCruiseDestination=Norway,SpainorFranceANDNo.UpgradesIAC=0
THENTooktheBig-TipsCruise=0.4%
NOTEthenumberingoftherulesfollowsthenumberingoftheendingnodesonthetreediagram
Rulesliketheseareallweneedtodescribetheoutput,orcreatea

model.Thismodeliswhatwewouldusetoscoreanotherdataset.Inthisexample,everyoneinthedatasetgotaprobabilityoftakingthe big cruise based on themodel. Then thosemost likely to buyinto this could be approached with appeals to consider thisenriching(andpossiblybankrupting)experience.
Classificationrules
Aclassificationtreeleadstoasetofsimpleif-thenstatementsdescribingthecombinationsofpredictorvariablesthatleadtodifferentvaluesofthetargetvariable.Theytypicallydescribejusttheendingboxesornodesinthetree.Theserulescanbeusedtoassignvaluestoanotherdataset.
These rules are extremely simple and so very easy to programintoadatabase.Thisgreatsimplicityofthemodel,withitsabsenceofequationsorothercalculations, isahighlyappealing featureofclassificationtrees.This treerequires15rules,one foreach terminalnode.Wealso
usedonly10predictorvariables.This treehasdonea tremendousamounttoclarifythedatawithahighlycompactmodel.Recallthatthis database ran into the hundreds of thousands. Everyone wasclassifiedintoagroup,andonlyonegroup.Moreformally,themodelismutuallyexclusiveandcompletely
exhaustive. This kind of jargon can become catching in certainenvironments. At one client company, people were sitting in ameetingand talkingabout amodelbeing something that soundedlike‘me-see’.Atfirsttheirsanityseemedindoubt.Itthenemergedtheywereindeedtalkingabouttheinitialsformutuallyexclusiveand completely exhaustive, or MECE. However, we are still notsureabouttheirsanity.Inanyevent,thisability(tocaptureandcharacterizeeveryonein
a group with so few variables) is a tremendous strength ofclassificationtreemethods.Withsomeaudiencesitmayposesomedifficulties.Theymaynotbelievethatyoucanrevealsomuchaboutadatasetwithsofewpredictors,andmayevenquestionwhytheirfavouriteitemwasnotincluded.
Theultimateindetail:thegainsanalysisWecan learnstillmoreabout the finerpointsof theclassification

tree from a gains analysis. This may also be called a lift orleverage analysis. It lists the terminal nodes of the tree in order,from highest incidence to lowest. It also provides other detailsaboutthem.Table6.2showsaportionofagainsanalysis.Thefullanalysisforthistreewouldhave15sections(oneforeachterminalnode).Wewillshowanddiscussthefirstfive.
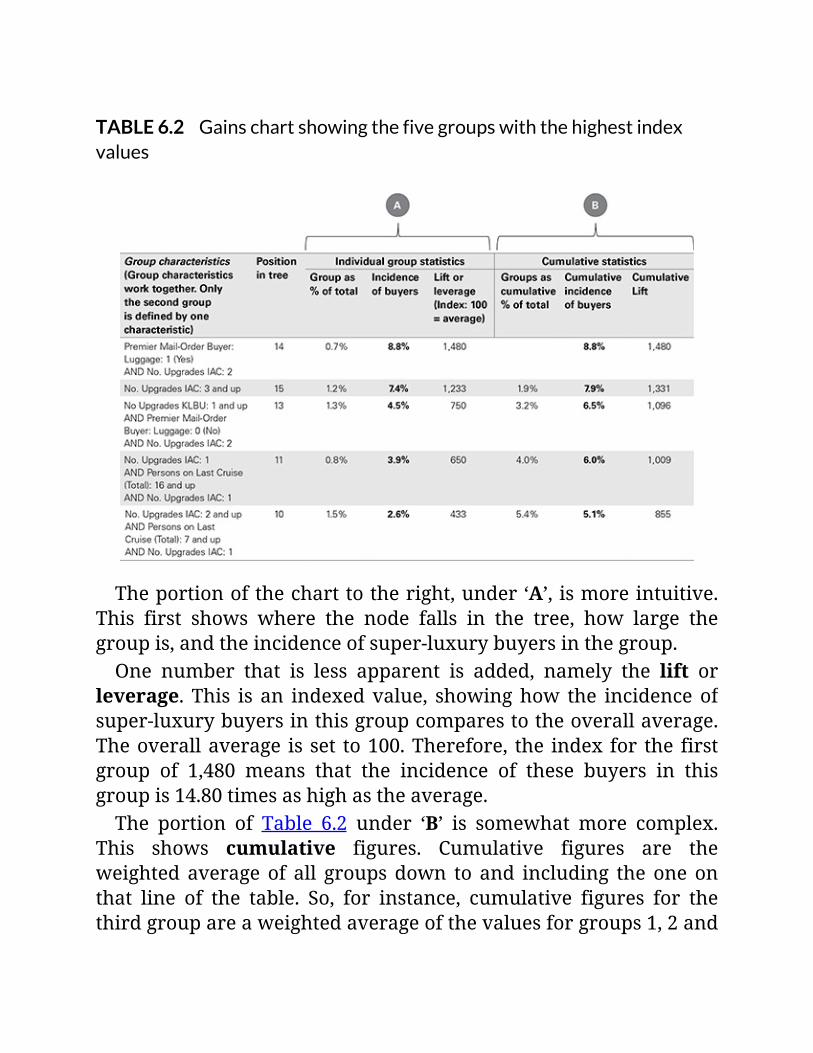
TABLE6.2Gainschartshowingthefivegroupswiththehighestindexvalues
Theportionofthecharttotheright,under‘A’, ismoreintuitive.This first shows where the node falls in the tree, how large thegroupis,andtheincidenceofsuper-luxurybuyersinthegroup.One number that is less apparent is added, namely the lift or
leverage. This is an indexedvalue, showinghow the incidenceofsuper-luxurybuyersinthisgroupcomparestotheoverallaverage.Theoverallaverage isset to100.Therefore, the index for the firstgroup of 1,480 means that the incidence of these buyers in thisgroupis14.80timesashighastheaverage.The portion of Table 6.2 under ‘B’ is somewhat more complex.
This shows cumulative figures. Cumulative figures are theweightedaverageof all groupsdown to and including the oneonthat line of the table. So, for instance, cumulative figures for thethirdgroupareaweightedaverageofthevaluesforgroups1,2and
3. (The third group is defined as: No. upgrades KLBU = 1 and upAND premier mail-order buyer of luggage = 0 (No) AND no.upgrades IAC = 2.) Cumulative figures are valuable because theyhelpdecideonacut-offpoint for targeting.Whenyouuseagainscharttotarget,youwouldtaganumberofgroupsinthedatabase.The simplicity of the if-then rules coming from the classificationtreemakesiteasytospecifythatanyofadozenormoreconditionsbemet. Someclassification treeprogramsevengenerate the rulesindatabase(SQL)languageautomatically.Still more statistics could appear in the diagram, such as the
percentageofallluxurybuyersineachgroupsandactualcountsofpeople.However, asmanydetails aswehave shown in this chartoftenseemsperplexing,especiallytoharassedmanagementpeople.Sometimes,then,asimplerdisplaycanhelpgetthemessageacrossmore easily. One such chart, which we could subtitle ‘Gains formanagement’,appearsinFigure6.12.
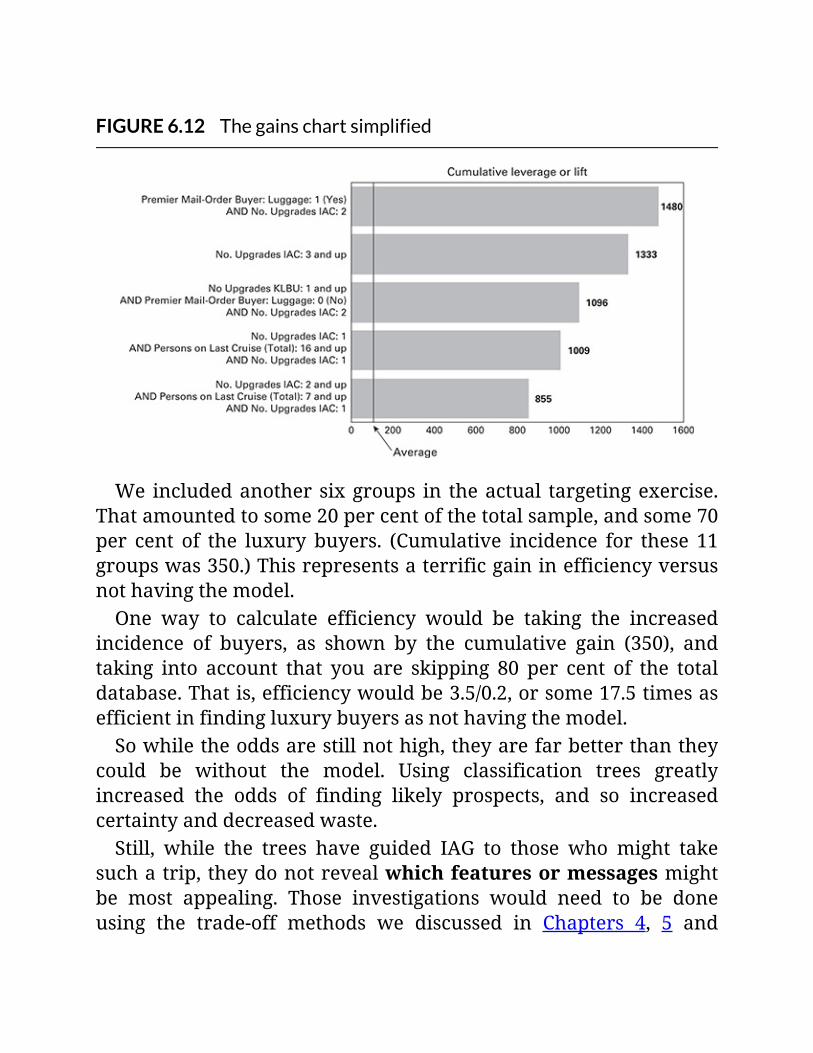
FIGURE6.12Thegainschartsimplified
Weincludedanother sixgroups in theactual targetingexercise.Thatamountedtosome20percentofthetotalsample,andsome70per cent of the luxury buyers. (Cumulative incidence for these 11groupswas350.)Thisrepresentsaterrificgaininefficiencyversusnothavingthemodel.One way to calculate efficiency would be taking the increased
incidence of buyers, as shown by the cumulative gain (350), andtaking into account that you are skipping 80 per cent of the totaldatabase.Thatis,efficiencywouldbe3.5/0.2,orsome17.5timesasefficientinfindingluxurybuyersasnothavingthemodel.Sowhiletheoddsarestillnothigh,theyarefarbetterthanthey
could be without the model. Using classification trees greatlyincreased the odds of finding likely prospects, and so increasedcertaintyanddecreasedwaste.Still, while the trees have guided IAG to those who might take
suchatrip,theydonotrevealwhichfeaturesormessagesmightbe most appealing. Those investigations would need to be doneusing the trade-off methods we discussed in Chapters 4, 5 and
onlinebonusChapter1.
Growingtrees:automatedorguided?Intheexample,wecouldhavemadethetreelarger,orhavegrownitfurther.Weelectedtostopat15terminalgroupsbecauseaddingmoresplitsprovidednoadditional informationuseful indirectingtactics.Thatis,weguidedthegrowthofthetree.Youeithercan let classification trees runautomaticallyor (with
some programs) guide what the procedure does. Some programsrunonlyautomatically,which inyourauthor’sopinion isastrongdisadvantage if you want to do anything more than optimalrecodingofvariables.The ‘greediness’oftreemethodsthatwediscussedearlierisone
mainreasonthatautomationcanbeaseriousproblem.Thatis,treeprograms will automatically choose the one variable that looks‘best’ateachspotinthetree,evenifthatvariablewouldnotleadtothebestoverallresultwhenaddingothervariableslater.Infact,weencounterthisissuewithnearlyallmethodsthattryto
build models by adding variables. It is worse with trees becausechoosing thewrongvariable can lead tono further growth in thetree.Thiscanbecomeaseriousproblembecausetreestypicallydonotcontainmanyvariables.Sometimesthe‘best’variableoreventhenext‘best’willcausethe
tree to stop growing because no further statistically significantvariables canbe foundbelow it.However, someother statisticallysignificant variable could lead to further growth, and to furthervaluableinformationaboutwhatinfluencesanoveralloutcome.
RecommendationsontreegrowingTypically results are excellent if you let the program pickautomaticallyfirstandthengobackandcheckanyspotsthatseemproblematic – for instance, a place where a large group was left
undivided.Themost complete classification treeprograms let youlookatalistofpossiblevariablesthatcouldsplitthesampleateachpoint in thetree (allof thesevariablespassingyourchosentestofstatistical significance). You then can explore how the tree growswhenyouswaptheprogram’sfirstchoiceforanothervariable.No matter which program you use, you will need to set the
acceptablesignificancelevel,andthesmallestgroupyouwillallowwhentheprogramdoessplitting.Ifyoudonotsetaminimum,theprogrammay even split off a single person into his or her owngroup. And of course, theminimum size you selectwill influencehowthetreegrows.Allthesefactorsleadtotheconclusionthatwemayneverreacha
demonstrably optimal tree. Small fluctuations in the data – forinstance,droppingonepersonwithquestionableresponses–mightlead to very different-looking trees being selected as the bestpossiblebyacomputerprogram.Still,whilethisisacaution,itshouldnotbeadeterrenttousing
this remarkable method. The goal should always be to create amodel that has the most useful information and that still hasstrongpredictivepower.Squeezingthelastpossibledropoutofascore showing thegoodnessofprediction shouldnotbeyouraim.Scores are valuable things, but real-world applicability is moreimportant. Sacrificing a point or two of a score for amoreusefulmodelmakesagreatdealofsense.
CHAIDandCART(andCRT,C&RT,QUEST,J48andothers)Beforeweget toournextnewmethod,weneed to clearup someterminologyabouttrees.Asyouhavenoticed,wehavebeentalkinghere about a specific type of classification tree analysis, calledCHAID.AID, a notoriously inaccurate method, came first. Over the last
few decades, a healthy host of related methods have beendeveloped. CHAID was the first method to solve the problem ofcomparing significance when using variables that have differentnumbers of categories – as it turns out, a fiendishly difficultproblem.OvertheyearsmanyalternativestoCHAIDhavebeenproposed.
Againventuringoutontoametaphoricallimb,wewillsaythattheyalldobasicallythesamethings,butwithdifferentrestrictionsandrules.Atonetime, therewerefiercepartisansofvariousmethods.Now that classification trees are no longer the latest word inpredictivemodels,therancorouslanguageseemstohavesubsided.Perhapsthedisputesalsohavequietedbecausetherenowareso
many variations of classification tree methods, well over 40. ThemostwidelyusedalongwithCHAIDiscalledCART(alsocalledCRTand C&RT because strangely the word CART was allowed atrademark).CART and its relatives, such asQUEST, do only two-way splits
whileCHAIDcansplitmorefinely.SomeusersstillpreferCART,butforthepurposeofperformingoptimalrecoding,CHAIDappearstobemoreefficient.All thegroupsyouneedcanbe formedatonce,ratherthaninaseriesoftwo-waysplits.Youmay also encounter such programs asAC2, J48,C4.5 (free)
andC5(notfree).Wehavediscussedoneoutgrowthofclassificationtrees,randomforests.Nextwediscussanother,boosteddecisionstumps.
DecisionstumpsrescueatheoreticalmodelA decision stump, aside from being another unlovely term, issimplyaone-leveltree.Thesecanbeusedforoptimalrecoding,asintheexampleshowninFigure6.13,whereadecisionstumplinksalargeregression-basedmodeltomarketshare.
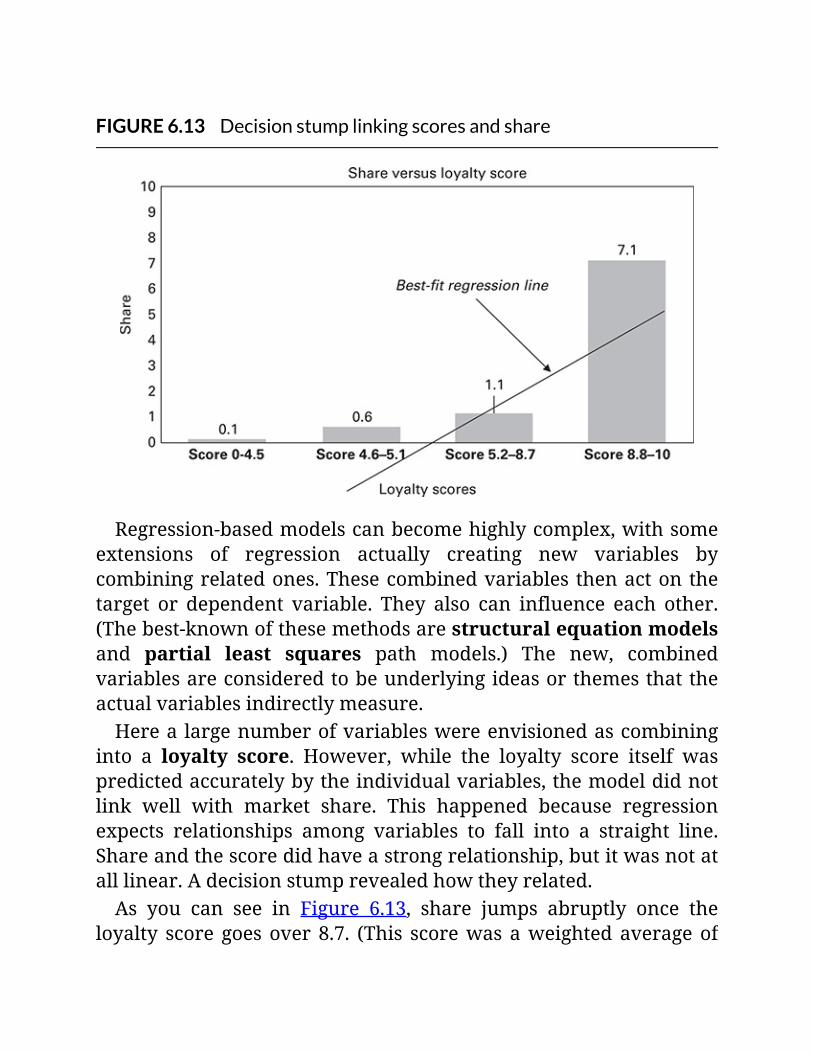
FIGURE6.13Decisionstumplinkingscoresandshare
Regression-basedmodelscanbecomehighlycomplex,withsomeextensions of regression actually creating new variables bycombiningrelatedones.Thesecombinedvariables thenactonthetarget or dependent variable. They also can influence each other.(Thebest-knownofthesemethodsarestructuralequationmodelsand partial least squares path models.) The new, combinedvariablesareconsideredtobeunderlyingideasorthemesthattheactualvariablesindirectlymeasure.Herea largenumberofvariableswereenvisionedascombining
into a loyalty score. However, while the loyalty score itself waspredictedaccuratelybytheindividualvariables,themodeldidnotlink well with market share. This happened because regressionexpects relationships among variables to fall into a straight line.Shareandthescoredidhaveastrongrelationship,butitwasnotatalllinear.Adecisionstumprevealedhowtheyrelated.As you can see in Figure 6.13, share jumps abruptly once the
loyalty score goesover 8.7. (This scorewasaweightedaverageof
manyothervariables,andsocouldbeanyvaluebetween0and10.)The classification tree program found the best places to split thescorevariable,usingoptimalrecoding.Thebest-fit regression linemisses this relationship. It even falls
belowapredictedvalueofzero forsharewhenthescore isabout5.2.
BoosteddecisionstumpsThis application gives us another, distinctive way to determinevariables’ importances. It uses a process of building single-leveltrees repeatedly. Itsapproachdiffers from thatof randomforests,which reruns larger trees while randomly swapping predictorvariablesandcases(people)inandoutofeachmodel.Rather, boosting decision stumps runs a first model, a single-
level tree,andthen learns fromthatmodel.Theproceduremarkswhichcasesarepredictedcorrectlyandwhicharenot.Thecorrectcasesaremarkedastheeasyonesandtheincorrectcasesashard.The procedure then puts more weight or emphasis on the hardcases,andtriestofitamodelthatcapturesthembetter.It will redo this as many times as you request. Each time, it
focusesmostonthehardcases,tryingtopredictthosepeoplewhowereincorrectlyclassifiedthelasttime.Boostingisanothertypeofensemblemodel.Figure 6.14 shows an output from a run of boosted decision
stumps. These importances followed a classification tree modelshowing the linkages between the nature of psoriasis anddepression. The model used measurements of the extent andlocation of the affected skin areas for about 6,900 patients. Thesepatients also took an internationally normed test designed tomeasureseriousdepression.

FIGURE6.14Outputfromboosting
NOTEThesescoresarescaledtosumto100
Thetreemodelledtoasimplesetofif-thenrules,witheachrulecorrespondingtoadifferentprobabilityofseveredepression.Itwaseasytouse,sinceitwasbasedonmeasurementsthatdoctorswouldtake in any event as a part of treatment. It could even be scoredusingapencilandpaper.Aquestionaroseabouthowimportantthevariablesinthemodel
were,andforthisboostingwasused.ThespecificmethodiscalledAdaBoost.M1,whichspecifically ismade tousewithclassificationtrees.We asked the method to run boosting 40 times, and the
importancesthatappearinFigure6.14emergedfromtheanalysis.Asyoucanseeinthefigure,twovaluesofthesamepredictorwerethe most important. This one predictor is percentage of bodysurfaceareawithpsoriasis(PSOBSA).Onecriticalthresholdisover10percentofbodysurfaceareaandtheotherisover20percent.Few othermethodsmatch this ability to isolate two values of the
samevariableasimportant.Thismodelprovedtobevaluablebecausepsoriasispatientsoften
conceal how depressed they feel, even from their doctors. Theclassification treemodel gave doctors a simple way to determinewhichpatientsmightbemostatrisk.Theboostinggavethemafewfeaturestowatchwithparticularextraattention.
Summary:applicationsandcautionsClassification trees remainpre-eminent for teasingout and seeinginteractions – theways inwhich variables’ influence on a targetvariable is stronger or weaker than expectedwhen theywork incombination. When two variables work together to produce aneffectthatisstrongerthanwewouldexpectbasedonthewaysthateach behaves separately, we can actually say for once that theseeffectsaresynergistic–andmeanit.Other analytical methods allow variables to interact as part of
theirnormaloperation,inparticulartheBayesNetswediscussinChapter7.Butnowherearethesepatternsasapparentastheyareinaclassificationtreeanalysis.Thesemethods are so effective at finding interactions that they
make a good first step before othermethods of analysis, such asregression-based models. The important interactions thatclassification trees find can be entered into the regression,improvingresults.We mainly discussed the CHAID method, which can produce
many-waysplits.Thisisparticularlyefficienttofindthebestwaytosplit a large categorical variable that holds many codes. Anothertypeofclassificationtreemethod,exemplifiedinCART(orC&RTorCRT),producesonlytwo-waysplitsandsomakesoptimalrecodingsomewhatmorecumbersome.Trees do not produce equations like regressions. Classification
tree models typically are small, with few variables and few
classification rules. Rules are simple if-then statements thatdescribe how the variables work together to lead to an outcome.Thissimplicity,evenwithverylargedatasets, isasalientstrengthof these methods. We typically can explain everything importantquickly and efficiently. Some audiences may find this hard tobelievethough,sothiscouldrequiresomeadvanceexplanation.Classification tree methods do not produce a truly definitive
model. Small fluctuations in thedataorsmallchanges in thewayyouchoosetosetminimumacceptablegroupsizes,forinstance,canleadtoverydifferent-lookingtrees.Ifyouallowthesoftwaretodoall the choosing in shaping the tree, youmight get a result that isnotbestsuitedtoyourstrategicortacticalneeds.Some programs claim to find the best possible model
automatically,butyoualoneknowwhatyoureallyneed.Therefore,you are best served by a program that allows you to modify themodeltofityourobjectives.Weexplainedtwoensemblemethodsbasedontrees.Ensembles
runmanymodelsandeitheraverageortakevotes.Oneofthekeyfindingsofmachinelearningisthattheaverageofmanyindifferentorweakmodels typicallyworks better than any of the individualmodels.Random forests help understand the importance of variables.
Theybuildhundredsofclassificationtreeswithrandomswappingof people andpredictors into themodel each time. They canhelpyoufocusinonthetrulyimportantvariables,aswedidintheIAGCruiseLinesexample.Adaptiveboostingisanotherapproachthatcanprovideanexcellentreadingofvariables’ importances.Whichof theseapproachesyouusewoulddependonwhichmostclearlyshowstheinformationyouneedtomeetthegoalsofyourproject.However, another method, Bayes Nets, arguably provides the
ultimate in seeing how variables relate and understandingvariables’importances.WediscussBayesNetsinChapter7.
07RemarkablepredictivemodelswithBayesNets
In thischapterwewill learnabout theremarkablesetofmethodscalledBayes Nets or Bayesian networks.Wewill show how theyreadilyseepatternsintherealworldthatcompletelyeludeus.Wealso illustratehowtheyautomatically learndatastructures, fittingvariablestogetherintonaturalgroupings.Wereviewsomeoftheirmany other abilities, including the ways they can trim groups ofvariables, determine the true importances of predictors, andgenerally make sense of data. Using numerous illustrations, thischapterdemonstratestheremarkablepropertiesofthesemethods.
WhatareBayesNetsandhowdotheycomparewithothermethods?Nowthatwehaveassimilatedagreatdealabouttrade-offmethods,classification trees and ensembles, we head in another directionentirely:exploringBayesNetsorBayesiannetworks.BayesNetshaveremarkablepropertiesallowingthemtosurpass
manyothermethods in showingusefulpatterns indata.Theycanevensolvesomeproblemsthateludeothermethodsentirely.Theywillrepaylearninganewwaytothinkaboutdata.
ComparingtotheregressionstandardBayes Nets can tackle many of the same problems that havetraditionally been addressed with various regression-based
models. Nearly everyone who has sat (or suffered) through astatisticsclasshasheardaboutregression.Manypeoplebelievethatthey know these methods and their uses, and some in fact dounderstandthem.So that everyone is on an even footing, let’s reviewa fewbasic
properties of regressions. One basic idea behind them is thatwecanaddtheeffectsofvariablestopredictthevaluesofsometargetvariable. This target could be, for instance, a scaled rating or thelevel of use of a product or service. The types of regression wetypically use all work based on seeking straight-linesrelationships. Hence, the designation you will sometimes see:linearadditivemodels.Regressions are based on the patterns of correlations among
variables.Asareminder,whilecorrelationhasbeentakentomeanmanythings,withregressionitmeansasimplesummarymeasureofhowcloselytwovariablesfallintoastraight-linerelationship.Some extensions to regression deal with curved lines for the
target variable, but you are not likely to encounter these outsidescientific settings. Even if the line is curved, regression seeks thebestfittothatline,asitdoeswiththestraightlineinFigure7.1.
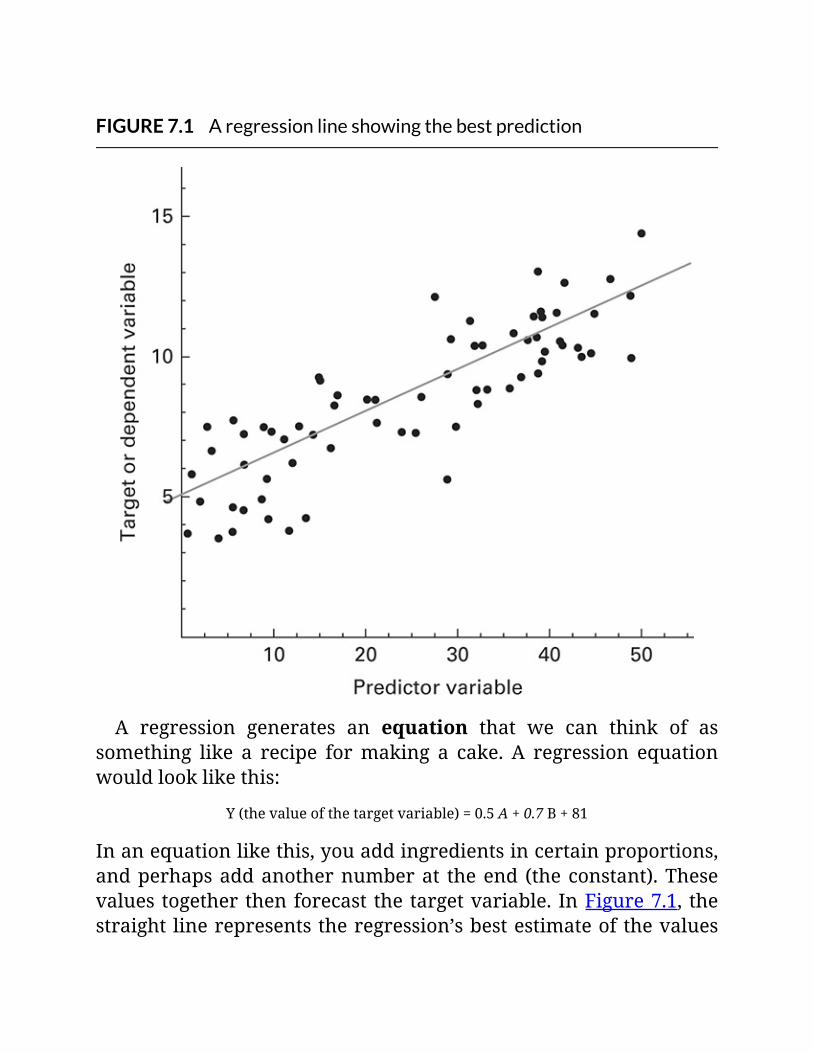
FIGURE7.1Aregressionlineshowingthebestprediction
A regression generates an equation that we can think of assomething like a recipe formaking a cake. A regression equationwouldlooklikethis:
Y(thevalueofthetargetvariable)=0.5A+0.7B+81
Inanequationlikethis,youaddingredientsincertainproportions,andperhapsaddanothernumberat theend (theconstant).Thesevaluestogetherthenforecast thetargetvariable. InFigure7.1, thestraightlinerepresentstheregression’sbestestimateofthevalues
of the target variable, based on values of one predictor. The dotsshow the actual values of the target variable (shown as distancesacross) versus the predictor variable (shown as distances up anddown).Regression-basedmethodshavehadalong,distinguishedhistory
of working well in many settings. They are among the mostvenerableandmost testedof all analyticalmethods. Still, at timesregressionsperformindifferently,poorlyorevennotatall.Regular regressions do not work with target variables that are
categorical (such as predicting the group to which a personbelongs, or in which region a person lives). You alsomust breakdown categorical predictors into sets of yes/no variables. Mostcommonlythisisdoneviaaprocesscalleddummycoding.We did not talk much about the methods underlying discrete
choice modelling – these are complex and not critical tounderstandingtheoutput.However,theyarebasedonrelativesofregression that can use a categorical target variable. Specifically,these are variants of multinomial logit or the more inclusivemotherlogit.
Regressionsaregreatforexperiments
Regression-relatedmethodsareaperfectmatchforanexperiment.That is, you have all the variables that youwant tomeasure andnoneextra.Regressionexpectsthat.Also,inanexperiment,allthepredictorvariableshavezeroornear-zerocorrelations.Thisallowsthe regression to measure each variable’s effects precisely. Withthiscarefulset-up,youreallycanmeasuretheeffectofavariableifallothervariablesremainconstant.
Sometroubleintherealworld
However,regressionsmayrunintotroublewithmessier,real-worlddata. When predictor variables are related to each other, thecoefficients of the variables can shift or even reverse signs (going
from positive to negative or vice versa). Variables that are toocloselyrelatedcangetsqueezedoutofthefinalmodelaltogether.Regression will not alert you to situations in which variables
interact, or combine to produce a result different from what wewouldexpectfromeachvariableseparately.YoumayrecallthatinChapter6we saw that large families living in the suburbsboughtmoreKardboardKrunchiesthanwewouldexpecteitherfromlargefamilies overall or from those living in the suburbs overall. Thatwas an interaction. While it appeared in a classification tree, itwouldnotemergespontaneouslyfromaregression.
ReviewingtreesClassification trees take a radically different approach fromregressions, allowing them to tease out different patterns in thedata. All treemethods handle categorical, ordinal and continuousvariables equally well. They can break apart continuous or largecategoricalvariablesinthebestwaytoleadtoastrongprediction.Thisiscalledoptimalrecoding.Treemethodsevencanhandlemissingvaluesindataasanother
typeofresponse,aswesawinChapter6.Theydoallthisinadditiontotheirunparalleledabilitytoshowhowvariablesinteract.Asareminder,classificationtreesworkbysplittingthesample
into contrasting groups and resplitting those groups again andagain, seeking to find small subgroups that differ as much aspossibleinlevelsofsometargetvariable.(Thistargetcouldbe,forinstance, preference ratings or levels of use.)We can see a singlesplit in a tree in Figure 7.2. This comes from the first example inChapter6.
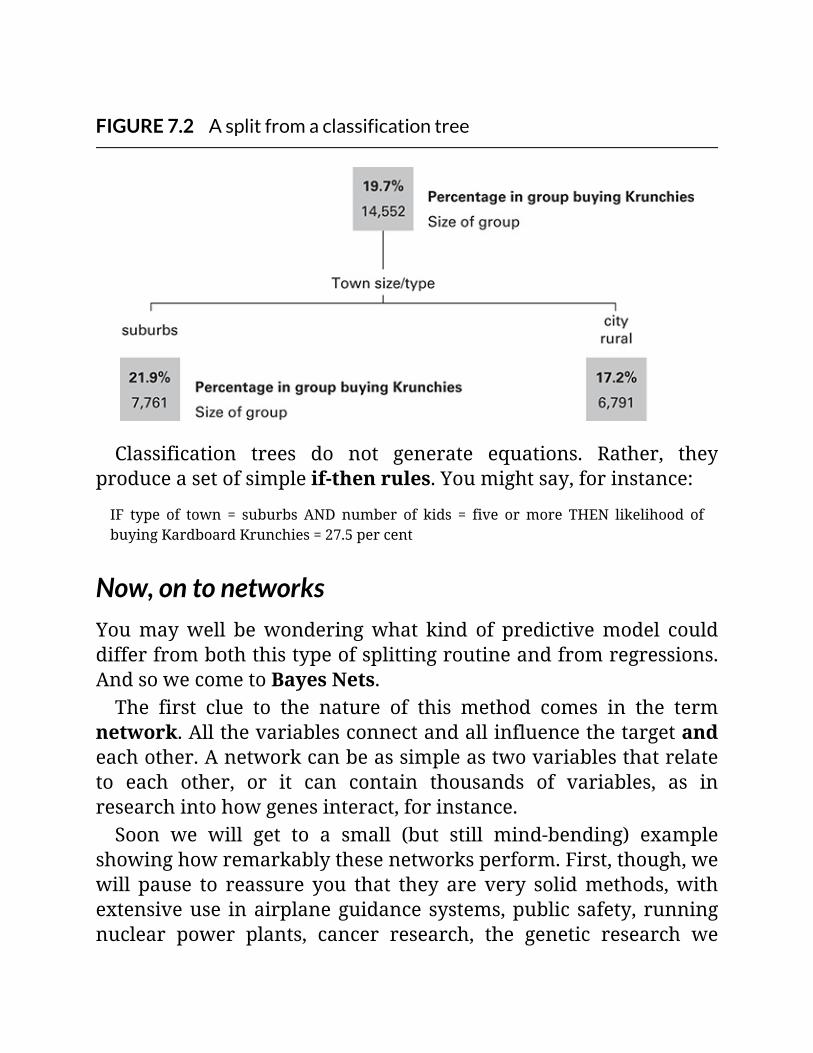
FIGURE7.2Asplitfromaclassificationtree
Classification trees do not generate equations. Rather, theyproduceasetofsimpleif-thenrules.Youmightsay,forinstance:
IF type of town = suburbs AND number of kids = five ormore THEN likelihood ofbuyingKardboardKrunchies=27.5percent
Now,ontonetworksYoumaywell bewonderingwhat kind of predictivemodel coulddifferfromboththistypeofsplittingroutineandfromregressions.AndsowecometoBayesNets.The first clue to the nature of this method comes in the term
network.Allthevariablesconnectandallinfluencethetargetandeachother.Anetworkcanbeassimpleastwovariablesthatrelateto each other, or it can contain thousands of variables, as inresearchintohowgenesinteract,forinstance.Soon we will get to a small (but still mind-bending) example
showinghowremarkablythesenetworksperform.First,though,wewill pause to reassure you that they are very solidmethods,withextensiveuse inairplaneguidancesystems,public safety, runningnuclear power plants, cancer research, the genetic research we
mentionedjustabove–andevennationaldefence.We have seen an example online showing how a Bayes Net is
used to determinewhether to launch a surface-to-airmissile.Weactually can say that these networks have been battle-tested. Thesocialsciencesandmarketingscienceshavebeenalittlelatetotheparty.Catchingupnowseemsliketherightthingtodo.
Whatdothesenetworksactuallydo?These networks can solve a vast and even bewildering array ofproblems. Applications range from brainstorming to highlysophisticated modelling and forecasting systems. Here are someuses:
automaticallyfindingmeaningfulpatternsamongvariables;gettingaccuratemeasuresofvariables’strengths;screeninglargenumbersofvariablesquickly,fordatamining;developingmodelsofcauseandeffect(intherightcircumstances);incorporatingexpertjudgementintodata-drivenmodels;solvingproblemsinconditionalprobability.
Wewillshowseveralexamplesofnetworksinactionfollowingoursmall introductorymodel.Oneexamplewill linksurveyresponsesto actual marketplace behaviour with high predictive accuracy.Anotherwill support and extend a theoreticalmodel. A thirdwillshow how accurate readings of variables’ importances helped toguidedecisionsandstrategy.
WhatmakesaBayesiannetworkBayesian?EverythingBayesian refersback to theworkofReverendThomasBayes, who lived an apparently quiet life in Tunbridge Wells,England,inthe18thcentury.Hepublishedtwobooksinthe1730s,
butneveranythinghecalled‘BayesTheorem’.Bayes’s formulation itself is simple. Any reasonably literate
person caneasilyunderstand it in its entirety, oncewe stepasidefromthenearlyblindingformulaoftenusedtorepresentit.StartingfromBayes’sstraightforwardassertionandarrivingatmanyofthetypesofanalysesthatbearhisnamelikelywouldhavecausedthegood reverend to take on a strange hue. This perhaps is theinevitablepriceofprogress.We can formulate Bayes’s idea in a variety of ways. Let’s start
withthismorepracticalformulation:
We start with prior (existing) information or beliefs that we can then update ormodifybyusinginformationthatwegetfromdataweobserve.Thisupdatinggivesusanewandmoreaccurateposteriorestimate.Fromthisposteriorestimate,wedrawconclusions.
That’sreallyallthereistoit.However,itisusualtoencounterthisheadache-inducingrepresentation:
P(Bi|A)=P(A|Bi)P(Bi)/∑i{P(Bi)P(A|Bi)}
Mostofuslikelywouldpreferthesimpledescriptiveparagraph.
ThegroundrulesfornetworksDiagrams of variables are key. Bayesian networks are graphicallybased methods. As they are based on graph theory and onprobability theory, they fall under the heading of graphicalanalyticalmethods.Graspingtheirworkingsfullyrequiresbothadiagramandthecalculationsthatunderlieit.BayesNets in fact are calleddirected acyclic diagrams (DAGs)
because all the variables connect, and allmust point somewhere.Nonecanpointbacktoitself,orformacyclicstructure.A Bayes Netmay look familiar if you are one of the lucky few
having experience with structural equation models (SEMs) orwith partial least squares (PLS) path models. Variables are
connected with arrows, as in those types of models. You can seepathways among the variables, and finally these lead to a targetvariable.
Arrowsmatter,butnotasyoumightthink
The arrows have a specific meaning in Bayes Net diagrams;however,thisisnotentirelyintuitive.Wecansaythatavariableatthestartofanarrowleadstoanothervariable,orexplainsanothervariable. In highly specific conditions we even can say that thestarting variable causes the variable at the end. However, if wechange the variable at the end of an arrow, the variable at thestartingpointwillchangeaswell.Soeffectsruninbothdirectionsinanetwork.Dealingwiththedatawetypicallyencounter,connectedvariables
inanetworkalmostalwayshaveanequalchanceofbeingthecauseandbeingtheeffect.Stronginfluencesgobothways.Itisveryrareindeed that we can prove one variable in fact causes another,dealing with the messiness inherent in behaviour, opinions andbeliefs.
Termsandphrases:it’sallinthefamily
Thereis,ofcourse,someterminologytolearn.Fortunately,thispartlargely goes down easily, being (for statistics) warm and fuzzy.Someoftherelationshipsare(showninFigure7.3):
Thevariableatthestartofanarrowiscalledaparent.Thevariableattheendiscalledachildoftheparent.Childrencanhaveseveralparentsandparentscanhaveseveralchildren.Iftherearetwoormoreparents,theyarecalledspouses.Aparentofaparentisagrandparent,andsoon.Variablesaredependentonlyiftheyaredirectlyconnected:
–Childrenandparentsaredependentoneachother.

–Childrenareindependentofgrandparentsandothervariablesfurtheraway.
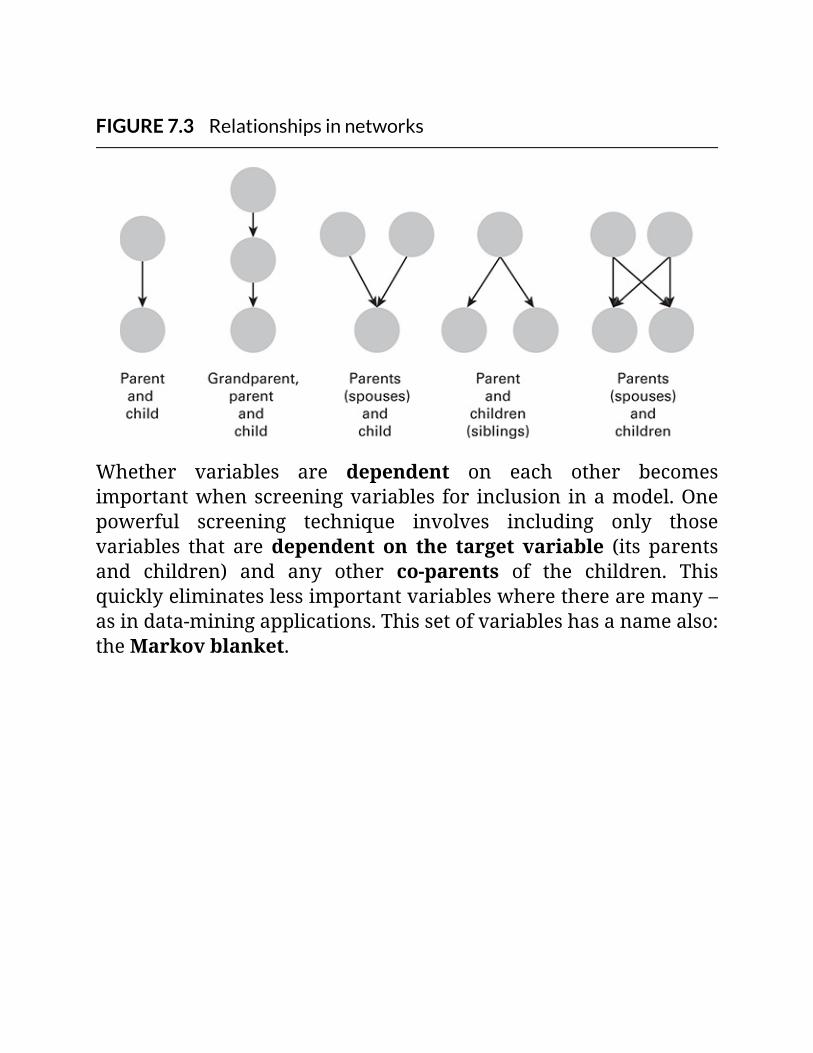
FIGURE7.3Relationshipsinnetworks
Whether variables are dependent on each other becomesimportantwhenscreeningvariables for inclusion inamodel.Onepowerful screening technique involves including only thosevariables that aredependent on the target variable (its parentsand children) and any other co-parents of the children. Thisquicklyeliminateslessimportantvariableswheretherearemany–asindata-miningapplications.Thissetofvariableshasanamealso:theMarkovblanket.
Everythingisconnected
Changesmovethroughthewholenetwork.Understandingthisiscritical.Inwhicheverwaythearrowsbetweenvariablespoint,allvariablesinanetworkchangewhenonechanges.Networksconveyinformationacrossalltheconnectedvariables.
NetworkconstructionrangesfromsimpletocomplexWhen we are attempting to understand relationships amongvariables, the way we fit the network together is of primeimportance. Networks can learn structures from the data,building themselves automatically. This is something akin to aclassification tree constructing itself on autopilot. However,networksarefarlesspronetotakingondifferentshapesbasedonsmallchangesinthedata.There are many ways that you can choose for a network to
assembleitself.Thesimplestmethodsfitallthevariablesdirectlytothe targetvariable.This isverymuch likea standardregression–all the predictor variables are put into the mix and each oneconnectsonlytothetargetvariable,andnottoanotherpredictor.Attheirmostcomplex,networkshavemanybranchesandresult
from countless attempts to develop a best model. They test andretest how variables best fit together to predict the values in thetarget.Thesemethodsensurethatthenetworkdoesnotseizeuponaconnectionthatisgood‘locally’(whereavariableisbeingadded)butnotgoodfortheoverallnetwork.Youalsocanputanetworktogetheryourself.Ifyoudonotviolate
anybasicconstructionrules,itwillreturnanswersaboutvariables’effectsbasedonthewayyouhaveassembledeverything.Therearevariousintermediarystrategiesaswell,suchaslettingthenetworkform an initial shape and then modifying it based on yourunderstandingofthequestionsyouneedtoanswer.
Aboutconditionalprobability

AboutconditionalprobabilityWeneed toexplainconditionalprobability. This ideaappears inmanydiscussionsofBayesNets.Aprobabilitythatisconditionalisnomorethanwhatwejustdescribed:itisanestimateofprobabilitythat takes intoaccountsomeinformationfromanearlierestimateoritemofinformation.That is, we understand how one ormore variableswill change
basedonwhatishappeningtoanothervariableorvariables.Inthesimplest terms, this means all changes in variables consider allvaluesinallothervariables.Theworkingsofconditionalprobabilitymaybedifficulttograsp,
but let’s try in thesmallexamplewehavebeenpromising.This iscalledthethree-doorlet’s-make-a-dealorMontyHallproblem.Theanswerissurprising!
Let’smakeadealSomemayhaveseenthelong-runningtelevisionshowLet’sMakeaDeal, and somemay recall its inimitable formerhost,MontyHall.Althoughhewentoff theairmanyyearsago,showswithhimcanstillbefoundbythecurious,lurkingindarkcranniesoftheweb.The show poses a challenge to contestants. They need to pick
whichofthreedoorshasaprizebehindit–withanaddedwrinkle.The contestant first picks whichever of the doors feels right toher/him.Thehostnever opens that door to revealwhether it hastheprize,though.Rather,heopensanotherdoorthatdoesnothavetheprizebehindit.Thenheasks, ‘Willyoustaywithyourdoororwillyouswitchtotheotherunopeneddoor?’Now we ask you to consider this: if you were advising the
contestant, would you tell her/him to switch or to stay?Alternatively, do you think it makes any difference? Nearlyeveryonesaysthereshouldbenodifference.Andnearlyeveryoneiswrong.
Infact,thisveryproblemanditssolutionappearedinamagazinecolumn by Marilyn vos Savant, billed as the world’s smartestperson.WhetherMsSavantisinfactsmartest,shegotthisanswerright.Youarebetteroffswitching,byafactorof2to1.This correct answer seems somehow impossible to nearly
everyone.Some10,000peoplewrote toMsSavant, sayingshewasmistaken.About1,000ofthemhadPhDdegrees.Let’snowvindicateher.
SolvingtheproblemissimpleusingaBayesNetYou can struggle with standard statistics to get the right answer.You can, for instance, find code on the web for using standardstatistics to run 10,000 simulations to address this question. Youranswerwillbenearlycorrect.AbasicBayesNettakingaboutthreeminutestoconstructcansolvethisproblemexactly.Recallthatwecanmakeanetworkourselvesbylinkingvariables.
Here,wewillformatinynetworkbyjoiningthreeevents:thedooryouchoose,thedoorthatisopenedandthewinningdoor.The simplest representationof aBayesNet looks like connected
shapes. This is what appears in Figure 7.4. We know that thewinningdoorcanbeanyofthethree,andthedooryouchoosecanbeanyofthethree.However,thedoorthatthesneakygame-showhost opens depends on both the door you have chosen and thewinningdoor.
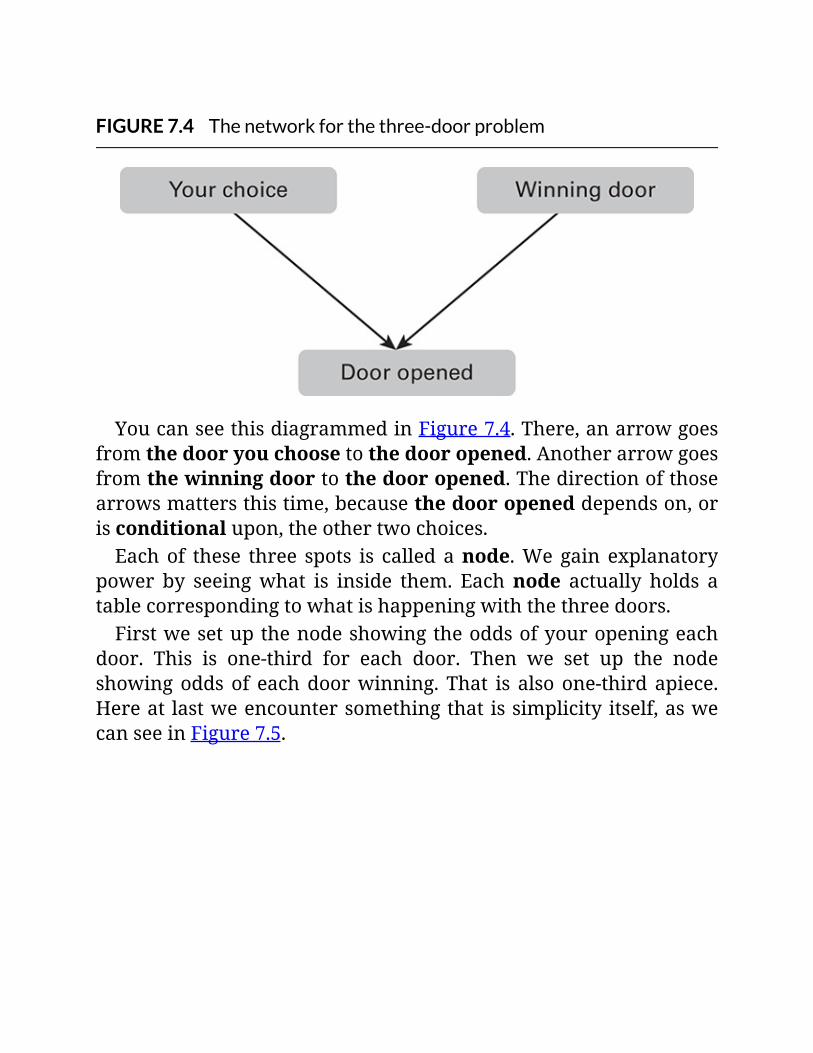
FIGURE7.4Thenetworkforthethree-doorproblem
YoucanseethisdiagrammedinFigure7.4.There,anarrowgoesfromthedooryouchoosetothedooropened.Anotherarrowgoesfromthewinningdoortothedooropened.Thedirectionofthosearrowsmattersthistime,becausethedooropeneddependson,orisconditionalupon,theothertwochoices.Eachof these three spots is called anode.We gain explanatory
power by seeingwhat is inside them. Eachnode actually holds atablecorrespondingtowhatishappeningwiththethreedoors.Firstwesetupthenodeshowingtheoddsofyouropeningeach
door. This is one-third for each door. Then we set up the nodeshowingoddsof eachdoorwinning.That is alsoone-thirdapiece.Hereat lastweencountersomethingthatissimplicityitself,aswecanseeinFigure7.5.

FIGURE7.5Insidethefirsttwonodesofthenetwork
Nowwesetupthelastandmostcomplicatedofthenodes.Oncewehavemadethefirsttwonodesandconnectedthemtothethird,the table describing this node automatically appears in thesoftware,readytofill.Aswementioned,inBayesNets,seeingwhatyouaredoingiskey.Because this table ismore complicated,wewill take it in parts,
startinginFigure7.6.ThisshowswhathappensifyouchooseDoor1.AboveletterA,youseethatDoor1NEVERgetsopenedifyoupickit–itdoesn’tmatterwhichdooristhewinner.Thisisabasicruleofthegame.

FIGURE7.6Partofthethirdnode–whenyouchooseDoor1
IfyoupickDoor1andit is thewinner,youcansee(onthefirstrowofthetableinFigure7.6)thatthechancesofopeningDoor2orDoor3are50percenteach.ThatrowisnexttoletterB.Sofarsogood.Now,ifyouchooseDoor1andthewinningdooris
2,thehostmustopenDoor3orrevealtheprize.Soheretheoddsfor theotherdoorsarenot the sameatall – in fact, theyarezeroversus100percent.YoucanseethisontherownearletterC.Finally,verymuchthesameconditionholdsifyouchoseDoor1
and thewinner is 3. The hostmust openDoor 2. The probabilitythatheorshewilldosois100percent.WeseethisaboveletterD.Oncewehave filled in thecorrectvalues forDoor1, itbecomes
relativelysimpletofillinthecorrectvaluesforDoor2andDoor3.Theentire tablefor thethirdnodeappears inFigure7.7.Wehaveadded someheavilyoutlinedboxes to separate the sectionsof thetable corresponding to each door you might have chosen.Otherwise, all we did was fill in the correct numbers. Again, thenetworkcreatedtheblanktableitselfonceweconnectedthethreenodestogether.
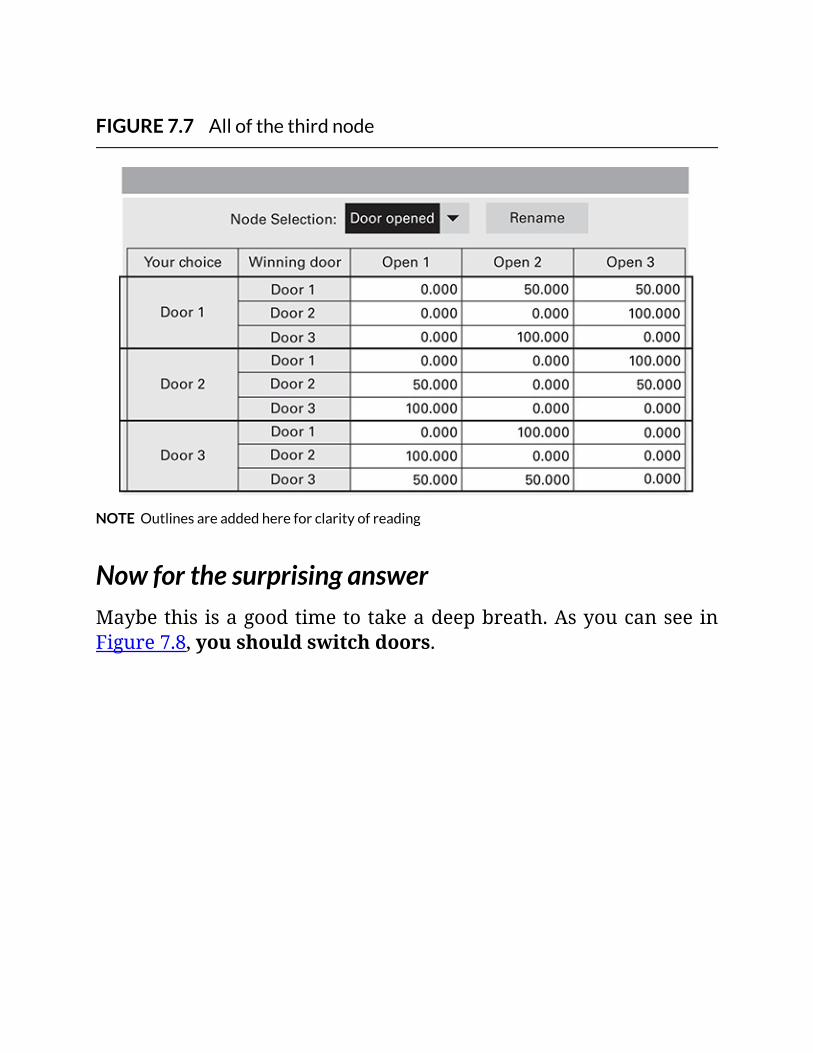
FIGURE7.7Allofthethirdnode
NOTEOutlinesareaddedhereforclarityofreading
NowforthesurprisinganswerMaybethisisagoodtimetotakeadeepbreath.AsyoucanseeinFigure7.8,youshouldswitchdoors.
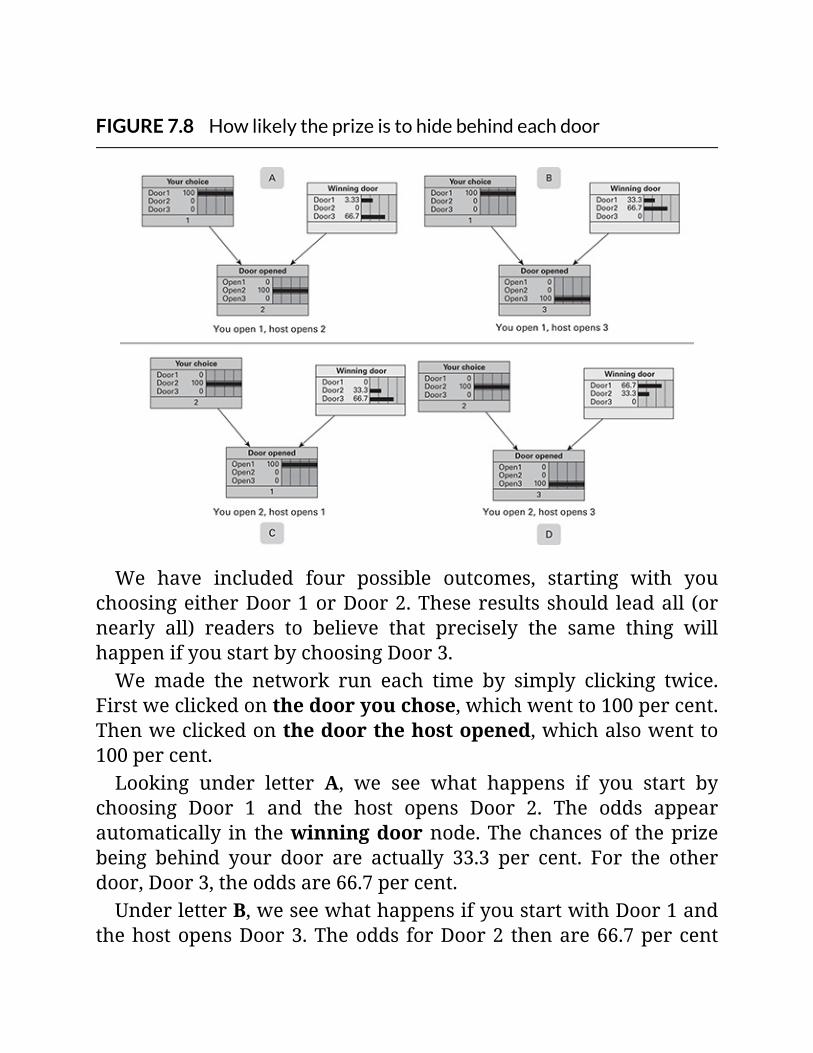
FIGURE7.8Howlikelytheprizeistohidebehindeachdoor
We have included four possible outcomes, starting with youchoosingeitherDoor1orDoor2.Theseresultsshould leadall (ornearly all) readers to believe that precisely the same thing willhappenifyoustartbychoosingDoor3.We made the network run each time by simply clicking twice.
Firstweclickedonthedooryouchose,whichwentto100percent.Thenweclickedonthedoorthehostopened,whichalsowentto100percent.Looking under letter A, we see what happens if you start by
choosing Door 1 and the host opens Door 2. The odds appearautomatically in thewinningdoornode.Thechancesof theprizebeing behind your door are actually 33.3 per cent. For the otherdoor,Door3,theoddsare66.7percent.UnderletterB,weseewhathappensifyoustartwithDoor1and
thehostopensDoor3.Theodds forDoor2 thenare66.7percent
andforyourdoor33.3percent.JusttoconfirmthatthisisnotaflukerelatedsolelytoDoor1,we
showwhatwouldhappenifyoustartedwithDoor2.OverletterC,youseetheresultifthehostfollowsbyopeningDoor1.Oddsfortheother door are again 66.7 per cent. And finally, if the host opensDoor 3, the odds for the door youdidnot pick are again 66.7 percent.Again, this also underlines a key property of networks. If you
changeavariable,anyvariableconnectedtoitchanges.Weseethatdooropened hasanarrowpointing to it fromwinningdoor. Yetwhen we change door opened, the variable leading to it alsochanges.
Whyisthecorrectanswersodifferentfromwhatweexpect?Thishappensbecausewhatthehostdoesactuallydependson,orisconditional upon, your choice and the winning door. We do notthinkintermsofthiskindofconditionalprobability.Herewe comeuponan issuewithBayesiannetworks.Wehave
justneatlyandsimplyunravelledaproblemthatlikelyeludedmostofus.Andyet,theanswerseemsstrangeuntilitisexplained–andperhapsevenafterwards.As an expert on this subject (Eliezer Yudkowsky) points out,
solvingproblemsof this typeposesdifficulties fornovice studentsandtrainedprofessionalsalike.Wehaveanapproachthat is trulypowerful and that easily reaches answers we cannot guessintuitively.Thismethodlearnspatternsinthedatathatwecannotsee or guess.With that in mind, let’s discuss in more detail howBayesNetswork.
MoreaboutnetworkscomparedwithregressionsBayesNets lookat thewholepatternofscoresorresponses in the

variables theyanalyse.For instance,comparing twovariables thatwewill callA andN, thismethod creates a chart, ormatrix, thatshowshowthescoresrelate.Wecansee this inFigure7.9. In thischart, each box represents how often scores coincide. At the topright, for instance, we see that 33 people gave a score of 10 onvariable A and 10 on variable N, that 44 gave a score of 9 onvariableAand10onvariableN,andsoon.Thedarkenedboxesarewherethescoresonthetwovariablesalignmostoften.
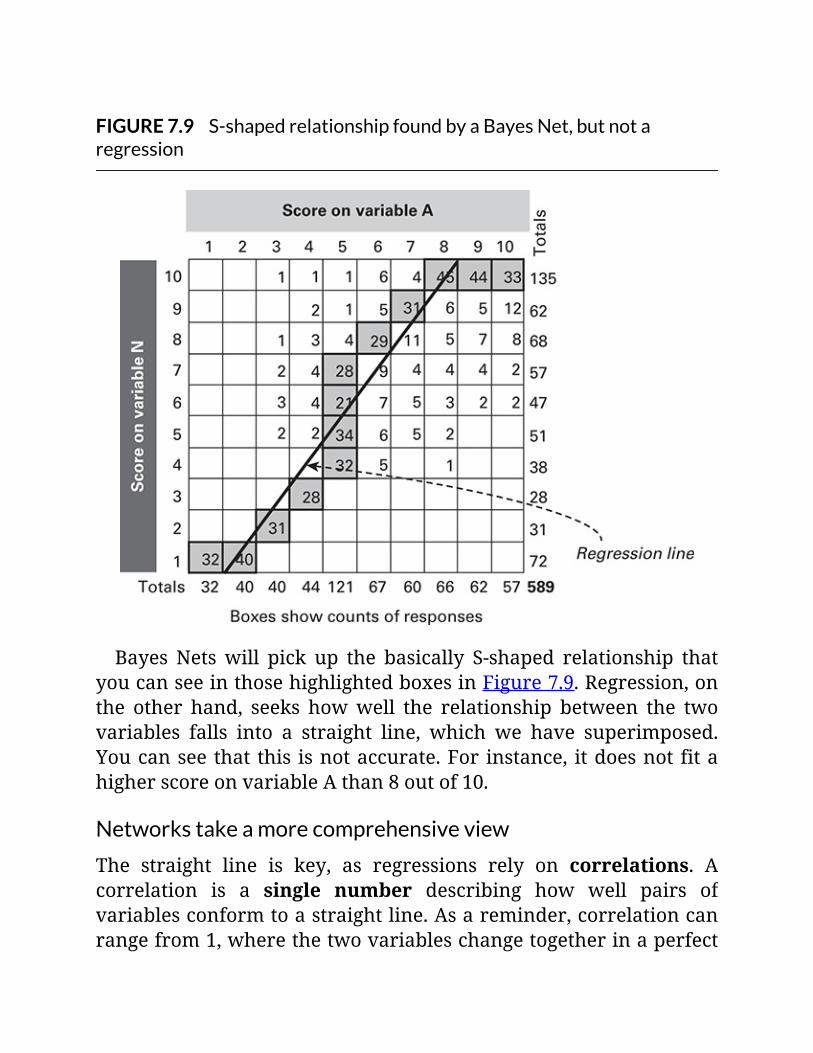
FIGURE7.9S-shapedrelationshipfoundbyaBayesNet,butnotaregression
Bayes Netswill pick up the basically S-shaped relationship thatyoucanseeinthosehighlightedboxesinFigure7.9.Regression,onthe other hand, seeks howwell the relationship between the twovariables falls into a straight line, which we have superimposed.Youcanseethat this isnotaccurate.For instance, itdoesnot fitahigherscoreonvariableAthan8outof10.
Networkstakeamorecomprehensiveview
The straight line is key, as regressions rely on correlations. Acorrelation is a single number describing how well pairs ofvariablesconformtoastraightline.Asareminder,correlationcanrangefrom1,wherethetwovariableschangetogetherinaperfect
straight-line pattern, down to –1,where the two variables have aperfect inverse relationship (one rises exactly as theother falls invalue).Correlations provide a less detailed understanding of how
variablesrelatethanthewholepatterncapturedbyBayesNets.AndmanytimestheBayesNetwillalsoprovideamoreaccuratemodel.
BayesNetsversusclassificationtreesClassification trees take a step towards looking at the wholedistributionsofvariables.Buttheydothis inadifferentandmorerestricted way than Bayes Nets. Classification trees seek to splitapart the scores in the target variable based on scores in thepredictors.Oneway toexpress this is thatclassification trees lookforsituationalrelationships,asinsaying,‘whenvariableNislikethis,THENvariableAislikethat’.The splitting doneby classification trees leads to relatively few
variablesgettingchosenaspredictors.AswediscussedinChapter6,thetreeformssubgroupsthatbecomesmallerateachstep.Finally,thegroupsbecometoosmalltosplitfurther.Thiscompactnesshasadvantages and disadvantages. Variables that you might want toconsidercouldgetleftoutofthemodel.
Differencesindynamicpredictions:networkstakethemorerealisticviewWehavesaidthisbefore,butit isworthunderlining: innetworks,whenonevariablechanges,all theothervariableschangeaswell.Anygivenvariablehasthemostinfluenceonvariableswithwhichitiscloselyconnected.Still,effectsfromchangestravelthroughthenetwork like ripples going across a pond. Another, more formal,way to say this is that information propagates across thenetwork.Thewaynetworksaccountforchangesdiffersstronglyfromthe
assumptionsofregression-basedmodels.Measuringanyvariable’seffectinaregressionassumesthatallothervariablesremainthesame.Thisisaparticularlyunrealisticviewwhendealingwithdatasuchasopinions,beliefsorpurchasingpatterns,asthesealltendtobehighlyinterrelated.Indeed, some authorities on regression (for instance Leland
Wilkinson),bemoanthetendencyofregression-basedmodelstofailin real-world applications, in particular setting policy. In the realworld, when we change one factor, many other factors changealong with it – leading to the downfall of some precise-lookingforecaststhatregressiondelivers.
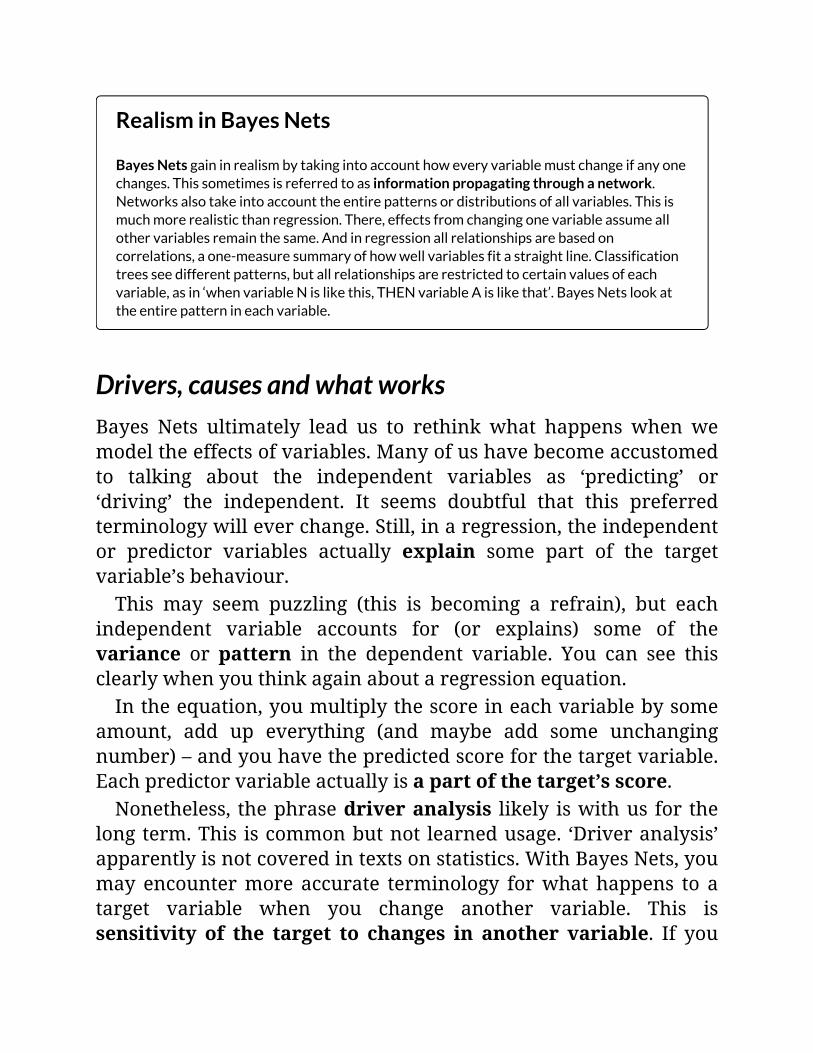
RealisminBayesNets
BayesNetsgaininrealismbytakingintoaccounthoweveryvariablemustchangeifanyonechanges.Thissometimesisreferredtoasinformationpropagatingthroughanetwork.Networksalsotakeintoaccounttheentirepatternsordistributionsofallvariables.Thisismuchmorerealisticthanregression.There,effectsfromchangingonevariableassumeallothervariablesremainthesame.Andinregressionallrelationshipsarebasedoncorrelations,aone-measuresummaryofhowwellvariablesfitastraightline.Classificationtreesseedifferentpatterns,butallrelationshipsarerestrictedtocertainvaluesofeachvariable,asin‘whenvariableNislikethis,THENvariableAislikethat’.BayesNetslookattheentirepatternineachvariable.
Drivers,causesandwhatworksBayes Nets ultimately lead us to rethink what happens when wemodeltheeffectsofvariables.Manyofushavebecomeaccustomedto talking about the independent variables as ‘predicting’ or‘driving’ the independent. It seems doubtful that this preferredterminologywilleverchange.Still,inaregression,theindependentor predictor variables actually explain some part of the targetvariable’sbehaviour.This may seem puzzling (this is becoming a refrain), but each
independent variable accounts for (or explains) some of thevariance or pattern in the dependent variable. You can see thisclearlywhenyouthinkagainaboutaregressionequation.Intheequation,youmultiplythescoreineachvariablebysome
amount, add up everything (and maybe add some unchangingnumber)–andyouhavethepredictedscoreforthetargetvariable.Eachpredictorvariableactuallyisapartofthetarget’sscore.Nonetheless, thephrasedriveranalysis likely iswithus for the
longterm.This iscommonbutnot learnedusage. ‘Driveranalysis’apparentlyisnotcoveredintextsonstatistics.WithBayesNets,youmay encountermore accurate terminology forwhat happens to atarget variable when you change another variable. This issensitivity of the target to changes in another variable. If you
seethat,anditseemsconfusing,justthinkofdrivers.
Ourfirstexample:BayesNetslinkingsurveyquestionsandbehaviourWe will start with a relatively simple example of Bayes Netsshowing a predictive relationship between responses to surveyquestions and behaviour. In this example, Bayes Nets address animportantsetofquestions:
whattherelativeeffectsareofseveralvariablesonthedependentvariable;howstronglychangingeachvariableaffectsthedependent;thewaysthesevariablesrelatetoeachotherandtothedependent.
The predictor variables were heavily weeded in this example. Asmentioned, Bayes Nets can cut out variables having little directrelationship to the target variable. They can, for instance, restrictthepredictors to those in theMarkovblanket thatwementionedearlier.(MrMarkovandhisblanketcouldbethesubjectofanotherwholediscussion,butwewillhavetoskipthishere.)
NowontotheactualnetworkThisexamplecomesfromasurveydoneamongprofessionalsusingan information technology (or IT)product. It involvedavery longquestionnaire.Wewillleappastthevariablescreeningphase,tothepoint wherewe have just seven key variables. Figure 7.10 showshowthesevariablesrelatetoeachotherandtothetargetvariable,which is the percentage of services each corporate customersigneduptouseagain.
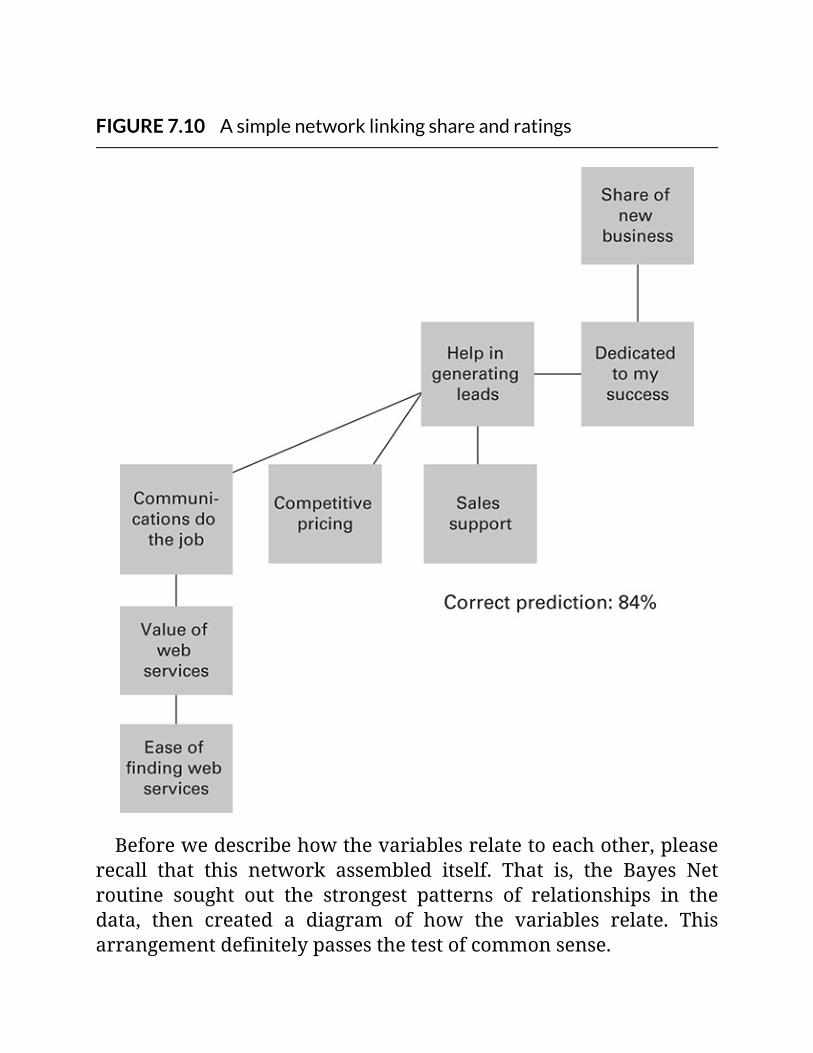
FIGURE7.10Asimplenetworklinkingshareandratings
Beforewedescribehowthevariablesrelatetoeachother,pleaserecall that this network assembled itself. That is, the Bayes Netroutine sought out the strongest patterns of relationships in thedata, then created a diagram of how the variables relate. Thisarrangementdefinitelypassesthetestofcommonsense.
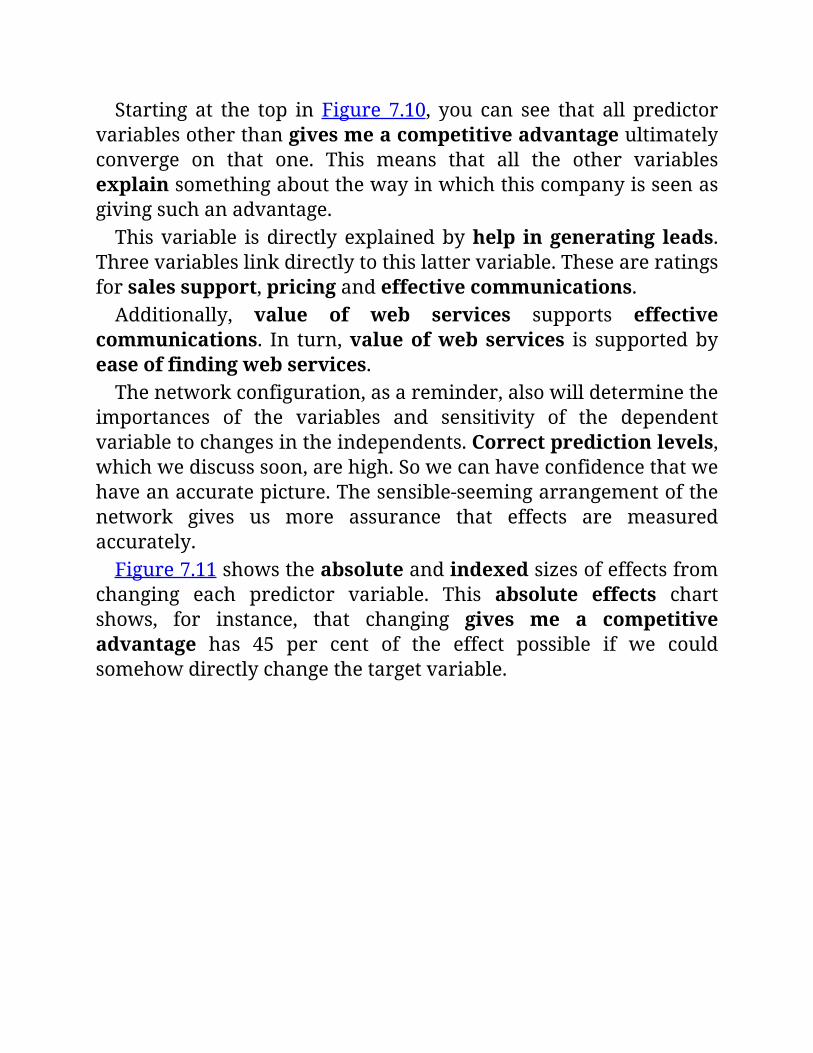
Starting at the top in Figure 7.10, you can see that all predictorvariablesotherthangivesmeacompetitiveadvantageultimatelyconverge on that one. This means that all the other variablesexplainsomethingaboutthewayinwhichthiscompanyisseenasgivingsuchanadvantage.Thisvariable isdirectly explainedbyhelp ingenerating leads.
Threevariableslinkdirectlytothislattervariable.Theseareratingsforsalessupport,pricingandeffectivecommunications.Additionally, value of web services supports effective
communications. In turn,valueofweb services is supportedbyeaseoffindingwebservices.Thenetworkconfiguration,asareminder,alsowilldeterminethe
importances of the variables and sensitivity of the dependentvariabletochangesintheindependents.Correctpredictionlevels,whichwediscusssoon,arehigh.Sowecanhaveconfidencethatwehaveanaccuratepicture.Thesensible-seemingarrangementofthenetwork gives us more assurance that effects are measuredaccurately.Figure7.11showstheabsoluteandindexedsizesofeffectsfrom
changing each predictor variable. This absolute effects chartshows, for instance, that changing gives me a competitiveadvantage has 45 per cent of the effect possible if we couldsomehowdirectlychangethetargetvariable.
FIGURE7.11Effectsrelativetothetargetandindexedversustheaverage
Theseabsoluteeffectscanbehardtocompare,sotheotherchartinFigure7.11showsthemindexed.Theaverageindexissetto100.This chart shows, for instance, that gives me a competitiveadvantage has 1.94 times the effect of each variable on average(seeninitsindexof194).The unindexed values are similar to the Beta values or
coefficientsfromaregression.However,networksdevelopafullerunderstanding of effects. Changes in a predictor variable actuallycanhavevaryinglevelsofimpactfordifferentvaluesofthetargetvariable.Wecouldmakeanotherchartallowingustoseethis.While we will skip this second chart in this short example, it
would indeed show that effects on the target variable vary,depending on the values of the predictor variable and the targetvariable.Thatis,oversomerangesofthevaluesofeach,thetarget
variablechangesmore.Thisisanotherlevelofinformationbeyondwhatwecanseeinasimpleregressioncoefficient.There is still more that we can learn. Inside the more
comprehensiveprogramscreatingBayesNets,thenetworkdiagramitselfisdynamic.Wecanchangeavariableandobservehoweveryothervariablechangesasaresult.Someprogramsalsoallowyoutomake stand-alone simulator programs. These are similar to thesimulators for discrete choice modelling and conjoint analysisdiscussedinChapters4and5.
Informationmovingacrossthenetwork
Variables that are closely connected (such as parent nodes andchildrennodes)have strong influencesoneachother.The furtherthe variables are from each other in the diagram, the less impactthey tend to have on each other. However, all changes propagatethroughthewholenetwork.As a reminder, this whole-network understanding of the data
makesanypredictionofreal-worldeffectsmuchmorerealisticthanthe estimates from a regression-based model. In regressions, wemustassumethatallothervariablesremainthesameifwechangeanyonevariable.
Howthemodelperformed
Correct prediction levels were very strong indeed for fittingquestionnaire questions to behaviour. The level of correctprediction for the target variable (percentage of business signedfor)was84percent.Thiswasusingastringentformoftestingorvalidation of results, called cross-folded validation (more onvalidation follows). Without any validation, predictions were astellar93percentcorrect.Thoseofuswhohavetriedtofitquestionnairequestionstoactual
behaviourknowthat thisalmost invariablyhaspoorresultswhenusingregression-basedmodels.Networksdonotalwaysdoaswell
as thisone.Still, theyhaveusuallyoutperformedregression-basedmodelsonoverallmeasuresofmodelfitwithabehaviouraltargetvariable,suchasactualuselevelsorpurchases.Inthiscase,thebestregression-basedmodelemergedfromavery
complexvariantofregressioncalledapartial leastsquares (PLS)path model. This created intermediary variables that groupeditems,andevensoturnedinapaltry11percentcorrectpredictionofshare.
Whatpreciselyisvalidation?We discussed validation in Chapter 2, but a refresher could beuseful.Validationisnotanewidea,butthenotionthatyoushoulduseitregularlyhasgainedsupportasdatasetshavebecomelargerandmodelshavegrownmorecomplex.Withvalidation,youbuildthemodelonpartofthedata,holding
asidetherestofit.Youthentryoutthemodelontheportionofthedatathatyouheldaside.Whenyoutrythemodelonthishold-outsample,predictiveaccuracyusuallycomesinatalowerlevelthanwhen you simply look at the how themodel performedwhere itwasmade.Even the best predictive modelling technique will fit some
randombumpsandfluctuationsthatarefoundonlyinthedatasetonwhichamodelwasbuilt.Tryingoutthemodelelsewhere,evenonanotherpartofthesamedatathatyousetaside,givesyousomesafeguards against overfitting. Overfitting builds a model usingseemingpatternsinyourdatathatyouwillnotfindintheoutsideworld.
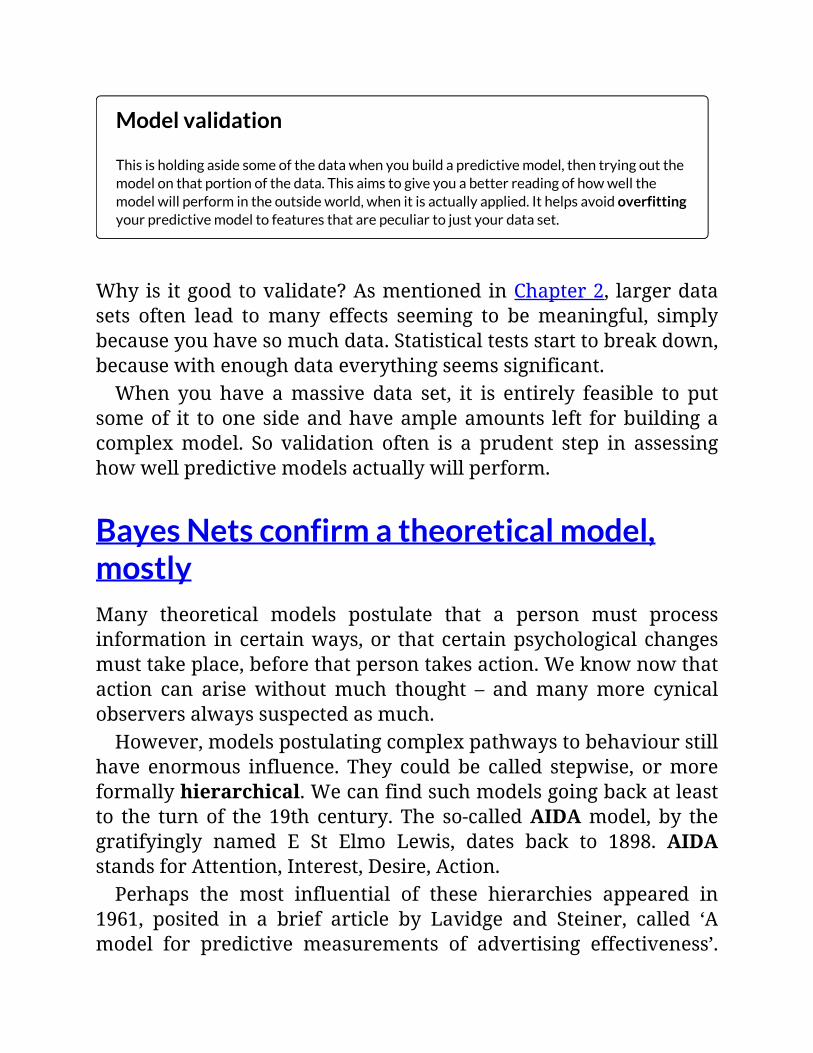
Modelvalidation
Thisisholdingasidesomeofthedatawhenyoubuildapredictivemodel,thentryingoutthemodelonthatportionofthedata.Thisaimstogiveyouabetterreadingofhowwellthemodelwillperformintheoutsideworld,whenitisactuallyapplied.Ithelpsavoidoverfittingyourpredictivemodeltofeaturesthatarepeculiartojustyourdataset.
Whyis itgoodtovalidate?AsmentionedinChapter2, largerdatasets often lead tomany effects seeming to bemeaningful, simplybecauseyouhavesomuchdata.Statisticaltestsstarttobreakdown,becausewithenoughdataeverythingseemssignificant.When you have amassive data set, it is entirely feasible to put
someof it toonesideandhaveampleamounts left forbuildingacomplexmodel. So validation often is a prudent step in assessinghowwellpredictivemodelsactuallywillperform.
BayesNetsconfirmatheoreticalmodel,mostlyMany theoretical models postulate that a person must processinformation incertainways,or thatcertainpsychological changesmusttakeplace,beforethatpersontakesaction.Weknownowthataction can arisewithoutmuch thought – andmanymore cynicalobserversalwayssuspectedasmuch.However,modelspostulatingcomplexpathwaystobehaviourstill
have enormous influence. They could be called stepwise, ormoreformallyhierarchical.Wecanfindsuchmodelsgoingbackatleastto the turnof the 19th century. The so-calledAIDAmodel, by thegratifyingly named E St Elmo Lewis, dates back to 1898. AIDAstandsforAttention,Interest,Desire,Action.Perhaps the most influential of these hierarchies appeared in
1961, posited in a brief article by Lavidge and Steiner, called ‘Amodel for predictive measurements of advertising effectiveness’.

They postulated six stages, building from awareness to purchase.The ideawas that you needed to pass through and complete onestagetomovetothenext–somethinglikeclimbingtherungsofaladder.TheirmodelappearsinFigure7.12.
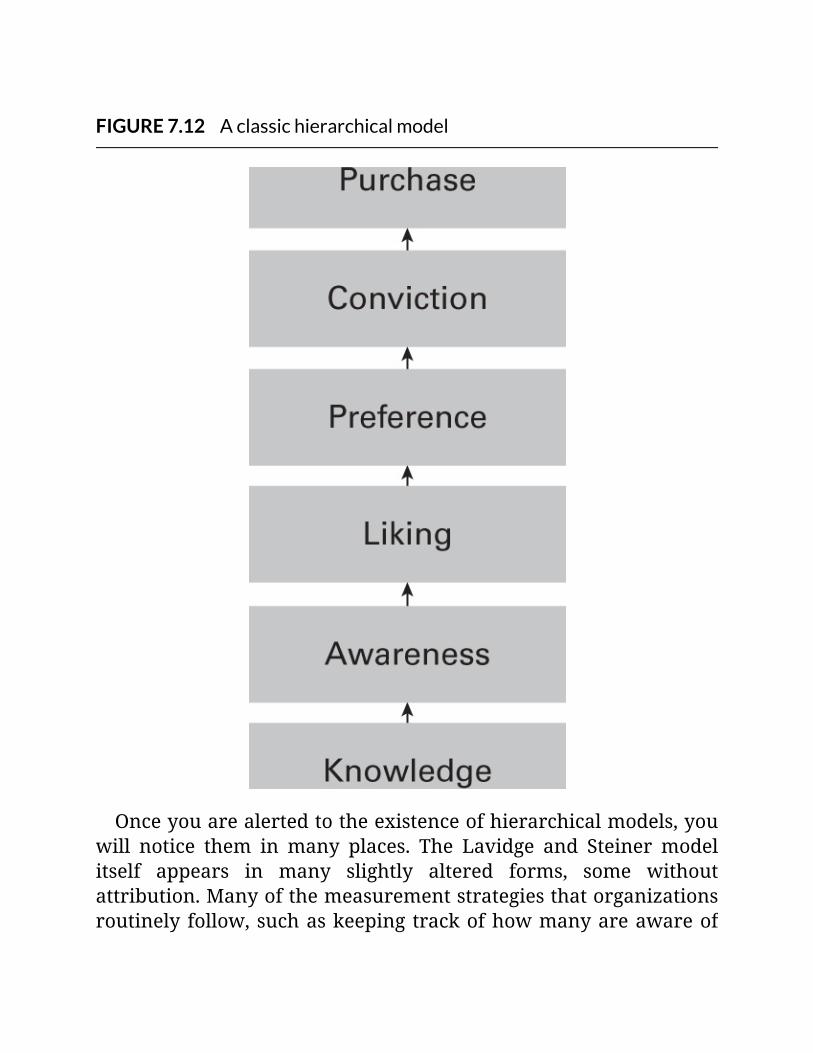
FIGURE7.12Aclassichierarchicalmodel
Onceyouarealertedtotheexistenceofhierarchicalmodels,youwill notice them in many places. The Lavidge and Steiner modelitself appears in many slightly altered forms, some withoutattribution.Manyofthemeasurementstrategiesthatorganizationsroutinely follow,suchaskeeping trackofhowmanyareawareof
theirproducts,reflectbeliefinahierarchicalmodel.Thesemodels also have had great importance due to analytical
limitations. Foryears, itwasalmost impossible to linkbehaviourswithquestionsaboutawareness,likingorpreference.Thisproblemarose because regression models expect linear relationships, andmany times therelationshipbetweenshareor salesandratings isnotlinear.WesawthisintheloyaltyscoreexampleinChapter6.
GoingthenextstepwithBayesNetsThemodelinFigure7.13isbasedonastudyofcommercialbrokersdone by a firm that provided services to them. The survey askedmanyquestionsabouthowwellthefirmperformed,andhowtheircustomersperceivedthemandfeltaboutthem.Theyalsoaskedforself-reported estimates of the study sponsor’s share of business.(This diagram is part of a much larger model with many othervariables.)
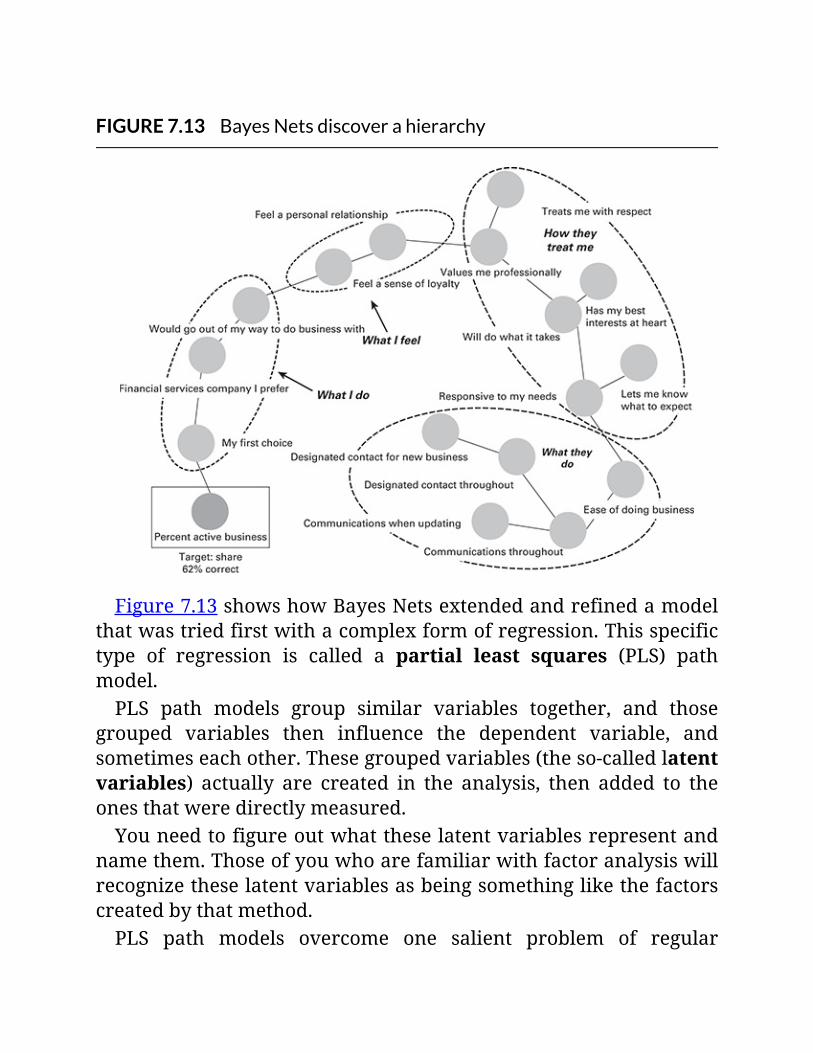
FIGURE7.13BayesNetsdiscoverahierarchy
Figure7.13showshowBayesNetsextendedandrefinedamodelthatwastriedfirstwithacomplexformofregression.Thisspecifictype of regression is called a partial least squares (PLS) pathmodel.PLS path models group similar variables together, and those
grouped variables then influence the dependent variable, andsometimeseachother.Thesegroupedvariables(theso-calledlatentvariables) actually are created in the analysis, then added to theonesthatweredirectlymeasured.Youneedtofigureoutwhattheselatentvariablesrepresentand
namethem.Thoseofyouwhoarefamiliarwithfactoranalysiswillrecognizetheselatentvariablesasbeingsomethinglikethefactorscreatedbythatmethod.PLS path models overcome one salient problem of regular
regressions, namely dealing with variables that are highlycorrelated. Regular regression cannot adequately handle highlycorrelated variables. Some of them will get squeezed out of themodel, and readings of the strengths of the others typically getdistorted.
Theunderlyingtheorybeingexplored
The PLS model was based on a theoretical hierarchical model. Itwasbuiltbyhand,slowlyandpainstakingly.Thismodelpostulatedthat the client’s actions were part of satisfaction, while thecustomer’sfeelingswerepartofrelationship.Together,theseweresupposedtopredictloyalty,whichinturnwouldpredictshare.Loyaltywasconceivedasaweightedaverageofthevariablesin
thetwogroups labelled inFigure7.13as ‘whatIfeel’and ‘whatIdo’.Theoriginalmodelfinallytriedtolinkloyaltytoshare.Whilethatmodeldidwellpredictingwhatwentintoitsviewofloyalty,itpredictedsharewithonly18percentaccuracy.This was a clearly unacceptable level, but it was the best that
couldbemanaged.RecallthatthePLSpathmodelwasconstructedin many steps and with many stops and starts. Elements wereadded and subtracted to theorized groups. Combinations thatproved to be impossible had to be scrapped and tried again, andagain.
LettingthedataspeakwithaBayesNet
BecauseofthepoorPLSpathmodelresults,aBayesNetwastriedasanalternative.Itwasallowedtolearnpatternsinthedata,andtheresultappearsinFigure7.13.Thenetworkshowsaclearhierarchy.However, this differsmarkedly from two chains of variables, onerelatedtosatisfactionandonerelatedtorelationship.TheBayesNetdeterminedpatternsinthedatawhereeffectsran
inadifferentsequence.This is thehierarchy thatappeared,goingfromactionstothetargetvariable(share):
Whattheydo(objectively)→Howtheytreatme→HowIfeel→WhatIdo→Share
TheBayesNet reached 62 per cent correct prediction,with cross-validation.Themodel seemsentirely sensible. It supportsparts ofthe postulated model. The various feelings proposed to make uployaltydo fall together,and they leaddirectly to share.Theothervariablessupportorexplainthisloyaltygroup.However, the reality otherwise differs from the initial theory.
Actionsdonotformagroupworkingseparatelyfromrelationshipto influence loyalty, and then share. Rather, how actions areviewedby customers informs or explains their feelings,which inturnexplainshowtheyact,which inexplainsshare.This iswhatthe diagram shows. The strong prediction of share by thismodelarguesthatthisisplausible.
Whatnext?Variables’importancesalsocomefromthisanalysis.Whilewewillskiptheentirecharthere,severaltypesofspecificactionsemergedas important in affecting feelings and shares. Among these wereseveral that appeared in Figure 7.13 and a few we did not haveroomtoshow.Theseincluded:
designatedcontactthroughout;communicationswhenupdating;designatedcontactfornewbusiness;voicemenusystem;dedicatedpersonforproblemresolution.
Knowing the importance of these items could possibly provideenough information to guide decisions. Ultimately, the clientdecidedtotestthespecificwaysthattheseareascouldbeimprovedusing theconjoint-basedserviceoptimization thatwediscussed inChapter5.
Hereweseeboththestrengthandtheweaknessofthisanalyticalmethodwhenusedwithsurvey-basedratingquestions.Themethodispowerfulenoughtogiveapreciserelationshipbetweenchangesin ratings and changes in share. However, the limitations ofstandard survey ratings make it difficult to move from knowingwhichchangesmustbemade toknowingpreciselyhowchangesmustbemade.
Whatisimportanttobuyersofchildren’sapparelAmajormanufacturerofchildren’sapparelranlargesemi-annualsurveys in which they measured reactions to their products andcompetitors’ offerings. They asked numerous questions related toawareness, shopping, use patterns, and ratings of the products inmanyareas, suchasvalue formoneyandappropriateness for thechild.Theyalsoaskedshopperstoestimatewhatpercentageoftheirspendingwenttoeachofmanybrands.Theyhadmanythousandsofanswersandwantedtolearnmore
aboutwhatspecificallydrovelevelsofpurchasing.Afterexploringafew alternative methods without much success, includingregression-basedmodels and classification trees, they tried BayesNets.Theresultswerehighlyinformative.
ThespecificsoftheanalysisChildren’sapparelisactuallynotasinglemarket.Basedontheageof the child, up to 13, expectations and needs vary sharply. Thismanufacturersawchildrenasfallingintotheseagegroups:
infants(ageuptotwo);toddlers(age2–4);earlyschoolage(age4–8);

pre-teens(age8–13).
Parentswithchildrenineachagecohortwereanalysedseparately.Therewere some 9,000 cases in total, or about 2,250 in each agegroup.Inall,some46variablesweremeasuredandanalysed.Youcan see the importances of these as determined by Bayes Nets,disguised in Figure 7.14. (This disguising is a necessary evil usingrealdata.)
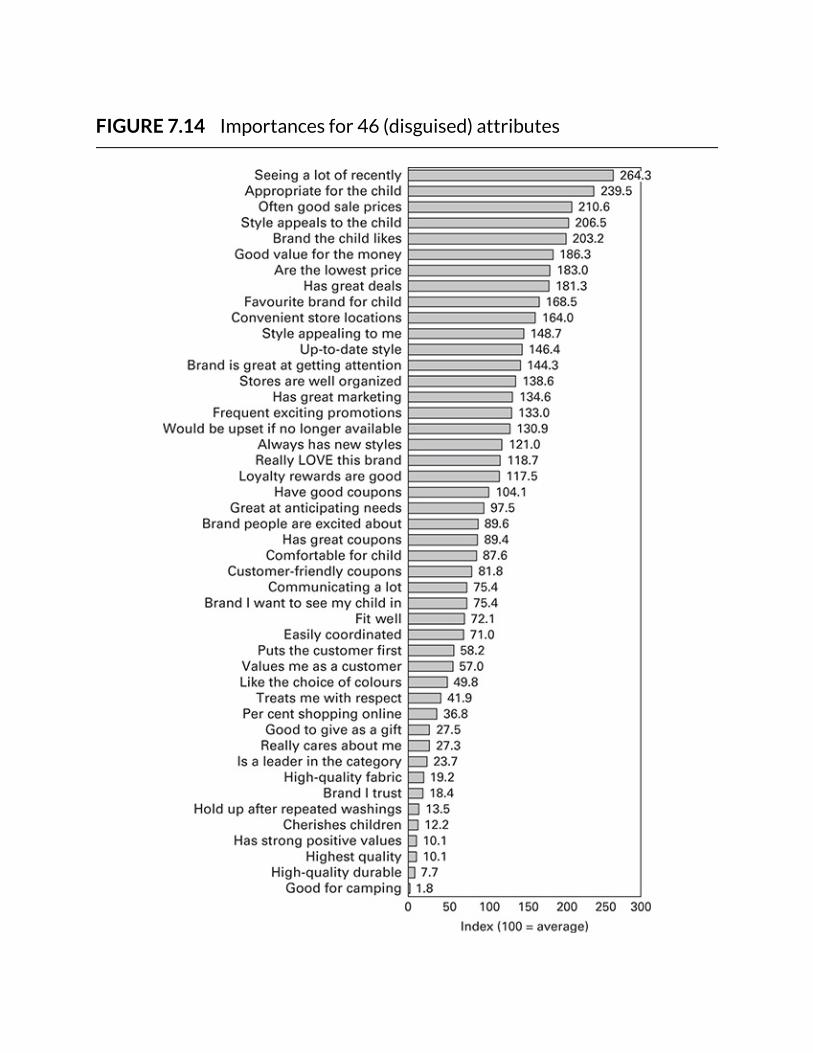
FIGURE7.14Importancesfor46(disguised)attributes
Strongdifferencesemerged,mostmarkedlyintheimportanceofthevariableabrandItrust.Thishasexceptionallylowimportanceforparentsofinfants.Thisperhapsshouldbeexpected,asformanyparentsatthattimeallbrandsarenew.Importancerosetoaboutaverageamongthenextagecohort,the
toddlers,thenskyrocketedforchildrenaged4–8.Forthatgroup,itactually is one of the three most important attributes out of theentirelonglist.However, for the pre-teens, the importance of brand I trust
plummeted toavery low level,as lowas for infants.Thisposedaseemingmystery,butsoonpatternsinotherratingsexplainedwhathadhappened.Figure 7.15 shows the pattern in ratings forbrand I trust. The
otherchart in this figureoffersanexplanationofwhathappened.Threerelatedconcernsbecomehighlyimportantamongparentsofpre-teens: a style appealing to me, a brand or style the childlikes,andclothingappropriateforachildthisage.
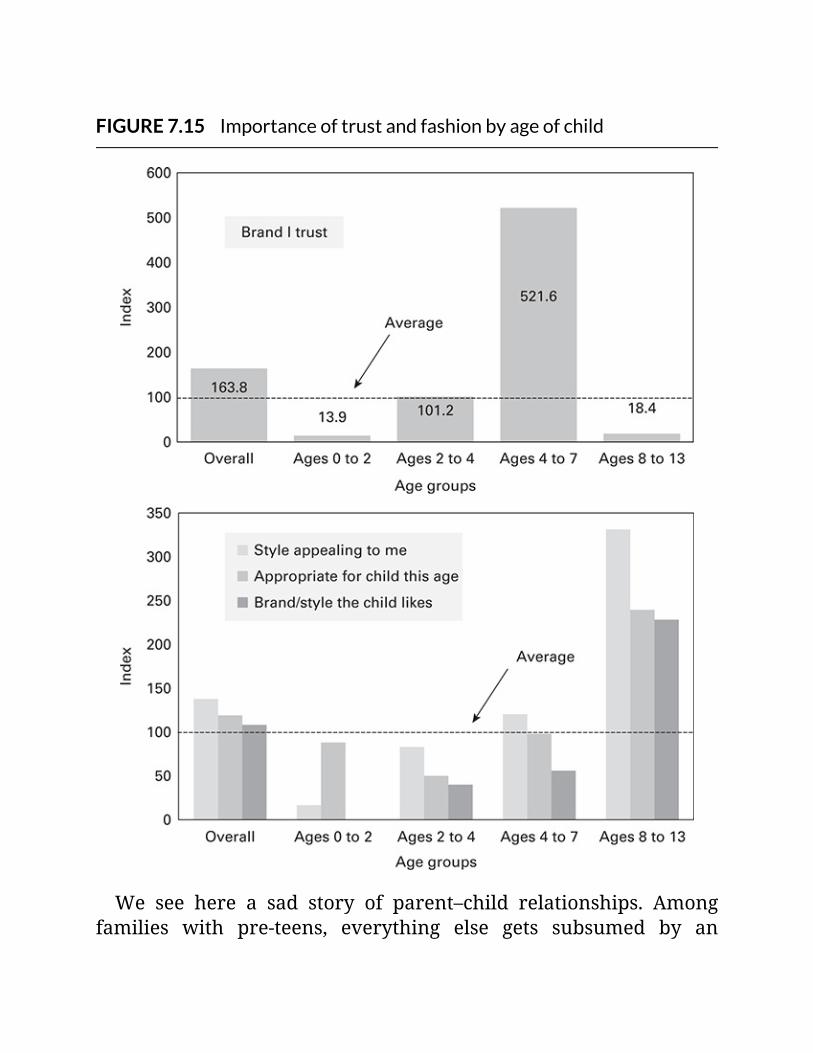
FIGURE7.15Importanceoftrustandfashionbyageofchild
We see here a sad story of parent–child relationships. Amongfamilies with pre-teens, everything else gets subsumed by an
argument over the question of, ‘You are thinking of going outwearingWHAT?’Hereisacriticallearningforcreatingmessagesaboutthebenefits
of thismanufacturer’s fine products. By allmeans, for parents ofearly-school children, stress how this is a brand that families cantrust. For pre-teens, stress how parents will find the clothingacceptable(allright,notheart-stopping)andtheirchildrenwillnotsimplysay,‘Ican’teven?’(thislastlocutionwascurrentfor‘noway’when the bookwent to press, but by the time you read this,whoknows?).The manufacturer did this analysis after a segmentation study,
and so was particularly interested in what was important inaffecting share of wallet for their target segment, called SavvySylvia.Thiscompany’smanagementreallybelievedinthevalidityofthesegmentsfound,andthetargetsegmentwasaloadstonefortheirefforts.Forthehard-workinganalystinvolved,itwasstrangebut gratifying to hear the whole company asking ‘What wouldSylviado?’
RunningyourownBayesNetsSoftware unfortunately is a confusing terrain, evenmore so thanfor classification trees. Some programs are free, although theyfollowthegeneralrulethatfreesoftwareishardertouseandmorelimitedinwhatitcandothanprogramsyoubuy.Youcanspendagreat, great amounton someBayesianNetwork software.But youmay not have to, because there are some very powerful choicesamongthemorereasonablypricedoptions.Aswithanysoftware,it isbesttostartwithacuratedlistonline
(that is, a list with a person’s name attached). Then try as manyprogramsasseemreasonablylikelycontenders.BecauseBayesNetsoperate differently from other methods, even if you use regularstatisticalsoftware,therewillbeatleastsomelearning.Ultimately,onlyyouknowwhatwillworkbestforyourneeds.
SummaryandconclusionsBayesNetsorBayesianNetworksarearemarkablesetofmethodswithstrongpredictivepowers.Aswesawinthefirstexample,theycansailwithaplombthroughproblemsthatareextremelydifficultwith traditionalstatistics–andthatcompletelybafflenearlyallofus.They typicallydobetter thanmore traditionalmethods, suchas
regressions,inseveralareas.Inparticular,theyexcelingettinganaccuratefixonvariables’importances,whileincludingallvariablesofinterestinapredictivemodel.Networkstakeintoaccountalltheinterrelationsofallvariableswhenestimatingimportances,unlikeregressions, which assume that when one variable is changed allothersremainconstant.Like classification trees, Bayes Nets give us insight into how
variablesinteract,buttheunderstandinginBayesNetsextendstoaholistic view of the ways in which all variables in a model fittogether. Classification trees’ view of interactions is situational,thatis,anyvariablebeyondthefirstoneinthemodelwillhaveaneffectonly if the other variables have specific values. BayesNetsmodelsseepatternsacrossallvaluesinallvariables.BayesNetsalsoaremorecomprehensivethanclassificationtrees,
in that trees tend to produce simple models with relatively fewpredictors.YoucanenteragreatmanyvariablesintoaBayesNetsmodel,anditwill includeandevaluateallof them.Evenwiththiscomprehensive view,BayesNets runquickly, just as classificationtreesdo.
New,differentandworthgettingtoknowBayesNetsarenewermethodsthatuseanalyticalapproachesquitedifferentfrommoretraditionalmethods.Theycansolveproblemseasily that may entirely elude other analytical procedures.However, they require some new terminology and their
unfamiliaritymaymakesomeaudienceslesswillingtoacceptthem.Bayesian Networks definitely are machine learning methods.
They fall under the heading of graphical analytical methods.Diagrams are key to understanding theirworkings. You can get agreatdealoutofnetworks–suchasvariables’relativeimportancesandeffects –without ever lookingat thenetwork itself.However,thosewiththepatiencetoexaminethestructureofthenetworkwilldevelop a fuller understanding of whether the outcome makessense.BayesNetsdonotinvolveequations(asregressionsdo)orsetsof
if-then rules (as classification trees do). At times, you mightencounter someone who needs to see equations, and for thatperson,networksmightnotprovideasatisfyinganswer.Tosee theeffectsofchangingmore thanonevariableata time,
you need to go back to the network diagram itself, in thoseprogramsthatdynamicallyallowyouto interactwiththenetworkdiagram.Somesoftwareprogramsallowyou to constructa stand-alone simulator. These simulators are similar to the ones thatweencounteredfordiscretechoicemodellingandconjointanalysis inChapters4and5.Inanetwork,evenwitha singlevariablebeingchanged,effects
can vary depending on the values of the target variable and thepredictorvariable.Effectsfromchangingseveralvariablesatoncerequirestakingmanyfactorsintoaccountandcertainlyarenothingwecouldsee intuitively–even though thenetworkwillhandleasmanychangesasyouwantwithaplomb.Wehavecoverednewmaterialandnewconceptsinthischapter.
Using Bayes Nets requires still more in terms of hands-onexperience and learning about the details of the software youchoose.Theyalmostalwaysmerittheeffort.Still, likeanymethod,BayesNetsarenotguaranteedtodevelopusefuloutputeverytime.At times, the questions being analysed themselves limit how
much you can extract from the analysis. For instance, in the
examplewiththebrokerage,themostimportantvariablesaffectingshareemergedclearly.However, theratingsanalysedwerebroad.They showedwhat needed to change, but not how to make thechanges. For that, another approach was needed, namely, theconjoint-basedserviceoptimizationdiscussedinChapter5.Overall, Bayes Nets are among the most powerful of analytical
methods, typically producing very strong predictive models thatoften can address your informational and strategic needs. Anylearningthattheyrequiredefinitelywillbemorethanrepaid.

BonusChapter2:Artificialintelligence,ensemblesandneuralnets
Thisbonusonlinechapterexplainsthepromiseandpitfallsoftheonemethodmostcloselyassociatedwithartificialintelligence:neuralnetworks.Wediscussthepracticalapplicationsandlimitationsofthisapproach,includinghowitperformedversusothermethodswithactualdata.Wehelpyounavigatethroughthemorassofterminology,hypeandconflictingclaimsaboutthisevolvingfield.Thechapteralsoreviewsensembles,includingonemethodwithstrongpredictiveperformanceandaninterestingname:decorate.Finally,itreviewssomeofthemorebasicquestionsraisedbythequestforincreasinglyautonomousmachines.
Accessthisbonuschapteronlinehere:
www.koganpage.com/AI-Marketing
08PuttingittogetherWhattousewhen
Ifwetakeabroaddefinitionofartificialintelligence,thenweseethat it actually has been working alongside us for many years.Thosewho did not skip directly to this chaptermay have noticedthis.Thisalsoassumesthatthistopichasnotbecometotallyblurredforreaderswhohavegotthisfar(andthankyouforpersevering).AllthewaybackinthePreface,wementionedwhatsomepeople
working at the epicentre of artificial intelligence, Alphabet(formerlyGoogle),hadtosaywhenaskedtodefinethisterm.Asarefresher,herearesomeanswers:
‘Iwoulddefinitelyinterviewsomeoneelse.’
‘I’mnotsure.Ihaven’tdoneanythingwithAI.’
‘Idon’tknowanythingaboutit.’
‘It’smachinelearning.’
‘IworkatYahoo…’
InChapter1,wehazardedadefinitionofartificial intelligence.Soyou do not have to page back, here it is again. Broadly,artificialintelligence means anything a machine does to respond to itsenvironment tomaximize its chancesof success. Sincewearenotdiscussing cars that drive themselves ormachines that otherwiseamble around in the outside world, the environment of ourmachines, computers, is data. We set their goal as detectingcomplex relationships we cannot, to aid in our making betterdecisions.
Wecanfindthistypeofartificialintelligenceinmanyplaces.Forinstance, we encounter this in theway the computer takesmanyalternativeviewsofaproblem,asinensemblessuchasboosting,random forests or decorate. We see it in the way that thecomputer learns from thousandsofpasses through thedata, as inthe hierarchical Bayesian analysis that we use to extend thepower of discrete choice modelling, conjoint analysis andmaximumdifferencescaling.Inadifferentway,wefindcomputer learning insolutions that
completely escape us, as in Bayes Nets and how they useconditional probabilities. This method finds underlyingrelationshipsandsolvesproblemsthatentirelybaffleus.Oneoftheearliestapplicationsofartificialintelligenceisfoundin
thehighlysophisticatedtestingdonebyclassificationtrees.Oneofthemostcurrent,andmostrapidlyexpanding,applicationsisinthecomplexlearningdonebyneuralnetworks.
ThetasksthemethodsdoOur discussion has been organized by method. We explained aparticularapproach,thenexplainedwhatitcouldaccomplish.Thischaptertakesanalternativeview,startingwiththetypeofproblem,thenreviewingthemethodsthatcanaddressit.
First,whatoldermethodscandoWeexplained onemore traditionalmethod,Q-Sort/Case 5,whichcangiveyouaclearhierarchyofimportancesforlonglistsofitems.We included this approach because it nicely complementsMaximumDifference Scaling (MaxDiff), which getsmuch of itspowerfromthemachinelearningmethod,HierarchicalBayesiananalysis.Many other long-established methods solve key problems. For
instance,clusteringneatlyhandlestheproblemoffindinggroupsin data.Discriminant analysis can determine differences amonggroups. It also can assign new people into groups. Clustering hasbeenappliedsinceatleastthe1950s,discriminantanalysissincethe1930s.Newer,high-techalternativestothesemethodsexist,butwedidnothavethespacetodiscussthem.Several other methods use advanced concepts and plenty of
calculationsbutdonotinvolvemachinelearning.Amongthese,wefindmappingmethodssuchascorrespondenceanalysis,MD-PREFand bi-plots. They serve the important function of visuallyrevealing relationships among groups or among brands.Comparisonsofmanygroupswouldbeaddressedbymanymethodsin theanalysisofvariance(ANOVA) family.Someof thesereachhair-raisinglevelsofcomplexity.A complete tool-kit for solvingproblemsandaddressing tactical
andstrategicissuesthereforeneedstoincludeamixofthecutting-edgeandtheold.Nowlet’sgoontowhatcanbeaccomplishedwiththenewermethodswehavebeendiscussing.
FindingandcharacterizinggroupsChapter 6 showed how classification trees greatly boosted theoddsof finding a group. Thismethodnot only locates groups, butcharacterizes them. It also can determine what characterizesdifferentlevelsofconsumptionorspending.Classification treesprovidesimple if-thenrules thatareeasy to
programintoadatabase.Usingthese,newpeople(outsidethedatasetbeingexamined)canbeassignedtogroupsorassigneddifferentprobabilities of acting. The gains analysis (or lift or leverageanalysis) provides a straightforward roadmap to locating bestprospects.Classification trees can be supplemented with random forests.
Thisensemblemethod,alsodiscussedinChapter6,runshundredsoftrees,randomlyswappingpredictorsandcases(people)intoand
out of each run. Based on these hundreds of trees, it developsimportancesforeachvariable.Unfortunately,likeallensembles,itsworkingsareopaque.IntheexampleinChapter6,weusedrandomforeststozeroin
on a list of definitely important predictors. We then used thosepredictors to construct a single classification tree that could bestudied,evaluatedandapplied.Boosting also can extend insights from classification trees. In
Chapter6weshowedhowaboostingmethod,AdaBoost.MI,addedtoamodeldevelopedusingclassificationtrees.Thismodelshowedwhich psoriasis patients were most at risk of severe depression.Boosting highlighted two values of one predictor that warrantedparticularattention.
FindingwhatismostvaluableinalistofitemsDetermining what is most valuable in a list of items has manyapplications. For instance, it can help you decide which of manypossibleincentives(or,astheyarecalled,‘freegifts’)havethemostappeal.Thisalsocanhelpprioritizecorporatemessageelementsorclaims.The first online bonus chapter (available at
www.koganpage.com/AI-Marketing) shows how MaximumDifference Scaling (MaxDiff) and Q-Sort/Case 5 provide asubstantiallyclearerpictureofimportancesorlevelsofappealthandirect scaled ratings. Both methods provide ratio-level readings.Youcansay,forinstance, ‘FreegiftNistwiceasappealingasFreeGiftT’.The power of MaxDiff is greatly enhanced by Hierarchical
Bayesian analysis. Thanks to this machine learning method,MaxDiffcanprovideindividual-leveldata.TheQ-Sortmethodrelieson an older form of analysis, and provides importances only forgroups.While theQ-Sort method is lower tech, it can prioritize many
more items. In practice, MaxDiff starts to become overlyburdensome for people participating in a survey with about 35items. Q-Sort/Case 5 results have been reported with up to 100items.
Determiningtheeffectsofvariables(aka‘drivers’)Bayes Nets remain one of the best methods for determining theeffectsofvariablesonanoutcome,suchasshareor intent tobuy.They work remarkably well with non-experimental data, such asquestionnairequestions,demographicsandothercharacteristics.They have many features that make them a superior method.
Among these, BayesNetsmeasure effects taking all variables intoaccount.Thisdiffersentirelyfrommethodsintheregressionfamily.There,measuringtheeffectsofchanginganyvariablemustassumethatallothervariablesremainconstant.(Thatrarelyhappensintherealworld.Wetypicallyfindawebofinterconnectedrelationshipsandeffects.)Bayes Nets also look at the whole pattern of scores in all
variables. A regression-related model is based on correlations. Acorrelation is a simple one-number summary of how well twovariables fall into a straight line. Bayes Nets also take a morecomprehensive view than classification trees. Trees describespecific situations, as in ‘variable Thas this effect IF (andonly if)variableRhasthisvalue’.Bayes Nets also provide ratio-level importances, as do MaxDiff
andQ-Sort/Case5.However,BayesNetsgobeyond thesemethods,alsoprovidingtheabsolutestrengthsofeffects.Networkswillshowthe precise amount of influence over each range of the predictorvariableandthetargetvariable.Itcanrevealeffectsthatareeitherstraight-lineorthatchangeinnon-linearways.As we showed in Chapter 7, Bayes Nets allow you to see the
patternsofconnectionsamongvariables.Youthencanchecktheseto see if theymake sense.You shouldacceptananalysisonly if it
providesareasonable-lookingnetworkdiagram.Thisalmostalwayshappens.Random forests and boosting also return variables’
importances. However, Bayes Nets usually have higher predictiveaccuracy, and they take amore comprehensive view of the data.Therefore, they typically are a better choice for determiningvariables’ importances. In those few instances where theperformance of a Bayes Net is indifferent, you could check theseothermethodsasanalternativewaytofindimportances.
Optimizingcomplexmessages,advertisementsorsingleproductsConjoint analysis has worked well in applications like these.Conjointanalysis, inparticularthetraditionalfull-profilemethod,hastheadvantageofaskingforanevaluationofawholeproductormessage.Thisensuresthatelementsorfeaturesareevaluatedinarealisticcontext.However, ifyouwanttodeterminehowproductswould fare in a competitive environment, discrete choicemodelling is a superior method. Chapters 4 and 5 explain thereasons.Experimental designs underlie conjoint analyses. These ensure
thatthereisnorelationshipinthewayfeatures(orattributes)varyfromoneevaluatedproductdescription(orprofile)toanother.Thiscompletelackofrelationshipinthewayprofilesvaryensuresthateffects arising from changing any attribute are measured purelyandprecisely.Conjointanalysisisanestablishedmethod,goingbackatleastto
the1970sinanolderform.Itcanbeextendedconsiderablybytheuseof themachine learningmethod,HierarchicalBayesian (HB)analysis. Complex products and serviceswithmany features andmanyvariationsof those featuresnowcanbe investigated.BeforeHBanalysis,thiswasnotpossible.
Conjoint analysis leads to market simulator programs. Theyshow the effects of changing features in any of hundreds orthousandsofwaysandreturnresultsinrealtime.Theseareeasytouseand can rununderpopularprograms suchasMicrosoftExcelandMicrosoftPowerPoint.
DeterminingresponsestoalternativenewproductsinacompetitivemarketplaceDiscrete choice modelling remains the best method fordetermining the effects of varying a product, introducing a newproduct,and/oreliminatingproductsinacompetitivemarketplace.Like conjoint analysis, discrete choice modelling uses designedexperiments.Anyeffectsfromvaryingthefeaturesofaproductorservicearemeasuredprecisely.Also like conjoint analysis, discrete choice modelling gains
considerablepowerfromtheuseofHBanalysis.WithHBanalysis,you can measure effects in complex situations where manyproductsorserviceschangeinmanyways.Discretechoicemodellinggoesbeyondconjointintakingawhole-
marketplace perspective. Consumers participating in a well-designed discrete choice study see the main choices they wouldhaveintheactualmarket.Theydowhattheywoulddoinreallife–makeadecision.Thismethodhasthemostrealismofanymethodforforecasting
whatwillhappeninachangingmarketplace–assumingitissetupwell.Unfortunately,though,therearefartoomanypoorlythoughtout andpoorly designed studies. It is important to set the contextfor the decisionwith reasonable accuracy. Recent research showshowmuchconsumersrelyonthiscontextwhenmakingdecisions.Italsoiscritical tothinkofallreasonablecontingencies.Youneedto consider both how your fine product might change and whatcompetitorsmightbedoingatthesametime,orinresponsetoyouractions.
You also need to build in adjustments to go from the share ofpreference found in simulations, to estimatemarket share.Mostcommonly, you need to adjust for how aware consumers are ofeachproductandhowwidelyeachisdistributed.Ifyousucceedwithall thehard thinking involved, thesestudies
can have remarkable predictive power. Market simulators andmarket simulations can do exceptionally well at forecastingwhatconsumerswillchooseinarealandchangingmarketplace.
FindingcomplexrelationshipsandstructuresindataBayesNetsandclassificationtreescomeclosesttotheelusivegoalofmachine learning spontaneously showing ‘patterns’ in thedata.Bayes Nets take a holistic view, looking at how all variables fittogether into a network of relationships and effects. Classificationtreesrevealinteractionsmoreclearlythananyothermethod.An interaction occurs when two or more variables together
produce an effect that we would not expect from the individualvariables. In our example in Chapter 6, for instance,we saw thatfamilieswithfiveormorechildrenwholivedinthesuburbsboughtmore cardboard-like cereal than either families of that size or allsuburbanites.Both characteristicsworked together to lead tohighlevelsofpurchasing.BayesNetsincludeallthevariablesthatyouareexamining.They
allconnectintoanetwork.Youwillgetstrengthsofrelationshipstothe targetvariableandconnections forall of them.Classificationtrees are sparser. In our cruise line example in Chapter 6, forinstance, only 10 variables clearly differentiated levels ofpurchasingamongover340,000peopleinadatabase.Bothmethodsrevealstructuresthatwecouldnototherwiseunderstand.
NowaboutneuralnetworksNeural networks are being touted as the future of artificial
intelligence.Andwithswathsofdataandampletraining,theyhavedoneremarkablethings.Forall theirpromisedstrengthinfindingpatterns, though, they remain largely mute about what they aredoing.InBonusOnlineChapter2(availableatwww.koganpage.com/AI-
Marketing)weuseneuralnetworkstotrytopredictshare.Asyouwill see, the diagram that the network provided was basicallyunintelligible,aswerethereportedvariablestrengthsinthehiddenlayers.Italsodidpoorlyatprediction,substantiallyworsethantheother
methods we discuss. Even with 1,800 cases and 70 variables, wemightnothavehadenoughdatafortheneuralnetworktofunctionwell.Wealsosawproblemswithoverfittingofthemodeltothedata,
traditionally aweak spotwith thismethod.New implementationsarebeingdevelopedall the time,and so someof these limitationsmay well be overcome. For now, these networks would not be afirstchoiceinmanycases.Ifyouhavealotofdata,andcandoalotoftraining,youmightwanttotrythem.
ThinkingaboutthinkingWantingcomputerstodomoreoftheheavyliftinghasbeenalong-heldwish. Itgoesfarback,at least to theearliestdaysofmachinelearning.Around1959,anarticleaboutteachingcomputerstoplaychequershopedforthehappydaywhenwewouldnotneedtodosomuch programming of every step. More work for the computer,ratherthanus,remainsagoal.Butwhatdoyouwantthemachinetodo?In an old joke, a computer salesperson tells an executive that a
newcomputerwill cuthisworkby 50per cent. ‘In that case’, theexecutiveanswers,‘Iwilltaketwo.’Thismaynotbethefunniestthingyouhaveread,eveninthelast
half-hour,butitunderscoresanimportantquestion.Wheredoyouwant to be in control, andwhere do you cede this control to thecomputers, and/or the friendly vendors running them? We raisethis issue at the end of Bonus Online Chapter 2, and it is worthtalkingaboutagainhere.Many of the newer methods, like ensembles, are basically
incomprehensible. Neural networks epitomize the class ofmethods that we cannot fully understand. They are doingsomething,butpreciselywhatremainsentirely,ornearlyentirely,outofsight.Youmayrecallthecoefficientsfromtheneuralnetworkthatwe
show in TableA2.2. In noway could those be squaredwithwhatseemed sensible. The coefficients’ sizes looked wrong and theirsigns–positiveornegative–seemedbackwardabouthalfthetime.Howwouldyouknowthatthisdoesnotreflectabasicmistake?You could argue that the proof is in the doing. But then, this
networkdidnotdo thatwell. Itpredictedpoorly. Italsoshowedasalientproblemwithoverfitting ofdata–modelling features thatwerepeculiar to thatonedataset,but thatwouldnotbe found intheoutsideworld.Also,whatdoyoudowhenyoucannotpreciselyjudgehowwella
system is doing? It is easy to tell if a self-driving car is not doingwell,forinstance.Itcrashes.Butwhathappensifyouarerunningasystemthatsupposedlylearnsfromthedata,anditdoesamiddlingjob– just likemanyanalyseswhendealingwithmessy,real-worldsituations?Howwouldyoucheck,forinstance,ontheperformanceofanautomatedrecommendationsystem?Wemaywellbecomingtothetimewhenwesetcomputersloose
on data, and they learn by themselves. Theymight even find outonce and for all if there is a connection between the sales ofdisposable diapers and beer. (If this reference is hazy, wementioned inChapter2whatamounted toanurban legendaboutsomebody serendipitously finding such a relationship, just by

havingalotofdata.)Butnoamountofdiggingthroughtransactionswill think up a new strategy for you to follow. Even the mostexquisiteanalysisofhistoricaldatacannotgiveyouasingleideaforanewproductorservice.Youstillneedtoputintheeffortanddothehardthinking.Computers, and machine learning methods in particular, have
beenworkingwithustosolveproblemsformanyyears.Theyhaveprovided admirable assistance, zeroing in on predictiverelationships that we could never have found without them. Youmayhavenotedanobviousauthorialbiasinfavourofmethodsthatkeep the details out in the open, where you can test the modelagainst your experience and acumen. These seem to be theunquestionablygoodusesofmachinelearning.Howmuchyouwant to trust thecomputer togooffon itsown,
and even learn in ways that you can barely understand, isbecoming an increasingly important decision. Recall that we still(theoretically) have an edge in common sense. Then you need tochoose.

BIBLIOGRAPHY
PrefaceCuppy,W(1931)HowtoTellYourFriendsfromtheApes,HoraceLiveright,NewYorkGhosh,P(2016)[accessed15August2016]MachineLearningoftheNextDecade:The
PromisesandthePitfalls[Online]http://wwwdataversitynet/machine-learning-next-decade-promises-pitfalls(anarticleidentifyingregressionandclusteringasadvancedmachine-learningmethods)
Kantrowitz,A(2016)[accessed15August2016]CanAnyoneinThisGroupofAdvancedProgrammersExplaintheTechWorld’sHottestTrend?[Online]https://www.buzzfeed.com/alexkantrowitz/finding-the-meaning-of-artificial-intelligence-at-google-io?utm_term=hr8N7KRmY#obKALmWxk(23/5/2016)
QuoteattributedtoEdwarddeBono[accessed15August2016]EdwarddeBonoQuotes,101Sharequotes2016[Online]http://101sharequotes.com/quote/edward_de_bono-an-expert-is-someone-who-has-suc-80976
QuoteattributedtoNielsBohrbyEdwardTeller(1954),inDrEdwardTeller’sMagnificentObsession,byRCoughlan,LIFEMagazine,6September1954,p62

Chapter1Armstrong,JS,ed(2001)PrinciplesofForecasting,Kluwer,Norwell,MABagozzi,R(1994)AdvancedMethodsofMarketingResearch,BlackwellPublishers,
CambridgeMAChakrapani,C,ed(2002)MarketingResearch:State-of-the-artperspectives,Southwest
EducationalPublishing,Mason,OHDull,T(2015)[accessed15August2016]DataLakevsDataWarehouse:ABigDataCheat
Sheet:WhatMarketersWanttoKnow(Part4)[Online]http://www.kdnuggets.com/2015/09/data-lake-vs-data-warehouse-key-differenceshtml
Foreman,JW(2014)DataSmart:Usingdatasciencetotransforminformationintoinsight,Wiley,Indianapolis,IN
Gelman,A,etal(2013)BayesianDataAnalysis,3rdedn,Chapman&Hall/CRCTextsinStatisticalScience,BocaRaton,FL
Green,PEandCarroll,J(1978)AnalyzingMultivariateData,DrydenPress,Hinsdale,ILGrigsby,M(2015)MarketingAnalytics,KoganPage,LondonIhaka,RandGentleman,R(1996)R:alanguagefordataanalysisandgraphics,Journalof
ComputationalandGraphicalStatistics,5(3),pp299–314Inmon,B(1992)BuildingtheDataWarehouse,Wiley,Somerset,NJKimball,RandRoss,M
(2013)TheDataWarehouseToolkit,3rdedn,Wiley,Somerset,NJKugler,T,etal(2008)DecisionModelingandBehaviorinComplexandUncertain
Environments,Springer,NewYorkMayer-Schönberger,VandCukier,K(2013)BigData:Arevolutionthatwilltransformhowwelive,work,andthink,JohnMurray,London(abookthatsaysmoredataisalwaysbetter)McCullagh,P(2002)Whatisastatisticalmodel?AnnalsofStatistics,30(5),pp1225–310
Nisbet,R,Elder,JandMiner,G(2009)HandbookofStatisticalAnalysisandDataMiningApplications,AcademicPress,Boston,MAOram,A(1998)[accessed15August2016]TheLandMinesofDataMining[Online]http://www.praxagora.com/andyo/ar/privacy_mineshtml
Provost,FandFawcett,T(2013)DataScienceforBusiness:Whatyouneed.toknowaboutdatamininganddata-analyticthinking,O’ReillyMedia,Sebastopol,CARainer,RK(2012)IntroductiontoInformationSystems:Enablingandtransformingbusiness,4thedn,Wiley,Somerset,NJ
Russo,EandSchoemaker,P(2002)WinningDecisions,Doubleday,NewYork(abookonmakingdecisionsthatbarelymentionsdata)Sapsford,RandJupp,V(2006)DataCollectionandAnalysis,Sage,NewYork
Silver,N(2012)TheSignalandtheNoise:Whysomanypredictionsfail–butsomedon’t,Penguin,NY
Stoll,Clifford(2006)quote,inKeeler,M,NothingtoHide:Privacyinthe21stcentury,iUniverse:Lincoln,NE
Struhl,S(2008)[accessed15August2016]DataMiningComesofAge:OvercomingtheMythsandMisconceptions[online]http://www.hospitalitynet.org/news/4036261.xhtml
Sztandera,L(2014)ComputationalIntelligenceinBusinessAnalytics:Concepts,methods,andtoolsforbigdataapplications,Pearson,UpperSaddleRiver,NJ

Vriens,M(2012)TheInsightsAdvantage:Knowinghowtowin,iUniverse,Bloomington,IN(abookondecisionmakingthatbarelymentionsdata)Winer,RandNeslin,SA(2014)TheHistoryofMarketingScience,WorldScientificPublishingCo,Singapore
Witten,I,Frank,EandHall,A(2011)DataMining,3rdedn,MorganKaufmann,Burlington,MA
Woods,Dan(2011)[accessed15August2016]BigDataRequiresaBigArchitecture,Forbes[Online]http://www.forbes.com/sites/ciocentral/2011/07/21/big-data-requires-a-big-new-architecture/#1c5ed8bf1d75

Chapter2Armstrong,JSandCollopy,F(1992)Errormeasuresforgeneralizingaboutforecasting
methods:empiricalcomparisons,InternationalJournalofForecasting,8(1)pp69–80Barton,SJ(2010)StrategicManagementSimplified:Whateverymanagerneedstoknow
aboutstrategyandhowtomanageit,iUniversePress,Bloomington,Indiana(storyaboutapparelmanufacturerLevi’s)Box,GEPandDraper,NR(1987)EmpiricalModelBuildingandResponseSurfaces,JohnWiley&Sons,NewYorkCohen,J(1988)StatisticalPowerAnalysisfortheBehavioralSciences,2ndedn,ErlbaumPublishers,Mahwah,NJ
DeTurck,D[accessed15August2016]CaseStudy1:The1936LiteraryDigestPoll[Online]https://www.math.upenn.edu/~deturck/m170/wk4/lecture/case1.xhtml
Dziak,JJetal(2012)SensitivityandSpecificityofInformationCriteria[Online]https://methodology.psu.edu/media/techreports/12-119.pdf
Floridi,L(2010)Information–AVeryShortIntroduction,OxfordUniversityPress,OxfordJessen,RJ(1978)StatisticalSurveyTechniques,Wiley,Edison,NJKish,L(1995)SurveySampling,Wiley,Edison,NJMarcus,AHandElias,W(1999)Someusefulstatisticalmethodsformodelvalidation,
EnvironmentalHealthPerspectives,106(Supplement6),pp1541–50McCullagh,P(2002)Whatisastatisticalmodel?AnnalsofStatistics,30(5),pp1225–310Sapsford,RandJupp,V(2006)DataCollectionandAnalysis,Sage,NewYorkSnedecor,GandCochran,W(1989)StatisticalMethods,8thedn,IowaStateUniversity
Press,Ames,IowaSpanos,S(2011)Statisticalmodelspecificationandvalidation:statisticalvssubstantiveinformation[Online]http://faculty.chicagobooth.edu/midwest.econometrics/papers/megspanos.pdf
Stevens,JP,Pituch,KandWhittaker,T(1999)IntermediateStatistics:Amodernapproach,3rdedn,LawrenceErlbaum,Mahwah,NJ
Thurstone,LL(1935)VectorsoftheMind,UniversityofChicagoPress,Chicago,ILWilkinson,L,Blank,GandGruber,C(1995)DesktopDataAnalysiswithSystat,SPSS,Inc.,
Chicago,IL
Chapter3Note: references for discrete choice modelling, conjoint, MaxDiffand Q-Sort/Case 5 are found in the chapters focusing on eachmethod.
HierarchicalBayesiananalysisAllenby,G,Rossi,PandMcCulloch,RE(2005)HierarchicalBayesmodel:apractitioner’s
guide,JournalofBayesianApplicationsinMarketing,pp1–4[Online]http://ssrn.com/abstract=655541
Box,GandTiao,G(1965)MultiparameterproblemsfromaBayesianpointofview,Ann.MathematicalStatistics,36(5),pp1468–82
Gelman,A,Carlin,J,Stern,HandRubin,D(2004)BayesianDataAnalysis,2ndedn,CRCPress,BocaRaton,FloridaSmith,B(1994)BayesianTheory,JohnWiley&Sons,Chichester
ExperimentaldesignsBingham,D,Sitter,RandTangB(2009)Orthogonalandnearlyorthogonaldesignsfor
computerexperimentsBiometrika96,pp51-65Box,GE;Hunter,JS;Hunter,WG(2005)Statisticsforexperimenters:Design,innovation,and
discovery,2ndedn,Wiley,NewYorkCochran,WandCox,G(1992)Experimental
designs,2ndedn,Wiley,NewYorkFang,KT,LiR,Sudjianto,A(2006)Designandmodelingforcomputerexperiments,CRC
Press,NewYorkLinCD,Bingham,D,SitterR,Tang,B(2010)Anewandflexiblemethodforconstructing
designsforcomputerexperiments,Ann.Statistics,38,pp1460–77Yang,JYandLiu,MQ(2012)ConstructionoforthogonalandnearlyorthogonalLatin
hypercubedesignsfromorthogonaldesigns,StatisticaSinica,22,pp433–42

Chapter4Agresti,A(2013)CategoricalDataAnalysis,3rdedn,JohnWileyandSons,Hoboken,NJBaltas,GeorgeandDoyle,Peter(2001)Randomutilitymodelsinmarketingresearch:a
survey,JournalofBusinessResearch,51(2),pp115–25BarghJA,ed(2006)SocialPsychologyandtheUnconscious:Theautomaticityofhigher
mentalprocesses,PsychologyPress,PhiladelphiaBen-Akiva,MandBierlaire,M(1999)Discretechoicemethodsandtheirapplicationstoshort-termtraveldecisions,HandbookofTransportationSciences,pp7–38,Kluwer,Norwell,MABen-Akiva,MandLerman,S(1985)DiscreteChoiceAnalysis:Theoryandapplicationtotraveldemand,MITPress,Cambridge,MAChu,C(1989)Apairedcombinatoriallogitmodelfortraveldemandanalysis,Proceedingsofthe5thWorldConferenceonTransportationResearch,Ventura,CA,pp295–309
Greenwald,AG(1992)NewlookIII:unconsciouscognitionreclaimed,AmericanPsychologist,47,pp766–79
Gustafsson,A,Herrmann,AandHuber,F,eds(2013)ConjointMeasurement:Methodsandapplications,Springer-Verlag,Berlin
Hausman,JandWise,D(1978)Aconditionalprobitmodelforqualitativechoice:discretedecisionsrecognizinginterdependenceandheterogeneouspreference,Econometrica,48(2),pp403–26
Kahneman,D(2013)Thinking,FastandSlow,Farrar,Strauss&Giroux,NewYorkKahneman,DandTverskyA(1979)Prospecttheory:ananalysisofdecisionunderrisk,
Econometrica,47(2),pp263–91Luce,MF,Payne,JWandBettman,JR(1999)Emotionaltrade-offdifficultyandchoice,
JournalofMarketingResearch,36(2),pp143–60Luce,RD(1959)IndividualChoiceBehavior,Wiley,NewYorkMcFadden,DandTrain,K(2000)MixedMNLmodelsfordiscreteresponse,Journalof
AppliedEconometrics,15(5),pp447–70Revelt,DandTrain,K(1998)Mixedlogitwithrepeatedchoices:households’choicesof
applianceefficiencylevel,ReviewofEconomicsandStatistics,80(4),pp647–57Train,K(1978)Avalidationtestofadisaggregatemodechoicemodel,Transportation
Research,12,pp167–74Train,K(2003)DiscreteChoiceMethodswithSimulation,CambridgeUniversityPress,MA
Chapter5Carroll,JandGreenE(1995)Psychometricmethodsinmarketingresearch:partI,conjoint
analysis,JournalofMarketingResearch,32,pp385–91Cattin,PandWittink,D(1982)Commercialuseofconjointanalysis:asurvey,Journalof
Marketing,46,pp44–53Green,P(1984)Hybridmodelsforconjointanalysis:anexpositoryreview,Journalof
MarketingResearch,21,pp155–59Green,PCarroll,JandGoldberg,S(1981)Ageneralapproachtoproductdesign
optimizationviaconjointanalysis,JournalofMarketing,43,pp17–35Green,P,Krieger,MandAgarwalM(1991)Adaptiveconjointanalysis:somecaveatsand
suggestions,JournalofMarketingResearch,28,pp215–21Green,PandSrinivasan,V(1978)Conjointanalysisinconsumerresearch:issuesand
outlook,JournalofConsumerResearch,5,pp103–23Green,PandWind,Y(1973)MultiattributeDecisionsinMarketing:Ameasurement
approach,DrydenPress,Hinsdale,ILLuce,RD(1959)IndividualChoiceBehaviorWiley,NewYorkMarder,E(1999)Theassumptionsofchoicemodelling,CanadianJournalofMarketResearch,18,pp1–10McCollough,PR(2002)[accessed15August2016]ShortcomingsofAdaptiveConjoint
[Online]http://www.macroinc.com/english/dont-use-adaptive-conjoint-methods/McCullough,PR(2002)AUsersGuidetoConjoint[Online]
http://www.macroinc.com/english/papers/A%20Users%20Guide%20to%20Conjoint%20Analysis.pdfMorowitz,V(2001)Methodsforforecastingfromintentionsdata,inPrinciplesof
Forecasting,edJArmstrong,Springer,NewYorkOrme,B(2009)GettingStartedwithConjointAnalysis,ResearchPublishers,Madison,WIRao,V(2014)AppliedConjointAnalysis,Sprinter-Verlag,Berlin

Chapter6Breiman,L,Friedman,J,Olshen,RandStone,C(1984)ClassificationandRegressionTrees,
ChapmanandHall,NewYorkBrodley,CEandUtgoff,PE(1995)Multivariatedecisiontrees,MachineLearning,19,pp45–
77Buntine,W(1992)Learningclassificationtrees,StatisticsandComputing,2,pp63–73Clark,LAandPregibon,D(1993)Tree-basedmodels,inStatisticalModels,edJMChambers
andTJHastie,pp377–419,ChapmanandHall,NewYorkHazewinkel,M,ed(1987)Greedyalgorithm,EncyclopediaofMathematics,SupplementIII,Springer,Norwell,MAHochberg,YandTamhane,AC(1987)MultipleComparisonProcedures,Wiley,NewYork
Holte,RC(1993)Verysimpleclassificationrulesperformwellonmostcommonlyuseddatasets,MachineLearning,11,pp63–90
Kass,GV(1980)Anexploratorytechniqueforinvestigatinglargequantitiesofcategoricaldata,AppliedStatistics,29,pp119–27
Lim,T-S,Loh,W-YandShih,Y-S(2000)Acomparisonofpredictionaccuracy,complexity,andtrainingtimeofthirty-threeoldandnewclassificationalgorithms,MachineLearning,40,pp203–28
Muller,WandWysotzki,F(1994)Automaticconstructionofdecisiontreesforclassification,AnnalsofOperationsResearch,52,pp231–47
Quinlan,JR(1989)Unknownattributevaluesininduction,ProceedingsoftheSixthInternationalMachineLearningWorkshop,pp164–68
Shi,LandHorvath,S(2006)Unsupervisedlearningwithrandomforestpredictors,JournalofComputationalandGraphicalStatistics,15(1),pp118–38
Steinberg,DandColla,P(1992)CART:AsupplementarymoduleforSystat,SystatInc.,Evanston,IL
White,APandLiu,WZ(1994)Biasininformation-basedmeasuresindecisiontreeinduction,MachineLearning,15,pp321–29
Witten,IandFrank,E(2005)DataMining:Practicalmachinelearningtoolsandtechniques,2ndedn,MorganKaufmann,SanFrancisco

Chapter7Cooper,GFandHerskovits,E(1992)ABayesianmethodfortheinductionofprobabilistic
networksfromdata,MachineLearning,9,pp309–47Gill,R(2010)MontyHallproblem,inInternationalEncyclopediaofStatisticalScience,pp
858–63Springer-Verlag,BerlinHeckerman,D(1995)TutorialonlearningwithBayesiannetworks,inJordan,M,LearninginGraphicalModelsAdaptiveComputationandMachineLearning,MIT,Press,Cambridge,MAJensen,FVandNielsen,TD(2007)BayesianNetworksandDecisionGraphs,2ndedn,Springer-Verlag,NewYork
Kahneman,D,Slovic,PandTversky,A,eds(1982)JudgmentunderUncertainty:Heuristicsandbiases,CambridgeUniversityPress,Cambridge,UK
Korb,KBandNicholson,A(2010)BayesianArtificialIntelligence,Chapman&Hall(CRCPress),NewYork
Mackay,D(2003)InformationTheory,InferenceandLearningAlgorithms,CambridgeUniversityPress,Cambridge,UK
Pearl,J(1986)Fusion,propagation,andstructuringinbeliefnetworks,ArtificialIntelligence,29(3),pp241–88
Pearl,J(1988)ProbabilisticReasoninginIntelligentSystems:Networksofplausibleinferencerepresentationandreasoningseries,2ndedn,MorganKaufmann,SanFrancisco,CAPearl,J(200)Causality:Models,reasoning,andinference,CambridgeUniversityPress,NewYork
Russell,SJandNorvig,P(2003)ArtificialIntelligence:Amodernapproach,2ndedn,PrenticeHall,UpperSaddleRiver,NJ
SolvingtheMontyHallThree-DoorProblemwithBayesNets[accessed15August2016][Online]http://download.hugin.com/webdocs/manuals/Htmlhelp/monty_hall_pane.xhtml
Wilkinson,L,Blank,IandGruber,P(1999)DesktopDataAnalysiswithSystat,SPSSInc.,Chicago,IL
Witten,IandFrank,E(2005)DataMining:Practicalmachinelearningtoolsandtechniques,2ndedn,MorganKaufmann,SanFranciscoYudkowsky,E(2016)[accessed15August2016]AnIntuitiveExplanationofBayes’Theorem[Online]http://yudkowsky.net/rational/bayes
Zhang,NandPoole,D(1994)AsimpleapproachtoBayesiannetworkcomputations,ProceedingsoftheTenthBiennialCanadianArtificialIntelligenceConference,AI-94,pp171–78,Banff,Alberta

Chapter8Fisher,RA(1936)Theuseofmultiplemeasurementsintaxonomicproblems,Annalsof
Eugenics,7(2),pp179–88Kantrowitz,A(2016)[accessed15August2016]CanAnyoneinThisGroupofAdvanced.
ProgrammersExplaintheTechWorld’sHottestTrend?[Online]https://www.buzzfeed.com/alexkantrowitz/finding-the-meaning-of-artificial-intelligence-at-google-io?utm_term=hr8N7KRmY#obKALmWxk(23/5/2016)
Lloyd,SP(1957)LeastsquarequantizationinPCM,BellTelephoneLaboratoriespaper;publishedinjournalmuchlater:Lloyd,SP(1982)LeastsquaresquantizationinPCM(PDF),IEEETransactionsonInformationTheory,28(2),pp129–37
Metz,C(2016)[accessed15August2016]AIisTransformingGoogleSearch:TheRestoftheWebisNext[Online]http://www.wired.com/2016/02/ai-is-changing-the-technology-behind-google-searches(4/2/2016)
Samuel,AL(1959)Somestudiesinmachinelearningusingthegameofcheckers,IBMJournalofResearchandDevelopment,3(3),pp210–29
Bonusonline-onlyChapter1
MaximumDifferenceScaling(MaxDiff)Flynn,TNetal(2007)Best–worstscaling:whatitcandoforhealthcareresearchandhow
todoit,JournalofHealthEconomics,26(1),pp171–89Louviere,JJetal(2015)Best-WorstScaling:Theory,methodsandapplications,Cambridge
UniversityPress,CambridgeMarley,AAandLouviere,JJ(2005)Someprobabilisticmodelsofbest,worst,andbest–worstchoices,JournalofMathematicalPsychology,49(6),pp464–80
Q-SortandCase5Block,J(1978)TheQ-SortMethodinPersonalityAssessmentandPsychiatricResearch,
ConsultingPsychologistsPress,MountainView,CABorbinha,J,etal(c.2005)[accessed15August2016]AdaptiveQ-SortMatrixGeneration:ASimplifiedApproach[Online]http://www.inesc-id.pt/pt/indicadores/Ficheiros/11389.pdf
Bracken,SSandFischel,J(2006)Assessmentofpreschoolclassroompractices:applicationofQ-sortmethodology,EarlyChildhoodResearchQuarterly,21(4),pp417–30
Bradley,RAandTerry,ME(1952)Rankanalysisofincompleteblockdesigns,I:themethodofpairedcomparisons,Biometrika,39,pp324–45
Luce,RD(1959)IndividualChoiceBehaviors:Atheoreticalanalysis,JWiley,NewYorkMcKeown,BFandThomas,BD(1988)Q-Methodology,SagePublications,NewburyPark,CAMichell,J(1997)Quantitativescienceandthedefinitionofmeasurementinpsychology,
BritishJournalofPsychology,88,pp355–83Rasch,G(1980)ProbabilisticModelsforSomeIntelligenceandAttainmentTests,University
ofChicagoPress,ChicagoThurstone,LL(1927)Alawofcomparativejudgement,PsychologicalReview,34,pp273–86Thurstone,LL(1929)Themeasurementofpsychologicalvalue,inEssaysinPhilosophyby
SeventeenDoctorsofPhilosophyoftheUniversityofChicago,edTSmithandWWright,OpenCourt,ChicagoThurstone,LL(1959)TheMeasurementofValues,UniversityofChicagoPress,Chicago
RegressionAchen,CH(1973)InterpretingandUsingRegression,SagePublications,BeverlyHillsDarlington,RB(1968)Multipleregressioninpsychologicalresearchandpractice,
PsychologicalBulletin,69,pp161–82Gorsuch,RL(1973)Dataanalysisofcorrelatedindependentvariables,Multivariate
BehavioralResearch,8,pp89–107Lorenz,FO(1987)Teachingaboutinfluenceinsimpleregression,TeachingSociology,15,

pp173–77Mansfield,ERandConerly,MD(1987)Diagnosticvalueofresidualandpartialresidual
plots,TheAmericanStatistician,41,pp107–16Mauro,R(1990)Understandingl.o.v.e.(leftoutvariableserror):amethodforestimating
theeffectsofomittedvariables,PsychologicalBulletin,108,pp314–29Mosteller,FandTukey,J(1977)DataAnalysisandRegression:Asecondcourseinstatistics,
Pearson,UpperSaddleRiver,NJStevens,JP(1984)Outliersandinfluentialdatapointsinregressionanalysis,Psychological
Bulletin,95,pp334–44Wilkinson,L,Blank,GandGruber,C(1995)DesktopDataAnalysiswithSystat,SPSSPress,
Chicago,ILWolf,GandCartwright,B(1974)Rulesforcodingdummyvariablesinmultipleregression,
PsychologicalBulletin,81,pp173–79

Bonusonline-onlyChapter2Asimov,I(1964)Introduction,TheRestoftheRobots,Doubleday,NewYorkBaer,D(2016)[accessed15August2016]The‘OutfielderProblem’ShowsHowYourBrain
IsNotaComputer[Online]http://nymag.com/scienceofus/2016/06/outfielder-problem.xhtml
Bengio,Yoshuaetal(2006)Neuralprobabilisticlanguagemodels,inInnovationsinMachineLearning,edDEHolmesandLCJain,pp137–86,Springer,NewYork
Bourzac,K(2016)[accessed15August2016]BringingBigNeuralNetworkstoSelfDrivingCars,Smartphones,andDrones[Online]http://spectrum.ieee.org/computing/embedded-systems/bringing-big-neuralnetworks-to-selfdriving-cars-smartphones-and-drones
Cellan-Jones,R(2016)[accessed15August2016]StephenHawkingWarnsArtificialIntelligenceCouldEndMankind[Online]http://www.bbc.com/news/technology-30290540
Cho,S-JandKim,J(2003)Bayesiannetworkmodelingofhangulcharactersforon-line:handwritingrecognition,ICDARProceedingsoftheSeventhInternationalConferenceonDocumentAnalysisandRecognition(1),IEEEComputerSociety,Washington,DC
Claburn,T(2016)[accessed15August2016]ManyBusinessesUsingAIWithoutRealizingIt[Online]http://www.informationweek.com/strategic-cio/many-businesses-using-ai-without-realizing-it/d/d-id/1326333(21/7/2016)
Coffman,V(2013)[accessed15August2016]WhyYouShouldNotBuildaRecommendationEngineOnline]http://www.datacommunitydc.org/blog/2013/05/recommendation-engines-why-you-shouldnt-build-one
Coldewey,D(2016)[accessed15August2016]DeepLearningSoftwareKnowsThataRoseisaRoseisaRosaRubiginosa,http://www.techcrunch.com/2016/07/26/deeplearning-software-knows-that-a-rose-is-a-rose-is-a-rosa-rubiginosa
Daugman,JG(2001)Brainmetaphorandbraintheory,inPhilosophyandtheNeurosciences:Areader,edWBechtel,PMandik,JMundaleandRStufflebeam,Blackwell,Oxford,UK
Davis,E(2016)[accessed15August2016]CollectionofWinogradSchemas[Online]http://www.cs.nyu.edu/faculty/davise/papers/WinogradSchemas/WS.xhtml
Etzioni,0(2016)[accessed15August2016]DeepLearningisn’taDangerousMagicGenieit’sJustMath[Online]http://www.wired.com/2016/06/deeplearning-isnt-dangerous-magic-genie-just-math(15/6/2016)
Goodman,J(2016)[accessed15August2016]SayOneSentenceandit’sDoneintheAI-FirstWorld[Online]https://www.theguardian.com/media-network/2016/may/20/say-one-sentence-and-its-done-in-the-ai-first-world?CMP=oth_b-aplnews_d-1
Hern,A(2016)[accessed15August2016]GoogleSaysMachineLearningistheFutureSoITriedItMyself[Online]https://www.theguardian.com/technology/2016/jun/28/google-says-machine-learning-is-the-future-so-i-tried-it-myself(28/7/2016)
Hinton,G(2010)ApracticalguidetotrainingrestrictedBoltzmannmachines,Momentum,91,pp926–43
Hinton,G,Osindero,SandTeh,Y(2006)Afastlearningalgorithmfordeepbeliefnets,

NeuralComputation,18(7),pp1527–54Kahneman,D(2013)Thinking,FastandSlow,Farrar,Strauss&Giroux,NewYorkKoch,C(2016)[accessed22February2017]HowtheComputerBeattheGoMaster[Online]
http://www.scientificamerican.com/article/how-the-computer-beat-the-go-master(29/3/16)
Kosko,B(1993)FuzzyThinking:Thenewscienceoffuzzylogic,Hyperion,NewYorkLivingston,B(2002)[accessed22February2017]PaulGrahamProvidesStunningAnswer
toSpamE-Mails[Online]http://www.infoworld.com/article/2674702/technology-business/techology-business-paul-graham-provides-stunning-answer-to-spam-e-mails.xhtml
Masnick,M(2012)[accessed15August2016]WhyNetflixNeverImplementedtheAlgorithmthatWontheNetflix$1MillionChallenge[Online]https://www.techdirt.com/blog/innovation/articles/20120409/03412518422/why-netflix-never-implemented-algorithm-that-won-netflix-1-million-challenges.xhtml
Montaner,M,Lopez,BanddelaRosa,JL(2003)Ataxonomyofrecommenderagentsontheinternet,ArtificialIntelligenceReview,19(4),pp285–330
Nielsen,M(2016)[accessed22February2017]HowtheBackpropagationAlgorithmWorks[Online]http://neuralnetworksanddeeplearning.com/chap2.xhtml
Reese,B(2016)[accessed15August2016]GigaomChats:InterfacingWithMachinesin2026[Online]http://www.gigaom.com/2016/08/02/gigaom-chats-interfacing-with-machines-in-2026(2/8/2016)
Ricci,F,Rokach,LandShapira,B(2012)Introductiontorecommendersystemshandbook,RecommenderSystemsHandbook,Springer,NewYork,pp1–35
Sacks,O(1998)TheManWhoMistookHisWifeForHisHat,Touchstone,NewYorkSahmai,M,Dumais,M,Heckerman,DandHorvitz,E(1998)ABayesianapproachto
filteringjunke-mail,AAAI1998WorkshoponLearningforTextCategorizationShi,LandHorvath,S(2006)Unsupervisedlearningwithrandomforestpredictors,Journal
ofComputationalandGraphicalStatistics,15(1),pp118–38Sonnad,N(2016)[accessed15August2016]Easyquestionsthatcomputersareterribleat
answering[Online]http://qz.com/745104/easy-questions-that-computers-are-terrible-at-answering(2/8/2016)
SpamBayessourcecode[Online]http://spambayes.sourceforge.net/Standage,T(2016)[accessed15August2016]WhyArtificialIntelligenceisEnjoyinga
Renaissance[Online]http://www.economist.com/blogs/economist-explains/2016/07/economist-explains(15/7/2016)
StanfordUniversityDeepLearningTutorial[Online]http://deeplearning.stanford.edu/tutorial/(byANgetal)
Tracy,A(2016)[accessed15August2016]SuddenlyEverybodyisObsessedwithAI–EvenifInvestorsDon’tGetIt[Online]http://www.vanityfair.com/news/2016/06/silicon-valley-artificial-intelligence-obsession(29/6/2016)
Vanian,J(2016)[accessed15August2016]ArtificialIntelligenceStillHasaWays[Sic]ToGoBeforeMachinesCanBehaveLikeHumans[Online]http://fortune.com/2016/05/23/google-baidu-research-artificial-intelligence/?xid=smartnews(23/5/16)
Wakefield,J(2016)[accessed15August2016]WouldYouWanttoTalktoaMachine?[Online]www.bbc.co.uk/news/technology-36225980(4/8/2016)
Zaknich,A(2003)NeuralNetworksforIntelligentSignalProcessing,WorldScientific

Publishing,SingaporeZhu,X(2008)Semi-SupervisedLearningLiteratureSurvey,ComputerSciences,TR1530,
UniversityofWisconsin,Madison,WI[Online]http://pages.cs.wisc.edu/~jerryzhu/pub/ssl_survey.pdf

INDEX
Note: The index is filed in alphabetical, word-by-word order.Numbersandacronymswithinmainheadingsarefiledasspeltout.Page locators in italics denote information contained within aFigure or Table; locators in roman numerals denote informationwithinthePreface.
A/Bwebtesting127,131,132,146,161,162AC2191acquiescencebias12,57,58actions218,222AdaBoost.M1(adaptiveboosting)194,195–96,231adaptivechoice-basedmodelling120AdaptiveConjointAnalysis(ACA)76,156–57advertisements140–44,152–54AIDmodel191AIDAmodel218AkaikeInformationCriterion(AIC)45,48,54allocatingpurchases(choices)114,124–25AmericanExpress(Amex)91–92,129analysisseeconjointanalysis;correspondenceanalysis;discriminantanalysis;driveranalysis;drugsaleanalysis;gainsanalysis;HBanalysis(hierarchicalBayesiananalysis)
analysisofvariance(ANOVA)230artificialintelligence,defined4–5,229attributesbrandas121–22,131,158,160contingent125levelsof59,69–71,81–82,89,92–94,95,101,128–30,137–38,140–41
sensory119,125
basecase(referencecase)96,106,109,110,111,112,113,116,117Bayes,ReverendThomas201–02BayesNets(BayesianNetworks)33,37,50,166,197,200–28,232–35BayesianInformationCriterion(BIC)45,48,54bestpractice94–97,122–23bi-plots230bias11–13,53acquiescence57,58
Bohr,Nielsxiiiboosteddecisionstumps192–94boosting192–94,231,232seealsoAdaBoost.M1(adaptiveboosting)
Box,George48brand32,34–35,93,121–22,128,131,154–55,158,160,223–26brandawareness34–35brandidentity119
cannibalization79,83cards62,68,127CART(C&RT)166,191,195Case5analysisseeThurstone’sCase5methodcategoricaldata45categoricalvariables53,166,172,181,195,199,200C4.5/C5191CHAID(chi-squaredautomaticinteractiondetector)166,168–72,181,191,195
changerequirements28,51,92childvariable203,217children’sapparel223–26Choice-Based-Conjoint(CBC)93,120,156,157–59,161–62Citibank91,92,129classificationseeclassificationrules;classificationtrees;correctclassification
classificationrules184–86,195classificationtrees38,165–96,200,211–12,227,230,231,234–35clusteringxi,230
seealsoTwoStepCME(continuingmedicaleducation)148,149communications19,131,132,161,214,215,216,220seealsomessages;telecommunicationscompetitiveadvantage214–15,216competitors(competition)19conjointanalysis79,130,160–61discretechoicemodelling83,90,91–92,95–96,110,112,117,122–23,131,233–34
complexnetworks204computers4,16,18,21,32,70,235–36discretechoicemodelling60–61,89–90HBanalysis73–74,123,229–30
conditionalprobabilities205,206,207,210,230conjointanalysis13,62,67,75–77,78,79–80,81,83–84,127–64,233andbrand93partialprofile156andshareofpreference34
constant,the71,92,93,94,122,129,137,198consumers5,22,89seealsocustomersatisfaction;customers
contingentattributes125continuingmedicaleducation(CME)148,149continuousdata46continuouspredictorvariables181convergence73,101correctclassification45,46–47,53,193correctpredictionlevels47,214,215,217,222correlations43–45,54,68–69,128,198,211,232seealsozerocorrelation
correspondenceanalysis230counting14,22cross-foldedvalidation217CRT(CART)166,191,195culturalskew12,58
cumulativefigures(statistics)186,187,188,189currentcase108,109,115,116,117customerlists16–17customersatisfaction10,11,23,62,150,151,221,222customers15–17,131,132,147–52,161,162seealsocustomersatisfaction;touchpoints
D-optimaldesigns90DAGs202data6–8,22,28–31,45–46,48–49,98historical11–12,13,14,23,25,32–33,51,56,75ordinal200patternsin32–33,38,234ratio-level65,77,80,149,231,232scanner167transaction14,25,32–33,51seealsosampleerrors;datalakes;datamining;dataquality;dataswamps;datawarehouses
datalakes7datamining14,33,201,204dataquality7,22dataswamps7datawarehouses7,31,32databasemanagement16–17,167–68,174,175,177,181,185,186deBono,Edwardxiiidebitcards91–92decisionstumps191–94demographicinformation10,167–72,174seealsochildren’sapparel
designedexperiments66–71,82dietaryfibremarket133–36direct-mail79,83,137–40,146directmeasurement8–9directquestions12,24,56directedacyclicdiagrams202seealsoBayesNets(BayesianNetworks)
discretechoicemodelling13–14,52,60–61,67,74,78–79,81,83,85–126,233–34andattributes128,129
andshareofpreference34andsurveys17–18andutility130
discriminantanalysis230donationgeneration8driveranalysis213drugsalesanalysis19,49,86,87,114,124,142,143,148–52dummycoding199
earlyschoolageclothingmarket223–24,225efficiencycalculation189elasticity99electiondata28–29,39engineers71,95,156ensemblelearning(models)174,194,195,229enterpriseclasssoftware21envelopes137,138,139,140errorsdata28–29discretechoicemodelling103–04inmeasurement71,94,104inpricing155sample38–41,53,103andsignificancetesting42–43TypeI36,52TypeII37seealsomarginoferror
estimationoptimism135–36evaluation35–36,45–50Excel70,81,86–88,107,109,114–17,136,152ExcelRibbon87,88,114–15,117,152expectationsetting50–51,54experimentalmethods10,12,23,24,34–35,52,55–84,89–90,233
seealsoconjointanalysis;discretechoicemodelling;HBanalysis(hierarchicalBayesiananalysis);marketsimulatorprograms(marketsimulations);MaxDiff(maximumdifferencescaling);Q-Sortmethod;Thurstone’sCase5method
explainedvariance45,47,49,53exponentiation107extrapolation96,99extremeresponses57–58extremevalues144
farmers71,156focusgroups38,41–42,53font138,139,140,141,143forecasting4,15,19,25,125,201seealsodiscretechoicemodelling;marketsimulatorprograms(marketsimulations)
fractionalfactorialorthogonaldesigns69,82fullprofileconjointanalysis62,76–77,79,81,127,133–36,158,159,233
gainsanalysis184,186–89,231Gallup,George(GallupPoll)29GeneralSocialSurvey37goals48,50–51,66,165,190‘goodresults’48–49grandparentvariable203graphicalanalyticalmethods202,227seealsoBayesNets(BayesianNetworks)
graphicaluserinterfaces(GUIs)21grossrevenues99,111,112,113,116,117growthcurve43–44Gumbeldistribution103–04
Hadoop7HBanalysis(hierarchicalBayesiananalysis)72–74,78,82–83,98,101–02,104,107,123–24

headlines79,139,140,141,143hierarchicalmodels218–19HIPPO(highestpaidperson’sopinion)140historicaldata(models)11–12,13,14,23,25,32–33,51,56,75hold-outsamples49–50,54,217
if-thenstatements(rules)184–85,186,194,195,200,227,231implicitviews11–13,23–24in-depthinterviews38inelasticity99,112infantclothingmarket223–24,225inflectionpoints99,100information6–7,22,37informationcriteria45,48,53–54informationpropagation212insurancesector79,83,91,137,147,161,162interactions154–56,158,170,195,234interpolation59,95,121,133interval-leveldata45–46interviews9,10–11,23,31,38,41,57,147online(web)60,64,65,68,159
Japan58JCPenney32J4820,191
Kahneman,Daniel105
latentvariables221LatinAmerica58LavidgeandSteinermodel219LawofComparativeJudgements,The,seeThurstone’sCase5method
Let’sMakeaDeal205–10letters137,138,139,140levels,attribute59,69–71,81–82,89,92–94,95,101,128–30,137–38,
140–41leverageanalysis(liftanalysis)seegainsanalysislinearadditivemodels198linearregression50LiteraryDigest29logos141,143loyalty220,221,222loyaltyprogrammes167,224loyaltyscores192
McFadden,Daniel74machinelearningxi–xii,13,21,74,173–74,236seealsoHBanalysis(hierarchicalBayesiananalysis)
marginoferror39marketshare11,33,84,86,125,136,165,191–92,234marketsimulations10,23,34,126,234marketsimulatorprograms63–64,70,86–90,107–17,124,126,133–36,142–44,162,234
marketplace,understandingof15–16,84,94,106,121,122,160marketplacescenarios(marketscenarios)60–61,81,88,89,93–94,96,98,104–05,120–21
Markovblanket204,213mathematicalmodels5,10,46MaxDiff(maximumdifferencescaling)13,52,64–65,66,78,80,81–82,84,163,230,231,232
MD-PREF230measurement8–11,71–72,94,95–96,98,99,103,104,122MECE183–86messageoptimizationsimulators142–44,152–54,233messageprofiles137messages136–47,152–54seealsomessageoptimizationsimulators
MicrosoftExcel70,81,86–88,107,109,114–17,136,152ExcelRibbon87,88,114–15,117,152PowerPoint70,133–36
missingvalues181,200mobilephonetowers5,110–14MontyHallproblem205–10Morwitz,V.56motherlogit166,199multinomiallogit166,199mutuallyexclusiveandcompletelyexhaustive185–86
NCSS20networks201,226Bayesian33,37,50,166,197,200–28,232–35neural166,228,230,235,236simple204,214
newsletters148,150nodes176,177,178,181,184,185,186,206–08,217non-compensatorytheories118,120Nonameo154–55,156‘noneofthese’option60,81,97,109,111,123NORC37normaldistribution103–04norms56nullhypothesis36,52
Ockham’sRazor94onlineinterviews60,68,159seealsowebinterviews
optimalrecoding100,172,189,191,192,195,200optimism,ofestimation135–36optimizers117ordinaldata45,46,200orthogonaldesigns69,82,89–90outcomes9–10,11,60overfitting50,218,235,236
parentvariable203,217parents223–26
partialleastsquares(PLS)pathmodels192,202,217,221partialprofileconjointmethod76–77,156penproduction132–33pharmaceuticalindustry148–52seealsodrugsalesanalysis
photos(pictures)140,141–42,143pointofinflection(inflectionpoints)99,100PowerPoint70,133–36pre-teenclothingmarket223–24,225,226precursors(surrogates),forbehaviour9–10,23prediction4,21,47,214,215,217,222predictorvariablesBayesNets198–99,204,213,215,227,232classificationtrees173,176,181,192,211,231
preferences9,11,23presetvalues117priceelasticity99pricevsshare98–100pricing97–100,123,133,155–56,214printadvertisement140–44,152–54privacyissues11,14probabilities,conditional205,206,207,210,230productlinesynergies79,83productprofiles62,127–28,156,158,159productsawarenessof9,34–35,95,122,125distributionof34–35,125sensory119,125seealsoproductlinesynergies;productprofiles;single-productoptimization
projectplanning27–54projections15–18,25,29,31,84prospecttheory105–06,135psoriasistreatment193–94,231
Q-Sortmethod13,52,60,65–66,78,80,81–82,84,163,232
seealsoThurstone’sCase5analysisqualitativeresearch94,95QUEST191questionsandanswers10–11,12,13,14,23,24–25,27,33,51–52,56seealsosociallydesirableresponses(socialdesirability);straight-lineresponses(straightlining)
QuietFinancialServices(QFS)casestudy91–93,129
R(program)21R-squaredstatistic43,44,47Rstatistic43,44randomforests173–76,192,195,231,232randomsamples43ratingsscales(scaledratings)9,12,33,46,55–59,67,75,80,88–89,147–48
ratio-leveldata46,65,77,80,149,231,232RCA154–55referencecase(basecase)96,106,109,110,111,112,113,116,117referencevalue106regression43,44,47,50,166,191–92,198–99,210–11,212,221replication72representative(definition)31reservationprices99results48–50,54revenueneutral99seealsogrossrevenues
Roosevelt,Franklin29root-mean-squarederror(RMSE)48,54
s-curve105–07,109,124,130,210–11sampleerrors(samplingerror)38–42,53,103sampleframes29–31,51samplesize38–41,42,53sampling148,150–51seealsohold-outsamples;randomsamples;sampleerrors(samplingerror);samplesize
SAS20Savant,Marilynvos205SavvySylvia226SawtoothSoftware119–20scaledratings(ratingsscales)9,12,33,46,55–59,67,75,80,88–89,147–48
scannerdata167screening17–18,203–04self-effectscurve98–99sensoryproducts(attributes)119,125servicedeliveryoptimization147–52,162share98–100,107,109,114,124,135,192,214–15,221shareofacceptance52,63,64,84,134shareofpreference34,35,86,87,108,120,125,135,158,234significancetesting37–38,42–43,52–54seealsostatisticalsignificance
silentdonationdrives8simplenetworks204,214single-productoptimization132–36socialmedia31sociallydesirableresponses(socialdesirability)12,58,128softwareprograms20–21,43,191,195,226,227seealsoAdaptiveConjointAnalysis(ACA);Choice-Based-Conjoint(CBC);Hadoop;marketsimulatorprograms;MaxDiff(maximumdifferencescaling);messageoptimizationsimulators;SawtoothSoftware;SPSS
solver,the117Sony35,119,154–55spousevariable203SPSS20,48stakeholders50Stat20Statistica20statisticalanalysissoftware20–21statisticalpower36–37,52
statisticalsignificance36,37,52–53,171–72,173,176–77,178,190seealsosignificancetesting
stimulusitems66storeddataseehistoricdata(models)straight-lineresponses(straightlining)12,57–58,99,100straight-linesrelationships43,44,54,105,109,130,198,211structuralequationmodels192,202surrogates(precursors),forbehaviour9–10,23surveys17–18,33,37,59,65,66,147synergistic170,195Systat20
taglines141,143targetvariablesBayesNets202,204,211,213,214,215,216,217,222,227classificationtrees194,198–99,200
telecommunications22,84,147,161,162testingA/B127,131,132,146,161,162direct-mail146significance37–38,42–43,52–54seealsostatisticalsignificance
text140,141theoreticalmodels11,13,14,23,25Thurstone’sCase5method13,60,65–66,77,78,81,163,165,230,232seealsoQ-Sortmethod
TinyCo99,100toddlerclothingmarket223–24,225touchpoints147,149,162trade-offmethodsseeexperimentalmethodstransactiondata14,25,32–33,51transportationsector74,91trust,brand223–26TwoStep48TypeIerror36,52
TypeIIerror37typicalgrowthcurve43–44
UK167UnitedStates(US)14,29,58,91,99,148,167,172userbenefits95,122utility59–60,86,88,105–07,109,121,124,130,135,160
validation49–50,54,217–18valueofinformation37values106,117,181,200variables5,68–69,170,180,190,194–95,202–04,210,212categorical53,166,172,181,199,200latent221predictorBayesNets198–99,213,215,227,232classificationtrees173,176,181,192,211,231randomforests175,176targetBayesNets211,213,214,215,216,217,222,227classificationtrees198–99,200
variance47,213explained45,49,53seealsoanalysisofvariance(ANOVA)
variations59,70,71,94,122,144–45verbatimcomments14–15
wealthindex175,180,181,183webinterviews64,65seealsoonlineinterviewswebsites119–20,131–32,136–37,144–46,147,149,161Weka20,21Wilkinson,Leland212WilliamofOckham94win-lossmatrix77

Yudkowsky,Eliezer210
zerocorrelation89,128,199

“Fullofhard-wonpracticalwisdom,thisisacomprehensiveguidetonavigatingthecomplexityofmarketforecasting.Foregoingthehyperbolethatsooftencharacterizesdiscussionsofartificial
intelligence,DrStruhlthoroughlyexplainsawiderangeofmethods,wheretheirdifficultieslieandhowtogetthebestinsightsfromeach.”
PeterGoldstein,SoftwareEngineer,Google
“DrStruhl’snewbookisararejewelamongmarketingsciencetomes–informative,easytounderstandand,dareIsay,evenentertaining.DrStruhlsurveysseveralmajoranalytictechniquesinplainEnglish,introducingthenovicetofoundationalconceptswhileatthesame
timeremindingtheseasonedanalystofbestpracticesoftenforgotten.Avaluableresourceforbeginnerandexpertalike.”
DrRichardMcCullough,President,MacroConsultingInc
“Thisbookcoverslucidlyanumberofresearchmethodologiesthatcommonlysupportveryimportantnewproductdevelopmentandmarketingstrategydecisions.DrStruhlshouldbecommendedformakingthematerialsaccessibletoawiderangeofaudiencesby
emphasizingthepracticality,appropriateness,andprosandconsofthevariousmethodologies.”
JehoshuaEliashberg,SebastianSKresgeProfessorofMarketing,andProfessorofOperations,InformationandDecisions,TheWharton
School
“DrStruhlhaswrittenanotherhighlyinformativebook.Itoffersaneasy-to-understandwayofthinkingabouthowtobestusedatatoanswerbiggermarketingquestions.Hisexplanationsareclearandrelatable,makingthisbookaninvaluabletoolforanyoneinvolvedincommercialdecisionmaking,especiallymarketersandresearchers.”KatieSzelc,Manager,CustomerInsights,GlobalBusinessInsights,
Johnson&JohnsonMedicalDevices
Theabilitytopredictconsumerchoiceisafundamentalaspectofsuccessforanybusiness.Inthecontextofartificialintelligence
marketing,thereisawidearrayofpredictiveanalytictechniquesthatcanbeusedtoanticipatewhatconsumerswant;eachtechniquehavingitsownuniqueadvantagesanddisadvantages.ArtificialIntelligenceMarketingandPredictingConsumerChoiceservestointegratethesedisparateapproaches,showingthestrengths,weaknessesandbestapplicationsofeach.
Byexploringthehumansideofadvancedanalytics,thisbookprovidesabridgebetweenthepersonwhomustlearnorapplytheseproblem-solvingmethodsandthecommunityofexpertswhodotheactualanalysis.Coveringareassuchasdiscretechoicemodelling,conjointanalysisandmachinelearningmethods,ArtificialIntelligenceMarketingandPredictingConsumerChoicedeliversincrediblyusefulbusinesstechniques–allowingforpracticalreal-worldapplicationwhilesimultaneouslyprovidingengaginginsightintotheremarkableadvancesinthisfascinatingfield.
Bonusonlineresourcesareavailableatwww.koganpage.com/AI-Marketing
DrStevenStruhlPhD,MBA,MA,hasmorethan25years’experienceinconsultingandresearch,specializinginpracticalsolutionsbasedonstatisticalmodelsofdecisionmakingandbehaviour.Alongsidetextanalyticsanddatamining,hisworkaddresseshowbuyingdecisionsaremade,optimizingservicedeliveryandproductconfigurations,andfindingthemeaningfuldifferencesamongproductsandservices.DrStruhlhasalsotaughtgraduatecoursesonstatisticalmethodsanddataanalysis.Heisaregularconferencespeakerandhasgivennumerousseminarsonpricing,choicemodelling,marketsegmentationandpresentingdata.
KoganPage

London

NewYork


Related Documents