ADA L. RYLAND E. I. du Pont de Nemours & Co., Inc., Polychemicals Department, Wilmington, Delaware IN RECENT years X-ray diffraction has become an increasingly important technique for qualitative and quantitative analyses as well as for fundamental stud- ies of the properties and structures of polymers. The nondestructive nature of the technique makes it par- ticularly valuable because one frequently needs to ob- tain a large amount of information about a relatively small sample of material. The unique feature of X-ray diffraction as a tech- nique for qualitative analysis is that components are identified as specific compounds. It has been used in this laboratory to identify a wide variety of inorganic and organic compounds. It might appear that the technique is not generally applicable to organic analysis because of the necessity of working with crystalline compounds. However, when organic compounds cannot be identified directly (if they are liquids, for example) it is frequently possible to convert them to crystalline derivatives which have characteristic patterns. Many of the classical deriva- tives can he used for X-ray identification, and stand- ard patterns of a number of derivatives have been pub- lished (1-7). Standard samples have been prepared, and the X-ray patterns of a large number of organic compounds have been obtained in this laboratory. Among the applications which have been made of the technique to organic analysis are identification of dibasic acids directly, identification of aldehydes and ketones as 2,4-dinitrophenylhydrazones, fatty acids as gbromoanilides, and amines as picrate derivatives. Recent studies on two binary derivative systems, acetic and propionic pbromoanilides and acet- and propion- 2,4dinitrophenylhydrazones were made in this laboratory (8). These studies indicated that X-ray techniques could be used satisfactorily for semiquan- titative estimation of composition as well as for identifi- cation of the derivatives. QUANTITATIVE ANALYSIS Although X-ray diffraction has received primary em- phasis as a tool for qualitative analysis, it is readily adaptable to quantitative applications because the intensities of the diffraction peaks of a given com- pound in a mixture are proportional to the fraction of the material in the mixture. In practice the method does not work quite as smoothly as this statement would seem to indicate. Direct comparison of the intensity of a diffraction peak in the pattern obtained Presented as part of the Symposium on An Analy~is Group in an Industrial Research Organization before the Divisions of Chemical Education and Analytical Chemistry at the 130th Meeting of the American Chemical Society, Atlantic City, Sep- tember, 1956. from a mixture with the intensity of the same peak in the pattern of the pure material does not give the most reliable analysis. It is frequently necessary to make corrections for the differences in absorption coef- ficients between the compound being determined and the matrix. Considerable effort must sometimes be exerted to prevent the establishment of preferred orien- tation which may seriously distort the intensity ratios. A method was recently developed for determining the graphite content in blends of graphite and Teflonv' tetrafluoroethylene resin. The integrated intensities of the graphite crystalline peak and the crystalline peak and amorphous halo of Teflon were measured. A correction was applied to eliminate the effect of the varying crystallinity of the Teflon in different samples. At the 10% level, the graphite could be determined with a precision of about *0.5% absolute. Probably an ultimate in quantitative analysis by X- ray diffraction was reported a few years ago by Black (9). An elegant arrangement permitted the simul- taneous determination of six mineral components in bauxite at the rate of eighty samples a day with a pre- cision and accuracy which compared favorably with chemical measurements. Notably, the various com- ponents were individually distinguishable in the mix- ture. Frequently, when complex mixtures are analyzed, a separation of some sort must be effected before the individual components can be adequately identified. Very often separations can be made on the basis of different colors or textures of the components. In other cases good separations can be made by a flotation method which takes advantage of density differences among the various compounds. COMBINATION WITH OTHER TECHNIQUES X-ray diffraction frequently can he combined with other techniques to provide a simple solution to a relatively complex problem. For example, a con- venient method was devised for determining beryl- lium in a complex beryllium organic compound. The compound was wet ashed using sulfuric acid, and the ash was identified as BeSOa by X-ray diffraction. In some instances, other techniques are of great value in differentiating compounds for which the diffraction patterns are quite similar. This situation occurs rela- tively frequently in inorganic systems. A notable ex- ample is the case of FeO, COO and Cu10 which have virtually identical "d" spacings although the intensities of the spacings are different. Emission spectrography is the most valuable technique for identifying metallic constituents, and it is used routinely in these labora- tories to complement the X-ray results, particularly when complex mixtures are being analyzed. JOURNAL OF CHEMICAL EDUCATION

Articulo Difracción Rayos X
Dec 21, 2015
Difracción de rayos X
Welcome message from author
This document is posted to help you gain knowledge. Please leave a comment to let me know what you think about it! Share it to your friends and learn new things together.
Transcript
ADA L. RYLAND E. I. du Pont de Nemours & Co., Inc., Polychemicals Department, Wilmington, Delaware
IN RECENT years X-ray diffraction has become an increasingly important technique for qualitative and quantitative analyses as well as for fundamental stud- ies of the properties and structures of polymers. The nondestructive nature of the technique makes it par- ticularly valuable because one frequently needs to ob- tain a large amount of information about a relatively small sample of material.
The unique feature of X-ray diffraction as a tech- nique for qualitative analysis is that components are identified as specific compounds. It has been used in this laboratory to identify a wide variety of inorganic and organic compounds.
It might appear that the technique is not generally applicable to organic analysis because of the necessity of working with crystalline compounds. However, when organic compounds cannot be identified directly (if they are liquids, for example) it is frequently possible to convert them to crystalline derivatives which have characteristic patterns. Many of the classical deriva- tives can he used for X-ray identification, and stand- ard patterns of a number of derivatives have been pub- lished (1-7). Standard samples have been prepared, and the X-ray patterns of a large number of organic compounds have been obtained in this laboratory. Among the applications which have been made of the technique to organic analysis are identification of dibasic acids directly, identification of aldehydes and ketones as 2,4-dinitrophenylhydrazones, fatty acids as gbromoanilides, and amines as picrate derivatives.
Recent studies on two binary derivative systems, acetic and propionic pbromoanilides and acet- and propion- 2,4dinitrophenylhydrazones were made in this laboratory (8). These studies indicated that X-ray techniques could be used satisfactorily for semiquan- titative estimation of composition as well as for identifi- cation of the derivatives.
QUANTITATIVE ANALYSIS
Although X-ray diffraction has received primary em- phasis as a tool for qualitative analysis, it is readily adaptable to quantitative applications because the intensities of the diffraction peaks of a given com- pound in a mixture are proportional to the fraction of the material in the mixture. In practice the method does not work quite as smoothly as this statement would seem to indicate. Direct comparison of the intensity of a diffraction peak in the pattern obtained
Presented as part of the Symposium on An Analy~is Group in an Industrial Research Organization before the Divisions of Chemical Education and Analytical Chemistry a t the 130th Meeting of the American Chemical Society, Atlantic City, Sep- tember, 1956.
from a mixture with the intensity of the same peak in the pattern of the pure material does not give the most reliable analysis. It is frequently necessary to make corrections for the differences in absorption coef- ficients between the compound being determined and the matrix. Considerable effort must sometimes be exerted to prevent the establishment of preferred orien- tation which may seriously distort the intensity ratios.
A method was recently developed for determining the graphite content in blends of graphite and Teflonv' tetrafluoroethylene resin. The integrated intensities of the graphite crystalline peak and the crystalline peak and amorphous halo of Teflon were measured. A correction was applied to eliminate the effect of the varying crystallinity of the Teflon in different samples. At the 10% level, the graphite could be determined with a precision of about *0.5% absolute.
Probably an ultimate in quantitative analysis by X- ray diffraction was reported a few years ago by Black (9). An elegant arrangement permitted the simul- taneous determination of six mineral components in bauxite a t the rate of eighty samples a day with a pre- cision and accuracy which compared favorably with chemical measurements. Notably, the various com- ponents were individually distinguishable in the mix- ture.
Frequently, when complex mixtures are analyzed, a separation of some sort must be effected before the individual components can be adequately identified. Very often separations can be made on the basis of different colors or textures of the components. In other cases good separations can be made by a flotation method which takes advantage of density differences among the various compounds.
COMBINATION WITH OTHER TECHNIQUES
X-ray diffraction frequently can he combined with other techniques to provide a simple solution to a relatively complex problem. For example, a con- venient method was devised for determining beryl- lium in a complex beryllium organic compound. The compound was wet ashed using sulfuric acid, and the ash was identified as BeSOa by X-ray diffraction.
In some instances, other techniques are of great value in differentiating compounds for which the diffraction patterns are quite similar. This situation occurs rela- tively frequently in inorganic systems. A notable ex- ample is the case of FeO, COO and Cu10 which have virtually identical "d" spacings although the intensities of the spacings are different. Emission spectrography is the most valuable technique for identifying metallic constituents, and it is used routinely in these labora- tories to complement the X-ray results, particularly when complex mixtures are being analyzed.
JOURNAL OF CHEMICAL EDUCATION
One of the principal values of X-ray diffraction for qualitative analysis is the ability to analyze very small samples. Our laboratory was asked to identify a minute flake-like contaminant in a polymer sample. The particle, which was about I mm. long and 0.2 rnm. thick, was excised from the polymer with the help of a binocular microscope. The tiny fragment was then stuck on a short length of wire, and an X-ray pattern was ohtained using a powder camera. Two crystalline components, TiOn (rutile) and anhydrous CaSO4 were readily identified from the diffraction pattern. Addi- tional evidence obtained with the infrared "micro- scope" led to the conclusion that the particle was a paint fragment.
POLYMER STRUCTURE STUDIES
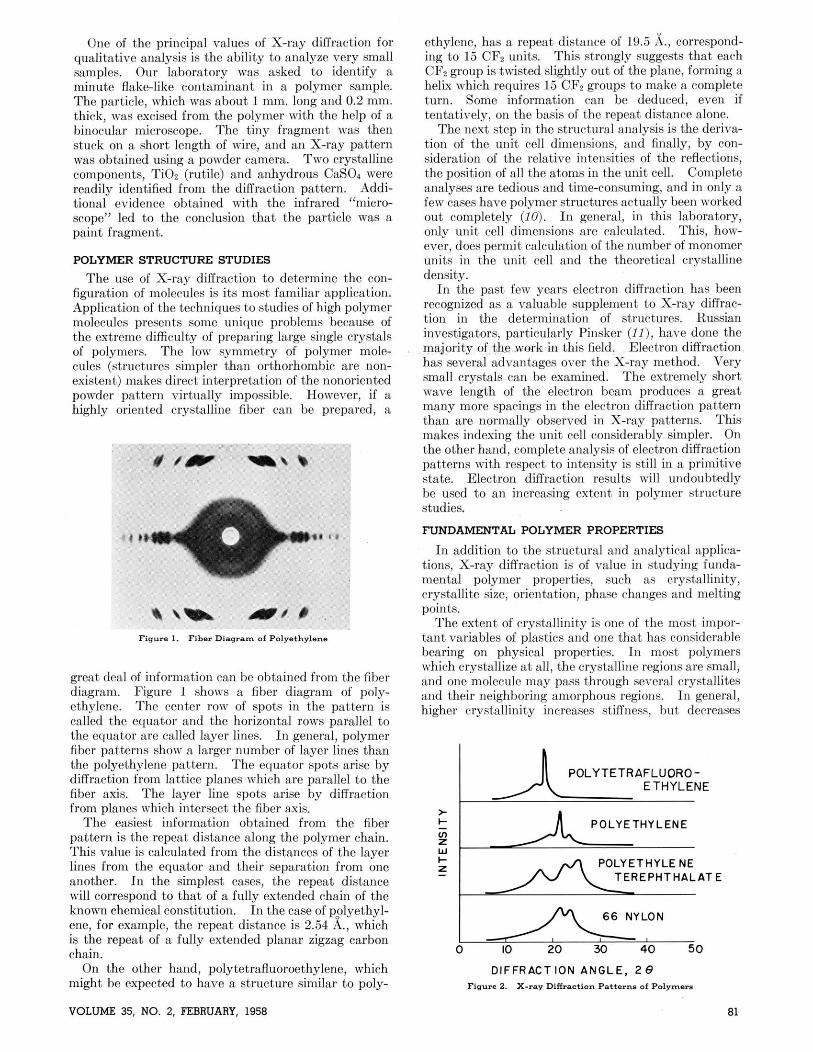
The use of X-ray diffraction to determine the con- figuration of molecules is its most familiar application. Application of the techniques to studies of high polymer molecules presents some unique problems because of the extreme difficulty of preparing large single crystals of polymers. The low symmetry of polymer mole- cules (structures simpler than orthorhombic are non- existent) makes direct interpretation of the nonoriented powder pattern virtually impossible. However, if a highly oriented crystalline fiber can be prepared, a
Figure 1. Fiber Diagram of Polyethylene
great deal of information can be ohtained from the fiber diagram. Figure 1 shows a fiber diagram of poly- ethylene. The center row of spots in the pattern is called the equator and the horizontal rows parallel to the equator are called layer lines. In general, polymer fiber patterns show a larger number of layer lines than the polyethylene pattern. The equator spots arise by diffraction from lattice planes which are parallel to the fiber axis. The layer line spots arise by diffraction from planes which intersect the fiber axis.
The easiest information obtained from the fiber pattern is the repeat distance along the polymer chain. This value is calculated from the distances of the layer lines from the equator and their separation from one another. In the simplest cases, the repeat distance will correspond to that of a fully extended chain of the known chemical constitution. In the case of p2lyethyl- ene, for example, the repeat distance is 2.54 h., which is the repeat of a fully extended planar zigzag carbon chain.
On the other hand, polytetrafluoroethylene, which might be expected to have a structure similar to poly-
ethylene, has a repeat distance of 19.5 A., correspond- ing to 15 CF2 units. This strongly suggests that each CF2 group is twisted slightly out of the plane, forming a helix which requires 15 CF2 groups to make a complete turn. Some information can be deduced, even if tentatively, on the basis of the repeat distance alone.
The next step in the structural analysis is the deriva- tion of the unit cell dimensions, and finally, by con- sideration of the relative intensities of the reflertions, the position of all the atoms in the unit cell. Complete analyses are tedious and time-consuming, and in only a few cases have polymer structures actually been worked out completely (10). In general, in this laboratory, only unit cell dimensions are calculated. This, how- ever, does permit calculation of the number of monomer units in the unit cell and the theoretical crystalline density.
In the past few years electron diffraction has been recognized as a valuable supplement to X-ray diffrac- tion in the determination of structures. Russian investigators, particularly Pinsker (II), have done the majority of the work in this field Electron diffraction has several advantages over the X-ray method. Very small crystals can be examined. The extremely short wave length of the electron beam produces a great many more spacings in the electron diffraction pattern than are normally observed in X-ray patterns. This makes indexing the unit cell considerably simpler. On the other hand, complete analysis of electron diffraction patterns with respect to intensity is still in a primitive state. Electron diffraction results will undoubtedly be used to an increasing extent in polymer structure studies.
m D A M E N T A L POLYMER PROPERTIES
In addition to the structural and analytical applica- tions, X-ray diffraction is of value in studying funda- mental polymer properties, such as crystallinity, crystallite size, orientation, phase changes and melting points.
The extent of crystallinity is one of the most impor- tant variables of plastics and one that has considerable bearing on physical properties. In most polymers which crystallize at all, the crystalline regions are small, and one molerule may pass through several crystallites and their neighboring amorphous regions. In general, higher crystallinity increases stiffness, but decreases
POLYTETRAFLUORO- 1 A ETHYLENE
POLYETHYLENE
I- POLYETHYLENE TEREPHTHALAT E
DIFFRACTION ANGLE, 2e Fig- 2. X-ray Difiaction Patterns of Polymnrr
VOLUME 35, NO. 2, FEBRUARY, 1958
0 10 2 0 30 4 0
DIFFRACTION ANGLE
Figure 3. Amorphous content of Teflon TetraBuolo- ethylene Renin
toughness, so that an optimum value of crystallinity will give the proper balance of physical properties for given applications. As a consequence one of the first questions asked about a new polymer is "Is it crystalline?"
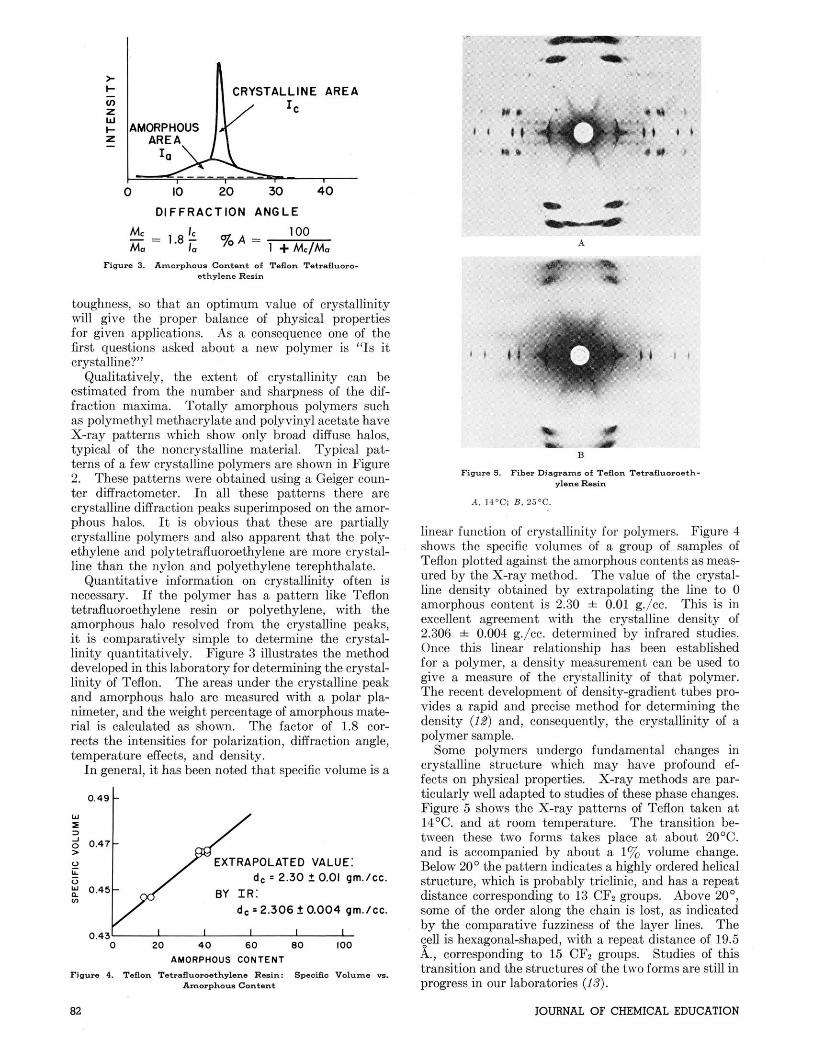
Qualitatively, the extent of crystallinity can be estimated from the number and sharpness of the dif- fraction maxima. Totally amorphous polymers such as polymethyl methacrylate and polyvinyl acetate have X-ray patterns which show only broad diffuse halos. typical of the noncrystalline material. Twical pat- Gins of a few crystaliine polymers are shownin ~ i g u r e 2. These patterns were obtained using a Geiger coun- Figure 5. Fiber Diagrama of Teflon Tetrafluoroeth-
dancRasin , . . . . . . ..... . ter diiractometer. In all these patterns there are
A , 14'C: B. 25-C. crvstalline diffraction ~ e a k s su~erim~osed on the amor- pgous halos. It is dbvious ihat ihese are partially crystalline polymers also apparent that the poly- linear function of crystallinity for polymers. Figure 4
ethylene and polytetrafluoroethylene are more crystal- the 'peeific a group of line than the nylon and polyethylene terephthalate. Teflon plotted against the amorphous contents as meas-
~ ~ ~ ~ t i t ~ t i ~ ~ information on crystallinity often is ured by the X-ray method. The value of the crystal-
necessary. 1f the polymer has a pattern like ~ ~ f l ~ ~ line density obtained by extrapolating the line $0 0
ktrafluoroethylene resin or polyethylene, with the morphous content is 2.30 * 0.01 g./cc. This is in
amorphous halo resolved from the crystalline peaks, excellent agreement with the crystalline density of
it is comparatively simple to determine the crystal- 2.306 + 0.004 g./cc. determined by infrared studies. linity quantitatively, ~i~~~~ illustrates the method Once this linear relationship has been established developed in this laboratory for determining the crystal- a polymer, a measurement can be wed to
liuity of ~ ~ f l ~ ~ . ~h~ areas under the crystalline peak give a measure of the crystallinity of that polymer.
and amorphous halo are measured with a polar pla- The recent development of density-gradient tubes pro- nimeter, and the weight percentage of amorphous vides a rapid and precise method for determining the
rial is as shown. ~h~ factor of 1.8 tor- density (18) and, consequently, the crystallinity of a
rects the intensities for polarization, diffraction angle, polymer
temperature effects, and density. Some polymers undergo fundamental changes in rn general, it has heen noted that specific volume is a crystalline structure which may have profound ef-
fects on ~hysical ~ ro~er t i e s . X-ray methods are var-
Y I 3
0.47 > 0 EXTRAPOLATED VALUE: Y o d, = 2.30 2 0.01 g m . l c c .
0.45 V)
BY I R : d, = 2.306 t 0.004 g m . l c c .
0 . 4 3 ~ I I I I I 0 20 4 0 60 80 100
AMORPHOUS CONTENT
Figur. 4. T-flon T.trdu0roethyl.n. Resin: Sp.ci5c Volume vr. Amaphova cont-nt
titularly %I adaitedto studies of these phase changes. Figure 5 shows the X-ray patterns of Teflon taken a t 14°C. and a t room temperature. The transition be- tween these two forms takes place a t about 20°C. and is accompanied by about a 1% volume change. Below 20' the pattern indicates a highly ordered helical structure, which is probably triclinic, and has a repeat distance corresponding to 13 CF2 groups. Above 20°, some of the order along the chain is lost, as indicated by the comparative fuzziness of the layer lines. The cell is hexagonal-shaped, with a repeat distance of 19.5 A., corresponding to 15 CF2 groups. Studies of this transition and the structures of the two forms are still in progress in our laboratories ( I S ) .
JOURNAL OF CHEMICAL EDUCATION
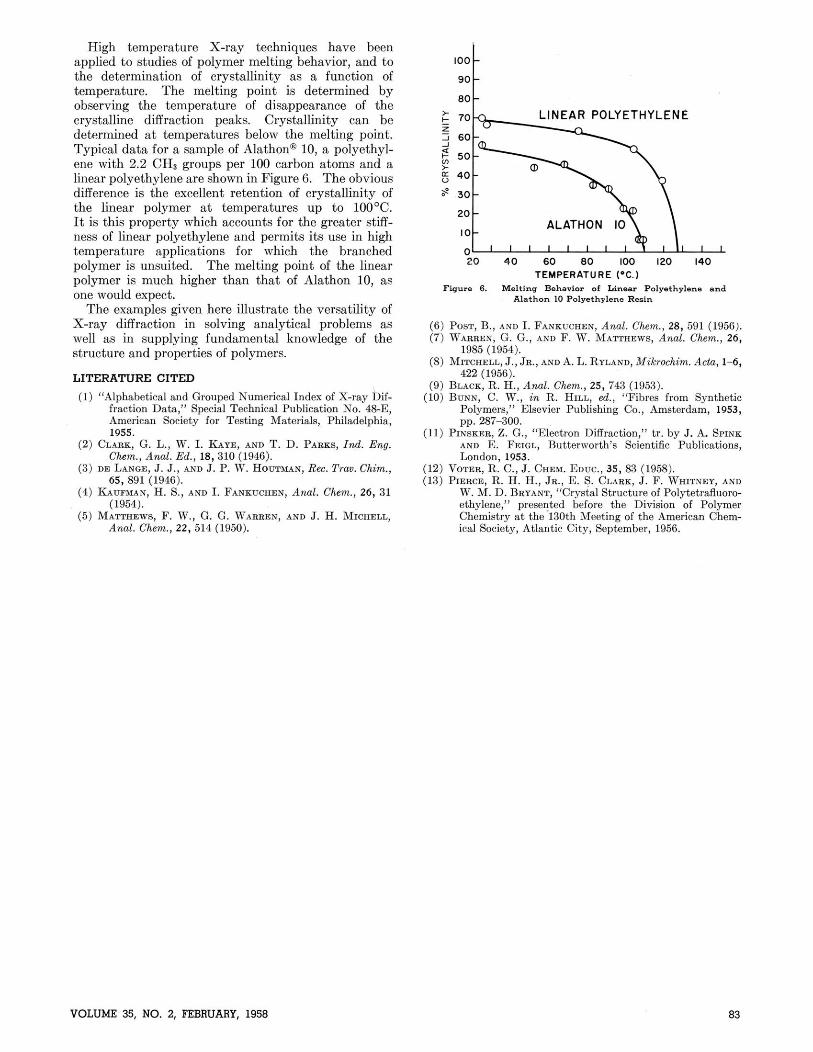
High temperature X-ray techniques have been applied to studies of polymer melting behavior, and to the determination of crystallinity as a function of so temperature. The melting point is determined by -,, I observing the temperature of disappearance of the crvstalline diffraction ueaks. Crvstallinitv can be u N E A R P o w E T H Y L E N t
dLtermined a t tempera&res below- the melting point. Typical data for a sample of Alathon@ 10, a polyethyl- ene with 2.2 CHa groups per 100 carbon atoms and a linear polyethylene are shown in Figure 6. The obvious 40 difference is the excellent retention of cnistallinitv of the linear polymer a t temperatures up to 1 0 0 ~ ~ . It is this property which accounts for the greater stiff-
10 ALATHON 10
ness of linear polyethylene and permits its use in high temperature applications for which the branched 20u o polymer is unsuited. The melting point of the linear 20 40 60 80 100 120 140
polymer is much higher than that of Alathon 10, ae TEMPERATURE P C . ) Figure 6. Melting Behavior of Lin- Polyethylene and
one would expect. A I - ~ ~ O ~ 10 P ~ I ~ ~ ~ ~ ~ I ~ ~ ~ ~ e g i ~
The examples given here illustrate the versatility of X-ray diffraction in solving analytical problems as (6) POST, B., AND I. FANKUCHEN, Anal. Chem., 28, 591 (1956). well as in supplying fundamental knowledge of the (7) WARREN, G. G., AND F. W. MAITHEWS, Anal. Chem., 26,
structure and properties of polymers. 1985 (1954). (8) MITCHELL, J., JR., AND A. L. RYLAND, Mikrochim. Ach, 1-6,
LITERATURE CITED
(1) "Alphahetical and Grouped Numerical Index of X-ray Dif- freetion Data," Special Technical Publication No. 4&E, American Society for Testing Matmisls, Philadelphia, 1955.
(2) CL&, G. L., W. I. &YE, AND T. D. PARKS, Ind. Eng. Chem., Anal. Ed., 18,310 (1946).
(3) DE LANQE, J. J., AND J. P. W. HOUTXAN, Ree. Trav. Chim.,
(4) KAUFMAN, H. S.. A N D I. FANKUCHEN, Anal. Chem.. 26, 31 (1954).
(5) MATTHEWS, F. W., G. G. WARREN, AND J. H. MICBELL, Anal. Chern., 22, 514 (1950).
422 (1956). BLACK, R. H., Anal. Chem., 25, 743 (1953). BWNN, C. W., in R. HILL, ed., "Fibres from Synthetic
Polymers," Elsevier Publishing Co., Amsterdam, 1953, nn. 287-300. . ~ . ~ ~ - ~~~~
PINSKER, Z. G., "Electron Diffraction," tr. by J. A. SPINK AND E. FEIQL, Butterworth's Scientific Publicahions, London, 1953.
VOTER, R. C., J. CHEM. EDUC., 35, 83 (1958). PIERCE, R. H. H., JR., E. 5. CLARK, J. F. WHITNEY, AND
W. M. D. BRYANT, "Crystal Structure of Polytetrafluoro- ethylene," presented before the Division of Polymer Chemistrv a t the 130th Meetine of the American Chem- " ical Society, Atlantic City, September, 1956.
VOLUME 35, NO. 2, FEBRUARY, 1958
Related Documents