61 ECB Monthly Bulletin August 2007 ARTICLES ADJUSTMENT OF GLOBAL IMBALANCES IN A FINANCIALLY INTEGRATING WORLD The global economy continues to be characterised by large current account deficits and surpluses in several large economies, as reflected in the direction of global capital flows. These global imbalances have sparked an intense and controversial debate about what their underlying causes are and how such imbalances may be resolved. The issue is important, as a potentially disorderly unwinding could pose a risk for the global economy and the stability of the international financial system. This article offers a definition of global imbalances and various proxies to measure their complexity in order to help understand their significance and evolution. In analysing the causes of the phenomenon, the article distinguishes between structural factors – those that correspond to long-run trends and reflect underlying structural characteristics of the global economy – and cyclical factors – those that may be reversed relatively quickly. Structural factors include the role of incomplete financial globalisation, financial imperfections, the increasing trade integration of emerging Asian countries – where saving rates tend to be structurally high – and the effect of business cycle moderation. Cyclical factors include the dynamics of household savings, the role of financial asset and house prices, the impact of growth differentials across countries, the effect of public savings and oil prices. While any classification of this type is subject to caveats, given that all economic factors can have both a cyclical and a structural dimension – and taking into account that the cyclical dimension can, itself, be heavily influenced by the policy mix – this distinction is useful in understanding the likely evolution of global imbalances over time. To keep the focus of this article, some aspects of global imbalances – such as the consequences of global imbalances on global liquidity creation and on long-term interest rates – are not directly discussed here. The article concludes by discussing policy implications. Clearly, recent developments do not point to a worsening of global imbalances, owing in particular to the ongoing pattern of growth-rebalancing across countries. Although the risk of a disorderly adjustment is, to date, relatively contained, it cannot be neglected. An appropriate policy response therefore remains essential to ensure a smooth adjustment over the medium term, as agreed in G7 communiqués and in the recent IMF multilateral consultation process on this topic. 1 INTRODUCTION Large imbalances in countries’ current account positions that also have implications for the global economy are not a new phenomenon but have materialised periodically over the last few centuries. They were present in the late 19th century between the United Kingdom and its colonies, for instance, during the era of the gold standard. More recently, the United States recorded a large current account deficit in the 1980s, which has since undergone significant variations and risen to unprecedented levels in recent years. In the 1980s and 1990s, several emerging markets borrowed massively from advanced economies before being hit by severe financial crises (Latin America in the 1980s and in 1994, Asia in 1997 and Russia in 1998). Such crises were also characterised by significant contagion across countries and sometimes across regions, highlighting the importance of systemic risks in a globalised economy. The issue of global imbalances has again arisen in the current decade. More than a mere increase in the magnitude of global current account positions, what is particularly noticeable this time is the concentration of the deficits in one single country, the United States, which is now absorbing roughly 75% of the net consolidated current account of those regions with surpluses (see Chart 1). Another peculiarity of the current constellation of international net lending positions is the fact that the counterpart of the US deficit is mostly accounted for by non- industrial economies, primarily in East Asia, and oil-exporting countries. In 2006 China recorded a current account surplus equal to 9.1% of its GDP, while other emerging Asian economies registered an aggregate surplus of 3.4% and oil-exporting countries one of nearly 15%. This is somewhat paradoxical from the perspective of macroeconomic theory, as it means that emerging markets have increasingly become net lenders and advanced industrial

Welcome message from author
This document is posted to help you gain knowledge. Please leave a comment to let me know what you think about it! Share it to your friends and learn new things together.
Transcript
61ECB
Monthly BulletinAugust 2007
ART ICLES
ADJUSTMENT OF GLOBAL IMBALANCES IN A FINANCIALLY INTEGRATING WORLDThe global economy continues to be characterised by large current account deficits and surpluses in several large economies, as reflected in the direction of global capital flows. These global imbalances have sparked an intense and controversial debate about what their underlying causes are and how such imbalances may be resolved. The issue is important, as a potentially disorderly unwinding could pose a risk for the global economy and the stability of the international financial system. This article offers a definition of global imbalances and various proxies to measure their complexity in order to help understand their significance and evolution. In analysing the causes of the phenomenon, the article distinguishes between structural factors – those that correspond to long-run trends and reflect underlying structural characteristics of the global economy – and cyclical factors – those that may be reversed relatively quickly. Structural factors include the role of incomplete financial globalisation, financial imperfections, the increasing trade integration of emerging Asian countries – where saving rates tend to be structurally high – and the effect of business cycle moderation. Cyclical factors include the dynamics of household savings, the role of financial asset and house prices, the impact of growth differentials across countries, the effect of public savings and oil prices. While any classification of this type is subject to caveats, given that all economic factors can have both a cyclical and a structural dimension – and taking into account that the cyclical dimension can, itself, be heavily influenced by the policy mix – this distinction is useful in understanding the likely evolution of global imbalances over time. To keep the focus of this article, some aspects of global imbalances – such as the consequences of global imbalances on global liquidity creation and on long-term interest rates – are not directly discussed here. The article concludes by discussing policy implications. Clearly, recent developments do not point to a worsening of global imbalances, owing in particular to the ongoing pattern of growth-rebalancing across countries. Although the risk of a disorderly adjustment is, to date, relatively contained, it cannot be neglected. An appropriate policy response therefore remains essential to ensure a smooth adjustment over the medium term, as agreed in G7 communiqués and in the recent IMF multilateral consultation process on this topic.
1 INTRODUCTION
Large imbalances in countries’ current account positions that also have implications for the global economy are not a new phenomenon but have materialised periodically over the last few centuries. They were present in the late 19th century between the United Kingdom and its colonies, for instance, during the era of the gold standard. More recently, the United States recorded a large current account deficit in the 1980s, which has since undergone significant variations and risen to unprecedented levels in recent years. In the 1980s and 1990s, several emerging markets borrowed massively from advanced economies before being hit by severe financial crises (Latin America in the 1980s and in 1994, Asia in 1997 and Russia in 1998). Such crises were also characterised by significant contagion across countries and sometimes across regions, highlighting the importance of systemic risks in a globalised economy.
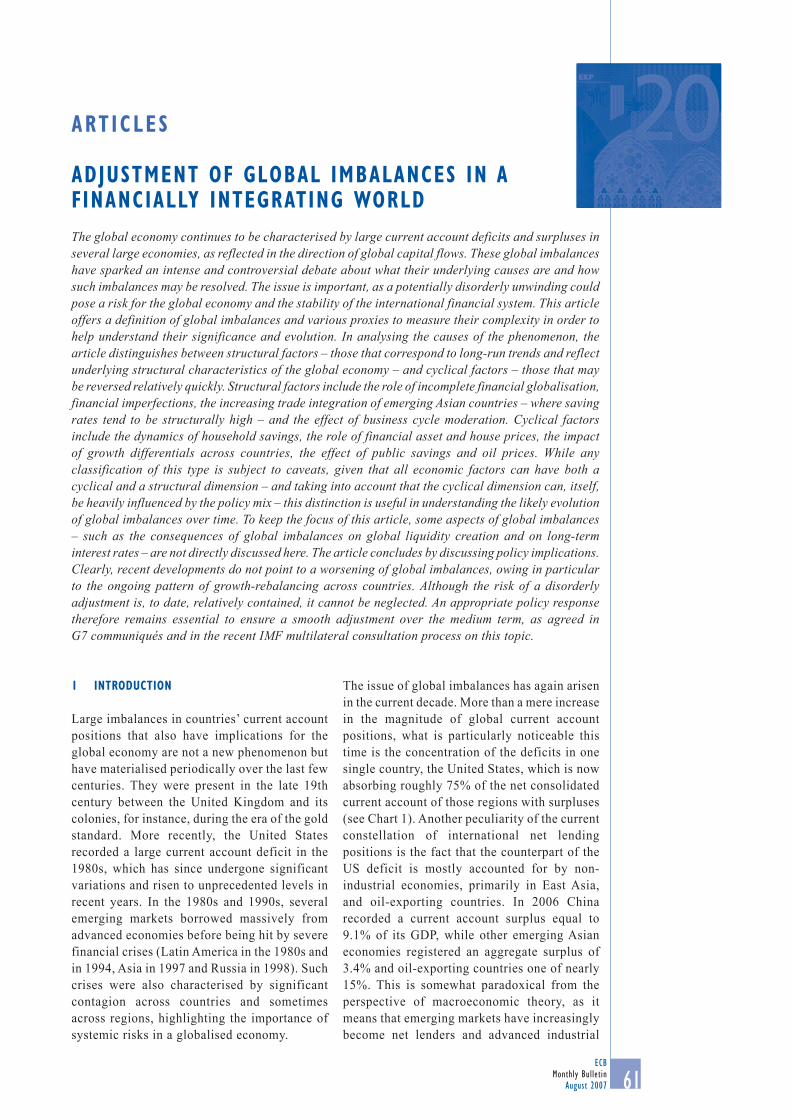
The issue of global imbalances has again arisen in the current decade. More than a mere increase in the magnitude of global current account positions, what is particularly noticeable this time is the concentration of the deficits in one single country, the United States, which is now absorbing roughly 75% of the net consolidated current account of those regions with surpluses (see Chart 1). Another peculiarity of the current constellation of international net lending positions is the fact that the counterpart of the US deficit is mostly accounted for by non-industrial economies, primarily in East Asia, and oil-exporting countries. In 2006 China recorded a current account surplus equal to 9.1% of its GDP, while other emerging Asian economies registered an aggregate surplus of 3.4% and oil-exporting countries one of nearly 15%. This is somewhat paradoxical from the perspective of macroeconomic theory, as it means that emerging markets have increasingly become net lenders and advanced industrial
62ECB Monthly BulletinAugust 2007
economies net borrowers. However, in recent years, the euro area current account has been broadly balanced.
The global imbalances that emerged during the last decade represent a challenge to the international community, for two main reasons. First, they entail the risk of a disorderly adjustment, which could adversely affect the prosperity of the global economy and the stability of the international financial system. Second, they reflect, to some extent, distortions in the global allocation of capital. Such distortions are mirrored, in particular, in large foreign exchange interventions (in East Asia and several oil-exporting countries) and incomplete financial development in many emerging market economies, as well as in significant labour and product market regulation (in several advanced economies). Even if the risks of a disorderly adjustment were not to materialise, the presence of such distortions represents a welfare loss for the world economy. This article therefore aims to analyse the factors behind the current global imbalances, outline possible adjustment mechanisms and review the required policy response.
Section 2 introduces a definition of global imbalances and presents a number of indicators that measure the evolution of global imbalances over time. Section 3 reviews the main cyclical and structural factors behind global imbalances and Section 4 discusses policy measures and possible adjustment mechanisms, while Section 5 sets out the conclusions.
2 DEFINITION AND MEASUREMENT
DEFINING GLOBAL IMBALANCES
Although the notion of global imbalances is often referred to, it is rarely defined. It may be useful to define global imbalances as “external positions of systemically important economies that reflect distortions or entail risks for the global economy”. This definition, which is broader than the definition restricting global imbalances to the magnitude of the US deficit, highlights three key aspects of global imbalances.
First, defining global imbalances as a set of external positions emphasises that they are not merely a real phenomenon related to current account positions in terms of flows, but that they can also have a financial dimension in terms of the structure of financial stocks. Global imbalances are not restricted to flow concepts such as the current and financial accounts of the balance of payments; they also relate to stock concepts such as the international investment position. For example, the composition of foreign assets and liabilities, in terms of currency breakdown, liquidity and risk, has proved to be particularly relevant in past current account adjustments.1 Another implication of this definition is that it does not rely on a particular threshold above which current
1 Many emerging markets have, in the past, experienced balance of payment crises in spite of relatively contained current account deficits. Such crises occurred for a number of reasons, such as currency mismatches between foreign assets (in domestic currency) and liabilities (in foreign currency), weak domestic financial sectors, overvalued exchange rates and excessive government debt.
Chart 1 Current account balances for selected countries and regions
(USD billions)
Source: IMF World Economic Outlook.
-1,200-1,000
-800-600-400-200
0200400600800
1,0001,200
-1,200-1,000-800-600-400-20002004006008001,0001,200
1990 1992 1994 1996 1998 2000 2002 2004 2006
Latin AmericaChinaJapanother Asian countriesoil-exporting countriesUnited Stateseuro areaCentral and Eastern Europe
63ECB
Monthly BulletinAugust 2007
ART ICLES
Adjustment of global imbalances
in a financially integrating world
account positions are deemed to constitute an imbalance, which may vary from one country to another and over time.2
Second, focusing on all systemically important economies highlights the global nature of the issue. Studying only the United States would omit the role of the countries that run the corresponding current account surpluses, as the accumulation of net savings in Asia and in oil-exporting countries, for instance, is one of the key factors behind global imbalances. In practice, it is hard to define which countries are systemically important: some past financial crises have been triggered by relatively small economies, thus underlining that developments in such economies can also have systemic repercussions.
Third, the definition suggests a double motivation to monitor issues related to global imbalances closely, namely the fact that they entail risks and reflect distortions. The risks are primarily potentially adverse financial market developments resulting from an unexpected shock, but also include risks – such as rising protectionism – that could negatively affect the global economy.3 However, potential risks associated with large external imbalances are not the only reason for the international financial community to examine the issue. Another key element to consider when assessing the magnitude and the evolution of global imbalances is the number of distortions that they are associated with. Indeed, there is clear evidence that today’s global capital flows are not entirely the result of free market forces but that various distortions have a bearing on international net lending positions. These distortions particularly take the form of i) insufficient flexibility in exchange rate regimes, which leads to large-scale interventions in the foreign exchange markets, ii) incomplete financial market liberalisation in a number of emerging markets, which forces savings to leave the country in search of liquid and safe financial assets4 and iii) excessive regulation in the product and labour markets, also in advanced economies. These distortions negatively affect
global factor allocation by impacting trade and production patterns, and are thus suboptimal in terms of global economic welfare. Hence, the presence, in the world economy, of distortions sustaining global imbalances is also a source of concern for policy-makers, even if the risks of unwinding were to remain contained.
MEASURING GLOBAL IMBALANCES
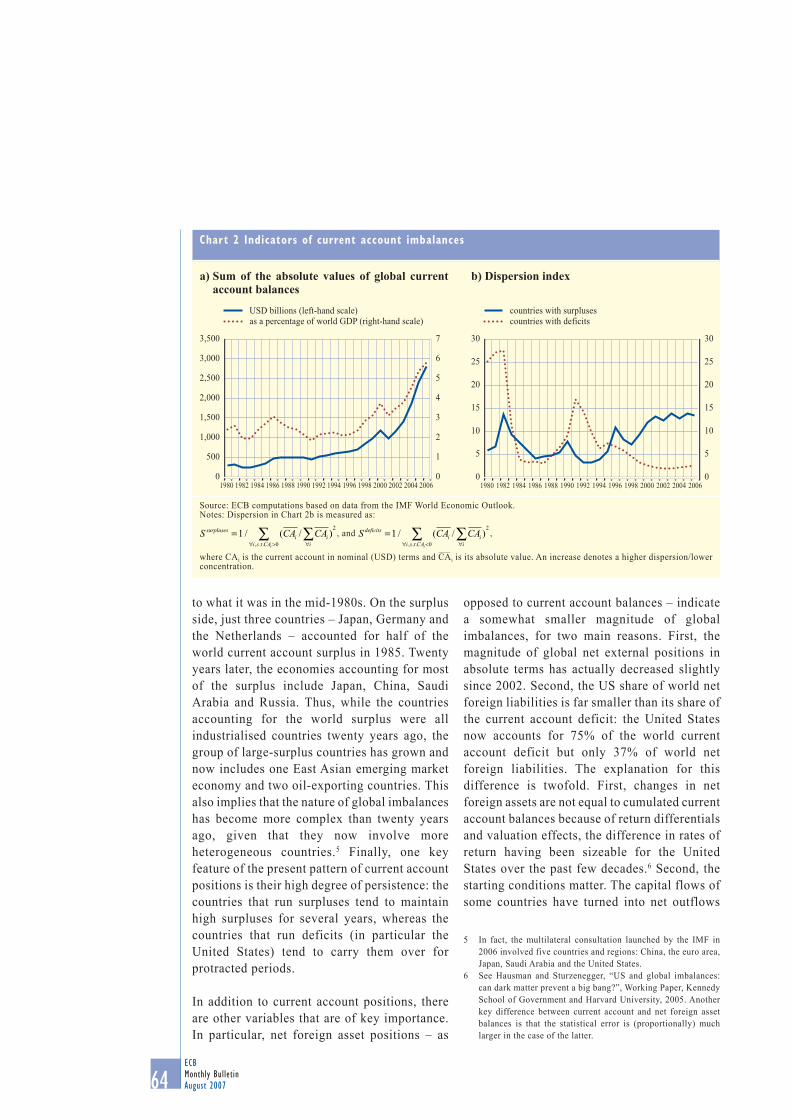
Several statistical indicators or proxies may be useful to shed light on the multi-faceted nature of global imbalances relating, in particular, to the magnitude and degree of dispersion of current account positions, the magnitude and dispersion of net foreign asset positions, and the level of international reserves. First, the sum of the absolute value of all current account positions has recorded a substantial rise in recent years (see Chart 2a). The fact that countries have been recording larger current account positions over time (also scaled by world GDP) is not necessarily a sign of a growing imbalance, since it could simply imply that countries are taking advantage of globalisation to trade more and enhance the diversification of their portfolios. However, it appears that this evolution does not concern all countries equally. Chart 2b shows a statistical measure for the dispersion of current account surpluses and deficits, with a rise implying an increase in dispersion. These measures indicate that, in the past ten years, global deficits have been increasingly concentrated, whereas surpluses have been increasingly spread across countries. On the deficit side, the degree of concentration is currently very similar
2 Economic theory does not require all current account positions to be balanced. From an intertemporal perspective, for example, it is perfectly rational for a rapidly growing economy to borrow temporarily against future income. However, in practice it is difficult to derive a threshold above which a given deficit is deemed unsustainable.
3 The economic cost of a protectionist backlash could indeed be substantial, as suggested for example in H. Faruqee, D. Laxton, D. Muir and P. Pesenti, “Would protectionism defuse global imbalances and spur economic activity? A scenario analysis”, Staff Reports, Federal Reserve Bank of New York, No 268, December 2006.
4 Related to this, portfolio inflows into emerging markets also tend to be contained owing to capital account restrictions.
64ECB Monthly BulletinAugust 2007
to what it was in the mid-1980s. On the surplus side, just three countries – Japan, Germany and the Netherlands – accounted for half of the world current account surplus in 1985. Twenty years later, the economies accounting for most of the surplus include Japan, China, Saudi Arabia and Russia. Thus, while the countries accounting for the world surplus were all industrialised countries twenty years ago, the group of large-surplus countries has grown and now includes one East Asian emerging market economy and two oil-exporting countries. This also implies that the nature of global imbalances has become more complex than twenty years ago, given that they now involve more heterogeneous countries.5 Finally, one key feature of the present pattern of current account positions is their high degree of persistence: the countries that run surpluses tend to maintain high surpluses for several years, whereas the countries that run deficits (in particular the United States) tend to carry them over for protracted periods.
In addition to current account positions, there are other variables that are of key importance. In particular, net foreign asset positions – as
opposed to current account balances – indicate a somewhat smaller magnitude of global imbalances, for two main reasons. First, the magnitude of global net external positions in absolute terms has actually decreased slightly since 2002. Second, the US share of world net foreign liabilities is far smaller than its share of the current account deficit: the United States now accounts for 75% of the world current account deficit but only 37% of world net foreign liabilities. The explanation for this difference is twofold. First, changes in net foreign assets are not equal to cumulated current account balances because of return differentials and valuation effects, the difference in rates of return having been sizeable for the United States over the past few decades.6 Second, the starting conditions matter. The capital flows of some countries have turned into net outflows
5 In fact, the multilateral consultation launched by the IMF in 2006 involved five countries and regions: China, the euro area, Japan, Saudi Arabia and the United States.
6 See Hausman and Sturzenegger, “US and global imbalances: can dark matter prevent a big bang?”, Working Paper, Kennedy School of Government and Harvard University, 2005. Another key difference between current account and net foreign asset balances is that the statistical error is (proportionally) much larger in the case of the latter.
Chart 2 Indicators of current account imbalances
b) Dispersion index
Source: ECB computations based on data from the IMF World Economic Outlook. Notes: Dispersion in Chart 2b is measured as:
S CA CAsurplusesi i
ii s t CAi
=∀∀ >∑∑1
0
2/ ( / )
, . .
, and S CA CAdeficitsi i
ii s t CAi
=∀∀ <∑∑1
0
2/ ( / )
, . .
,
where CAi is the current account in nominal (USD) terms and CAi is its absolute value. An increase denotes a higher dispersion/lower concentration.
a) Sum of the absolute values of global current account balances
0
500
1,000
1,500
2,000
2,500
3,000
3,500
0
1
2
3
4
5
6
7
USD billions (left-hand scale)as a percentage of world GDP (right-hand scale)
1980 1982 1984 1986 1988 1990 1992 1994 1996 1998 2000 2002 2004 2006
countries with surplusescountries with deficits
1980 1982 1984 1986 1988 1990 1992 1994 1996 1998 2000 2002 2004 20060
5
10
15
20
25
30
0
5
10
15
20
25
30
65ECB
Monthly BulletinAugust 2007
ART ICLES
Adjustment of global imbalances
in a financially integrating world
only recently, while they still record net foreign liabilities. Mexico, for example, continues to have significant net foreign liabilities (45% of GDP in 2005), although its current account position was close to balance in 2005, due to current account deficits accumulated in the past.
Finally, another key variable is the level of international reserves, which has increased substantially in several regions of the world, particularly in East Asia.7 In China, the level of international reserves amounted to USD 1.2 trillion at the beginning of 2007. While the accumulation of international reserve assets is not a distortion per se (but may, for instance, partly reflect precautionary motives8), it can be seen as an indirect measure of distortions when largely associated with foreign exchange interventions.
In summary, global imbalances have widened since the beginning of the 1990s and accelerated since the early 2000s, although the magnitude of this increase may vary across indicators. Furthermore, recent developments do not all point to a worsening of positions. Owing to the multi-faceted nature of these imbalances, which goes beyond the mere dispersion of current account positions in the world, it is necessary to examine together the indicators reviewed in this section to assess the evolution of global imbalances over time.
3 THE ROLE OF CYCLICAL AND STRUCTURAL FACTORS
In order to understand the nature of global imbalances and to be able to gauge their likely evolution and degree of sustainability over time, it is useful to make a distinction between structural factors and cyclical factors. While structural factors correspond to long-run trends exhibiting significant inertia, cyclical factors correspond to shorter-run factors that can be reversed rather quickly – in particular, cyclical factors are those that affect the allocation of global demand in the short run.9 Of course, this
distinction is especially useful for analytical purposes, these two types of factors being sometimes closely related in practice. To take an example, a given rise in world oil prices may be attributed both to short-run factors (e.g. geopolitical tensions in some of the oil-producing countries) and to broader long-run factors (e.g. a structural increase in demand from emerging market economies).10 Although the impact of each of these factors is difficult to evaluate precisely, several studies have attempted to provide estimates that can be used to gauge their relative importance.
CYCLICAL FACTORS
Of the wide range of cyclical factors that can affect the current account, five of them – asset prices, business cycles and, in particular, changes in domestic demand, public savings and oil prices – are of key importance.
Since the current account – given national account identities – is equal to the difference between domestic saving and domestic investment, fluctuations in asset prices can affect the national current account balance through their wealth effect on household consumption and net saving. In the United States, the increase in the current account deficit since the early 1990s has been associated with a fall in domestic net savings in the household sector (see Chart 3). Although the
7 Many oil-exporting countries do not accumulate foreign exchange reserves in spite of large cumulated current account surpluses. This is because their external assets are managed by heritage funds and therefore do not appear on the central bank’s balance sheets.
8 The accumulation of reserves partly corresponds to a precautionary motive, for example to cover a sufficient number of months of imports or to cover short-term debt to avoid a liquidity crisis (see M. Bussière and C. Mulder, “External vulnerability in emerging market economies: how high liquidity can offset weak fundamentals and the effects of contagion”, IMF Working Paper 1999/88).
9 Structural and cyclical factors could also be understood as follows: structural factors affect the equilibrium level warranted by the fundamentals, whereas cyclical factors refer to transitory movements around the equilibrium level.
10 On the role of oil prices and oil-exporting countries, see the article entitled “Oil-exporting countries: key structural features, economic developments and oil revenue recycling” in the July 2007 issue of the Monthly Bulletin.

66ECB Monthly BulletinAugust 2007
other sectors (the corporate and the government sectors) may have contributed to the overall decline in national net savings, an analysis of the reasons behind the fall in household net savings would be an important step towards understanding what triggered the rise in the US current account deficit. The link between household net savings and current account balances is in fact not limited to the United States, but also characterises several OECD countries (see Chart 4).
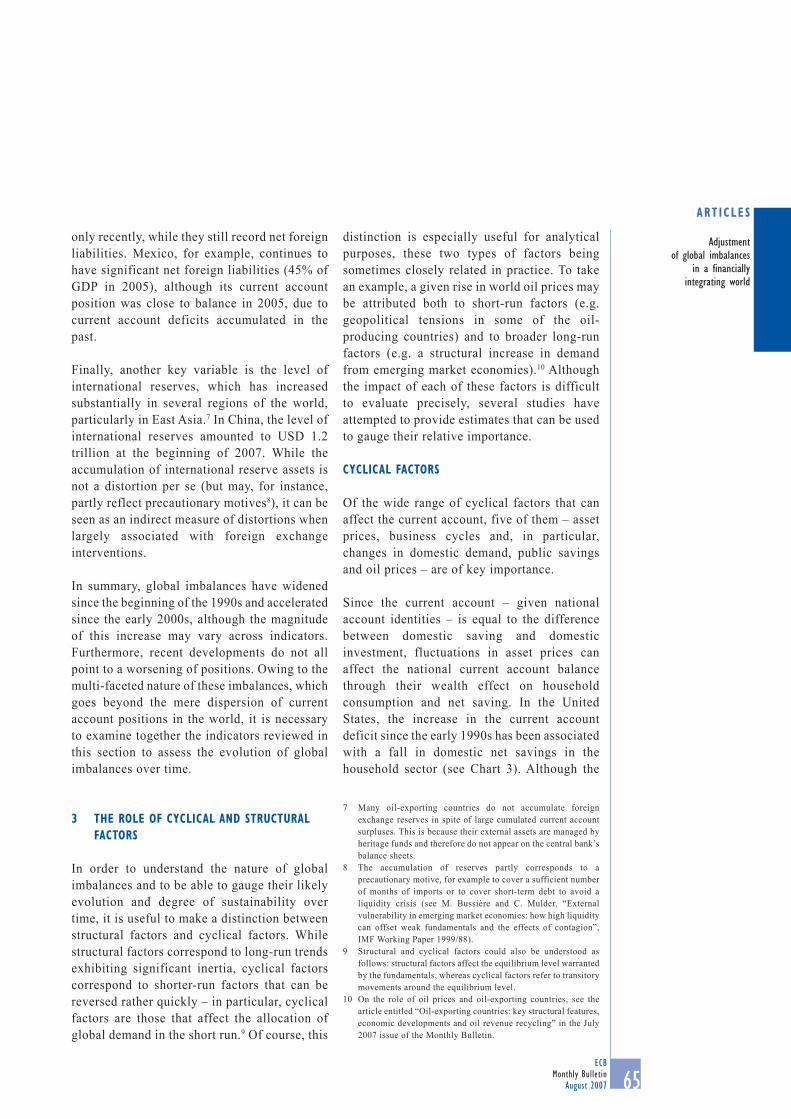
In turn, changes in household net savings can be related to a variety of factors, both cyclical and structural. Overall, it seems that variations in house prices – a largely cyclical factor – can have a strong effect on current account balances across countries. Changes in house prices are indeed negatively correlated with changes in current account balances across countries, as higher house prices can trigger higher consumption and reduce saving (see Chart 5). In the particular case of the United States, a fall in house prices and equity prices could therefore have significant effects on the US current account deficit by inducing a rise in domestic net savings. More generally, asset prices appear to be an important determinant of current account positions.11
Turning to China, over the past three years the rise in the trade balance has been accounted for
not only by the robust growth rate of exports, but also by a noticeable deceleration in imports, which was especially pronounced in the course of 2005 (see Chart 6). This deceleration may be partly due to long-run structural factors related to import substitution and to a deceleration in domestic investment. As investment is generally estimated to have a strong import content, changes in investment can have a significant impact on imports from the rest of the world. Domestic investment patterns can, in turn, be partly related to business cycle fluctuations.
Business cycle fluctuations induced by productivity shocks may indeed also constitute a key driver of global current account positions. If changes in economic growth and domestic demand are temporary in nature, the intertemporal approach to the current account suggests that the current account should be pro-cyclical: during high-growth periods, for example, when agents temporarily earn higher income, they will save and record trade surpluses in order to smooth consumption over time. Overall, however, there is ample evidence that the current account is counter-cyclical. Following a
Chart 3 US households’ net savings and the current account balance
(as a percentage of GDP)
Source: IMF World Economic Outlook.
Chart 4 Households’ net savings and the current account balance in advanced economies(average for 2001-05, as a percentage of GDP)
Source: OECD.
-8-6-4-202468
10
-8-6-4-20246810
personal savings minus household residential investmentcurrent account balance
197019721974197619781980198219841986198819901992199419961998200020022004-8-6-4-202468
101214
-8-6-4-202468101214
-12 -10 -8 -6 -4 -2 0 2 4 6
x-axis: average households’ savings-investment balancey-axis: average current account balance
AustraliaAustria
BelgiumCanada Denmark
FinlandNetherlands
Switzerland
Sweden
Japan
ItalyFranceGermany
Ireland
New ZealandSpain
United Kingdom
United States
11 It has been estimated that, in the past, a 10% rise in equity prices or house prices in the United States, relative to the rest of the world, has led to an increase of about 1% in the US current account deficit (see M. Fratzscher, L. Juvenal and L. Samo, “Asset prices, exchange rates and the current account”, ECB Working paper No 790, August 2007).
67ECB
Monthly BulletinAugust 2007
ART ICLES
Adjustment of global imbalances
in a financially integrating world
sufficiently persistent productivity shock, the current account balance is indeed expected to move towards a deficit as investment rises.12
Public savings may also play a role in current account fluctuations. In the United States, the coincidence of a fiscal and current account deficit in the mid-1980s and early 2000s was sometimes referred to as the “twin-deficit” relationship. Finally, the current account of most countries has been strongly influenced by oil price fluctuations in recent years. The effect of higher oil prices differs fundamentally across countries, positively affecting the balance of oil-exporting countries and negatively affecting that of net oil importers. The reason why oil prices are so important stems from the fact that demand for oil is very inelastic in oil-importing countries, at least in the short run.13 In the United States, the increase in oil prices that has taken place in recent years has contributed to the increase in the overall trade deficit through higher oil imports. Similarly, in oil-exporting countries, absorption capacities are limited in the short run, such that most of the windfall in oil revenues is reinvested abroad financially.
STRUCTURAL FACTORS
Aside from the cyclical factors, there are structural factors that affect the current account.
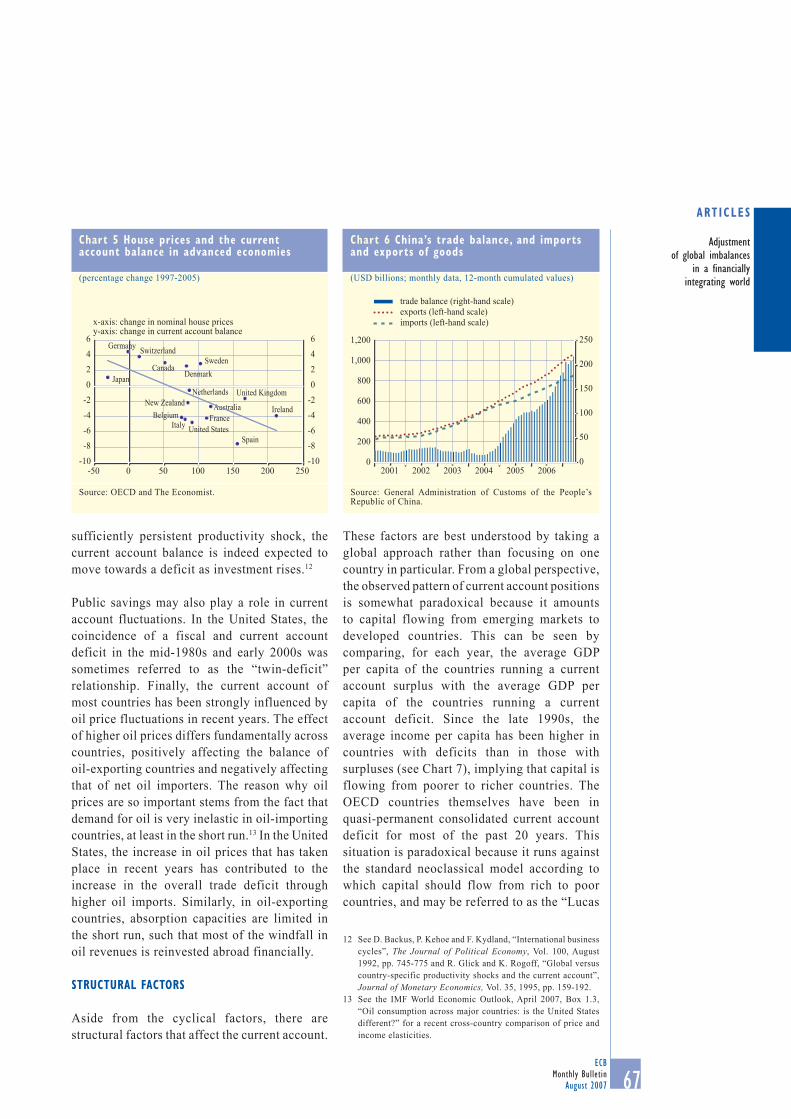
These factors are best understood by taking a global approach rather than focusing on one country in particular. From a global perspective, the observed pattern of current account positions is somewhat paradoxical because it amounts to capital flowing from emerging markets to developed countries. This can be seen by comparing, for each year, the average GDP per capita of the countries running a current account surplus with the average GDP per capita of the countries running a current account deficit. Since the late 1990s, the average income per capita has been higher in countries with deficits than in those with surpluses (see Chart 7), implying that capital is flowing from poorer to richer countries. The OECD countries themselves have been in quasi-permanent consolidated current account deficit for most of the past 20 years. This situation is paradoxical because it runs against the standard neoclassical model according to which capital should flow from rich to poor countries, and may be referred to as the “Lucas
12 See D. Backus, P. Kehoe and F. Kydland, “International business cycles”, The Journal of Political Economy, Vol. 100, August 1992, pp. 745-775 and R. Glick and K. Rogoff, “Global versus country-specific productivity shocks and the current account”, Journal of Monetary Economics, Vol. 35, 1995, pp. 159-192.
13 See the IMF World Economic Outlook, April 2007, Box 1.3, “Oil consumption across major countries: is the United States different?” for a recent cross-country comparison of price and income elasticities.
Chart 5 House prices and the current account balance in advanced economies
(percentage change 1997-2005)
Source: OECD and The Economist.
Chart 6 China’s trade balance, and imports and exports of goods
(USD billions; monthly data, 12-month cumulated values)
Source: General Administration of Customs of the People’s Republic of China.
x-axis: change in nominal house prices y-axis: change in current account balance
Belgium
CanadaDenmark
Netherlands
SwitzerlandSweden
ItalyFrance
IrelandNew Zealand
Spain
United Kingdom
United States
-10-8-6-4-20246
-10-8-6-4-20246
-50 0 50 100 150 200 250
Australia
Japan
Germany
0
200
400
600
800
1,000
1,200
0
50
100
150
200
250
trade balance (right-hand scale)exports (left-hand scale)imports (left-hand scale)
2001 2002 2003 2004 2005 2006
68ECB Monthly BulletinAugust 2007
paradox”.14 Understanding what drives this particular configuration of current account positions therefore represents an important step towards explaining global imbalances and their likely evolution over time.
Several explanations of the Lucas paradox have been put forward. Lucas himself provided a first possible interpretation, which emphasises the fact that in many emerging markets the risk-adjusted return on capital is not catching up with the returns observed in advanced economies. This would explain why investors do not invest in emerging markets, where returns are not as high as in advanced economies. However, this explanation has some drawbacks. Indeed, if investment and capital flows mostly resulted from differences in risk-adjusted returns on capital, countries that invest more should also receive more capital, which is, however, not the case: capital flows and investment (both expressed as a percentage of GDP) are not positively correlated across emerging economies. Indeed, they tend to be negatively correlated (see Chart 8).15
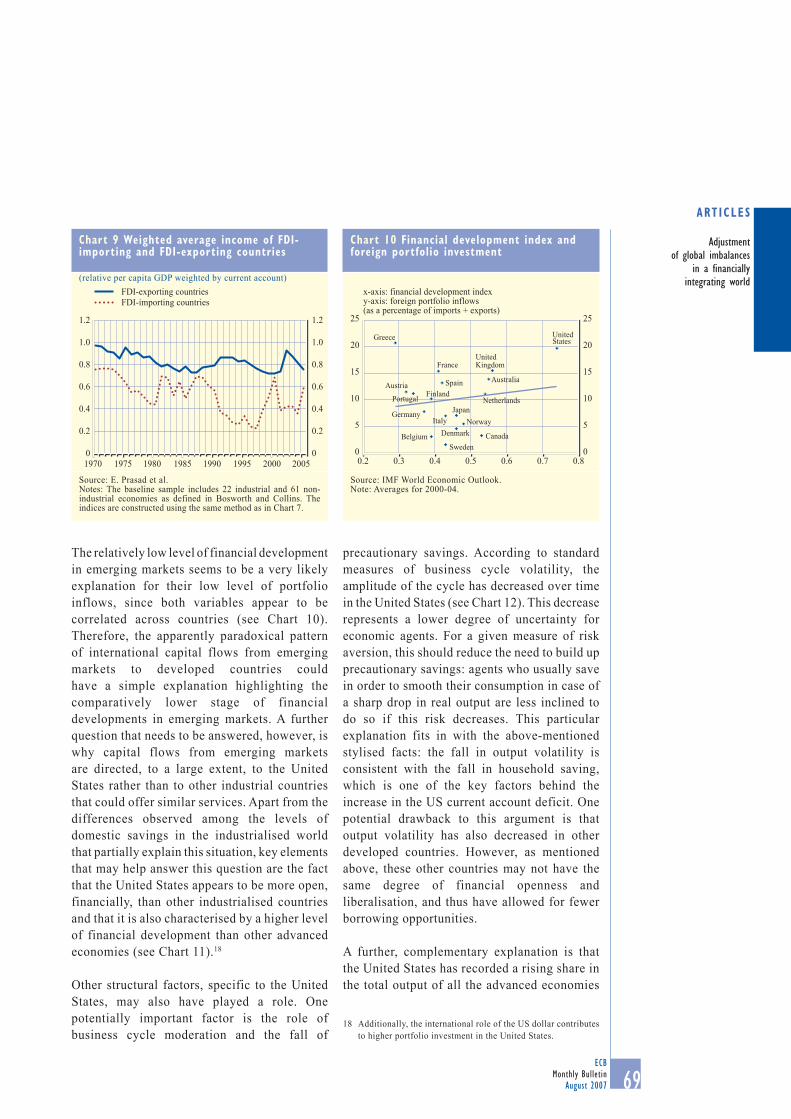
Nevertheless, it should be noted that some types of cross-border financial flows do seem to flow from industrialised countries to emerging markets. This is particularly the case of foreign direct investment (FDI): since 1970 the weighted average income of FDI-exporting countries has always been above that of FDI-importing countries (see Chart 9).16 In other words, comparatively richer countries tend to invest in comparatively poorer countries when it comes to FDI, in contrast to the pattern observed for overall net investment in Chart 7.
The role of incomplete financial liberalisation has received increasing attention as one of the most fundamental determinants of the current constellation of global net lending positions.17
14 See R. Lucas, “Why doesn’t capital flow from rich to poor countries?”, American Economic Review Papers and Proceedings, Vol. 80, No 2, May 1990, pp. 92-6. In the original article, Lucas pointed to the paradox that capital was flowing between developed economies. The current pattern is therefore even more paradoxical since capital flows from poorer countries to richer countries.
15 See P. O. Gourinchas and O. Jeanne, “Capital flows to developing countries: the allocation puzzle”, mimeo, IMF, 2006.
16 See E. Prasad, R. Rajan and A. Subramanian, “Foreign capital and economic growth”, mimeo, IMF, 2006.
17 See L. Bini Smaghi, “Globalization and monetary policy”, Journal of Policy Modeling, forthcoming.
Chart 7 Weighted average of income in surplus and deficit countries
(indices)
Source: E. Prasad et al.Notes: The baseline sample includes 22 industrial and 61 non-industrial economies as defined in Bosworth and Collins, “The empirics of growth: an update”, Brookings Papers on Economic Activity, No 2, 2003, pp. 117-179. The indices report a weighted average of income per capita in countries running current account surpluses or deficits. They are scaled by the income per capita of the richest country and weighted by the magnitude of each country’s current account balance as a share of the sum of all surpluses or deficits.
1.2
1.0
0.8
0.6
0.4
0.2
0
1.2
1.0
0.8
0.6
0.4
0.2
0
Highincome
Lowincome
1970 1975 1980 1985 1990 1995 2000 2005
group of countries with current account surplusesgroup of countries with current account deficits
Chart 8 Average capital inflows and investment rates in emerging economies
(as a percentage of GDP; 1980-2006)
Source: IMF World Economic Outlook.
-5
-20
0
5
10
-10
15
-15
-5
-20
0
5
10
-10
15
-15
Capital Inflows/GDP
Investment/GDP0 5 10 15 20 25 30 35 40 45
69ECB
Monthly BulletinAugust 2007
ART ICLES
Adjustment of global imbalances
in a financially integrating world
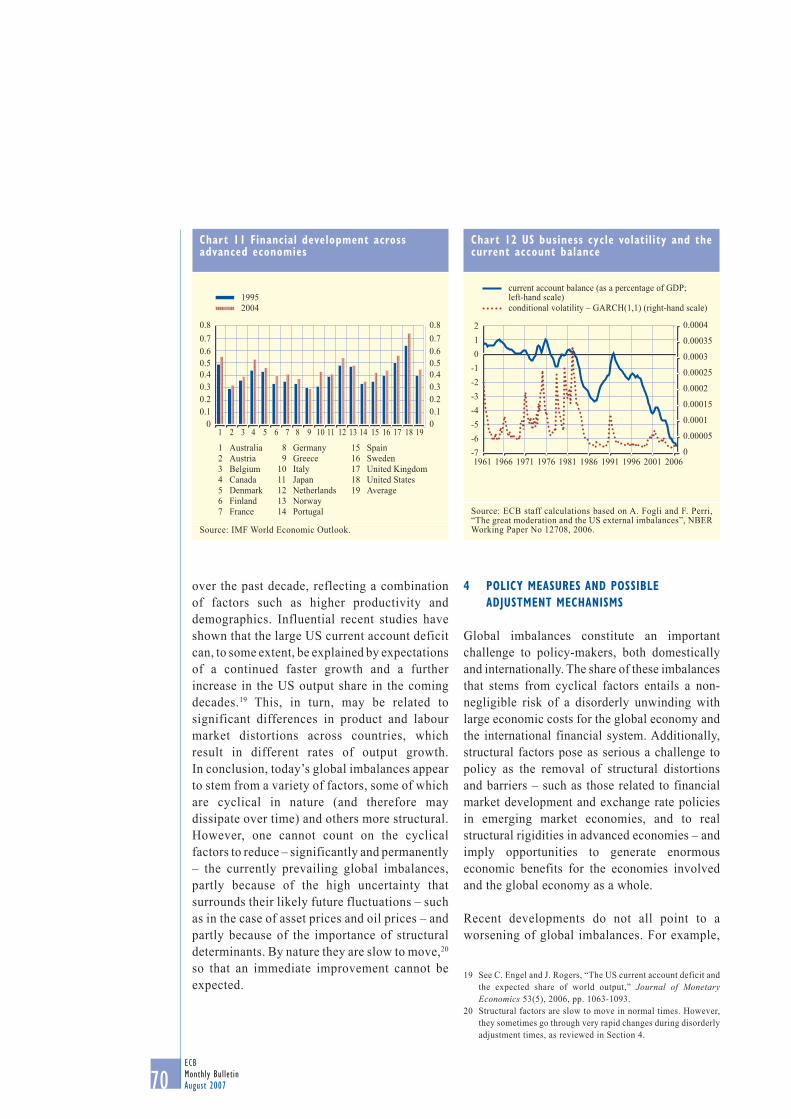
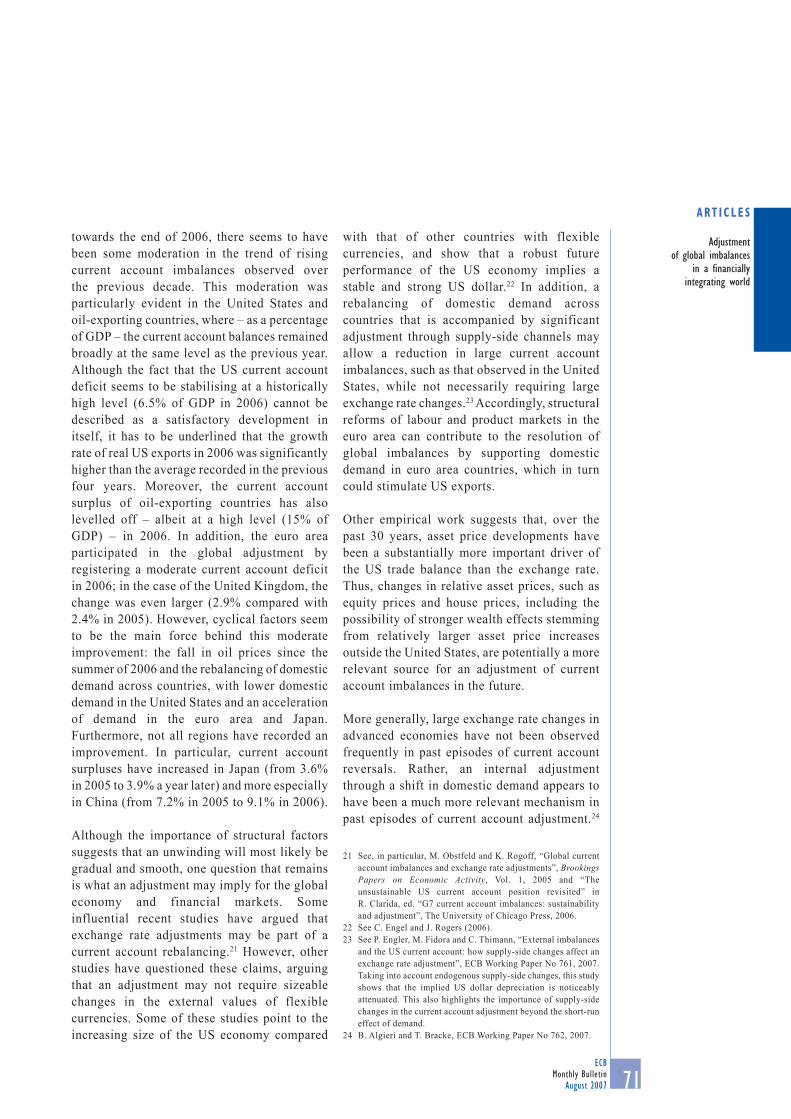
The relatively low level of financial development in emerging markets seems to be a very likely explanation for their low level of portfolio inflows, since both variables appear to be correlated across countries (see Chart 10). Therefore, the apparently paradoxical pattern of international capital flows from emerging markets to developed countries could have a simple explanation highlighting the comparatively lower stage of financial developments in emerging markets. A further question that needs to be answered, however, is why capital flows from emerging markets are directed, to a large extent, to the United States rather than to other industrial countries that could offer similar services. Apart from the differences observed among the levels of domestic savings in the industrialised world that partially explain this situation, key elements that may help answer this question are the fact that the United States appears to be more open, financially, than other industrialised countries and that it is also characterised by a higher level of financial development than other advanced economies (see Chart 11).18
Other structural factors, specific to the United States, may also have played a role. One potentially important factor is the role of business cycle moderation and the fall of
precautionary savings. According to standard measures of business cycle volatility, the amplitude of the cycle has decreased over time in the United States (see Chart 12). This decrease represents a lower degree of uncertainty for economic agents. For a given measure of risk aversion, this should reduce the need to build up precautionary savings: agents who usually save in order to smooth their consumption in case of a sharp drop in real output are less inclined to do so if this risk decreases. This particular explanation fits in with the above-mentioned stylised facts: the fall in output volatility is consistent with the fall in household saving, which is one of the key factors behind the increase in the US current account deficit. One potential drawback to this argument is that output volatility has also decreased in other developed countries. However, as mentioned above, these other countries may not have the same degree of financial openness and liberalisation, and thus have allowed for fewer borrowing opportunities.
A further, complementary explanation is that the United States has recorded a rising share in the total output of all the advanced economies
18 Additionally, the international role of the US dollar contributes to higher portfolio investment in the United States.
Chart 9 Weighted average income of FDI-importing and FDI-exporting countries
(relative per capita GDP weighted by current account)
Source: E. Prasad et al. Notes: The baseline sample includes 22 industrial and 61 non-industrial economies as defined in Bosworth and Collins. The indices are constructed using the same method as in Chart 7.
Chart 10 Financial development index and foreign portfolio investment
Source: IMF World Economic Outlook.Note: Averages for 2000-04.
0
5
10
15
20
25
0
5
10
15
20
25
0.2 0.3 0.4 0.5 0.6 0.7 0.8
x-axis: financial development indexy-axis: foreign portfolio inflows (as a percentage of imports + exports)
UnitedStatesGreece
France
Spain
UnitedKingdom
Australia
Netherlands
Austria
Portugal Finland
Germany
BelgiumSweden
Canada
ItalyJapan
NorwayDenmark
FDI-exporting countriesFDI-importing countries
1.2
1.0
0.8
0.6
0.4
0.2
0
1.2
1.0
0.8
0.6
0.4
0.2
01970 1975 1980 1985 1990 1995 2000 2005
70ECB Monthly BulletinAugust 2007
over the past decade, reflecting a combination of factors such as higher productivity and demographics. Influential recent studies have shown that the large US current account deficit can, to some extent, be explained by expectations of a continued faster growth and a further increase in the US output share in the coming decades.19 This, in turn, may be related to significant differences in product and labour market distortions across countries, which result in different rates of output growth. In conclusion, today’s global imbalances appear to stem from a variety of factors, some of which are cyclical in nature (and therefore may dissipate over time) and others more structural. However, one cannot count on the cyclical factors to reduce – significantly and permanently – the currently prevailing global imbalances, partly because of the high uncertainty that surrounds their likely future fluctuations – such as in the case of asset prices and oil prices – and partly because of the importance of structural determinants. By nature they are slow to move,20 so that an immediate improvement cannot be expected.
4 POLICY MEASURES AND POSSIBLE ADJUSTMENT MECHANISMS
Global imbalances constitute an important challenge to policy-makers, both domestically and internationally. The share of these imbalances that stems from cyclical factors entails a non-negligible risk of a disorderly unwinding with large economic costs for the global economy and the international financial system. Additionally, structural factors pose as serious a challenge to policy as the removal of structural distortions and barriers – such as those related to financial market development and exchange rate policies in emerging market economies, and to real structural rigidities in advanced economies – and imply opportunities to generate enormous economic benefits for the economies involved and the global economy as a whole.
Recent developments do not all point to a worsening of global imbalances. For example,
19 See C. Engel and J. Rogers, “The US current account deficit and the expected share of world output,” Journal of Monetary Economics 53(5), 2006, pp. 1063-1093.
20 Structural factors are slow to move in normal times. However, they sometimes go through very rapid changes during disorderly adjustment times, as reviewed in Section 4.
Chart 11 Financial development across advanced economies
Source: IMF World Economic Outlook.
Chart 12 US business cycle volatility and the current account balance
Source: ECB staff calculations based on A. Fogli and F. Perri, “The great moderation and the US external imbalances”, NBER Working Paper No 12708, 2006.
-7-6-5-4-3-2-1012
0
0.0004
0.00035
0.0003
0.00025
0.0002
0.00015
0.0001
0.00005
current account balance (as a percentage of GDP; left-hand scale)conditional volatility – GARCH(1,1) (right-hand scale)
1961 1966 1971 1976 1981 1986 1991 1996 2001 2006
19952004
00.10.20.30.40.50.60.70.8
00.10.20.30.40.50.60.70.8
1 Australia2 Austria3 Belgium4 Canada5 Denmark6 Finland7 France
8 Germany 9 Greece10 Italy11 Japan12 Netherlands13 Norway14 Portugal
15 Spain16 Sweden17 United Kingdom18 United States19 Average
1 2 3 4 5 6 7 8 9 10 11 12 13 14 15 16 17 18 19
71ECB
Monthly BulletinAugust 2007
ART ICLES
Adjustment of global imbalances
in a financially integrating world
towards the end of 2006, there seems to have been some moderation in the trend of rising current account imbalances observed over the previous decade. This moderation was particularly evident in the United States and oil-exporting countries, where – as a percentage of GDP – the current account balances remained broadly at the same level as the previous year. Although the fact that the US current account deficit seems to be stabilising at a historically high level (6.5% of GDP in 2006) cannot be described as a satisfactory development in itself, it has to be underlined that the growth rate of real US exports in 2006 was significantly higher than the average recorded in the previous four years. Moreover, the current account surplus of oil-exporting countries has also levelled off – albeit at a high level (15% of GDP) – in 2006. In addition, the euro area participated in the global adjustment by registering a moderate current account deficit in 2006; in the case of the United Kingdom, the change was even larger (2.9% compared with 2.4% in 2005). However, cyclical factors seem to be the main force behind this moderate improvement: the fall in oil prices since the summer of 2006 and the rebalancing of domestic demand across countries, with lower domestic demand in the United States and an acceleration of demand in the euro area and Japan. Furthermore, not all regions have recorded an improvement. In particular, current account surpluses have increased in Japan (from 3.6% in 2005 to 3.9% a year later) and more especially in China (from 7.2% in 2005 to 9.1% in 2006).
Although the importance of structural factors suggests that an unwinding will most likely be gradual and smooth, one question that remains is what an adjustment may imply for the global economy and financial markets. Some influential recent studies have argued that exchange rate adjustments may be part of a current account rebalancing.21 However, other studies have questioned these claims, arguing that an adjustment may not require sizeable changes in the external values of flexible currencies. Some of these studies point to the increasing size of the US economy compared
with that of other countries with flexible currencies, and show that a robust future performance of the US economy implies a stable and strong US dollar.22 In addition, a rebalancing of domestic demand across countries that is accompanied by significant adjustment through supply-side channels may allow a reduction in large current account imbalances, such as that observed in the United States, while not necessarily requiring large exchange rate changes.23 Accordingly, structural reforms of labour and product markets in the euro area can contribute to the resolution of global imbalances by supporting domestic demand in euro area countries, which in turn could stimulate US exports.
Other empirical work suggests that, over the past 30 years, asset price developments have been a substantially more important driver of the US trade balance than the exchange rate. Thus, changes in relative asset prices, such as equity prices and house prices, including the possibility of stronger wealth effects stemming from relatively larger asset price increases outside the United States, are potentially a more relevant source for an adjustment of current account imbalances in the future.
More generally, large exchange rate changes in advanced economies have not been observed frequently in past episodes of current account reversals. Rather, an internal adjustment through a shift in domestic demand appears to have been a much more relevant mechanism in past episodes of current account adjustment.24
21 See, in particular, M. Obstfeld and K. Rogoff, “Global current account imbalances and exchange rate adjustments”, Brookings Papers on Economic Activity, Vol. 1, 2005 and “The unsustainable US current account position revisited” in R. Clarida, ed. “G7 current account imbalances: sustainability and adjustment”, The University of Chicago Press, 2006.
22 See C. Engel and J. Rogers (2006).23 See P. Engler, M. Fidora and C. Thimann, “External imbalances
and the US current account: how supply-side changes affect an exchange rate adjustment”, ECB Working Paper No 761, 2007. Taking into account endogenous supply-side changes, this study shows that the implied US dollar depreciation is noticeably attenuated. This also highlights the importance of supply-side changes in the current account adjustment beyond the short-run effect of demand.
24 B. Algieri and T. Bracke, ECB Working Paper No 762, 2007.
72ECB Monthly BulletinAugust 2007
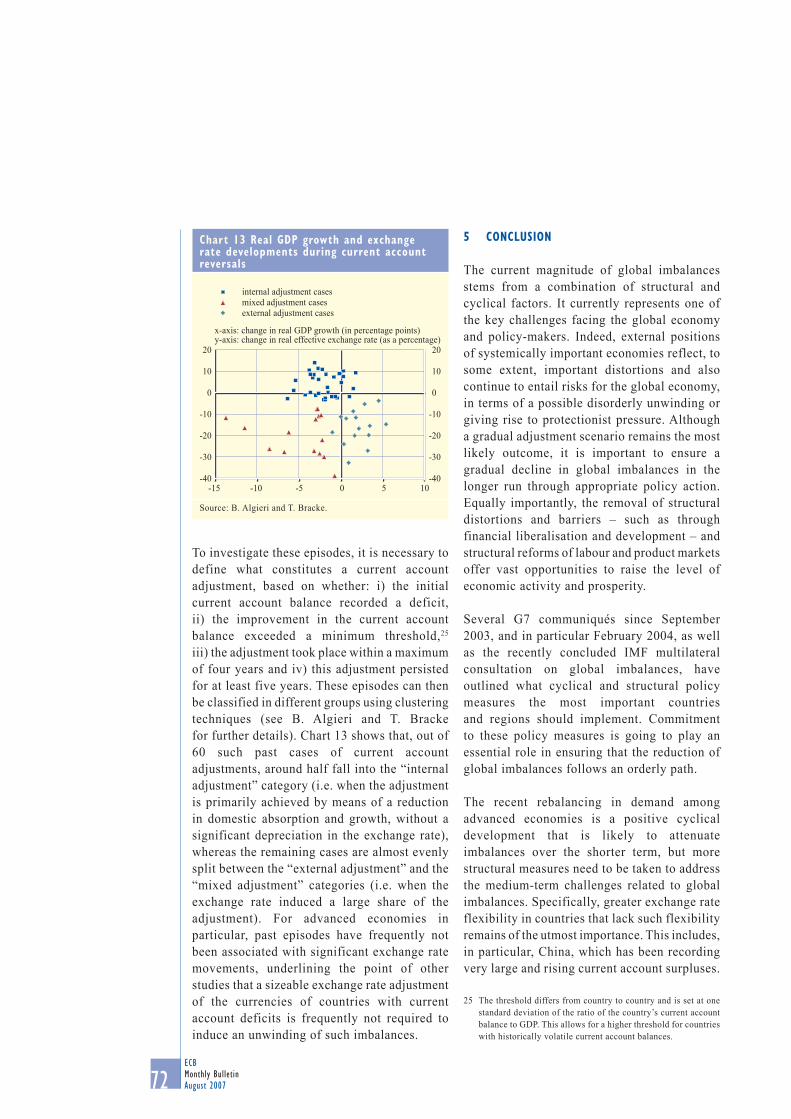
To investigate these episodes, it is necessary to define what constitutes a current account adjustment, based on whether: i) the initial current account balance recorded a deficit, ii) the improvement in the current account balance exceeded a minimum threshold,25 iii) the adjustment took place within a maximum of four years and iv) this adjustment persisted for at least five years. These episodes can then be classified in different groups using clustering techniques (see B. Algieri and T. Bracke for further details). Chart 13 shows that, out of 60 such past cases of current account adjustments, around half fall into the “internal adjustment” category (i.e. when the adjustment is primarily achieved by means of a reduction in domestic absorption and growth, without a significant depreciation in the exchange rate), whereas the remaining cases are almost evenly split between the “external adjustment” and the “mixed adjustment” categories (i.e. when the exchange rate induced a large share of the adjustment). For advanced economies in particular, past episodes have frequently not been associated with significant exchange rate movements, underlining the point of other studies that a sizeable exchange rate adjustment of the currencies of countries with current account deficits is frequently not required to induce an unwinding of such imbalances.
5 CONCLUSION
The current magnitude of global imbalances stems from a combination of structural and cyclical factors. It currently represents one of the key challenges facing the global economy and policy-makers. Indeed, external positions of systemically important economies reflect, to some extent, important distortions and also continue to entail risks for the global economy, in terms of a possible disorderly unwinding or giving rise to protectionist pressure. Although a gradual adjustment scenario remains the most likely outcome, it is important to ensure a gradual decline in global imbalances in the longer run through appropriate policy action. Equally importantly, the removal of structural distortions and barriers – such as through financial liberalisation and development – and structural reforms of labour and product markets offer vast opportunities to raise the level of economic activity and prosperity.
Several G7 communiqués since September 2003, and in particular February 2004, as well as the recently concluded IMF multilateral consultation on global imbalances, have outlined what cyclical and structural policy measures the most important countries and regions should implement. Commitment to these policy measures is going to play an essential role in ensuring that the reduction of global imbalances follows an orderly path.
The recent rebalancing in demand among advanced economies is a positive cyclical development that is likely to attenuate imbalances over the shorter term, but more structural measures need to be taken to address the medium-term challenges related to global imbalances. Specifically, greater exchange rate flexibility in countries that lack such flexibility remains of the utmost importance. This includes, in particular, China, which has been recording very large and rising current account surpluses.
25 The threshold differs from country to country and is set at one standard deviation of the ratio of the country’s current account balance to GDP. This allows for a higher threshold for countries with historically volatile current account balances.
Chart 13 Real GDP growth and exchange rate developments during current account reversals
Source: B. Algieri and T. Bracke.
-40
-30
-20
-10
0
10
20
-40
-30
-20
-10
0
10
20
-15 -10 -5 0 5 10
x-axis: change in real GDP growth (in percentage points) y-axis: change in real effective exchange rate (as a percentage)
internal adjustment casesmixed adjustment casesexternal adjustment cases
73ECB
Monthly BulletinAugust 2007
ART ICLES
Adjustment of global imbalances
in a financially integrating world
The misalignment of its currency is also reflected in very high rates of foreign reserve accumulation leading to challenges in domestic macroeconomic management, inter alia through strong liquidity and credit growth. Moreover, financial sector reforms, deregulation and liberalisation in many emerging markets, including China, will be crucial to reduce excess savings and improve the effectiveness of economic policies and the overall allocation of resources, thereby fostering the economic well-being of the population at large.
However, it is not only emerging markets that need to take appropriate policy action. Further progress in the structural reform of labour and product markets in Europe and Japan are important to allow also these economies to contribute to the resolution of global imbalances. In the case of the United States, the country with by far the world’s largest current account deficit in absolute terms, an adjustment in macroeconomic policies – including fiscal policy – and determined steps to raise, in particular, private savings will be crucial to help rebalance current account positions and re-equilibrate global capital flows. Overall, given that the responsibility for global imbalances is shared by the world’s largest economies, the joint implementation of structural reforms in all of the countries concerned will considerably reinforce the chances of a successful adjustment.
Related Documents