S1 Supplemental Material 1 Article title: Geohistorical records of the Anthropocene in Chile Eugenia M. Gayo 1,2,3* , Virginia B. McRostie 4 , Roberto Campbell 4 , Carola Flores 1,5 , Antonio Maldonado 5,6 , Mauricio Uribe-Rodriguez 7 , Patricio I. Moreno 1,8 , Calogero M. Santoro 9 , Duncan A. Christie 1,10 , Ariel A. Muñoz 1,11 , Laura Gallardo 1,12 1 Center for Climate and Resilience Research (CR2, FONDAP 15110009), Chile 2 Laboratory for Stable Isotope Biogeochemistry, Departamento de Oceanografía, Universidad de Concepción, Concepción, Chile 3 Center of Applied Ecology and Sustainability (CAPES) 4 Programa de Antropología, Instituto de Sociología, Pontificia Universidad Católica de Chile, Santiago, Chile 5 Centro de Estudios Avanzados en Zonas Áridas (CEAZA), La Serena, Chile 6 Instituto de Investigación Multidisciplinario en Ciencia y Tecnología, Universidad de La Serena, La Serena, Chile & Departamento de Biología Marina, Universidad Católica del Norte, Coquimbo, Chile 7 Departamento de Antropología, Facultad de Ciencias Sociales, Universidad de Chile, Santiago, Chile 8 Instituto de Ecología y Biodiversidad, Departamento de Ciencias Ecológicas, Universidad de Chile, Santiago, Chile 9 Instituto de Alta Investigación, Universidad de Tarapacá, Arica, Chile 10 Instituto de Conservación Biodiversidad y Territorio, Universidad Austral de Chile, Valdivia, Chile 11 Institute of Geography, Pontificia Universidad Católica de Valparaíso, Valparaiso, Chile 12 Departamento de Geofísica, Universidad de Chile, Santiago, Chile Corresponding author: Eugenia M. Gayo ([email protected])

Welcome message from author
This document is posted to help you gain knowledge. Please leave a comment to let me know what you think about it! Share it to your friends and learn new things together.
Transcript

S1
Supplemental Material 1
Article title: Geohistorical records of the Anthropocene in Chile
Eugenia M. Gayo1,2,3*
, Virginia B. McRostie4, Roberto Campbell
4, Carola Flores
1,5, Antonio
Maldonado5,6
, Mauricio Uribe-Rodriguez7, Patricio I. Moreno
1,8, Calogero M. Santoro
9, Duncan A.
Christie1,10
, Ariel A. Muñoz1,11
, Laura Gallardo1,12
1 Center for Climate and Resilience Research (CR2, FONDAP 15110009), Chile
2 Laboratory
for Stable Isotope Biogeochemistry, Departamento de Oceanografía, Universidad de
Concepción, Concepción, Chile
3 Center of Applied Ecology and Sustainability (CAPES)
4 Programa de Antropología, Instituto de Sociología, Pontificia Universidad Católica de Chile,
Santiago, Chile
5 Centro de Estudios Avanzados en Zonas Áridas (CEAZA), La Serena, Chile
6 Instituto de Investigación Multidisciplinario en Ciencia y Tecnología, Universidad de La Serena,
La Serena, Chile & Departamento de Biología Marina, Universidad Católica del Norte, Coquimbo,
Chile
7 Departamento de Antropología, Facultad de Ciencias Sociales, Universidad de Chile, Santiago,
Chile
8 Instituto de Ecología y Biodiversidad, Departamento de Ciencias Ecológicas, Universidad de
Chile, Santiago, Chile
9 Instituto de Alta Investigación, Universidad de Tarapacá, Arica, Chile
10 Instituto de Conservación Biodiversidad y Territorio, Universidad Austral de Chile, Valdivia,
Chile
11 Institute of Geography, Pontificia Universidad Católica de Valparaíso, Valparaiso, Chile
12 Departamento de Geofísica, Universidad de Chile, Santiago, Chile
Corresponding author: Eugenia M. Gayo ([email protected])

S2
List of Contents:
Table S1. Geohistorical records considered here for reconstructing human-driven transformations on Chilean
ecosystems over the past 3000 years. The “Biophysical pattern” column specifies anthropogenic
transformations in environmental patterns/processes that were informed by each geohistorical record. (*) and
(**) indicate proxy data available only for northern and central Chile, respectively.
Text S1. Paleodemographic reconstructions: datasets, procedures and methodological caveats.
Figure S1. Evaluation of research/sampling biases in the accumulation of chronometric data in the
regional datasets. Legend (A) SPDs obtained from resampled datasets. (B) Absolute frequency distributions per 100-year bin
for calibrated ages from full databases.
Figure S2. Evaluation of taphonomic bias for the Northern Chile dataset. Legend (A) Absolute frequency distributions for uncorrected (red bars) and corrected (blue bars) calibrated
ages. (B) Density plots for corrected (red curve) and uncorrected (blue curve) data.
Figure S3. Evaluation of taphonomic bias for the Central Chile database. Legend (A) Absolute frequency distributions for uncorrected (red bars) and corrected (blue bars) calibrated
ages. (B) Density plots for corrected (red curve) and uncorrected (blue curve) data.
Figure S4. Calibration effects on summed probability distributions (SPDs) over the past 3,500 years.
Legend A) Age-range bar analysis. Horizontal dashed line shows the 199.8 years threshold estimated at 2-
sigma calibration. B) Slope analysis for the SHCAL13 calibration curve. Dashed horizontal lines show upper
(2.7) and lower (-0.9) normalized thresholds.
Table S2. Range and duration for radiocarbon plateaus in SHCAL13 calibration curve. (*) indicates
discontinuous flattening intervals.
Table S3. Range and duration of steepening in the SHCAL13 calibration curve. (*) indicates discontinuous
steepening intervals.
Text S2. Detection of regime shifts in air quality and fire events
Table S4. Proxy records used to generate time-series for the detection of regime shifts in air quality and fire
activity in northern and central Chile, respectively.
Table S5. Chile´s historical census data for the period 1865 AD- 1982 AD (Bravo et al., 2013; CELADE,
2005; McCaa, 1972). (*) and (**) indicate census data interpolated for northern and central Chile,
respectively.
Cited References
S3
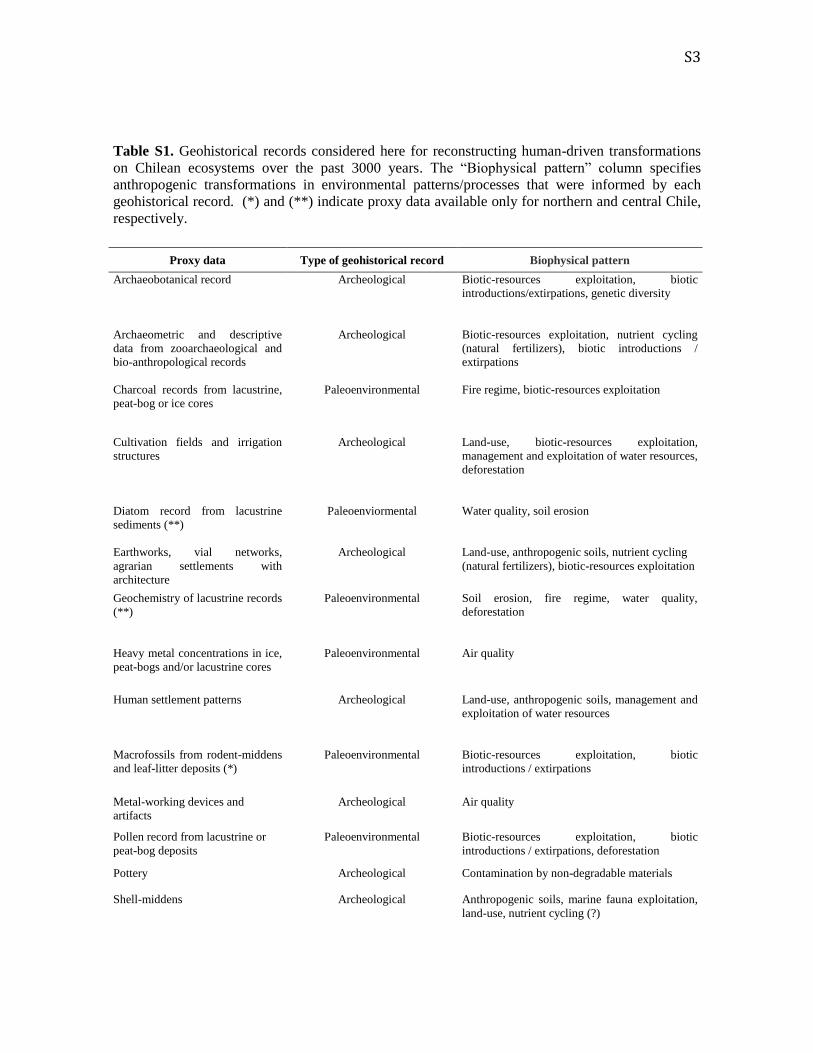
Table S1. Geohistorical records considered here for reconstructing human-driven transformations
on Chilean ecosystems over the past 3000 years. The “Biophysical pattern” column specifies
anthropogenic transformations in environmental patterns/processes that were informed by each
geohistorical record. (*) and (**) indicate proxy data available only for northern and central Chile,
respectively.
Proxy data Type of geohistorical record Biophysical pattern
Archaeobotanical record Archeological Biotic-resources exploitation, biotic
introductions/extirpations, genetic diversity
Archaeometric and descriptive
data from zooarchaeological and
bio-anthropological records
Archeological Biotic-resources exploitation, nutrient cycling
(natural fertilizers), biotic introductions /
extirpations
Charcoal records from lacustrine,
peat-bog or ice cores
Paleoenvironmental Fire regime, biotic-resources exploitation
Cultivation fields and irrigation
structures
Archeological Land-use, biotic-resources exploitation,
management and exploitation of water resources,
deforestation
Diatom record from lacustrine
sediments (**)
Paleoenviormental Water quality, soil erosion
Earthworks, vial networks,
agrarian settlements with
architecture
Archeological Land-use, anthropogenic soils, nutrient cycling
(natural fertilizers), biotic-resources exploitation
Geochemistry of lacustrine records
(**)
Paleoenvironmental Soil erosion, fire regime, water quality,
deforestation
Heavy metal concentrations in ice,
peat-bogs and/or lacustrine cores
Paleoenvironmental Air quality
Human settlement patterns Archeological Land-use, anthropogenic soils, management and
exploitation of water resources
Macrofossils from rodent-middens
and leaf-litter deposits (*)
Paleoenvironmental Biotic-resources exploitation, biotic
introductions / extirpations
Metal-working devices and
artifacts
Archeological Air quality
Pollen record from lacustrine or
peat-bog deposits
Paleoenvironmental Biotic-resources exploitation, biotic
introductions / extirpations, deforestation
Pottery Archeological Contamination by non-degradable materials
Shell-middens Archeological Anthropogenic soils, marine fauna exploitation,
land-use, nutrient cycling (?)

S4
Spherical carbonaceous particles
in lacustrine sediments (**)
Paleoenviormental Air quality
Tree-rings (**) Paleoenvironmental Fire regime
Text S1. Paleodemographic reconstructions: datasets, procedures and
methodological caveats.
Regional datasets (Datasets 1-2 in Supplemental Data 1) include radiometric and/or
thermoluminescence dates for the last 3000 14
C yrs BP that have been obtained from remains with
unambiguous anthropogenic origin and recovered strictly in archaeological contexts: charcoal,
human tissues, artefacts on mineral (i.e. ceramics) and organic materials. Dates on marine and
terrestrial ecofacts were also considered (Campbell and Quiroz, 2015; Gayo et al., 2015). To
produce high spatial and temporal resolution datasets for the Northern and Central Chile regions,
we concatenated available independent databases for both areas. We accepted the quality, reliability
and stratigraphic association of chronometric determinations contained within these sources. We
vetted, however, dates with laboratory errors greater than 200 years.
Long-term paleodemographic trends for northern Chile were reconstructed by combining 709
chronometric determinations (Dataset 1, Supplemental Data 1) contained in the “South Central
Andes Radiocarbon Database” (SCAR; Gayo et al., 2015) and the compilation presented by
Troncoso and Pavlovic (2013). SCAR includes 675 radiocarbon dates from 270 archaeological sites
situated along the hyperarid coastal Atacama Desert and the semi-arid Altiplano (18º-25ºS). From
the dataset by Troncoso and Plavovic (2013), we considered 24 thermoluminescence and 10
radiometric ages from 13 archeological sites lying between Copiapó and Huasco valleys (see Fig. 1
in the main text). Roughly 1.4% of 14
C dates (n=10 entries) contained in the Northern dataset derive
from marine vestiges (e.g shells, Supplemental Data 1).
The Central Chile database comprises 555 chronological determinations derived from 310
archeological sites, including 374 thermoluminescence and 181 radiocarbon ages (Dataset 2,
Supplemental Data 1). Again, radiocarbon dates from marine samples are under-represented with 8
entries (1.81%). The resulting concatenated database is unevenly distributed over space. Most of
14C-dates come from sites located at 35°30'S - 42°S (Campbell and Quiroz, 2015), but a few
radiometric reports exist (n=36) north of 35°S (Falabella et al., 2007; Sanhueza et al., 2003;
Troncoso and Pavlovic, 2013). Thermoluminescence data mostly contribute to the region between

S5
29° and 34°S (Ávalos et al., 2006; Falabella et al., 2015; 2007; Sanchez, 2001; 2006; Sanhueza et
al., 2003; Troncoso and Pavlovic, 2013), concentrated mainly around the Elqui-Choapa transverse
valleys (n= 92 dates) and the area of the Intermediate Depression flanked by the Maipo and
Cachapoal rivers (n= 239 dates) (see Fig 1 in the main text).
We calculated summed probabilities distribution (SPD) of calibrated data through a Bayesian
approach, which allows us to combine a diverse array of chronological data to temporally constrain
past events (Michczyski and Pazdur, 2003). We used the “BchronDensityFast” command in Bchron
4.2.6 package (Parnell et al., 2008) for R (R-Development-Core-Team, 2016), which adjusts a
Bayesian Gaussian mixture model to concurrently obtain SPD from multiple radiocarbon and
thermoluminescence ages. Radiometric determinations on terrestrial samples and
thermoluminescence dates were calibrated using the Southern Hemisphere SHCAL13 (Hogg et al.,
2013) and the NORMAL (Parnell et al., 2008) calibration curves, respectively. This later calibration
dataset is available in the Bchron 4.2.6 for treating normally distributed ages (e.g
thermoluminescence). Marine 14
C-ages were calibrated with the MARINE13 curve (Reimer et al.,
2013) and without applying any corrections for local reservoir effect.
Regional plots for SPD were obtained by exporting data generated by Bchron 4.2.6 into SciDAVis
version 1.14 (Benkert et al., 2016). Since the method sums and merges probabilities for independent
dates according to their uncalibrated age and associated standard error, subsequent distribution
curves usually extend below and above the lower and upper values contained within a given
database (Supplemental Data 1). Hence, plots for regional long-term paleodemographic trends
extend up to 3500 cal yrs BP and onwards towards the present.
The use of dates as a proxy for paleodemographic trends relies on archeological (Buchanan et al.,
2008; Rick, 1987; Smith et al., 2008; Surovell and Brantingham, 2007) and ecological (Gayo et al.,
2015) principles. Because resource exploitation is a density-dependent process, then high (low)
demographic levels in past populations should result in amplified (reduced) deposition of datable
materials/artefacts in existing archaeological sites over a region. Recently, Chaput and Gajewski
(2016) demonstrate that this methodology reproduces long-term demographic patterns that mimic
population numbers/densities modeled from historical data contained within the History Database
of the Global Environment database (aka HYDE, Klein Goldewijk et al., 2010; Klein Goldewijk et
al., 2011).
Inferences about the intensity of human activities should be derived from the analysis of major
trends in SPD plots (i.e. population events or demographic phases), which are defined by main

S6
modes in the temporal distribution of archaeological calibrated ages (Gamble et al., 2005; Shennan
and Edinborough, 2007; Smith et al., 2008). Thus, our interpretations focus on major peaks (or
troughs) that inform us about definitive intervals of intensified (reduced) resource exploitation as
human activities and demographic levels remained high (low) over a given landscape. This is
because truncated or low amplitude changes in SPD could arise from biases in the accumulation of
cultural dates instead of variations in the rate of resource utilization by Prehistoric populations
(Gamble et al., 2005).
This method is not without its critics (Contreras and Meadows, 2014; Crombé and Robinson, 2014;
Hiscock and Attenbrow, 2016; Torfing, 2015) as some biases might blur the relationship between
accumulated frequencies of chronometric determinations on archaeological remains and past
settlement intensities. Archeological research/sampling biases and reduced database size could
compromise the robustness and reproducibility of reconstructed patterns (Michczynska et al., 2007;
Michczynska and Pazdur, 2004). We rule out distorting effects of sample size or research bias in
our reconstructions. The resulting concatenated databases for both regions are large enough,
approximating to randomly sampled sets that exceed the critical minimum number of entries
(n=107), to produce reliable reconstructions over a short time interval (i.e. 3000 years)
(Michczynska and Pazdur, 2004; Timpson et al., 2014; Williams, 2012). Earlier works presenting
the structure and properties of the individual datasets considered here (i.e. the original data sources),
demonstrate the negligible contribution of research limitations in reconstructing paleodemographic
trends from SPDs. In fact, Gayo et al. (2015) dismiss the impact of a diverse array of “scientific
biases” on the long-term paleodemographic reconstruction derived from the SCAR dataset. More
importantly, however, by implementing a re-sampling procedure, these authors verify that the
overall trend in the SPD for northern Chile remained insensitive to redundancies or hiatuses in the
accumulation of 14
C-dates. In the case of central Chile, temporal trends in the accumulation of dates
have been discussed in light of the dynamics of the regional archeological research (Campbell and
Quiroz, 2015), and, in turn, these have been interpreted in terms of “paleodemographic” (human
population dynamics) or “archaeo-demographic” (i.e. research bias) events. A similar discussion is
presented in Falabella et al. (2015) for the reconstruction of the demographic dynamics based on the
distribution of the thermoluminescence dates that integrate our unified central Chile database.
Because our inferences are based on the combination of different individual databases for each
region, we assessed whether this “merging procedure” resulted in imbalanced datasets. To this end,
we resampled our concatenated regional datasets following the re-sampling procedure implemented
in Gayo et al. (2015). By reducing the number of multiple overlapping dates per archeological site,
we were able to examine the contribution of oversampling in reconstructed demographic trends. To
S7
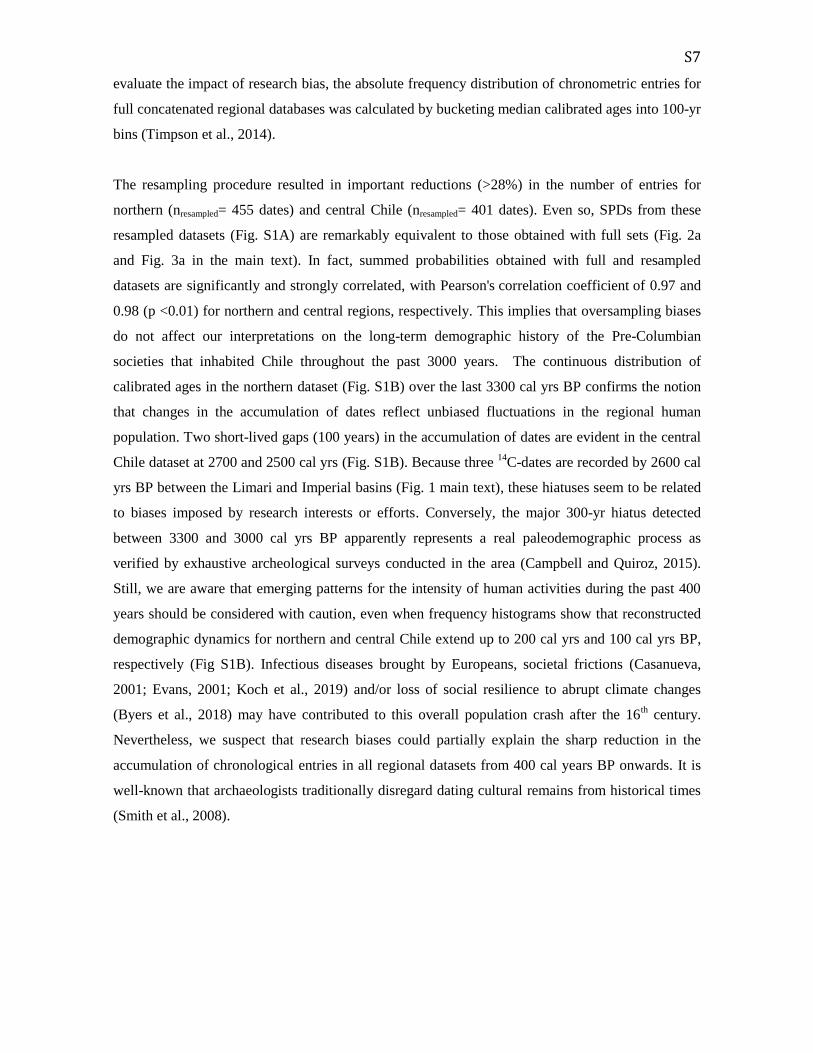
evaluate the impact of research bias, the absolute frequency distribution of chronometric entries for
full concatenated regional databases was calculated by bucketing median calibrated ages into 100-yr
bins (Timpson et al., 2014).
The resampling procedure resulted in important reductions (>28%) in the number of entries for
northern (nresampled= 455 dates) and central Chile (nresampled= 401 dates). Even so, SPDs from these
resampled datasets (Fig. S1A) are remarkably equivalent to those obtained with full sets (Fig. 2a
and Fig. 3a in the main text). In fact, summed probabilities obtained with full and resampled
datasets are significantly and strongly correlated, with Pearson's correlation coefficient of 0.97 and
0.98 (p <0.01) for northern and central regions, respectively. This implies that oversampling biases
do not affect our interpretations on the long-term demographic history of the Pre-Columbian
societies that inhabited Chile throughout the past 3000 years. The continuous distribution of
calibrated ages in the northern dataset (Fig. S1B) over the last 3300 cal yrs BP confirms the notion
that changes in the accumulation of dates reflect unbiased fluctuations in the regional human
population. Two short-lived gaps (100 years) in the accumulation of dates are evident in the central
Chile dataset at 2700 and 2500 cal yrs (Fig. S1B). Because three 14
C-dates are recorded by 2600 cal
yrs BP between the Limari and Imperial basins (Fig. 1 main text), these hiatuses seem to be related
to biases imposed by research interests or efforts. Conversely, the major 300-yr hiatus detected
between 3300 and 3000 cal yrs BP apparently represents a real paleodemographic process as
verified by exhaustive archeological surveys conducted in the area (Campbell and Quiroz, 2015).
Still, we are aware that emerging patterns for the intensity of human activities during the past 400
years should be considered with caution, even when frequency histograms show that reconstructed
demographic dynamics for northern and central Chile extend up to 200 cal yrs and 100 cal yrs BP,
respectively (Fig S1B). Infectious diseases brought by Europeans, societal frictions (Casanueva,
2001; Evans, 2001; Koch et al., 2019) and/or loss of social resilience to abrupt climate changes
(Byers et al., 2018) may have contributed to this overall population crash after the 16th century.
Nevertheless, we suspect that research biases could partially explain the sharp reduction in the
accumulation of chronological entries in all regional datasets from 400 cal years BP onwards. It is
well-known that archaeologists traditionally disregard dating cultural remains from historical times
(Smith et al., 2008).

S8
Figure S1. Evaluation of research/sampling biases in the accumulation of chronometric data in the
regional datasets. Legend (A) SPDs obtained from resampled datasets. (B) Absolute frequency distributions per 100-year bin
for calibrated ages from full databases.
Stratigraphic incompleteness of archeological sequences and/or the expected loss of archeological
deposits over time could also exert significant influences on the temporal accumulation of
chronometric data (Peros et al., 2010; Surovell and Brantingham, 2007; Surovell et al., 2009;
Timpson et al., 2014; Williams, 2012). Because of the preferential preservation of more recent
records, the distribution of dates could adopt an exponential decay function (see Surovell et al.,
2009). The calibration process to obtain SPD of 14
C-dates is another source of uncertainty that is
brought about by changes in the slope of the calibration curve, ultimately related to fluctuations in
atmospheric radiocarbon levels (Bamforth and Grund, 2012; McFadgen et al., 1994; Reyes and
Cooke, 2011; Steele, 2010; Thorndycraft and Benito, 2006; Williams, 2012). Actually, during
periods in which 14
C varies highly (little), radiocarbon cliffs (plateaus) occur in the corresponding
section of the calibration curve, which can produce spurious peaks (troughs) in the SPD.
Several procedures, however, have been devised to overcome or minimize much of these biases,
which have opened new possibilities for reconstructing more reliable paleodemographic patterns
(Buchanan et al., 2008; Michczynski and Michczynski, 2006; Peros et al., 2010; Shennan et al.,
2013; Steele, 2010; Surovell and Brantingham, 2007; Surovell et al., 2009; Timpson et al., 2014;
Williams, 2012). Here, we followed the standard procedure introduced by Williams (2012) to
evaluate the contribution of taphonomic biases on reconstructed long-term paleodemography
dynamics. Specifically, each full database was corrected for taphonomic loss by applying a square
root non-linear model on the real frequency of calibrated ages per 250-year bin (Surovell and
Brantingham, 2007; Surovell et al., 2009; Williams, 2012).
S9
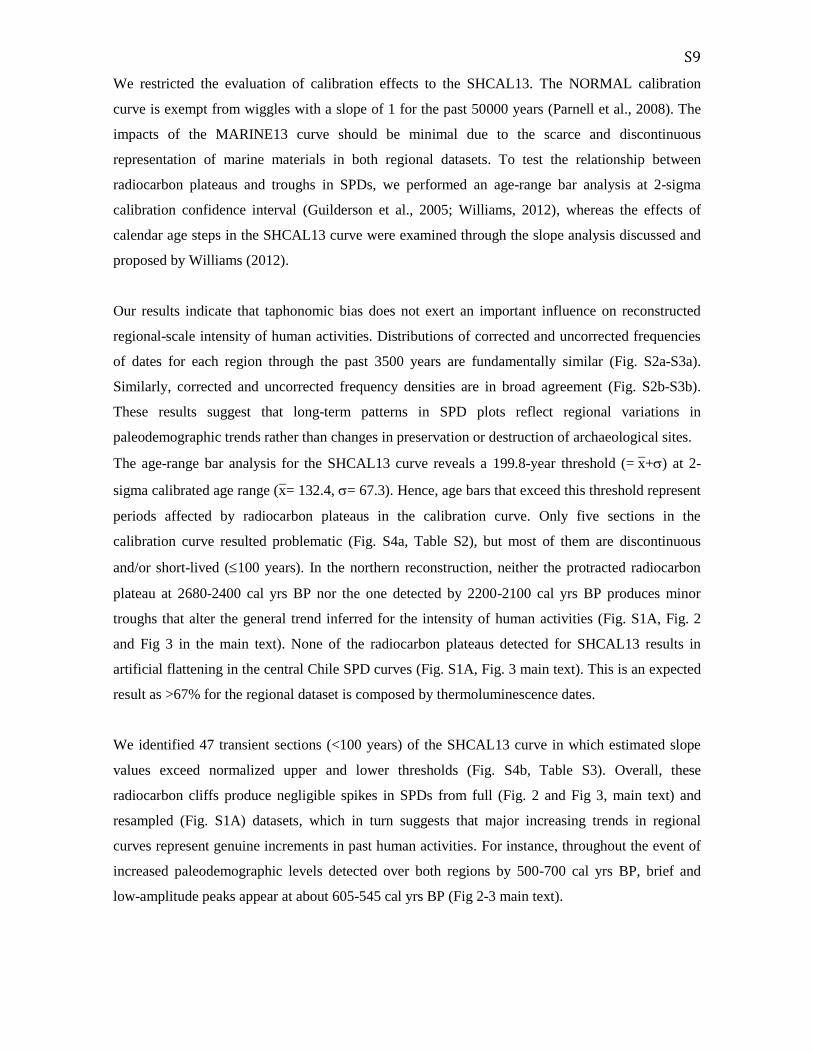
We restricted the evaluation of calibration effects to the SHCAL13. The NORMAL calibration
curve is exempt from wiggles with a slope of 1 for the past 50000 years (Parnell et al., 2008). The
impacts of the MARINE13 curve should be minimal due to the scarce and discontinuous
representation of marine materials in both regional datasets. To test the relationship between
radiocarbon plateaus and troughs in SPDs, we performed an age-range bar analysis at 2-sigma
calibration confidence interval (Guilderson et al., 2005; Williams, 2012), whereas the effects of
calendar age steps in the SHCAL13 curve were examined through the slope analysis discussed and
proposed by Williams (2012).
Our results indicate that taphonomic bias does not exert an important influence on reconstructed
regional-scale intensity of human activities. Distributions of corrected and uncorrected frequencies
of dates for each region through the past 3500 years are fundamentally similar (Fig. S2a-S3a).
Similarly, corrected and uncorrected frequency densities are in broad agreement (Fig. S2b-S3b).
These results suggest that long-term patterns in SPD plots reflect regional variations in
paleodemographic trends rather than changes in preservation or destruction of archaeological sites.
The age-range bar analysis for the SHCAL13 curve reveals a 199.8-year threshold (= x̄+) at 2-
sigma calibrated age range (x̄= 132.4, = 67.3). Hence, age bars that exceed this threshold represent
periods affected by radiocarbon plateaus in the calibration curve. Only five sections in the
calibration curve resulted problematic (Fig. S4a, Table S2), but most of them are discontinuous
and/or short-lived (100 years). In the northern reconstruction, neither the protracted radiocarbon
plateau at 2680-2400 cal yrs BP nor the one detected by 2200-2100 cal yrs BP produces minor
troughs that alter the general trend inferred for the intensity of human activities (Fig. S1A, Fig. 2
and Fig 3 in the main text). None of the radiocarbon plateaus detected for SHCAL13 results in
artificial flattening in the central Chile SPD curves (Fig. S1A, Fig. 3 main text). This is an expected
result as >67% for the regional dataset is composed by thermoluminescence dates.
We identified 47 transient sections (<100 years) of the SHCAL13 curve in which estimated slope
values exceed normalized upper and lower thresholds (Fig. S4b, Table S3). Overall, these
radiocarbon cliffs produce negligible spikes in SPDs from full (Fig. 2 and Fig 3, main text) and
resampled (Fig. S1A) datasets, which in turn suggests that major increasing trends in regional
curves represent genuine increments in past human activities. For instance, throughout the event of
increased paleodemographic levels detected over both regions by 500-700 cal yrs BP, brief and
low-amplitude peaks appear at about 605-545 cal yrs BP (Fig 2-3 main text).

S10
Figure S2. Evaluation of taphonomic bias for the Northern Chile dataset. Legend (A) Absolute frequency distributions for uncorrected (red bars) and corrected (blue bars) calibrated
ages. (B) Density plots for corrected (red curve) and uncorrected (blue curve) data.
Figure S3. Evaluation of taphonomic bias for the Central Chile database. Legend (A) Absolute frequency distributions for uncorrected (red bars) and corrected (blue bars) calibrated
ages. (B) Density plots for corrected (red curve) and uncorrected (blue curve) data.

S11
Figure S4. Calibration effects on summed probability distributions (SPDs) over the past 3,500 years.
Legend A) Age-range bar analysis. Horizontal dashed line shows the 199.8 years threshold estimated at 2-
sigma calibration. B) Slope analysis for the SHCAL13 calibration curve. Dashed horizontal lines show upper
(2.7) and lower (-0.9) normalized thresholds.
Table S2. Range and duration for radiocarbon plateaus in SHCAL13 calibration curve. (*) indicates
discontinuous flattening intervals
Lower range limit (Calibrated Age BP) Upper range limit (Calibrated Age BP) Duration (years)
100 215 115 *
2100 2200 100
2405 2740 335 3000 3040 40 *
3110 3220 110 *

S12
Table S3. Range and duration of steepening in the SHCAL13 calibration curve. (*) indicates
discontinuous steepening intervals
Lower range limit (Calibrated Age BP) Upper range limit (Calibrated Age BP) Duration (years)
15 25 10 *
70 90 20 *
110 170 60 200 230 30
270 365 95 *
400 405 5 440 445 5
490 505 15 *
545 605 60 625 630 5
650 680 30
725 730 5 790 800 10
860 870 10
915 930 15
955 960 5
1010 1025 15
1055 1070 15 1130 1135 5
1175 1215 40
1265 1270 5 1295 1305 10
1385 1390 5
1530 1535 5 1645 1660 15
1695 1705 10 *
1745 1770 25 * 1825 1850 25
1925 1930 5
1965 1970 5 1995 2005 10
2025 2030 5
2125 2130 5
2145 2180 35
2220 2245 25 2265 2270 5
2295 2310 15
2340 2360 20 2485 2490 5
2555 2560 5
2585 2640 55 2735 2755 20 *
2900 2920 20
3075 3095 20 * 3280 3305 25 *
3420 3450 30 *
3475 3500 25
Text S2. Detection of regime shifts in air quality and fire events
We generated time-series for heavy metal paleopollution and past fire activity (Table S4) by
selecting published proxy records that met the criteria described in the main text. These data were
obtained either from the principal author of the primary source, online databases (NOAA, Global
Charcoal Database, Mendeley), or supplementary materials. The time-series for paleopollution in
northern Chile aggregates sequential trace-element characterizations of stratified sedimentary
records (peat-bogs, lakes) and ice-cores from the western Andean slope (12°-20°S; Cooke et al.,
2007; 2009; 2011; 2013; Eichler et al., 2017; 2015; Uglietti et al., 2015) and Patagonia (De
Vleeschouwer et al., 2014). Because we are interested in the contribution of anthropogenic

S13
emissions to the inventory of metalloids derived from traditional metallurgical activities (Cu, Ag,
Pb, Hg), only data reported as crustal-normalized concentrations (Enrichment Factors or EFs) or
background flux-ratios were considered (Table S4). An independent time-series for air-quality
changes in the Santiago basin for the period 1852 AD – 2002 AD was constructed by gathering
influxes of spheroidal carbonaceous particles (SCPs) in four lakes located close to El Teniente
mining operation (33°S) (von Gunten et al., 2009). The time-series for past fire activity is based on
influxes of micro-charcoal particles (<120 μm) in closed lacustrine basins (Heusser, 1990; Martel-
Cea et al., 2016; Villa-Martínez et al., 2003), which collectively inform on “regional” fires
(Whitlock and Larsen, 2001) occurring along Mediterranean central Chile between 33° and 34°S.
Additionally, we aggregated the absolute frequency of fire events per 100 years inferred from the
Austrocedrus chilensis tree-ring series from the Cachapoal basin (34°S, Bustos-Schindler et al.,
2010).
To produce equally spaced data, heavy-metal pollution proxy records were matched to the
chronology of the Illimani ice-core (Eichler et al., 2017) through linear interpolation between two
adjacently measured geochemical samples. The Illimani record provides Cu EFs at 50-yr intervals
from the onset of the Pre-Columbian metallurgy (3125 cal yrs BP) to the Industrial period (2005
AD). Nevertheless, most of geochemical data could not be interpolated up to 3125 cal yrs BP due to
their limited temporal extent (Table S4). Flux-ratios and EFs were then min-max normalized (1-0),
and all of these proxy records were merged into a single time-series by averaging normalized values
for each 50-year interval. Therefore, we obtained a time-series for a paleopollution index that
describes concurrently the trajectory for anthropogenic emissions of Hg, Pb, Cu and Ag in northern
Chile from 2005 AD to 3125 cal yrs BP (Dataset 3, Supplemental Data 1). SCP and paleofire time-
series for central Chile were generated following these same procedures. However, because of the
sparse temporal-resolution of lacustrine records, data were spaced at 100-year and 5-year intervals
for paleofire and SCPs time-series, respectively (Table S4, Datasets 4-5).
We used the sequential t-test algorithm proposed by Rodionov (2004) to detect statistically
significant changes in the mean of our paleopollution and paleofire time-series. A cutoff length of 3
intervals (i.e. 150 years) and a significance p-value of 0.05 were defined to identify long-term
regime shifts in metal air pollution over the past 3125 cal yrs BP. The probability level was
maintained when analyzing long-term changes in the fire activity and SCPs pollution, but we
applied cutoff lengths of 5 (500 years) and 3 (15 years) intervals, respectively. For comparative
purposes, we also looked into regime shift in fire activity during the past 7000 cal yrs BP (cutoff
window= 1000 years, p-value= 0.05) by considering the Tagua Tagua micro-charcoal record (Fig.
5a in main text; Heusser, 1990), which represents the largest charcoal time-series available for

S14
central Chile. All regime shift analyses were implemented using the SRSD v.3.2 package for Excel
(Rodionov, 2004; 2006).
Table S4. Proxy records used to generate time-series for the detection of regime shifts in air quality
and fire activity in northern and central Chile, respectively.
A- Northern Chile: Paleopollution time-series
Record Metal Unit Temporal coverage Reference Access
Laguna Lobato Pb, Ag Enrichment factor 1995 AD - 1225 cal yrs BP Cooke et al. (2011) Provided by Colin Cooke
Karukinka peat-bog
Cu Crustal-normalized Cu/La
2005 AD - 3125 cal yrs BP De Vleeschouwer
et al. (2014) Provided by Anja Eichler
Laguna
Pirhuacocha Cu Flux ratios 2005 AD - 1375 cal yrs BP Cooke et al. (2007) Provided by Colin Cooke
Illimani ice-core Cu Enrichment factor 1975 AD - 3125 cal yrs BP Eichler et al.
(2017) Provided by Anja Eichler
Illimani ice-core Pb Enrichment factor 1975 AD - 1875 cal yrs BP Eichler et al.
(2015) NOAA paleoclimate database
Laguna Negrita Hg Flux ratios 2005 AD - 3075 cal yrs BP Cooke et al. (2013) Supplementary material in the
original article
Laguna Yanacocha core
1
Hg Flux ratios 2005 AD - 3075 cal yrs BP Cooke et al. (2009) Provided by Colin Cooke
Laguna Yanacocha core
2
Hg Flux ratios 2005 AD - 3125 cal yrs BP Cooke et al. (2009) Provided by Colin Cooke
Chungara Lake Hg Flux ratios 2005 AD – 2675 cal yrs BP Guedron et al.
(2019) data.mendely.com/datasets
Quelccaya ice-
core
Cu, Ag,
Pb Enrichment factor 1985 AD - 1225 cal yrs BP
Uglietti et al.
(2015) NOAA paleoclimate database
B- Central Chile: Paleofire time-series
Record Proxy
record Unit Temporal coverage Reference Access
Lagunas Aculeo, El Ocho,
Ensueño, Del
Inca, Negra
Spheriodal
carbon particles
Influx
(particles/ cm2/yr) 1852 AD – 2002 AD
von Gunten et al.
(2009) Provided by Lucien Von Gunten
Laguna Tagua Tagua
Charcoal Influx (mm2/cm2/yr)
1710 AD – 2400 cal yrs BP Heusser (1990) Global Charcoal Database
Laguna Aculeo Charcoal Influx (particles/cm2/yr)
1950 AD - 3500 cal yrs BP Villa-Martínez et
al. (2003) Global Charcoal Database
Laguna Chepical Charcoal Influx
(particles/cm2/yr) 1950 AD – 3000 cal yrs BP
Martel-Cea et al.
(2016) Provided by Alejandra Martel-Cea
Austrocedrus
chilensis stands Tree-rings
Absolute frequency
of fires 1950 AD – 1450 AD
Bustos-Schindler et
al. (2010) Extracted from the original article
To perform statistical correlations with heavy-metal paleopollution or fire activity,
paleodemographic time-series for the northern and central regions were resampled by estimating
median values of obtained SPDs at 50-yr and 100-yr intervals, respectively. Specifically, we
evaluated the relationship between these patterns and population levels during Pre-Columbian (425
– 3500 cal yrs BP) and historical (1575 AD – 2005 AD) times. Because the metallurgy production
in northern Chile was likely driven by economic pressures of centralized states since the Inca period
S15
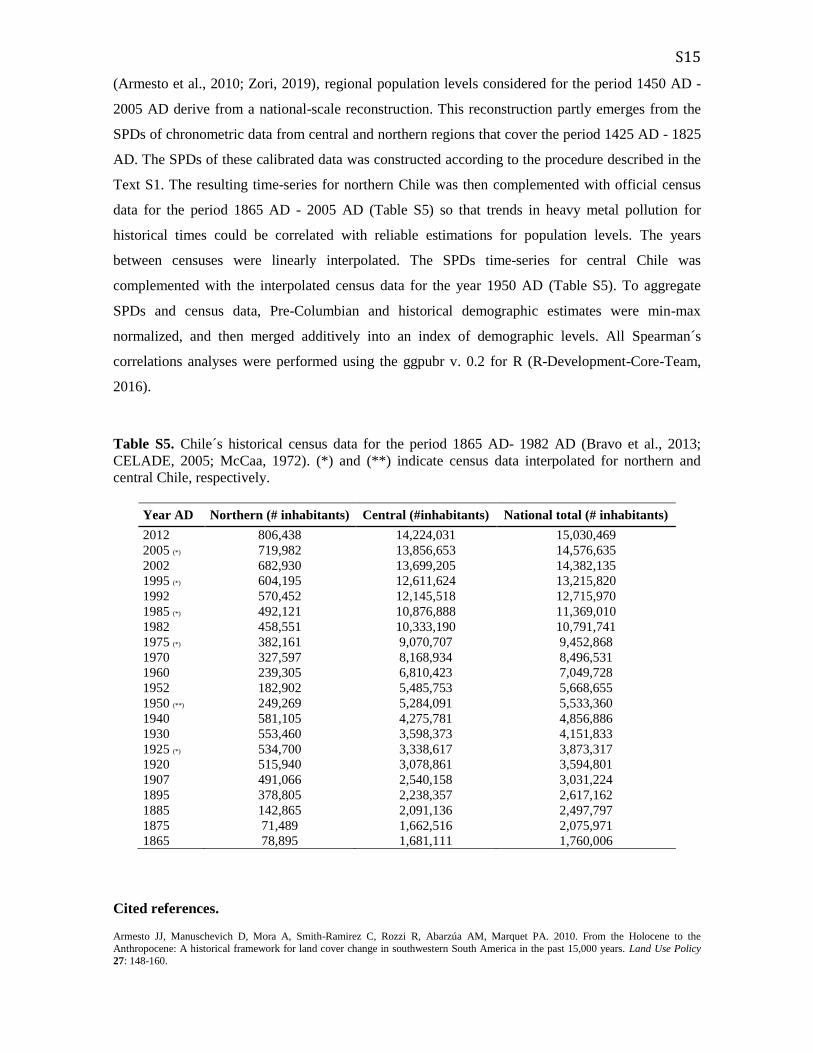
(Armesto et al., 2010; Zori, 2019), regional population levels considered for the period 1450 AD -
2005 AD derive from a national-scale reconstruction. This reconstruction partly emerges from the
SPDs of chronometric data from central and northern regions that cover the period 1425 AD - 1825
AD. The SPDs of these calibrated data was constructed according to the procedure described in the
Text S1. The resulting time-series for northern Chile was then complemented with official census
data for the period 1865 AD - 2005 AD (Table S5) so that trends in heavy metal pollution for
historical times could be correlated with reliable estimations for population levels. The years
between censuses were linearly interpolated. The SPDs time-series for central Chile was
complemented with the interpolated census data for the year 1950 AD (Table S5). To aggregate
SPDs and census data, Pre-Columbian and historical demographic estimates were min-max
normalized, and then merged additively into an index of demographic levels. All Spearman´s
correlations analyses were performed using the ggpubr v. 0.2 for R (R-Development-Core-Team,
2016).
Table S5. Chile´s historical census data for the period 1865 AD- 1982 AD (Bravo et al., 2013;
CELADE, 2005; McCaa, 1972). (*) and (**) indicate census data interpolated for northern and
central Chile, respectively.
Year AD Northern (# inhabitants) Central (#inhabitants) National total (# inhabitants)
2012 806,438 14,224,031 15,030,469
2005 (*) 719,982 13,856,653 14,576,635
2002 682,930 13,699,205 14,382,135
1995 (*) 604,195 12,611,624 13,215,820
1992 570,452 12,145,518 12,715,970
1985 (*) 492,121 10,876,888 11,369,010
1982 458,551 10,333,190 10,791,741
1975 (*) 382,161 9,070,707 9,452,868
1970 327,597 8,168,934 8,496,531
1960 239,305 6,810,423 7,049,728
1952 182,902 5,485,753 5,668,655
1950 (**) 249,269 5,284,091 5,533,360
1940 581,105 4,275,781 4,856,886
1930 553,460 3,598,373 4,151,833
1925 (*) 534,700 3,338,617 3,873,317
1920 515,940 3,078,861 3,594,801
1907 491,066 2,540,158 3,031,224
1895 378,805 2,238,357 2,617,162
1885 142,865 2,091,136 2,497,797
1875 71,489 1,662,516 2,075,971
1865 78,895 1,681,111 1,760,006
Cited references. Armesto JJ, Manuschevich D, Mora A, Smith-Ramirez C, Rozzi R, Abarzúa AM, Marquet PA. 2010. From the Holocene to the
Anthropocene: A historical framework for land cover change in southwestern South America in the past 15,000 years. Land Use Policy
27: 148-160.

S16
Ávalos H, Didier A, Andrade P, Lucero M, González A, Valenzuela E, Carmona G, Ponce A, Román A. 2006. Nuevas evidencias para
Alfarero temprano e Intermedio tardío en el curso inferior del río Aconcagua: El Membrillar 1 y 2 (Concón, región de Valparaíso). in:
Arqueología SCd, editor. XVII Congreso Nacional de Arqueología Chilena; Valdivia, Chile.
Bamforth DB, Grund B. 2012. Radiocarbon calibration curves, summed probability distributions, and early Paleoindian population trends
in North America. J Archaeol Sci 39(6): 1768-1774.
Benkert T, Franke K, Narayanankutty A, Pozitron D, Standish R. 2016. SciDAVis. Available at http://scidavis.sourceforge.net/.
Bravo D, Larrañaga O, Millan I, Ruiz M, Zamorano F. 20 3. nforme f nal com s n externa rev sora del censo 0 . Santiago Chile:
40.
Buchanan B, Collard M, Edinborough K. 2008. Paleoindian demography and the extraterrestrial impact hypothesis. Proc Natl Acad Sci U S A 105(33): 11651-11654. doi:10.1073/pnas.0803762105.
Bustos-Schindler C, Le Quesne C, González ME, Solari ME. 2010. Historia preliminar de incendios y prácticas (multi) culturales en la
cuenca media del río Cachapoal (34º S), Chile central. Bosque (Valdivia) 31: 17-27.
Byers DA, Lima M, Gil A, Gayo E, Latorre C, Robinson E, Villalba R. 2018. Increasing social complexity, climate change, and why
societies might fail to cope. PAGES Magazine 26: 94.
Campbell R, Quiroz D. 2015. Chronological database for Southern Chile (35°30'–42° S), ∼33000 BP to present: Human implications and archaeological biases. Quat Int 356: 39-53.
Casanueva F. 2001. Smallpox and war in Southern Chile in the Lata Eighteenth century, in Cook ND, Lovell WG eds., Secret Judgments of God: Old World Disease in Colonial Spanish America. University of Oklahoma Press: 183-212.
CELADE. 2005. Chile Censo Población - Chile - Estadísticas Año: 1950 2002. 6.
Chaput MA, Gajewski K. 2016. Radiocarbon dates as estimates of ancient human population size. Anthropocene 15: 3-12.
Contreras DA, Meadows J. 2014. Summed radiocarbon calibrations as a population proxy: a critical evaluation using a realistic
simulation approach. J Archaeol Sci 52: 591-608.
Cooke CA, Abbott MB, Wolfe AP, Kittleson JL. 2007. A Millennium of Metallurgy Recorded by Lake Sediments from Morococha,
Peruvian Andes. Environmental Science & Technology 41(10): 3469-3474. doi:10.1021/es062930+.
Cooke CA, Balcom PH, Biester H, Wolfe AP. 2009. Over three millennia of mercury pollution in the Peruvian Andes. Proc Natl Acad
Sci U S A 106(22): 8830-8834. doi:10.1073/pnas.0900517106.
Cooke CA, Balcom PH, Kerfoot C, Abbott MB, Wolfe AP. 2011. Pre-Colombian Mercury Pollution Associated with the Smelting of
Argentiferous Ores in the Bolivian Andes. AMBIO 40(1): 18-25. doi:10.1007/s13280-010-0086-4.
Cooke CA, Hintelmann H, Ague JJ, Burger R, Biester H, Sachs JP, Engstrom DR. 2013. Use and Legacy of Mercury in the Andes.
Environmental Science & Technology 47(9): 4181-4188. doi:10.1021/es3048027.
Crombé P, Robinson E. 2014. 14C dates as demographic proxies in Neolithisation models of northwestern Europe: a critical assessment using Belgium and northeast France as a case-study. J Archaeol Sci 52: 558-566. doi:http://dx.doi.org/10.1016/j.jas.2014.02.001.
De Vleeschouwer F, Vanneste H, Mauquoy D, Piotrowska N, Torrejón F, Roland T, Stein A, Le Roux G. 2014. Emissions from Pre-
Hispanic Metallurgy in the South American Atmosphere. PLOS ONE 9(10): e111315. doi:10.1371/journal.pone.0111315.
Eichler A, Gramlich G, Kellerhals T, Tobler L, Rehren T, Schwikowski M. 2017. Ice-core evidence of earliest extensive copper
metallurgy in the Andes 2700 years ago. Scientific Reports 7: 41855.
Eichler A, Gramlich G, Kellerhals T, Tobler L, Schwikowski M. 2015. Pb pollution from leaded gasoline in South America in the context of a 2000-year metallurgical history. Science Advances 1(2). doi:10.1126/sciadv.1400196.
Evans BM. 2001. Death in Aymaya of Upper Peru, 1580-1623, in Cook ND, Lovell WG eds., Secret Judgments of God: Old World
Disease in Colonial Spanish America. University of Oklahoma Press: 142-158.
Falabella F, Cornejo LE, Sanhueza L, Correa I. 2015. Trends in thermoluminescence date distributions for the Angostura micro-region in
Central Chile. Quat Int 356: 27-38.
Falabella F, Planella MT, Aspillaga E, Sanhueza L, Tykot RH. 2007. Dieta en sociedades alfareras de Chile Central: Aporte de análisis de isótopos estables. Chungara 39: 5-27.
S17
Gamble C, Davies W, Pettitt P, Hazelwood L, Richards M. 2005. The archaeological and genetic foundations of the European population
during the late glacial: mplications for „Agricultural Thinking‟. Cambridge Archaeological Journal 15: 193-223.
Gayo EM, Latorre C, Santoro CM. 2015. Timing of occupation and regional settlement patterns revealed by time-series analyses of an archaeological radiocarbon database for the South-Central Andes (16°–25°S). Quat Int 356(0): 4-14.
Guedron S, Tolu J, Brisset E, Sabatier P, Perrot V, Bouchet S, Develle AL, Bindler R, Cossa D, Fritz SC, Baker PA. 2019. Late Holocene
volcanic and anthropogenic mercury deposition in the western Central Andes (Lake Chungará, Chile). Science of The Total Environment 662: 903-914. doi:https://doi.org/10.1016/j.scitotenv.2019.01.294.
Guilderson TP, Reimer PJ, Brown TA. 2005. The Boon and Bane of Radiocarbon Dating. Science 307(5708): 362-364.
doi:10.1126/science.1104164.
Heusser CJ. 1990. Ice age vegetation and climate of subtropical Chile. Palaeogeogr Palaeocl 80(2): 107-127.
Hiscock P, Attenbrow V. 2016. Dates and demography? The need for caution in using radiometric dates as a robust proxy for prehistoric
population change. Archaeology in Oceania 51: 218–219.
Hogg AG, Hua Q, Blackwell PG, Niu M, Buck CE, Guilderson TP, Heaton TJ, Palmer JG, Reimer PJ, Reimer RW, Turney CSM,
Zimmerman SRH. 2013. SHCal13 Southern Hemisphere Calibration, 0–50,000 Years cal BP. Radiocarbon 55: 1889-1903.
Klein Goldewijk K, Beusen A, Janssen P. 2010. Long-term dynamic modeling of global population and built-up area in a spatially explicit way: HYDE 3.1. Holocene 20: 565–573.
Klein Goldewijk K, Beusen A, Van Drecht G, De Vos M. 2011. The HYDE 3.1 spatially explicit database of human-induced global land-
use change over the past 12,000 years. Global Ecol Biogeogr 20: 73–86.
Koch A, Brierley C, Maslin MM, Lewis SL. 2019. Earth system impacts of the European arrival and Great Dying in the Americas after
1492. Quaternary Sci Rev 207: 13-36. doi:https://doi.org/10.1016/j.quascirev.2018.12.004.
Martel-Cea A, Grosjean M, Alvial I, de Jong R, Fritz SC, von Gunten L. 2016. Late Holocene environmental changes as recorded in the sediments of high Andean Laguna Chepical, Central Chile (32°S; 3050 masl.). Paleo3 461: 44-54.
McCaa R. 1972. Chile XI Censo de Población (1940): Recopilación de cifras publicadas por la Dirección de Estadísticas y Censos.
Santiago, Chile: CEPAL: 348.
McFadgen BG, Knox FB, Cole TRL. 1994. Radiocarbon calibration curve variations and their implications for the interpretation of New
Zealand prehistory. Radiocarbon 36: 221-236.
Michczynska DJ, Michczynski A, Pazdur A. 2007. Frequency Distribution of Radiocarbon Dates as a Tool for Reconstructing Environmental Changes. Radiocarbon 49: 799-806.
Michczynska DJ, Pazdur A. 2004. Shape analysis of cumulative probability density function of radiocarbon dates set in the study of
climate change in the late glacial and Holocene. Radiocarbon 46: 733-744.
Michczynski A Michczynski DJ. 006. The effect of PDF peaks‟ height increase during calibration of radiocarbon date sets.
Geochronometria 25: 1–4.
Michczyski A, Pazdur A. 2003. The method of combining radiocarbon dates and other information in application to study the chronologies of archaeological sites. Geochronometria 22: 41-46.
Parnell AC, Haslett J, Allen JRM, Buck CE, Huntley B. 2008. A flexible approach to assessing synchroneity of past events using
Bayesian reconstructions of sedimentation history. Quaternary Sci Rev 27(19–20): 1872-1885. doi:http://dx.doi.org/10.1016/j.quascirev.2008.07.009.
Peros MC, Munoz SE, Gajewski K, Viau AE. 2010. Prehistoric demography of North America inferred from radiocarbon data. J
Archaeol Sci 37(3): 656-664. doi:http://dx.doi.org/10.1016/j.jas.2009.10.029.
R-Development-Core-Team. 2016. R: A language and environment for statistical computing. R Foundation for Statistical Computing. R
Foundation for Statistical Computing. Vienna, Austria.
Reimer PJ, Bard E, Bayliss A, Beck JW, Blackwell PG, Bronk Ramsey C, Grootes PM, Guilderson TP, Haflidason H, Hajdas I, Hatté C, Heaton TJ, Hoffmann DL, Hogg AG, Hughen KA, Kaiser KF, Kromer B, Manning SW, Niu M, Reimer RW, Richards DA, Scott EM,
Southon JR, Staff RA, Turney CSM, van der Plicht J. 2013. IntCal13 and Marine13 Radiocarbon Age Calibration Curves 0-50,000 Years
cal BP. Radiocarbon 55: 1869-1887.
S18
Reyes AV, Cooke CA. 2011. Northern peatland initiation lagged abrupt increases in deglacial atmospheric CH4. Proc Natl Acad Sci U S
A 108: 4748-4753 doi:10.1073/pnas.1013270108.
Rick JW. 1987. Dates as Data: An Examination of the Peruvian Preceramic Radiocarbon Record. Am Antiq 52(1): 55-73.
Rodionov SN. 2004. A sequential algorithm for testing climate regime shifts. Geophys Res Lett 31: L09204.
Rodionov SN. 2006. Use of prewhitening in climate regime shift detection. Geophys Res Lett 33: L12707.
Sanchez R. 2001. El Tawantinsuyo salvaje en el Finis Terrae Australis (Central Chile). Revista Chilena de Antropología 16: 87-127.
Sanhueza L, Falabella F, Cornejo L, Vásquez M. 2006. Período Alfarero temprano en Chile Central: Nuevas perspectivas a partir de
estudios en la cuenca de Rancagua. in: Arqueología SCd, ed. XVII Congreso Nacional de Arqueología Chilena. Valdivia, Chile.
Sanhueza L, Vásquez M, Falabella F. 2003. Las sociedades Alfareras tempranas de la cuenca de Santiago. Chungara 35: 23-50.
Shennan S, Downey SS, Timpson A, Edinborough K, Colledge S, Kerig T, Manning K, Thomas MG. 2013. Regional population collapse
followed initial agriculture booms in mid-Holocene Europe. Nature Communications DOI: 10.1038/ncomms3486.
Shennan S, Edinborough K. 2007. Prehistoric population history: From the late glacial to the late Neolithic in Central and Northern Europe. J Archaeol Sci 34: 1339-1345.
Smith MA, Williams AN, Turney CSM, Cupper ML. 2008. Human-environment interactions in Australian drylands: exploratory time-
series analysis of archaeological records. Holocene 18(3): 389-401. doi:10.1177/0959683607087929.
Steele J. 2010. Radiocarbon dates as data: quantitative strategies for estimating colonization front speeds and event densities. J Archaeol
Sci 37: 2017-2030.
Surovell TA, Brantingham PJ. 2007. A note on the use of temporal frequency distributions in studies of prehistoric demography. J Archaeol Sci 34: 1868-1877.
Surovell TA, Finley J, Smith GM, Brantingham PJ, Kelly RL. 2009. Correcting Temporal Frequency Distributions for Taphonomic Bias.
J Archaeol Sci 36: 1715-1734.
Thorndycraft VR, Benito G. 2006. The Holocene fluvial chronology of Spain: evidence from a newly compiled radiocarbon database.
Quaternary Sci Rev 25: 223-234.
Timpson A, Colledge S, Crema E, Edinborough K, Kerig T, Manning K, Thomas MG, Shennan S. 2014. Reconstructing regional population fluctuations in the European Neolithic using radiocarbon dates: a new case-study using an improved method. J Archaeol Sci
52: 549-557. doi:http://dx.doi.org/10.1016/j.jas.2014.08.011.
Torfing T. 2015. Neolithic population and summed probability distribution of 14C-dates. J Archaeol Sci 63: 193-198. doi:http://dx.doi.org/10.1016/j.jas.2015.06.004.
Troncoso A, Pavlovic D. 2013. Historia, Saberes y Prácticas: Un Ensayo Sobre el Desarrollo de las Comunidades Alfareras del Norte
Semiárido Chileno. Revista Chilena de Antropología 27: 101-140.
Uglietti C, Gabrielli P, Cooke CA, Vallelonga P, Thompson LG. 2015. Widespread pollution of the South American atmosphere predates
the industrial revolution by 240 y. Proc Natl Acad Sci U S A 112(8): 2349-2354. doi:10.1073/pnas.1421119112.
Villa-Martínez R, Villagrán C, Jenny B. 2003. The last 7500 cal yr B.P. of westerly rainfall in Central Chile inferred from a high-resolution pollen record from Laguna Aculeo (34°S). Quaternary Reseach 60: 284-293.
von Gunten L, Grosjean M, Eggenberger U, Grob P, Urrutia R, Morales A. 2009. Pollution and eutrophication history AD 1800–2005 as
recorded in sediments from five lakes in Central Chile. Global Planet Change 68(3): 198-208. doi:http://dx.doi.org/10.1016/j.gloplacha.2009.04.004.
Whitlock C, Larsen C. 2001. Charcoal as a Fire Proxy, in Smol JP, Birks HJB, Last WM, Bradley RS, Alverson K eds., Tracking
Environmental Change Using Lake Sediments: Terrestrial, Algal, and Siliceous Indicators. Dordrecht: Springer Netherlands: 75-97.
Williams AN. 2012. The use of summed radiocarbon probability distributions in archaeology: A review of methods. J Archaeol Sci 39:
578–589.
Zori C. 2019. Extracting Insights from Prehistoric Andean Metallurgy: Political Organization, Interregional Connections, and Ritual Meanings. Journal of Archaeological Research. doi:10.1007/s10814-019-09128-7.
Related Documents