Article (refereed) Vanderwalle, Marie; de Bello, Francesco; Berg, Matty P.; Bolger, Thomas; Doledec, Sylvain; Dubs, Florence; Feld, Christian K.; Harrington, Richard; Harrison, Paula A.; Lavorel, Sandra; da Silva, Pedro Martins; Moretti, Marco; Niemela, Jari; Santos, Paulo; Sattler, Thomas; Sousa, J.Paulo; Sykes, Martin T.; Vanbergen, Adam J.; Woodcock, Ben A.. 2010 Functional traits as indicators of biodiversity response to land use changes across ecosystems and organisms. Biodiversity and Conservation, 19 (10). 2921-2947. 10.1007/s10531-010-9798-9 © Springer Science+Business Media 2011 This version available http://nora.nerc.ac.uk/13657/ NERC has developed NORA to enable users to access research outputs wholly or partially funded by NERC. Copyright and other rights for material on this site are retained by the authors and/or other rights owners. Users should read the terms and conditions of use of this material at http://nora.nerc.ac.uk/policies.html#access This document is the author’s final manuscript version of the journal article, incorporating any revisions agreed during the peer review process. Some differences between this and the publisher’s version remain. You are advised to consult the publisher’s version if you wish to cite from this article. The original publication is available at www.springerlink.com Contact CEH NORA team at [email protected] The NERC and CEH trade marks and logos (‘the Trademarks’) are registered trademarks of NERC in the UK and other countries, and may not be used without the prior written consent of the Trademark owner. CORE Metadata, citation and similar papers at core.ac.uk Provided by NERC Open Research Archive

Welcome message from author
This document is posted to help you gain knowledge. Please leave a comment to let me know what you think about it! Share it to your friends and learn new things together.
Transcript

Article (refereed)
Vanderwalle, Marie; de Bello, Francesco; Berg, Matty P.; Bolger, Thomas; Doledec, Sylvain; Dubs, Florence; Feld, Christian K.; Harrington, Richard; Harrison, Paula A.; Lavorel, Sandra; da Silva, Pedro Martins; Moretti, Marco; Niemela, Jari; Santos, Paulo; Sattler, Thomas; Sousa, J.Paulo; Sykes, Martin T.; Vanbergen, Adam J.; Woodcock, Ben A.. 2010 Functional traits as indicators of biodiversity response to land use changes across ecosystems and organisms. Biodiversity and Conservation, 19 (10). 2921-2947. 10.1007/s10531-010-9798-9
© Springer Science+Business Media 2011
This version available http://nora.nerc.ac.uk/13657/
NERC has developed NORA to enable users to access research outputs wholly or partially funded by NERC. Copyright and other rights for material on this site are retained by the authors and/or other rights owners. Users should read the terms and conditions of use of this material at http://nora.nerc.ac.uk/policies.html#access
This document is the author’s final manuscript version of the journal article, incorporating any revisions agreed during the peer review process. Some differences between this and the publisher’s version remain. You are advised to consult the publisher’s version if you wish to cite from this article.
The original publication is available at www.springerlink.com
Contact CEH NORA team at
The NERC and CEH trade marks and logos (‘the Trademarks’) are registered trademarks of NERC in the UK and other countries, and may not be used without the prior written consent of the Trademark owner.
CORE Metadata, citation and similar papers at core.ac.uk
Provided by NERC Open Research Archive

Running head: Functional traits as indicators of biodiversity
1
Functional traits as indicators of biodiversity response to land use changes across
ecosystems and organisms
Marie Vandewalle*, Francesco de Bello*, Matty P. Berg, Thomas Bolger, Sylvain
Dolédec, Florence Dubs, Christian K. Feld, Richard Harrington, Paula A. Harrison,
Sandra Lavorel, Pedro Martins da Silva, Marco Moretti, Jari Niemelä, Paulo Santos,
Thomas Sattler, J. Paulo Sousa, Martin T. Sykes, Adam J. Vanbergen, Ben
A.Woodcock
*both authors contributed equally to the manuscript
M. Vandewalle - F. deBello - S. Lavorel
Laboratoire d’Ecologie Alpine, CNRS UMR 5553, Université Joseph Fourier, BP 53,
38041 Grenoble cedex 9, France
F.de Bello
Institute of Botany, Czech Academy of Sciences, Dukelská 135, CZ-379 82 Třeboň
M. Vandewalle ([:8) - M.T. Sykes
Department of Earth and Ecosystem Sciences,
Lund University, Sölvegatan 12, S-223 62 Lund, Sweden
M.P. Berg
VU University, Amsterdam, Institute of Ecological Science, Department of Animal
Ecology De Boelelaan 1085, 1081 HV Amsterdam, The Netherlands

Running head: Functional traits as indicators of biodiversity
2
T. Bolger - Department of Zoology, University College Dublin, Belfield, Dublin 4,
Ireland
S. Dolédec
Université de Lyon, Université Lyon 1, CNRS, UMR 5023, Laboratoire d'Ecologie des
Hydrosystèmes Fluviaux, Bât Forel, 43 bd du 11 novembre 1918, 69622 Villeurbanne,
France
F. Dubs
UMR 137 BioSol. Institut de Recherche pour le Développement - Centre Ile de France /
Universités de Paris
C.K. Feld
Applied Zoology/Hydrobiology, Faculty of Biology and Geography, University of
Duisburg-Essen, 45117 Essen, Germany
R. Harrington
Rothamsted Research, Harpenden, Hertfordshire AL5 2JQ, UK
P. A. Harrison
Environmental Change Institute, Oxford University Centre for the Environment
(OUCE) South Parks Road, Oxford, OX1 3QY, UK
P.M. da Silva - P. Santos - J.P. Sousa
Running head: Functional traits as indicators of biodiversity
3
IMAR-CMA, Department of Life Sciences, Faculty of Sciences and Technology,
University of Coimbra, P3004-517 Coimbra, Portugal
M. Moretti - T. Sattler
Swiss Federal Research Institute WSL, Research Unit Ecosystem Boundaries, Via
Belsoggiorno 22, CH-6500 Bellinzona, Switzerland
Jari Niemelä - Department of Biological and Environmental Sciences, P. O. Box 65, FI-
0014 University of Helsinki, Finland
A.J. Vanbergen
NERC Centre for Ecology and Hydrology, Bush Estate, Penicuik, Edinburgh EH26
0QB, UK
Ben A.Woodcock – NERC Centre for Ecology and Hydrology, Crowmarsh Gifford,
Wallingford, OX10 8BB, UK
Full address for correspondence:
Marie Vandewalle
Department of Earth and Ecosystem Sciences,
Lund University, Sölvegatan 12, S-223 62 Lund, Sweden
Telephone: (+46) 46 2223622
Mobile: (+46) 735 461967
Fax: (+46) 46 2220321

Running head: Functional traits as indicators of biodiversity
4
Abstract
Rigorous and widely applicable indicators of biodiversity are needed to monitor the
responses of ecosystems to global change and design effective conservation schemes.
Among the potential indicators of biodiversity, those based on the functional traits of
species and communities are interesting because they can be generalized to similar
habitats and can be assessed by relatively rapid field assessment across eco-regions.
Functional traits, however, have as yet been rarely considered in current common
monitoring schemes. Moreover, standardized procedures of trait measurement and
analyses have almost exclusively been developed for plants but different approaches
have been used for different groups of organisms.
Here we review approaches using functional traits as biodiversity indicators focussing
not on plants as usual but particularly on animal groups that are commonly considered
in different biodiversity monitoring schemes (benthic invertebrates, collembolans,
above ground insects and birds). Further, we introduce a new framework based on
functional traits indices and illustrate it using case studies where the traits of these
organisms can help monitoring the response of biodiversity to different land use change
drivers. We propose and test standard procedures to integrate different components of
functional traits into biodiversity monitoring schemes across trophic levels and
disciplines. We suggest that the development of indicators using functional traits could
complement, rather than replace, the existent biodiversity monitoring. In this way, the
comparison of the effect of land use changes on biodiversity is facilitated and is
expected to positively influence conservation management practices.

Running head: Functional traits as indicators of biodiversity
5
Keywords
Bioindicators; birds; carabids; collembola; functional diversity; macroinvertebrates;
community weighted mean trait; standardized biodiversity monitoring
Abbreviations
mT mean Trait per community
FD Functional Diversity
LU Landscape Unit
Introduction
Globally, the proportion of land that has been transformed or degraded by humans is
estimated to range between 40-50 % since 1945 (Daily 1995). Much of this land use
transformation has led to a decline in ecosystem quality, i.e. naturalness, and the erosion
of biological diversity. Biodiversity loss is a growing concern that has moved from the
scientific community to public awareness and the political arena. In 2010, more than
190 nations worldwide will be called to present their progress in biodiversity
conservation at the 10th Conference of Parties of the Convention on Biological
Diversity (Balmford et al. 2005; Mace and Baillie 2007). Consensus and commitment to
biodiversity conservation, however, cannot be achieved and translated into management
planning unless reliable ways to monitor biodiversity have been developed (Noss 1990;
Mace and Baillie 2007). The identification of widely applicable indicators of
biodiversity is crucial for effective monitoring schemes.
Various methodologies are adopted for monitoring different aspects of
biodiversity and practically it is impossible to assess all aspects of biodiversity in an
ecosystem. In theory, a number of different indicators, providing information on genes,

Running head: Functional traits as indicators of biodiversity
6
species or populations, and ecosystems or any combination thereof are needed for a
relevant, albeit relative, evaluation of biological diversity (Niemi and MacDonald 2004;
de Bello et al. 2010). The term indicator of biodiversity, in this sense, is used for any
measurable single or composite variable that can help to estimate and monitor a
particular component of biodiversity (Teder et al. 2007). Standardized indicators, i.e. for
which a methodology and data exist, are therefore essential for all types of biodiversity
monitoring (e.g. Green et al. 2005) and different initiatives have attempted to produce
lists of minimum sets of indicators of biodiversity to monitor the pace of biodiversity
loss and assess the result of restoration and conservation policies (e.g. Streamlining
European 2010 Biodiversity Indicators; EEA 2007).
In general however, biodiversity, have been often estimated using a simple
index, i.e. species richness (i.e. the number of species; Levrel 2007) or other indices
based on the taxonomical composition of communities and ecosystem under study (such
as the Simpson index or the presence of red-list species). However biodiversity need not
be restricted to taxonomical components such as numbers of species, but should also
include functional components of communities (Noss 1990; de Bello et al. 2010), which
reflect important structural properties of communities (Moretti et al. 2009). For
example, taxonomical indicators assign an equal functional weight to all species, for
which there is no clear justification (Levrel 2007). Functional traits, i.e. the
characteristics of organisms with demonstrable links to the organism’s fitness, have a
long tradition in ecological studies, especially with regard to plants (Cornelissen et al.
2003). Their possible application have, nevertheless, been investigated through a dozen
of papers in freshwater and marine ecology (e.g., Statzner et al. 2001; Bonada et al.
2006; Diaz et al. 2008; for freshwater environment and e.g., Bremner et al. 2006;
Mouillot et al. 2006; for marine or transitional environments). In freshwater

Running head: Functional traits as indicators of biodiversity
7
environments, Charvet et al. (1998) showed, for example, that effluents from a
wastewater treatment plant significantly changed the trait composition of benthic
invertebrate communities in a small stream. Similar investigations at the European scale
showed significant differences in the trait composition between communities impacted
by sewage and natural reference communities for different countries (Statzner et al.
2001). However this concept is yet a neglected component in biodiversity monitoring
programmes in most ecosystems (Feld et al. 2009).
Traits can be an effective tool in many monitoring studies because, beside
capturing key dimensions of biodiversity not taken into account by other purely
taxonomical indices, they can be relatively easy to estimate once they have been defined
and standard methodologies have been established (Hodgson et al. 2005; Gaucherand
and Lavorel 2007). The presence, abundance and diversity of a given set of functional
traits (e.g., morphological, ecophysiological and life history characteristics) could be
used for estimating particular components of biodiversity (de Bello et al. 2010) and
form together what we will call “functional indicators of biodiversity”. The advantages
of including functional indicators in biodiversity monitoring are numerous. As the
ecosystem processes that are measured do not rely on a specific set of species,
functional indicators can allow further comparison of biodiversity among regions with
different biogeography (Statzner et al. 2001; Hodgson et al. 2005). Hodgson et al.
(2005) for example demonstrated how simple plant traits (e.g. leaf characteristics and
plant height) could be used as indicators for biodiversity conservation in different
European grasslands. Abandoned grasslands (i.e. dominated by tall species) often host a
lower number of plant species due to competitive displacements (Pärtel et al. 1996;
Lepš 2006). Consequently, it has been shown that the diversity of higher trophic levels
(e.g. phytophages, predators) is decreased (Usher 1992). Similarly, canopy architecture

Running head: Functional traits as indicators of biodiversity
8
has been used as one of the most important indicators for biodiversity of different
trophic groups in Swiss grasslands (Schwab et al. 2002). Further, Moretti and Legg
(2009) describe a method to assess functional response to disturbance by combining
plant and animal traits and suggest new challenging opportunities for comparing traits
across trophic levels. Finally functional indicators can also greatly improve predicting
the functions or services provided by an ecosystem as they are proxies for the rate, or
relative importance, of particular processes (Diaz et al. 2007; de Bello et al. this issue).
In this study we explore concepts, methods and possible applications of
functional traits as bioindicators in organisms other than plants. Four case studies were
selected based on the traits of freshwater benthic invertebrates, soil fauna, above-ground
insects and urban birds. The organism groups selected are widely used in large-scale
monitoring because of their indication potential (e.g. Breure et al. 2005). These four
groups of organisms can therefore be considered to represent some key components of
biodiversity monitoring that could not be captured by focussing on plants alone in terms
of e.g., their life histories and dispersal potential. We first review possible approaches
for defining and analyzing functional traits as indicators in these organisms and
allowing generalization beyond specific taxa and regions. We then propose a
standardized procedure for including trait data into biodiversity assessments and
evaluate which type of metrics has the greatest potential as indicators of the response of
biodiversity to land use intensification.
Functional trait indicators across trophic levels: a historical perspective
Freshwater indicators

Running head: Functional traits as indicators of biodiversity
9
The Index of Biotic Integrity (IBI; Karr 1981) was a first step toward preserving most of
the ecological information into a new synthetic expression beyond usual indices (biotic
index, species richness). This index aimed to assess the biotic integrity of fish
communities in North America and was composed of 12 metrics or biological measures
representing some aspects of the composition, function (e.g., the proportion of specific
feeding types) or other characteristics (e.g., the proportion of individuals with disease).
The use of numerous metrics, each reflecting a different aspect of the community, was
supposed to provide a comprehensive view of the status of biodiversity with respect to
multiple environmental stressors (e.g., pollution, physical habitat modification,
acidification and eutrophication). Multimetric indices were further developed for other
organism groups (e.g. benthic macroinvertebrates) and became the national standard for
river assessment and monitoring in the U.S.A. (Karr 1999). Since 2000, the
development and application of multimetric assessment systems has been increasingly
acknowledged in Europe (e.g., FAME consortium 2005; Hering et al. 2006; Pont et al.
2006). Some metrics are based on sound concepts of ecology and are a priori predictive
(e.g. functional feeding groups and their composition along the river continuum)
whereas most structural metrics are based on generalizations drawn from empirical
observations (see Bonada et al. 2006). The advantage of traits over traditional
assessment and monitoring of rivers in Europe has been demonstrated by Dolédec et al.
(1999), Usseglio-Polatera and Beisel (2002) and Statzner et al. (2001; 2005). Besides
their applicability in large biogeographic areas, most traits are predictably affected by
various types of human impact (e.g., Dolédec et al. 2006; Feld and Hering 2007;
Dolédec and Statzner 2008).
Based on the ideas of Southwood (1977), Townsend and Hildrew (1994)
developed the habitat templet concept for river ecosystems. The concept relies on
Running head: Functional traits as indicators of biodiversity
10
predicting general ecological response (in terms of size, reproduction, dispersal,
physiology, i.e., biological traits) of aquatic organisms to habitat disturbance, thus
potentially adding strength if used for river assessment and monitoring. This strength
was picked up by Charvet et al. (1998), who proposed a first river assessment and
monitoring tool to discriminate conditions up- and downstream of a power plant
effluent using biological traits. An overview of the traits of European benthic
macroinvertebrate genera is provided by Usseglio-Polatera (2000) and Statzner et al.
(2007).
Although mostly developed for macroinvertebrates of European running waters,
other biota have been given concern. For example, Pont et al. (2006) applied fish traits
(e.g., reproduction, migration) for river assessment at the European scale.
Soil indicators
Since the early 1960s (e.g. Volz 1962) soil organisms have been used as indicators in
applied ecological studies (Faber 1991; Breure et al. 2005), particularly for soil quality
assessment purposes in managed ecosystems (e.g. microorganisms: Kennedy 1999;
protozoans: Foissner 1999; nematodes: Yeates and Bongers 1999; enchytraeids: Graefe
and Schmelz 1999; earthworms: Paoletti 1999; mites: Behan-Pelletier 1999;
collembolans: Van Straalen 1998). Excepting microorganisms, soil indicator groups
have mainly been applied based on taxonomic identification (Breure et al. 2005). Yet, in
recent decades, a more functional approach has been developed using organisms’ traits
and functional groups, particularly with regard to soil fauna.
With regard to nematodes, a predominance of trait indicators has been typically applied
to soil quality evaluation, mainly life-history traits such as “maturity index” (MI)

Running head: Functional traits as indicators of biodiversity
11
(Bongers 1990; Bongers and Bongers 1998; Yeates and Bongers 1999). MI is
considered to be an ecological measure of disturbance based on ranking taxa according
to their dominant life strategy along a colonizer-persister (c-p) scale, i.e., from r
strategists (colonizers) to K strategists (persisters). Low c-p values are assigned to
nematode families that have a short life-cycle, high colonization ability and are tolerant
to disturbances. Hence, a high MI indicates a nematode fauna that is associated with
more stable environmental conditions.
Life-history traits based on this r-K continuum, as well as on life-forms (i.e.
traits related to taxa vertical distribution in soils), were also considered for enchytraeids
(e.g., Jänsch et al. 2005), earthworms (e.g., Römbke et al. 2005) and mites (e.g., Zaitsev
et al. 2002). Life-history traits have been useful to soil ecologists in measuring the
impact of stressors and management practices, suggesting an easier functional
interpretation in relation to land-use disturbance (Siepel 1995). Another functional
approach that has been widely used among soil fauna is based on the trophic groups to
which the different taxa belongs (e.g. Bongers and Bongers 1998; Nahmani et al. 2006).
All these functional approaches are especially relevant considering their potential at
regional and national scales, such as for the soil ecological classification frameworks
developed in Europe during the 1990s (e.g. BISQ, Schouten et al. 1997; BBSK,
Römbke et al. 1997).
Among soil fauna, collembolans have great potential for use in integrated
biodiversity monitoring schemes (Siepel 1995; Van Straalen et al 2008). Despite their
abundance, diversity and functional role in soils (Hopkin, 1997; Wolters 2001), a trait-
based approach was not explicitly used for indication purposes until recently. Only a
few attempts, particularly addressing traits of dispersal and colonization ability, have
been made to assess the effects of land-use disturbance (Lindberg and Bengtsson 2005;

Running head: Functional traits as indicators of biodiversity
12
Ponge et al. 2006). However, collembolan species display a wide variation in life-
history traits (Hopkin 1997), which could provide a functional and more insightful tool
for assessing the effects of land-use disturbance on collembolan diversity, particularly
in dynamic landscapes (Lindberg and Bengtsson 2005; Van Straalen et al. 2008).
Collembolan life-forms have already been included in Parisi’s ‘Qualità
Biologica del Suolo’ (QBS) (Parisi 2001), a soil quality index based on an eco-
morphological range of arthropods edaphic adaptations for assessment of land-use
sustainability. Yet, the present state of knowledge concerning the impact of disturbance
on life-history traits and functional diversity of collembolans remains limited, partly due
to a lack of empirical data for many species (Lindberg and Bengtsson 2005; Van
Straalen et al. 2008).
Above ground insects as indicators
Terrestrial arthropod diversity has long been used as an indicator of environmental
change, for example, termites, beetles, bees, butterflies, true bugs and hoverflies have
all been used as indicators of changing land-use (Lawton et al. 1998; Hendrickx et al.
2007). Moreover, some insect taxa (e.g. butterflies and beetles) covary with other taxa
and can, sometimes, be used as a surrogate measure for changes in other trophic levels
(Oliver and Beattie 1996; Lawton et al. 1998; Billeter et al. 2008). Insects have many
advantages as indicators. They are numerous and diverse, but can be sampled relatively
easily and often passively with traps. Specific habitat or resource requirements make
them responsive to environmental change (Steffan-Dewenter and Tscharntke 2000,
Moretti and Legg 2009). Despite high diversity and small size they can be identified to
species by specialists or morphospecies by trained non-specialists who, using the
Running head: Functional traits as indicators of biodiversity
13
concept of recognizable taxonomic units (RTU), can provide an accurate proxy of
species diversity (Oliver and Beattie 1996).
The use of trait-based indicators for above ground insects is a relatively
uncommon, but growing, approach. Traits, such as trophic level, diet breadth, dispersal
power, voltinism, and body size, have been used to understand the response of insects to
disturbance or habitat structure (Didham et al. 1998; Steffan-Dewenter and Tscharntke
2000; Driscoll and Weir 2005; Schweiger et al. 2005). More recent examples examined
the relationship between bee and predatory arthropod traits and incidence of fire and
flooding, respectively (Lambeets et al. 2008; Moretti et al. 2009). Ground beetles
(Carabidae) are often used as indicators because they are taxonomically and
functionally diverse, widely-distributed and abundant, well studied, and are sensitive to
habitat heterogeneity and land-use within individual countries (Vanbergen et al. 2005).
Moreover, there is evidence that ground beetle assemblages from different regions
respond in a comparable way to the same environmental factors (Schweiger et al. 2005).
Historically, most ground beetle studies have focused on taxonomic diversity, but a few
studies have considered the response of ground beetle traits to land-use or landscape
heterogeneity (Driscoll and Weir 2005; Pizzolotto 2009).
Bird as indicators
Birds are a good model for indicators because they react rapidly and markedly to
environmental changes (Gregory et al. 2005). They are comparatively easy to survey,
their ecology is known and the limits of the census methods are established. The
species-specific ecological requirements of birds allow assessment of their responses to
modifications of landscape structures. For these reasons birds are often chosen as

Running head: Functional traits as indicators of biodiversity
14
indicators of habitat quality (e.g. Revaz et al. 2008; Douglas et al. 2009). But only
recently, the response and redundancy of bird functional traits to environmental changes
is receiving attention as a way to generalize patterns in biodiversity response across
regions (e.g. Petchey et al. 2007). Bird traits have been used to assess the functional
response to different kinds of ecosystem change, from structure alteration (Cooch and
Ricklefs 1994), to landscape fragmentation (Barbaro and van Halder 2009), land use
intensity (Flynn et al. 2009) and climate changes (Jiguet et al. 2007). The most
commonly traits used are both life-history and autoecological attributes such as body
size, trophic guild, dispersal power, feeding and nesting strategy, and migration
behaviour.
It is particularly interesting to assess functional trait response in urban birds.
Urban areas are the fastest growing land-use type worldwide (United Nations 2000).
The urban matrix represents a heterogeneous environment that is adopted frequently to
suit changing human needs. Plant and animal communities living in urban landscapes
are influenced by urban-specific processes, such as fragmentation, management of the
urban green and high anthropogenic pressure (e.g. Shochat et al. 2006). Bird community
composition strongly modified by the structure related to urban green (see Clergeau et
al. 2001 for review). As a general pattern, bird species richness and diversity decrease
with increasing level of urbanization along a rural to urban gradient but individual
numbers may increase (e.g. Clergeau et al. 2006; McKinney 2006). Considering urban
green gradients within cities, rather than out-vs-inside gradients, species diversity,
community composition and functional structure are expected to be positively affected
by the amount and the structural heterogeneity of the urban green (e.g. Shochat et al.
2006; Sorace and Gustin 2008).
Running head: Functional traits as indicators of biodiversity
15
2
Metrics for functional trait indicators
The approach by Moretti et al. (2009) to define functional traits as indicators of biotic
communities is applied here as a way to generalize and include functional traits into
biodiversity indication. This approach, derived from studies on plants (Diaz et al. 2007)
has the potential for application at different trophic levels and gives relatively simple
and intuitive indices based on functional traits of species.
From the taxonomic point of view, two indices are commonly considered in
biodiversity monitoring schemes and in ecological studies. These are the number of
species (species richness), and other indices that also consider species abundance, such
as Simpson's diversity (Simpson 1949). The Simpson index is defined as 1 minus
Simpson dominance (D) where:
(1) S
D = ∑ pi
i =1
with S being the number of species in the community, and pi the proportion of the i-th
species in a sample (i.e. pi = Ni /N and N = ∑Ni. where, Ni is the number of individuals
of the i-th species). The index can be calculated after log-transformation of the number
of individuals of each species to reduce the effect of dominant species (Moretti et al.
2009).
Likewise, two main types of functional trait indices can be used for biodiversity
monitoring (Diaz et al. 2007; Lavorel et al. 2008). First, the mean trait value per
community (mT) can be calculated for each species trait as the average of trait values in
the community, weighted by the relative abundance of the species carrying each value.
This metric is often understood as defining the dominant functional attribute in a
community or the proportion of a given functional group (functional groups can
generally indicate group of species that either has a similar set of traits, or that share
Running head: Functional traits as indicators of biodiversity
16
similar resources, in this case these groups are generally defined as “guilds”; see
glossary paper in the same issue). Second, the range of trait values within the
community can be expressed through various indices, among which functional diversity
is increasingly used (Lepš et al. 2006; Petchey and Gaston 2006).
Both mT and FD can be calculated for different species traits in each
community. The mT is calculated as an average for a given trait weighted by species
abundance, according to Garnier et al. (2004):
S
(2) mT = ∑ pi x i
i=1
where xi is the trait value of the i-th species. For binary traits xi can be either zero or
one. Categorical traits are treated as binary traits and for each category the relative
abundance of a particular group (or modality) is calculated by the index. In freshwater
ecology, since the information on traits generally includes expert knowledge and
various literature sources, authors have used a “fuzzy coding” approach to quantify
traits (Chevenet et al. 1994). This coding consists in assigning, for each taxon, an
affinity (ak) to each category (1≤ k ≤ h) of a given trait. An affinity score of “0”
indicates no affinity of the taxon whereas an affinity score of “3” indicates a high
affinity of the taxon for a given trait category. For example, the final maximal body size
of a genus was described as falling into seven length categories (Appendix 1). If all the
individuals of a genus fell in one size category, affinity of that species was scored “3”.
If most individuals fell into one size category but a few lay in a neighbouring category,
the genus would score “2” and “1” for the two categories respectively. Here, we further
treated this information as frequency distributions (ak/sum(ak) with sum(ak)=1, see
Bady et al. 2005).
Functional diversity (FD) was calculated for different species traits and using the
Rao index of diversity (Rao 1982; Lepš et al. 2006) as:

Running head: Functional traits as indicators of biodiversity
17
S S
(3) FD = ∑ ∑ d ij p
i p
j
i =1 j =1
where dij expresses the dissimilarity between each pair of species i and j according to
their trait values (Pavoine & Dolédec 2005). Thus the FD index equals the sum of the
dissimilarity in trait space among all possible pairs of species, weighted by the product
of the species’ relative abundances. The parameter dij varies between 0 (two species
have exactly the same trait values) and 1 (the two species have completely different trait
values). For example, in the case of binary traits, when the species have the same trait
value then dij = 0; when they have different values then dij = 1. Note, that the Rao index
is a generalization of a Simpson index of diversity because if dij = 1 for any pair of
species (i.e. each pair of species is completely different), then FD is equal to the
Simpson index of diversity SD (1) (see Rao 1982 for details). In natural communities,
however, the Simpson index and the Rao FD can vary independently (de Bello et al.
2006), therefore the Rao index does not produce necessarily correlated indices of
species and functional diversity (as, for example, Petchey et al. 2007).
The quantification of an ecosystem’s biodiversity from a functional traits point
of view can proceed following three steps. First, the environmental gradient for which
indicators are needed has to be defined. This could be represented by a gradient of
increased human pressure, such as land use changes and intensification. Second, the
response of taxonomic and functional indicators to this gradient needs to be assessed.
Different models can be applied according to the type of design and ecological
hypothesis underlying the response of the organism to this gradient. Third, the
relationship between species and functional diversity needs to be assessed to account for
the overlap between the taxonomic and functional components. In the next section we
use four case studies to explore this framework.

Running head: Functional traits as indicators of biodiversity
18
Case studies
Benthic macroinvertebrates
Benthic macroinvertebrates were sampled in 75 sites across southern Sweden, the
Netherlands, Germany, and western and central Poland. Five land cover types (forest,
grass/shrubs, pasture, crop land, and urban settlement) and ten hydromorphological
variables (shade, density and width of riparian woody vegetation, proportion of riprap at
site, number of logs and debris dams at site, number of dam structures upstream,
stagnation at site, and meandering/straightened river course) were recorded at each site
to quantify two environmental gradients: land use/cover and hydromorphology. All
samples were taken according to a standard multi-habitat sampling protocol using a
handned (mesh: 500 µ m, sampling area: 1.25 m2; for details on sampling and sample
processing see Feld and Hering 2007).
The overall taxon list comprised 240 benthic macroinvertebrate species or
genera. We used a trait by taxon matrix comprising 11 traits (maximal body size, life
cycle duration, number of reproduction cycles per year, aquatic stages, reproduction
type, dissemination strategy, resistance form, respiration types, locomotion, food and
feeding habits) subdivided into 62 fuzzy coded trait categories (see Appendix 1 for
details). Simpson diversity, mT for each single trait and overall FD based on 11 traits
(expressed as arithmetic mean of the 11 FD values) were calculated. Here, the mT
metric reflects the relative abundance of functionally different genera from their trait
categories (Appendix 1). We applied Principal Components Analysis (PCA) to land
cover and hydromorphological variables respectively to derive the degree of
environmental impact at each site. The first PCA axes explained 64 % of the total

Running head: Functional traits as indicators of biodiversity
19
variance of land cover data and 73 % of the total variance of hydromorphological data
respectively. As a result, only first site scores were used to define environmental stress
at each site. The relationships between Simpson diversity, trait/functional diversity and
environmental stress were quantified using Pearson’s correlation coefficients.
Species and functional diversity were positively correlated with each other (r =
0.441, p <0.001) but neither Simpson index (taxonomic diversity) nor functional
diversity (FD) were correlated with environmental pressure gradients (Table 2). On the
contrary, the proportion of various functional groups (as summarized by the mT)
responded significantly to the environmental stressors considered (Table 2). For
instance, the proportion of multivoltine organisms significantly increased with the
proportion of crop in the floodplain (and decreased in the forested floodplains).
Both increasing and intensified agricultural land use (crops) often cause surface
erosion and the entry of fine sediments and organic material into the river channel. This
fine material (fine sand, silt, mud) should promote, for instance, deposit feeders or
species that live on muddy substrata. Deposit feeders significantly decreased with
increasing floodplain forest area, while the correlation with crop land was insignificant.
We also tested the relation of mud-dwelling species proportion to land use. The
correlation of % mud dwellers to % land use was r = -0.411 (p <0.001) for forest and r =
0.300 (p <0.001) for crop land in the floodplain.
In summary, we found Simpson and functional diversity (FD) to remain
relatively stable along environmental stress gradients in lowland rivers of Central
Europe, even in the presence of severe hydromorphological and land use impact. The
results imply that it is the community mean trait values (mT) of various traits that
measurably respond to environmental gradients rather than the overall community

Running head: Functional traits as indicators of biodiversity
20
diversity. We conclude that community diversity measures are likely to be less useful
for the assessment and monitoring of environmental stress in river ecosystems.
Soil collembola
Replacing autochthonous forests by exotic Eucalypus globulus plantations has been an
important land use change pressure on soil biodiversity (Sousa et al. 1997, 2000). In this
case study, data collected in 16 forested areas in Portugal, separated into 8 groups of
contiguous sites (comparing, at each group, one or more stands of autochthonous tree
species and one or more plantations of E. globulus) were considered (see Table 3). At
each site 16 soil cores were taken following a nested design (see details in Sousa et al.
1997, 2000). In each core, the organic horizon was separated from the mineral soil
layer. In the laboratory, collembolans from each horizon of each sample were extracted
using a Tulgren funnel. Traits considered were morphological characteristics connected
to the adaptation of each collembolan species to the soil environment, namely the ocelli,
furca, antenna, pigmentation and the presence of hairs and scales (Appendix 2). These
individual traits were combined to create the “Life-form” trait used in all calculations; it
was the sum of all the scores from each individual trait, being comprised between 2
(minimum, indicating a species with higher adaptation to the surface layers) and 18
(maximum, indicating a species with higher adaptation to deep soil layers). All the
analyses in this example were undertaken at the site level, pooling all the samples from
each site. Simpson index, mT and FD were calculated for each site using the methods
described above. The mT values were compared within each pair of matching sites
using a t-test.

Running head: Functional traits as indicators of biodiversity
21
The comparison of forest types (autochthonous forest vs. eucalypt plantation
from the same area) showed that the eucalypt plantation led to a generalized
impoverishment in the taxonomic diversity of Collembola together with significant
changes in community composition (Sousa et al. 1997, 2000). Moreover, species
present in the upper soil layers (with some exceptions) were generally most affected by
the exotic plantation. The decrease of species diversity in collembolans under E.
globulus stands was accompanied by a similar trend of functional diversity values
(Table 3). In fact both parameters presented a strong and positive correlation (r = 0.85,
p<0.001) although in most comparisons functional diversity suffered a larger decrease
than taxonomic diversity. This decrease was more evident in the upper soil layer when
compared to the mineral horizon (data not shown). Regarding the mean trait
community, despite the absence of significant differences between pairs of
corresponding sites, the shift to the exotic trees led to a general increase of the mT
values. Since higher trait values correspond to species more adapted to mineral soil
layers, this shift led to a change in the functional composition of the community,
namely to an increase in the representation of eu- and hemi-edaphic species, and the
decrease of litter dwelling species (with the exception of Lousã sites). These findings
indicate a general change in the quality and structure of the organic horizon originated
by the exotic plantations. Collembolan life-form traits gave this response trend.
Presumably, therefore, the use of more trait types (e.g. feeding, habitat width related
traits, and ecophysiological tolerance traits) could provide a finer analysis of the
community composition at the functional level and could help to understand better the
reasons behind the observed response.

Running head: Functional traits as indicators of biodiversity
22
Carabids
Data from a pan-European landscape-scale survey of ground beetles were used
to compare the relative performance of taxonomic (activity density and species
richness) and functional measures (FD, mT) of diversity along two gradients in
landscape structure (habitat composition and landscape heterogeneity). Twenty-four
landscape areas were selected comprising six 1 km2
landscape units (LU) sited in each
of four European countries (Finland, France, Ireland and Scotland). Landscape structure
was quantified in GIS (ArcView 3.1), using remotely sensed land cover data (fused
Landsat 7 ETM+ & IRS-1C image), following the CORINE (Level 3) biotopes
classification (EEA). Using FRAGSTATS (McGarigal et al. 2002) a measure of
landscape composition (percentage cover of all forest classes) and heterogeneity
(habitat richness: count of all habitat classes excluding aquatic and artificial surfaces)
was calculated for each LU. Forest percentage cover was the chosen measure of
landscape composition because it is the dominant perennial habitat across these regions
offering refuges for carabids in contemporary agricultural landscapes (Petit and Usher
1998). Habitat richness was the chosen measure of landscape heterogeneity because it
represented the accumulation of ecological niches.
Carabid beetle assemblages were sampled with pitfall traps on a systematic grid
of 16 sampling plots, 200m apart, in each LU giving a total of 96 sampling plots per
country (details in Vanbergen et al. 2005). Trait information was available for 117 out
of the 124 species collected and this subset forms the basis of this analysis. Traits used
were morphological proxies of body size (body length, elytra and pronotum size),
activity and dispersal power (leg femora, tibia, metatarsus size and winglessness),
colour variation (leg and body), sensory structures (body pubescence, eye and antenna

Running head: Functional traits as indicators of biodiversity
23
size), and association with anthropogenic habitat (Appendix 3). These traits were used
to calculate mT and FD (total and morphological and colour traits separately) as
detailed above. Species richness was estimated by rarefaction (Coleman method
standardized to 250 individuals) curves (Estimate-S 8.00) because of large differences
in beetle densities among countries (Gotelli and Colwell 2001). Taxonomic (activity
density and rarefied species richness) and functional (FD and mT) data were log and
arcsine square-root transformed, respectively.
The country of origin was often a significant predictor of both taxonomic and
functional diversity (Table 4a), and the trait dominance of the assemblages (Table 4b),
indicating turnover in individuals and species among geographical regions. This effect
of geographical region was controlled for when testing for relationships between
taxonomic and functional diversity and landscape structure (heterogeneity and
composition). The response of most taxonomic and functional parameters was generally
consistent across geographical regions; local species pools had an effect only on
FDmorph (Table 4a: Forest × Country) and on a single mT (Pronotum height: Forest ×
Country F 3, 16 = 3.71 p = 0.0337 (not shown)) and this was controlled when testing for
the main effects of landscape structure. Both measures of taxonomic diversity (activity
density and species richness) of ground beetles were positively correlated with
increasing landscape heterogeneity (habitat richness) in the landscapes (Table 4a), while
landscape heterogeneity predicted taxonomic diversity, functional diversity and mean
community trait value were more strongly correlated with landscape composition (forest
cover).
There was a significant positive correlation between species richness and
FDcolour (Pearson correlation coefficient 0.63352, p = 0.0009) but FDmorph was
unrelated (-0.01029, p = 0.9620) (not shown). Activity density was unrelated to either

Running head: Functional traits as indicators of biodiversity
24
FDmorph (-0.29180, p = 0.1665) or FDcolour (0.24268, p = 0.2532) (not shown).
FDmorph and FDcolour were positively and negatively correlated with forest cover,
respectively (Table 4a); these inverse relationships explaining a lack of detectable
effects when all traits were pooled (Table 4a: FDtotal).
The mT of these assemblages shifted along the gradient of forest cover with
67% and 22% of the traits related positively and negatively respectively to increasing
forest cover (Table 4b, Fig.1). Increasing forest cover in the landscape led to a shift in
the mT. Species with larger body size, longer legs, larger eyes and longer antennas and
darker in colour dominate the more forested landscapes (Table 4b, Fig.1). Assemblages
in open landscapes were dominated by species covered with pubescence, paler in colour
and fully winged species (Table 4b, Fig.1). In summary, the example of ground beetles
shows that both taxonomic and functional descriptors of diversity conveyed
complementary information about the response of this group to landscape structure.
Taxonomic diversity was enhanced by the addition of niches in landscapes of high
habitat richness, whereas functional diversity and the mean community trait value was
influenced by the shift in landscape composition from forested to open, agricultural
landscapes.
Urban birds
The case study on urban birds was carried out in three Swiss cities (i.e. Zurich, Lucerne
and Lugano). In each city 32 census points (total 96) were selected along a gradient of
impervious area (buildings and sealed surfaces) within cities. Birds were assessed
visually and acoustically by point count method (Bibby et al. 1992) within a 50 m
radius, six mornings between April 15 and June 13, 2007 during 15 minutes (order of
Running head: Functional traits as indicators of biodiversity
25
adj
locations was switched). Nesting, visiting, and migrating individuals were counted and
considered equally in the analyses (Fontana 2008). We assessed the ecological and
functional response of the bird community by selecting 8 species traits (Bezzel 1993;
Maumary et al. 2007). Partial Redundancy Analyses (pRDA) was used to test the
multivariate response of bird species diversity (D) and trait composition (mT and FD) to
urbanization, while city identity was used as co-variable. Species-specific nesting
habitats and feeding guilds (see Appendix 4) were used as model traits in this study.
The number of individuals was log-transformed to reduce the influence of extreme
values. Urbanization was described using two main factors sampled in a radius of 50 m
around the bird count points: the proportion of surface that was covered by impervious
area (Impervious Area), and the percentage cover of trees and bushes (Bush&Tree).
Partial RDA on the community mT and FD resulted in urbanization explaining a
significant amount of variance (12.5%; P <0.0001) in trait composition (biplot not
shown). Increasing asphalted and built area enhanced bird nesting in buildings, while
negatively affected tree and bush nesting communities (Table 5a). This rising coverage
also increased the FD of traits related to nesting habitats while it reduced the FD related
to feeding (Table 5b). Simpson species diversity (SD) of birds was positively linearly
related to functional diversity (FD) (R2
adj = 0.1048, P = 0.0008) and to the percentage
cover of bushes and trees (Bush&Tree) (R2
= 0.1996, P = 0.0069).
Discussion
One of the most important, but yet unresolved, issue to build sound indicator systems is
the standardization of monitoring schemes across organisms and disciplines (see e.g.
Cornelissen et al. 2003; de Bello et al. 2010). In this context the complementarity of
Running head: Functional traits as indicators of biodiversity
26
taxonomical and functional indicators has the potential to lead to an improved system of
biodiversity monitoring, especially in very diverse animal communities (Moretti et al.
2009) and across trophical guilds trying to combine plants and animals (Moretti and
Legg, 2009).
In our study, we deliberately chose examples of animals that are widely used as
indicators for different ecosystem types and different monitoring schemes (Bongers
1990; Siepel 1995; EASAC 2005; Gregory et al. 2005; Douglas et al. 2009) and show
that simple functional metrics (e.g. mT and FD) can be applied in different contexts.
Our main goal was to assess to what extent animal traits measurements could efficiently
complement the traditional use of more taxonomical measurements in the assessment of
the current ecological state of biodiversity. We show (see Table 1 for a summary) that
taxonomical and functional components of diversity respond differently to land use
changes and that, although they can be partially related to each other, they do largely
cover different facets of diversity. In this sense we suggest that the development of
indicators using functional traits could expand, rather than replace, the existent
biodiversity monitoring schemes.
Large and accessible databases of traits are accumulating for plants and animals
(e.g. Vieira et al. 2006; Kleyer et al. 2008), despite this, the use of species-specific traits
as reliable indicator tools is not yet widely applied in current monitoring schemes of the
biodiversity, especially with respect to animal groups. As previously demonstrated for
plants (e.g. Lavorel et al. 2008), we show here that, in general, averaged trait values
over a community (mT) and functional diversity metrics can respond strongly to
environmental changes (Table 1), and are therefore promising as biodiversity indicators.
In the benthic invertebrates’ case study, for example, we found a low level response of
species diversity despite the large changes in species composition (taxon richness
Running head: Functional traits as indicators of biodiversity
27
ranged between 5 and 37 taxa per sample in our case study; see also Bady et al. 2005).
By combining different indicators, and including functional trait metrics, such as the
dominant functional groups in the community, we could better determine the changes in
community structure that has, potentially, key consequences in the functioning of these
ecosystems. Voltinism and the proportion of deposit feeders seem to be indicative of
land use impact in European lowland rivers. As such relationships can be derived from
ecological theory (e.g., from the Habitat Templet Concept, Townsend and Hildrew
1994), traits provide a means for both prediction-based assessment and predictive
modelling of community changes along environmental gradients.
In all the other examples (Table 1), the mean trait value in a community was
always an important indicator of community response to land use modification, both in
terms of land use intensity and landscape structure. This suggest that this facet of
community composition, which reflects the dominant type of organisms in biological
communities (Garnier et al. 2004; Lavorel et al. 2008), can be particularly useful to
understand the response of ecosystems and different trophic levels to changes in
environmental conditions. In most of the case studies considered, species diversity and
FD were correlated significantly (p<0.05), even if the covariation was sometimes week
(low R). The Rao index of FD is a mathematical generalization of the Simpson index,
where the Simpson index is the upper limit for its values (de Bello et al. 2009).
Consequently, purely mathematically, we cannot expect that these two values will be
completely independent. However, the degree to which they are related to each other
depends mostly on properties of the data set and on the biological communities
considered (unlike other indices where a strong positive correlation with species
diversity results by the mathematical properties of the indices; Petchey and Gaston
2006). An important issue is how the variability of the Simpson index compares with

Running head: Functional traits as indicators of biodiversity
28
the variability of the functional diversity index. In our case studies (except for the soil
one, see above), low correlation values, together with different responses of species
diversity and FD to land use gradients, suggest that these two dimensions can indicate
largely independent components of diversity (Pavoine and Dolédec 2005; de Bello et al.
2006; Moretti et al. 2009).
These cases studies suggest, overall, that both the mT and FD metrics have
important potential as to complement present indicators of biodiversity. First, while
taxonomical indicators (such as a list of taxa) cannot be easily extrapolated and applied
to different regions, traits and functional groups can generalise across regions (Statzner
et al. 2001; Hodgson et al. 2005; Pont et al. 2006). This is further justified by the
example on Carabids showing very weak different effects of land use on traits in
different regions (lack of strong effects of land use x country Table 4a). Thus, indicators
that provide consistent measures of biological condition across regions are valuable
tools for both research and management (Carlisle and Hawkins, 2008). Comparisons
across bioclimatic regions, however, should be interpreted carefully (Moretti et al.
2009). Second, such as the soft traits for plants, some morphological traits (e.g. body or
organ size, colour and shape) often do not require strong specific taxonomical
knowledge or specific biological expertise and equipment and could, therefore, provide
a less expensive solution for biodiversity monitoring by shortly trained personnel.
Third, these functional metrics underlie a number of ecosystem functions that can link
biodiversity responses of communities to the delivery of different ecosystem services
(Diaz et al. 2007). Of the mT and FD metrics, probably the most useful remains the mT
since it responds better to environmental gradients and is easier to estimate than FD,
which requires greater experience. Finally, simple functional metrics do have a more
direct link to changes in the ecosystem because, if well selected, functional traits are

Running head: Functional traits as indicators of biodiversity
29
directly coupled to the fitness of the animal. They might therefore give better
predictions of ecosystem response than taxonomical indicators alone (Cornelissen et al.
2003).
As for all indicators of biodiversity, we could foresee some limitations to the use
of these functional metrics. We should indeed be aware that this approach does not for
example take the rare species or the species with a particular conservation priority into
account. Using functional indicators alone, therefore, could lead to a non-optimal
conclusion on biodiversity indication. For example in a conservation perspective, the
use of the functional metrics alone would not be suitable to highlight the importance of
red listed species, which means that we may loose some information on an important
aspect of biodiversity. However, most of indices based on species diversity, as currently
applied in various standardized monitoring schemes (e.g. the number of species),
present the same limitation. Although in some cases, the functional indicator approach
could represent a cost-effective monitoring alternative, we don’t propose here to replace
taxonomical indicators by functional indicators but rather to combine both methods to
improve the biodiversity assessment.
Conclusions
We propose standard indicators that can help integrate monitoring of biodiversity via
functional traits assessment across trophic levels and disciplines. In particular, we
propose that different studies are defined and compared as in Table 1 to assess to what
extent and in which conditions functional traits measurements could efficiently
complement the common use of more taxonomical measurements in the assessment of
the current ecological state of biodiversity. In general, we ask for more background

Running head: Functional traits as indicators of biodiversity
30
knowledge on patterns of variation of the proposed indices to serve as benchmarks for
future observed variations when monitoring the effect of a land use change.
To conclude, and as a step forward to the general criteria mentioned by
Balmford et al. (2005) in the establishment of indicators of biodiversity and ecosystem
services, we propose the following criteria for selecting good functional indicators:
• A precise definition of the indication goals
• A precise definition of the environmental factors that might drive the change
in biodiversity
• A precise definition of the trait or combination of traits, carefully selected
according the driver of change in place.
• If possible, available traits database ready to use
• Functional indicators have to be appropriate for comparative investigations
and estimations
• The developed functional indicator should be easy to measure.
Acknowledgements
This work was supported by the RUBICODE Coordination Action Project
(Rationalising Biodiversity Conservation in Dynamic Ecosystems) funded under the
Sixth Framework Programme of the European Commission (Contract No. 036890). The
study on urban birds was part of the interdisciplinary project ‘BiodiverCity’
(www.biodivercity.ch) funded by the Swiss National Science Foundation as a project of
the NRP54 ‘Sustainable development of the built environment’.

Running head: Functional traits as indicators of biodiversity
31
References
Bady P, Dolédec S, Fesl C, Gayraud G, Bacchi M, Schöll F (2005) Use of
invertebrate traits for the biomonitoring of European large rivers: the effects of
sampling effort on genus richness and functional diversity. Freshw Biol 50(1): 159-
173
Balmford AL, Bennun L, ten Brink B, Cooper D, Côté IM, Crane P, Dobson A,
Dudley N, Dutton I, Green RE, Gregory RD, Harrison J, Kennedy ET, Kremen C,
Leader-Williams N, Lovejoy TE, Mace G, May R, Mayaux P, Morling P, Phillips J,
Redford K, Ricketts TH, Rodríguez JP, Sanjayan M, Schei PJ, van Jaarsveld AS,
Walther BA (2005) The convention on biological diversity's 2010 target. Science
307(5707): 212-213
Barbaro L, van Halder I (2009) Linking bird, carabid beetle and butterfly life-
history traits to habitat fragmentation in mosaic landscapes. Ecography 32(2): 321-
333
Barrocas HM, Gama MM da, Sousa JP, Ferreira C (1998) Impact of reafforestation
with Eucalyptus globulus Labill. on the edaphic collembolan fauna from Serra de
Monchique (Algarve). Misc Zool 21(2): 9-23
Behan-Pelletier VM (1999) Oribatid mite biodiversity in agroecosystems: role for
bioindication. Agric Ecosyst Environ 74: 411–423

Running head: Functional traits as indicators of biodiversity
32
Bezzel E (1993) Kompendium der Vögel Mitteleuropas: Passeres-Singvögel.
Wiesbaden, Aula-Verlag
Bibby CJ, Burgess ND, Hill DA (1992) Bird census techniques. Academic Press,
London, UK
Billeter R, Liira J, Bailey D, Bugter R, Arens P, Augenstein I, Aviron S, Baudry J,
Bukacek R, Burel F, Cerny M,De Blust G, De Cock R, Diekotter T, Dietz H,
Dirksen J, Dormann C, Durka W, Frenzel M, Hamersky R, Hendrickx F, Herzog F,
Klotz S, Koolstra B, Lausch A, Le Coeur D, Maelfait JP, Opdam P, Roubalova M,
Schermann A, Schermann N, Schmidt T, Schweiger O, Smulders MJM, Speelmans
M, Simova P, Verboom J, van Wingerden WKRE, Zobel M, Edwards PJ (2008)
Indicators for biodiversity in agricultural landscapes: a pan-European study. J Appl
Ecol 45: 141-150
Bonada, N, Prat N, Resh VH, Statzner B (2006) Developments in aquatic insect
biomonitoring: a comparative analysis of recent approaches. Annu Rev Entomol
51:495–523
Bongers T (1990) The Maturity Index: an ecological measure of environmental
disturbance based on nematode species composition. Oecologia 83: 14–19
Bongers T, Bongers M (1998) Functional diversity of nematodes. Appl Soil Ecol
10: 239–251

Running head: Functional traits as indicators of biodiversity
33
Bremner J, Rogers SI, Frid CLJ (2006) Matching biological traits to environmental
conditions in marine benthic ecosystems. J Mar Syst 60: 302–316
Breure AM, Mulder CM, Römbke J, Ruf A (2005) Ecological classification and
assessment concepts in soil protection. Ecotox Environ Safe 62: 211–229
Carlisle DM, Hawkins CP (2008) Land use and the structure of western US stream
invertebrate assemblages: predictive models and ecological traits. J N Am Benthol
Soc 27(4): 986-999
Charvet S, Kosmala A, Statzner B (1998) Biomonitoring through biological traits of
benthic macroinvertebrates: perspectives for a general tool in stream management.
Arch Hydrobiol 142:415–432
Chevenet F, Dolédec S, Chessel D (1994) A fuzzy coding approach for the analysis
of long-term ecological data. Freshw Biol 31: 295-309
Clergeau P, Jokimäki J, Savard J-P (2001) Are urban bird communities influenced
by the bird diversity of adjacent landscapes? J Appl Ecol 38: 1122-1134
Clergeau P, Croci S, Jokimäki J, Kaisanlahti-Jokimaki ML, Dinetti M (2006)
Avifauna homogenisation by urbanisation: Analysis at different European latitudes.
Biol Conserv 127: 336-344

Running head: Functional traits as indicators of biodiversity
34
Cooch EG, Ricklefs RE (1994) Do variable environments significantly influence
optimal reproductive effort in birds. Oikos 69: 447-459
Cornelissen JHC, Lavorel S, Garnier E, Diaz S, Buchmann N, Gurvich DE, Reich
PB, ter Steege H, Morgan HD, van der Heijden MGA, Pausas JG, Poorter H (2003)
A handbook of protocols for standardised and easy measurement of plant functional
traits worldwide. Aust J Bot 51(4): 335-380
Daily GC (1995) Restoring Value to the Worlds Degraded Lands. Science
269(5222): 350-354
de Bello F, Leps J, Sebastia MT (2006) Variations in species and functional plant
diversity along climatic and grazing gradients. Ecography 29(6): 801-810
de Bello F, Buchmann N, Casals P, Leps J , Sebastia MT (2009) Relating plant
species and functional diversity to community [delta]13C in NE Spain pastures.
Agric Ecosyst Environ 131(3-4): 303-307
de Bello F, Lavorel S, Gerhold P, Reier Ü, Pärtel M (2010) A biodiversity
indication framework for practical conservation of grasslands and shrublands. Biol
Conserv 143: 9-17
de Bello F, Lavorel S, Diaz S, Harrington R, Cornelissen JHC, Bardgett RD,
Berg MP, Cipriotti P, Feld CK, Hering D, Martin da Silva P, Potts SG, Sandin L,
Sousa JP, Storkey J, Wardle DA, Harrison PA. Towards an assessment of multiple

Running head: Functional traits as indicators of biodiversity
35
ecosystem processes and services via functional traits. Biodiversity and
Conservation: this volume, in revision
Diaz S, Lavorel S, de Bello F, Quétier F, Grigulis K, Robson M (2007)
Incorporating plant functional diversity effects in ecosystem service assessments.
Proc Natl Acad Sci USA 104(52): 20684-20689
Diaz AM, Alonso MLS, Gutierrez MRVA (2008) Biological traits of stream
macroinvertebrates from a semi-arid catchment: patterns along complex
environmental gradients. Freshw Biol 53:1–21
Didham RK, Lawton JH, Hammond PM, Eggleton P (1998) Trophic structure
stability and extinction dynamics of beetles (Coleoptera) in tropical forest
fragments. Philos. Trans R Soc Lond Ser B-Biol Sci 353: 437-451
Dolédec S, Statzner B, Bournard M (1999) Species traits for future biomonitoring
across ecoregions: patterns along a human-impacted river. Freshw Biol 42: 737-758
Dolédec, S, Phillips N, Scarsbrook MR, Riley RH, Townsend CR (2006)
Comparison of structural and functional approaches to determining land-use effects
on grassland stream invertebrate communities. J N Am Benthol Soc 25:44–60
Dolédec S, Statzner B (2008) Invertebrate traits for the biomonitoring of large
European rivers: an assessment of specific types of human impact. Freshw Biol 53:
617-634

Running head: Functional traits as indicators of biodiversity
36
Douglas DJT, Vickery JA, Benton TG (2009) Improving the value of field margins
as foraging habitat for farmland birds. J Appl Ecol 46: 353-362
Driscoll DA, Weir T (2005) Beetle responses to habitat fragmentation depend on
ecological traits, habitat condition, and remnant size. Conserv Biol 19:182-194
EASAC (European Academies Science Advisory Council) (2005) A user’s guide to
biodiversity indicators. The Royal Society
(http://www.royalsoc.ac.uk/document.asp?tip=0&id=3004)
EEA (European Environment Agency) (2007) Halting the loss of biodiversity by
2010: proposal for a first set of indicators to monitor progress in Europe. EEA
technical report 11/2007, Luxembourg
Faber JH (1991) Functional Classification of Soil Fauna - a New Approach. Oikos
62(1): 110-117
FAME Consortium (2005) Manual for application of the European Fish Index (EFI).
A fish-based method to assess the ecological status of European rivers in support of
the Water Framework Directive. Version 1.1, January 2005, Rep. No. EVK1-CT-
2001-00094

Running head: Functional traits as indicators of biodiversity
37
Feld CK, Hering D (2007) Community structure or function: effects of
environmental stress on benthic macroinvertebrates at different spatial scales.
Freshw Biol 52: 1380-1399
Feld CK, Martins da Silva P, Sousa JP, deBello F, Bugter R, Grandin U, Hering D,
Lavorel S, Mountford O, Pardo I, Pärtel M, Römbke J, Sandin L, Jones KB,
Harrison PA (2009) Indicators of biodiversity and ecosystem services: a synthesis
across ecosystems and spatial scales. Oikos 118(12): 1862-1871
Flynn DFB, Gogol-Prokurat M, Nogeire T, Molinari N, Trautman Richers B, Lin
BB, Simpson N, Mayfield MM, DeClerck F (2009) Loss of functional diversity
under land use intensification across multiple taxa. Ecol Lett 12: 22-33
Foissner W (1999) Soil protozoa as bioindicators: pros and cons, methods, diversity,
representative examples. Agric Ecosyst Environ 74: 95–112
Fontana S (2008) Responses of bird community and functional composition to
ecological gradients in Swiss cities. Master thesis, Conservation Biology
Department, University of Basel
Gama MM da, Nogueira A, Múrias dos Santos AFA (1991) Effets du reboisement
par Eucalyptus globulus sur les Collemboles édaphiques. Rev Ecol Biol Sol 28(1):
9-18
Running head: Functional traits as indicators of biodiversity
38
Gama MM da, Vasconcelos TM, Sousa JP (1994) Collembola Diversity in
Portuguese Autocthonous and Allocthonous Forests. Acta Zool Fennica 195: 44-46
Garnier E, Cortez J, Billes G, Navas ML, Roumet C, Debussche M, Laurent G,
Blanchard A, Aubry D, Bellmann A, Neill C, Toussaint JP (2004) Plant functional
markers capture ecosystem properties during secondary succession. Ecology 85(9):
2630-2637
Gaucherand S, Lavorel S (2007) New method for rapid assessment of the functional
composition of herbaceous plant communities. Austral Ecol 32(8): 927-936
Gotelli NJ, Colwell RK (2001) Quantifying biodiversity: procedures and pitfalls in
the measurement and comparison of species richness. Ecol Lett 4: 379-351
Graefe U, Schmelz R (1999) Indicator values, strategy types and life forms of
terrestrial Enchytraeidae and other microannelids. Newsletter on Enchytraeidae 6:
59–68
Green RE, Balmford A, Crane PR, Mace GM, Reynolds JD, Turner RK (2005) A
framework for improved monitoring of biodiversity: Responses to the World
Summit on Sustainable Development. Conserv Biol 19(1): 56-65
Gregory RD, van Strien A, Vorisek P, Meyling AWG, Noble DG, Foppen RPB,
Gibbons DW (2005) Developing indicators for European birds. Philos Trans R Soc
B-Biol Sci 360(1454): 269-288

Running head: Functional traits as indicators of biodiversity
39
Hendrickx F, Maelfait JP, Van Wingerden W, Schweiger O, Speelmans M, Aviron
S, Augenstein I, Billeter R, Bailey D, Bukacek R, Burel F, Diekotter T, Dirksen J,
Herzog F, Liira J, Roubalova M, Vandomme V, Bugter R (2007) How landscape
structure, land-use intensity and habitat diversity affect components of total
arthropod diversity in agricultural landscapes. J Appl Ecol 44: 340-351
Hering D, Feld CK, Moog O, Ofenbock T (2006) Cook book for the development of
a Multimetric Index for biological condition of aquatic ecosystems: experiences
from the European AQEM and STAR projects and related initiatives. Hydrobiologia
566: 311–324
Hodgson JG, Montserrat-Marti G, Cerabolini B, Ceriani RM, Maestro-Martinez M,
Peco B, Wilson PJ, Thompson K, Grime JP, Band SR, Bogard A, Castro-Diez P,
Charles M, Jones G, Perez-Rontome MC, Caccianiga M, Alard D, Bakker JP,
Cornelissen JHC, Dutoit T, Grootjans AP, Guerrero-Campo J, Gupta PL, Hynd A,
Kahmen S, Poschlod P, Romo-Diez A, Rorison IH, Rosen E, Schreiber KF,
Tallowin J, Espuny LD, Villar-Salvador P (2005) A functional method for
classifying European grasslands for use in joint ecological and economic studies.
Basic Appl Ecol 6(2): 119-131
Hopkin S (1997) Biology of the Springtails (Insecta: Collembola). Oxford
University Press, Oxford
Running head: Functional traits as indicators of biodiversity
40
Jänsch S, Römbke J, Didden W (2005) The use of enchytraeids in ecological soil
classification and assessment concepts. Ecotoxicol Environ Saf 62: 266–277
Jiguet F, Gadot AS, Julliard R, Newson SE, Couvet D (2007) Climate envelope, life
history traits and the resilience of birds facing global change. Glob Change Biol
13(8): 1672-1684
Karr JR (1981) Assessment of biotic integrity using fish communities. Fisheries 992
6:21–27
Karr JR (1999) Defining and measuring river health. Freshw Biol 41: 221-234
Kennedy AC (1999) Bacterial diversity in agroecosystems. Agric Ecosyst Environ
74: 65–76
Kleyer M, Bekker RM, Knevel IC, Bakker JP, Thompson K, Sonnenschein M,
Poschlod P, van Groenendael JM, Klimes L, Klimesova J, Klotz S Rusch GM,
Hermy M, Adriaens D, Boedeltje G, Bossuyt B, Dannemann A, Endels P,
Gotzenberger L, Hodgson JG, Jackel AK, Kuhn I, Kunzmann D, Ozinga WA,
Romermann C, Stadler M, Schlegelmilch J, Steendam HJ, Tackenberg O, Wilmann
B, Cornelissen JHC, Eriksson O, Garnier E, Peco B (2008) The LEDA Traitbase: A
database of life-history traits of Northwest European flora. J Ecol 96: 1266-1274

Running head: Functional traits as indicators of biodiversity
41
Lambeets K, Vandegehuchte ML, Maelfait JP, Bonte D (2008) Understanding the
impact of flooding on trait-displacements and shifts in assemblage structure of
predatory arthropods on river banks. J. Anim. Ecol 77: 1162-1174
Lavorel S, Grigulis K, McIntyre S, Garden D, Williams N, Dorrough J, Berman
S, Quétier F, Thébault A, Bonis A (2008) Assessing functional diversity in the field
- methodology matters! Funct Ecol 22(1): 134-147
Lawton JH, Bignell DE, Bolton B, Bloemers GF, Eggleton P, Hammond PM,
Hodda M, Holt RD, Larsen TB, Mawdsley NA, Stork NE, Srivastava DS, Watt AD
(1998) Biodiversity inventories, indicator taxa and effects of habitat modification in
tropical forest. Nature 391: 72-76
Leps J (2006) Biodiversity and plant mixtures in agriculture and ecology.
In: Wachendorf M, Helgadóttir A, Parente G (eds) Sward dynamics, N-flows and
forage utilization in legume-based systems. Proceedings of the 2nd COST 852
workshop, Grado, Italy, 10-12 November 2005, pp13-20.
Lepš J, de Bello F, Lavorel S, Berman S (2006) Quantifying and interpreting
functional diversity of natural communities: practical considerations matter. Preslia
78: 481-501
Levrel H (2007) Selecting indicators for the management of biodiversity. Les
Cahiers de l’IFB, IFB Edition, Paris

Running head: Functional traits as indicators of biodiversity
42
Lindberg N, Bengtsson J (2005) Population responses of oribatid mites and
collembolans after drought. Appl Soil Ecol 28: 163–174
Mace GM, Baillie JEM (2007) The 2010 biodiversity indicators: Challenges for
science and policy. Conserv Biol 21(6): 1406-1413
Maumary L, Valloton L, Knaus P (2007) Die Vögel der Schweiz. Schweizerische
Vogelwarte, Sempach, und Nos Oiseaux, Montmollin
McGarigal K, Cushman SA, Neel MC, Ene E (2002) FRAGSTATS: Spatial Pattern
Analysis Program for Categorical Maps. Computer software program produced by
the authors at the University of Massachusetts, Amherst.
http://www.umass.edu/landeco/research/fragstats/fragstats.html
McKinney ML (2006) Urbanization as a major cause of biotic homogenization. Biol
Conserv 127: 247-260
Moretti M, Legg C (2009) Combining plant and animal traits to assess community
functional responses to disturbance. Ecography 32: 299-309
Moretti M, deBello F, Roberts SPM, Potts SG (2009) Taxonomical vs. functional
responses of bee communities to fire in two contrasting climatic regions. J Anim
Ecol 78: 98-108
Running head: Functional traits as indicators of biodiversity
43
Mouillot D, Spatharis S, Reizopoulou S, Laugier T, Sabetta L, Basset A, Chi TD
(2006) Alternatives to taxonomic-based approaches to assess changes in transitional
water communities. Aquat Conserv 16(5): 469-482
Nahmani J, Lavelle P, Rossi J-P (2006) Does changing the taxonomic resolution
alter the value of soil macroinvertebrates as bioindicators of metal pollution? Soil
Biol Biochem 38: 385–396
Niemi GJ, McDonald M (2004) Application of Ecological Indicators. Annu Rev
Ecol Syst 35: 89-111
Noss RF (1990) Indicators for Monitoring Biodiversity - a Hierarchical Approach.
Conserv Biol 4(4): 355-364
Oliver I, Beattie AJ (1996) Designing a cost-effective invertebrate survey: A test of
methods for rapid assessment of biodiversity. Ecol Appl 6: 594-607
Paoletti MG (1999) The role of earthworms for assessment of sustainability and as
bioindicators. Agric Ecosyst Environ 74: 137–155
Parisi V (2001) The biological soil quality, a method based on microarthropods.
Ateneo Parmense Acta Nat 37: 97–106
Running head: Functional traits as indicators of biodiversity
44
Pärtel M, Zobel M, Zobel K, van der Maarel E (1996) The species pool and its
relation to species richness: Evidence from Estonian plant communities. Oikos
75(1): 111-117
Pavoine S, Dolédec S (2005) The apportionment of quadratic entropy: a useful
alternative for partitioning diversity in ecological data. Environ Ecol Stat 12(2):
125-138
Petchey OL, Gaston KJ (2006) Functional diversity: back to basics and looking
forward. Ecol Lett 9(6): 741-758
Petchey OL, Evans KL, Fishburn IS, Gaston KJ (2007) Low functional diversity and
no redundancy in British avian assemblages. J Anim Ecol 76: 977-985
Petit S, Usher MB (1998) Biodiversity in agricultural landscapes: the ground beetle
communities of woody uncultivated habitats. Biodivers Conserv 7: 1549-1561
Pizzolotto R (2009) Characterization of different habitats on the basis of the species
traits and eco-field approach. Acta Oecol -Int J Ecol 35(1): 142-148
Ponge J-F, Dubs F, Gillet S, Sousa JP, Lavelle P (2006) Decreased biodiversity in
soil springtail communities: the importance of dispersal and landuse history in
heterogeneous landscapes. Soil Biol Biochem 38: 1158–1161

Running head: Functional traits as indicators of biodiversity
45
Pont D, Hugueny B, Beier U, Goffaux D, Melcher A, Noble R, Rogers C, Roset N,
Schmutz S (2006) Assessing river biotic condition at a continental scale: a European
approach using functional metrics and fish assemblages. J Appl Ecol 43: 70–80
Rao CR (1982) Diversity and Dissimilarity Coefficients - a Unified Approach.
Theor Popul Biol 21(1): 24-43
Revaz E, Schaub M, Arlettaz R (2008) Foraging ecology and reproductive biology
of the Stonechat Saxicola torquata: comparison between a revitalized, intensively
cultivated and a historical, traditionally cultivated agro-ecosystem. J Ornithol 149:
301-312
Römbke J, Beck L, Förster B, Ruf A, Rosciczewski, Scheurig M, Woas S, Fründ H-
C, Beck L (1997) Boden als Lebensraum für Bodenorganismen und die
bodenbiologische Standortklassifikation: Eine Literaturstudie. Texte und Berichte
zum Bodenschutz 4/97. Landesanstalt Umweltschutz Baden-Württemberg,
Karlsruhe
Römbke J, Jänsch S, Didden W (2005) The use of earthworms in ecological soil
classification and assessment concepts. Ecotoxicol Environ Saf 62: 249–265
Schouten AJ, Brussaard L, de Ruiter PC, Siepel H, Van Straalen NM (1997) Een
indicatorsysteem voor life support functies van de bodem in relatie tot biodiversiteit.
RIVM Report 712910005 (Rijksinstituut voor Volksgezondheid en Milieu, the
Netherlands), 90 pp
Running head: Functional traits as indicators of biodiversity
46
Schwab A, Dubois D, Fried PM, Edwards PJ (2002) Estimating the biodiversity of
hay meadows in north-eastern Switzerland on the basis of vegetation structure. Agr
Ecosyst Environ 93: 197-209
Schweiger O, Maelfait JP, Van Wingerden W, Hendrickx F, Billeter R, Speelmans
M, Augenstein I, Aukema B, Aviron S, Bailey D, Bukacek R, Burel F, Diekotter T,
Dirksen J, Frenzel M, Herzog F, Liira J, Roubalova M, Bugter R (2005) Quantifying
the impact of environmental factors on arthropod communities in agricultural
landscapes across organizational levels and spatial scales. J Appl Ecol 42: 1129-
1139
Shochat E, Warren PS, Faeth SH, McIntyre NE, Hope D (2006) From patterns to
emerging processes in mechanistic urban ecology. Trends Ecol Evol 21: 186-191
Siepel H (1995) Applications of microarthopod life-history tactics I nature
management and ecotoxicology. Biol Fert Soils 19:75-83
Simpson EH (1949) Measurement of diversity. Nature 163(4148): 688
Sorace A, Gustin M (2008) Homogenization processes and local effects on
avifaunal composition in Italian towns. Acta Oecol 33: 15-26

Running head: Functional traits as indicators of biodiversity
47
Sousa JP, Gama MM da (1994) Rupture in a Collembola community structure from
a Quercus rotundifolia Lam. forest due to the reafforestation with Eucalyptus
globulus Labill. Eur J Soil Biol 30(2): 71-78
Sousa JP, Vingada JV, Barrocas H, Gama MM da (1997) Effects of introduced
exotic tree species on Collembola communities: the importance of management
techniques. Pedobiologia 41: 145–153
Sousa JP, Gama MM da, Ferreira C, Barrocas H (2000) Effect of eucalyptus
plantations on Collembola communities in Portugal: a review. Belg J Entomol 2:
187–201
Southwood TRE (1977) Habitat, the templet for ecological strategies? J. Anim. Ecol
46: 337-365
Statzner B, Bis B, Dolédec S, Usseglio-Polatera P (2001) Perspectives for
biomonitoring at large spatial scales: a unified measure for the functional
composition of invertebrate communities in European running waters. Basic Appl
Ecol 2: 73-85
Statzner B, Bady P, Dolédec S, Scholl F (2005) Invertebrate traits for the
biomonitoring of large European rivers: an initial assessment of trait patterns in least
impacted river reaches. Freshw Biol 50: 2136-2161

Running head: Functional traits as indicators of biodiversity
48
Statzner, B, Bonada, N, Dolédec S (2007) Conservation of taxonomic and biological
trait diversity of European stream macroinvertebrate communities: towards a
collective public database. Biodivers Conserv 16:3609–3632
Steffan-Dewenter I, Tscharntke T (2000) Butterfly community structure in
fragmented habitats. Ecol Lett 3: 449-456
Streamlining European 2010 Biodiversity Indicators (SEBI). http://biodiversity-
chm.eea.europa.eu/information/indicator/F1090245995/F1101800700/1090246068
Teder T, Moora M, Roosaluste E, Zobel K, Partel M, Koljalg U, Zobel M (2007)
Monitoring of biological diversity: a common-ground approach. Conserv Biol
21(2): 313-317
Townsend CR, Hildrew AG (1994) Species traits in relation to habitat template for
river systems. Freshw Biol 31: 265-275
Usher MB (1992) Management and diversity of arthropods in Calluna heathland.
Biodivers Conserv 1: 63-79
Usseglio-Polatera P, Bournaud M, Richoux P, Tachet H (2000) Biological and
ecological traits of benthic freshwater macroinvertebrates: relationships and
definition of groups with similar traits. Freshw Biol 43: 175-205
Running head: Functional traits as indicators of biodiversity
49
Usseglio-Polatera P and Beisel JN (2002) Longitudinal changes in
macroinvertebrate assemblages in the Meuse River: Anthropogenic effects versus
natural change. River Res Appl 18(2): 197-211
Vanbergen AJ, Woodcock BA, Watt AD, Niemela J (2005) Effect of land-use
heterogeneity on carabid communities at the landscape scale. Ecography 28: 3-16
Van Straalen NM (1998) Evaluation of bioindicator systems derived from soil
arthropod communities. Appl Soil Ecol 9: 429–437
Van Straalen NM, Timmermans MJTN, Roelofs D, Berg MP (2008) Apterygota in
the spotlights of ecology, evolution and genomics. Eur J Soil Biol 44: 452-457
Vieira NKM, Poff NL, Carlisle DM, Moulton SR II, Koski ML, Kondratieff BC
(2006) A database of lotic invertebrate traits for North America: U.S. Geological
Survey Data Series 187 (http://pubs.usgs.gov/ds/ds187/pdf/ds187.pdf)
Volz P (1962) Beiträge zu einer pedozoologischen Standortslehre. Pedobiologia 1:
242–290
Wolters V (2001) Biodiversity of soil animals and its function. Eur J Soil Biol 37:
221-227
Yeates GW, Bongers T (1999) Nematode diversity in agroecosystems. Agric
Ecosyst Environ 74: 113–135

Running head: Functional traits as indicators of biodiversity
50
Zaitsev AS, Chauvat M, Pflug A, Wolters V (2002) Oribatid mite diversity and
community dynamics in a spruce chronosequence. Soil Bioi Biochem 34: 1919-
1927

Running head: Functional traits as indicators of biodiversity
Table 1: Summary of the results for the 4 case studies (i.e. 4 organism types): response of species diversity (richness or Simpson), functional
diversity (Rao) and community mean traits (or % of different functional groups) metrics to different environmental changes
Response of indices to environment
Organism
type
Environmental
gradient Species diversity
(Richness or Simpson)
Functional diversity
(FD with Rao index)
Community mean trait
(mT)
Species vs. functional
diversity
River benthic
invertebrates
(GER)
Land use intensity Non linear (difference
only among extremes)
Non linear (difference
only among extremes)
Yes (linear for aquatic
stages, reproduction,
dispersion)
Yes – weak linear
relationship
Soil fauna (PT) Native vs. exotic
forest stands
Yes (general decrease
of species diversity in
exotic stands)
Yes (Similar pattern as
Simpson index, but in
most cases more
pronounced decreases)
Yes (for life-form trait).
Shift to the exotic led to an
increase in the
representation of eu- and
hemi-edaphic species, and
a decrease in litter
dwelling species
Yes -linear relationship
(expected since traits are
also used for species
identification)
Terrestrial
insects (EU)
Landscape
heterogeneity and
composition
Yes –positive linear
relationship with
landscape
heterogeneity
Yes FDcolour
negatively and FD
morph positively
related to landscape
composition
Yes (for all traits) with
landscape composition
Yes -linear relationship
between FDcolour and
species richness, but not
for activity density
Birds (CH) Urbanization Yes -linear relationship Yes -linear relationship Yes - linear relationship Yes – weak linear
relationship
51

Running head: Functional traits as indicators of biodiversity
Table 2: Correlation of land use and hydromorphological degradation, selected traits
(mT metrics), Simpson index and Functional Diversity (FD) for benthic
macroinvertebrates. PCA 1 axes (sample scores) represent land use and
hydromorphological gradients.
Diversity measure x Environmental gradients r p
Simpson index PCA 1 land use 0.047 0.654
Simpson index PCA 1 hydromorphology 0.088 0.404
FD PCA 1 land use 0.140 0.181
FD PCA 1 hydromorphology 0.089 0.394
mT category (metrics) x Environmental gradients and parameters
multivoltine species
multivoltine species
multivoltine species
multivoltine species
mud preferences
mud preferences
mud preferences
mud preferences
deposit-feeders
PCA1 land use
PCA 1 hydromorphology
% Forest land cover
% Crop land use
PCA1 land use
PCA1 hydromorphology
% Forest land cover
% Crop land use
PCA1 land use
-0.383
-0.400
-0.389
0.230
-0.418
-0.271
-0.411
0.300
-0.209
<0.001
<0.001
<0.001
0.006
<0.001
<0.001
<0.001
<0.001
0.012
deposit feeder PCA1 hydromorphology -0.157 0.061
deposit feeder % Forest land cover -0.188 0.024
deposit feeder % Crop land use -0.091 0.280
52

Running head: Functional traits as indicators of biodiversity
Table 3: Summary of the results obtained for the 8 Collembola case studies. Information is given for each forest stand. Comparisons should be
analysed between the autochthonous and exotic stand at each case study
Case study / author Tree species Sp richness Simpson Functional diversity Mean trait per community Habitat Diff (3)
Values % change (1) Values % change (1) mT % change (2)
Cercal Q. suber 59 0,911 0,235 0,219 Gama et al (1991) E. globulus 39 0,834 8,42 0,225 4,21 0,284 29,68 Some
Almeirim Q. suber 19 0,805 0,239 0,442 Sousa et al (1997) E. globulus 21 0,648 19,51 0,174 27,26 0,509 15,16 Some
Monchique 1 Q. suber 1 47 0,629 0,111 0,285 Barrocas et al (1998) E. globulus 1 19 0,576 8,49 0,064 42,09 0,547 91,93 Marked
E. globulus 2 21 0,568 9,64 0,067 39,71 0,510 78,95 Marked E. globulus 3 23 0,858 -36,41 0,160 -44,63 0,513 80,00 Few
Monchique 2 Q. suber 2 46 0,651 0,120 0,334 Barrocas et al (1998) E. globulus 1 19 0,576 11,66 0,064 46,44 0,547 63,77 Marked
E. globulus 2 21 0,568 12,77 0,067 44,24 0,510 52,69 Marked E. globulus 3 23 0,858 -31,68 0,160 -33,77 0,513 53,59 Few
Monchique 3 Q. canariensis 45 0,852 0,166 0,285 Barrocas et al (1998) E. globulus 1 19 0,576 32,46 0,064 61,30 0,547 91,93 Marked
E. globulus 2 21 0,568 33,31 0,067 59,71 0,510 78,95 Marked E. globulus 3 23 0,858 -0,68 0,160 3,34 0,513 80,00 Few
Idanha Q. ilex 43 0,863 0,201 0,242 Sousa et al (1994) E. globulus 26 0,773 10,44 0,209 -3,70 0,410 69,42 Marked
Sever P. pinaster 46 0,787 0,214 0,182 Sousa et al (2000) E. globulus 41 0,708 9,96 0,153 28,61 0,235 29,12 Few
Lousã P. pinaster 37 0,603 0,083 0,264 Gama et al (1994) E. globulus 40 0,845 -40,08 0,192 -130,53 0,248 -6,06 Few
(1) Positive values indicate a decrease in Simpson or Functional diversity values when shifting to Eucalyptus
(2) Positive values indicate na increase in mT values when shifting to Eucalyptus
(3) Habitat differences were evaluated taking into account vegetation cover, structure of the organic horizon and soil parameters
53

Running head: Functional traits as indicators of biodiversity
54
Table 4 a: Results of GLMMs (proc glimmix SAS v9.0) showing the influence of region (Country), landscape heterogeneity (habitat richness) and
composition (% cover forest) on the taxonomic and functional diversity of ground beetle assemblages (Carabidae) sampled from 24 1km2
landscape
units (LU) situated in four European countries. AIC = goodness of fit; MPE = multiple parameter estimates; ndf = numerator degrees of freedom, ddf =
denominator degrees of freedom. FDtotal includes all traits; FDmorph = morphological traits only; FDcolour = colour variation only.
AIC Fixed effects Random estimate ± SE Slope ndf, ddf F p Taxonomic diversity LU(Country)
Activity density 28.31 Country 0.05714 ± 0.03708 MPE 3,19 13.40 <0.0001 Habitat richness 0.08240 1,19 5.03 0.0370
Species richness -34.20 Habitat richness 0.003567 ± 0.002151 0.02849 1,22 15.76 0.0006
Functional diversity
FDtotal 19.22 Country 0.04380 ± 0.02770 MPE 3,20 3.05 0.0525
FDmorph 18.69 Country 0.005225±0.003695 MPE 3,16 1.88 0.1740
Forest 0.003837 1,16 5.75 0.0290
Forest × Country MPE 3,16 3.78 0.0318
FDcolour 12.07 Country 0.01790 ± 0.01162 MPE 3,19 3.31 0.0421 Forest -0.00251 1,19 4.99 0.0378
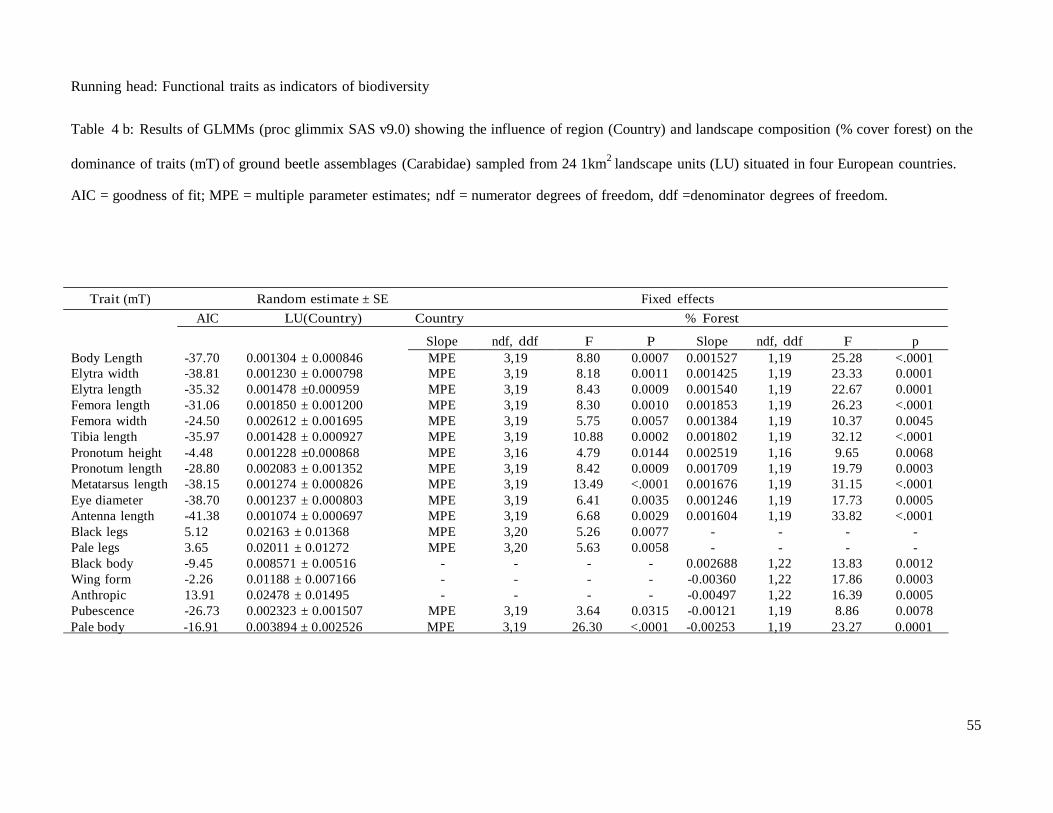
Running head: Functional traits as indicators of biodiversity
55
Table 4 b: Results of GLMMs (proc glimmix SAS v9.0) showing the influence of region (Country) and landscape composition (% cover forest) on the
dominance of traits (mT) of ground beetle assemblages (Carabidae) sampled from 24 1km2
landscape units (LU) situated in four European countries.
AIC = goodness of fit; MPE = multiple parameter estimates; ndf = numerator degrees of freedom, ddf =denominator degrees of freedom.
Trait (mT) Random estimate ± SE Fixed effects
AIC LU(Country) Country % Forest
Slope ndf, ddf F P Slope ndf, ddf F p Body Length -37.70 0.001304 ± 0.000846 MPE 3,19 8.80 0.0007 0.001527 1,19 25.28 <.0001 Elytra width -38.81 0.001230 ± 0.000798 MPE 3,19 8.18 0.0011 0.001425 1,19 23.33 0.0001 Elytra length -35.32 0.001478 ±0.000959 MPE 3,19 8.43 0.0009 0.001540 1,19 22.67 0.0001 Femora length -31.06 0.001850 ± 0.001200 MPE 3,19 8.30 0.0010 0.001853 1,19 26.23 <.0001 Femora width -24.50 0.002612 ± 0.001695 MPE 3,19 5.75 0.0057 0.001384 1,19 10.37 0.0045 Tibia length -35.97 0.001428 ± 0.000927 MPE 3,19 10.88 0.0002 0.001802 1,19 32.12 <.0001 Pronotum height -4.48 0.001228 ±0.000868 MPE 3,16 4.79 0.0144 0.002519 1,16 9.65 0.0068 Pronotum length -28.80 0.002083 ± 0.001352 MPE 3,19 8.42 0.0009 0.001709 1,19 19.79 0.0003 Metatarsus length -38.15 0.001274 ± 0.000826 MPE 3,19 13.49 <.0001 0.001676 1,19 31.15 <.0001 Eye diameter -38.70 0.001237 ± 0.000803 MPE 3,19 6.41 0.0035 0.001246 1,19 17.73 0.0005 Antenna length -41.38 0.001074 ± 0.000697 MPE 3,19 6.68 0.0029 0.001604 1,19 33.82 <.0001 Black legs 5.12 0.02163 ± 0.01368 MPE 3,20 5.26 0.0077 - - - - Pale legs 3.65 0.02011 ± 0.01272 MPE 3,20 5.63 0.0058 - - - - Black body -9.45 0.008571 ± 0.00516 - - - - 0.002688 1,22 13.83 0.0012 Wing form -2.26 0.01188 ± 0.007166 - - - - -0.00360 1,22 17.86 0.0003 Anthropic 13.91 0.02478 ± 0.01495 - - - - -0.00497 1,22 16.39 0.0005 Pubescence -26.73 0.002323 ± 0.001507 MPE 3,19 3.64 0.0315 -0.00121 1,19 8.86 0.0078
Pale body -16.91 0.003894 ± 0.002526 MPE 3,19 26.30 <.0001 -0.00253 1,19 23.27 0.0001

Running head: Functional traits as indicators of biodiversity
56
adj
1 Table 5 a,b: Linear regressions between bird traits of nesting habitats and feeding
2 guilds (see Appendix 4) and urbanization factors, i.e. asphalted and built area
3 (Impervious Area) and percentage cover of bushes and trees (Bush&Tree) for (a)
4 Community weight mean of single traits (mT) and (b) FD of trait groups. Only
5 significant results are given (P-value < 0.05; Coef = coefficient of regression; R2
=
6 adjusted R squared).
7
8 a) mT
Trait
Urbanization 2
group Trait
factor Coef P-value R adj
Nesting NestBuilding ImperviousArea 0.222 0.0017 0.3149 habitat Bush&Tree - 0.250 0.0130
NestTree ImperviousArea - 0.120 0.0011 0.1025
NestCavity Bush&Tree 0.108 0.0511 0.0800
NestBush ImperviousArea - 0.068 0.0385 0.2701
Bush&Tree 0.144 0.0027
NestGround Bush&Tree 0.048 0.0200 0.0897
Feeding LargeCarnivore - - n.s. 0.0072
guild Insectivore Bush&Tree 0.342 0.0005 0.1811
Granivore Bush&Tree - 0.348 0.0005 0.1930
9
10
b) FD
Trait group Urbanization
2 adj
factor Coef P-value R
Nesting habitat Bush&Tree 0.094 0.0001 0.3218
Feeding guild Bush&Tree - 0.097 0.0013 0.1935
11
12
13
14
15
16
17
18

Running head: Functional traits as indicators of biodiversity
57
A) 0.6
0.4
0.2
0.0
T -0.2
m -0.4
-0.6
-0.8 Pale body Wing form
-1.0 Anthropic Pubescence
-1.2
0 20 40 60 80 100
B) 0.5
0.4 Body length Elytra width
0.3 Elytra length Femora length
0.2 Femora width Tibia length
T Pronotum height
m 0.1 Pronotum length
0.0 Metatarsus length Eye diameter
-0.1 Antenna length Black body
-0.2
-0.3
0 20 40 60 80 100
Forest cover per landscape unit (1km2)
0.6
0.4
0.2
0.0
T -0.2
m -0.4
-0.6
-0.8 Pale body Wing form
-1.0 Anthropic Pubescence
-1.2
0 20 40 60 80 100
0.5
0.4 Body length Elytra width
0.3 Elytra length Femora length
0.2 Femora width Tibia length
T Pronotum height
m 0.1 Pronotum length
0.0 Metatarsus length Eye diameter
-0.1 Antenna length Black body
-0.2
-0.3
0 20 40 60 80 100
Forest cover per landscape unit (1km2)
mT
m
T
19 Figure 1
20 Mean traits (mT) of ground beetle (Carabidae) assemblages negatively (A) and
21 positively (B) correlated with increasing forest cover in 24 1km2
landscape units (LU)
22 situated in four European countries.
23
24
25 (A) 26 27
28
29
30
31
32
33
34
35
36
37
38
39
40 (B) 41
42
43
44
45
46
47
48
49
50
51
52
0.6
0.4
0.2
0.0
-0.2
-0.4
-0.6
-0.8
-1.0
-1.2
0.5
0.4
0.3
0.2
0.1
0.0
-0.1
-0.2
-0.3
0 20 40 60 80 100
0 20 40 60 80 100
Forest cover per landscape unit (1km2)
Pale body
Wing form
Anthropic
Pubescence
Body length
Elytra width
Elytra length
Femora length
Femora width
Tibia length
Pronotum height
Pronotum length
Metatarsus length
Eye diameter
Antenna length
Black body

Running head: Functional traits as indicators of biodiversity
58
Appendix 1:
Benthic macroinvertebrate traits and trait modalities.
Traits No. of Categories
categories
Maximal body size 7 ≤ 0.25 cm, > 0.25–0.5 cm, > 0.5–1 cm, > 1–2 cm, > 2–
4 cm, > 4–8 cm, > 8 cm
Life cycle duration 2 ≤ 1 year, > 1 year
Potential number of 3
reproduction cycles
per year
< 1, 1, > 1
Aquatic stages 4 egg, larva, nymph, imago
Reproduction 8 ovoviviparity, isolated free eggs, isolated cemented
eggs, cemented or fixed clutches, free clutches,
clutches in vegetation (endophytic), terrestrial
clutches, asexual reproduction
Dissemination 4 aquatic passive, aquatic active, aerial passive, aerial
active
Resistance form 5 eggs/statoblasts/gemmules, cocoons, cells against
desiccation, diapause or dormancy, none
Respiration 4 tegument, gill, plastron, spiracle (aerial)
Locomotion and
substrate relation
8 flier, surface swimmer, swimmer, crawler, burrower
(epibenthic), interstitial (endobenthic), temporarily
attached, permanently attached
Food 9 fine sediment + microorganisms, detritus < 1 mm,
plant detritus ≥ 1 mm, living macrophytes, dead
animals > 1 mm, living microinvertebrates, living
macroinvertebrates, vertebrates
Feeding habits 8 absorber, deposit feeder, shredder, scraper, filter
feeder, piercer (plant or animal), predator
(carver/engulfer/swallower), parasite/parasitoid
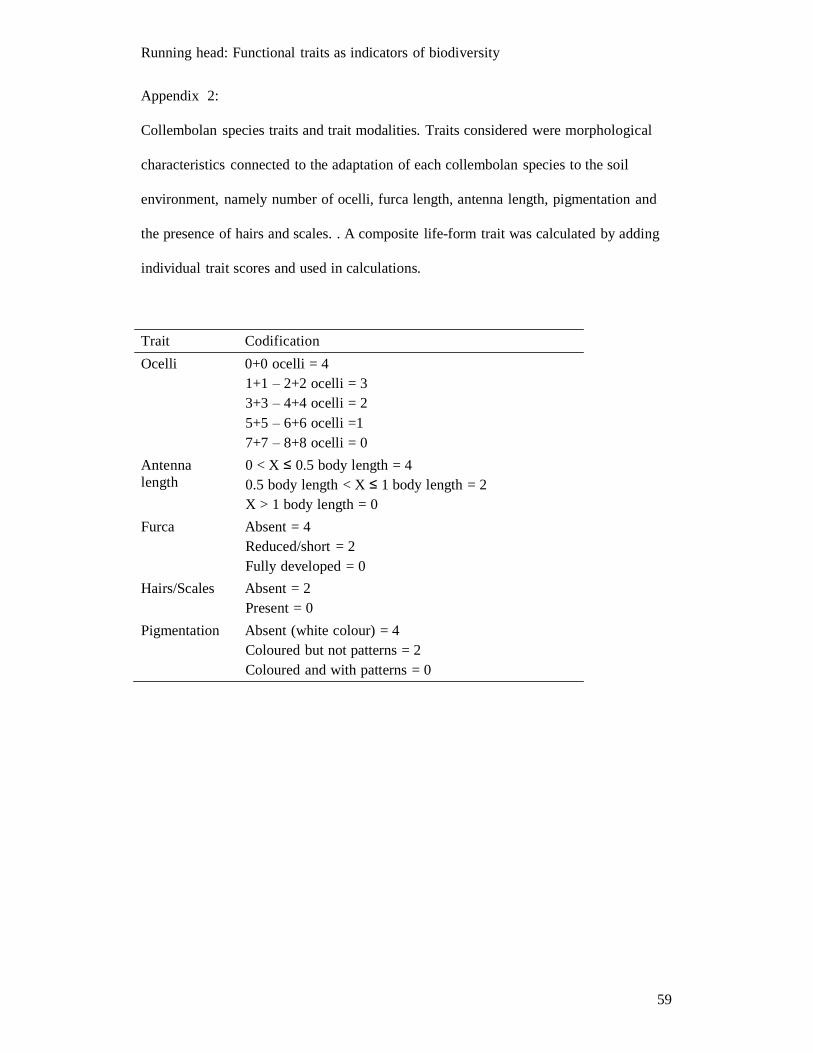
Running head: Functional traits as indicators of biodiversity
59
Appendix 2:
Collembolan species traits and trait modalities. Traits considered were morphological
characteristics connected to the adaptation of each collembolan species to the soil
environment, namely number of ocelli, furca length, antenna length, pigmentation and
the presence of hairs and scales. . A composite life-form trait was calculated by adding
individual trait scores and used in calculations.
Trait Codification
Ocelli 0+0 ocelli = 4
1+1 – 2+2 ocelli = 3
3+3 – 4+4 ocelli = 2
5+5 – 6+6 ocelli =1
7+7 – 8+8 ocelli = 0
Antenna
length
0 < X ≤ 0.5 body length = 4
0.5 body length < X ≤ 1 body length = 2
X > 1 body length = 0
Furca Absent = 4
Reduced/short = 2
Fully developed = 0
Hairs/Scales Absent = 2
Present = 0
Pigmentation Absent (white colour) = 4
Coloured but not patterns = 2
Coloured and with patterns = 0

Running head: Functional traits as indicators of biodiversity
60
Appendix 3:
Traits of carabids (117 species collected from 24 landscapes in four European countries)
used in the calculation of FD and mT.
Trait group Trait Definition
Morphology
Colouration
Wing form 0 = wingless, 0.5 = brachypterous, 1.0 = macropterous
Body pubescence 0 = glabrous, 1 = pubescent
Body length Continuous (scaled between 0-1)
Elytra width Continuous (scaled between 0-1)
Elytra length Continuous (scaled between 0-1)
Femora length Continuous (scaled between 0-1)
Femora width Continuous (scaled between 0-1)
Tibae length Continuous (scaled between 0-1)
Metatarsus length Continuous (scaled between 0-1)
Pronotum height Continuous (scaled between 0-1)
Pronotum length Continuous (scaled between 0-1)
Eye diameter Continuous (scaled between 0-1)
Antennae length Continuous (scaled between 0-1)
Body black 0 = other, 1 = black
Body pale 0 = other, 1 = pale
Legs black 0 = other, 1 = black
Legs Pale 0 = other, 1 = pale
Habitat Anthropic 0 = natural habitat only, 1 = associated with humans

Running head: Functional traits as indicators of biodiversity
61
Appendix 4:
Description of the bird nesting and feeding traits and categories. Traits were described
for each species according published sources (Bezzel 1993; Maumary et al. 2007)
nominal value that range from 0 to 1 to describe better the attribute to the species. For
each trait we calculated the community weighted mean trait (mT) and functional
diversity (FD) to assess the impact of the urbanization on bird communities (see
Methods).
Trait
group Trait Description Type
Nesting
habitats
Feeding
guild
NestBuilding Nest on / in buildings continuous
NestTree Nest on trees continuous
NestCavity Nest in natural cavities and nest-boxes continuous
NestBush Nest on bushes continuous
NestGround Nest on the ground continuous
LargeCarnivore All vertebrates continuous
Insectivore All invertebrates continuous
Granivore All vegetal diet (buds, leaves, seeds) continuous
Related Documents