Arterial input function of an optical tracer for dynamic contrast enhanced imaging can be determined from pulse oximetry oxygen saturation measurements This article has been downloaded from IOPscience. Please scroll down to see the full text article. 2012 Phys. Med. Biol. 57 8285 (http://iopscience.iop.org/0031-9155/57/24/8285) Download details: IP Address: 129.170.195.144 The article was downloaded on 06/01/2013 at 16:50 Please note that terms and conditions apply. View the table of contents for this issue, or go to the journal homepage for more Home Search Collections Journals About Contact us My IOPscience

Welcome message from author
This document is posted to help you gain knowledge. Please leave a comment to let me know what you think about it! Share it to your friends and learn new things together.
Transcript

Arterial input function of an optical tracer for dynamic contrast enhanced imaging can be
determined from pulse oximetry oxygen saturation measurements
This article has been downloaded from IOPscience. Please scroll down to see the full text article.
2012 Phys. Med. Biol. 57 8285
(http://iopscience.iop.org/0031-9155/57/24/8285)
Download details:
IP Address: 129.170.195.144
The article was downloaded on 06/01/2013 at 16:50
Please note that terms and conditions apply.
View the table of contents for this issue, or go to the journal homepage for more
Home Search Collections Journals About Contact us My IOPscience
IOP PUBLISHING PHYSICS IN MEDICINE AND BIOLOGY
Phys. Med. Biol. 57 (2012) 8285–8295 doi:10.1088/0031-9155/57/24/8285
Arterial input function of an optical tracer fordynamic contrast enhanced imaging can bedetermined from pulse oximetry oxygen saturationmeasurements
Jonathan T Elliott1,2,4, Eric A Wright2, Kenneth M Tichauer3,Mamadou Diop2, Laura B Morrison2, Brian W Pogue3, Ting-Yim Lee1,2
and Keith St. Lawrence1,2
1 Department of Medical Biophysics, Western University, London, Ontario N6A 5C1, Canada2 Imaging Division, Lawson Health Research Institute, London, Ontario N6A 4V2, Canada3 Thayer School of Engineering, Dartmouth College, Hanover, NH 03755, USA
E-mail: [email protected]
Received 23 September 2012, in final form 5 November 2012Published 29 November 2012Online at stacks.iop.org/PMB/57/8285
AbstractIn many cases, kinetic modeling requires that the arterial input function (AIF)—the time-dependent arterial concentration of a tracer—be characterized. Astraightforward method to measure the AIF of red and near-infrared opticaldyes (e.g., indocyanine green) using a pulse oximeter is presented. The methodis motivated by the ubiquity of pulse oximeters used in both preclinical andclinical applications, as well as the gap in currently available technologiesto measure AIFs in small animals. The method is based on quantifying theinterference that is observed in the derived arterial oxygen saturation (SaO2)following a bolus injection of a light-absorbing dye. In other words, the changein SaO2 can be converted into dye concentration knowing the chromophore-specific extinction coefficients, the true arterial oxygen saturation, and totalhemoglobin concentration. A simple error analysis was performed to highlightpotential limitations of the approach, and a validation of the method wasconducted in rabbits by comparing the pulse oximetry method with the AIFacquired using a pulse dye densitometer. Considering that determining the AIFis required for performing quantitative tracer kinetics, this method provides aflexible tool for measuring the arterial dye concentration that could be used ina variety of applications.
4 Author to whom any correspondence should be addressed.
0031-9155/12/248285+11$33.00 © 2012 Institute of Physics and Engineering in Medicine Printed in the UK & the USA 8285
8286 J T Elliott et al
1. Introduction
In medical imaging, tracer kinetic modeling is commonly used to characterize physiologicalprocesses (Sourbron and Buckley 2012). The methodology typically requires injecting a traceror contrast agent into the blood stream and monitoring the kinetics of the tracer as it passesthrough a tissue of interest. In most cases, extracting quantitative measurements from kineticdata requires determining the time-dependent concentration of tracer in arterial blood, referredto as the arterial input function (AIF), which describes the delivery of tracer to the tissue.Proper characterization of the AIF is an important goal in many modalities, including opticalimaging, where a wide assortment of dyes has been engineered to study various physiologicalprocesses. The most well-known is indocyanine green (ICG) that acts as an intravascular tracerdue to its binding with plasma proteins and can be used to measure tissue blood flow, bloodvolume and mean transit time (Brown et al 2002, Elliott et al 2010, Diop et al 2010, Elliottet al 2012, Springett et al 2001). Since ICG is FDA approved (United States Food and DrugAdministration 2012), it has been used in clinical settings to assess neurological function(Steinkellner et al 2010, Liebert et al 2005) and to characterize breast tumors (Schneider et al2011). The principles of tracer kinetic modeling can also be applied to targeted optical contrastagents that are conjugated with ligands to study receptor binding potential and drug deliverymechanisms (Becker et al 2001).
To properly measure the AIF of an optical dye, a device known as a pulse dye densitometer(PDD) is usually needed (Iijima et al 1997). However, these units are specialized pieces ofequipment that are not commonly found and are only optimized for determining the AIF ofICG. Furthermore, in preclinical small animal studies, no PDD is available that functions at thehigh heart rates of these animals. Because of these obstacles, more simplistic kinetic models areused that do not correct for AIF-dependent effects. For example, dynamic contrast-enhancedMRI techniques will perform kinetic analysis on tissue measurements with the assumption thatthe AIF is constant across measurements or patients, but these assumptions can be problematicand lead to errors in the recovered parameters (Parker et al 2006). The wider application ofkinetic modeling to quantify important parameters such as blood flow, vascular leakage andreceptor binding potential requires a more accessible method of measuring the AIF.
We present a method that can convert an off-the-shelf pulse oximeter into a PDD. Thisis accomplished by deriving a mathematical relationship between the arterial concentrationof dye and the negative change in apparent SaO2 measured by the pulse oximeter, whichoccurs because the increase in absorption due to the dye is interpreted as an increase indeoxyhemoglobin. While this interference has been previously observed (Sidi et al 1987), thisis the first time it has been used to actually quantify the AIF. Validation experiments wereconducted in rabbits using a small animal oximetry device (MouseOx, STARR Life Sciences,Oakmont, PA), but the approach is translatable to the clinic, capitalizing on the ubiquity ofpulse oximeters.
2. Theory
Pulse oximeters record oscillations in light attenuation (�A1 and �A2) at two wavelengths(λ1 and λ2) that results from oscillations in arterial blood vessel diameter, �D, in responseto the beating heart (Aoyagi 2003). Oxyhemoglobin and deoxyhemoglobin are the dominantlight-absorbing molecules in the blood for the wavelengths selected by pulse oximeters. Inthis case, the changes in attenuation can be approximated using the Beer–Lambert law
�A1 = (εa,1 · Ca + εb,1 · Cb) · �D (1a)
Arterial input function from a pulse oximeter 8287
�A2 = (εa,2 · Ca + εb,2 · Cb) · �D, (1b)
where Ca and Cb are the concentrations of oxyhemoglobin and deoxyhemoglobin, respectively,and εa,j and εb,j are their corresponding extinction coefficients defined for j = (λ1, λ2). In pulseoximetry, equations (1a) and (1b) are rearranged to determine SaO2 as follows:
�A1 = (εa,1 · SaO2 · tHb + εb,1 · (1 − SaO2) · tHb) · �D (2a)
�A2 = (εa,2 · SaO2 · tHb + εb,2 · (1 − SaO2) · tHb) · �D, (2b)
where SaO2 is the oxygen saturation ratio, defined as CHbO2/tHb, and tHb, the total hemoglobinconcentration, equals Ca + Cb. In practice, scattering and partial volume errors arising from theexpansion of non-blood media create systematic errors in the measured signal. To overcomemany of the subject-dependent errors, the channel-dependent information is converted to aratio:
� = �A1
�A2= εa,1 · SaO2 + εb,1 · (1 − SaO2)
εa,2 · SaO2 + εb,2 · (1 − SaO2). (3)
Small errors that still remain in this expression are generally calibrated by adjusting theintensity and gains of the electronics until the actual SaO2 measured by hemoximetry matchesthe SaO2 recovered by solving equation (3). Alternatively, a calibration curve can be used togenerate a linear approximation:
� = Ms · SaO2 + bs, (4)
where Ms and bs are the calibration factors determined by the manufacture, typically obtainedfrom healthy subjects (Mendelson 1992), to convert the measured change in light absorptionSaO2.
The addition of another chromophore (such as an intravenously injected optical dye) willnot appreciably alter the calibration process described above if it does not cause an appreciablechange in the scattering properties of the tissue and does not substantially accumulate in thenon-blood media within the region of interrogation. The relationship between the apparentSaO2 (aSaO2) reported by the pulse oximeter and the concentration of injected dye can begiven by
εa,1 · aSaO2 + εb,1 · (1 − aSaO2)
εa,2 · aSaO2 + εb,2 · (1 − aSaO2)= ε∗
a,1 · SaO2 + ε∗b,1 · (1 − SaO2) + ε∗
i,1 · CitHb
ε∗a,2 · SaO2 + ε∗
b,2 · (1 − SaO2) + ε∗i,2 · Ci
tHb
(5)
where Ci represents the concentration of the additional chromophore and εi,j represents theextinction coefficient of the ith chromophore at the jth wavelength that is normally used by thesystem. Extinction coefficients, εi,j
∗, represent the extinction coefficient of the ith chromophore
at the jth wavelength that is actually used to acquire the measurement. If the native probesare used to acquire the signal, then εi,j
∗is equal to εi,j. However, if a customized probe is
used to modify the emission wavelength of the probe, εi,j∗
must be adjusted for the differencein absorption at the new wavelength. This additional parameter allows the use of a differentwavelength of light in order to increase the sensitivity of the system to the desired opticaldye, as was done in the validation experiments. The variable aSaO2 represents the apparentSaO2 that is reported by the instrument, whereas the variable SaO2 represents the actual SaO2.The latter can be measured before the injection and assumed to be constant during the periodthat the AIF is measured. Finally, the total hemoglobin concentration, tHb, is determined froma venous blood sample. To obtain Ci, equation (5) is solved using the fminsearch function inMATLAB (The MathWorks, Natick, MA).
In tracer kinetic modeling, the time-dependent concentration of contrast agent in tissue,Ct(t), is related to the AIF by
Ct (t) = F · R(t) ∗ Ci(t) (6)

8288 J T Elliott et al
Table 1. Input parameters for the AATH forward model equations (7a) and (7b) used in thevalidation experiment.
Parameter Units Input value
Blood flow, F mL/min/100 g 15.0Capillary transit time, Tc s 6.5EVS distribution volume, Ve mL/100 g 75.0Permeability-surface area product, PS mL/min/100 g 10.4
where F is the blood flow, R(t) is the impulse residue function provided by the kinetic model,and the symbol ∗ refers to the convolution operator (Meier and Zierler 1954). The specificdefinition of R(t) will change depending on the behavior of the contrast agent in the tissueregion of interest. For the purpose of this validation paper, the adiabatic approximation to thetissue homogeneity model (AATH), which characterizes blood flow and tracer leakage intothe surrounding tissue, was used to simulate tissue concentration curves (St. Lawrence andLee 1998). The impulse residue function, R(t), derived from the AATH model is given by:
R(t) = 1 0 � t < Tc (7a)
R(t) = Ee− EFVe (t−Tc) t � Tc (7b)
where F is blood flow, Tc is capillary transit time, and Ve is the distribution volume of thetracer in the extravascular space. The extraction fraction, E = 1 − e−PS/F , where PS is thepermeability surface-area product of the tracer. The tracer kinetic portion of the error analysisin the next section was conducted for an untargeted tracer using the input summarized intable 1.
3. Materials and methods
3.1. Validation of AIFs measured by pulse oximetry
An error analysis based on simulated data was conducted to better understand the effect ofcertain variables on the ability to recover the AIF accurately. First, the measurement resolutionof the recovered dye concentration was characterized since it depends on the resolution of thepulse oximeter SaO2 channel, the absorption properties of the dye, and the total hemoglobinconcentration (tHb). For this analysis, tHb was fixed at 12 g dL−1, the true SaO2 was set to 95%,and the apparent SaO2 was decreased from 95% to 75% in steps of 0.1%, which is the resolutionof the SaO2 data stored by the MouseOx system. The concentration of dye at each SaO2 levelwas recovered from equation (5) using the extinction coefficients of ICG. This was repeatedfor different ’red channel’ wavelengths from 600 to 900 nm to determine the relationshipbetween the selected wavelength and the resolution of the measured dye concentration. Next,the effect of total hemoglobin concentration on the measurement resolution of the recovereddye concentration was investigated. The ‘red channel’ wavelength was fixed at 760 nm, thetrue SaO2 was set to 95%, and the apparent SaO2 was decreased from 95% to 75% in stepsof 0.1%. The concentration of dye at each SaO2 level was recovered, and this process wasrepeated for tHb values from 5 to 25 g dL–1.
In the second part of the experiment, the relationship between the PDD measured dyeconcentration and the dye curves extracted with the pulse oximeter method were investigatedin a rabbit model (see Animal experiments). Regression plots were generated for each set ofICG curves, and a meta-analysis was performed to determine the mean and 95% confidenceinterval of the individual regression slopes. Theoretical tissue curves were generated by the

Arterial input function from a pulse oximeter 8289
Figure 1. The measurement resolution of the dye concentration extracted from the pulse oximeterSaO2 channel plotted on a log scale (black line), and the corresponding ICG absorption spectrumin plasma (gray line) plotted on an arbitrary linear scale.
AATH model using the measured AIF from the pulse oximeter and from the PDD to furtherunderstand how differences between the two AIFs would affect the accuracy of the derivedmodel parameters. The ‘true’ Ct(t) was generated using the PDD-measured AIF and the valuesof the model parameters given in table 1. The AIF derived from pulse oximetry was then usedto recover best-fit estimates of the model parameters from the theoretical Ct(t) curve by thefminsearch minimization function. The per cent difference between the recovered and inputF, PS and Tc values were determined.
3.2. Instrumentation
For the validation experiments, a small animal pulse oximeter (MouseOx, STARR LifeSciences, Oakmont, PA) was used. This unit is sensitive to fast heart rates, making it suitablefor mouse and rat experiments, in addition to animals with slower heart rates such as rabbits.Custom-made probes with a ’red channel’ wavelength of 753 nm were used to improve thesensitivity of the pulse oximeter to ICG (see figure 1). The extinction coefficients for theleft side of equation (5) were provided by the engineering team at STARR Life Sciences,whereas the modified extinction coefficients for the right side of equation (5) were determinedin two steps: first, the light source spectrum was characterized with an off-the-shelf broadbandspectrometer (QEE65000, Ocean Optics, Dunedin, FL). Second, this reference spectrum wasused as a probability density function to sample from the extinction spectra of the threechromophores, which have been previously measured (Landsman et al 1976). Finally, a pulse-dye densitometer (DDM2000, Nihon Koden, Japan) capable of measuring the AIF in rabbits,which have a normal heart rate range of 190–310 bpm (Murphy et al 2011), was used tovalidate the AIF obtained from pulse oximetry. This instrument has been previously validatedby comparison to serial blood sampling (Iijima et al 1998).
3.3. Animal experiments
All animal experiments were approved by the animal use committee at Western University.Measurements using the pulse oximeter and PDD were acquired in four New Zealand whiterabbits, approximately 6 months old (weight = 2.8 ± 0.3 kg). Animals were induced and

8290 J T Elliott et al
maintained with isofluorane gas anesthesia at 4% and 2.5% concentration, respectively. Amixture of 2:1 oxygen and medical air was maintained for the duration of the experiment, andblood gases, glucose, and rectal temperature were monitored frequently. The pulse oximeterand PDD probes were placed on separate hind limbs, and adequate signal strength was verifiedin both instruments before proceeding with tracer injection. Animals were allowed to rest for30 min to stabilize before the experiment was started.
For each animal experiment, a solution of ICG (Cardiogreen, Sigma-Aldrich, St. Louis,MO; 0.3 mg–1 kg–1 mL–1 dissolved in 0.5 mL of sterile water) was prepared. A total oftwo bolus injections were administered by intravenously with approximately 40 min betweeninjections to allow the ICG to clear the system. Boli were rapidly injected, resulting in afirst-pass full width half maximum of approximately 5 s. During each injection, data wereacquired by the pulse oximeter and PDD simultaneously, and downloaded to a laptop forsubsequent analysis. The sampling rate of the pulse oximeter was 15 Hz; the PPD records eachmeasurement at systole (equivalent to approximately 5 Hz in these animals) to a maximumof approximately 6 Hz. Heart rate, arterial oxygen saturation, and total hemoglobin werealso measured and recorded, with the latter being measured by hemoximetry (ABL 80 FLEXCO-OX, Radiometer, Copenhagen, Denmark).
4. Results and discussion
4.1. Error analysis
Measurement resolution is defined as the minimum change in dye concentration that producesa detectable instrument response. The recorded SaO2 channel used to calculate the dyeconcentration has a measurement resolution of 0.1%. Additionally, the degree to which achange in causes a response in the SaO2 channel depends on the absorption properties ofthat dye. These two factors ultimately determine the AIF measurement resolution. For erroranalysis, simulations were performed by varying the ‘red channel’ of the dye from 600 to900 nm (step size: 5 nm), while fixing SaO2 at 95% and tHb at 12 g dL−1. Figure 1 depictsthe measurement resolution as a function of the wavelength of the ‘red’ channel, which is thenumerator in equation (5), when ICG is used as the optical dye. The absorption spectrum ofICG is shown for comparison. Note that the resolution function is not a perfect mirror of theICG spectrum due to the additional influence of the other chromophores.
As expected, the highest measurement resolution is achieved when a ‘red channel’wavelength is used that corresponds to the absorption peak of the dye (802 nm for ICGin plasma). If a light source is used that corresponds to the absorption peak of ICG, then apulse oximeter that has a measurement resolution of 0.1% is capable of resolving 0.01 mMchanges in dye concentration. A standard pulse oximeter, which employs a light source ofaround 650 nm would be able to resolve submillimolar (∼0.5 mM) concentrations.
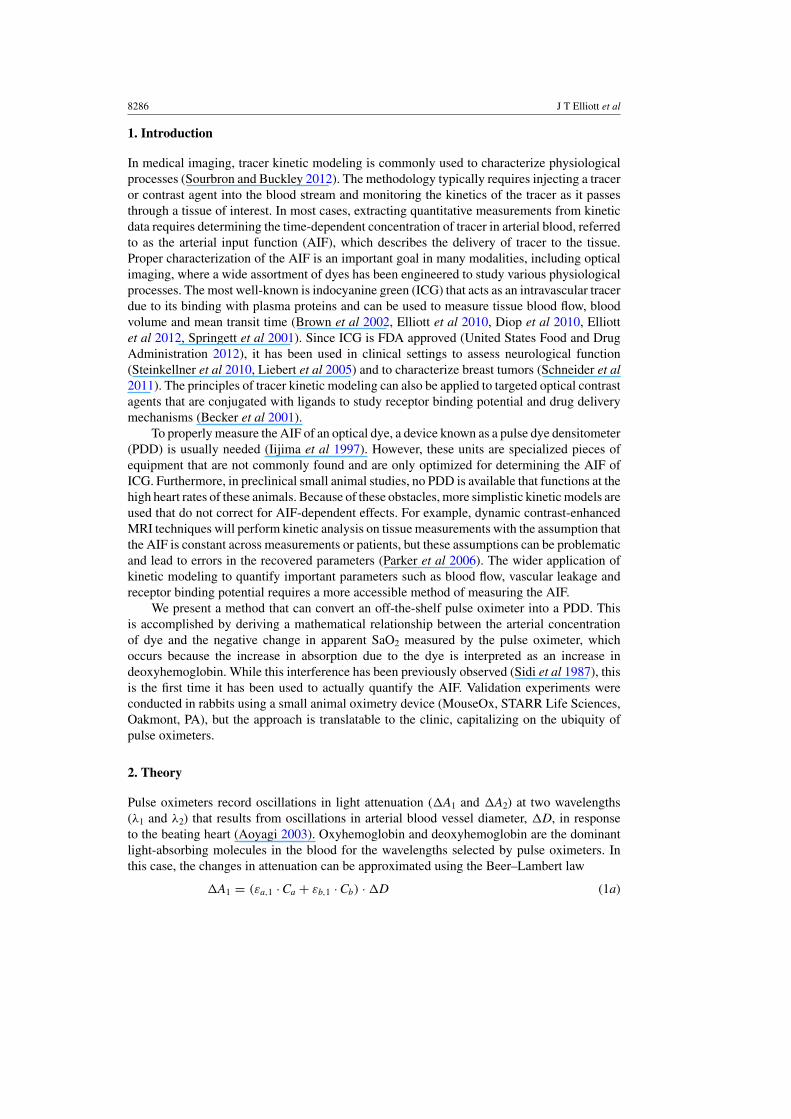
The amount of endogenous light absorption depends on the total hemoglobinconcentration, tHb. Therefore, the relative effect of the dye on the overall signal changewill depend on this parameter, which ultimately will affect the measurement resolution. Anerror analysis was performed by varying tHb from 5 to 25 g dL−1 (step size: 0.25 g dL−1). A‘red channel’ wavelength of 760 nm was used, and SaO2 was set to 95%.
Figure 2 summarizes the relationship between tHb and dye measurement resolution, andnormal hemoglobin ranges are highlighted for several patient groups by a forest plot. The erroranalysis suggests two distinct resolution levels within the range of normal human hemoglobinconcentration, which may reduce the performance of the technique in a certain subjects suchas healthy adult men, by a factor of approximately 5. It is important to note that the abrupt
Arterial input function from a pulse oximeter 8291
Figure 2. The measurement resolution of the dye concentration extracted from the pulse oximeterSaO2 channel plotted on a log scale (black line) versus the total hemoglobin (tHB). A forest plotof tHb reference ranges are shown to provide context (London Laboratory Services Group 2012,Abbassi-Ghanavati et al 2009). ∗Values obtained from animals used in this experiment.
0 10 20 30 40 50 60-5
0
5
10
15
20
time (s)
dye
con
cent
ratio
n (m
M)
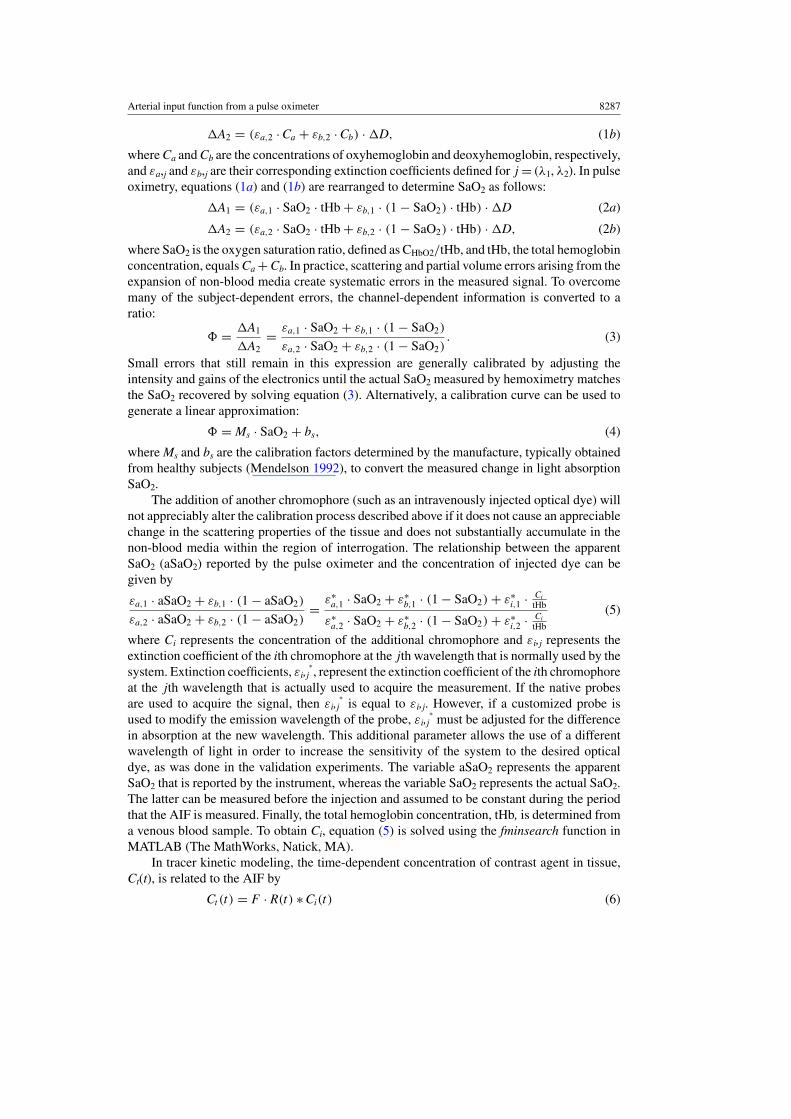
Figure 3. The AIF recorded by the dye densitometer (black line) and the AIF recovered with apulse oximeter (gray line) using the method presented in this paper.
changes in measurement resolution are not artificial, but represent an amplification of therounding error resulting from the SaO2 channel measurement resolution of 0.1%.
4.2. Validation experiment
A representative example of the AIF acquired with the PDD plotted alongside the AIFcalculated from pulse oximetry is depicted in figure 3. In this case, the slope and y-interceptof the regression between the two curves was 0.915 and 0.1 mM, respectively. There wasa −3.3% difference in the peak concentration, and a −10.2% and 5.5% per cent difference inF and PS when the pulse oximeter AIF was used to extract the kinetic parameters from Ct(t)generated from the PDD-measured AIF.
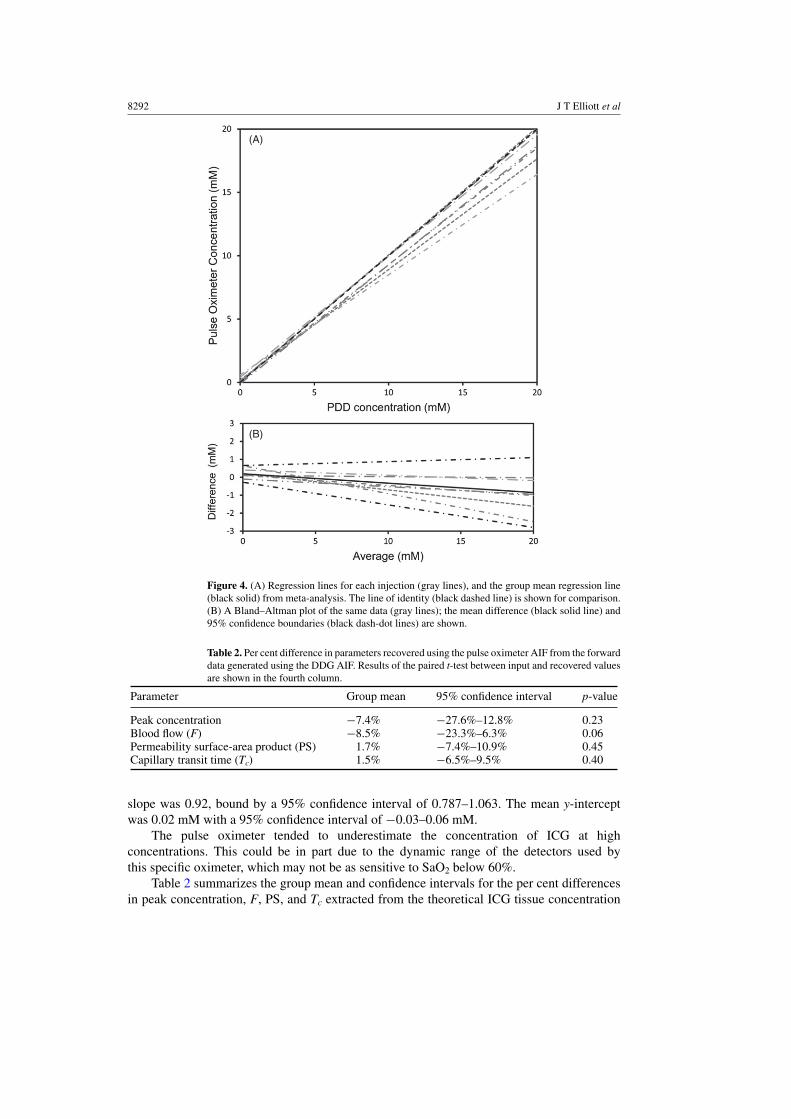
This analysis was performed for all measurements across the four rabbits used in thestudy, and group means were determined as well as the 95% confidence intervals for eachparameter. Figure 4(A) summarizes the regression results for the group analysis. The mean
8292 J T Elliott et al
(A)
(B)
Figure 4. (A) Regression lines for each injection (gray lines), and the group mean regression line(black solid) from meta-analysis. The line of identity (black dashed line) is shown for comparison.(B) A Bland–Altman plot of the same data (gray lines); the mean difference (black solid line) and95% confidence boundaries (black dash-dot lines) are shown.
Table 2. Per cent difference in parameters recovered using the pulse oximeter AIF from the forwarddata generated using the DDG AIF. Results of the paired t-test between input and recovered valuesare shown in the fourth column.
Parameter Group mean 95% confidence interval p-value
Peak concentration −7.4% −27.6%–12.8% 0.23Blood flow (F) −8.5% −23.3%–6.3% 0.06Permeability surface-area product (PS) 1.7% −7.4%–10.9% 0.45Capillary transit time (Tc) 1.5% −6.5%–9.5% 0.40
slope was 0.92, bound by a 95% confidence interval of 0.787–1.063. The mean y-interceptwas 0.02 mM with a 95% confidence interval of −0.03–0.06 mM.
The pulse oximeter tended to underestimate the concentration of ICG at highconcentrations. This could be in part due to the dynamic range of the detectors used bythis specific oximeter, which may not be as sensitive to SaO2 below 60%.
Table 2 summarizes the group mean and confidence intervals for the per cent differencesin peak concentration, F, PS, and Tc extracted from the theoretical ICG tissue concentration

Arterial input function from a pulse oximeter 8293
data using the AIF from the pulse oximeter AIF rather than the true AIF from PDD. In addition,the p-values from a paired t-test comparisons of values obtained using the two AIFs are shown.While there was no significant difference in the parameters obtained with the two AIFs, bloodflow measurements were most affected by the underestimation in high ICG concentrationspreviously mentioned.
The results of this study suggest that the commonly used pulse oximeter can be readilyconverted to a PDD fairly easily, providing an accessible means of acquiring an AIF foruse in tracer kinetic studies. Advancements in dynamic contrast-enhanced optical techniqueshave resulted in the ability to assess cerebral hemodynamics in neonates (Arora et al 2012),stroke patients (Steinkellner et al 2010) and traumatic brain injury patients (Keller et al2001), and to localize and assess tumors in breast cancer patients (Schneider et al 2011). Inaddition, dynamic contrast-enhanced techniques have been described for a wide of range ofapplications including diagnosis of peripheral artery disease (Kang et al 2010) and monitoringmuscle oxygenation (Boushel and Piantadosi 2000), and have been theoretically describedfor pre-clinical imaging methods such as fluorescence molecular tomography (Elliott et al2012). In all cases, the ability to measure the AIF would enable the use of more sophisticatedand more accurate kinetic models that would account for the between-subjects variability inAIFs (Schneider et al 2011). For example, recent work by Schneider et al demonstrated theability of NIRx to detect breast cancer in a group of patients undergoing biopsy (Schneideret al 2011). In this study, relative metrics such as time-to-peak and relative peak concentrationwere used to discriminate between benign and malignant tissues. The acquisition of the AIFwould allow blood flow and vascular leakage of the regions of interest to be characterized,possibly providing additional sensitivity and specificity, and would also reduce intra-subjectvariability since measuring the AIF implicitly accounts for differences in blood circulation.Despite the benefit of characterizing the AIF, only a limited number of groups regularlyemploy a PDD because they are expensive and few units have been approved for patient use.The methodology described in this note enables clinicians and researchers to instead capitalizeon pulse oximeters, which exist in virtually every advanced trauma center or intensive careunit around the world, and can be combined with current dynamic contrast-enhanced opticaltechniques at little additional cost.
In small animal imaging, an additional challenge to measuring the AIF is that no PDDdevice has been developed that is compatible with the high heart rates of rodents. There are,however, several pulse oximeter devices, including the MouseOx device used in this study,which are suitable for heart rates up to 900 bpm and can therefore be used to measure theAIF. Doing so would enable more sophisticated tracer kinetic models that could determinekey parameters in the study of cancer development and treatment. For example, plasma inputtwo-tissue compartment models (Mintun et al 1984) could be used to quantify molecularlytargeted optical probe binding.
While the method described in this paper will be useful for a variety of applications,there are several limitations that will ultimately determine whether the use of a PDD ismore appropriate. First, the accuracy of the recovered dye concentration will be affectedby any errors in the extinction coefficients in equation (5), as well as the accuracy of themeasured tHb concentration. The former can be minimized if the peak wavelength of thetwo channels can be obtained either from the manufacturer of the device, or by spectrometricmeasurement by the user. Careful consideration of equation (5) reveals that an error in tHbconcentration will result in an equal error in recovered dye concentration. This could beimportant, for example, in the critical care setting, where trauma patients presenting lowerinitial hemoglobin concentration may receive a packed red blood cell (PRBC) transfusion toimprove the oxygen carrying capacity of the blood. In this case, a PRBC-corrected value of
8294 J T Elliott et al
tHb may be helpful, where tHb is incremented by 1 g for every one unit of infused PRBC(Christy et al 2011). More significantly, the limited measurement resolution of this approachin certain circumstances may hinder its applications. As demonstrated in the error analysis,measurement resolution issues are addressed by using higher dye concentrations, constructingcustom probes that use a ‘red channel’ wavelength at the peak absorption of the dye-of-interest,and being aware of the potential tHb-related pitfall. In some cases, however, the measurementresolution may still be limited. For example, when performing a tracer kinetic binding study,only a limited concentration of dye can be injected to avoid receptor saturation. However,given that demand often drives technological advances, the adoption of this technique as ameans of measuring the AIF may result in the development of pulse oximeters capable of0.01% or better SaO2 measurement resolution.
5. Conclusion
The results of this study demonstrate that with a basic understanding of pulse oximetry, it ispossible to convert an off-the-shelf pulse oximeter into a dye densitometer that can be usedto approximate the arterial input function in dynamic contrast-enhanced studies. This findinghas immediate applications in both clinical and preclinical contexts.
Acknowledgments
We gratefully acknowledge the assistance received from Starr Life Sciences Corp., whichprovided the extinction coefficients used by the MouseOx instrument. We would also like tothank Lise Desjardins and Jennifer Hadway for assistance with the animal experiments. Thisproject has been funded by the Canadian Health Research Institutes and the Heart and StrokeFoundation of Canada. KMT is supported by a CIHR postdoctoral fellowship grant.
References
Abbassi-Ghanavati M, Greer L G and Cunningham F G 2009 Pregnancy and laboratory studies: a reference table forclinicians Obstet. Gynecol. 114 1326–31
Aoyagi T 2003 Pulse oximetry: its invention, theory, and future J. Anesthesiol. 17 259–66Arora R, Ridha M, Elliott J T, Diop M, Rosenberg H, Lee D, Lee T Y and St Lawrence K 2012 NIRS study to
assess the effects of Indomethacin on cerebral blood flow and metabolic rate of oxygen in preterm infantsPediatr. Res. (submitted)
Becker A, Hessenius C, Licha K, Ebert B, Sukowski U, Semmler W, Wiedenmann B and Grotzinger C 2001 Receptor-targeted optical imaging of tumors with near-infrared fluorescent ligands Nature Biotechnol. 19 327–31
Boushel R and Piantadosi C A 2000 Near-infrared spectroscopy for monitoring muscle oxygenation Acta Physiol.Scand. 168 615–22
Brown D W, Picot P A, Naeini J G, Springett R, Delpy D T and Lee T Y 2002 Quantitative near infrared spectroscopymeasurement of cerebral hemodynamics in newborn piglets Pediatr. Res. 51 564–70
Christy J M et al 2011 The impact of antiplatelet therapy on pelvic fracture outcomes J. Emerg. Trauma. Shock 4 64–9Diop M, Tichauer K M, Elliott J T, Migueis M, Lee T Y and St. Lawrence K 2010 Comparison of time-
resolved and continuous-wave near-infrared techniques for measuring cerebral blood flow in piglets J. Biomed.Opt. 15 057004
Elliott J T, Diop M, Lee T Y and Lawrence K S 2012 Model-independent dynamic constraint to improve the opticalreconstruction of regional kinetic parameters Opt. Lett. 37 2571–3
Elliott J T, Diop M, Tichauer K M, Lee T Y and St. Lawrence K 2010 Quantitative measurement of cerebral bloodflow in a juvenile porcine model by depth-resolved near-infrared spectroscopy J. Biomed. Opt. 15 037014
Iijima T, Aoyagi T, Iwao Y, Masuda J, Fuse M, Kobayashi N and Sankawa H 1997 Cardiac output and circulatingblood volume analysis by pulse dye-densitometry J. Clin. Monit. 13 81–9

Arterial input function from a pulse oximeter 8295
Iijima T, Iwao Y and Sankawa H 1998 Circulating blood volume measured by pulse dye-densitometry: comparisonwith (131)I-HSA analysis Anesthesiology 89 1329–35
Kang Y, Lee J, Kwon K and Choi C 2010 Dynamic fluorescence imaging of indocyanine green for reliable andsensitive diagnosis of peripheral vascular insufficiency Microvasc. Res. 80 552–5
Keller E, Wolf M, Martin M and Yonekawa Y 2001 Estimation of cerebral oxygenation and hemodynamics in cerebralvasospasm using indocyaningreen dye dilution and near infrared spectroscopy: a case report J. Neurosurg.Anesthesiol. 13 43–8
Landsman M L, Kwant G, Mook G A and Zijlstra W G 1976 Light-absorbing properties, stability, and spectralstabilization of indocyanine green J. Appl. Physiol. 40 575–83
Liebert A, Wabnitz H, Steinbrink J, Moller M, Macdonald R, Rinneberg H, Villringer A and Obrig H 2005 Bed-sideassessment of cerebral perfusion in stroke patients based on optical monitoring of a dye bolus by time-resolveddiffuse reflectance Neuroimage 24 426–35
London Laboratory Services Group 2012 Laboratory test information guide: complete blood count ed L Gopaul(London, ON: LHSC) http://www.lhsc.on.ca/lab/handbook.htm
Meier P and Zierler K L 1954 On the theory of the indicator-dilution method for measurement of blood flow andvolume J. Appl. Physiol. 6 731–44
Mendelson Y 1992 Pulse oximetry: theory and applications for noninvasive monitoring Clin. Chem. 38 1601–7Mintun M A, Raichle M E, Kilbourn M R, Wooten G F and Welch M J 1984 A quantitative model for the in vivo
assessment of drug binding sites with positron emission tomography Ann. Neurol. 15 217–27Murphy M J, Tichauer K M, Sun L, Chen X and Lee T Y 2011 Mean transit time as an index of cerebral perfusion
pressure in experimental systemic hypotension Physiol. Meas. 32 395–405Parker G J, Roberts C, Macdonald A, Buonaccorsi G A, Cheung S, Buckley D L, Jackson A, Watson Y, Davies K
and Jayson G C 2006 Experimentally-derived functional form for a population-averaged high-temporal-resolution arterial input function for dynamic contrast-enhanced MRI Magn. Reson. Med. 56 993–1000
Schneider P, Piper S, Schmitz C H, Schreiter N F, Volkwein N, Ludemann L, Malzahn U and Poellinger A 2011 Fast3D near-infrared breast imaging using indocyanine green for detection and characterization of breast lesionsFortschr. Rontgenstr. 183 956–63
Sidi A, Paulus D A, Rush W, Gravenstein N and Davis R F 1987 Methylene blue and indocyanine green artifactuallylower pulse oximetry readings of oxygen saturation. Studies in dogs J. Clin. Monit. 3 249–56
Sourbron S P and Buckley D L 2012 Tracer kinetic modelling in MRI: estimating perfusion and capillary permeabilityPhys. Med. Biol. 57 R1–33
Springett R, Sakata Y and Delpy D T 2001 Precise measurement of cerebral blood flow in newborn piglets from thebolus passage of indocyanine green Phys. Med. Biol. 46 2209–25
Steinkellner O, Gruber C, Wabnitz H, Jelzow A, Steinbrink J, Fiebach J B, Macdonald R and Obrig H 2010 Opticalbedside monitoring of cerebral perfusion: technological and methodological advances applied in a study onacute ischemic stroke J. Biomed. Opt. 15 061708
St. Lawrence K S and Lee T Y 1998 An adiabatic approximation to the tissue homogeneity model for water exchangein the brain: I. Theoretical derivation J. Cereb. Blood Flow Metab. 18 1365–77
United States Food and Drug Administration 2012 Approved Drug Products with Therapeutic Equivalence Evaluations(Washington DC: Government Printing Office)
Related Documents


![Oximetry Refers to determination of percentage of oxygen saturation of the circulating arterial blood. Oxygen saturation= [ HbO 2 ] [HbO 2 ] +[Hb] [ HbO.](https://static.cupdf.com/doc/110x72/56649e9d5503460f94b9dc9f/oximetry-refers-to-determination-of-percentage-of-oxygen-saturation-of-the.jpg)