Supporting Information Arsenate recognition in aqueous media by a simple tripodal urea Ranjan Dutta, Purnandhu Bose and Pradyut Ghosh* Indian Association for the Cultivation of Science, 2A&2B Raja S. C. Mullick Road, Kolkata 700 032, 5 India. Fax: (+91) 33-2473-2805 E-mail: [email protected] 10 15 20 25 Electronic Supplementary Material (ESI) for Dalton Transactions This journal is © The Royal Society of Chemistry 2013

Welcome message from author
This document is posted to help you gain knowledge. Please leave a comment to let me know what you think about it! Share it to your friends and learn new things together.
Transcript

Supporting Information
Arsenate recognition in aqueous media by a simple
tripodal urea
Ranjan Dutta, Purnandhu Bose and Pradyut Ghosh*
Indian Association for the Cultivation of Science, 2A&2B Raja S. C. Mullick Road, Kolkata 700 032, 5
India. Fax: (+91) 33-2473-2805
E-mail: [email protected]
10
15
20
25
Electronic Supplementary Material (ESI) for Dalton TransactionsThis journal is © The Royal Society of Chemistry 2013

Table of Contents
Materials and Methods
Synthesis of complex 1
Fig. 1S.1H- NMR spectrum of complex 1 5
Fig. 2S.13C-NMR spectrum of complex1
Fig. 3S.1H-NMR titration spectra of L with aliquots of HAsO42-in DMSO-d6/D2O
Fig. 4S. Plot of chemical shift of CHc proton of Lvs equiv. of HAsO42-
Fig. 5S. Job’s plot of L with HAsO42-
Fig. 6S. 1H-NMR spectra of L with aliquots of SO42-inDMSO-d6/D2O 10
Fig. 7S. Plot of chemical shift of CHc proton of Lvs equiv. of SO42-
Fig. 8S. Job’s plot of L withSO42-
Fig. 9S. 1H-NMR spectra of L with aliquots of HPO42-inDMSO-d6/D2O
Fig. 10S. Plot of chemical shift of CHc proton of Lvs equiv. of HPO42-
Fig. 11S. Job’s plot of L with HPO42- 15
Fig. 12S. 1H-NMR spectra of L with aliquots of CO3-in DMSO-d6/D2O
Fig. 13S. Plot of chemical shift of CHc protons of L vs equiv. of CO32-
Fig. 14S. Job’s plot of L with CO32-
Fig. 15S. Qualitative 1H-NMR spectra of L with F-, Cl-, Br- and AcO-
Fig. 16S. Plot of chemical shift of NHa/b protons of L in control titration experiment 20
Fig. 17S. 1H-NMR titration spectra of L with aliquots of HAsO42-in buffer.
Fig. 18S. Plot of chemical shift of CHc proton of L vs equiv. of HAsO42- in buffer
Fig. 19S. Job’s plot of L with HAsO42- in buffer
Fig. 20S. 1H-NMR spectra of L with aliquots of SO42-in DMSO-d6/D2O in buffer
Fig. 21S. Plot of chemical shift of CHc proton of Lvs equiv. of SO42- in buffer 25
Fig. 22S. Job’s plot of L with SO42- in buffer
Fig. 23S. 1H-NMR spectra of L with aliquots of HPO42-in DMSO-d6/D2O in buffer
Fig. 24S. Plot of chemical shift of CHc proton of L vs equiv. of HPO42- in buffer
Fig. 25S. Job’s plot of L with HPO42- in buffer
Fig. 26S. Plot of chemical shift of CHc/d protons of L in control titration experiment in buffer 30
Fig. 27S. Comparative FTIR analyses of L and complex 1
Table 1S. Crystallographic table of complex 1
Electronic Supplementary Material (ESI) for Dalton TransactionsThis journal is © The Royal Society of Chemistry 2013
Fig. 28S. Spacefill model and capsular dimension of crystal structure of complex 1
Fig. 29S. Scatter plot for complex 1
Table 2S. Hydrogen bonding parameters for complex 1
Fig. 30S. TGA analysis of complex 1
Fig. 31S. PXRD pattern of complex 1 5
Fig. 32S. TEM-EDX profile of complex 1
References
10
MATERIALS AND METHODS
Materials: Tris-(2-aminoethyl)-amine (TREN), pentafluorophenyl isocyanate, tetrabutylammonium
iodide were purchased from Sigma-Aldrich and were used as received. Dichloromethane (DCM) was
freshly distilled with Calcium hydride. Sodium hydrogenarsenate (Na2HAsO4), sodium sulfate
(Na2SO4) and sodium dihydrogenphosphate (NaH2PO4) were purchased from Merck, India and were 15
used as received. All solvents were procured from Merck.
Methods: FTIR was recorded on SHIMADZU FTIR-8400S infrared spectrophotometer with KBr
pellets. 1H-NMR and 13C-NMR spectra were obtained on a 500/300 MHz and 125/75 MHz
BrukerDPX-500 MHz NMR and BrukerAvance300 Spectrometer. Transmission Electron Microscope-
Energy Dispersive X-ray (TEM-EDX) analyses were carried out on a JEOL JEM-2010 electron 20
microscope operated at an accelerating voltage of 100 kV. pH measurements are performed in
Metrohm glass electrode. 1H-NMR titration studies: All 1H-NMR titration experiments for L with different anions were
conducted on a Bruker300 MHz at 298 K respectively. Stock solution of host was prepared in DMSO-
d6:D2O (9:1, v/v) solvent mixture. Sodium salts of arsenate (HAsO42-), sulfate (SO4
2-), 25
dihydrogenphosphate (H2PO4-) and carbonate (CO3
2-) were used to prepared the stock solution of
anion in DMSO-d6: D2O (1:1.1) solvent system. To evaluate the association constants and
stoichiometry of binding in cases of these four anions with L, 1H-NMR titrations were performed at
298 K. Aliquots of anions were added from a standard stock solution of anion to the solution of L. The
association constants, K, were calculated by fitting the change in the CHc chemical shift with a 1:1 30
association model with non-linear least square analysis. Job’s plot revealed a best fit for 1:1 host to
Electronic Supplementary Material (ESI) for Dalton TransactionsThis journal is © The Royal Society of Chemistry 2013

guest binding mode.The equation ∆δ = {([A]0+[L]0+1/K)±(([A]0+[L]0+1/K)2–
4[L]0[A]0)1/2}∆δmax/2[L]0 was used for calculating association constants.
pH measurement experiment:
GC grade dimethyl sulfoxide (DMSO) and double distilled water is used for all the pH measurement
experiment. Stock solution of anion i.e. arsenate and phosphate are buffered by mixing borax (10 5
mM)/boric acid (200 mM) in DMSO-H2O (1:1.1, v/v) solvent mixture. Solution of L is buffered by
mixing borax (2 mM)/boric acid (200mM) in DMSO-H2O (9:1, v/v) solvent mixture. Na2HAsO4 and
NaH2PO4 salts are used to prepare the stock solution of respective anion. Further the concentration of
anion is maintained as that the scale of 1H NMR titration experiment scale i.e 30 mM for anion and ~ 3
mM for L. The pH of buffered stock solution for arsenate and phosphate are measured as 9.5 and 8.5 10
respectively. All the pH experiments are performed thrice.
X-ray Crystallography: Crystals suitable for single crystal X-ray diffraction studies were selected from
the mother liquor and immersed in paratone oil and then mounted on the tip of a glass fibre and
cemented using epoxy resin. Intensity data for the crystals of complex 1was collected using MoKα (λ
= 0.7107 Å) radiation on a Bruker SMART APEX II diffractometer equipped with CCD area detector 15
at 100 K. The data integration and reduction were processed with SAINT2 software provided with the
software package of SAMRT APEX II. An empirical absorption correction was applied to the
collected reflections with SADABS3. The structures were solved by direct methods using SHELXTL4
and were refined on F2 by the full-matrix least-squares technique using the SHELXL-975 program
package. Graphics were generated using PLATON6and MERCURY 2.4.7The non-hydrogen atoms 20
were refined anisotropically till the convergence. In the case of complex 1, all the hydrogen atoms
were located from the difference Fourier map and refined isotropically. One tetrabutylammonium
cation and one dimethyl sulfoxide solvent molecules in complex 1 are disordered. Disordered S1
atoms of the dimethyl sulfoxide over three positions are treated by FVAR command. C72, C73, C74,
C79, C81, C84, C85, C86, C87 and C88 are isotropically refined. CCDC-910790 (complex 1) contains 25
the supplementary crystallographic data for this paper. These data can be obtained free of charge from
The Cambridge Crystallographic Data Centre via www.ccdc.cam.ac.uk/data_request/cif.
30
Electronic Supplementary Material (ESI) for Dalton TransactionsThis journal is © The Royal Society of Chemistry 2013

SYNTHESIS
Synthesis of Complex 1:60 mg (0.08 mmol) of L was dissolved in DMSO/H2O (20:1 v/v) and then 58
mg (2 equiv.) of n-Bu4N+I-and excess Na2HAsO4was added to the above solution. Then the mixture
was stirred at room temperature for 10 minutes and then heated to 60ºC. The mixture was then filtered
allowed to evaporate for crystallization. After 3-4 days, colorless diamond like crystals of complex 5
[L2(HAsO42-)·(n-Bu4N
+)2.(DMSO)2] (1) suitable for single crystal X-ray diffraction analysis were
obtained in 80% yield. 1H NMR (500 MHz, DMSO-d6):δ 0.927 (t, 12H,NCH2CH2CH2CH3,J= 7.25
Hz), 1.294-1.322 (m, 8H, NCH2CH2CH2CH3), 1.558 (8H, NCH2CH2CH2CH3), 2.375 (6H, NCH2CH2),
2.950 (6H, NCH2CH2), 3.134-3.168 (m, 8H, NCH2CH2CH2CH3), 8.041 (br, 3H, NHb), 9.506(br, 3H,
NHa); 13C NMR (125 MHz, DMSO-d6): δ 13.4 (NCH2CH2CH2CH3), 19.2(NCH2CH2CH2CH3), 10
23.0 (NCH2CH2CH2CH3) 38.1(NCH2), 54.8 (NCH2CH2), 57.5 (NCH2CH2CH2CH3), 115.8 (m of s,
ArCCF, JCCF = 15.3 Hz), 134.8-135.7 (m of d, ArCF),138.2-138.9 (m of d, ArCF), 140.9-141.2 (m of d,
ArCF), 144.3-144.5 (m of d, ArCF), 155.2 (s, C=O).
15
Electronic Supplementary Material (ESI) for Dalton TransactionsThis journal is © The Royal Society of Chemistry 2013

Fig. 1S. 1H-NMR spectra of complex 1 in DMSO-d6 at 298K.
5
Electronic Supplementary Material (ESI) for Dalton TransactionsThis journal is © The Royal Society of Chemistry 2013
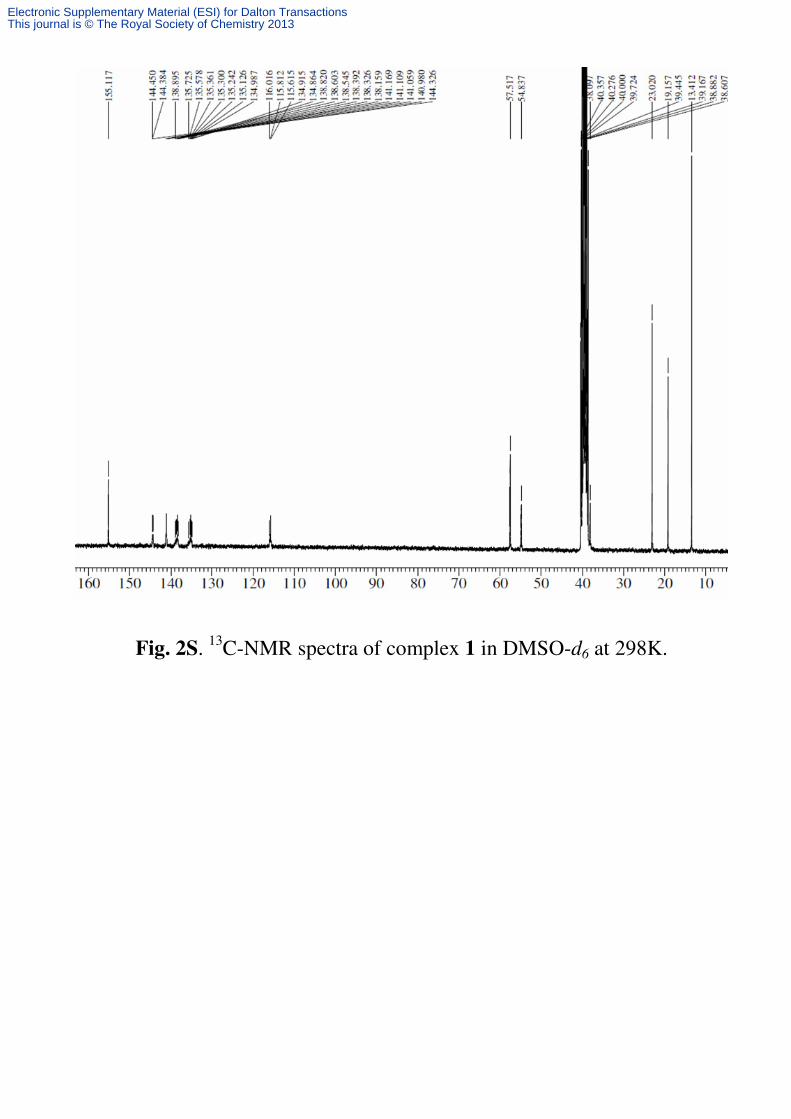
Fig. 2S. 13C-NMR spectra of complex 1 in DMSO-d6 at 298K.
Electronic Supplementary Material (ESI) for Dalton TransactionsThis journal is © The Royal Society of Chemistry 2013
5
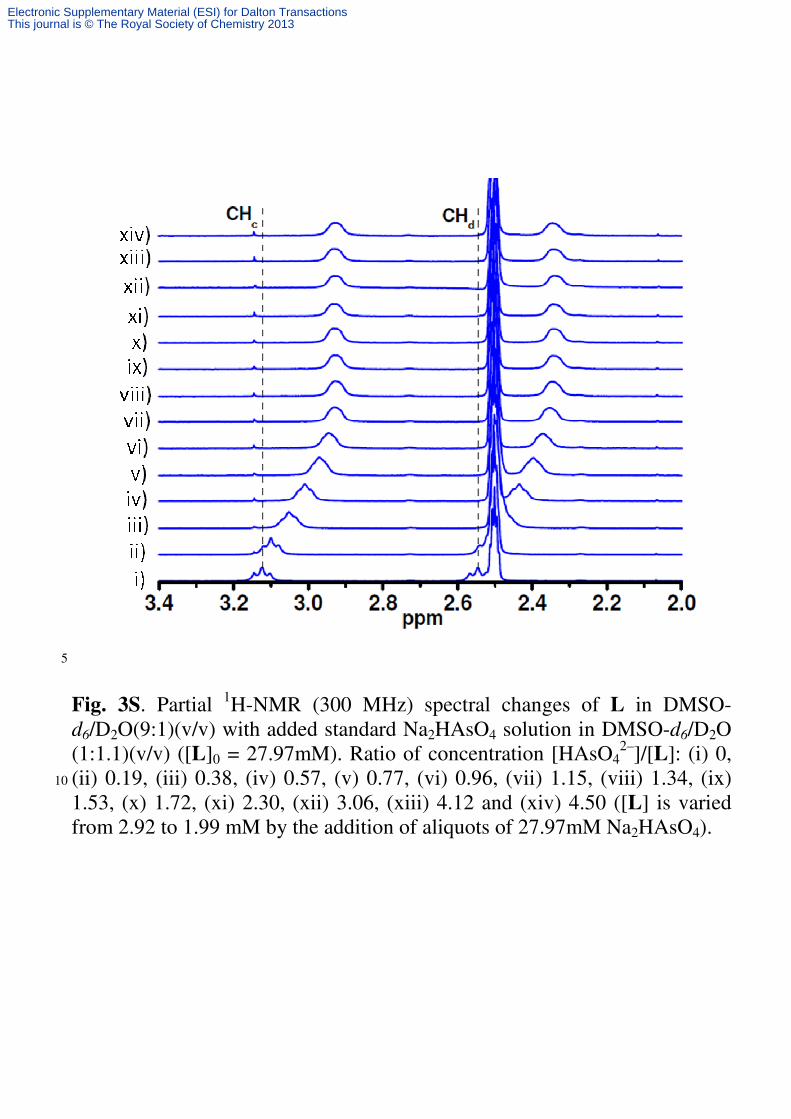
Fig. 3S. Partial 1H-NMR (300 MHz) spectral changes of L in DMSO-d6/D2O(9:1)(v/v) with added standard Na2HAsO4 solution in DMSO-d6/D2O (1:1.1)(v/v) ([L]0 = 27.97mM). Ratio of concentration [HAsO4
2–]/[L]: (i) 0, (ii) 0.19, (iii) 0.38, (iv) 0.57, (v) 0.77, (vi) 0.96, (vii) 1.15, (viii) 1.34, (ix) 10
1.53, (x) 1.72, (xi) 2.30, (xii) 3.06, (xiii) 4.12 and (xiv) 4.50 ([L] is varied from 2.92 to 1.99 mM by the addition of aliquots of 27.97mM Na2HAsO4).
Electronic Supplementary Material (ESI) for Dalton TransactionsThis journal is © The Royal Society of Chemistry 2013

5
Fig. 4S. Plot shows the change in chemical shift of the –CHc of L with 10
increasing amounts of standard Na2HAsO4 solution at 298K.
Electronic Supplementary Material (ESI) for Dalton TransactionsThis journal is © The Royal Society of Chemistry 2013

5
10
Fig. 5S. Job’s plot of L with Na2HAsO4 in DMSO-d6/D2O (1:1.1)(v/v) at 298K.
15
Electronic Supplementary Material (ESI) for Dalton TransactionsThis journal is © The Royal Society of Chemistry 2013

5
Fig. 6S. Partial 1H-NMR (300 MHz) spectral changes of L in DMSO-d6with 10
added standard Na2SO4 solution in DMSO-d6/D2O(1:1.1)(v/v) ([L]0 = 4.27 mM). Ratio of concentration [SO4
2–]/[L]: (i) 0, (ii) 0.14, (iii) 0.27, (iv) 0.41, (v) 0.55, (vi) 0.69, (vii) 0.82, (viii) 0.96, (ix) 1.10, (x) 1.23, (xi) 1.64, (xii) 2.15, (xiii) 2.74 and (xiv) 2.97 ([L] is varied from 4.27 to 3.39 mM by the addition of aliquots of 48.68 mM Na2SO4). 15
Electronic Supplementary Material (ESI) for Dalton TransactionsThis journal is © The Royal Society of Chemistry 2013

5
10
Fig. 4S. Plot shows the change in chemical shift of the –CHc of L with 15
increasing amounts of standard Na2SO4 solution at 298K.
Electronic Supplementary Material (ESI) for Dalton TransactionsThis journal is © The Royal Society of Chemistry 2013

5
10 15
Fig. 8S. Job’s plot of L with Na2SO4 in DMSO-d6/D2O (1:1.1)(v/v) at 298K.
Electronic Supplementary Material (ESI) for Dalton TransactionsThis journal is © The Royal Society of Chemistry 2013

Fig. 9S. Partial 1H-NMR (300 MHz) spectral changes of L in DMSO-d6/D2O (9:1)(v/v) with added standard NaH2PO4 solution in DMSO-d6/D2O (1:1.1)(v/v) ([L]0 = 4.01mM). Ratio of concentration [H2PO4
–]/[L]: (i) 0, (ii) 0.11, (iii) 0.22, (iv) 0.33, (v) 0.43, (vi) 0.54, (vii) 0.65, (viii) 0.76, (ix) 0.87, (x) 0.98, (xi) 1.30, (xii) 1.70, (xiii) 2.21 and (xiv) 2.39([L] is varied from 4.01 to 3.17 mM by the addition of aliquots of 36.26 mM NaH2PO4).
Electronic Supplementary Material (ESI) for Dalton TransactionsThis journal is © The Royal Society of Chemistry 2013

Fig. 10S. Plot shows the change in chemical shift of the –CHc of L with increasing amounts of standard NaH2PO4 solution at 298K.
Electronic Supplementary Material (ESI) for Dalton TransactionsThis journal is © The Royal Society of Chemistry 2013

Fig. 11S. Job’s plot of L with NaH2PO4 in DMSO-d6/D2O (1:1.1)(v/v) at 298K.
Electronic Supplementary Material (ESI) for Dalton TransactionsThis journal is © The Royal Society of Chemistry 2013

Fig. 12S. Partial 1H-NMR (300 MHz) spectral changes of L in DMSO-d6/D2O (9:1)(v/v) with added standard Na2CO3 solution in DMSO-d6/D2O (1:1.1)(v/v) ([L]0 = 2.46 mM). Ratio of concentration [CO3
-]/[L]: (i) 0, (ii) 0.13, (iii) 0.25, (iv) 0.38, (v) 0.51, (vi) 0.63, (vii) 0.76, (viii) 0.88, (ix) 1.01, (x) 1.14, (xi) 1.52, (xii) 1.94, (xiii) 2.53 and (xiv) 2.74([L] is varied from 2.46 to 1.94 mM by the addition of aliquots of 25.88 mM Na2CO3).
Electronic Supplementary Material (ESI) for Dalton TransactionsThis journal is © The Royal Society of Chemistry 2013

Fig. 13S. Plot shows the change in chemical shift of the –CHc of L with increasing amounts of standard Na2CO3 solution at 298K.
Electronic Supplementary Material (ESI) for Dalton TransactionsThis journal is © The Royal Society of Chemistry 2013

Fig. 14S. Job’s plot of L with Na2CO3in DMSO-d6/D2O (1:1.1)(v/v) at 298K.
Electronic Supplementary Material (ESI) for Dalton TransactionsThis journal is © The Royal Society of Chemistry 2013
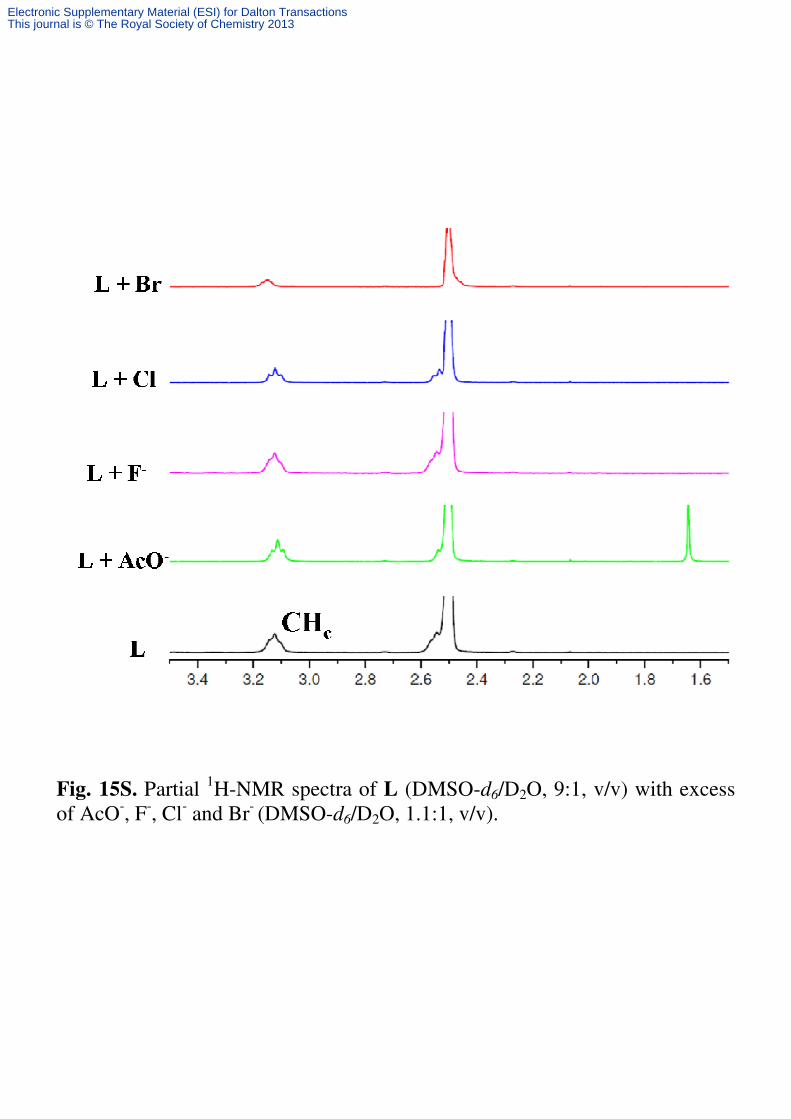
Fig. 15S. Partial 1H-NMR spectra of L (DMSO-d6/D2O, 9:1, v/v) with excess of AcO-, F-, Cl- and Br- (DMSO-d6/D2O, 1.1:1, v/v).
Electronic Supplementary Material (ESI) for Dalton TransactionsThis journal is © The Royal Society of Chemistry 2013

Fig. 16S. Partial 1H-NMR (300 MHz) spectral changes of L in DMSO-d6 with added solution of DMSO-d6/D2O (1:1.1)(v/v) solvent. Volume of added solvent: i) 0µl, ii) 10µl, iii) 20 µl, iv) 40 µl, v) 60 µl.
Electronic Supplementary Material (ESI) for Dalton TransactionsThis journal is © The Royal Society of Chemistry 2013
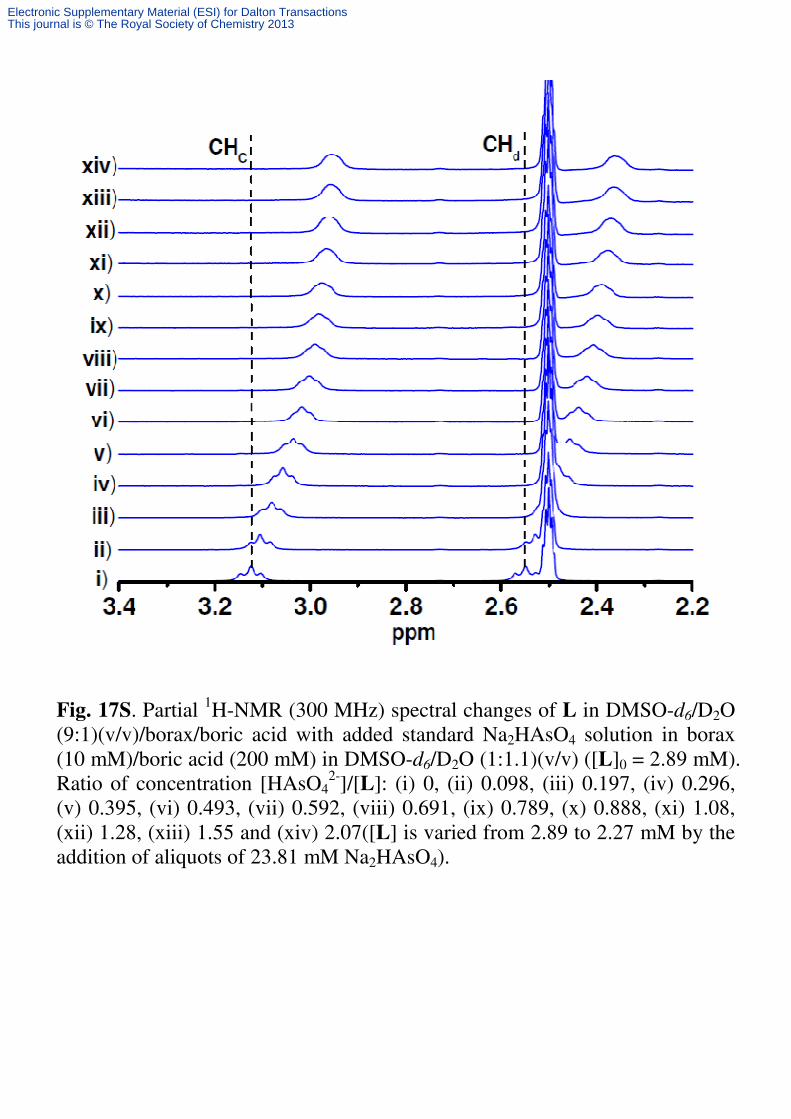
Fig. 17S. Partial 1H-NMR (300 MHz) spectral changes of L in DMSO-d6/D2O (9:1)(v/v)/borax/boric acid with added standard Na2HAsO4 solution in borax (10 mM)/boric acid (200 mM) in DMSO-d6/D2O (1:1.1)(v/v) ([L]0 = 2.89 mM). Ratio of concentration [HAsO4
2-]/[L]: (i) 0, (ii) 0.098, (iii) 0.197, (iv) 0.296, (v) 0.395, (vi) 0.493, (vii) 0.592, (viii) 0.691, (ix) 0.789, (x) 0.888, (xi) 1.08, (xii) 1.28, (xiii) 1.55 and (xiv) 2.07([L] is varied from 2.89 to 2.27 mM by the addition of aliquots of 23.81 mM Na2HAsO4).
Electronic Supplementary Material (ESI) for Dalton TransactionsThis journal is © The Royal Society of Chemistry 2013

Fig. 18S. Plot shows the change in chemical shift of the –CHc of L with increasing amounts of standard Na2HAsO4 solution at 298K in borax/boric acid buffer.
Electronic Supplementary Material (ESI) for Dalton TransactionsThis journal is © The Royal Society of Chemistry 2013

Fig. 19S. Job’s plot of L with Na2HAsO4 in DMSO-d6/D2O (1:1.1)(v/v) at 298K in borax/boric acid buffer.
Electronic Supplementary Material (ESI) for Dalton TransactionsThis journal is © The Royal Society of Chemistry 2013

Fig. 20S. Partial 1H-NMR (300 MHz) spectral changes of L in DMSO-d6/D2O (9:1)(v/v)/borax/boric acid with added standard Na2SO4 solution in borax (10 mM)/boric acid (200 mM) in DMSO-d6/D2O (1:1.1)(v/v) ([L]0 = 2.97mM). Ratio of concentration [SO4
2-]/[L]: (i) 0, (ii) 0.15, (iii) 0.30, (iv) 0.45, (v) 0.61, (vi) 0.76, (vii) 0.91, (viii) 1.06, (ix) 1.21, (x) 1.36, (xi) 1.67, (xii) 1.97, (xiii) 2.37 and (xiv) 3.18 ([L] is varied from 2.97 to 2.33 mM by the addition of aliquots of 37.55 mM Na2SO4).
Electronic Supplementary Material (ESI) for Dalton TransactionsThis journal is © The Royal Society of Chemistry 2013

Fig. 21S. Plot shows the change in chemical shift of the –CHc of L with increasing amounts of standard Na2SO4 solution at 298K in borax/boric acid buffer.
Electronic Supplementary Material (ESI) for Dalton TransactionsThis journal is © The Royal Society of Chemistry 2013
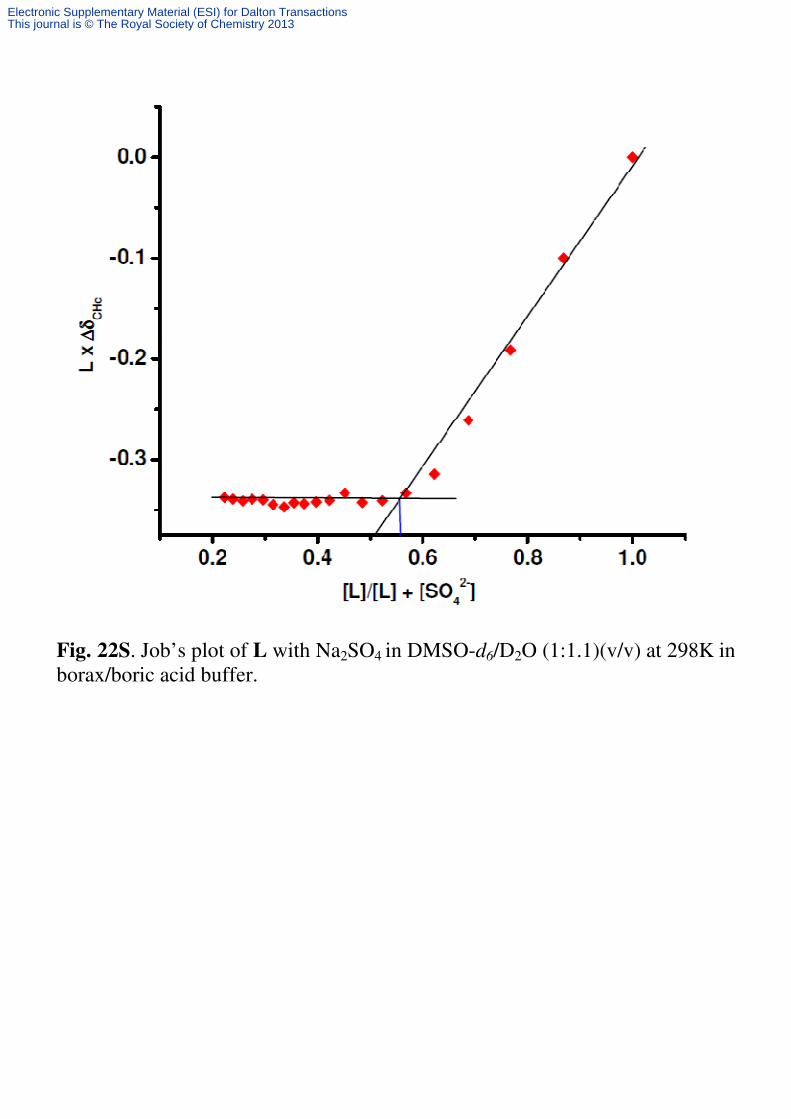
Fig. 22S. Job’s plot of L with Na2SO4 in DMSO-d6/D2O (1:1.1)(v/v) at 298K in borax/boric acid buffer.
Electronic Supplementary Material (ESI) for Dalton TransactionsThis journal is © The Royal Society of Chemistry 2013

Fig. 23S. Partial 1H-NMR (300 MHz) spectral changes of L in DMSO-d6/D2O (9:1)(v/v)/borax/boric acid with added standard NaH2PO4 solution in borax (10 mM)/boric acid (200 mM) in DMSO-d6/D2O (1:1.1)(v/v) ([L]0 = 3.75 mM). Ratio of concentration [H2PO4
-]/[L]: (i) 0, (ii) 0.11, (iii) 0.21, (iv) 0.32, (v) 0.42, (vi) 0.53, (vii) 0.64, (viii) 0.75, (ix) 0.85, (x) 0.96, (xi) 1.17, (xii) 1.39, (xiii) 1.67 and (xiv) 2.24([L] is varied from 3.75 to 2.93 mM by the addition of aliquots of 33.33 mM NaH2PO4).
Electronic Supplementary Material (ESI) for Dalton TransactionsThis journal is © The Royal Society of Chemistry 2013

Fig. 24S. Plot shows the change in chemical shift of the –CHc of L with increasing amounts of standard NaH2PO4 solution at 298K in borax/boric acid buffer.
Electronic Supplementary Material (ESI) for Dalton TransactionsThis journal is © The Royal Society of Chemistry 2013

Fig. 25S. Job’s plot of L with NaH2PO4 in DMSO-d6/D2O (1:1.1)(v/v) at 298K in borax/boric acid buffer .
Electronic Supplementary Material (ESI) for Dalton TransactionsThis journal is © The Royal Society of Chemistry 2013

Fig. 26S. Partial 1H-NMR (300 MHz) spectral changes of L in DMSO-d6 with added solution of DMSO-d6/D2O (1:1.1)(v/v) solvent in borax/boric acid buffer. Volume of added solvent: i) 0µl, ii) 10µl, iii) 20 µl, iv) 40 µl, v) 60 µl.
Electronic Supplementary Material (ESI) for Dalton TransactionsThis journal is © The Royal Society of Chemistry 2013

Fig.27S. Comparative FT-IR analyses of L (red) and complex 1 (blue) in KBr discs (‘*’ indicates the C-H stretching frequency of tetrabutylammonium cation in complex 1).
Electronic Supplementary Material (ESI) for Dalton TransactionsThis journal is © The Royal Society of Chemistry 2013
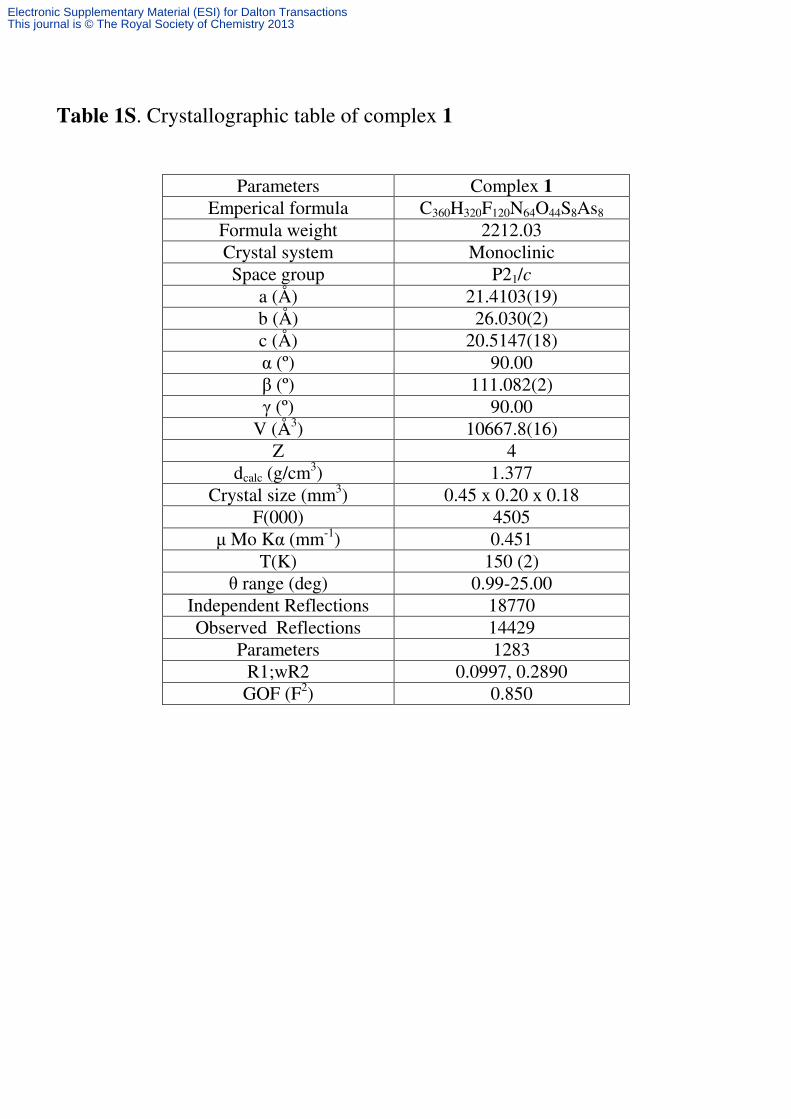
Table 1S. Crystallographic table of complex 1
Parameters Complex 1 Emperical formula C360H320F120N64O44S8As8
Formula weight 2212.03 Crystal system Monoclinic Space group P21/c
a (Å) 21.4103(19) b (Å) 26.030(2) c (Å) 20.5147(18) α (º) 90.00 β (º) 111.082(2) γ (º) 90.00
V (Å3) 10667.8(16) Z 4
dcalc (g/cm3) 1.377 Crystal size (mm3) 0.45 x 0.20 x 0.18
F(000) 4505 µ Mo Kα (mm-1) 0.451
T(K) 150 (2) θ range (deg) 0.99-25.00
Independent Reflections 18770 Observed Reflections 14429
Parameters 1283 R1;wR2 0.0997, 0.2890 GOF (F2) 0.850
Electronic Supplementary Material (ESI) for Dalton TransactionsThis journal is © The Royal Society of Chemistry 2013

Fig. 28S. a) Space-fill representation of HAsO4
2-encapsulateddimeric capsular assembly of complex 1; b) ball-stick representation showing the dimension of complex 1capsule.
Electronic Supplementary Material (ESI) for Dalton TransactionsThis journal is © The Royal Society of Chemistry 2013

Fig.29S.The scatter plot of X–H…O vs. H…O distances of the hydrogen bonds in complex 1(X = N/O).
Electronic Supplementary Material (ESI) for Dalton TransactionsThis journal is © The Royal Society of Chemistry 2013

Table 2S. Inter-atomic distances, and angles for the H-bonding Interactions of the encapsulated HAsO4
2- in complex 1.
D-H···A d (H···A), Å d (D·· ·A), Å < D-H-A º N3-H3·· ·O7a 2.010 2.808(8) 154 N4-H4·· ·O10a 2.010 2.856(7) 169 N5-H5·· ·O7a 2.000 2.812(7) 158 N6-H6·· ·O10a 2.440 3.101(7) 134 N7-H7·· ·O10a 1.990 2.776(9) 153 O8-H8·· ·O11a 1.840 2.659(10) 173 N9-H9·· ·O9b 2.080 2.879(8) 154
N10-H10···O10b 1.980 2.808(8) 162 N11-H11···O9b 2.400 2.985(9) 126 N12-H12···O9b 2.070 2.826(7) 146 N13-H13···O9b 2.130 2.958(7) 162 N14-H14···O7b 2.010 2.797(7) 151
a x, y, z; b1-x,-1/2+y,3/2-z
Electronic Supplementary Material (ESI) for Dalton TransactionsThis journal is © The Royal Society of Chemistry 2013

Fig. 30S. The TGA analysis of complex1 shows weight loss of 7.368% within around 150oC, which corresponds to the loss of two dimethyl sulfoxide and one water molecule.
Electronic Supplementary Material (ESI) for Dalton TransactionsThis journal is © The Royal Society of Chemistry 2013

Fig. 31S. (a) PXRD pattern of the crystal of complex 1 (simulated) and (b) PXRD pattern of complex 1 (experimental pattern).
Electronic Supplementary Material (ESI) for Dalton TransactionsThis journal is © The Royal Society of Chemistry 2013

Fig. 32S.TEM-EDX profile of complex 1.
References: 1) M. J. Hynes, J. Chem. Soc., Dalton Trans. 1993, 311. 2) SAINT and XPREP, 5.1 ed.; Siemens Industrial Automation Inc.: Madison, WI, 1995. G. M. Sheldrick. 3) SADABS, empirical absorption Correction Program; University of Göttingen: Göttingen, Germany, 1997. 4) G. M. Sheldrick, SHELXTL Reference Manual: Version 5.1; Bruker AXS: Madison, WI, 1997. 5) G. M. Sheldrick, SHELXL-97: Program for Crystal Structure Refinement; University of Göttingen: Göttingen, Germany, 1997. 6) A. L. Spek, PLATON-97; University of Utrecht: Utrecht, The Netherlands, 1997. 7) Mercury 2.3 Supplied with Cambridge Structural Database; CCDC: Cambridge, U.K., 2003-2004.
Electronic Supplementary Material (ESI) for Dalton TransactionsThis journal is © The Royal Society of Chemistry 2013
Related Documents