Supporting Information Variation in the toxicity of sediment-associated substituted phenylamine antioxidants to an epibenthic (Hyalella azteca) and endobenthic (Tubifex tubifex) invertebrate Prosser, R.S. 1,3* , Bartlett, A.J. 1 , Milani, D. 2 , Holman, E.A.M. 1 , Ikert, H. 1 , Schissler, D. 1 , Toito, J. 1 , Parrott, J.L. 1 , Gillis, P.L. 1 , and Balakrishnan, V.K. 1 1 Environment and Climate Change Canada, Aquatic Contaminants Research Division, Burlington, Ontario, Canada 2 Environment and Climate Change Canada, Watershed Hydrology and Ecology Research Division, Burlington, Ontario, Canada * Corresponding Author Current affiliation: 3 University of Guelph, School of Environmental Sciences, Guelph, Ontario, Canada Page 1 of 39

Welcome message from author
This document is posted to help you gain knowledge. Please leave a comment to let me know what you think about it! Share it to your friends and learn new things together.
Transcript
Supporting Information
Variation in the toxicity of sediment-associated substituted phenylamine antioxidants to an epibenthic (Hyalella azteca) and endobenthic (Tubifex tubifex) invertebrate
Prosser, R.S. 1,3*, Bartlett, A.J. 1, Milani, D. 2, Holman, E.A.M. 1, Ikert, H. 1, Schissler, D. 1, Toito, J. 1, Parrott, J.L. 1, Gillis, P.L. 1, and Balakrishnan, V.K.1
1 Environment and Climate Change Canada, Aquatic Contaminants Research Division, Burlington, Ontario, Canada2 Environment and Climate Change Canada, Watershed Hydrology and Ecology Research Division, Burlington, Ontario, Canada
* Corresponding Author
Current affiliation:3 University of Guelph, School of Environmental Sciences, Guelph, Ontario, Canada
Corresponding Author:Ryan Prosser Ph.D.University of GuelphSchool of Environmental SciencesGuelph, Ontario, [email protected]@canada.ca
Page 1 of 26
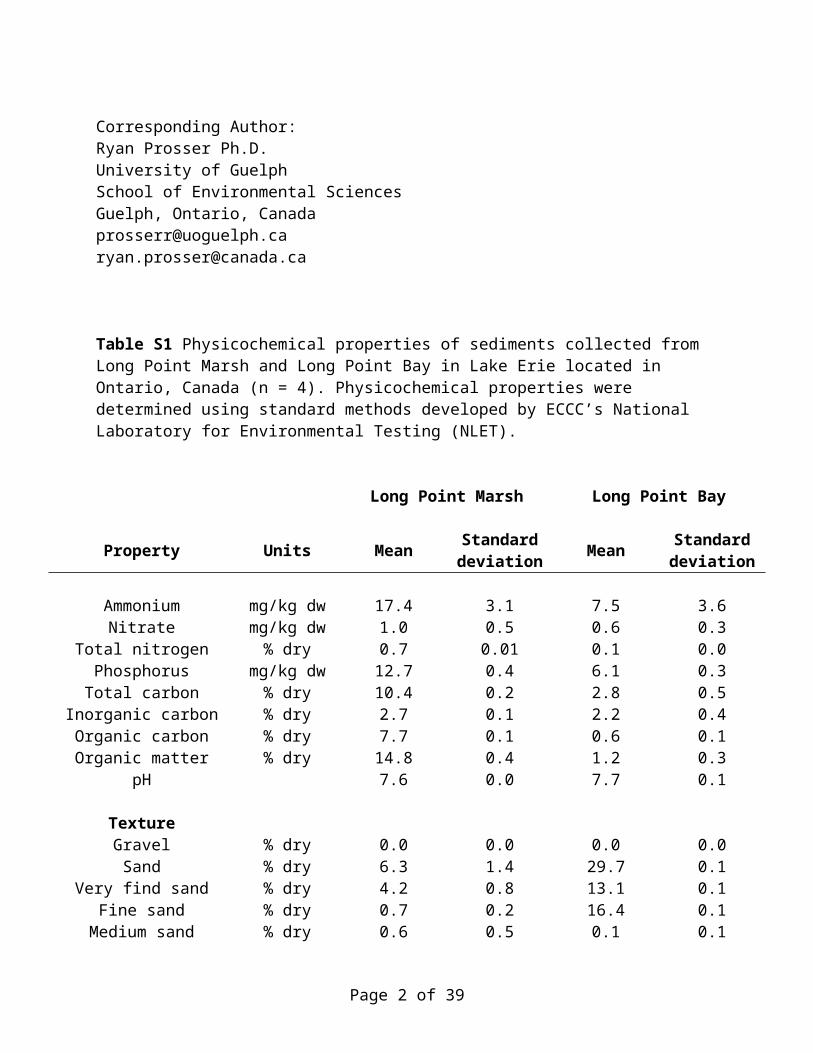
Table S1 Physicochemical properties of sediments collected from Long Point Marsh and Long Point Bay in Lake Erie located in Ontario, Canada (n = 4). Physicochemical properties were determined using standard methods developed by ECCC’s National Laboratory for Environmental Testing (NLET).
Long Point Marsh Long Point Bay
Property Units Mean Standard deviation Mean Standard
deviation
Ammonium mg/kg dw 17.4 3.1 7.5 3.6Nitrate mg/kg dw 1.0 0.5 0.6 0.3
Total nitrogen % dry 0.7 0.01 0.1 0.0Phosphorus mg/kg dw 12.7 0.4 6.1 0.3Total carbon % dry 10.4 0.2 2.8 0.5
Inorganic carbon % dry 2.7 0.1 2.2 0.4Organic carbon % dry 7.7 0.1 0.6 0.1Organic matter % dry 14.8 0.4 1.2 0.3
pH 7.6 0.0 7.7 0.1
TextureGravel % dry 0.0 0.0 0.0 0.0Sand % dry 6.3 1.4 29.7 0.1
Very find sand % dry 4.2 0.8 13.1 0.1Fine sand % dry 0.7 0.2 16.4 0.1
Medium sand % dry 0.6 0.5 0.1 0.1Coarse sand % dry 0.7 0.1 0.0 0.0
Very coarse sand % dry 0.1 0.2 0.1 0.1Silt % dry 71.5 2.5 59.8 0.4Clay % dry 22.2 2.6 10.6 0.4
Page 2 of 26

Table S2 Physicochemical properties of mixed sediment used in toxicity testing (n = 6). Physicochemical properties were determined using standard methods developed by ECCC’s NLET.
Mixed sediment
Property Units Mean Standard deviation
Ammonium mg/kg dw 8.6 3.1Nitrate mg/kg dw 0.4 0.5
Total nitrogen % dry 0.2 0.01Phosphorus mg/kg dw 7.8 0.4Total carbon % dry 4.9 0.2
Inorganic carbon % dry 2.9 0.1Organic carbon % dry 2.0 0.1Organic matter % dry 3.9 0.4
pH 7.8 0.0
TextureGravel % dry 0.0 0.0Sand % dry 21.1 10.2
Very find sand % dry 10.2 1.5Fine sand % dry 10.0 11.2
Medium sand % dry 0.9 0.3Coarse sand % dry 0.2 0.2
Very coarse sand % dry 0.0 0.0Silt % dry 66.4 10.3Clay % dry 12.6 0.3
Page 3 of 26

Table S3 Concentration of selected inorganic and organic contaminants in mixed sediment used in toxicity testing (n = 4). Analyses were conducted using standard methods developed by ECCC’s NLET.
Metals(µg/g dw) Mean Standard
deviation
Polycyclic aromatic hydrocarbons
(ng/g dw)Mean
Standard
deviation
Organochlorines(ng/g dw) Mean Standard
deviation
Aluminum 40200 1243 Acenaphthene <0.7 - Aldrin <0.003 -Antimony 0.2 0.0 Acenaphthylene <0.2 - alpha-BHC <0.01 -Arsenic 2.4 0.7 Anthracene 2.75 0.5 beta-BHC <0.01 -Barium 439 23.1 Anthanthrene <0.03 - gamma-BHC (lindane) <0.01 -
Beryllium 1 0.1 Benzo(a)anthracene 4.85 0.9 delta-BHC <0.01 -Bismuth 0.07 0.0 Benzo(a)pyrene 2.8 1.0 alpha-Chlordane 0.024 0.004
Cadmium 0.4 0.0 Benzo(a)acridine 0.096 0.00 gamma-Chlordane 0.027 0.006Calcium 88700 324 Benzo(c)phenanthrene 2.0 0.2 Captan <0.2 -
Chromium 17.3 7.9 Benzo(b)fluoranthene 12 4.2 Chlorothalonil <0.002 -Cobalt 4.7 0.9 Benzo(e)pyrene 8.6 1.9 o,p'-DDD 0.19 0.06Copper 10.6 1.0 Benzo(g,h,i)perylene 9.6 2.1 o,p'-DDE 0.045 0.004
Galllium 10.2 1.2 Benzo(j)fluoranthene 4.5 1.8 o,p'-DDT 0.09 0.02Iron 18300 439 Benzo(k)fluoranthene 4.0 5.0 p,p'-DDD 1.0 0.1
Lanthanum 19.3 4.3 1-Chloronaphthalene <0.01 - p,p'-DDE 1.6 0.6Lead 8.8 3.0 2-Chloronaphthalene <0.01 - p,p'-DDT <0.2 -
Lithium 13.7 1.3 Chrysene 10.1 1.3 Deltamethrine <0.1 -Magnesium 19800 234 Dibenzo(a,h)anthracene 1.2 0.6 Dieldrin 0.038 0.008Manganese 588 34.5 Dibenzo(a,j)anthracene 1.3 0.2 Endosulfan I <0.02 -
Mercury <0.035 - Dibenzo(a,h)acridine <0.02 - Endosulfan II <0.03 -Molybdenum 0.8 0.3 Dibenzo(a,j)acridine <0.03 - Endosulfane sulphate <0.01 -
Nickel 10.9 1.7 7H-Dibenzo(c,g)carbazole 9.2 0.0 Endrin <0.01 -Phosphorus 776 83 Dibenzo(a,e)fluoranthene 1.7 0.6 Endrin aldehyde <0.01 -Potassium 14800 329 Dibenzo(a,e)pyrene 1.7 0.5 Endrin ketone <0.1 -Rubidium 43 7.2 Dibenzo(a,h)pyrene <0.05 - Heptachlor <0.002 -Selenium 0.3 0.2 Dibenzo(a,i)pyrene <0.05 - Heptachlor epoxide (A) <0.02 -Sodium 12500 92 Dibenzothiophene <10 - Heptachlor epoxide (B) <0.004 -
Strontium 271 53.2 7,12-Dimethylbenzo(a)anthracene 2.55 1.9 Hexachlorobenzene 0.040 0.003Thallium 0.3 0.1 1,3-Dimethylnaphthalene 0.83 0.1 Hexachlorobutadiene 0.0083 0.0002Uranium 1.5 0.8 Fluoranthene 19 9.9 Hexachlorocyclopentadiene <0.001 -
Vanadium 43 5.2 Fluorene 5.5 0.8 Metolachlor <0.01 -Zinc 36.9 5.9 Indeno(1,2,3-c,d)pyrene 7.1 3.0 Methoxychlor <0.01 -
2-Methylchrysene 2.2 1.4 Mirex <0.001 -3-Methylchrysene 1.3 0.6 trans-Nonachlor <0.012 -
Ʃ5- and 6-Methylchrysene <0.03 - cis-Nonachlor <0.02 -2-Methylfluoranthene 1.4 0.4 Octachlorostyrene <0.002 -1-Methylnaphthalene 3.0 0.4 Oxychlordane <0.01 -2-Methylnaphthalene 3.8 0.4 Pentachloroanisole <0.004 -
1-Methylphenanthrene <0.3 - Pentachlorobenzene 0.022 0.0011-Nitropyrene <0.3 - Permethrin <0.02 -Naphthalene 7.1 0.7
Perylene 12.7 1.9Phenanthrene 26.7 10.3
Pyrene 11.8 1.82,3,5-Trimethylnaphthalene 1.1 0.1
Page 4 of 26

Table S4 Physicochemical properties of culture water (dechlorinated Burlington, ON, tap water) used in toxicity testing (n = 4). Physicochemical properties were determined using standard methods developed by ECCC’s NLET.
Physicochemical property Mean value (standard deviation)Ca2+ 35.7 (0.3) mg/LMg2+ 9.0 (0.07) mg/LK+ 1.7 (0.02) mg/LSilica 1.3 (0.04) mg/LNa+ 15.5 (0.6) mg/LCl- 26.5 (0.3) mg/LF- 0.7 (0.01) mg/LSO4
2- 26.9 (0.1) mg/LDissolved inorganic carbon 21.6 (0.1) mg/LDissolved organic carbon 0.9 (0.0) mg/LNH4
+ / NH3 0.017 (0.001) mg/LNO3
-/NO2- 0.78 (0.23) mg/L
Soluble reactive phosphorus 0.009 (0.006) mg/LNitrogen, total Kjeldahl 0.16 (0.03) mg/LAlkalinity (CaCO3) 90.4 (0.64) mg/LpH 8.13 (0.28)Specific conductance (25 ºC) 316 (4) µS/cmHardness (CaCO3) 126 (0) mg/L
Page 5 of 26
Table S5 Concentration of selected inorganic and organic contaminants in culture water used in toxicity testing (n = 4). Analyses were conducted using standard methods developed by ECCC’s NLET.
Contaminant Mean concentration (µg/L) Standard deviation
Metals
Lithium 1.91 0.01Beryllium 0.002 0.001
Boron 21.8 3.4Aluminum 54.2 21.9Vanadium 0.308 0.014Chromium 0.19 0.01Manganese 0.12 0.02
Iron 1.7 0.5Cobalt 0.018 0.001Nickel 0.66 0.16Copper 0.60 0.15
Zinc 3.3 1.7Gallium 0.009 0.001Arsenic 0.99 0.23
Selenium 0.14 0.01Rubidium 0.995 0.066Strontium 185 10Yttrium 0.055 0.051Niobium <0.001 -
Molybdenum 1.31 0.03Silver 0.097 0.025
Cadmium 0.007 0.002Tin 1.83 1.73
Antimony 0.159 0.001Cesium 0.018 0.006Barium 25.7 2.6
Lanthanum 2.14 0.58Cerium 0.014 0.008
Tungsten 0.066 0.016Platinum 0.003 0.002Thallium 0.003 0.001
Lead 1.21 0.429Bismuth 0.001 0.001Uranium 0.255 0.074
Page 6 of 26

Table S5 continued
Contaminant Mean concentration (ng/L) Standard deviation
Organochlorines
Pentachlorobenzene <0.440 -alpha-BHC <1.14 -
Hexachlorobenzene <0.440 -gamma-BHC (lindane) <0.410 -
Heptachlor <0.780 -Aldrin <0.770 -
Heptachlor epoxide <0.600 -alpha-Chlordane <0.410 -
Dieldrin <1.33 -p,p-DDE <1.28 -Endrin <1.26 -
Endosulfan II <0.860 -p,p-DDD <1.32 -o,p-DDT <1.77 -p,p-DDT <1.58 -
Methoxychlor <3.81 -Mirex <1.02 -
Hexachlorobutadiene <0.530 -beta-BHC <0.850 -
Pentachloroanisole <0.480 -Oxychlordane <0.450 -
o,p-DDE <1.29 -o,p-DDD <0.940 -
trans-nonachlor <0.590 -cis-nonachlor <0.600 -
Page 7 of 26
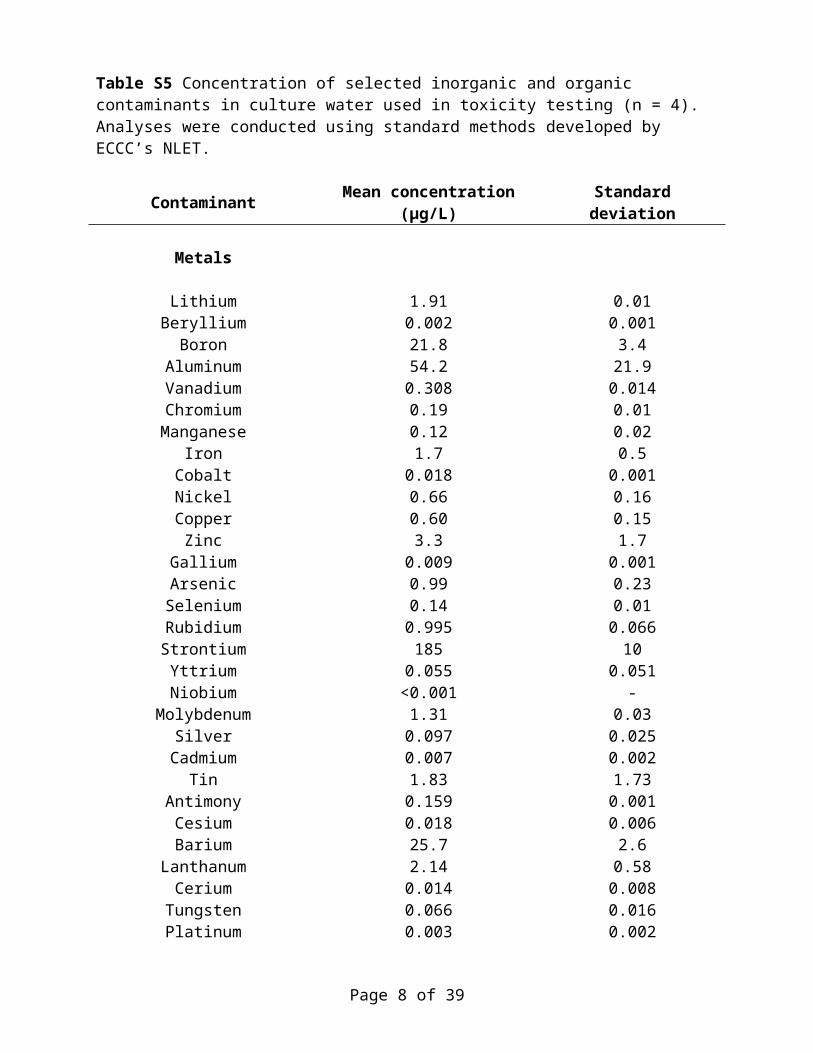
Table S5 continued
Contaminant Mean concentration (ng/L) Standard deviation
Polycyclic aromatic hydrocarbons
Acenaphthene <5.17 -Acenaphthylene <6.53 -
Anthracene <6.12 -Benzo(a)anthracene <9.96 -
Benzo(a)pyrene <9.42 -Benzo(b)fluoranthene <10.0 -
Benzo(e)pyrene <8.70 -Benzo(g,h,i)perylene <17.1 -Benzo(k)fluoranthene <8.63 -
Chrysene <2.95 -2-Chloronaphthalene <6.65 -
Dibenzo(a,h)anthracene <25.1 -Dibenzothiophene <8.16 -
Fluoranthene <4.08 -Fluorene <6.38 -Indene <5.05 -
Indeno(1,2,3-c,d)pyrene <18.0 -1-Methylnaphthalene <6.73 -2-Methylnaphthalene <7.59 -
Naphthalene <5.80 -Perylene <13.4 -
Phenathrene <6.20 -Pyrene <3.93 -Retene <13.6 -
1,2,3,4-Tetrahydronaphthlene <5.71 -
Page 8 of 26

Table S6 Mean, standard deviation, maximum, and minimum of water quality parameters in replicate test vessels across treatments at the initiation and conclusions of tests exposing juvenile Hyalella azteca to SPAs for 96 h.
Experiment pH Dissolved oxygen (mg/L)
Conductivity (µS/cm)
Ammonia (mg/L)
DPA t = 0 d Mean 8.26 8.41 360 <0.01Standard Deviation 0.03 0.27 3Max. 8.29 8.58 363 <0.01Min. 8.21 7.82 357 <0.01
t = 28 d Mean 8.26 9.40 374 0.004Standard Deviation 0.04 0.19 5 0.1Max. 8.31 9.56 380 <0.01Min. 8.24 9.08 364 0.025
PNA t = 0 d Mean 8.24 8.57 357 <0.01Standard Deviation 0.03 0.24 6Max. 8.26 8.93 370 <0.01Min. 8.19 8.31 351 <0.01
t = 28 d Mean 8.29 8.01 357 0.02Standard Deviation 0.19 0.36 8 0.02Max. 8.72 8.33 371 0.025Min. 8.17 7.26 352 <0.01
DPPDA t = 0 d Mean 8.33 9.25 357 <0.01Standard Deviation 0.03 0.48 17Max. 8.38 9.37 394 <0.01Min. 8.27 8.52 348 <0.01
t = 28 d Mean 8.28 7.72 347 0.004Standard Deviation 0.05 0.33 10 0.1Max. 8.32 7.99 377 0.025Min. 8.18 7.01 358 <0.01
MBA t = 0 d Mean 8.29 7.98 350 <0.01Standard Deviation 0.05 0.62 3Max. 8.33 8.45 353 <0.01Min. 8.20 6.94 349 <0.01
t = 28 d Mean 8.06 8.18 375 0.014Standard Deviation 0.05 0.63 10 0.02Max. 8.13 8.94 391 0.05Min. 7.98 6.89 365 <0.01
Page 9 of 26

Table S7 Mean, standard deviation, maximum, and minimum of water quality parameters in replicate test vessels across treatments at the initiation and conclusions of tests exposing juvenile Hyalella azteca to sediment spiked with SPAs.
Experiment pH Dissolved oxygen (mg/L)
Conductivity (µS/cm)
Ammonia (mg/L)
DPA t = 0 d Mean 8.39 7.94 453 0.01Standard Deviation 0.03 0.20 15 0.02Max. 8.41 8.22 478 0.05Min. 8.32 7.67 436 <0.01
t = 28 d Mean 8.41 8.03 514 <0.01Standard Deviation 0.06 0.20 20Max. 8.53 8.29 539 <0.01Min. 8.37 7.66 483 <0.01
PNA t = 0 d Mean 8.44 8.74 516 <0.01Standard Deviation 0.10 0.12 54Max. 8.67 8.91 586 <0.01Min. 8.38 8.53 449 <0.01
t = 28 d Mean 8.34 8.11 531 <0.01Standard Deviation 0.04 0.11 28Max. 8.40 8.27 565 <0.01Min. 8.30 7.91 496 <0.01
DPPDA t = 0 d Mean 8.37 7.78 420 0.06Standard Deviation 0.07 0.38 35 0.05Max. 8.44 8.20 484 0.1Min. 8.30 7.22 383 <0.01
t = 28 d Mean 8.47 8.19 470 0.07Standard Deviation 0.03 0.11 50 0.15Max. 8.51 8.33 571 0.4Min. 8.43 8.05 430 <0.01
MBA t = 0 d Mean 8.46 8.24 471 <0.01Standard Deviation 0.04 0.18 35Max. 8.49 8.44 545 <0.01Min. 8.37 8.03 437 <0.01
t = 28 d Mean 8.36 7.86 485 <0.01Standard Deviation 0.08 0.24 27Max. 8.50 8.20 524 <0.01Min. 8.27 7.47 445 <0.01
Page 10 of 26

Table S8 Mean, standard deviation, maximum, and minimum of water quality parameters in replicate test vessels across treatments at the initiation and conclusions of tests exposing Tubifex tubifex to sediment spiked with SPAs.
Experiment pH Dissolved oxygen (mg/L)
Conductivity (µS/cm)
Ammonia (mg/L)
DPA t = 0 d Mean 8.41 7.74 446 0.01Standard Deviation 0.06 0.29 8 0.04Max. 8.47 8.26 460 0.1Min. 8.32 7.44 439 <0.01
t = 28 d Mean 8.38 7.66 476 <0.01Standard Deviation 0.06 0.13 23Max. 8.44 7.79 509 <0.01Min. 8.28 7.39 449 <0.01
PNA t = 0 d Mean 8.36 7.89 489 <0.01Standard Deviation 0.03 0.11 40Max. 8.41 8.06 535 <0.01Min. 8.34 7.73 438 <0.01
t = 28 d Mean 8.44 7.96 496 <0.01Standard Deviation 0.06 0.14 33Max. 8.51 8.13 529 <0.01Min. 8.34 7.74 452 <0.01
DPPDA t = 0 d Mean 8.37 7.62 438 0.004Standard Deviation 0.06 0.09 33 0.01Max. 8.43 7.71 475 0.025Min. 8.28 7.47 398 <0.01
t = 28 d Mean 8.52 7.77 482 0.03Standard Deviation 0.04 0.08 72 0.05Max. 8.58 7.90 630 0.1Min. 8.48 7.69 428 <0.01
MBA t = 0 d Mean 8.41 7.88 497 <0.01Standard Deviation 0.03 0.13 32Max. 8.45 8.09 533 <0.01Min. 8.34 7.67 443 <0.01
t = 28 d Mean 8.59 8.50 514 <0.01Standard Deviation 0.04 0.12 40Max. 8.62 8.66 567 <0.01Min. 8.54 8.26 462 <0.01
Page 11 of 26

Table S9 Mortality for each replicate in experiments exposing Hyalella azteca to water spiked with SPAs for 96 h.
Nominal concentration
of DPA in water(μg/L)
Mortality(/10)
Nominal concentration
of PNA in water(μg/L)
Mortality(/10)
Nominal concentration of DPPDA in
water(μg/L)
Mortality(/15)
Nominal concentration
of MBA in water(μg/L)
Mortality(/10)
Control 0 Control 0 Control 1 Control 1Control 1 Control 2 Control 0 Control 0Control 1 Control 1 Control 0 Control 1Solvent 0 Solvent 2 Solvent 0 Solvent 1Solvent 0 Solvent 0 Solvent 1 Solvent 0Solvent 1 Solvent 1 Solvent 1 Solvent 1
250 1 80 2 125 1 0.005 2250 1 80 0 125 1 0.005 0250 0 80 1 125 3 0.005 1500 0 160 1 250 8 0.05 1500 0 160 1 250 5 0.05 0500 0 160 2 250 2 0.05 11000 2 208 10 500 13 0.5 01000 1 208 10 500 11 0.5 11000 2 208 10 500 9 0.5 02000 5 260 10 1000 15 5 02000 6 260 10 1000 14 5 12000 5 260 10 1000 15 5 14000 10 430 10 2000 15 50 04000 10 430 10 2000 15 50 14000 10 430 10 2000 15 50 1
Page 12 of 26

Table S10 Mortality, growth (g dry weight (dw)/ amphipod), and production of biomass (g dw / test vessel) for each replicate in experiments exposing Hyalella azteca to sediment spiked with SPAs for 28 days.
Nominal concentration
of DPA in sediment(μg/g dw)
Mortality(/15)
Growth Biomass production
Nominal concentration
of PNA in sediment(μg/g dw)
Mortality(/15)
Growth Biomassproduction
Nominal concentration of DPPDA in
sediment(μg/g dw)
Mortality(/15)
Growth Biomassproduction
Nominal concentration of
MBA in sediment(μg/g dw)
Mortality(/15)
Growth Biomassproduction
Control 1 0.000386 0.000360 Control 0 0.00055 0.00036 Control 0 0.000313 0.000313 Control 1 0.000657 0.000613Control 1 0.000536 0.000500 Control 0 0.00043 0.00055 Control 0 0.000307 0.000307 Control 1 0.000529 0.000493Control 0 0.000473 0.000473 Control 0 0.00162 0.00043 Control 2 0.000723 0.000627 Control 0 0.000540 0.000540Control 0 0.000456 0.000456 Control 0 0.00034 0.00141 Control 0 0.000627 0.000627 Control 1 0.000636 0.000593Control 0 0.000333 0.000333 Control 0 0.00030 0.00034 Control 0 0.000587 0.000587 Control 4 0.000818 0.000600Control 0 0.000453 0.000453 Control 0 0.00040 0.00040 Control 0 0.000393 0.000393 Control 0 0.000467 0.000467Solvent 2 0.000569 0.000493 Solvent 0 0.00051 0.00051 Solvent 0 0.000820 0.000820 Solvent 0 0.000453 0.000453Solvent 1 0.000471 0.000440 Solvent 0 0.00030 0.00030 Solvent 0 0.000327 0.000327 Solvent 2 0.000746 0.000647Solvent 0 0.000593 0.000593 Solvent 2 0.00081 0.00070 Solvent 2 0.000769 0.000667 Solvent 0 0.000513 0.000513Solvent 0 0.000733 0.000733 Solvent 0 0.00037 0.00035 Solvent 0 0.000767 0.000767 Solvent 2 0.000562 0.000487Solvent 0 0.000520 0.000520 Solvent 1 0.00044 0.00041 Solvent 1 0.000629 0.000587 Solvent 1 0.000664 0.000620Solvent 3 0.000425 0.000340 Solvent 0 0.00025 0.00023 Solvent 0 0.000673 0.000673 Solvent 0 0.000633 0.000633
2 1 0.000486 0.000453 20 0 0.00039 0.00039 200 2 0.000785 0.000680 2 0 0.000687 0.0006872 0 0.000488 0.000488 20 0 0.00063 0.00059 200 1 0.000729 0.000680 2 1 0.000564 0.0005272 1 0.000443 0.000413 20 2 0.00026 0.00026 200 1 0.000950 0.000887 2 0 0.000867 0.0008672 1 0.000450 0.000420 20 1 0.00044 0.00038 200 0 0.000700 0.000700 2 1 0.000486 0.0004532 0 0.000613 0.000613 20 1 0.00054 0.00058 200 0 0.000767 0.000767 2 2 0.000692 0.0006002 0 0.000620 0.000620 20 1 0.00033 0.00033 200 2 0.000962 0.000833 2 1 0.000571 0.00053320 1 0.000564 0.000527 200 0 0.00065 0.00056 500 3 0.000858 0.000687 20 0 0.000587 0.00058720 0 0.000520 0.000520 200 1 0.00041 0.00043 500 0 0.000753 0.000753 20 0 0.000493 0.00049320 0 0.000540 0.000540 200 0 0.00041 0.00039 500 0 0.000773 0.000773 20 0 0.000567 0.00056720 2 0.000546 0.000473 200 2 0.00066 0.00066 500 0 0.000713 0.000713 20 1 0.000521 0.00048720 1 0.000493 0.000460 200 0 0.00039 0.00036 500 1 0.000950 0.000887 20 2 0.000677 0.00058720 0 0.000413 0.000413 200 0 0.00041 0.00041 500 2 0.000585 0.000507 20 0 0.000613 0.000613100 1 0.000379 0.000353 600 2 0.00042 0.00045 1000 12 0.003300 0.000660 200 0 0.000567 0.000567100 6 0.000611 0.000367 600 0 0.00051 0.00051 1000 3 0.000683 0.000547 200 2 0.000546 0.000473100 5 0.000750 0.000500 600 1 0.00027 0.00027 1000 14 0.000600 0.000040 200 0 0.000480 0.000480100 3 0.000475 0.000380 600 0 0.00051 0.00044 1000 12 0.000867 0.000173 200 0 0.000627 0.000627100 3 0.000508 0.000407 600 1 0.00053 0.00053 1000 13 0.000500 0.000067 200 0 0.000567 0.000567100 6 0.000544 0.000327 600 0 0.00036 0.00036 1000 4 0.000600 0.000440 200 0 0.000713 0.000713200 11 0.000650 0.000173 1200 0 0.00000 0.00000 1500 15 0.000000 0.000000 800 1 0.000357 0.000333200 15 0.000000 0.000000 1200 0 0.00000 0.00000 1500 15 0.000000 0.000000 800 2 0.000485 0.000420200 13 0.000800 0.000107 1200 0 0.00000 0.00000 1500 15 0.000000 0.000000 800 7 0.000450 0.000240200 13 0.000550 0.000073 1200 2 0.00077 0.00015 1500 15 0.000000 0.000000 800 5 0.000630 0.000420200 8 0.000614 0.000287 1200 0 0.00000 0.00000 1500 15 0.000000 0.000000 800 0 0.000560 0.000560200 13 0.001000 0.000133 1200 0 0.00000 0.00000 1500 15 0.000000 0.000000 800 0 0.000473 0.000473500 15 0.000000 0.000000 2000 15 0.00055 0.00036 2000 15 0.000000 0.000000 2000 3 0.000567 0.000453500 15 0.000000 0.000000 2000 15 0.00043 0.00055 2000 15 0.000000 0.000000 2000 0 0.000453 0.000453500 15 0.000000 0.000000 2000 15 0.00162 0.00043 2000 15 0.000000 0.000000 2000 1 0.000493 0.000460500 15 0.000000 0.000000 2000 12 0.00034 0.00141 2000 15 0.000000 0.000000 2000 4 0.000627 0.000460500 15 0.000000 0.000000 2000 15 0.00030 0.00034 2000 15 0.000000 0.000000 2000 3 0.000475 0.000380500 15 0.000000 0.000000 2000 15 0.00040 0.00040 2000 15 0.000000 0.000000 2000 2 0.000485 0.000420
Page 13 of 26

Table S11 Adult mortality, number of juvenile worms >500 µm, number of juvenile worms <500 µm, number of full cocoons, number of empty cocoons, total number of cocoons and total number of juveniles for each replicate in experiments exposing Tubifex tubifex to sediment spiked with SPAs for 28 days.
Experiment
Nominal concentration in sediment(μg/g dw)
Adult mortality
(/4)
Juvenile worms > 500
μm
Juvenile worms < 500
μmFull cocoons Empty
cocoonsTotal
cocoonsTotal
juveniles
DPA Control 0 13 30 13 17 30 43Control 0 12 39 14 31 45 51Control 0 15 39 15 20 35 54Solvent 0 12 46 18 24 42 58Solvent 0 17 68 14 27 41 85Solvent 0 15 30 20 24 44 45
2 0 15 58 19 24 43 732 0 19 57 17 26 43 762 0 13 42 14 22 36 5520 0 13 45 23 23 46 5820 0 16 42 22 25 47 5820 0 18 47 13 24 37 65100 0 3 21 26 12 38 24100 0 4 25 30 17 47 29100 0 3 15 42 6 48 18200 4 0 0 5 9 14 0200 0 6 23 29 13 42 29200 0 0 7 32 11 43 7500 4 0 0 0 0 0 0500 4 0 0 0 0 0 0500 4 0 0 0 0 0 0
Page 14 of 26

Table S11 continued
Experiment
Nominal concentration in sediment(μg/g dw)
Adult mortality
(/4)
Juvenile worms > 500
μm
Juvenile worms < 500
μmFull cocoons Empty
cocoonsTotal
cocoonsTotal
juveniles
PNA Control 0 25 59 18 21 39 84Control 0 16 66 16 19 35 82Control 0 15 48 13 23 36 63Solvent 0 26 76 21 27 48 102Solvent 0 33 60 13 31 44 93Solvent 0 45 80 19 30 49 125
20 0 10 70 15 26 41 8020 0 25 73 15 29 44 9820 0 41 85 20 29 49 126200 0 15 70 14 26 40 85200 0 29 57 17 30 47 86200 0 12 51 20 14 34 63500 0 7 25 16 19 35 32500 0 4 31 17 26 43 35500 0 5 33 18 21 39 381000 0 0 4 19 5 24 41000 0 0 5 19 10 29 51000 0 0 10 20 8 28 102000 4 0 0 0 0 0 02000 4 0 0 0 0 0 02000 4 0 0 0 0 0 0
Page 15 of 26
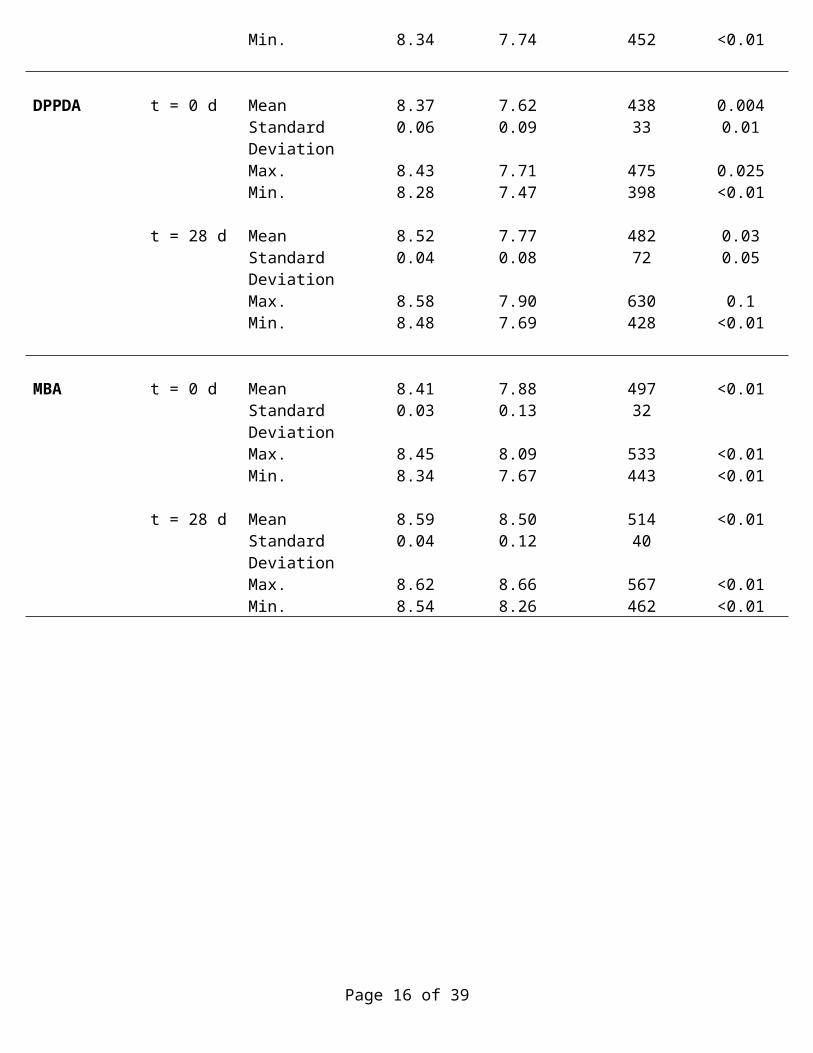
Table S11 continued
Experiment
Nominal concentration in sediment(μg/g dw)
Adult mortality
(/4)
Juvenile worms > 500
μm
Juvenile worms < 500
μmFull cocoons Empty
cocoonsTotal
cocoonsTotal
juveniles
DPPDA Control 0 9 64 16 25 41 73Control 0 25 59 18 35 53 84Control 0 14 59 17 23 40 73Solvent 0 34 55 21 22 43 89Solvent 0 32 68 14 32 46 100Solvent 0 31 62 18 30 48 93
20 0 31 60 17 26 43 9120 0 23 70 19 30 49 9320 0 29 57 10 25 35 86200 0 0 0 25 3 28 0200 0 0 0 29 2 31 0200 0 0 0 28 0 28 0500 0 0 0 2 3 5 0500 1 0 0 1 0 1 0500 1 0 0 2 0 2 01000 4 0 0 0 0 0 01000 4 0 0 0 0 0 01000 4 0 0 0 0 0 02000 4 0 0 0 0 0 02000 4 0 0 0 0 0 02000 4 0 0 0 0 0 0
Page 16 of 26

Table S11 continued
Experiment
Nominal concentration in sediment(μg/g dw)
Adult mortality
(/4)
Juvenile worms > 500
μm
Juvenile worms < 500
μmFull cocoons Empty
cocoonsTotal
cocoonsTotal
juveniles
MBA Control 0 19 59 12 22 34 78Control 0 16 67 21 18 39 83Control 0 10 50 12 27 39 60Solvent 0 16 90 24 30 54 106Solvent 0 48 53 15 26 41 101Solvent 2 23 36 11 23 34 59
50 0 16 56 13 28 41 7250 0 20 75 22 26 48 9550 0 0 32 18 7 25 32200 0 13 58 18 23 41 71200 0 2 36 8 18 26 38200 0 1 21 17 7 24 22500 0 0 8 17 3 20 8500 0 5 4 4 11 15 9500 0 0 0 0 0 0 01000 2 0 3 4 2 6 31000 0 0 3 4 2 6 31000 0 0 0 0 0 0 02000 2 0 0 0 0 0 02000 2 0 0 0 0 0 02000 3 0 0 0 0 0 0
Page 17 of 26

Figure S1 Images of mature Tubifex tubifex used in the current study along with juvenile worm >500 µm in size (A; x10 magnification) and full and empty cocoons (B; x20 magnification).
A
B
Page 18 of 26
Juvenile worm >500 µm
Mature worm
Cocoon

Analysis of toxicity dataRed – data file nameBlue – variable name (top of column)Green – new function file namePurple – R output
R coding for determination of LCx and ECx values in drc
Example data file: snailcloth7
conc mort total0 1 100 2 100 0 100 0 1010 0 1010 0 1010 0 1010 0 1050 0 1050 0 1050 0 1050 0 10100 1 10100 0 10100 0 10100 1 10500 2 10500 1 10500 0 10500 2 101000 1 101000 2 101000 2 101000 4 105000 4 105000 2 105000 5 105000 5 1010000 10 1010000 7 1010000 8 1010000 8 10
Page 19 of 26

Determination of LCx or ECx values
Binomial data
> snailcloth7x<- drm(mort/total~conc, weights=total, data=snailcloth7, fct=LL.4(fixed=c(NA,0,1,NA)), type="binomial")
>summary(snailcloth7x)
Model fitted: Log-logistic (ED50 as parameter) (2 parms)
Parameter estimates:
Estimate Std. Error t-value p-valueb:(Intercept) -0.98601 0.13131 -7.50923 0e:(Intercept) 4000.33138 779.52232 5.13177 0
> ED(snailcloth7x,c(10,25,50),interval="delta")
Estimated effective doses(Delta method-based confidence interval(s))
Estimate Std. Error Lower Upper1:10 430.84 128.36 179.27 682.411:25 1312.82 266.95 789.60 1836.041:50 4000.33 779.52 2472.50 5528.17
Continuous data
> snailcloth28growthx<- drm(growth~conc, data=snailcloth28growth, fct=LL.4(fixed=c(NA,0,NA,NA))
The scale of the data will determine whether a lower or upper limit is set on the model.
Page 20 of 26

Table S12 Mean concentrations of SPAs in exposure solutions used in 96-h water-only tests with Hyalella azteca and percent differences in measured concentration from Day 0 to 4. The number in the brackets is the standard deviation of triplicate samples. Percent differences between nominal concentrations in water and measured concentrations in water at day 0 and percent differences between measured concentrations in water from day 0 to 4.
Mean concentration (µg/L)
SPA Nominal concentration (µg/L) Day 0 Day 4 Percent difference –
nominal vs. measured
Percent difference –day 0 to 4
DPA Control < 0.4 < 0.4 - -Solvent control < 0.4 < 0.4 - -250 223 (11.1) 117 (2.33) 11% 48%500 451 (58.5) 333 (8.94) 10% 26%1000 882 (33.3) 703 (4.07) 12% 20%2000 1690 (12.8) 1320 (33.6) 16% 22%4000 3380 (54.8) 2650 (74.9) 16% 22%
PNA Control < 0.07 < 0.07 - -Solvent control < 0.07 < 0.07 - -80 54.2 (3.02) 46.4 (1.00) 33% 14%160 105 (8.71) 85.6 (3.37) 34% 18%208 135 (10.9) 109 (1.19) 35% 20%260 170 (9.09) 146 (3.04) 35% 14%430 263 (18.8) 227 (5.35) 39% 16%
DPPDA
Control < 0.01 < 0.01 - -
Solvent control < 0.01 < 0.01 - -125 89.4 (6.02) 22.2 (2.49) 29% 75%250 212 (26.5) 43.0 (3.23) 15% 80%500 369 (42.5) 64.8 (3.41) 26% 82%1000 1100 (314) 112 (7.33) 10% 90%2000 1380 (91.8) 141 (9.29) 31% 90%
MBA Control < 0.001 < 0.001 - -Solvent control < 0.001 < 0.001 - -0.005 < 0.001 < 0.001 - -0.05 < 0.001 < 0.001 - -0.5 < 0.001 < 0.001 - -5 1.01 (0.07) 0.21 (0.04) 80% 79%50 22.9 (0.54) 9.28 (0.57) 54% 60%
Page 21 of 26

Table S13 Mean concentrations of SPAs in sediment and overlying water of test vessels at the initiation and conclusion of the 28-day sediment exposures with Hyalella azteca. The number in brackets is the standard deviation of triplicate samples. Percent differences in nominal concentration in sediment and measured concentrations in sediment on day 0, percent differences between measured concentrations in sediment at day 0 and 28, and percent differences between measured concentrations in overlying water on day 0 and 28.
Mean concentration – sediment (µg/g dw) Mean concentration – overlying water (µg/L)
SPANominal
concentration – sediment (µg/g dw)
Day 0 Day 28
Percent difference – nominal vs. measured
Percent difference –day 0 to 28
Day 0 Day 28Percent
difference –day 0 to 28
DPA Control < 0.0003 < 0.0003 - - < 0.4 < 0.4 -Solvent control < 0.0003 < 0.0003 - - < 0.4 < 0.4 -2 1.2 (0.2) 0.2 (0.01) 40% 83% < 0.4 < 0.4 -20 5.8 (1.7) 0.4 (0.2) 71% 93% 5.56 (0.14) < 0.4 100%100 22.9 (2.6) 3.3 (0.9) 77% 86% 40.7 (0.23) < 0.4 100%200 52.1 (5.6) 9.5 (2.4) 74% 82% 78.4 (4.76) < 0.4 100%500 101 (11.3) 16.8 (1.0) 80% 83% 436 (65.33) < 0.4 100%
PNA Control < 0.00005 < 0.00005 - - < 0.07 < 0.07 -Solvent control < 0.00005 < 0.00005 - - < 0.07 < 0.07 -20 0.1 (0.01) 0.08 (0.01) 99% 20% < 0.07 < 0.07 -200 2.8 (0.3) 1.0 (0.4) 99% 64% < 0.07 < 0.07 -600 3.3 (1.0) 1.7 (0.4) 99% 48% < 0.07 < 0.07 -1200 49.2 (7.7) 22.9 (10.5) 96% 53% < 0.07 < 0.07 -2000 268 (22.7) 93.7 (14.2) 87% 65% 10.7 (0.47) 0.83 (0.21) 92%
DPPA
Control < 0.0002 < 0.0002 - - < 0.01 < 0.01 -
Solvent control < 0.0002 < 0.0002 - - < 0.01 < 0.01 -200 23.7 (13.2) 18.9 (2.2) 88% 20% 1.33 (0.08) < 0.01 100%500 80.4 (23.4) 45.3 (16.4) 84% 44% 8.09 (0.15) 4.62 (0.09) 43%1000 176 (54.6) 75.3 (26.9) 82% 57% 16.2 (1.33) 5.07 (0.05) 69%1500 305 (40.3) 221 (16.5) 80% 28% 28.1 (2.45) 7.18 (0.16) 74%2000 487 (55.1) 252 (33.5) 76% 48% 40.0 (1.85) 9.12 (0.09) 77%
MBA Control < 0.0003 < 0.0003 - - < 0.001 < 0.001 -Solvent control < 0.0003 < 0.0003 - - < 0.001 < 0.001 -2 0.3 (0.2) 0.1 (0.06) 85% 67% < 0.001 < 0.001 -20 3.5 (0.6) 0.5 (0.06) 83% 86% < 0.001 < 0.001 -200 135 (39.6) 24.7 (5.8) 33% 82% 0.09 (0.01) < 0.001 100%800 195 (32.8) 48.1 (8.4) 76% 75% 0.20 (0.02) 0.17 (0.02) 15%2000 403 (77.7) 188 (10.6) 80% 53% 1.62 (0.16) 0.42 (0.06) 74%
Page 22 of 26
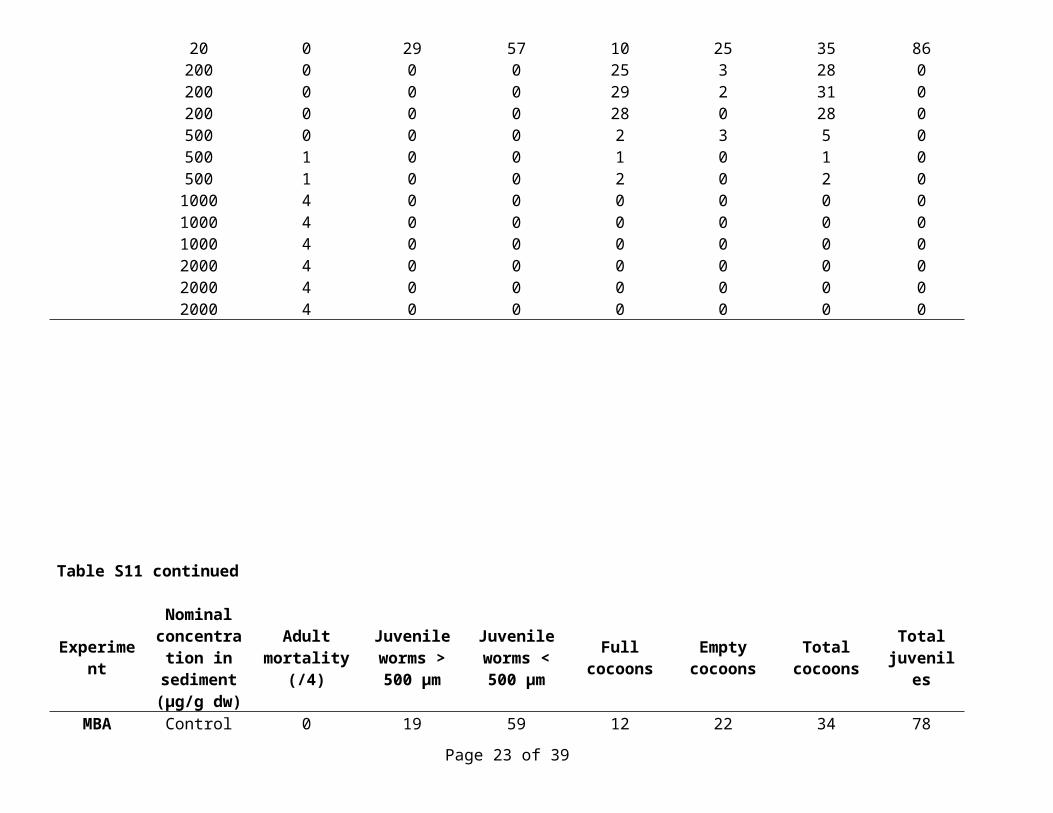
Table S14 Mean concentrations of SPAs in overlying water of test vessels at the initiation and conclusion of 28-day sediment exposures with Tubifex tubifex. The number in brackets is the standard deviation of triplicate samples. Percent differences in nominal concentrations in sediment and measured concentrations in sediment on day 0, percent differences between measured concentrations in sediment at day 0 and 28, and percent differences between measured concentrations in overlying water on day 0 and 28.
Mean concentration – sediment (g/g dw) Mean concentration – overlying water (µg/L)
SPANominal
concentration – sediment (µg/g dw)
Day 0 Day 28
Percent difference – nominal vs. measured
Percent difference –day 0 to 28
Day 0 Day 28Percent
difference –day 0 to 28
DPA Control < 0.0003 < 0.0003 - - < 0.4 < 0.4 -Solvent control < 0.0003 < 0.0003 - - < 0.4 < 0.4 -2 2.3 (1.2) 1.8 (0.4) 15% 22% < 0.4 < 0.4 -20 4.4 (0.06) 2.8 (0.4) 78% 36% 10.6 (0.70) < 0.4 100%100 20.1 (3.2) 7.6 (0.4) 80% 62% 54.8 (0.79) < 0.4 100%200 33.0 (16.7) 11.2 (0.2) 84% 66% 185.5 (2.29) < 0.4 100%500 70.0 (8.6) 25.4 (1.7) 86% 64% 470.8 (7.8) < 0.4 100%
PNA Control < 0.00005 < 0.00005 - - < 0.07 < 0.07 -Solvent control < 0.00005 < 0.00005 - - < 0.07 < 0.07 -20 1.1 (0.08) 0.6 (0.2) 95% 45% < 0.07 < 0.07 -200 5.5 (0.3) 2.1 (0.5) 97% 62% < 0.07 < 0.07 -500 21.7 (3.0) 12.2 (2.9) 96% 44% < 0.07 < 0.07 -1000 53.0 (4.1) 30.1 (5.2) 95% 43% 2.86 (0.07) < 0.07 100%2000 164 (11.1) 59.3 92% 64% 6.75 (1.34) 5.00 (0.65) 26%
DPPA Control < 0.0002 < 0.0002 - - < 0.01 < 0.01 -
Solvent control < 0.0002 < 0.0002 - - < 0.01 < 0.01 -20 0.6 (0.1) 0.3 (0.2) 97% 50% < 0.01 < 0.01 -200 22.5 (8.7) 13.0 (4.9) 89% 42% 0.45 (0.02) < 0.01 100%500 64.3 (41.5) 21.8 (2.2) 87% 66% 3.71 (0.04) 0.18 (0.01) 95%1000 81.9 (15.3) 58.4 (34.3) 92% 29% 5.42 (0.05) 0.49 (0.02) 91%2000 278 (28.7) 79.6 (10.8) 86% 71% 17.8 (0.01) 1.45 (0.08) 92%
MBA Control < 0.0003 < 0.0003 - - < 0.001 < 0.001 -Solvent control < 0.0003 < 0.0003 - - < 0.001 < 0.001 -50 2.7 (0.6) 1.5 (0.3) 95% 44% < 0.001 < 0.001 -200 21.3 (5.8) 10.8 (2.9) 89% 49% 0.10 (0.01) 0.07 (0.01) 30%500 52.7 (5.1) 44.0 (12.1) 89% 17% 0.13 (0.02) 0.07 (0.01) 46%1000 278 (73.1) 74.7 (49.4) 72% 73% 1.42 (0.13) 0.08 (0.01) 94%2000 810 (71.1) 185 (78.8) 59% 77% 3.41 (1.25) 0.91 (0.02) 73%
Page 23 of 26
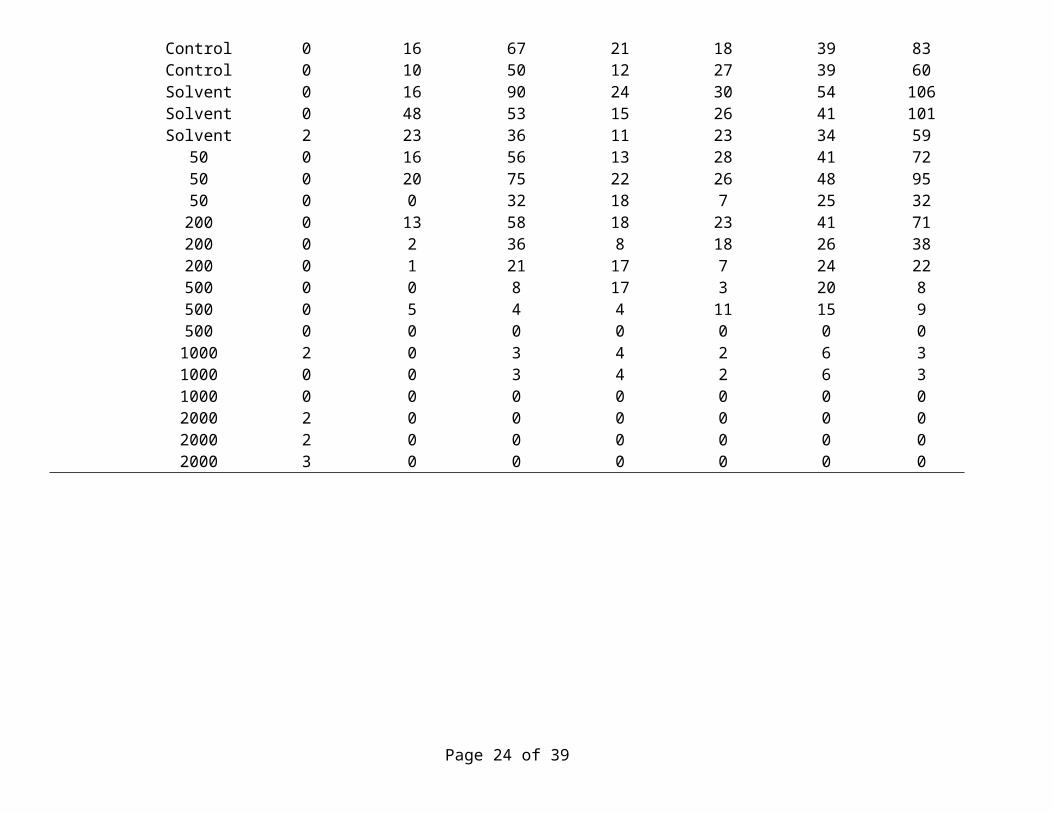
Table S15 Measured concentrations of substituted phenylamine antioxidants (SPA) at the conclusion of the test in water causing 10, 25, or 50% mortality in Hyalella azteca in 96-h water-only tests and associated 95% confidence intervals. The number in brackets is the standard error for each LC.
SPA LC10 (µg/L) 95% CI LC25 (µg/L) 95% CI LC50 (µg/L) 95% CI
DPA 491 (80) 335 – 647 745 (84) 580 – 911 1132 (107) 921 - 1342
PNA 66 (5) 56 – 77 77 (4) 68 – 85 89 (4) 82 – 96
DPPDA 26 (3) 21 – 31 35 (3) 30 – 40 48 (3) 42 – 53
MBA > 9 - > 9 - > 9 -
Page 24 of 26
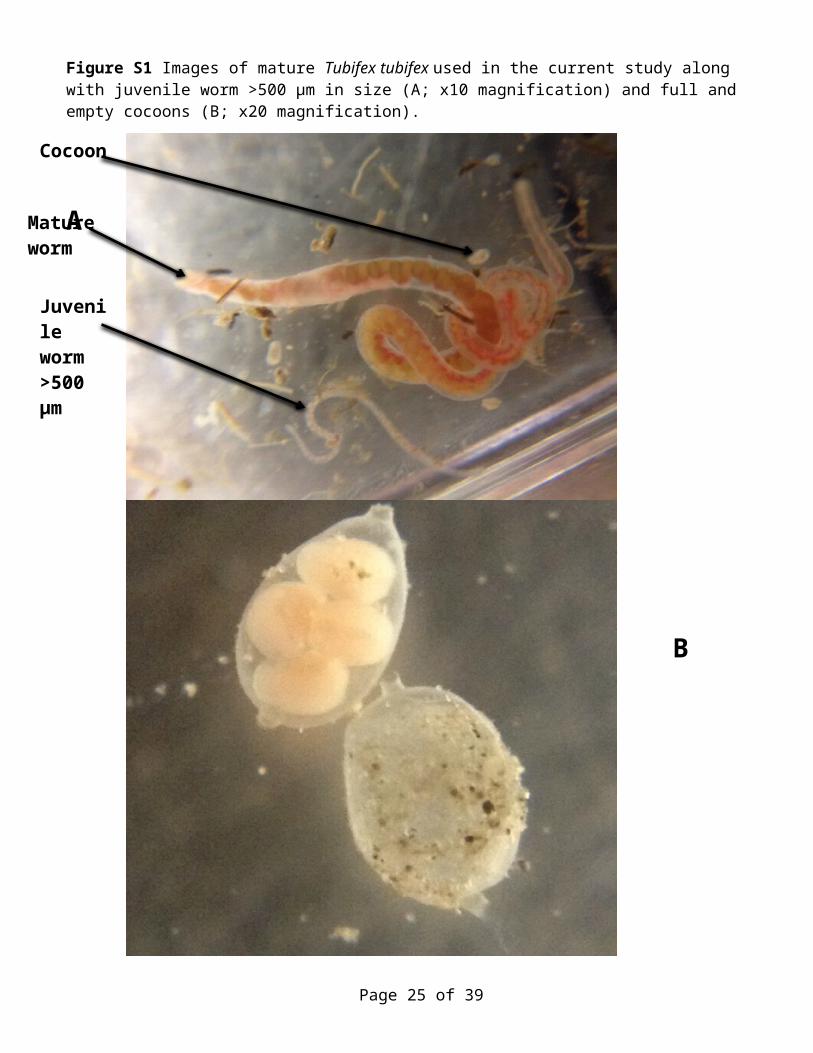
Table S16 Measured concentrations of substituted phenylamine antioxidants (SPA) in overlying water and sediment at the conclusion of the test causing 10, 25, and 50% mortality or reduction in growth or production of biomass and associated 95% confidence intervals for Hyalella azteca in 28-day sediment tests. The number in brackets is the standard error for each LC/EC.
SPA Matrix Endpoint LC/EC10 95% CI LC/EC25 95% CI LC/EC50 95% CI
DPA Overlying water (µg/L) β Mortality - - - - < 0.4 -Growth - - - - < 0.4 -
Production of biomass - - - - < 0.4 -Sediment (µg/g dw) Mortality 1.2 (0.2) 0.8 – 1.5 2.2 (0.3) 1.7 – 2.7 4.1 (0.4) 3.4 – 4.9
Growth α 12 (7) -1 – 26 13 (7) -0.2 – 26 13 (6) 0.6 – 27Production of biomass 3 (0.6) 1 – 4 4 (0.7) 2 – 5 6 (0.8) 4 – 7
PNA Overlying water (µg/L) β Mortality - - - - < 0.83 -Growth - - - - < 0.83 -
Production of biomass - - - - < 0.83 -Sediment (µg/g dw) Mortality 5 (1) 3 – 7 14 (2) 9 – 19 40 (6) 29 – 52
Growth α 2 (3) -4 – 7 4 (5) -6 – 14 9 (9) -8 – 27Production of biomass 0.0003 (NA) NA 0.0004 (NA) NA 0.0006 (NA) NA
DPPDA Overlying water (µg/L) Mortality 5 (0.05) 5 – 5 5 (0.03) 5 – 5 5 (0.02) 5 – 5
Growth 5 (0.09) 5 – 5 5 (0.2) 5 – 6 5 (0.4) 4 – 6Production of biomass 5 (0.3) 4 – 6 5 (0.1) 5 – 5 5 (0.02) 5 – 5
Sediment (µg/g dw) Mortality 37 (3) 32 – 43 50 (3) 45 – 55 67 (3) 62 – 73Growth α 74 (7) 59 – 89 79 (18) 43 – 116 85 (45) -5 - 176
Production of biomass 66 (24) 17 – 116 71 (13) 44 – 97 75 (2) 72 – 79
MBA Overlying water (µg/L) γ Mortality - - - - > 0.42 -Growth - - - - > 0.42 -
Production of biomass - - - - > 0.42 -Sediment (µg/g dw) γ Mortality - - - - > 188 -
Growth - - - - > 188Production of biomass - - - - > 188
: 95% confidence interval included zero: Unable to calculate LC/ECs because of concentrations of PNA in overlying water were < MDL in all treatments except the highest concentration tested and the effect at the highest concentration tested was > 50%: LC/ECs could not be calculated and LC/EC50s were greater than the concentration of MBA in the overlying water and sediment in the treatment with the highest concentration of MBA due to 50% mortality or 50% reduction in production of biomass not being observed in this treatment.NA: drc package not able to estimate standard error or 95% confidence interval due to relatively high variability in the data
Page 25 of 26

Table S16 Measured concentrations of substituted phenylamine antioxidants (SPA) in sediment at the conclusion of the test causing 10, 25, and 50% mortality in adult Tubifex tubifex and 10, 25, and 50% reduction in production of juvenile worms >500 µm, juvenile worms >500 µm, full cocoons, empty cocoons, total cocoons or total juveniles and associated 95% confidence interval for 28-day sediment tests. The number in brackets is the standard error for each EC.
SPA Endpoint LC/EC10
(µg/g dw) 95% CI LC/EC25
(µg/g dw) 95% CI LC/EC50
(µg/g dw) 95% CI
DPA Adult mortality 11 (3) 4 – 17 11 (1) 9 – 13 12 (2) 8 – 15Juvenile worms >500 µm 4 (1) 2 – 6 5 (1) 3 – 7 6 (1) 5 – 8Juvenile worms <500 µm 4 (1) 1 – 7 5 (1) 3 – 8 7 (1) 5 – 9
Total juveniles α 29 (16) -4 – 63 50 (18) 12 – 88 86 (19) 46 – 125Full cocoons α 15 (19) - 25 – 56 17 (20) -25 – 59 18 (22) -27 – 63
Empty cocoons 3 (1) 1 – 6 5 (1) 3 – 8 9 (1) 6 – 11Total cocoons 11 (2) 6 – 16 11 (1) 10 – 13 12 (4) 3 – 21
PNA Adult mortality α 40 (142) -239 – 319 41 (145) -243 – 325 42 (148) -248 – 332Juvenile worms >500 µm α 1 (1) -1 – 3 2 (1) -1 – 5 4 (2) -1 – 9Juvenile worms <500 µm α 3 (2) -1 – 7 6 (2) 1 – 10 10 (2) 5 – 15
Total juveniles α 2 (1) -1 – 5 4 (2) 0.1 – 8 8 (2) 3 – 13Full cocoons α 40 (15) 8 – 72 43 (15) 11 – 75 45 (16) 12 – 79
Empty cocoons 11 (4) 3 – 20 16 (4) 8 – 24 23 (4) 15 – 30Total cocoons α 25 (14) -4 – 54 29 (5) 18 – 39 32 (7) 18 – 47
DPPDA Adult mortality 21 (4) 13 – 29 22 (4) 15 – 30 24 (12) -0.2 – 48Juvenile worms >500 µm α 2 (94) -195 – 199 2 (119) -248 – 253 2 (151) -316 – 321Juvenile worms <500 µm α 1 (138) -289 – 291 2 (172) -360 – 363 2 (214) -448 – 451
Total juveniles α 2 (112) -235 – 238 2 (140) -293 – 296 2 (174) -363 – 367Full cocoons 18 (7) 3 – 33 19 (6) 7 – 31 20 (4) 11 – 29
Empty cocoons α 1 (1) -1 – 2 1 (1) -1 – 4 2 (2) -2 – 7Total cocoons 10 (1) 7 – 11 12 (1) 11 – 13 14 (1) 13 – 15
MBA Adult mortality 70 (19) 33 – 107 106 (20) 67 – 144 159 (30) 100 – 217Juvenile worms >500 µm α 0.1 (0.3) -0.6 – 0.8 0.5 (0.9) -1.3 – 2.3 2 (2) -2 – 6Juvenile worms <500 µm α 5 (3) - 2- 12 9 (3) 2 – 16 15 (4) 6 – 23
Total juveniles α 3 (4) -5 – 11 6 (5) -5 – 16 12 (5) 1 – 22Full cocoons α 12 (13) -16 – 40 21 (15) -11 – 53 36 (15) 4 – 68
Empty cocoons α 4 (4) -4 – 12 8 (5) -2 – 19 17 (7) 3 – 31Total cocoons α 6 (4) -1 – 13 12 (5) 2 – 22 23 (7) 10 – 37
: 95% confidence interval(s) included zero
Page 26 of 26
Related Documents