Supplementary Material SUPPLEMENTARY TABLES Supplementary Table 1. Official Global, N America & Europe Recommendation on Supplements for CVD & Cancer (2004-2016) Supplementary Table 2. Search Strategy for vitamin and mineral supplements for cardiovascular diseases & all-cause mortality Supplementary Table 3. Characteristics of included RCT studies for CVD and all-cause mortality Supplementary Table 4. GRADE assessment for vitamin D Supplementary Table 5. GRADE assessment for vitamin A Supplementary Table 6. GRADE assessment for beta-carotene Supplementary Table 7. GRADE assessment for antioxidants Supplementary Table 8. GRADE assessment for vitamin E Supplementary Table 9. GRADE assessment for vitamin C Supplementary Table 10. GRADE assessment for selenium Supplementary Table 11. GRADE assessment for vitamin B-complex Supplementary Table 12. GRADE assessment for folic acid Supplementary Table 13. GRADE assessment for niacin (B3) Supplementary Table 14. GRADE assessment for vitamin B6 Supplementary Table 15. GRADE assessment for calcium Supplementary Table 16. GRADE assessment for iron Supplementary Table 17. GRADE assessment for multivitamin Supplementary Table 18. GRADE assessment for calcium and vitamin D Supplementary Table 19. Summary of the meta-analayses results for all-cause mortality, CVD mortality, total CVD risk and other significant assocations SUPPLEMENTARY FIGURES Supplementary Figure 1. Consort statement Supplementary Figure 2. Risk of bias graph for supplements and CVD and total mortality. 1

Welcome message from author
This document is posted to help you gain knowledge. Please leave a comment to let me know what you think about it! Share it to your friends and learn new things together.
Transcript
Supplementary Material
SUPPLEMENTARY TABLES Supplementary Table 1. Official Global, N America & Europe Recommendation on Supplements for CVD & Cancer (2004-2016) Supplementary Table 2. Search Strategy for vitamin and mineral supplements for cardiovascular diseases & all-cause mortalitySupplementary Table 3. Characteristics of included RCT studies for CVD and all-cause mortalitySupplementary Table 4. GRADE assessment for vitamin DSupplementary Table 5. GRADE assessment for vitamin ASupplementary Table 6. GRADE assessment for beta-caroteneSupplementary Table 7. GRADE assessment for antioxidantsSupplementary Table 8. GRADE assessment for vitamin ESupplementary Table 9. GRADE assessment for vitamin CSupplementary Table 10. GRADE assessment for seleniumSupplementary Table 11. GRADE assessment for vitamin B-complexSupplementary Table 12. GRADE assessment for folic acidSupplementary Table 13. GRADE assessment for niacin (B3)Supplementary Table 14. GRADE assessment for vitamin B6Supplementary Table 15. GRADE assessment for calciumSupplementary Table 16. GRADE assessment for ironSupplementary Table 17. GRADE assessment for multivitaminSupplementary Table 18. GRADE assessment for calcium and vitamin DSupplementary Table 19. Summary of the meta-analayses results for all-cause mortality, CVD mortality, total CVD risk and other significant assocations
SUPPLEMENTARY FIGURES Supplementary Figure 1. Consort statementSupplementary Figure 2. Risk of bias graph for supplements and CVD and total mortality.Supplementary Figure 3. Summary of the pooled effect estimates of RCTs assessing the relationship between vitamin D supplementation and CVD and all cause mortality risk.Supplementary Figure 4. Forest plot of vitamin D supplementation and total CVD risk.Supplementary Figure 5. Forest plot of vitamin D supplementation and total CHD riskSupplementary Figure 6. Forest plot of vitamin D supplementation and MI risk.Supplementary Figure 7. Forest plot of vitamin D supplementation and stroke risk.Supplementary Figure 8. Forest plot of vitamin D supplementation and CVD mortality risk.Supplementary Figure 9. Forest plot of vitamin D supplementation and CHD mortality risk.Supplementary Figure 10. Forest plot of vitamin D supplementation and MI mortality risk. Supplementary Figure 11. Forest plot of vitamin D supplementation and stroke mortality risk.
1

Supplementary Figure 12. Forest plot of vitamin D supplementation and all-cause mortality risk.Supplementary Figure 13. Funnel plot of vitamin D supplementation and CVD and all-cause mortality risk.Supplementary Figure 14. Summary of the pooled effect estimates of RCTs assessing the relationship between vitamin A supplementation and CVD and all cause mortality risk.Supplementary Figure 15. Forest plot of vitamin A supplementation and all-cause mortality risk.Supplementary Figure 16. Summary of the pooled effect estimates of RCTs assessing the relationship between beta-carotene supplementation and CVD and all cause mortality risk.Supplementary Figure 17. Forest plot of beta-carotene supplementation and total CVD risk.Supplementary Figure 18. Forest plot of beta-carotene supplementation and total CHD risk.Supplementary Figure 19. Forest plot of beta-carotene supplementation and MI risk.Supplementary Figure 20. Forest plot of beta-carotene supplementation and stroke risk.Supplementary Figure 21. Forest plot of beta-carotene supplementation and CVD mortality risk.Supplementary Figure 22. Forest plot of beta-carotene supplementation and CHD mortality risk.Supplementary Figure 23. Forest plot of beta-carotene supplementation and MI mortality risk.Supplementary Figure 24. Forest plot of beta-carotene supplementation and stroke mortality risk.Supplementary Figure 25. Forest plot of beta-carotene supplementation and all-cause mortality risk.Supplementary Figure 26. Summary of the pooled effect estimates of RCTs assessing the relationship between antioxidants supplementation and CVD and all cause mortality risk.Supplementary Figure 27. Forest plot of antioxidants supplementation and total CVD risk.Supplementary Figure 28. Forest plot of antioxidants supplementation and total CHD risk.Supplementary Figure 29. Forest plot of antioxidants supplementation and MI risk.Supplementary Figure 30. Forest plot of antioxidants supplementation and stroke risk.Supplementary Figure 31. Forest plot of antioxidants supplementation and CVD mortality risk.Supplementary Figure 32. Forest plot of antioxidants supplementation and CHD mortality risk.Supplementary Figure 33. Forest plot of antioxidants supplementation and MI mortality risk. Supplementary Figure 34. Forest plot of antioxidants supplementation and stroke mortality risk.Supplementary Figure 35. Forest plot of antioxidants supplementation and all-cause mortality risk.Supplementary Figure 36. Funnel plot of antioxidants supplementation and all-cause mortality risk.Supplementary Figure 37. Summary of the pooled effect estimates of RCTs assessing the relationship between vitamin E supplementation and CVD and all cause mortality risk.Supplementary Figure 38. Forest plot of vitamin E supplementation and total CVD risk.
2

Supplementary Figure 39. Forest plot of vitamin E supplementation and total CHD risk.Supplementary Figure 40. Forest plot of vitamin E supplementation and MI risk.Supplementary Figure 41. Forest plot of vitamin E supplementation and stroke risk.Supplementary Figure 42. Forest plot of vitamin E supplementation and CVD mortality risk.Supplementary Figure 43. Forest plot of vitamin E supplementation and CHD mortality risk.Supplementary Figure 44. Forest plot of vitamin E supplementation and MI mortality risk.Supplementary Figure 45. Forest plot of vitamin E supplementation and stroke mortality risk.Supplementary Figure 46. Forest plot of vitamin E supplementation and all-cause mortality risk.Supplementary Figure 47. Funnel plot of vitamin E supplementation and CVD and all-cause mortality risk.Supplementary Figure 48. Summary of the pooled effect estimates of RCTs assessing the relationship between vitamin C supplementation and CVD and all cause mortality risk.Supplementary Figure 49. Forest plot of vitamin C supplementation and total CVD risk.Supplementary Figure 50. Forest plot of vitamin C supplementation and total CHD risk.Supplementary Figure 51. Forest plot of vitamin C supplementation and MI risk.Supplementary Figure 52. Forest plot of vitamin C supplementation and stroke risk.Supplementary Figure 53. Forest plot of vitamin C supplementation and CVD mortality risk.Supplementary Figure 54. Forest plot of vitamin C supplementation and MI mortality risk.Supplementary Figure 55. Forest plot of vitamin C supplementation and stroke mortality risk.Supplementary Figure 56. Forest plot of vitamin C supplementation and all-cause mortality risk.Supplementary Figure 57. Summary of the pooled effect estimates of RCTs assessing the relationship between selenium supplementation and CVD and all cause mortality risk.Supplementary Figure 58. Forest plot of selenium supplementation and total CVD risk.Supplementary Figure 59. Forest plot of selenium supplementation and total CHD risk.Supplementary Figure 60. Forest plot of selenium supplementation and MI risk.Supplementary Figure 61. Forest plot of selenium supplementation and stroke risk.Supplementary Figure 62. Forest plot of selenium supplementation and CVD mortality risk.Supplementary Figure 63. Forest plot of selenium supplementation and MI mortality risk.Supplementary Figure 64. Forest plot of selenium supplementation and stroke mortality risk.Supplementary Figure 65. Forest plot of selenium supplementation and all-cause mortality risk.Supplementary Figure 66. Summary of the pooled effect estimates of RCTs assessing the relationship between vitamin B complex supplementation and CVD and all cause mortality risk.Supplementary Figure 67. Forest plot of vitamin B complex supplementation and total CVD risk.Supplementary Figure 68. Forest plot of vitamin B complex supplementation and total CHD risk.Supplementary Figure 69. Forest plot of vitamin B complex supplementation and MI risk.Supplementary Figure 70. Forest plot of vitamin B complex supplementation and stroke risk.Supplementary Figure 71. Forest plot of vitamin B complex supplementation and CVD mortality risk.
3

Supplementary Figure 72. Forest plot of vitamin B complex supplementation and CHD mortality risk.Supplementary Figure 73. Forest plot of vitamin B complex supplementation and MI mortality risk.Supplementary Figure 74. Forest plot of vitamin B complex supplementation and stroke mortality risk.Supplementary Figure 75. Forest plot of vitamin B complex supplementation and all-cause mortality risk.Supplementary Figure 76. Funnel plot of vitamin B complex supplementation and CVD risk and all-cause mortality risk.Supplementary Figure 77. Summary of the pooled effect estimates of RCTs assessing the relationship between folic acid supplementation and CVD and all cause mortality risk.Supplementary Figure 78. Forest plot of folic acid supplementation and total CVD risk.Supplementary Figure 79. Forest plot of folic acid supplementation and total CHD risk.Supplementary Figure 80. Forest plot of folic acid supplementation and MI risk.Supplementary Figure 81. Forest plot of folic acid supplementation and stroke risk.Supplementary Figure 82. Forest plot of folic acid supplementation and CVD mortality risk.Supplementary Figure 83. Forest plot of folic acid supplementation and MI mortality risk.Supplementary Figure 84. Forest plot of folic acid supplementation and stroke mortality risk.Supplementary Figure 85. Forest plot of folic acid supplementation and all-cause mortality risk.Supplementary Figure 86. Funnel plot of folic acid supplementation and all-cause mortality risk.Supplementary Figure 87. Summary of the pooled effect estimates of RCTs assessing the relationship between niacin (B3) supplementation and CVD and all cause mortality risk.Supplementary Figure 88. Forest plot of niacin (B3) supplementation and total CVD risk.Supplementary Figure 89. Forest plot of niacin (B3) supplementation and total CHD risk.Supplementary Figure 90. Forest plot of niacin (B3) supplementation and MI risk.Supplementary Figure 91. Forest plot of niacin (B3) supplementation and stroke risk.Supplementary Figure 92. Forest plot of niacin (B3) supplementation and CVD mortality risk.Supplementary Figure 93. Forest plot of niacin (B3) supplementation and CHD mortality risk.Supplementary Figure 94. Forest plot of niacin (B3) supplementation and all-cause mortality risk.Supplementary Figure 95. Summary of the pooled effect estimates of RCTs assessing the relationship between vitamin B6 supplementation and CVD and all cause mortality risk.Supplementary Figure 96. Forest plot of vitamin B6 supplementation and total CVD risk.Supplementary Figure 97. Forest plot of vitamin B6 supplementation and MI risk.Supplementary Figure 98. Forest plot of vitamin B6 supplementation and stroke risk.Supplementary Figure 99. Forest plot of vitamin B6 supplementation and MI mortality risk.Supplementary Figure 100. Forest plot of vitamin B6 supplementation and all-cause mortality risk.Supplementary Figure 101. Summary of the pooled effect estimates of RCTs assessing the relationship between calcium supplementation and CVD and all cause mortality risk.Supplementary Figure 102. Forest plot of calcium supplementation and total CVD risk.Supplementary Figure 103. Forest plot of calcium supplementation and total CHD risk.
4
Supplementary Figure 104. Forest plot of calcium supplementation and MI risk.Supplementary Figure 105. Forest plot of calcium supplementation and stroke risk.Supplementary Figure 106. Forest plot of calcium supplementation and CVD mortality risk.Supplementary Figure 107. Forest plot of calcium supplementation and MI mortality risk.Supplementary Figure 108. Forest plot of calcium supplementation and stroke mortality risk.Supplementary Figure 109. Forest plot of calcium supplementation and all-cause mortality risk.Supplementary Figure 110. Summary of the pooled effect estimates of RCTs assessing the relationship between iron supplementation and CVD and all cause mortality risk.Supplementary Figure 111. Forest plot of iron supplementation and total CVD risk.Supplementary Figure 112. Forest plot of iron supplementation and MI risk.Supplementary Figure 113. Forest plot of iron supplementation and CVD mortality risk.Supplementary Figure 114. Forest plot of iron supplementation and all-cause mortality risk.Supplementary Figure 115. Summary of the pooled effect estimates of RCTs studies assessing the relationship between multivitamins supplementation and CVD and all cause mortality risk.Supplementary Figure 116. Forest plot of multivitamins supplementation and total CVD risk.Supplementary Figure 117. Forest plot of multivitamins supplementation and MI risk.Supplementary Figure 118. Forest plot of multivitamins supplementation and stroke risk.Supplementary Figure 119. Forest plot of multivitamins supplementation and CVD mortality risk.Supplementary Figure 120. Forest plot of multivitamins supplementation and MI mortality risk.Supplementary Figure 121. Forest plot of multivitamins supplementation and stroke mortality risk.Supplementary Figure 122. Forest plot of multivitamins supplementation and all-cause mortality risk.Supplementary Figure 123. Funnel plot of multivitamin supplementation and all-cause mortality risk.Supplementary Figure 124. Summary of the pooled effect estimates of RCTs assessing the relationship between calcium and vitamin D supplementation and CVD and all cause mortality risk.Supplementary Figure 125. Forest plot of calcium and vitamin D supplementation and total CVD risk.Supplementary Figure 126. Forest plot of calcium and vitamin D supplementation and total CHD risk.Supplementary Figure 127. Forest plot of calcium and vitamin D supplementation and MI risk.Supplementary Figure 128. Forest plot of calcium and vitamin D supplementation and stroke risk.Supplementary Figure 129. Forest plot of calcium and vitamin D supplementation and CVD mortality risk.Supplementary Figure 130. Forest plot of calcium and vitamin D supplementation and CHD mortality risk.
5

Supplementary Figure 131. Forest plot of calcium and vitamin D supplementation and MI mortality risk.Supplementary Figure 132. Forest plot of calcium and vitamin D supplementation and stroke mortality risk.Supplementary Figure 133. Forest plot of calcium and vitamin D supplementation and all-cause mortality risk.Supplementary Figure 134. Funnel plot of vitamin D & calcium supplementation and all-cause mortality risk.
6

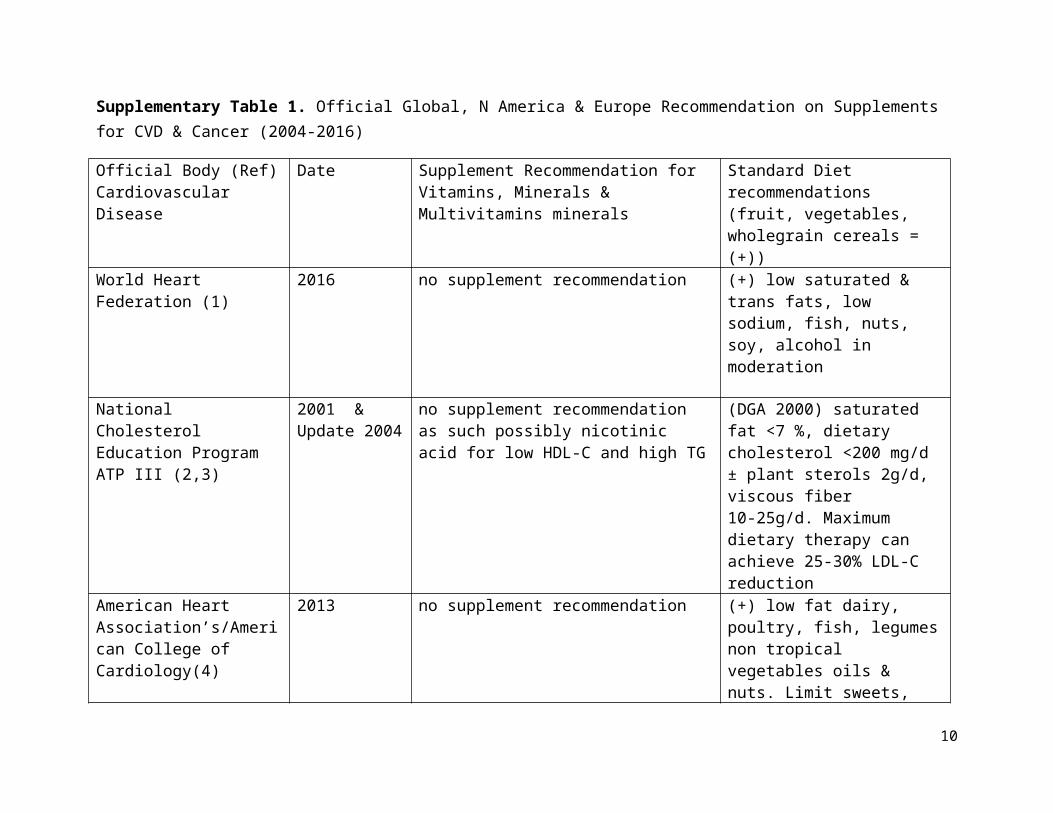
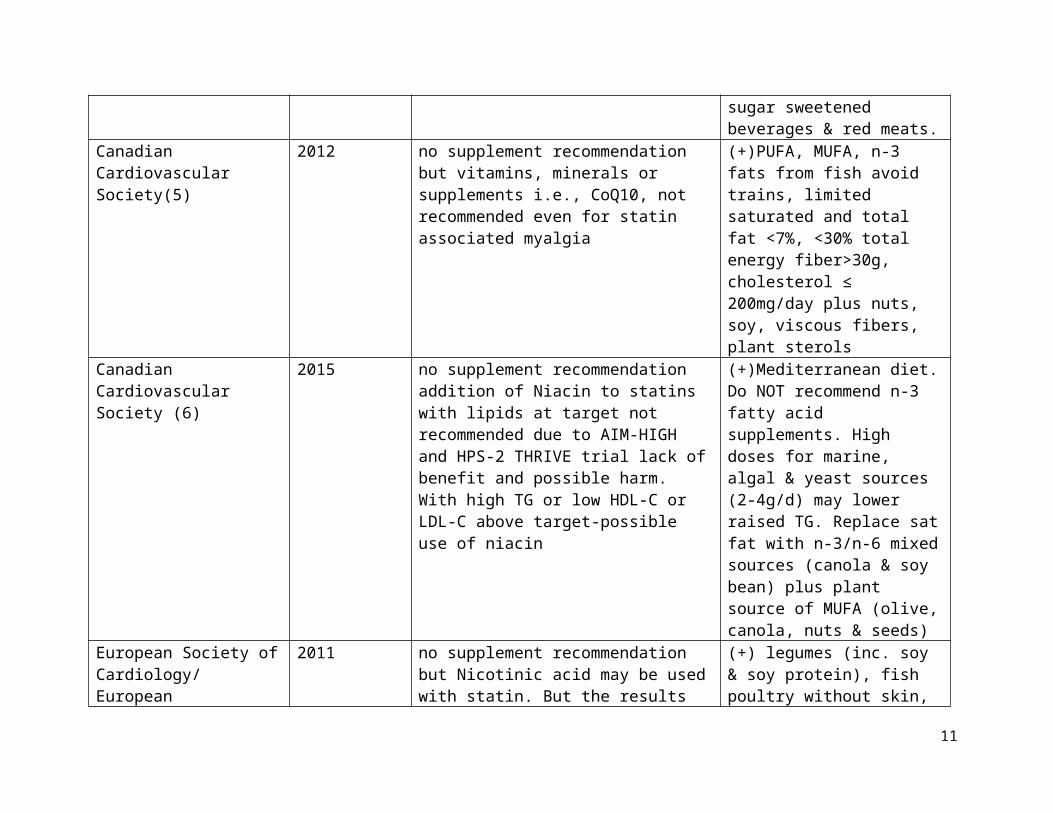
Supplementary Table 1. Official Global, N America & Europe Recommendation on Supplements for CVD & Cancer (2004-2016)
Official Body (Ref) Cardiovascular Disease
Date Supplement Recommendation for Vitamins, Minerals & Multivitamins minerals
Standard Diet recommendations (fruit, vegetables, wholegrain cereals = (+))
World Heart Federation (1) 2016 no supplement recommendation (+) low saturated & trans fats, low sodium, fish, nuts, soy, alcohol in moderation
National Cholesterol Education Program ATP III (2,3)
2001 & Update 2004
no supplement recommendation as such possibly nicotinic acid for low HDL-C and high TG
(DGA 2000) saturated fat <7 %, dietary cholesterol <200 mg/d ± plant sterols 2g/d, viscous fiber 10-25g/d. Maximum dietary therapy can achieve 25-30% LDL-C reduction
American Heart Association’s/American College of Cardiology(4)
2013 no supplement recommendation (+) low fat dairy, poultry, fish, legumes non tropical vegetables oils & nuts. Limit sweets, sugar sweetened beverages & red meats.
Canadian Cardiovascular Society(5)
2012 no supplement recommendation but vitamins, minerals or supplements i.e., CoQ10, not recommended even for statin associated myalgia
(+)PUFA, MUFA, n-3 fats from fish avoid trains, limited saturated and total fat <7%, <30% total energy fiber>30g, cholesterol ≤ 200mg/day plus nuts, soy, viscous fibers, plant sterols
Canadian Cardiovascular Society (6)
2015 no supplement recommendation addition of Niacin to statins with lipids at target not recommended due to AIM-HIGH and HPS-2 THRIVE trial lack of benefit and possible harm. With high TG or low HDL-C or LDL-C above target-possible use of niacin
(+)Mediterranean diet. Do NOT recommend n-3 fatty acid supplements. High doses for marine, algal & yeast sources (2-4g/d) may lower raised TG. Replace sat fat with n-3/n-6
7
mixed sources (canola & soy bean) plus plant source of MUFA (olive, canola, nuts & seeds)
European Society of Cardiology/ European Atherosclerosis Society(7)
2011 no supplement recommendation but Nicotinic acid may be used with statin. But the results of HPS-2 THRIVE and AIM-HIGH trials are awaited
(+) legumes (inc. soy & soy protein), fish poultry without skin, skimmed milk. Moderation in refined cereals, processed fruit (dried, jams, canned etc) red meat, seafood, nuts. But “nutraceuticals” (phytosterols, soy protein, viscous fibers, n-3 fatty acids, polycosanols & red yeast rice) can be used as alternatives or in addition to lipid lowering drugs
European Atherosclerosis Society (Statin associated Muscle Symptoms -SAMS consensus statement)(8)
2015 Supplements Not Recommended. Niacin lowers LDL-C by 15-20% but recent large RCTs showed significant adverse events and no CVD benefit when added to statin.Co-Q10 and Vitamin D failed to reduce SAMS. Therefore not advised.Red Yeast Rice 20-30% LDL-C reduction. Need longer term studies
(+)(as in 2011 assumed since no diet details given) Low saturated fat & Avoid trans-fat plus incorporate a portfolio of plant sterol, soy protein , viscous fibers and nuts, appropriate for SAMS alone or with statin or non-statin drug therapy
British Heart Foundation- Health Eating(9)
N/A No supplement Recommendation (+) plus some dairy products, some meat, fish, eggs, beans and non-dairy product small amount of drinks high in fat or sugar, replace saturated fats mono & poly saturated fats
CVD & CancerUS Preventive Services Task Force (10)
2003 revised 2014
No Supplement Recommendation. Too little evidence on harms versus benefits. Except Recommendation AGAINST β-Carotene & vitamin E supplementation, increased cancer
(+) (Endorse dietary guidelines of 2010) plus Fat free and low fat dairy & seafood.
8

risks in smokers with β-Carotene and possible hemorrhagic stroke with vitamin E
CancerWorld Cancer Research Fund International(11)
N/A Supplements not recommended. Do not rely on supplements for Cancer prevention.Meet nutritional needs through diet alone (special situations, e.g., illness, supplements may be of value)
(+) (fruit and non-starchy (colored) vegetables 600g/d plus unprocessed cereals ≥ 25g fiber/d) pulses (legumes) with every meal
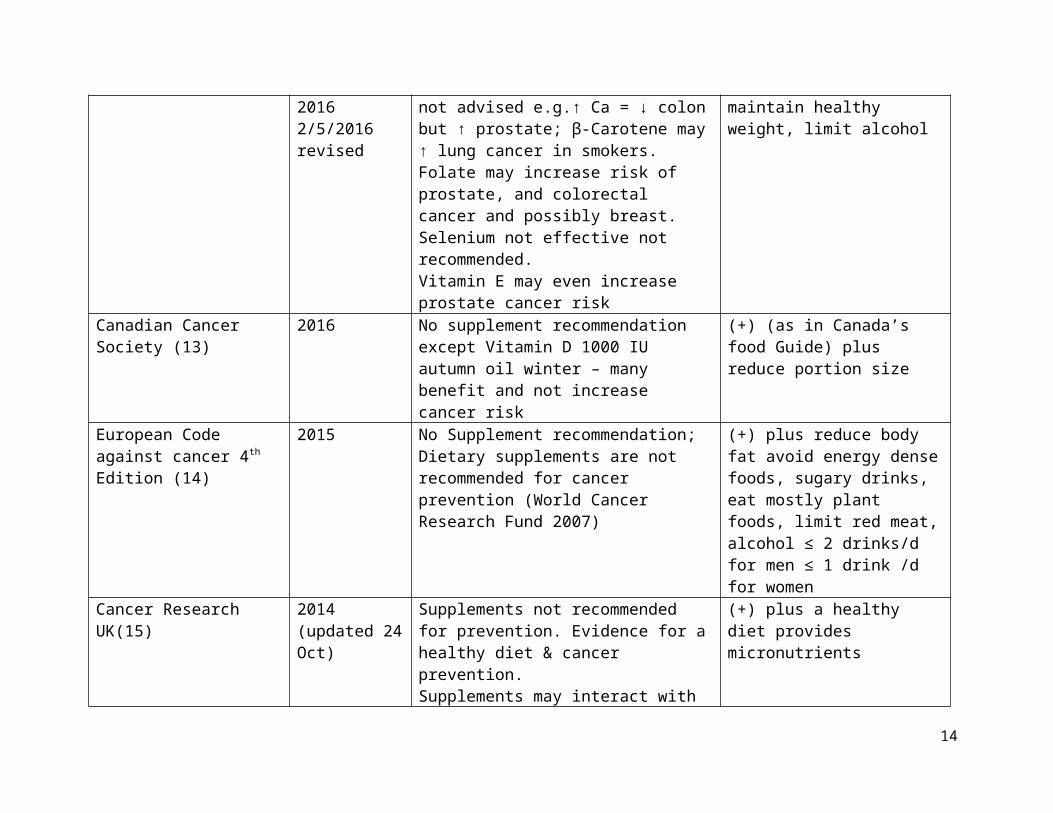
American Cancer Society (12)
20121/11/201220162/5/2016 revised
Supplements not recommended. Evidence not clear therefore not advised e.g.↑ Ca = ↓ colon but ↑ prostate; β-Carotene may ↑ lung cancer in smokers. Folate may increase risk of prostate, and colorectal cancer and possibly breast. Selenium not effective not recommended.Vitamin E may even increase prostate cancer risk
(+) plus less red & processed meat maintain healthy weight, limit alcohol
Canadian Cancer Society (13)
2016 No supplement recommendation except Vitamin D 1000 IU autumn oil winter – many benefit and not increase cancer risk
(+) (as in Canada’s food Guide) plus reduce portion size
European Code against cancer 4th Edition (14)
2015 No Supplement recommendation; Dietary supplements are not recommended for cancer prevention (World Cancer Research Fund 2007)
(+) plus reduce body fat avoid energy dense foods, sugary drinks, eat mostly plant foods, limit red meat, alcohol ≤ 2 drinks/d for men ≤ 1 drink /d for women
Cancer Research UK(15) 2014 (updated 24 Oct)
Supplements not recommended for prevention. Evidence for a healthy diet & cancer prevention.Supplements may interact with treatment therefore advice against antioxidant supplement use. But supplements may have a benefit in life prolongation of patients with advanced cancer
(+) plus a healthy diet provides micronutrients
9
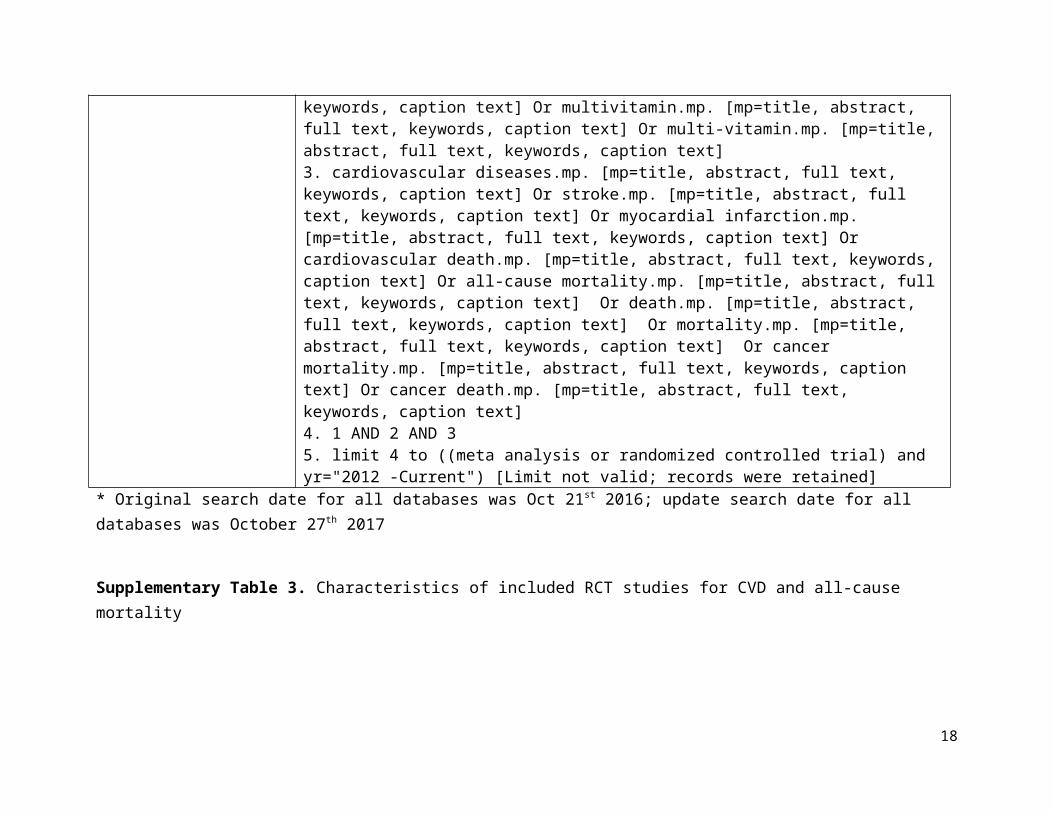
Supplementary Table 2. Search Strategy for vitamin and mineral supplements for cardiovascular diseases & all-cause mortality
Databases Search TermsMEDLINE 1. exp Dietary Supplements/ Or supplement*.mp.
2. exp Vitamin D/ Or exp Cholecalciferol/ Or Vitamin D.mp. Or exp Vitamin A/ Or vitamin A.mp. Or retinol.mp. Or exp beta Carotene/ Or alpha carotene.mp. Or exp Antioxidants/ Or antioxidant.mp. Or Vitamin E.mp. Or exp alpha-Tocopherol/ Or tocopherol.mp. Or Vitamin C.mp. Or ascorbic acid.mp. Or ascorbic acid.mp. Or exp Selenium/ Or selenium.mp. Or exp Vitamin B Complex/ Or B complex.mp. Or exp Folic Acid/ Or folate.mp. Or exp Niacinamide/ Or Vitamin B3.mp. Or exp Niacin/ Or exp Vitamin B 6/ Or pyridoxine.mp. Or Vitamin B6.mp. Or exp Calcium/ Or exp Calcium Carbonate/ Or exp Iron/ Or Iron.mp. Or exp Magnesium/ Or magnesium.mp. Or exp Potassium/ Or potassium.mp. Or Zinc.mp. Or exp Zinc Or Multivitamin.mp. Or multi vitamin.mp. Or (exp Calcium/ Or calcium carbonate.mp. AND exp Vitamin D/ Or exp Cholecalciferol/)3. exp Cardiovascular Diseases/ Or exp Myocardial Infarction/ Or exp Stroke/ Or cardiovascular death.mp. Or exp Mortality/ Or all-cause mortality.mp. Or exp Death/ Or death.mp. Or cancer death.mp. Or cancer mortality.mp.4. 1 AND 2 AND 35. limit 4 to (yr="2012 -Current" and (meta analysis or observational study or randomized controlled trial))
PUB MED 1. ("Dietary Supplements" Or supplements) AND ("Vitamin D" Or Cholecalciferol Or "Vitamin A" Or retinol Or "beta-Carotene" Or "alpha-carotene" Or Antioxidants Or "Vitamin E" Or "alpha-Tocopherol" Or tocopherol Or "Vitamin C" Or "ascorbic acid" Or Selenium Or "Vitamin B-Complex" Or "Folic Acid" Or folate Or Niacinamide Or "Vitamin B3" Or Niacin Or "Vitamin B6" Or pyridoxine Or Calcium Or "Calcium Carbonate" Or Iron Or Magnesium Or Potassium Or Zinc Or Multivitamin Or "multi-vitamin" Or (Calcium Or "calcium carbonate" AND "Vitamin D" Or Cholecalciferol)) AND ("Cardiovascular Diseases" Or "Myocardial Infarction" Or Stroke Or "cardiovascular death" Or Mortality Or "all-cause mortality" Or Death Or "cancer death" Or "cancer mortality")2. limit 1 to (yr="2012/01/01 - 2017/12/31" and (meta analysis or observational study or randomized controlled trial))
10
COCHRANE 1. dietary supplements.mp. [mp=title, abstract, full text, keywords, caption text] Orsupplements.mp. [mp=title, abstract, full text, keywords, caption text] "2. vitamin D.mp. [mp=title, abstract, full text, keywords, caption text] Or cholecalciferol.mp. [mp=title, abstract, full text, keywords, caption text] Or Vitamin A.mp. [mp=title, abstract, full text, keywords, caption text] Or retinol.mp. [mp=title, abstract, full text, keywords, caption text] Or beta-carotene.mp. [mp=title, abstract, full text, keywords, caption text] Or alpha-carotene.mp. [mp=title, abstract, full text, keywords, caption text] Or Antioxidant*.mp. [mp=title, abstract, full text, keywords, caption text] Or Vitamin E.mp. [mp=title, abstract, full text, keywords, caption text] Or alpha-tocopherol.mp. [mp=title, abstract, full text, keywords, caption text] Or tocopherol.mp. [mp=title, abstract, full text, keywords, caption text] Or Vitamin C.mp. [mp=title, abstract, full text, keywords, caption text] Or ascorbic acid.mp. [mp=title, abstract, full text, keywords, caption text] Or Selenium.mp. [mp=title, abstract, full text, keywords, caption text] Or B-complex.mp. [mp=title, abstract, full text, keywords, caption text] Or Folate.mp. [mp=title, abstract, full text, keywords, caption text] Or Folic acid.mp. [mp=title, abstract, full text, keywords, caption text] Or niacinamide.mp. [mp=title, abstract, full text, keywords, caption text] Or vitamin B3.mp. [mp=title, abstract, full text, keywords, caption text] Or niacin.mp. [mp=title, abstract, full text, keywords, caption text] Or vitamin B6.mp. [mp=title, abstract, full text, keywords, caption text] Or pyridoxine.mp. [mp=title, abstract, full text, keywords, caption text] Or calcium.mp. [mp=title, abstract, full text, keywords, caption text] Or calcium carbonate.mp. [mp=title, abstract, full text, keywords, caption text] Or iron.mp. [mp=title, abstract, full text, keywords, caption text] Or magnesium.mp. [mp=title, abstract, full text, keywords, caption text] Or potassium.mp. [mp=title, abstract, full text, keywords, caption text] Or zinc.mp. [mp=title, abstract, full text, keywords, caption text] Or multivitamin.mp. [mp=title, abstract, full text, keywords, caption text] Or multi-vitamin.mp. [mp=title, abstract, full text, keywords, caption text]3. cardiovascular diseases.mp. [mp=title, abstract, full text, keywords, caption text] Or stroke.mp. [mp=title, abstract, full text, keywords, caption text] Or myocardial infarction.mp. [mp=title, abstract, full text, keywords, caption text] Or cardiovascular death.mp. [mp=title, abstract, full text, keywords, caption text] Or all-cause mortality.mp. [mp=title, abstract, full text, keywords, caption text] Or death.mp. [mp=title, abstract, full text, keywords, caption text] Or mortality.mp. [mp=title, abstract, full text, keywords, caption text] Or cancer mortality.mp. [mp=title, abstract, full text, keywords, caption text] Or cancer death.mp. [mp=title, abstract, full text, keywords, caption text]4. 1 AND 2 AND 3
11

5. limit 4 to ((meta analysis or randomized controlled trial) and yr="2012 -Current") [Limit not valid; records were retained]
* Original search date for all databases was Oct 21st 2016; update search date for all databases was October 27th 2017
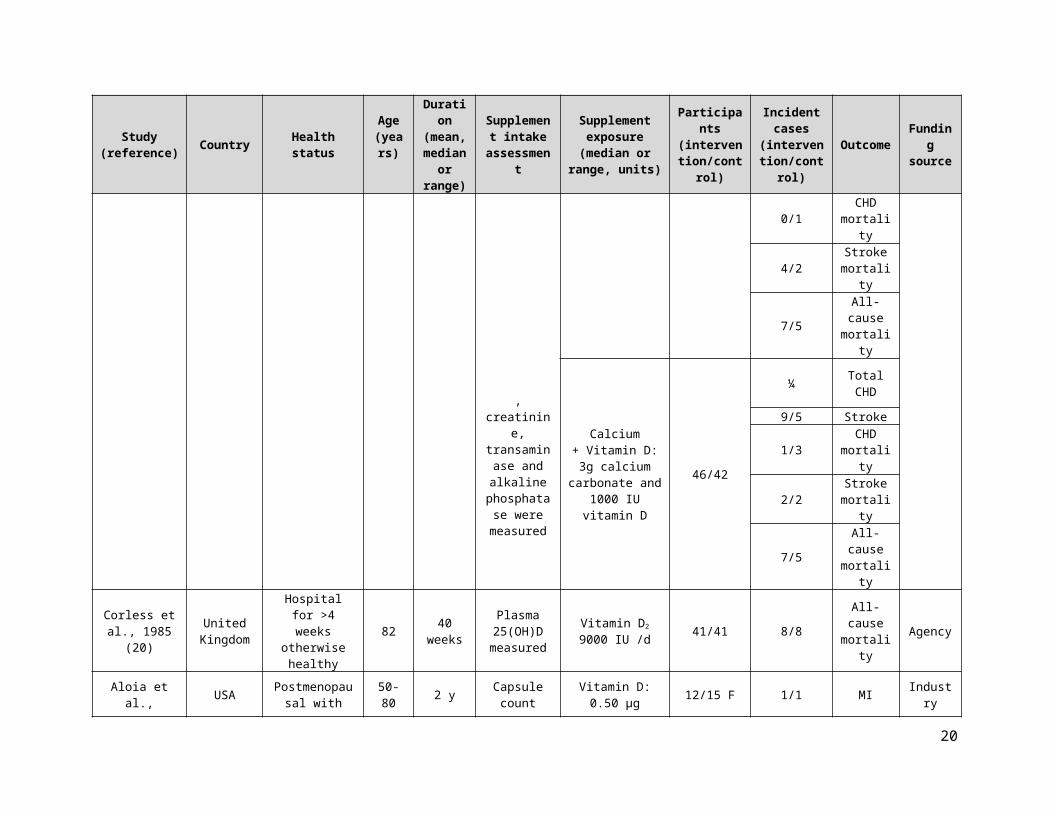
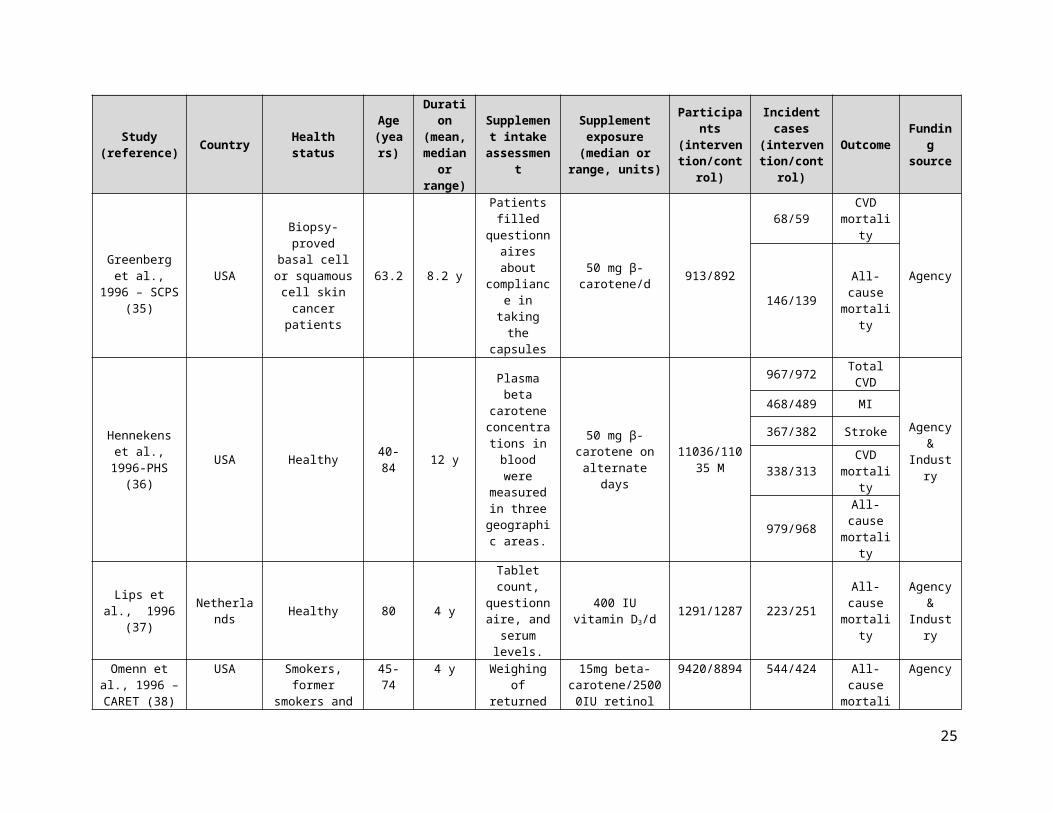
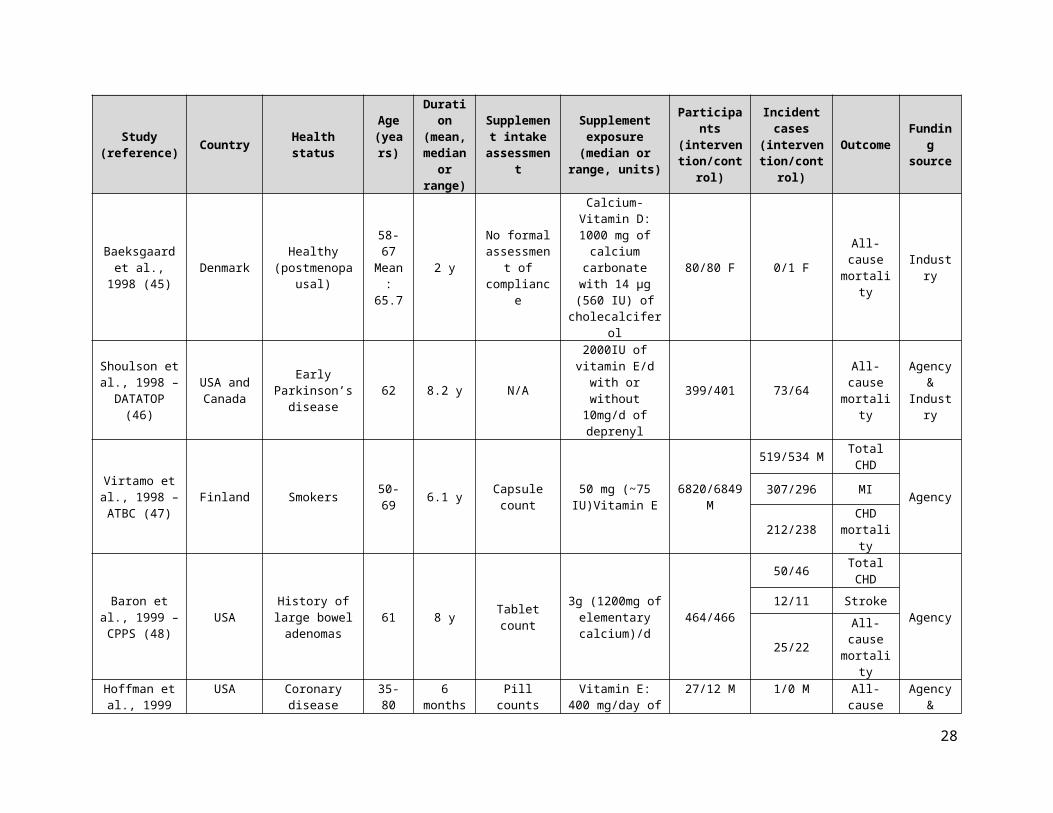
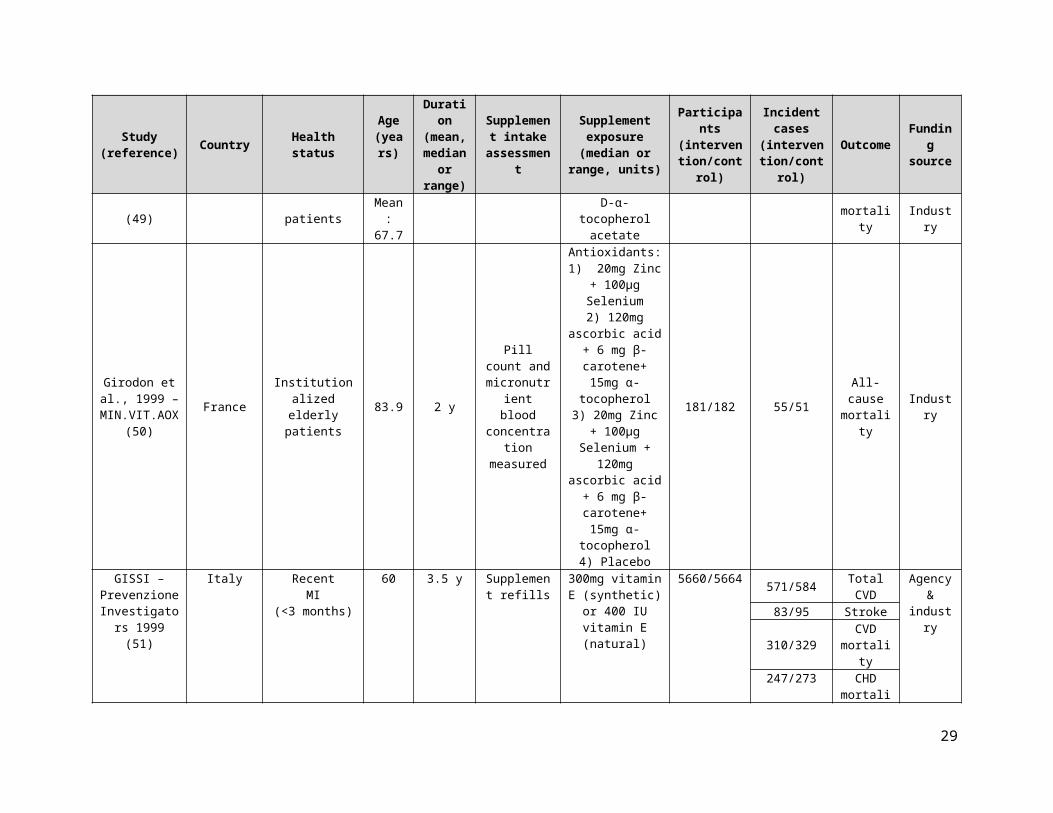
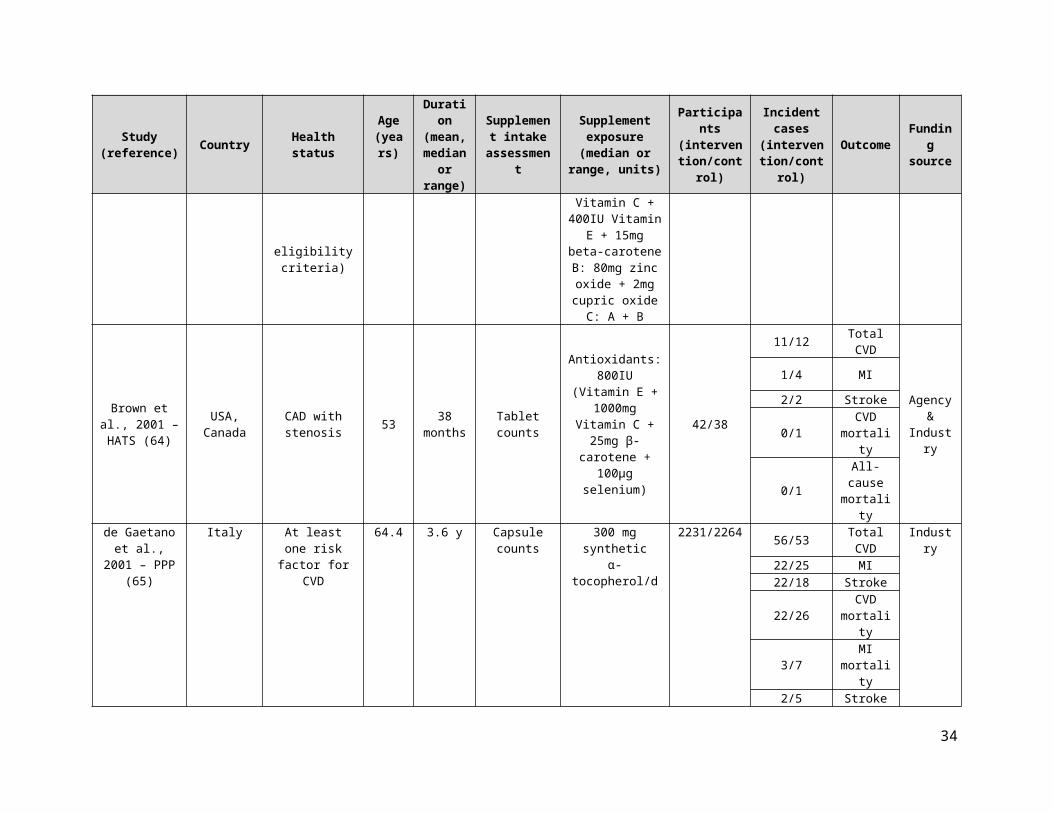
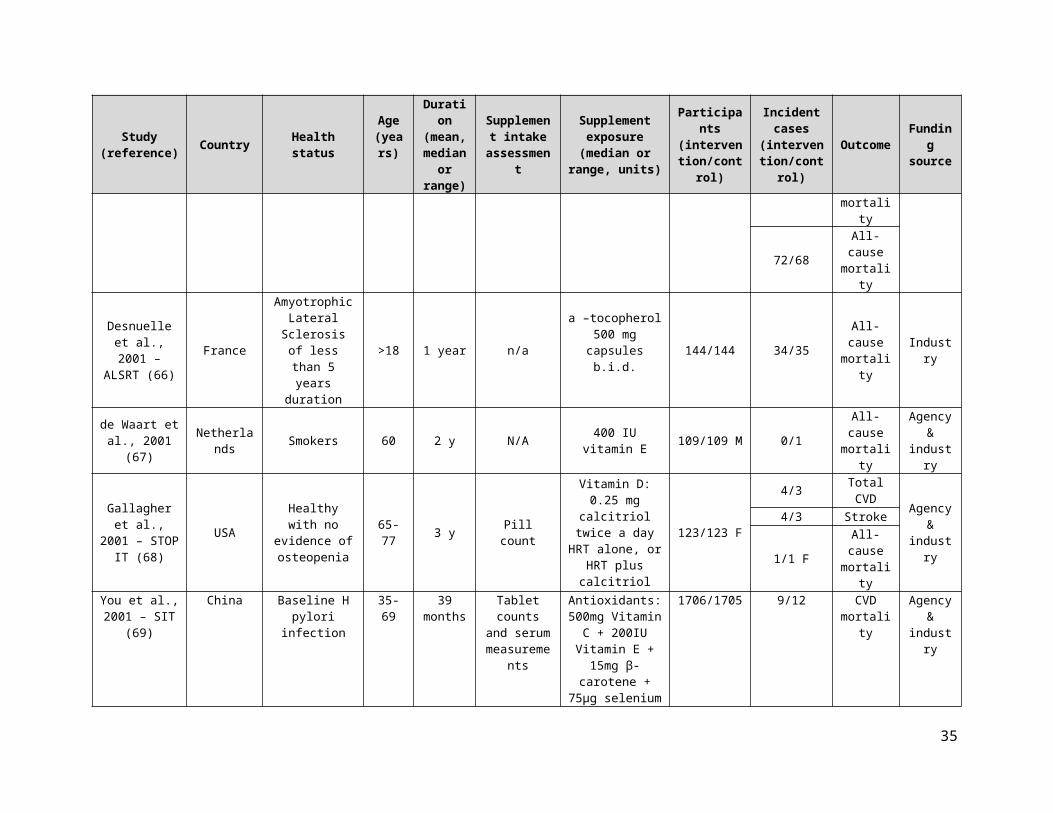
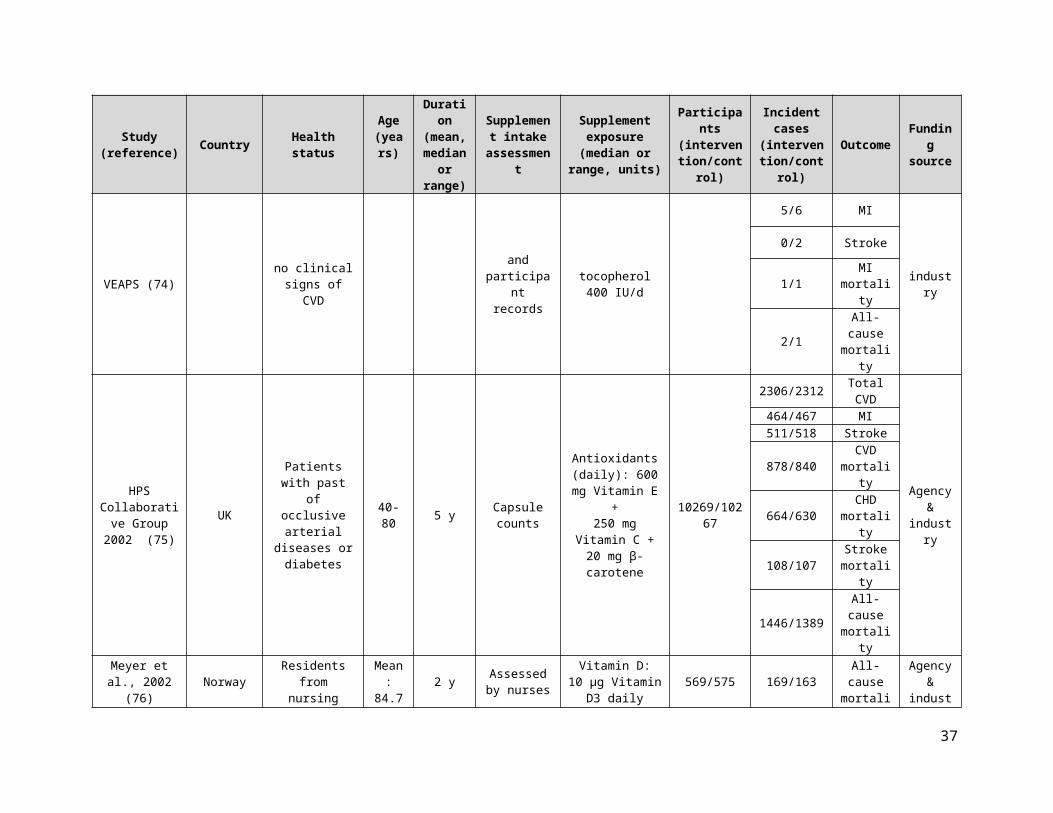
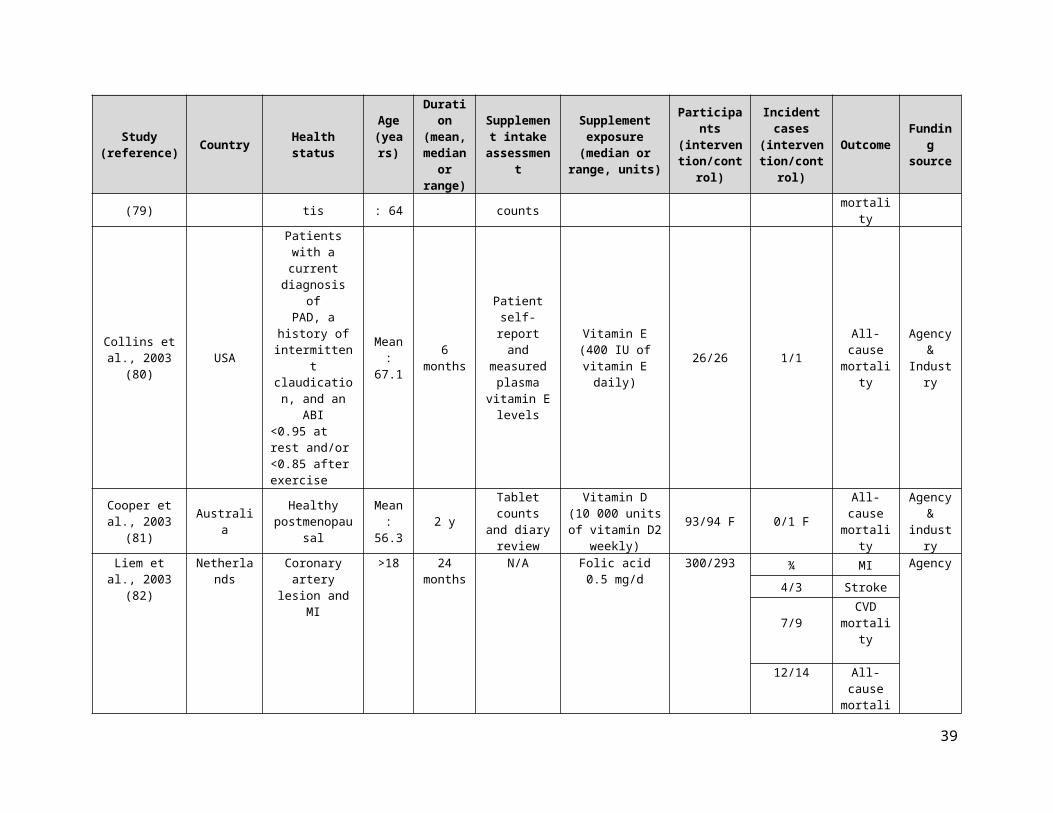
Supplementary Table 3. Characteristics of included RCT studies for CVD and all-cause mortality
Study (reference) Country Health status
Age (years)
Duration (mean, median
or range)
Supplement intake
assessment
Supplement exposure (median or range, units)
Participants(intervention
/control)
Incident cases
(intervention/control)
Outcome Funding source
Cardiovascular disease (CVD) outcomes
Brohult et al., 1973 (16) Sweden Rheumatoid
arthritis
18-69Mean:
521 y N/A
Vitamin D:100000 IU
calciferol per day25/25 1/0 All-cause
mortality Agency
CDPRG 1975(17)
United States CHD 30-64
Mean:74
months
Follow up visit
consisting of an assessment
to drug adherence
Vitamin B3:3.0 gm/day 1119/2789
914/2333 Total CVD
Agency
114/386 MI95/311 Stroke
238/633 CVD mortality
203/535 CHD mortality
273/709 All-cause mortality
Gillilan et al., 1977 (18) USA
Angina pectoris with obstructive coronary disease
57 (mean)
Vitamin E: 189 ± 15.0 daysPlacebo:
192 ± 13.3 days
capsule count and urine
fluorescence test
Vitamin E: 1600IU daily 26/26 2/2 All-cause
mortality Industry
Inkovaara et al., 1983(19)
Finland Healthy 79.5 1 y Serumcalcium,
phosphate, creatinine,
transaminase and alkaline phosphatase
were measured
Vitamin D:1000 IU /d
45/42 0/1 Total CHD
N/A
12/5 Stroke
0/1 CHD mortality
4/2 Stroke mortality
7/5 All-cause mortality
12

Study (reference) Country Health status
Age (years)
Duration (mean, median
or range)
Supplement intake
assessment
Supplement exposure (median or range, units)
Participants(intervention
/control)
Incident cases
(intervention/control)
Outcome Funding source
Calcium+ Vitamin D:3g calcium
carbonate and 1000 IU vitamin D
46/42
¼ Total CHD
9/5 Stroke
1/3 CHD mortality
2/2 Stroke mortality
7/5 All-cause mortality
Corless et al., 1985 (20)
United Kingdom
Hospital for >4 weeks otherwise
healthy82 40 weeks
Plasma 25(OH)D measured
Vitamin D2 9000 IU /d 41/41 8/8 All-cause
mortality Agency
Aloia et al., 1988(21) USA Postmenopausal
with osteoporosis 50-80 2 y Capsule count
Vitamin D:0.50 µg calcitriol/d
with doseescalation if necessary.
Average: 0.8 µg calcitriol/d
12/15 F 1/1 MI Industry
Korpela et al., 1989(22) Finland Patients with
acute MIMean:
57 6 months
Serum selenium
concentration measured
Selenium(selenium-rich
yeast, 100 µg/day)40/41
1/2 MI
N/A
0/4 CVD mortality
McKeown-Eyssen et al.,
1988 (23)Canada
Patients believed to be free of polyps after
removal of at least
one colorectal polyp
58.0 2 yearsrandom urine
sample 400 mg each of vitamins C and E 96/89 4/3 All-cause
mortality Industry
13
Study (reference) Country Health status
Age (years)
Duration (mean, median
or range)
Supplement intake
assessment
Supplement exposure (median or range, units)
Participants(intervention
/control)
Incident cases
(intervention/control)
Outcome Funding source
Ott et al., 1989(24) USA
Postmenopausal with
>2 compression fractures
50-80 2 y N/A.
Vitamin D:0.25 g calcitriol
twice dailywith dose
escalation ifneeded
43/43 F
0/1 MI mortality
Agency
0/1 F All-cause mortality
Gallagher et al., 1990 (25) USA
postmenopausal women with
vertebral fractures
50-78Mean: 69.7
2 y N/A
Vitamin D:From 0.25µg
calcitriol twice daily until a
maximum dose of 1µg twice daily
25/25 F 1/0 F All-cause mortality Industry
Grady et al., 1991 (26) USA Healthy >69 6 months
Serum calcium was
measured and capsule count at each follow
up visit
0.25 g vitamin D3
orally, twice per day
50/48 1/0 All-cause mortality Industry
Chapuy et al., 1992 (27) France Healthy 84 3 y
Taken with a nurse
supervision
1.2g calcium and 20g (800 IU) of
vitamin D3/d1634/1636 F 258/274 All-cause
mortality Agency
Li et al., 1993 – NIT2(28) China
Under nourished population with a
previous cytologic
diagnosis of esophageal squamous dysplasia
40-69 6 y Pill count Multivitamins 1657/1661
22/35Stroke
mortality
Agency
157/167 All-cause mortality
Bogden et al., 1994 (29) USA Healthy 59-85 1 y n/a Multivitamins 33/32 0/1 MI
Agency &
Industry
14

Study (reference) Country Health status
Age (years)
Duration (mean, median
or range)
Supplement intake
assessment
Supplement exposure (median or range, units)
Participants(intervention
/control)
Incident cases
(intervention/control)
Outcome Funding source
0/1 All-cause mortality
de la Maza et al., 1995 (30) Chile
Decompensated ambulatoryalcoholic cirrhotics
48.7±8.3
(vitamin E)
50.9±9.9
(placebo)
1year Pill counts500 mg vitamin E
daily 37/37 5/4 All-cause mortality Industry
Hamdy et al., 1995 (31)
Europe (Belgium,
France, Netherlands,
UK)
Mild to moderate chronic renal
failure18-81 2 y
Serum calcium levels
were measured
0.25 g alfacalcidol
(vitamin D) every other daywith dose
escalation ifneeded to 1g to maintain serum
calcium concentrations at
upper limit.
89/87 4/1 All-cause mortality N/A
Ooms et al., 1995 (32) Netherlands Healthy >70 2 y
Questionnaire, by pill
counting, and by
measuring serum 250HD
levels
400 IU of vitamin D3/d
177/171 F 11/21 All-cause mortality Agency
15

Study (reference) Country Health status
Age (years)
Duration (mean, median
or range)
Supplement intake
assessment
Supplement exposure (median or range, units)
Participants(intervention
/control)
Incident cases
(intervention/control)
Outcome Funding source
Pike et al.,1995 (33) Canada
Healthy, non-institutionalized
elderly61-79
1 yearBottle checks
and interviews
Multivitamin 24/23 1/0 All-cause mortality Industry
Steiner et al., 1995 (34) USA
Transient ischemic attacks, minor strokes or
residual neurologic
deficits
71.1 2 y n/a α-tocopherol400 IU daily 52/48 3/6 Stroke Industry
Greenberg et al., 1996 – SCPS (35)
USA
Biopsy-proved basal cell or squamous
cell skin cancer patients
63.2 8.2 y
Patients filled questionnaires
about compliance in
taking the capsules
50 mg β-carotene/d 913/892
68/59 CVD mortality
Agency
146/139 All-cause mortality
Hennekens et al., 1996-PHS
(36)USA Healthy 40-84 12 y
Plasma beta carotene
concentrations in blood were
measuredin three
geographic areas.
50 mg β-carotene on alternate days
11036/11035 M
967/972 Total CVD
Agency &
Industry
468/489 MI
367/382 Stroke
338/313 CVD mortality
979/968 All-cause mortality
Lips et al., 1996 (37) Netherlands Healthy 80 4 y
Tablet count, questionnaire,
and serum levels.
400 IU vitamin D3/d
1291/1287 223/251 All-cause mortality
Agency &
Industry
Omenn et al., USA Smokers, former 45-74 4 y Weighing of 15mg beta- 9420/8894 544/424 All-cause Agency
16

Study (reference) Country Health status
Age (years)
Duration (mean, median
or range)
Supplement intake
assessment
Supplement exposure (median or range, units)
Participants(intervention
/control)
Incident cases
(intervention/control)
Outcome Funding source
1996 – CARET (38)
smokers and workers exposed
to asbestos
returned bottles/self-
report
carotene/25000IU retinol mortality
Stephens et al., 1996 – CHAOS
(39)
United Kingdom
Coronary atherosclerosis 62 510 d Timing of
refill request400 -800 IU vitamin E/d 1035/967
32/54 MI
Agency
27/23 CVD mortality
18/13 MI mortality
1/1 Stroke mortality
36/26 All-cause mortality
Dawson-Hughes et al.,
1997 (40)USA Healthy ≥65 3 y Pill counts
500 mg of calcium plus 700 IU of
vitamin D3
(cholecalciferol)per day
187/202 2/2 All-cause mortality
Agency &
Industry
Girodon et al., 1997 (41) France Elderly,
institutionalized 83.75 2 y Given by nurse
Antioxidants: One of 3
preparations:A: 20mg zinc
sulfate + 100µg selenite
B: 120mg ascorbic acid + 6mg β-
carotene + 15mg α-tocopherolC: A + B
21/20 7/7 All-cause mortality Industry
Moon et al., 1997 – SKICAP
AK (42)
United States
History of at least 10 actinic
keratosis & at most 2 squamous cell carcinoma or
basal cell carcinoma skin
cancers
Median: 63 3 y Capsule count 25, 000 IU Retinol 1157/1140 24/24
All-cause mortality
Agency &
Industry
Sano et al., 1997 – ADCS 1 USA Alzheimer’s
disease 73 2 y Serum levels 2000 IU of vitamin E/d 85/84 12/12 All-cause
mortality Agency
17
Study (reference) Country Health status
Age (years)
Duration (mean, median
or range)
Supplement intake
assessment
Supplement exposure (median or range, units)
Participants(intervention
/control)
Incident cases
(intervention/control)
Outcome Funding source
(43)Sato et al., 1997
(44) Japan Hemiplegia after stroke
Mean: 68 6 months N/A Vitamin D
1 μg/d 1α(OH)D 45/39 1/1 All-cause mortality N/A
Baeksgaard et al., 1998 (45) Denmark Healthy
(postmenopausal)
58-67Mean: 65.7
2 yNo formal
assessment of compliance
Calcium-Vitamin D:
1000 mg of calcium carbonate with 14 µg (560
IU) of cholecalciferol
80/80 F 0/1 F All-cause mortality Industry
Shoulson et al., 1998 –
DATATOP(46)
USA and Canada
Early Parkinson’s disease 62 8.2 y N/A
2000IU of vitamin E/d with or without 10mg/d of deprenyl
399/401 73/64 All-cause mortality
Agency &
Industry
Virtamo et al., 1998 – ATBC
(47)Finland Smokers 50-69 6.1 y Capsule count 50 mg (~75
IU)Vitamin E 6820/6849 M
519/534 M Total CHD
Agency307/296 MI
212/238 CHD mortality
Baron et al., 1999 – CPPS
(48)USA History of large
bowel adenomas 61 8 y Tablet count3g (1200mg of
elementary calcium)/d
464/466
50/46 Total CHD
Agency12/11 Stroke
25/22 All-cause mortality
Hoffman et al., 1999 (49) USA Coronary disease
patients
35-80Mean: 67.7
6 months Pill counts
Vitamin E:400 mg/day of D-
α-tocopherol acetate
27/12 M 1/0 M All-cause mortality
Agency &
Industry
Girodon et al., 1999 –
MIN.VIT.AOX (50)
France Institutionalized elderly patients
83.9 2 y Pill count and micronutrient
blood concentration
measured
Antioxidants:1) 20mg Zinc + 100µg Selenium
2) 120mg ascorbic acid + 6 mg β-
carotene+ 15mg α-tocopherol
3) 20mg Zinc + 100µg Selenium +
181/182 55/51 All-cause mortality
Industry
18

Study (reference) Country Health status
Age (years)
Duration (mean, median
or range)
Supplement intake
assessment
Supplement exposure (median or range, units)
Participants(intervention
/control)
Incident cases
(intervention/control)
Outcome Funding source
120mg ascorbic acid + 6 mg β-
carotene+ 15mg α-tocopherol4) Placebo
GISSI – Prevenzione Investigators
1999 (51)
ItalyRecent
MI(<3 months)
60 3.5 y Supplement refills
300mg vitamin E (synthetic) or 400
IU vitamin E (natural)
5660/5664
571/584 Total CVD
Agency &
industry
83/95 Stroke
310/329 CVD mortality
247/273 CHD mortality
228/251 MI mortality
488/529 All-cause mortality
Green et al., 1999 – NSCPT
(52)Australia
Healthy and patients who
previously had skin cancer
20-69 4.5 y
Tablet counts and
concentration of
betacarotene in the skin
30 mg/d of beta-carotene 801/820
6/12 CVD mortality
Agency and
Industry11/21 All-cause mortality
Komulainen et al., 1999 –
OSTPRE (53)Finland
Postmenopausal with 6–24
months elapsed since last
menstruation
47-56 5 y Participant reporting
300IU/d, and 100IU/d of vitamin D during the fifth
year with or without hormone
replacement therapy
112/115 F
1/0 MI
Industry
0/1 All-cause mortality
93mg Calcium and 300 IU vitamin D (cholecalciferol)/d
116/115 F
1/1 MI
2/1 Stroke
19
Study (reference) Country Health status
Age (years)
Duration (mean, median
or range)
Supplement intake
assessment
Supplement exposure (median or range, units)
Participants(intervention
/control)
Incident cases
(intervention/control)
Outcome Funding source
1/0 MI mortality
1/1 All-cause mortality
Krieg et al., 1999 (54) Switzerland Institutionalized
elderly 84.5 2 yTaken with a
nurse supervision
880 IU of vitamin D3 with 1000 mg of
calcium124/124 21/26 All-cause
mortality N/A
Sato et al.,1999 (55) Japan Parkinson’s
disease
65-88Mean: 70.6
18 months N/A
Vitamin D:1 µg 1α(OH)D3
daily43/43 1/0 All-cause
mortality N/A
Boaz et al., 2000 – SPACE
(56)Israel
Patients with stable
hemodialysis with documented history of CVD
64.6 1.4 y
Serum vitamin E
levels were monitored
800 IU of vitamin E daily (natural) 97/99
15/33 Total CVD
Agency
5/17 MI5/6 Stroke
9/15 CVD mortality
2/8 MI mortality
31/29 All-cause mortality
Correa et al., 2000 (57) Colombia
Subjects with confirmed histologic
diagnoses ofmultifocal
nonmetaplastic atrophy and/or
intestinal metaplasia
29-69 72 months Pill counts
2g Vitamin C 130/117 2/0
All-cause mortality Agency
30 mg Beta-Carotene 117/117 2/0
Antioxidants (Vit C and Beta-
carotene)121/117 2/0
Frazao et al., 2000 (58) USA
Hemodialysis patients with
hyperparathyroidism
52 24 weeksAdministered
with hemodialysis
Vitamin D:10µg 1α-
hydroxyvitamin D2
with dosage adjustments to
maintain plasma iPTH levels
71/67
1/2 CHD mortality Agency
1/2 All-cause mortality
20

Study (reference) Country Health status
Age (years)
Duration (mean, median
or range)
Supplement intake
assessment
Supplement exposure (median or range, units)
Participants(intervention
/control)
Incident cases
(intervention/control)
Outcome Funding source
Lee et al., 1999 – WHS (59) USA Healthy 45 Median
2.1 yFollow-up
questionnaires
50 mg of beta-carotene
given on alternatedays.
19939/19937 74/65 Total CVD
Agency &
Industry
Leppälä et al., 2000 – ATBC
(60)Finland Male smokers 50-69 6 y Tablet counts
Antioxidants:50mg/day Vitamin E and 20mg/day
beta-carotene
7118/7153 M
258/252 Stroke
Agency
46/34 Stroke mortality
20mg β-carotene14246/14273
M
554/503 Stroke
82/78 Stroke mortality
Jacobson et al., 2000 (61) USA Heavy smokers ≥18 6 months Bottle checks
Antioxidant: 500 mg
of vitamin C, 400 IU of a-tocopherol,
and 12 mg of b-carotene.
57/55 0/1 All-cause mortality Agency
Salonen et al., 2000 – ASAP
(62)Finland Hypercholesterol
aemia
45-69Mean: 59.7
3 y Tablet counts
Vitamin E:91 mg of d-α-
tocopherol twice daily
130/130 3/1 All-cause mortality
Agency &
IndustryVitamin C 130/130 1/1
AREDS Research Group
2001 (63)USA
Healthy (with additional ocular
eligibility criteria)
68 6.3 y Tablet counts
Antioxidants:One of 3
preparations:A: 500mg Vitamin C + 400IU Vitamin
E + 15mg beta-carotene
B: 80mg zinc oxide + 2mg cupric oxide
C: A + B
2304/2325 251/240 All-cause mortality
Agency &
Industry
21

Study (reference) Country Health status
Age (years)
Duration (mean, median
or range)
Supplement intake
assessment
Supplement exposure (median or range, units)
Participants(intervention
/control)
Incident cases
(intervention/control)
Outcome Funding source
Brown et al., 2001 – HATS
(64)
USA, Canada
CAD with stenosis 53 38
months Tablet counts
Antioxidants: 800IU (Vitamin E + 1000mg Vitamin
C + 25mg β-carotene + 100µg
selenium)
42/38
11/12 Total CVD
Agency &
Industry
1/4 MI
2/2 Stroke
0/1 CVD mortality
0/1 All-cause mortality
de Gaetano et al., 2001 – PPP
(65)Italy At least one risk
factor for CVD 64.4 3.6 y Capsule counts
300 mg syntheticα-tocopherol/d 2231/2264
56/53 Total CVD
Industry
22/25 MI22/18 Stroke
22/26 CVD mortality
3/7 MI mortality
2/5 Stroke mortality
72/68 All-cause mortality
Desnuelle et al., 2001 – ALSRT
(66)France
Amyotrophic Lateral Sclerosis
of less than 5 years duration
>18 1 year n/aa –tocopherol 500 mg capsules b.i.d. 144/144 34/35 All-cause
mortality Industry
de Waart et al., 2001 (67) Netherlands Smokers 60 2 y N/A 400 IU vitamin E 109/109 M 0/1 All-cause
mortality
Agency &
industry
Gallagher et al., 2001 – STOP IT
(68)USA
Healthy with noevidence of osteopenia
65-77 3 y Pill count
Vitamin D:0.25 mg calcitriol
twice a dayHRT alone, or
HRT pluscalcitriol
123/123 F
4/3 Total CVD Agency
& industry
4/3 Stroke
1/1 F All-cause mortality
You et al., 2001 – SIT (69)
China Baseline H pylori infection
35-69 39 months
Tablet counts and serum
measurements
Antioxidants:500mg Vitamin C
+ 200IU Vitamin E + 15mg β-carotene + 75µg selenium
1706/1705 9/12 CVD mortality
Agency &
industry
22

Study (reference) Country Health status
Age (years)
Duration (mean, median
or range)
Supplement intake
assessment
Supplement exposure (median or range, units)
Participants(intervention
/control)
Incident cases
(intervention/control)
Outcome Funding source
(β-carotene component was
discontinued after 6 months)
Baker et al., 2002 (70)
United Kingdom CHD N/A 1.7 y N/A 5mg/day folic acid 942/940 23/12 Total
CHD N/A
Chapuy et al., 2002 –
Decalyos II (71)France Healthy 85.2 2 years
Taken in the presence of a
nurse toensure
compliance.
1200mg calcium and 20g (800 IU)
of vitamin D3/d393/190 67/43 All-cause
mortality Industry
Chylack et al., 2002 – REACT
(72)US and UK Early age-related
cataract 67 3 y
Plasma concentrations
measured monthly
Antioxidants:β-carotene
[18mg/d], vitamin C [750mg/d], and
vitamin E [600mg/d]
149/148
2/1 MI mortality Agency
and industry9/3 All-cause
mortality
Graat et al., 2002 (73) Netherlands Healthy
≥60Mean: 73.3
15 months
Returned capsules
counted + plasma samples
Vitamin E:200mg/dL of α-
tocopheryl acetate twice daily
164/153 3/5 All-cause mortality
Agency and
IndustryMultivitamin 163/153 0/5
Hodis et al., 2002 – VEAPS
(74)USA
LDL-C ≥3.37 mmol/L and no clinical signs of
CVD
56 3 y
Clinic visits and
participant records
Vitamin E:DL-α-tocopherol
400 IU/d177/176
11/14 Total CVD
Agency &
industry
5/6 MI
0/2 Stroke
1/1 MI mortality
2/1 All-cause mortality
HPS Collaborative Group 2002
(75)
UK Patients with past of occlusive
arterial diseases or diabetes
40-80 5 y Capsule counts
Antioxidants (daily): 600 mg
Vitamin E +250 mg Vitamin C
+20 mg β-carotene
10269/10267 2306/2312 Total CVD
Agency &
industry464/467 MI511/518 Stroke878/840 CVD
mortality
23

Study (reference) Country Health status
Age (years)
Duration (mean, median
or range)
Supplement intake
assessment
Supplement exposure (median or range, units)
Participants(intervention
/control)
Incident cases
(intervention/control)
Outcome Funding source
664/630 CHD mortality
108/107 Stroke mortality
1446/1389 All-cause mortality
Meyer et al., 2002 (76) Norway Residents from
nursing homesMean: 84.7 2 y Assessed by
nurses
Vitamin D:10 µg Vitamin D3
daily569/575 169/163 All-cause
mortality
Agency &
industry
Schnyder et al., 2002 – The Swiss Heart Study (77)
Switzerland CHD (undergone angioplasty) 63 1 y
Homocysteine levels were measured
B-complex: folic acid (1mg/d), vitamin B12,
(cyanocobalamin, 400µg/d) and
vitamin B6
(pyridoxine hydrochloride,
10mg/d)
272/281
7/12 MI
Agency3/6 CHD mortality
4/8 All-cause mortality
Waters et al., 2002 – WAVE
(78)
US/Canada
Postmenopausal women with at
least one 15% to 75% coronary
stenosis at baseline coronary
angiography
Mean: 65 5 y Tablet/capsule
counts
1. Antioxidants: 800 IU/d vitamin E
+ 1000 mg/d Vitamin C
2. HRT: 0.625 mg/d conjugated equine estrogens
(+2.5 mg medroxyprogestero
ne acetate if no hysterectomy)
3. 1+2
105/108 F
3/1 MI
Agency1/3 Stroke
4/2 CVD mortality
6/2 F All-cause mortality
Wluka et al., 2002 (79) Australia Knee
osteoarthritis
≥ 40Mean:
642 y
Residual capsule counts
Vitamin E:500 IU daily 67/69 1/0 All-cause
mortality Agency
Collins et al., 2003 (80)
USA Patients with a current diagnosis
ofPAD, a history of
intermittent claudication, and
Mean: 67.1
6 months Patient self-report and measured plasma
vitamin E levels
Vitamin E(400 IU of vitamin
E daily)
26/26 1/1 All-cause mortality
Agency &
Industry
24
Study (reference) Country Health status
Age (years)
Duration (mean, median
or range)
Supplement intake
assessment
Supplement exposure (median or range, units)
Participants(intervention
/control)
Incident cases
(intervention/control)
Outcome Funding source
an ABI<0.95 at rest and/or <0.85 after exercise
Cooper et al., 2003 (81) Australia Healthy
postmenopausalMean: 56.3 2 y
Tablet counts and diary
review
Vitamin D(10 000 units of
vitamin D2 weekly)
93/94 F 0/1 F All-cause mortality
Agency &
industry
Liem et al., 2003 (82) Netherlands Coronary artery
lesion and MI >18 24 months N/A Folic acid 0.5 mg/d 300/293
¾ MI
Agency
4/3 Stroke
7/9 CVD mortality
12/14 All-cause mortality
Righetti et al., 2003 (83) Italy End stage renal
disease 64 1 y Pill counts15 mg folic acid or 5 mg folic acid per
day51/30 13/11 Total
CVD N/A
Trivedi et al., 2003 (84)
United Kingdom Healthy 74.75 5 y Complete and
return a form
Vitamin D:100,000IU
cholecalciferol once every 4
months
1345/1341
477/503 Total CVD
Agency
224/233 MI
105/101 Stroke
101/117 CVD mortality
42/49 MI mortality
28/26 Stroke mortality
224/247 All-cause mortality
Virtamo et al., 2003 – ATBC
(85)Finland Smokers 50-69 8 y Tablet count
20mg/d β-carotene 7282/7287 919/851 All-cause mortality Agency
50 mg/d Vitamin E 7286/7287 868/851
25

Study (reference) Country Health status
Age (years)
Duration (mean, median
or range)
Supplement intake
assessment
Supplement exposure (median or range, units)
Participants(intervention
/control)
Incident cases
(intervention/control)
Outcome Funding source
Dukas et al., 2004 (86) Switzerland Healthy
≥70Mean:
7536 weeks
serum uestionnaire
of 25(OH)D3, 1,25
dihydroxyvitamin D (D-hormone) measured
Vitamin D:1 µg of alfacalcidol 192/186 1/1 All-cause
mortality
Agency and
Industry
Harwood et al., 2004 – NoNOF
(87)
United Kingdom
Within 7 days post-surgery for
hip fracture81.2 1 y N/A
Vitamin D: Single injection of 300,000IU
ergocalciferol
38/37 F 7/5 F
All-cause mortality Industry800IU
cholecalciferol plus 1g calcium
carbonate daily
39/37 F 6/5 F
Coburn et al., 2004 (88) USA Chronic kidney
disease 64.5 8 months Blood and urine samples were collected
Vitamin D:iPTH 85 pg/mL
(ng/L), oral doxercalciferol
27/28
0/2 MI
Agency
0/1 MI mortality
Lange et al., 2004 (89)
Germany and
Netherlands
Patients who had undergone successful
coronary stenting
Folate (mean): 61.4
Placebo
(mean): 61.3
2 yMonthly telephone contact
1.2 mg/d folic acid, 48 mg/d vitamin B6, and 60 μg
mg/d vitamin B12
316/320
53/35 CHD
Agency3/2 MI
1/1 All-cause mortality
Larsen et al., 2004 (90) Denmark Elderly
66-103Mean:
743 y
Plasma levels of 25-
hydroxyvitamin D
[25(OH)D] and 1,25-
dihydroxyvitamin D
[1,25(OH)2D]
Calcium-Vitamin D
(1000 mgof elemental
calcium as calcium carbonate and 400
IU (10 µg) of vitamin D3 daily)
4957/4648 832/839 All-cause mortality
Agency &
Industry
26

Study (reference) Country Health status
Age (years)
Duration (mean, median
or range)
Supplement intake
assessment
Supplement exposure (median or range, units)
Participants(intervention
/control)
Incident cases
(intervention/control)
Outcome Funding source
measured
Liem et al., 2004 (91) Netherlands Acute MI 59 1 y Pill counts 5 mg folic acid per
day 140/143
43/45 Total CVD
Industry
8/10 MI
1/0 Stroke
2/2 MI mortality
1/0 Stroke mortality
6/7 All-cause mortality
Taylor et al., 2004 –
ARBITER 2 (92)
United States CHD Mean:
67 3 y Pill countsVitamin B3
(niacin): 1000mg /day
87/80
4/11 Total CVD
Agency &
Industry
2/2 MI0/1 Stroke
1/2 CVD mortality
Tornwall et al., 2004 – ATBC
(93)Finland Men, smokers 50-69 6 y Capsule
counts
Antioxidants (daily):
50 mg α-tocopherol, 20 mg
β-carotene
6781/6849 M
511/534 Total CHD
Agency
289/296 MI
222/238 CHD mortality
20 mg/d β-carotene 6821/6849 M
548/534 Total CHD
314/296 MI
234/238 CHD mortality
Manuel-Y-Keenoy et al.,
2004 – DATOR (94)
BelgiumType 1 Diabetes
Mellitus with high cholesterol
21-69 6 months n/a d-α-tocopherol 750 IU 12/12 1/0 All-cause
mortality Industry
McNeil et al., 2004 – VECAT
Australia Early or no cataract
55-88 4 y Blood samples were
Vitamin E (500 IU)/d
595/598 11/7 All-cause mortality
Agency &
27
Study (reference) Country Health status
Age (years)
Duration (mean, median
or range)
Supplement intake
assessment
Supplement exposure (median or range, units)
Participants(intervention
/control)
Incident cases
(intervention/control)
Outcome Funding source
(95)
collected to analyze conc.
Of α-tocopherol and total vitamin E
Industry
Meier et al., 2004 (96)
Southwestern Germany
Healthy men and postmenopausal
women33-78 2 y
Blood and urine samples collected in non-fasting
state
Oral cholecalciferol (500 IU/d) and
calcium (500 mg/d)
30/25 0/1 All-cause mortality N/A
Meydani et al., 2004 (97) USA
Respiratory Infections-elderly
nursing home residents
≥65 3 y
Pill count, medication
records, quarterly
measurement of plasma E
levels
Vitamin E (200 IU)/d 311/306 39/44 All-cause
mortalityAgency
& Industry
Aloia et al., 2005 (98) USA Healthy black
postmenopausal 50-75 3 y Pill Count 20 µg/day (800 IU) oral vitamin D3
104/104 F ½ All-cause mortality
Agency &
IndustryAvenell et al.,
2005 – MAVIS (99)
ScotlandElderly with or without chronic
illness≥65 1 y Diaries/tablet
counts Multivitamin 456/454 8/4 All-cause mortality Agency
Brazier et al., 2005 (100) France
Ambulatory with vitamin D deficiency
>65 1 y Blood and urine samples
Calcium carbonate 500 mg and
Vitamin D3 400 IU95/97 F
6/5 Total CVD
Industry3/0 MI1/1 Stroke
3/1 All-cause mortality
Flicker et al., 2005 (101) Australia Elderly Mean:
83.4 2 y
Compliance measured
according to the percentage
of thesupplements
removed from the subject’s medicationcontainer
Vitamin D (ergocalciferol,
initially 10,000 IU given once weekly and then 1,000 IU
daily)
313/312 76/85 All-cause mortality Agency
28
Study (reference) Country Health status
Age (years)
Duration (mean, median
or range)
Supplement intake
assessment
Supplement exposure (median or range, units)
Participants(intervention
/control)
Incident cases
(intervention/control)
Outcome Funding source
Graf et al., 2005 (102) Germany
Probable or definite ALS treated with
riluzole
59-57 18 months
Blood samples
Vitamin E (α-tocopherol) 5000
mg per day – distributed over the
active day or placebo.
83/77 31/28 All-cause mortality Industry
Grant et al., 2005 –
RECORD (103)UK Low trauma
fracture ≥70 24- 62 months
Blood sample taken for
analysis of 25-OH
vitamin D3
and PTH hormone
Vitamin D3 (800 IU per day) and
calcium (1000 mg per day)
1306/133244/39 MI
Agency &
Industry
60/48 Stroke
221/217 All-cause mortality
Calcium only1113/1128W
39/31 Total CHD
26/13 MI
2617/2675 464/434 All-cause mortality
Vitamin D only 2649/2643
78/84 MI
118/104 stroke
438/460 All-cause mortality
Lee et al., 2005 –WHS (104) USA Healthy 45 Mean:
10.1 yFollow-up
questionnaires
600 IU of natural-source vitamin E
on alternate days or placebo
19937/19939 F
482/517 Total CVD
Agency &
Industry
196/195 MI
241/246 Stroke
106/140 CVD mortality
12/14 MI mortality
21/24 Stroke mortality
636/615 F All-cause mortality
Limburg et al., 2005 (105) China
Patients with mild or moderate
esophagealsquamous dysplasia
26-73 10 months
Direct observation
and pill counts
selenomethionine 200 µg/day 90/90
1/0 MI mortality
Agency1/0 All-cause
mortality
29

Study (reference) Country Health status
Age (years)
Duration (mean, median
or range)
Supplement intake
assessment
Supplement exposure (median or range, units)
Participants(intervention
/control)
Incident cases
(intervention/control)
Outcome Funding source
Lonn et al., 2005 – HOPE and HOPE-TOO (106)
Canada
Patients with vascular disease
or diabetes mellitus
≥55 7 y Pill counts Vitamin E (400IU daily) 4761/4780
1022/985 Total CVD
Agency &
Industry
724/686 MI270/246 Stroke
482/475 CVD mortality
799/801 All-cause mortality
Mooney et al., 2005 (107) USA
Men and women smokers with ≥10
cigarettesper day and
serum cotinine ≥25 ng/mL
>18years old
(mean: 36.8±0
.6)
15 months
Serum measures and
pill counts
500 mg vitamin C and 400 IU vitamin E 142/142
1/0 MI mortality
Agency1/0 All-cause
mortality
Petersen et al, 2005 – ADCS 2
(108)
USA and Canada
Amnestic mild cognitive
impairment55-90 3 years n/a 2000 IU of vitamin
E daily 257/259 5/5 All-cause mortality
Agency and
Industry
Porthouse et al., 2005 (109) UK
One or morerisk factors for
hip fracture
≥70Mean: 76.9
25 months Self-reported
Calcium+Vitamin D
(1000 mgcalcium with 800 IU cholecaliferol
daily)
1321/1993 F 57/68 F All-cause mortality
Agency &
Industry
Potena et al., 2005 (110) Italy
Heart transplantation
recipients
Mean 54 1 y N/A
Folic acid:15 mg/day of 5-
methyltethrahydrofolate or placebo
26/25 1/0 All-cause mortality
Agency and
Industry
Sato et al., 2005 (111) Japan Poststroke
hemiplegiaMean: 74.1 2 y
Supplement administered
in the presence of a study nurse
Vitamin D(1000 IU
ergocalciferol daily)
48/48 F 1/2F All-cause mortality N/A
Bairati et al., 2006 (112) Canada Stage I or II head
and neck cancer 62.5 3 y Pill count 400 IU DL- α –tocopherol/d 194/190 65/47 All-cause
mortality Agency
Bonaa et al., 2006 –
NORVIT (113)
Norway MI 63 3.3 y Questionnaires
Vitamin B6 934/943175/172 Total
CVDAgency
& Industry161/153 MI
22/27 Stroke92/89 All-cause
30

Study (reference) Country Health status
Age (years)
Duration (mean, median
or range)
Supplement intake
assessment
Supplement exposure (median or range, units)
Participants(intervention
/control)
Incident cases
(intervention/control)
Outcome Funding source
mortality
61/59 MI mortality
B-complex 937/943
201/172 Total CVD
182/153 MI21/27 Stroke
68/59 MI mortality
104/89 All-cause mortality
Coyne et al., 2006 (114)
USA, Poland
Chronic kidney disease (stage 3&4) for > 2
months
>186 months (treatmen
t 24 weeks)
Serum levels
2 g paricalcitol thrice weekly; 4 ug thrice weekly, 1 ug daily, or 2 ug daily; avg weekly dose: 9.5+/- 3.81 ug or 1.3 to 1.4 ug per
day
107/113 2/1 All-cause mortality Industry
Daly et al.,2006 (115) Australia Healthy
50-87Mean: 61.9
2 y
Participant reporting
(compliance calendar)
Calcium+Vitamin D:
400 ml/day of reduced fatUHT milk
containing 1000 mg of calcium plus 800 IU of vitamin
D3
85/82 M 1/0 M All-cause mortality
Agency &
Industry
Law et al.,2006 (116)
United Kingdom Elderly 85 10 m Serum levels
2.5 mg ergocalciferol
every 3 m1762/1955 347/322 All-cause
mortality Agency
Lonn et al., 2006 – HOPE-
TOO (117)
Canada, USA
Brazil, western EU, and Slovakia
High risk (history of CVD, diabetes
or other risk factors)
69 5 y
Interview and pill count evaluation
every 6 months
B-complex (2.5 mg folic acid/d, 50 mg of vitamin B6/d & 1 mg of vitamin B12/d) or placebo
2758/2764
519/547 Total CVD
Agency &
Industry
341/349 MI
276/291 CVD mortality
470/475 All-cause mortality
Magliano et al., 2006 – MAVET
Australia Smokers > 55Mean:
4 y Phoned every 3 m, capsule
Vitamin E: 500 IU d- α –tocopherol/d
205/204 2/4 CVD mortality
Agency
31

Study (reference) Country Health status
Age (years)
Duration (mean, median
or range)
Supplement intake
assessment
Supplement exposure (median or range, units)
Participants(intervention
/control)
Incident cases
(intervention/control)
Outcome Funding source
(118) 63.5 count 9/17 All-cause mortality
Schleithoff et al., 2006 (119) Germany CHF 55.5 15 m
Bottle counts and serum
levels
50 g vitamin D3/d with 500 mg Ca/d or placebo with
500mg Ca/d
61/62 7/6 All-cause mortality Agency
Stranges et al., 2006 – NPC
(120)USA
Patients with histories of
nonmelanoma skin cancers
within the year prior to
randomization
62.3 7.6 yParticipant
reporting and blood samples
200 µg selenium/d 504/500
103/96 Total CVD
Agency
63/59 Total CHD
41/43 MI35/32 Stroke
40/31 CVD mortality
9/8 MI mortality
110/111 All-cause mortality
Zoungas et al., 2006 –
ASFAST (121)
Australia & New
Zealand
End stage renal disease
Avg: 57
(range 24-79)
3.6 N/A 15 mg folic acid or placebo daily 156/159
46/55 Total CVD
Agency
23/19 Total CHD
8/18 Stroke
21/24 CVD mortality
45/46 All-cause mortality
Bolton-Smith et al., 2007 (122) UK 2 y Pill counts
Calcium/Vitamin D(10µg (400 IU) vitamin D3 plus
1000 mg calcium/day)
62/61 0/1 All-cause mortality
Agency &
Industry
CLIPS Group 2007 (123) Europe
stage I-II Peripheral
Arterial Disease
Mean : 65.5 2 y Tablet/capsule
counts
Antioxidants:100 mg/d aspirin600 mg/d vitamin E + 250 mg/d
185/18116/11 Total
CVDIndustry9/4 MI
6/5 Stroke
32

Study (reference) Country Health status
Age (years)
Duration (mean, median
or range)
Supplement intake
assessment
Supplement exposure (median or range, units)
Participants(intervention
/control)
Incident cases
(intervention/control)
Outcome Funding source
vitamin C + 20 mg/d β-carotene both
6/3 CVD mortality
2/2 MI mortality
3/0 Stroke mortality
7/4 All-cause mortality
Cole et al., 2007 – AFPPS (124)
USACANADA
History of colorectal adenomas
Mean 57y 10y
Participant reporting and blood samples
1 mg/d folic acid or placebo 516/505
14/8 MIAgency
& Industry
9/5 Stroke
10/19 All-cause mortality
Cook et al., 2007 – WACS
(125)
USA Patients with history of CVD, or at least three
cardiac risk factors
≥40Mean: 60.6
9.4 y Self-report
β-carotene: 50 mg every other day 4084/4087 F
435/399 Total CVD
Agency &
Industry500/499 Total CHD
135/139 MI161/137 Stroke
211/184 CVD mortality
10/24 MI mortality
22/11 Stroke mortality
505/490 F All-cause mortality
Vitamin C: 500 mg daily
4087/4084 F 419/415 Total CVD
510/489 Total CHD
140/134 MI138/160 Stroke
206/189 CVD mortality
15/19 MI mortality
15/18 Stroke
33
Study (reference) Country Health status
Age (years)
Duration (mean, median
or range)
Supplement intake
assessment
Supplement exposure (median or range, units)
Participants(intervention
/control)
Incident cases
(intervention/control)
Outcome Funding source
mortality
504/491 F All-cause mortality
600 IU Vitamin E every other day 4083/4088 F
399/435 Total CVD
491/508 Total CHD
131/143 MI137/151 Stroke
193/202 CVD mortality
18/16 MI mortality
18/15 Stroke mortality
502/493 F All-cause mortality
Antioxidants: vitamin C (500mg daily), E (600IU every other day), and beta-carotene (50mg every other
day)
1020/1022F 133/124F All-cause mortality
Durga et al., 2007 – FACIT
(126)Netherlands High plasma
homocysteine
50 -70Mean:
603 y
Capsule return count,
diary.800 g folic acid/d 405/413 8/4 All-cause
mortality
Agency &
industry
Jamison et al., 2007 – HOST
(127)USA End stage renal
failure65.8(>20) 3.2 y Serum level
B-complex (100 mg vitamin B6, 2
mg vitamin B12 and 40 mg folic acid)
1032/1024129/150 MI Agency
& industry
37/41 Stroke
448/436 All-cause mortality
Lappe et al., 2007 (128) Nebraska Postmenopausal
women >55 4 y Bottle weight 1500mg Ca/d (Calcium) and 446/288 F 3/2 MI Industry
34
Study (reference) Country Health status
Age (years)
Duration (mean, median
or range)
Supplement intake
assessment
Supplement exposure (median or range, units)
Participants(intervention
/control)
Incident cases
(intervention/control)
Outcome Funding source
1000 IU cholesalciferol/d (Vitamin D) or
placebo
6/4 Stroke
Liu et al., 2007 (129) Canada Long-term care
residents 85 19 months Pill counts Multivitamin 375/373 96/97 All-cause
mortality Agency
Lyons et al., 2007 (130)
United Kingdom
Healthy patients and those with
mobility, cognitive,
visual, hearing or communication
impairments
84 3 y
Dosing was supervised by the research
nurse to record
adherence
Vitamin D:Two 1.25 mg
vitamin D2 tablets (ergocalciferol) or matched placebo three times a year (i.e., 100,000 IU,
four-monthly)
1725/1715 947/953 All-cause mortality Agency
Plummer et al., 2007 (131) Venezuela
Healthy patients from a high-risk for gastric cancer
population
35-69 3 y Capsule counts
Antioxidants: 750 mg vitamin C +
600 mg vitamin E + 18 mg β-carotene
daily
990/990
1/0 TotalCVD Agency
and Industry16/11 All-cause
mortality
Smith et al., 2007 (132)
UK(England) Healthy ≥75 3 y
Intramuscular injections by
nurses
Vitamin D:300 000 IU
intramuscular ergocalciferol injection every autumn over 3
years
4727/4713 355/354 All-cause mortality
Agency &
Industry
Vianna et al., 2007 (133) Brazil End stage renal
disease ≥18 2 y Nurse supervision
10 mg folic acid 3 times / week 93/93
9/9 Total CVD
Agency17/21 CVD mortality
23/30 All-cause mortality
Albert et al., 2008 –
WAFACS (134)USA
Post-menopausal with either a
history of CVD or ≥3 coronary
≥ 42 7.3 y
Calendar packs
containing active agents
B-complex (2.5 mg of folic acid, 50 mg of vitamin B6, and 1 mg of vitamin
2721/2721 F205/211 Total
CVD Agency283/280 Total
CHD
35

Study (reference) Country Health status
Age (years)
Duration (mean, median
or range)
Supplement intake
assessment
Supplement exposure (median or range, units)
Participants(intervention
/control)
Incident cases
(intervention/control)
Outcome Funding source
risk factors or placebos mailed
monthly. Annual
participant reporting
B12)/d
65/74 MI
79/69 Stroke
96/94 CVD mortality
250/256 F All-cause mortality
Bjorkman et al., 2008 (135) Finland Aged chronically
immobile patients
65-104Mean: 84.5
6 months Nurses supervision
Vitamin D:400 IU or 1200 IUcholecalciferol per
day
73/68 10/9 All-cause mortality
Agency &
industry
Bolland et al., 2008 (136)
New Zealand
Healthy post-menopausal
women74 5 y Tablet counts 1g of elemental
calcium 732/739 F
101/54 Total CVD
Agency and
industry
45/19 MI52/34 Stroke
4/1 CVD mortality
38/30 F All-cause mortality
CTNS 2008 (137) Italy Early cataract or
no cataract 55-75 9 y Tablet counts Multivitamin 510/51023/31 CVD
mortality Agency77/81 All-cause
mortality
Ebbing et al., 2008-WENBIT
(138)Norway
Patients with suspected CAD
and/or aortic valve stenosis
61.6 3.2 yCapsule count
and interviews
Vitamin B6 772/780
55/58 MI
Agency &
Industry
20/19 Stroke
28/30 All-cause mortality
B-complex 772/780
59/58 MI
11/19 Stroke
35/30 All-cause mortality
Guyton et al., 2008 (139) USA Type 11a or 11b
Hyperlipidemia 18-7924 weeks (part 1 of 64 week
N/A Vitamin B3 (niacin): 2g/day 670/272 1/0 Total
CHD Industry
36
Study (reference) Country Health status
Age (years)
Duration (mean, median
or range)
Supplement intake
assessment
Supplement exposure (median or range, units)
Participants(intervention
/control)
Incident cases
(intervention/control)
Outcome Funding source
study) 1/1 MI0/1 Stroke
Logan et al., 2008 – UK CAP
(140)
United Kingdom,Denmark
History of colorectal adenomas
Mean 57.8 3 y
Participant reporting and
pill count
0.5 mg of folic acid supplementation
with or without 300 mg enteric-coated
aspirin
470/469
3/0 MI Agency &
Industry1/1 Stroke
1/7 All-cause mortality
Milman et al., 2008 (141) Israel
Patients with type 2 diabetes mellitus
>55
Mean 68.7-69.5
18 months
Participant reporting
Vitamin E (natural source d-alpha
tocopherol) 400 IU/d or placebo
726/708
16/33 Total CVD
Agency
7/17 MI
6/11 Stroke
3/5 CVD mortality
11/12 All-cause mortality
Prince et al., 2008 (142) Australia
History of falling in past 12 months
and plasma 25OHD
concentration of < 24.0 ng/mL
70-90 1 y Pill counts
1000 IU/d of ergocalciferol with
or without 1000 mg/d of calcium as
calcium citrate
151/151 F2/3 MI Agency
& Industry
3/3 Stroke
0/1 All-cause mortality
Reid et al., 2008 (143)
New Zealand Healthy
> 40 (average 57)
2 y
A staff member
dispensed the study
medication into numbered
containers.
600 mg calcium citrate/d, 1200 mg calcium citrate/d,
or placebo
108/107 M
2/0 MI
Agency
1/1 All-cause mortality
Sesso et al., 2008 – PHS II
(144)USA
Healthy and also allowed: MI,
stroke, or cancer 64.4 Mean 8 y Participant reporting
Vitamin E (400 IU synthetic_-
tocopherol) every other day with or without vitamin C
3659/3653 M
310/316 Total CVD Agency
& Industry
107/144 MI
133/113 Stroke
37

Study (reference) Country Health status
Age (years)
Duration (mean, median
or range)
Supplement intake
assessment
Supplement exposure (median or range, units)
Participants(intervention
/control)
Incident cases
(intervention/control)
Outcome Funding source
(500 mg synthetic ascorbic acid).
131/122 CVD mortality
Antioxidants (vitamin E and
vitamin C)
3656/3653 M
310/316 Total CVD
133/144 MI104/113 Stroke
127/122 CVD mortality
Vitamin C 500 mg 3673/3653 M
309/316 Total CVD
127/144 MI114/113 Stroke
129/122 CVD mortality
Zhu et al., 2008 – CAIFOS
(145)Australia Elderly living in
a sunny climate 70 -80 5y
Tablet count every 12 months.
Follow-up assessments at 1, 3, and 5 yr at the same time of year
Calcium + Vitamin D:
1200mg/d calcium with placebo with 1000 IU/d vitamin
D2
39/41 F 0/2 All-cause mortality Agency
Anker et al., 2009 – FAIR-
HF (146)USA Chronic heart
failure67.6 years 24 weeks Patients
reporting200 mg of
intravenous iron 304/155
21/22 Total CVD
Industry2/3 MI
4/4 CVD mortality
5/4 All-cause mortality
Hodis et al., 2009 – BVAIT
(147)USA
Men and postmenopausal
women with fasting tHcy≥8.5 μmol/L and no
clinical
40-89 3.1 y Pill count and blood samples
B-complex (folic acid 5 mg +
vitamin B12 0.4 mg + vitamin B6 50 mg) or placebo
254/252
9/11 Total CVD Agency
& Industry0/2 All-cause
mortality
38
Study (reference) Country Health status
Age (years)
Duration (mean, median
or range)
Supplement intake
assessment
Supplement exposure (median or range, units)
Participants(intervention
/control)
Incident cases
(intervention/control)
Outcome Funding source
signs/symptoms
Imasa et al., 2009 (148) Phillipines
Unstable angina or NSTEMI in the previous 2
weeks.
Mean 59.1-59.6
6 months
Compliance rate was
measure in both treatment
and control
B-complex (1mg folic acid, 400 µg vitamin B12, and
10 mg vitamin B6) or placebo daily
118/125
15/13 Total CHD
Agency0/1 Stroke
22/20 All-cause mortality
LaCroix et al., 2009 – WHI
(149)USA Healthy
(postmenopausal)
50-79Mean: 62.4
7 yweighing
returned pill bottles during clinic visits
Calcium+Vitamin D
(1000 mg of elemental calcium
as calcium carbonate with 400 IU of vitamin D3
daily)
18176/18106 F
226/244 F CVD mortality
Agency &
Industry130/128 F CHD mortality
54/60 F Stroke mortality
Lippman et al., 2009 –
SELECT (150)
USA,Canada,
Puerto Rico
No prior prostate-cancer diagnosis,
serum prostate specific antigen 4
ng/ml or less
50-75+ Median: 5.46 y (range,
4.17 – 7. 33 y).
Pill counts and serum
levels
Selenium 200 μg/d 8856/8910 M
1080/1050 Total CVD
Agency &
Industry
82/100 Stroke
129/142 CVD mortality
9/8 Stroke mortality
378/382 All-cause mortality
Vitamin E400 IU/d
8863/8910 M 1034/1050 Total CVD
70/92 Stroke
119/142 CVD mortality
9/8 Stroke
39
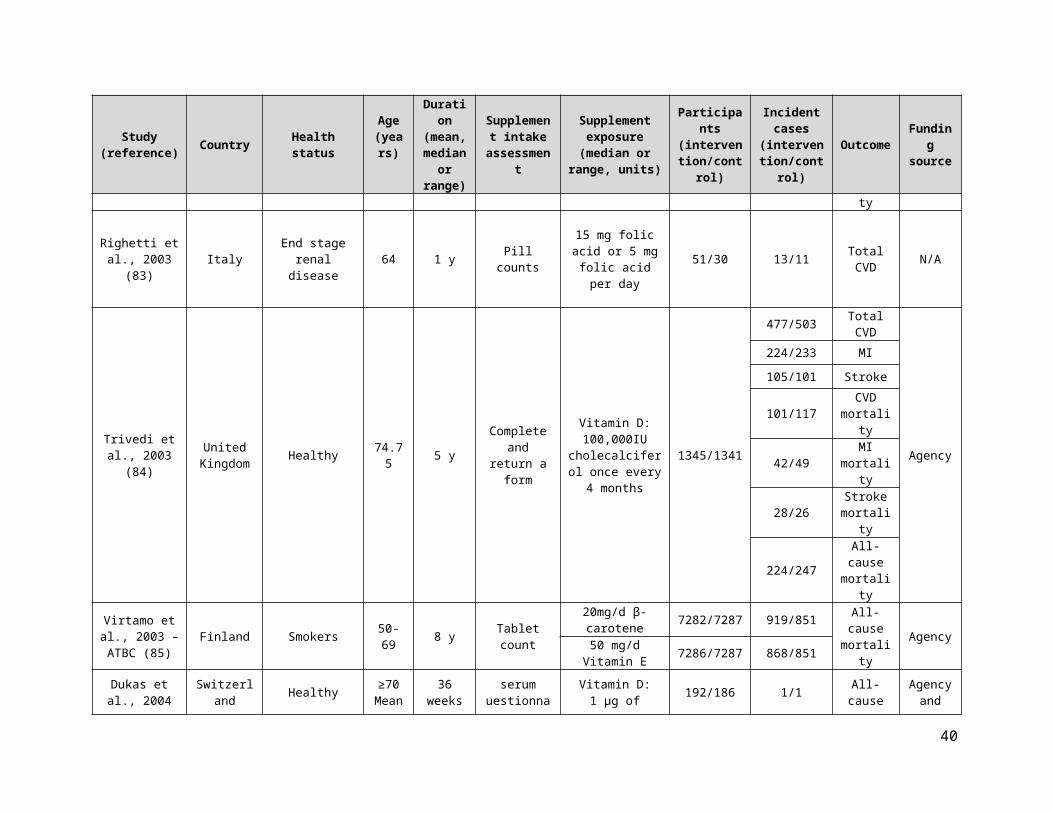
Study (reference) Country Health status
Age (years)
Duration (mean, median
or range)
Supplement intake
assessment
Supplement exposure (median or range, units)
Participants(intervention
/control)
Incident cases
(intervention/control)
Outcome Funding source
mortality
358/382 All-cause mortality
Selenium and Vitamin E
8904/8910M
1041/1050 Total CVD
111/100 Stroke
117/142 CVD mortality
12/8 Stroke mortality
359/382 All-cause mortality
Saposnik et al., 2009 – HOPE 2
(151)
Canada, USA,Brazil,
western EU, and Slovakia
History of CHD, CVD, or
peripheral arterial disease, or
diabetes mellitus and at least 1
additional CVD risk factor
Mean 68.9 5 y
Participant reporting and
pill count
B-complex (2.5 mg of folic acid, 50 mg of vitamin B6, and
1 mg of vitamin B12) or placebo
2758/2764
111/147 Stroke Agency &
Industry
27/30 Stroke mortality
Sang et al., 2009 (152) China
Coronary artery disease Mean:
7112
months N/A
10 mg/d atorvastatin +
extended-releaseniacin initially 500 mg/d for 30 days, then 1000 mg/d
52/56 0/1 All-cause mortality N/A
Wu et al., 2009 – NHS/HPFS
(153)USA
History of colorectal adenoma
50-78Mean 64.1
months
Capsule count and blood samples to
assess adherence
1mg/d of folic acid or placebo
338/334
6/1 MI
Agency &
Industry
4/3 Stroke
0/3 CVD mortality
7/15 All-cause mortality
Armitage et al., 2010 –
SEARCH (154)UK History of MI 64 6.7 y
Adherencewas assessed by reviewing the calendar-
packedtablets
remaining
B-complex (2 mg folic acid + 1 mg vitamin B12/d) or matching placebo
6033/6031
1537/1493 Total CVD
Agency &
Industry
1229/1185 Total CHD
431/429 MI
269/265 Stroke
40

Study (reference) Country Health status
Age (years)
Duration (mean, median
or range)
Supplement intake
assessment
Supplement exposure (median or range, units)
Participants(intervention
/control)
Incident cases
(intervention/control)
Outcome Funding source
578/559 CVD mortality
463/423 CHD mortality
185/170 MI mortality
59/65 Stroke mortality
983/951 All-cause mortality
Chailurkit et al., 2010 (155) Thailand Postmenopausal
w/o osteoporosis 60-97 2 y Tablet count at each visit
500 mg elemental Ca/d 201/196 F
2/0 Total CVD Agency
& Industry1/1 W All-cause
mortality
de Zeeuw et al., 2010 – VITAL
(156)
USA, Europe
Type 2 Diabetes Mellitus,
oncentrati & consuming ACE inhibitors for ≥3
months
> 20 24 weeks
Collect blood sample 5x for
plasma paricalcitrol
concentration.
1 μg paricalcitol & 2 μg paricalcitol/d 95/93
1/0 Total CHD
Industry2/0 MI1/0 Stroke
1/0 All-cause mortality
Galan et al., 2010 –
SU.FOL.OM3(157)
France
History of MI, unstable angina,
or ischaemic stroke
45-80 4.7 y
Compliance with treatment
was self-reported in the
biannual questionnaires
(or by telephone interview).
B-complex (560ug 5-
methyltetrahydrofolate, 3mg B6, 20ug
B12) daily
1242/1259
75/82 Total CVD
Agency &
Industry
49/55 Total CHD
28/32 MI
35/48 Stroke
26/14 CVD mortality
72/45 All-cause mortality
Heinz et al., 2010 (158)
Germany End stage renal disease
20-80 6 y Dosing was supervised by the research
B-complex :1 tablet contained 2.5 mg folic acid,
327/323 83/98 Total CVD
Agency &
Industry20/19 MI
41

Study (reference) Country Health status
Age (years)
Duration (mean, median
or range)
Supplement intake
assessment
Supplement exposure (median or range, units)
Participants(intervention
/control)
Incident cases
(intervention/control)
Outcome Funding source
nurse to record
adherence
25ug cobalamin,& 10 mg vitamin B6 (2 tablets were taken 3 times per
11/15 Stroke
37/32 CHD mortality
102/92 All-cause mortality
Hercberg et al., 2010 –
SU.VI.MAX (159)
France Healthy 35-60 Mean: 7.5 y
Monthly questionnaire
Antioxidants:120 mg/d ascorbic
acid + 30 mg/d vitamin E + 6 mg/d β-carotene + 100
µg/d selenium + 20 mg/d zinc
6377/6364
137/143 Total CVD Agency
& Industry
77/99 All-cause mortality
House et al., 2010 – DIVINe
(160)Canada
History of Type 1or 2 diabetes & a clinical diagnosis
ofdiabetic
nephropathy
> 18 6 y
Pill counts aevery clinic
visit &annual
measurements of plasma
total homocysteine, serum folate, & serum B12.
B-complex (folic acid 2.5mg/d; B6
25mg/d; B12 1mg/d)
119/119
8/4 MI
Agency &
Industry6/1 Stroke
7/6 All-cause mortality
Janssen et al., 2010 (161) Netherlands Geriatric patients >65 6 months
Compliance calculated as a percentage of
trial medication
taken
Vitamin Dcholecalciferol 400
IU/day36/34 F 1/0 F All-cause
mortality Agency
Salovaara et al., 2010 – OSTRE-
FPS (162)Finland Postmenopausal 65-71 3 y
Tablet count at end of
study
800 IU cholecalciferol &
1000 mg elemental Ca/d
1586/1609 F 15/13 F All-cause mortality
Agency &
Industry
Sanders et al., 2010 – Vital D
(163)Australia Elderly with high
risk of fractured ≥70 5 y
Study staff confirmed by telephone the ingestion of
study medication
within 2
Vitamin D:500 000 IU
cholecalciferol/year
1131/1127 F17/13 Total
CVDAgency
40/47 All-cause mortality
42
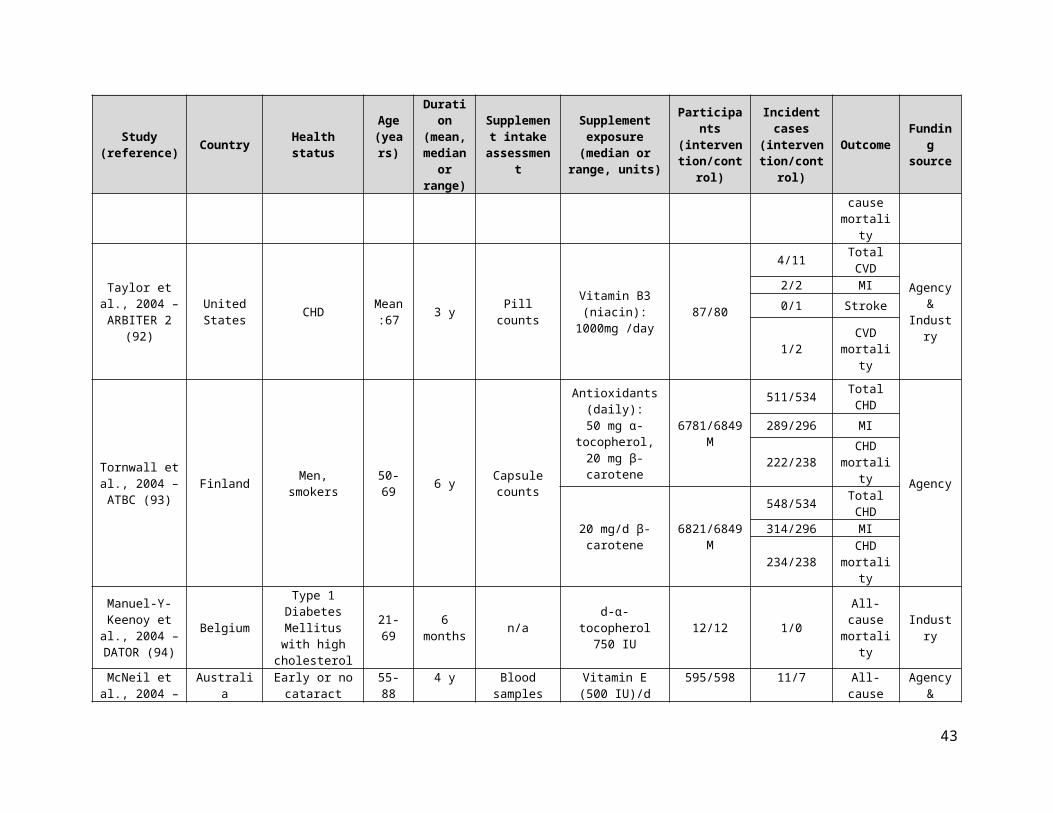
Study (reference) Country Health status
Age (years)
Duration (mean, median
or range)
Supplement intake
assessment
Supplement exposure (median or range, units)
Participants(intervention
/control)
Incident cases
(intervention/control)
Outcome Funding source
weeks.
Sanyal et al., 2010 – PIVENS
(164)USA Nonalcoholic
steatohepatitisMean: 46.3
120 weeks
(96 weeks of treatment
+ 24 weeks of follow-
up)
N/A Vitamin E800 IU /d 84/83 1/0 All-cause
mortality
Agency &
Industry
VITATOPS Trial Study Group 2010
(165)
AustraliaNorth-
AmericaAsia
South-AmericaEurope
History of stroke/TIA 63 3.4 years N/A
B-complex (2 mg folic acid/d , 25mg
B6, 0.5mg B12)4089/4075
616/678 Total CVD
Agency &
Industry
118/114 MI360/388 Stroke
328/380 CVD mortality
614/633 All-cause mortality
Boden et al., 2011 – AIM HIGH (166)
USA and Canada CVD ≥45 3 y Pill counts
Vitamin B3 (niacin): 1500-
2000mg per day1718/1696
171/158 Total CVD
Agency &
Industry
104/93 MI
30/18 Stroke
45/38 CVD mortality
38/34 CHD mortality
96/82 All-cause mortality
Cherniack et al., 2011 (167) USA elderly veterans ≥ 70 6 months serum Vitamin D: 2000
IU/d 23/23
1/1 MIAgency
& industry
1/0 MI mortality
1/0 All-cause mortality
Grimnes et al., 2011 (168) Norway Healthy Mean:
53 6 months
Phone call by study nurses at month 1 and 3 + pill
counts
Vitamin D:20,000 IU vitamin D3 twice weekly
51/53 0/1 All-cause mortality Agency
43

Study (reference) Country Health status
Age (years)
Duration (mean, median
or range)
Supplement intake
assessment
Supplement exposure (median or range, units)
Participants(intervention
/control)
Incident cases
(intervention/control)
Outcome Funding source
Lewis et al., 2011 – CAIFOS
(169)Australia Healthy
postmenopausal 75.1 5 y
Medication return and
tablet counting
1200 mg calcium/d 730/730 F
104/103 Total CVD
Agency
63/63 MI36/33 Stroke
18/24 CVD mortality
13/9 MI mortality
6/8 Stroke mortality
29/38 All-cause mortality
Gallagher et al., 2012 – VIDOS
(170)USA
≥7 years postmenopausal with Vitamin D
insufficiency
67 1 y
Food diary, serum
analysis, urine sample every
3months
Vitamin D3 400-4800 IU once daily 20/21 F 1/0 Stroke Agency
Marshall et al., 2011 (171) USA
HGPIN with no evidence of
cancer≥40 3 y Pill counts 200 µg/d selenium 212/211 4/6 All-cause
mortality Agency
Alvarez et al., 2012 (172) USA Early chronic
kidney disease 62 1 y Food records, serum levels.
50,000 IU Vitamin D3/wk for 12 wk
followed by 50,000 IU every other wk
for 40 wk.
24/24 1/1 All-cause mortality Agency
Glendenning et al., 2012 (173) Australia Healthy
(postmenopausal)
≥70Mean: 76.7
9 monthsUnder
supervision of study staff
Vitamin D:150,000 IU oral cholecalciferol every 3 months
353/333 F 2/0 F All-cause mortality
Agency &
Industry
44

Study (reference) Country Health status
Age (years)
Duration (mean, median
or range)
Supplement intake
assessment
Supplement exposure (median or range, units)
Participants(intervention
/control)
Incident cases
(intervention/control)
Outcome Funding source
Lehouck et al., 2012 (174) Belgium Hospitalized
COPD patients 68 1 y Oral syringe dispensers
100,000 IU vitamin D/4 weeks 91/91 9/6 All-cause
mortality Agency
Ma et al., 2012 – SIT (175) China
Seropositive for Helicobacte
pylori35-64 7.3 y
Tablet counts and serum
measurements
Antioxidants:500mg Vitamin C
+ 200IU Vitamin E + 15mg β-carotene + 75µg selenium
(β-carotene component was
discontinued after 6 months)
1706/1705
10/14 Stroke mortality
Agency
82/101 All-cause mortality
Punthakee et al., 2012 – TIDE
(176)33 countries
Type 2 Diabetes Mellitus and
other CVD risk factors
≥50 5.5 y N/A 1,000 IU vitamin D/day 607/614
2/3 Total CVD
Industry
1/1 MI1/1 Stroke
0/1 CVD mortality
0/2 All-cause mortality
Sesso et al., 2012 – PHS II
(177)USA Healthy 64.3 11.2 y
Annual mailed
questionnaireMultivitamin 7317/7324 M
876/856 Total CVD
Agency &
industry
317/335 MI
332/311 Stroke
408/421 CVD mortality
27/43 MI mortality
89/76 Stroke mortality
1345/1412 All-cause
45

Study (reference) Country Health status
Age (years)
Duration (mean, median
or range)
Supplement intake
assessment
Supplement exposure (median or range, units)
Participants(intervention
/control)
Incident cases
(intervention/control)
Outcome Funding source
mortality
Delanaye et al., 2013 (178) Belgium Hemodialysed
Patients ≥18 1 y
Supplements were taken
with a nurse ensuring
compliance
Vitamin D:Cholecalciferol
(25000 IU) therapy or placebo every 2
weeks
22/21 6/5 All-cause mortality N/A
Hewitt et al., 2013 (179) Australia
Patients on a thrice-weekly
hemodialysis for ≥ 3 months & with screening
levels of 25(OH)D ≤24ng/ml
(60nmol/L)
≥ 18 ≥6 months
Supplements provided by dialysis staff
to ensure compliance
10 ml of an oral solution of medium chain triglyceride containing 50000
IU of cholecalciferol or placebo. Taken
weekly for the first 8 weeks, followed by monthly doses
for 4 months.
30/30 1/1 All-cause mortality Industry
Lamas et al., 2013 – TACT
(180)
USA & Canada Post MI 65 3 y
Unused pills returned to
site
Multivitamins (28-component mixture)
853/855
94/115 Total CVD
Agency
58/61 MI8/15 Stroke
45/56 CVD mortality
87/93 All-cause mortality
Manning et al., 2013 (181)
New-Zealand
Metabolic syndrome 27-80 1 y Pill counts Vitamin E
(100 IU/day) 36/40 0/1 All-cause mortality
Agency &
industry
Prentice et al., 2013 –WHI CaD (182) USA Postmenopausal 50-79 Mean 7.2
y Semiannual pill counts
1000 mg of calcium + 400 IU Vitamin D3 (daily, given in two equal doses) or placebo.
Concurrent supplementation was permitted.
7718/7584 F(no personal supplement
users)
848/813 Total CVD
Agency
229/211 Total CHD
193/167 MI
184/162 Stroke
331/338 All-cause mortality
46

Study (reference) Country Health status
Age (years)
Duration (mean, median
or range)
Supplement intake
assessment
Supplement exposure (median or range, units)
Participants(intervention
/control)
Incident cases
(intervention/control)
Outcome Funding source
Witham et al., 2013 – VitDISH
(183)
United Kingdom
Isolated systolic hypertension &
baseline 25OHD level < 30 ng/ml
≥ 70 mean:
772 y
Patients were observed ingesting
supplement
Vitamin D:A total of 100 000
U of oral cholecalciferol or placebo every 3
months for 1 year.
80/79
2/2 Total CHD
Agency3/1 Stroke
0/1 All-cause mortality
Witham et al., 2013 (184) UK
History of myocardial infarction
66 (mean) 6 months n/a
Vitamin D3300,000
units39/36
5/4 Total CVD Agency
1/0 All-cause mortality
HPS2-THRIVE Collaborative Group 2014
(185)
United Kingdom,
China, Scandinavia
History of MI, CVD, peripheral arterial disease,
DM, & symptomatic
coronary disease
50-80 Median:3.9 y
Self-reported consumption & blood tests
2 g vitamin B3 (niacin)/d 12838/12835
1696/1758 Total CVD
Agency &
industry
668/694 Total CHD
402/431 MI498/499 Stroke
302/291 CHD mortality
798/732 All-cause mortality
Wang et al., 2014 – OPERA
(186)Hong Kong
Stage 3-5 CKD with LV
hypertrophy18-75 52 weeks
Recorded during visits at weeks 6,
12, 24, 36, 48, and 52.
Vitamin D: Oral paricalcitrol (1ug)
once daily30/30
0/6 Total CVD
Agency0/2 MI
0/2 Stroke
Van Wijngaarden et al., 2014 – B-PROOF (187)
Netherlands
Living independently with elevated homocysteine (12-50µmol)
≥65 2 yTablet counts,
periodic phone calls
B-complex (500µg vitamin B12 plus 400µg folic acid)
or placebo
1516/1511 37/42 All-cause mortality Agency
Wang et al., 2014 – PHS II
(188)USA Healthy
≥50(mean: 64.3)
Mean: 10.3 y
Self-reported (questionnaire
)
Vitamin E400 IU synthetic α-
tocopherol on alternate days
3659/3653M 397/406 M All-cause mortality
Agency &
industryVitamin C 3673/3653 M 414/406 MAntioxidants
(Vitamin E and C) 3656/3653 M 440/406 M
47
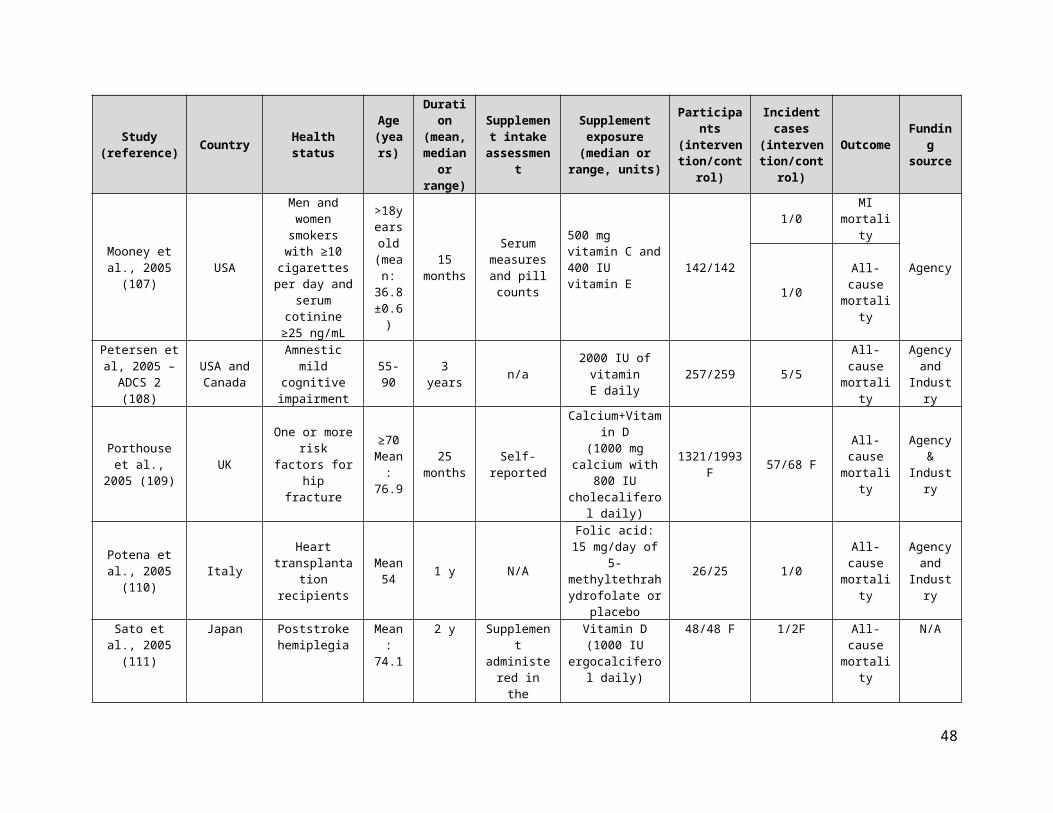
Study (reference) Country Health status
Age (years)
Duration (mean, median
or range)
Supplement intake
assessment
Supplement exposure (median or range, units)
Participants(intervention
/control)
Incident cases
(intervention/control)
Outcome Funding source
Huo et al., 2015 – CSPPT (189) China Hypertension 60 4.5 y Participant
reporting0.8 mg /d of folic
acid 10348/10354
324/405 Total CVD
Agency &
industry
25/24 MI282/355 Stroke
43/43 CVD mortality
5/4 MI mortality
18/10 Stroke mortality
302/320 All-cause mortality
Ponikowski et al., 2015 –
CONFIRM-HF (190)
Austria, Italy,
Poland, Portugal, Russia, Spain,
Sweden, UK, Ukraine
Heart failure 68 52 weeksIntervention delivered by
injection
i.v.iron, as ferric
carboxymaltose150/151
11/12CVD
mortality
Industry
12/14All-cause mortality
Wang et al., 2015 (191) China Healthy 60–74 1 y
Number of capsules
consumedwas recorded
to monitor compliance
400 µg folic acid, 2 mg vitamin B6, 10
µg vitamin B12195/195 4/6
All-cause mortality Agency
Van Dijk et al., 2015 –
B-PROOF (192)Netherlands
Living independently with elevated homocysteine (12-50µmol)
≥65 2 yTablet counts,
periodic phone calls
B-complex (500µg vitamin B12 plus 400µg folic acid)
or placebo
1516/1511181/170
Total CVD
Agency46/60 Stroke
45/43 MI
Gupta et al., 2016 (193) India
Ischaemic stroke survivors with
low serum vitamin D
(<75nmol/L)
60±11.3 6 months
Administered by healthcare
providers
Calcium + Vitamin D 25/28 4/11
All-cause mortality
None
Lappe et al., 2017 (194) USA Healthy
(postmenopausal) ≥556 y
(supplementation
Pill counts and returned
bottles
Calcium + Vitamin D (2000 IU/d
of vitamin D3 and 1156/1147 W 7/9 W All-cause
mortality
Agency &
industry
48

Study (reference) Country Health status
Age (years)
Duration (mean, median
or range)
Supplement intake
assessment
Supplement exposure (median or range, units)
Participants(intervention
/control)
Incident cases
(intervention/control)
Outcome Funding source
during 4 y) weighing 1500mg/d of
calcium)CHD, Coronary heart disease; CVD, cardiovascular disease; N/A, not available; T2DM, type two diabetes mellitus; CDPRG, The Coronary Drug Project Research Group; STOCKHOLM, Stockholm lschaemic Heart Disease Secondary Prevention Study; FATS, Familial Atherosclerosis Treatment Study;UCSF-SCOR, University of California, San Francisco, Arteriosclerosis Specialized Center of Research; CHAOS, Cambridge Heart Antioxidant Study; ADCS, Alzheimer’s Disease Cooperative Study; DATATOP, Deprenyl And Tocopherol AntioxidativeTherapy Of Parkinsonism; ATBC , The Alpha- Tocopherol, Beta-Carotene Cancer Prevention Study; CPPS, Calcium Polyp Prevention Study;OSTPRE, Kuopio Osteoporosis Study; SPACE, Secondary Prevention with Antioxidants of Cardiovascular disease in Endstage renal disease; HOPE, Heart Outcomes Prevention Evaluation; AREDS, Age-Related Eye Disease Study; HATS, The HDL-Atherosclerosis Treatment Study; PPP, Primary Prevention Project; VEAPS, The Vitamin E Atherosclerosis Prevention Study; The Swiss Heart Study, The Swiss Heart Study: A Randomized Control Trial; REACT, The Roche European American Cataract Trial; WAVE, Women’s Angiographic Vitamin and Estrogen; FITNESS, The Frailty Interventions Trial iN Elderly SubjectS; NoNOF, The Notthinghan Neck Of Femur Study; VECAT, Vitamin E, Cataract and Age-related Maculopathy Trial;ARBITER2, Arterial Biology for the Investigation of the Treatment Effects of Reducing Cholesterol; RECORD, Randomized Evaluation of Calcium Or vitamin D; VIP, Visual ImPairment Trial; WHI, Women’s Health Study; NORVIT, The NORwegian Viamin Trial; HOPE, Heart Outcomes Prevention Evaluation; ASFAST, Atherosclerosis and Folic Acid Supplementation Trial; MAVET, The Melbourne Atherosclerosis Vitamin E Trial; FACIT, Folic Acid and Carotid Intima-media Thickness; HOST, Homocysteinemia in Kidney and End Stage Renal Disease; ASCENT, AIPC (Androgenindependent Prostate Cancer) Study of Calcitriol Enhancing Taxotere; WAFACS, Women’s Antioxidant and Folic Acid Cardiovascular Study; CAIFOS, Calcium Intake Fracture Outcome Study UK CAP, The United Kingdom Colorectal Adenoma Prevention Trial; FERRIC- HF, Ferric Iron Sucrose in Heart Failure; PHS, Physicians Health Study; FAIR-HF, Ferinject Assessment in Patients with Iron Deficiency and Chronic Heart Failure Ttrial; BVAIT, The B-Vitamin Atherosclerosis Intervention Trial; WACS, The Women’s Antioxidant Cardiovascular Study; NHS/HPFS, Nurse’s Health Study/ Health Professionals Follow-up Study; SELECT, The Selenium and Vitamin E Cancer Prevention Trial; ARBITER, Arterial Biology for the Investigation of the Treatment Effects of Reducing Cholesterol; SEARCH, Study of the Effectiveness of Additional Reductions in Cholesterol and Homocysteine; SU.VI.MAX, The Supplémentation en Vitamines et Minéraux AntioXydants study; VITAL, VITamins And Lifestyle cohort CAIFOS, Calcium Intake Fracture Outcome Study; WAFACS, Women’s Antioxidant and Folic Acid Cardiovascular Study; UK CAP, The United Kingdom Colorectal Adenoma Prevention Trial; SELECT, The Selenium and Vitamin E Cancer Prevention
.
49

Supplementary Table 4. GRADE assessment for vitamin D
Certainty assessment Effect
Certainty№ of
studiesStudy design Risk of bias Inconsistency Indirectness Imprecision Other considerations Relative
(95% CI)Absolute(95% CI)
Vitamin D and total CVD risk (random effects model) - RCTs
6 randomised trials
not serious not serious not serious a serious b none c RR 0.95(0.86 to 1.05)
8 fewer per 1,000
(from 8 more to 23
fewer)
⨁⨁⨁◯MODERATE
Vitamin D and total CHD risk (random effects model) - RCTs
3 randomised trials
not serious not serious not serious d very serious e none c RR 0.97(0.22 to 4.22)
0 fewer per 1,000
(from 11 fewer to 45
more)
⨁⨁◯◯LOW
Vitamin D and MI risk (random effects model) - RCTs
12 randomised trials
not serious not serious not serious f serious g none RR 0.95(0.83 to 1.10)
3 fewer per 1,000
(from 6 more to 10
fewer)
⨁⨁⨁◯MODERATE
Vitamin D and stroke risk (random effects model) - RCTs
11 randomised trials
not serious not serious not serious h serious i none RR 1.12(0.94 to 1.34)
5 more per 1,000
(from 2 fewer to 14
more)
⨁⨁⨁◯MODERATE
Vitamin D and CVD mortality risk - (random effects model) - RCTs
2 randomised trials
not serious not serious not serious j serious k none c RR 0.86(0.66 to 1.10)
8 fewer per 1,000
(from 6 more to 21
fewer)
⨁⨁⨁◯MODERATE
Vitamin D and CHD mortality risk - (random effects model) - RCTs
2 randomised trials
not serious l not serious serious m very serious n none c RR 0.41(0.06 to 2.72)
16 fewer per 1,000(from 26
fewer to 47 more)
⨁◯◯◯VERY LOW
Vitamin D and stroke mortality risk - (random effects model) - RCTs
2 randomised trials
not serious o not serious not serious p serious q none c RR 1.13(0.68 to 1.87)
3 more per 1,000
(from 6 fewer to 18
more)
⨁⨁⨁◯MODERATE
Vitamin D and all-cause mortality risk (random effects model) - RCTs
43 randomised trials
not serious not serious not serious r not serious none RR 0.99(0.95 to 1.03)
2 fewer per 1,000
(from 5 more to 8
fewer)
⨁⨁⨁⨁HIGH
50
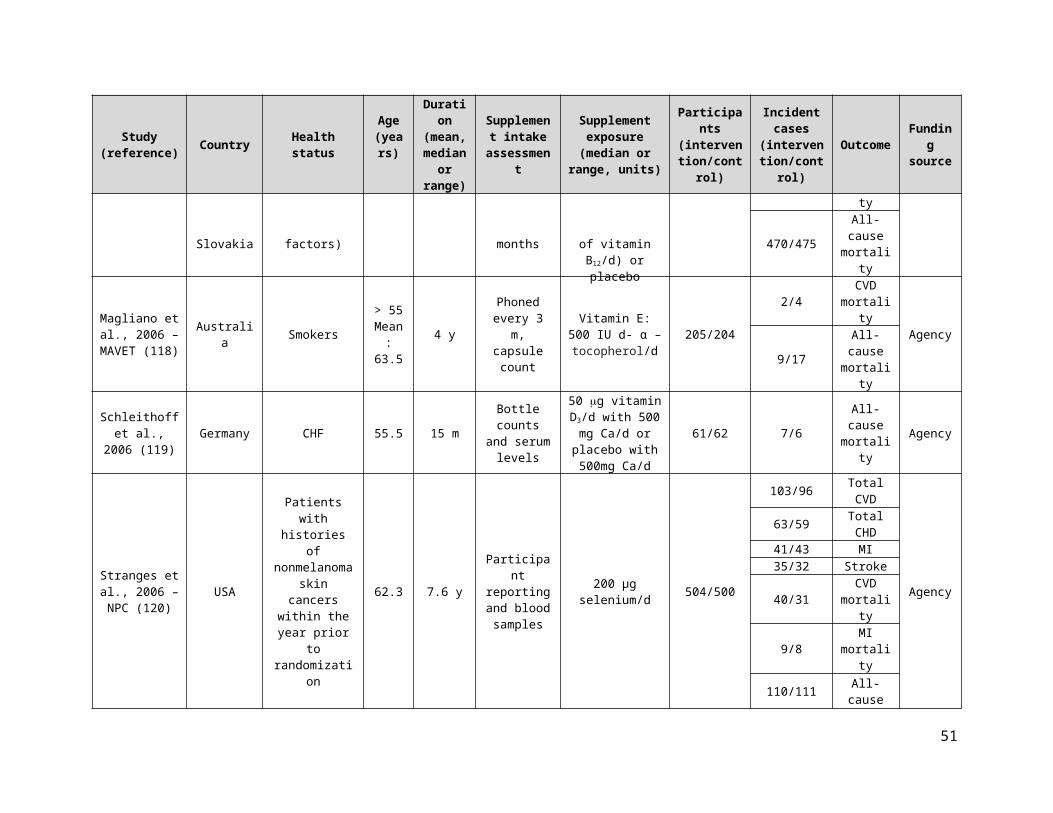
CI: Confidence interval; RR: Risk ratio
Explanationsa. No serious indirectness for vitamin D supplementation and total CVD risk (RCTs). Five of six studies were primary prevention and one study was secondary prevention. b. Serious imprecision for vitamin D supplementation and total CVD risk (RCTs), as the 95% CI (RR, 0.86-1.05) overlaps with the minimally important difference for clinical benefit (RR<0.95). c. Publication bias was not assessed since there were <10 studies. d. No serious indirectness for vitamin D supplementation and total CHD risk (RCTs). All 3 studies were primary prevention. e. Very serious imprecision for vitamin D supplementation and total CHD risk (RCTs) as the 95% CI (RR, 0.22-4.22) include both clinically important benefit (RR<0.95) and harm (RR>1.05). f. No serious indirectness for vitamin D supplementation and MI risk (RCTs). All 12 studies were primary prevention. g. Serious imprecision for vitamin D supplementation and MI risk (RCTs) as the 95% CI (RR, 0.83-1.10) include both clinically important benefit (RR<0.95) and harm (RR>1.05). h. No serious indirectness for vitamin D supplementation and stroke risk (RCTs). All 11 included studies were primary prevention. i. Serious imprecision for vitamin D supplementation and stroke risk (RCTs) as the 95% CI (RR, 0.94-1.34) include both clinically important benefit (RR<0.95) and harm (RR>1.05). j. No serious indirectness for vitamin D supplementation and CVD mortality risk (RCTs). Both studies were primary prevention. k. Serious imprecision for vitamin D supplementation and CVD mortality risk (RCTs) as the 95% CI (RR, 0.66-1.10) include both clinically important benefit (RR<0.95) and harm (RR>1.05). l. No serious risk of bias for vitamin D supplementation and total CHD mortality risk (RCTs) despite one study being high risk and the other being unclear for random sequence allocation. m. Serious indirectness for vitamin D supplementation and CHD mortality risk (RCTs) as 61% of the study population were hemodialysis patients. n. Very serious imprecision for vitamin D supplementation and CHD mortality risk (RCTs) as the 95% CI (RR, 0.06-2.72) include both clinically important benefit (RR<0.95) and harm (RR>1.05). o. No serious risk of bias for vitamin D supplementation and stroke mortality risk (RCTs) despite one study being high risk and the other being unclear for random sequence allocation. p. No serious indirectness for vitamin D supplementation and stroke mortality risk (RCTs). Both studies were primary prevention. q. Serious imprecision for vitamin D supplementation and stroke mortality risk (RCTs) as the 95% CI (RR, 0.68-1.87) include both clinically important benefit (RR<0.95) and harm (RR>1.05). r. No serious indirectness for vitamin D supplementation and all-cause mortality risk (RCTs). All 44 studies were primary prevention.
Supplementary Table 5. GRADE assessment for vitamin A
Certainty assessment Effect
Certainty№ of
studiesStudy design Risk of bias Inconsistency Indirectness Imprecision Other considerations Relative
(95% CI)Absolute(95% CI)
Vitamin A and all-cause mortality (random effects model) - RCTs
1 randomised trials
not serious not serious a serious c serious d none b RR 0.99(0.56 to 1.72)
0 fewer per 1,000
(from 9 fewer to 15
more)
⨁⨁◯◯LOW
CI: Confidence interval; RR: Risk ratio
Explanationsa. Unable to assess inconsistency as only one study was included. b. Publication bias was not assessed as there were < 10 studies. c. Serious indirectness for vitamin A supplementation and all-cause mortality risk (RCTs), as the only included study was conducted among a population with actinic keratoses and squamous cell carcinoma or basal cell carcinoma skin cancers. d. Serious imprecision for vitamin A and all-cause mortality risk (RCTs), as the 95% CI (RR, 0.56-1.72) include both clinically important benefit (RR<0.95) and harm (RR>1.05).
Supplementary Table 6. GRADE assessment for beta-carotene
Certainty assessment Effect Certainty
№ of studies
Study design Risk of bias Inconsistency Indirectness Imprecision Other considerations Relative
(95% CI)Absolute(95% CI)
Beta-carotene and total CVD risk (random effects model) - RCTs
3 randomised trials
not serious not serious not serious a serious b none c RR 1.03(0.96 to 1.10)
1 more per 1,000
(from 2 fewer to 4
more)
⨁⨁⨁◯MODERATE
Beta-carotene and total CHD risk (random effects model) - RCTs
51

Certainty assessment Effect Certainty
№ of studies
Study design Risk of bias Inconsistency Indirectness Imprecision Other considerations Relative
(95% CI)Absolute(95% CI)
2 randomised trials
not serious not serious serious e serious f none c RR 1.02(0.94 to 1.10)
2 more per 1,000
(from 6 fewer to 9
more)
⨁⨁◯◯LOW
Beta-carotene and MI risk (random effects model) - RCTs
3 randomised trials
not serious not serious not serious g serious h none c RR 0.99(0.91 to 1.09)
0 fewer per 1,000
(from 4 fewer to 4
more)
⨁⨁⨁◯MODERATE
Beta-carotene and stroke risk (random effects model) - RCTs
3 randomised trials
not serious not serious not serious i serious j none c RR 1.06(0.95 to 1.19)
2 more per 1,000
(from 2 fewer to 7
more)
⨁⨁⨁◯MODERATE
Beta-carotene and CVD mortality risk (random effects model) - RCTs
4 randomised trials
not serious not serious not serious k serious l none c RR 1.10(0.98 to 1.23)
3 more per 1,000
(from 1 fewer to 8
more)
⨁⨁⨁◯MODERATE
Beta-carotene and CHD mortality risk (random effects model) - RCTs
1 randomised trials
not serious not serious d serious m serious n none c RR 0.99(0.83 to 1.18)
0 fewer per 1,000
(from 6 fewer to 6
more)
⨁⨁◯◯LOW
Beta-carotene and MI mortality risk (random effects model) - RCTs
1 randomised trials
not serious not serious d serious o not serious none c RR 0.42(0.20 to 0.87)
3 fewer per 1,000
(from 1 fewer to 5
fewer)
⨁⨁⨁◯MODERATE
Beta-carotene and stroke mortality risk (random effects model) - RCTs
2 randomised trials
not serious not serious serious p serious q none c RR 1.33(0.73 to 2.44)
2 more per 1,000
(from 1 fewer to 7
more)
⨁⨁◯◯LOW
Beta-carotene and all-cause mortality risk (random effects model) - RCTs
6 randomised trials
not serious not serious not serious r serious s none c RR 1.03(0.96 to 1.11)
3 more per 1,000
(from 4 fewer to 11
more)
⨁⨁⨁◯MODERATE
CI: Confidence interval; RR: Risk ratio
Explanationsa. No serious indirectness for beta-carotene supplementation and total CVD risk (RCTs). Majority of studies were primary prevention with the exception of one study (Cook et al. 2007) which included individuals with a history of CVD or at least three cardiac risk factors. b. Serious imprecision for beta-carotene supplementation and total CVD risk (RCTs), as the 95% CI (RR, 0.96-1.10) overlaps with the minimally important difference for clinical harm (RR>1.05). c. Publication bias was not assessed since there were <10 studies.
52

d. Not able to assess consistency as only one study was included. e. Serious indirectness for beta-carotene supplementation and CHD risk (RCTs), as the 2 included studies were conducted either in middle-aged, Finnish male smokers or middle-aged females with a history of CVD, or at least three cardiac risk factors. f. Serious imprecision for beta-carotene supplementation and total CHD risk (RCTs), as the 95% CI (RR, 0.94, 1.10) include both clinically important benefit (RR<0.95) and harm (RR>1.05). g. No serious indirectness for beta-carotene supplementation and MI risk (RCTs). Majority of studies were primary prevention with the exception of one study (Cook et al. 2007) which included individuals with history of CVD or at least three cardiac risk factors. h. Serious imprecision for beta-carotene supplementation and MI risk (RCTs), as the 95% CI (RR, 0.91, 1.09) include both clinically important benefit (RR<0.95) and harm (RR>1.05). i. No serious indirectness for beta-carotene supplementation and stroke risk (RCTs). Majority of studies were primary prevention with the exception of one study (Cook et al., 2007) which included individuals with history of CVD or at least three cardiac risk factors. j. Serious imprecision for beta-carotene supplementation and stroke risk (RCTs), as the 95% CI (RR, 0.95-1.19) overlaps with the minimally important difference for clinical harm (RR>1.05). k. No serious indirectness for beta-carotene and CVD mortality risk (RCTs). Majority of the studies were primary prevention, with the exception of one study (Cook et al., 2007) which included individuals with history of CVD, or at least three cardiac risk factors. l. Serious imprecision for beta-carotene and CVD mortality risk (RCTs), as the 95% CI (RR, 0.98-1.23) overlaps with the minimally important difference for clinical harm (RR>1.05). m. Serious indirectness for beta-carotene supplementation and CHD mortality risk (RCTs), as the 1 included study was conducted in middle-aged, Finnish male smokers. n. Serious imprecision for beta-carotene supplementation and CHD mortality risk (RCTs), as the 95% CI (RR, 0.83, 1.18) include both clinically important benefit (RR<0.95) and harm (RR>1.05). o. Serious indirectness for beta-carotene supplementation and MI mortality risk (RCTs), as the one included study was conducted in a female population at high risk for CVD. This was a secondary prevention study. p. Serious indirectness for beta-carotene supplementation and stroke mortality risk (RCTs), as the 2 included studies were conducted in middle-aged, Finnish male smokers or middle-aged females with a history of CVD or at least 3 cardiac risk factors. q. Serious imprecision for beta-carotene supplementation and stroke mortality risk (RCTs), as the 95% CI (RR 0.73, 2.44), include both clinically important benefit (RR<0.95) and harm (RR>1.05). r. No serious indirectness for beta-carotene supplementation and all-cause mortality risk (RCTs). Majority of the studies were primary prevention, with the exception of one study (Cook et al., 2007) which included individuals with of CVD, or at least three cardiac risk factors. s. Serious imprecision for beta-carotene supplementation and all-cause mortality risk (RCTs), as the 95% CI (RR, 0.96-1.11) overlaps with the minimally important difference for clinical harm (RR>1.05).
Supplementary Table 7. GRADE assessment for antioxidants
Certainty assessment Effect Certainty
№ of studies
Study design Risk of bias Inconsistency Indirectness Imprecision Other considerations Relative
(95% CI)Absolute(95% CI)
Antioxiants and total CVD (random effects model) - RCTs
7 randomised trials
not serious not serious not serious a not serious none b RR 0.99(0.95 to 1.04)
1 fewer per 1,000
(from 5 more to 6
fewer)
⨁⨁⨁⨁HIGH
Antioxidants and total CHD (random effects model) - RCTs
1 randomised trials
not serious not serious c serious d serious e none b RR 0.97(0.86 to 1.09)
2 fewer per 1,000
(from 7 more to 11
fewer)
⨁⨁◯◯LOW
Antioxidants and MI (random effects model) - RCTs
6 randomised trials
not serious not serious not serious f serious g none b RR 0.98(0.90 to 1.08)
1 fewer per 1,000
(from 3 more to 4
fewer)
⨁⨁⨁◯MODERATE
Antioxidants and stroke (random effects model) - RCTs
7 randomised trials
not serious not serious not serious h serious i none b RR 1.00(0.92 to 1.09)
0 fewer per 1,000
(from 3 fewer to 3
more)
⨁⨁⨁◯MODERATE
Antioxidants and CVD mortality (random effects model) - RCTs
7 randomised trials
not serious not serious not serious j serious k none b RR 1.02(0.94 to 1.10)
1 more per 1,000
(from 3 fewer to 5
more)
⨁⨁⨁◯MODERATE
Antioxidants and CHD mortality (random effects model) - RCTs
53

Certainty assessment Effect Certainty
№ of studies
Study design Risk of bias Inconsistency Indirectness Imprecision Other considerations Relative
(95% CI)Absolute(95% CI)
2 randomised trials
not serious not serious serious l serious m none b RR 1.02(0.93 to 1.13)
1 more per 1,000
(from 4 fewer to 7
more)
⨁⨁◯◯LOW
Antioxidants and MI mortality (random effects model) - RCTs
3 randomised trials
not serious not serious serious n very serious o none b RR 1.51(0.39 to 5.93)
3 more per 1,000
(from 4 fewer to 31
more)
⨁◯◯◯VERY LOW
Antioxidants and stroke mortality (random effects model) - RCTs
5 randomised trials
not serious not serious not serious p serious q none b RR 1.10(0.87 to 1.39)
1 more per 1,000
(from 1 fewer to 2
more)
⨁⨁⨁◯MODERATE
Antioxidants and all-cause mortality (random effects model) - RCTs
21 randomised trials
not serious not serious not serious r serious s none RR 1.06(1.00 to 1.12)
5 more per 1,000
(from 0 fewer to 9
more)
⨁⨁⨁◯MODERATE
CI: Confidence interval; RR: Risk ratio
Explanationsa. No serious indirectness for antioxidant supplementation and total CVD risk (RCTs). Two studies were secondary prevention, four studies were primary prevention and one study was a combination of both. b. Publication bias was not assessed since there were < 10 studies. c. Unable to assess inconsistency as only one study was included. d. Serious indirectness for antioxidants supplementation and total CHD risk (RCTs) as there was only one study included (Tornwall et al., 2004) and it was conducted among Finnish male smokers. e. Serious imprecision for antioxidant supplementation and total CHD risk (RCTs), as the 95% CI (RR, 0.86-1.09) include both clinically important benefit (RR<0.95) and harm (RR>1.05). f. No serious indirectness for antioxidant supplementation and MI risk (RCTs). Three studies were for secondary prevention, two studies were primary prevention and one study was a combination of both. g. Serious imprecision for antioxidant supplementation and MI risk (RCTs), as the 95% CI (RR, 0.90-1.08) include both clinically important benefit (RR<0.95) and harm (RR>1.05). h. No serious indirectness for antioxidant supplementation and stroke risk (RCTs). Three studies were secondary prevention, three studies were primary prevention and one study was a combination of both. i. Serious imprecision for antioxidant supplementation and stroke risk (RCTs), as the 95% CI (RR, 0.92-1.09) include both clinically important benefit (RR<0.95) and harm (RR>1.05). j. No serious indirectness for antioxidant supplementation and CVD mortality risk (RCTs). Three studies were for secondary prevention, three studies were primary prevention and one study was a combination of both. k. Serious imprecision for antioxidants supplementation and CVD mortality risk (RCTs), as the 95% CI (RR, 0.94-1.10) include both clinically important benefit( (RR<0.95) harm (RR>1.05). l. Serious indirectness for antioxidants supplementation and CHD mortality risk (RCTs) as there was only two studies included and one of them (Tornwall et al., 2004) was conducted among Finnish male smokers only, which accounted for ~30% of the population. m. Serious imprecision for antioxidant supplementation and CHD mortality risk (RCTs), as the 95% CI (RR, 0.93-1.13) include both clinically important benefit (RR<0.95) and harm (RR>1.05). n. Serious indirectness for antioxidant supplementation MI mortality risk (RCTs), as the included studies were in specific populations: early age-related cataract (Chylack et al., 2002), smokers >10 cigarettes/day (Mooney et al., 2005) and peripheral artery disease (CLIPS group 2007). o. Very serious imprecision for antioxidant supplementation and MI mortality risk (RCTs), as the 95% CI (RR, 0.39-5.93) include both appreciable clinically important benefit (RR<0.95) and harm (RR>1.05). p. No serious indirectness for antioxidant supplementation and stroke mortality risk (RCTs). One study was secondary prevention, 3 studies were primary prevention and 1 study was a combination of both. q. Serious imprecision for antioxidant supplementation and stroke mortality risk (RCTs), as the 95% CI (RR, 0.87-1.39) include both clinically important benefit (RR<0.95) and harm (RR>1.05). r. No serious indirectness for antioxidant supplementation and all-cause mortality (RCTs). Sixteen studies were primary prevention, three were secondary prevention and two were a combination of both. s. Serious imprecision for antioxidants supplementation and all-cause mortality risk (RCTs)-random effects model, as the 95% CI (RR, 1.00-1.12) overlaps with the minimally important difference for clinical harm (RR>1.05).
Supplementary Table 8. GRADE assessment for vitamin E
54

Certainty assessment Effect
Certainty№ of
studiesStudy design Risk of bias Inconsistency Indirectness Imprecision Other considerations Relative
(95% CI)Absolute(95% CI)
Vitamin E and total CVD risk (random effects model) - RCTs
10 randomised trials
not serious not serious a not serious b serious c publication bias strongly suspected d
RR 0.96(0.89 to 1.03)
3 fewer per 1,000
(from 2 more to 9
fewer)
⨁⨁◯◯LOW
Vitamin E and total CHD risk (random effects model) - RCTs
2 randomised trials
not serious not serious serious e serious f none g RR 0.97(0.90 to 1.06)
3 fewer per 1,000
(from 6 more to 10
fewer)
⨁⨁◯◯LOW
Vitamin E and MI risk (random effects model) - RCTs
10 randomised trials
not serious serious h not serious i serious j publication bias strongly suspected d
RR 0.87(0.75 to 1.01)
5 fewer per 1,000
(from 0 fewer to 9
fewer)
⨁◯◯◯VERY LOW
Vitamin E and stroke risk (random effects model) - RCTs
11 randomised trials
not serious not serious not serious k serious l none g RR 0.98(0.88 to 1.08)
0 fewer per 1,000
(from 2 fewer to 2
more)
⨁⨁◯◯MODERATE
Vitamin E and CVD mortality risk (random effects model) - RCTs
11 randomised trials
not serious not serious not serious m serious n none g RR 0.95(0.89 to 1.02)
1 fewer per 1,000
(from 1 more to 3
fewer)
⨁⨁⨁◯MODERATE
Vitamin E and CHD Mortality risk (random effects model) - RCTs
2 randomised trials
not serious not serious serious o serious p none g RR 0.90(0.80 to 1.02)
4 fewer per 1,000
(from 1 more to 8
fewer)
⨁⨁◯◯LOW
Vitamin E and MI mortality risk (random effects model) - RCTs
7 randomised trials
not serious not serious not serious q serious r none g RR 0.91(0.78 to 1.07)
1 fewer per 1,000
(from 1 more to 2
fewer)
⨁⨁⨁◯MODERATE
Vitamin E and stroke mortality risk (random effects model) - RCTs
5 randomised trials
not serious not serious not serious s serious t none g RR 0.97(0.66 to 1.43)
0 fewer per 1,000
(from 0 fewer to 1
more)
⨁⨁⨁◯MODERATE
Vitamin E and all-cause mortality risk (random effects model) - RCTs
32 randomised trials
not serious not serious not serious u not serious none RR 1.00(0.97 to 1.04)
0 fewer per 1,000
(from 2 fewer to 3
more)
⨁⨁⨁⨁HIGH
55
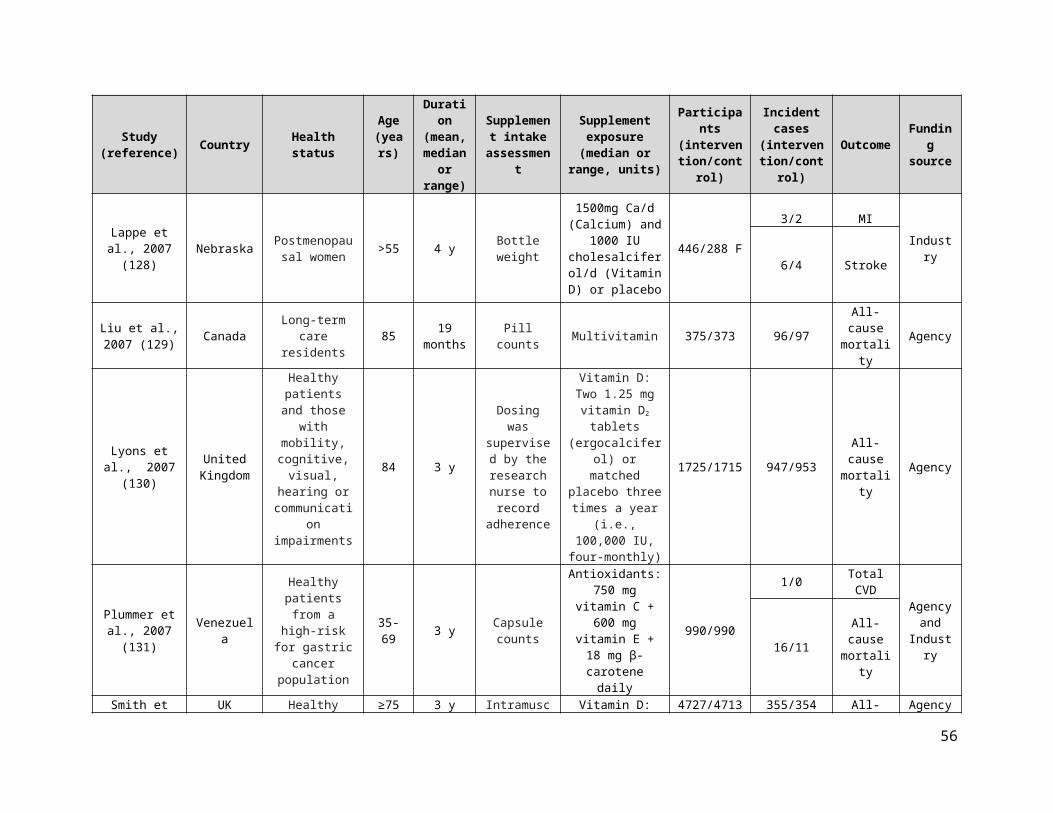
CI: Confidence interval; RR: Risk ratio
Explanations
a. Although there was evidence of serious inconsistency for vitamin E and total CVD risk (RCTs) (I2=50%, p=0.04), independent removal of one trial (Boaz et al.) explained half of the heterogeneity (I2=24%, p=0.24). b. No serious indirectness for vitamin E and total CVD risk (RCTs). Two studies were secondary prevention, five studies were primary prevention and three were a combination of both. c. Serious imprecision for vitamin E supplementation and total CVD risk (RCTs), as the 95% CI (RR 0.89, 1.03) overlaps with the minimally important difference for clinical benefit (RR<0.95). d. Publication bias strongly detected due to funnel plot asymmetry and Egger’s and Begg’s tests (p<0.05) e. Serious indirectness for vitamin E supplementation and total CHD risk (RCTs), as the two included studies were conducted either in Finnish, middle-aged male smokers or middle-aged women with history of CVD, or at least three cardiac risk factors. f. Serious imprecision for vitamin E supplementation and total CHD risk (RCTs), as the 95% CI (RR, 0.90, 1.06) include both clinically important benefit (RR<0.95) and harm (RR>1.05). g. Publication bias was not assessed since there were <10 studies. h. Serious inconsistency for vitamin E supplementation and MI risk (RCTs), as I2=59%, p=0.01. i. No serious indirectness for vitamin E and total MI risk (RCTs). Two studies were secondary prevention, five studies were primary prevention and three studies were a combination of both. j. Serious imprecision for vitamin E supplementation and MI risk (RCTs), as the 95% CI (RR, 0.75-1.01) overlaps with the minimally important difference for clinical benefit (RR<0.95) k. No serious indirectness for vitamin E and stroke risk (RCTs). Three studies were secondary prevention, five studies were primary prevention and three studies were a combination of both. l. Serious imprecision for vitamin E supplementation and stroke risk (RCTs), as the 95% CI (RR 0.88, 1.08) include both clinically important benefit (RR<0.95) and harm (RR>1.05). m. No serious indirectness for vitamin E supplementation and CVD mortality risk (RCTs). Three studies were secondary prevention, five studies were primary prevention and three studies were a combination of both. n. Serious imprecision for vitamin E supplementation and CVD mortality risk (RCTs), as the 95% CI (RR, 0.89-1.02) overlaps with the minimally important difference for clinical benefit (RR<0.95) o. Serious indirectness for vitamin E supplementation and CHD mortality risk (RCTs), as the two included studies were conducted in Italian, middle-aged individuals with a recent MI or Finnish, middle-aged male smokers. p. Serious imprecision for vitamin E supplementation and CHD mortality risk (RCTs), as the 95% CI (RR, 0.80-1.02) overlaps with the minimally important difference for clinical benefit (RR<0.95) q. No serious indirectness for vitamin E and MI mortality risk (RCTs). Three studies were secondary prevention, three studies were primary prevention and two studies were a combination of both. r. Serious imprecision for vitamin E supplementation and MI mortality risk (RCTs), as the 95% CI (RR, 0.78-1.07) include both clinically important benefit (RR <0.95) and harm (RR>1.05). s. No serious indirectness for vitamin E supplementation and stroke mortality risk (RCTs). One study was secondary prevention, three studies were primary prevention and two studies were a combination of both. t. Serious imprecision for vitamin E supplementation and stroke mortality risk (RCTs), as the 95% CI (RR, 0.66-1.43) include both clinically important benefit (RR <0.95) and harm (RR>1.05). u. No serious indirectness for vitamin E supplementation and all-cause mortality risk (RCTs). Nine studies were secondary prevention and 23 studies were primary prevention.
Supplementary Table 9. GRADE assessment for vitamin C
Certainty assessment Effect
Certainty№ of
studiesStudy design Risk of bias Inconsistency Indirectness Imprecision Other considerations Relative
(95% CI)Absolute(95% CI)
Vitamin C and total CVD risk (random effects model) - RCTs
2 randomised trials
not serious not serious not serious a serious b none c RR 0.99(0.90 to 1.10)
1 fewer per 1,000
(from 9 fewer to 9
more)
⨁⨁⨁◯MODERATE
Vitamin C and total CHD risk (random effects model) - RCTs
1 randomised trials
not serious not serious d serious e serious f none c RR 1.04(0.93 to 1.17)
5 more per 1,000
(from 8 fewer to 20
more)
⨁⨁◯◯LOW
Vitamin C and MI risk (random effects model) - RCTs
2 randomised trials
not serious not serious not serious g serious h none c RR 0.96(0.81 to 1.14)
1 fewer per 1,000
(from 5 more to 7
fewer)
⨁⨁⨁◯MODERATE
Vitamin C and stroke risk (random effects model) - RCTs
56

Certainty assessment Effect
Certainty№ of
studiesStudy design Risk of bias Inconsistency Indirectness Imprecision Other considerations Relative
(95% CI)Absolute(95% CI)
2 randomised trials
not serious not serious not serious i serious j none c RR 0.92(0.78 to 1.09)
3 fewer per 1,000
(from 3 more to 8
fewer)
⨁⨁⨁◯MODERATE
Vitamin C and CVD mortality risk (random effects model) - RCTs
2 randomised trials
not serious not serious not serious k serious l none c RR 1.07(0.92 to 1.25)
3 more per 1,000
(from 3 fewer to 10
more)
⨁⨁⨁◯MODERATE
Vitamin C and MI mortality risk (random effects model) - RCTs
1 randomised trials
not serious not serious not serious m serious n none c RR 0.79(0.40 to 1.55)
1 fewer per 1,000
(from 3 fewer to 3
more)
⨁⨁⨁◯MODERATE
VItamin C and stroke mortality risk (random effects model) - RCTs
1 randomised trials
not serious not serious not serious o serious p none c RR 0.83(0.42 to 1.65)
1 fewer per 1,000
(from 3 fewer to 3
more)
⨁⨁⨁◯MODERATE
Vitamin C and all-cause mortality risk (random effects model) - RCTs
4 randomised trials
not serious not serious not serious q serious r none c RR 1.02(0.94 to 1.11)
2 more per 1,000
(from 7 fewer to 12
more)
⨁⨁⨁◯MODERATE
CI: Confidence interval; RR: Risk ratio
Explanationsa. No serious indirectness for vitamin C supplementation and total CVD risk (RCTs). Both studies were a combination of primary and secondary prevention and had large populations, one of men and the other of women. b. Serious imprecision for vitamin C supplementation and total CVD risk (RCTs), as the 95% CI (RR, 0.90-1.10) include both clinically important benefit (RR<0.95) and harm (RR>1.05). c. Publication bias was not assessed as there were < 10 studies. d. Unable to assess inconsistency as only one study was included. e. Serious indirectness for vitamin C supplementation and total CHD risk (RCTs), as the one included study was conducted in women only. f. Serious imprecision for vitamin C supplementation and total CHD risk (RCTs), as the 95% CI (RR, 0.93-1.17) include both clinically important benefit (RR<0.95) and harm (RR>1.05). g. No serious indirectness for vitamin C supplementation and MI risk (RCTs). Both studies were a combination of primary and secondary prevention and had large populations, one of men and the other of women. h. Serious imprecision for vitamin C supplementation and MI risk (RCTs), as the 95% CI (RR, 0.81-1.14) include both clinically important benefit (RR<0.95) and harm (RR>1.05). i. No serious indirectness for vitamin C supplementation and total CVD risk (RCTs). Both studies were a combination of primary and secondary prevention and had large populations, one of men and the other of women. j. Serious imprecision for vitamin C supplementation and stroke risk (RCTs), as the 95% CI (RR, 0.78-1.09) include both clinically important benefit (RR<0.95) and harm (RR>1.05). k. No serious indirectness for vitamin C supplementation and CVD mortality risk (RCTs). Both studies were a combination of primary and secondary prevention and had large populations, one of men and the other of women. l. Serious imprecision for vitamin C supplementation and CVD mortality risk (RCTs), as the 95% CI (RR, 0.92-1.25) include both clinically important benefit (RR<0.95) and harm (RR>1.05). m. No serious indirectness for vitamin C supplementation and MI mortality risk (RCTs). Both studies were a combination of primary and secondary prevention and had large populations, one of men and the other of women. n. Serious imprecision for vitamin C supplementation and MI mortality risk (RCTs), as the 95% CI (RR, 0.40-1.55) includes both clinically important benefit (RR<0.95) and harm (RR>1.05). o. No serious indirectness for vitamin C supplementation and stroke mortality risk (RCTs). Both studies were a combination of primary and secondary prevention and had large populations, one of men and the other of women. p. Serious imprecision for vitamin C supplementation and stroke mortality risk (RCTs), as the 95% CI (RR, 0.42-1.65) include both clinically important benefit (RR<0.95) and harm (RR>1.05). q. No serious indirectness for vitamin C supplementation and all-cause mortality risk (RCTs). Three studies were primary prevention and one was a combination of both primary and secondary prevention. r. Serious imprecision for vitamin C supplementation and all-cause mortality risk (RCTs), as the 95% CI (RR, 0.94-1.11) include both clinically important benefit (RR<0.95) and harm (RR>1.05).
57

Supplementary Table 10. GRADE assessment for selenium
Certainty assessment Effect
Certainty№ of
studiesStudy design Risk of bias Inconsistency Indirectness Imprecision Other considerations Relative
(95% CI)Absolute(95% CI)
Selenium and total CVD risk (random effects model) - RCTs
2 randomised trials
not serious not serious serious a serious b none c RR 1.04(0.96 to 1.12)
5 more per 1,000
(from 5 fewer to 15
more)
⨁⨁◯◯LOW
Selenium and total CHD risk (random effects model) - RCTs
1 randomised trials
not serious not serious d serious e serious f none c RR 1.06(0.76 to 1.48)
7 more per 1,000
(from 28 fewer to 57
more)
⨁⨁◯◯LOW
Selenium and MI risk (random effects model) - RCTs
2 randomised trials
not serious not serious serious g serious h none c RR 0.93(0.62 to 1.39)
6 fewer per 1,000
(from 32 fewer to 32
more)
⨁⨁◯◯LOW
Selenium and stroke risk (random effects model) - RCTs
2 randomised trials
not serious not serious serious i serious j none c RR 0.89(0.70 to 1.14)
2 fewer per 1,000
(from 2 more to 4
fewer)
⨁⨁◯◯LOW
Selenium and CVD mortality risk (random effects model) - RCTs
3 randomised trials
not serious not serious serious k serious l none c RR 1.00(0.66 to 1.51)
0 fewer per 1,000
(from 6 fewer to 10
more)
⨁⨁◯◯LOW
Selenium and MI mortality risk (random effects model) - RCTs
2 randomised trials
not serious not serious serious m very serious n none c RR 1.21(0.49 to 2.99)
3 more per 1,000
(from 7 fewer to 27
more)
⨁◯◯◯VERY LOW
Selenium and stroke mortality risk (random effects model) - RCTs
1 randomised trials
not serious not serious d serious o very serious p none c RR 1.13(0.44 to 2.93)
0 fewer per 1,000
(from 1 fewer to 2
more)
⨁◯◯◯VERY LOW
Selenium and all-cause mortality risk (random effects model) - RCTs
4 randomised trials
not serious not serious serious q serious r none c RR 0.99(0.88 to 1.12)
1 fewer per 1,000
(from 6 fewer to 6
more)
⨁⨁◯◯LOW
CI: Confidence interval; RR: Risk ratio
58

Explanationsa. Serious indirectness for selenium supplementation and total CVD risk (RCTs) since both included studies were conducted in specific populations, that is, Lippman et al., 2009 included males only (at higher CVD risk) and Stranges et al., 2006 was conducted in patients with history of non-melanoma skin cancers. b. Serious imprecision for selenium supplementation and total CVD risk (RCTs), as the 95% CI (RR, 0.96-1.12) overlaps with the minimally important difference for clinical harm (RR>1.05). c. Publication bias was not assessed as there were < 10 studies. d. Unable to assess inconsistency as only one study was conducted. e. Serious indirectness for selenium supplementation and total CHD risk (RCTs) as there was only one study which included individuals with a history of non-melanoma skin cancer. f. Serious imprecision for selenium supplementation and total CHD risk (RCTs) as the 95% CI (RR, 0.76-1.48) include both clinically important benefit (RR<0.95) and harm (RR>1.05). g. Serious indirectness for selenium supplementation and MI risk (RCTs) as one of the included studies, Stranges et al., 2006 - NPC, which represented ~ 96% of the population, was conducted in patients with history of non-melanoma skin cancers. h. Serious imprecision for selenium supplementation and MI risk (RCTs) as the 95% CI (RR, 0.62-1.39) include both clinically important benefit (RR<0.95) and harm (RR>1.05). i. Serious indirectness for selenium supplementation and stroke risk (RCTs), since both included studies were conducted in specific populations, that is, Lippman et al., 2009 included males only (at higher CVD risk) and Stranges et al., 2006 was conducted in patients with history of non-melanoma skin cancers. j. Serious imprecision for selenium supplementation and stroke risk (RCTs) as the 95% CI (RR, 0.70-1.14) include both clinically important benefit (RR<0.95) and harm (RR>1.05). k. Serious indirectness for selenium supplementation and total CVD mortality risk (RCTs) since one of the included studies, Lippman et al., 2009-SELECT, which represented ~94% of the population was conducted in males. l. Serious imprecision for selenium supplementation and CVD mortality risk (RCTs) as the 95% CI (RR, 0.66-1.51) include both clinically important benefit (RR<0.95) and harm (RR>1.05). m. Serious indirectness for selenium supplementation and MI mortality risk (RCTs) as one of the included studies, Lippman et al., 2009-SELECT, which represented ~95% of the population was conducted in males. n. Very serious imprecision for selenium supplementation and MI mortality risk (RCTs) as the 95% CI (RR, 0.49-2.99) include both appreciable clinically important benefit (RR<0.95) and harm (RR>1.05). o. Serious indirectness for selenium supplementation and stroke mortality risk (RCTs) as the one included study was conducted in males with higher CVD risks. p. Very serious imprecision for selenium supplementation and stroke mortality risk (RCTs) as the 95% CI (RR, 0.44-2.93) include both appreciable clinically important benefit (RR<0.95) and harm (RR>1.05). q. Serious indirectness for selenium supplementation and all-cause mortality risk (RCTs), as one of the included studies was conducted in males and accounted for 94% of the population. r. Serious imprecision for selenium supplementation and all-cause mortality risk (RCTs) as the 95% CI (RR, 0.88-1.12) include both clinically important benefit (RR<0.95) and harm (RR>1.05).
Supplementary Table 11. GRADE assessment for vitamin B-complex
Certainty assessment Effect Certainty
№ of studies
Study design Risk of bias Inconsistency Indirectness Imprecision Other considerations Relative
(95% CI)Absolute(95% CI)
B-Complex and total CVD risk (random effects model) - RCTs
9 randomised trials
not serious not serious not serious a serious b none c RR 0.98(0.93 to 1.04)
3 fewer per 1,000
(from 7 more to 12
fewer)
⨁⨁⨁◯MODERATE
B-complex and total CHD risk (random effects model) - RCTs
5 randomised trials
not serious not serious not serious d serious e none c RR 1.04(0.96 to 1.14)
6 more per 1,000
(from 6 fewer to 21
more)
⨁⨁⨁◯MODERATE
B-Complex and MI risk (random effects model) - RCTs
13 randomised trials
not serious not serious not serious f serious g none RR 1.00(0.93 to 1.07)
0 fewer per 1,000
(from 5 fewer to 5
more)
⨁⨁⨁◯MODERATE
B-complex and stroke risk (random effects model) - RCTs
12 randomised trials
not serious not serious not serious h serious i none RR 0.90(0.81 to 1.00)
5 fewer per 1,000
(from 0 fewer to 9
fewer)
⨁⨁⨁◯MODERATE
B-Complex and CVD mortality risk (random effects model) - RCTs
5 randomised trials
not serious not serious not serious j serious k none c RR 0.98(0.87 to 1.11)
2 fewer per 1,000
(from 9 more to 10
fewer)
⨁⨁⨁◯MODERATE
59

Certainty assessment Effect Certainty
№ of studies
Study design Risk of bias Inconsistency Indirectness Imprecision Other considerations Relative
(95% CI)Absolute(95% CI)
B-complex and CHD mortality risk (random effects model) - RCTs
3 randomised trials
not serious not serious not serious l serious m none c RR 1.09(0.97 to 1.23)
6 more per 1,000
(from 2 fewer to 16
more)
⨁⨁⨁◯MODERATE
B-complex and MI mortality risk (random effects model) - RCTs
2 randomised trials
not serious not serious not serious n serious o none c RR 1.11(0.93 to 1.32)
4 more per 1,000
(from 2 fewer to 11
more)
⨁⨁⨁◯MODERATE
B-complex and stroke mortality risk (random effects model) - RCTs
2 randomised trials
not serious not serious not serious p serious q none c RR 0.91(0.68 to 1.21)
1 fewer per 1,000
(from 2 more to 3
fewer)
⨁⨁⨁◯MODERATE
B-Complex and all-cause mortality risk (random effects model) - RCTs
16 randomised trials
not serious not serious not serious r serious s none RR 1.02(0.97 to 1.06)
3 more per 1,000
(from 4 fewer to 8
more)
⨁⨁⨁◯MODERATE
CI: Confidence interval; RR: Risk ratio
Explanationsa. No serious indirectness for vitamin B-complex supplementation and total CVD risk (RCTs). Three studies were primary prevention and six studies were secondary prevention. b. Serious imprecision for vitamin B-complex supplementation and total CVD risk (RCTs) as the 95% CI (RR, 0.93-1.04) overlaps with the minimally important difference for clinical benefit (RR<0.95). c. Publication bias was not assessed since there were < 10 studies. d. No serious indirectness for vitamin B-complex supplementation and total CHD risk (RCTs). All studies were secondary prevention. e. Serious imprecision for vitamin B-complex supplementation and total CHD risk (RCTs) as the 95% CI (RR, 0.96-1.14) overlaps with the minimally important difference for clinical harm (RR>1.05). f. No serious indirectness for vitamin B-complex supplementation and MI risk (RCTs). Four studies were primary prevention, seven studies were secondary prevention and two studies were a combination of both. g. Serious imprecision for vitamin B-complex supplementation and MI risk (RCTs) as the 95% CI (RR, 0.93-1.07) include both clinically important benefit (RR <0.95) and harm (RR>1.05). h. No serious indirectness in vitamin B-complex supplementation and stroke risk (RCTs). Four studies were primary prevention and eight studies were secondary prevention. i. Serious imprecision for vitamin B-complex supplementation and stroke risk (RCTs) as the 95% CI (RR, 0.81-1.00) overlaps with the minimally important difference for clinical benefit (RR<0.95). j. No serious indirectness for vitamin B-complex supplementation and total CVD mortality risk (RCTs). Three studies were secondary prevention and two studies were a combination of primary and secondary prevention. k. Serious imprecision for vitamin B-complex supplementation and CVD mortality risk (RCTs) as the 95% CI (RR, 0.87, 1.11) include both clinically important benefit (RR<0.95) and harm (RR>1.05). l. No serious indirectness for vitamin B-complex supplementation and CHD mortality risk (RCTs). One study was primary prevention and two studies were secondary prevention. m. Serious imprecision for vitamin B-complex supplementation and CHD mortality risk (RCTs) as the 95% CI (RR, 0.97-1.23) overlaps with the minimally important difference for clinical harm (RR>1.05). n. No serious indirectness for vitamin B-complex supplementation and MI mortality risk (RCTs). Both studies were secondary prevention. o. Serious imprecision for vitamin B-complex supplementation and MI mortality risk (RCTs) as the 95% CI (RR, 0.93-1.32) include both clinically important benefit (RR<0.95) and harm (RR>1.05). p. No serious indirectness for vitamin B-complex supplementation and stroke mortality risk (RCTs), although both studies were secondary prevention. q. Serious imprecision for vitamin B-complex supplementation and stroke mortality risk (RCTs) as the 95% CI (RR, 0.68-1.21) include both clinically important benefit (RR<0.95) and harm (RR>1.05). r. No serious indirectness for vitamin B-complex supplementation and all-cause mortality risk (RCTs). Seven studies were primary prevention, seven studies were secondary prevention and two studies were a combination of both. s. Serious imprecision for vitamin B-complex supplementation and all-cause mortality risk (RCTs) as the 95% CI (RR, 0.97-1.06) overlaps with the minimally important difference for clinical harm (RR>1.05).
Supplementary Table 12. GRADE assessment for folic acid
60

Certainty assessment Effect
Certainty№ of
studiesStudy design Risk of bias Inconsistency Indirectness Imprecision Other considerations Relative
(95% CI)Absolute(95% CI)
Folic acid and total CVD risk (random effects model) - RCTs
5 randomised trials
not serious not serious serious a not serious none b RR 0.83(0.73 to 0.93)
8 fewer per 1,000
(from 3 fewer to 13
fewer)
⨁⨁⨁◯MODERATE
Folic acid and total CHD risk (random effects model) - RCTs
2 randomised trials
not serious not serious not serious c serious d none b RR 1.47(0.95 to 2.28)
13 more per 1,000
(from 1 fewer to 36
more)
⨁⨁⨁◯MODERATE
Folic acid and MI risk (random effects model) - RCTs
6 randomised trials
not serious not serious serious e serious f none b RR 1.21(0.78 to 1.88)
1 more per 1,000
(from 1 fewer to 3
more)
⨁⨁◯◯LOW
Folic acid and stroke risk (random effects model) - RCTs
7 randomised trials
not serious not serious serious g not serious none b RR 0.80(0.69 to 0.93)
6 fewer per 1,000
(from 2 fewer to 10
fewer)
⨁⨁⨁◯MODERATE
Folic acid and CVD mortality risk (random effects model) - RCTs
5 randomised trials
not serious not serious serious h serious i none b RR 0.89(0.68 to 1.17)
1 fewer per 1,000
(from 2 more to 3
fewer)
⨁⨁◯◯LOW
Folic acid and MI mortality risk (random effects model) - RCTs
2 randomised trials
not serious not serious serious j very serious k none b RR 1.17(0.39 to 3.49)
0 fewer per 1,000
(from 0 fewer to 1
more)
⨁◯◯◯VERY LOW
Folic acid and stroke mortality risk (random effects model) - RCTs
2 randomised trials
not serious not serious serious l serious m none b RR 1.85(0.88 to 3.93)
1 more per 1,000
(from 0 fewer to 3
more)
⨁⨁◯◯LOW
Folic acid and all-cause mortality risk (random effects model) - RCTs
10 randomised trials
not serious not serious serious n serious o none RR 0.87(0.72 to 1.05)
5 fewer per 1,000
(from 2 more to 10
fewer)
⨁⨁◯◯LOW
CI: Confidence interval; RR: Risk ratio
Explanationsa. Serious indirectness for folic acid supplementation and CVD risk (RCTs), as the benefit appears to be driven by one study (Huo et al. 2015-CSPPT) conducted in a Chinese population-removal of this one study changes the pooled effect estimate from a beneficial lowering to no lowering in CVD risk (RR=0.89; 95%CI: 0.72, 1.10, p=0.28). One study was secondary prevention and four studies were primary prevention.
61

b. Publication bias was not assessed since there were <10 studies. c. No serious indirectness for folic acid supplementation and total CHD risk (RCTs). One study was primary prevention, while the other one was secondary prevention. d. Serious imprecision for folic acid supplementation and total CHD risk (RCTs), as the 95% CI (RR, 0.95-2.28) overlaps with the minimally important difference for clinical harm (RR>1.05). e. Serious indirectness for folic acid supplementation and MI risk (RCTs). The majority of the population came from one study (Huo et al., 2015-CSPPT) that was conducted in a chinese population only. Two studies were secondary prevention and four studies were primary prevention. f. Serious imprecision for folic acid supplementation and MI risk (RCTs) as the 95% CI (RR, 0.78-1.88) include both clinically important benefit (RR<0.95) and harm (RR>1.05). g. Serious indirectness for folic acid supplementation and stroke risk (RCTs), as the benefit appears to be driven by one study (Huo et al. 2015-CSPPT) conducted in a Chinese population -removal of this one study changes the pooled effect estimate from a beneficial lowering to no lowering in stroke risk (RR=0.92; 95%CI: 0.52, 1.63, p=0.78). Five studies were primary prevention and two were secondary prevention. h. Serious indirectness for folic acid supplementation and CVD mortality risk (RCTs). The majority of the population came from one study (Huo et al., 2015-CSPPT) that was conducted in a chinese population only. One study was secondary prevention and four studies were primary prevention. i. Serious imprecision for folic acid supplementation and CVD mortality risk (RCTs) as the 95% CI (RR, 0.68-1.17) include both clinically important benefit (RR<0.95) and harm (RR>1.05). j. Serious indirectness for folic acid supplementation and MI mortality risk (RCTs). The majority of the population came from one study (Huo et al., 2015-CSPPT) that was conducted in a chinese population only. One study was secondary prevention and one study was primary prevention. k. Very serious imprecision for folic acid supplementation and MI mortality risk (RCTs) as the 95% CI (RR, 0.39-3.49) include both appreciable clinically important benefit (RR<0.95) and harm (RR>1.05). l. Serious indirectness for folic acid supplementation and stroke mortality risk (RCTs). The majority of the population came from one study (Huo et al., 2015-CSPPT) that was conducted in a chinese population only. One study was secondary prevention and one study was primary prevention. m. Serious imprecision for folic acid supplementation and stroke mortality risk (RCTs) as the 95% CI (RR, 0.88-3.93) include both clinically important benefit (RR<0.95) and harm (RR>1.05). n. Serious indirectness for folic acid supplementation and all-cause mortality risk (RCTs). The majority of the population came from one study (Huo et al., 2015-CSPPT) that was conducted in a chinese population only. Two studies were secondary prevention, seven studies were primary prevention and one study was conducted in heart transplantation recipients. o. Serious imprecision for folic acid supplementation and all-cause mortality risk (RCTs), as the 95% CI (RR, 0.72-1.05) overlaps with the minimally important difference for clinical benefit (RR<0.95).
Supplementary Table 13. GRADE assessment for niacin (B3)
Certainty assessment Effect
Certainty№ of
studiesStudy design Risk of bias Inconsistency Indirectness Imprecision Other considerations Relative
(95% CI)Absolute(95% CI)
Vitamin B3 (Niacin) and total CVD risk (random effects model) - RCTs
4 randomised trials
not serious not serious not serious a serious b none c RR 0.97(0.93 to 1.03)
7 fewer per 1,000
(from 7 more to 17
fewer)
⨁⨁⨁◯MODERATE
Vitamin B3 (Niacin) and total CVD risk - No statins (random effects model) - RCTs
1 randomised trials
not serious not serious d serious e not serious none c RR 0.98(0.95 to 1.01)
17 fewer per 1,000
(from 8 more to 42
fewer)
⨁⨁⨁◯MODERATE
Vitamin B3 (Niacin) and total CVD risk - Background statin treatment (random effects model) - RCTs
3 randomised trials
not serious not serious not serious f serious g none c RR 0.97(0.81 to 1.17)
4 fewer per 1,000
(from 22 more to 25
fewer)
⨁⨁⨁◯MODERATE
Vitamin B3 (Niacin) and total CHD risk (random effects model) - RCTs
2 randomised trials
not serious not serious not serious serious h none c RR 0.96(0.87 to 1.07)
2 fewer per 1,000
(from 4 more to 7
fewer)
⨁⨁⨁◯MODERATE
Vitamin B3 (Niacin) and MI risk (random effects model) - RCTs
5 randomised trials
not serious not serious not serious i serious j none c RR 0.90(0.75 to 1.06)
5 fewer per 1,000
(from 3 more to 13
fewer)
⨁⨁⨁◯MODERATE
62

Certainty assessment Effect
Certainty№ of
studiesStudy design Risk of bias Inconsistency Indirectness Imprecision Other considerations Relative
(95% CI)Absolute(95% CI)
Vitamin B3 (Niacin) and MI risk - No statins (random effects model) - RCTs
1 randomised trials
not serious not serious d serious k not serious none c RR 0.74(0.60 to 0.90)
36 fewer per 1,000(from 14
fewer to 55 fewer)
⨁⨁⨁◯MODERATE
Vitamin B3 (Niacin) and MI risk- Background statin treatment (random effects model) - RCTs
4 randomised trials
not serious not serious not serious l serious m none c RR 0.96(0.85 to 1.08)
1 fewer per 1,000
(from 3 more to 5
fewer)
⨁⨁⨁◯MODERATE
Vitamin B3 (Niacin) and stroke risk (random effects model) - RCTs
5 randomised trials
not serious not serious n not serious o serious p none c RR 0.95(0.72 to 1.26)
2 fewer per 1,000
(from 12 more to 13
fewer)
⨁⨁⨁◯MODERATE
Vitamin B3 (Niacin) and stroke risk - No statins (random effects model) - RCTs
1 randomised trials
not serious not serious d not serious q not serious none c RR 0.76(0.61 to 0.95)
27 fewer per 1,000
(from 6 fewer to 43
fewer)
⨁⨁⨁⨁HIGH
Vitamin B3 (Niacin) and stroke risk - Background statin treatment (random effects model) - RCTs
4 randomised trials
not serious not serious not serious r serious s none c RR 1.10(0.70 to 1.72)
3 more per 1,000
(from 10 fewer to 25
more)
⨁⨁⨁◯MODERATE
Vitamin B3 (Niacin) and CVD mortality risk (random effects model) - RCTs
3 randomised trials
not serious not serious not serious t serious u none c RR 0.95(0.84 to 1.08)
7 fewer per 1,000
(from 12 more to 24
fewer)
⨁⨁⨁◯MODERATE
Vitamin B3 (Niacin) and CVD mortality risk - No statins (random effects model) - RCTs
1 randomised trials
not serious not serious d serious v serious w none c RR 0.94(0.82 to 1.07)
14 fewer per 1,000(from 16
more to 41 fewer)
⨁⨁◯◯LOW
Vitamin B3 (Niacin) and CVD mortality risk - Background statin treatment (random effects model) - RCTs
2 randomised trials
not serious not serious not serious x serious y none c RR 1.14(0.75 to 1.73)
3 more per 1,000
(from 6 fewer to 16
more)
⨁⨁⨁◯MODERATE
Vitamin B3 (Niacin) and CHD mortality risk (random effects model) - RCTs
63

Certainty assessment Effect
Certainty№ of
studiesStudy design Risk of bias Inconsistency Indirectness Imprecision Other considerations Relative
(95% CI)Absolute(95% CI)
3 randomised trials
not serious not serious not serious z serious aa none c RR 0.99(0.89 to 1.10)
0 fewer per 1,000
(from 5 fewer to 5
more)
⨁⨁⨁◯MODERATE
Vitamin B3 (Niacin) and CHD mortality risk - No statins (random effects model) - RCTs
1 randomised trials
not serious not serious d not serious ab serious ac none c RR 0.95(0.82 to 1.09)
10 fewer per 1,000(from 17
more to 35 fewer)
⨁⨁⨁◯MODERATE
Vitamin B3 (Niacin) and CHD mortality risk - Background statin treatment (random effects model) - RCTs
2 randomised trials
not serious not serious not serious ad serious ae none c RR 1.04(0.90 to 1.21)
1 more per 1,000
(from 2 fewer to 5
more)
⨁⨁⨁◯MODERATE
Vitamin B3 (Niacin) and all-cause mortality risk (random effects model) - RCTs
4 randomised trials
not serious not serious not serious af serious ag none c RR 1.04(0.95 to 1.14)
4 more per 1,000
(from 4 fewer to 12
more)
⨁⨁⨁◯MODERATE
Vitamin B3 (Niacin) and all-cause mortality - No statins (random effects model) - RCTs
1 randomised trials
not serious not serious d serious ah serious ai none c RR 0.96(0.85 to 1.08)
10 fewer per 1,000(from 20
more to 38 fewer)
⨁⨁◯◯LOW
Vitamin B3 (Niacin) and all-cause mortality risk - Background statin treatment (random effects model) - RCTs
3 randomised trials
not serious not serious not serious aj serious ak none c RR 1.1(1.0 to 1.2)
6 more per 1,000
(from 0 fewer to 11
more)
⨁⨁⨁◯MODERATE
CI: Confidence interval; RR: Risk ratio
Explanationsa. No serious indirectness for vitamin B3 (niacin) supplementation and total CVD risk (RCTs), despite all studies being in populations with a history of CVD or CHD; the total population was also high (29,254). b. Serious imprecision for vitamin B3 (niacin) supplementation and total CVD risk (RCTs), as the 95% CI (RR, 0.93-1.03) overlaps with the minimally important difference for clinical benefit (RR<0.95). c. Publication bias was not assessed since there were <10 studies. d. Not able to assess inconsistency as only one study was included. e. Serious indirectness for vitamin B3 (niacin) supplementation and total CVD risk (RCTs-no statins) as the one included study was conducted in a population with CHD. f. No serious indirectness for vitamin B3 (niacin) supplementation and total CVD risk (RCTs-background statin). All three included studies were secondary prevention. g. Serious imprecision for vitamin B3 (niacin) supplementation and total CVD risk (RCTs-background statin), as the 95% CI (RR, 0.81-1.17) include both clinically important benefit (RR<0.95) and harm (RR>1.05). h. Serious imprecision for vitamin B3 (niacin) supplementation and total CHD risk (RCTs), as the 95% CI (RR, 0.87-1.07) include both clinically important benefit (RR<0.95) and harm (RR>1.05). i. No serious indirectness for vitamin B3 (niacin) supplementation and MI risk (RCTs). Four studies were secondary prevention and one study was primary prevention. j. Serious imprecision for vitamin B3 (niacin) supplementation and MI risk (RCTs-random effects model), as the 95% CI (RR, 0.75-1.06) include both clinically important benefit (RR<0.95) and harm (RR>1.05).
64
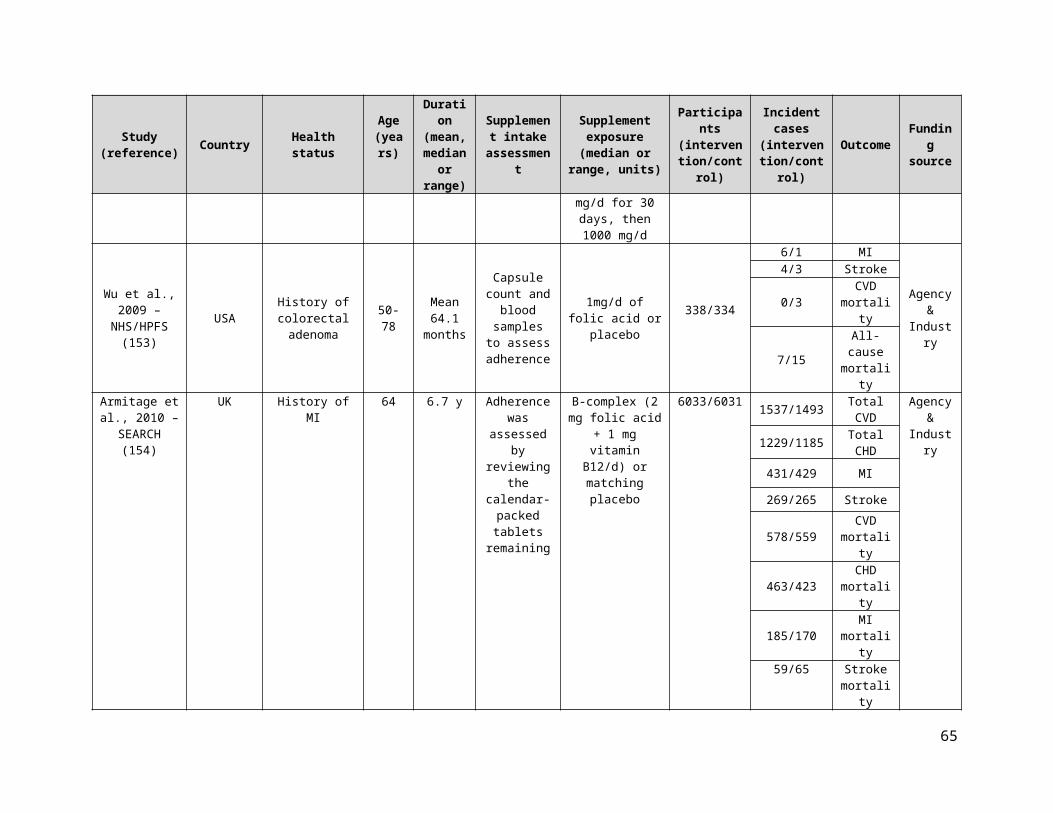
k. Serious indirectness for vitamin B3 (niacin) supplementation and MI risk (RCTs-no statins) as the one included study was conducted in a population with CHD. l. No serious indirectness for vitamin B3 (niacin) supplementation and MI risk (RCTs-background statin). All four included studies were secondary prevention. m. Serious imprecision for vitamin B3 (niacin) supplementation and MI risk (RCTs-background statin), as the 95% CI (RR 0.85-1.08) include both clinically important benefit (RR<0.95) and harm (RR>1.05). n. Although there was evidence of serious inconsistency for vitamin B3 (niacin) supplementation and stroke risk (RCTs) (I²=60%, p=0.04), independent removal of one trial (CDPRG 1975) explained almost half of the heterogeneity (I²=37%, P=0.19). o. No serious indirectness for vitamin B3 (niacin) supplementation and stroke risk (RCTs). Four studies were secondary prevention and one study was primary prevention. p. Serious imprecision for vitamin B3 (niacin) supplementation and stroke risk (RCTs-random effects model), as the 95% CI (RR, 0.72-1.26) include both clinically important benefit (RR<0.95) and harm (RR>1.05). q. No serious indirectness for vitamin B3 (niacin) supplementation and stroke risk (RCTs-no statins). The included study was secondary prevention. r. No serious indirectness for vitamin B3 (niacin) supplementation and stroke risk (RCTs-backgroud statin). Three studies were secondary prevention and one study was primary prevention. s. Serious imprecision for vitamin B3 (niacin) supplementation and stroke risk (RCTs-background statin) (random effects model) as the 95% CI (RR, 0.70-1.72) include both clinically important benefit (RR<0.95) and harm (RR>1.05). t. No serious indirectness for vitamin B3 (niacin) supplementation and CVD mortality risk (RCTs), despite all studies being in populations with a history of CVD or CHD; the total population was also high (7,489). u. Serious imprecision for vitamin B3 (niacin) supplementation and CVD mortality risk (RCTs), as the 95% CI (RR, 0.84-1.08) include both clinically important benefit (RR<0.95) and harm (RR> 1.05). v. Serious indirectness for niacin (B3) supplementation and CVD mortality risk (RCTs-no statins) as the one included study was conducted in a population with CHD. w. Serious imprecision for vitamin B3 (niacin) supplementation and CVD mortality risk (RCTs-no statins), as the 95% CI (RR, 0.82-1.07) include both clinically important benefit (RR<0.95) and harm (RR>1.05). x. No serious indirectness for vitamin B3 (niacin) supplementation and CVD mortality risk (RCTs-background statin). Both included studies were secondary prevention. y. Serious imprecision for vitamin B3 (niacin) supplementation and CVD mortality risk (RCTs-background statin), as the 95% CI (RR 0.75, 1.73) include both clinically important benefit (RR<0.95) and harm (RR>1.05). z. No serious indirectness for vitamin B3 (niacin) supplementation and CHD mortality risk (RCTs). All three studies were secondary prevention. aa. Serious imprecision for vitamin B3 (niacin) supplementation and CHD mortality risk (RCTs), as the 95% CI (RR, 0.89-1.10) include both clinically important benefit (RR<0.95) and harm (RR>1.05). ab. No serious indirectness for vitamin B3 (niacin) supplementation and CHD mortality risk (RCTs-no statin). The one included study was secondary prevention. ac. Serious imprecision for vitamin B3 (niacin) supplementation and CHD mortality risk (RCTs-no statins), as the 95% CI (RR, 0.82-1.09) includes both clinically important benefit (RR<0.95) and harm (RR>1.05). ad. No serious indirectness for vitamin B3 (niacin) supplementation and CHD mortality risk (RCTs-background statin). Both studies were secondary prevention. ae. Serious imprecision for vitamin B3 (niacin) supplementation and CHD mortality risk (RCTs-background statin), as the 95% CI (RR, 0.90-1.21) include both clinically important benefit (RR<0.95) and harm (RR>1.05). af. No serious indirectness for vitamin B3 (niacin) supplementation and all-cause mortality risk (RCTs), despite all studies being in populations with a history of CVD or CHD; the total population was also high (33,103). ag. Serious imprecision for vitamin B3 (niacin) supplementation and all-cause mortality risk (RCTs), as the 95% CI (RR, 0.95-1.14) overlaps with the minimally important difference for clinical harm (RR>1.05). ah. Serious indirectness for vitamin B3 (niacin) supplementation and all-cause mortality risk (RCTs-no statin) as the one included study was conducted in a population with CHD. ai. Serious imprecision for vitamin B3 (niacin) supplementation and all-cause mortality risk (RCTs-no statin), as the 95% CI (RR, 0.85-1.08) include both clinically benefit (RR<0.95) and harm (RR>1.05) aj. No serious indirectness for vitamin B3 (niacin) supplementation and all-cause mortality risk (RCTs-background statin). All 3 studies were secondary prevention. ak. Serious imprecision for vitamin B3 (niacin) supplementation and all-cause mortality risk (RCTs-background statin) as the 95% CI (RR, 1.0-1.2) overlaps with the minimally important difference for clinical harm (RR>1.05)
Supplementary Table 14. GRADE assessment for vitamin B6
Certainty assessment Effect
Certainty№ of
studiesStudy design Risk of bias Inconsistency Indirectness Imprecision Other considerations Relative
(95% CI)Absolute(95% CI)
Vitamin B6 (Pyridoxine) and total CVD risk (random effects model) - RCTs
1 randomised trials
not serious not serious a not serious b serious c none d RR 1.03(0.85 to 1.24)
5 more per 1,000
(from 27 fewer to 44
more)
⨁⨁⨁◯MODERATE
Vitamin B6 (Pyridoxine) and MI risk (random effects model) - RCTs
2 randomised trials
not serious not serious not serious e serious f none d RR 1.04(0.87 to 1.23)
5 more per 1,000
(from 16 fewer to 28
more)
⨁⨁⨁◯MODERATE
Vitamin B6 (Pyridoxine) and stroke risk (random effects model) - RCTs
2 randomised trials
not serious not serious not serious g serious h none d RR 0.92(0.61 to 1.40)
2 fewer per 1,000
(from 10 fewer to 11
more)
⨁⨁⨁◯MODERATE
Vitamin B6 (Pyridoxine) and MI mortality risk (random effects model) - RCTs
65

Certainty assessment Effect
Certainty№ of
studiesStudy design Risk of bias Inconsistency Indirectness Imprecision Other considerations Relative
(95% CI)Absolute(95% CI)
1 randomised trials
not serious not serious a not serious i serious j none d RR 1.04(0.74 to 1.48)
3 more per 1,000
(from 16 fewer to 30
more)
⨁⨁⨁◯MODERATE
Vitamin B6 (Pyridoxine) and all-cause mortality risk (random effects model) - RCTs
2 randomised trials
not serious not serious not serious k serious l none d RR 1.02(0.80 to 1.30)
1 more per 1,000
(from 14 fewer to 21
more)
⨁⨁⨁◯MODERATE
CI: Confidence interval; RR: Risk ratio
Explanationsa. Unable to assess inconsistency as only one study was included. b. No serious indirectness for vitamin B6 (pyridoxine) supplementation and total CVD risk (RCTs), although the single study was secondary prevention. c. Serious imprecision for vitamin B6 (pyridoxine) supplementation and total CVD risk (RCTs), as the 95% CI (RR, 0.85-1.24) include both clinically important benefit (RR<0.95) and harm (RR>1.05). d. Publication bias was not assessed since there were <10 studies. e. No serious indirectness for vitamin B6 (pyridoxine) supplementation and MI risk (RCTs), although both included studies were secondary prevention. f. Serious imprecision for vitamin B6 (pyridoxine) supplementation and MI risk (RCTs), as the 95% CI (RR, 0.87- 1.23) include both clinically important benefit (RR<0.95) and harm (RR>1.05). g. No serious indirectness for vitamin B6 (pyridoxine) supplementation and stroke risk (RCTs), although both included studies were secondary prevention. h. Serious imprecision for vitamin B6 (pyridoxine) supplementation and stroke risk (RCTs), as the 95% CI (RR, 0.61-1.40) include both clinically important benefit (RR<0.95) and harm (RR>1.05). i. No serious indirectness for vitamin B6 (pyridoxine) supplementation and MI mortality risk (RCTs), although the one included study was conducted in a population with MI. It was a secondary prevention study. j. Serious imprecision for vitamin B6 (pyridoxine) supplementation and MI mortality risk (RCTs), as the 95% CI (RR, 0.74-1.48) include both clinically important benefit (RR<0.95) and harm (RR>1.05). k. No serious indirectness for vitamin B6 (pyridoxine) supplementation and all-cause mortality risk (RCTs), although both included studies were conducted in a population with MI and suspected CAD. Both were secondary prevention studies. l. Serious imprecision for vitamin B6 (pyridoxine) supplementation and all-cause mortality risk (RCTs), as the 95% CI (RR 0.80, 1.30) include both clinically important benefit (RR<0.95) and harm (RR>1.05).
Supplementary Table 15. GRADE assessment for calcium
Certainty assessment Effect Certainty
№ of studies
Study design Risk of bias Inconsistency Indirectness Imprecision Other considerations Relative
(95% CI)Absolute(95% CI)
Calcium and total CVD risk (random effects model) - RCTs
3 randomised trials
not serious serious a serious b serious c none d RR 1.43(0.79 to 2.59)
41 more per 1,000
(from 20 fewer to 150
more)
⨁◯◯◯VERY LOW
Calcium and total CHD risk (random effects model) - RCTs
2 randomised trials
not serious not serious serious e serious f none d RR 1.16(0.87 to 1.56)
8 more per 1,000
(from 6 fewer to 27
more)
⨁⨁◯◯LOW
Calcium and MI risk (random effects model) - RCTs
4 randomised trials
not serious serious g not serious h serious i none d RR 1.69(0.94 to 3.04)
24 more per 1,000
(from 2 fewer to 72
more)
⨁⨁◯◯LOW
66
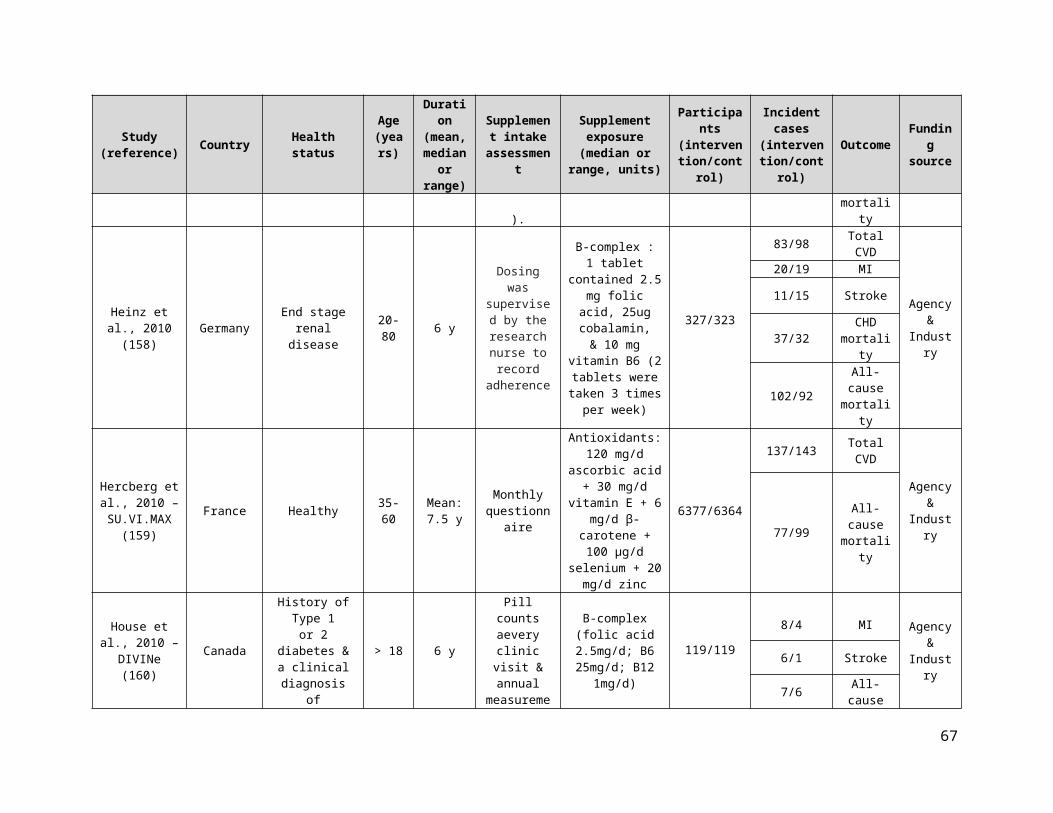
Certainty assessment Effect Certainty
№ of studies
Study design Risk of bias Inconsistency Indirectness Imprecision Other considerations Relative
(95% CI)Absolute(95% CI)
Calcium and stroke risk (random effects model) - RCTs
3 randomised trials
not serious not serious serious j serious k none d RR 1.29(0.96 to 1.72)
12 more per 1,000
(from 2 fewer to 29
more)
⨁⨁◯◯LOW
Calcium and CVD mortality risk (random effects model) - RCTs
2 randomised trials
not serious not serious l serious m very serious n none d RR 1.24(0.27 to 5.65)
4 more per 1,000
(from 12 fewer to 79
more)
⨁◯◯◯VERY LOW
Calcium and MI mortality risk (random effects model) - RCTs
1 randomised trials
not serious not serious o serious p serious q none d RR 1.44(0.62 to 3.36)
5 more per 1,000
(from 5 fewer to 29
more)
⨁⨁◯◯LOW
Calcium and stroke mortality risk (random effects model) - RCTs
1 randomised trials
not serious not serious o serious r very serious s none d RR 0.75(0.26 to 2.15)
3 fewer per 1,000
(from 8 fewer to 13
more)
⨁◯◯◯VERY LOW
Calcium and all-cause mortality risk (random effects model) - RCTs
6 randomised trials
not serious not serious not serious t serious u none d RR 1.08(0.97 to 1.21)
9 more per 1,000
(from 3 fewer to 22
more)
⨁⨁⨁◯MODERATE
CI: Confidence interval; RR: Risk ratio
Explanationsa. Serious inconsistency for calcium supplementation and total CVD risk (RCTs), as I²=80% and p=0.007. b. Serious indirectness for calcium supplementation and total CVD risk (RCTs), as all of the included studies were conducted in post-menopausal women. c. Serious imprecision for calcium supplementation and total CVD risk (RCTs), as the 95% CI (RR, 0.79-2.59) include both clinically important benefit (RR<0.95) and harm (RR>1.05). d. Publication bias was not assessed as there were <10 studies. e. Serious indirectness for calcium supplementation and total CHD risk (RCTs), as 29% of the population have a history of large bowel adenomas and the remaining 71% have low trauma fracture. f. Serious imprecision for calcium supplementation and total CHD risk (RCTs), as the 95% CI (RR, 0.87-1.56) include both clinically important benefit (RR<0.95) and harm (RR>1.05). g. Serious inconsistency for calcium supplementation and MI risk (RCTs), as I²=69% and p=0.02. h. No serious indirectness for calcium supplementation and MI risk (RCTs). All studies were primary prevention. i. Serious imprecision for calcium supplementation and MI risk (RCTs), as the 95% CI (RR, 0.94-3.04) include both clinically important benefit (RR<0.95) and harm (RR>1.05). j. Serious indirectness for calcium supplementation and stroke risk (RCTs), as 24% of total participants had a history of large bowel adenomas and 76% of total participants are post-menopausal women. k. Serious imprecision for calcium supplementation and stroke risk (RCTs), as the 95% CI (RR, 0.96-1.72) overlaps with the minimally important difference for clinical harm (RR>1.05). l. No serious inconsistency for calcium supplementation and CVD mortality risk (RCTs), although I²=53% and p=0.14. m. Serious indirectness for calcium supplementation and total CVD mortality risk (RCTs), as both included studies were conducted in post-menopausal women. n. Very serious imprecision for calcium supplementation and CVD mortality risk (RCTs), as the 95% CI (RR, 0.27-5.65) include both appreciable clinically important benefit (RR<0.95) and harm (RR>1.05). o. Unable to assess inconsistency as only one study was included. p. Serious indirectness for calcium supplementation and MI mortality risk (RCTs), as the only study was conducted in post-menopausal women. q. Serious imprecision for calcium supplementation and MI mortality risk (RCTs), as the 95% CI (RR, 0.62-3.36) include both clinically important benefit (RR<0.95) and harm (RR>1.05). r. Serious indirectness for calcium supplementation and stroke mortality risk (RCTs), as the only included study was conducted in post-menopausal women. s. Very serious imprecision for calcium supplementation and stroke mortality risk (RCTs), as the 95% CI (RR, 0.26-2.15) include both appreciable clinically important benefit (RR<0.95) and harm (RR>1.05). t. No serious indirectness for calcium supplementation and all-cause mortality risk (RCTs). All studies were primary prevention. u. Serious imprecision for calcium supplementation and all-cause mortality risk (RCTs), as the 95% CI (RR, 0.97-1.21) overlaps with the minimally important difference for clinical harm (RR>1.05).
67

Supplementary Table 16. GRADE assessment for iron
Certainty assessment Effect Certainty
№ of studies
Study design Risk of bias Inconsistency Indirectness Imprecision Other considerations Relative
(95% CI)Absolute(95% CI)
Iron and total CVD risk (IV iron for iron deficiency in heart failure) (random effects model) - RCTs
1 randomised trials
not serious not serious a serious b not serious none c RR 0.49(0.28 to 0.86)
72 fewer per 1,000(from 20
fewer to 102 fewer)
⨁⨁⨁◯MODERATE
Iron and MI risk (IV iron for iron deficiency in heart failure) (random effects model) - RCTs
1 randomised trials
not serious not serious a serious d very serious e none c RR 0.34(0.06 to 2.01)
13 fewer per 1,000(from 18
fewer to 20 more)
⨁◯◯◯VERY LOW
Iron and CVD mortality risk (IV iron for iron deficiency in heart failure) (random effects model) - RCTs
2 randomised trials
not serious not serious not serious f serious g none c RR 0.80(0.40 to 1.58)
10 fewer per 1,000(from 30
more to 31 fewer)
⨁⨁⨁◯MODERATE
Iron and all-cause mortality risk (Iron for iron deficiency in heart failure) (random effects model) - RCTs
2 randomised trials
not serious not serious serious h serious i none c RR 0.79(0.42 to 1.51)
12 fewer per 1,000(from 30
more to 34 fewer)
⨁⨁◯◯LOW
CI: Confidence interval; RR: Risk ratio
Explanationsa. Unable to assess inconsistency as only one study was included. b. Serious indirectness for iron supplementation and total CVD risk (RCTs), as the one included study was conducted in patients with chronic heart failure. c. Publication bias was not assessed as there were <10 studies. d. Serious indirectness for iron supplementation and MI risk (RCTs), as the one included study was conducted in patients with chronic heart failure. e. Very serious imprecision for iron supplementation and MI risk (RCTs), as the 95% CI (RR, 0.06-2.01) include both appreciable clinically important benefit (RR<0.95) and harm (RR>1.05). f. No serious indirectness for iron supplementation and total CVD mortality risk (RCTs), even though there were only two studies, one study was a multi-center study and included several countries and both studies were conducted in high risk populations for CVD mortality. g. Serious imprecision for iron supplementation and CVD mortality risk (RCTs), as the 95% CI (RR, 0.40-1.58) include both clinically important benefit (RR<0.95) and harm (RR>1.05). h. Serious indirectness for iron supplementation and all-cause mortality risk (RCTs), as both studies were conducted in patients with heart failure. i. Serious imprecision for iron supplementation and all-cause mortality risk (RCTs), as the 95% CI (RR, 0.42-1.51) include both clinically important benefit (RR<0.95) and harm (RR>1.05).
Supplementary Table 17. GRADE assessment for multivitamin
Certainty assessment Effect
Certainty№ of
studiesStudy design Risk of bias Inconsistency Indirectness Imprecision Other considerations Relative
(95% CI)Absolute(95% CI)
Multivitamin and total CVD risk (random effects model) - RCTs
2 randomised trials
not serious not serious serious a serious b none c RR 0.95(0.77 to 1.17)
6 fewer per 1,000
(from 20 more to 27
fewer)
⨁⨁◯◯LOW
Multivitamin and MI risk (random effects model) - RCTs
68

Certainty assessment Effect
Certainty№ of
studiesStudy design Risk of bias Inconsistency Indirectness Imprecision Other considerations Relative
(95% CI)Absolute(95% CI)
3 randomised trials
not serious not serious not serious e serious f none c RR 0.95(0.82 to 1.09)
2 fewer per 1,000
(from 4 more to 9
fewer)
⨁⨁⨁◯MODERATE
Multivitamin and stroke (random effects model) - RCTs
2 randomised trials
not serious serious g serious h serious i none c RR 0.86(0.46 to 1.62)
6 fewer per 1,000
(from 22 fewer to 25
more)
⨁◯◯◯VERY LOW
Multivitamin and CVD mortality risk (random effects model) - RCTs
3 randomised trials
not serious not serious serious j serious k none c RR 0.94(0.83 to 1.06)
4 fewer per 1,000
(from 4 more to 10
fewer)
⨁⨁◯◯LOW
Multivitamin and MI mortality risk (random effects model) - RCTs
1 randomised trials
not serious not serious d serious l serious m none c RR 0.63(0.39 to 1.02)
2 fewer per 1,000
(from 0 fewer to 4
fewer)
⨁⨁◯◯LOW
Multivitamins and stroke mortality risk (random effects model) - RCTs
2 randomised trials
not serious not serious not serious n serious o none c RR 0.88(0.51 to 1.51)
1 fewer per 1,000
(from 6 fewer to 6
more)
⨁⨁⨁◯MODERATE
Multivitamin and all-cause mortality risk (random effects model) - RCTs
10 randomised trials
not serious not serious not serious p serious q none RR 0.95(0.90 to 1.01)
8 fewer per 1,000
(from 2 more to 16
fewer)
⨁⨁⨁◯MODERATE
CI: Confidence interval; RR: Risk ratio
Explanationsa. Serious indirectness for multivitamin supplementation and total CVD risk (RCTs) as one of the included studies (Sesso et al., 2012- PHS II), which represented ~90% of the population, was conducted in males only. One study was secondary prevention and the other one was primary prevention. b. Serious imprecision for multivitamin supplementation and total CVD risk (RCTs), as the 95% CI (RR, 0.77-1.17) include both clinically important benefit (RR<0.95) and harm (RR>1.05). c. Publication bias was not assessed since there were <10 studies. d. Inconsistency was not assessed as only one study was included. e. No serious indirectness for multivitamin supplementation and MI risk (RCTs). Majority of the studies were primary prevention, with the exception of one (Lamas et al., 2013) which included individuals post MI. f. Serious imprecision for multivitamin supplementation and MI risk (RCTs), as the 95% CI (RR, 0.82-1.09) include both clinically important benefit (RR<0.95) and harm (RR>1.05). g. Serious inconsistency for multivitamin supplementation and stroke risk (RCTs), as I²=59% and p=0.12 (effect estimates for the two included studies go in opposite directions). h. Serious indirectness for multivitamin supplementation and stroke risk (RCTs), as one of the included studies (Sesso et al., 2012- PHS II), which represented ~83% of the population, was conducted in males only. One included study was primary prevention and the other one was for secondary prevention. i. Serious imprecision for multivitamin supplementation and stroke risk (RCTs), as the 95% CI (RR, 0.46-1.62) include both clinically important benefit (RR<0.95) and harm (RR>1.05). j. Serious indirectness for multivitamin supplementation and CVD mortality risk (RCTs), as one of the included studies (Sesso et al., 2012- PHS II), which represented ~83% of the population, was conducted in males only. k. Serious imprecision for multivitamin supplementation and CVD mortality risk (RCTs), as the 95% CI (RR, 0.83-1.06) include both clinically important benefit (RR<0.95) and harm (RR>1.05). l. Serious indirectness for multivitamin supplementation and MI mortality risk (RCTs), as the one included study (Sesso et al., 2012- PHS II), was conducted in males only. m. Serious imprecision for multivitamin supplementation and MI mortality risk (RCTs), as the 95% CI (RR, 0.39-1.02) overlaps with the minimally important difference for clinical benefit (RR<0.95). n. No serious indirectness for multivitamin supplementation and stroke mortality risk (RCTs). One study was for primary prevention and the second one, Sesso et al., 2012 was a combination of both.
69

o. Serious imprecision for multivitamin supplementation and stroke mortality risk (RCTs), as the 95% CI (RR, 0.49-1.63) include both clinically important benefit (RR<0.95) and harm (RR>1.05). p. No serious indirectness for multivitamin supplementation and all-cause mortality (RCTs). Majority of the studies were for primary prevention with the exception for one study (Lamas et al., 2013) which included individuals post MI. q. Serious imprecision for multivitamin supplementation and all-cause mortality risk (RCTs), as the 95% CI (RR, 0.90-1.01) overlaps with the minimally important difference for clinical benefit (RR<0.95).
Supplementary Table 18. GRADE assessment for calcium and vitamin D
Certainty assessment Effect
Certainty№ of
studiesStudy design Risk of bias Inconsistency Indirectness Imprecision Other considerations Relative
(95% CI)Absolute(95% CI)
VitD+Ca and total CVD risk (random effects model) - RCTs
2 randomised trials
not serious not serious serious a serious b none c RR 1.03(0.94 to 1.12)
3 more per 1,000
(from 6 fewer to 13
more)
⨁⨁◯◯LOW
VitD+Ca and total CHD risk (random effects model) - RCTs
2 randomised trials
not serious not serious serious e very serious f none c RR 0.73(0.20 to 2.68)
8 fewer per 1,000
(from 23 fewer to 47
more)
⨁◯◯◯VERY LOW
VitD+Ca and MI risk (random effects model) - RCTs
5 randomised trials
not serious not serious serious g serious h none c RR 1.14(0.95 to 1.37)
3 more per 1,000
(from 1 fewer to 8
more)
⨁⨁◯◯LOW
VitD+Ca and stroke risk (random effects model) - RCTs
7 randomised trials
not serious not serious not serious i serious j none c RR 1.17(0.98 to 1.39)
4 more per 1,000
(from 0 fewer to 9
more)
⨁⨁⨁◯MODERATE
Vit D+Ca and CVD mortality risk (random effects model) - RCTs
1 randomised trials
not serious not serious d serious k serious l none c RR 0.92(0.77 to 1.10)
1 fewer per 1,000
(from 1 more to 3
fewer)
⨁⨁◯◯LOW
VitD+Ca and CHD mortality risk (random effects model) - RCTs
2 randomised trials
not serious not serious serious m serious n none c RR 0.94(0.54 to 1.64)
0 fewer per 1,000
(from 3 fewer to 5
more)
⨁⨁◯◯LOW
Vit D+Ca and MI mortality risk (random effects model) - RCTs
1 randomised trials
not serious not serious d serious o very serious p none c RR 2.97(0.12 to 72.26)
0 fewer per 1,000
(from 0 fewer to 0
fewer)
⨁◯◯◯VERY LOW
VitD+Ca and stroke mortality risk (random effects model) - RCTs
70

Certainty assessment Effect
Certainty№ of
studiesStudy design Risk of bias Inconsistency Indirectness Imprecision Other considerations Relative
(95% CI)Absolute(95% CI)
2 randomised trials
not serious not serious serious q serious r none c RR 0.90(0.63 to 1.29)
0 fewer per 1,000
(from 1 fewer to 1
more)
⨁⨁◯◯LOW
VitD+Ca and all-cause mortality (random effects model) - RCTs
20 randomised trials
not serious not serious not serious s serious t none RR 0.95(0.89 to 1.01)
4 fewer per 1,000
(from 1 more to 10
fewer)
⨁⨁⨁◯MODERATE
CI: Confidence interval; RR: Risk ratio
Explanationsa. Serious indirectness for calcium and vitamin D supplementation and total CVD risk (RCTs), as both studies were in women only. b. Serious imprecision for calcium and vitamin D supplementation and total CVD risk (RCTs), as the 95% CI (RR, 0.94-1.12) include both clinically important benefit (RR<0.95) and harm (RR>1.05). c. Publication bias was not assessed as there were < 10 studies. d. Unable to assess inconsistency as there was only 1 study included. e. Serious indirectness for calcium and vitamin D supplementation and total CHD risk (RCTs), as nearly 100% of the population were women. f. Very serious imprecision for calcium and vitamin D supplementation and total CHD risk (RCTs), as the 95% CI (RR, 0.20-2.68) include both appreciable clinically important benefit (RR<0.95) and harm (RR>1.05). g. Serious indirectness for calcium and vitamin D supplementation and MI risk (RCTs), as 95% of the population were women. All studies were primary prevention. h. Serious imprecision for calcium and vitamin D supplementation and MI risk (RCTs), as the 95% CI (RR, 0.95-1.37) overlaps with minimally important difference for clinical harm (RR>1.05). i. Serious indirectness for calcium and vitamin D supplementation and stroke risk (RCTs). All studies were primary prevention. j. Serious imprecision for calcium and vitamin D supplementation and stroke (RCTs), as the 95% CI (RR, 0.98-1.39) overlaps with minimally important difference for clinical harm (RR>1.05). k. Serious indirectness for calcium and vitamin D supplementation and CVD mortality risk (RCTs), as the only included study was conducted in women only. l. Serious imprecision for calcium and vitamin D supplementation and CVD mortality (RCTs), as the 95% CI (RR, 0.77-1.10) include both clinically important benefit (RR<0.95) and harm (RR>1.05). m. Serious indirectness for calcium and vitamin D supplementation and CHD mortality risk (RCTs), as >99% of the population were women. n. Serious imprecision for calcium and vitamin D supplementation and CHD mortality risk (RCTs), as the 95% CI (RR, 0.54-1.64) include both clinically important benefit (RR<0.95) and harm (RR>1.05). o. Serious indirectness for calcium and vitamin D supplementation and MI mortality risk (RCTs), as the only study was conducted in early menopausal women only. p. Very serious imprecision for calcium and vitamin D supplementation and MI mortality risk (RCTs), as the 95% CI (RR, 0.12-72.26) include both appreciable clinically important benefit (RR<0.95) and harm (RR>1.05). q. Serious indirectness for calcium and vitamin D supplementation and stroke mortality risk (RCTs), as >99% of the population were women. r. Serious imprecision for calcium and vitamin D supplementation and stroke mortality risk (RCTs), as the 95% CI (RR, 0.63-1.29) include both clinically important benefit (RR<0.95) and harm (RR>1.05). s. No serious indirectness for calcium and vitamin D supplementation and all-cause mortality risk (RCTs). All but one study were primary prevention, the sole secondary prevention study was conducted in ischemic stroke survivors (Gupta et al., 2016). t. Serious imprecision for calcium and vitamin D supplementation and all-cause mortality risk (RCTs), as the 95% CI (RR, 0.89-1.01) overlaps with minimally important difference for clinical benefit (RR<0.95).
71

Supplementary Table 19. Summary of the meta-analayses results for all-cause mortality, CVD mortality, total CVD risk and other significant assocations
Test Control
All-cause mortality 0 43 RCTs 6m-5.5y 0.99 0.95, 1.03 0.58 2,908/18,719 2,968/18,831 0 Random HighCVD mortality 0 2 RCTs 5-5.5y 0.86 0.66, 1.10 0.23 101/1,952 118/1,955 0 Random LowTotal CVD risk 0 6 RCTs 6m-5.5y 0.95 0.86, 1.05 0.31 505/3,275 532/3,271 0 Random Moderate
All-cause mortality 0 1 RCT 3y 0.99 0.56, 1.72 0.96 24/1,157 24/1,140 N/A Random Low
All-cause mortality 0 6 RCTs 4.5-12y 1.03 0.96, 1.11 0.37 2,181/21,188 2,103/21,154 17 Random ModerateCVD mortality 0 4 RCTs 4.5-12y 1.10 0.98, 1.23 0.11 623/16,834 568/16,834 0 Random ModerateTotal CVD risk 0 3 RCTs 2.1-12y 1.03 0.96, 1.10 0.44 1,476/35,059 1,436/35,059 0 Random ModerateMI mortality - 1 RCT 9.4y 0.42 0.20, 0.87 0.02 10/4,084 24/4,087 N/A Random Moderate
All-cause mortality + 21 RCTs 6m-9.4y 1.06 1.00, 1.12 0.05 4,372/53,153 4,100/52,627 17 Random ModerateCVD mortality 0 7 RCTs 3.3-8y 1.02 0.94, 1.10 0.65 1,141/2,4867 1,122/2,4862 0 Random ModerateTotal CVD risk 0 7 RCTs 2-8y 0.99 0.95, 1.04 0.77 3,822/30,423 3,844/30,403 0 Random High
All-cause mortality 0 32 RCTs 6m-10.1y 1.00 0.97, 1.04 0.87 4,497/61,506 4,487/61,495 0 Random HighCVD mortality 0 11 RCTs 1.4y-10.1y 0.95 0.89, 1.02 0.16 1,404/51,257 1,483/51,276 0 Random ModerateTotal CVD risk 0 10 RCTs 1.4y-10.1y 0.96 0.89, 1.03 0.23 3,916/50,194 4,020/50,281 50 Random Low
All-cause mortality 0 4 RCTs 3-10.3y 1.02 0.94, 1.11 0.63 921/8,020 898/7,984 0 Random ModerateCVD mortality 0 2 RCTs 8-9.4y 1.07 0.92, 1.25 0.35 335/7,760 311/7,737 0 Random ModerateTotal CVD risk 0 2 RCTs 1.4-10.1y 0.99 0.90, 1.10 0.89 728/7,760 731/7,737 0 Random Moderate
All-cause mortality 0 4 RCTs 10m-7.6y 0.99 0.88, 1.12 0.87 493/9,662 499/9,711 0 Random LowCVD mortality 0 3 RCTs 6m-7.6y 1.00 0.66, 1.51 1.00 169/9,400 177/9,451 48 Random LowTotal CVD risk 0 2 RCTs 5.5-7.6y 1.04 0.96, 1.12 0.34 1,183/9,360 1,146/9,410 0 Random Low
All-cause mortality 0 16 RCTs 6m-7.3y 1.02 0.97, 1.06 0.41 3,153/22,701 3,092/22,723 0 Random ModerateCVD mortality 0 5 RCTs 3.4-7.3y 0.98 0.87, 1.11 0.74 1,304/16,843 1,338/16,850 52 Random ModerateTotal CVD risk 0 9 RCTs 2-7.3y 0.98 0.93, 1.04 0.58 3,426/19,877 3,462/19,879 29 Random Moderate
Stroke - 12 RCTs 6m-7.3y 0.90 0.81, 1.00 0.04 986/21,664 1,081/21,675 16 Random Moderate
All-cause mortality 0 10 RCTs 1-10y 0.87 0.72, 1.05 0.14 415/12,792 462/12,788 17 Random ModerateCVD mortality 0 5 RCTs 2-5.3y 0.89 0.68, 1.17 0.41 88/11,235 100/11,233 0 Random ModerateTotal CVD risk - 5 RCTs 1-4.5y 0.83 0.73, 0.93 0.002 435/10,788 525/10,779 0 Random High
Stroke risk - 7 RCTs 1-10y 0.80 0.69, 0.93 0.003 309/12,268 385/12,257 0 Random Moderate
All-cause mortality 0 4 RCTs 1-6.2y 1.04 0.95, 1.14 0.36 1,167/15,727 1,524/17,376 16 Random ModerateCVD mortality 0 3 RCTs 3-6.2y 0.95 0.84, 1.08 0.46 284/2,924 673/4,565 0 Random ModerateTotal CVD risk 0 4 RCTs 3-6.2y 0.97 0.93, 1.03 0.33 2,785/15,762 4,260/17,400 34 Random Moderate
MI risk 0 5 RCTs 6m-6.2y 0.90 0.75, 1.06 0.20 623/16,432 913/17,672 41 Random ModerateStroke risk 0 5 RCTs 6m-6.2y 0.95 0.72, 1.26 0.73 623/16,432 830/17,672 60 Random Moderate
All-cause mortality 0 1 RCT 6.2y 0.96 0.85, 1.08 0.51 273/1,119 709/2,789 N/A Random LowCVD mortality 0 1 RCT 6.2y 0.94 0.82, 1.07 0.33 238/1,119 633/2,789 N/A Random LowTotal CVD risk 0 1 RCT 6.2y 0.98 0.95, 1.01 0.15 914/1,119 2,333/2,789 N/A Random Moderate
MI risk - 1 RCT 6.2y 0.74 0.60, 0.90 0.002 114/1,119 386/2,789 N/A Random ModerateStroke risk - 1 RCT 6.2y 0.76 0.61, 0.95 0.01 95/1,119 311/2,789 N/A Random High
All-cause mortality + 3 RCTs 1-3.9y 1.10 1.00,1.20 0.05 894/14,608 815/14,587 0 Random ModerateCVD mortality 0 2 RCTs 3y 1.14 0.75, 1.73 0.55 46/1,805 40/1,776 0 Random ModerateTotal CVD risk 0 3 RCTs 3-3.9y 0.97 0.81, 1.17 0.77 1,871/14,643 1,927/14,611 55 Random Moderate
MI risk 0 4 RCTs 6m-3.9y 0.96 0.85, 1.08 0.53 509/15,313 527/14,883 0 Random ModerateStroke risk 0 4 RCTs 6m-3.9y 1.10 0.70, 1.72 0.68 528/15,313 519/14,883 37 Random Moderate
Study lengths I2 (%)
Model (R/F)
Grade95% CI P-valueSupplements EffectNumber of
RCTs/CohortsRisk
Ratio Participant number
Beta carotene
Vitamin A
Vitamin D
Vitamin C
Vitamin B3 (Niacin) - overall effect
Folic acid
Selenium
B-Complex
Vitamin E
Antioxidants
Vitamin B3 (Niacin) - no statin
Vitamin B3 (Niacin)- with background statin
72
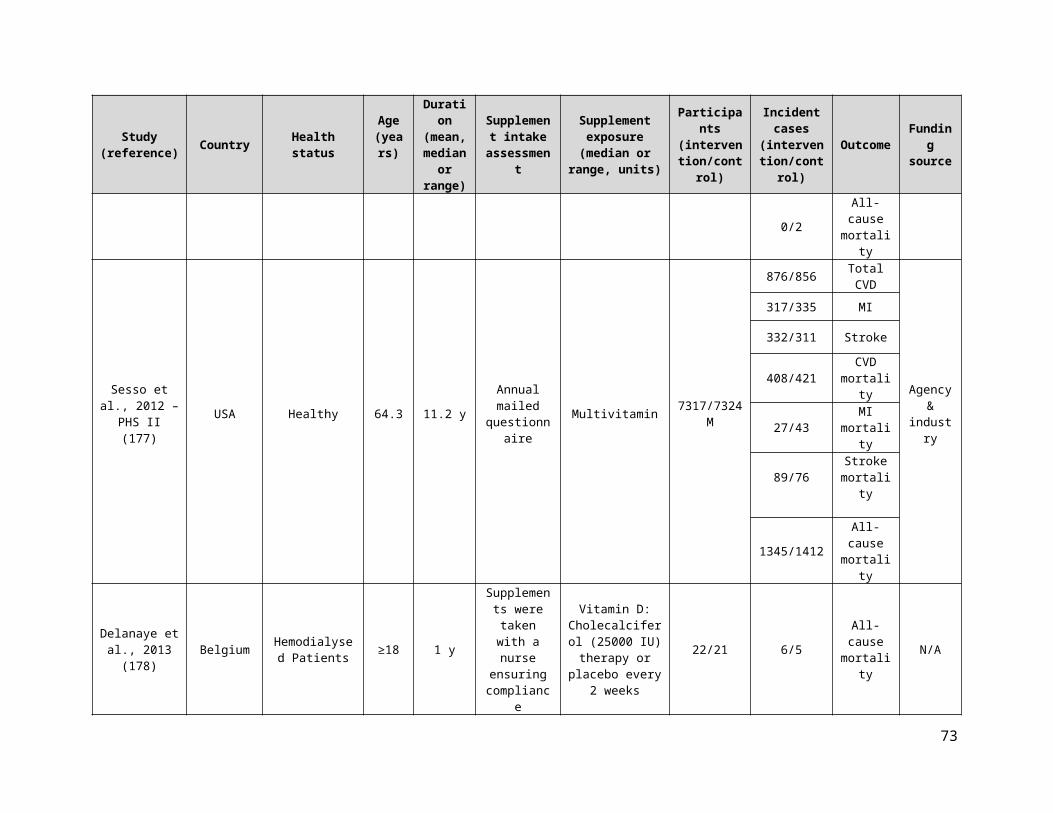
Supplementary Table 20 (continued). Summary of the meta-analayses results for all-cause mortality, CVD mortality, total CVD risk and other significant assocations
All-cause mortality 0 2 RCTs 3.2-3.3y 1.02 0.80, 1.30 0.88 120/1,706 119/1,723 0 Random ModerateTotal CVD risk 0 1 RCT 3.3y 1.03 0.85, 1.24 0.78 175/934 172/943 N/A Random Moderate
All-cause mortality 0 6 RCTs 2-8y 1.08 0.97, 1.21 0.16 558/4,852 526/4,913 0 Random ModerateCVD mortality 0 2 RCTs 5y 1.24 0.27, 5.65 0.78 22/1,462 25/1,469 53 Random Very lowTotal CVD risk 0 3 RCTs 2-5y 1.43 0.79, 2.59 0.23 207/1,663 157/1,665 80 Random Very low
MI risk 0 4 RCTs 2-5y 1.69 0.94, 3.04 0.08 136/2,683 95/2,704 69 Random Low
All-cause mortality 0 2 RCTs 24-52wks 0.79 0.42, 1.51 0.48 17/456 18/306 0 Random LowCVD mortality 0 2 RCT 24-52wks 0.80 0.40, 1.58 0.51 15/454 16/306 0 Random ModerateTotal CVD risk - 1 RCT 24wks 0.49 0.28, 0.86 0.01 21/304 22/155 N/A Random Moderate
All-cause mortality 0 10 RCTs 1-11.2y 0.95 0.90, 1.01 0.12 1,771/11,436 1,862/11,433 0 Random ModerateCVD mortality 0 3 RCTs 3-11.2y 0.94 0.83, 1.06 0.30 476/8,671 508/8,680 0 Random ModerateTotal CVD risk 0 2 RCTs 3-11.2y 0.95 0.77, 1.17 0.61 970/8,170 971/8,179 62 Random Low
All-cause mortality 0 20 RCTs 6m-7.2y 0.95 0.89, 1.01 0.09 1,833/20,999 1,857/21,073 0 Random ModerateCVD mortality 0 1 RCTs 7y 0.92 0.77, 1.11 0.38 226/18,176 244/18,106 N/A Random LowTotal CVD risk 0 2 RCTs 1-7.2y 1.03 0.94, 1.12 0.58 854/7813 818/7,681 0 Random Low
Calcium and Vitamin D
Iron
Calcium
Multivitamins
Vitamin B6
73
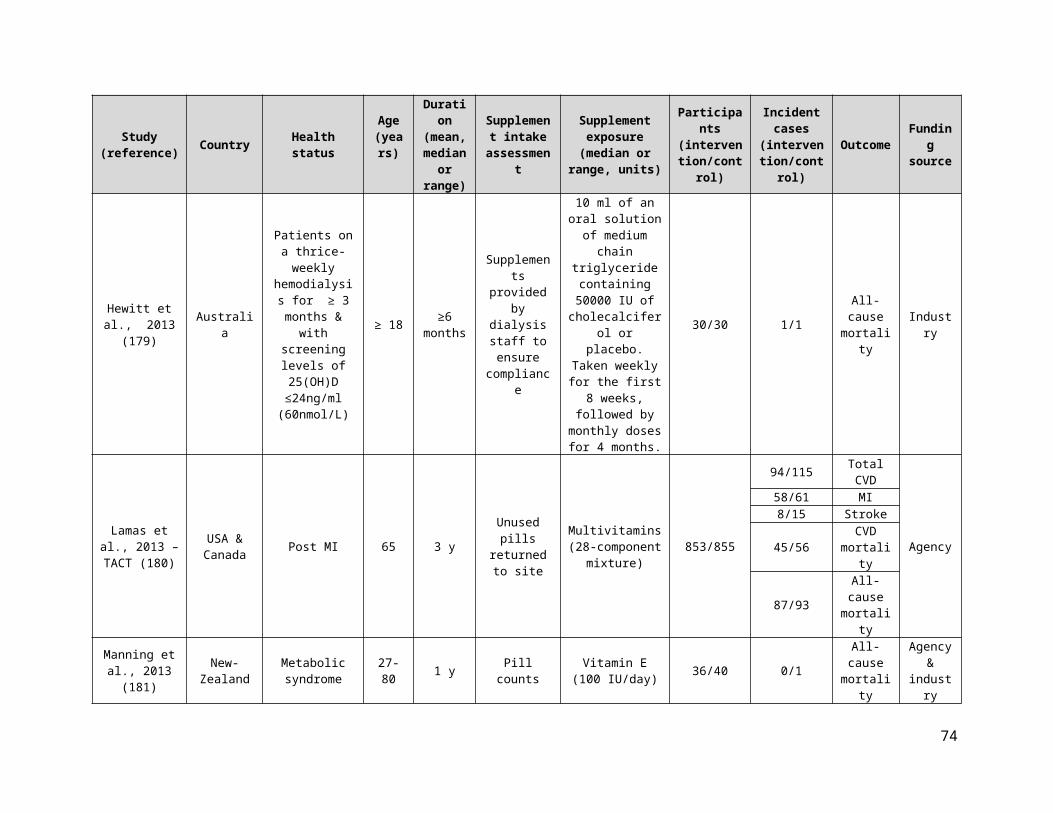
Vitamin and mineral supplements and CVD & all-cause mortality
TOTAL: 1496 PAPERS 284 COCHRANE 716 MEDLINE 402 PUBMED 94 Manual Searches
1383 Excluded 479 Duplicates 2 Foreign Language 96 Less than 6 months 158 No outcome of interest 100 No supplement of interest 8 Non-human 59 Observational studies 9 SRMA of cohorts 181 Non-supplemental 74 Protocol 8 Review 209 Wrong population
113 PAPERS 55 SRMA (952 RCTs, 2 RCTs/cohorts)
54 single RCTs 4 single RCT/cohorts
833 Excluded (Duplicates, not the nutrient of interest, no control arm, foreign language, no supplement use, less than 6 months)
Studies identified through systematic search.
All individual RCT and cohort studies.
179 INCLUDED RCTs Outcome Vit D Vit A β-carotene Antioxidants Vit E Vit C Selenium B-complex Folic acid Total CVD 6 0 3 7 10 2 2 9 5 Total CHD 3 0 2 1 2 1 1 5 2 MI 12 0 3 6 10 2 2 13 6 Stroke 11 0 3 7 11 2 2 12 7 CVD mortality 2 0 4 7 11 2 3 5 5 CHD mortality 2 0 1 2 2 0 0 3 0 MI mortality 4 0 1 3 8 2 2 2 2 Stroke mortality 2 0 2 5 6 2 1 2 2 All-cause mortality
43 1 6 21 32 4 4 16 10
Outcome Vit B3 Vit B6 Calcium Iron Magnesium Potassium Zinc Multivitamins Ca & Vit D Total CVD 4 1 3 1 0 0 0 2 2 Total CHD 2 0 2 0 0 0 0 0 2 MI 5 2 4 1 0 0 0 3 5 Stroke 5 2 3 0 0 0 0 2 7 CVD mortality 3 0 2 2 0 0 0 3 1 CHD mortality 3 0 0 0 0 0 0 0 2 MI mortality 0 1 1 0 0 0 0 1 1 Stroke mortality 0 0 1 0 0 0 0 2 2 All-cause mortality
4 2 6 2 0 0 0 10 20
Supplementary Figure 1. Consort statement
74

Ran
dom
seq
uenc
e ge
nera
tion
(sel
ectio
n bi
as)
Albert et al., 2008 - WAFACS ?
Aloia et al., 1988 ?
Aloia et al., 2005 +
Alvarez et al., 2012 ?
Anker et al., 2009 - FAIR-HF +
AREDS Research Group 2001 +
Armitage et al., 2010 - SEARCH +
Avenell et al., 2005 - MAVIS +
Baeksgaard et al., 1998 ?
Bairati et al., 2006 +
Baker et al., 2002 ?
Baron et al., 1999 - CPPS +
Bjorkman et al., 2008 ?
Boaz et al., 2000 - SPACE +
Boden et al., 2011 - AIM HIGH ?
Bogden et al., 1994 +
Bolland et al., 2008 +
Bolton-Smith et al., 2007 +
Bonaa et al., 2006 - NORVIT ?
Brazier et al., 2005 ?
Brohult et al., 1973 ?
Brown et al., 2001 - HATS ?
CDPRG 1975 ?
Chailurkit et al., 2010 ?
Chapuy et al., 1992 ?
Chapuy et al., 2002 - Decalyos II ?
Cherniack et al., 2011 ?
Chylack et al.., 2002 - REACT +
CLIPS Group 2007 ?
Coburn et al., 2004 ?
Cole et al., 2007 - AFPPS +
Collins et al., 2003 +
Cook et al., 2007 - WACS +
Cooper et al., 2003 ?
Corless et al., 1985 +
Correa et al., 2000 +
Coyne et al., 2006 +
CTNS 2008 ?
Daly et al., 2006 +
Dawson-Hughes et al., 1997 ?
de Gaetano et al., 2001 - PPP +
de la Maza et al., 1995 +
Delanaye et al., 2013 ?
Desnuelle et al., 2001 - ALSRT ?
de Waart et al., 2001 ?
de Zeeuw et al., 2010 - VITAL +
Dukas et al., 2004 ?
Durga et al., 2007 - FACIT ?
Ebbing et al., 2008 - WENBIT +
Flicker et al., 2005 +
Frazao et al., 2000 ?
Galan et al., 2010 - SU.FOL.OM3 +
Gallagher et al., 1990 +
Gallagher et al., 2001 - STOP IT –
Gallagher et al., 2012 - VIDOS +
Gillilan et al., 1997 ?
Girodon et al., 1997 ?
Girodon et al., 1999 - MIN.VIT.AOX ?
GISSI-Prevenzione Investigators 1999 +
Glendenning et al., 2012 +
Graat et al., 2002 +
Grady et al., 1991 ?
Graf et al., 2005 ?
Grant et al., 2005 - RECORD +
Greenberg et al., 1996 - SCPS +
Green et al., 1999 - NSCPT +
Grimnes et al. 2011 ?
Gupta et al., 2016 +
Guyton et al., 2008 ?
Hamdy et al., 1995 ?
Harwood et al., 2004 - NoNOF +
Heinz et al., 2010 ?
Hennekens et al., 1996 - PHS +
Hercberg et al., 2010 - SU.VI.MAX ?
Hewitt et al., 2013 +
Hodis et al., 2002 - VEAPS +
Hodis et al., 2009 - BVAIT +
Hoffman et al., 1999 ?
House et al., 2010- DIVINe +
HPS2-THRIVE Collaborative Group 2014 +
HPS Collaborative Group 2002 +
Huo et al., 2015 - CSPPT +
Imasa et al., 2009 ?
Inkovaara et al., 1983 –
Jacobson et al., 2000 ?
Jamison et al., 2007 - HOST +
Janssen et al.,2010 ?
Komulainen et al., 1999 - OSTPRE ?
Korpela et al., 1989 ?
Krieg et al., 1999 ?
Lacroix et al., 2009 - WHI +
Lamas et al., 2013 - TACT +
Lange et al., 2004 ?
Lappe et al., 2007 +
Lappe et al., 2017 +
Larsen et al., 2004 +
Law et al., 2006 +
Lee et al., 1999 - WHS +
Lee et al., 2005 - WHS +
Lehouck et al., 2012 +
Leppälä et al., 2000 - ATBC ?
Lewis et al., 2011 - CAIFOS +
Liem et al., 2003 +
Liem et al., 2004 ?
Li et al., 1993 - NIT 2 ?
Limburg et al., 2005 +
Lippman et al., 2009 - SELECT ?
Lips et al., 1996 +
Liu et al., 2007 +
Logan et al., 2008 - UKCAP +
Lonn et al., 2005 - HOPE & HOPE TOO ?
Lonn et al., 2006 - HOPE TOO ?
Lyons et al., 2007 +
Ma et al., 2012 - SIT ?
Magliano et al., 2006 - MAVET ?
Manning et al., 2013 +
Manuel-Y-Kennoy et al., 2004 - DATOR ?
Marshall et al., 2011 ?
McKeown-Eyssen et al., 1988 ?
McNeil et al., 2004 - VECAT ?
Meier et al., 2004 ?
Meydani et al., 2004 +
Meyer et al., 2002 –
Milman et al., 2008 - ICARE +
Moon et al., 1997 - SKICAP AK ?
Mooney et al., 2005 +
Omenn et al., 1996 - CARET ?
Ooms et al., 1995 ?
Ott et al., 1989 ?
Petersen et al., 2005 - ADCS 2 +
Pike et al., 1995 +
Plummer et al., 2007 +
Ponikowski et al. 2015 - CONFIRM-HF +
Porthouse et al., 2005 +
Potena et al., 2005 +
Prentice et al., 2013 - WHI CaD +
Prince et al., 2008 +
Punthakee et al., 2012 - TIDE +
Reid et al., 2008 +
Righetti et al., 2003 ?
Salonen et al., 2000 - ASAP ?
Salovaara et al., 2010 - OSTRE-FPS +
Sanders et al., 2010 - Vital D +
Sang et al., 2009 ?
Sano et al., 1997 - ADCS 1 ?
Sanyal et al., 2010 - PIVENS ?
Saposnik et al., 2009 - HOPE 2 +
Sato et al., 1997 ?
Sato et al., 1999 +
Sato et al., 2005 +
Schleitoff et al., 2006 +
Schnyder et al., 2002 - The Swiss Heart Study ?
Sesso et al., 2008 - PHS II +
Sesso et al., 2012 - PHS II +
Shoulson et al., 1998 - DATATOP ?
Smith et al., 2007 ?
Steiner et al., 1995 ?
Stephens et al., 1996 - CHAOS +
Stranges et al., 2006 - NPC ?
Taylor et al., 2004 - ARBITER 2 +
Tornwall et al., 2004 - ATBC ?
Trivedi et al., 2003 ?
Van Dijk et al., 2015 - B-PROOF +
Van Wijngaarden et al., 2014 - B-PROOF +
Vianna et al., 2007 ?
Virtamo et al., 1998 - ATBC ?
Virtamo et al., 2003 - ATBC ?
VITATOPS Trial Study Group 2010 +
Wang et al., 2014 - OPERA +
Wang et al., 2014 - PHS II +
Wang et al., 2015 +
Waters et al., 2002 - WAVE +
Witham et al., 2013 +
Witham et al., 2013 - VitDISH +
Wluka et al., 2002 +
Wu et al., 2009 - NHS/HPFS +
You et al., 2001 - SIT ?
Zhu et al., 2008 - CAIFOS +
Zoungas et al., 2006 - ASFAST ?
Allo
catio
n co
ncea
lmen
t (se
lect
ion
bias
)
+
?
?
+
+
+
+
?
?
?
?
?
+
?
+
?
+
+
+
?
?
?
?
+
?
?
?
+
+
+
+
+
+
?
?
?
+
?
+
?
+
?
?
?
?
+
+
+
+
+
+
+
+
+
+
?
?
?
+
+
+
?
?
+
?
+
+
–
+
?
+
+
?
?
?
?
?
?
+
+
+
+
+
+
?
+
+
?
?
?
?
+
?
–
–
–
?
?
?
+
?
+
?
?
?
+
+
+
+
+
+
+
+
?
+
+
?
?
?
?
?
+
?
+
?
?
+
+
?
+
?
+
+
+
+
?
+
+
+
+
+
?
+
+
?
+
+
?
?
+
?
?
?
?
?
+
?
?
+
+
?
?
+
+
?
?
?
+
?
?
+
+
?
+
?
+
+
+
?
Blin
ding
of p
artic
ipan
ts a
nd p
erso
nnel
(per
form
ance
bia
s)+
+
+
+
+
+
+
+
+
+
?
+
+
+
+
+
+
+
+
+
+
+
+
+
?
+
+
+
+
+
+
+
+
+
+
+
+
+
+
+
+
+
+
+
+
+
+
+
+
+
+
+
+
+
+
+
+
+
+
+
+
+
+
+
+
+
+
–
+
+
+
+
+
+
+
+
+
?
+
+
+
+
+
+
+
+
+
+
+
+
+
+
+
+
+
?
+
+
+
+
+
+
+
+
+
+
+
+
+
+
+
+
+
+
+
+
?
+
+
+
+
+
+
+
+
+
+
+
+
+
+
+
+
+
+
+
+
+
+
?
+
?
+
+
+
+
+
+
+
+
+
+
+
+
+
+
+
+
+
+
+
+
+
+
+
+
+
+
+
+
+
+
+
+
+
+
+
+
+
Inco
mpl
ete
outc
ome
data
(attr
ition
bia
s)
+
+
+
+
+
+
+
+
+
?
?
+
+
?
?
?
+
+
?
?
?
+
+
?
+
?
+
+
+
+
+
?
+
+
+
–
+
+
+
+
+
+
+
+
?
+
?
+
+
+
?
+
+
+
+
+
?
+
+
+
+
+
?
+
?
?
+
+
+
+
?
?
+
+
+
+
+
?
+
?
+
?
?
?
–
+
?
+
?
?
+
?
+
+
+
?
+
+
+
+
?
?
+
+
?
+
+
+
+
+
+
+
+
+
?
+
+
+
?
+
+
?
?
+
+
+
+
+
+
+
?
+
+
+
+
+
+
+
+
+
?
+
+
?
+
?
+
?
+
?
+
+
+
+
?
+
?
+
+
+
?
+
+
+
+
?
?
+
+
?
?
?
+
+
?
?
+
+
+
Sel
ectiv
e re
porti
ng (r
epor
ting
bias
)
+
+
+
+
+
+
+
+
+
?
?
+
+
+
+
+
+
+
+
+
+
+
+
+
+
+
+
+
+
+
+
+
+
+
+
+
+
+
+
+
+
+
+
+
+
+
+
+
+
+
+
+
+
+
+
+
+
+
+
+
+
+
+
+
+
+
+
+
+
+
+
+
+
+
+
+
+
+
+
+
+
+
+
+
+
+
+
+
?
+
+
+
+
+
+
?
+
+
+
+
+
+
+
+
+
+
+
+
+
+
+
+
+
+
+
+
+
+
+
+
+
+
+
+
+
+
+
+
+
+
+
+
+
+
+
+
+
+
+
+
+
+
+
+
+
+
+
?
?
+
+
+
+
+
+
+
+
+
+
+
?
+
+
+
+
+
+
+
+
+
+
+
+
+
+
+
+
+
+
Supplementary Figure 2. Risk of bias summary for supplements and CVD and total mortality. Review authors' judgments about each risk of bias item for each included study.
75
Ran
dom
seq
uenc
e ge
nera
tion
(sel
ectio
n bi
as)
Albert et al., 2008 - WAFACS ?
Aloia et al., 1988 ?
Aloia et al., 2005 +
Alvarez et al., 2012 ?
Anker et al., 2009 - FAIR-HF +
AREDS Research Group 2001 +
Armitage et al., 2010 - SEARCH +
Avenell et al., 2005 - MAVIS +
Baeksgaard et al., 1998 ?
Bairati et al., 2006 +
Baker et al., 2002 ?
Baron et al., 1999 - CPPS +
Bjorkman et al., 2008 ?
Boaz et al., 2000 - SPACE +
Boden et al., 2011 - AIM HIGH ?
Bogden et al., 1994 +
Bolland et al., 2008 +
Bolton-Smith et al., 2007 +
Bonaa et al., 2006 - NORVIT ?
Brazier et al., 2005 ?
Brohult et al., 1973 ?
Brown et al., 2001 - HATS ?
CDPRG 1975 ?
Chailurkit et al., 2010 ?
Chandra et al., 1992 +
Chapuy et al., 1992 ?
Chapuy et al., 2002 - Decalyos II ?
Cherniack et al., 2011 ?
Chylack et al.., 2002 - REACT +
CLIPS Group 2007 ?
Coburn et al., 2004 ?
Cole et al., 2007 - AFPPS +
Collins et al., 2003 +
Cook et al., 2007 - WACS +
Cooper et al., 2003 ?
Corless et al., 1985 +
Correa et al., 2000 +
Coyne et al., 2006 +
CTNS Study Group 2008 ?
Daly et al., 2008 +
Dawson-Hughes et al., 1997 ?
de Gaetano et al., 2001 - PPP +
de la Maza et al., 1995 +
Delanaye et al., 2013 ?
Desnuelle et al., 2001 - ALSRT ?
de Waart et al., 2001 ?
de Zeeuw et al., 2010 - VITAL +
Dukas et al., 2004 ?
Durga et al., 2007 - FACIT ?
Ebbing et al., 2008 - WENBIT +
Flicker et al., 2005 +
Frazao et al., 2000 ?
Galan et al., 2010 - SU.FOL.OM3 +
Gallagher et al., 1990 +
Gallagher et al., 2001 - STOP IT –
Gallagher et al., 2012 - VIDOS +
Gillilan et al., 1997 ?
Girodon et al., 1997 ?
Girodon et al., 1999 - MIN.VIT.AOX ?
GISSI-Prevenzione Investigators 1999 +
Glendenning et al., 2012 +
Graat et al., 2002 +
Grady et al., 1991 ?
Graf et al., 2005 ?
Grant et al., 2005 - RECORD +
Greenberg et al., 1996 - SCPS +
Green et al., 1999 - NSCPT +
Grimnes et al. 2011 ?
Gupta et al., 2016 +
Guyton et al., 2008 ?
Hamdy et al., 1995 ?
Harwood et al., 2004 - NoNOF +
Heinz et al., 2010 ?
Hennekens et al., 1996 - PHS +
Hercberg et al., 2010 - SU.VI.MAX ?
Hewitt et al., 2013 +
Hodis et al., 2002 - VEAPS +
Hodis et al., 2009 - BVAIT +
Hoffman et al., 1999 ?
House et al., 2010- DIVINe +
HPS2-THRIVE Collaborative Group 2014 +
HPS Collaborative Group 2002 +
Huo et al., 2015 - CSPPT +
Imasa et al., 2009 ?
Inkovaara et al., 1983 –
Jacobson et al., 2000 ?
Jamison et al., 2007 - HOST +
Janssen et al.,2010 ?
Komulainen et al., 1999 - OSTPRE ?
Korpela et al., 1989 ?
Krieg et al., 1999 ?
Lacroix et al., 2009 - WHI +
Lamas et al., 2013 - TACT +
Lange et al., 2004 ?
Lappe et al., 2007 +
Lappe et al., 2017 +
Larsen et al., 2004 +
Law et al., 2006 +
Lee et al., 1999 - WHS +
Lee et al., 2005 - WHS +
Lehouck et al., 2012 +
Leppälä et al., 2000 - ATBC ?
Lewis et al., 2011 - CAIFOS +
Liem et al., 2003 +
Liem et al., 2004 ?
Li et al., 1993 - NIT 2 ?
Limburg et al., 2005 +
Lippman et al., 2009 - SELECT ?
Lips et al., 1996 +
Liu et al., 2007 +
Logan et al., 2008 - UKCAP +
Lonn et al., 2005 - HOPE & HOPE TOO ?
Lonn et al., 2006 - HOPE TOO ?
Lyons et al., 2007 +
Ma et al., 2012 - SIT ?
Magliano et al., 2006 - MAVET ?
Manning et al., 2013 +
Manuel-Y-Kennoy et al., 2004 - DATOR ?
Marshall et al., 2011 ?
McKeown-Eyssen et al., 1988 ?
McNeil et al., 2004 - VECAT ?
Meier et al., 2004 ?
Meydani et al., 2004 +
Meyer et al., 2002 –
Milman et al., 2008 - ICARE +
Moon et al., 1997 - SKICAP AK ?
Mooney et al., 2005 +
Omenn et al., 1996 - CARET ?
Ooms et al., 1995 ?
Ott et al., 1989 ?
Petersen et al., 2005 - ADCS 2 +
Pike et al., 1995 +
Plummer et al., 2007 +
Ponikowski et al. 2015 - CONFIRM-HF +
Porthouse et al., 2005 +
Potena et al., 2005 +
Prentice et al., 2013 - WHI CaD +
Prince et al., 2008 +
Punthakee et al., 2012 - TIDE +
Reid et al., 2008 +
Righetti et al., 2003 ?
Salonen et al., 2000 - ASAP ?
Salovaara et al., 2010 - OSTRE-FPS +
Sanders et al., 2010 - Vital D +
Sang et al., 2009 ?
Sano et al., 1997 - ADCS 1 ?
Sanyal et al., 2010 - PIVENS ?
Saposnik et al., 2009 - HOPE 2 +
Sato et al., 1997 ?
Sato et al., 1999 +
Sato et al., 2005 +
Schleitoff et al., 2006 +
Schnyder et al., 2002 - The Swiss Heart Study ?
Sesso et al., 2008 - PHS II +
Sesso et al., 2012 - PHS II +
Shoulson et al., 1998 - DATATOP ?
Smith et al., 2007 ?
Steiner et al., 1995 ?
Stephens et al., 1996 - CHAOS +
Stranges et al., 2006 - NPC ?
Taylor et al., 2004 - ARBITER 2 +
Tornwall et al., 2004 - ATBC ?
Trivedi et al., 2003 ?
Van Dijk et al., 2015 - B-PROOF +
Van Wijngaarden et al., 2014 - B-PROOF +
Vianna et al., 2007 ?
Virtamo et al., 1998 - ATBC ?
Virtamo et al., 2003 - ATBC ?
VITATOPS Trial Study Group 2010 +
Wang et al., 2014 - OPERA +
Wang et al., 2014 - PHS II +
Wang et al., 2015 +
Waters et al., 2002 - WAVE +
Witham et al., 2013 +
Witham et al., 2013 - VitDISH +
Wluka et al., 2002 +
Wu et al., 2009 - NHS/HPFS +
You et al., 2001 - SIT ?
Zhu et al., 2008 - CAIFOS +
Zoungas et al., 2006 - ASFAST ?
Allo
catio
n co
ncea
lmen
t (se
lect
ion
bias
)
+
?
?
+
+
+
+
?
?
?
?
?
+
?
+
?
+
+
+
?
?
?
?
+
?
?
?
?
+
+
+
+
+
+
?
?
?
+
?
+
?
+
?
?
?
?
+
+
+
+
+
+
+
+
+
+
?
?
?
+
+
+
?
?
+
?
+
+
–
+
?
+
+
?
?
?
?
?
?
+
+
+
+
+
+
?
+
+
?
?
?
?
+
?
–
–
–
?
?
?
+
?
+
?
?
?
+
+
+
+
+
+
+
+
?
+
+
?
?
?
?
?
+
?
+
?
?
+
+
?
+
?
+
+
+
+
?
+
+
+
+
+
?
+
+
?
+
+
?
?
+
?
?
?
?
?
+
?
?
+
+
?
?
+
+
?
?
?
+
?
?
+
+
?
+
?
+
+
+
?
Blin
ding
of p
artic
ipan
ts a
nd p
erso
nnel
(per
form
ance
bia
s)
+
+
+
+
+
+
+
+
+
+
?
+
+
+
+
+
+
+
+
+
+
+
+
+
+
?
+
+
+
+
+
+
+
+
+
+
+
+
+
+
+
+
+
+
+
+
+
+
+
+
+
+
+
+
+
+
+
+
+
+
+
+
+
+
+
+
+
+
–
+
+
+
+
+
+
+
+
+
?
+
+
+
+
+
+
+
+
+
+
+
+
+
+
+
+
+
?
+
+
+
+
+
+
+
+
+
+
+
+
+
+
+
+
+
+
+
+
?
+
+
+
+
+
+
+
+
+
+
+
+
+
+
+
+
+
+
+
+
+
+
?
+
?
+
+
+
+
+
+
+
+
+
+
+
+
+
+
+
+
+
+
+
+
+
+
+
+
+
+
+
+
+
+
+
+
+
+
+
+
+
Inco
mpl
ete
outc
ome
data
(attr
ition
bia
s)
+
+
+
+
+
+
+
+
+
?
?
+
+
?
?
?
+
+
?
?
?
+
+
?
+
+
?
+
+
+
+
+
?
+
+
+
–
+
+
+
+
+
+
+
+
?
+
?
+
+
+
?
+
+
+
+
+
?
+
+
+
+
+
?
+
?
?
+
+
+
+
?
?
+
+
+
+
+
?
+
?
+
?
?
?
–
+
?
+
?
?
+
?
+
+
+
?
+
+
+
+
?
?
+
+
?
+
+
+
+
+
+
+
+
+
?
+
+
+
?
+
+
?
?
+
+
+
+
+
+
+
?
+
+
+
+
+
+
+
+
+
?
+
+
?
+
?
+
?
+
?
+
+
+
+
?
+
?
+
+
+
?
+
+
+
+
?
?
+
+
?
?
?
+
+
?
?
+
+
+
Sel
ectiv
e re
porti
ng (r
epor
ting
bias
)
+
+
+
+
+
+
+
+
+
?
?
+
+
+
+
+
+
+
+
+
+
+
+
+
+
+
+
+
+
+
+
+
+
+
+
+
+
+
+
+
+
+
+
+
+
+
+
+
+
+
+
+
+
+
+
+
+
+
+
+
+
+
+
+
+
+
+
+
+
+
+
+
+
+
+
+
+
+
+
+
+
+
+
+
+
+
+
+
+
?
+
+
+
+
+
+
?
+
+
+
+
+
+
+
+
+
+
+
+
+
+
+
+
+
+
+
+
+
+
+
+
+
+
+
+
+
+
+
+
+
+
+
+
+
+
+
+
+
+
+
+
+
+
+
+
+
+
+
?
?
+
+
+
+
+
+
+
+
+
+
+
?
+
+
+
+
+
+
+
+
+
+
+
+
+
+
+
+
+
+
Ran
dom
seq
uenc
e ge
nera
tion
(sel
ectio
n bi
as)
Albert et al., 2008 - WAFACS ?
Aloia et al., 1988 ?
Aloia et al., 2005 +
Alvarez et al., 2012 ?
Anker et al., 2009 - FAIR-HF +
AREDS Research Group 2001 +
Armitage et al., 2010 - SEARCH +
Avenell et al., 2005 - MAVIS +
Baeksgaard et al., 1998 ?
Bairati et al., 2006 +
Baker et al., 2002 ?
Baron et al., 1999 - CPPS +
Bjorkman et al., 2008 ?
Boaz et al., 2000 - SPACE +
Boden et al., 2011 - AIM HIGH ?
Bogden et al., 1994 +
Bolland et al., 2008 +
Bolton-Smith et al., 2007 +
Bonaa et al., 2006 - NORVIT ?
Brazier et al., 2005 ?
Brohult et al., 1973 ?
Brown et al., 2001 - HATS ?
CDPRG 1975 ?
Chailurkit et al., 2010 ?
Chandra et al., 1992 +
Chapuy et al., 1992 ?
Chapuy et al., 2002 - Decalyos II ?
Cherniack et al., 2011 ?
Chylack et al.., 2002 - REACT +
CLIPS Group 2007 ?
Coburn et al., 2004 ?
Cole et al., 2007 - AFPPS +
Collins et al., 2003 +
Cook et al., 2007 - WACS +
Cooper et al., 2003 ?
Corless et al., 1985 +
Correa et al., 2000 +
Coyne et al., 2006 +
CTNS 2008 ?
Daly et al., 2006 +
Dawson-Hughes et al., 1997 ?
de Gaetano et al., 2001 - PPP +
de la Maza et al., 1995 +
Delanaye et al., 2013 ?
Desnuelle et al., 2001 - ALSRT ?
de Waart et al., 2001 ?
de Zeeuw et al., 2010 - VITAL +
Dukas et al., 2004 ?
Durga et al., 2007 - FACIT ?
Ebbing et al., 2008 - WENBIT +
Flicker et al., 2005 +
Frazao et al., 2000 ?
Galan et al., 2010 - SU.FOL.OM3 +
Gallagher et al., 1990 +
Gallagher et al., 2001 - STOP IT –
Gallagher et al., 2012 - VIDOS +
Gillilan et al., 1997 ?
Girodon et al., 1997 ?
Girodon et al., 1999 - MIN.VIT.AOX ?
GISSI-Prevenzione Investigators 1999 +
Glendenning et al., 2012 +
Graat et al., 2002 +
Grady et al., 1991 ?
Graf et al., 2005 ?
Grant et al., 2005 - RECORD +
Greenberg et al., 1996 - SCPS +
Green et al., 1999 - NSCPT +
Grimnes et al. 2011 ?
Gupta et al., 2016 +
Guyton et al., 2008 ?
Hamdy et al., 1995 ?
Harwood et al., 2004 - NoNOF +
Heinz et al., 2010 ?
Hennekens et al., 1996 - PHS +
Hercberg et al., 2010 - SU.VI.MAX ?
Hewitt et al., 2013 +
Hodis et al., 2002 - VEAPS +
Hodis et al., 2009 - BVAIT +
Hoffman et al., 1999 ?
House et al., 2010- DIVINe +
HPS2-THRIVE Collaborative Group 2014 +
HPS Collaborative Group 2002 +
Huo et al., 2015 - CSPPT +
Imasa et al., 2009 ?
Inkovaara et al., 1983 –
Jacobson et al., 2000 ?
Jamison et al., 2007 - HOST +
Janssen et al.,2010 ?
Komulainen et al., 1999 - OSTPRE ?
Korpela et al., 1989 ?
Krieg et al., 1999 ?
Lacroix et al., 2009 - WHI +
Lamas et al., 2013 - TACT +
Lange et al., 2004 ?
Lappe et al., 2007 +
Lappe et al., 2017 +
Larsen et al., 2004 +
Law et al., 2006 +
Lee et al., 1999 - WHS +
Lee et al., 2005 - WHS +
Lehouck et al., 2012 +
Leppälä et al., 2000 - ATBC ?
Lewis et al., 2011 - CAIFOS +
Liem et al., 2003 +
Liem et al., 2004 ?
Li et al., 1993 - NIT 2 ?
Limburg et al., 2005 +
Lippman et al., 2009 - SELECT ?
Lips et al., 1996 +
Liu et al., 2007 +
Logan et al., 2008 - UKCAP +
Lonn et al., 2005 - HOPE & HOPE TOO ?
Lonn et al., 2006 - HOPE TOO ?
Lyons et al., 2007 +
Ma et al., 2012 - SIT ?
Magliano et al., 2006 - MAVET ?
Manning et al., 2013 +
Manuel-Y-Kennoy et al., 2004 - DATOR ?
Marshall et al., 2011 ?
McKeown-Eyssen et al., 1988 ?
McNeil et al., 2004 - VECAT ?
Meier et al., 2004 ?
Meydani et al., 2004 +
Meyer et al., 2002 –
Milman et al., 2008 - ICARE +
Moon et al., 1997 - SKICAP AK ?
Mooney et al., 2005 +
Omenn et al., 1996 - CARET ?
Ooms et al., 1995 ?
Ott et al., 1989 ?
Petersen et al., 2005 - ADCS 2 +
Pike et al., 1995 +
Plummer et al., 2007 +
Ponikowski et al. 2015 - CONFIRM-HF +
Porthouse et al., 2005 +
Potena et al., 2005 +
Prentice et al., 2013 - WHI CaD +
Prince et al., 2008 +
Punthakee et al., 2012 - TIDE +
Reid et al., 2008 +
Righetti et al., 2003 ?
Salonen et al., 2000 - ASAP ?
Salovaara et al., 2010 - OSTRE-FPS +
Sanders et al., 2010 - Vital D +
Sang et al., 2009 ?
Sano et al., 1997 - ADCS 1 ?
Sanyal et al., 2010 - PIVENS ?
Saposnik et al., 2009 - HOPE 2 +
Sato et al., 1997 ?
Sato et al., 1999 +
Sato et al., 2005 +
Schleitoff et al., 2006 +
Schnyder et al., 2002 - The Swiss Heart Study ?
Sesso et al., 2008 - PHS II +
Sesso et al., 2012 - PHS II +
Shoulson et al., 1998 - DATATOP ?
Smith et al., 2007 ?
Steiner et al., 1995 ?
Stephens et al., 1996 - CHAOS +
Stranges et al., 2006 - NPC ?
Taylor et al., 2004 - ARBITER 2 +
Tornwall et al., 2004 - ATBC ?
Trivedi et al., 2003 ?
Van Dijk et al., 2015 - B-PROOF +
Van Wijngaarden et al., 2014 - B-PROOF +
Vianna et al., 2007 ?
Virtamo et al., 1998 - ATBC ?
Virtamo et al., 2003 - ATBC ?
VITATOPS Trial Study Group 2010 +
Wang et al., 2014 - OPERA +
Wang et al., 2014 - PHS II +
Wang et al., 2015 +
Waters et al., 2002 - WAVE +
Witham et al., 2013 +
Witham et al., 2013 - VitDISH +
Wluka et al., 2002 +
Wu et al., 2009 - NHS/HPFS +
You et al., 2001 - SIT ?
Zhu et al., 2008 - CAIFOS +
Zoungas et al., 2006 - ASFAST ?
Allo
catio
n co
ncea
lmen
t (se
lect
ion
bias
)
+
?
?
+
+
+
+
?
?
?
?
?
+
?
+
?
+
+
+
?
?
?
?
+
?
?
?
?
+
+
+
+
+
+
?
?
?
+
?
+
?
+
?
?
?
?
+
+
+
+
+
+
+
+
+
+
?
?
?
+
+
+
?
?
+
?
+
+
–
+
?
+
+
?
?
?
?
?
?
+
+
+
+
+
+
?
+
+
?
?
?
?
+
?
–
–
–
?
?
?
+
?
+
?
?
?
+
+
+
+
+
+
+
+
?
+
+
?
?
?
?
?
+
?
+
?
?
+
+
?
+
?
+
+
+
+
?
+
+
+
+
+
?
+
+
?
+
+
?
?
+
?
?
?
?
?
+
?
?
+
+
?
?
+
+
?
?
?
+
?
?
+
+
?
+
?
+
+
+
?
Blin
ding
of p
artic
ipan
ts a
nd p
erso
nnel
(per
form
ance
bia
s)
+
+
+
+
+
+
+
+
+
+
?
+
+
+
+
+
+
+
+
+
+
+
+
+
+
?
+
+
+
+
+
+
+
+
+
+
+
+
+
+
+
+
+
+
+
+
+
+
+
+
+
+
+
+
+
+
+
+
+
+
+
+
+
+
+
+
+
+
–
+
+
+
+
+
+
+
+
+
?
+
+
+
+
+
+
+
+
+
+
+
+
+
+
+
+
+
?
+
+
+
+
+
+
+
+
+
+
+
+
+
+
+
+
+
+
+
+
?
+
+
+
+
+
+
+
+
+
+
+
+
+
+
+
+
+
+
+
+
+
+
?
+
?
+
+
+
+
+
+
+
+
+
+
+
+
+
+
+
+
+
+
+
+
+
+
+
+
+
+
+
+
+
+
+
+
+
+
+
+
+
Inco
mpl
ete
outc
ome
data
(attr
ition
bia
s)
+
+
+
+
+
+
+
+
+
?
?
+
+
?
?
?
+
+
?
?
?
+
+
?
+
+
?
+
+
+
+
+
?
+
+
+
–
+
+
+
+
+
+
+
+
?
+
?
+
+
+
?
+
+
+
+
+
?
+
+
+
+
+
?
+
?
?
+
+
+
+
?
?
+
+
+
+
+
?
+
?
+
?
?
?
–
+
?
+
?
?
+
?
+
+
+
?
+
+
+
+
?
?
+
+
?
+
+
+
+
+
+
+
+
+
?
+
+
+
?
+
+
?
?
+
+
+
+
+
+
+
?
+
+
+
+
+
+
+
+
+
?
+
+
?
+
?
+
?
+
?
+
+
+
+
?
+
?
+
+
+
?
+
+
+
+
?
?
+
+
?
?
?
+
+
?
?
+
+
+
Sel
ectiv
e re
porti
ng (r
epor
ting
bias
)
+
+
+
+
+
+
+
+
+
?
?
+
+
+
+
+
+
+
+
+
+
+
+
+
+
+
+
+
+
+
+
+
+
+
+
+
+
+
+
+
+
+
+
+
+
+
+
+
+
+
+
+
+
+
+
+
+
+
+
+
+
+
+
+
+
+
+
+
+
+
+
+
+
+
+
+
+
+
+
+
+
+
+
+
+
+
+
+
+
?
+
+
+
+
+
+
?
+
+
+
+
+
+
+
+
+
+
+
+
+
+
+
+
+
+
+
+
+
+
+
+
+
+
+
+
+
+
+
+
+
+
+
+
+
+
+
+
+
+
+
+
+
+
+
+
+
+
+
?
?
+
+
+
+
+
+
+
+
+
+
+
?
+
+
+
+
+
+
+
+
+
+
+
+
+
+
+
+
+
+

Supplementary Figure 2 (Continued). Risk of bias summary for supplements and CVD and total mortality. Review authors' judgments about each risk of bias item for each included study.
76
Ran
dom
seq
uenc
e ge
nera
tion
(sel
ectio
n bi
as)
Albert et al., 2008 - WAFACS ?
Aloia et al., 1988 ?
Aloia et al., 2005 +
Alvarez et al., 2012 ?
Anker et al., 2009 - FAIR-HF +
AREDS Research Group 2001 +
Armitage et al., 2010 - SEARCH +
Avenell et al., 2005 - MAVIS +
Baeksgaard et al., 1998 ?
Bairati et al., 2006 +
Baker et al., 2002 ?
Baron et al., 1999 - CPPS +
Bjorkman et al., 2008 ?
Boaz et al., 2000 - SPACE +
Boden et al., 2011 - AIM HIGH ?
Bogden et al., 1994 +
Bolland et al., 2008 +
Bolton-Smith et al., 2007 +
Bonaa et al., 2006 - NORVIT ?
Brazier et al., 2005 ?
Brohult et al., 1973 ?
Brown et al., 2001 - HATS ?
CDPRG 1975 ?
Chailurkit et al., 2010 ?
Chandra et al., 1992 +
Chapuy et al., 1992 ?
Chapuy et al., 2002 - Decalyos II ?
Cherniack et al., 2011 ?
Chylack et al.., 2002 - REACT +
CLIPS Group 2007 ?
Coburn et al., 2004 ?
Cole et al., 2007 - AFPPS +
Collins et al., 2003 +
Cook et al., 2007 - WACS +
Cooper et al., 2003 ?
Corless et al., 1985 +
Correa et al., 2000 +
Coyne et al., 2006 +
CTNS Study Group 2008 ?
Daly et al., 2008 +
Dawson-Hughes et al., 1997 ?
de Gaetano et al., 2001 - PPP +
de la Maza et al., 1995 +
Delanaye et al., 2013 ?
Desnuelle et al., 2001 - ALSRT ?
de Waart et al., 2001 ?
de Zeeuw et al., 2010 - VITAL +
Dukas et al., 2004 ?
Durga et al., 2007 - FACIT ?
Ebbing et al., 2008 - WENBIT +
Flicker et al., 2005 +
Frazao et al., 2000 ?
Galan et al., 2010 - SU.FOL.OM3 +
Gallagher et al., 1990 +
Gallagher et al., 2001 - STOP IT –
Gallagher et al., 2012 - VIDOS +
Gillilan et al., 1997 ?
Girodon et al., 1997 ?
Girodon et al., 1999 - MIN.VIT.AOX ?
GISSI-Prevenzione Investigators 1999 +
Glendenning et al., 2012 +
Graat et al., 2002 +
Grady et al., 1991 ?
Graf et al., 2005 ?
Grant et al., 2005 - RECORD +
Greenberg et al., 1996 - SCPS +
Green et al., 1999 - NSCPT +
Grimnes et al. 2011 ?
Gupta et al., 2016 +
Guyton et al., 2008 ?
Hamdy et al., 1995 ?
Harwood et al., 2004 - NoNOF +
Heinz et al., 2010 ?
Hennekens et al., 1996 - PHS +
Hercberg et al., 2010 - SU.VI.MAX ?
Hewitt et al., 2013 +
Hodis et al., 2002 - VEAPS +
Hodis et al., 2009 - BVAIT +
Hoffman et al., 1999 ?
House et al., 2010- DIVINe +
HPS2-THRIVE Collaborative Group 2014 +
HPS Collaborative Group 2002 +
Huo et al., 2015 - CSPPT +
Imasa et al., 2009 ?
Inkovaara et al., 1983 –
Jacobson et al., 2000 ?
Jamison et al., 2007 - HOST +
Janssen et al.,2010 ?
Komulainen et al., 1999 - OSTPRE ?
Korpela et al., 1989 ?
Krieg et al., 1999 ?
Lacroix et al., 2009 - WHI +
Lamas et al., 2013 - TACT +
Lange et al., 2004 ?
Lappe et al., 2007 +
Lappe et al., 2017 +
Larsen et al., 2004 +
Law et al., 2006 +
Lee et al., 1999 - WHS +
Lee et al., 2005 - WHS +
Lehouck et al., 2012 +
Leppälä et al., 2000 - ATBC ?
Lewis et al., 2011 - CAIFOS +
Liem et al., 2003 +
Liem et al., 2004 ?
Li et al., 1993 - NIT 2 ?
Limburg et al., 2005 +
Lippman et al., 2009 - SELECT ?
Lips et al., 1996 +
Liu et al., 2007 +
Logan et al., 2008 - UKCAP +
Lonn et al., 2005 - HOPE & HOPE TOO ?
Lonn et al., 2006 - HOPE TOO ?
Lyons et al., 2007 +
Ma et al., 2012 - SIT ?
Magliano et al., 2006 - MAVET ?
Manning et al., 2013 +
Manuel-Y-Kennoy et al., 2004 - DATOR ?
Marshall et al., 2011 ?
McKeown-Eyssen et al., 1988 ?
McNeil et al., 2004 - VECAT ?
Meier et al., 2004 ?
Meydani et al., 2004 +
Meyer et al., 2002 –
Milman et al., 2008 - ICARE +
Moon et al., 1997 - SKICAP AK ?
Mooney et al., 2005 +
Omenn et al., 1996 - CARET ?
Ooms et al., 1995 ?
Ott et al., 1989 ?
Petersen et al., 2005 - ADCS 2 +
Pike et al., 1995 +
Plummer et al., 2007 +
Ponikowski et al. 2015 - CONFIRM-HF +
Porthouse et al., 2005 +
Potena et al., 2005 +
Prentice et al., 2013 - WHI CaD +
Prince et al., 2008 +
Punthakee et al., 2012 - TIDE +
Reid et al., 2008 +
Righetti et al., 2003 ?
Salonen et al., 2000 - ASAP ?
Salovaara et al., 2010 - OSTRE-FPS +
Sanders et al., 2010 - Vital D +
Sang et al., 2009 ?
Sano et al., 1997 - ADCS 1 ?
Sanyal et al., 2010 - PIVENS ?
Saposnik et al., 2009 - HOPE 2 +
Sato et al., 1997 ?
Sato et al., 1999 +
Sato et al., 2005 +
Schleitoff et al., 2006 +
Schnyder et al., 2002 - The Swiss Heart Study ?
Sesso et al., 2008 - PHS II +
Sesso et al., 2012 - PHS II +
Shoulson et al., 1998 - DATATOP ?
Smith et al., 2007 ?
Steiner et al., 1995 ?
Stephens et al., 1996 - CHAOS +
Stranges et al., 2006 - NPC ?
Taylor et al., 2004 - ARBITER 2 +
Tornwall et al., 2004 - ATBC ?
Trivedi et al., 2003 ?
Van Dijk et al., 2015 - B-PROOF +
Van Wijngaarden et al., 2014 - B-PROOF +
Vianna et al., 2007 ?
Virtamo et al., 1998 - ATBC ?
Virtamo et al., 2003 - ATBC ?
VITATOPS Trial Study Group 2010 +
Wang et al., 2014 - OPERA +
Wang et al., 2014 - PHS II +
Wang et al., 2015 +
Waters et al., 2002 - WAVE +
Witham et al., 2013 +
Witham et al., 2013 - VitDISH +
Wluka et al., 2002 +
Wu et al., 2009 - NHS/HPFS +
You et al., 2001 - SIT ?
Zhu et al., 2008 - CAIFOS +
Zoungas et al., 2006 - ASFAST ?
Allo
catio
n co
ncea
lmen
t (se
lect
ion
bias
)
+
?
?
+
+
+
+
?
?
?
?
?
+
?
+
?
+
+
+
?
?
?
?
+
?
?
?
?
+
+
+
+
+
+
?
?
?
+
?
+
?
+
?
?
?
?
+
+
+
+
+
+
+
+
+
+
?
?
?
+
+
+
?
?
+
?
+
+
–
+
?
+
+
?
?
?
?
?
?
+
+
+
+
+
+
?
+
+
?
?
?
?
+
?
–
–
–
?
?
?
+
?
+
?
?
?
+
+
+
+
+
+
+
+
?
+
+
?
?
?
?
?
+
?
+
?
?
+
+
?
+
?
+
+
+
+
?
+
+
+
+
+
?
+
+
?
+
+
?
?
+
?
?
?
?
?
+
?
?
+
+
?
?
+
+
?
?
?
+
?
?
+
+
?
+
?
+
+
+
?
Blin
ding
of p
artic
ipan
ts a
nd p
erso
nnel
(per
form
ance
bia
s)
+
+
+
+
+
+
+
+
+
+
?
+
+
+
+
+
+
+
+
+
+
+
+
+
+
?
+
+
+
+
+
+
+
+
+
+
+
+
+
+
+
+
+
+
+
+
+
+
+
+
+
+
+
+
+
+
+
+
+
+
+
+
+
+
+
+
+
+
–
+
+
+
+
+
+
+
+
+
?
+
+
+
+
+
+
+
+
+
+
+
+
+
+
+
+
+
?
+
+
+
+
+
+
+
+
+
+
+
+
+
+
+
+
+
+
+
+
?
+
+
+
+
+
+
+
+
+
+
+
+
+
+
+
+
+
+
+
+
+
+
?
+
?
+
+
+
+
+
+
+
+
+
+
+
+
+
+
+
+
+
+
+
+
+
+
+
+
+
+
+
+
+
+
+
+
+
+
+
+
+
Inco
mpl
ete
outc
ome
data
(attr
ition
bia
s)
+
+
+
+
+
+
+
+
+
?
?
+
+
?
?
?
+
+
?
?
?
+
+
?
+
+
?
+
+
+
+
+
?
+
+
+
–
+
+
+
+
+
+
+
+
?
+
?
+
+
+
?
+
+
+
+
+
?
+
+
+
+
+
?
+
?
?
+
+
+
+
?
?
+
+
+
+
+
?
+
?
+
?
?
?
–
+
?
+
?
?
+
?
+
+
+
?
+
+
+
+
?
?
+
+
?
+
+
+
+
+
+
+
+
+
?
+
+
+
?
+
+
?
?
+
+
+
+
+
+
+
?
+
+
+
+
+
+
+
+
+
?
+
+
?
+
?
+
?
+
?
+
+
+
+
?
+
?
+
+
+
?
+
+
+
+
?
?
+
+
?
?
?
+
+
?
?
+
+
+
Sel
ectiv
e re
porti
ng (r
epor
ting
bias
)
+
+
+
+
+
+
+
+
+
?
?
+
+
+
+
+
+
+
+
+
+
+
+
+
+
+
+
+
+
+
+
+
+
+
+
+
+
+
+
+
+
+
+
+
+
+
+
+
+
+
+
+
+
+
+
+
+
+
+
+
+
+
+
+
+
+
+
+
+
+
+
+
+
+
+
+
+
+
+
+
+
+
+
+
+
+
+
+
+
?
+
+
+
+
+
+
?
+
+
+
+
+
+
+
+
+
+
+
+
+
+
+
+
+
+
+
+
+
+
+
+
+
+
+
+
+
+
+
+
+
+
+
+
+
+
+
+
+
+
+
+
+
+
+
+
+
+
+
?
?
+
+
+
+
+
+
+
+
+
+
+
?
+
+
+
+
+
+
+
+
+
+
+
+
+
+
+
+
+
+
Ran
dom
seq
uenc
e ge
nera
tion
(sel
ectio
n bi
as)
Albert et al., 2008 - WAFACS ?
Aloia et al., 1988 ?
Aloia et al., 2005 +
Alvarez et al., 2012 ?
Anker et al., 2009 - FAIR-HF +
AREDS Research Group 2001 +
Armitage et al., 2010 - SEARCH +
Avenell et al., 2005 - MAVIS +
Baeksgaard et al., 1998 ?
Bairati et al., 2006 +
Baker et al., 2002 ?
Baron et al., 1999 - CPPS +
Bjorkman et al., 2008 ?
Boaz et al., 2000 - SPACE +
Boden et al., 2011 - AIM HIGH ?
Bogden et al., 1994 +
Bolland et al., 2008 +
Bolton-Smith et al., 2007 +
Bonaa et al., 2006 - NORVIT ?
Brazier et al., 2005 ?
Brohult et al., 1973 ?
Brown et al., 2001 - HATS ?
CDPRG 1975 ?
Chailurkit et al., 2010 ?
Chandra et al., 1992 +
Chapuy et al., 1992 ?
Chapuy et al., 2002 - Decalyos II ?
Cherniack et al., 2011 ?
Chylack et al.., 2002 - REACT +
CLIPS Group 2007 ?
Coburn et al., 2004 ?
Cole et al., 2007 - AFPPS +
Collins et al., 2003 +
Cook et al., 2007 - WACS +
Cooper et al., 2003 ?
Corless et al., 1985 +
Correa et al., 2000 +
Coyne et al., 2006 +
CTNS Study Group 2008 ?
Daly et al., 2008 +
Dawson-Hughes et al., 1997 ?
de Gaetano et al., 2001 - PPP +
de la Maza et al., 1995 +
Delanaye et al., 2013 ?
Desnuelle et al., 2001 - ALSRT ?
de Waart et al., 2001 ?
de Zeeuw et al., 2010 - VITAL +
Dukas et al., 2004 ?
Durga et al., 2007 - FACIT ?
Ebbing et al., 2008 - WENBIT +
Flicker et al., 2005 +
Frazao et al., 2000 ?
Galan et al., 2010 - SU.FOL.OM3 +
Gallagher et al., 1990 +
Gallagher et al., 2001 - STOP IT –
Gallagher et al., 2012 - VIDOS +
Gillilan et al., 1997 ?
Girodon et al., 1997 ?
Girodon et al., 1999 - MIN.VIT.AOX ?
GISSI-Prevenzione Investigators 1999 +
Glendenning et al., 2012 +
Graat et al., 2002 +
Grady et al., 1991 ?
Graf et al., 2005 ?
Grant et al., 2005 - RECORD +
Greenberg et al., 1996 - SCPS +
Green et al., 1999 - NSCPT +
Grimnes et al. 2011 ?
Gupta et al., 2016 +
Guyton et al., 2008 ?
Hamdy et al., 1995 ?
Harwood et al., 2004 - NoNOF +
Heinz et al., 2010 ?
Hennekens et al., 1996 - PHS +
Hercberg et al., 2010 - SU.VI.MAX ?
Hewitt et al., 2013 +
Hodis et al., 2002 - VEAPS +
Hodis et al., 2009 - BVAIT +
Hoffman et al., 1999 ?
House et al., 2010- DIVINe +
HPS2-THRIVE Collaborative Group 2014 +
HPS Collaborative Group 2002 +
Huo et al., 2015 - CSPPT +
Imasa et al., 2009 ?
Inkovaara et al., 1983 –
Jacobson et al., 2000 ?
Jamison et al., 2007 - HOST +
Janssen et al.,2010 ?
Komulainen et al., 1999 - OSTPRE ?
Korpela et al., 1989 ?
Krieg et al., 1999 ?
Lacroix et al., 2009 - WHI +
Lamas et al., 2013 - TACT +
Lange et al., 2004 ?
Lappe et al., 2007 +
Lappe et al., 2017 +
Larsen et al., 2004 +
Law et al., 2006 +
Lee et al., 1999 - WHS +
Lee et al., 2005 - WHS +
Lehouck et al., 2012 +
Leppälä et al., 2000 - ATBC ?
Lewis et al., 2011 - CAIFOS +
Liem et al., 2003 +
Liem et al., 2004 ?
Li et al., 1993 - NIT 2 ?
Limburg et al., 2005 +
Lippman et al., 2009 - SELECT ?
Lips et al., 1996 +
Liu et al., 2007 +
Logan et al., 2008 - UKCAP +
Lonn et al., 2005 - HOPE & HOPE TOO ?
Lonn et al., 2006 - HOPE TOO ?
Lyons et al., 2007 +
Ma et al., 2012 - SIT ?
Magliano et al., 2006 - MAVET ?
Manning et al., 2013 +
Manuel-Y-Kennoy et al., 2004 - DATOR ?
Marshall et al., 2011 ?
McKeown-Eyssen et al., 1988 ?
McNeil et al., 2004 - VECAT ?
Meier et al., 2004 ?
Meydani et al., 2004 +
Meyer et al., 2002 –
Milman et al., 2008 - ICARE +
Moon et al., 1997 - SKICAP AK ?
Mooney et al., 2005 +
Omenn et al., 1996 - CARET ?
Ooms et al., 1995 ?
Ott et al., 1989 ?
Petersen et al., 2005 - ADCS 2 +
Pike et al., 1995 +
Plummer et al., 2007 +
Ponikowski et al. 2015 - CONFIRM-HF +
Porthouse et al., 2005 +
Potena et al., 2005 +
Prentice et al., 2013 - WHI CaD +
Prince et al., 2008 +
Punthakee et al., 2012 - TIDE +
Reid et al., 2008 +
Righetti et al., 2003 ?
Salonen et al., 2000 - ASAP ?
Salovaara et al., 2010 - OSTRE-FPS +
Sanders et al., 2010 - Vital D +
Sang et al., 2009 ?
Sano et al., 1997 - ADCS 1 ?
Sanyal et al., 2010 - PIVENS ?
Saposnik et al., 2009 - HOPE 2 +
Sato et al., 1997 ?
Sato et al., 1999 +
Sato et al., 2005 +
Schleitoff et al., 2006 +
Schnyder et al., 2002 - The Swiss Heart Study ?
Sesso et al., 2008 - PHS II +
Sesso et al., 2012 - PHS II +
Shoulson et al., 1998 - DATATOP ?
Smith et al., 2007 ?
Steiner et al., 1995 ?
Stephens et al., 1996 - CHAOS +
Stranges et al., 2006 - NPC ?
Taylor et al., 2004 - ARBITER 2 +
Tornwall et al., 2004 - ATBC ?
Trivedi et al., 2003 ?
Van Dijk et al., 2015 - B-PROOF +
Van Wijngaarden et al., 2014 - B-PROOF +
Vianna et al., 2007 ?
Virtamo et al., 1998 - ATBC ?
Virtamo et al., 2003 - ATBC ?
VITATOPS Trial Study Group 2010 +
Wang et al., 2014 - OPERA +
Wang et al., 2014 - PHS II +
Wang et al., 2015 +
Waters et al., 2002 - WAVE +
Witham et al., 2013 +
Witham et al., 2013 - VitDISH +
Wluka et al., 2002 +
Wu et al., 2009 - NHS/HPFS +
You et al., 2001 - SIT ?
Zhu et al., 2008 - CAIFOS +
Zoungas et al., 2006 - ASFAST ?
Allo
catio
n co
ncea
lmen
t (se
lect
ion
bias
)
+
?
?
+
+
+
+
?
?
?
?
?
+
?
+
?
+
+
+
?
?
?
?
+
?
?
?
?
+
+
+
+
+
+
?
?
?
+
?
+
?
+
?
?
?
?
+
+
+
+
+
+
+
+
+
+
?
?
?
+
+
+
?
?
+
?
+
+
–
+
?
+
+
?
?
?
?
?
?
+
+
+
+
+
+
?
+
+
?
?
?
?
+
?
–
–
–
?
?
?
+
?
+
?
?
?
+
+
+
+
+
+
+
+
?
+
+
?
?
?
?
?
+
?
+
?
?
+
+
?
+
?
+
+
+
+
?
+
+
+
+
+
?
+
+
?
+
+
?
?
+
?
?
?
?
?
+
?
?
+
+
?
?
+
+
?
?
?
+
?
?
+
+
?
+
?
+
+
+
?
Blin
ding
of p
artic
ipan
ts a
nd p
erso
nnel
(per
form
ance
bia
s)
+
+
+
+
+
+
+
+
+
+
?
+
+
+
+
+
+
+
+
+
+
+
+
+
+
?
+
+
+
+
+
+
+
+
+
+
+
+
+
+
+
+
+
+
+
+
+
+
+
+
+
+
+
+
+
+
+
+
+
+
+
+
+
+
+
+
+
+
–
+
+
+
+
+
+
+
+
+
?
+
+
+
+
+
+
+
+
+
+
+
+
+
+
+
+
+
?
+
+
+
+
+
+
+
+
+
+
+
+
+
+
+
+
+
+
+
+
?
+
+
+
+
+
+
+
+
+
+
+
+
+
+
+
+
+
+
+
+
+
+
?
+
?
+
+
+
+
+
+
+
+
+
+
+
+
+
+
+
+
+
+
+
+
+
+
+
+
+
+
+
+
+
+
+
+
+
+
+
+
+
Inco
mpl
ete
outc
ome
data
(attr
ition
bia
s)
+
+
+
+
+
+
+
+
+
?
?
+
+
?
?
?
+
+
?
?
?
+
+
?
+
+
?
+
+
+
+
+
?
+
+
+
–
+
+
+
+
+
+
+
+
?
+
?
+
+
+
?
+
+
+
+
+
?
+
+
+
+
+
?
+
?
?
+
+
+
+
?
?
+
+
+
+
+
?
+
?
+
?
?
?
–
+
?
+
?
?
+
?
+
+
+
?
+
+
+
+
?
?
+
+
?
+
+
+
+
+
+
+
+
+
?
+
+
+
?
+
+
?
?
+
+
+
+
+
+
+
?
+
+
+
+
+
+
+
+
+
?
+
+
?
+
?
+
?
+
?
+
+
+
+
?
+
?
+
+
+
?
+
+
+
+
?
?
+
+
?
?
?
+
+
?
?
+
+
+
Sel
ectiv
e re
porti
ng (r
epor
ting
bias
)
+
+
+
+
+
+
+
+
+
?
?
+
+
+
+
+
+
+
+
+
+
+
+
+
+
+
+
+
+
+
+
+
+
+
+
+
+
+
+
+
+
+
+
+
+
+
+
+
+
+
+
+
+
+
+
+
+
+
+
+
+
+
+
+
+
+
+
+
+
+
+
+
+
+
+
+
+
+
+
+
+
+
+
+
+
+
+
+
+
?
+
+
+
+
+
+
?
+
+
+
+
+
+
+
+
+
+
+
+
+
+
+
+
+
+
+
+
+
+
+
+
+
+
+
+
+
+
+
+
+
+
+
+
+
+
+
+
+
+
+
+
+
+
+
+
+
+
+
?
?
+
+
+
+
+
+
+
+
+
+
+
?
+
+
+
+
+
+
+
+
+
+
+
+
+
+
+
+
+
+

Supplementary Figure 2 (Continued). Risk of bias summary for supplements and CVD and total mortality. Review authors' judgments about each risk of bias item for each included study
77
Ran
dom
seq
uenc
e ge
nera
tion
(sel
ectio
n bi
as)
Albert et al., 2008 - WAFACS ?
Aloia et al., 1988 ?
Aloia et al., 2005 +
Alvarez et al., 2012 ?
Anker et al., 2009 - FAIR-HF +
AREDS Research Group 2001 +
Armitage et al., 2010 - SEARCH +
Avenell et al., 2005 - MAVIS +
Baeksgaard et al., 1998 ?
Bairati et al., 2006 +
Baker et al., 2002 ?
Baron et al., 1999 - CPPS +
Bjorkman et al., 2008 ?
Boaz et al., 2000 - SPACE +
Boden et al., 2011 - AIM HIGH ?
Bogden et al., 1994 +
Bolland et al., 2008 +
Bolton-Smith et al., 2007 +
Bonaa et al., 2006 - NORVIT ?
Brazier et al., 2005 ?
Brohult et al., 1973 ?
Brown et al., 2001 - HATS ?
CDPRG 1975 ?
Chailurkit et al., 2010 ?
Chandra et al., 1992 +
Chapuy et al., 1992 ?
Chapuy et al., 2002 - Decalyos II ?
Cherniack et al., 2011 ?
Chylack et al.., 2002 - REACT +
CLIPS Group 2007 ?
Coburn et al., 2004 ?
Cole et al., 2007 - AFPPS +
Collins et al., 2003 +
Cook et al., 2007 - WACS +
Cooper et al., 2003 ?
Corless et al., 1985 +
Correa et al., 2000 +
Coyne et al., 2006 +
CTNS Study Group 2008 ?
Daly et al., 2008 +
Dawson-Hughes et al., 1997 ?
de Gaetano et al., 2001 - PPP +
de la Maza et al., 1995 +
Delanaye et al., 2013 ?
Desnuelle et al., 2001 - ALSRT ?
de Waart et al., 2001 ?
de Zeeuw et al., 2010 - VITAL +
Dukas et al., 2004 ?
Durga et al., 2007 - FACIT ?
Ebbing et al., 2008 - WENBIT +
Flicker et al., 2005 +
Frazao et al., 2000 ?
Galan et al., 2010 - SU.FOL.OM3 +
Gallagher et al., 1990 +
Gallagher et al., 2001 - STOP IT –
Gallagher et al., 2012 - VIDOS +
Gillilan et al., 1997 ?
Girodon et al., 1997 ?
Girodon et al., 1999 - MIN.VIT.AOX ?
GISSI-Prevenzione Investigators 1999 +
Glendenning et al., 2012 +
Graat et al., 2002 +
Grady et al., 1991 ?
Graf et al., 2005 ?
Grant et al., 2005 - RECORD +
Greenberg et al., 1996 - SCPS +
Green et al., 1999 - NSCPT +
Grimnes et al. 2011 ?
Gupta et al., 2016 +
Guyton et al., 2008 ?
Hamdy et al., 1995 ?
Harwood et al., 2004 - NoNOF +
Heinz et al., 2010 ?
Hennekens et al., 1996 - PHS +
Hercberg et al., 2010 - SU.VI.MAX ?
Hewitt et al., 2013 +
Hodis et al., 2002 - VEAPS +
Hodis et al., 2009 - BVAIT +
Hoffman et al., 1999 ?
House et al., 2010- DIVINe +
HPS2-THRIVE Collaborative Group 2014 +
HPS Collaborative Group 2002 +
Huo et al., 2015 - CSPPT +
Imasa et al., 2009 ?
Inkovaara et al., 1983 –
Jacobson et al., 2000 ?
Jamison et al., 2007 - HOST +
Janssen et al.,2010 ?
Komulainen et al., 1999 - OSTPRE ?
Korpela et al., 1989 ?
Krieg et al., 1999 ?
Lacroix et al., 2009 - WHI +
Lamas et al., 2013 - TACT +
Lange et al., 2004 ?
Lappe et al., 2007 +
Lappe et al., 2017 +
Larsen et al., 2004 +
Law et al., 2006 +
Lee et al., 1999 - WHS +
Lee et al., 2005 - WHS +
Lehouck et al., 2012 +
Leppälä et al., 2000 - ATBC ?
Lewis et al., 2011 - CAIFOS +
Liem et al., 2003 +
Liem et al., 2004 ?
Li et al., 1993 - NIT 2 ?
Limburg et al., 2005 +
Lippman et al., 2009 - SELECT ?
Lips et al., 1996 +
Liu et al., 2007 +
Logan et al., 2008 - UKCAP +
Lonn et al., 2005 - HOPE & HOPE TOO ?
Lonn et al., 2006 - HOPE TOO ?
Lyons et al., 2007 +
Ma et al., 2012 - SIT ?
Magliano et al., 2006 - MAVET ?
Manning et al., 2013 +
Manuel-Y-Kennoy et al., 2004 - DATOR ?
Marshall et al., 2011 ?
McKeown-Eyssen et al., 1988 ?
McNeil et al., 2004 - VECAT ?
Meier et al., 2004 ?
Meydani et al., 2004 +
Meyer et al., 2002 –
Milman et al., 2008 - ICARE +
Moon et al., 1997 - SKICAP AK ?
Mooney et al., 2005 +
Omenn et al., 1996 - CARET ?
Ooms et al., 1995 ?
Ott et al., 1989 ?
Petersen et al., 2005 - ADCS 2 +
Pike et al., 1995 +
Plummer et al., 2007 +
Ponikowski et al. 2015 - CONFIRM-HF +
Porthouse et al., 2005 +
Potena et al., 2005 +
Prentice et al., 2013 - WHI CaD +
Prince et al., 2008 +
Punthakee et al., 2012 - TIDE +
Reid et al., 2008 +
Righetti et al., 2003 ?
Salonen et al., 2000 - ASAP ?
Salovaara et al., 2010 - OSTRE-FPS +
Sanders et al., 2010 - Vital D +
Sang et al., 2009 ?
Sano et al., 1997 - ADCS 1 ?
Sanyal et al., 2010 - PIVENS ?
Saposnik et al., 2009 - HOPE 2 +
Sato et al., 1997 ?
Sato et al., 1999 +
Sato et al., 2005 +
Schleitoff et al., 2006 +
Schnyder et al., 2002 - The Swiss Heart Study ?
Sesso et al., 2008 - PHS II +
Sesso et al., 2012 - PHS II +
Shoulson et al., 1998 - DATATOP ?
Smith et al., 2007 ?
Steiner et al., 1995 ?
Stephens et al., 1996 - CHAOS +
Stranges et al., 2006 - NPC ?
Taylor et al., 2004 - ARBITER 2 +
Tornwall et al., 2004 - ATBC ?
Trivedi et al., 2003 ?
Van Dijk et al., 2015 - B-PROOF +
Van Wijngaarden et al., 2014 - B-PROOF +
Vianna et al., 2007 ?
Virtamo et al., 1998 - ATBC ?
Virtamo et al., 2003 - ATBC ?
VITATOPS Trial Study Group 2010 +
Wang et al., 2014 - OPERA +
Wang et al., 2014 - PHS II +
Wang et al., 2015 +
Waters et al., 2002 - WAVE +
Witham et al., 2013 +
Witham et al., 2013 - VitDISH +
Wluka et al., 2002 +
Wu et al., 2009 - NHS/HPFS +
You et al., 2001 - SIT ?
Zhu et al., 2008 - CAIFOS +
Zoungas et al., 2006 - ASFAST ?
Allo
catio
n co
ncea
lmen
t (se
lect
ion
bias
)
+
?
?
+
+
+
+
?
?
?
?
?
+
?
+
?
+
+
+
?
?
?
?
+
?
?
?
?
+
+
+
+
+
+
?
?
?
+
?
+
?
+
?
?
?
?
+
+
+
+
+
+
+
+
+
+
?
?
?
+
+
+
?
?
+
?
+
+
–
+
?
+
+
?
?
?
?
?
?
+
+
+
+
+
+
?
+
+
?
?
?
?
+
?
–
–
–
?
?
?
+
?
+
?
?
?
+
+
+
+
+
+
+
+
?
+
+
?
?
?
?
?
+
?
+
?
?
+
+
?
+
?
+
+
+
+
?
+
+
+
+
+
?
+
+
?
+
+
?
?
+
?
?
?
?
?
+
?
?
+
+
?
?
+
+
?
?
?
+
?
?
+
+
?
+
?
+
+
+
?
Blin
ding
of p
artic
ipan
ts a
nd p
erso
nnel
(per
form
ance
bia
s)
+
+
+
+
+
+
+
+
+
+
?
+
+
+
+
+
+
+
+
+
+
+
+
+
+
?
+
+
+
+
+
+
+
+
+
+
+
+
+
+
+
+
+
+
+
+
+
+
+
+
+
+
+
+
+
+
+
+
+
+
+
+
+
+
+
+
+
+
–
+
+
+
+
+
+
+
+
+
?
+
+
+
+
+
+
+
+
+
+
+
+
+
+
+
+
+
?
+
+
+
+
+
+
+
+
+
+
+
+
+
+
+
+
+
+
+
+
?
+
+
+
+
+
+
+
+
+
+
+
+
+
+
+
+
+
+
+
+
+
+
?
+
?
+
+
+
+
+
+
+
+
+
+
+
+
+
+
+
+
+
+
+
+
+
+
+
+
+
+
+
+
+
+
+
+
+
+
+
+
+
Inco
mpl
ete
outc
ome
data
(attr
ition
bia
s)
+
+
+
+
+
+
+
+
+
?
?
+
+
?
?
?
+
+
?
?
?
+
+
?
+
+
?
+
+
+
+
+
?
+
+
+
–
+
+
+
+
+
+
+
+
?
+
?
+
+
+
?
+
+
+
+
+
?
+
+
+
+
+
?
+
?
?
+
+
+
+
?
?
+
+
+
+
+
?
+
?
+
?
?
?
–
+
?
+
?
?
+
?
+
+
+
?
+
+
+
+
?
?
+
+
?
+
+
+
+
+
+
+
+
+
?
+
+
+
?
+
+
?
?
+
+
+
+
+
+
+
?
+
+
+
+
+
+
+
+
+
?
+
+
?
+
?
+
?
+
?
+
+
+
+
?
+
?
+
+
+
?
+
+
+
+
?
?
+
+
?
?
?
+
+
?
?
+
+
+
Sel
ectiv
e re
porti
ng (r
epor
ting
bias
)
+
+
+
+
+
+
+
+
+
?
?
+
+
+
+
+
+
+
+
+
+
+
+
+
+
+
+
+
+
+
+
+
+
+
+
+
+
+
+
+
+
+
+
+
+
+
+
+
+
+
+
+
+
+
+
+
+
+
+
+
+
+
+
+
+
+
+
+
+
+
+
+
+
+
+
+
+
+
+
+
+
+
+
+
+
+
+
+
+
?
+
+
+
+
+
+
?
+
+
+
+
+
+
+
+
+
+
+
+
+
+
+
+
+
+
+
+
+
+
+
+
+
+
+
+
+
+
+
+
+
+
+
+
+
+
+
+
+
+
+
+
+
+
+
+
+
+
+
?
?
+
+
+
+
+
+
+
+
+
+
+
?
+
+
+
+
+
+
+
+
+
+
+
+
+
+
+
+
+
+

Random Effects
Comparison RCTs N Events RR (95% CIs) RR (95% CIs) I2 p -value
CVD
Total CVD 6 6,546 1,037 0.95 [0.86, 1.05] 0% 0.31Total CHD 3 434 6 0.97 [0.22, 4.22] 0% 0.97MI 12 11,081 643 0.95 [0.83, 1.10] 0% 0.52Stroke 11 11,173 479 1.12 [0.94, 1.34] 0% 0.20Total CVD mortality 2 3,907 219 0.86 [0.66, 1.10] 0% 0.23Total CHD mortality 2 225 4 0.41 [0.06, 2.72] 0% 0.35MI mortality 4 2,873 94 0.85 [0.57, 1.26] 0% 0.41Stroke mortality 2 2,773 60 1.13 [0.68, 1.87] 0% 0.63
ALL-CAUSE MORTALITY All-cause mortality 43 37,550 5,876 0.99 [0.95, 1.03] 0% 0.58
Favours vitamin D/ Favours control/ Negative association Positive association
Pooled Effect Estimates
0.0 0.5 1.0 1.5 2.0
Supplementary Figure 3. Summary of the pooled effect estimates of RCTs assessing the relationship between vitamin D supplementation and CVD and all-cause mortality risk. RR, risk ratio; CIs, confidence intervals; RTCs, randomized clinical trials; CVD, cardiovascular disease; CHD, coronary heart disease; MI, myocardial infarction; N/A, not applicable. The diamonds represents the pooled risk estimate. Inter-study heterogeneity was tested using the Cochran Q statistic (Chi2) at a significance level of P < 0.10, and quantified by the I2 statistic. An I2 value ≥ 50% is considered to indicate substantial heterogeneity. All results are presented as risk ratios with 95% CIs, using the Manthel-Haenszel method with random effects model.
Subgroup and Study, Year Events Total Events TotalRCTsGallagher et al., 2001 - STOP IT 4 123 3 123 0.4% 1.33 [0.30, 5.83]Trivedi et al., 2003 477 1,345 503 1,341 96.6% 0.95 [0.86, 1.04]Sanders et al., 2010 - Vital D 17 1,131 13 1,127 1.9% 1.30 [0.64, 2.67]Punthakee et al., 2012 - TIDE 2 607 3 614 0.3% 0.67 [0.11, 4.02]Witham et al., 2013 5 39 4 36 0.6% 1.15 [0.34, 3.96]Wang et al., 2014 - OPERA 0 30 6 30 0.1% 0.08 [0.00, 1.31]
Total (95% CI) 3,275 3,271 100% 0.95 [0.86, 1.05]Total events 505 532Heterogeneity: Tau² = 0.00; Chi² = 4.23, df = 5 (P = 0.52); I² = 0%Test for overall effect: Z = 1.02 (P = 0.31) 0.5 0.7 1 1.5 2.0
Favours vitamin D Favours control
Vitamin D ControlWeight
Risk RatioM-H, Random, 95% CI
Risk RatioM-H, Random, 95% CI in total CVD risk
Study or SubgroupGallagher et al., 2001 - STOP ITTrivedi et al., 2003Sanders et al., 2010 - Vital DPunthakee et al., 2012 - TIDEWitham et al., 2013Wang et al., 2014 - OPERA
Total (95% CI)Total eventsHeterogeneity: Tau² = 0.00; Chi² = 4.23, df = 5 (P = 0.52); I² = 0%Test for overall effect: Z = 1.02 (P = 0.31)
Events4
47717
250
505
Total123
13451131
6073930
3275
Events3
50313
346
532
Total123
13411127
6143630
3271
Weight0.4%
96.6%1.9%0.3%0.6%0.1%
100.0%
M-H, Random, 95% CI1.33 [0.30, 5.83]0.95 [0.86, 1.04]1.30 [0.64, 2.67]0.67 [0.11, 4.02]1.15 [0.34, 3.96]0.08 [0.00, 1.31]
0.95 [0.86, 1.05]
Year200120032010201220132014
Vitamin D Control Risk Ratio Risk RatioM-H, Random, 95% CI
0.5 0.7 1 1.5 2Favours vitamin D Favours control
Supplementary Figure 4. Forest plot of vitamin D supplementation and total CVD risk. M-H, Manthel-Haenszel, CVD, cardiovascular disease. The diamond represents the pooled risk estimate. Inter-study heterogeneity was tested using the Cochran Q statistic (Chi2) at a significance level of P < 0.10, and quantified by the I2 statistic. An I2 value ≥ 50% is considered to indicate substantial heterogeneity. All results are presented as risk ratios with 95% Confidence Intervals, using the Manthel-Haenszel method with random effects model.
78

Subgroup and Study, Year Events Total Events TotalRCTsInkovaara et al., 1983 0 45 1 42 21.4% 0.31 [0.01, 7.44]de Zeeuw et al., 2010 - VITAL 1 95 0 93 21.2% 2.94 [0.12, 71.20]Witham et al., 2013 - VitDISH 2 80 2 79 57.5% 0.99 [0.14, 6.84]
Total (95% CI) 220 214 100% 0.97 [0.22, 4.22]Total events 3 3Heterogeneity: Tau² = 0.00; Chi² = 0.96, df = 2 (P = 0.62); I² = 0%Test for overall effect: Z = 0.04 (P = 0.97) 0.001 0.1 1 10 1000
Favours vitamin D Favours control
Vitamin D ControlWeight
Risk RatioM-H, Random, 95% CI
Risk RatioM-H, Random, 95% CI in total CHD risk
Study or SubgroupInkovaara et al., 1983de Zeeuw et al., 2010 - VITALWitham et al., 2013 - VitDISH
Total (95% CI)Total eventsHeterogeneity: Tau² = 0.00; Chi² = 0.96, df = 2 (P = 0.62); I² = 0%Test for overall effect: Z = 0.04 (P = 0.97)
Events012
3
Total459580
220
Events102
3
Total429379
214
Weight21.4%21.2%57.5%
100.0%
M-H, Random, 95% CI0.31 [0.01, 7.44]
2.94 [0.12, 71.20]0.99 [0.14, 6.84]
0.97 [0.22, 4.22]
Year198320102013
Vitamin D Control Risk Ratio Risk RatioM-H, Random, 95% CI
0.001 0.1 1 10 1000Favours Vitamin D Favours Control
Supplementary Figure 5. Forest plot of vitamin D supplementation and total CHD risk. M-H, Manthel-Haenszel, CHD, coronary heart disease. The diamond represents the pooled risk estimate. Inter-study heterogeneity was tested using the Cochran Q statistic (Chi2) at a significance level of P < 0.10, and quantified by the I2 statistic. An I2 value ≥ 50% is considered to indicate substantial heterogeneity. All results are presented as risk ratios with 95% Confidence Intervals, using the Manthel-Haenszel method with random effects model.
Subgroup and Study, Year Events Total Events TotalRCTsAloia et al., 1988 1 12 1 15 0.3% 1.25 [0.09, 17.98]Ott et al., 1989 1 43 0 43 0.2% 3.00 [0.13, 71.65]Komulainen et al., 1999 - OSTPRE 1 112 0 115 0.2% 3.08 [0.13, 74.81]Trivedi et al., 2003 224 1,345 233 1,341 74.2% 0.96 [0.81, 1.13]Coburn et al., 2004 0 27 2 28 0.2% 0.21 [0.01, 4.13]Grant et al., 2005 - RECORD* 78 2649 84 2643 22.5% 0.93 [0.68, 1.25]Lappe et al., 2007† 3 445 2 446 0.7% 1.50 [0.25, 8.95]Prince et al., 2008‡ 2 151 3 151 0.7% 0.67 [0.11, 3.93]de Zeeuw et al., 2010 - VITAL 2 95 0 93 0.2% 4.90 [0.24, 100.62]Cherniack et al., 2011 1 23 1 23 0.3% 1.00 [0.07, 15.04]Punthakee et al., 2012 - TIDE 1 607 1 614 0.3% 1.01 [0.06, 16.14]Wang et al., 2014 - OPERA 0 30 2 30 0.2% 0.20 [0.01, 4.00]
Total (95% CI) 5,539 5,542 100% 0.95 [0.83, 1.10]Total events 314 329Heterogeneity: Tau² = 0.00; Chi² = 4.68, df = 11 (P = 0.95); I² = 0%Test for overall effect: Z = 0.64 (P = 0.52) 0.1 0.2 0.5 1 2 5 10
Favours vitamin D Favours control
Vitamin D ControlWeight
Risk RatioM-H, Random, 95% CI
Risk RatioM-H, Random, 95% CI in MI risk
Study or SubgroupAloia et al., 1988Ott et al., 1989Komulainen et al., 1999 - OSTPRETrivedi et al., 2003Coburn et al., 2004Grant et al., 2005 - RECORDLappe et al., 2007Prince et al., 2008de Zeeuw et al., 2010 - VITALCherniack et al., 2011Punthakee et al., 2012 - TIDEWang et al., 2014 - OPERA
Total (95% CI)Total eventsHeterogeneity: Tau² = 0.00; Chi² = 4.68, df = 11 (P = 0.95); I² = 0%Test for overall effect: Z = 0.64 (P = 0.52)
Events111
2240
78322110
314
Total1243
1121345
272649
445151
9523
60730
5539
Events100
2332
84230112
329
Total1543
1151341
282643
446151
9323
61430
5542
Weight0.3%0.2%0.2%
74.2%0.2%
22.5%0.7%0.7%0.2%0.3%0.3%0.2%
100.0%
M-H, Random, 95% CI1.25 [0.09, 17.98]3.00 [0.13, 71.65]3.08 [0.13, 74.81]
0.96 [0.81, 1.13]0.21 [0.01, 4.13]0.93 [0.68, 1.25]1.50 [0.25, 8.95]0.67 [0.11, 3.93]
4.90 [0.24, 100.62]1.00 [0.07, 15.04]1.01 [0.06, 16.14]
0.20 [0.01, 4.00]
0.95 [0.83, 1.10]
Year198819891999200320042005200720082010201120122014
Vitamin D Control Risk Ratio Risk RatioM-H, Random, 95% CI
0.1 0.2 0.5 1 2 5 10Favours vitamin D Favours control
Supplementary Figure 6. Forest plot of vitamin D supplementation and MI risk. M-H, Manthel-Haenszel, MI, myocardial infarction. *Lappe et al., 2007 - data taken from meta-analysis; Bolland et al., 2014; †Prince et al., 2008 - reported number of participants with at least one event. The diamond represents the pooled risk estimate. Inter-study heterogeneity was tested using the Cochran Q statistic (Chi2) at a significance level of P < 0.10, and quantified by the I2 statistic. An I2 value ≥ 50% is considered to indicate substantial heterogeneity. All results are presented as risk ratios with 95% Confidence Intervals, using the Manthel-Haenszel method with random effects model.
79

Subgroup and Study, Year Events Total Events TotalRCTsInkovaara et al., 1983 12 45 5 42 3.3% 2.24 [0.86, 5.82]Gallagher et al., 2001 - STOP IT 4 123 3 123 1.4% 1.33 [0.30, 5.83]Trivedi et al., 2003 105 1,345 101 1,341 44.2% 1.04 [0.80, 1.35]Grant et al., 2005 - RECORD* 118 2,649 104 2,643 45.7% 1.13 [0.87, 1.47]Lappe et al., 2007† 6 446 5 445 2.2% 1.20 [0.37, 3.89]Prince et al., 2008‡ 3 151 3 151 1.2% 1.00 [0.21, 4.88]de Zeeuw et al., 2010 - VITAL 1 95 0 93 0.3% 2.94 [0.12, 71.20]Gallagher et al., 2012 - VIDOS 1 20 0 21 0.3% 3.14 [0.14, 72.92]Punthakee et al., 2012 - TIDE 1 607 1 614 0.4% 1.01 [0.06, 16.14]Witham et al., 2013 - VitDISH 3 80 1 79 0.6% 2.96 [0.31, 27.88]Wang et al., 2014 - OPERA 0 30 2 30 0.3% 0.20 [0.01, 4.00]
Total (95% CI) 5,591 5,582 100% 1.12 [0.94, 1.34]Total events 254 225Heterogeneity: Tau² = 0.00; Chi² = 5.22, df = 10 (P = 0.88); I² = 0%Test for overall effect: Z = 1.30 (P = 0.20) 0.1 0.2 0.5 1 2 5 10
Favours vitamin D Favours control
Vitamin D ControlWeight
Risk RatioM-H, Random, 95% CI
Risk RatioM-H, Random, 95% CI in stroke risk
Study or SubgroupInkovaara et al., 1983Gallagher et al., 2001 - STOP ITTrivedi et al., 2003Grant et al., 2005 - RECORDLappe et al., 2007Prince et al., 2008de Zeeuw et al., 2010 - VITALGallagher et al., 2012 - VIDOSPunthakee et al., 2012 - TIDEWitham et al., 2013 - VitDISHWang et al., 2014 - OPERA
Total (95% CI)Total eventsHeterogeneity: Tau² = 0.00; Chi² = 5.22, df = 10 (P = 0.88); I² = 0%Test for overall effect: Z = 1.30 (P = 0.20)
Events12
4105118
6311130
254
Total45
12313452649
446151
9520
6078030
5591
Events53
101104
5300112
225
Total42
12313412643
445151
9321
6147930
5582
Weight3.3%1.4%
44.2%45.7%
2.2%1.2%0.3%0.3%0.4%0.6%0.3%
100.0%
M-H, Random, 95% CI2.24 [0.86, 5.82]1.33 [0.30, 5.83]1.04 [0.80, 1.35]1.13 [0.87, 1.47]1.20 [0.37, 3.89]1.00 [0.21, 4.88]
2.94 [0.12, 71.20]3.14 [0.14, 72.92]1.01 [0.06, 16.14]2.96 [0.31, 27.88]
0.20 [0.01, 4.00]
1.12 [0.94, 1.34]
Year19832001200320052007200820102012201220132014
Vitamin D Control Risk Ratio Risk RatioM-H, Random, 95% CI
0.1 0.2 0.5 1 2 5 10Favours vitamin D Favours control
Supplementary Figure 7. Forest plot of vitamin D supplementation and stroke risk. M-H, Manthel-Haenszel. *Grant et al., 2005 - data taken from meta-analysis Bolland et al., 2014 †Lappe et al., 2007 - data taken from meta-analysis Bolland et al., 2014 ‡Prince et al., 2008 - reported number of participants with at least one event. The diamond represents the pooled risk estimate. Inter-study heterogeneity was tested using the Cochran Q statistic (Chi2) at a significance level of P < 0.10, and quantified by the I2 statistic. An I2 value ≥ 50% is considered to indicate substantial heterogeneity. All results are presented as risk ratios with 95% Confidence Intervals, using the Manthel-Haenszel method with random effects model.
Subgroup and Study, Year Events Total Events TotalRCTsTrivedi et al., 2003 101 1,345 117 1,341 99.4% 0.86 [0.67, 1.11]Punthakee et al., 2012 - TIDE 0 607 1 614 0.6% 0.34 [0.01, 8.26]
Total (95% CI) 1,952 1,955 100% 0.86 [0.66, 1.10]Total events 101 118Heterogeneity: Tau² = 0.00; Chi² = 0.33, df = 1 (P = 0.57); I² = 0%Test for overall effect: Z = 1.20 (P = 0.23) 0.1 0.2 0.5 1 2 5 10
Favours vitamin D Favours control
Vitamin D ControlWeight
Risk RatioM-H, Random, 95% CI
Risk RatioM-H, Random, 95% CI in CVD mortality risk
Study or SubgroupTrivedi et al., 2003Punthakee et al., 2012 - TIDE
Total (95% CI)Total eventsHeterogeneity: Tau² = 0.00; Chi² = 0.33, df = 1 (P = 0.57); I² = 0%Test for overall effect: Z = 1.20 (P = 0.23)
Events101
0
101
Total1345
607
1952
Events117
1
118
Total1341
614
1955
Weight99.4%
0.6%
100.0%
M-H, Random, 95% CI0.86 [0.67, 1.11]0.34 [0.01, 8.26]
0.86 [0.66, 1.10]
Year20032012
Vitamin D Control Risk Ratio Risk RatioM-H, Random, 95% CI
0.1 0.2 0.5 1 2 5 10Favours Vitamin D Favours Control
Supplementary Figure 8. Forest plot of vitamin D supplementation and CVD mortality risk. M-H, Manthel-Haenszel, CVD, cardiovascular disease. The diamond represents the pooled risk estimate. Inter-study heterogeneity was tested using the Cochran Q statistic (Chi2) at a significance level of P < 0.10, and quantified by the I2 statistic. An I2 value ≥ 50% is considered to indicate substantial heterogeneity. All results are presented as risk ratios with 95% Confidence Intervals, using the Manthel-Haenszel method with random effects model.
80

Subgroup and Study, Year Events Total Events TotalRCTsInkovaara et al., 1983 0 45 1 42 35.9% 0.31 [0.01, 7.44]Frazao et al., 2000 1 71 2 67 64.1% 0.47 [0.04, 5.08]
Total (95% CI) 116 109 100% 0.41 [0.06, 2.72]Total events 1 3Heterogeneity: Tau² = 0.00; Chi² = 0.04, df = 1 (P = 0.84); I² = 0%Test for overall effect: Z = 0.93 (P = 0.35) 0.005 0.1 1 10 200
Favours vitamin D Favours control
Vitamin D ControlWeight
Risk RatioM-H, Random, 95% CI
Risk RatioM-H, Random, 95% CI in CHD mortality risk
Study or SubgroupInkovaara et al., 1983Frazao et al., 2000
Total (95% CI)Total eventsHeterogeneity: Tau² = 0.00; Chi² = 0.04, df = 1 (P = 0.84); I² = 0%Test for overall effect: Z = 0.93 (P = 0.35)
Events01
1
Total4571
116
Events12
3
Total4267
109
Weight35.9%64.1%
100.0%
M-H, Random, 95% CI0.31 [0.01, 7.44]0.47 [0.04, 5.08]
0.41 [0.06, 2.72]
Year19832000
Vitamin D Control Risk Ratio Risk RatioM-H, Random, 95% CI
0.005 0.1 1 10 200Favours Vitamin D Favours Control
Supplementary Figure 9. Forest plot of vitamin D supplementation and CHD mortality risk. M-H, Manthel-Haenszel, CHD, coronary heart disease. The diamond represents the pooled risk estimate. Inter-study heterogeneity was tested using the Cochran Q statistic (Chi2) at a significance level of P < 0.10, and quantified by the I2 statistic. An I2 value ≥ 50% is considered to indicate substantial heterogeneity. All results are presented as risk ratios with 95% Confidence Intervals, using the Manthel-Haenszel method with random effects model.
Subgroup and Study, Year Events Total Events TotalRCTsOtt et al., 1989 0 43 1 43 1.6% 0.33 [0.01, 7.96]Trivedi et al., 2003 42 1,345 49 1,341 95.3% 0.85 [0.57, 1.28]Coburn et al., 2004 0 27 1 28 1.6% 0.35 [0.01, 8.12]Cherniack et al., 2011 1 23 0 23 1.6% 3.00 [0.13, 70.02]
Total (95% CI) 1,438 1,435 100% 0.85 [0.57, 1.26]Total events 43 51Heterogeneity: Tau² = 0.00; Chi² = 1.26, df = 3 (P = 0.74); I² = 0%Test for overall effect: Z = 0.82 (P = 0.41) 0.02 0.1 1 10 50
Favours vitamin D Favours control
Vitamin D ControlWeight
Risk RatioM-H, Random, 95% CI
Risk RatioM-H, Random, 95% CI in MI mortality risk
Study or SubgroupOtt et al., 1989Trivedi et al., 2003Coburn et al., 2004Cherniack et al., 2011
Total (95% CI)Total eventsHeterogeneity: Tau² = 0.00; Chi² = 1.26, df = 3 (P = 0.74); I² = 0%Test for overall effect: Z = 0.82 (P = 0.41)
Events0
4201
43
Total43
13452723
1438
Events1
4910
51
Total43
13412823
1435
Weight1.6%
95.3%1.6%1.6%
100.0%
M-H, Random, 95% CI0.33 [0.01, 7.96]0.85 [0.57, 1.28]0.35 [0.01, 8.12]
3.00 [0.13, 70.02]
0.85 [0.57, 1.26]
Year1989200320042011
Vitamin D Control Risk Ratio Risk RatioM-H, Random, 95% CI
0.02 0.1 1 10 50Favours Vitamin D Favours Control
Supplementary Figure 10. Forest plot of vitamin D supplementation and MI mortality risk. M-H, Manthel-Haenszel, MI, myocardial infarction. The diamond represents the pooled risk estimate. Inter-study heterogeneity was tested using the Cochran Q statistic (Chi2) at a significance level of P < 0.10, and quantified by the I2 statistic. An I2 value ≥ 50% is considered to indicate substantial heterogeneity. All results are presented as risk ratios with 95% Confidence Intervals, using the Manthel-Haenszel method with random effects model.
81
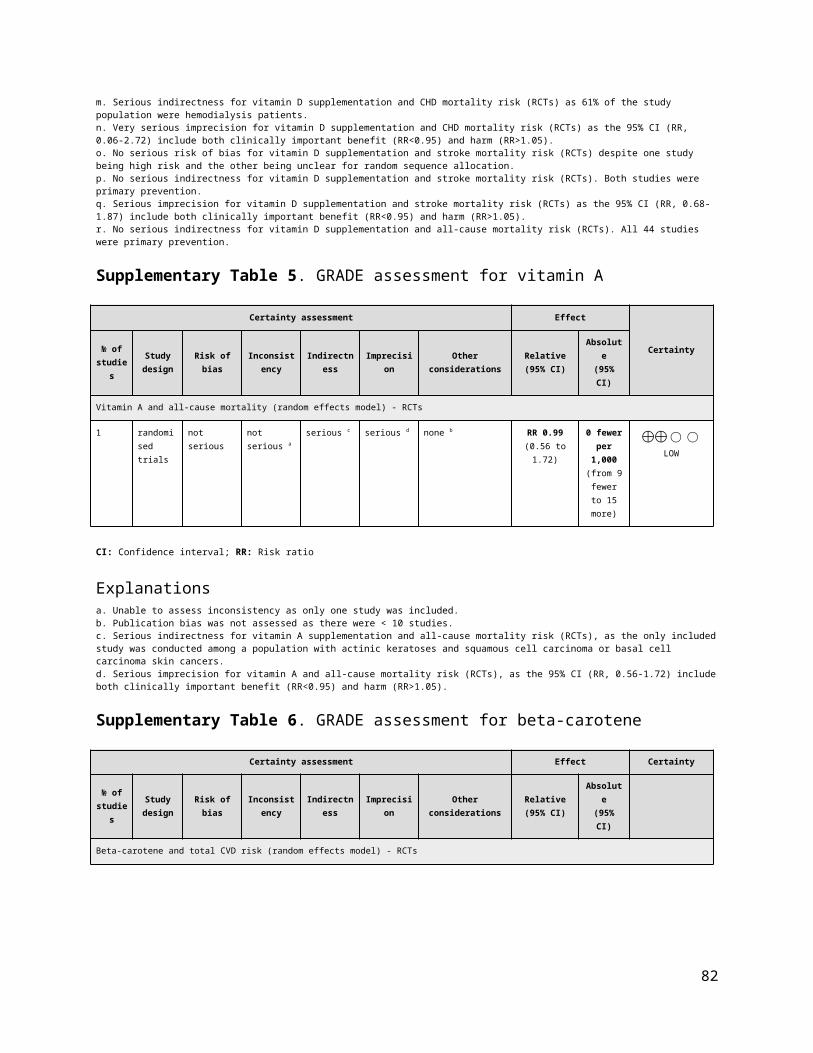
Subgroup and Study, Year Events Total Events TotalRCTsInkovaara et al., 1983 4 45 2 42 9.4% 1.87 [0.36, 9.67]Trivedi et al., 2003 28 1,345 26 1,341 90.6% 1.07 [0.63, 1.82]
Total (95% CI) 1,390 1,383 100% 1.13 [0.68, 1.87]Total events 32 28Heterogeneity: Tau² = 0.00; Chi² = 0.39, df = 1 (P = 0.53); I² = 0%Test for overall effect: Z = 0.48 (P = 0.63) 0.1 0.2 0.5 1 2 5 10
Favours vitamin D Favours control
Vitamin D ControlWeight
Risk RatioM-H, Random, 95% CI
Risk RatioM-H, Random, 95% CI in stroke mortality risk
Study or SubgroupInkovaara et al., 1983Trivedi et al., 2003
Total (95% CI)Total eventsHeterogeneity: Tau² = 0.00; Chi² = 0.39, df = 1 (P = 0.53); I² = 0%Test for overall effect: Z = 0.48 (P = 0.63)
Events4
28
32
Total45
1345
1390
Events2
26
28
Total42
1341
1383
Weight9.4%
90.6%
100.0%
M-H, Random, 95% CI1.87 [0.36, 9.67]1.07 [0.63, 1.82]
1.13 [0.68, 1.87]
Vitamin D Control Risk Ratio Risk RatioM-H, Random, 95% CI
0.1 0.2 0.5 1 2 5 10Favours Vitamin D Favours Control
Supplementary Figure 11. Forest plot of vitamin D supplementation and stroke mortality risk. M-H, Manthel-Haenszel. The diamond represents the pooled risk estimate. Inter-study heterogeneity was tested using the Cochran Q statistic (Chi2) at a significance level of P < 0.10, and quantified by the I2 statistic. An I2 value ≥ 50% is considered to indicate substantial heterogeneity. All results are presented as risk ratios with 95% Confidence Intervals, using the Manthel-Haenszel method with random effects model.
82

Subgroup and Study, Year Events Total Events TotalRCTsBrohult et al., 1973* 1 25 0 25 0.0% 3.00 [0.13, 70.30]Inkovaara et al., 1983 7 45 5 42 0.1% 1.31 [0.45, 3.80]Corless et al., 1985 8 41 8 41 0.2% 1.00 [0.42, 2.41]Ott et al., 1989 0 43 1 43 0.0% 0.33 [0.01, 7.96]Gallagher et al., 1990† 1 25 0 25 0.0% 3.00 [0.13, 70.30]Grady et al., 1991‡ 1 50 0 48 0.0% 2.88 [0.12, 69.07]Hamdy et al., 1995 4 89 1 87 0.0% 3.91 [0.45, 34.29]Ooms et al., 1995§ 11 177 21 171 0.3% 0.51 [0.25, 1.02]Lips et al., 1996 223 1,291 251 1,287 6.4% 0.89 [0.75, 1.04]Sato et al., 1997 1 45 1 39 0.0% 0.87 [0.06, 13.40]Sato et al., 1999ǁ 1 43 0 43 0.0% 3.00 [0.13, 71.65]Komulainen et al., 1999 - OSTPRE 0 112 1 115 0.0% 0.34 [0.01, 8.31]Frazao et al., 2000 1 71 2 67 0.0% 0.47 [0.04, 5.08]Gallagher et al., 2001 - STOP IT 1 123 1 123 0.0% 1.00 [0.06, 15.81]Meyer et al., 2002 169 569 163 575 5.2% 1.05 [0.87, 1.26]Trivedi et al., 2003 224 1,345 247 1,341 6.3% 0.90 [0.77, 1.07]Cooper et al., 2003¶ 0 93 1 94 0.0% 0.34 [0.01, 8.16]Harwood et al., 2004 - NONOF 7 38 5 37 0.2% 1.36 [0.47, 3.91]Dukas et al., 2004 1 192 1 186 0.0% 0.97 [0.06, 15.37]Sato et al., 2005** 1 48 2 48 0.0% 0.50 [0.05, 5.33]Grant et al., 2005 - RECORD 438 2,649 460 2,643 12.0% 0.95 [0.84, 1.07]Aloia et al., 2005†† 1 104 2 104 0.0% 0.50 [0.05, 5.43]Flicker et al., 2005 76 313 85 312 2.4% 0.89 [0.68, 1.16]Coyne et al., 2006 2 107 1 113 0.0% 2.11 [0.19, 22.96]Law et al., 2006 347 1,762 322 1,955 9.0% 1.20 [1.04, 1.37]Schleithoff et al., 2006 7 61 6 62 0.2% 1.19 [0.42, 3.33]Smith et al., 2007‡‡ 355 4,727 354 4,713 8.5% 1.00 [0.87, 1.15]Lyons et al., 2007 947 1,725 953 1,715 47.0% 0.99 [0.93, 1.05]Prince et al., 2008 0 151 1 151 0.0% 0.33 [0.01, 8.12]Bjorkman et al., 2008 10 73 9 68 0.2% 1.04 [0.45, 2.39]Janssen et al., 2010§§ 1 36 0 34 0.0% 2.84 [0.12, 67.36]Sanders et al., 2010 - Vital D 40 1,131 47 1,127 1.0% 0.85 [0.56, 1.28]de Zeeuw et al., 2010 - VITAL 1 95 0 93 0.0% 2.94 [0.12, 71.20]Cherniack et al., 2011 1 23 0 23 0.0% 3.00 [0.13, 70.02]Grimnes et al., 2011 0 51 1 53 0.0% 0.35 [0.01, 8.31]Punthakee et al., 2012 - TIDE 0 607 2 614 0.0% 0.20 [0.01, 4.21]Alvarez et al., 2012 1 24 1 24 0.0% 1.00 [0.07, 15.08]Lehouck et al., 2012 9 91 6 91 0.2% 1.50 [0.56, 4.04]Glendenning et al., 2012 2 353 0 333 0.0% 4.72 [0.23, 97.90]Witham et al., 2013 1 39 0 36 0.0% 2.77 [0.12, 66.02]Hewitt et al., 2013 1 30 1 30 0.0% 1.00 [0.07, 15.26]Delanaye et al., 2013 6 22 5 21 0.2% 1.15 [0.41, 3.19]Witham et al., 2013 - VitDISH 0 80 1 79 0.0% 0.33 [0.01, 7.96]
Total (95% CI) 18,719 18,831 100% 0.99 [0.95, 1.03]Total events 2,908 2,968Heterogeneity: Tau² = 0.00; Chi² = 28.51, df = 42 (P = 0.94); I² = 0%Test for overall effect: Z = 0.55 (P = 0.58) 0.05 0.2 1 5 20
Favours vitamin D Favours control
Vitamin D ControlWeight
Risk RatioM-H, Random, 95% CI
Risk RatioM-H, Random, 95% CI in all-cause mortality risk
Study or SubgroupBrohult et al., 1973Inkovaara et al., 1983Corless et al., 1985Ott et al., 1989Gallagher et al., 1990Grady et al., 1991Hamdy et al., 1995Ooms et al., 1995Lips et al., 1996Sato et al., 1997Sato et al., 1999Komulainen et al., 1999 - OSTPREFrazao et al., 2000Gallagher et al., 2001 - STOP ITMeyer et al., 2002Trivedi et al., 2003Cooper et al., 2003Harwood et al., 2004 - NONOFDukas et al., 2004Sato et al., 2005Grant et al., 2005 - RECORDAloia et al., 2005Flicker et al., 2005Coyne et al., 2006Law et al., 2006Schleithoff et al., 2006Smith et al., 2007Lyons et al., 2007Prince et al., 2008Bjorkman et al., 2008Janssen et al.,2010Sanders et al., 2010 - Vital Dde Zeeuw et al., 2010 - VITALCherniack et al., 2011Grimnes et al. 2011Punthakee et al., 2012 - TIDEAlvarez et al., 2012Lehouck et al., 2012Glendenning et al., 2012Witham et al., 2013Hewitt et al., 2013Delanaye et al., 2013Witham et al., 2013 - VitDISH
Total (95% CI)Total eventsHeterogeneity: Tau² = 0.00; Chi² = 28.51, df = 42 (P = 0.94); I² = 0%Test for overall effect: Z = 0.55 (P = 0.58)
Events1780114
11223
11011
169224
0711
4381
762
3477
355947
010
140
11001921160
2908
Total25454143255089
1771291
4543
11271
123569
13459338
19248
2649104313107
176261
47271725
1517336
1131952351
6072491
35339302280
18719
Events0581001
21251
10121
163247
1512
4602
851
3226
354953
190
4700121600151
2968
Total25424143254887
1711287
3943
11567
123575
13419437
18648
2643104312113
195562
47131715
1516834
1127932353
6142491
33336302179
18831
Weight0.0%0.1%0.2%0.0%0.0%0.0%0.0%0.3%6.4%0.0%0.0%0.0%0.0%0.0%5.2%6.3%0.0%0.2%0.0%0.0%
12.0%0.0%2.4%0.0%9.0%0.2%8.5%
47.0%0.0%0.2%0.0%1.0%0.0%0.0%0.0%0.0%0.0%0.2%0.0%0.0%0.0%0.2%0.0%
100.0%
M-H, Random, 95% CI3.00 [0.13, 70.30]
1.31 [0.45, 3.80]1.00 [0.42, 2.41]0.33 [0.01, 7.96]
3.00 [0.13, 70.30]2.88 [0.12, 69.07]3.91 [0.45, 34.29]
0.51 [0.25, 1.02]0.89 [0.75, 1.04]
0.87 [0.06, 13.40]3.00 [0.13, 71.65]
0.34 [0.01, 8.31]0.47 [0.04, 5.08]
1.00 [0.06, 15.81]1.05 [0.87, 1.26]0.90 [0.77, 1.07]0.34 [0.01, 8.16]1.36 [0.47, 3.91]
0.97 [0.06, 15.37]0.50 [0.05, 5.33]0.95 [0.84, 1.07]0.50 [0.05, 5.43]0.89 [0.68, 1.16]
2.11 [0.19, 22.96]1.20 [1.04, 1.37]1.19 [0.42, 3.33]1.00 [0.87, 1.15]0.99 [0.93, 1.05]0.33 [0.01, 8.12]1.04 [0.45, 2.39]
2.84 [0.12, 67.36]0.85 [0.56, 1.28]
2.94 [0.12, 71.20]3.00 [0.13, 70.02]
0.35 [0.01, 8.31]0.20 [0.01, 4.21]
1.00 [0.07, 15.08]1.50 [0.56, 4.04]
4.72 [0.23, 97.90]2.77 [0.12, 66.02]1.00 [0.07, 15.26]
1.15 [0.41, 3.19]0.33 [0.01, 7.96]
0.99 [0.95, 1.03]
Year1973198319851989199019911995199519961997199919992000200120022003200320042004200520052005200520062006200620072007200820082010201020102011201120122012201220122013201320132013
Vitamin D Control Risk Ratio Risk RatioM-H, Random, 95% CI
0.01 0.1 1 10 100Favours Vitamin D Favours Control
Supplementary Figure 12. Forest plot of vitamin D supplementation and all-cause mortality risk. M-H, Manthel-Haenszel. *Brohult et al., 1973 - data taken from meta-analysis Bjelakovic et al., 2014 †Gallagher et al., 1990 - data taken from meta-analysis Avenell et al., 2014 ‡Grady et al., 1991 - data taken from meta-analysis Chowdhury et al., 2014 §Ooms et al., 1995 - data taken from meta-analysis Zheng et al., 2013 ǁSato et al., 1999 - data taken from meta-analysis Bjelakovic et al., 2014 ¶Cooper et al., 2003 - data taken from meta-analysis Zheng et al., 2013**Sato et al., 2005 - data taken from meta-analysis Chowdhury et al., 2014, Bjelakovic et al., 2014 ††Aloia et al., 2005 - data taken from meta-analysis Zheng et al., 2013 ‡‡Smith et al., 2007 - data taken from meta-analysis Bjelakovic et al., 2014 §§Jansen et al., 2010 - data taken from meta-analysis Avenell et al., 2014. ǁǁAvenell et al., 2012 - Data provided included results from the RCT and follow-up period combined. The diamond represents the pooled risk estimate. Inter-study heterogeneity was tested using the Cochran Q statistic (Chi2) at a significance level of P <
83
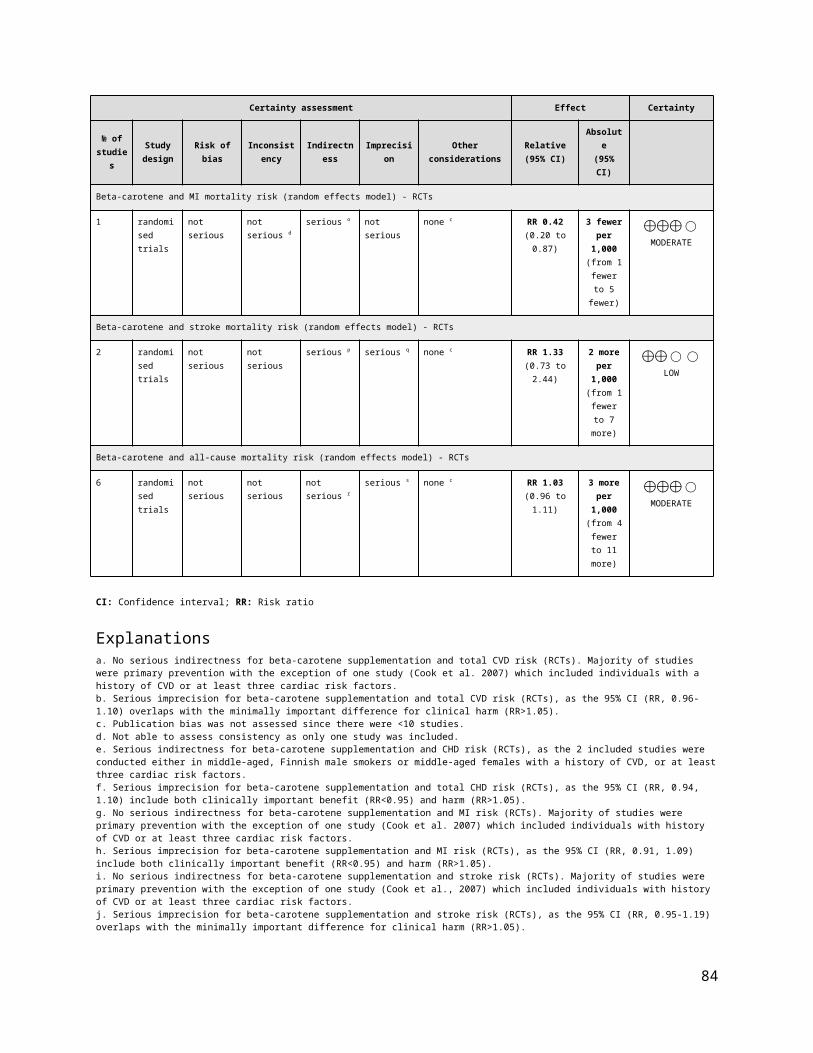
0.10, and quantified by the I2 statistic. An I2 value ≥ 50% is considered to indicate substantial heterogeneity. All results are presented as risk ratios with 95% Confidence Intervals, using the Manthel-Haenszel method with random effects model.
Supplementary Figure 13. Funnel plot of vitamin D supplementation and CVD and all-cause mortality outcomes: (A) MI risk, (B) stroke risk, and (C) all-cause mortality risk. The vertical line represents the pooled effect estimate expressed as a RR. Dashed lines represent pseudo-95% confidence intervals (CI). The circles represent risk estimates for each study, and the horizontal lines represent standard errors of the RR. We were unable to test for funnel plot asymmetry for other CVD outcomes (<10 RCTs).
Random Effects
Comparison RCTs N Events RR (95% CIs) RR (95% CIs) I2 p -value
ALL-CAUSE MORTALITY All-cause mortality 1 2,297 48 0.99 [0.56, 1.72] N/A 0.96
Favours vitamin A / Favours control/ Negative association Positive association
Pooled Effect Estimates
0.5 1.0 1.5
84

Supplementary Figure 14. Summary of the pooled effect estimates of RCTsassessing the relationship vitamin A supplementation and all cause mortality risk. RR, risk ratio; CIs, confidence intervals; CVD, cardiovascular disease; CHD, coronary heart disease; MI, myocardial infarction; N/A, not applicable or not available. The diamonds represents the pooled risk estimate. Inter-study heterogeneity was tested using the Cochran Q statistic (Chi2) at a significance level of P < 0.10, and quantified by the I2 statistic. An I2 value ≥ 50% is considered to indicate substantial heterogeneity. All results are presented as risk ratios with 95% CIs, using the Manthel-Haenszel method with random effects model.
Subgroup and Study, Year Events Total Events TotalRCTs Moon et al., 1997- SKICAP-AK 24 1,157 24 1,140 100.0% 0.99 [0.56, 1.72]
Total (95% CI) 1,157 1,140 100% 0.99 [0.56, 1.72]Total events 24 24 Heterogeneity: Not applicable 0.02 0.1 1 10 50Test for overall effect: Z = 0.05 (P = 0.96) Favours vitamin A Favours control
Risk RatioM-H, Random, 95% CI in all-cause mortality
Vitamin A ControlWeight
Risk RatioM-H, Random, 95% CI
Study or SubgroupMoon et al., 1997- SKICAP-AK
Total (95% CI)Total eventsHeterogeneity: Not applicableTest for overall effect: Z = 0.05 (P = 0.96)
Events24
24
Total1157
1157
Events24
24
Total1140
1140
Weight100.0%
100.0%
M-H, Random, 95% CI0.99 [0.56, 1.72]
0.99 [0.56, 1.72]
Year1997
Vitamin A Control Risk Ratio Risk RatioM-H, Random, 95% CI
0.02 0.1 1 10 50Favours Vitamin A Favours Control
Supplementary Figure 15. Forest plot of vitamin A supplementation and all-cause mortality risk. M-H, Manthel-Haenszel. The diamond represents the pooled risk estimate. Inter-study heterogeneity was tested using the Cochran Q statistic (Chi2) at a significance level of P < 0.10, and quantified by the I2 statistic. An I2 value ≥ 50% is considered to indicate substantial heterogeneity. All results are presented as risk ratios with 95% Confidence Intervals, using the Manthel-Haenszel method with random effects model.
85

Random Effects
Comparison RCTs N Events RR (95% CIs) RR (95% CIs) I2 p -value
CVDTotal CVD 3 70,118 2,912 1.03 [0.96, 1.10] 0% 0.44Total CHD 2 21,841 2,081 1.02 [0.94, 1.10] 0% 0.69MI 3 43,912 1,841 0.99 [0.90, 1.09] 0% 0.89Stroke 3 58,761 2,104 1.06 [0.95, 1.19] 36% 0.29Total CVD mortality 4 33,668 1,191 1.10 [0.98, 1.23] 0% 0.11Total CHD mortality 1 13,670 472 0.99 [0.83, 1.18] N/A 0.89MI mortality 1 8,171 34 0.42 [0.20, 0.87] N/A 0.02Stroke mortality 2 36,690 193 1.33 [0.73, 2.44] 61% 0.35
ALL-CAUSE MORTALITY All-cause mortality 6 42,342 4,284 1.03 [0.96, 1.11] 17% 0.37
Pooled Effect Estimates
Favours beta-carotene/ Favours control/ Negative association Positive association
0.0 0.5 1.0 1.5 2.0
Supplementary Figure 16. Summary of the pooled effect estimates of RCT assessing the relationship between beta-carotene supplementation and CVD and all cause mortality risk. RR, risk ratio; CIs, confidence intervals; CVD, cardiovascular disease; CHD, coronary heart disease; MI, myocardial infarction; N/A, not applicable or not available. The diamonds represents the pooled risk estimate. Inter-study heterogeneity was tested using the Cochran Q statistic (Chi2) at a significance level of P < 0.10, and quantified by the I2 statistic. An I2 value ≥ 50% is considered to indicate substantial heterogeneity. All results are presented as risk ratios with 95% CIs, using the Manthel-Haenszel method with random effects model.
Subgroup and Study, Year Events Total Events TotalRCTsHennekens et al., 1996 - PHS 967 11,036 972 11,035 66.6% 0.99 [0.91, 1.08]Lee et al., 1999 - WHS 74 19,939 65 19,937 4.4% 1.14 [0.82, 1.59]Cook et al., 2007 - WACS 435 4,084 399 4,087 29.0% 1.09 [0.96, 1.24]
Total (95% CI) 35,059 35,059 100% 1.03 [0.96, 1.10]Total events 1,476 1,436 Heterogeneity: Tau² = 0.00; Chi² = 1.76, df = 2 (P = 0.42); I² = 0%Test for overall effect: Z = 0.78 (P = 0.44) 0.7 0.85 1 1.2 1.5
Favours beta-carotene Favours control
Beta-carotene ControlWeight
Risk RatioM-H, Random, 95% CI
Risk RatioM-H, Random, 95% CI in total CVD risk
Study or SubgroupHennekens et al., 1996 - PHSLee et al., 1999 - WHSCook et al., 2007 - WACS
Total (95% CI)Total eventsHeterogeneity: Tau² = 0.00; Chi² = 1.76, df = 2 (P = 0.42); I² = 0%Test for overall effect: Z = 0.78 (P = 0.44)
Events96774
435
1476
Total11036199394084
35059
Events97265
399
1436
Total11035199374087
35059
Weight66.6%4.4%
29.0%
100.0%
M-H, Random, 95% CI0.99 [0.91, 1.08]1.14 [0.82, 1.59]1.09 [0.96, 1.24]
1.03 [0.96, 1.10]
Year199619992007
Experimental Control Risk Ratio Risk RatioM-H, Random, 95% CI
0.7 0.85 1 1.2 1.5Favours beta-carotene Favours control
Supplementary Figure 17. Forest plot of beta-carotene supplementation and total CVD risk. M-H, Manthel-Haenszel, CVD, cardiovascular disease. The diamond represents the pooled risk estimate. Inter-study heterogeneity was tested using the Cochran Q statistic (Chi2) at a significance level of P < 0.10, and quantified by the I2 statistic. An I2 value ≥ 50% is considered to indicate substantial heterogeneity. All results are presented as risk ratios with 95% Confidence Intervals, using the Manthel-Haenszel method with random effects model.
86

Subgroup and Study, Year Events Total Events TotalRCTsTornwall et al., 2004 - ATBC 548 6,821 534 6,849 50.8% 1.03 [0.92, 1.16]Cook et al., 2007 - WACS 500 4,084 499 4,087 49.2% 1.00 [0.89, 1.13]
Total (95% CI) 10,905 10,936 100% 1.02 [0.94, 1.10]Total events 1,048 1,033 Heterogeneity: Tau² = 0.00; Chi² = 0.11, df = 1 (P = 0.74); I² = 0%Test for overall effect: Z = 0.40 (P = 0.69) 0.7 0.85 1 1.2 1.5
Favours beta-carotene Favours control
Beta-carotene ControlWeight
Risk RatioM-H, Random, 95% CI
Risk RatioM-H, Random, 95% CI in total CHD risk
Study or SubgroupTornwall et al., 2004 - ATBCCook et al., 2007 - WACS
Total (95% CI)Total eventsHeterogeneity: Tau² = 0.00; Chi² = 0.11, df = 1 (P = 0.74); I² = 0%Test for overall effect: Z = 0.40 (P = 0.69)
Events548500
1048
Total68214084
10905
Events534499
1033
Total68494087
10936
Weight50.8%49.2%
100.0%
M-H, Random, 95% CI1.03 [0.92, 1.16]1.00 [0.89, 1.13]
1.02 [0.94, 1.10]
Year20042007
Experimental Control Risk Ratio Risk RatioM-H, Random, 95% CI
0.7 0.85 1 1.2 1.5Favours beta-carotene Favours control
Supplementary Figure 18. Forest plot of beta-carotene supplementation and total CHD risk. M-H, Manthel-Haenszel, CHD, coronary heart disease. The diamond represents the pooled risk estimate. Inter-study heterogeneity was tested using the Cochran Q statistic (Chi2) at a significance level of P < 0.10, and quantified by the I2 statistic. An I2 value ≥ 50% is considered to indicate substantial heterogeneity. All results are presented as risk ratios with 95% Confidence Intervals, using the Manthel-Haenszel method with random effects model.
Subgroup and Study, Year Events Total Events TotalRCTsHennekens et al., 1996 - PHS 468 11,036 489 11,035 52.0% 0.96 [0.85, 1.08]Tornwall et al., 2004 - ATBC 314 6,821 296 6,849 33.2% 1.07 [0.91, 1.24]Cook et al., 2007 - WACS 135 4,084 139 4,087 14.8% 0.97 [0.77, 1.23]
Total (95% CI) 21,941 21,971 100% 0.99 [0.91, 1.09]Total events 917 924Heterogeneity: Tau² = 0.00; Chi² = 1.16, df = 2 (P = 0.56); I² = 0%Test for overall effect: Z = 0.13 (P = 0.89) 0.85 0.9 1 1.1 1.2
Favours beta-carotene Favours control
Beta-carotene ControlWeight
Risk RatioM-H, Random, 95% CI
Risk RatioM-H, Random, 95% CI in MI risk
Study or SubgroupHennekens et al., 1996 - PHSTornwall et al., 2004 - ATBCCook et al., 2007 - WACS
Total (95% CI)Total eventsHeterogeneity: Tau² = 0.00; Chi² = 1.16, df = 2 (P = 0.56); I² = 0%Test for overall effect: Z = 0.13 (P = 0.89)
Events468314135
917
Total1103668214084
21941
Events489296139
924
Total1103568494087
21971
Weight52.0%33.2%14.8%
100.0%
M-H, Random, 95% CI0.96 [0.85, 1.08]1.07 [0.91, 1.24]0.97 [0.77, 1.23]
0.99 [0.91, 1.09]
Year199620042007
Experimental Control Risk Ratio Risk RatioM-H, Random, 95% CI
0.85 0.9 1 1.1 1.2Favours beta-carotene Favours control
Supplementary Figure 19. Forest plot of beta-carotene supplementation and MI risk. M-H, Manthel-Haenszel, MI, myocardial infarction. The diamond represents the pooled risk estimate. Inter-study heterogeneity was tested using the Cochran Q statistic (Chi2) at a significance level of P < 0.10, and quantified by the I2 statistic. An I2 value ≥ 50% is considered to indicate substantial heterogeneity. All results are presented as risk ratios with 95% Confidence Intervals, using the Manthel-Haenszel method with random effects model.
87
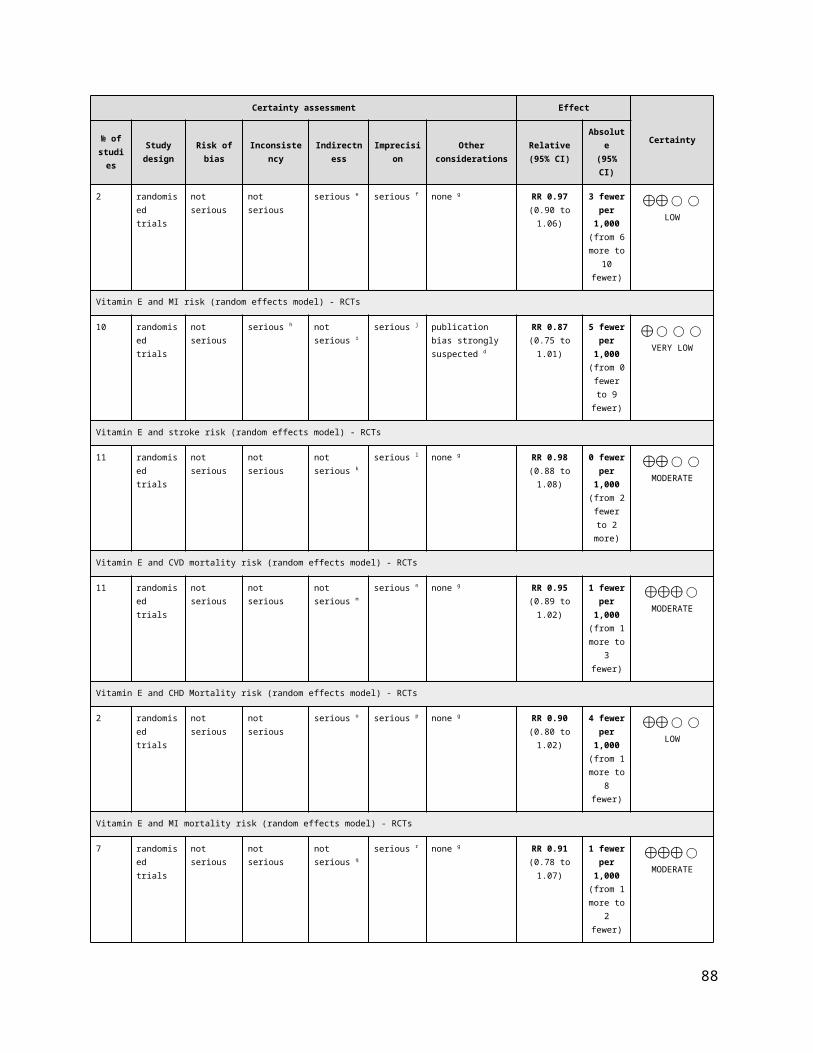
Subgroup and Study, Year Events Total Events TotalRCTsHennekens et al., 1996 - PHS 367 11,036 382 11,035 36.6% 0.96 [0.83, 1.11]Leppala et al., 2000 - ATBC 554 14,246 503 14,273 44.3% 1.10 [0.98, 1.24]Cook et al., 2007 - WACS 161 4,084 137 4,087 19.2% 1.18 [0.94, 1.47]
Total (95% CI) 29,366 29,395 100% 1.06 [0.95, 1.19]Total events 1,082 1022Heterogeneity: Tau² = 0.00; Chi² = 3.15, df = 2 (P = 0.21); I² = 36%Test for overall effect: Z = 1.07 (P = 0.29) 0.7 0.85 1 1.2 1.5
Favours beta-carotene Favours control
Beta-carotene ControlWeight
Risk RatioM-H, Random, 95% CI
Risk RatioM-H, Random, 95% CI in stroke risk
Study or SubgroupHennekens et al., 1996 - PHSLeppala et al., 2000 - ATBCCook et al., 2007 - WACS
Total (95% CI)Total eventsHeterogeneity: Tau² = 0.00; Chi² = 3.15, df = 2 (P = 0.21); I² = 36%Test for overall effect: Z = 1.07 (P = 0.29)
Events367554161
1082
Total11036142464084
29366
Events382503137
1022
Total11035142734087
29395
Weight36.6%44.3%19.2%
100.0%
M-H, Random, 95% CI0.96 [0.83, 1.11]1.10 [0.98, 1.24]1.18 [0.94, 1.47]
1.06 [0.95, 1.19]
Year199620002007
Experimental Control Risk Ratio Risk RatioM-H, Random, 95% CI
0.7 0.85 1 1.2 1.5Favours beta-carotene Favours control
Supplementary Figure 20. Forest plot of beta-carotene supplementation and stroke risk. M-H, Manthel-Haenszel. The diamond represents the pooled risk estimate. Inter-study heterogeneity was tested using the Cochran Q statistic (Chi2) at a significance level of P < 0.10, and quantified by the I2 statistic. An I2 value ≥ 50% is considered to indicate substantial heterogeneity. All results are presented as risk ratios with 95% Confidence Intervals, using the Manthel-Haenszel method with random effects model.
Subgroup and Study, Year Events Total Events TotalRCTsHennekens et al., 1996 - PHS 338 11,036 313 11,035 54.2% 1.08 [0.93, 1.26]Greenberg et al., 1996 - SCPS 68 913 59 892 11.0% 1.13 [0.80, 1.58]Green et al., 1999 - NSCPT 6 801 12 820 1.3% 0.51 [0.19, 1.36]Cook et al., 2007 - WACS 211 4,084 184 4,087 33.4% 1.15 [0.95, 1.39]
Total (95% CI) 16,834 16,834 100% 1.10 [0.98, 1.23]Total events 623 568Heterogeneity: Tau² = 0.00; Chi² = 2.62, df = 3 (P = 0.45); I² = 0%Test for overall effect: Z = 1.62 (P = 0.11) 0.5 0.7 1 1.5 2
Favours beta-carotene Favours control
Beta-carotene ControlWeight
Risk RatioM-H, Random, 95% CI
Risk RatioM-H, Random, 95% CI in CVD mortality risk
Study or SubgroupHennekens et al., 1996 - PHSGreenberg et al., 1996 - Skin Cancer PreventionGreen et al., 1999 - NSCPTCook et al., 2007 - WACS
Total (95% CI)Total eventsHeterogeneity: Tau² = 0.00; Chi² = 2.62, df = 3 (P = 0.45); I² = 0%Test for overall effect: Z = 1.62 (P = 0.11)
Events338686
211
623
Total11036
913801
4084
16834
Events3135912
184
568
Total11035
892820
4087
16834
Weight54.2%11.0%1.3%
33.4%
100.0%
M-H, Random, 95% CI1.08 [0.93, 1.26]1.13 [0.80, 1.58]0.51 [0.19, 1.36]1.15 [0.95, 1.39]
1.10 [0.98, 1.23]
Year1996199619992007
Experimental Control Risk Ratio Risk RatioM-H, Random, 95% CI
0.5 0.7 1 1.5 2Favours beta-carotene Favours control
Supplementary Figure 21. Forest plot of beta-carotene supplementation and CVD mortality risk. M-H, Manthel-Haenszel, CVD, cardiovascular disease. The diamond represents the pooled risk estimate. Inter-study heterogeneity was tested using the Cochran Q statistic (Chi2) at a significance level of P < 0.10, and quantified by the I2 statistic. An I2 value ≥ 50% is considered to indicate substantial heterogeneity. All results are presented as risk ratios with 95% Confidence Intervals, using the Manthel-Haenszel method with random effects model.
88

Subgroup and Study, Year Events Total Events TotalRCTsTornwall et al., 2004 - ATBC 234 6,821 238 6,849 100% 0.99 [0.83, 1.18]
Total (95% CI) 6,821 6,849 100% 0.99 [0.83, 1.18]Total events 234 238Heterogeneity: Not applicableTest for overall effect: Z = 0.14 (P = 0.89) 0.2 0.5 1 1.5 2.0
Favours beta-carotene Favours control
Beta-carotene ControlWeight
Risk RatioM-H, Random, 95% CI
Risk RatioM-H, Random, 95% CI in CHD mortality risk
Study or SubgroupTornwall et al., 2004 - ATBC
Total (95% CI)Total eventsHeterogeneity: Not applicableTest for overall effect: Z = 0.14 (P = 0.89)
Events234
234
Total6821
6821
Events238
238
Total6849
6849
Weight100.0%
100.0%
M-H, Random, 95% CI0.99 [0.83, 1.18]
0.99 [0.83, 1.18]
Year2004
Experimental Control Risk Ratio Risk RatioM-H, Random, 95% CI
0.2 0.5 1 2 5Favours beta-carotene Favours control
Supplementary Figure 22. Forest plot of beta-carotene supplementation and CHD mortality risk. M-H, Manthel-Haenszel, CHD, coronary heart disease. The diamond represents the pooled risk estimate. Inter-study heterogeneity was tested using the Cochran Q statistic (Chi2) at a significance level of P < 0.10, and quantified by the I2 statistic. An I2 value ≥ 50% is considered to indicate substantial heterogeneity. All results are presented as risk ratios with 95% Confidence Intervals, using the Manthel-Haenszel method with random effects model.
Subgroup and Study, Year Events Total Events TotalRCTsCook et al., 2007 - WACS 10 4,084 24 4,087 100.0% 0.42 [0.20, 0.87]
Total (95% CI) 4,084 4,087 100% 0.42 [0.20, 0.87]Total events 10 24Heterogeneity: Not applicable 0.05 0.2 1 5 20 Test for overall effect: Z = 2.33 (P = 0.02) Favours beta-carotene Favours control
Beta-carotene ControlWeight
Risk RatioM-H, Random, 95% CI
Risk RatioM-H, Random, 95% CI in MI mortality risk
Study or SubgroupCook et al., 2007 - WACS
Total (95% CI)Total eventsHeterogeneity: Not applicableTest for overall effect: Z = 2.33 (P = 0.02)
Events10
10
Total4084
4084
Events24
24
Total4087
4087
Weight100.0%
100.0%
M-H, Random, 95% CI0.42 [0.20, 0.87]
0.42 [0.20, 0.87]
Year2007
Experimental Control Risk Ratio Risk RatioM-H, Random, 95% CI
0.05 0.2 1 5 20Favours beta-carotene Favours control
Supplementary Figure 23. Forest plot of beta-carotene supplementation and MI mortality risk. M-H, Manthel-Haenszel, MI, myocardial infarction. The diamond represents the pooled risk estimate. Inter-study heterogeneity was tested using the Cochran Q statistic (Chi2) at a significance level of P < 0.10, and quantified by the I2 statistic. An I2 value ≥ 50% is considered to indicate substantial heterogeneity. All results are presented as risk ratios with 95% Confidence Intervals, using the Manthel-Haenszel method with random effects model.
Subgroup and Study, Year Events Total Events TotalRCTsLeppala et al., 2000 - ATBC 82 14,246 78 14,273 63.5% 1.05 [0.77, 1.43]Cook et al., 2007 - WACS 22 4,084 11 4,087 36.5% 2.00 [0.97, 4.12]
Total (95% CI) 18,330 18,360 100% 1.33 [0.73, 2.44]Total events 104 89Heterogeneity: Tau² = 0.13; Chi² = 2.57, df = 1 (P = 0.11); I² = 61% 0.2 0.5 1 2 5 Test for overall effect: Z = 0.93 (P = 0.35) Favours beta-carotene Favours control
Beta-carotene ControlWeight
Risk RatioM-H, Random, 95% CI
Risk RatioM-H, Random, 95% CI in stroke mortality risk
Study or SubgroupLeppala et al., 2000 - ATBCCook et al., 2007 - WACS
Total (95% CI)Total eventsHeterogeneity: Tau² = 0.13; Chi² = 2.57, df = 1 (P = 0.11); I² = 61%Test for overall effect: Z = 0.93 (P = 0.35)
Events8222
104
Total14246
4084
18330
Events7811
89
Total14273
4087
18360
Weight63.5%36.5%
100.0%
M-H, Random, 95% CI1.05 [0.77, 1.43]2.00 [0.97, 4.12]
1.33 [0.73, 2.44]
Year20002007
Experimental Control Risk Ratio Risk RatioM-H, Random, 95% CI
0.2 0.5 1 2 5Favours beta-carotene Favours control
Supplementary Figure 24. Forest plot of beta-carotene supplementation and stroke mortality risk. M-H, Manthel-Haenszel. The diamond represents the pooled risk estimate. Inter-study heterogeneity was tested using the Cochran Q statistic (Chi2) at a significance level of P < 0.10, and quantified by the I2 statistic. An I2 value ≥ 50% is considered to indicate substantial heterogeneity. All results are presented as risk ratios with 95% Confidence Intervals, using the Manthel-Haenszel method with random effects model.
89
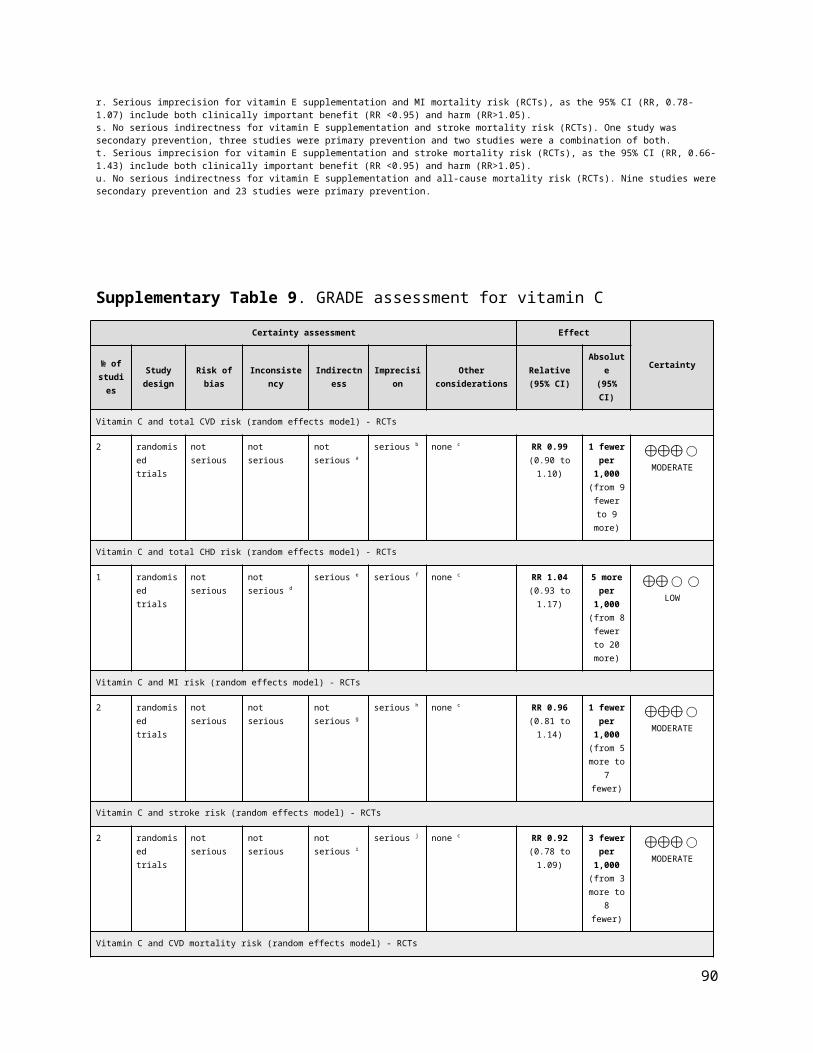
Subgroup and Study, Year Events Total Events TotalRCTsGreenberg et al., 1996 - Skin Cancer Prevention 146 913 139 892 10.0% 1.03 [0.83, 1.27]Hennekens et al., 1996 - PHS 979 11,036 968 11,035 41.0% 1.01 [0.93, 1.10]Green et al., 1999 - NSCPT 11 820 21 801 1.0% 0.51 [0.25, 1.05]Correa et al., 2000 2 117 0 117 0.1% 5.00 [0.24, 103.03]Virtamo et al., 2003 - ATBC 919 7,282 851 7,287 39.5% 1.08 [0.99, 1.18]Cook 2007 - WACS 124 1,020 124 1,022 8.5% 1.00 [0.79, 1.27]
Total (95% CI) 21,188 21,154 100% 1.03 [0.96, 1.11]Total events 2,181 2,103 Heterogeneity: Tau² = 0.00; Chi² = 5.99, df = 5 (P = 0.31); I² = 17%Test for overall effect: Z = 0.90 (P = 0.37) 0.2 0.5 1 2 5
Favours beta-carotene Favours control
Beta-carotene ControlWeight
Risk RatioM-H, Random, 95% CI
Risk RatioM-H, Random, 95% CI in all-cause mortality risk
Study or SubgroupGreenberg et al., 1996 - Skin Cancer PreventionHennekens et al., 1996 - PHSGreen et al., 1999 - NSCPTCorrea et al., 2000Virtamo et al., 2003 - ATBCCook 2007 - WACS
Total (95% CI)Total eventsHeterogeneity: Tau² = 0.00; Chi² = 5.99, df = 5 (P = 0.31); I² = 17%Test for overall effect: Z = 0.90 (P = 0.37)
Events146979
112
919124
2181
Total913
11036820117
72821020
21188
Events139968
210
851124
2103
Total892
11035801117
72871022
21154
Weight10.0%41.0%
1.0%0.1%
39.5%8.5%
100.0%
M-H, Random, 95% CI1.03 [0.83, 1.27]1.01 [0.93, 1.10]0.51 [0.25, 1.05]
5.00 [0.24, 103.03]1.08 [0.99, 1.18]1.00 [0.79, 1.27]
1.03 [0.96, 1.11]
Year199619961999200020032007
Experimental Control Risk Ratio Risk RatioM-H, Random, 95% CI
0.2 0.5 1 2 5Favours [experimental] Favours [control]
Supplementary Figure 25. Forest plot of beta-carotene supplementation and all-cause mortality risk. M-H, Manthel-Haenszel. The diamond represents the pooled risk estimate. Inter-study heterogeneity was tested using the Cochran Q statistic (Chi2) at a significance level of P < 0.10, and quantified by the I2 statistic. An I2 value ≥ 50% is considered to indicate substantial heterogeneity. All results are presented as risk ratios with 95% Confidence Intervals, using the Manthel-Haenszel method with random effects model.
Random Effects
Comparison RCTs N Events RR (95% CIs) RR (95% CIs) I2 p -value
CVDTotal CVD 7 60,826 7,726 0.99 [0.95, 1.04] 0% 0.77
Total CHD 1 13,630 1,045 0.97 [0.86, 1.09] N/A 0.57
MI 6 42,134 1,815 0.98 [0.90, 1.08] 0% 0.73
Stroke 7 60,589 1,986 1.00 [0.92, 1.09] 0% 0.98
Total CVD mortality 7 49,729 2,263 1.02 [0.94, 1.10] 0% 0.65
Total CHD mortality 2 34,166 1,754 1.02 [0.93, 1.13] 10% 0.68
MI mortality 3 947 8 1.51 [0.39, 5.93] 0% 0.55
Stroke mortality 5 56,352 342 1.10 [0.87, 1.39] 7% 0.43
ALL-CAUSE MORTALITY All-cause mortality 21 105,780 8,472 1.06 [1.00, 1.12] 0% 0.05
Favours antioxidants/ Favours control/
Negative association Positive association
Pooled Effect Estimates
0.0 0.5 1.0 1.5 2.0
Supplementary Figure 26. Summary of the pooled effect estimates of RCTs assessing the relationship between antioxidants supplementation and CVD and all cause mortality risk. RR, risk ratio; CIs, confidence intervals; RTCs, randomized clinical trials; CVD, cardiovascular disease; CHD, coronary heart disease; MI, myocardial infarction; N/A, not applicable. The diamonds represents the pooled risk estimate. Inter-study heterogeneity was tested using the Cochran Q statistic (Chi2) at a significance level of P < 0.10, and quantified by the I2 statistic. An I2 value ≥ 50% is considered to indicate substantial heterogeneity. All results are presented as risk ratios with 95% CIs, using the Manthel-Haenszel method with random effects model.
90
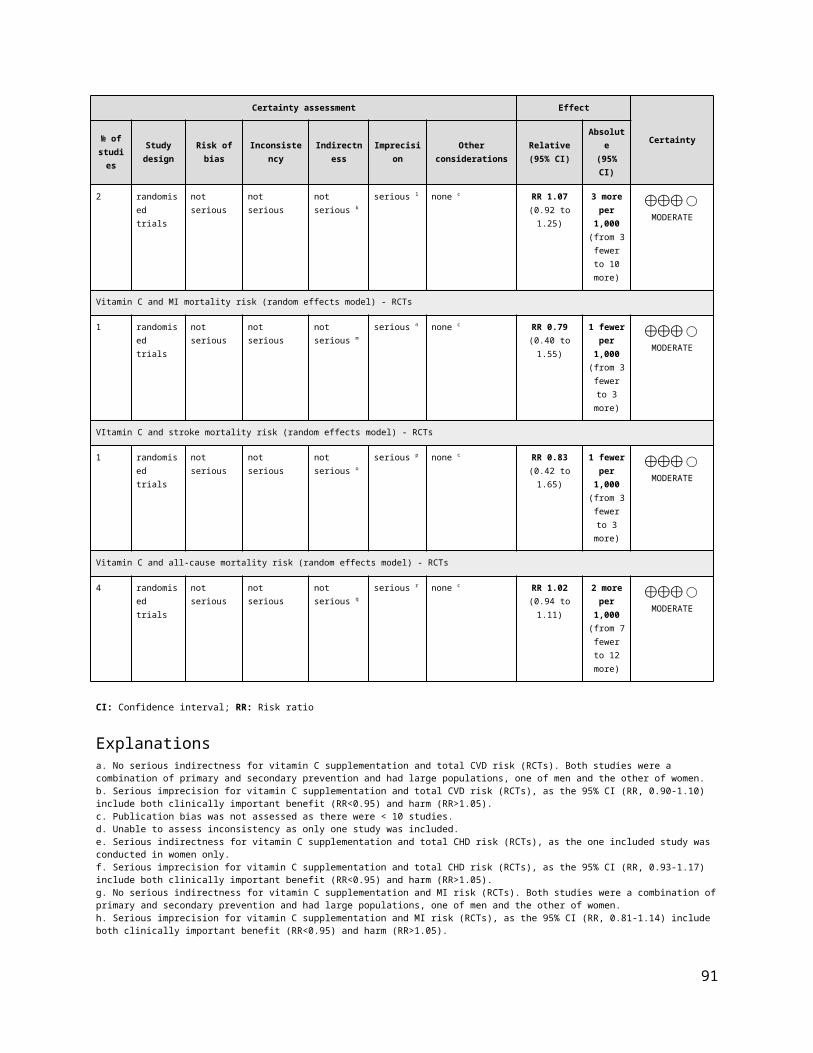
Subgroup and Study, Year Events Total Events TotalRCTsBrown et al., 2001 - HATS* 11 42 12 38 0.3% 0.83 [0.42, 1.65]HPS Collaborative Group 2002 2,306 10,269 2,312 10,267 63.7% 1.00 [0.95, 1.05]CLIPS Group 2007 16 185 11 181 0.3% 1.42 [0.68, 2.98]Plummer et al., 2007 1 990 - 990 0.0% 3.00 [0.12, 73.55]Sesso et al., 2008 - PHS II 310 3,656 316 3,653 7.3% 0.98 [0.84, 1.14]Lippman et al., 2009 - SELECT 1,041 8,904 1,050 8,910 25.3% 0.99 [0.92, 1.08]Hercberg et al., 2010 - SU.VI.MAX 137 6,377 143 6,364 3.1% 0.96 [0.76, 1.21]
Total (95% CI) 30,423 30,403 100% 0.99 [0.95, 1.04]Total events 3,822 3,844 Heterogeneity: Tau² = 0.00; Chi² = 1.79, df = 6 (P = 0.94); I² = 0%Test for overall effect: Z = 0.29 (P 0.2 0.5 1 2 5
Favours antioxidant Favours control
Antioxidant Control Risk RatioM-H, Random, 95% CI
Risk RatioM-H, Random, 95%CI in total CVD riskWeight
Study or SubgroupBrown et al., 2001 - HATSHPS Collaborative Group 2002CLIPS Group 2007Plummer et al., 2007Sesso et al., 2008 - PHS IILippman et al., 2009 - SELECTHercberg et al., 2010 - SU.VI.MAX
Total (95% CI)Total eventsHeterogeneity: Tau² = 0.00; Chi² = 1.79, df = 6 (P = 0.94); I² = 0%Test for overall effect: Z = 0.29 (P = 0.77)
Events11
230616
1310
1041137
3822
Total42
10269185990
365689046377
30423
Events12
231211
0316
1050143
3844
Total38
10267181990
365389106364
30403
Weight0.3%
63.7%0.3%0.0%7.3%
25.3%3.1%
100.0%
M-H, Random, 95% CI0.83 [0.42, 1.65]1.00 [0.95, 1.05]1.42 [0.68, 2.98]
3.00 [0.12, 73.55]0.98 [0.84, 1.14]0.99 [0.92, 1.08]0.96 [0.76, 1.21]
0.99 [0.95, 1.04]
Year2001200220072007200820092010
Antioxidants Control Risk Ratio Risk RatioM-H, Random, 95% CI
0.2 0.5 1 2 5Favours antioxidants Favours control
Supplementary Figure 27. Forest plot of antioxidants supplementation and total CVD risk. M-H, Manthel-Haenszel, CVD, cardiovascular disease. *Brown et al., 2001 - reported number of participants with at least one event. The diamond represents the pooled risk estimate. Inter-study heterogeneity was tested using the Cochran Q statistic (Chi2) at a significance level of P < 0.10, and quantified by the I2 statistic. An I2 value ≥ 50% is considered to indicate substantial heterogeneity. All results are presented as risk ratios with 95% Confidence Intervals, using the Manthel-Haenszel method with random effects model.
Subgroup and Study, Year Events Total Events TotalRCTsTornwall et al., 2004 - ATBC 511 6,781 534 6,849 100.0% 0.97 [0.86, 1.09]
Total (95% CI) 6,781 6,849 100% 0.97 [0.86, 1.09]Total events 511 534 Heterogeneity: Not applicable 0.5 0.7 1 1.5 2Test for overall effect: Z = 0.57 (P = 0.57) Favours antioxidant Favours control
Antioxidant ControlWeight
Risk RatioM-H, Random, 95% CI
Risk RatioM-H, Random, 95%CI in total CHD risk
Study or SubgroupTornwall et al., 2004 - ATBC
Total (95% CI)Total eventsHeterogeneity: Not applicableTest for overall effect: Z = 0.57 (P = 0.57)
Events511
511
Total6781
6781
Events534
534
Total6849
6849
Weight100.0%
100.0%
M-H, Random, 95% CI0.97 [0.86, 1.09]
0.97 [0.86, 1.09]
Year2004
Antioxidants Control Risk Ratio Risk RatioM-H, Random, 95% CI
0.5 0.7 1 1.5 2Favours antioxidants Favours control
Supplementary Figure 28. Forest plot of antioxidants supplementation and total CHD risk. M-H, Manthel-Haenszel, CHD, coronary heart disease. The diamond represents the pooled risk estimate. Inter-study heterogeneity was tested using the Cochran Q statistic (Chi2) at a significance level of P < 0.10, and quantified by the I2 statistic. An I2 value ≥ 50% is considered to indicate substantial heterogeneity. All results are presented as risk ratios with 95% Confidence intervals, using the Manthel-Haenszel method with random effects model.
91

Subgroup and Study, Year Events Total Events TotalRCTsBrown et al., 2001 - HATS* 1 42 4 38 0.2% 0.23 [0.03, 1.94]HPS Collaborative Group 2002 464 10,269 467 10,267 51.6% 0.99 [0.88, 1.13]Waters et al., 2002 - WAVE 3 105 1 108 0.2% 3.09 [0.33, 29.19]Tornwall et al., 2004 - ATBC 289 6,781 296 6,849 32.3% 0.99 [0.84, 1.16]CLIPS Group 2007 9 185 4 181 0.6% 2.20 [0.69, 7.02]Sesso et al., 2008 - PHS II 133 3,656 144 3,653 15.2% 0.92 [0.73, 1.16]
Total (95% CI) 21,038 21,096 100% 0.98 [0.90, 1.08]Total events 899 916 Heterogeneity: Tau² = 0.00; Chi² = 4.97, df = 5 (P = 0.42); I² = 0%Test for overall effect: Z = 0.35 (P = 0.73) 0.2 0.5 1 2 5
Favours antioxidant Favours control
Antioxidant ControlWeight
Risk RatioM-H, Random, 95% CI
Risk RatioM-H, Random, 95%CI in MI risk
Study or SubgroupBrown et al., 2001 - HATSHPS 2002Waters et al., 2002 - WAVETornwall et al., 2004 - ATBCCLIPS 2007Sesso et al., 2008 - PHS II
Total (95% CI)Total eventsHeterogeneity: Tau² = 0.00; Chi² = 4.97, df = 5 (P = 0.42); I² = 0%Test for overall effect: Z = 0.35 (P = 0.73)
Events1
4643
2899
133
899
Total42
10269105
6781185
3656
21038
Events4
4671
2964
144
916
Total38
10267108
6849181
3653
21096
Weight0.2%
51.6%0.2%
32.3%0.6%
15.2%
100.0%
M-H, Random, 95% CI0.23 [0.03, 1.94]0.99 [0.88, 1.13]
3.09 [0.33, 29.19]0.99 [0.84, 1.16]2.20 [0.69, 7.02]0.92 [0.73, 1.16]
0.98 [0.90, 1.08]
Year200120022002200420072008
Antioxidants Control Risk Ratio Risk RatioM-H, Random, 95% CI
0.2 0.5 1 2 5Favours antioxidants Favours control
Supplementary Figure 29. Forest plot of antioxidants supplementation and MI risk. M-H, Manthel-Haenszel, MI, myocardial infarction. *Brown et al., 2001 - reported number of participants with at least one event. The diamond represents the pooled risk estimate. Inter-study heterogeneity was tested using the Cochran Q statistic (Chi2) at a significance level of P < 0.10, and quantified by the I2 statistic. An I2 value ≥ 50% is considered to indicate substantial heterogeneity. All results are presented as risk ratios with 95% Confidence Intervals, using the Manthel-Haenszel method with random effects model.
Subgroup and Study, Year Events Total Events TotalRCTsLeppala et al., 2000 - ATBC 258 7,118 252 7,153 25.6% 1.03 [0.87, 1.22]Brown et al., 2001 - HATS* 2 42 2 38 0.2% 0.90 [0.13, 6.11]Waters et al., 2002 - WAVE 1 105 3 108 0.1% 0.34 [0.04, 3.24]HPS Collaborative Group 2002 511 10,269 518 10,267 52.4% 0.99 [0.88, 1.11]CLIPS Group 2007 6 185 5 181 0.5% 1.17 [0.36, 3.78]Sesso et al., 2008 - PHS II 104 3,656 113 3,653 10.8% 0.92 [0.71, 1.20]Lippman et al., 2009 - SELECT 111 8,904 100 8,910 10.3% 1.11 [0.85, 1.45]
Total (95% CI) 30,279 30,310 100% 1.00 [0.92, 1.09]Total events 993 993 Heterogeneity: Tau² = 0.00; Chi² = 2.09, df = 6 (P = 0.91); I² = 0%Test for overall effect: Z = 0.02 (P = 0.98) 0.2 0.5 1 2 5
Favours antioxidant Favours control
Antioxidant ControlWeight
Risk RatioM-H, Random, 95% CI
Risk RatioM-H, Random, 95%CI in stroke risk
Study or SubgroupLeppala et al., 2000 - ATBCBrown et al., 2001 - HATSWaters et al., 2002 - WAVEHPS Collaborative Group 2002CLIPS Group 2007Sesso et al., 2008 - PHS IILippman et al., 2009 - SELECT
Total (95% CI)Total eventsHeterogeneity: Tau² = 0.00; Chi² = 2.09, df = 6 (P = 0.91); I² = 0%Test for overall effect: Z = 0.02 (P = 0.98)
Events258
21
5116
104111
993
Total7118
42105
10269185
36568904
30279
Events252
23
5185
113100
993
Total7153
38108
10267181
36538910
30310
Weight25.6%
0.2%0.1%
52.4%0.5%
10.8%10.3%
100.0%
M-H, Random, 95% CI1.03 [0.87, 1.22]0.90 [0.13, 6.11]0.34 [0.04, 3.24]0.99 [0.88, 1.11]1.17 [0.36, 3.78]0.92 [0.71, 1.20]1.11 [0.85, 1.45]
1.00 [0.92, 1.09]
Year2000200120022002200720082009
Antioxidants Control Risk Ratio Risk RatioM-H, Random, 95% CI
0.2 0.5 1 2 5Favours antioxidants Favours control
Supplementary Figure 30. Forest plot of antioxidants supplementation and stroke risk. M-H, Manthel-Haenszel. *Brown et al., 2001 - reported number of participants with at least one event. The diamond represents the pooled risk estimate. Inter-study heterogeneity was tested using the Cochran Q statistic (Chi2) at a significance level of P < 0.10, and quantified by the I2 statistic. An I2 value ≥ 50% is considered to indicate substantial heterogeneity. All results are presented as risk ratios with 95% Confidence Intervals, using the Manthel-Haenszel method with random effects model.
92

Subgroup and Study, Year Events Total Events TotalRCTsBrown et al., 2001 - HATS - 42 1 38 0.1% 0.30 [0.01, 7.21]You et al., 2001 9 1,706 12 1,705 0.9% 0.75 [0.32, 1.77]Waters et al., 2002 - WAVE 4 105 2 108 0.2% 2.06 [0.38, 10.99]HPS Collaborative Group 2002 878 10,269 840 10,267 77.2% 1.05 [0.95, 1.14]CLIPS Group 2007 6 185 3 181 0.3% 1.96 [0.50, 7.71]Sesso et al., 2008 - PHS II 127 3,656 122 3,653 10.6% 1.04 [0.81, 1.33]Lippman et al., 2009 - SELECT 117 8,904 142 8,910 10.7% 0.82 [0.65, 1.05]
Total (95% CI) 24,867 24,862 100% 1.02 [0.94, 1.10]Total events 1,141 1,122 Heterogeneity: Tau² = 0.00; Chi² = 5.84, df = 6 (P = 0.44); I² = 0%Test for overall effect: Z = 0.45 (P = 0.65) 0.05 0.2 1 5 20
Favours antioxidant Favours control
Antioxidant ControlWeight
Risk RatioM-H, Random, 95% CI
Risk RatioM-H, Random, 95%CI in CVD mortality risk
Study or SubgroupBrown et al., 2001 - HATSYou et al., 2001Waters et al., 2002 - WAVEHPS Collaborative Group 2002CLIPS Group 2007Sesso et al., 2008 - PHS IILippman et al., 2009 - SELECT
Total (95% CI)Total eventsHeterogeneity: Tau² = 0.00; Chi² = 5.84, df = 6 (P = 0.44); I² = 0%Test for overall effect: Z = 0.45 (P = 0.65)
Events094
8786
127117
1141
Total42
1706105
10269185
36568904
24867
Events1
122
8403
122142
1122
Total38
1705108
10267181
36538910
24862
Weight0.1%0.9%0.2%
77.2%0.3%
10.6%10.7%
100.0%
M-H, Random, 95% CI0.30 [0.01, 7.21]0.75 [0.32, 1.77]
2.06 [0.38, 10.99]1.05 [0.95, 1.14]1.96 [0.50, 7.71]1.04 [0.81, 1.33]0.82 [0.65, 1.05]
1.02 [0.94, 1.10]
Year2001200120022002200720082009
Antioxidants Control Risk Ratio Risk RatioM-H, Random, 95% CI
0.05 0.2 1 5 20Favours antioxidants Favours control
Supplementary Figure 31. Forest plot of antioxidants supplementation and CVD mortality risk. M-H, Manthel-Haenszel, CVD, cardiovascular disease. The diamond represents the pooled risk estimate. Inter-study heterogeneity was tested using the Cochran Q statistic (Chi2) at a significance level of P < 0.10, and quantified by the I2 statistic. An I2 value ≥ 50% is considered to indicate substantial heterogeneity. All results are presented as risk ratios with 95% Confidence Intervals, using the Manthel-Haenszel method with random effects model.
Subgroup and Study, Year Events Total Events TotalRCTsHPS Collaborative Group 2002 664 10,269 630 10,267 72.0% 1.05 [0.95, 1.17]Tornwall et al., 2004 - ATBC 222 6,781 238 6,849 28.0% 0.94 [0.79, 1.13]
Total (95% CI) 17,050 17,116 100% 1.02 [0.93, 1.13]Total events 886 868 Heterogeneity: Tau² = 0.00; Chi² = 1.11, df = 1 (P = 0.29); I² = 10% 0.5 0.7 1 1.5 2 Test for overall effect: Z = 0.42 (P = 0.68) Favours antioxidant Favours control
Antioxidant ControlWeight
Risk RatioM-H, Random, 95% CI
Risk RatioM-H, Random, 95%CI in CHD mortality risk
Study or SubgroupHPS 2002Tornwall et al., 2004 - ATBC
Total (95% CI)Total eventsHeterogeneity: Tau² = 0.00; Chi² = 1.11, df = 1 (P = 0.29); I² = 10%Test for overall effect: Z = 0.42 (P = 0.68)
Events664222
886
Total10269
6781
17050
Events630238
868
Total10267
6849
17116
Weight72.0%28.0%
100.0%
M-H, Random, 95% CI1.05 [0.95, 1.17]0.94 [0.79, 1.13]
1.02 [0.93, 1.13]
Year20022004
Antioxidants Control Risk Ratio Risk RatioM-H, Random, 95% CI
0.5 0.7 1 1.5 2Favours antioxidants Favours control
Supplementary Figure 32. Forest plot of antioxidants supplementation and CHD mortality risk. M-H, Manthel-Haenszel, CHD, coronary heart disease. The diamond represents the pooled risk estimate. Inter-study heterogeneity was tested using the Cochran Q statistic (Chi2) at a significance level of P < 0.10, and quantified by the I2 statistic. An I2 value ≥ 50% is considered to indicate substantial heterogeneity. All results are presented as risk ratios with 95% Confidence Intervals, using the Manthel-Haenszel method with random effects model.
93

Subgroup and Study, Year Events Total Events TotalRCTsChylack et al.., 2002 - REACT 2 149 1 148 32.6% 1.99 [0.18, 21.67]Mooney et al., 2005 1 142 0 142 18.3% 3.00 [0.12, 73.03]CLIPS Group 2007 2 185 2 181 49.1% 0.98 [0.14, 6.87]
Total (95% CI) 476 471 100% 1.51 [0.39, 5.93]Total events 5 3 Heterogeneity: Tau² = 0.00; Chi² = 0.42, df = 2 (P = 0.81); I² = 0%Test for overall effect: Z = 0.59 (P = 0.55) 0.02 0.1 1 10 50
Favours antioxidant Favours control
Antioxidant ControlWeight
Risk RatioM-H, Random, 95% CI
Risk RatioM-H, Random, 95%CI in MI mortality risk
Study or SubgroupChylack et al.., 2002 - REACTMooney et al., 2005CLIPS Group 2007
Total (95% CI)Total eventsHeterogeneity: Tau² = 0.00; Chi² = 0.42, df = 2 (P = 0.81); I² = 0%Test for overall effect: Z = 0.59 (P = 0.55)
Events212
5
Total149142185
476
Events102
3
Total148142181
471
Weight32.6%18.3%49.1%
100.0%
M-H, Random, 95% CI1.99 [0.18, 21.67]3.00 [0.12, 73.03]0.98 [0.14, 6.87]
1.51 [0.39, 5.93]
Year200220052007
Antioxidants Control Risk Ratio Risk RatioM-H, Random, 95% CI
0.02 0.1 1 10 50Favours antioxidants Favours control
Supplementary Figure 33. Forest plot of antioxidants supplementation and MI mortality risk. M-H, Manthel-Haenszel, MI, myocardial infarction. The diamond represents the pooled risk estimate. Inter-study heterogeneity was tested using the Cochran Q statistic (Chi2) at a significance level of P < 0.10, and quantified by the I2 statistic. An I2 value ≥ 50% is considered to indicate substantial heterogeneity. All results are presented as risk ratios with 95% Confidence Intervals, using the Manthel-Haenszel method with random effects model.
Subgroup and Study, Year Events Total Events TotalRCTsLeppala et al., 2000 - ATBC 46 7,118 34 7,153 25.4% 1.36 [0.87, 2.12]HPS Collaborative Group 2002 108 10,269 107 10,267 58.9% 1.01 [0.77, 1.32]CLIPS Group 2007 3 185 0 181 0.6% 6.85 [0.36, 131.67]Lippman et al., 2009 - SELECT 12 8,904 8 8,910 6.8% 1.50 [0.61, 3.67]Ma et al., 2012 10 1,677 14 1,688 8% 0.72 [0.32, 1.61]
Total (95% CI) 28,153 28,199 100% 1.10 [0.87, 1.39]Total events 179 163 Heterogeneity: Tau² = 0.01; Chi² = 4.28, df = 4 (P = 0.37); I² = 7%Test for overall effect: Z = 0.80 (P = 0.43) 0.01 0.1 1 10 100
Favours antioxidant Favours control
Antioxidant ControlWeight
Risk RatioM-H, Random, 95% CI
Risk RatioM-H, Random, 95%CI in stroke mortality risk
Study or SubgroupLeppala et al., 2000 - ATBCHPS Collaborative Group 2002CLIPS Group 2007Lippman et al., 2009 - SELECTMa et al., 2012
Total (95% CI)Total eventsHeterogeneity: Tau² = 0.01; Chi² = 4.28, df = 4 (P = 0.37); I² = 7%Test for overall effect: Z = 0.80 (P = 0.43)
Events46
1083
1210
179
Total7118
10269185
89041677
28153
Events34
10708
14
163
Total7153
10267181
89101688
28199
Weight25.4%58.9%0.6%6.8%8.2%
100.0%
M-H, Random, 95% CI1.36 [0.87, 2.12]1.01 [0.77, 1.32]
6.85 [0.36, 131.67]1.50 [0.61, 3.67]0.72 [0.32, 1.61]
1.10 [0.87, 1.39]
Year20002002200720092012
Antioxidants Control Risk Ratio Risk RatioM-H, Random, 95% CI
0.01 0.1 1 10 100Favours antioxidants Favours control
Supplementary Figure 34. Forest plot of antioxidants supplementation and stroke mortality risk. M-H, Manthel-Haenszel. The diamond represents the pooled risk estimate. Inter-study heterogeneity was tested using the Cochran Q statistic (Chi2) at a significance level of P < 0.10, and quantified by the I2 statistic. An I2 value ≥ 50% is considered to indicate substantial heterogeneity. All results are presented as risk ratios with 95% Confidence Intervals, using the Manthel-Haenszel method with random effects model.
94
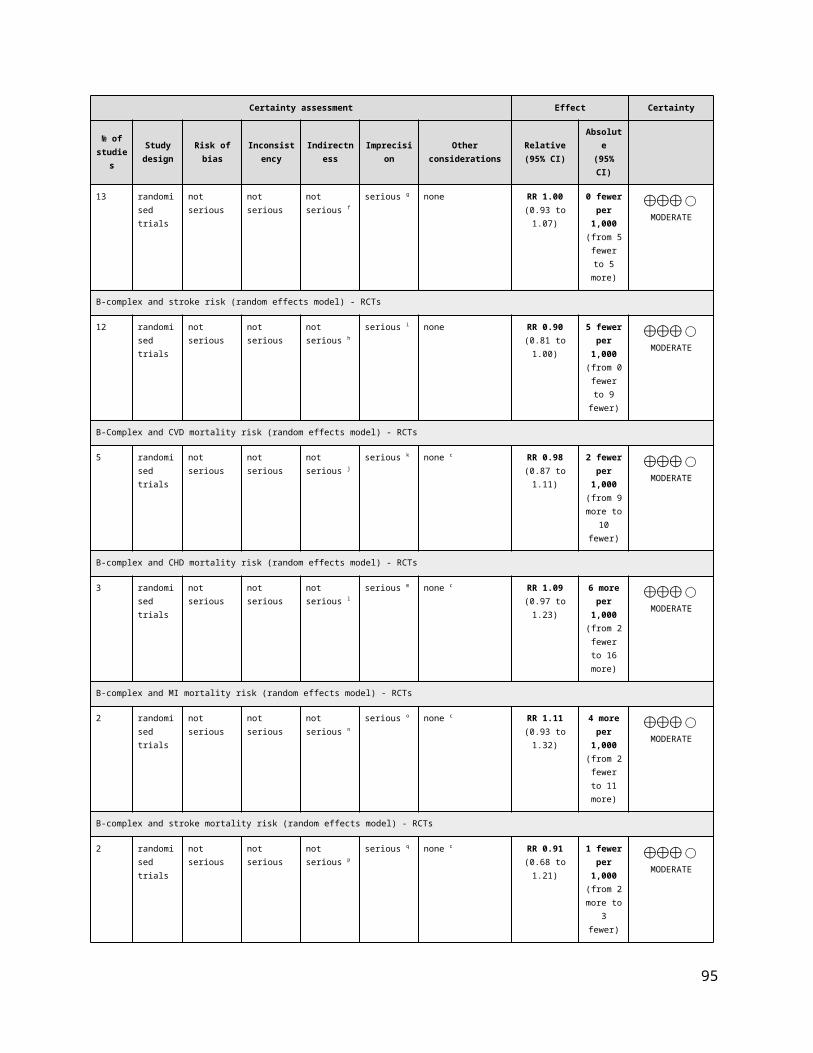
Subgroup and Study, Year Events Total Events TotalRCTsMcKeown-Eyssen et al., 1988 4 96 3 89 0.10% 1.24 [0.28, 5.37]Omenn et al., 1996 - CARET 544 9,420 424 8,894 12.50% 1.21 [1.07, 1.37]Girodon et al., 1997* 7 21 7 20 0.40% 0.95 [0.41, 2.23]Girodon et al., 1999 - MIN.VIT.AOX† 55 181 51 182 2.6% 1.08 [0.79, 1.49]Salonen et al., 2000 - ASAP 1 130 1 130 0.0% 1.00 [0.06, 15.82]Correa et al., 2000 2 121 0 117 0.0% 4.84 [0.23, 99.67]Jacobson et al., 2000 0 57 1 55 0.0% 0.32 [0.01, 7.74]Brown et al., 2001 - HATS 0 42 1 38 0.0% 0.30 [0.01, 7.21]AREDS Research Group 2001 251 2,304 240 2,325 8.1% 1.06 [0.89, 1.25]HPS Collaborative Group 2002 1,446 10,269 1,389 10,267 22.8% 1.04 [0.97, 1.11]Waters et al., 2002 - WAVE 6 105 2 108 0.1% 3.09 [0.64, 14.95]Chylack et al.., 2002 - REACT 9 149 3 148 0.2% 2.98 [0.82, 10.79]Virtamo et al., 2003 - ATBC 932 7,278 851 7,287 18.6% 1.10 [1.01, 1.20]Mooney et al., 2005 1 142 0 142 0.0% 3.00 [0.12, 73.03]CLIPS Group 2007 7 185 4 181 0.2% 1.71 [0.51, 5.75]Plummer et al., 2007 16 990 11 990 0.5% 1.45 [0.68, 3.12]Cook et al., 2007 - WAC 133 1,020 124 1,022 4.8% 1.07 [0.85, 1.35]Lippman et al., 2009 - SELECT 359 8,904 382 8,910 10.4% 0.94 [0.82, 1.08]Hercberg et al., 2010 - SU.VI.MAX 77 6,377 99 6,364 3.1% 0.78 [0.58, 1.04]Ma et al., 2012 - SIT 82 1,706 101 1,705 3.3% 0.81 [0.61, 1.08]Wang et al., 2014 - PHS II 440 3,656 406 3,653 12.1% 1.08 [0.95, 1.23]
Total (95% CI) 53,153 52,627 100.0% 1.06 [1.00, 1.12]Total events 4372 4100Heterogeneity: Tau² = 0.00; Chi² = 24.05, df = 20 (P = 0.24); I² = 17%Test for overall effect: Z = 2.00 (P = 0.05) 0.1 0.2 0.5 1 2 5 10
Favours antioxidant Favours control
Antioxidant ControlWeight
Risk RatioM-H, Random, 95% CI
Risk RatioM-H, Random, 95%CI in all-cause mortality risk
Study or SubgroupMcKeown-Eyssen et al., 1988Omenn et al., 1996 - CARETGirodon et al., 1997Girodon et al., 1999 - MIN.VIT.AOXSalonen et al., 2000 - ASAPCorrea et al., 2000Jacobson et al., 2000Brown et al., 2001 - HATSAREDS Research Group 2001HPS Collaborative Group 2002Waters et al., 2002 - WAVEChylack et al.., 2002 - REACTVirtamo et al., 2003 - ATBCMooney et al., 2005CLIPS Group 2007Plummer et al., 2007Cook et al., 2007 - WACLippman et al., 2009 - SELECTHercberg et al., 2010 - SU.VI.MAXMa et al., 2012 - SITWang et al., 2014 - PHS II
Total (95% CI)Total eventsHeterogeneity: Tau² = 0.00; Chi² = 24.05, df = 20 (P = 0.24); I² = 17%Test for overall effect: Z = 2.00 (P = 0.05)
Events4
5447
551200
2511446
69
93217
161333597782
440
4372
Total96
942021
1811301215742
230410269
105149
7278142185990
10208904637717063656
53153
Events3
4247
511011
2401389
23
85104
1112438299
101406
4100
Total89
889420
1821301175538
232510267
108148
7287142181990
10228910636417053653
52627
Weight0.1%
12.5%0.4%2.6%0.0%0.0%0.0%0.0%8.1%
22.8%0.1%0.2%
18.6%0.0%0.2%0.5%4.8%
10.4%3.1%3.3%
12.1%
100.0%
M-H, Random, 95% CI1.24 [0.28, 5.37]1.21 [1.07, 1.37]0.95 [0.41, 2.23]1.08 [0.79, 1.49]
1.00 [0.06, 15.82]4.84 [0.23, 99.67]0.32 [0.01, 7.74]0.30 [0.01, 7.21]1.06 [0.89, 1.25]1.04 [0.97, 1.11]
3.09 [0.64, 14.95]2.98 [0.82, 10.79]1.10 [1.01, 1.20]
3.00 [0.12, 73.03]1.71 [0.51, 5.75]1.45 [0.68, 3.12]1.07 [0.85, 1.35]0.94 [0.82, 1.08]0.78 [0.58, 1.04]0.81 [0.61, 1.08]1.08 [0.95, 1.23]
1.06 [1.00, 1.12]
Year198819961997199920002000200020012001200220022002200320052007200720072009201020122014
Antioxidants Control Risk Ratio Risk RatioM-H, Random, 95% CI
0.1 0.2 0.5 1 2 5 10Favours antioxidants Favours control
Supplementary Figure 35. Forest plot of antioxidants supplementation and all-cause mortality risk. M-H, Manthel-Haenszel. *Girodon et al., 1997 - vitamin C, vitamin E, β-carotene, selenium and zinc vs placebo; †Girodon et al., 1999 - vitamin C, vitamin E, β-carotene, selenium and zinc vs placebo. The diamond represents the pooled risk estimate. Inter-study heterogeneity was tested using the Cochran Q statistic (Chi2) at a significance level of P < 0.10, and quantified by the I2 statistic. An I2 value ≥ 50% is considered to indicate substantial heterogeneity. All results are presented as risk ratios with 95% Confidence Intervals, using the Manthel-Haenszel method with random effects model.
95
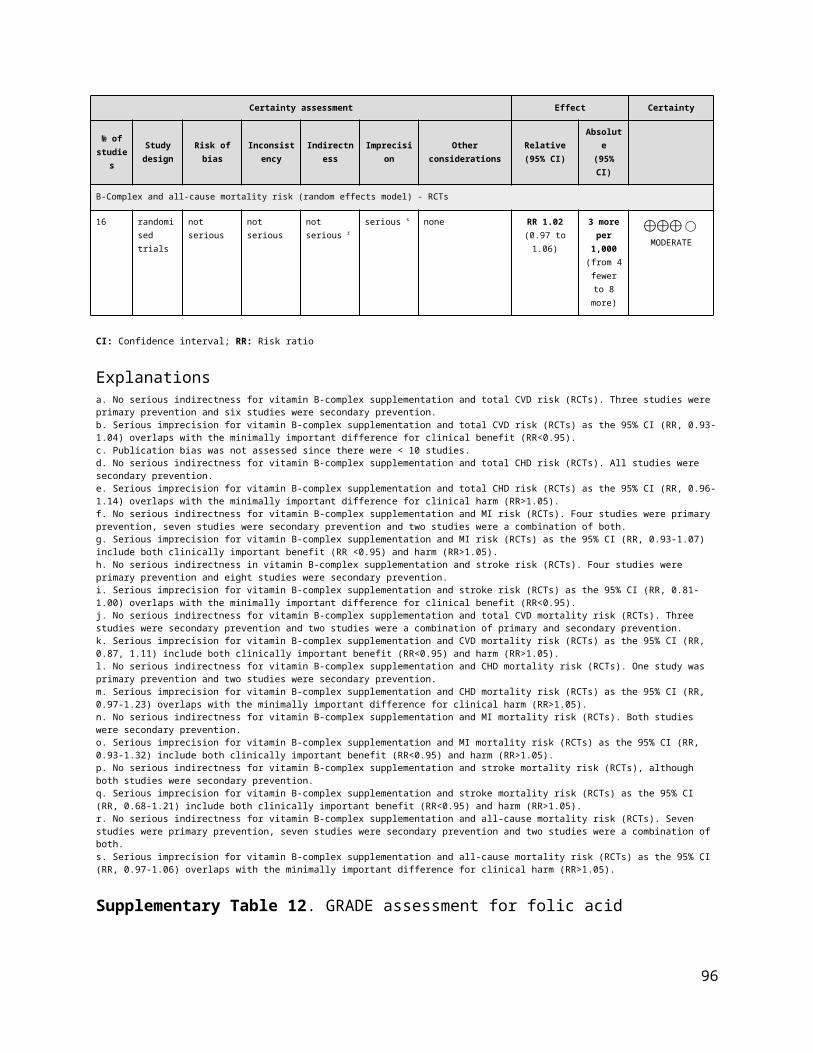
Supplementary Figure 36. Funnel plot of antioxidants supplementation and all-cause mortality risk. The vertical line represents the pooled effect estimate expressed as a RR. Dashed lines represent pseudo-95% confidence intervals (CI). The circles represent risk estimates for each study, and the horizontal lines represent standard errors of the RR. We were unable to test for other CVD outcomes (<10 RCTs).
Random Effects
Comparison RCTs N Events RR (95% CIs) RR (95% CIs) I2 p -valueCVDTotal CVD 10 100,475 7,936 0.96 [0.89, 1.03] 50% 0.23
Total CHD 2 21,840 2,052 0.97 [0.90, 1.06] 0% 0.50MI 10 87,049 3,119 0.87 [0.75, 1.01] 64% 0.07Stroke 11 101 1,956 0.98 [0.88, 1.08] 15% 0.67Total CVD mortality 11 102,533 2,887 0.95 [0.89, 1.02] 0% 0.16Total CHD mortality 2 24,993 970 0.90 [0.80, 1.02] 0% 0.10MI mortality 7 66,417 592 0.91 [0.78, 1.07] 0% 0.26Stroke mortality 5 72,317 104 0.97 [0.66, 1.43] 0% 0.88
ALL-CAUSE MORTALITY All-cause mortality 32 123,001 8,984 1.00 [0.97, 1.04] 0% 0.87
Favours vitamin E/ Favours control/ Negative association Positive association
Pooled Effect Estimates
0.0 0.5 1.0 1.5 2.0
Supplementary Figure 37. Summary of the pooled effect estimates of RCTs assessing the relationship between vitamin E supplementation and CVD and all-cause mortality risk. RR, risk ratio; CIs, confidence intervals; RTCs, randomized clinical trials; CVD, cardiovascular disease; CHD, coronary heart disease; MI, myocardial infarction; N/A, not applicable. The diamonds represents the pooled risk estimate. Inter-study heterogeneity was tested using the Cochran Q statistic (Chi2) at a significance level of P < 0.10, and quantified by the I2 statistic. An I2 value ≥ 50% is considered to indicate substantial heterogeneity. All results are presented as risk ratios with 95% CIs, using the Manthel-Haenszel method with random effects model.
96

Subgroup and Study, Year Events Total Events TotalRCTsGISSI-Prevenzione Investigators 1999 571 5,660 584 5,664 15.6% 0.98 [0.88, 1.09]Boaz et al., 2000 - SPACE 15 97 33 99 1.5% 0.46 [0.27, 0.80]de Gaetano et al., 2001 - PPP 56 2,231 53 2,264 3.1% 1.07 [0.74, 1.55]Hodis et al., 2002 - VEAPS 11 177 14 176 0.8% 0.78 [0.36, 1.67]Lonn et al., 2005 - HOPE & HOPE-TOO 1,022 4,761 985 4,780 19.3% 1.04 [0.96, 1.13]Lee et al., 2005 - WHS 482 19,937 517 19,939 14.2% 0.93 [0.82, 1.05]Cook et al., 2007 - WACS 399 4,083 435 4,088 13.6% 0.92 [0.81, 1.04]Sesso et al., 2008 - PHS II 310 3,659 316 3,653 11.6% 0.98 [0.84, 1.14]Milman et al., 2008 16 726 33 708 1.3% 0.47 [0.26, 0.85]Lippman et al., 2009 - SELECT 1,034 8,863 1,050 8,910 19% 0.99 [0.91, 1.07]
Total (95% CI) 50,194 50,281 100% 0.96 [0.89, 1.03]Total events 3,916 4,020 Heterogeneity: Tau² = 0.00; Chi² = 17.84, df = 9 (P = 0.04); I² = 50%Test for overall effect: Z = 1.21 (P = 0.23) 0.5 0.7 1 1.5 2
Favours vitamin E Favours control
Vitamin E ControlWeight
Risk RatioM-H, Random, 95% CI
Risk RatioM-H, Random, 95%CI in total CVD risk
Study or SubgroupGISSI-Prevenzione Investigators 1999Boaz et al., 2000 - SPACEde Gaetano et al., 2001 - PPPHodis et al., 2002 - VEAPSLonn et al., 2005 - HOPE & HOPE-TOOLee et al., 2005 - WHSCook et al., 2007 - WACSMilman et al., 2008Sesso et al., 2008 - PHS IILippman et al., 2009 - SELECT
Total (95% CI)Total eventsHeterogeneity: Tau² = 0.00; Chi² = 17.84, df = 9 (P = 0.04); I² = 50%Test for overall effect: Z = 1.21 (P = 0.23)
Events571
155611
1022482399
16310
1034
3916
Total5660
972231
1774761
199374083
72636598863
50194
Events584
335314
985517435
33316
1050
4020
Total5664
992264176
478019939
4088708
36538910
50281
Weight15.6%
1.5%3.1%0.8%
19.3%14.2%13.6%
1.3%11.6%19.0%
100.0%
M-H, Random, 95% CI0.98 [0.88, 1.09]0.46 [0.27, 0.80]1.07 [0.74, 1.55]0.78 [0.36, 1.67]1.04 [0.96, 1.13]0.93 [0.82, 1.05]0.92 [0.81, 1.04]0.47 [0.26, 0.85]0.98 [0.84, 1.14]0.99 [0.91, 1.07]
0.96 [0.89, 1.03]
Year1999200020012002200520052007200820082009
Vitamin E Control Risk Ratio Risk RatioM-H, Random, 95% CI
0.5 0.7 1 1.5 2Favours vitamin E Favours control
Supplementary Figure 38. Forest plot of vitamin E supplementation and total CVD risk. M-H, Manthel-Haenszel, CVD, cardiovascular disease. The diamond represents the pooled risk estimate. Inter-study heterogeneity was tested using the Cochran Q statistic (Chi2) at a significance level of P < 0.10, and quantified by the I2 statistic. An I2 value ≥ 50% is considered to indicate substantial heterogeneity. All results are presented as risk ratios with 95% Confidence Intervals, using the Manthel-Haenszel method with random effects model.
Subgroup and Study, Year Events Total Events TotalRCTsVirtamo et al., 1998 - ATBC 519 6,820 534 6,849 50.1% 0.98 [0.87, 1.10]Cook et al., 2007 - WACS 491 4,083 508 4,088 49.9% 0.97 [0.86, 1.09]
Total (95% CI) 10,903 10,937 100% 0.97 [0.90, 1.06]Total events 1,010 1,042 Heterogeneity: Tau² = 0.00; Chi² = 0.01, df = 1 (P = 0.92); I² = 0%Test for overall effect: Z = 0.68 (P = 0.50) 0.7 0.85 1 1.2 1.5
Favours vitamin E Favours control
Vitamin E ControlWeight
Risk RatioM-H, Random, 95% CI
Risk RatioM-H, Random, 95%CI in CHD risk
Study or SubgroupVirtamo et al., 1998 - ATBCCook et al., 2007 - WACS
Total (95% CI)Total eventsHeterogeneity: Tau² = 0.00; Chi² = 0.01, df = 1 (P = 0.92); I² = 0%Test for overall effect: Z = 0.68 (P = 0.50)
Events519491
1010
Total68204083
10903
Events534508
1042
Total68494088
10937
Weight50.1%49.9%
100.0%
M-H, Random, 95% CI0.98 [0.87, 1.10]0.97 [0.86, 1.09]
0.97 [0.90, 1.06]
Year19982007
Vitamin E Control Risk Ratio Risk RatioM-H, Random, 95% CI
0.7 0.85 1 1.2 1.5Favours Vitamin E Favours Control
Supplementary Figure 39. Forest plot of vitamin E supplementation and total CHD risk. M-H, Manthel-Haenszel, CHD, coronary heart disease. The diamond represents the pooled risk estimate. Inter-study heterogeneity was tested using the Cochran Q statistic (Chi2) at a significance level of P < 0.10, and quantified by the I2 statistic. An I2 value ≥ 50% is considered to indicate substantial heterogeneity. All results are presented as risk ratios with 95% Confidence Intervals, using the Manthel-Haenszel method with random effects model.
97

Subgroup and Study, Year Events Total Events TotalRCTsStephens et al., 1996 - CHAOS 32 1,035 54 967 7.8% 0.55 [0.36, 0.85]Virtamo et al., 1998 - ATBC 307 6,820 296 6,849 17.4% 1.04 [0.89, 1.22]Boaz et al., 2000 - SPACE 5 97 17 99 2.2% 0.30 [0.12, 0.78]de Gaetano et al., 2001 - PPP 22 2,231 25 2,264 5.3% 0.89 [0.51, 1.58]Hodis et al., 2002 - VEAPS 5 177 6 176 1.5% 0.83 [0.26, 2.67]Lee et al., 2005 - WHS 196 19,937 195 19,939 15.7% 1.01 [0.83, 1.22]Lonn et al., 2005 - HOPE & HOPE-TOO 724 4,761 686 4,780 19.7% 1.06 [0.96, 1.17]Cook et al., 2007 - WACS 131 4,083 143 4,088 14.2% 0.92 [0.73, 1.16]Milman et al., 2008 7 726 17 708 2.6% 0.40 [0.17, 0.96]Sesso et al., 2008 - PHS II 107 3,659 144 3,653 13.6% 0.74 [0.58, 0.95]
Total (95% CI) 43,526 43,523 100% 0.87 [0.75, 1.01]Total events 1,536 1,583 Heterogeneity: Tau² = 0.03; Chi² = 25.34, df = 9 (P = 0.003); I² = 64%Test for overall effect: Z = 1.81 (P = 0.07) 0.5 0.7 1 1.5 2
Favours vitamin E Favours control
Vitamin E ControlWeight
Risk RatioM-H, Random, 95% CI
Risk RatioM-H, Random, 95%CI in MI risk
Study or SubgroupStephens et al., 1996 - CHAOSVirtamo et al., 1998 - ATBCBoaz et al., 2000 - SPACEde Gaetano et al., 2001 - PPPHodis et al., 2002 - VEAPSLee et al., 2005 - WHSLonn et al., 2005 - HOPE & HOPE-TOOCook et al., 2007 - WACSMilman et al., 2008Sesso et al., 2008 - PHS II
Total (95% CI)Total eventsHeterogeneity: Tau² = 0.03; Chi² = 25.34, df = 9 (P = 0.003); I² = 64%Test for overall effect: Z = 1.81 (P = 0.07)
Events32
3075
225
196724131
7107
1536
Total10356820
972231
17719937
47614083
7263659
43526
Events54
2961725
6195686143
17144
1583
Total967
684999
2264176
1993947804088
7083653
43523
Weight7.8%
17.4%2.2%5.3%1.5%
15.7%19.7%14.2%
2.6%13.6%
100.0%
M-H, Random, 95% CI0.55 [0.36, 0.85]1.04 [0.89, 1.22]0.30 [0.12, 0.78]0.89 [0.51, 1.58]0.83 [0.26, 2.67]1.01 [0.83, 1.22]1.06 [0.96, 1.17]0.92 [0.73, 1.16]0.40 [0.17, 0.96]0.74 [0.58, 0.95]
0.87 [0.75, 1.01]
Year1996199820002001200220052005200720082008
Vitamin E Control Risk Ratio Risk RatioM-H, Random, 95% CI
0.5 0.7 1 1.5 2Favours Vitamin E Favours Control
Supplementary Figure 40. Forest plot of vitamin E supplementation and MI risk. M-H, Manthel-Haenszel, MI, myocardial infarction. The diamond represents the pooled risk estimate. Inter-study heterogeneity was tested using the Cochran Q statistic (Chi2) at a significance level of P < 0.10, and quantified by the I2 statistic. An I2 value ≥ 50% is considered to indicate substantial heterogeneity. All results are presented as risk ratios with 95% Confidence Intervals, using the Manthel-Haenszel method with random effects model.
Subgroup and Study, Year Events Total Events TotalRCTsSteiner et al., 1995 3 52 6 48 0.6% 0.46 [0.12, 1.74]GISSI-Prevenzione Investigators 1999 83 5,660 95 5,664 10.4% 0.87 [0.65, 1.17]Boaz et al., 2000 - SPACE 5 97 6 99 0.8% 0.85 [0.27, 2.70]de Gaetano et al., 2001 - PPP 22 2,231 18 2,264 2.6% 1.24 [0.67, 2.31]Hodis et al., 2002 - VEAPS 0 177 2 176 0.1% 0.20 [0.01, 4.11]Lee et al., 2005 - WHS 241 19,937 246 19,939 22.1% 0.98 [0.82, 1.17]Lonn et al., 2005 - HOPE & HOPE-TOO 270 4,761 246 4,780 23.6% 1.10 [0.93, 1.30]Cook et al., 2007 - WACS 137 4,083 151 4,088 15.5% 0.91 [0.72, 1.14]Milman et al., 2008 6 726 11 708 1.1% 0.53 [0.20, 1.43]Sesso et al., 2008 - PHS II 133 3,659 113 3,653 13.70% 1.18 [0.92, 1.50]Lippman et al., 2009 - SELECT 70 8,863 92 8,910 9.40% 0.76 [0.56, 1.04]
Total (95% CI) 50,246 50,329 100% 0.98 [0.88, 1.08]Total events 970 986 Heterogeneity: Tau² = 0.00; Chi² = 11.78, df = 10 (P = 0.30); I² = 15%Test for overall effect: Z = 0.43 (P = 0.67) 0.2 0.5 1 2 5
Favours vitamin E Favours control
Vitamin E ControlWeight
Risk RatioM-H, Random, 95% CI
Risk RatioM-H, Random, 95%CI in stroke risk
Study or SubgroupSteiner et al., 1995GISSI-Prevenzione Investigators 1999Boaz et al., 2000 - SPACEde Gaetano et al., 2001 - PPPHodis et al., 2002 - VEAPSLee et al., 2005 - WHSLonn et al., 2005 - HOPE & HOPE-TOOCook et al., 2007 - WACSMilman et al., 2008Sesso et al., 2008 - PHS IILippman et al., 2009 - SELECT
Total (95% CI)Total eventsHeterogeneity: Tau² = 0.00; Chi² = 11.78, df = 10 (P = 0.30); I² = 15%Test for overall effect: Z = 0.43 (P = 0.67)
Events3
835
220
241270137
6133
70
970
Total52
566097
2231177
1993747614083
72636598863
50246
Events6
956
182
246246151
11113
92
986
Total48
566499
2264176
1993947804088
70836538910
50329
Weight0.6%
10.4%0.8%2.6%0.1%
22.1%23.6%15.5%
1.1%13.7%
9.4%
100.0%
M-H, Random, 95% CI0.46 [0.12, 1.74]0.87 [0.65, 1.17]0.85 [0.27, 2.70]1.24 [0.67, 2.31]0.20 [0.01, 4.11]0.98 [0.82, 1.17]1.10 [0.93, 1.30]0.91 [0.72, 1.14]0.53 [0.20, 1.43]1.18 [0.92, 1.50]0.76 [0.56, 1.04]
0.98 [0.88, 1.08]
Year19951999200020012002200520052007200820082009
Vitamin E Control Risk Ratio Risk RatioM-H, Random, 95% CI
0.2 0.5 1 2 5Favours vitamin E Favours control
Supplementary Figure 41. Forest plot of vitamin E supplementation and stroke risk. * M-H, Manthel-Haenszel. The diamond represents the pooled risk estimate. Inter-study heterogeneity was tested using the Cochran Q statistic (Chi2) at a significance level of P < 0.10, and quantified by the I2 statistic. An I2 value ≥ 50% is considered to indicate substantial heterogeneity. All results are presented as risk ratios with 95% Confidence Intervals, using the Manthel-Haenszel method with random effects model.
98

Subgroup and Study, Year Events Total Events TotalRCTsStephens et al., 1996 - CHAOS 27 1,035 23 967 1.7% 1.10 [0.63, 1.90]GISSI-Prevenzione Investigators 1999 310 5,660 329 5,664 22.1% 0.94 [0.81, 1.10]Boaz et al., 2000 - SPACE 9 97 15 99 0.8% 0.61 [0.28, 1.33]de Gaetano et al., 2001 - PPP 22 2,231 26 2,264 1.6% 0.86 [0.49, 1.51]Lee et al., 2005 - WHS 106 19,937 140 19,939 7.9% 0.76 [0.59, 0.97]Lonn et al., 2005 - HOPE & HOPE-TOO 482 4,761 475 4,780 34.8% 1.02 [0.90, 1.15]Magliano et al., 2006 - MAVET 2 205 4 204 0.2% 0.50 [0.09, 2.69]Cook et al., 2007 - WACS 193 4,083 202 4,088 13.6% 0.96 [0.79, 1.16]Sesso et al., 2008 - PHS II 131 3,659 122 3,653 8.6% 1.07 [0.84, 1.37]Milman et al., 2008 3 726 5 708 0.2% 0.59 [0.14, 2.44]Lippman et al., 2009 - SELECT 119 8,863 142 8,910 8.60% 0.84 [0.66, 1.07]
Total (95% CI) 51,257 51,276 100% 0.95 [0.89, 1.02]Total events 1,404 1,483 Heterogeneity: Tau² = 0.00; Chi² = 8.96, df = 10 (P = 0.54); I² = 0%Test for overall effect: Z = 1.41 (P = 0.16) 0.2 0.5 1 2 5
Favours vitamin E Favours control
Vitamin E ControlWeight
Risk RatioM-H, Random, 95% CI
Risk RatioM-H, Random, 95%CI in CVD mortality risk
Study or SubgroupStephens et al., 1996 - CHAOSGISSI-Prevenzione Investigators 1999Boaz et al., 2000 - SPACEde Gaetano et al., 2001 - PPPLee et al., 2005 - WHSLonn et al., 2005 - HOPE & HOPE-TOOMagliano et al., 2006 - MAVETCook et al., 2007 - WACSSesso et al., 2008 - PHS IIMilman et al., 2008Lippman et al., 2009 - SELECT
Total (95% CI)Total eventsHeterogeneity: Tau² = 0.00; Chi² = 8.96, df = 10 (P = 0.54); I² = 0%Test for overall effect: Z = 1.41 (P = 0.16)
Events27
3109
22106482
2193131
3119
1404
Total10355660
972231
199374761205
40833659726
8863
51257
Events23
3291526
140475
4202122
5142
1483
Total967
566499
226419939
4780204
40883653
7088910
51276
Weight1.7%
22.1%0.8%1.6%7.9%
34.8%0.2%
13.6%8.6%0.2%8.6%
100.0%
M-H, Random, 95% CI1.10 [0.63, 1.90]0.94 [0.81, 1.10]0.61 [0.28, 1.33]0.86 [0.49, 1.51]0.76 [0.59, 0.97]1.02 [0.90, 1.15]0.50 [0.09, 2.69]0.96 [0.79, 1.16]1.07 [0.84, 1.37]0.59 [0.14, 2.44]0.84 [0.66, 1.07]
0.95 [0.89, 1.02]
Year19961999200020012005200520062007200820082009
Vitamin E Control Risk Ratio Risk RatioM-H, Random, 95% CI
0.2 0.5 1 2 5Favours vitamin E Favours control
Supplementary Figure 42. Forest plot of vitamin E supplementation and CVD mortality risk. M-H, Manthel-Haenszel, CVD, cardiovascular disease. The diamond represents the pooled risk estimate. Inter-study heterogeneity was tested using the Cochran Q statistic (Chi2) at a significance level of P < 0.10, and quantified by the I2 statistic. An I2 value ≥ 50% is considered to indicate substantial heterogeneity. All results are presented as risk ratios with 95% Confidence Intervals, using the Manthel-Haenszel method with random effects model.
Risk Ratio Risk RatioSubgroup and Study, Year Events Total Events Total Weight M-H, Random, 95% CI M-H, Random, 95% CI in CHD mortality riskRCTsVirtamo et al., 1998 - ATBC 212 6,820 238 6,849 46.0% 0.89 [0.75, 1.07]GISSI-Prevenzione Investigators 1999 247 5,660 273 5,664 54.0% 0.91 [0.77, 1.07]
Total (95% CI) 12,480 12,513 100% 0.90 [0.80, 1.02]Total events 459 511 Heterogeneity: Tau² = 0.00; Chi² = 0.01, df = 1 (P = 0.92); I² = 0%Test for overall effect: Z = 1.67 (P = 0.10) 0.85 0.9 1 1.1 1.2
Favours vitamin E Favours control
Vitamin E Control
Study or SubgroupVirtamo et al., 1998 - ATBCGISSI-Prevenzione Investigators 1999
Total (95% CI)Total eventsHeterogeneity: Tau² = 0.00; Chi² = 0.01, df = 1 (P = 0.92); I² = 0%Test for overall effect: Z = 1.67 (P = 0.10)
Events212247
459
Total68205660
12480
Events238273
511
Total68495664
12513
Weight46.0%54.0%
100.0%
M-H, Random, 95% CI0.89 [0.75, 1.07]0.91 [0.77, 1.07]
0.90 [0.80, 1.02]
Year19981999
Vitamin E Control Risk Ratio Risk RatioM-H, Random, 95% CI
0.5 0.7 1 1.5 2Favours Vitamin E Favours Control
Supplementary Figure 43. Forest plot of vitamin E supplementation and CHD mortality risk. M-H, Manthel-Haenszel, CHD, coronary heart disease. The diamond represents the pooled risk estimate. Inter-study heterogeneity was tested using the Cochran Q statistic (Chi2) at a significance level of P < 0.10, and quantified by the I2 statistic. An I2 value ≥ 50% is considered to indicate substantial heterogeneity. All results are presented as risk ratios with 95% Confidence Intervals, using the Manthel-Haenszel method with random effects model.
99
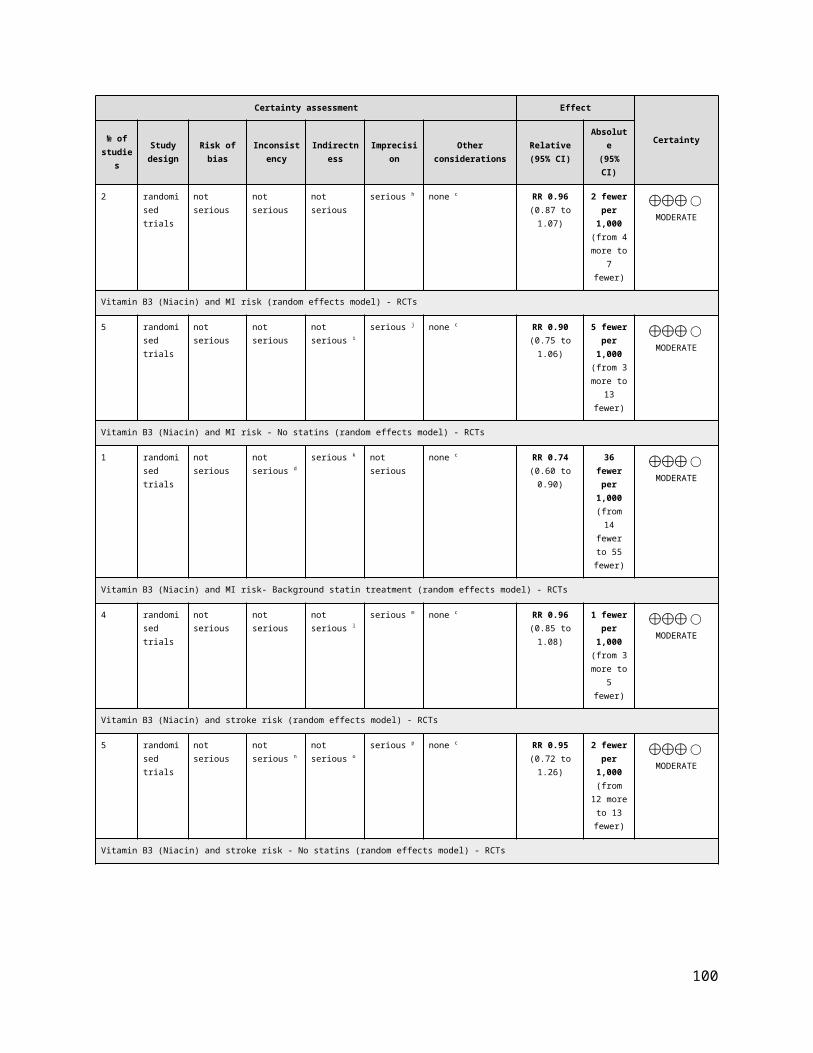
Subgroup and Study, Year Events Total Events TotalRCTsStephens et al., 1996 - CHAOS 18 1,035 13 967 5.1% 1.29 [0.64, 2.63]GISSI-Prevenzione Investigators 1999 228 5,660 251 5,664 82.3% 0.91 [0.76, 1.08]Boaz et al., 2000 - SPACE 2 97 8 99 1.1% 0.26 [0.06, 1.17]de Gaetano et al., 2001 - PPP 3 2,231 7 2,264 1.4% 0.43 [0.11, 1.68]Hodis et al., 2002 - VEAPS 1 177 1 176 0.3% 0.99 [0.06, 15.77]Lee et al., 2005 - WHS 12 19,937 14 19,939 4.3% 0.86 [0.40, 1.85]Cook et al., 2007 - WACS 18 4,083 16 4,088 5.6% 1.13 [0.58, 2.21]
Total (95% CI) 33,220 33,197 100% 0.91 [0.78, 1.07]Total events 282 310 Heterogeneity: Tau² = 0.00; Chi² = 5.19, df = 6 (P = 0.52); I² = 0%Test for overall effect: Z = 1.13 (P = 0.26) 0.1 0.2 0.5 1 2 5 10
Favours vitamin E Favours control
Vitamin E ControlWeight
Risk RatioM-H, Random, 95% CI
Risk RatioM-H, Random, 95%CI in MI mortality risk
Study or SubgroupStephens et al., 1996 - CHAOSGISSI-Prevenzione Investigators 1999Boaz et al., 2000 - SPACEde Gaetano et al., 2001 - PPPHodis et al., 2002 - VEAPSLee et al., 2005 - WHSCook et al., 2007 - WACS
Total (95% CI)Total eventsHeterogeneity: Tau² = 0.00; Chi² = 5.19, df = 6 (P = 0.52); I² = 0%Test for overall effect: Z = 1.13 (P = 0.26)
Events18
228231
1218
282
Total10355660
972231
17719937
4083
33220
Events13
251871
1416
310
Total967
566499
2264176
199394088
33197
Weight5.1%
82.3%1.1%1.4%0.3%4.3%5.6%
100.0%
M-H, Random, 95% CI1.29 [0.64, 2.63]0.91 [0.76, 1.08]0.26 [0.06, 1.17]0.43 [0.11, 1.68]
0.99 [0.06, 15.77]0.86 [0.40, 1.85]1.13 [0.58, 2.21]
0.91 [0.78, 1.07]
Year1996199920002001200220052007
Vitamin E Control Risk Ratio Risk RatioM-H, Random, 95% CI
0.1 0.2 0.5 1 2 5 10Favours Vitamin E Favours Control
Supplementary Figure 44. Forest plot of vitamin E supplementation and MI mortality risk. M-H, Manthel-Haenszel, MI, myocardial infarction. The diamond represents the pooled risk estimate. Inter-study heterogeneity was tested using the Cochran Q statistic (Chi2) at a significance level of P < 0.10, and quantified by the I2 statistic. An I2 value ≥ 50% is considered to indicate substantial heterogeneity. All results are presented as risk ratios with 95% Confidence Intervals, using the Manthel-Haenszel method with random effects model.
Subgroup and Study, Year Events Total Events TotalRCTsStephens et al., 1996 - CHAOS 1 1,035 1 967 2.0% 0.93 [0.06, 14.92]de Gaetano et al., 2001 - PPP 2 2,231 5 2,264 5.6% 0.41 [0.08, 2.09]Lee et al., 2005 - WHS 21 19,937 24 19,939 43.8% 0.88 [0.49, 1.57]Cook et al., 2007 - WACS 18 4,083 15 4,088 32.1% 1.20 [0.61, 2.38]Lippman et al., 2009 - SELECT 9 8,863 8 8,910 16.6% 1.13 [0.44, 2.93]
Total (95% CI) 36,149 36,168 100% 0.97 [0.66, 1.43]Total events 51 53 Heterogeneity: Tau² = 0.00; Chi² = 1.68, df = 4 (P = 0.79); I² = 0%Test for overall effect: Z = 0.16 (P = 0.88) 0.05 0.2 1 5 20
Favours vitamin E Favours control
Vitamin E ControlWeight
Risk RatioM-H, Random, 95% CI
Risk RatioM-H, Random, 95%CI in stroke mortality risk
Study or SubgroupStephens et al., 1996 - CHAOSde Gaetano et al., 2001 - PPPLee et al., 2005 - WHSCook et al., 2007 - WACSLippman et al., 2009 - SELECT
Total (95% CI)Total eventsHeterogeneity: Tau² = 0.00; Chi² = 1.68, df = 4 (P = 0.79); I² = 0%Test for overall effect: Z = 0.16 (P = 0.88)
Events12
2118
9
51
Total10352231
1993740838863
36149
Events15
2415
8
53
Total967
226419939
40888910
36168
Weight2.0%5.6%
43.8%32.1%16.6%
100.0%
M-H, Random, 95% CI0.93 [0.06, 14.92]
0.41 [0.08, 2.09]0.88 [0.49, 1.57]1.20 [0.61, 2.38]1.13 [0.44, 2.93]
0.97 [0.66, 1.43]
Year19962001200520072009
Vitamin E Control Risk Ratio Risk RatioM-H, Random, 95% CI
0.05 0.2 1 5 20Favours vitamin E Favours control
Supplementary Figure 45. Forest plot of vitamin E supplementation and stroke mortality risk. M-H, Manthel-Haenszel. The diamond represents the pooled risk estimate. Inter-study heterogeneity was tested using the Cochran Q statistic (Chi2) at a significance level of P < 0.10, and quantified by the I2 statistic. An I2 value ≥ 50% is considered to indicate substantial heterogeneity. All results are presented as risk ratios with 95% Confidence Intervals, using the Manthel-Haenszel method with random effects model.
100

Subgroup and Study, Year Events Total Events TotalRCTsde la Maza et al., 1995 5 37 4 37 0.1% 1.25 [0.36, 4.29]Stephens et al., 1996 - CHAOS 36 1,035 26 967 0.6% 1.29 [0.79, 2.13]Sano et al., 1997 - ADCS 12 85 12 84 0.3% 0.99 [0.47, 2.07]Gillilan et al., 1997 2 26 2 26 0.0% 1.00 [0.15, 6.57]Shoulson et al., 1998 - DATATOP 73 399 64 401 1.6% 1.15 [0.84, 1.56]GISSI-Prevenzione Investigators 1999 488 5,660 529 5,664 11.0% 0.92 [0.82, 1.04]Hoffman et al., 1999* 1 27 0 12 0.0% 1.39 [0.06, 31.93]Salonen et al., 2000 - ASAP 3 130 1 130 0.0% 3.00 [0.32, 28.47]Boaz et al., 2000 - SPACE 31 97 29 99 0.9% 1.09 [0.72, 1.66]de Gaetano et al., 2001 - PPP 72 2,231 68 2,264 1.4% 1.07 [0.78, 1.49]Desnuelle et al., 2001 - ALSRT 34 144 35 144 0.9% 0.97 [0.64, 1.47]de Waart et al., 2001 0 109 1 109 0.0% 0.33 [0.01, 8.09]Wluka et al., 2002 1 67 0 69 0.0% 3.09 [0.13, 74.50]Graat et al., 2002 3 164 5 153 0.1% 0.56 [0.14, 2.30]Hodis et al., 2002 - VEAPS 2 177 1 176 0.0% 1.99 [0.18, 21.73]Virtamo et al., 2003 - ATBC 868 7,286 851 7,287 19.3% 1.02 [0.93, 1.11]Collins et al., 2003† 1 26 1 26 0.0% 1.00 [0.07, 15.15]McNeil et al., 2004 - VECAT 11 595 7 598 0.2% 1.58 [0.62, 4.05]Manuel-Y-Keenoy et al., 2004 - DATOR 1 12 - 12 0.0% 3.00 [0.13, 67.06]Meydani et al., 2004 39 311 44 306 0.9% 0.87 [0.58, 1.30]Lonn et al., 2005 - HOPE & HOPE-TOO 799 4,761 801 4,780 19.0% 1.00 [0.92, 1.10]Graf et al., 2005 31 83 28 77 0.9% 1.03 [0.68, 1.54]Peterson et al., 2005 - ADCS 2 5 257 5 259 0.1% 1.01 [0.30, 3.44]Lee et al., 2005 - WHS 636 19,937 615 19,939 12.8% 1.03 [0.93, 1.15]Bairati et al., 2006 65 194 47 190 1.5% 1.35 [0.99, 1.86]Magliano et al., 2006 - MAVET 9 205 17 204 0.2% 0.53 [0.24, 1.15]Cook et al., 2007 - WACS 502 4,083 493 4,088 11.2% 1.02 [0.91, 1.15]Milman et al., 2008 11 726 12 708 0.2% 0.89 [0.40, 2.01]Lippman et al., 2009 - SELECT 358 8,863 382 8,910 7.6% 0.94 [0.82, 1.08]Sanyal et al., 2010 - PIVENS 1 84 0 83 0.0% 2.96 [0.12, 71.75]Manning et al., 2013 0 36 1 40 0% 0.37 [0.02, 8.79]Wang et al., 2014 - PHS II 397 3,659 406 3,653 9% 0.98 [0.86, 1.11]
Total (95% CI) 61,506 61,495 100% 1.00 [0.97, 1.04]Total events 4,497 4,487 Heterogeneity: Tau² = 0.00; Chi² = 17.22, df = 31 (P = 0.98); I² = 0%Test for overall effect: Z = 0.17 (P = 0.87)
0.05 0.2 1 5 20 Favours vitamin E Favours control
Vitamin E ControlWeight
Risk RatioM-H, Random, 95% CI
Risk RatioM-H, Random, 95%CI in all-cause mortality risk
Study or Subgroupde la Maza et al., 1995Stephens et al., 1996 - CHAOSSano et al., 1997 - ADCSGillilan et al., 1997Shoulson et al., 1998 - DATATOPGISSI-Prevenzione Investigators 1999Hoffman et al., 1999Salonen et al., 2000 - ASAPBoaz et al., 2000 - SPACEde Gaetano et al., 2001 - PPPDesnuelle et al., 2001 - ALSRTde Waart et al., 2001Wluka et al., 2002Graat et al., 2002Hodis et al., 2002 - VEAPSVirtamo et al., 2003 - ATBCCollins et al., 2003McNeil et al., 2004 - VECATManuel-Y-Keenoy et al., 2004 - DATORMeydani et al., 2004Lonn et al., 2005 - HOPE & HOPE-TOOGraf et al., 2005Peterson et al., 2005 - ADCS 2Lee et al., 2005 - WHSBairati et al., 2006Magliano et al., 2006 - MAVETCook et al., 2007 - WACSMilman et al., 2008Lippman et al., 2009 - SELECTSanyal et al., 2010 - PIVENSManning et al., 2013Wang et al., 2014 - PHS II
Total (95% CI)Total eventsHeterogeneity: Tau² = 0.00; Chi² = 17.22, df = 31 (P = 0.98); I² = 0%Test for overall effect: Z = 0.17 (P = 0.87)
Events5
3612
273
48813
317234
0132
8681
111
39799
315
63665
9502
11358
10
397
4497
Total37
10358526
3995660
27130
972231
144109
67164177
728626
59512
3114761
83257
19937194205
4083726
88638436
3659
61506
Events4
2612
264
52901
296835
1051
851170
44801
285
6154717
49312
38201
406
4487
Total37
9678426
4015664
12130
992264
144109
69153176
728726
59812
3064780
77259
19939190204
4088708
89108340
3653
61495
Weight0.1%0.6%0.3%0.0%1.6%
11.0%0.0%0.0%0.9%1.4%0.9%0.0%0.0%0.1%0.0%
19.3%0.0%0.2%0.0%0.9%
19.0%0.9%0.1%
12.8%1.5%0.2%
11.2%0.2%7.6%0.0%0.0%8.9%
100.0%
M-H, Random, 95% CI1.25 [0.36, 4.29]1.29 [0.79, 2.13]0.99 [0.47, 2.07]1.00 [0.15, 6.57]1.15 [0.84, 1.56]0.92 [0.82, 1.04]
1.39 [0.06, 31.93]3.00 [0.32, 28.47]
1.09 [0.72, 1.66]1.07 [0.78, 1.49]0.97 [0.64, 1.47]0.33 [0.01, 8.09]
3.09 [0.13, 74.50]0.56 [0.14, 2.30]
1.99 [0.18, 21.73]1.02 [0.93, 1.11]
1.00 [0.07, 15.15]1.58 [0.62, 4.05]
3.00 [0.13, 67.06]0.87 [0.58, 1.30]1.00 [0.92, 1.10]1.03 [0.68, 1.54]1.01 [0.30, 3.44]1.03 [0.93, 1.15]1.35 [0.99, 1.86]0.53 [0.24, 1.15]1.02 [0.91, 1.15]0.89 [0.40, 2.01]0.94 [0.82, 1.08]
2.96 [0.12, 71.75]0.37 [0.02, 8.79]0.98 [0.86, 1.11]
1.00 [0.97, 1.04]
Year19951996199719971998199919992000200020012001200120022002200220032003200420042004200520052005200520062006200720082009201020132014
Vitamin E Control Risk Ratio Risk RatioM-H, Random, 95% CI
0.05 0.2 1 5 20Favours vitamin E Favours control
Supplementary Figure 46. Forest plot of vitamin E supplementation and all-cause mortality. M-H, Manthel-Haenszel. *Hoffman et al., 1999 - data taken from Curtis et al., 2014; †Collins et al., 2003 - data taken from Curtis et al., 2014. The diamond represents the pooled risk estimate. Inter-study heterogeneity was tested using the Cochran Q statistic (Chi2) at a significance level of P < 0.10, and quantified by the I2 statistic. An I2 value ≥ 50% is considered to indicate substantial heterogeneity. All results are presented as risk ratios with 95% Confidence Intervals, using the Manthel-Haenszel method with random effects model.
101
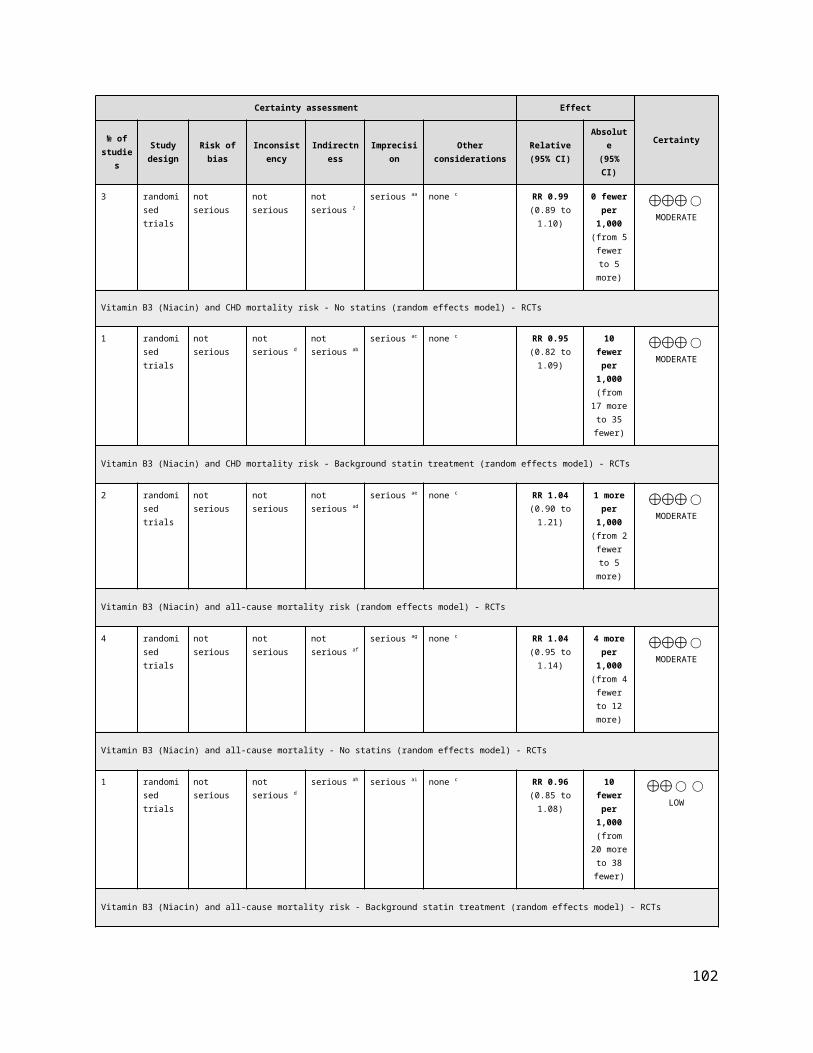
Supplementary Figure 47. Funnel plot of vitamin E supplementation and and CVD and all-cause mortality outcomes: (A) total CVD risk, (B) MI risk, (C) stroke risk, (D) CVD mortality risk and (E) all-cause mortality risk. The vertical line represents the pooled effect estimate expressed as a RR. Dashed lines represent pseudo-95% confidence intervals (CI). The circles represent risk estimates for each study, and the horizontal lines represent standard errors of the RR. We were unable to test for funnel plot asymmetry for other CVD outcomes (<10 RCTs).
102

Random Effects
Comparison RCTs N Events RR (95% CIs) RR (95% CIs) I2 p -valueCVDTotal CVD 2 15,497 1,459 0.99 [0.90, 1.10] 0% 0.89Total CHD 1 8,171 999 1.04 [0.93, 1.17] N/A 0.49MI 2 15,497 545 0.96 [0.81, 1.14] 6% 0.62Stroke 2 15,497 525 0.92 [0.78, 1.09] 0% 0.33Total CVD mortality 2 15,497 646 1.07 [0.92, 1.25] 0% 0.35MI mortality 1 8,171 34 0.79 [0.40, 1.55] N/A 0.49Stroke mortality 1 8,171 33 0.83 [0.42, 1.65] N/A 0.60
ALL-CAUSE MORTALITY
All-cause mortality 4 16,004 1,819 1.02 [0.94, 1.11] 0% 0.63
Favours vitamin C/ Favours control/ Negative association Positive association
Pooled Effect Estimates
0.0 0.5 1.0 1.5 2.0
Supplementary Figure 48. Summary of the pooled effect estimates of RCTs assessing the relationship between vitamin C supplementation and CVD and all-cause mortality risk. RR, risk ratio; CIs, confidence intervals; RTCs, randomized clinical trials; CVD, cardiovascular disease; CHD, coronary heart disease; MI, myocardial infarction; N/A, not applicable. The diamonds represents the pooled risk estimate. Inter-study heterogeneity was tested using the Cochran Q statistic (Chi2) at a significance level of P < 0.10, and quantified by the I2 statistic. An I2 value ≥ 50% is considered to indicate substantial heterogeneity. All results are presented as risk ratios with 95% CIs, using the Manthel-Haenszel method with random effects model.
Subgroup and Study, Year Events Total Events TotalRCTsCook et al., 2007 - WACS 419 4,087 415 4,084 57.6% 1.01 [0.89, 1.15]Sesso et al., 2008 - PHS II* 309 3,673 316 3,653 42.4% 0.97 [0.84, 1.13]
Total (95% CI) 7,760 7,737 100% 0.99 [0.90, 1.10]Total events 728 731 Heterogeneity: Tau² = 0.00; Chi² = 0.13, df = 1 (P = 0.72); I² = 0%Test for overall effect: Z = 0.13 (P = 0.89) 0.5 0.7 1 1.5 2
Favours vitamin C Favours control
Vitamin C ControlWeight
Risk RatioM-H, Random, 95% CI
Risk RatioM-H, Random, 95% CI in total CVD risk
Study or SubgroupCook et al., 2007 - WACSSesso et al., 2008 - PHS II
Total (95% CI)Total eventsHeterogeneity: Tau² = 0.00; Chi² = 0.13, df = 1 (P = 0.72); I² = 0%Test for overall effect: Z = 0.13 (P = 0.89)
Events419309
728
Total40873673
7760
Events415316
731
Total40843653
7737
Weight57.6%42.4%
100.0%
M-H, Random, 95% CI1.01 [0.89, 1.15]0.97 [0.84, 1.13]
0.99 [0.90, 1.10]
Vitamin C Control Risk Ratio Risk RatioM-H, Random, 95% CI
0.5 0.7 1 1.5 2Favours vitamin C Favours control
Supplementary Figure 49. Forest plot of vitamin C supplementation and total CVD risk. M-H, Manthel-Haenszel, CVD, cardiovascular disease. *Sesso et al., 2008 - Data taken from most updated trial data from Wang et al., 2014. The diamond represents the pooled risk estimate. Inter-study heterogeneity was tested using the Cochran Q statistic (Chi2) at a significance level of P < 0.10, and quantified by the I2 statistic. An I2 value ≥ 50% is considered to indicate substantial heterogeneity. All results are presented as risk ratios with 95% Confidence Intervals, using the Manthel-Haenszel method with random effects model.
103
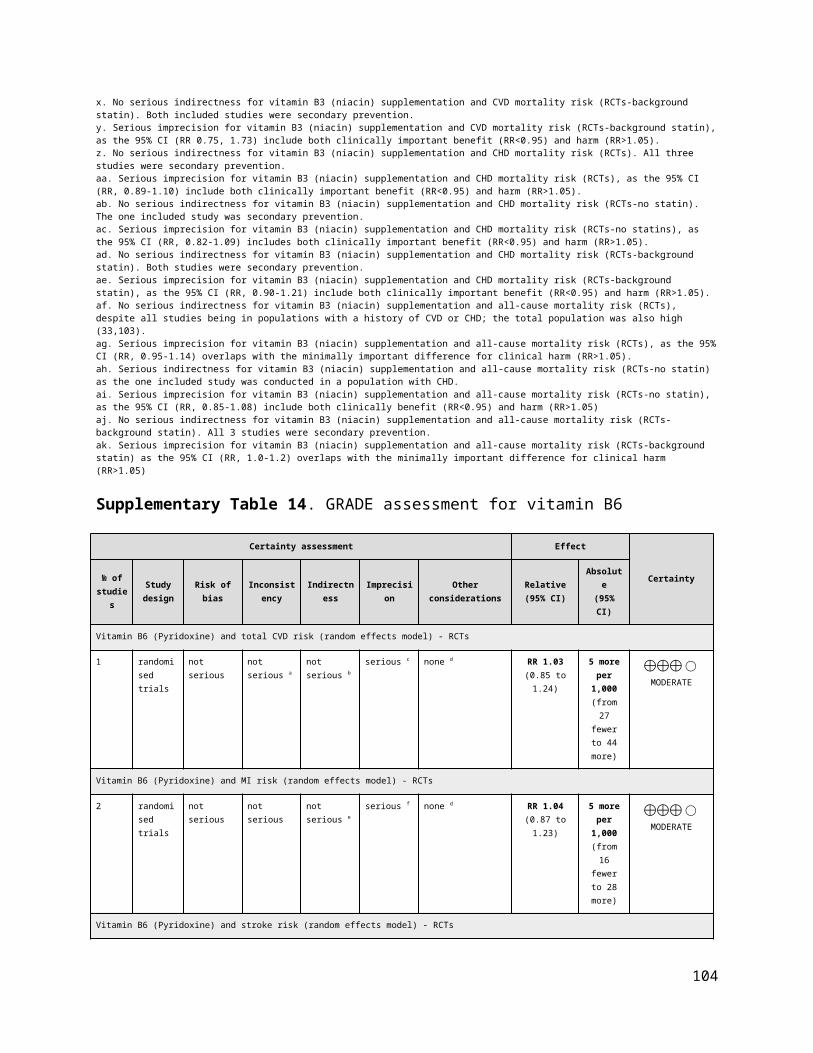
Subgroup and Study, Year Events Total Events TotalRCTsCook et al., 2007 - WACS 510 4,087 489 4,084 100% 1.04 [0.93, 1.17]
Total (95% CI) 4,087 4,084 100% 1.04 [0.93, 1.17]Total events 510 489 Heterogeneity: Not applicable 0.5 0.7 1 1.5 2Test for overall effect: Z = 0.70 (P = 0.49) Favours vitamin C Favours control
Vitamin C ControlWeight
Risk RatioM-H, Random, 95% CI
Risk RatioM-H, Random, 95% CI in CHD risk
Study or SubgroupCook et al., 2007 - WACS
Total (95% CI)Total eventsHeterogeneity: Not applicableTest for overall effect: Z = 0.70 (P = 0.49)
Events510
510
Total4087
4087
Events489
489
Total4084
4084
Weight100.0%
100.0%
M-H, Random, 95% CI1.04 [0.93, 1.17]
1.04 [0.93, 1.17]
Year2007
Vitamin C Control Risk Ratio Risk RatioM-H, Random, 95% CI
0.5 0.7 1 1.5 2Favours vitamin C Favours control
Supplementary Figure 50. Forest plot of vitamin C supplementation and total CHD risk. M-H, Manthel-Haenszel, CHD, coronary heart disease. The diamond represents the pooled risk estimate. Inter-study heterogeneity was tested using the Cochran Q statistic (Chi2) at a significance level of P < 0.10, and quantified by the I2 statistic. An I2 value ≥ 50% is considered to indicate substantial heterogeneity. All results are presented as risk ratios with 95% Confidence Intervals, using the Manthel-Haenszel method with random effects model.
Subgroup and Study, Year Events Total Events TotalRCTsCook et al., 2007 - WACS 140 4,087 134 4,084 50.3% 1.04 [0.83, 1.32]Sesso et al., 2008 - PHS II* 127 3,673 144 3,653 49.7% 0.88 [0.69, 1.11]
Total (95% CI) 7,760 7,737 100% 0.96 [0.81, 1.14]Total events 267 278 Heterogeneity: Tau² = 0.00; Chi² = 1.07, df = 1 (P = 0.30); I² = 6%Test for overall effect: Z = 0.50 (P = 0.62) 0.5 0.7 1 1.5 2
Favours vitamin C Favours control
Vitamin C ControlWeight
Risk RatioM-H, Random, 95% CI
Risk RatioM-H, Random, 95% CI in MI risk
Study or SubgroupCook et al., 2007 - WACSSesso et al., 2008 - PHS II
Total (95% CI)Total eventsHeterogeneity: Tau² = 0.00; Chi² = 1.07, df = 1 (P = 0.30); I² = 6%Test for overall effect: Z = 0.50 (P = 0.62)
Events140127
267
Total40873673
7760
Events134144
278
Total40843653
7737
Weight50.3%49.7%
100.0%
M-H, Random, 95% CI1.04 [0.83, 1.32]0.88 [0.69, 1.11]
0.96 [0.81, 1.14]
Year20072008
Vitamin C Control Risk Ratio Risk RatioM-H, Random, 95% CI
0.5 0.7 1 1.5 2Favours vitamin C Favours control
Supplementary Figure 51. Forest plot of vitamin C supplementation and MI risk. M-H, Manthel-Haenszel, MI, myocardial infarction. *Sesso et al., 2008 - Data taken from most updated trial data from Wang et al., 2014. The diamond represents the pooled risk estimate. Inter-study heterogeneity was tested using the Cochran Q statistic (Chi2) at a significance level of P < 0.10, and quantified by the I2 statistic. An I2 value ≥ 50% is considered to indicate substantial heterogeneity. All results are presented as risk ratios with 95% Confidence Intervals, using the Manthel-Haenszel method with random effects model.
Subgroup and Study, Year Events Total Events TotalRCTsCook et al., 2007 - WACS 138 4,087 160 4,084 56.8% 0.86 [0.69, 1.08]Sesso et al., 2008 - PHS II* 114 3,673 113 3,653 43.2% 1.00 [0.78, 1.30]
Total (95% CI) 7,760 7,737 100% 0.92 [0.78, 1.09]Total events 252 273Heterogeneity: Tau² = 0.00; Chi² = 0.77, df = 1 (P = 0.38); I² = 0%Test for overall effect: Z = 0.97 (P = 0.33) 0.5 0.7 1 1.5 2
Favours vitamin C Favours control
Vitamin C ControlWeight
Risk RatioM-H, Random, 95% CI
Risk RatioM-H, Random, 95% CI in stroke risk
Study or SubgroupCook et al., 2007 - WACSSesso et al., 2008 - PHS II
Total (95% CI)Total eventsHeterogeneity: Tau² = 0.00; Chi² = 0.77, df = 1 (P = 0.38); I² = 0%Test for overall effect: Z = 0.97 (P = 0.33)
Events138114
252
Total40873673
7760
Events160113
273
Total40843653
7737
Weight56.8%43.2%
100.0%
M-H, Random, 95% CI0.86 [0.69, 1.08]1.00 [0.78, 1.30]
0.92 [0.78, 1.09]
Year20072008
Vitamin C Control Risk Ratio Risk RatioM-H, Random, 95% CI
0.5 0.7 1 1.5 2Favours vitamin C Favours control
Supplementary Figure 52. Forest plot of vitamin C supplementation and stroke risk. M-H, Manthel-Haenszel. *Sesso et al., 2008 - Data taken from most updated trial data from Wang et al., 2014. The diamond represents the pooled risk estimate. Inter-study heterogeneity was tested using the Cochran Q statistic (Chi2) at a significance level of P < 0.10, and quantified by the I2 statistic. An I2 value ≥ 50% is considered to indicate substantial heterogeneity. All results are presented as risk ratios with 95% Confidence Intervals, using the Manthel-Haenszel method with random effects model.
104

Subgroup and Study, Year Events Total Events TotalRCTsCook et al., 2007 - WACS 206 4,087 189 4,084 61.5% 1.09 [0.90, 1.32]Sesso et al., 2008 - PHS II* 129 3,673 122 3,653 38.5% 1.05 [0.82, 1.34]
Total (95% CI) 7,760 7,737 100% 1.07 [0.92, 1.25]Total events 335 311 Heterogeneity: Tau² = 0.00; Chi² = 0.05, df = 1 (P = 0.82); I² = 0%Test for overall effect: Z = 0.93 (P = 0.35) 0.5 0.7 1 1.5 2
Favours vitamin C Favours control
Vitamin C ControlWeight
Risk RatioM-H, Random, 95% CI
Risk RatioM-H, Random, 95% CI in CVD mortality risk
Study or SubgroupCook et al., 2007 - WACSSesso et al., 2008 - PHS II
Total (95% CI)Total eventsHeterogeneity: Tau² = 0.00; Chi² = 0.05, df = 1 (P = 0.82); I² = 0%Test for overall effect: Z = 0.93 (P = 0.35)
Events206129
335
Total40873673
7760
Events189122
311
Total40843653
7737
Weight61.5%38.5%
100.0%
M-H, Random, 95% CI1.09 [0.90, 1.32]1.05 [0.82, 1.34]
1.07 [0.92, 1.25]
Year20072008
Vitamin C Control Risk Ratio Risk RatioM-H, Random, 95% CI
0.5 0.7 1 1.5 2Favours vitamin C Favours control
Supplementary Figure 53. Forest plot of vitamin C supplementation and CVD mortality risk. M-H, Manthel-Haenszel, CVD, cardiovascular disease. *Sesso et al., 2008 - Data taken from most updated trial data from Wang et al., 2014. The diamond represents the pooled risk estimate. Inter-study heterogeneity was tested using the Cochran Q statistic (Chi2) at a significance level of P < 0.10, and quantified by the I2 statistic. An I2 value ≥ 50% is considered to indicate substantial heterogeneity. All results are presented as risk ratios with 95% Confidence Intervals, using the Manthel-Haenszel method with random effects model.
Subgroup and Study, Year Events Total Events TotalRCTsCook et al., 2007 - WACS 15 4,087 19 4,084 100.0% 0.79 [0.40, 1.55]
Total (95% CI) 4,087 4,084 100% 0.79 [0.40, 1.55]Total events 15 19 Heterogeneity: Not applicable 0.02 0.1 1 10 50Test for overall effect: Z = 0.69 (P = 0.49) Favours vitamin C Favours control
Vitamin C ControlWeight
Risk RatioM-H, Random, 95% CI
Risk RatioM-H, Random, 95% CI in MI mortality risk
Study or SubgroupCook et al., 2007 - WACS
Total (95% CI)Total eventsHeterogeneity: Not applicableTest for overall effect: Z = 0.69 (P = 0.49)
Events15
15
Total4087
4087
Events19
19
Total4084
4084
Weight100.0%
100.0%
M-H, Random, 95% CI0.79 [0.40, 1.55]
0.79 [0.40, 1.55]
Year2007
Vitamin C Control Risk Ratio Risk RatioM-H, Random, 95% CI
0.02 0.1 1 10 50Favours vitamin C Favours control
Supplementary Figure 54. Forest plot of vitamin C supplementation and MI mortality risk. M-H, Manthel-Haenszel, MI, myocardial infarction. *Sesso et al., 2008 - Data taken from most updated trial data from Wang et al., 2014. The diamond represents the pooled risk estimate. Inter-study heterogeneity was tested using the Cochran Q statistic (Chi2) at a significance level of P < 0.10, and quantified by the I2 statistic. An I2 value ≥ 50% is considered to indicate substantial heterogeneity. All results are presented as risk ratios with 95% Confidence Intervals, using the Manthel-Haenszel method with random effects model.
105
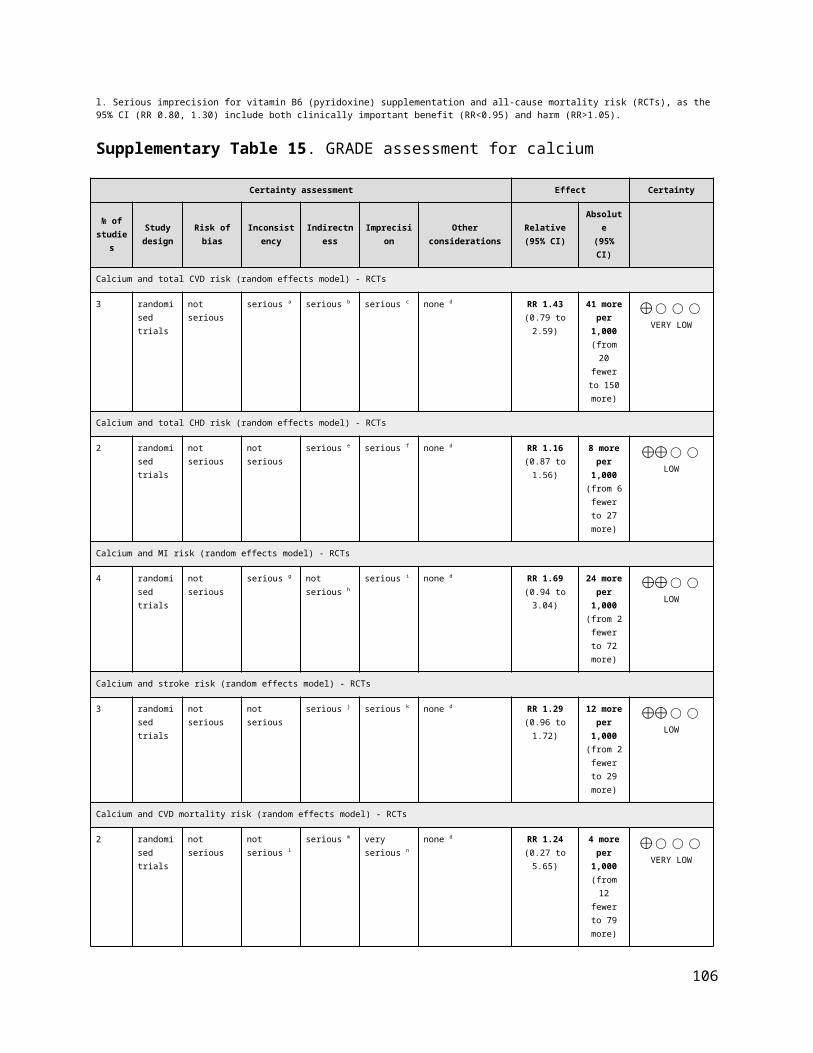
Subgroup and Study, Year Events Total Events TotalRCTsCook et al., 2007 - WACS 15 4,087 18 4,084 100.0% 0.83 [0.42, 1.65]
Total (95% CI) 4,087 4,084 100% 0.83 [0.42, 1.65]Total events 15 18 Heterogeneity: Not applicableTest for overall effect: Z = 0.52 (P = 0.60) 0.02 0.1 1 10 50
Favours vitamin C Favours control
Vitamin C ControlWeight
Risk RatioM-H, Random, 95% CI
Risk RatioM-H, Random, 95% CI in stroke mortality risk
Study or SubgroupCook et al., 2007 - WACS
Total (95% CI)Total eventsHeterogeneity: Not applicableTest for overall effect: Z = 0.52 (P = 0.60)
Events15
15
Total4087
4087
Events18
18
Total4084
4084
Weight100.0%
100.0%
M-H, Random, 95% CI0.83 [0.42, 1.65]
0.83 [0.42, 1.65]
Year2007
Vitamin C Control Risk Ratio Risk RatioM-H, Random, 95% CI
0.02 0.1 1 10 50Favours vitamin C Favours control
Supplementary Figure 55. Forest plot of vitamin C supplementation and stroke mortality risk. M-H, Manthel-Haenszel. *Sesso et al., 2008 - Data taken from most updated trial data from Wang et al., 2014. The diamond represents the pooled risk estimate. Inter-study heterogeneity was tested using the Cochran Q statistic (Chi2) at a significance level of P < 0.10, and quantified by the I2 statistic. An I2 value ≥ 50% is considered to indicate substantial heterogeneity. All results are presented as risk ratios with 95% Confidence Intervals, using the Manthel-Haenszel method with random effects model.
Subgroup and Study, Year Events Total Events TotalRCTsSalonen et al., 2000- ASAP 1 130 1 130 0.1% 1.00 [0.06, 15.82]Correa et al., 2000 2 130 0 117 0.1% 4.50 [0.22, 92.86]Cook et al., 2007 - WACS 504 4,087 491 4,084 55.0% 1.03 [0.91, 1.15]Wang et al., 2014 - PHS II 414 3,673 406 3,653 44.8% 1.01 [0.89, 1.15]
Total (95% CI) 8,020 7,984 100% 1.02 [0.94, 1.11]Total events 921 898 Heterogeneity: Tau² = 0.00; Chi² = 0.94, df = 3 (P = 0.82); I² = 0%
0.1 0.2 0.5 1 2 5 10 Favours vitamin C Favours control
Vitamin C ControlWeight
Risk RatioM-H, Random, 95% CI
Risk RatioM-H, Random, 95% CI in all-cause mortality risk
Study or SubgroupSalonen et al., 2000- ASAPCorrea et al., 2000Cook et al., 2007 - WACSWang et al., 2014 - PHS II
Total (95% CI)Total eventsHeterogeneity: Tau² = 0.00; Chi² = 0.94, df = 3 (P = 0.82); I² = 0%Test for overall effect: Z = 0.49 (P = 0.63)
Events12
504414
921
Total130130
40873673
8020
Events10
491406
898
Total130117
40843653
7984
Weight0.1%0.1%
55.0%44.8%
100.0%
M-H, Random, 95% CI1.00 [0.06, 15.82]4.50 [0.22, 92.86]
1.03 [0.91, 1.15]1.01 [0.89, 1.15]
1.02 [0.94, 1.11]
Year2000200020072014
Vitamin C Control Risk Ratio Risk RatioM-H, Random, 95% CI
0.1 0.2 0.5 1 2 5 10Favours vitamin C Favours control
Supplementary Figure 56. Forest plot of vitamin C supplementation and all-cause mortality risk. M-H, Manthel-Haenszel. The diamond represents the pooled risk estimate. Inter-study heterogeneity was tested using the Cochran Q statistic (Chi2) at a significance level of P < 0.10, and quantified by the I2 statistic. An I2 value ≥ 50% is considered to indicate substantial heterogeneity. All results are presented as risk ratios with 95% Confidence Intervals, using the Manthel-Haenszel method with random effects model.
106
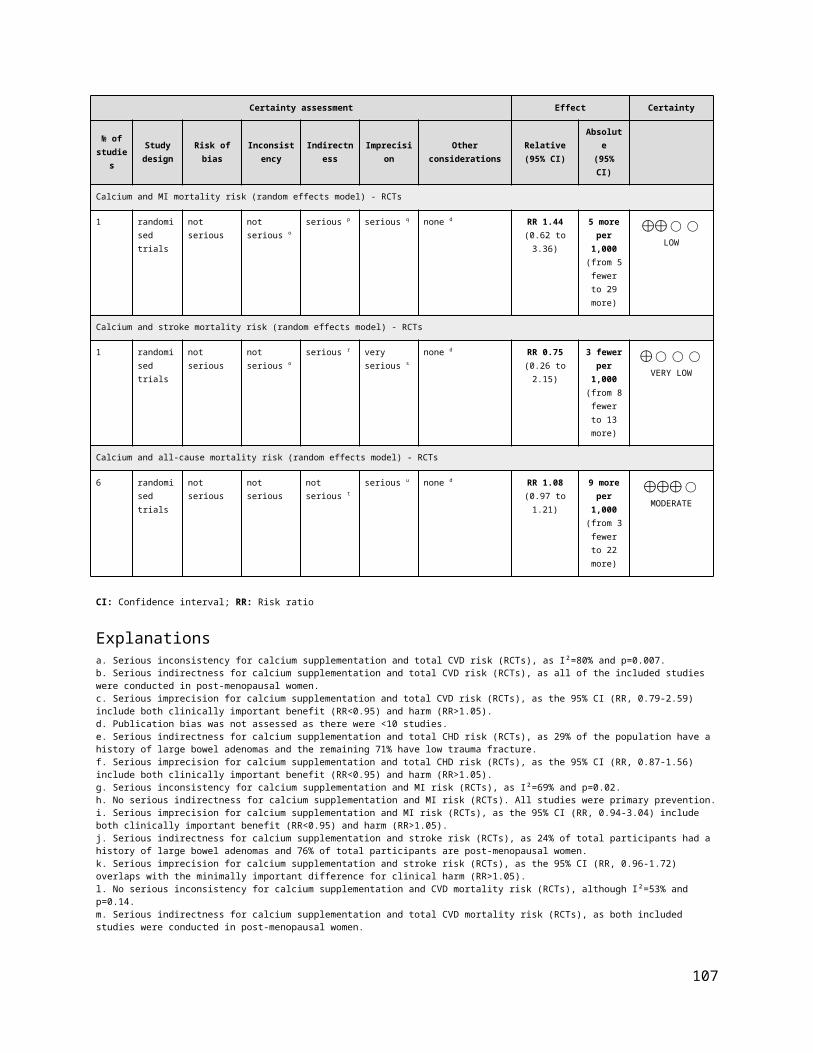
Random Effects
Comparison RCTs N Events RR (95% CIs) RR (95% CIs) I2 p -value
CVDTotal CVD 2 18,770 2,329 1.04 [0.96, 1.12] 0% 0.34
Total CHD 1 1,004 122 1.06 [0.76, 1.48] N/A 0.73
MI 2 1,085 87 0.93 [0.62, 1.39] 0% 0.72
Stroke 2 18,770 249 0.89 [0.70, 1.14] 0% 0.36
Total CVD mortality 3 18,851 346 1.00 [0.66, 1.51] 48% 1.00
MI mortality 2 1,184 18 1.21 [0.49, 2.99] 0% 0.68
Stroke mortality 1 17,766 17 1.13 [0.44, 2.93] N/A 0.80
ALL-CAUSE MORTALITY
All-cause mortality 4 19,373 992 0.99 [0.88, 1.12] 0% 0.87
Pooled Effect Estimates
Favours selenium/ Favours control/ Negative association Positive association
0.0 0.5 1.0 1.5 2.0
Supplementary Figure 57. Summary of the pooled effect estimates of RCTs assessing the relationship between selenium supplementation and CVD and all cause mortality risk. RR, risk ratio; CIs, confidence intervals; RTCs, randomized clinical trials; CVD, cardiovascular disease; CHD, coronary heart disease; MI, myocardial infarction; N/A, not applicable. The diamonds represents the pooled risk estimate. Inter-study heterogeneity was tested using the Cochran Q statistic (Chi2) at a significance level of P < 0.10, and quantified by the I2 statistic. An I2 value ≥ 50% is considered to indicate substantial heterogeneity. All results are presented as risk ratios with 95% CIs, using the Manthel-Haenszel method with random effects.
Subgroup and Study, Year Events Total Events TotalRCTsStranges et al., 2006 - NPC 103 504 96 500 9.3% 1.06 [0.83, 1.37]Lippman et al., 2009 - SELECT 1,080 8,856 1,050 8,910 90.7% 1.03 [0.96, 1.12]
Total (95% CI) 9,360 9,410 100% 1.04 [0.96, 1.12]Total events 1,183 1,146Heterogeneity: Tau² = 0.00; Chi² = 0.04, df = 1 (P = 0.83); I² = 0%Test for overall effect: Z = 0.95 (P = 0.34) 0.7 0.85 1 1.2 1.5
Favours selenium Favours control
Selenium ControlWeight
Risk RatioM-H, Random, 95% CI
Risk RatioM-H, Random, 95% CI in total CVD risk
Study or SubgroupStranges et al., 2006 - NPCLippman et al., 2009 - SELECT
Total (95% CI)Total eventsHeterogeneity: Tau² = 0.00; Chi² = 0.04, df = 1 (P = 0.83); I² = 0%Test for overall effect: Z = 0.95 (P = 0.34)
Events103
1080
1183
Total504
8856
9360
Events96
1050
1146
Total500
8910
9410
Weight9.3%
90.7%
100.0%
M-H, Random, 95% CI1.06 [0.83, 1.37]1.03 [0.96, 1.12]
1.04 [0.96, 1.12]
Year20062009
Selenium Control Risk Ratio Risk RatioM-H, Random, 95% CI
0.7 0.85 1 1.2 1.5Favours selenium Favours control
Supplementary Figure 58. Forest plot of selenium supplementation and total CVD risk. M-H, Manthel-Haenszel, CVD, cardiovascular disease. The diamond represents the pooled risk estimate. Inter-study heterogeneity was tested using the Cochran Q statistic (Chi2) at a significance level of P < 0.10, and quantified by the I2 statistic. An I2 value ≥ 50% is considered to indicate substantial heterogeneity. All results are presented as risk ratios with 95% Confidence Intervals, using the Manthel-Haenszel method with random effects model.
107

Subgroup and Study, Year Events Total Events TotalRCTsStranges et al., 2006 - NPC 63 504 59 500 100.0% 1.06 [0.76, 1.48]
Total (95% CI) 504 500 100% 1.06 [0.76, 1.48]Total events 63 59Heterogeneity: Not applicableTest for overall effect: Z = 0.34 (P = 0.73) 0.2 0.5 1 2 5
Favours selenium Favours control
Selenium ControlWeight
Risk RatioM-H, Random, 95% CI
Risk RatioM-H, Random, 95% CI in total CHD risk
Study or SubgroupStranges et al., 2006 - NPC
Total (95% CI)Total eventsHeterogeneity: Not applicableTest for overall effect: Z = 0.34 (P = 0.73)
Events63
63
Total504
504
Events59
59
Total500
500
Weight100.0%
100.0%
M-H, Random, 95% CI1.06 [0.76, 1.48]
1.06 [0.76, 1.48]
Year2006
Selenium Control Risk Ratio Risk RatioM-H, Random, 95% CI
0.2 0.5 1 2 5Favours selenium Favours control
Supplementary Figure 59. Forest plot of selenium supplementation and total CHD risk. M-H, Manthel-Haenszel, CHD, coronary heart disease. The diamond represents the pooled risk estimate. Inter-study heterogeneity was tested using the Cochran Q statistic (Chi2) at a significance level of P < 0.10, and quantified by the I2 statistic. An I2 value ≥ 50% is considered to indicate substantial heterogeneity. All results are presented as risk ratios with 95% Confidence Intervals, using the Manthel-Haenszel method with random effects model.
Subgroup and Study, Year Events Total Events TotalRCTsKorpela et al., 1989 1 40 2 41 2.9% 0.51 [0.05, 5.43]Stranges et al., 2006 - NPC 41 504 43 500 97.1% 0.95 [0.63, 1.42]
Total (95% CI) 544 541 100% 0.93 [0.62, 1.39]Total events 42 45Heterogeneity: Tau² = 0.00; Chi² = 0.25, df = 1 (P = 0.62); I² = 0%Test for overall effect: Z = 0.36 (P = 0.72) 0.05 0.2 1 5 20
Favours selenium Favours control
Selenium ControlWeight
Risk RatioM-H, Random, 95% CI
Risk RatioM-H, Random, 95% CI in MI risk
Study or SubgroupKorpela et al., 1989Stranges et al., 2006 - NPC
Total (95% CI)Total eventsHeterogeneity: Tau² = 0.00; Chi² = 0.25, df = 1 (P = 0.62); I² = 0%Test for overall effect: Z = 0.36 (P = 0.72)
Events1
41
42
Total40
504
544
Events2
43
45
Total41
500
541
Weight2.9%
97.1%
100.0%
M-H, Random, 95% CI0.51 [0.05, 5.43]0.95 [0.63, 1.42]
0.93 [0.62, 1.39]
Year19892006
Selenium Control Risk Ratio Risk RatioM-H, Random, 95% CI
0.05 0.2 1 5 20Favours selenium Favours control
Supplementary Figure 60. Forest plot of selenium supplementation and MI risk. M-H, Manthel-Haenszel, MI, myocardial infarction. The diamond represents the pooled risk estimate. Inter-study heterogeneity was tested using the Cochran Q statistic (Chi2) at a significance level of P < 0.10, and quantified by the I2 statistic. An I2 value ≥ 50% is considered to indicate substantial heterogeneity. All results are presented as risk ratios with 95% Confidence Intervals, using the Manthel-Haenszel method with random effects model.
Subgroup and Study, Year Events Total Events TotalRCTsStranges et al., 2006 - NPC 35 504 32 500 28.2% 1.09 [0.68, 1.72]Lippman et al., 2009 - SELECT 82 8,856 100 8,910 71.8% 0.82 [0.62, 1.10]
Total (95% CI) 9,360 9,410 100% 0.89 [0.70, 1.14]Total events 117 132Heterogeneity: Tau² = 0.00; Chi² = 0.97, df = 1 (P = 0.33); I² = 0%Test for overall effect: Z = 0.92 (P = 0.36) 0.1 0.2 0.5 1 2 5 10
Favours selenium Favours control
Selenium ControlWeight
Risk RatioM-H, Random, 95% CI
Risk RatioM-H, Random, 95% CI in stroke risk
Study or SubgroupStranges et al., 2006 - NPCLippman et al., 2009 - SELECT
Total (95% CI)Total eventsHeterogeneity: Tau² = 0.00; Chi² = 0.97, df = 1 (P = 0.33); I² = 0%Test for overall effect: Z = 0.92 (P = 0.36)
Events3582
117
Total504
8856
9360
Events32
100
132
Total500
8910
9410
Weight28.2%71.8%
100.0%
M-H, Random, 95% CI1.09 [0.68, 1.72]0.82 [0.62, 1.10]
0.89 [0.70, 1.14]
Year20062009
Selenium Control Risk Ratio Risk RatioM-H, Random, 95% CI
0.1 0.2 0.5 1 2 5 10Favours selenium Favours control
Supplementary Figure 61. Forest plot of selenium supplementation and stroke risk. M-H, Manthel-Haenszel. The diamond represents the pooled risk estimate. Inter-study heterogeneity was tested using the Cochran Q statistic (Chi2) at a significance level of P < 0.10, and quantified by the I2 statistic. An I2 value ≥ 50% is considered to indicate substantial heterogeneity. All results are presented as risk ratios with 95% Confidence Intervals, using the Manthel-Haenszel method with random effects model.
108

Subgroup and Study, Year Events Total Events TotalRCTsKorpela et al., 1989 0 40 4 41 2.0% 0.11 [0.01, 2.05]Stranges et al., 2006 - NPC 40 504 31 500 38.9% 1.28 [0.81, 2.01]Lippman et al., 2009 - SELECT 129 8,856 142 8,910 59.1% 0.91 [0.72, 1.16]
Total (95% CI) 9,400 9,451 100% 1.00 [0.66, 1.51]Total events 169 177Heterogeneity: Tau² = 0.06; Chi² = 3.82, df = 2 (P = 0.15); I² = 48%Test for overall effect: Z = 0.00 (P = 1.00) 0.005 0.1 1 10 200
Favours selenium Favours control
Selenium ControlWeight
Risk RatioM-H, Random, 95% CI
Risk RatioM-H, Random, 95% CI in CVD mortality risk
Study or SubgroupKorpela et al., 1989Stranges et al., 2006 - NPCLippman et al., 2009 - SELECT
Total (95% CI)Total eventsHeterogeneity: Tau² = 0.06; Chi² = 3.82, df = 2 (P = 0.15); I² = 48%Test for overall effect: Z = 0.00 (P = 1.00)
Events0
40129
169
Total40
5048856
9400
Events4
31142
177
Total41
5008910
9451
Weight2.0%
38.9%59.1%
100.0%
M-H, Random, 95% CI0.11 [0.01, 2.05]1.28 [0.81, 2.01]0.91 [0.72, 1.16]
1.00 [0.66, 1.51]
Year198920062009
Selenium Control Risk Ratio Risk RatioM-H, Random, 95% CI
0.005 0.1 1 10 200Favours Selenium Favours control
Supplementary Figure 62. Forest plot of selenium supplementation and CVD mortality risk. M-H, Manthel-Haenszel, CVD, cardiovascular disease. The diamond represents the pooled risk estimate. Inter-study heterogeneity was tested using the Cochran Q statistic (Chi2) at a significance level of P < 0.10, and quantified by the I2 statistic. An I2 value ≥ 50% is considered to indicate substantial heterogeneity. All results are presented as risk ratios with 95% Confidence Intervals, using the Manthel-Haenszel method with random effects model.
Subgroup and Study, Year Events Total Events TotalRCTsLimburg et al., 2005 1 90 0 90 8.1% 3.00 [0.12, 72.68]Stranges et al., 2006 - NPC 9 504 8 500 91.9% 1.12 [0.43, 2.87]
Total (95% CI) 594 590 100% 1.21 [0.49, 2.99]Total events 10 8Heterogeneity: Tau² = 0.00; Chi² = 0.34, df = 1 (P = 0.56); I² = 0%Test for overall effect: Z = 0.41 (P = 0.68) 0.01 0.1 1 10 100
Favours selenium Favours control
Selenium ControlWeight
Risk RatioM-H, Random, 95% CI
Risk RatioM-H, Random, 95% CI in MI mortality
Study or SubgroupLimburg et al., 2005Stranges et al., 2006 - NPC
Total (95% CI)Total eventsHeterogeneity: Tau² = 0.00; Chi² = 0.34, df = 1 (P = 0.56); I² = 0%Test for overall effect: Z = 0.41 (P = 0.68)
Events19
10
Total90
504
594
Events08
8
Total90
500
590
Weight8.1%
91.9%
100.0%
M-H, Random, 95% CI3.00 [0.12, 72.68]1.12 [0.43, 2.87]
1.21 [0.49, 2.99]
Year20052006
Selenium Control Risk Ratio Risk RatioM-H, Random, 95% CI
0.01 0.1 1 10 100Favours selenium Favours control
Supplementary Figure 63. Forest plot of selenium supplementation and MI mortality risk. M-H, Manthel-Haenszel, MI, myocardial infarction. The diamond represents the pooled risk estimate. Inter-study heterogeneity was tested using the Cochran Q statistic (Chi2) at a significance level of P < 0.10, and quantified by the I2 statistic. An I2 value ≥ 50% is considered to indicate substantial heterogeneity. All results are presented as risk ratios with 95% Confidence Intervals, using the Manthel-Haenszel method with random effects model.
Subgroup and Study, Year Events Total Events TotalRCTsLippman et al., 2009 - SELECT 9 8,856 8 8,910 100.0% 1.13 [0.44, 2.93]
Total (95% CI) 8,856 8,910 100% 1.13 [0.44, 2.93]Total events 9 8Heterogeneity: Not applicableTest for overall effect: Z = 0.26 (P = 0.80) 0.01 0.1 1 10 100
Favours selenium Favours control
Selenium ControlWeight
Risk RatioM-H, Random, 95% CI
Risk RatioM-H, Random, 95% CI in stroke mortality risk
Study or SubgroupLippman et al., 2009 - SELECT
Total (95% CI)Total eventsHeterogeneity: Not applicableTest for overall effect: Z = 0.26 (P = 0.80)
Events9
9
Total8856
8856
Events8
8
Total8910
8910
Weight100.0%
100.0%
M-H, Random, 95% CI1.13 [0.44, 2.93]
1.13 [0.44, 2.93]
Year2009
Selenium Control Risk Ratio Risk RatioM-H, Random, 95% CI
0.01 0.1 1 10 100Favours selenium Favours control
Supplementary Figure 64. Forest plot of selenium supplementation and stroke mortality risk. M-H, Manthel-Haenszel. The diamond represents the pooled risk estimate. Inter-study heterogeneity was tested using the Cochran Q statistic (Chi2) at a significance level of P < 0.10, and quantified by the I2 statistic. An I2 value ≥ 50% is considered to indicate substantial heterogeneity. All results are presented as risk ratios with 95% Confidence Intervals, using the Manthel-Haenszel method with random effects model.
109
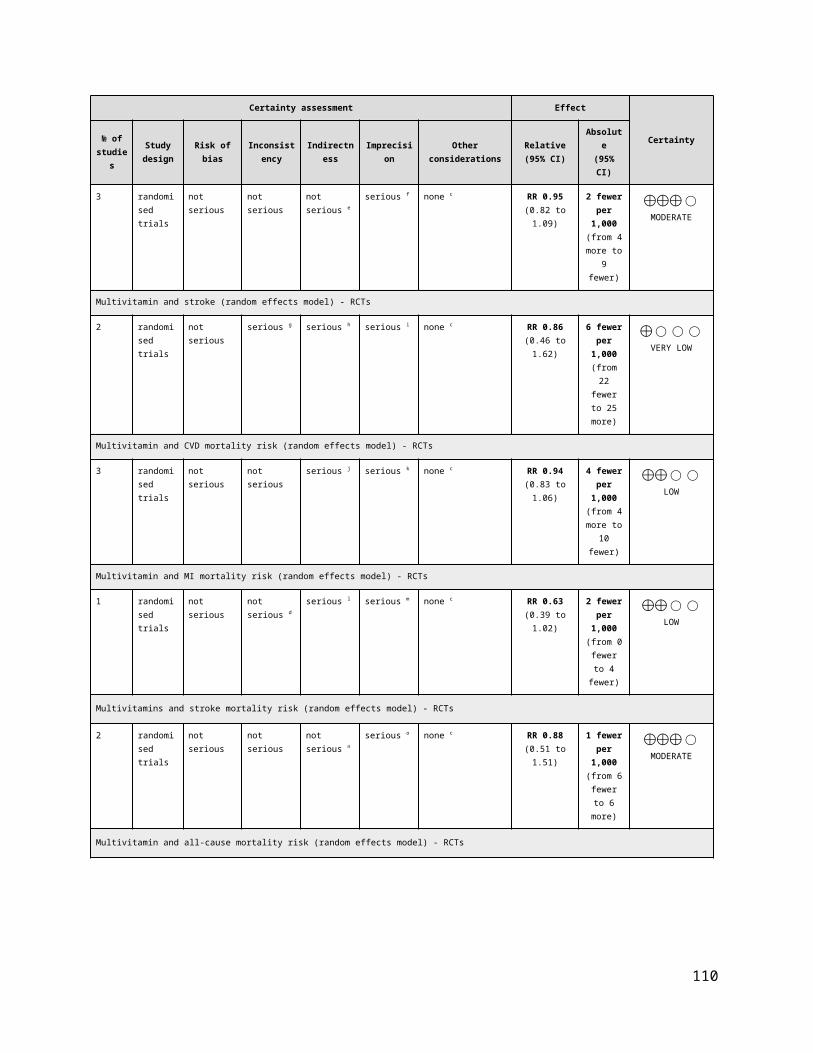
Subgroup and Study, Year Events Total Events TotalRCTsLimburg et al., 2005 1 90 0 90 0.1% 3.00 [0.12, 72.68]Stranges et al., 2006 - NPC 110 504 111 500 26.0% 0.98 [0.78, 1.24]Lippman et al., 2009 - SELECT 378 8856 382 8910 72.9% 1.00 [0.87, 1.14]Marshall et al., 2011 4 212 6 211 0.9% 0.66 [0.19, 2.32]
Total (95% CI) 9,662 9,711 100% 0.99 [0.88, 1.12]Total events 493 499Heterogeneity: Tau² = 0.00; Chi² = 0.87, df = 3 (P = 0.83); I² = 0%Test for overall effect: Z = 0.16 (P = 0.87) 0.2 0.5 1 2 5
Favours Selenium Favours control
Selenium ControlWeight
Risk RatioM-H, Random, 95% CI
Risk RatioM-H, Random, 95% CI in all-cause mortality
Study or SubgroupLImburg et al., 2005Stranges et al., 2006 - NPCLippman et al., 2009 - SELECTMarshall et al., 2011
Total (95% CI)Total eventsHeterogeneity: Tau² = 0.00; Chi² = 0.87, df = 3 (P = 0.83); I² = 0%Test for overall effect: Z = 0.16 (P = 0.87)
Events1
110378
4
493
Total90
5048856212
9662
Events0
111382
6
499
Total90
5008910211
9711
Weight0.1%
26.0%72.9%0.9%
100.0%
M-H, Random, 95% CI3.00 [0.12, 72.68]0.98 [0.78, 1.24]1.00 [0.87, 1.14]0.66 [0.19, 2.32]
0.99 [0.88, 1.12]
Year2005200620092011
Selenium Control Risk Ratio Risk RatioM-H, Random, 95% CI
0.2 0.5 1 2 5Favours Selenium Favours control
Supplementary Figure 65. Forest plot of selenium supplementation and all-cause mortality risk. M-H, Manthel-Haenszel. The diamond represents the pooled risk estimate. Inter-study heterogeneity was tested using the Cochran Q statistic (Chi2) at a significance level of P < 0.10, and quantified by the I2 statistic. An I2 value ≥ 50% is considered to indicate substantial heterogeneity. All results are presented as risk ratios with 95% Confidence Intervals, using the Manthel-Haenszel method with random effects model.
Random Effects
Comparison RCTs N Events RR (95% CIs) RR (95% CIs) I2 p -valueCVDTotal CVD 9 39,756 6,888 0.98 [0.93, 1.04] 29% 0.58Total CHD 5 20,886 3,197 1.04 [0.96, 1.14] 12% 0.32MI 13 44,285 2,875 1.00 [0.93, 1.07] 0% 1.00Stroke 12 43,339 2,067 0.90 [0.81, 1.00] 16% 0.04
Total CVD mortality 5 33,693 2,642 0.98 [0.87, 1.11] 52% 0.74Total CHD mortality 3 13,267 964 1.09 [0.97, 1.23] 0% 0.16
MI mortality 2 13,944 482 1.11 [0.93, 1.32] 0% 0.26
Stroke mortality 2 17,586 181 0.91 [0.68, 1.21] 0% 0.50
ALL-CAUSE MORTALITY
All-cause mortality 16 45,424 6,245 1.02 [0.97, 1.06] 0% 0.41
Favours B-complex/ Favours control/ Negative association Positive association
Pooled Effect Estimates
0.5 1.0 1.5
Supplementary Figure 66. Summary of the pooled effect estimates of RCTs assessing the relationship between vitamin B complex supplementation and CVD and all cause mortality risk. RR, risk ratio; CIs, confidence intervals; RTCs, randomized clinical trials; CVD, cardiovascular disease; CHD, coronary heart disease; MI, myocardial infarction; N/A, not applicable. The diamonds represents the pooled risk estimate. Inter-study heterogeneity was tested using the Cochran Q statistic (Chi2) at a significance level of P < 0.10, and quantified by the I2 statistic. An I2 value ≥ 50% is considered to indicate substantial heterogeneity. All results are presented as risk ratios with 95% CIs, using the Manthel-Haenszel method with random effects model.
110

Subgroup and Study, Year Events Total Events TotalRCTLonn et al., 2006 - HOPE-TOO 519 2,758 547 2,764 17.8% 0.95 [0.85, 1.06]Bonaa et al., 2006 - NORVIT* 201 937 172 943 8.5% 1.18 [0.98, 1.41]Albert et al., 2008 - WAFACS 205 2,721 211 2,721 8.3% 0.97 [0.81, 1.17]Hodis et al., 2009 - BVAIT† 9 254 11 252 0.5% 0.81 [0.34, 1.93]Heinz et al., 2010 83 327 98 323 5.0% 0.84 [0.65, 1.07]VITATOPS Trial Study Group 2010 616 4,089 678 4,075 19.4% 0.91 [0.82, 1.00]Galan et al., 2010 - SU.FOL.OM3 75 1,242 82 1,259 3.5% 0.93 [0.68, 1.26]Armitage et al., 2010 - SEARCH 1,537 6,033 1,493 6,031 29.7% 1.03 [0.97, 1.09]Van Dijk et al., 2015 - B-PROOF 181 1,516 170 1,511 7.50% 1.06 [0.87, 1.29]
Total (95% CI) 19,877 19,879 100% 0.98 [0.93, 1.04]Total events 3,426 3,462 Heterogeneity: Tau² = 0.00; Chi² = 11.20, df = 8 (P = 0.19); I² = 29%Test for overall effect: Z = 0.55 (P = 0.58) 0.5 0.7 1 1.5 2.0
Favours B-complex Favours control
B-complex ControlWeight
Risk RatioM-H, Random, 95% CI
Risk RatioM-H, Random, 95%CI in total CVD risk
Study or SubgroupLonn et al., 2006 - HOPE 2Bonaa et al., 2006 - NORVITAlbert et al., 2008 - WAFACSHodis et al., 2009 - BVAITHeinz et al., 2010VITATOPS Trial Study Group 2010Galan et al., 2010 - SU.FOL.OM3Armitage et al., 2010 - SEARCHVan Dijk et al., 2015 - B-PROOF
Total (95% CI)Total eventsHeterogeneity: Tau² = 0.00; Chi² = 11.20, df = 8 (P = 0.19); I² = 29%Test for overall effect: Z = 0.55 (P = 0.58)
Events519201205
983
61675
1537181
3426
Total2758
9372721
254327
4089124260331516
19877
Events547172211
1198
67882
1493170
3462
Total2764
9432721
252323
4075125960311511
19879
Weight17.8%
8.5%8.3%0.5%5.0%
19.4%3.5%
29.7%7.5%
100.0%
M-H, Random, 95% CI0.95 [0.85, 1.06]1.18 [0.98, 1.41]0.97 [0.81, 1.17]0.81 [0.34, 1.93]0.84 [0.65, 1.07]0.91 [0.82, 1.00]0.93 [0.68, 1.26]1.03 [0.97, 1.09]1.06 [0.87, 1.29]
0.98 [0.93, 1.04]
Year200620062008200920102010201020102015
B-Complex Control Risk Ratio Risk RatioM-H, Random, 95% CI
0.5 0.7 1 1.5 2Favours B-Complex Favours Control
Supplementary Figure 67. Forest plot of vitamin B complex supplementation and total CVD risk. M-H, Manthel-Haenszel, CVD, cardiovascular disease. *Bonaa et al., 2006 - folic acid, B6 and B12 vs placebo. †Hodis et al., 2009 - reported number of participants with at least one event. The diamond represents the pooled risk estimate. Inter-study heterogeneity was tested using the Cochran Q statistic (Chi2) at a significance level of P < 0.10, and quantified by the I2 statistic. An I2 value ≥ 50% is considered to indicate substantial heterogeneity. All results are presented as risk ratios with 95% Confidence Intervals, using the Manthel-Haenszel method with random effects model.
Subgroup and Study, Year Events Total Events TotalRCTLange et al., 2004 53 316 35 320 4.4% 1.53 [1.03, 2.28]Albert et al., 2008 - WAFACS 283 2,721 280 2,721 23.7% 1.01 [0.86, 1.18]Imasa et al., 2009 15 118 13 125 1.5% 1.22 [0.61, 2.46]Galan et al., 2010 - SU.FOL.OM3 49 1,242 55 1,259 4.9% 0.90 [0.62, 1.32]Armitage et al., 2010 - SEARCH 1,229 6,033 1,185 6,031 65.6% 1.04 [0.97, 1.11]
Total (95% CI) 10,430 10,456 100% 1.04 [0.96, 1.14]Total events 1,629 1,568 Heterogeneity: Tau² = 0.00; Chi² = 4.54, df = 4 (P = 0.34); I² = 12%Test for overall effect: Z = 0.99 (P = 0.32) 0.5 0.7 1 1.5 2
Favours B-complex Favours control
B-complex ControlWeight
Risk RatioM-H, Random, 95% CI
Risk RatioM-H, Random, 95%CI in total CHD risk
Study or SubgroupLange et al., 2004Albert et al., 2008 - WAFACSImasa et al., 2009Galan et al., 2010 - SU.FOL.OM3Armitage et al., 2010 - SEARCH
Total (95% CI)Total eventsHeterogeneity: Tau² = 0.00; Chi² = 4.54, df = 4 (P = 0.34); I² = 12%Test for overall effect: Z = 0.99 (P = 0.32)
Events53
2831549
1229
1629
Total316
2721118
12426033
10430
Events35
2801355
1185
1568
Total320
2721125
12596031
10456
Weight4.4%
23.7%1.5%4.9%
65.6%
100.0%
M-H, Random, 95% CI1.53 [1.03, 2.28]1.01 [0.86, 1.18]1.22 [0.61, 2.46]0.90 [0.62, 1.32]1.04 [0.97, 1.11]
1.04 [0.96, 1.14]
Year20042008200920102010
B-Complex Control Risk Ratio Risk RatioM-H, Random, 95% CI
0.5 0.7 1 1.5 2Favours B-complex Favours control
Supplementary Figure 68. Forest plot of vitamin B complex supplementation and total CHD risk. M-H, Manthel-Haenszel, CHD, coronary heart disease. The diamond represents the pooled risk estimate. Inter-study heterogeneity was tested using the Cochran Q statistic (Chi2) at a significance level of P < 0.10, and quantified by the I2 statistic. An I2 value ≥ 50% is considered to indicate substantial heterogeneity. All results are presented as risk ratios with 95% Confidence Intervals, using the Manthel-Haenszel method with random effects model.
111
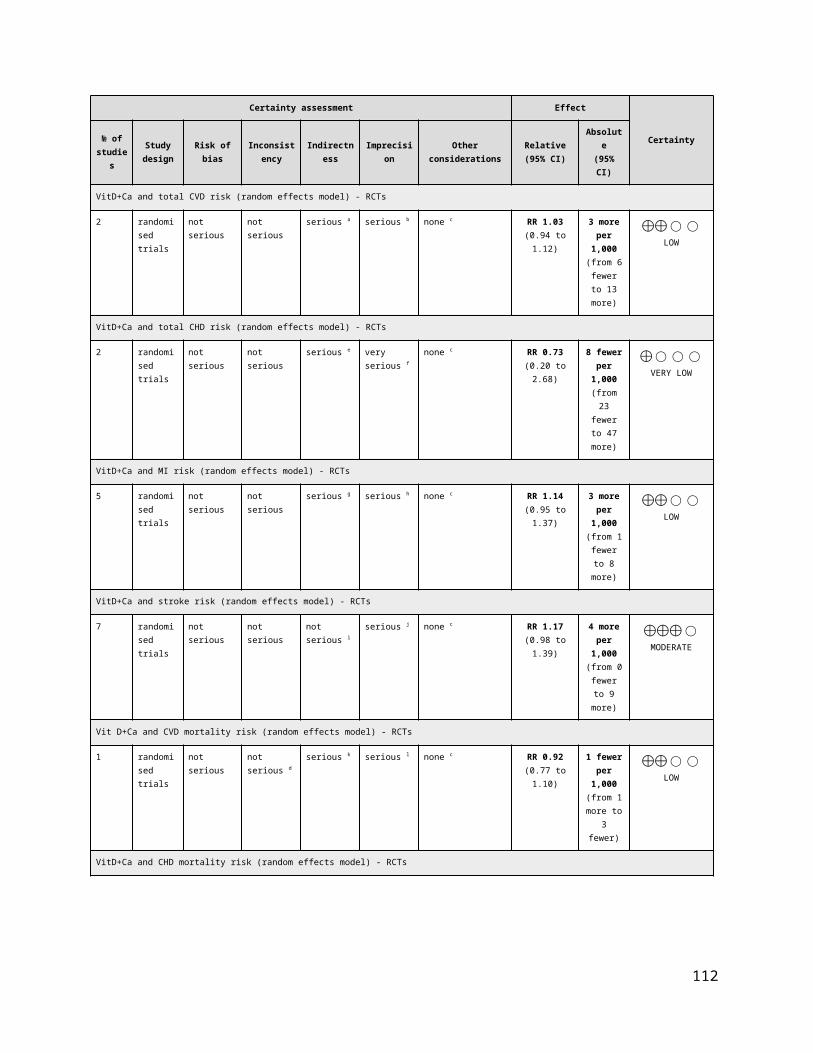
Subgroup and Study, Year Events Total Events TotalRCTsSchnyder et al., 2002 - The Swiss Heart Study 7 272 12 281 0.6% 0.60 [0.24, 1.51]Lange et al., 2004 3 316 2 320 0.2% 1.52 [0.26, 9.03]Bonaa et al., 2006 - NORVIT* 182 937 153 943 12.7% 1.20 [0.99, 1.45]Lonn et al., 2006 - HOPE-TOO 341 2,758 349 2,764 24.8% 0.98 [0.85, 1.13]Jamison et al., 2007 - HOST 129 1,032 150 1,024 10.1% 0.85 [0.69, 1.06]Albert et al., 2008 - WAFACS 65 2,721 74 2,721 4.5% 0.88 [0.63, 1.22]Ebbing et al., 2008 - WENBIT† 59 772 58 780 4.0% 1.03 [0.73, 1.46]VITATOPS Trial Study Group 2010 118 4,089 114 4,075 7.5% 1.03 [0.80, 1.33]Galan et al., 2010 - SU.FOL.OM3 28 1,242 32 1,259 1.9% 0.89 [0.54, 1.46]Armitage et al., 2010 - SEARCH 431 6,033 429 6,031 29.2% 1.00 [0.88, 1.14]House et al., 2010 - DIVINe 8 119 4 119 0.4% 2.00 [0.62, 6.46]Heinz et al., 2010 20 327 19 323 1.3% 1.04 [0.57, 1.91]Van Dijk et al., 2015 - B-PROOF 45 1,516 43 1,511 2.9% 1.04 [0.69, 1.57]
Total (95% CI) 22,134 22,151 100% 1.00 [0.93, 1.07]Total events 1,436 1,439Heterogeneity: Tau² = 0.00; Chi² = 9.06, df = 12 (P = 0.70); I² = 0%Test for overall effect: Z = 0.00 (P = 1.00) 0.5 0.7 1 1.5 2
Favours B-complex Favours control
B-complex ControlWeight
Risk RatioM-H, Random, 95% CI
Risk RatioM-H, Random, 95%CI in MI risk
Study or SubgroupSchnyder et al., 2002 - The Swiss Heart StudyLange et al., 2004Bonaa et al., 2006 - NORVITLonn et al., 2006 - HOPE 2Jamison et al., 2007 - HOSTAlbert et al., 2008 - WAFACSEbbing et al., 2008 - WENBITVITATOPS Trial Study Group 2010Galan et al., 2010 - SU.FOL.OM3Armitage et al., 2010 - SEARCHHouse et al., 2010 - DIVINeHeinz et al., 2010Van Dijk et al., 2015 - B-PROOF
Total (95% CI)Total eventsHeterogeneity: Tau² = 0.00; Chi² = 9.06, df = 12 (P = 0.70); I² = 0%Test for overall effect: Z = 0.00 (P = 1.00)
Events73
182341129
6559
11828
4318
2045
1436
Total272316937
275810322721
772408912426033
119327
1516
22134
Events12
2153349150
7458
11432
4294
1943
1439
Total281320943
276410242721
780407512596031
119323
1511
22151
Weight0.6%0.2%
12.7%24.8%10.1%
4.5%4.0%7.5%1.9%
29.2%0.4%1.3%2.9%
100.0%
M-H, Random, 95% CI0.60 [0.24, 1.51]1.52 [0.26, 9.03]1.20 [0.99, 1.45]0.98 [0.85, 1.13]0.85 [0.69, 1.06]0.88 [0.63, 1.22]1.03 [0.73, 1.46]1.03 [0.80, 1.33]0.89 [0.54, 1.46]1.00 [0.88, 1.14]2.00 [0.62, 6.46]1.04 [0.57, 1.91]1.04 [0.69, 1.57]
1.00 [0.93, 1.07]
Year2002200420062006200720082008201020102010201020102015
B-Complex Control Risk Ratio Risk RatioM-H, Random, 95% CI
0.5 0.7 1 1.5 2Favours B-Complex Favours Control
Supplementary Figure 69. Forest plot of vitamin B complex supplementation and MI risk. M-H, Manthel-Haenszel, MI, myocardial infarction. *Bonaa et al., 2006 - folic acid, B6 and B12 vs placebo. †Ebbing et al., 2008 - folic acid, B6 and B12 vs placebo. The diamond represents the pooled risk estimate. Inter-study heterogeneity was tested using the Cochran Q statistic (Chi2) at a significance level of P < 0.10, and quantified by the I2 statistic. An I2 value ≥ 50% is considered to indicate substantial heterogeneity. All results are presented as risk ratios with 95% Confidence Intervals, using the Manthel-Haenszel method with random effects model.
Subgroup and Study, Year Events Total Events TotalRCTsBonaa et al., 2006 - NORVIT* 21 937 27 943 3.3% 0.78 [0.45, 1.37]Jamison et al., 2007 - HOST 37 1,032 41 1,024 5.2% 0.90 [0.58, 1.38]Ebbing et al., 2008 - WENBIT† 11 772 19 780 2.0% 0.58 [0.28, 1.22]Albert et al., 2008 - WAFACS 79 2,721 69 2,721 9.1% 1.14 [0.83, 1.57]Saposnik et al., 2009 - HOPE 2 111 2,758 147 2,764 14.2% 0.76 [0.59, 0.96]Imasa et al., 2009 0 118 1 125 0.1% 0.35 [0.01, 8.58]VITATOPS Trial Study Group 2010 360 4,089 388 4,075 28.7% 0.92 [0.81, 1.06]Heinz et al., 2010 11 327 15 323 1.8% 0.72 [0.34, 1.55]Galan et al., 2010 - SU.FOL.OM3 35 1,242 48 1,259 5.4% 0.74 [0.48, 1.13]Armitage et al., 2010 - SEARCH 269 6,033 265 6,031 23.3% 1.01 [0.86, 1.20]House et al., 2010 - DIVINe 6 119 1 119 0.2% 6.00 [0.73, 49.08]Van Dijk et al., 2015 - B-PROOF 46 1,516 60 1,511 7% 0.76 [0.52, 1.11]
Total (95% CI) 21,664 21,675 100% 0.90 [0.81, 1.00]Total events 986 1,081 Heterogeneity: Tau² = 0.01; Chi² = 13.13, df = 11 (P = 0.28); I² = 16%Test for overall effect: Z = 2.01 (P = 0.04) 0.2 0.5 1 2 5
Favours B-complex Favours control
B-complex ControlWeight
Risk RatioM-H, Random, 95% CI
Risk RatioM-H, Random, 95%CI in stroke risk
Study or SubgroupBonaa et al., 2006 - NORVITJamison et al., 2007 - HOSTEbbing et al., 2008 - WENBITAlbert et al., 2008 - WAFACSSaposnik et al., 2009 - HOPE 2Imasa et al., 2009VITATOPS Trial Study Group 2010Heinz et al., 2010Galan et al., 2010 - SU.FOL.OM3Armitage et al., 2010 - SEARCHHouse et al., 2010 - DIVINeVan Dijk et al., 2015 - B-PROOF
Total (95% CI)Total eventsHeterogeneity: Tau² = 0.01; Chi² = 13.13, df = 11 (P = 0.28); I² = 16%Test for overall effect: Z = 2.01 (P = 0.04)
Events21371179
1110
3601135
2696
46
986
Total937
1032772
27212758
1184089
32712426033
1191516
21664
Events27411969
1471
3881548
2651
60
1081
Total943
1024780
27212764
1254075
32312596031
1191511
21675
Weight3.3%5.2%2.0%9.1%
14.2%0.1%
28.7%1.8%5.4%
23.3%0.2%6.8%
100.0%
M-H, Random, 95% CI0.78 [0.45, 1.37]0.90 [0.58, 1.38]0.58 [0.28, 1.22]1.14 [0.83, 1.57]0.76 [0.59, 0.96]0.35 [0.01, 8.58]0.92 [0.81, 1.06]0.72 [0.34, 1.55]0.74 [0.48, 1.13]1.01 [0.86, 1.20]
6.00 [0.73, 49.08]0.76 [0.52, 1.11]
0.90 [0.81, 1.00]
Year200620072008200820092009201020102010201020102015
B-Complex Control Risk Ratio Risk RatioM-H, Random, 95% CI
0.2 0.5 1 2 5Favours B-Complex Favours Control
Supplementary Figure 70. Forest plot of vitamin B complex supplementation and stroke risk. M-H, Manthel-Haenszel. *Bonaa et al., 2006 - folic acid, B6 and B12 vs placebo. †Ebbing et al., 2008 - folic acid, B6 and B12 vs placebo. The diamond represents the pooled risk estimate. Inter-study heterogeneity was tested using the Cochran Q statistic (Chi2) at a significance level of P < 0.10, and quantified by the I2 statistic. An I2 value ≥ 50% is considered to indicate substantial heterogeneity. All results are presented as risk ratios with 95% Confidence Intervals, using the Manthel-Haenszel method with random effects model.
112

Subgroup and Study, Year Events Total Events TotalRCTsLonn et al., 2006 - HOPE-TOO 276 2,758 291 2,764 25.0% 0.95 [0.81, 1.11]Albert et al., 2008 - WAFACS 96 2,721 94 2,721 12.9% 1.02 [0.77, 1.35]VITATOPS Trial Study Group 2010 328 4,089 380 4,075 27.1% 0.86 [0.75, 0.99]Galan et al., 2010 - SU.FOL.OM3 26 1,242 14 1,259 3.2% 1.88 [0.99, 3.59]Armitage et al., 2010 - SEARCH 578 6,033 559 6,031 31.7% 1.03 [0.93, 1.15]
Total (95% CI) 16,843 16,850 100% 0.98 [0.87, 1.11]Total events 1,304 1,338 Heterogeneity: Tau² = 0.01; Chi² = 8.30, df = 4 (P = 0.08); I² = 52%Test for overall effect: Z = 0.33 (P = 0.74) 0.5 0.7 1 1.5 2
Favours B-complex Favours control
B-complex ControlWeight
Risk RatioM-H, Random, 95% CI
Risk RatioM-H, Random, 95%CI in CVD mortality risk
Study or SubgroupLonn et al., 2006 - HOPE 2Albert et al., 2008 - WAFACSVITATOPS 2010Galan et al., 2010 - SU.FOL.OM3Armitage et al., 2010 - SEARCH
Total (95% CI)Total eventsHeterogeneity: Tau² = 0.01; Chi² = 8.30, df = 4 (P = 0.08); I² = 52%Test for overall effect: Z = 0.33 (P = 0.74)
Events276
96328
26578
1304
Total27582721408912426033
16843
Events291
94380
14559
1338
Total27642721407512596031
16850
Weight25.0%12.9%27.1%
3.2%31.7%
100.0%
M-H, Random, 95% CI0.95 [0.81, 1.11]1.02 [0.77, 1.35]0.86 [0.75, 0.99]1.88 [0.99, 3.59]1.03 [0.93, 1.15]
0.98 [0.87, 1.11]
Year20062008201020102010
B-Complex Control Risk Ratio Risk RatioM-H, Random, 95% CI
0.5 0.7 1 1.5 2Favours B-Complex Favours Control
Supplementary Figure 71. Forest plot of vitamin B complex supplementation and CVD mortality risk. M-H, Manthel-Haenszel, CVD, cardiovascular disease. The diamond represents the pooled risk estimate. Inter-study heterogeneity was tested using the Cochran Q statistic (Chi2) at a significance level of P < 0.10, and quantified by the I2 statistic. An I2 value ≥ 50% is considered to indicate substantial heterogeneity. All results are presented as risk ratios with 95% Confidence Intervals, using the Manthel-Haenszel method with random effects model.
Subgroup and Study, Year Events Total Events TotalRCTsSchnyder et al., 2002 - The Swiss Heart Study 3 272 6 281 0.8% 0.52 [0.13, 2.04]Heinz et al., 2010 37 327 32 323 7.4% 1.14 [0.73, 1.79]Armitage et al., 2010 - SEARCH 463 6,033 423 6,031 91.8% 1.09 [0.96, 1.24]
Total (95% CI) 6,632 6,635 100% 1.09 [0.97, 1.23]Total events 503 461 Heterogeneity: Tau² = 0.00; Chi² = 1.18, df = 2 (P = 0.56); I² = 0%Test for overall effect: Z = 1.41 (P = 0.16)
0.01 0.1 1 10 100 Favours B-complex Favours control
B-complex ControlWeight
Risk RatioM-H, Random, 95% CI
Risk RatioM-H, Random, 95%CI in CHD mortality risk
Study or SubgroupSchnyder et al., 2002 - The Swiss Heart StudyHeinz et al., 2010Armitage et al., 2010 - SEARCH
Total (95% CI)Total eventsHeterogeneity: Tau² = 0.00; Chi² = 1.18, df = 2 (P = 0.56); I² = 0%Test for overall effect: Z = 1.41 (P = 0.16)
Events3
37463
503
Total272327
6033
6632
Events6
32423
461
Total281323
6031
6635
Weight0.8%7.4%
91.8%
100.0%
M-H, Random, 95% CI0.52 [0.13, 2.04]1.14 [0.73, 1.79]1.09 [0.96, 1.24]
1.09 [0.97, 1.23]
Year200220102010
B-Complex Control Risk Ratio Risk RatioM-H, Random, 95% CI
0.01 0.1 1 10 100Favours B-complex Favours control
Supplementary Figure 72. Forest plot of vitamin B complex supplementation and CHD mortality risk. M-H, Manthel-Haenszel, CHD, coronary heart disease. The diamond represents the pooled risk estimate. Inter-study heterogeneity was tested using the Cochran Q statistic (Chi2) at a significance level of P < 0.10, and quantified by the I2 statistic. An I2 value ≥ 50% is considered to indicate substantial heterogeneity. All results are presented as risk ratios with 95% Confidence Intervals, using the Manthel-Haenszel method with random effects model.
Subgroup and Study, Year Events Total Events TotalRCTsBonaa et al., 2006 - NORVIT* 68 937 59 943 27.1% 1.16 [0.83, 1.62]Armitage et al., 2010 - SEARCH 185 6,033 170 6,031 72.9% 1.09 [0.89, 1.34]
Total (95% CI) 6,970 6,974 100% 1.11 [0.93, 1.32]Total events 253 229 Heterogeneity: Tau² = 0.00; Chi² = 0.10, df = 1 (P = 0.75); I² = 0%Test for overall effect: Z = 1.14 (P = 0.26) 0.5 0.7 1 1.5 2
Favours B-complex Favours control
B-complex ControlWeight
Risk RatioM-H, Random, 95% CI
Risk RatioM-H, Random, 95%CI in MI mortality risk
Study or SubgroupBonaa et al., 2006 - NORVITArmitage et al., 2010 - SEARCH
Total (95% CI)Total eventsHeterogeneity: Tau² = 0.00; Chi² = 0.10, df = 1 (P = 0.75); I² = 0%Test for overall effect: Z = 1.14 (P = 0.26)
Events68
185
253
Total937
6033
6970
Events59
170
229
Total943
6031
6974
Weight27.1%72.9%
100.0%
M-H, Random, 95% CI1.16 [0.83, 1.62]1.09 [0.89, 1.34]
1.11 [0.93, 1.32]
Year20062010
B-Complex Control Risk Ratio Risk RatioM-H, Random, 95% CI
0.5 0.7 1 1.5 2Favours B-complex Favours control
Supplementary Figure 73. Forest plot of vitamin B complex supplementation and MI mortality risk. M-H, Manthel-Haenszel, MI, myocardial infarction. *Bonaa et al., 2006 - folic acid, B6 and B12 vs placebo. The diamond represents the pooled risk estimate. Inter-study heterogeneity was tested using the Cochran Q statistic (Chi2) at a significance level of P < 0.10, and quantified by the I2 statistic. An I2 value ≥ 50% is considered to indicate substantial heterogeneity. All results are presented as risk ratios with 95% Confidence Intervals, using the Manthel-Haenszel method with random effects model.
113

Subgroup and Study, Year Events Total Events TotalRCTsSaposnik et al., 2009 - HOPE 2 27 2,758 30 2,764 31.5% 0.90 [0.54, 1.51]Armitage et al., 2010 - SEARCH 59 6,033 65 6,031 68.5% 0.91 [0.64, 1.29]
Total (95% CI) 8,791 8,795 100% 0.91 [0.68, 1.21]Total events 86 95 Heterogeneity: Tau² = 0.00; Chi² = 0.00, df = 1 (P = 0.98); I² = 0%Test for overall effect: Z = 0.67 (P = 0.50) 0.1 0.2 0.5 1 2 5 10
Favours B-complex Favours control
B-complex ControlWeight
Risk RatioM-H, Random, 95% CI
Risk RatioM-H, Random, 95%CI in stroke mortality risk
Study or SubgroupSaposnik et al., 2009 - HOPE 2Armitage et al., 2010 - SEARCH
Total (95% CI)Total eventsHeterogeneity: Tau² = 0.00; Chi² = 0.00, df = 1 (P = 0.98); I² = 0%Test for overall effect: Z = 0.67 (P = 0.50)
Events2759
86
Total27586033
8791
Events3065
95
Total27646031
8795
Weight31.5%68.5%
100.0%
M-H, Random, 95% CI0.90 [0.54, 1.51]0.91 [0.64, 1.29]
0.91 [0.68, 1.21]
Year20092010
B-Complex Control Risk Ratio Risk RatioM-H, Random, 95% CI
0.1 0.2 0.5 1 2 5 10Favours B-complex Favours control
Supplementary Figure 74. Forest plot of vitamin B complex supplementation and stroke mortality risk. M-H, Manthel-Haenszel. The diamond represents the pooled risk estimate. Inter-study heterogeneity was tested using the Cochran Q statistic (Chi2) at a significance level of P < 0.10, and quantified by the I2 statistic. An I2 value ≥ 50% is considered to indicate substantial heterogeneity. All results are presented as risk ratios with 95% Confidence Intervals, using the Manthel-Haenszel method with random effects model.
Subgroup and Study, Year Events Total Events TotalRCTsSchnyder et al., 2002 - The Swiss Heart Study 4 272 8 281 0.1% 0.52 [0.16, 1.70]Lange et al., 2004 1 316 1 320 0.0% 1.01 [0.06, 16.12]Lonn et al., 2006 - HOPE-TOO 470 2,758 475 2,764 14.5% 0.99 [0.88, 1.11]Bonaa et al., 2006 - NORVIT* 104 937 89 943 2.7% 1.18 [0.90, 1.54]Jamison et al., 2007 - HOST 448 1,032 436 1,024 19.7% 1.02 [0.92, 1.13]Ebbing et al., 2008 - WENBIT† 35 772 30 780 0.9% 1.18 [0.73, 1.90]Albert et al., 2008 - WAFACS 250 2,721 256 2,721 7.1% 0.98 [0.83, 1.15]Hodis et al., 2009 - BVAIT 0 254 2 252 0.0% 0.20 [0.01, 4.11]Imasa et al., 2009 22 118 20 125 0.6% 1.17 [0.67, 2.02]Heinz et al., 2010 102 327 92 323 3.5% 1.10 [0.86, 1.39]Armitage et al., 2010 - SEARCH 983 6,033 951 6,031 29.3% 1.03 [0.95, 1.12]Galan et al., 2010 - SU.FOL.OM3 72 1,242 45 1,259 1.5% 1.62 [1.13, 2.33]VITATOPS Trial Study Group 2010 614 4,089 633 4,075 18.7% 0.97 [0.87, 1.07]House et al., 2010 - DIVINe 7 119 6 119 0.2% 1.17 [0.40, 3.37]Van Wijngaarden et al., 2014 - B-PROOF 37 1,516 42 1,511 1.00% 0.88 [0.57, 1.36]Wang et al., 2015 4 195 6 195 0% 0.67 [0.19, 2.33]
Total (95% CI) 22,701 22,723 100% 1.02 [0.97, 1.06]Total events 3,153 3,092 Heterogeneity: Tau² = 0.00; Chi² = 13.22, df = 15 (P = 0.58); I² = 0%Test for overall effect: Z = 0.82 (P = 0.41) 0.1 0.2 0.5 1 2 5 10
Favours B-complex Favours control
B-complex ControlWeight
Risk RatioM-H, Random, 95% CI
Risk RatioM-H, Random, 95%CI in all-cause mortality risk
Study or SubgroupSchnyder et al., 2002 - The Swiss Heart StudyLange et al., 2004Lonn et al., 2006 - HOPE 2Bonaa et al., 2006 - NORVITJamison et al., 2007 - HOSTEbbing et al., 2008 - WENBITAlbert et al., 2008 - WAFACSHodis et al., 2009Imasa et al., 2009Heinz et al., 2010Armitage et al., 2010 - SEARCHGalan et al., 2010 - SU.FOL.OM3VITATOPS Trial Study Group 2010House et al., 2010 - DIVINeVan Wijngaarden et al., 2014 - B-PROOFWang et al., 2015
Total (95% CI)Total eventsHeterogeneity: Tau² = 0.00; Chi² = 13.22, df = 15 (P = 0.58); I² = 0%Test for overall effect: Z = 0.82 (P = 0.41)
Events41
470104448
35250
022
102983
72614
737
4
3153
Total272316
2758937
1032772
2721254118327
603312424089
1191516
195
22701
Events81
47589
43630
2562
2092
95145
6336
426
3092
Total281320
2764943
1024780
2721252125323
603112594075
1191511
195
22723
Weight0.1%0.0%
14.5%2.7%
19.7%0.9%7.1%0.0%0.6%3.5%
29.3%1.5%
18.7%0.2%1.0%0.1%
100.0%
M-H, Random, 95% CI0.52 [0.16, 1.70]
1.01 [0.06, 16.12]0.99 [0.88, 1.11]1.18 [0.90, 1.54]1.02 [0.92, 1.13]1.18 [0.73, 1.90]0.98 [0.83, 1.15]0.20 [0.01, 4.11]1.17 [0.67, 2.02]1.10 [0.86, 1.39]1.03 [0.95, 1.12]1.62 [1.13, 2.33]0.97 [0.87, 1.07]1.17 [0.40, 3.37]0.88 [0.57, 1.36]0.67 [0.19, 2.33]
1.02 [0.97, 1.06]
Year2002200420062006200720082008200920092010201020102010201020142015
B-Complex Control Risk Ratio Risk RatioM-H, Random, 95% CI
0.1 0.2 0.5 1 2 5 10Favours B-complex Favours control
Supplementary Figure 75. Forest plot of vitamin B complex supplementation and all-cause mortality risk. M-H, Manthel-Haenszel. *Bonaa et al., 2006 - folic acid, B6 and B12 vs placebo. †Ebbing et al., 2008 - folic acid, B6 and B12 vs placebo. The diamond represents the pooled risk estimate. Inter-study heterogeneity was tested using the Cochran Q statistic (Chi2) at a significance level of P < 0.10, and quantified by the I2 statistic. An I2 value ≥ 50% is considered to indicate substantial heterogeneity. All results are presented as risk ratios with 95% Confidence Intervals, using the Manthel-Haenszel method with random effects model.
114

Supplementary Figure 76. Funnel plot of vitamin B complex supplementation and CVD and all-cause mortality outcomes: (A) MI risk, (B) stroke risk, and (C) all-cause mortality risk. The vertical line represents the pooled effect estimate expressed as a RR. Dashed lines represent pseudo-95% confidence intervals (CI). The circles represent risk estimates for each study, and the horizontal lines represent standard errors of the RR. We were unable to test for funnel plot asymmetry for other CVD outcomes (<10 RCTs).
115

Random Effects
Comparison RCTs N Events RR (95% CIs) RR (95% CIs) I2 p -valueCVD
Total CVD 5 21,567 960 0.83 [0.73, 0.93] 0% <0.01
Total CHD 2 2,197 77 1.47 [0.95, 2.28] 0% 0.08MI 6 24,210 106 1.21 [0.78, 1.88] 12% 0.41Stroke 7 24,525 694 0.80 [0.69, 0.93] 0% <0.01Total CVD mortality 5 22,468 188 0.89 [0.68, 1.17] 0% 0.41MI mortality 2 20,985 13 1.17 [0.39, 3.49] 0% 0.77
Stroke mortality 2 20,985 29 1.85 [0.88, 3.93] 0% 0.11
ALL-CAUSE MORTALITY All-cause mortality 10 25,580 877 0.87 [0.72, 1.05] 17% 0.14
Pooled Effect Estimates
Favours folic acid/ Favours control/ Negative association Positive association
0.0 0.5 1.0 1.5 2.0
Supplementary Figure 77. Summary of the pooled effect estimates of RCTs assessing the relationship between folic acid supplementation and CVD and all-cause mortality risk. RR, risk ratio; CIs, confidence intervals; RTCs, randomized clinical trials; CVD, cardiovascular disease; CHD, coronary heart disease; MI, myocardial infarction; N/A, not applicable. The diamonds represents the pooled risk estimate. Inter-study heterogeneity was tested using the Cochran Q statistic (Chi2) at a significance level of P < 0.10, and quantified by the I2 statistic. An I2 value ≥ 50% is considered to indicate substantial heterogeneity. All results are presented as risk ratios with 95% CIs, using the Manthel-Haenszel method with random effects model.
Folic acid Control Weight Risk RatioSubgroup and Study, Year Events Total Events TotalRCTsRighetti et al., 2003 13 51 11 30 3.2% 0.70 [0.36, 1.35]Liem et al., 2004 43 140 45 143 11.9% 0.98 [0.69, 1.38]Zoungas et al., 2006 - ASFAST 46 156 55 159 13.7% 0.85 [0.62, 1.18]Vianna et al., 2007 9 93 9 93 1.9% 1.00 [0.42, 2.41]Huo et al., 2015 - CSPPT 324 10,348 405 10,354 69.4% 0.80 [0.69, 0.92]
Total (95% CI) 10,788 10,779 100% 0.83 [0.73, 0.93]Total events 435 525 Heterogeneity: Tau² = 0.00; Chi² = 1.56, df = 4 (P = 0.82); I² = 0%Test for overall effect: Z = 3.13 (P = 0.002) 0.5 0.7 1 1.5 2
Favours folic acid Favours control
Risk RatioM-H, Random, 95%CI in total CVD risk
Study or SubgroupRighetti et al., 2003Liem et al., 2004Zoungas et al., 2006 - ASFASTVianna et al., 2007Huo et al., 2015 - CSPPT
Total (95% CI)Total eventsHeterogeneity: Tau² = 0.00; Chi² = 1.56, df = 4 (P = 0.82); I² = 0%Test for overall effect: Z = 3.13 (P = 0.002)
Events134346
9324
435
Total51
140156
9310348
10788
Events114555
9405
525
Total30
143159
9310354
10779
Weight3.2%
11.9%13.7%
1.9%69.4%
100.0%
M-H, Random, 95% CI0.70 [0.36, 1.35]0.98 [0.69, 1.38]0.85 [0.62, 1.18]1.00 [0.42, 2.41]0.80 [0.69, 0.92]
0.83 [0.73, 0.93]
Year20032004200620072015
Folate Control Risk Ratio Risk RatioM-H, Random, 95% CI
0.5 0.7 1 1.5 2Favours folate Favours control
Supplementary Figure 78. Forest plot of folic acid supplementation and total CVD risk. M-H, Manthel-Haenszel, CVD, cardiovascular disease. The diamond represents the pooled risk estimate. Inter-study heterogeneity was tested using the Cochran Q statistic (Chi2) at a significance level of P < 0.10, and quantified by the I2 statistic. An I2 value ≥ 50% is considered to indicate substantial heterogeneity. All results are presented as risk ratios with 95% Confidence Intervals, using the Manthel-Haenszel method with random effects model.
116

Subgroup and Study, Year Events Total Events TotalRCTsBaker et al., 2002 23 942 12 940 40.1% 1.91 [0.96, 3.82]Zoungas et al., 2006 - ASFAST 23 156 19 159 59.9% 1.23 [0.70, 2.17]
Total (95% CI) 1,098 1,099 100% 1.47 [0.95, 2.28]Total events 46 31 Heterogeneity: Tau² = 0.00; Chi² = 0.93, df = 1 (P = 0.33); I² = 0% 0.01 0.1 1 10 100Test for overall effect: Z = 1.73 (P = 0.08) Favours folic acid Favours control
Folic acid ControlWeight
Risk RatioM-H, Random, 95% CI
Risk RatioM-H, Random, 95%CI in total CHD risk
Study or SubgroupBaker et al., 2002Zoungas et al., 2006 - ASFAST
Total (95% CI)Total eventsHeterogeneity: Tau² = 0.00; Chi² = 0.93, df = 1 (P = 0.33); I² = 0%Test for overall effect: Z = 1.73 (P = 0.08)
Events2323
46
Total942156
1098
Events1219
31
Total940159
1099
Weight40.1%59.9%
100.0%
M-H, Random, 95% CI1.91 [0 .96, 3.82]1.23 [0 .70, 2.17]
1.47 [0.95, 2.28]
Year20022006
Folate Control Risk Ratio Risk RatioM-H, Random, 95% CI
0.01 0.1 1 10 100Favours folate Favours control
Supplementary Figure 79. Forest plot of folic acid supplementation and total CHD risk. M-H, Manthel-Haenszel, CHD, coronary heart disease. The diamond represents the pooled risk estimate. Inter-study heterogeneity was tested using the Cochran Q statistic (Chi2) at a significance level of P < 0.10, and quantified by the I2 statistic. An I2 value ≥ 50% is considered to indicate substantial heterogeneity. All results are presented as risk ratios with 95% Confidence Intervals, using the Manthel-Haenszel method with random effects model.
Subgroup and Study, Year Events Total Events TotalRCTsLiem et al., 2003 3 300 4 293 8.3% 0.73 [0.17, 3.24]Liem et al., 2004 8 140 10 143 20.5% 0.82 [0.33, 2.01]Cole et al., 2007 - AFPPS 14 516 8 505 22.1% 1.71 [0.72, 4.05]Logan et al., 2008 - ukCAP 3 470 0 469 2.2% 6.99 [0.36, 134.86]Wu et al., 2009 - NHS/HPFS 6 338 1 334 4.3% 5.93 [0.72, 48.98]Huo et al., 2015 - CSPPT 25 10,348 24 10,354 42.6% 1.04 [0.60, 1.82]
Total (95% CI) 12,112 12,098 100% 1.21 [0.78, 1.88]Total events 59 47 Heterogeneity: Tau² = 0.04; Chi² = 5.66, df = 5 (P = 0.34); I² = 12%Test for overall effect: Z = 0.83 (P = 0.41) 0.02 0.1 1 10 50
Favours folic acid Favours control
Folic acid ControlWeight
Risk RatioM-H, Random, 95% CI
Risk RatioM-H, Random, 95%CI in MI risk
Study or SubgroupLiem et al., 2003Liem et al., 2004Cole et al., 2007 - AFPPSLogan et al., 2008Wu et al., 2009 - NHS/HPFSHuo et al., 2015 - CSPPT
Total (95% CI)Total eventsHeterogeneity: Tau² = 0.04; Chi² = 5.66, df = 5 (P = 0.34); I² = 12%Test for overall effect: Z = 0.83 (P = 0.41)
Events38
1436
25
59
Total300140516470338
10348
12112
Events4
10801
24
47
Total293143505469334
10354
12098
Weight8.3%
20.5%22.1%
2.2%4.3%
42.6%
100.0%
M-H, Random, 95% CI0.73 [0.17, 3.24]0.82 [0.33, 2.01]1.71 [0.72, 4.05]
6.99 [0.36, 134.86]5.93 [0.72, 48.98]
1.04 [0.60, 1.82]
1.21 [0.78, 1.88]
Year200320042007200820092015
Folate Control Risk Ratio Risk RatioM-H, Random, 95% CI
0.02 0.1 1 10 50Favours folate Favours control
Supplementary Figure 80. Forest plot of folic acid supplementation and MI risk. Manthel-Haenszel M-H, MI, myocardial infarction. The diamond represents the pooled risk estimate. Inter-study heterogeneity was tested using the Cochran Q statistic (Chi2) at a significance level of P < 0.10, and quantified by the I2 statistic. An I2 value ≥ 50% is considered to indicate substantial heterogeneity. All results are presented as risk ratios with 95% Confidence Intervals, using the Manthel-Haenszel method with random effects model.
117

Subgroup and Study, Year Events Total Events TotalRCTsLiem et al., 2003 4 300 3 293 1.0% 1.30 [0.29, 5.77]Liem et al., 2004 1 140 0 143 0.2% 3.06 [0.13, 74.58]Zoungas et al., 2006 - ASFAST 8 156 18 159 3.4% 0.45 [0.20, 1.01]Cole et al., 2007 - AFPPS 9 516 5 505 1.9% 1.76 [0.59, 5.22]Logan et al., 2008 - ukCAP 1 470 1 469 0.3% 1.00 [0.06, 15.91]Wu et al., 2009 - NHS/HPFS 4 338 3 334 1.0% 1.32 [0.30, 5.84]Huo et al., 2015 - CSPPT 282 10,348 355 10,354 92.3% 0.79 [0.68, 0.93]
Total (95% CI) 12,268 12,257 100% 0.80 [0.69, 0.93]Total events 309 385Heterogeneity: Tau² = 0.00; Chi² = 5.51, df = 6 (P = 0.48); I² = 0%Test for overall effect: Z = 2.92 (P = 0.003) 0.02 0.1 1 10 50
Favours folic acid Favours control
Folic acid ControlWeight
Risk RatioM-H, Random, 95% CI
Risk RatioM-H, Random, 95%CI in stroke risk
Study or SubgroupLiem et al., 2003Liem et al., 2004Zoungas et al., 2006 - ASFASTCole et al., 2007 - AFPPSLogan et al., 2008Wu et al., 2009 - NHS/HPFSHuo et al., 2015 - CSPPT
Total (95% CI)Total eventsHeterogeneity: Tau² = 0.00; Chi² = 5.51, df = 6 (P = 0.48); I² = 0%Test for overall effect: Z = 2.92 (P = 0.003)
Events418914
282
309
Total300140156516470338
10348
12268
Events30
18513
355
385
Total293143159505469334
10354
12257
Weight1.0%0.2%3.4%1.9%0.3%1.0%
92.3%
100.0%
M-H, Random, 95% CI1.30 [0.29, 5.77]
3.06 [0.13, 74.58]0.45 [0.20, 1.01]1.76 [0.59, 5.22]
1.00 [0.06, 15.91]1.32 [0.30, 5.84]0.79 [0.68, 0.93]
0.80 [0.69, 0.93]
Year2003200420062007200820092015
Folate Control Risk Ratio Risk RatioM-H, Random, 95% CI
0.02 0.1 1 10 50Favours folate Favours control
Supplementary Figure 81. Forest plot of folic acid supplementation and stroke risk. M-H, Manthel-Haenszel. The diamond represents the pooled risk estimate. Inter-study heterogeneity was tested using the Cochran Q statistic (Chi2) at a significance level of P < 0.10, and quantified by the I2 statistic. An I2 value ≥ 50% is considered to indicate substantial heterogeneity. All results are presented as risk ratios with 95% Confidence Intervals, using the Manthel-Haenszel method with random effects model.
Subgroup and Study, Year Events Total Events TotalRCTsLiem et al., 2003 7 300 9 293 7.9% 0.76 [0.29, 2.01]Zoungas et al., 2006 - ASFAST 21 156 24 159 25.7% 0.89 [0.52, 1.53]Vianna et al., 2007 17 93 21 93 23.1% 0.81 [0.46, 1.43]Wu et al., 2009 - NHS/HPFS 0 338 3 334 0.9% 0.14 [0.01, 2.72]Huo et al., 2015 - CSPPT 43 10,348 43 10,354 42.4% 1.00 [0.66, 1.53]
Total (95% CI) 11,235 11,233 100% 0.89 [0.68, 1.17]Total events 88 100 Heterogeneity: Tau² = 0.00; Chi² = 1.99, df = 4 (P = 0.74); I² = 0%Test for overall effect: Z = 0.83 (P = 0.41) 0.01 0.1 1 10 100
Favours folic acid Favours control
Folic acid ControlWeight
Risk RatioM-H, Random, 95% CI
Risk RatioM-H, Random, 95%CI in CVD mortality risk
Study or SubgroupLiem et al., 2003Zoungas et al., 2006 - ASFASTVianna et al., 2007Wu et al., 2009 - NHS/HPFSHuo et al., 2015 - CSPPT
Total (95% CI)Total eventsHeterogeneity: Tau² = 0.00; Chi² = 1.99, df = 4 (P = 0.74); I² = 0%Test for overall effect: Z = 0.83 (P = 0.41)
Events7
2117
043
88
Total300156
93338
10348
11235
Events9
2421
343
100
Total293159
93334
10354
11233
Weight7.9%
25.7%23.1%
0.9%42.4%
100.0%
M-H, Random, 95% CI0.76 [0.29, 2.01]0.89 [0.52, 1.53]0.81 [0.46, 1.43]0.14 [0.01, 2.72]1.00 [0.66, 1.53]
0.89 [0.68, 1.17]
Year20032006200720092015
Folate Control Risk Ratio Risk RatioM-H, Random, 95% CI
0.01 0.1 1 10 100Favours folate Favours control
Supplementary Figure 82. Forest plot of folic acid supplementation and CVD mortality risk. M-H, Manthel-Haenszel, CVD, cardiovascular disease. The diamond represents the pooled risk estimate. Inter-study heterogeneity was tested using the Cochran Q statistic (Chi2) at a significance level of P < 0.10, and quantified by the I2 statistic. An I2 value ≥ 50% is considered to indicate substantial heterogeneity. All results are presented as risk ratios with 95% Confidence Intervals, using the Manthel-Haenszel method with effects model.
118

Subgroup and Study, Year Events Total Events TotalRCTsLiem et al., 2004 2 140 2 143 31.3% 1.02 [0.15, 7.15]Huo et al., 2015 - CSPPT 5 10,348 4 10,354 68.7% 1.25 [0.34, 4.66]
Total (95% CI) 10,488 10,497 100% 1.17 [0.39, 3.49]Total events 7 6 Heterogeneity: Tau² = 0.00; Chi² = 0.03, df = 1 (P = 0.87); I² = 0%Test for overall effect: Z = 0.29 (P = 0.77) 0.002 0.1 1 10 500
Favours folic acid Favours control
Folic acid ControlWeight
Risk RatioM-H, Random, 95% CI
Risk RatioM-H, Random, 95%CI in MI mortality risk
Study or SubgroupLiem et al., 2004Huo et al., 2015 - CSPPT
Total (95% CI)Total eventsHeterogeneity: Tau² = 0.00; Chi² = 0.03, df = 1 (P = 0.87); I² = 0%Test for overall effect: Z = 0.29 (P = 0.77)
Events25
7
Total140
10348
10488
Events24
6
Total143
10354
10497
Weight31.3%68.7%
100.0%
M-H, Random, 95% CI1.02 [0.15, 7.15]1.25 [0.34, 4.66]
1.17 [0.39, 3.49]
Year20042015
Folate Control Risk Ratio Risk RatioM-H, Random, 95% CI
0.002 0.1 1 10 500Favours folate Favours control
Supplementary Figure 83. Forest plot of folic acid supplementation and MI mortality risk. M-H, Manthel-Haenszel, MI, myocardial infarction. The diamond represents the pooled risk estimate. Inter-study heterogeneity was tested using the Cochran Q statistic (Chi2) at a significance level of P < 0.10, and quantified by the I2 statistic. An I2 value ≥ 50% is considered to indicate substantial heterogeneity. All results are presented as risk ratios with 95% Confidence Intervals, using the Manthel-Haenszel method with random effects model.
Subgroup and Study, Year Events Total Events TotalRCTsLiem et al., 2004 1 140 0 143 5.5% 3.06 [0.13, 74.58]Huo et al., 2015 - CSPPT 18 10,348 10 10,354 94.5% 1.80 [0.83, 3.90]
Total (95% CI) 10,488 10,497 100% 1.85 [0.88, 3.93]Total events 19 10 Heterogeneity: Tau² = 0.00; Chi² = 0.10, df = 1 (P = 0.75); I² = 0%Test for overall effect: Z = 1.61 (P = 0.11) 0.01 0.1 1 10 100
Favours folic acid Favours control
Folic acid ControlWeight
Risk RatioM-H, Random, 95% CI
Risk RatioM-H, Random, 95%CI in stroke mortality risk
Study or SubgroupLiem et al., 2004Huo et al., 2015 - CSPPT
Total (95% CI)Total eventsHeterogeneity: Tau² = 0.00; Chi² = 0.10, df = 1 (P = 0.75); I² = 0%Test for overall effect: Z = 1.61 (P = 0.11)
Events1
18
19
Total140
10348
10488
Events0
10
10
Total143
10354
10497
Weight5.5%
94.5%
100.0%
M-H, Random, 95% CI3.06 [0.13, 74.58]
1.80 [0.83, 3.90]
1.85 [0.88, 3.93]
Year20042015
Folate Control Risk Ratio Risk RatioM-H, Random, 95% CI
0.01 0.1 1 10 100Favours folate Favours control
Supplementary Figure 84. Forest plot of folic acid supplementation and stroke mortality risk. M-H, Manthel-Haenszel. The diamond represents the pooled risk estimate. Inter-study heterogeneity was tested using the Cochran Q statistic (Chi2) at a significance level of P < 0.10, and quantified by the I2 statistic. An I2 value ≥ 50% is considered to indicate substantial heterogeneity. All results are presented as risk ratios with 95% Confidence Intervals, using the Manthel-Haenszel method with random effects model.
119

Subgroup and Study, Year Events Total Events TotalRCTsLiem et al., 2003 12 300 14 293 5.7% 0.84 [0.39, 1.78]Liem et al., 2004 6 140 7 143 3.0% 0.88 [0.30, 2.54]Potena et al., 2005 1 26 0 25 0.4% 2.89 [0.12, 67.75]Zoungas et al., 2006 - ASFAST 45 156 46 159 20.2% 1.00 [0.71, 1.41]Vianna et al., 2007 23 93 30 93 13.3% 0.77 [0.48, 1.22]Durga et al., 2007 - FACIT 8 405 4 413 2.4% 2.04 [0.62, 6.72]Cole et al., 2007 - AFPPS 10 516 19 505 5.7% 0.52 [0.24, 1.10]Logan et al., 2008 - UKCAP 1 470 7 469 0.8% 0.14 [0.02, 1.15]Wu et al., 2009 - NHS/HPFS 7 338 15 334 4.3% 0.46 [0.19, 1.12]Huo et al., 2015 - CSPPT 302 10,348 320 10,354 44.1% 0.94 [0.81, 1.10]
Total (95% CI) 12,792 12,788 100% 0.87 [0.72, 1.05]Total events 415 462Heterogeneity: Tau² = 0.02; Chi² = 10.82, df = 9 (P = 0.29); I² = 17%Test for overall effect: Z = 1.46 (P = 0.14) 0.2 0.5 1 2 5
Favours folic acid Favours control
Folic acid ControlWeight
Risk RatioM-H, Random, 95% CI
Risk RatioM-H, Random, 95%CI in all-cause mortality risk
Study or SubgroupLiem et al., 2003Liem et al., 2004Potena et al., 2005Zoungas et al., 2006 - ASFASTVianna et al., 2007Durga et al., 2007 - FACITCole et al., 2007 - AFPPSLogan et al., 2008 - UKCAPWu et al., 2009 - NHS/HPFSHuo et al., 2015 - CSPPT
Total (95% CI)Total eventsHeterogeneity: Tau² = 0.02; Chi² = 10.82, df = 9 (P = 0.29); I² = 17%Test for overall effect: Z = 1.46 (P = 0.14)
Events12
61
4523
810
17
302
415
Total300140
26156
93405516470338
10348
12792
Events14
70
4630
419
715
320
462
Total293143
25159
93413505469334
10354
12788
Weight5.7%3.0%0.4%
20.2%13.3%
2.4%5.7%0.8%4.3%
44.1%
100.0%
M-H, Random, 95% CI0.84 [0.39, 1.78]0.88 [0.30, 2.54]
2.89 [0.12, 67.75]1.00 [0.71, 1.41]0.77 [0.48, 1.22]2.04 [0.62, 6.72]0.52 [0.24, 1.10]0.14 [0.02, 1.15]0.46 [0.19, 1.12]0.94 [0.81, 1.10]
0.87 [0.72, 1.05]
Year2003200420052006200720072007200820092015
Folate Control Risk Ratio Risk RatioM-H, Random, 95% CI
0.2 0.5 1 2 5Favours folate Favours control
Supplementary Figure 85. Forest plot of folic acid supplementation and all-cause mortality risk. M-H, Manthel-Haenszel. The diamond represents the pooled risk estimate. Inter-study heterogeneity was tested using the Cochran Q statistic (Chi2) at a significance level of P < 0.10, and quantified by the I2 statistic. An I2 value ≥ 50% is considered to indicate substantial heterogeneity. All results are presented as risk ratios with 95% Confidence Intervals, using the Manthel-Haenszel method with random effects model.
Supplementary Figure 86. Funnel plot of folic acid supplementation and all-cause mortality risk. The vertical line represents the pooled effect estimate expressed as a RR. Dashed lines represent pseudo-95% confidence intervals (CI). The circles represent risk estimates for each study, and the horizontal lines represent standard errors of the RR. We were unable to test for other CVD outcomes (<10 RCTs).
120

Random Effects
ComparisonRCTs/
CohortsN Events RR (95% CIs) RR (95% CIs) I2 p -value
CVD (RCTs)Total CVD 4 33,162 7,045 0.97 [0.93, 1.03] 34% 0.33Total CHD 2 26,615 1,363 0.96 [0.87, 1.07] 0% 0.47MI 5 34,104 1,536 0.90 [0.75, 1.06] 41% 0.20
Stroke 5 34,104 1,453 0.95 [0.72, 1.26] 60% 0.73Total CVD mortality 3 7,489 957 0.95 [0.84, 1.08] 0% 0.46
Total CHD mortality 3 32,995 1,403 0.99 [0.89, 1.10] 0% 0.89
ALL-CAUSE MORTALITY All-cause mortality (RCTs) 4 33,103 2,691 1.04 [0.95, 1.14] 16% 0.36
Negative association Positive association
Pooled Effect Estimates
Favours niacin(B3)/ Favours control/0.5 1.0 1.5
Supplementary Figure 87. Summary of the pooled effect estimates of RCTs assessing the relationship between niacin (B3) supplementation and CVD and all cause mortality risk. RR, risk ratio; CIs, confidence intervals; RTCs, randomized clinical trials; CVD, cardiovascular disease; CHD, coronary heart disease; MI, myocardial infarction; N/A, not applicable. The diamonds represents the pooled risk estimate. Inter-study heterogeneity was tested using the Cochran Q statistic (Chi2) at a significance level of P < 0.10, and quantified by the I2 statistic. An I2 value ≥ 50% is considered to indicate substantial heterogeneity. All results are presented as risk ratios with 95% CIs, using the Manthel-Haenszel method with random effects model.
121
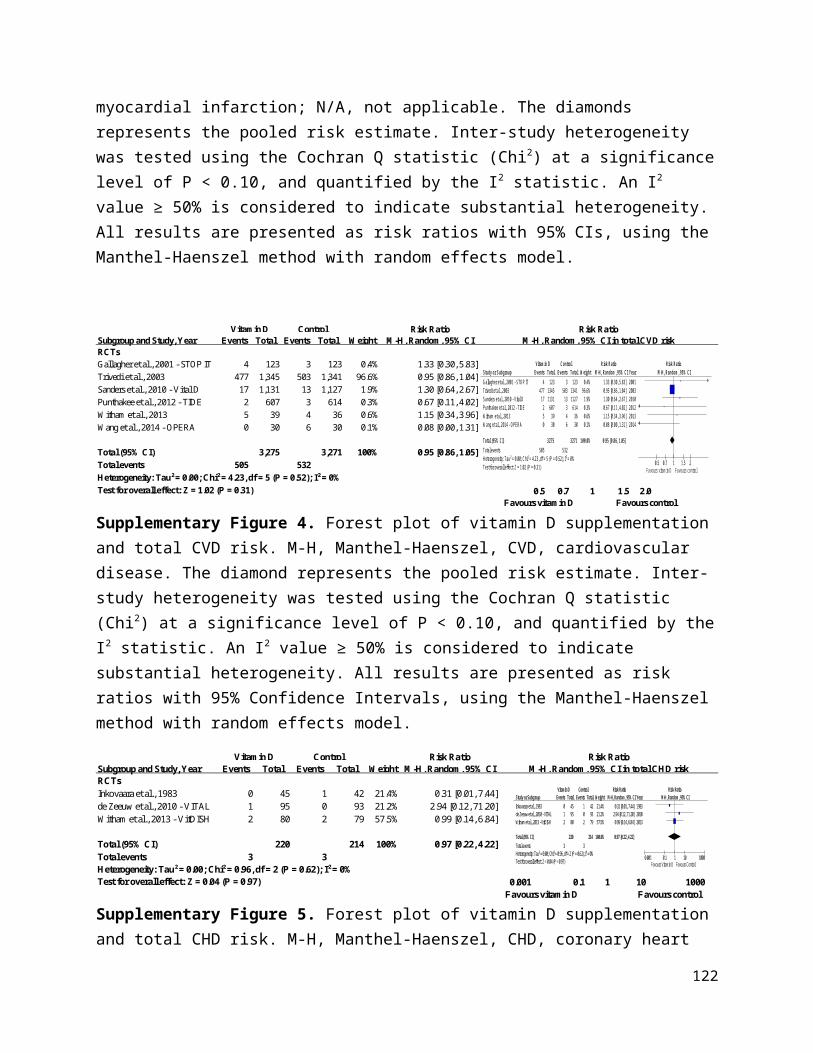
Subgroup and Study, Year Events Total Events TotalRCTsNo statinsCDPRG 1975 914 1,119 2,333 2,789 58.3% 0.98 [0.95, 1.01]Subtotal (95% CI) 1,119 2,789 58.3% 0.98 [0.95, 1.01]Total events 914 2,333 Heterogeneity: Not applicableTest for overall effect: Z = 1.45 (P = 0.15)
Background statin treatmentTaylor et al., 2004 - ARBITER 2 4 87 11 80 0.2% 0.33 [0.11, 1.01]Boden et al., 2011 - AIM HIGH* 171 1,718 158 1,696 5.7% 1.07 [0.87, 1.31]HPS2-THRIVE Collaborative Group 2014 1,696 12,838 1,758 12,835 35.8% 0.96 [0.91, 1.03]Subtotal (95% CI) 14,643 14,611 41.7% 0.97 [0.81, 1.17]Total events 1,871 1,927 Heterogeneity: Tau² = 0.01; Chi² = 4.46, df = 2 (P = 0.11); I² = 55%Test for overall effect: Z = 0.29 (P = 0.77)
Total (95% CI) 15,762 17,400 100% 0.97 [0.93, 1.03]Total events 2,785 4,260 Heterogeneity: Tau² = 0.00; Chi² = 4.54, df = 3 (P = 0.21); I² = 34%Test for overall effect: Z = 0.98 (P = 0.33) 0.2 0.5 1 2 5 Test for subgroup differences: Chi² = 0.00, df = 1 (P = 0.96), I² = 0% Favours B3 (niacin) Favours control
Vitamin B3 ControlWeight
Risk RatioM-H, Random, 95% CI
Risk RatioM-H, Random, 95% CI in total CVD risk
Study or Subgroup1.1.1 No statinsCDPRG 1975Subtotal (95% CI)Total eventsHeterogeneity: Not applicableTest for overall effect: Z = 1.45 (P = 0.15)
1.1.2 Background statin treatmentTaylor et al., 2004 - ARBITER 2Boden et al., 2011 - AIM HIGHHPS 2 THRIVE 2014Subtotal (95% CI)Total eventsHeterogeneity: Tau² = 0.01; Chi² = 4.46, df = 2 (P = 0.11); I² = 55%Test for overall effect: Z = 0.29 (P = 0.77)
Total (95% CI)Total eventsHeterogeneity: Tau² = 0.00; Chi² = 4.54, df = 3 (P = 0.21); I² = 34%Test for overall effect: Z = 0.98 (P = 0.33)Test for subgroup differences: Chi² = 0.00, df = 1 (P = 0.96), I² = 0%
Events
914
914
4171
1696
1871
2785
Total
11191119
871718
1283814643
15762
Events
2333
2333
11158
1758
1927
4260
Total
27892789
801696
1283514611
17400
Weight
58.3%58.3%
0.2%5.7%
35.8%41.7%
100.0%
M-H, Random, 95% CI
0.98 [0.95, 1.01]0.98 [0.95, 1.01]
0.33 [0.11, 1.01]1.07 [0.87, 1.31]0.96 [0.91, 1.03]0.97 [0.81, 1.17]
0.97 [0.93, 1.03]
Year
1975
200420112014
Vitamin B3 (Niacin) Control Risk Ratio Risk RatioM-H, Random, 95% CI
0.2 0.5 1 2 5Favours B3 (Niacin) Favours Control
Supplementary Figure 88. Forest plot of niacin (B3) supplementation and total CVD risk. M-H, Manthel-Haenszel, CVD, cardiovascular disease. *Boden et al., 2011 - reported number of participants with at least one event. The diamond represents the pooled risk estimate. Inter-study heterogeneity was tested using the Cochran Q statistic (Chi2) at a significance level of P < 0.10, and quantified by the I2 statistic. An I2 value ≥ 50% is considered to indicate substantial heterogeneity. All results are presented as risk ratios with 95% Confidence Intervals, using the Manthel-Haenszel method with random effects model.
Subgroup and Study, Year Events Total Events TotalRCTsGuyton et al., 2008 1 670 0 272 0.1% 1.22 [0.05, 29.87]HPS2-THRIVE Collaborative Group 2014 668 12,838 694 12,835 99.9% 0.96 [0.87, 1.07]
Total (95% CI) 13,508 13,107 100% 0.96 [0.87, 1.07]Total events 669 694Heterogeneity: Tau² = 0.00; Chi² = 0.02, df = 1 (P = 0.88); I² = 0%Test for overall effect: Z = 0.72 (P = 0.47) 0.05 0.2 1 5 20
Favours B3 (niacin) Favours control
Vitamin B3 ControlWeight
Risk RatioM-H, Random, 95% CI
Risk RatioM-H, Random, 95% CI in total CHD risk
Study or SubgroupGuyton et al., 2008HPS 2 THRIVE 2014
Total (95% CI)Total eventsHeterogeneity: Tau² = 0.00; Chi² = 0.02, df = 1 (P = 0.88); I² = 0%Test for overall effect: Z = 0.72 (P = 0.47)
Events1
668
669
Total670
12838
13508
Events0
694
694
Total272
12835
13107
Weight0.1%
99.9%
100.0%
M-H, Random, 95% CI1.22 [0.05, 29.87]
0.96 [0.87, 1.07]
0.96 [0.87, 1.07]
Year20082014
Vitamin B3 (Niacin) Control Risk Ratio Risk RatioM-H, Random, 95% CI
0.05 0.2 1 5 20Favours Vitamin B3 Favours Control
Supplementary Figure 89. Forest plot of niacin (B3) supplementation and total CHD risk. M-H, Manthel-Haenszel, CHD, coronary heart disease. The diamond represents the pooled risk estimate. Inter-study heterogeneity was tested using the Cochran Q statistic (Chi2) at a significance level of P < 0.10, and quantified by the I2 statistic. An I2 value ≥ 50% is considered to indicate substantial heterogeneity. All results are presented as risk ratios with 95% Confidence Intervals, using the Manthel-Haenszel method with random effects model.
122

Subgroup and Study, Year Events Total Events TotalRCTsNo statinsCDPRG 1975 114 1,119 386 2,789 32.7% 0.74 [0.60, 0.90]Subtotal (95% CI) 1,119 2,789 32.7% 0.74 [0.60, 0.90]Total events 114 386 Heterogeneity: Not applicableTest for overall effect: Z = 3.05 (P = 0.002)
Background statin treatmentTaylor et al., 2004 - ARBITER 2 2 87 2 80 0.8% 0.92 [0.13, 6.38]Guyton et al., 2008 1 670 1 272 0.4% 0.41 [0.03, 6.47]Boden et al., 2011 - AIM HIGH* 104 1,718 93 1,696 23.5% 1.10 [0.84, 1.45]HPS2-THRIVE Collaborative Group 2014 402 12,838 431 12,835 42.7% 0.93 [0.82, 1.07]Subtotal (95% CI) 15,313 14,883 67.3% 0.96 [0.85, 1.08]Total events 509 527Heterogeneity: Tau² = 0.00; Chi² = 1.57, df = 3 (P = 0.67); I² = 0%Test for overall effect: Z = 0.64 (P = 0.53)
Total (95% CI) 16,432 17,672 100% 0.90 [0.75, 1.06]Total events 623 913 Heterogeneity: Tau² = 0.01; Chi² = 6.75, df = 4 (P = 0.15); I² = 41%Test for overall effect: Z = 1.27 (P = 0.20) 0.02 0.1 1 10 50 Test for subgroup differences: Chi² = 5.18, df = 1 (P = 0.02), I² = 80.7% Favours B3 (niacin) Favours control
Vitamin B3 ControlWeight
Risk RatioM-H, Random, 95% CI
Risk RatioM-H, Random, 95% CI in MI risk
Study or Subgroup1.3.1 No statinsCDPRG 1975Subtotal (95% CI)Total eventsHeterogeneity: Not applicableTest for overall effect: Z = 3.05 (P = 0.002)
1.3.2 Background statin treatmentTaylor et al., 2004 - ARBITER 2Guyton et al., 2008Boden et al., 2011 - AIM HIGHHPS 2 THRIVE 2014Subtotal (95% CI)Total eventsHeterogeneity: Tau² = 0.00; Chi² = 1.57, df = 3 (P = 0.67); I² = 0%Test for overall effect: Z = 0.64 (P = 0.53)
Total (95% CI)Total eventsHeterogeneity: Tau² = 0.01; Chi² = 6.75, df = 4 (P = 0.15); I² = 41%Test for overall effect: Z = 1.27 (P = 0.20)Test for subgroup differences: Chi² = 5.18, df = 1 (P = 0.02), I² = 80.7%
Events
114
114
21
104402
509
623
Total
11191119
87670
17181283815313
16432
Events
386
386
21
93431
527
913
Total
27892789
80272
16961283514883
17672
Weight
32.7%32.7%
0.8%0.4%
23.5%42.7%67.3%
100.0%
M-H, Random, 95% CI
0.74 [0.60, 0.90]0.74 [0.60, 0.90]
0.92 [0.13, 6.38]0.41 [0.03, 6.47]1.10 [0.84, 1.45]0.93 [0.82, 1.07]0.96 [0.85, 1.08]
0.90 [0.75, 1.06]
Year
1975
2004200820112014
Vitamin B3 (Niacin) Control Risk Ratio Risk RatioM-H, Random, 95% CI
0.02 0.1 1 10 50Favours B3 (Niacin) Favours Control
Supplementary Figure 90. Forest plot of niacin (B3) supplementation and MI risk. M-H, Manthel-Haenszel, MI, myocardial infarction. *Boden et al., 2011 - reported number of participants with at least one event. The diamond represents the pooled risk estimate. Inter-study heterogeneity was tested using the Cochran Q statistic (Chi2) at a significance level of P < 0.10, and quantified by the I2 statistic. An I2 value ≥ 50% is considered to indicate substantial heterogeneity. All results are presented as risk ratios with 95% Confidence Intervals, using the Manthel-Haenszel method with random effects model.
123

Subgroup and Study, Year Events Total Events TotalRCTsNo statinsCDPRG 1975 95 1,119 311 2,789 37.8% 0.76 [0.61, 0.95]Subtotal (95% CI) 1,119 2,789 37.8% 0.76 [0.61, 0.95]Total events 95 311 Heterogeneity: Not applicableTest for overall effect: Z = 2.44 (P = 0.01)
Back ground statin treatmentTaylor et al., 2004 - ARBITER 2 0 87 1 80 0.8% 0.31 [0.01, 7.42]Guyton et al., 2008 0 670 1 272 0.8% 0.14 [0.01, 3.32]Boden et al., 2011 - AIM HIGH* 30 1,718 18 1,696 15.8% 1.65 [0.92, 2.94]HPS2-THRIVE Collaborative Group 2014 498 12,838 499 12,835 44.9% 1.00 [0.88, 1.13]Subtotal (95% CI) 15,313 14,883 62.2% 1.10 [0.70, 1.72]Total events 528 519 Heterogeneity: Tau² = 0.08; Chi² = 4.80, df = 3 (P = 0.19); I² = 37%Test for overall effect: Z = 0.42 (P = 0.68)
Total (95% CI) 16,432 17,672 100% 0.95 [0.72, 1.26]Total events 623 830Heterogeneity: Tau² = 0.04; Chi² = 9.89, df = 4 (P = 0.04); I² = 60%Test for overall effect: Z = 0.35 (P = 0.73) 0.05 0.2 1 5 20 Test for subgroup differences: Chi² = 2.09, df = 1 (P = 0.15), I² = 52.2% Favours B3 (niacin) Favours control
Vitamin B3 ControlWeight
Risk RatioM-H, Random, 95% CI
Risk RatioM-H, Random, 95% CI in stroke risk
Study or Subgroup1.5.1 no statinsCDPRG 1975Subtotal (95% CI)Total eventsHeterogeneity: Not applicableTest for overall effect: Z = 2.44 (P = 0.01)
1.5.2 Back ground statin treatmentTaylor et al., 2004 - ARBITER 2Guyton et al., 2008Boden et al., 2011 - AIM HIGHHPS 2 THRIVE 2014Subtotal (95% CI)Total eventsHeterogeneity: Tau² = 0.08; Chi² = 4.80, df = 3 (P = 0.19); I² = 37%Test for overall effect: Z = 0.42 (P = 0.68)
Total (95% CI)Total eventsHeterogeneity: Tau² = 0.04; Chi² = 9.89, df = 4 (P = 0.04); I² = 60%Test for overall effect: Z = 0.35 (P = 0.73)Test for subgroup differences: Chi² = 2.09, df = 1 (P = 0.15), I² = 52.2%
Events
95
95
00
30498
528
623
Total
11191119
87670
17181283815313
16432
Events
311
311
11
18499
519
830
Total
27892789
80272
16961283514883
17672
Weight
37.8%37.8%
0.8%0.8%
15.8%44.9%62.2%
100.0%
M-H, Random, 95% CI
0.76 [0.61, 0.95]0.76 [0.61, 0.95]
0.31 [0.01, 7.42]0.14 [0.01, 3.32]1.65 [0.92, 2.94]1.00 [0.88, 1.13]1.10 [0.70, 1.72]
0.95 [0.72, 1.26]
Year
1975
2004200820112014
Vitamin B3 (Niacin) Control Risk Ratio Risk RatioM-H, Random, 95% CI
0.05 0.2 1 5 20Favours B3 (Niacin) Favours Control
Supplementary Figure 91. Forest plot of niacin (B3) supplementation and stroke risk. M-H, Manthel-Haenszel. *Boden et al., 2011 - reported number of participants with at least one event. The diamond represents the pooled risk estimate. Inter-study heterogeneity was tested using the Cochran Q statistic (Chi2) at a significance level of P < 0.10, and quantified by the I2 statistic. An I2 value ≥ 50% is considered to indicate substantial heterogeneity. All results are presented as risk ratios with 95% Confidence Intervals, using the Manthel-Haenszel method with random effects model.
Subgroup and Study, Year Events Total Events TotalRCTsNo statinsCDPRG 1975 238 1,119 633 2,789 91.0% 0.94 [0.82, 1.07]Subtotal (95% CI) 1,119 2,789 91.0% 0.94 [0.82, 1.07]Total events 238 633 Heterogeneity: Not applicableTest for overall effect: Z = 0.97 (P = 0.33)
Background statin treatmentTaylor et al., 2004 - ARBITER 2 1 87 2 80 0.3% 0.46 [0.04, 4.97]Boden et al., 2011 - AIM HIGH 45 1,718 38 1,696 8.7% 1.17 [0.76, 1.79]Subtotal (95% CI) 1,805 1,776 9.0% 1.14 [0.75, 1.73]Total events 46 40Heterogeneity: Tau² = 0.00; Chi² = 0.57, df = 1 (P = 0.45); I² = 0%Test for overall effect: Z = 0.59 (P = 0.55)
Total (95% CI) 2,924 4,565 100% 0.95 [0.84, 1.08]Total events 284 673 Heterogeneity: Tau² = 0.00; Chi² = 1.31, df = 2 (P = 0.52); I² = 0%Test for overall effect: Z = 0.74 (P = 0.46) 0.05 0.2 1 5 20 Test for subgroup differences: Chi² = 0.73, df = 1 (P = 0.39), I² = 0% Favours B3 (niacin) Favours control
Vitamin B3 ControlWeight
Risk RatioM-H, Random, 95% CI
Risk RatioM-H, Random, 95% CI in CVD mortality risk
Study or Subgroup1.6.1 No statinsCDPRG 1975Subtotal (95% CI)Total eventsHeterogeneity: Not applicableTest for overall effect: Z = 0.97 (P = 0.33)
1.6.2 Background statin treatmentTaylor et al., 2004 - ARBITER 2Boden et al., 2011 - AIM HIGHSubtotal (95% CI)Total eventsHeterogeneity: Tau² = 0.00; Chi² = 0.57, df = 1 (P = 0.45); I² = 0%Test for overall effect: Z = 0.59 (P = 0.55)
Total (95% CI)Total eventsHeterogeneity: Tau² = 0.00; Chi² = 1.31, df = 2 (P = 0.52); I² = 0%Test for overall effect: Z = 0.74 (P = 0.46)Test for subgroup differences: Chi² = 0.73, df = 1 (P = 0.39), I² = 0%
Events
238
238
145
46
284
Total
11191119
8717181805
2924
Events
633
633
238
40
673
Total
27892789
8016961776
4565
Weight
91.0%91.0%
0.3%8.7%9.0%
100.0%
M-H, Random, 95% CI
0.94 [0.82, 1.07]0.94 [0.82, 1.07]
0.46 [0.04, 4.97]1.17 [0.76, 1.79]1.14 [0.75, 1.73]
0.95 [0.84, 1.08]
Year
1975
20042011
Vitamin B3 (Niacin) Control Risk Ratio Risk RatioM-H, Random, 95% CI
0.05 0.2 1 5 20Favours B3 (Niacin) Favours Control
Supplementary Figure 92. Forest plot of niacin (B3) supplementation and CVD mortality risk. M-H, Manthel-Haenszel, CVD, cardiovascular disease. The diamond represents the pooled risk estimate. Inter-study heterogeneity was tested using the Cochran Q statistic (Chi2) at a significance level of P < 0.10, and quantified by the I2 statistic. An I2 value ≥ 50% is considered to indicate substantial heterogeneity. All results are presented as risk ratios with 95% Confidence Intervals, using the Manthel-Haenszel method with random effects model.
124
Subgroup and Study, Year Events Total Events TotalRCTsNo statinsCDPRG 1975 203 1,119 535 2,789 51.5% 0.95 [0.82, 1.09]Subtotal (95% CI) 1,119 2,789 51.5% 0.95 [0.82, 1.09]Total events 203 535 Heterogeneity: Not applicableTest for overall effect: Z = 0.75 (P = 0.45)
Background statin treatmentBoden et al., 2011 - AIM HIGH 38 1,718 34 1,696 5.2% 1.10 [0.70, 1.74]HPS2-THRIVE Collaborative Group 2014 302 12,838 291 12,835 43.3% 1.04 [0.88, 1.22]Subtotal (95% CI) 14,556 14,531 48.5% 1.04 [0.90, 1.21]Total events 340 325Heterogeneity: Tau² = 0.00; Chi² = 0.06, df = 1 (P = 0.80); I² = 0%Test for overall effect: Z = 0.57 (P = 0.57)
Total (95% CI) 15,675 17,320 100% 0.99 [0.89, 1.10]Total events 543 860 Heterogeneity: Tau² = 0.00; Chi² = 0.93, df = 2 (P = 0.63); I² = 0%Test for overall effect: Z = 0.14 (P = 0.89) 0.7 0.85 1 1.2 1.5Test for subgroup differences: Chi² = 0.86, df = 1 (P = 0.35), I² = 0% Favours B3 (niacin) Favours control
Vitamin B3 ControlWeight
Risk RatioM-H, Random, 95% CI
Risk RatioM-H, Random, 95% CI in CHD mortality risk
Study or Subgroup1.7.1 No statinsCDPRG 1975Subtotal (95% CI)Total eventsHeterogeneity: Not applicableTest for overall effect: Z = 0.75 (P = 0.45)
1.7.2 Background statin treatmentBoden et al., 2011 - AIM HIGHHPS 2 THRIVE 2014Subtotal (95% CI)Total eventsHeterogeneity: Tau² = 0.00; Ch i² = 0.06, df = 1 (P = 0.80); I² = 0%Test for overall effect: Z = 0.57 (P = 0.57)
Total (95% CI)Total eventsHeterogeneity: Tau² = 0.00; Ch i² = 0.93, df = 2 (P = 0.63); I² = 0%Test for overall effect: Z = 0.14 (P = 0.89)Test for subgroup differences: Chi² = 0.86, df = 1 (P = 0.35), I² = 0%
Events
203
203
38302
340
543
Total
11191119
17181283814556
15675
Events
535
535
34291
325
860
Total
27892789
16961283514531
17320
Weight
51.5%51.5%
5.2%43.3%48.5%
100.0%
M-H, Random, 95% CI
0.95 [0.82, 1.09]0.95 [0.82, 1.09]
1.10 [0.70, 1.74]1.04 [0.88, 1.22]1.04 [0.90, 1.21]
0.99 [0.89, 1.10]
Year
1975
20112014
Vitamin B3 (Niacin) Control Risk Ratio Risk RatioM-H, Random, 95% CI
0.7 0.85 1 1.2 1.5Favours B3 (Niacin) Favours Control
Supplementary Figure 93. Forest plot of niacin (B3) supplementation and CHD mortality risk. M-H, Manthel-Haenszel, CHD, coronary heart disease. The diamond represents the pooled risk estimate. Inter-study heterogeneity was tested using the Cochran Q statistic (Chi2) at a significance level of P < 0.10, and quantified by the I2 statistic. An I2 value ≥ 50% is considered to indicate substantial heterogeneity. All results are presented as risk ratios with 95% Confidence Intervals, using the Manthel-Haenszel method with random effects model.
Subgroup and Study, Year Events Total Events TotalNo statinsCDPRG 1975 273 1,119 709 2,789 38.8% 0.96 [0.85, 1.08]Subtotal (95% CI) 1,119 2,789 38.8% 0.96 [0.85, 1.08]Total events 273 709 Heterogeneity: Not applicableTest for overall effect: Z = 0.67 (P = 0.51)
Background statin treatmentSang et al., 2009* - 52 1 56 0.1% 0.36 [0.01, 8.61]Boden et al., 2011 - AIM HIGH 96 1,718 82 1,696 8.9% 1.16 [0.87, 1.54]HPS2-THRIVE Collaborative Group 2014 798 12,838 732 12,835 52.3% 1.09 [0.99, 1.20]Subtotal (95% CI) 14,608 14,587 61.2% 1.10 [1.00, 1.20]Total events 894 815Heterogeneity: Tau² = 0.00; Chi² = 0.62, df = 2 (P = 0.73); I² = 0%Test for overall effect: Z = 1.94 (P = 0.05)
Total (95% CI) 15,727 17,376 100.0% 1.04 [0.95, 1.14]Total events 1,167 1,524 Heterogeneity: Tau² = 0.00; Chi² = 3.55, df = 3 (P = 0.31); I² = 16%Test for overall effect: Z = 0.91 (P = 0.36) 0.2 0.5 1 2 5 Test for subgroup differences: Chi² = 2.90, df = 1 (P = 0.09), I² = 65.6% Favours B3 (niacin) Favours control
Vitamin B3 ControlWeight
Risk RatioM-H, Random, 95% CI
Risk RatioM-H, Random, 95% CI in all-cause mortality risk
Study or Subgroup1.5.1 No statinsCDPRG 1975Subtotal (95% CI)Total eventsHeterogeneity: Not applicableTest for overall effect: Z = 0.67 (P = 0.51)
1.5.2 Background statin treatmentSang et al., 2009Boden et al., 2011 - AIM HIGHHPS2-THRIVE Collaborative Group 2014Subtotal (95% CI)Total eventsHeterogeneity: Tau² = 0.00; Chi² = 0.62, df = 2 (P = 0.73); I² = 0%Test for overall effect: Z = 1.94 (P = 0.05)
Total (95% CI)Total eventsHeterogeneity: Tau² = 0.00; Chi² = 3.55, df = 3 (P = 0.31); I² = 16%Test for overall effect: Z = 0.91 (P = 0.36)Test for subgroup differences: Chi² = 2.90, df = 1 (P = 0.09), I² = 65.6%
Events
273
273
096
798
894
1167
Total
11191119
521718
1283814608
15727
Events
709
709
182
732
815
1524
Total
27892789
561696
1283514587
17376
Weight
38.8%38.8%
0.1%8.9%
52.3%61.2%
100.0%
M-H, Random, 95% CI
0.96 [0.85, 1.08]0.96 [0.85, 1.08]
0.36 [0.01, 8.61]1.16 [0.87, 1.54]1.09 [0.99, 1.20]1.10 [1.00, 1.20]
1.04 [0.95, 1.14]
Year
1975
200920112014
Vitamin B3 (Niacin) Control Risk Ratio Risk RatioM-H, Random, 95% CI
0.2 0.5 1 2 5Favours B3 (Niacin) Favours Control
Supplementary Figure 94. Forest plot of niacin (B3) supplementation and all-cause mortality risk. M-H, Manthel-Haenszel. *Sang et al., 2009 - Data taken from meta-analysis Keene et al., 2014. The diamond represents the pooled risk estimate. Inter-study heterogeneity was tested using the Cochran Q statistic (Chi2) at a significance level of P < 0.10, and quantified by the I2 statistic. An I2 value ≥ 50% is considered to indicate substantial heterogeneity. All results are presented as risk ratios with 95% Confidence Intervals, using the Manthel-Haenszel method with random effects model.
125

Random Effects
Comparison RCTs/Cohorts
N Events RR (95% CIs) RR (95% CIs) I2 p -value
CVD (RCTs)
Total CVD 1 1,877 347 1.03 [0.85, 1.24] N/A 0.78MI 2 3,429 427 1.04 [0.87, 1.23] 0% 0.69
Stroke 2 3,429 88 0.92 [0.61, 1.40] 0% 0.70
MI mortality 1 1,877 120 1.04 [0.74, 1.48] N/A 0.81
ALL-CAUSE MORTALITY
All-cause mortality (RCTs) 2 3,429 239 1.02 [0.80, 1.30] 0% 0.88
Pooled Effect Estimates
Favours vitamin B6/ Favours control/ Negative association Positive association
0.5 1.0 1.5
Supplementary Figure 95. Summary of the pooled effect estimates of RCTs studies assessing the relationship between vitamin B6 supplementation and CVD and all cause mortality risk. RR, risk ratio; CIs, confidence intervals; RTCs, randomized clinical trials; CVD, cardiovascular disease; MI, myocardial infarction; N/A, not applicable. The diamonds represents the pooled risk estimate. Inter-study heterogeneity was tested using the Cochran Q statistic (Chi2) at a significance level of P < 0.10, and quantified by the I2 statistic. An I2 value ≥ 50% is considered to indicate substantial heterogeneity. All results are presented as risk ratios with 95% CIs, using the Manthel-Haenszel method with random effects model.
Subgroup and Study, Year Events Total Events TotalRCTsBonaa et al., 2006 - NORVIT 175 934 172 943 100.0% 1.03 [0.85, 1.24]
Total (95% CI) 934 943 100% 1.03 [0.85, 1.24]Total events 175 172 Heterogeneity: Not applicableTest for overall effect: Z = 0.28 (P = 0.78) 0.2 0.5 1 2 5
Favours vitamin B6 Favours control
Vitamin B6 ControlWeight
Risk RatioM-H, Random, 95% CI
Risk RatioM-H, Random, 95% CI in total CVD risk
Study or SubgroupBonaa et al., 2006 - NORVIT
Total (95% CI)Total eventsHeterogeneity: Not applicableTest for overall effect: Z = 0.28 (P = 0.78)
Events175
175
Total934
934
Events172
172
Total943
943
Weight100.0%
100.0%
M-H, Random, 95% CI1.03 [0.85, 1.24]
1.03 [0.85, 1.24]
Year2006
Vitamin B6 Control Risk Ratio Risk RatioM-H, Random, 95% CI
0.2 0.5 1 2 5Favours vitamin B6 Favours control
Supplementary Figure 96. Forest plot of vitamin B6 supplementation and total CVD risk. M-H, Manthel-Haenszel, CVD, cardiovascular disease. The diamond represents the pooled risk estimate. Inter-study heterogeneity was tested using the Cochran Q statistic (Chi2) at a significance level of P < 0.10, and quantified by the I2 statistic. An I2 value ≥ 50% is considered to indicate substantial heterogeneity. All results are presented as risk ratios with 95% Confidence Intervals, using the Manthel-Haenszel method with random effects model.
126

Subgroup and Study, Year Events Total Events TotalRCTsBonaa et al., 2006 - NORVIT 161 934 153 943 75.6% 1.06 [0.87, 1.30]Ebbing et al., 2008 - WENBIT 55 772 58 780 24.4% 0.96 [0.67, 1.37]
Total (95% CI) 1,706 1,723 100% 1.04 [0.87, 1.23]Total events 216 211 Heterogeneity: Tau² = 0.00; Chi² = 0.25, df = 1 (P = 0.62); I² = 0%Test for overall effect: Z = 0.39 (P = 0.69) 0.7 0.85 1 1.2 1.5
Favours vitamin B6 Favours control
Vitamin B6 ControlWeight
Risk RatioM-H, Random, 95% CI
Risk RatioM-H, Random, 95% CI in MI risk
Study or SubgroupBonaa et al., 2006 - NORVITEbbing et al., 2008 - WENBIT
Total (95% CI)Total eventsHeterogeneity: Tau² = 0.00; Chi² = 0.25, df = 1 (P = 0.62); I² = 0%Test for overall effect: Z = 0.39 (P = 0.69)
Events16155
216
Total934772
1706
Events15358
211
Total943780
1723
Weight75.6%24.4%
100.0%
M-H, Random, 95% CI1.06 [0.87, 1.30]0.96 [0.67, 1.37]
1.04 [0.87, 1.23]
Year20062008
Vitamin B6 Control Risk Ratio Risk RatioM-H, Random, 95% CI
0.7 0.85 1 1.2 1.5Favours vitamin B6 Favours control
Supplementary Figure 97. Forest plot of vitamin B6 supplementation and MI risk. M-H, Manthel-Haenszel, MI, myocardial infarction. The diamond represents the pooled risk estimate. Inter-study heterogeneity was tested using the Cochran Q statistic (Chi2) at a significance level of P < 0.10, and quantified by the I2 statistic. An I2 value ≥ 50% is considered to indicate substantial heterogeneity. All results are presented as risk ratios with 95% Confidence Intervals, using the Manthel-Haenszel method with random effects model.
Subgroup and Study, Year Events Total Events TotalRCTsBonaa et al., 2006 - NORVIT 22 934 27 943 55.5% 0.82 [0.47, 1.43]Ebbing et al., 2008 - WENBIT 20 772 19 780 44.5% 1.06 [0.57, 1.98]
Total (95% CI) 1,706 1,723 100% 0.92 [0.61, 1.40]Total events 42 46 Heterogeneity: Tau² = 0.00; Chi² = 0.37, df = 1 (P = 0.55); I² = 0%Test for overall effect: Z = 0.38 (P = 0.70) 0.05 0.2 1 5 20
Favours vitamin B6 Favours control
Vitamin B6 ControlWeight
Risk RatioM-H, Random, 95% CI
Risk RatioM-H, Random, 95% CI in stroke risk
Study or SubgroupBonaa et al., 2006 - NORVITEbbing et al., 2008 - WENBIT
Total (95% CI)Total eventsHeterogeneity: Tau² = 0.00; Chi² = 0.37, df = 1 (P = 0.55); I² = 0%Test for overall effect: Z = 0.38 (P = 0.70)
Events2220
42
Total934772
1706
Events2719
46
Total943780
1723
Weight55.5%44.5%
100.0%
M-H, Random, 95% CI0.82 [0.47, 1.43]1.06 [0.57, 1.98]
0.92 [0.61, 1.40]
Year20062008
Vitamin B6 Control Risk Ratio Risk RatioM-H, Random, 95% CI
0.05 0.2 1 5 20Favours vitamin B6 Favours control
Supplementary Figure 98. Forest plot of vitamin B6 supplementation and stroke risk. M-H, Manthel-Haenszel. The diamond represents the pooled risk estimate. Inter-study heterogeneity was tested using the Cochran Q statistic (Chi2) at a significance level of P < 0.10, and quantified by the I2 statistic. An I2 value ≥ 50% is considered to indicate substantial heterogeneity. All results are presented as risk ratios with 95% Confidence Intervals, using the Manthel-Haenszel method with random effects model.
Subgroup and Study, Year Events Total Events TotalRCTsBonaa et al., 2006 - NORVIT 61 934 59 943 100% 1.04 [0.74, 1.48]
Total (95% CI) 934 943 100% 1.04 [0.74, 1.48]Total events 61 59 Heterogeneity: Not applicableTest for overall effect: Z = 0.24 (P = 0.81) 0.5 0.7 1 1.5 2
Favours vitamin B6 Favours control
Vitamin B6 ControlWeight
Risk RatioM-H, Random, 95% CI
Risk RatioM-H, Random, 95% CI in MI mortality risk
Study or SubgroupBonaa et al., 2006 - NORVIT
Total (95% CI)Total eventsHeterogeneity: Not applicableTest for overall effect: Z = 0.24 (P = 0.81)
Events61
61
Total934
934
Events59
59
Total943
943
Weight100.0%
100.0%
M-H, Random, 95% CI1.04 [0.74, 1.48]
1.04 [0.74, 1.48]
Year2006
Vitamin B6 Control Risk Ratio Risk RatioM-H, Random, 95% CI
0.5 0.7 1 1.5 2Favours vitamin B6 Favours control
Supplementary Figure 99. Forest plot of vitamin B6 supplementation and MI mortality risk. M-H, Manthel-Haenszel, MI, myocardial infarction. The diamond represents the pooled risk estimate. Inter-study heterogeneity was tested using the Cochran Q statistic (Chi2) at a significance level of P < 0.10, and quantified by the I2 statistic. An I2 value ≥ 50% is considered to indicate substantial heterogeneity. All results are presented as risk ratios with 95% Confidence Intervals, using the Manthel-Haenszel method with random effects model.
127

Subgroup and Study, Year Events Total Events TotalRCTsBonaa et al., 2006 - NORVIT 92 934 89 943 76.9% 1.04 [0.79, 1.38]Ebbing et al., 2008 - WENBIT 28 772 30 780 23.1% 0.94 [0.57, 1.56]
Total (95% CI) 1,706 1,723 100% 1.02 [0.80, 1.30]
Total events 120 119 Heterogeneity: Tau² = 0.00; Chi² = 0.12, df = 1 (P = 0.73); I² = 0%Test for overall effect: Z = 0.16 (P = 0.88) 0.5 0.7 1 1.5 2
Favours vitamin B6 Favours control
Vitamin B6 Control Risk RatioM-H, Random, 95% CI
Risk RatioM-H, Random, 95% CI in all-cause mortality riskWeight
Study or SubgroupBonaa et al., 2006 - NORVITEbbing et al., 2008 - WENBIT
Total (95% CI)Total eventsHeterogeneity: Tau² = 0.00; Chi² = 0.12, df = 1 (P = 0.73); I² = 0%Test for overall effect: Z = 0.16 (P = 0.88)
Events9228
120
Total934772
1706
Events8930
119
Total943780
1723
Weight76.9%23.1%
100.0%
M-H, Random, 95% CI1.04 [0.79, 1.38]0.94 [0.57, 1.56]
1.02 [0.80, 1.30]
Year20062008
Vitamin B6 Control Risk Ratio Risk RatioM-H, Random, 95% CI
0.5 0.7 1 1.5 2Favours vitamin B6 Favours control
Supplementary Figure 100. Forest plot of vitamin B6 supplementation and all-cause mortality risk. M-H, Manthel-Haenszel. The diamond represents the pooled risk estimate. Inter-study heterogeneity was tested using the Cochran Q statistic (Chi2) at a significance level of P < 0.10, and quantified by the I2 statistic. An I2 value ≥ 50% is considered to indicate substantial heterogeneity. All results are presented as risk ratios with 95% Confidence Intervals, using the Manthel-Haenszel method with random effects model.
Random Effects
Comparison RCTs N Events RR (95% CIs) RR (95% CIs) I2 p -value
CVD
Total CVD 3 3,328 364 1.43 [0.79, 2.59]80% 0.23
Total CHD 2 3,171 166 1.16 [0.87, 1.56] 0% 0.32MI 4 5,387 231 1.69 [0.94, 3.04] 69% 0.08Stroke 3 3,861 178 1.29 [0.96, 1.72] 0% 0.09Total CVD mortality 2 2,931 47 1.24 [0.27, 5.65] 53% 0.78Total CHD mortality 1 5,292 338 1.15 [0.94, 1.41] N/A 0.18MI mortality 1 1,460 22 1.44 [0.62, 3.36] N/A 0.39Stroke mortality 1 1,460 14 0.75 [0.26, 2.15] N/A 0.59
ALL-CAUSE MORTALITY All-cause mortality 6 9,765 1,084 1.08 [0.97, 1.21] 0% 0.16
Favours calcium/ Favours control/ Negative association Positive association
Pooled Effect Estimates
0.0 0.5 1.0 1.5 2.0
Supplementary Figure 101. Summary of the pooled effect estimates of RCTs studies assessing the relationship between calcium supplementation and CVD and all cause mortality risk. RR, risk ratio; CIs, confidence intervals; RTCs, randomized clinical trials; CVD, cardiovascular disease; CHD, coronary heart disease; MI, myocardial infarction; N/A, not applicable. The diamonds represents the pooled risk estimate. Inter-study heterogeneity was tested using the Cochran Q statistic (Chi2) at a significance level of P < 0.10, and quantified by the I2 statistic. An I2 value ≥ 50% is considered to indicate substantial heterogeneity. All results are presented as risk ratios with 95% CIs, using the Manthel-Haenszel method with random effects model.
128
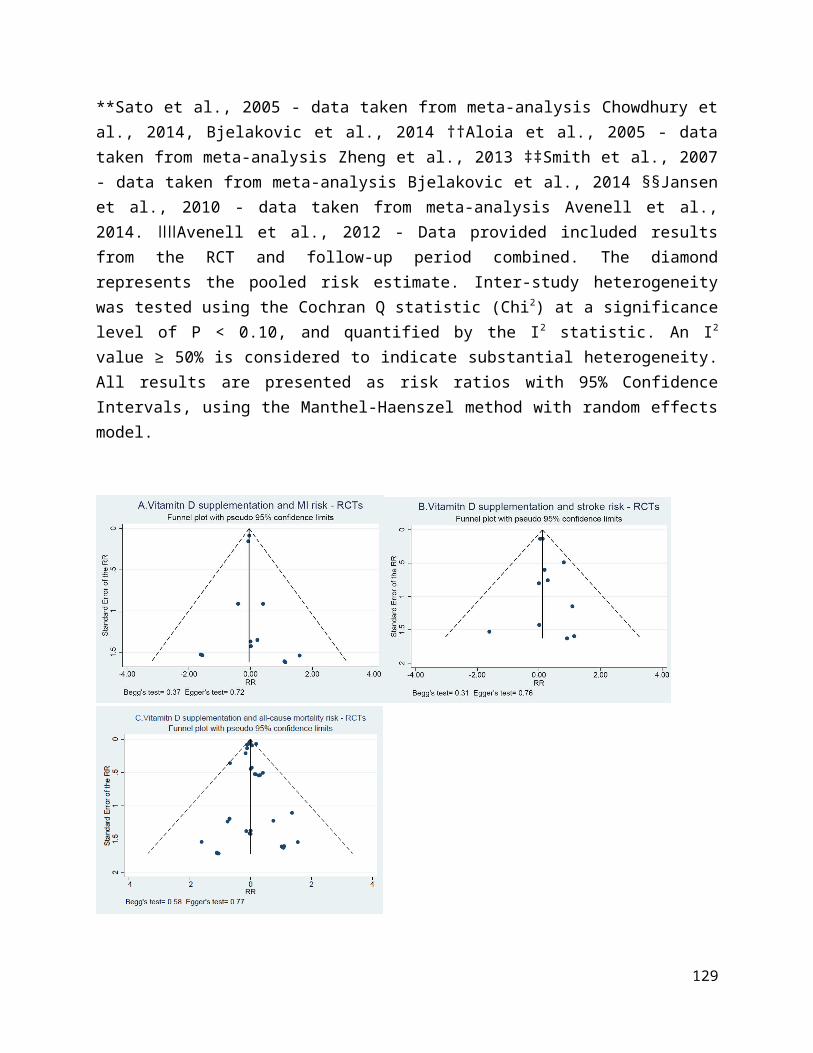
Subgroup and Study, Year Events Total Events TotalRCTsBolland et al., 2008 101 732 54 739 47.1% 1.89 [1.38, 2.59]Chailurkit et al., 2010 2 201 0 196 3.6% 4.88 [0.24, 100.93]Lewis et al., 2011 - CAIFOS* 104 730 103 730 49.4% 1.01 [0.78, 1.30]
Total (95% CI) 1,663 1,665 100% 1.43 [0.79, 2.59]Total events 207 157 Heterogeneity: Tau² = 0.17; Chi² = 10.04, df = 2 (P = 0.007); I² = 80%Test for overall effect: Z = 1.19 (P = 0.23) 0.01 0.1 1 10 100
Favours calcium Favours control
Calcium ControlWeight
Risk RatioM-H, Random, 95% CI
Risk RatioM-H, Random, 95% CI in total CVD risk
Study or SubgroupBolland et al., 2008Chailurkit et al., 2010Lewis et al., 2011 - CAIFOS
Total (95% CI)Total eventsHeterogeneity: Tau² = 0.17; Chi² = 10.04, df = 2 (P = 0.007); I² = 80%Test for overall effect: Z = 1.19 (P = 0.23)
Events101
2104
207
Total732201730
1663
Events540
103
157
Total739196730
1665
Weight47.1%3.6%
49.4%
100.0%
M-H, Random, 95% CI1.89 [1.38, 2.59]
4.88 [0.24, 100.93]1.01 [0.78, 1.30]
1.43 [0.79, 2.59]
Year200820102011
Calcium Control Risk Ratio Risk RatioM-H, Random, 95% CI
0.01 0.1 1 10 100Favours calcium Favours control
Supplementary Figure 102. Forest plot of calcium supplementation and total CVD risk. M-H, Manthel-Haenszel, CVD, cardiovascular disease. *Lewis et al., 2011 - reported number of participants with at least one event. The diamond represents the pooled risk estimate. Inter-study heterogeneity was tested using the Cochran Q statistic (Chi2) at a significance level of P < 0.10, and quantified by the I2 statistic. An I2 value ≥ 50% is considered to indicate substantial heterogeneity. All results are presented as risk ratios with 95% Confidence Intervals, using the Manthel-Haenszel method with random effects model.
Subgroup and Study, Year Events Total Events TotalRCTsBaron et al., 1999 50 464 46 466 60.0% 1.09 [0.75, 1.60]Grant et al., 2005 - RECORD* 39 1,113 31 1,128 40.0% 1.28 [0.80, 2.03]
Total (95% CI) 1,577 1,594 100% 1.16 [0.87, 1.56]Total events 89 77 Heterogeneity: Tau² = 0.00; Chi² = 0.26, df = 1 (P = 0.61); I² = 0%Test for overall effect: Z = 1.00 (P = 0.32) 0.2 0.5 1 2 5
Favours calcium Favours control
Calcium ControlWeight
Risk RatioM-H, Random, 95% CI
Risk RatioM-H, Random, 95% CI in total CHD risk
Study or SubgroupBaron et al., 1999Grant et al., 2005 - RECORD
Total (95% CI)Total eventsHeterogeneity: Tau² = 0.00; Chi² = 0.26, df = 1 (P = 0.61); I² = 0%Test for overall effect: Z = 1.00 (P = 0.32)
Events5039
89
Total464
1113
1577
Events4631
77
Total466
1128
1594
Weight60.0%40.0%
100.0%
M-H, Random, 95% CI1.09 [0.75, 1.60]1.28 [0.80, 2.03]
1.16 [0.87, 1.56]
Year19992005
Calcium Control Risk Ratio Risk RatioM-H, Random, 95% CI
0.2 0.5 1 2 5Favours calcium Favours control
Supplementary Figure 103. Forest plot of calcium supplementation and total CHD risk. M-H, Manthel-Haenszel, CHD, coronary heart disease. *Grant et al., 2005 - data taken from Lewis et al, 2015 (meta), however, data include women only; The diamond represents the pooled risk estimate. Inter-study heterogeneity was tested using the Cochran Q statistic (Chi2) at a significance level of P < 0.10, and quantified by the I2 statistic. An I2 value ≥ 50% is considered to indicate substantial heterogeneity. All results are presented as risk ratios with 95% Confidence Intervals, using the Manthel-Haenszel method with random effects model.
129

Subgroup and Study, Year Events Total Events TotalRCTsGrant et al., 2005 - RECORD* 26 1,113 13 1,128 27.6% 2.03 [1.05, 3.92]Reid et al., 2008† 2 108 - 107 3.5% 4.95 [0.24, 101.99]Bolland et al., 2008 45 732 19 739 31.6% 2.39 [1.41, 4.05]Lewis et al., 2011 - CAIFOS‡ 63 730 63 730 37.3% 1.00 [0.72, 1.40]
Total (95% CI) 2,683 2,704 100% 1.69 [0.94, 3.04]Total events 136 95 Heterogeneity: Tau² = 0.21; Chi² = 9.81, df = 3 (P = 0.02); I² = 69%Test for overall effect: Z = 1.76 (P = 0.08) 0.02 0.1 1 10 50
Favours calcium Favours control
Calcium ControlWeight
Risk RatioM-H, Random, 95% CI
Risk RatioM-H, Random, 95% CI in MI risk
Study or SubgroupGrant et al., 2005 - RECORDReid et al., 2008Bolland et al., 2008Lewis et al., 2011 - CAIFOS
Total (95% CI)Total eventsHeterogeneity: Tau² = 0.21; Chi² = 9.81, df = 3 (P = 0.02); I² = 69%Test for overall effect: Z = 1.76 (P = 0.08)
Events262
4563
136
Total1113108732730
2683
Events130
1963
95
Total1128107739730
2704
Weight27.6%3.5%
31.6%37.3%
100.0%
M-H, Random, 95% CI2.03 [1.05, 3.92]
4.95 [0.24, 101.99]2.39 [1.41, 4.05]1.00 [0.72, 1.40]
1.69 [0.94, 3.04]
Year2005200820082011
Calcium Control Risk Ratio Risk RatioM-H, Random, 95% CI
0.02 0.1 1 10 50Favours calcium Favours control
Supplementary Figure 104. Forest plot of calcium supplementation and MI risk. M-H, Manthel-Haenszel, MI, Myocardial infarction. *Grant et al., 2005 - data taken from Lewis et al, 2015 (meta), however, data include women only; †Reid et al., 2008 - highest dose of calcium (1200mg/day) used as intervention group; ‡Lewis et al., 2011 - reported number of participants with at least one event. The diamond represents the pooled risk estimate. Inter-study heterogeneity was tested using the Cochran Q statistic (Chi2) at a significance level of P < 0.10, and quantified by the I2 statistic. An I2 value ≥ 50% is considered to indicate substantial heterogeneity. All results are presented as risk ratios with 95% Confidence Intervals, using the Manthel-Haenszel method with random effects model.
Subgroup and Study, Year Events Total Events TotalRCTsBaron et al., 1999 12 464 11 466 12.9% 1.10 [0.49, 2.46]Bolland et al., 2008 52 732 34 739 47.6% 1.54 [1.01, 2.35]Lewis et al., 2011 - CAIFOS* 36 730 33 730 39.5% 1.09 [0.69, 1.73]
Total (95% CI) 1,926 1,935 100% 1.29 [0.96, 1.72]Total events 100 78 Heterogeneity: Tau² = 0.00; Chi² = 1.37, df = 2 (P = 0.50); I² = 0%Test for overall effect: Z = 1.71 (P = 0.09) 0.2 0.5 1 2 5
Favours calcium Favours control
Calcium ControlWeight
Risk RatioM-H, Random, 95% CI
Risk RatioM-H, Random, 95% CI in stroke risk
Study or SubgroupBaron et al., 1999Bolland et al., 2008Lewis et al., 2011 - CAIFOS
Total (95% CI)Total eventsHeterogeneity: Tau² = 0.00; Chi² = 1.37, df = 2 (P = 0.50); I² = 0%Test for overall effect: Z = 1.71 (P = 0.09)
Events125236
100
Total464732730
1926
Events113433
78
Total466739730
1935
Weight12.9%47.6%39.5%
100.0%
M-H, Random, 95% CI1.10 [0.49, 2.46]1.54 [1.01, 2.35]1.09 [0.69, 1.73]
1.29 [0.96, 1.72]
Year199920082011
Calcium Control Risk Ratio Risk RatioM-H, Random, 95% CI
0.2 0.5 1 2 5Favours calcium Favours control
Supplementary Figure 105. Forest plot of calcium supplementation and stroke risk. M-H, Manthel-Haenszel. *Lewis et al., 2011 - reported number of participants with at least one event; The diamond represents the pooled risk estimate. Inter-study heterogeneity was tested using the Cochran Q statistic (Chi2) at a significance level of P < 0.10, and quantified by the I2 statistic. An I2 value ≥ 50% is considered to indicate substantial heterogeneity. All results are presented as risk ratios with 95% Confidence Intervals, using the Manthel-Haenszel method with random effects model.
130

Subgroup and Study, Year Events Total Events TotalRCTsBolland et al., 2008 4 732 1 739 29.9% 4.04 [0.45, 36.04]Lewis et al., 2011 - CAIFOS* 18 730 24 730 70.1% 0.75 [0.41, 1.37]
Total (95% CI) 1,462 1,469 100% 1.24 [0.27, 5.65]Total events 22 25 Heterogeneity: Tau² = 0.76; Chi² = 2.13, df = 1 (P = 0.14); I² = 53% 0.002 0.1 1 10 500Test for overall effect: Z = 0.28 (P = 0.78) Favours calcium Favours control
Calcium ControlWeight
Risk RatioM-H, Random, 95% CI
Risk RatioM-H, Random, 95% CI in CVD mortality risk
Study or SubgroupBolland et al., 2008Lewis et al., 2011 - CAIFOS
Total (95% CI)Total eventsHeterogeneity: Tau² = 0.76; Chi² = 2.13, df = 1 (P = 0.14); I² = 53%Test for overall effect: Z = 0.28 (P = 0.78)
Events4
18
22
Total732730
1462
Events1
24
25
Total739730
1469
Weight29.9%70.1%
100.0%
M-H, Random, 95% CI4.04 [0.45, 36.04]
0.75 [0.41, 1.37]
1.24 [0.27, 5.65]
Year20082011
Calcium Control Risk Ratio Risk RatioM-H, Random, 95% CI
0.002 0.1 1 10 500Favours calcium Favours control
Supplementary Figure 106. Forest plot of calcium supplementation and CVD mortality risk. M-H, Manthel-Haenszel, CVD, cardiovascular disease. *Lewis et al., 2011 - reported number of participants with at least one event. The diamond represents the pooled risk estimate. Inter-study heterogeneity was tested using the Cochran Q statistic (Chi2) at a significance level of P < 0.10, and quantified by the I2 statistic. An I2 value ≥ 50% is considered to indicate substantial heterogeneity. All results are presented as risk ratios with 95% Confidence Intervals, using the Manthel-Haenszel method with random effects model.
Subgroup and Study, Year Events Total Events TotalRCTsLewis et al., 2011 - CAIFOS* 13 730 9 730 100% 1.44 [0.62, 3.36]
Total (95% CI) 730 730 100% 1.44 [0.62, 3.36]Total events 13 9 Heterogeneity: Not applicableTest for overall effect: Z = 0.85 (P = 0.39) 0.01 0.1 1 10 100
Favours calcium Favours control
Calcium ControlWeight
Risk RatioM-H, Random, 95% CI
Risk RatioM-H, Random, 95% CI in MI mortality risk
Study or SubgroupLewis et al., 2011 - CAIFOS
Total (95% CI)Total eventsHeterogeneity: Not applicableTest for overall effect: Z = 0.85 (P = 0.39)
Events13
13
Total730
730
Events9
9
Total730
730
Weight100.0%
100.0%
M-H, Random, 95% CI1.44 [0.62, 3.36]
1.44 [0.62, 3.36]
Year2011
Calcium Control Risk Ratio Risk RatioM-H, Random, 95% CI
0.01 0.1 1 10 100Favours calcium Favours control
Supplementary Figure 107. Forest plot of calcium supplementation and MI mortality risk. M-H, Manthel-Haenszel, MI, myocardial infarction. *Lewis et al., 2011 - reported number of participants with at least one event. The diamond represents the pooled risk estimate. Inter-study heterogeneity was tested using the Cochran Q statistic (Chi2) at a significance level of P < 0.10, and quantified by the I2 statistic. An I2 value ≥ 50% is considered to indicate substantial heterogeneity. All results are presented as risk ratios with 95% Confidence Intervals, using the Manthel-Haenszel method with random effects model.
131

Subgroup and Study, Year Events Total Events TotalRCTsLewis et al., 2011 - CAIFOS* 6 730 8 730 100.0% 0.75 [0.26, 2.15]
Total (95% CI) 730 730 100% 0.75 [0.26, 2.15]Total events 6 8 Heterogeneity: Not applicableTest for overall effect: Z = 0.54 (P = 0.59) 0.002 0.1 1 10 500
Favours calcium Favours control
Calcium ControlWeight
Risk RatioM-H, Random, 95% CI
Risk RatioM-H, Random, 95% CI in stroke mortality risk
Study or SubgroupLewis et al., 2011 - CAIFOS
Total (95% CI)Total eventsHeterogeneity: Not applicableTest for overall effect: Z = 0.54 (P = 0.59)
Events6
6
Total730
730
Events8
8
Total730
730
Weight100.0%
100.0%
M-H, Random, 95% CI0.75 [0.26, 2.15]
0.75 [0.26, 2.15]
Year2011
Calclium Control Risk Ratio Risk RatioM-H, Random, 95% CI
0.002 0.1 1 10 500Favours calcium Favours control
Supplementary Figure 108. Forest plot of calcium supplementation and stroke mortality risk. M-H, Manthel-Haenszel. *Lewis et al., 2011 - reported number of participants with at least one event. The diamond represents the pooled risk estimate. Inter-study heterogeneity was tested using the Cochran Q statistic (Chi2) at a significance level of P < 0.10, and quantified by the I2 statistic. An I2 value ≥ 50% is considered to indicate substantial heterogeneity. All results are presented as risk ratios with 95% Confidence Intervals, using the Manthel-Haenszel method with random effects model.
Subgroup and Study, Year Events Total Events TotalRCTsBaron et al., 1999 25 464 22 466 3.9% 1.14 [0.65, 1.99]Grant et al., 2005 - RECORD 464 2,617 434 2,675 84.9% 1.09 [0.97, 1.23]Reid et al., 2008* 1 108 1 107 0.2% 0.99 [0.06, 15.64]Bolland et al., 2008 38 732 30 739 5.5% 1.28 [0.80, 2.04]Chailurkit et al., 2010 1 201 1 196 0.2% 0.98 [0.06, 15.48]Lewis et al., 2011 - CAIFOS 29 730 38 730 5.4% 0.76 [0.48, 1.22]
Total (95% CI) 4,852 4,913 100% 1.08 [0.97, 1.21]Total events 558 526 Heterogeneity: Tau² = 0.00; Chi² = 2.66, df = 5 (P = 0.75); I² = 0%Test for overall effect: Z = 1.42 (P = 0.16) 0.05 0.2 1 5 20
Favours calcium Favours control
Calcium ControlWeight
Risk RatioM-H, Random, 95% CI
Risk RatioM-H, Random, 95% CI in all-cause mortality risk
Study or SubgroupBaron et al., 1999Grant et al., 2005 - RECORDReid et al., 2008Bolland et al., 2008Chailurkit et al., 2010Lewis et al., 2011 - CAIFOS
Total (95% CI)Total eventsHeterogeneity: Tau² = 0.00; Chi² = 2.66, df = 5 (P = 0.75); I² = 0%Test for overall effect: Z = 1.42 (P = 0.16)
Events25
4641
381
29
558
Total464
2617108732201730
4852
Events22
4341
301
38
526
Total466
2675107739196730
4913
Weight3.9%
84.9%0.2%5.5%0.2%5.4%
100.0%
M-H, Random, 95% CI1.14 [0.65, 1.99]1.09 [0.97, 1.23]
0.99 [0.06, 15.64]1.28 [0.80, 2.04]
0.98 [0.06, 15.48]0.76 [0.48, 1.22]
1.08 [0.97, 1.21]
Year199920052008200820102011
Calcium Control Risk Ratio Risk RatioM-H, Random, 95% CI
0.05 0.2 1 5 20Favours calcium Favours control
Supplementary Figure 109. Forest plot of calcium supplementation and all-cause mortality risk. M-H, Manthel-Haenszel. *Reid et al., 2008 - highest dose of calcium (1200mg/day) used as intervention group. The diamond represents the pooled risk estimate. Inter-study heterogeneity was tested using the Cochran Q statistic (Chi2) at a significance level of P < 0.10, and quantified by the I2 statistic. An I2 value ≥ 50% is considered to indicate substantial heterogeneity. All results are presented as risk ratios with 95% Confidence Intervals, using the Manthel-Haenszel method with random effects model.
132
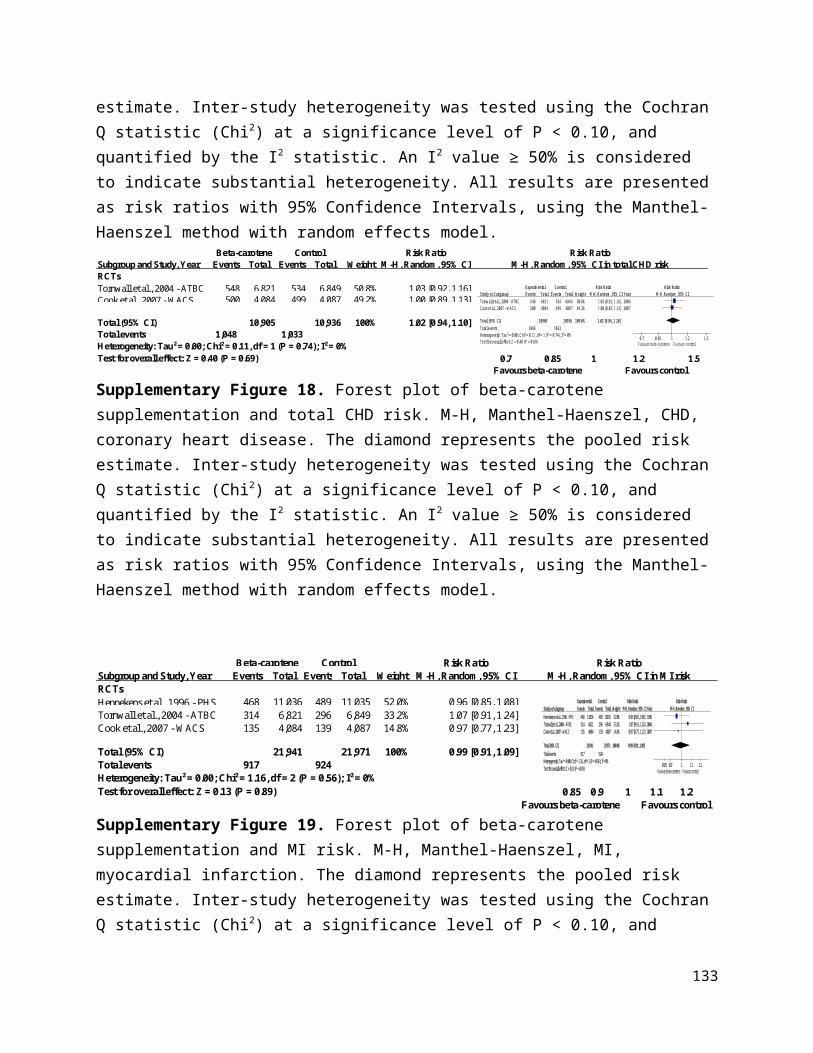
Random Effects
Comparison RCTs N Events RR (95% CIs) RR (95% CIs) I2 p -value
CVD
Total CVD 1 459 43 0.49 [0.28, 0.86] N/A 0.01
MI 1 459 5 0.34 [0.06, 2.01] N/A 0.23
Total CVD mortality 2 760 31 0.80 [0.40, 1.58] 0% 0.51
ALL-CAUSE MORTALITY
All-cause mortality 2 762 35 0.79 [0.42, 1.51] 0% 0.48
Pooled Effect Estimates
Favours iron/ Favours control/
Negative association Positive association
0.0 0.5 1.0 1.5 2.0
Supplementary Figure 110. Summary of the pooled effect estimates of RCTs and studies assessing the relationship between iron supplementation and CVD and all cause mortality risk. RR, risk ratio; CIs, confidence intervals; RTCs, randomized clinical trials; CVD, cardiovascular disease; MI, myocardial infarction; N/A, not applicable. The diamonds represents the pooled risk estimate. Inter-study heterogeneity was tested using the Cochran Q statistic (Chi2) at a significance level of P < 0.10, and quantified by the I2 statistic. An I2 value ≥ 50% is considered to indicate substantial heterogeneity. All results are presented as risk ratios with 95% CIs, using the Manthel-Haenszel method with random effects model.
Subgroup and Study, Year Events Total Events TotalRCTsAnker et al., 2009 - FAIR-HF* 21 304 22 155 100% 0.49 [0.28, 0.86]
Total (95% CI) 304 155 100% 0.49 [0.28, 0.86]Total events 21 22Heterogeneity: Not applicableTest for overall effect: Z = 2.49 (P = 0.01) 0.01 0.1 1 10 100
Favours iron Favours control
Iron ControlWeight
Risk RatioM-H, Random, 95% CI
Risk RatioM-H, Random, 95%CI in total CVD risk
Study or SubgroupAnker et al., 2009 - FAIR-HF
Total (95% CI)Total eventsHeterogeneity: Not applicableTest for overall effect: Z = 2.49 (P = 0.01)
Events21
21
Total304
304
Events22
22
Total155
155
Weight100.0%
100.0%
M-H, Random, 95% CI0.49 [0.28, 0.86]
0.49 [0.28, 0.86]
Year2009
Iron Control Risk Ratio Risk RatioM-H, Random, 95% CI
0.01 0.1 1 10 100Favours iron Favours control
Supplementary Figure 111. Forest plot of iron supplementation and total CVD risk. M-H, Manthel-Haenszel. CVD, cardiovascular disease. *Anker et al., 2009 - To treat iron deficiency in heart failure patients. The diamond represents the pooled risk estimate. Inter-study heterogeneity was tested using the Cochran Q statistic (Chi2) at a significance level of P < 0.10, and quantified by the I2 statistic. An I2 value ≥ 50% is considered to indicate substantial heterogeneity. All results are presented as risk ratios with 95% Confidence Intervals, using the Manthel-Haenszel method with random effects model.
133

Subgroup and Study, Year Events Total Events TotalRCTsAnker et al., 2009 - FAIR-HF* 2 304 3 155 100% 0.34 [0.06, 2.01]
Total (95% CI) 304 155 100% 0.34 [0.06, 2.01]Total events 2 3 Heterogeneity: Not applicableTest for overall effect: Z = 1.19 (P = 0.23) 0.002 0.1 1 10 500
Favours iron Favours control
Iron ControlWeight
Risk RatioM-H, Random, 95% CI
Risk RatioM-H, Random, 95%CI in MI risk
Study or SubgroupAnker et al., 2009 - FAIR-HF
Total (95% CI)Total eventsHeterogeneity: Not applicableTest for overall effect: Z = 1.19 (P = 0.23)
Events2
2
Total304
304
Events3
3
Total155
155
Weight100.0%
100.0%
M-H, Random, 95% CI0.34 [0.06, 2.01]
0.34 [0.06, 2.01]
Year2009
Iron Control Risk Ratio Risk RatioM-H, Random, 95% CI
0.002 0.1 1 10 500Favours iron Favours control
Supplementary Figure 112. Forest plot of iron supplementation and MI risk. M-H, Manthel-Haenszel. MI, myocardial infarction. *Anker et al., 2009 - To treat iron deficiency in heart failure patients. The diamond represents the pooled risk estimate. Inter-study heterogeneity was tested using the Cochran Q statistic (Chi2) at a significance level of P < 0.10, and quantified by the I2 statistic. An I2 value ≥ 50% is considered to indicate substantial heterogeneity. All results are presented as risk ratios with 95% Confidence Intervals, using the Manthel-Haenszel method with random effects model.
Subgroup and Study, Year Events Total Events TotalRCTsAnker et al., 2009 - FAIR-HF* 4 304 4 155 25% 0.51 [0.13, 2.01]Ponikowski et al., 2015 - CONFIRM HF 11 150 12 151 75% 0.92 [0.42, 2.03]
Total (95% CI) 454 306 100% 0.80 [0.40, 1.58]Total events 15 16 Heterogeneity: Tau² = 0.00; Chi² = 0.54, df = 1 (P = 0.46); I² = 0%Test for overall effect: Z = 0.65 (P = 0.51) 0.05 0.2 1 5 20
Favours iron Favours control
Iron ControlWeight
Risk RatioM-H, Random, 95% CI
Risk RatioM-H, Random, 95%CI in CVD mortality risk
Study or SubgroupAnker et al., 2009 - FAIR-HFPonikowski et al., 2015 - CONFIRM HF
Total (95% CI)Total eventsHeterogeneity: Tau² = 0.00; Chi² = 0.54, df = 1 (P = 0.46); I² = 0%Test for overall effect: Z = 0.65 (P = 0.51)
Events4
11
15
Total304150
454
Events4
12
16
Total155151
306
Weight24.7%75.3%
100.0%
M-H, Random, 95% CI0.51 [0.13, 2.01]0.92 [0.42, 2.03]
0.80 [0.40, 1.58]
Year20092015
Iron Control Risk Ratio Risk RatioM-H, Random, 95% CI
0.05 0.2 1 5 20Favours iron Favours control
Supplementary Figure 113. Forest plot of iron supplementation and CVD mortality risk. M-H, Manthel-Haenszel. CVD, cardiovascular disease. *Anker et al., 2009 - To treat iron deficiency in heart failure patients. The diamond represents the pooled risk estimate. Inter-study heterogeneity was tested using the Cochran Q statistic (Chi2) at a significance level of P < 0.10, and quantified by the I2 statistic. An I2 value ≥ 50% is considered to indicate substantial heterogeneity. All results are presented as risk ratios with 95% Confidence Intervals, using the Manthel-Haenszel method with random effects model.
Subgroup and Study, Year Events Total Events TotalRCTsAnker et al., 2009 - FAIR-HF* 5 304 4 155 24.3% 0.64 [0.17, 2.34]Ponikowski et al. 2015 - CONFIRM-HF* 12 152 14 151 75.7% 0.85 [0.41, 1.78]
Total (95% CI) 456 306 100% 0.79 [0.42, 1.51]Total events 17 18 Heterogeneity: Tau² = 0.00; Chi² = 0.14, df = 1 (P = 0.70); I² = 0%Test for overall effect: Z = 0.71 (P = 0.48) 0.2 0.5 1 2 5
Favours iron Favours control
Iron Control Risk RatioM-H, Random, 95% CI
Risk RatioM-H, Random, 95%CI in all-cause mortality riskWeight
Study or SubgroupAnker et al., 2009 - FAIR-HFPonikowski et al. 2015 - CONFIRM-HF
Total (95% CI)Total eventsHeterogeneity: Tau² = 0.00; Chi² = 0.14, df = 1 (P = 0.70); I² = 0%Test for overall effect: Z = 0.71 (P = 0.48)
Events5
12
17
Total304152
456
Events4
14
18
Total155151
306
Weight24.3%75.7%
100.0%
M-H, Random, 95% CI0.64 [0.17, 2.34]0.85 [0.41, 1.78]
0.79 [0.42, 1.51]
Year20092015
Iron Control Risk Ratio Risk RatioM-H, Random, 95% CI
0.2 0.5 1 2 5Favours iron Favours control
Supplementary Figure 114. Forest plot of iron supplementation and all-cause mortality risk. M-H, Manthel-Haenszel. *Anker et al., 2009 - To treat iron deficiency in heart failure patients; *Ponikowski et al., 2015 - To treat iron deficiency in heart failure patients. The diamond represents the pooled risk estimate. Inter-study heterogeneity was tested using the Cochran Q statistic (Chi2) at a significance level of P < 0.10, and quantified by the I2 statistic. An I2 value ≥ 50% is considered to indicate substantial heterogeneity. All results are presented as risk ratios with 95% Confidence Intervals, using the Manthel-Haenszel method with random effects model.
134

Random Effects
Comparison RCTs N Events RR (95% CIs) RR (95% CIs) I2 p -value
CVD Total CVD 2 16,349 1,941 0.95 [0.77, 1.17] 62% 0.61MI 3 16,414 772 0.95 [0.82, 1.09] 0% 0.43Stroke 2 16,349 666 0.86 [0.46, 1.62] 59% 0.64Total CVD mortality 3 17,351 984 0.94 [0.83, 1.06] 0% 0.30MI mortality 1 14,641 70 0.63 [0.39, 1.02] N/A 0.06
Stroke mortality 2 17,959 222 0.89 [0.49, 1.63] 75% 0.72
ALL-CAUSE MORTALITY
All-cause mortality 10 22,869 3,633 0.95 [0.90, 1.01] 0% 0.12
Favours multivitamins/ Favours control/ Negative association Positive association
Pooled Effect Estimates
0.0 0.5 1.0 1.5 2.0
Supplementary Figure 115. Summary of the pooled effect estimates of RCTs assessing the relationship between multivitamins supplementation and CVD and all cause mortality risk. RR, risk ratio; CIs, confidence intervals; RTCs, randomized clinical trials; CVD, cardiovascular disease; CHD, coronary heart disease; MI, myocardial infarction; N/A, not applicable. The diamonds represents the pooled risk estimate. Inter-study heterogeneity was tested using the Cochran Q statistic (Chi2) at a significance level of P < 0.10, and quantified by the I2 statistic. An I2 value ≥ 50% is considered to indicate substantial heterogeneity. All results are presented as risk ratios with 95% CIs, using the Manthel-Haenszel method with random effects model.
Subgroup and Study, Year Events Total Events TotalRCTsSesso et al., 2012 - PHS II 876 7,317 856 7,324 65.0% 1.02 [0.94, 1.12]Lamas et al., 2013 - TACT 94 853 115 855 35.0% 0.82 [0.63, 1.06]
Total (95% CI) 8,170 8,179 100% 0.95 [0.77, 1.17]Total events 970 971 Heterogeneity: Tau² = 0.02; Chi² = 2.62, df = 1 (P = 0.11); I² = 62% 0.5 0.7 1 1.5 2Test for overall effect: Z = 0.51 (P = 0.61) Favours multivitamin Favours control
Multivitamins ControlWeight
Risk RatioM-H, Random, 95% CI
Risk RatioM-H, Random, 95%CI in total CVD risk
Study or SubgroupSesso et al., 2012 - PHS IILamas et al., 2013 - TACT
Total (95% CI)Total eventsHeterogeneity: Tau² = 0.02; Chi² = 2.62, df = 1 (P = 0.11); I² = 62%Test for overall effect: Z = 0.51 (P = 0.61)
Events876
94
970
Total7317
853
8170
Events856115
971
Total7324
855
8179
Weight65.0%35.0%
100.0%
M-H, Random, 95% CI1.02 [0.94, 1.12]0.82 [0.63, 1.06]
0.95 [0.77, 1.17]
Year20122013
Multivitamins Control Risk Ratio Risk RatioM-H, Random, 95% CI
0.5 0.7 1 1.5 2Favours multivitamins Favours control
Supplementary Figure 116. Forest plot of multivitamins supplementation and total CVD risk. M-H, Manthel-Haenszel, CVD, cardiovascular disease. The diamond represents the pooled risk estimate. Inter-study heterogeneity was tested using the Cochran Q statistic (Chi2) at a significance level of P < 0.10, and quantified by the I2 statistic. An I2 value ≥ 50% is considered to indicate substantial heterogeneity. All results are presented as risk ratios with 95% Confidence Intervals, using the Manthel-Haenszel method with random effects model.
135

Subgroup and Study, Year Events Total Events TotalRCTsBogden et al., 1994 0 33 1 32 0.2% 0.32 [0.01, 7.66]Sesso et al., 2012 - PHS II 317 7,317 335 7,324 84.1% 0.95 [0.82, 1.10]Lamas et al., 2013 - TACT 58 853 61 855 15.8% 0.95 [0.67, 1.35]
Total (95% CI) 8,203 8,211 100% 0.95 [0.82, 1.09]Total events 375 397 Heterogeneity: Tau² = 0.00; Chi² = 0.44, df = 2 (P = 0.80); I² = 0%Test for overall effect: Z = 0.79 (P = 0.43) 0.2 0.5 1 2 5
Favours multivitamin Favours control
Multivitamins ControlWeight
Risk RatioM-H, Random, 95% CI
Risk RatioM-H, Random, 95%CI in MI risk
Study or SubgroupBogden et al., 1994Sesso et al., 2012 - PHS IILamas et al., 2013 - TACT
Total (95% CI)Total eventsHeterogeneity: Tau² = 0.00; Chi² = 0.44, df = 2 (P = 0.80); I² = 0%Test for overall effect: Z = 0.79 (P = 0.43)
Events0
31758
375
Total33
7317853
8203
Events1
33561
397
Total32
7324855
8211
Weight0.2%
84.1%15.8%
100.0%
M-H, Random, 95% CI0.32 [0.01, 7.66]0.95 [0.82, 1.10]0.95 [0.67, 1.35]
0.95 [0.82, 1.09]
Year199420122013
Multivitamins Control Risk Ratio Risk RatioM-H, Random, 95% CI
0.2 0.5 1 2 5Favours multivitamins Favours control
Supplementary Figure 117. Forest plot of multivitamins supplementation and MI risk. M-H, Manthel-Haenszel, MI, myocardial infarction. The diamond represents the pooled risk estimate. Inter-study heterogeneity was tested using the Cochran Q statistic (Chi2) at a significance level of P < 0.10, and quantified by the I2 statistic. An I2 value ≥ 50% is considered to indicate substantial heterogeneity. All results are presented as risk ratios with 95% Confidence Intervals, using the Manthel-Haenszel method with random effects model.
Subgroup and Study, Year Events Total Events TotalRCTsSesso et al., 2012 - PHS II 332 7,317 311 7,324 69.1% 1.07 [0.92, 1.24]Lamas et al., 2013 - TACT 8 853 15 855 30.9% 0.53 [0.23, 1.25]
Total (95% CI) 8,170 8,179 100% 0.86 [0.46, 1.62]Total events 340 326 Heterogeneity: Tau² = 0.14; Chi² = 2.46, df = 1 (P = 0.12); I² = 59%Test for overall effect: Z = 0.46 (P = 0.64) 0.05 0.2 1 5 20
Favours multivitamin Favours control
Multivitamins ControlWeight
Risk RatioM-H, Random, 95% CI
Risk RatioM-H, Random, 95%CI in stroke risk
Study or SubgroupSesso et al., 2012 - PHS IILamas et al., 2013 - TACT
Total (95% CI)Total eventsHeterogeneity: Tau² = 0.14; Chi² = 2.46, df = 1 (P = 0.12); I² = 59%Test for overall effect: Z = 0.46 (P = 0.64)
Events332
8
340
Total7317
853
8170
Events311
15
326
Total7324
855
8179
Weight69.1%30.9%
100.0%
M-H, Random, 95% CI1.07 [0.92, 1.24]0.53 [0.23, 1.25]
0.86 [0.46, 1.62]
Year20122013
Multivitamins Control Risk Ratio Risk RatioM-H, Random, 95% CI
0.05 0.2 1 5 20Favours multivitamins Favours control
Supplementary Figure 118. Forest plot of multivitamins supplementation and stroke risk. M-H, Manthel-Haenszel. The diamond represents the pooled risk estimate. Inter-study heterogeneity was tested using the Cochran Q statistic (Chi2) at a significance level of P < 0.10, and quantified by the I2 statistic. An I2 value ≥ 50% is considered to indicate substantial heterogeneity. All results are presented as risk ratios with 95% Confidence Intervals, using the Manthel-Haenszel method with random effects model.
Subgroup and Study, Year Events Total Events TotalRCTsCTNS 2008 23 501 31 501 5.4% 0.74 [0.44, 1.25]Sesso et al., 2012 - PHS II 408 7,317 421 7,324 84.5% 0.97 [0.85, 1.11]Lamas et al., 2013 - TACT 45 853 56 855 10.2% 0.81 [0.55, 1.18]
Total (95% CI) 8,671 8,680 100% 0.94 [0.83, 1.06]Total events 476 508 Heterogeneity: Tau² = 0.00; Chi² = 1.63, df = 2 (P = 0.44); I² = 0%Test for overall effect: Z = 1.03 (P = 0.30) 0.5 0.7 1 1.5 2
Favours multivitamin Favours control
Risk RatioM-H, Random, 95%CI in CVD mortality risk
Multivitamins ControlWeight
Risk RatioM-H, Random, 95% CI
Study or SubgroupCTNS 2008Sesso et al., 2012 - PHS IILamas et al., 2013 - TACT
Total (95% CI)Total eventsHeterogeneity: Tau² = 0.00; Chi² = 1.63, df = 2 (P = 0.44); I² = 0%Test for overall effect: Z = 1.03 (P = 0.30)
Events23
40845
476
Total501
7317853
8671
Events31
42156
508
Total501
7324855
8680
Weight5.4%
84.5%10.2%
100.0%
M-H, Random, 95% CI0.74 [0.44, 1.25]0.97 [0.85, 1.11]0.81 [0.55, 1.18]
0.94 [0.83, 1.06]
Year200820122013
Multivitamins Control Risk Ratio Risk RatioM-H, Random, 95% CI
0.5 0.7 1 1.5 2Favours multivitamins Favours control
Supplementary Figure 119. Forest plot of multivitamins supplementation and CVD mortality risk. M-H, Manthel-Haenszel, CVD, cardiovascular disease. The diamond represents the pooled risk estimate. Inter-study heterogeneity was tested using the Cochran Q statistic (Chi2) at a significance level of P < 0.10, and quantified by the I2 statistic. An I2 value ≥ 50% is considered
136
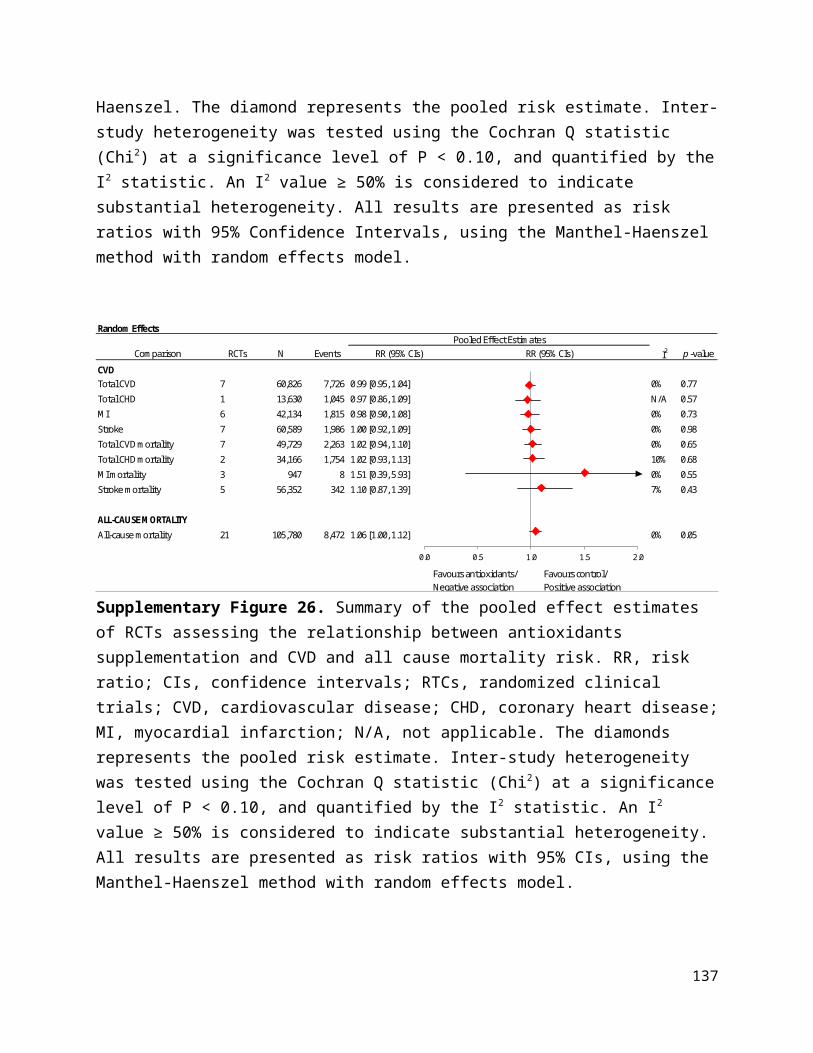
to indicate substantial heterogeneity. All results are presented as risk ratios with 95% Confidence Intervals, using the Manthel-Haenszel method with random effects model.
Subgroup and Study, Year Events Total Events TotalRCTsSesso et al., 2012 - PHS II 27 7,317 43 7,324 100% 0.63 [0.39, 1.02]
Total (95% CI) 7,317 7,324 100% 0.63 [0.39, 1.02]Total events 27 43 Heterogeneity: Not applicableTest for overall effect: Z = 1.90 (P = 0.06) 0.05 0.2 1 5 20
Favours multivitamin Favours control
Multivitamins ControlWeight
Risk RatioM-H, Random, 95% CI
Risk RatioM-H, Random, 95%CI in MI mortality risk
Study or SubgroupSesso et al., 2012 - PHS II
Total (95% CI)Total eventsHeterogeneity: Not applicableTest for overall effect: Z = 1.90 (P = 0.06)
Events27
27
Total7317
7317
Events43
43
Total7324
7324
Weight100.0%
100.0%
M-H, Random, 95% CI0.63 [0.39, 1.02]
0.63 [0.39, 1.02]
Year2012
Multivitamins Control Risk Ratio Risk RatioM-H, Random, 95% CI
0.05 0.2 1 5 20Favours multivitamins Favours control
Supplementary Figure 120. Forest plot of multivitamins supplementation and MI mortality risk. M-H, Manthel-Haenszel, MI, myocardial infarction. The diamond represents the pooled risk estimate. Inter-study heterogeneity was tested using the Cochran Q statistic (Chi2) at a significance level of P < 0.10, and quantified by the I2 statistic. An I2 value ≥ 50% is considered to indicate substantial heterogeneity. All results are presented as risk ratios with 95% Confidence Intervals, using the Manthel-Haenszel method with random effects model.
Subgroup and Study, Year Events Total Events TotalRCTsLi et al., 1993 - NIT2 22 1,657 35 1,661 43.7% 0.63 [0.37, 1.07]Sesso et al., 2012 - PHS II 89 7,317 76 7,324 56.3% 1.17 [0.86, 1.59]
Total (95% CI) 8,974 8,985 100% 0.89 [0.49, 1.63]Total events 111 111 Heterogeneity: Tau² = 0.14; Chi² = 3.98, df = 1 (P = 0.05); I² = 75%Test for overall effect: Z = 0.36 (P = 0.72) 0.02 0.1 1 10 50
Favours multivitamin Favours control
Multivitamins ControlWeight
Risk RatioM-H, Random, 95% CI
Risk RatioM-H, Random, 95%CI in stroke mortality risk
Study or SubgroupLi et al., 1993 - NIT2Sesso et al., 2012 - PHS II
Total (95% CI)Total eventsHeterogeneity: Tau² = 0.14; Chi² = 3.98, df = 1 (P = 0.05); I² = 75%Test for overall effect: Z = 0.36 (P = 0.72)
Events2289
111
Total16577317
8974
Events3576
111
Total16617324
8985
Weight43.7%56.3%
100.0%
M-H, Random, 95% CI0.63 [0.37, 1.07]1.17 [0.86, 1.59]
0.89 [0.49, 1.63]
Year19932012
Multivitamins Control Risk Ratio Risk RatioM-H, Random, 95% CI
0.02 0.1 1 10 50Favours multivitamins Favours control
Supplementary Figure 121. Forest plot of multivitamins supplementation and stroke mortality risk. M-H, Manthel-Haenszel. The diamond represents the pooled risk estimate. Inter-study heterogeneity was tested using the Cochran Q statistic (Chi2) at a significance level of P < 0.10, and quantified by the I2 statistic. An I2 value ≥ 50% is considered to indicate substantial heterogeneity. All results are presented as risk ratios with 95% Confidence Intervals, using the Manthel-Haenszel method with random effects model.
Subgroup and Study, Year Events Total Events TotalRCTsChandra et al., 1992 0 48 2 48 0.0% 0.20 [0.01, 4.06]Li et al., 1993 - NIT2 157 1,657 167 1,661 8.1% 0.94 [0.77, 1.16]Bogden et al., 1994 0 33 1 32 0.0% 0.32 [0.01, 7.66]Pike et al., 1995 1 24 0 23 0.0% 2.88 [0.12, 67.29]Graat et al., 2002 0 163 5 153 0.0% 0.09 [0.00, 1.53]Avenell et al., 2005 - MAVIS 8 456 4 454 0% 1.99 [0.60, 6.57]Liu et al., 2007 96 375 97 373 5.90% 0.98 [0.77, 1.26]CTNS 2008 77 510 81 510 4% 0.95 [0.71, 1.27]Sesso et al., 2012 - PHS II 1,345 7,317 1,412 7,324 77% 0.95 [0.89, 1.02]Lamas et al., 2013 - TACT 87 853 93 855 5% 0.94 [0.71, 1.24]
Total (95% CI) 11,436 11,433 100% 0.95 [0.90, 1.01]Total events 1,771 1,862 Heterogeneity: Tau² = 0.00; Chi² = 6.20, df = 9 (P = 0.72); I² = 0%Test for overall effect: Z = 1.58 (P = 0.12) 0.02 0.1 1 10 50
Favours multivitamin Favours control
Multivitamins ControlWeight
Risk RatioM-H, Random, 95% CI
Risk RatioM-H, Random, 95%CI in all-cause mortality risk
Study or SubgroupChandra et al., 1992Li et al., 1993 - NIT2Bogden et al., 1994Pike et al., 1995Graat et al., 2002Avenell et al., 2005 - MAVISLiu et al., 2007CTNS 2008Sesso et al., 2012 - PHS IILamas et al., 2013 - TACT
Total (95% CI)Total eventsHeterogeneity: Tau² = 0.00; Chi² = 6.20, df = 9 (P = 0.72); I² = 0%Test for overall effect: Z = 1.58 (P = 0.12)
Events0
1570108
9677
134587
1771
Total48
16573324
163456375510
7317853
11436
Events2
1671054
9781
141293
1862
Total48
16613223
153454373510
7324855
11433
Weight0.0%8.1%0.0%0.0%0.0%0.2%5.9%4.2%
76.8%4.5%
100.0%
M-H, Random, 95% CI0.20 [0.01, 4.06]0.94 [0.77, 1.16]0.32 [0.01, 7.66]
2.88 [0.12, 67.29]0.09 [0.00, 1.53]1.99 [0.60, 6.57]0.98 [0.77, 1.26]0.95 [0.71, 1.27]0.95 [0.89, 1.02]0.94 [0.71, 1.24]
0.95 [0.90, 1.01]
Year1992199319941995200220052007200820122013
Multivitamins Control Risk Ratio Risk RatioM-H, Random, 95% CI
0.02 0.1 1 10 50Favours multivitamins Favours control
Supplementary Figure 122. Forest plot of multivitamins supplementation and all-cause mortality risk. M-H, Manthel-Haenszel. The diamond represents the pooled risk estimate. Inter-
137

study heterogeneity was tested using the Cochran Q statistic (Chi2) at a significance level of P < 0.10, and quantified by the I2 statistic. An I2 value ≥ 50% is considered to indicate substantial heterogeneity. All results are presented as risk ratios with 95% Confidence Intervals, using the Manthel-Haenszel method with random effects effects model.
Supplementary Figure 123. Funnel plot of multivitamin supplementation and all-cause mortality risk. The vertical line represents the pooled effect estimate expressed as a RR. Dashed lines represent pseudo-95% confidence intervals (CI). The circles represent risk estimates for each study, and the horizontal lines represent standard errors of the RR. We were unable to test for funnel plot asymmetry for other CVD outcomes (<10 RCTs).
138
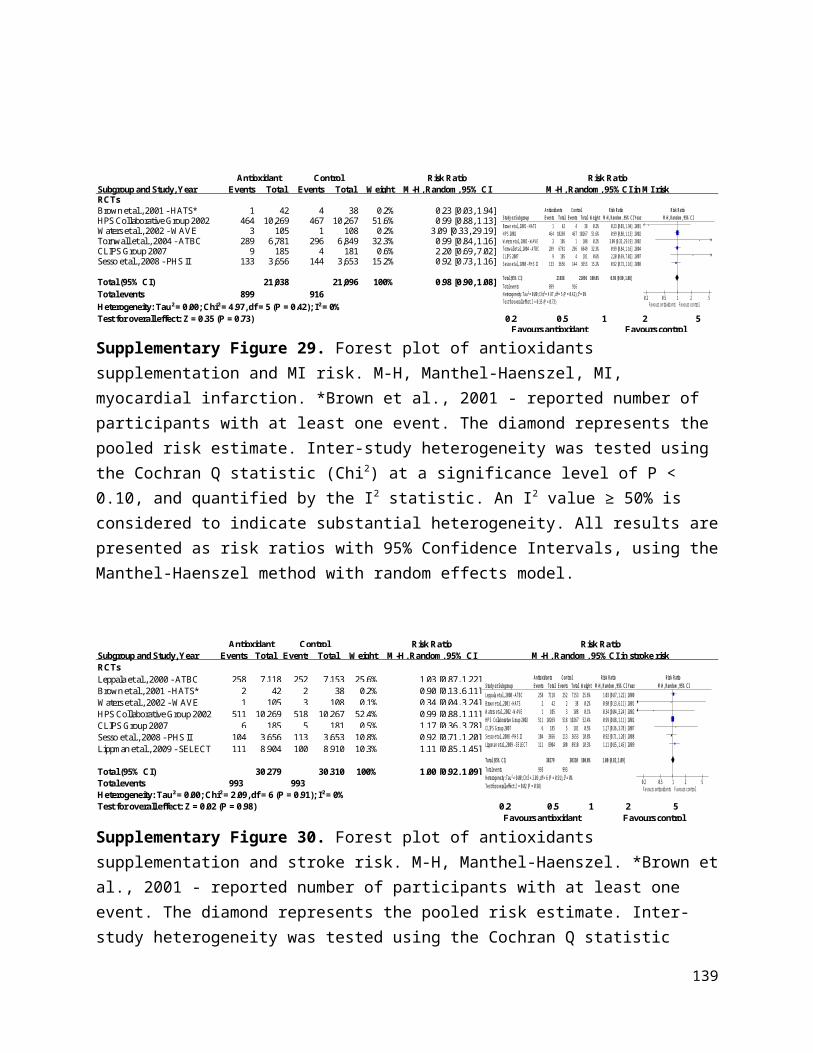
Random effects
ComparisonRCTs/
CohortsN Events RR (95% CIs) RR (95% CIs) I2 p -value
CVD Total CVD 2 15,494 1,672 1.03 [0.94, 1.12] 0% 0.58Total CHD 2 15,390 445 0.73 [0.20, 2.68] 49% 0.63MI 5 19,097 453 1.14 [0.95, 1.37] 0% 0.15Stroke 7 19,227 484 1.17 [0.98, 1.39] 0% 0.09Total CVD mortality 1 36,282 470 0.92 [0.77, 1.10] N/A 0.38Total CHD mortality 2 36,370 262 0.94 [0.54, 1.64] 10% 0.83MI mortality 1 231 1 2.97 [0.12, 72.26] N/A 0.50Stroke mortality 2 36,370 118 0.90[0.63, 1.29] 0% 0.56
ALL-CAUSE MORTALITY All-cause mortality 20 42,072 3,690 0.95 [0.89, 1.01] 0% 0.09
Pooled Effect Estimates
Fa vours cal cium Favours control/ & vitamin D/
Negative as socia tion Pos iti ve association
0.0 1.0 2.0 3.0
Supplementary Figure 124. Summary of the pooled effect estimates of RCTs and assessing the relationship between calcium and vitamin D supplementation and CVD and all cause mortality risk. RR, risk ratio; CIs, confidence intervals; RTCs, randomized clinical trials; CVD, cardiovascular disease; CHD, coronary heart disease; MI, myocardial infarction; N/A, not applicable. The diamonds represents the pooled risk estimate. Inter-study heterogeneity was tested using the Cochran Q statistic (Chi2) at a significance level of P < 0.10, and quantified by the I2 statistic. An I2 value ≥ 50% is considered to indicate substantial heterogeneity. All results are presented as risk ratios with 95% CIs, using the Manthel-Haenszel method with random effects model.
Subgroup and Study, Year Events Total Events TotalRCTsBrazier et al., 2005 6 95 5 97 0.6% 1.23 [0.39, 3.88]Prentice et al., 2013 - WHI CaD* 848 7,718 813 7,584 99.4% 1.02 [0.94, 1.12]
Total (95% CI) 7,813 7,681 100% 1.03 [0.94, 1.12]Total events 854 818 Heterogeneity: Tau² = 0.00; Chi² = 0.09, df = 1 (P = 0.76); I² = 0%Test for overall effect: Z = 0.56 (P = 0.58) 0.2 0.5 1 2 5
Favours Ca+VitD Favours control
Calcium & Vitamin D ControlWeight
Risk RatioM-H, Random, 95% CI
Risk RatioM-H, Random, 95% CI in total CVD risk
Study or SubgroupBrazier et al., 2005Prentice et al., 2013 - WHI CaD
Total (95% CI)Total eventsHeterogeneity: Tau² = 0.00; Chi² = 0.09, df = 1 (P = 0.76); I² = 0%Test for overall effect: Z = 0.56 (P = 0.58)
Events6
848
854
Total95
7718
7813
Events5
813
818
Total97
7584
7681
Weight0.6%
99.4%
100.0%
M-H, Random, 95% CI1.23 [0.39, 3.88]1.02 [0.94, 1.12]
1.03 [0.94, 1.12]
Year20052013
Calcium & Vitamin D Control Risk Ratio Risk RatioM-H, Random, 95% CI
0.2 0.5 1 2 5Favours Ca/VitD Favours control
Supplementary Figure 125. Forest plot of calcium and vitamin D supplementation and total CVD risk. M-H, Manthel-Haenszel, CVD, cardiovascular disease. *Prentice et al., 2013 - removed users of personal calcium or vitamin D supplement use. The diamond represents the pooled risk estimate. Inter-study heterogeneity was tested using the Cochran Q statistic (Chi2) at a significance level of P < 0.10, and quantified by the I2 statistic. An I2 value ≥ 50% is considered to indicate substantial heterogeneity. All results are presented as risk ratios with 95% Confidence Intervals, using the Manthel-Haenszel method with random effects model.
139
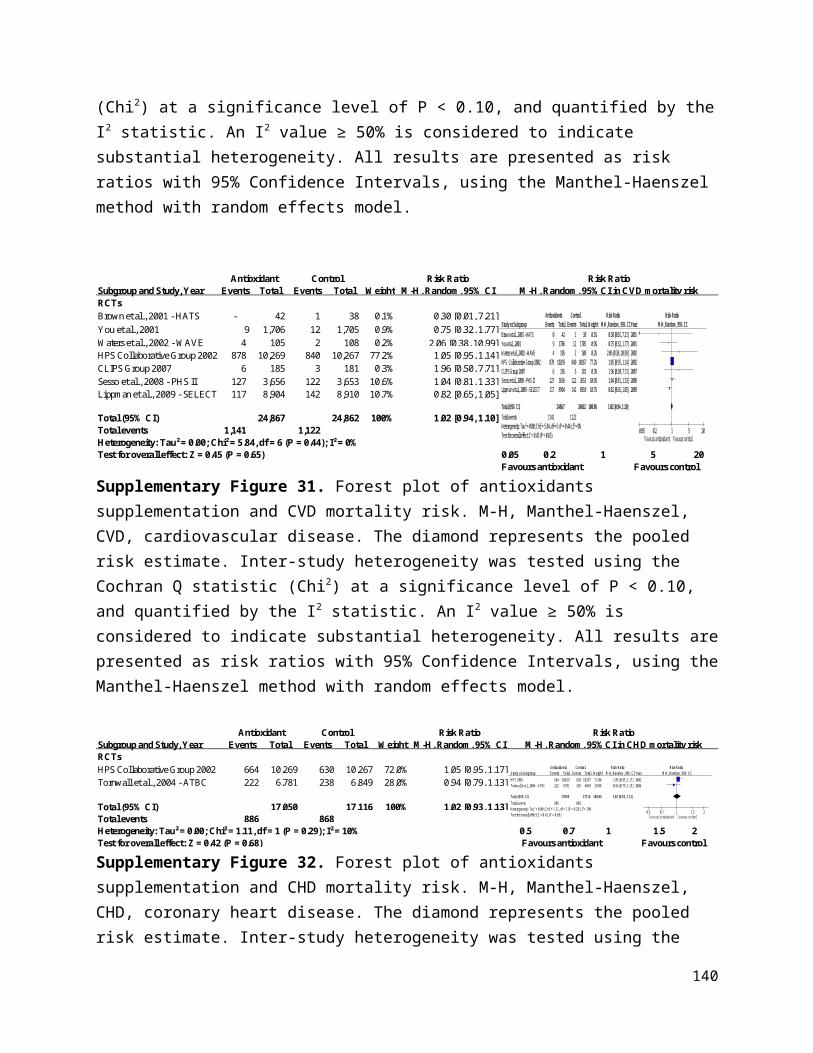
Subgroup and Study, Year Events Total Events TotalRCTsInkovaara et al., 1983 1 46 4 42 24.9% 0.23 [0.03, 1.96]Prentice et al., 2013 - WHI CaD* 229 7,718 211 7,584 75.1% 1.07 [0.89, 1.28]
Total (95% CI) 7,764 7,626 100% 0.73 [0.20, 2.68]Total events 230 215 Heterogeneity: Tau² = 0.58; Chi² = 1.96, df = 1 (P = 0.16); I² = 49%Test for overall effect: Z = 0.48 (P = 0.63) 0.05 0.2 1 5 20
Favours Ca+VitD Favours control
Calcium & Vitamin D ControlWeight
Risk RatioM-H, Random, 95% CI
Risk RatioM-H, Random, 95% CI in total CHD risk
Study or SubgroupInkovaara et al., 1983Prentice et al., 2013 - WHI CaD
Total (95% CI)Total eventsHeterogeneity: Tau² = 0.58; Chi² = 1.96, df = 1 (P = 0.16); I² = 49%Test for overall effect: Z = 0.48 (P = 0.63)
Events1
229
230
Total46
7718
7764
Events4
211
215
Total42
7584
7626
Weight24.9%75.1%
100.0%
M-H, Random, 95% CI0.23 [0.03, 1.96]1.07 [0.89, 1.28]
0.73 [0.20, 2.68]
Year19832013
Calcium and Vitamin D Control Risk Ratio Risk RatioM-H, Random, 95% CI
0.05 0.2 1 5 20Favours Ca/VitD Favours control
Supplementary Figure 126. Forest plot of calcium and vitamin D supplementation and total CHD risk. M-H, Manthel-Haenszel, CHD, coronary heart disease. *Prentice et al., 2013 - removed users of personal calcium or vitamin D supplement use. The diamond represents the pooled risk estimate. Inter-study heterogeneity was tested using the Cochran Q statistic (Chi2) at a significance level of P < 0.10, and quantified by the I2 statistic. An I2 value ≥ 50% is considered to indicate substantial heterogeneity. All results are presented as risk ratios with 95% Confidence Intervals, using the Manthel-Haenszel method with random effects model.
Subgroup and Study, Year Events Total Events TotalRCTsKomulainen et al., 1999 - OSTPRE 1 116 1 115 0.4% 0.99 [0.06, 15.66]Grant et al., 2005 - RECORD 44 1,306 39 1,332 18.5% 1.15 [0.75, 1.76]Brazier et al., 2005 3 95 0 97 0.4% 7.15 [0.37, 136.50]Lappe et al., 2007 3 446 2 288 1.0% 0.97 [0.16, 5.76]Prentice et al., 2013 - WHI CaD* 193 7,718 167 7,584 79.6% 1.14 [0.93, 1.39]
Total (95% CI) 9,681 9,416 100.0% 1.14 [0.95, 1.37]Total events 244 209Heterogeneity: Tau² = 0.00; Chi² = 1.53, df = 4 (P = 0.82); I² = 0% 0.1 0.2 0.5 1 2 5 10Test for overall effect: Z = 1.44 (P = 0.15) Favours Ca+VitD Favours control
Calcium & Vitamin D ControlWeight
Risk RatioM-H, Random, 95% CI
Risk RatioM-H, Random, 95% CI in MI risk
Study or SubgroupKomulainen et al., 1999 - OSTREGrant et al., 2005 - RECORDBrazier et al., 2005Lappe et al., 2007Prentice et al., 2013 - WHI CaD
Total (95% CI)Total eventsHeterogeneity: Tau² = 0.00; Chi² = 1.53, df = 4 (P = 0.82); I² = 0%Test for overall effect: Z = 1.44 (P = 0.15)
Events1
4433
193
244
Total116
130695
4467718
9681
Events1
3902
167
209
Total115
133297
2887584
9416
Weight0.4%
18.5%0.4%1.0%
79.6%
100.0%
M-H, Random, 95% CI0.99 [0.06, 15.66]1.15 [0.75, 1.76]
7.15 [0.37, 136.50]0.97 [0.16, 5.76]1.14 [0.93, 1.39]
1.14 [0.95, 1.37]
Year19992005200520072013
Calcium & Vitamin D Control Risk Ratio Risk RatioM-H, Random, 95% CI
0.1 0.2 0.5 1 2 5 10Favours Ca/VitD Favours control
Supplementary Figure 127. Forest plot of calcium and vitamin D supplementation and MI risk. M-H, Manthel-Haenszel, MI, myocardial infarction. *Prentice et al., 2013 - removed users of personal calcium or vitamin D supplement use. The diamond represents the pooled risk estimate. Inter-study heterogeneity was tested using the Cochran Q statistic (Chi2) at a significance level of P < 0.10, and quantified by the I2 statistic. An I2 value ≥ 50% is considered to indicate substantial heterogeneity. All results are presented as risk ratios with 95% Confidence Intervals, using the Manthel-Haenszel method with random effects model.
140

Subgroup and Study, Year Events Total Events TotalRCTsInkovaara et al., 1983 9 46 5 42 3.0% 1.64 [0.60, 4.51]Komulainen et al., 1999 - OSTPRE 2 116 1 115 0.5% 1.98 [0.18, 21.56]Brazier et al., 2005 1 95 1 97 0.4% 1.02 [0.06, 16.09]Grant et al., 2005 - RECORD 60 1,306 48 1,332 22.5% 1.27 [0.88, 1.85]Lappe et al., 2007 6 446 4 288 2.0% 0.97 [0.28, 3.40]Gallagher et al., 2012 1 21 0 21 0.3% 3.00 [0.13, 69.70]Prentice et al., 2013 - WHI CaD* 184 7,718 162 7,584 71.3% 1.12 [0.91, 1.38]
Total (95% CI) 9,748 9,479 100% 1.17 [0.98, 1.39]Total events 263 221 Heterogeneity: Tau² = 0.00; Chi² = 1.46, df = 6 (P = 0.96); I² = 0%Test for overall effect: Z = 1.72 (P = 0.09) 0.05 0.2 1 5 20
Favours Ca+VitD Favours control
Calcium & Vitamin D ControlWeight
Risk RatioM-H, Random, 95% CI
Risk RatioM-H, Random, 95% CI in stroke risk
Study or SubgroupInkovaara et al., 1983Komulainen et al., 1999 - OSTREBrazier et al., 2005Grant et al., 2005 - RECORDLappe et al., 2007Gallagher et al., 2012Prentice et al., 2013 - WHI CaD
Total (95% CI)Total eventsHeterogeneity: Tau² = 0.00; Chi² = 1.46, df = 6 (P = 0.96); I² = 0%Test for overall effect: Z = 1.72 (P = 0.09)
Events921
6061
184
263
Total46
11695
130644621
7718
9748
Events511
4840
162
221
Total42
11597
133228821
7584
9479
Weight3.0%0.5%0.4%
22.5%2.0%0.3%
71.3%
100.0%
M-H, Random, 95% CI1.64 [0.60, 4.51]
1.98 [0.18, 21.56]1.02 [0.06, 16.09]1.27 [0.88, 1.85]0.97 [0.28, 3.40]
3.00 [0.13, 69.70]1.12 [0.91, 1.38]
1.17 [0.98, 1.39]
Year1983199920052005200720122013
Calcium & Vitamin D Control Risk Ratio Risk RatioM-H, Random, 95% CI
0.05 0.2 1 5 20Favours Ca/VitD Favours control
Supplementary Figure 128. Forest plot of calcium and vitamin D supplementation and stroke risk. M-H, Manthel-Haenszel. *Prentice et al., 2013 - removed users of personal calcium or vitamin D supplement use. The diamond represents the pooled risk estimate. Inter-study heterogeneity was tested using the Cochran Q statistic (Chi2) at a significance level of P < 0.10, and quantified by the I2 statistic. An I2 value ≥ 50% is considered to indicate substantial heterogeneity. All results are presented as risk ratios with 95% Confidence Intervals, using the Manthel-Haenszel method with random effects model.
Subgroup and Study, Year Events Total Events TotalRCTsLaCroix et al., 2009 - WHI CaD 226 18,176 244 18,106 100.0% 0.92 [0.77, 1.10]
Total (95% CI) 18,176 18,106 100% 0.92 [0.77, 1.10]Total events 226 244 Heterogeneity: Not applicable 0.2 0.5 1 2 5Test for overall effect: Z = 0.88 (P = 0.38) Favours Ca+VitD Favours control
Calcium & Vitamin D ControlWeight
Risk RatioM-H, Random, 95% CI
Risk RatioM-H, Random, 95% CI in CVD mortality risk
Study or SubgroupLaCroix et al., 2009 - WHI CaD
Total (95% CI)Total eventsHeterogeneity: Not applicableTest for overall effect: Z = 0.88 (P = 0.38)
Events226
226
Total18176
18176
Events244
244
Total18106
18106
Weight100.0%
100.0%
M-H, Random, 95% CI0.92 [0.77, 1.10]
0.92 [0.77, 1.10]
Year2009
Vit D+Ca Control Risk Ratio Risk RatioM-H, Random, 95% CI
0.2 0.5 1 2 5Favours Vit D+Ca Favours Control
Supplementary Figure 129. Forest plot of calcium and vitamin D supplementation and CVD mortality risk. M-H, Manthel-Haenszel, CVD, cardiovascular disease. The diamond represents the pooled risk estimate. Inter-study heterogeneity was tested using the Cochran Q statistic (Chi2) at a significance level of P < 0.10, and quantified by the I2 statistic. An I2 value ≥ 50% is considered to indicate substantial heterogeneity. All results are presented as risk ratios with 95% Confidence Intervals, using the Manthel-Haenszel method with random effects model.
141

Subgroup and Study, Year Events Total Events TotalRCTsInkovaara et al., 1983 1 46 3 42 5.9% 0.30 [0.03, 2.81]
LaCroix et al., 2009 - WHI CaD 130 18,176 128 18,106 94.1% 1.01 [0.79, 1.29]
Total (95% CI) 18,222 18,148 100% 0.94 [0.54, 1.64]Total events 131 131 Heterogeneity: Tau² = 0.07; Chi² = 1.11, df = 1 (P = 0.29); I² = 10%Test for overall effect: Z = 0.21 (P = 0.83) 0.02 0.1 1 10 50
Favours Ca+VitD Favours control
Calcium & Vitamin D ControlWeight
Risk RatioM-H, Random, 95% CI
Risk RatioM-H, Random, 95% CI in CHD mortality risk
Study or SubgroupInkovaara et al., 1983LaCroix et al., 2009 - WHI CaD
Total (95% CI)Total eventsHeterogeneity: Tau² = 0.07; Chi² = 1.11, df = 1 (P = 0.29); I² = 10%Test for overall effect: Z = 0.21 (P = 0.83)
Events1
130
131
Total46
18176
18222
Events3
128
131
Total42
18106
18148
Weight5.9%
94.1%
100.0%
M-H, Random, 95% CI0.30 [0.03, 2.81]1.01 [0.79, 1.29]
0.94 [0.54, 1.64]
Year19832009
Calcium & Vitamin D Control Risk Ratio Risk RatioM-H, Random, 95% CI
0.02 0.1 1 10 50Favours Ca/VitD Favours control
Supplementary Figure 130. Forest plot of calcium and vitamin D supplementation and CHD mortality risk. M-H, Manthel-Haenszel, CHD, coronary heart disease. The diamond represents the pooled risk estimate. Inter-study heterogeneity was tested using the Cochran Q statistic (Chi2) at a significance level of P < 0.10, and quantified by the I2 statistic. An I2 value ≥ 50% is considered to indicate substantial heterogeneity. All results are presented as risk ratios with 95% Confidence Intervals, using the Manthel-Haenszel method with random effects model.
Subgroup and Study, Year Events Total Events TotalRCTsKomulainen et al., 1999 - OSTPRE 1 116 0 115 100.0% 2.97 [0.12, 72.26]
Total (95% CI) 116 115 100% 2.97 [0.12, 72.26]
Total events 1 0
Heterogeneity: Not applicable 0.001 0.1 1 10 1000Test for overall effect: Z = 0.67 (P = 0.50) Favours Ca+VitD Favours control
Calcium & Vitamin D ControlWeight
Risk RatioM-H, Random, 95% CI
Risk RatioM-H, Random, 95% CI in MI mortality risk
Study or SubgroupKomulainen et al., 1999 - OSTRE
Total (95% CI)Total eventsHeterogeneity: Not applicableTest for overall effect: Z = 0.67 (P = 0.50)
Events1
1
Total116
116
Events0
0
Total115
115
Weight100.0%
100.0%
M-H, Random, 95% CI2.97 [0.12, 72.26]
2.97 [0.12, 72.26]
Year1999
Experimental Control Risk Ratio Risk RatioM-H, Random, 95% CI
0.001 0.1 1 10 1000Favours Vit D and calcium Favours Control
Supplementary Figure 131. Forest plot of calcium and vitamin D supplementation and MI mortality risk. M-H, Manthel-Haenszel, MI, myocardial infarction. The diamond represents the pooled risk estimate. Inter-study heterogeneity was tested using the Cochran Q statistic (Chi2) at a significance level of P < 0.10, and quantified by the I2 statistic. An I2 value ≥ 50% is considered to indicate substantial heterogeneity. All results are presented as risk ratios with 95% Confidence Intervals, using the Manthel-Haenszel method with random effects model.
Subgroup and Study, Year Events Total Events TotalRCTsInkovaara et al., 1983 2 46 2 42 3.5% 0.91 [0.13, 6.20]LaCroix et al., 2009 - WHI CaD 54 18,176 60 18,106 96.5% 0.90 [0.62, 1.29]
Total (95% CI) 18,222 18,148 100% 0.90 [0.63, 1.29]Total events 56 62Heterogeneity: Tau² = 0.00; Chi² = 0.00, df = 1 (P = 0.99); I² = 0%Test for overall effect: Z = 0.59 (P = 0.56) 0.2 0.5 1 2 5
Favours Ca+VitD Favours control
Calcium & Vitamin D ControlWeight
Risk RatioM-H, Random, 95% CI
Risk RatioM-H, Random, 95% CI in stroke mortality risk
Study or SubgroupInkovaara et al., 1983LaCroix et al., 2009 - WHI CaD
Total (95% CI)Total eventsHeterogeneity: Tau² = 0.00; Chi² = 0.00, df = 1 (P = 0.99); I² = 0%Test for overall effect: Z = 0.59 (P = 0.56)
Events2
54
56
Total46
18176
18222
Events2
60
62
Total42
18106
18148
Weight3.5%
96.5%
100.0%
M-H, Random, 95% CI0.91 [0.13, 6.20]0.90 [0.62, 1.29]
0.90 [0.63, 1.29]
Year19832009
Calcium & Vitamin D Control Risk Ratio Risk RatioM-H, Random, 95% CI
0.2 0.5 1 2 5Favours Ca/VitD Favours control
Supplementary Figure 132. Forest plot of calcium and vitamin D supplementation and stroke mortality risk. M-H, Manthel-Haenszel. The diamond represents the pooled risk estimate. Inter-study heterogeneity was tested using the Cochran Q statistic (Chi2) at a significance level of P < 0.10, and quantified by the I2 statistic. An I2 value ≥ 50% is considered to indicate substantial heterogeneity. All results are presented as risk ratios with 95% Confidence Intervals, using the Manthel-Haenszel method with random effects model.
142

Subgroup and Study, Year Events Total Events TotalRCTsInkovaara et al., 1983 7 46 5 42 0.3% 1.28 [0.44, 3.72]Chapuy et al., 1992 258 1,634 274 1,636 14.8% 0.94 [0.81, 1.10]Dawson-Hughes et al., 1997* 2 187 2 202 0.1% 1.08 [0.15, 7.59]Baeksgaard et al., 1998 0 80 1 80 0.0% 0.33 [0.01, 8.06]Komulainen et al., 1999 1 116 1 115 0.0% 0.99 [0.06, 15.66]Krieg et al., 1999 21 124 26 124 1.3% 0.81 [0.48, 1.36]Chapuy et al., 2002 - Decalyos II 67 393 43 190 3.1% 0.75 [0.54, 1.06]Harwood et al., 2004 - NoNOF 6 39 5 37 0.3% 1.14 [0.38, 3.41]Meier et al., 2004 0 30 1 25 0.0% 0.28 [0.01, 6.58]Larsen et al., 2004† 832 4,957 839 4,648 47.0% 0.93 [0.85, 1.01]Grant et al., 2005 - RECORD 221 1306 217 1332 12.2% 1.04 [0.88, 1.23]Porthouse et al., 2005 57 1,321 68 1,993 3.0% 1.26 [0.90, 1.79]Brazier et al., 2005 3 95 1 97 0.1% 3.06 [0.32, 28.93]Daly et al., 2006 1 85 0 82 0.0% 2.90 [0.12, 70.07]Bolton-Smith et al., 2007‡ 0 62 1 61 0.0% 0.33 [0.01, 7.90]Zhu et al., 2008 - CAIFOS 0 39 2 41 0.0% 0.21 [0.01, 4.24]Salovaara et al., 2010 - OSTRE-FPS 15 1,586 13 1,609 0.7% 1.17 [0.56, 2.45]Prentice et al., 2013 - WHI CaD§ 331 7,718 338 7,584 16.3% 0.96 [0.83, 1.12]Gupta et al., 2016 4 25 11 28 0.4% 0.41 [0.15, 1.12]Lappe et al., 2017 7 1,156 9 1,147 0.4% 0.77 [0.29, 2.07]
Total (95% CI) 20,999 21,073 100% 0.95 [0.89, 1.01]Total events 1,833 1,857 Heterogeneity: Tau² = 0.00; Chi² = 13.61, df = 19 (P = 0.81); I² = 0%Test for overall effect: Z = 1.69 (P = 0.09) 0.02 0.1 1 10 50
Favours Ca+VitD Favours control
ControlWeight
Risk RatioM-H, Random, 95%
CIRisk Ratio
M-H, Random, 95% CI in all-cause mortality risk Calcium & Vitamin D
Study or SubgroupInkovaara et al., 1983Chapuy et al., 1992Dawson-Hughes et al., 1997Baeksgaard et al., 1998Komulainen et al., 1999Krieg et al., 1999Chapuy et al., 2002 - Decalyos IIHarwood et al., 2004 - NoNOFMeier et al., 2004Larsen et al., 2004Grant et al., 2005 - RECORDPorthouse et al., 2005Brazier et al., 2005Daly et al., 2006Bolton-Smith et al., 2007Zhu et al., 2008 - CAIFOSSalovaara et al., 2010 - OSTRE-FPSPrentice et al., 2013 - WHI CaDGupta et al., 2016Lappe et al., 2017
Total (95% CI)Total eventsHeterogeneity: Tau² = 0.00; Chi² = 13.61, df = 19 (P = 0.81); I² = 0%Test for overall effect: Z = 1.69 (P = 0.09)
Events7
258201
2167
60
832221
573100
15331
47
1833
Total46
1634187
80116124393
3930
495713061321
95856239
15867718
251156
20999
Events5
274211
2643
51
839217
681012
13338
119
1857
Total42
1636202
80115124190
3725
464813321993
97826141
16097584
281147
21073
Weight0.3%
14.8%0.1%0.0%0.0%1.3%3.1%0.3%0.0%
47.0%12.2%
3.0%0.1%0.0%0.0%0.0%0.7%
16.3%0.4%0.4%
100.0%
M-H, Random, 95% CI1.28 [0.44, 3.72]0.94 [0.81, 1.10]1.08 [0.15, 7.59]0.33 [0.01, 8.06]
0.99 [0.06, 15.66]0.81 [0.48, 1.36]0.75 [0.54, 1.06]1.14 [0.38, 3.41]0.28 [0.01, 6.58]0.93 [0.85, 1.01]1.04 [0.88, 1.23]1.26 [0.90, 1.79]
3.06 [0.32, 28.93]2.90 [0.12, 70.07]
0.33 [0.01, 7.90]0.21 [0.01, 4.24]1.17 [0.56, 2.45]0.96 [0.83, 1.12]0.41 [0.15, 1.12]0.77 [0.29, 2.07]
0.95 [0.89, 1.01]
Year19831992199719981999199920022004200420042005200520052006200720082010201320162017
Calcium and Vitamin D Control Risk Ratio Risk RatioM-H, Random, 95% CI
0.02 0.1 1 10 50Favours Ca/VitD Favours control
Supplementary Figure 133. Forest plot of calcium and vitamin D supplementation and all-cause mortality risk. M-H, Manthel-Haenszel. *Dawson-Hughes et al., 1997 - Data taken from meta-analysis Bolland et al., 2014, Bjelakovic et al., 2014; †Larsen et al., 2004 - Data taken from meta-analysis Bjelakovic et al., 2014; ‡Bolton-Smith et al., 2007 - Data taken from meta-analysis Bjelakovic et al., 2014. The diamond represents the pooled risk estimate. Inter-study heterogeneity was tested using the Cochran Q statistic (Chi2) at a significance level of P < 0.10, and quantified by the I2 statistic. An I2 value ≥ 50% is considered to indicate substantial heterogeneity. All results are presented as risk ratios with 95% Confidence Intervals, using the Manthel-Haenszel method with random effects model.
143
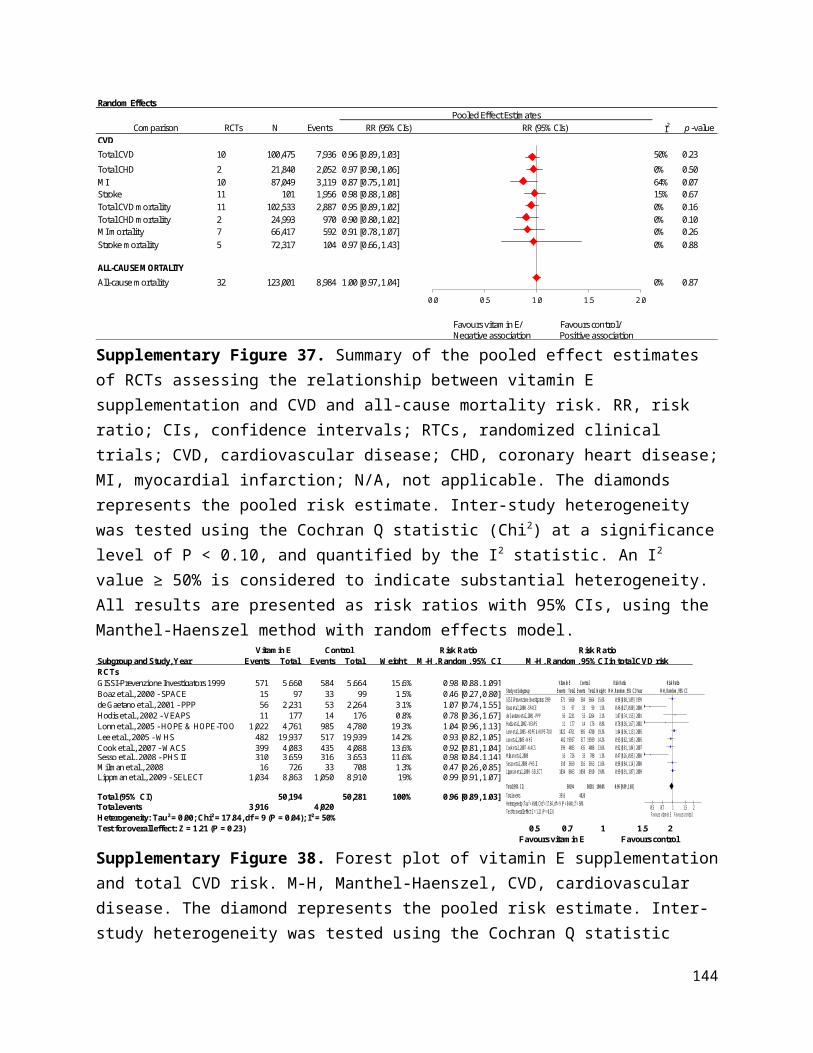
Supplementary Figure 134. Funnel plot of vitamin D & calcium supplementation and all-cause mortality risk. The vertical line represents the pooled effect estimate expressed as a RR. Dashed lines represent pseudo-95% confidence intervals (CI). The circles represent risk estimates for each study, and the horizontal lines represent standard errors of the RR. We were unable to test for funnel plot asymmetry for other CVD outcomes (<10 RCTs).
144
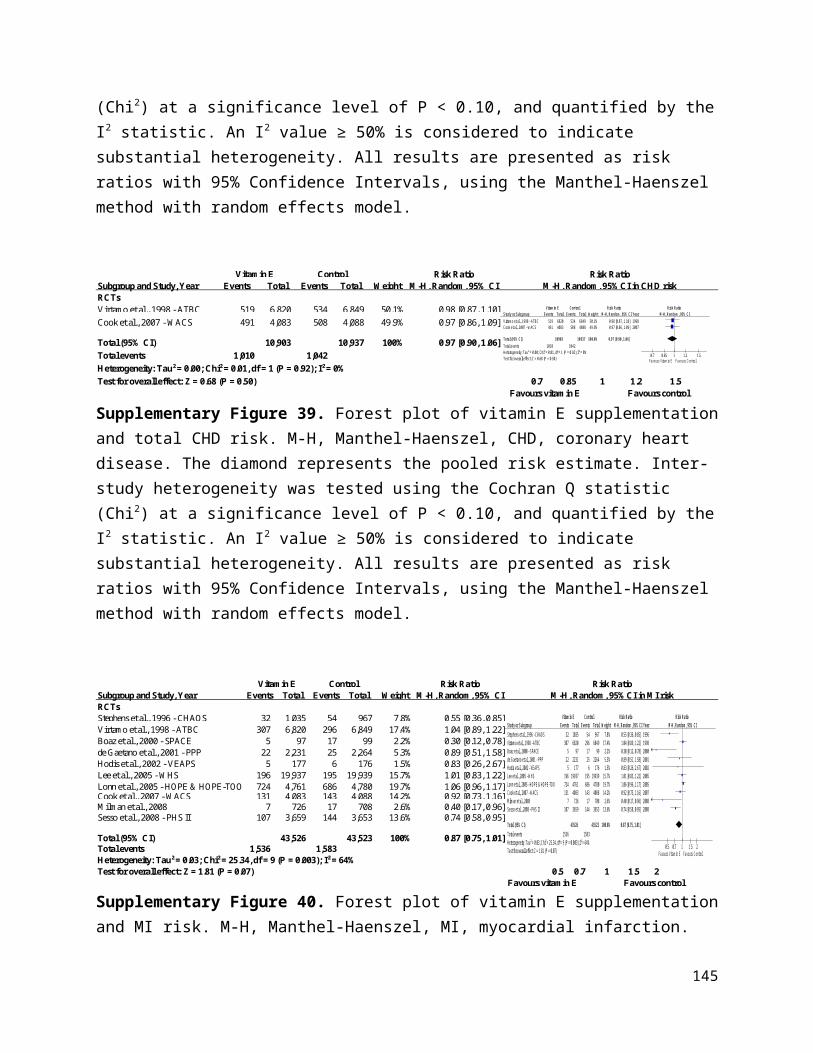
References
1. Anand SS, Hawkes C, de Souza RJ et al. Food Consumption and its Impact on Cardiovascular Disease: Importance of Solutions Focused on the Globalized Food System: A Report From the Workshop Convened by the World Heart Federation. Journal of the American College of Cardiology 2015;66:1590-614.
2. Executive Summary of The Third Report of The National Cholesterol Education Program (NCEP) Expert Panel on Detection, Evaluation, And Treatment of High Blood Cholesterol In Adults (Adult Treatment Panel III). Jama 2001;285:2486-97.
3. Grundy SM, Cleeman JI, Merz CN et al. Implications of recent clinical trials for the National Cholesterol Education Program Adult Treatment Panel III guidelines. Circulation 2004;110:227-39.
4. Stone NJ, Robinson JG, Lichtenstein AH et al. 2013 ACC/AHA guideline on the treatment of blood cholesterol to reduce atherosclerotic cardiovascular risk in adults: a report of the American College of Cardiology/American Heart Association Task Force on Practice Guidelines. Circulation 2014;129:S1-45.
5. Anderson TJ, Gregoire J, Hegele RA et al. 2012 update of the Canadian Cardiovascular Society guidelines for the diagnosis and treatment of dyslipidemia for the prevention of cardiovascular disease in the adult. The Canadian journal of cardiology 2013;29:151-67.
6. Anderson TJ, Gregoire J, Pearson GJ et al. 2016 Canadian Cardiovascular Society Guidelines for the Management of Dyslipidemia for the Prevention of Cardiovascular Disease in the Adult. The Canadian journal of cardiology 2016;32:1263-1282.
7. Reiner Z, Catapano AL, De Backer G et al. ESC/EAS Guidelines for the management of dyslipidaemias: the Task Force for the management of dyslipidaemias of the European Society of Cardiology (ESC) and the European Atherosclerosis Society (EAS). European heart journal 2011;32:1769-818.
8. Stroes ES, Thompson PD, Corsini A et al. Statin-associated muscle symptoms: impact on statin therapy-European Atherosclerosis Society Consensus Panel Statement on Assessment, Aetiology and Management. European heart journal 2015;36:1012-22.
9. British Heart Foundation. Healthy Eating. https://www.bhf.org.uk/heart-health/preventing-heart-disease/healthy-eating. Accessed December 6, 2016.
10. Moyer VA. Vitamin, mineral, and multivitamin supplements for the primary prevention of cardiovascular disease and cancer: U.S. Preventive services Task Force recommendation statement. Annals of internal medicine 2014;160:558-64.
11. World Cancer Research Fund International. Our cancer prevention recommendations. http://www.wcrf.org/int/research-we-fund/our-cancer-prevention-recommendations. Accessed December 6, 2016.
12. Kushi LH, Doyle C, McCullough M et al. American Cancer Society Guidelines on nutrition and physical activity for cancer prevention: reducing the risk of cancer with healthy food choices and physical activity. CA: a cancer journal for clinicians 2012;62:30-67.
13. Canadian Cancer Society. Nutrition and Fitness (Healthy Eating VDhwccep-a-sl-wn-a-froAD.
14. Norat T, Scoccianti C, Boutron-Ruault MC et al. European Code against Cancer 4th Edition: Diet and cancer. Cancer epidemiology 2015;39 Suppl 1:S56-66.
15. Cancer Research UK. Diet and Cancer. http://www.cancerresearchuk.org/about-cancer/causes-of-cancer/diet-and-cancer. Accessed December 7, 2016.
16. Brohult J, Jonson B. Effects of large doses of calciferol on patients with rheumatoid arthritis. A double-blind clinical trial. Scandinavian journal of rheumatology 1973;2:173-6.
17. Clofibrate and niacin in coronary heart disease. Jama 1975;231:360-81.
145
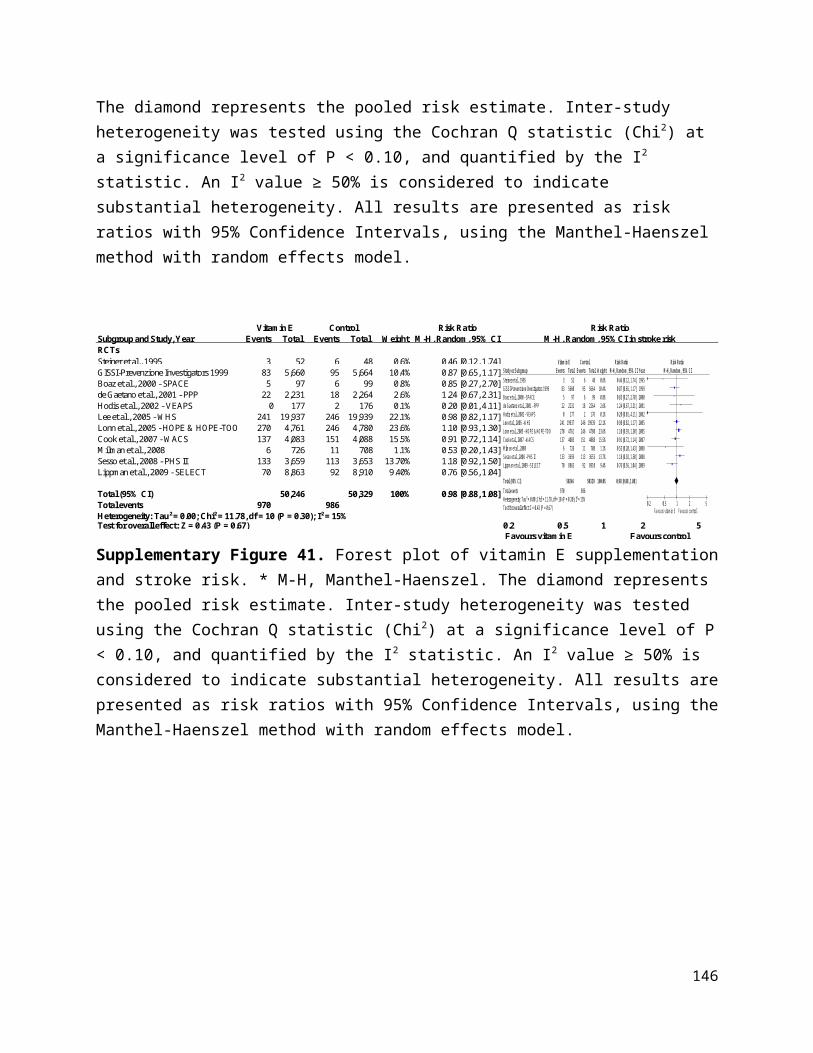
18. Gillilan RE, Mondell B, Warbasse JR. Quantitative evaluation of vitamin E in the treatment of angina pectoris. Am Heart J 1977;93:444-9.
19. Inkovaara J, Gothoni G, Halttula R, Heikinheimo R, Tokola O. Calcium, vitamin D and anabolic steroid in treatment of aged bones: double-blind placebo-controlled long-term clinical trial. Age and ageing 1983;12:124-30.
20. Corless D, Dawson E, Fraser F et al. Do vitamin D supplements improve the physical capabilities of elderly hospital patients? Age and ageing 1985;14:76-84.
21. Aloia JF, Vaswani A, Yeh JK, Ellis K, Yasumura S, Cohn SH. Calcitriol in the treatment of postmenopausal osteoporosis. The American journal of medicine 1988;84:401-8.
22. Korpela H, Kumpulainen J, Jussila E et al. Effect of selenium supplementation after acute myocardial infarction. Research communications in chemical pathology and pharmacology 1989;65:249-52.
23. McKeown-Eyssen G, Holloway C, Jazmaji V, Bright-See E, Dion P, Bruce WR. A randomized trial of vitamins C and E in the prevention of recurrence of colorectal polyps. Cancer Res 1988;48:4701-5.
24. Ott SM, Chesnut CH, 3rd. Calcitriol treatment is not effective in postmenopausal osteoporosis. Annals of internal medicine 1989;110:267-74.
25. Gallagher JC, Goldgar D. Treatment of postmenopausal osteoporosis with high doses of synthetic calcitriol. A randomized controlled study. Annals of internal medicine 1990;113:649-55.
26. Grady D, Halloran B, Cummings S et al. 1,25-Dihydroxyvitamin D3 and muscle strength in the elderly: a randomized controlled trial. The Journal of clinical endocrinology and metabolism 1991;73:1111-7.
27. Chapuy MC, Arlot ME, Duboeuf F et al. Vitamin D3 and calcium to prevent hip fractures in the elderly women. The New England journal of medicine 1992;327:1637-42.
28. Li JY, Taylor PR, Li B et al. Nutrition intervention trials in Linxian, China: multiple vitamin/mineral supplementation, cancer incidence, and disease-specific mortality among adults with esophageal dysplasia. Journal of the National Cancer Institute 1993;85:1492-8.
29. Bogden JD, Bendich A, Kemp FW et al. Daily micronutrient supplements enhance delayed-hypersensitivity skin test responses in older people. The American journal of clinical nutrition 1994;60:437-47.
30. de la Maza MP, Petermann M, Bunout D, Hirsch S. Effects of long-term vitamin E supplementation in alcoholic cirrhotics. J Am Coll Nutr 1995;14:192-6.
31. Hamdy NA, Kanis JA, Beneton MN et al. Effect of alfacalcidol on natural course of renal bone disease in mild to moderate renal failure. BMJ (Clinical research ed) 1995;310:358-63.
32. Ooms ME, Roos JC, Bezemer PD, van der Vijgh WJ, Bouter LM, Lips P. Prevention of bone loss by vitamin D supplementation in elderly women: a randomized double-blind trial. The Journal of clinical endocrinology and metabolism 1995;80:1052-8.
33. Pike J, Chandra RK. Effect of vitamin and trace element supplementation on immune indices in healthy elderly. International journal for vitamin and nutrition research Internationale Zeitschrift fur Vitamin- und Ernahrungsforschung Journal international de vitaminologie et de nutrition 1995;65:117-21.
34. Steiner M, Glantz M, Lekos A. Vitamin E plus aspirin compared with aspirin alone in patients with transient ischemic attacks. Am J Clin Nutr 1995;62:1381s-1384s.
35. Greenberg ER, Baron JA, Karagas MR et al. Mortality associated with low plasma concentration of beta carotene and the effect of oral supplementation. Jama 1996;275:699-703.
146

36. Hennekens CH, Buring JE, Manson JE et al. Lack of effect of long-term supplementation with beta carotene on the incidence of malignant neoplasms and cardiovascular disease. The New England journal of medicine 1996;334:1145-9.
37. Lips P, Graafmans WC, Ooms ME, Bezemer PD, Bouter LM. Vitamin D supplementation and fracture incidence in elderly persons. A randomized, placebo-controlled clinical trial. Annals of internal medicine 1996;124:400-6.
38. Omenn GS, Goodman GE, Thornquist MD et al. Effects of a combination of beta carotene and vitamin A on lung cancer and cardiovascular disease. The New England journal of medicine 1996;334:1150-5.
39. Stephens NG, Parsons A, Schofield PM, Kelly F, Cheeseman K, Mitchinson MJ. Randomised controlled trial of vitamin E in patients with coronary disease: Cambridge Heart Antioxidant Study (CHAOS). Lancet (London, England) 1996;347:781-6.
40. Dawson-Hughes B, Harris SS, Krall EA, Dallal GE. Effect of calcium and vitamin D supplementation on bone density in men and women 65 years of age or older. The New England journal of medicine 1997;337:670-6.
41. Girodon F, Lombard M, Galan P et al. Effect of micronutrient supplementation on infection in institutionalized elderly subjects: a controlled trial. Annals of nutrition & metabolism 1997;41:98-107.
42. Moon TE, Levine N, Cartmel B et al. Effect of retinol in preventing squamous cell skin cancer in moderate-risk subjects: a randomized, double-blind, controlled trial. Southwest Skin Cancer Prevention Study Group. Cancer epidemiology, biomarkers & prevention : a publication of the American Association for Cancer Research, cosponsored by the American Society of Preventive Oncology 1997;6:949-56.
43. Sano M, Ernesto C, Thomas RG et al. A controlled trial of selegiline, alpha-tocopherol, or both as treatment for Alzheimer's disease. The Alzheimer's Disease Cooperative Study. The New England journal of medicine 1997;336:1216-22.
44. Sato Y, Maruoka H, Oizumi K. Amelioration of hemiplegia-associated osteopenia more than 4 years after stroke by 1 alpha-hydroxyvitamin D3 and calcium supplementation. Stroke 1997;28:736-9.
45. Baeksgaard L, Andersen KP, Hyldstrup L. Calcium and vitamin D supplementation increases spinal BMD in healthy, postmenopausal women. Osteoporosis international : a journal established as result of cooperation between the European Foundation for Osteoporosis and the National Osteoporosis Foundation of the USA 1998;8:255-60.
46. Mortality in DATATOP: a multicenter trial in early Parkinson's disease. Parkinson Study Group. Annals of neurology 1998;43:318-25.
47. Virtamo J, Rapola JM, Ripatti S et al. Effect of vitamin E and beta carotene on the incidence of primary nonfatal myocardial infarction and fatal coronary heart disease. Archives of internal medicine 1998;158:668-75.
48. Baron JA, Beach M, Mandel JS et al. Calcium supplements for the prevention of colorectal adenomas. Calcium Polyp Prevention Study Group. The New England journal of medicine 1999;340:101-7.
49. Hoffman RM, Garewal HS. Alpha-tocopherol supplementation for men with existing coronary artery disease: a feasibility study. Preventive medicine 1999;29:112-8.
50. Girodon F, Galan P, Monget AL et al. Impact of trace elements and vitamin supplementation on immunity and infections in institutionalized elderly patients: a randomized controlled trial. MIN. VIT. AOX. geriatric network. Archives of internal medicine 1999;159:748-54.
51. Dietary supplementation with n-3 polyunsaturated fatty acids and vitamin E after myocardial infarction: results of the GISSI-Prevenzione trial. Gruppo Italiano per lo Studio della Sopravvivenza nell'Infarto miocardico. Lancet (London, England) 1999;354:447-55.
147

52. Green A, Williams G, Neale R et al. Daily sunscreen application and betacarotene supplementation in prevention of basal-cell and squamous-cell carcinomas of the skin: a randomised controlled trial. Lancet (London, England) 1999;354:723-9.
53. Komulainen M, Kroger H, Tuppurainen MT et al. Prevention of femoral and lumbar bone loss with hormone replacement therapy and vitamin D3 in early postmenopausal women: a population-based 5-year randomized trial. The Journal of clinical endocrinology and metabolism 1999;84:546-52.
54. Krieg MA, Jacquet AF, Bremgartner M, Cuttelod S, Thiebaud D, Burckhardt P. Effect of supplementation with vitamin D3 and calcium on quantitative ultrasound of bone in elderly institutionalized women: a longitudinal study. Osteoporosis international : a journal established as result of cooperation between the European Foundation for Osteoporosis and the National Osteoporosis Foundation of the USA 1999;9:483-8.
55. Sato Y, Manabe S, Kuno H, Oizumi K. Amelioration of osteopenia and hypovitaminosis D by 1alpha-hydroxyvitamin D3 in elderly patients with Parkinson's disease. Journal of neurology, neurosurgery, and psychiatry 1999;66:64-8.
56. Boaz M, Smetana S, Weinstein T et al. Secondary prevention with antioxidants of cardiovascular disease in endstage renal disease (SPACE): randomised placebo-controlled trial. Lancet (London, England) 2000;356:1213-8.
57. Correa P, Fontham ET, Bravo JC et al. Chemoprevention of gastric dysplasia: randomized trial of antioxidant supplements and anti-helicobacter pylori therapy. Journal of the National Cancer Institute 2000;92:1881-8.
58. Frazao JM, Elangovan L, Maung HM et al. Intermittent doxercalciferol (1alpha-hydroxyvitamin D(2)) therapy for secondary hyperparathyroidism. American journal of kidney diseases : the official journal of the National Kidney Foundation 2000;36:550-61.
59. Lee IM, Cook NR, Manson JE, Buring JE, Hennekens CH. beta-Carotene Supplementation and Incidence of Cancer and Cardiovascular Disease: the Women's Health Study. Journal of the National Cancer Institute 1999;91:2102-2106.
60. Leppala JM, Virtamo J, Fogelholm R et al. Controlled trial of alpha-tocopherol and beta-carotene supplements on stroke incidence and mortality in male smokers. Arteriosclerosis, thrombosis, and vascular biology 2000;20:230-5.
61. Jacobson JS, Begg MD, Wang LW et al. Effects of a 6-month vitamin intervention on DNA damage in heavy smokers. Cancer Epidemiol Biomarkers Prev 2000;9:1303-11.
62. Salonen JT, Nyyssonen K, Salonen R et al. Antioxidant Supplementation in Atherosclerosis Prevention (ASAP) study: a randomized trial of the effect of vitamins E and C on 3-year progression of carotid atherosclerosis. Journal of internal medicine 2000;248:377-86.
63. A randomized, placebo-controlled, clinical trial of high-dose supplementation with vitamins C and E and beta carotene for age-related cataract and vision loss: AREDS report no. 9. Archives of ophthalmology (Chicago, Ill : 1960) 2001;119:1439-52.
64. Brown BG, Zhao XQ, Chait A et al. Simvastatin and niacin, antioxidant vitamins, or the combination for the prevention of coronary disease. The New England journal of medicine 2001;345:1583-92.
65. de Gaetano G. Low-dose aspirin and vitamin E in people at cardiovascular risk: a randomised trial in general practice. Collaborative Group of the Primary Prevention Project. Lancet (London, England) 2001;357:89-95.
66. Desnuelle C, Dib M, Garrel C, Favier A. A double-blind, placebo-controlled randomized clinical trial of alpha-tocopherol (vitamin E) in the treatment of amyotrophic lateral sclerosis. ALS riluzole-tocopherol Study Group. Amyotrophic lateral sclerosis and other motor neuron disorders : official publication of the World Federation of Neurology, Research Group on Motor Neuron Diseases 2001;2:9-18.
148

67. de Waart FG, Kok FJ, Smilde TJ, Hijmans A, Wollersheim H, Stalenhoef AF. Effect of glutathione S-transferase M1 genotype on progression of atherosclerosis in lifelong male smokers. Atherosclerosis 2001;158:227-31.
68. Gallagher JC, Fowler SE, Detter JR, Sherman SS. Combination treatment with estrogen and calcitriol in the prevention of age-related bone loss. The Journal of clinical endocrinology and metabolism 2001;86:3618-28.
69. You WC, Chang YS, Heinrich J et al. An intervention trial to inhibit the progression of precancerous gastric lesions: compliance, serum micronutrients and S-allyl cysteine levels, and toxicity. European journal of cancer prevention : the official journal of the European Cancer Prevention Organisation (ECP) 2001;10:257-63.
70. Baker F PD, Blackwood S, Hunt J, Erskine M, Dyas M, Ashby M, Siva A, Brown MJ. . Blinded comparison of folic acid and placebo in patients with ischaemic heart disease: an outcome trial. . Circulation 2002;106.
71. Chapuy MC, Pamphile R, Paris E et al. Combined calcium and vitamin D3 supplementation in elderly women: confirmation of reversal of secondary hyperparathyroidism and hip fracture risk: the Decalyos II study. Osteoporosis international : a journal established as result of cooperation between the European Foundation for Osteoporosis and the National Osteoporosis Foundation of the USA 2002;13:257-64.
72. Chylack LT, Jr., Brown NP, Bron A et al. The Roche European American Cataract Trial (REACT): a randomized clinical trial to investigate the efficacy of an oral antioxidant micronutrient mixture to slow progression of age-related cataract. Ophthalmic epidemiology 2002;9:49-80.
73. Graat JM, Schouten EG, Kok FJ. Effect of daily vitamin E and multivitamin-mineral supplementation on acute respiratory tract infections in elderly persons: a randomized controlled trial. Jama 2002;288:715-21.
74. Hodis HN, Mack WJ, LaBree L et al. Alpha-tocopherol supplementation in healthy individuals reduces low-density lipoprotein oxidation but not atherosclerosis: the Vitamin E Atherosclerosis Prevention Study (VEAPS). Circulation 2002;106:1453-9.
75. MRC/BHF Heart Protection Study of antioxidant vitamin supplementation in 20,536 high-risk individuals: a randomised placebo-controlled trial. Lancet (London, England) 2002;360:23-33.
76. Meyer HE, Smedshaug GB, Kvaavik E, Falch JA, Tverdal A, Pedersen JI. Can vitamin D supplementation reduce the risk of fracture in the elderly? A randomized controlled trial. Journal of bone and mineral research : the official journal of the American Society for Bone and Mineral Research 2002;17:709-15.
77. Schnyder G, Roffi M, Flammer Y, Pin R, Hess OM. Effect of homocysteine-lowering therapy with folic acid, vitamin B12, and vitamin B6 on clinical outcome after percutaneous coronary intervention: the Swiss Heart study: a randomized controlled trial. Jama 2002;288:973-9.
78. Waters DD, Alderman EL, Hsia J et al. Effects of hormone replacement therapy and antioxidant vitamin supplements on coronary atherosclerosis in postmenopausal women: a randomized controlled trial. Jama 2002;288:2432-40.
79. Wluka AE, Stuckey S, Brand C, Cicuttini FM. Supplementary vitamin E does not affect the loss of cartilage volume in knee osteoarthritis: a 2 year double blind randomized placebo controlled study. The Journal of rheumatology 2002;29:2585-91.
80. Collins EG, Edwin Langbein W, Orebaugh C et al. PoleStriding exercise and vitamin E for management of peripheral vascular disease. Medicine and science in sports and exercise 2003;35:384-93.
149

81. Cooper L, Clifton-Bligh PB, Nery ML et al. Vitamin D supplementation and bone mineral density in early postmenopausal women. The American journal of clinical nutrition 2003;77:1324-9.
82. Liem A, Reynierse-Buitenwerf GH, Zwinderman AH, Jukema JW, van Veldhuisen DJ. Secondary prevention with folic acid: effects on clinical outcomes. Journal of the American College of Cardiology 2003;41:2105-13.
83. Righetti M, Ferrario GM, Milani S et al. Effects of folic acid treatment on homocysteine levels and vascular disease in hemodialysis patients. Medical science monitor : international medical journal of experimental and clinical research 2003;9:Pi19-24.
84. Trivedi DP, Doll R, Khaw KT. Effect of four monthly oral vitamin D3 (cholecalciferol) supplementation on fractures and mortality in men and women living in the community: randomised double blind controlled trial. BMJ (Clinical research ed) 2003;326:469.
85. Virtamo J, Pietinen P, Huttunen JK et al. Incidence of cancer and mortality following alpha-tocopherol and beta-carotene supplementation: a postintervention follow-up. Jama 2003;290:476-85.
86. Dukas L, Bischoff HA, Lindpaintner LS et al. Alfacalcidol reduces the number of fallers in a community-dwelling elderly population with a minimum calcium intake of more than 500 mg daily. Journal of the American Geriatrics Society 2004;52:230-6.
87. Harwood RH, Sahota O, Gaynor K, Masud T, Hosking DJ. A randomised, controlled comparison of different calcium and vitamin D supplementation regimens in elderly women after hip fracture: The Nottingham Neck of Femur (NONOF) Study. Age and ageing 2004;33:45-51.
88. Coburn JW, Maung HM, Elangovan L et al. Doxercalciferol safely suppresses PTH levels in patients with secondary hyperparathyroidism associated with chronic kidney disease stages 3 and 4. American journal of kidney diseases : the official journal of the National Kidney Foundation 2004;43:877-90.
89. Lange H, Suryapranata H, De Luca G et al. Folate therapy and in-stent restenosis after coronary stenting. The New England journal of medicine 2004;350:2673-81.
90. Larsen ER, Mosekilde L, Foldspang A. Vitamin D and calcium supplementation prevents osteoporotic fractures in elderly community dwelling residents: a pragmatic population-based 3-year intervention study. Journal of bone and mineral research : the official journal of the American Society for Bone and Mineral Research 2004;19:370-8.
91. Liem AH, van Boven AJ, Veeger NJ et al. Efficacy of folic acid when added to statin therapy in patients with hypercholesterolemia following acute myocardial infarction: a randomised pilot trial. International journal of cardiology 2004;93:175-9.
92. Taylor AJ, Sullenberger LE, Lee HJ, Lee JK, Grace KA. Arterial Biology for the Investigation of the Treatment Effects of Reducing Cholesterol (ARBITER) 2: a double-blind, placebo-controlled study of extended-release niacin on atherosclerosis progression in secondary prevention patients treated with statins. Circulation 2004;110:3512-7.
93. Tornwall ME, Virtamo J, Korhonen PA et al. Effect of alpha-tocopherol and beta-carotene supplementation on coronary heart disease during the 6-year post-trial follow-up in the ATBC study. European heart journal 2004;25:1171-8.
94. Manuel-y-Keenoy B, Vinckx M, Vertommen J, van Gaal L, de Leeuw I. Impact of vitamin E supplementation on lipoprotein peroxidation and composition in type 1 diabetic patients treated with atorvastatin. Atherosclerosis 2004;175:369-376.
95. McNeil JJ, Robman L, Tikellis G, Sinclair MI, McCarty CA, Taylor HR. Vitamin E supplementation and cataract: randomized controlled trial. Ophthalmology 2004;111:75-84.
96. Meier C, Woitge HW, Witte K, Lemmer B, Seibel MJ. Supplementation with oral vitamin D3 and calcium during winter prevents seasonal bone loss: a randomized controlled
150
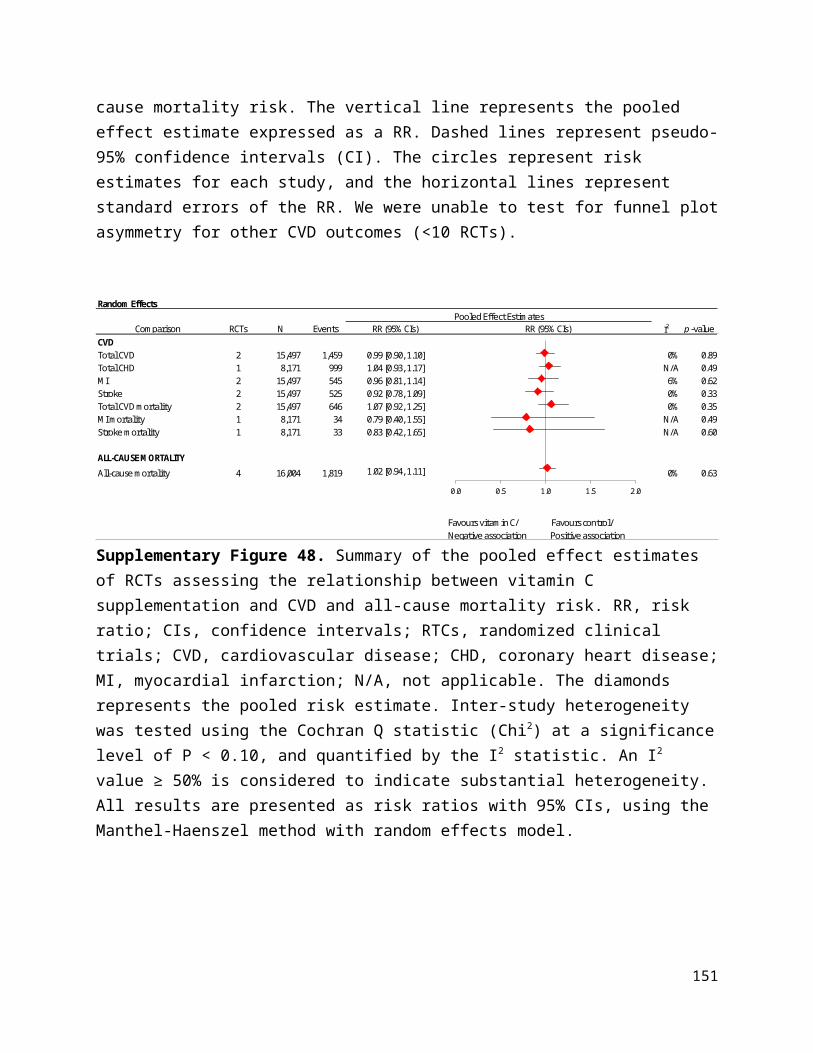
open-label prospective trial. Journal of bone and mineral research : the official journal of the American Society for Bone and Mineral Research 2004;19:1221-30.
97. Meydani SN, Leka LS, Fine BC et al. Vitamin E and respiratory tract infections in elderly nursing home residents: a randomized controlled trial. Jama 2004;292:828-36.
98. Aloia JF, Talwar SA, Pollack S, Yeh J. A randomized controlled trial of vitamin D3 supplementation in African American women. Archives of internal medicine 2005;165:1618-23.
99. Avenell A, Campbell MK, Cook JA et al. Effect of multivitamin and multimineral supplements on morbidity from infections in older people (MAVIS trial): pragmatic, randomised, double blind, placebo controlled trial. BMJ (Clinical research ed) 2005;331:324-9.
100. Brazier M, Grados F, Kamel S et al. Clinical and laboratory safety of one year's use of a combination calcium + vitamin D tablet in ambulatory elderly women with vitamin D insufficiency: results of a multicenter, randomized, double-blind, placebo-controlled study. Clinical therapeutics 2005;27:1885-93.
101. Flicker L, MacInnis RJ, Stein MS et al. Should older people in residential care receive vitamin D to prevent falls? Results of a randomized trial. Journal of the American Geriatrics Society 2005;53:1881-8.
102. Graf M, Ecker D, Horowski R et al. High dose vitamin E therapy in amyotrophic lateral sclerosis as add-on therapy to riluzole: results of a placebo-controlled double-blind study. Journal of neural transmission (Vienna, Austria : 1996) 2005;112:649-60.
103. Grant AM, Avenell A, Campbell MK et al. Oral vitamin D3 and calcium for secondary prevention of low-trauma fractures in elderly people (Randomised Evaluation of Calcium Or vitamin D, RECORD): a randomised placebo-controlled trial. Lancet (London, England) 2005;365:1621-8.
104. Lee IM, Cook NR, Gaziano JM et al. Vitamin E in the primary prevention of cardiovascular disease and cancer: the Women's Health Study: a randomized controlled trial. Jama 2005;294:56-65.
105. Limburg PJ, Wei W, Ahnen DJ et al. Randomized, placebo-controlled, esophageal squamous cell cancer chemoprevention trial of selenomethionine and celecoxib. Gastroenterology 2005;129:863-73.
106. Lonn E, Bosch J, Yusuf S et al. Effects of long-term vitamin E supplementation on cardiovascular events and cancer: a randomized controlled trial. Jama 2005;293:1338-47.
107. Mooney LA, Madsen AM, Tang D et al. Antioxidant vitamin supplementation reduces benzo(a)pyrene-DNA adducts and potential cancer risk in female smokers. Cancer epidemiology, biomarkers & prevention : a publication of the American Association for Cancer Research, cosponsored by the American Society of Preventive Oncology 2005;14:237-42.
108. Petersen RC, Thomas RG, Grundman M et al. Vitamin E and donepezil for the treatment of mild cognitive impairment. The New England journal of medicine 2005;352:2379-88.
109. Porthouse J, Cockayne S, King C et al. Randomised controlled trial of calcium and supplementation with cholecalciferol (vitamin D3) for prevention of fractures in primary care. BMJ (Clinical research ed) 2005;330:1003.
110. Potena L, Grigioni F, Magnani G et al. Homocysteine-lowering therapy and early progression of transplant vasculopathy: a prospective, randomized, IVUS-based study. American journal of transplantation : official journal of the American Society of Transplantation and the American Society of Transplant Surgeons 2005;5:2258-64.
111. Sato Y, Iwamoto J, Kanoko T, Satoh K. Low-dose vitamin D prevents muscular atrophy and reduces falls and hip fractures in women after stroke: a randomized controlled trial. Cerebrovascular diseases (Basel, Switzerland) 2005;20:187-92.
151

112. Bairati I, Meyer F, Jobin E et al. Antioxidant vitamins supplementation and mortality: a randomized trial in head and neck cancer patients. International journal of cancer 2006;119:2221-4.
113. Bonaa KH, Njolstad I, Ueland PM et al. Homocysteine lowering and cardiovascular events after acute myocardial infarction. The New England journal of medicine 2006;354:1578-88.
114. Coyne D, Acharya M, Qiu P et al. Paricalcitol capsule for the treatment of secondary hyperparathyroidism in stages 3 and 4 CKD. American journal of kidney diseases : the official journal of the National Kidney Foundation 2006;47:263-76.
115. Daly RM, Brown M, Bass S, Kukuljan S, Nowson C. Calcium- and vitamin D3-fortified milk reduces bone loss at clinically relevant skeletal sites in older men: a 2-year randomized controlled trial. Journal of bone and mineral research : the official journal of the American Society for Bone and Mineral Research 2006;21:397-405.
116. Law M, Withers H, Morris J, Anderson F. Vitamin D supplementation and the prevention of fractures and falls: results of a randomised trial in elderly people in residential accommodation. Age and ageing 2006;35:482-6.
117. Lonn E, Yusuf S, Arnold MJ et al. Homocysteine lowering with folic acid and B vitamins in vascular disease. The New England journal of medicine 2006;354:1567-77.
118. Magliano D, McNeil J, Branley P et al. The Melbourne Atherosclerosis Vitamin E Trial (MAVET): a study of high dose vitamin E in smokers. European journal of cardiovascular prevention and rehabilitation : official journal of the European Society of Cardiology, Working Groups on Epidemiology & Prevention and Cardiac Rehabilitation and Exercise Physiology 2006;13:341-7.
119. Schleithoff SS, Zittermann A, Tenderich G, Berthold HK, Stehle P, Koerfer R. Vitamin D supplementation improves cytokine profiles in patients with congestive heart failure: a double-blind, randomized, placebo-controlled trial. The American journal of clinical nutrition 2006;83:754-9.
120. Stranges S, Marshall JR, Trevisan M et al. Effects of selenium supplementation on cardiovascular disease incidence and mortality: secondary analyses in a randomized clinical trial. American journal of epidemiology 2006;163:694-9.
121. Zoungas S, McGrath BP, Branley P et al. Cardiovascular morbidity and mortality in the Atherosclerosis and Folic Acid Supplementation Trial (ASFAST) in chronic renal failure: a multicenter, randomized, controlled trial. Journal of the American College of Cardiology 2006;47:1108-16.
122. Bolton-Smith C, McMurdo ME, Paterson CR et al. Two-year randomized controlled trial of vitamin K1 (phylloquinone) and vitamin D3 plus calcium on the bone health of older women. Journal of bone and mineral research : the official journal of the American Society for Bone and Mineral Research 2007;22:509-19.
123. Catalano M, Born G, Peto R. Prevention of serious vascular events by aspirin amongst patients with peripheral arterial disease: randomized, double-blind trial. Journal of internal medicine 2007;261:276-84.
124. Cole BF, Baron JA, Sandler RS et al. Folic acid for the prevention of colorectal adenomas: a randomized clinical trial. Jama 2007;297:2351-9.
125. Cook NR, Albert CM, Gaziano JM et al. A randomized factorial trial of vitamins C and E and beta carotene in the secondary prevention of cardiovascular events in women: results from the Women's Antioxidant Cardiovascular Study. Archives of internal medicine 2007;167:1610-8.
126. Durga J, van Boxtel MP, Schouten EG et al. Effect of 3-year folic acid supplementation on cognitive function in older adults in the FACIT trial: a randomised, double blind, controlled trial. Lancet (London, England) 2007;369:208-16.
152
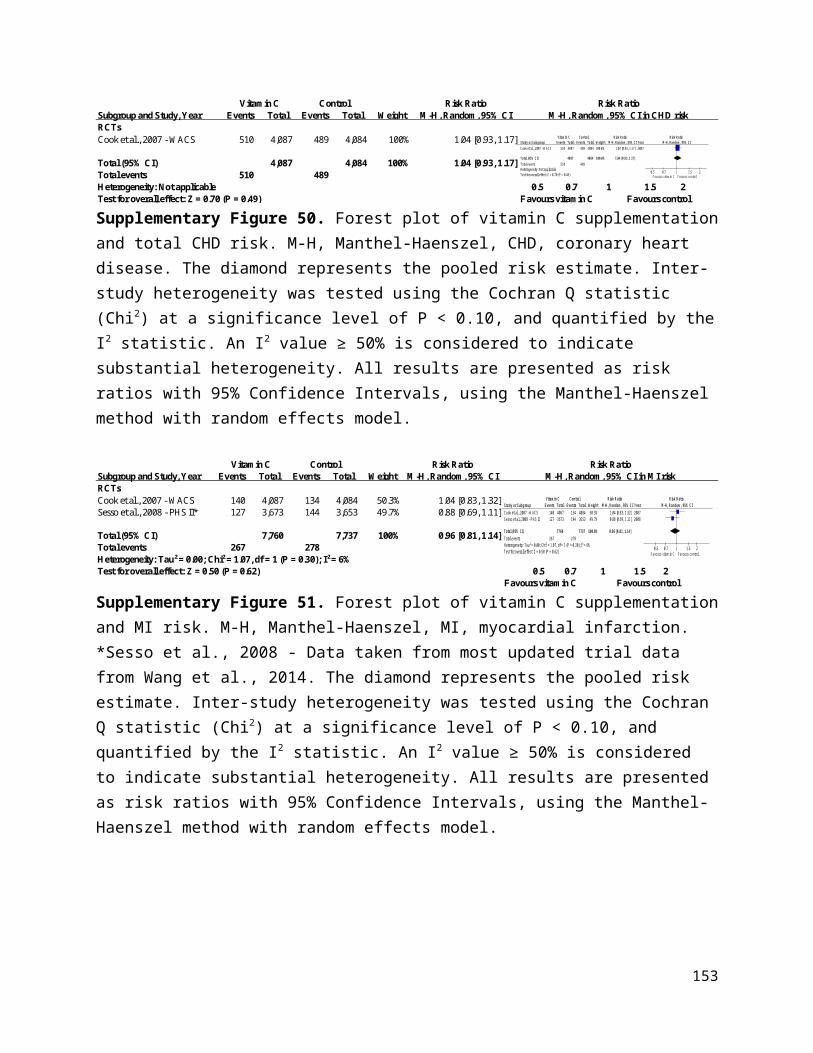
127. Jamison RL, Hartigan P, Kaufman JS et al. Effect of homocysteine lowering on mortality and vascular disease in advanced chronic kidney disease and end-stage renal disease: a randomized controlled trial. Jama 2007;298:1163-70.
128. Lappe JM, Travers-Gustafson D, Davies KM, Recker RR, Heaney RP. Vitamin D and calcium supplementation reduces cancer risk: results of a randomized trial. The American journal of clinical nutrition 2007;85:1586-91.
129. Liu BA, McGeer A, McArthur MA et al. Effect of multivitamin and mineral supplementation on episodes of infection in nursing home residents: a randomized, placebo-controlled study. Journal of the American Geriatrics Society 2007;55:35-42.
130. Lyons RA, Johansen A, Brophy S et al. Preventing fractures among older people living in institutional care: a pragmatic randomised double blind placebo controlled trial of vitamin D supplementation. Osteoporosis international : a journal established as result of cooperation between the European Foundation for Osteoporosis and the National Osteoporosis Foundation of the USA 2007;18:811-8.
131. Plummer M, Vivas J, Lopez G et al. Chemoprevention of precancerous gastric lesions with antioxidant vitamin supplementation: a randomized trial in a high-risk population. Journal of the National Cancer Institute 2007;99:137-46.
132. Smith H, Anderson F, Raphael H, Maslin P, Crozier S, Cooper C. Effect of annual intramuscular vitamin D on fracture risk in elderly men and women--a population-based, randomized, double-blind, placebo-controlled trial. Rheumatology (Oxford, England) 2007;46:1852-7.
133. Vianna AC, Mocelin AJ, Matsuo T et al. Uremic hyperhomocysteinemia: a randomized trial of folate treatment for the prevention of cardiovascular events. Hemodialysis international International Symposium on Home Hemodialysis 2007;11:210-6.
134. Albert CM, Cook NR, Gaziano JM et al. Effect of folic acid and B vitamins on risk of cardiovascular events and total mortality among women at high risk for cardiovascular disease: a randomized trial. Jama 2008;299:2027-36.
135. Bjorkman M, Sorva A, Risteli J, Tilvis R. Vitamin D supplementation has minor effects on parathyroid hormone and bone turnover markers in vitamin D-deficient bedridden older patients. Age and ageing 2008;37:25-31.
136. Bolland MJ, Barber PA, Doughty RN et al. Vascular events in healthy older women receiving calcium supplementation: randomised controlled trial. BMJ (Clinical research ed) 2008;336:262-6.
137. Maraini G, Williams SL, Sperduto RD et al. A randomized, double-masked, placebo-controlled clinical trial of multivitamin supplementation for age-related lens opacities. Clinical trial of nutritional supplements and age-related cataract report no. 3. Ophthalmology 2008;115:599-607.e1.
138. Ebbing M, Bleie O, Ueland PM et al. Mortality and cardiovascular events in patients treated with homocysteine-lowering B vitamins after coronary angiography: a randomized controlled trial. Jama 2008;300:795-804.
139. Guyton JR, Brown BG, Fazio S, Polis A, Tomassini JE, Tershakovec AM. Lipid-altering efficacy and safety of ezetimibe/simvastatin coadministered with extended-release niacin in patients with type IIa or type IIb hyperlipidemia. Journal of the American College of Cardiology 2008;51:1564-72.
140. Logan RF, Grainge MJ, Shepherd VC, Armitage NC, Muir KR. Aspirin and folic acid for the prevention of recurrent colorectal adenomas. Gastroenterology 2008;134:29-38.
141. Milman U, Blum S, Shapira C et al. Vitamin E supplementation reduces cardiovascular events in a subgroup of middle-aged individuals with both type 2 diabetes mellitus and the haptoglobin 2-2 genotype: a prospective double-blinded clinical trial. Arteriosclerosis, thrombosis, and vascular biology 2008;28:341-7.
153
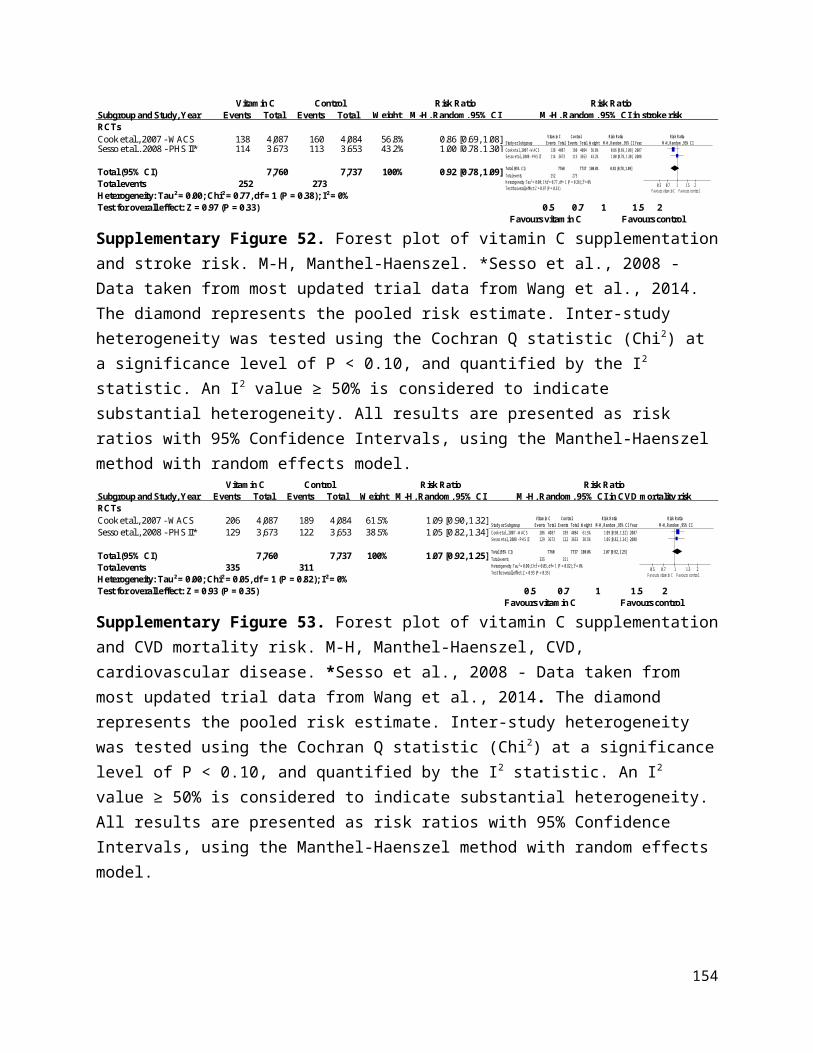
142. Prince RL, Austin N, Devine A, Dick IM, Bruce D, Zhu K. Effects of ergocalciferol added to calcium on the risk of falls in elderly high-risk women. Archives of internal medicine 2008;168:103-8.
143. Reid IR, Ames R, Mason B et al. Randomized controlled trial of calcium supplementation in healthy, nonosteoporotic, older men. Archives of internal medicine 2008;168:2276-2282.
144. Sesso HD, Buring JE, Christen WG et al. Vitamins E and C in the prevention of cardiovascular disease in men: the Physicians' Health Study II randomized controlled trial. Jama 2008;300:2123-33.
145. Zhu K, Devine A, Dick IM, Wilson SG, Prince RL. Effects of calcium and vitamin D supplementation on hip bone mineral density and calcium-related analytes in elderly ambulatory Australian women: a five-year randomized controlled trial. The Journal of clinical endocrinology and metabolism 2008;93:743-9.
146. Anker SD, Comin Colet J, Filippatos G et al. Ferric carboxymaltose in patients with heart failure and iron deficiency. The New England journal of medicine 2009;361:2436-48.
147. Hodis HN, Mack WJ, Dustin L et al. High-dose B vitamin supplementation and progression of subclinical atherosclerosis: a randomized controlled trial. Stroke 2009;40:730-6.
148. Imasa MS, Gomez NT, Nevado JB, Jr. Folic acid-based intervention in non-ST elevation acute coronary syndromes. Asian cardiovascular & thoracic annals 2009;17:13-21.
149. LaCroix AZ, Kotchen J, Anderson G et al. Calcium plus vitamin D supplementation and mortality in postmenopausal women: the Women's Health Initiative calcium-vitamin D randomized controlled trial. The journals of gerontology Series A, Biological sciences and medical sciences 2009;64:559-67.
150. Lippman SM, Klein EA, Goodman PJ et al. Effect of selenium and vitamin E on risk of prostate cancer and other cancers: the Selenium and Vitamin E Cancer Prevention Trial (SELECT). Jama 2009;301:39-51.
151. Saposnik G, Ray JG, Sheridan P, McQueen M, Lonn E. Homocysteine-lowering therapy and stroke risk, severity, and disability: additional findings from the HOPE 2 trial. Stroke 2009;40:1365-72.
152. Sang ZC, Wang F, Zhou Q et al. Combined use of extended-release niacin and atorvastatin: safety and effects on lipid modification. Chinese medical journal 2009;122:1615-20.
153. Wu K, Platz EA, Willett WC et al. A randomized trial on folic acid supplementation and risk of recurrent colorectal adenoma. The American journal of clinical nutrition 2009;90:1623-31.
154. Armitage JM, Bowman L, Clarke RJ et al. Effects of homocysteine-lowering with folic acid plus vitamin B12 vs placebo on mortality and major morbidity in myocardial infarction survivors: a randomized trial. Jama 2010;303:2486-94.
155. Chailurkit LO, Saetung S, Thakkinstian A, Ongphiphadhanakul B, Rajatanavin R. Discrepant influence of vitamin D status on parathyroid hormone and bone mass after two years of calcium supplementation. Clinical endocrinology 2010;73:167-72.
156. de Zeeuw D, Agarwal R, Amdahl M et al. Selective vitamin D receptor activation with paricalcitol for reduction of albuminuria in patients with type 2 diabetes (VITAL study): a randomised controlled trial. Lancet (London, England) 2010;376:1543-51.
157. Galan P, Kesse-Guyot E, Czernichow S, Briancon S, Blacher J, Hercberg S. Effects of B vitamins and omega 3 fatty acids on cardiovascular diseases: a randomised placebo controlled trial. BMJ (Clinical research ed) 2010;341:c6273.
158. Heinz J, Kropf S, Domrose U et al. B vitamins and the risk of total mortality and cardiovascular disease in end-stage renal disease: results of a randomized controlled trial. Circulation 2010;121:1432-8.
154

159. Hercberg S, Kesse-Guyot E, Druesne-Pecollo N et al. Incidence of cancers, ischemic cardiovascular diseases and mortality during 5-year follow-up after stopping antioxidant vitamins and minerals supplements: a postintervention follow-up in the SU.VI.MAX Study. International journal of cancer 2010;127:1875-81.
160. House AA, Eliasziw M, Cattran DC et al. Effect of B-vitamin therapy on progression of diabetic nephropathy: a randomized controlled trial. Jama 2010;303:1603-9.
161. Janssen HC, Samson MM, Verhaar HJ. Muscle strength and mobility in vitamin D-insufficient female geriatric patients: a randomized controlled trial on vitamin D and calcium supplementation. Aging clinical and experimental research 2010;22:78-84.
162. Salovaara K, Tuppurainen M, Karkkainen M et al. Effect of vitamin D(3) and calcium on fracture risk in 65- to 71-year-old women: a population-based 3-year randomized, controlled trial--the OSTPRE-FPS. Journal of bone and mineral research : the official journal of the American Society for Bone and Mineral Research 2010;25:1487-95.
163. Sanders KM, Stuart AL, Williamson EJ et al. Annual high-dose oral vitamin D and falls and fractures in older women: a randomized controlled trial. Jama 2010;303:1815-22.
164. Sanyal AJ, Chalasani N, Kowdley KV et al. Pioglitazone, vitamin E, or placebo for nonalcoholic steatohepatitis. The New England journal of medicine 2010;362:1675-85.
165. B vitamins in patients with recent transient ischaemic attack or stroke in the VITAmins TO Prevent Stroke (VITATOPS) trial: a randomised, double-blind, parallel, placebo-controlled trial. The Lancet Neurology 2010;9:855-65.
166. Boden WE, Probstfield JL, Anderson T et al. Niacin in patients with low HDL cholesterol levels receiving intensive statin therapy. The New England journal of medicine 2011;365:2255-67.
167. Cherniack EP, Florez HJ, Hollis BW, Roos BA, Troen BR, Levis S. The response of elderly veterans to daily vitamin D3 supplementation of 2,000 IU: a pilot efficacy study. Journal of the American Geriatrics Society 2011;59:286-90.
168. Grimnes G, Figenschau Y, Almas B, Jorde R. Vitamin D, insulin secretion, sensitivity, and lipids: results from a case-control study and a randomized controlled trial using hyperglycemic clamp technique. Diabetes 2011;60:2748-57.
169. Lewis JR, Calver J, Zhu K, Flicker L, Prince RL. Calcium supplementation and the risks of atherosclerotic vascular disease in older women: results of a 5-year RCT and a 4.5-year follow-up. Journal of bone and mineral research : the official journal of the American Society for Bone and Mineral Research 2011;26:35-41.
170. Gallagher JC, Sai A, Templin T, 2nd, Smith L. Dose response to vitamin D supplementation in postmenopausal women: a randomized trial. Annals of internal medicine 2012;156:425-37.
171. Marshall JR, Tangen CM, Sakr WA et al. Phase III trial of selenium to prevent prostate cancer in men with high-grade prostatic intraepithelial neoplasia: SWOG S9917. Cancer prevention research (Philadelphia, Pa) 2011;4:1761-9.
172. Alvarez JA, Law J, Coakley KE et al. High-dose cholecalciferol reduces parathyroid hormone in patients with early chronic kidney disease: a pilot, randomized, double-blind, placebo-controlled trial. The American journal of clinical nutrition 2012;96:672-9.
173. Glendenning P, Zhu K, Inderjeeth C, Howat P, Lewis JR, Prince RL. Effects of three-monthly oral 150,000 IU cholecalciferol supplementation on falls, mobility, and muscle strength in older postmenopausal women: a randomized controlled trial. Journal of bone and mineral research : the official journal of the American Society for Bone and Mineral Research 2012;27:170-6.
174. Lehouck A, Mathieu C, Carremans C et al. High doses of vitamin D to reduce exacerbations in chronic obstructive pulmonary disease: a randomized trial. Annals of internal medicine 2012;156:105-14.
155

175. Ma JL, Zhang L, Brown LM et al. Fifteen-year effects of Helicobacter pylori, garlic, and vitamin treatments on gastric cancer incidence and mortality. Journal of the National Cancer Institute 2012;104:488-92.
176. Punthakee Z, Bosch J, Dagenais G et al. Design, history and results of the Thiazolidinedione Intervention with vitamin D Evaluation (TIDE) randomised controlled trial. Diabetologia 2012;55:36-45.
177. Sesso HD, Christen WG, Bubes V et al. Multivitamins in the prevention of cardiovascular disease in men: the Physicians' Health Study II randomized controlled trial. Jama 2012;308:1751-60.
178. Delanaye P, Weekers L, Warling X et al. Cholecalciferol in haemodialysis patients: a randomized, double-blind, proof-of-concept and safety study. Nephrology, dialysis, transplantation : official publication of the European Dialysis and Transplant Association - European Renal Association 2013;28:1779-86.
179. Hewitt NA, O'Connor AA, O'Shaughnessy DV, Elder GJ. Effects of cholecalciferol on functional, biochemical, vascular, and quality of life outcomes in hemodialysis patients. Clinical journal of the American Society of Nephrology : CJASN 2013;8:1143-9.
180. Lamas GA, Boineau R, Goertz C et al. Oral high-dose multivitamins and minerals after myocardial infarction: a randomized trial. Annals of internal medicine 2013;159:797-805.
181. Manning PJ, Sutherland WH, Williams SM et al. The effect of lipoic acid and vitamin E therapies in individuals with the metabolic syndrome. Nutrition, metabolism, and cardiovascular diseases : NMCD 2013;23:543-9.
182. Prentice RL, Pettinger MB, Jackson RD et al. Health risks and benefits from calcium and vitamin D supplementation: Women's Health Initiative clinical trial and cohort study. Osteoporosis international : a journal established as result of cooperation between the European Foundation for Osteoporosis and the National Osteoporosis Foundation of the USA 2013;24:567-80.
183. Witham MD, Price RJ, Struthers AD et al. Cholecalciferol treatment to reduce blood pressure in older patients with isolated systolic hypertension: the VitDISH randomized controlled trial. JAMA internal medicine 2013;173:1672-9.
184. Witham MD, Dove FJ, Khan F, Lang CC, Belch JJ, Struthers AD. Effects of vitamin D supplementation on markers of vascular function after myocardial infarction--a randomised controlled trial. Int J Cardiol 2013;167:745-9.
185. Landray MJ, Haynes R, Hopewell JC et al. Effects of extended-release niacin with laropiprant in high-risk patients. The New England journal of medicine 2014;371:203-12.
186. Wang AY, Fang F, Chan J et al. Effect of paricalcitol on left ventricular mass and function in CKD--the OPERA trial. Journal of the American Society of Nephrology : JASN 2014;25:175-86.
187. van Wijngaarden JP, Swart KM, Enneman AW et al. Effect of daily vitamin B-12 and folic acid supplementation on fracture incidence in elderly individuals with an elevated plasma homocysteine concentration: B-PROOF, a randomized controlled trial. The American journal of clinical nutrition 2014;100:1578-86.
188. Wang L, Sesso HD, Glynn RJ et al. Vitamin E and C supplementation and risk of cancer in men: posttrial follow-up in the Physicians' Health Study II randomized trial. The American journal of clinical nutrition 2014;100:915-23.
189. Huo Y, Li J, Qin X et al. Efficacy of folic acid therapy in primary prevention of stroke among adults with hypertension in China: the CSPPT randomized clinical trial. Jama 2015;313:1325-35.
190. Ponikowski P, van Veldhuisen DJ, Comin-Colet J et al. Beneficial effects of long-term intravenous iron therapy with ferric carboxymaltose in patients with symptomatic heart failure and iron deficiencydagger. European heart journal 2015;36:657-68.
156

191. Wang LL, H. Zhou, Y. Jin, L. Liu, J. Low-dose B vitamins supplementation ameliorates cardiovascular risk: a double-blind randomized controlled trial in healthy Chinese elderly. Eur J Nutr 2015;54:455-64.
192. van Dijk SC, Enneman AW, Swart KM et al. Effects of 2-year vitamin B12 and folic acid supplementation in hyperhomocysteinemic elderly on arterial stiffness and cardiovascular outcomes within the B-PROOF trial. Journal of hypertension 2015;33:1897-906; discussion 1906.
193. Gupta A, Prabhakar S, Modi M et al. Effect of Vitamin D and calcium supplementation on ischaemic stroke outcome: a randomised controlled open-label trial. International journal of clinical practice 2016;70:764-70.
194. Lappe J, Watson P, Travers-Gustafson D et al. Effect of Vitamin D and Calcium Supplementation on Cancer Incidence in Older Women: A Randomized Clinical Trial. Jama 2017;317:1234-1243.
157
Related Documents