Strategic Enterprise Plan: 2021 Update & Operational and Financial Review Michael M. Crow February 12, 2021 Arizona State University

Welcome message from author
This document is posted to help you gain knowledge. Please leave a comment to let me know what you think about it! Share it to your friends and learn new things together.
Transcript

Strategic Enterprise Plan:2021 Update & Operational and Financial Review
Michael M. CrowFebruary 12, 2021
Arizona State University
The ASU Enterprise
2

Ohio State University
First WaveGreek Academies
Second WaveState Colleges
Fifth WaveNational Service Universities
Schools founded during the early Republicthat established the prototype for theAmerican residential liberal arts college
Liberal arts colleges established during the twentieth century as variants of the colonial colleges
163 6 1693 1701 1746 17541755 1764 1766 1769
1783 1793 1794 1800 1832 1833 1837 18461860 1864 18711885 1887
1908 1932 19461955 1969 1997
Harvard College*College of William and MaryYale CollegeCollege of New Jersey (Princeton)King’s College (Columbia)College of Philadelphia (Penn)College of Rhode Island (Brown)Queen’s College (Rutgers)Dartmouth College
Dickinson CollegeWilliams CollegeBowdoin CollegeMiddlebury CollegeWabash CollegeOberlin CollegeMount Holyoke CollegeGrinnell CollegeBard CollegeSwarthmore CollegeSmith CollegeBryn Mawr CollegePomona College, etc.
Reed CollegeBennington CollegeClaremont McKenna CollegeHarvey Mudd CollegeCollege of the AtlanticOlin College, etc.
Arizona State University*
Fourth Wave institutions combining scaleand accessibility with world-classresearch enterprises
Penn State UniversityUniversity of Maryland systemPurdue University, etc.
Fourth WaveResearch Universities
First Wave colleges that evolved into research universitiesHarvard UniversityYale UniversityPrinceton UniversityColumbia UniversityUniversity of PennsylvaniaBrown University, etc.
Second Wave colleges and universities that evolved into research universitiesUniversity of GeorgiaUniversity of North CarolinaUniversity of MichiganUniversity of VirginiaGeorgia TechCaltechArizona State University, etc.
Third Wave universities that evolved into research universitiesUniversity of WisconsinUniversity of MinnesotaMichigan State UniversityPenn State UniversityUniversity of MarylandIowa State UniversityMITCornell UniversityUniversity of IllinoisUniversity of CaliforniaPurdue University, etc.University of Arizona
1876 18851890
Johns Hopkins University*Stanford University*University of Chicago*
Third WaveLand-Grant Colleges
State-chartered colleges and universities, including teacher colleges and technological institutes, some private
1946 1963 1966
1862
2018
1909 1944
1880 1883 1885 1885
1891
1848 1851 185518551856 18581861
1785 17891792 1801 18161819
Portland State UniversityUniversity of Central FloridaUniversity of Maryland Baltimore County, etc.
California State Normal School (California State University system)
California Community College No. 115
Tennessee Tech1899 Northern Arizona University
Utah Valley University
University of Southern CaliforniaUniversity of Texas, AustinTempe Normal School (ASU)Georgia Institute of Technology(Georgia Tech)California Institute of Technology(Caltech), etc.
University of WisconsinUniversity of MinnesotaMichigan State UniversityPenn State UniversityUniversity of MarylandIowa State UniversityMassachusetts Institute of Technology (MIT), etc.
University of Georgia*University of North Carolina*University of Vermont University of South Carolina University of MichiganUniversity of Virginia*
University of WisconsinUniversity of MinnesotaMichigan State UniversityPenn State UniversityUniversity of MarylandIowa State UniversityMIT, etc.
Second Wave schools subsequently designated land-grant universities
Alabama A&M UniversityTuskegee UniversityWest Virginia State University, etc.
1890 land-grant institutions (HBCUs)
Land-grant colleges and universities established as a consequence of the Morrill Act of 1862
1865 1867 18681869
Cornell University*University of Illinois*University of California*Purdue University
Texas A&M University, etc.18701871
University of Arizona1885
3
ASU is leading the Fifth Wave
* = progenitors

National Service Universities aspire to accelerate positive social outcomes through the seamless integration of cutting-edge technological innovation and scalability with institutional cultures dedicated to the advancement of academic enterprise and public value.
ASU is an emerging National Service University
4

Our charter drives all we do
ASU is a comprehensive public research university, measured not by whom it excludes, but by whom it includes and how they succeed; advancing research and discovery of public value; and assuming fundamental responsibility for the economic, social, cultural and overall health of the communities it serves.
5

Fulfilling our responsibility and the public trust
The charter is a promise to the citizens of Arizona.
ASU has a responsibility to fulfill the requirements of the Arizona Constitution to provide public education.
The responsibility is not one that is conditional upon the actions of the legislature; it is ASU’s responsibility to find the means to fulfill its charter while seeking appropriate and fair public investment in the costs of education for Arizona resident students.
6

Leverage Our PlaceASU embraces its cultural, socioeconomic and physical setting.
Transform SocietyASU catalyzes social change by being connected to social needs.
Value EntrepreneurshipASU uses its knowledge and encourages innovation.
Conduct Use-Inspired ResearchASU research has purpose and impact.
Enable Student SuccessASU is committed to the success of each unique student.
Fuse Intellectual DisciplinesASU creates knowledge by transcending academic disciplines.
Be Socially EmbeddedASU connects with communities through mutually beneficial partnerships.
Engage GloballyASU engages with people and issues locally, nationally and internationally..
Our design aspirations are how we work
7

Academic Enterprise
8
ASU’s public enterprise continues to evolve

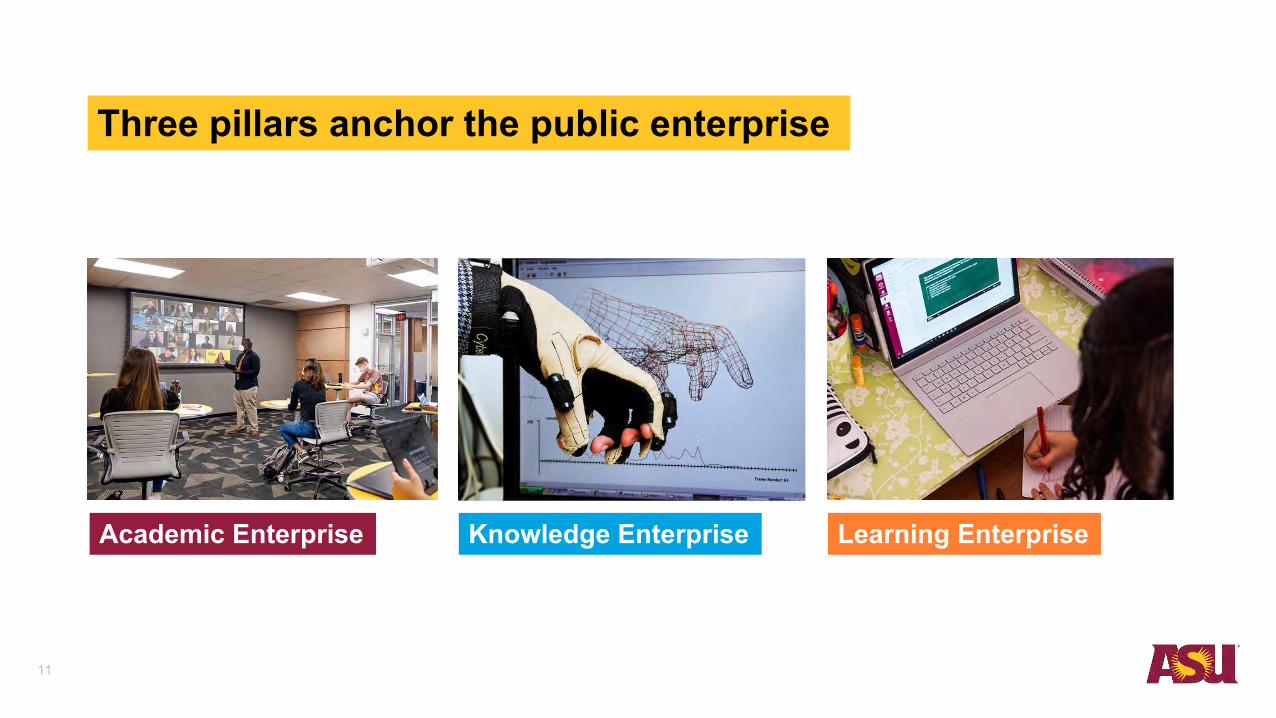
Academic Enterprise
Knowledge Enterprise
9
ASU’s public enterprise continues to evolve

Academic Enterprise
Knowledge Enterprise
Learning Enterprise
10
ASU’s public enterprise continues to evolve
Academic Enterprise Knowledge Enterprise Learning Enterprise
11
Three pillars anchor the public enterprise

ASU: A public enterprise university in service to the nation
ASU Preparatory Academy
ASU Marketing Hub
ASU Enterprise Technology Office
ASU Enterprise Partners
EdPlus@ASU
12
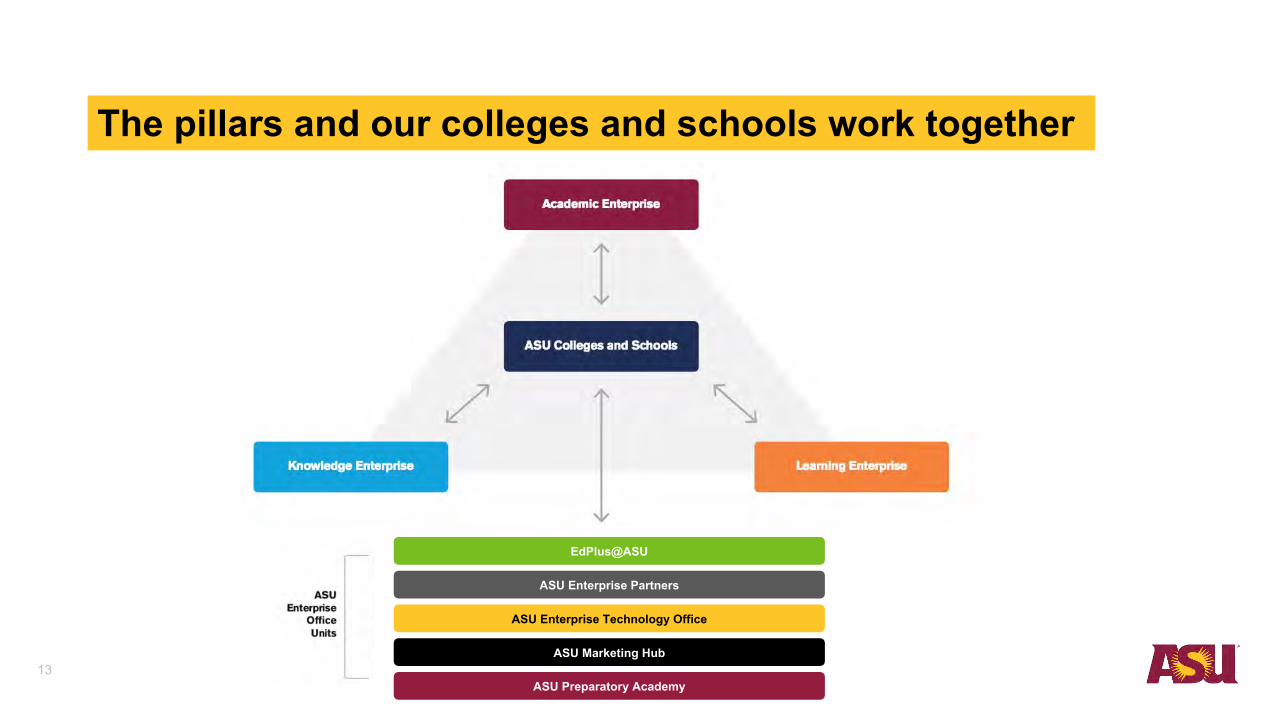
The pillars and our colleges and schools work together
ASU Preparatory Academy
ASU Marketing Hub
ASU Enterprise Technology Office
ASU Enterprise Partners
EdPlus@ASU
13

ASU advances across teaching and learning realms
14

The quality of being easily broken or damaged—The Oxford Dictionary
“the capacity of a system to absorb disturbance and re-organize while undergoing change so as to still retain essentially the same function, structure, identity and feedbacks”
—Walker et al., Ecology and Society, 2004
Something that “thrives and grows when exposed to volatility, randomness, disorder, and stressors and loves adventures, risk, and uncertainty”
—Nassim Taleb, author of The Black Swan, 2007
Resilient
Fragile
Antifragile
Our design enables our response under all conditions
15

COVID Management
16

Throughout the past year, during a time of high stress and unique demands, leaders throughout the state have called upon Arizona State University to be of service.
ASU as a resource for fighting COVID-19
17
ASU students, faculty and staff have relied on innovation, ingenuity, hard work and determination to take on assignments that have helped the state advance through unprecedented challenges.

ASU COVID-19 response: 2020 Timeline
18

19
ASU COVID-19 response: 2020 Timeline

ASU COVID-19 response: Students
• Accessible and free COVID-19 testing• Enhanced campus safety and cleaning protocols• ASU COVID-19 Outbreak Response Unit• Telemedicine and telecounseling• COVID-19 management strategy and case data updates• Three learning modalities: ASU immersion, ASU Sync, iCourses• ASU 24/7 Experience Center• Digital tools including laptops, WiFi hotspots• Digital academic support programs• Virtual orientations and campus visits• CARES Act funding• Modified dining options• Physically distanced community activities• Virtual commencement and convocation ceremonies
20

ASU COVID-19 response: Faculty and Staff• Enhanced safety protocols• Accessible and free COVID-19 testing• Daily health check app• COVID-19 management strategy and case updates• Employee Wellness Exposure Management Team• Employee Assistance Office• Phased return to work plan• Online employee webinars• Workplace accommodations• ASU Telecommuting Resource Guide• Classroom safety supplies• Classroom technology upgrades• Digital tools including laptops and WiFi hotspots• ASU Sync classroom orientations, on-demand training
modules, and digital tools and templates• ASU 24/7 Experience Center• Instructional videos to facilitate remote teaching (Zoom, Slack, etc.)• UTO key modality data dashboard
21
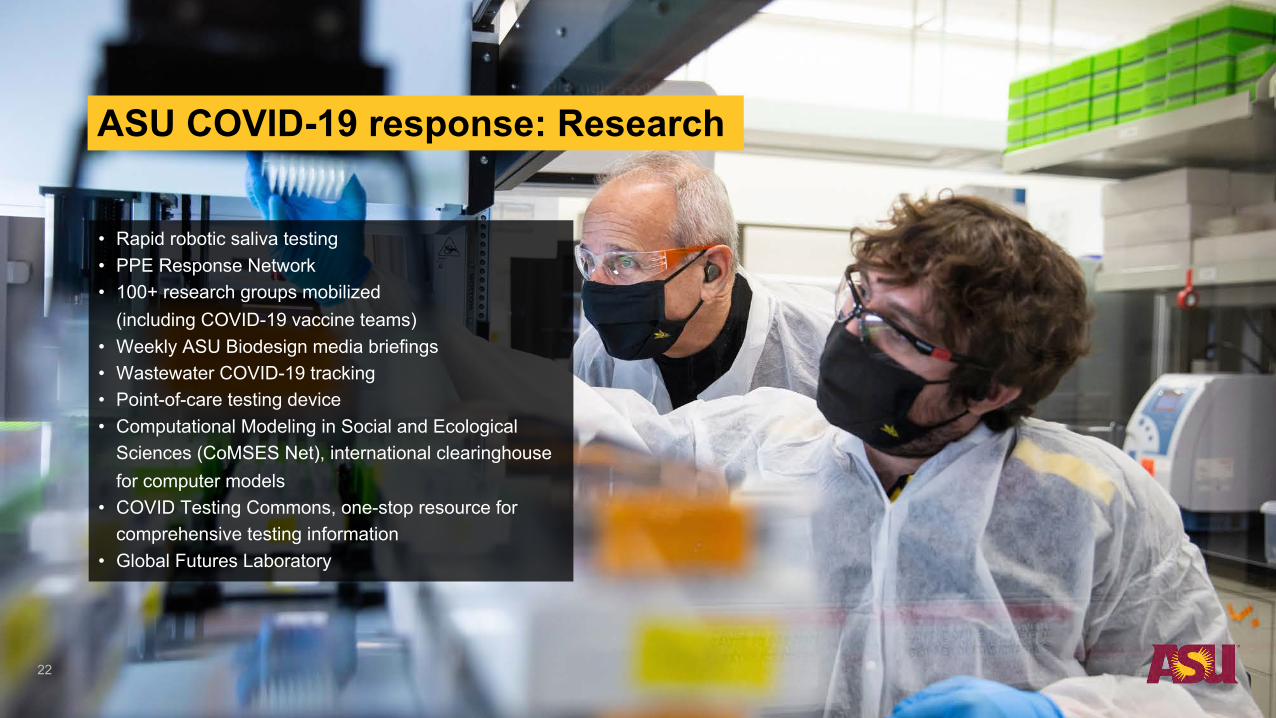
ASU COVID-19 response: Research
• Rapid robotic saliva testing• PPE Response Network• 100+ research groups mobilized
(including COVID-19 vaccine teams)• Weekly ASU Biodesign media briefings• Wastewater COVID-19 tracking• Point-of-care testing device• Computational Modeling in Social and Ecological
Sciences (CoMSES Net), international clearinghouse for computer models
• COVID Testing Commons, one-stop resource for comprehensive testing information
• Global Futures Laboratory
22

ASU COVID-19 response: Community
• Accessible and free COVID-19 saliva testing• Operation of the state’s mass vaccination sites• COVID-19 management strategy and case updates• Wastewater COVID-19 tracking• Outbreak Response Team traced 15,000 cases• Maricopa County Serosurvey Program• Edson mask-making tutorial • COVID Resilience for Healthcare Professionals Facebook group (ECONHI)• COVID-19 Diagnostic Commons• Online music therapy for the elderly (School of Music)• ASU Prep Digital and ASU For You• MLFTC Sun Devil Learning Labs• Virtual Field Trips• Arizona PBS educational programming• Center for Accelerating Operational Efficiency work on medical equipment
and vaccine supply chain challenges• Global Security Initiative’s Center for Cybersecurity and Digital Forensics
tracking of COVID-19 by online scammers23

The ASU community stepped up to serveVideo: Thank You, Sun Devils

These conditions accelerate the changes we knew were needed.
We believe there is more value in moving forward from here than going back to “normal.”
COVID-19 is not going away
25

Our ASU Sync modality is one way of moving
Course options
forward through innovation
Blend of in-person and ASU Sync experiences. ASU Sync is fully interactive remote learning using live lectures via Zoom.
On-campus, in-person instruction.
On-campus immersion courses delivered entirely online with lectures available on demand.
26

ASU succeeded and set new goalsVideo: Reflecting on college during a pandemic and planning for Spring 2021
28
public enterpriseEvolution of the
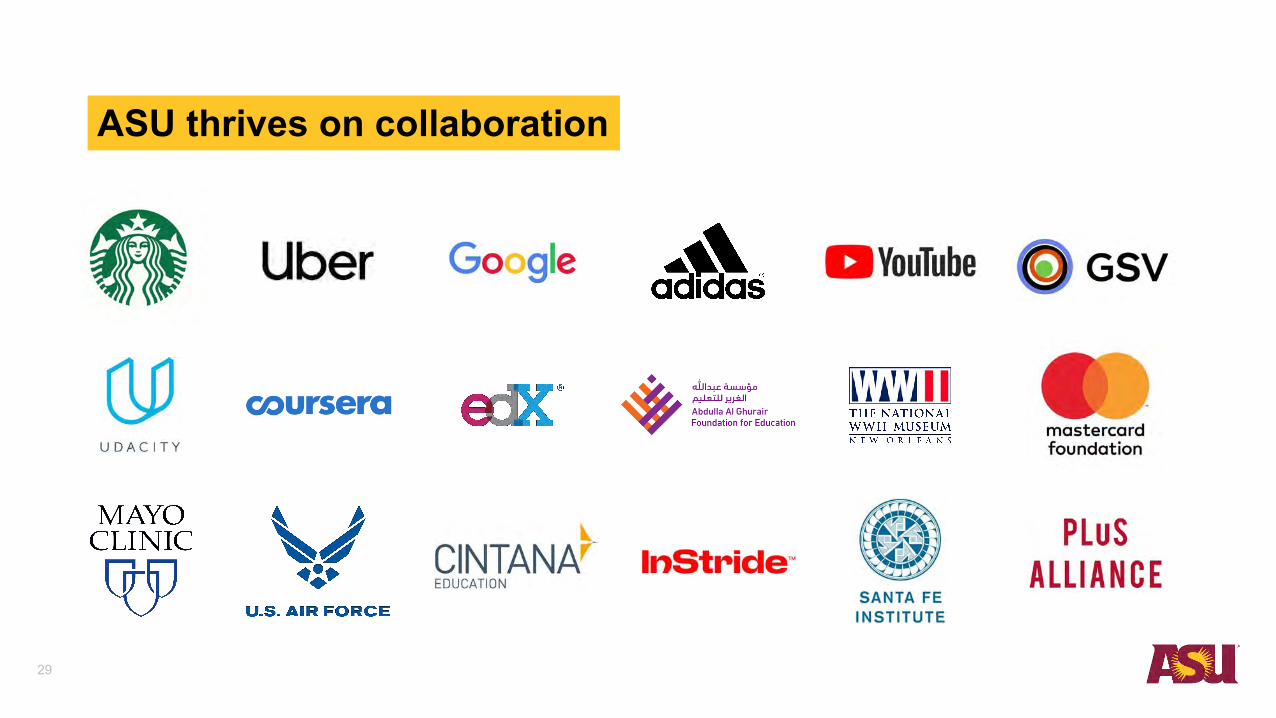
ASU thrives on collaboration
29

30
InStride
ASU integrates capacity of major affiliates
Cintana Dreamscape Learn

ASU operates in metropolitan U.S. cities
31

Herald Examiner Building
ASU will open flagship center in Downtown Los Angelesarchitectural landmark in 2021Five story, 80,000 square foot center for modern Los Angeles
32

33
ASU academic engagement spans the globe
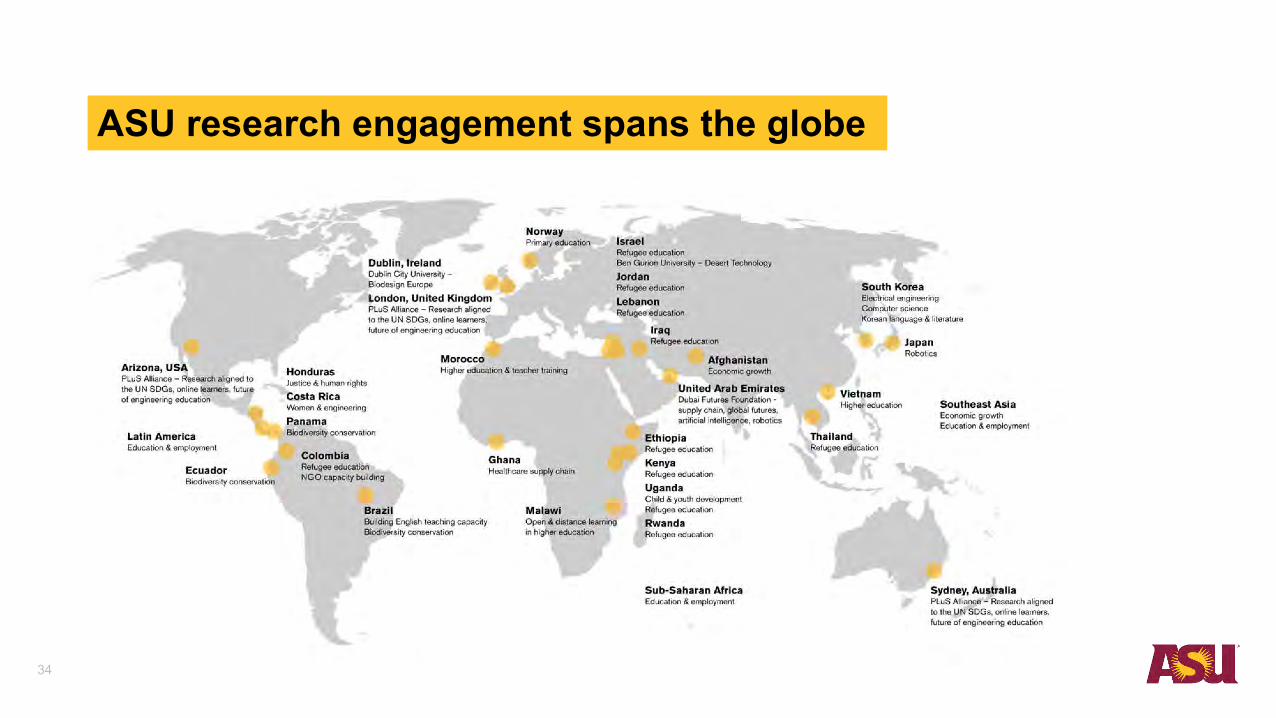
ASU research engagement spans the globe
34

Performance andAccomplishments
35

ASU mission and goals make clear our expectations
Establish national standing in academic quality and impact of colleges and schools in every field
Establish ASU as a global center for interdisciplinary research, discovery and development by 2025
Enhance our local impact and social embeddedness
Demonstrate leadership in academic excellence and accessibility
36

ASU progress is measured against our goals
Demonstrate leadership in academic excellence and accessibility
37
• Maintain the fundamental principle of accessibility to all students qualified to study at a research university.
• Maintain university accessibility to match Arizona’s socioeconomic diversity, with undifferentiated outcomes for success.
• Improve first-year persistence to greater than 90 percent.
• Enhance university graduation rate to greater than 85 percent and more than 32,000 graduates.
• Enhance quality while reducing the cost of a degree.
• Enroll 125,000 online and distance-education degree-seeking students.
• Enhance measured student development and individual student learning to national leadership levels.
• Engage all learners on all levels.

• Attain national standing in academic quality for each college and school (top 5 percent).
• Attain national standing in the learning value added to our graduates in each college and school.
• Become the leading university academically (faculty, discovery, research, creativity) in at least one department or school within each college and school.
Establish national standing in academic quality/ impact of colleges/schools in every field
38
ASU progress is measured against our goals

Establish ASU as a global center for interdisciplinary research, discovery and development
• Become the leading American center for discovery and scholarship in the integrated social sciences and comprehensive arts and sciences.
• Enhance research competitiveness to more than $1 billion in annual research expenditures.
• Transform regional economic competitiveness through research and discovery and value-added programs.
• Become a leading American center for innovation and entrepreneurship at all levels.
39
ASU progress is measured against our goals

Enhance our local impact and social embeddedness
40
• Strengthen Arizona’s interactive network of teaching, learning and discovery resources to reflect the scope of ASU’s comprehensive knowledge enterprise.
• Co-develop solutions to the critical social, technical, cultural and environmental issues facing 21st-century Arizona, ensuring sustainability and resilience.
• Meet the needs of 21st-century learners through the Universal Learner ® initiative by increasing individual success through personalized learning pathways and promoting adaptability to all accelerated social-technical changes.
ASU progress is measured against our goals

ASU excellence earns recognition
41

42

ASU continues to achieve on all fronts
43
Student Success Research Enterprise Management
Student Success
44

45
Three ASU winners• Outstanding undergraduates pursuing
environmental careers and Native American students who want to work in tribal public policy or tribal health
• Nekiyah Draper• Tahiry Langrand• Grant Real Bird• Two additional ASU honorary mentions
First place winners• Challenge to create a more comfortable
effective and affordable face covering• Floe Mask anti-fogging mask• $500,000 prize• Selected over 1,000+ other teams
Two ASU finalists in 2020-2021• Established by Sir Winston Churchill
to fulfil his vision of US–UK scientific exchange
• One year of Master’s study at Cambridge
• Maeve Kennedy• Alexis Hocken• Barrett Honors College 2020 alumni
Udall Undergraduate Scholarship Churchill ScholarshipXPRIZE Next-Gen Mask
ASU students demonstrate excellence andinnovation in 2020

-
20,000
40,000
60,000
80,000
100,000
120,000
140,000
2003
2004
2005
2006
2007
2008
2009
2010
2011
2012
2013
2014
2015
2016
2017
2018
2019
2020
2021
2022
2023
2024
2025
Online
Campus
Online
Campus
Online
Campus
International
Non Resident
Resident
Current Metric Goals
Proposed Metric Goals
Undergraduate enrollment reaches highest ever levelsUndergraduate enrollment actual, current metric goals, and proposed goals (2003-2025)
46

0
5,000
10,000
15,000
20,000
25,000
30,000
35,000
40,000
2003
2004
2005
2006
2007
2008
2009
2010
2011
2012
2013
2014
2015
2016
2017
2018
2019
2020
2021
2022
2023
2024
2025
Online
Campus
Online
Campus
Online
Campus
International
Non Resident
Resident
Current Metric Goals
Proposed Metric Goals
Graduate enrollment has continued to outpace goalsGraduate enrollment actual, current metric goals, and proposed goals (2003-2025)
47

0
2,000
4,000
6,000
8,000
10,000
12,000
14,000
16,000
18,000
'81 '83 '85 '87 '89 '91 '93 '95 '97 '99 '01 '03 '05 '07 '09 '11 '13 '15 '17 '19
Pacific Islander
American Indian
Black
Asian
Hispanic
White
Two or More
Unknown
International
First-year student enrollment has grown across all populationsFirst-time, first-year enrollment by race/ethnicity (1980-2020)
52%Arizona first-year students are students of color
48

-
200
400
600
800
1,000
1,200
1,400
1,600
< $2
0k
$20k
-40k
$40k
-60k
$60k
-80k
$80k
-100
k
$100
k-12
0
$120
k-14
0k$1
40k-
160k
$160
k-18
0k$1
80k-
200k
$200
k-22
0k$2
20k-
240k
$240
k-26
0k$2
60k-
280k
$280
k-30
0k$3
00k-
320k
$320
k-34
0k$3
40k-
360k
$360
k-38
0k$3
80k-
400k
> $4
00k
ASU is now more accessible to low-income students
All incomes adjusted to 2018 dollars using CPI.
Fall 2020
Fall 2011
Fall 2002
First-year enrollment by income (2002, 2011, 2020)
49
0
5,000
10,000
15,000
20,000
25,000
30,000
35,000
40,000
45,000
1990
-91
1991
-92
1992
-93
1993
-94
1994
-95
1995
-96
1996
-97
1997
-98
1998
-99
1999
-00
2000
-01
2001
-02
2002
-03
2003
-04
2004
-05
2005
-06
2006
-07
2007
-08
2008
-09
2009
-10
2010
-11
2011
-12
2012
-13
2013
-14
2014
-15
2015
-16
2016
-17
2017
-18
2018
-19
2019
-20
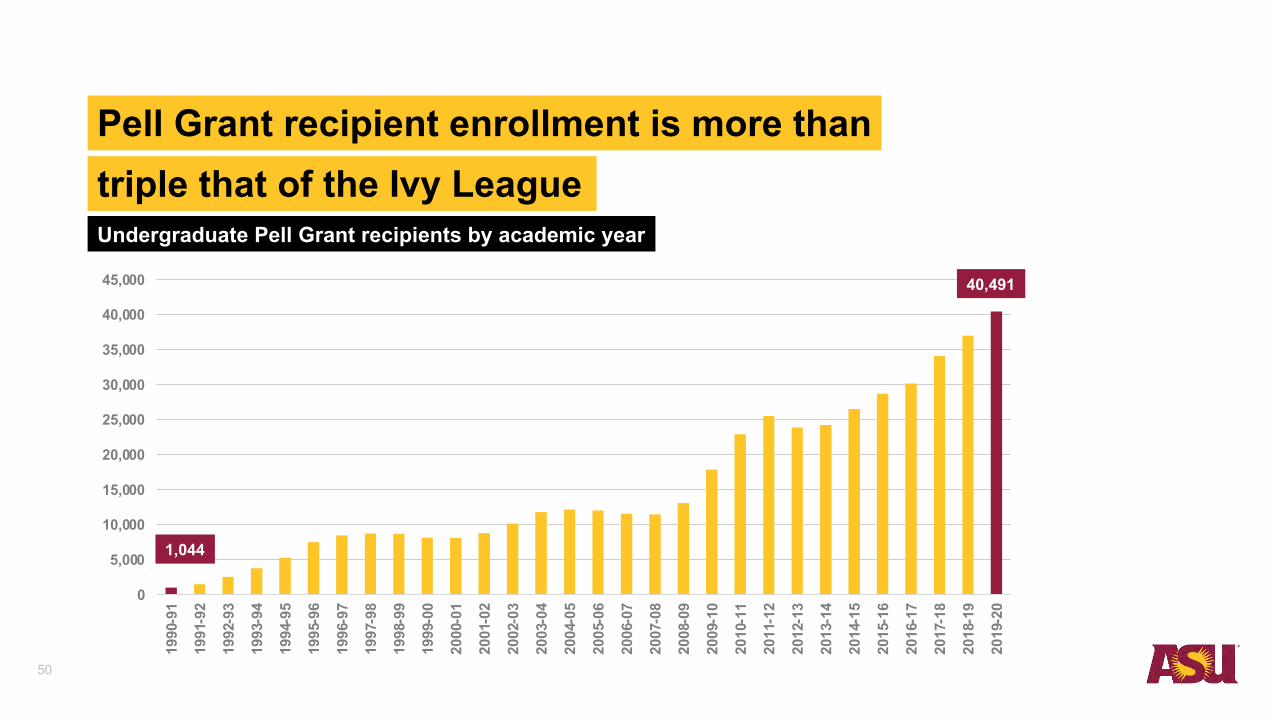
Undergraduate Pell Grant recipients by academic year
40,491
1,044
Pell Grant recipient enrollment is more thantriple that of the Ivy League
50

-
5,000
10,000
15,000
20,000
25,000
30,000
2002 2003 2004 2005 2006 2007 2008 2009 2010 2011 2012 2013 2014 2015 2016 2017 2018 2019 2020
First-generation student enrollment has tripled since 2002
27,900
7,560
First-generation student enrollment (Fall 2002-Fall 2020)
51

-25%
-20%
-15%
-10%
-5%
0%
5%
10%
15%
20%
2002
-03
2003
-04
2004
-05
2005
-06
2006
-07
2007
-08
2008
-09
2009
-10
2010
-11
2011
-12
2012
-13
2013
-14
2014
-15
2015
-16
2016
-17
2017
-18
2018
-19
2019
-20
Arizona community college transfer enrollment has grown Percentage change in 12-month enrollment compared to 2002-03
Over a period during which community college enrollment has declined, ASU has consistently increased enrollment, with four-year graduation rates of 70% in 2018-19.
New Transfers from AZ CCs
AZ CC Enrollment
6,259
5,541
52
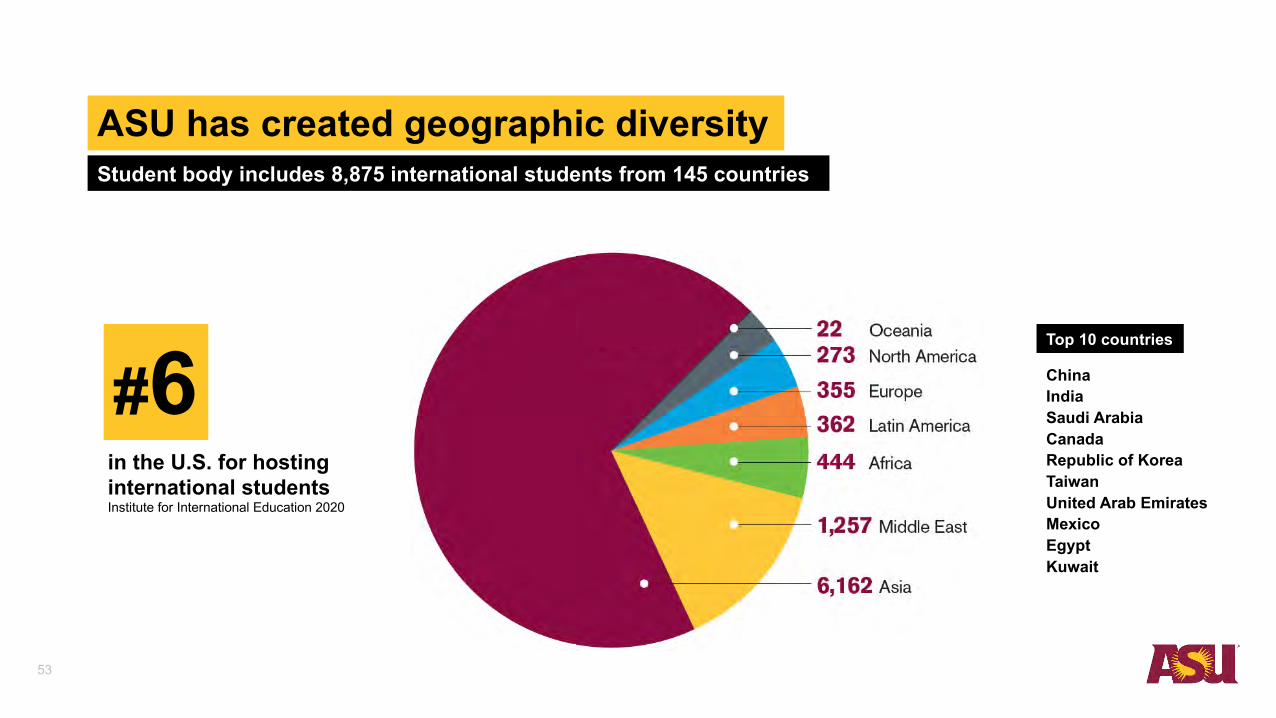
ASU has created geographic diversity
#6in the U.S. for hosting international studentsInstitute for International Education 2020
ChinaIndiaSaudi ArabiaCanadaRepublic of KoreaTaiwanUnited Arab EmiratesMexicoEgyptKuwait
Top 10 countries
Student body includes 8,875 international students from 145 countries
53
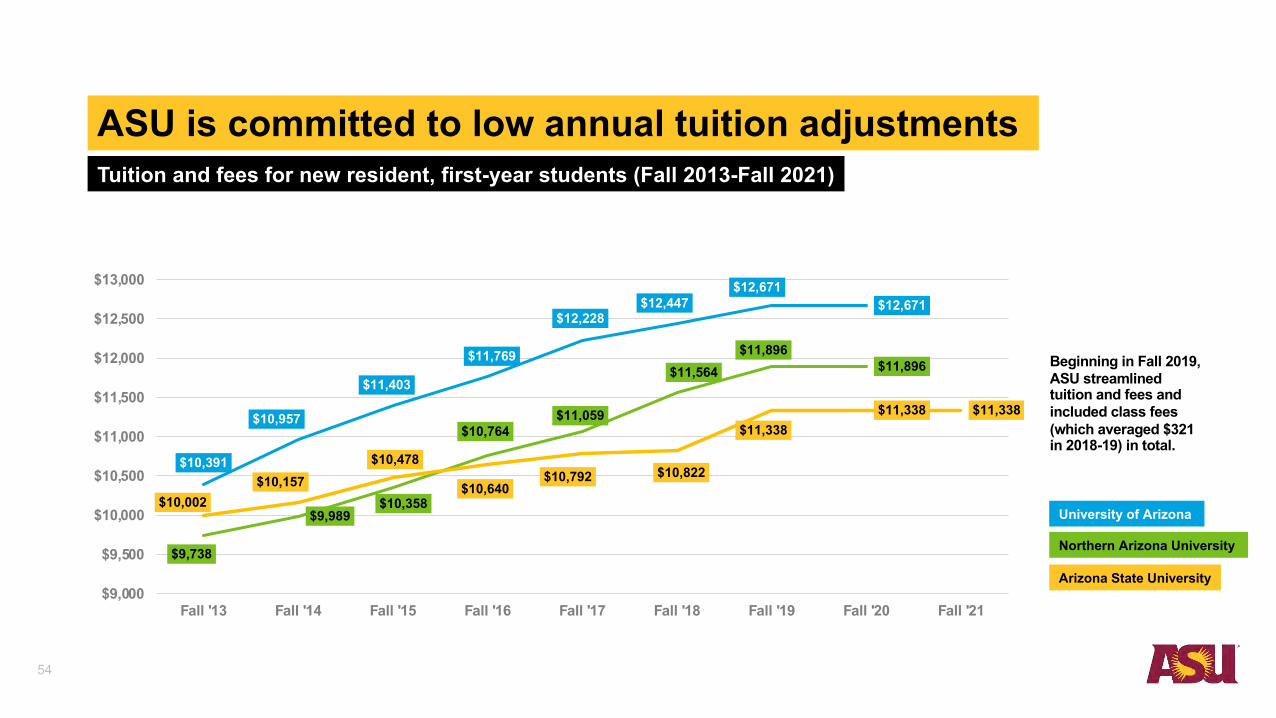
ASU is committed to low annual tuition adjustments
University of Arizona
Northern Arizona University
Arizona State University
Tuition and fees for new resident, first-year students (Fall 2013-Fall 2021)
Beginning in Fall 2019, ASU streamlined tuition and fees and included class fees (which averaged $321 in 2018-19) in total.
54
$10,391
$10,957
$11,403
$11,769
$12,228$12,447
$12,671$12,671
$9,738
$9,989$10,358
$10,764$11,059
$11,564$11,896
$11,896
$10,002$10,157
$10,478
$10,640$10,792 $10,822
$11,338$11,338 $11,338
$9,000
$9,500
$10,000
$10,500
$11,000
$11,500
$12,000
$12,500
$13,000
Fall '13 Fall '14 Fall '15 Fall '16 Fall '17 Fall '18 Fall '19 Fall '20 Fall '21
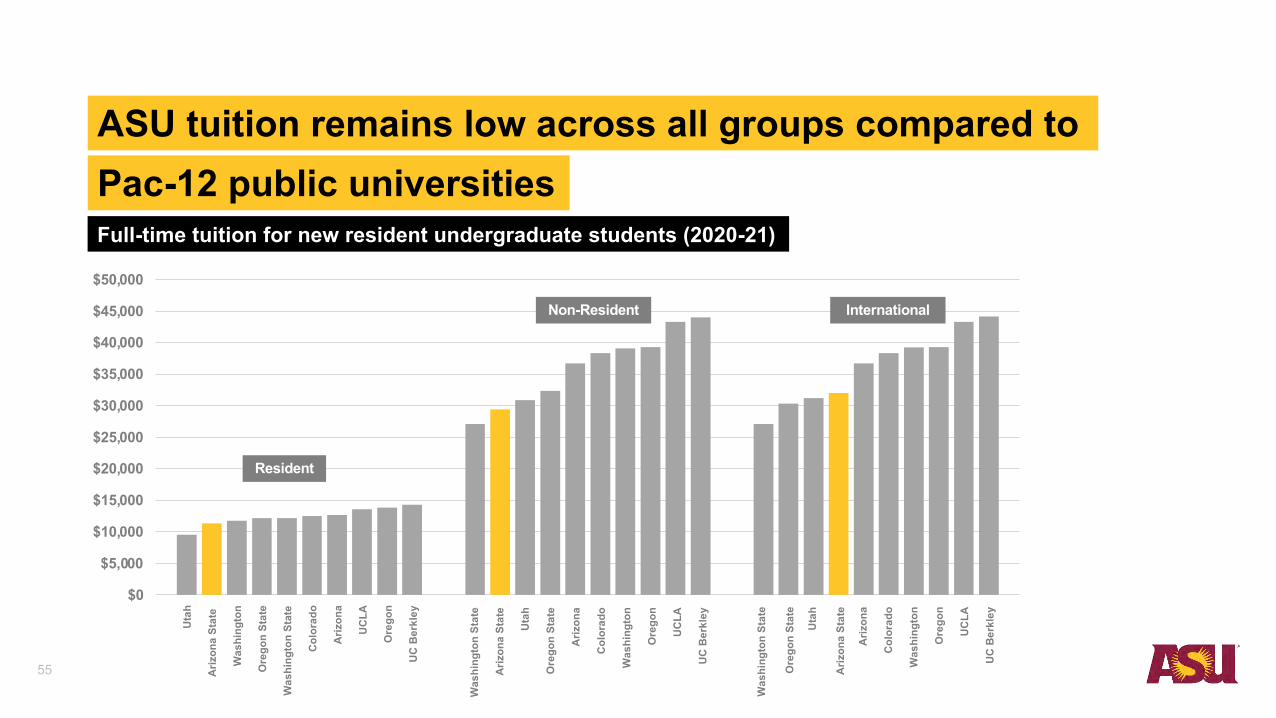
ASU tuition remains low across all groups compared to
55
Full-time tuition for new resident undergraduate students (2020-21)
Pac-12 public universities
$0
$5,000
$10,000
$15,000
$20,000
$25,000
$30,000
$35,000
$40,000
$45,000
$50,000
Uta
h
Ariz
ona
Stat
e
Was
hing
ton
Ore
gon
Stat
e
Was
hing
ton
Stat
e
Col
orad
o
UC
LA
Ore
gon
UC
Ber
kley
Ariz
ona
Was
hing
ton
Stat
e
Ariz
ona
Stat
e
Uta
h
Ore
gon
Stat
e
Ariz
ona
Col
orad
o
Was
hing
ton
Ore
gon
UC
LA
UC
Ber
kley
Was
hing
ton
Stat
e
Ariz
ona
Stat
e
Uta
h
Ore
gon
Stat
e
Ariz
ona
Col
orad
o
Was
hing
ton
Ore
gon
UC
LA
UC
Ber
kley
Resident
Non-Resident International

0
2000
4000
6000
8000
10000
12000
14000
16000
< $20K $20K- $34.99K $35K- $49.99K $50K-$64.99K $65K- $79.99K $80K- $119.99K >=$120K
ASU is committed to affordability by providing gift aidAverage gift aid awards by family income for 42,034 resident undergraduate students (2019-2020)
AZ Median Household Income = $58,945 U.S. Median Household Income = $62,843 Source: U.S. Census Bureau, 2019
State Gift Aid
Federal Gift Aid (all)
Institutional Gift Aid
Private / External Gift Aid
Number of Students
Tuition and Mandatory Fees = $11,338
8,087 5,317 3,963 2,861 2,163 4,656 8,160
Chart does not include data for 6,827 students for whom income data is unavailable56

74%
76%
78%
80%
82%
84%
86%
88%
90%
'02 '03 '04 '05 '06 '07 '08 '09 '10 '11 '12 '13 '14 '15 '16 '17 '18 '19
ASU first-year retention is nearing 90% goalFirst-year student retention rates (2002-2019)
Arizona First-Year Students
All First-Year Students
Cohort Entry Year
78.0%
76.7%
88.7%
86.2%
57

25%
35%
45%
55%
65%
75%
'02 '03 '04 '05 '06 '07 '08 '09 '10 '11 '12 '13 '14 '15 '16
Graduation rates have increased markedly since 2002
First-year resident student cohort graduation rate (Fall 1983-Fall 2016)
5-Year Rate
4-Year Rate
Cohort Entry Year
58
28.4%
57.0%
69.4%
55.8%
and the four-year rate has nearly doubled
6-Year Rate
66.5%
49.3%

Georgia State
Oregon State
UCF
Iowa State
Kansas
UC Riverside
Michigan State
ASU
Purdue
Ohio State
UT Austin
Four-year graduation rate compares well with UIA schoolsFour-year graduation rate of University Innovation Alliance member universities
59
“B” Average High School GPA
“A” Average High School GPA
0% 10% 20% 30% 40% 50% 60% 70%

0
5,000
10,000
15,000
20,000
25,000
30,000
35,000
40,000
45,000
2002
-03
2003
-04
2004
-05
2005
-06
2006
-07
2007
-08
2008
-09
2009
-10
2010
-11
2011
-12
2012
-13
2013
-14
2014
-15
2015
-16
2016
-17
2017
-18
2018
-19
2019
-20
2020
-21
2021
-22
2023
-23
2023
-24
2024
-25
ASU degrees awarded have nearly tripled since 2002-03Undergraduate and graduate degrees by year (2002-2025)
Online
Campus
Online
Campus
Online
Campus
International
Non Resident
Resident
Current Metric Goals
60
Proposed Metric Goals

0
2,000
4,000
6,000
8,000
10,000
12,000
2002
-03
2003
-04
2004
-05
2005
-06
2006
-07
2007
-08
2008
-09
2009
-10
2010
-11
2011
-12
2012
-13
2013
-14
2014
-15
2015
-16
2016
-17
2017
-18
2018
-19
2019
-20
Doctoral - STEM
Master’s – Health
Master’s - Education
Master’s - STEM
Bachelor’s - Health
Bachelor’s - Education
Doctoral - Education
Doctoral - Health
Bachelor’s - STEM
11,296
3,499
5,449
Number of ASU degrees awarded in high-demand
High demand degrees awarded (2002-2020)
fields doubled over 10 years
61

0
1,000
2,000
3,000
4,000
5,000
6,000
7,000
8,000
2002
-03
2003
-04
2004
-05
2005
-06
2006
-07
2007
-08
2008
-09
2009
-10
2010
-11
2011
-12
2012
-13
2013
-14
2014
-15
2015
-16
2016
-17
2017
-18
2018
-19
2019
-20
Doctoral
Master’s
Bachelor’s
1,857
6,972
2,514
ASU degrees awarded in STEM fields nearly
STEM degrees awarded (2002-2020)
tripled since 2002-03
62

Research
63

ASU produces pioneering research Game-changing, use-inspired discovery happens here
64
COVID-19 Saliva Test Mars Perseverance Rover Cameras Tandem Cell Energy Research

World-class new faculty continue to join ASU
65
Professor and Director, School of Mathematical and Statistical Sciences
Expertise: Partial differential equations, calculus of variations and geometric measure theory
2017 fellow of the American Mathematical Society
2020 Class of Fellows of the Association for Women in Mathematics
Professor and Senior Director, Thunderbird School of Global Management
Leads the Fourth Industrial Revolution and Globalization 4.0 Initiative and the Washington, DC-based Executive Masterof Global Affairs and Management
Senior fellow, Brookings InstitutionDistinguished fellow, Stanford UniversityWorld Economic Forum Young GlobalLeader
Professor, Department of Physics Director, Beus CXFEL LaboratoryBiodesign Institute at ASU
Lawrence Berkeley National Laboratory and 2019 fellow of the American Physical Society
Expertise: Quantum materials and ultrafast science, light-driven materials phenomena, multi-modal probes, terahertz and photoelectron spectroscopies
Donatella Danielli Robert KaindlLandry Signé

Research expenditures doubled over the last decade
Metric Goal
Actual
Dollars in millions
$0
$100
$200
$300
$400
$500
$600
$700
$800
$900
'98 '99 '00 '01 '02 '03 '04 '05 '06 '07 '08 '09 '10 '11 '12 '13 '14 '15 '16 '17 '18 '19 '20 '25
$660 Est.
New Goal: $1B$815 Est.
66

-100%
0%
100%
200%
300%
400%
500%
2005 2006 2007 2008 2009 2010 2011 2012 2013 2014 2015 2016 2017 2018 2019
Research growth has outpaced nearly all other universitiesPercentage growth for institutions with research expenditures greater than $100M annually
67
Indiana U. Bloomington gained IUPUI’s medical school in 2015.
Indiana
NYU
UNC
Utah
UT -M.D. Anderson Cancer Center
Arizona State
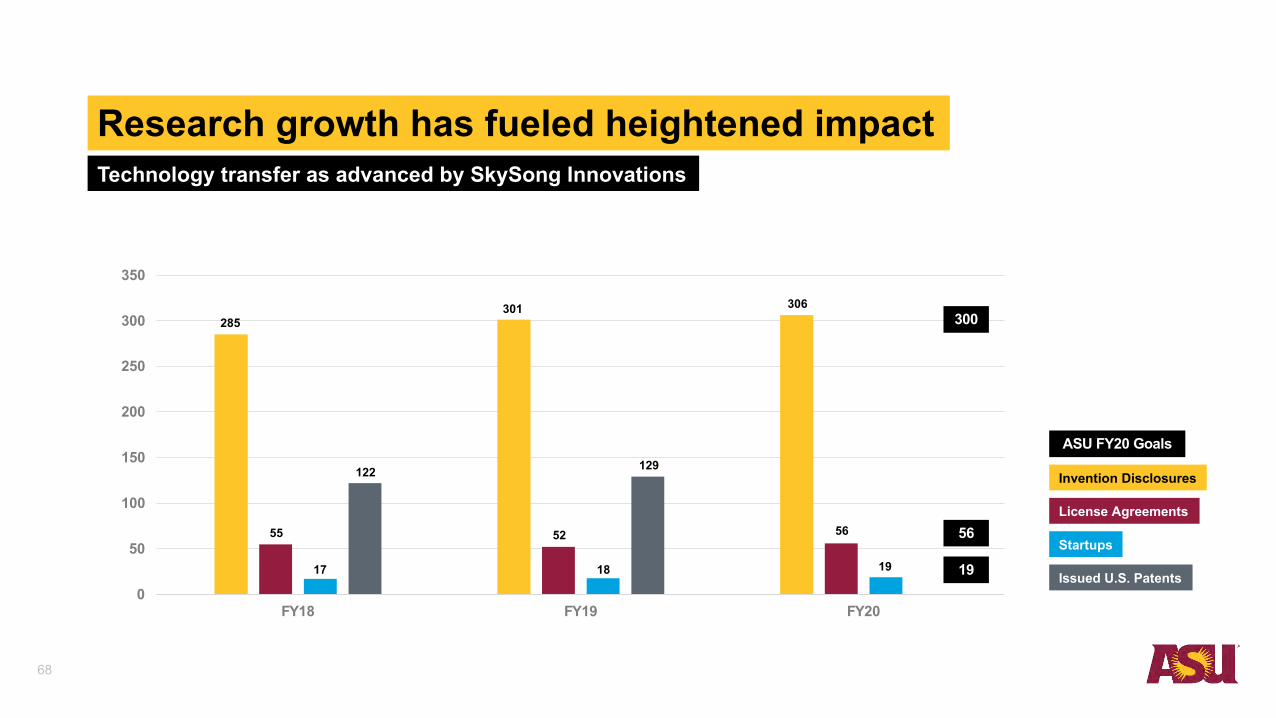
68
Research growth has fueled heightened impact
Startups
Issued U.S. Patents
License Agreements
Invention Disclosures
0
50
100
150
200
250
300
350
FY18 FY19 FY20
285
122
55
17
301
129
52
18
306
56
19
ASU FY20 Goals
300
56
19
Technology transfer as advanced by SkySong Innovations

SkySong Innovations supports start-up growth
SI’s startup portfolio continues to thrive. Nationally, these companies supported more than 2,000 jobs and contributed $222 million to the economy, with the bulk of that impact in Arizona.
In FY20, ASU startups also raised approximately $100 million in external funding. By the end of next year, if economic conditions stabilize, we may approach or surpass $1 billion in all-time funding raised by ASU-connected startups.
69

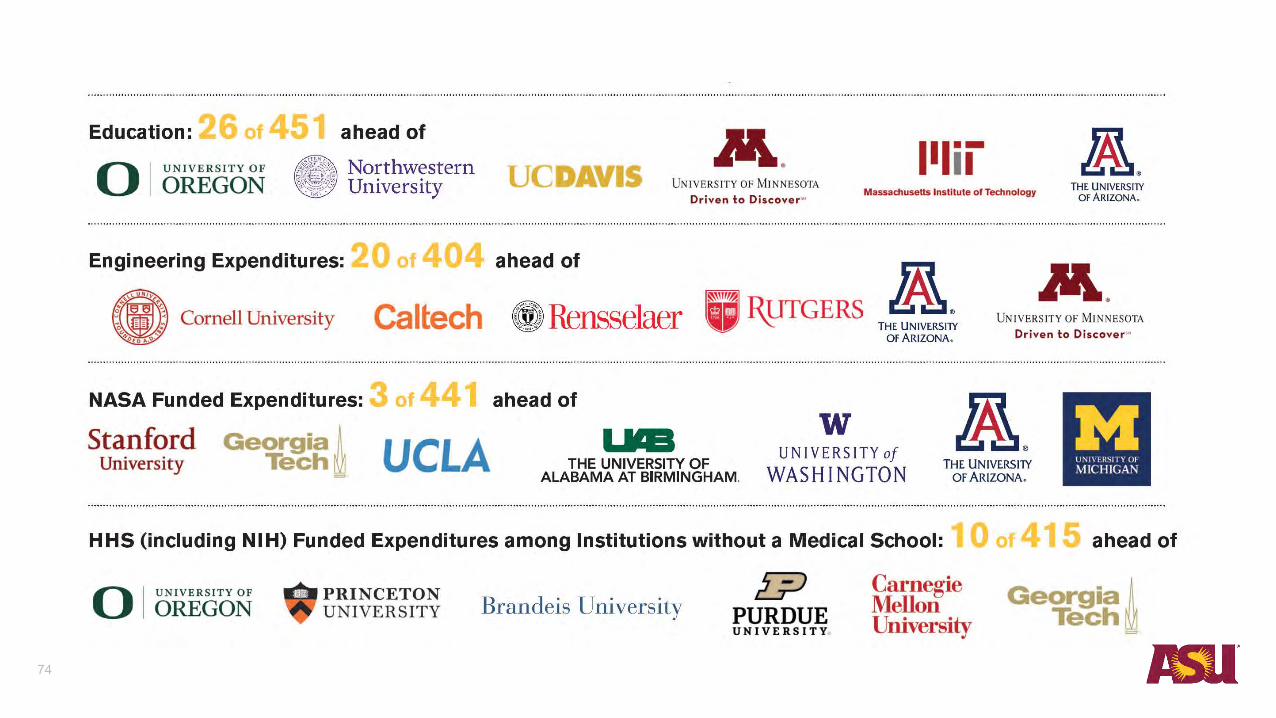
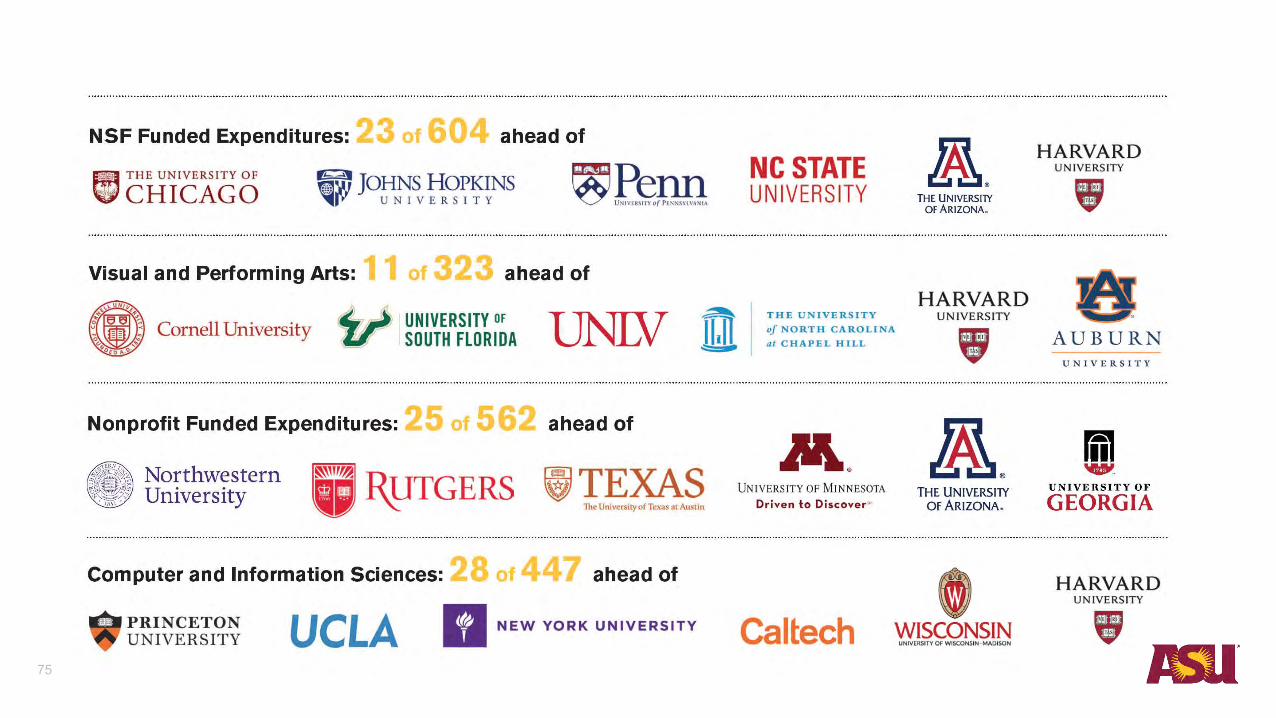
ASU leads across research disciplinesNational Science Foundation Higher Education Research and Development rankings (2019)
70

71

72

73
74
75

76

77

Enterprise Management
78

Revenues have more than tripled over past two decadesNet revenues for ASU and component units in millions (2008-2021)
79
Gifts
Tuition and Fees
State Appropriations
Financial Aid Grants
Grants and Contracts
Federal fiscal stabilization funds
Component Units
Learner and Other
TRIF
Auxiliary
-
500,000
1,000,000
1,500,000
2,000,000
2,500,000
3,000,000
3,500,000
4,000,000
4,500,000
FY2
002
FY2
003
FY2
004
FY2
005
FY2
006
FY2
007
FY2
008
FY2
009
FY2
010
FY2
011
FY2
012
FY2
013
FY2
014
FY2
015
FY2
016
FY2
017
FY2
018
FY2
019
FY2
020
FY2
021
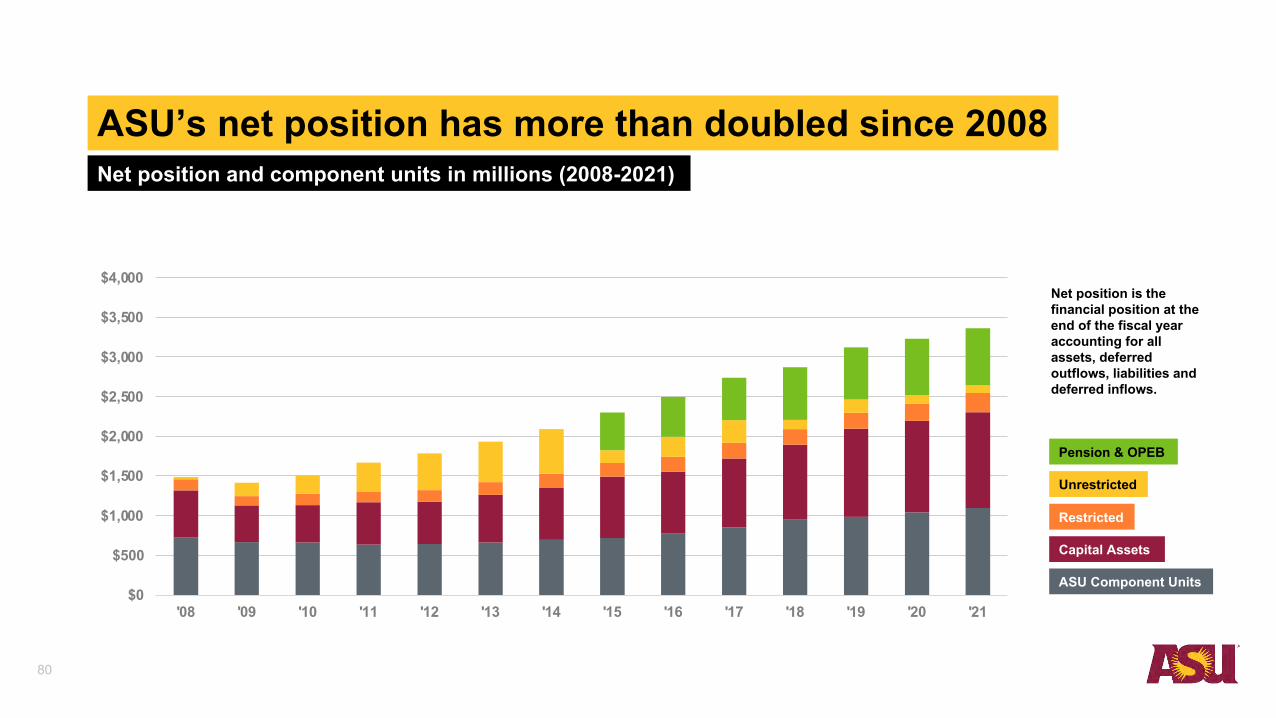
ASU’s net position has more than doubled since 2008
Unrestricted
Restricted
Capital Assets
Pension & OPEB
Net position and component units in millions (2008-2021)
ASU Component Units
80
Net position is the financial position at the end of the fiscal year accounting for all assets, deferred outflows, liabilities and deferred inflows.
$0
$500
$1,000
$1,500
$2,000
$2,500
$3,000
$3,500
$4,000
'08 '09 '10 '11 '12 '13 '14 '15 '16 '17 '18 '19 '20 '21

$0
$20,000
$40,000
$60,000
$80,000
$100,000
$120,000
ASU uses 21% fewer resources per degree awarded thanthe national median
81
Ore
gon
Source: IPEDS
Public very high research universities
Ore
gon
Ore
gon
Stat
e
Colo
rado
UtahAr
izon
a
Purd
ue
UCLA
Was
hing
ton
UC B
erke
ley
ASU
| $62
,670
Tuition and state appropriation per degree awarded (FY2018)

$0
$20,000
$40,000
$60,000
$80,000
$100,000
$120,000
ASU uses 14% fewer resources per degree awarded
Source: IPEDS
than the median of universities without medical schools
82
Tuition and state appropriation per degree awarded (FY2018)
Public very high research universities without medical schools
Ariz
ona
Stat
e
Ore
gon
Med
ian
Ore
gon
Stat
e
Colo
rado
UC B
erke
ley
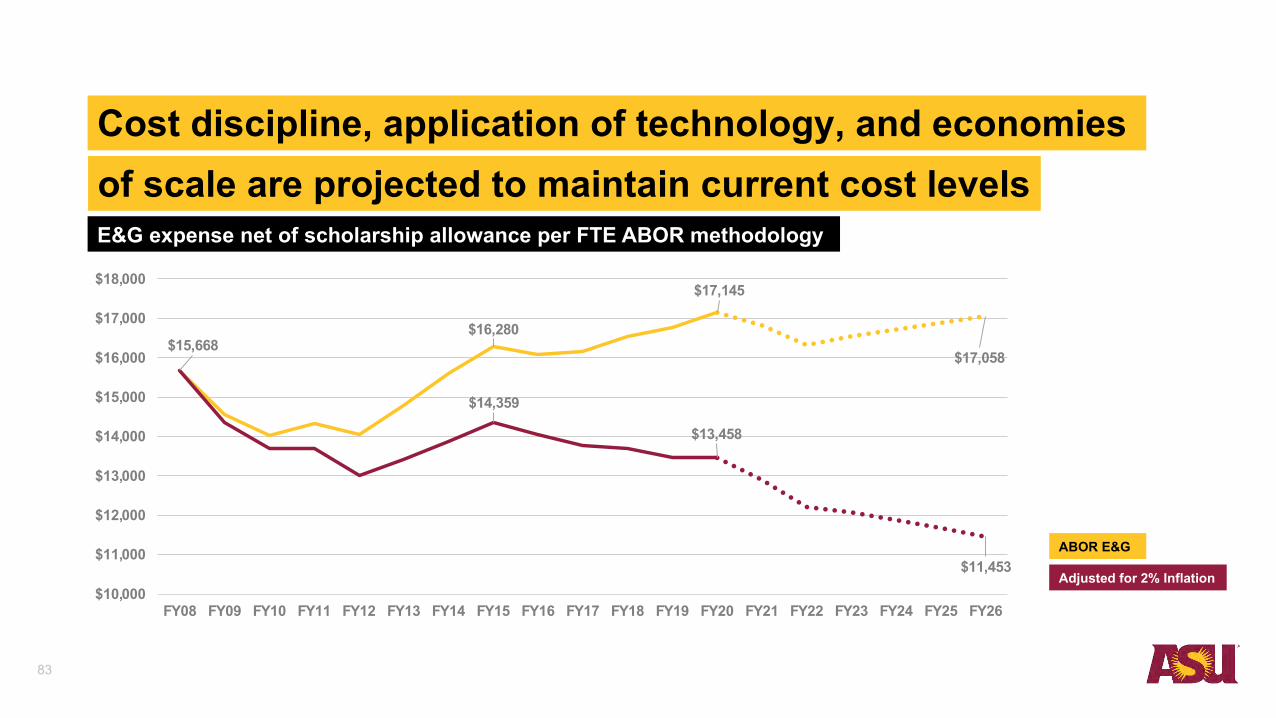
Cost discipline, application of technology, and economies
Adjusted for 2% Inflation
ABOR E&G
E&G expense net of scholarship allowance per FTE ABOR methodology
of scale are projected to maintain current cost levels
83
$16,280
$17,145
$17,058$15,668
$14,359
$13,458
$11,453
$10,000
$11,000
$12,000
$13,000
$14,000
$15,000
$16,000
$17,000
$18,000
FY08 FY09 FY10 FY11 FY12 FY13 FY14 FY15 FY16 FY17 FY18 FY19 FY20 FY21 FY22 FY23 FY24 FY25 FY26

For 5 years, ASU has operated with about half the staff
FTE employees per 100 FTE students (FY2012 - FY2019)
ASU
Peer Median
per student as its peers
84
0
5
10
15
20
25
30
'12 '13 '14 '15 '16 '17 '18 '19
FY12 FY13 FY14 FY15 FY16 FY17 FY18 FY19Arizona State University 12.91 12.93 12.92 12.85 12.52 12.36 12.90 12.78
Florida State University 15.3 15.8 16.1 16.0 16.1 16.2 16.8 17.5
Indiana University-Bloomington 20.1 20.5 20.1 20.8 20.3 20.8 22.1 22.5
Michigan State University 22.7 21.5 21.3 21.6 21.9 22.8 22.9 23.0
Ohio State University-Main Campus 24.3 23.0 23.0 22.9 22.7 22.9 23.5 23.5
Pennsylvania State University-Main Campus 28.6 28.8 28.8 29.0 29.6 29.3 30.1 31.7
Rutgers University-New Brunswick 23.0 23.9 25.7 25.0 24.7 25.9 29.9 29.9
The University of Texas at Austin 28.8 32.8 26.0 26.7 27.4 27.7 27.2 27.6
University of California-Los Angeles 27.3 26.7 28.4 26.4 26.9 26.7 27.1 29.4
University of Connecticut 26.9 28.1 28.3 27.6 27.2 27.9 28.5 26.8
University of Illinois at Urbana-Champaign 24.3 24.4 25.1 25.2 25.2 24.2 24.0 23.9
University of Iowa 23.2 23.3 23.5 24.1 24.2 23.5 23.2 23.1
University of Maryland-College Park 24.9 25.8 26.0 27.4 25.5 25.6 25.0 24.5
University of Minnesota-Twin Cities 29.6 30.3 30.9 31.2 31.6 31.7 31.9 32.3
University of Washington-Seattle Campus 25.6 24.4 25.3 25.6 21.7 25.6 24.7 24.0
University of Wisconsin-Madison 26.4 26.9 26.9 27.6 27.5 27.8 28.0 30.1
Peer Median 24.9 24.4 25.7 25.6 25.2 25.6 25.0 24.5

ASU use of space is efficient compared to ABOR peersSpace density: Net assignable square footage per FTE
85
-
50
100
150
200
250
300
350
400
450
500Institutions
Florida State UniversityIndiana UniversityMichigan State UniversityRutgers UniversityThe Ohio State UniversityPennsylvania State UniversityUniversity of ConnecticutUniversity of IowaUniversity of MarylandUniversity of MinnesotaUniversity of WashingtonUniversity of WisconsinNorthern Arizona UniversityUniversity of Arizona
ASU
NAU
UA
$0
$50
$100
$150
$200
$250
$300
$350
$400
$450
'10 '11 '12 '13 '14 '15 '16 '17 '18 '19 '20 '21 '22 '23 '24 '25
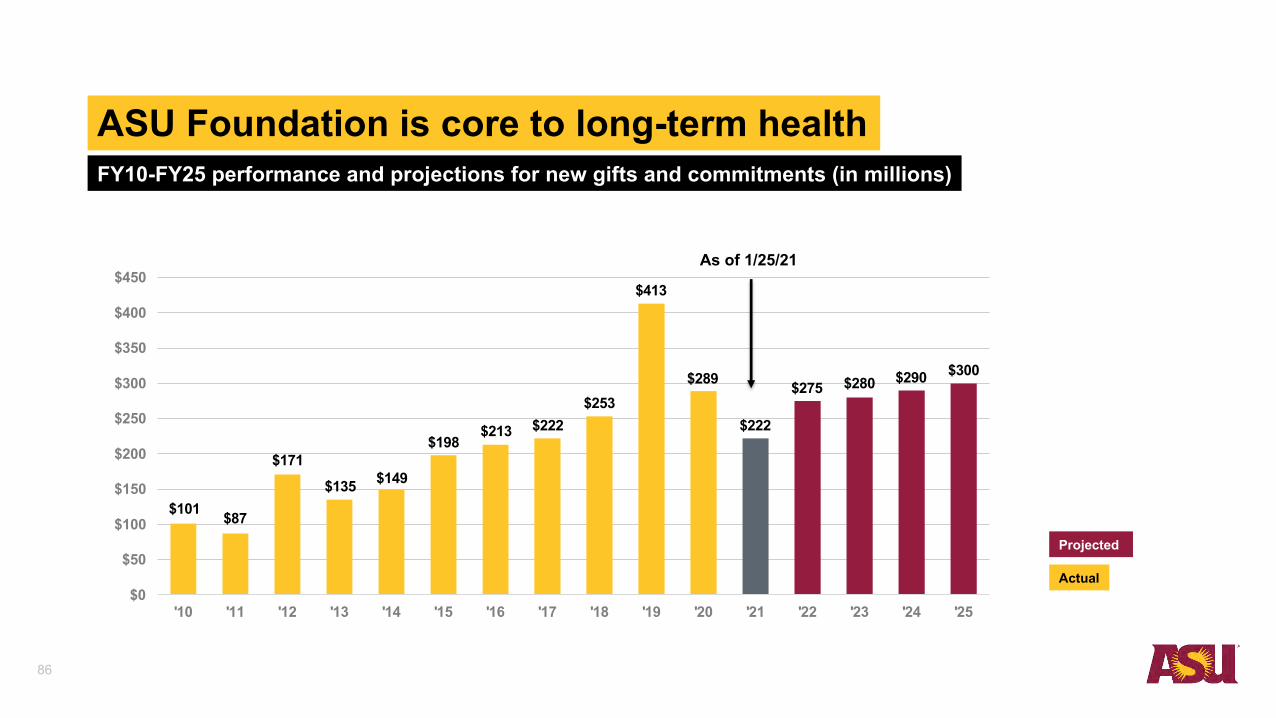
ASU Foundation is core to long-term healthFY10-FY25 performance and projections for new gifts and commitments (in millions)
Projected
Actual
As of 1/25/21
$101 $87
$171$135 $149
$198$213 $222
$253
$413
$289
$222
$275 $280 $290 $300
86
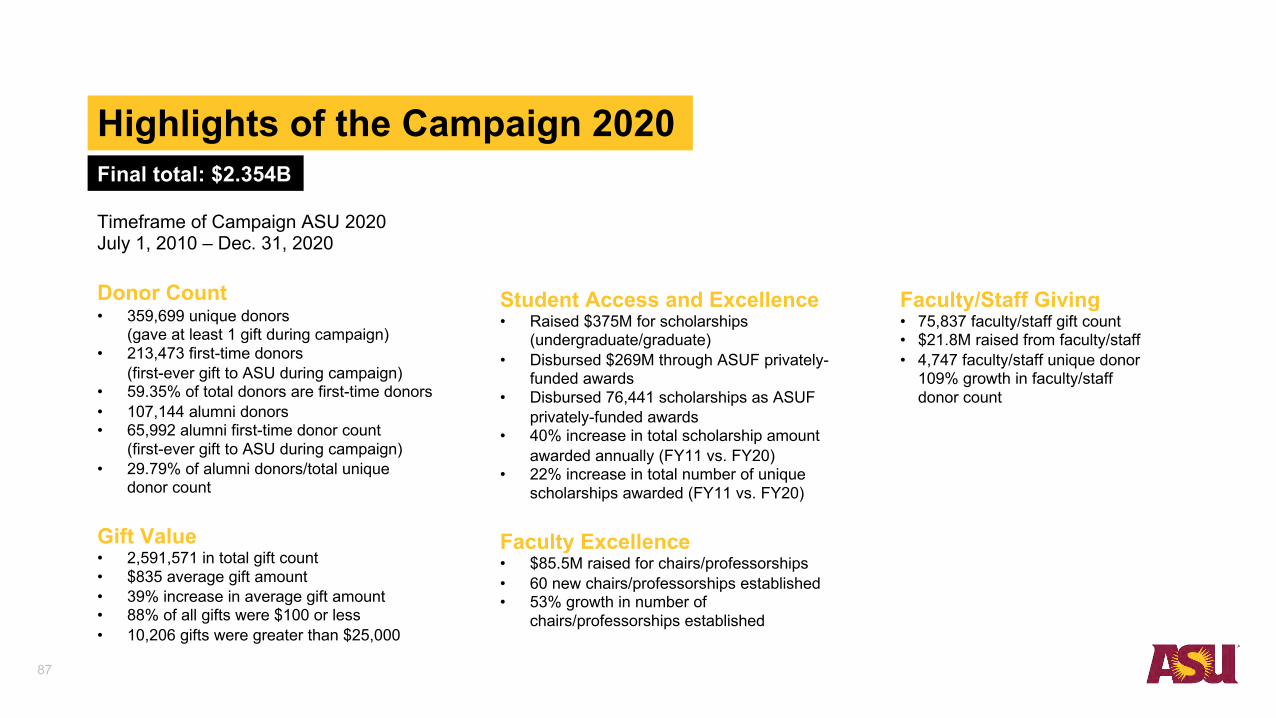
Highlights of the Campaign 2020Final total: $2.354B
Timeframe of Campaign ASU 2020July 1, 2010 – Dec. 31, 2020
Donor Count• 359,699 unique donors
(gave at least 1 gift during campaign)• 213,473 first-time donors
(first-ever gift to ASU during campaign)• 59.35% of total donors are first-time donors• 107,144 alumni donors• 65,992 alumni first-time donor count
(first-ever gift to ASU during campaign)• 29.79% of alumni donors/total unique
donor count
Gift Value• 2,591,571 in total gift count• $835 average gift amount • 39% increase in average gift amount• 88% of all gifts were $100 or less• 10,206 gifts were greater than $25,000
Student Access and Excellence• Raised $375M for scholarships
(undergraduate/graduate)• Disbursed $269M through ASUF privately-
funded awards• Disbursed 76,441 scholarships as ASUF
privately-funded awards• 40% increase in total scholarship amount
awarded annually (FY11 vs. FY20)• 22% increase in total number of unique
scholarships awarded (FY11 vs. FY20)
Faculty Excellence• $85.5M raised for chairs/professorships• 60 new chairs/professorships established• 53% growth in number of
chairs/professorships established
Faculty/Staff Giving• 75,837 faculty/staff gift count• $21.8M raised from faculty/staff• 4,747 faculty/staff unique donor
109% growth in faculty/staff donor count
87

What It Will Take
88

ASU is a catalyst for Arizona’s economic future
As Arizona leaders plan for a revitalized state economy in 2021 in this reshaped world, ASU is prepared for its next assignment.
89
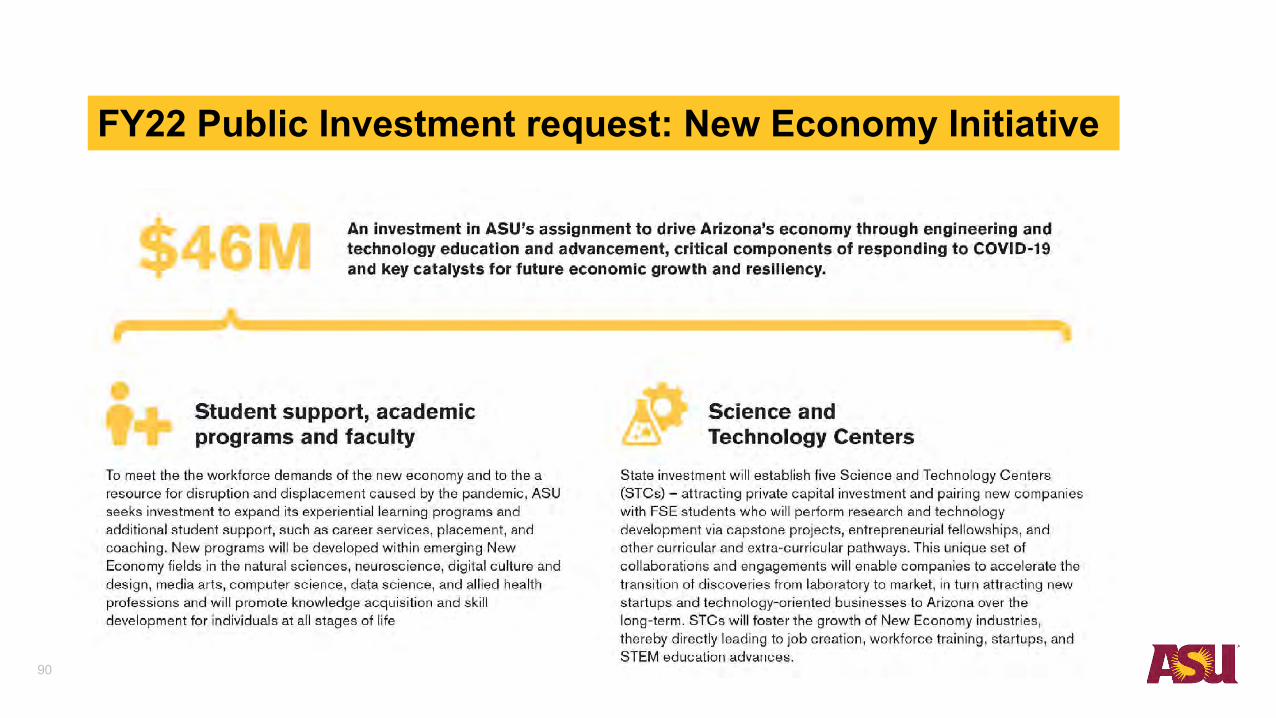
FY22 Public Investment request: New Economy Initiative
90

Ira A. Fulton Schools of Engineering
58,000+ 50+Graduate degreeprograms
25Undergraduate degreeprograms
7Transdisciplinary schools
#13Online engineering graduateprograms
#11Online engineering graduateprograms for veterans
#8Bachelor’s degrees awardedto Hispanics
#6Women as tenure/tenure-trackfaculty
$127MResearch expendituresFY 2019-2020
60Patents per year
#7Licenses and Options
#6IP Disclosures
#5Startups
Alumni
8,000Online students
5,300Female students
5,200Under-represented groups
232National Hispanic Scholars
218National Merit Scholars
85.embers of the National Academies and distinguished�societies
Largest and one of the most comprehensive engineering schools in the nation
#1
CAREER awards in the last 5 years. 13 in 2020
42
The largest and one of the most comprehensive engineering schools in the nation
91
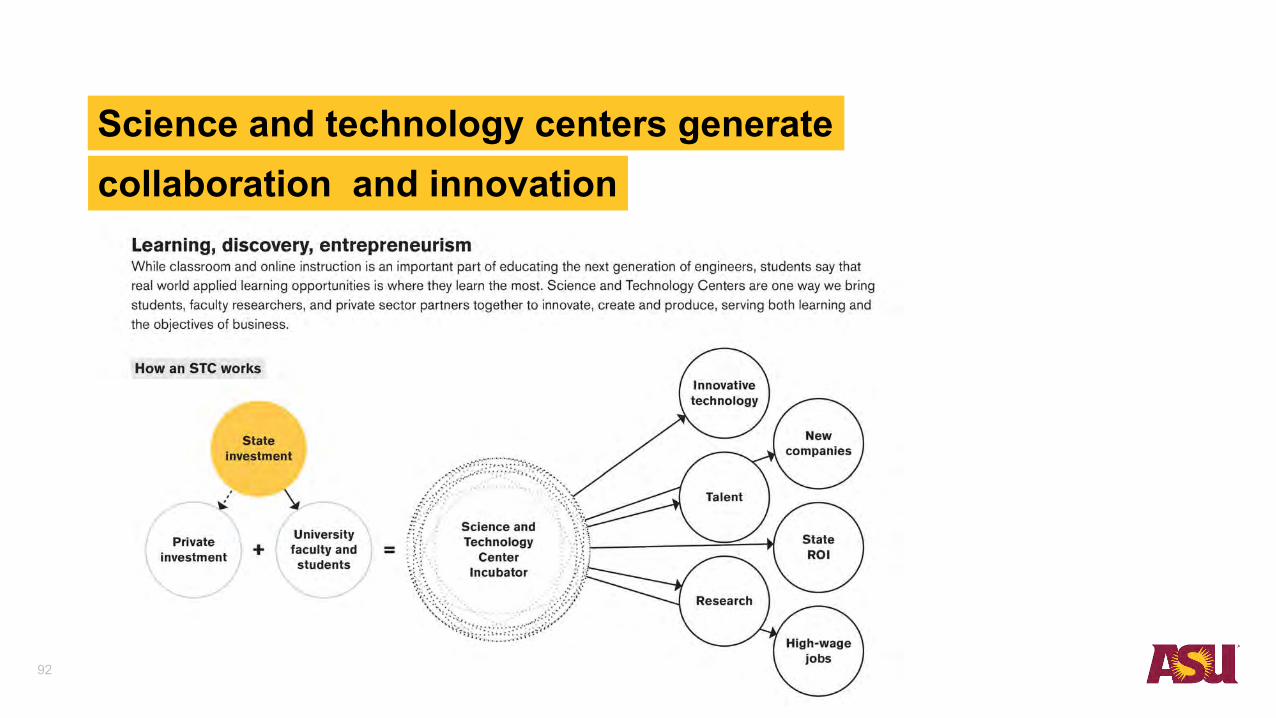
Science and technology centers generatecollaboration and innovation
92

Future science and technology centersin new economy industries
93

Arizona’s return on investment towarda stronger economy
94

ASU is prepared to operate and create progressin all realms
95
Grants and Contracts
Financial Aid Grants
International Tuition
Non- Resident UG Tuition
State Appropriations
Gifts
Learner and Other
Auxiliary
Resident UG Tuition
Graduate Tuition
ASU Online Tuition
Fees
Tuiti
on R
even
ues
TRIF
Federal Fiscal Stabilization
$0
$1,000
$2,000
$3,000
$4,000
$5,000
$6,000
$7,000
FY21: $3.6B FY22: $3.9B FY23: $4.4B FY24: $4.9B FY25: $5.5B FY26: $6.2B
Summer Session
Component Units
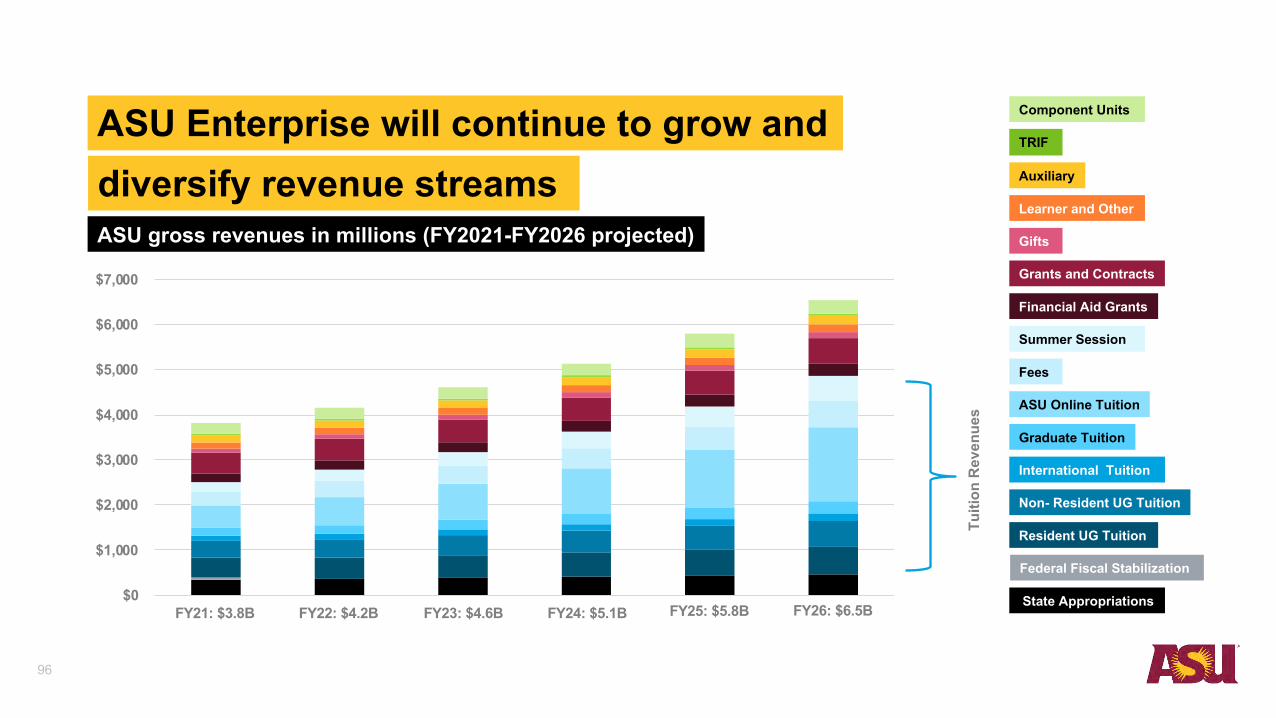
ASU gross revenues in millions (FY2021-FY2026 projected)
ASU Enterprise will continue to grow anddiversify revenue streams
96
FY26: $6.5B FY25: $5.8B FY24: $5.1B FY23: $4.6B FY22: $4.2B FY21: $3.8B

Dreamscape Learn / Outdoor Learning / COVID-19
97

New Economy Initiative
98

Related Documents


