IJCSI International Journal of Computer Science Issues, Vol. 8, Issue 3, No. 1, May 2011 ISSN (Online): 1694‐0814 www.IJCSI.org 113 Mrs. Firouz Abdullah Al-Wassai 1 , Dr. N.V. Kalyankar 2 , Dr. Ali A. Al-Zuky 3 1 Research Student, Computer Science Dept., Yeshwant College, (SRTMU), Nanded, India 2 Principal, Yeshwant Mahavidyala Colleg,Nanded, India 3 Assistant Professor, Dept.of Physics, College of Science, Mustansiriyah Un. Baghdad – Iraq. Abstract In remote sensing, image fusion technique is a useful tool used to fuse high spatial resolution panchromatic images (PAN) with lower spatial resolution multispectral images (MS) to create a high spatial resolution multispectral of image fusion (F) while preserving the spectral information in the multispectral image (MS).There are many PAN sharpening techniques or Pixel-Based image fusion techniques that have been developed to try to enhance the spatial resolution and the spectral property preservation of the MS. This paper attempts to undertake the study of image fusion, by using two types of pixel –based image fusion techniques i.e. Arithmetic Combination and Frequency Filtering Methods of Pixel-Based Image Fusion Techniques. The first t ype incl udes Brovey Transform (BT), Color Normalized Transformation (CN) and Multiplicative Method (MLT). The second type include High-Pass Filter Additive Method (HPFA), High – Frequency- Addition Method (HFA) High Frequency Modulation Method (HFM) and The Wavelet transform- based fusion method (WT). This paper also devotes to concentrate on the analytical techniques for evaluating the quality of image fusion (F) by using various methods including Standard Deviation (SD), EntropyEn), Correlation Coefficient ( CC), Signal-to Noise Ratio ( SNR ), Normalization Root Mean Square Error (NRMSE) and Deviation Index (DI) to estimate the quality and degree of information improvement of a fused image quantitatively. Keywords: Image Fusion; Pixel-Based Fusion; Brovey Transform; Color Normalized; High-Pass Filter ; Modulatio n, Wavelet transform. 1. INTRODUCTION Although Satellites remote sensing image fusion has been a hot research topic of remote sensing image processing [1]. This is obvious from the amount of conferences and workshops focusing on data fusion, as well as the special issues of scientific journals dedicated to the topic. Previously, data fusion, and in particular image fusion belonged to the world of research and development. In the meantime, it has become a valuable technique for data enhancement in many applications. More and more data providers envisage the marketing of fused products. Software vendors started to offer pre-defined fusion methods within their generic image processing packages [2]. Remote sensing offers a wide variety of image data with different characteristics in terms of temporal, spatial, radiometric and Spectral resolutions. Although the information content of these images might be part ially overlapping [3], imaging system s somehow offer a tradeoff between high spatial and high spectral resolution, whereas no single syst em offers both. Hence, in the remote sensing community, an image with ‘greater quality’ often means higher spatial or higher spectral resolution, which can only be obtained by more advanced sensors [4]. However, many applications of satellite images require both spectral and spatial resolution to be high. In order to automate the processing of these satellite images new concepts for sensor fusion are needed. It is, therefore, necessary and very useful to be able to merge images with higher spectral information and higher spatial information [5]. The t erm “fusion” gets several words to ap pear, such as merging, combination, synergy, integration … and several others that express more or less the same concept have since appeared in literature [6]. Different definitions of data fusion can be found in literature, each author interprets this term differently depending his research interests, such as [7-8] . A general definition of data fusion can be adopted as fallowing “Data fusion is a formal framework which expresses means and tools for the alliance of data originating from different sources. It aims at obtaining information of greater quality; the exact definition of ‘greater quality’ will depend upon the

Welcome message from author
This document is posted to help you gain knowledge. Please leave a comment to let me know what you think about it! Share it to your friends and learn new things together.
Transcript

7/31/2019 Arithmetic and Frequency Filtering Methods of Pixel-Based Image Fusion Techniques
http://slidepdf.com/reader/full/arithmetic-and-frequency-filtering-methods-of-pixel-based-image-fusion-techniques 1/10
IJCSI International Journal of Computer Science Issues, Vol. 8, Issue 3, No. 1, May 2011 ISSN (Online): 1694 ‐0814 www.IJCSI.org 113
Mrs. Firouz Abdullah Al-Wassai1
, Dr. N.V. Kalyankar2
, Dr. Ali A. Al-Zuky3
1 Research Student, Computer Science Dept., Yeshwant College, (SRTMU), Nanded, India
2Principal, Yeshwant Mahavidyala Colleg,Nanded, India
3Assistant Professor, Dept.of Physics, College of Science, Mustansiriyah Un. Baghdad – Iraq.
AbstractIn remote sensing, image fusion technique is a useful toolused to fuse high spatial resolution panchromatic images(PAN) with lower spatial resolution multispectral images(MS) to create a high spatial resolution multispectral of image fusion (F) while preserving the spectral informationin the multispectral image (MS).There are many PANsharpening techniques or Pixel-Based image fusiontechniques that have been developed to try to enhance thespatial resolution and the spectral property preservation of the MS. This paper attempts to undertake the study of image fusion, by using two types of pixel –based imagefusion techniques i.e. Arithmetic Combination andFrequency Filtering Methods of Pixel-Based Image FusionTechniques. The first type includes Brovey Transform(BT), Color Normalized Transformation (CN) andMultiplicative Method (MLT). The second type includeHigh-Pass Filter Additive Method (HPFA), High – Frequency- Addition Method (HFA) High FrequencyModulation Method (HFM) and The Wavelet transform- based fusion method (WT). This paper also devotes toconcentrate on the analytical techniques for evaluating thequality of image fusion (F) by using various methodsincluding Standard Deviation (SD), Entropy En),Correlation Coefficient (CC), Signal-to Noise Ratio (SNR), Normalization Root Mean Square Error (NRMSE) andDeviation Index (DI) to estimate the quality and degree of information improvement of a fused image quantitatively.
Keywords : Image Fusion; Pixel-Based Fusion; BroveyTransform; Color Normalized; High-Pass Filter ;
Modulation, Wavelet transform .
1. INTRODUCTION
Although Satellites remote sensing image fusionhas been a hot research topic of remote sensing image processing [1]. This is obvious from the amount of conferences and workshops focusing on data fusion,as well as the special issues of scientific journalsdedicated to the topic. Previously, data fusion, and in
particular image fusion belonged to the world of research and development. In the meantime, it has become a valuable technique for data enhancement inmany applications. More and more data providersenvisage the marketing of fused products. Softwarevendors started to offer pre-defined fusion methodswithin their generic image processing packages [2].
Remote sensing offers a wide variety of image datawith different characteristics in terms of temporal,spatial, radiometric and Spectral resolutions.Although the information content of these imagesmight be partially overlapping [3], imaging systemssomehow offer a tradeoff between high spatial andhigh spectral resolution, whereas no single systemoffers both. Hence, in the remote sensing community,an image with ‘greater quality’ often means higher
spatial or higher spectral resolution, which can only be obtained by more advanced sensors [4]. However,many applications of satellite images require bothspectral and spatial resolution to be high. In order toautomate the processing of these satellite images newconcepts for sensor fusion are needed. It is, therefore,necessary and very useful to be able to merge imageswith higher spectral information and higher spatialinformation [5].
The term “fusion” gets several words to appear,such as merging, combination, synergy, integration… and several others that express more or less thesame concept have since appeared in literature [6].Different definitions of data fusion can be found inliterature, each author interprets this term differentlydepending his research interests, such as [7-8] . Ageneral definition of data fusion can be adopted asfallowing “Data fusion is a formal framework whichexpresses means and tools for the alliance of dataoriginating from different sources. It aims atobtaining information of greater quality; the exactdefinition of ‘greater quality’ will depend upon the

7/31/2019 Arithmetic and Frequency Filtering Methods of Pixel-Based Image Fusion Techniques
http://slidepdf.com/reader/full/arithmetic-and-frequency-filtering-methods-of-pixel-based-image-fusion-techniques 2/10
IJCSI International Journal of Computer Science Issues, Vol. 8, Issue 3, No. 1, May 2011 ISSN (Online): 1694 ‐0814 www.IJCSI.org 114
application” [11-13]. Image fusion forms a subgroupwithin this definition and aims at the generation of asingle image from multiple image data for theextraction of information of higher quality. Havingthat in mind, the achievement of high spatialresolution, while maintaining the provided spectralresolution, falls exactly into this framework [14].
2. Pixel-Based Image Fusion Techniques
Image fusion is a sub area of the more generaltopic of data fusion [15]. Generally, Image fusiontechniques can be classified into three categoriesdepending on the stage at which fusion takes place; itis often divided into three levels, namely: pixel level,feature level and decision level of representation [16,17] . This paper will focus on pixel level imagefusion. The pixel image fusion techniques can begrouped into several techniques depending on the
tools or the processing methods for image fusion procedure. It is grouped into four classes: 1)Arithmetic Combination techniques (AC) 2)Component Substitution fusion techniques (CS) 3)Frequency Filtering Methods (FFM) 4) StatisticalMethods (SM). This paper focuses on using towtypes of pixel –based image fusion techniquesArithmetic Combination and Frequency FilteringMethods of Pixel-Based Image Fusion Techniques.The first type is included BT; CN; MLT and the lasttype includes HPFA; HFA HFM and WT. In thiswork to achieve the fusion algorithm and estimate thequality and degree of information improvement of afused image quantitatively used programming in VB.
To explain the algorithms through this report, Pixelsshould have the same spatial resolution from twodifferent sources that are manipulated to obtain theresultant image. So, before fusing two sources at a pixel level, it is necessary to perform a geometricregistration and a radiometric adjustment of theimages to one another. When images are obtainedfrom sensors of different satellites as in the case of fusion of SPOT or IRS with Landsat, the registrationaccuracy is very important. But registration is notmuch of a problem with simultaneously acquiredimages as in the case of Ikonos/Quickbird PAN andMS images. The PAN images have a different spatialresolution from that of MS images. Therefore,resampling of MS images to the spatial resolution of PAN is an essential step in some fusion methods to bring the MS images to the same size of PAN, , thusthe resampled MS images will be noted byΜ thatrepresents the set of DNof bandkin the resampledMS image . Also the following notations will be used:
Ρ asDNfor PAN image,FtheDNin final fusionresult for bandk. M P, σ ,σ Denotes the localmeans and standard deviation calculated inside thewindow of size (3, 3) for MandΡ respectively.
3. The AC Methods
This category includes simple arithmetictechniques. Different arithmetic combinations have been employed for fusing MS and PAN images. Theydirectly perform some type of arithmetic operation onthe MS and PAN bands such as addition,multiplication, normalized division, ratios andsubtraction which have been combined in differentways to achieve a better fusion effect. These modelsassume that there is high correlation between thePAN and each of the MS bands [24]. Some of the popular AC methods for pan sharpening are the BT,CN and MLM. The algorithms are described in thefollowing sections.
3.1 Brovey Transform (BT)
The BT, named after its author, uses ratios tosharpen the MS image in this method [18]. It wascreated to produce RGB images, and therefore onlythree bands at a time can be merged [19]. Manyresearchers used the BT to fuse a RGB image with ahigh resolution image [20-25].The basic procedure of the BT first multiplies each MS band by the highresolution PAN band, and then divides each product by the sum of the MS bands. The following equation,given by [18], gives the mathematical formula for the
BT:
, ,,∑ , (1)
The BT may cause color distortion if the spectralrange of the intensity image is different from thespectral range covered by the MS bands.
3.2 Color Normalized Transformation (CN)
CN is an extension of the BT [17]. CN transformalso referred to as an energy subdivision transform[26]. The CN transform separates the spectral spaceinto hue and brightness components. The transformmultiplies each of the MS bands by the p imagery,and these resulting values are each normalized by being divided by the sum of the MS bands. The CNtransform is defined by the following equation [26,27]:
, ,. , . .∑ ,. 1.0 (2)
7/31/2019 Arithmetic and Frequency Filtering Methods of Pixel-Based Image Fusion Techniques
http://slidepdf.com/reader/full/arithmetic-and-frequency-filtering-methods-of-pixel-based-image-fusion-techniques 3/10
IJCSI International Journal of Computer Science Issues, Vol. 8, Issue 3, No. 1, May 2011 ISSN (Online): 1694 ‐0814 www.IJCSI.org 115
(Note: The small additive constants in the equationare included to avoid division by zero.)
3.3 Multiplicative Method (MLT)
The Multiplicative model or the product fusion
method combines two data sets by multiplying each pixel in each band k of MS data by the corresponding pixel of the PAN data. To compensate for theincreased brightness, the square root of the mixeddata set is taken. The square root of theMultiplicative data set, reduce the data tocombination reflecting the mixed spectral propertiesof both sets. The fusion algorithm formula is asfollows [1; 19 ; 20]:
, , ,(3)
4. Frequency Filtering Methods (FFM)
Many authors have found fusion methods in thespatial domain (high frequency inserting procedures)superior over the other approaches, which are knownto deliver fusion results that are spectrally distorted tosome degree [28] Examples of those authors are [29-31].
Fusion techniques in this group use high pass filters,Fourier transform or wavelet transform to model thefrequency components between the PAN and MSimages by injecting spatial details in the PAN andintroducing them into the MS image. Therefore, theoriginal spectral information of the MS channels isnot or only minimally affected [32]. Such algorithmsmake use of classical filter techniques in the spatialdomain. Some of the popular FFM for pansharpening are the HPF, HFA, HFM and the WT based methods.
4.1 High-Pass Filter Additive Method (HPFA)
The High-Pass Filter Additive (HPFA) technique[28] was first introduced by Schowengerdt (1980)as a method to reduce data quantity and increasespatial resolution for Landsat MSS data [33]. HPF basically consists of an addition of spatial details,
taken from a high-resolution Pan observation, intothe low resolution MS image [34]. The highfrequencies information is computed by filteringthe PAN with a high-pass filter through a simplelocal pixel averaging, i.e. box filters. It is performed by emphasize the detailed highfrequency components of an image anddeemphasize the more general low frequencyinformation [35]. The HPF method uses standard
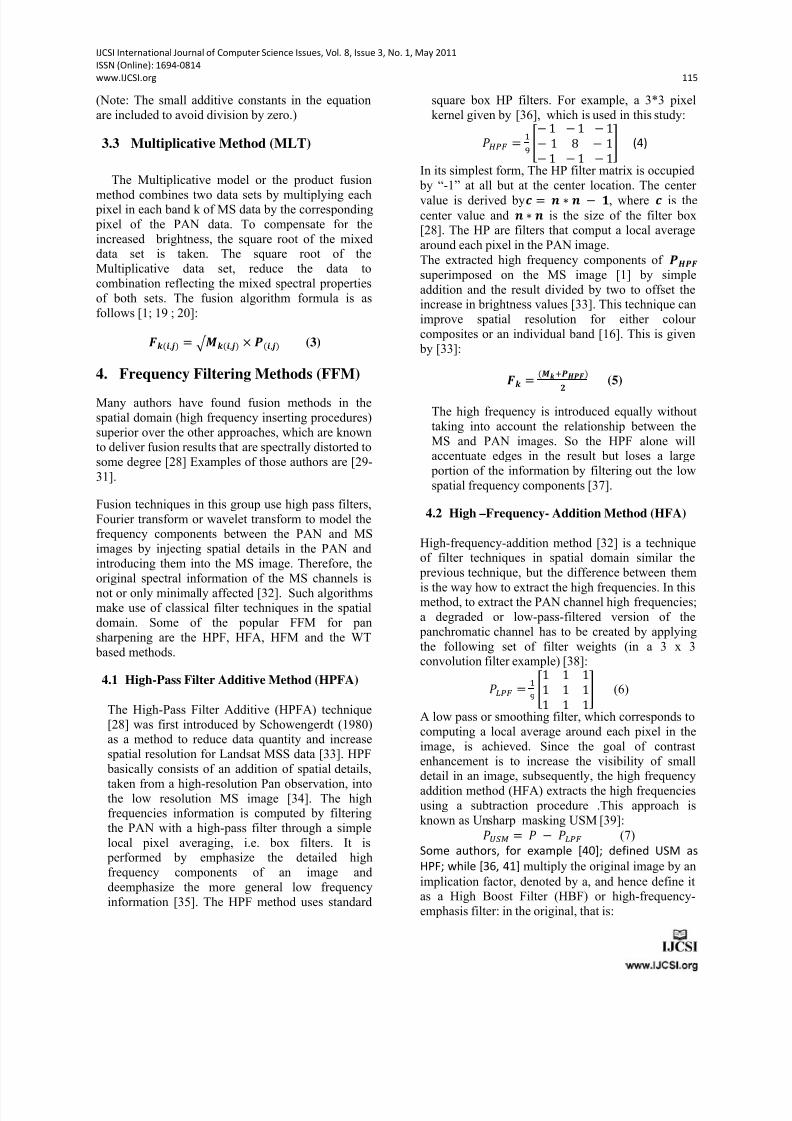
square box HP filters. For example, a 3*3 pixelkernel given by [36], which is used in this study: 1 1 1 8 11 1 (4)
In its simplest form, The HP filter matrix is occupied by “-1” at all but at the center location. The center value is derived by , where is thecenter value and is the size of the filter box[28]. The HP are filters that comput a local averagearound each pixel in the PAN image.The extracted high frequency components of superimposed on the MS image [1] by simpleaddition and the result divided by two to offset theincrease in brightness values [33]. This technique canimprove spatial resolution for either colour composites or an individual band [16]. This is given by [33]:
(5)
The high frequency is introduced equally withouttaking into account the relationship between theMS and PAN images. So the HPF alone willaccentuate edges in the result but loses a large portion of the information by filtering out the lowspatial frequency components [37].
4.2 High –Frequency- Addition Method (HFA)
High-frequency-addition method [32] is a techniqueof filter techniques in spatial domain similar the previous technique, but the difference between them
is the way how to extract the high frequencies. In thismethod, to extract the PAN channel high frequencies;a degraded or low-pass-filtered version of the panchromatic channel has to be created by applyingthe following set of filter weights (in a 3 x 3convolution filter example) [38]:1 1 11 1 11 1 1(6)
A low pass or smoothing filter, which corresponds tocomputing a local average around each pixel in theimage, is achieved. Since the goal of contrastenhancement is to increase the visibility of smalldetail in an image, subsequently, the high frequencyaddition method (HFA) extracts the high frequenciesusing a subtraction procedure .This approach isknown as Unsharp masking USM [39]: (7)Some authors, for example [40]; defined USM as HPF; while [36, 41] multiply the original image by animplication factor, denoted by a, and hence define itas a High Boost Filter (HBF) or high-frequency-emphasis filter: in the original, that is:

7/31/2019 Arithmetic and Frequency Filtering Methods of Pixel-Based Image Fusion Techniques
http://slidepdf.com/reader/full/arithmetic-and-frequency-filtering-methods-of-pixel-based-image-fusion-techniques 4/10
IJCSI International Journal of Computer Science Issues, Vol. 8, Issue 3, No. 1, May 2011 ISSN (Online): 1694 ‐0814 www.IJCSI.org 116
(8)The general process by using equation (8) calledunsharp masking [36] and adds them to the MSchannels via addition as shown by equation [32]: (9)When this technique is applied, it really leads to the
enhancement of
all
high
spatial
frequency
detail
in
an image including edges, line and points of high gradient [42]
4.3 High Frequency Modulation Method (HFM)
The problem of the addition operation is that theintroduced texture will be of different size relative toeach multispectral channel, so a channel wisescaling factor for the high frequencies is needed.The alternative high frequency modulation methodHFM extracts the high frequencies via division for the P on the PAN channel low frequency
PLwhich
is obtained by using equation (9) to extract the PANchannel low-frequencyPLand then adds them toeach multispectral channel via multiplication [32]: (10)
Because of the multiplication operation, everymultispectral channel is modulated by the same highfrequencies [32].
4.4 Wavelet Transformation (WT) Based ImageFusion
Wavelet-based methods Multi-resolution or multi-scale methods [24] is a mathematical tool developed
in the field of signal processing [9] have beenadopted for data fusion since the early 1980s(MALAT, 1989). Recently, the wavelet transformapproach has been used for fusing data and becomeshot topic in research [43]. The wavelet transform provides a framework to decompose (also calledanalysis) images into a number of new images, eachone of them with a different degree of resolution aswell as a perfect reconstruction of the signal (alsocalled synthesis). Wavelet-based approaches showsome favorable properties compared to the Fourier transform [44]. While the Fourier transform gives anidea of the frequency content in the image, thewavelet representation is an intermediaterepresentation between the Fourier and the spatialrepresentation, and it can provide good localization in both frequency and space domains [45]. Furthermore,the multi-resolution nature of the wavelet transformsallows for control of fusion quality by controlling thenumber of resolutions [46] as will as the wavelettransform does not operate on color images directlyso we have transformed the color image from RGBdomain to anther domain [47].
For more information about image fusion based onwavelet transform have been published in recentyears [48 -50].
The block diagram of a generic wavelet-based imagefusion scheme is shown in Fig. 3. Wavelet transform based image fusion involves three steps; forwardtransform coefficient combination and backwardtransform. In the forward transform, two or moreregistered input images are wavelet transformed toget their wavelet coefficients [51]. The waveletcoefficients for each level contain the spatial (detail)differences between two successive resolution levels[9].
The basic operation for calculating the DWT isconvolving the samples of the input with the low- pass and high-pass filters of the wavelet and downsampling the output [52]. Wavelet transform basedimage fusion involves various steps:
Step (1): the PAN image is first reference stretchedthree times, each time to match one of multispectral
histograms to produce three new PAN images.
Step (2): the wavelet basis for the transform is chosen.In this study the upper procedure is for one levelwavelet decomposition, and we used to implementthe image fusion using wavelet basis of Haar becauseit is found that the choice of the wavelet basis doesaffect the fused images [53]. The Haar basis vectorsare simple [37]: √ 1 1 √ 1 1 (10) Then performing the wavelet decomposition analysisto extract The structures or ”details” present betweenthe images of two different resolution. Thesestructures are isolated into three wavelet coefficients,which correspond to the detailed images according tothe three directions. The decomposition at first levelwe will have one approximation coefficients, (A N R,G,B) and 3N wavelets Planes for each band by thefallowing equation [54]:
RWT A∑ HVD GWT A∑ HVD BWT
A∑ HVD(11)
A: is Approximation coefficient at level N or approximation plane-H: is Horizontal coefficient at level l or horizontalwavelet plane- V: is Vertical Coefficient at level l or verticalwavelet plane- D: is Diagonal coefficient at level l or diagonalwavelet plane
7/31/2019 Arithmetic and Frequency Filtering Methods of Pixel-Based Image Fusion Techniques
http://slidepdf.com/reader/full/arithmetic-and-frequency-filtering-methods-of-pixel-based-image-fusion-techniques 5/10
IJCSI International Journal of Computer Science Issues, Vol. 8, Issue 3, No. 1, May 2011 ISSN (Online): 1694 ‐0814 www.IJCSI.org 117
Step (3): Similarly by decomposing the panchromatichigh-resolution image we will have oneapproximation coefficients, ( ) and 3N waveletsPlanes for Panchromatic image, wherePAN means, panchromatic image.
Step (4): the wavelet coefficients sets from two
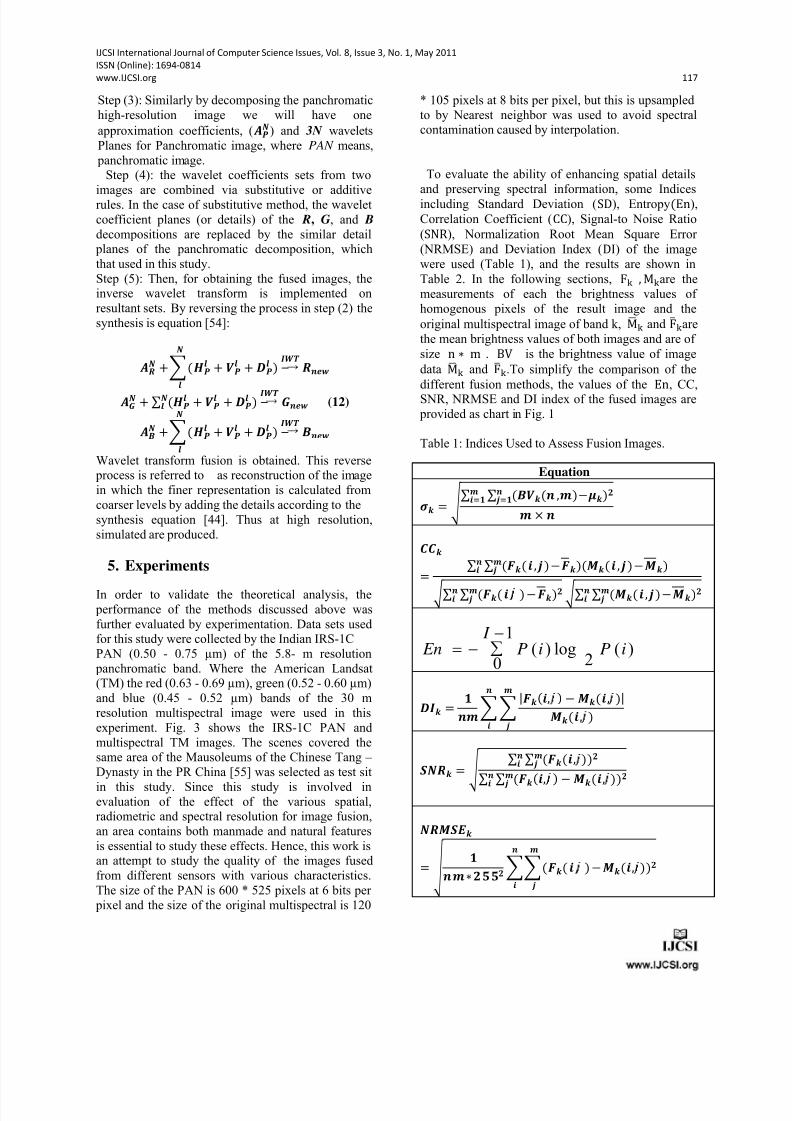
images are combined via substitutive or additiverules. In the case of substitutive method, the waveletcoefficient planes (or details) of the R, G, and B decompositions are replaced by the similar detail planes of the panchromatic decomposition, whichthat used in this study.Step (5): Then, for obtaining the fused images, theinverse wavelet transform is implemented onresultant sets. By reversing the process in step (2) thesynthesis is equation [54]:
∑ (12)
Wavelet transform fusion is obtained. This reverse process is referred to as reconstruction of the imagein which the finer representation is calculated fromcoarser levels by adding the details according to thesynthesis equation [44]. Thus at high resolution,simulated are produced.
5. Experiments
In order to validate the theoretical analysis, the performance of the methods discussed above wasfurther evaluated by experimentation. Data sets usedfor this study were collected by the Indian IRS-1CPAN (0.50 - 0.75 µm) of the 5.8- m resolution panchromatic band. Where the American Landsat(TM) the red (0.63 - 0.69 µm), green (0.52 - 0.60 µm)and blue (0.45 - 0.52 µm) bands of the 30 mresolution multispectral image were used in thisexperiment. Fig. 3 shows the IRS-1C PAN andmultispectral TM images. The scenes covered thesame area of the Mausoleums of the Chinese Tang – Dynasty in the PR China [55] was selected as test sitin this study. Since this study is involved inevaluation of the effect of the various spatial,radiometric and spectral resolution for image fusion,an area contains both manmade and natural featuresis essential to study these effects. Hence, this work isan attempt to study the quality of the images fusedfrom different sensors with various characteristics.The size of the PAN is 600 * 525 pixels at 6 bits per pixel and the size of the original multispectral is 120
* 105 pixels at 8 bits per pixel, but this is upsampledto by Nearest neighbor was used to avoid spectralcontamination caused by interpolation.
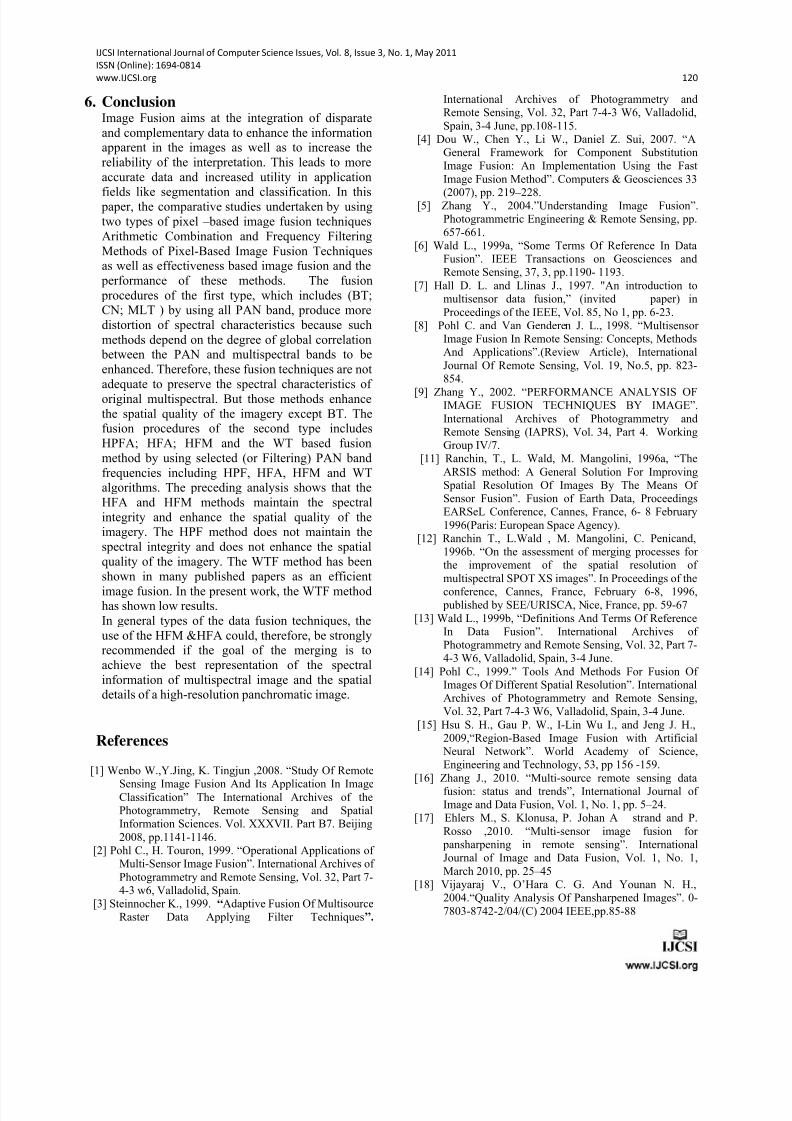
To evaluate the ability of enhancing spatial detailsand preserving spectral information, some Indicesincluding Standard Deviation (SD), Entropy E),Correlation Coefficient (CC), Signal-to Noise Ratio(SNR), Normalization Root Mean Square Error (NRMSE) and Deviation Index (DI) of the imagewere used (Table 1), and the results are shown inTable 2. In the following sections,F,Mare themeasurements of each the brightness values of homogenous pixels of the result image and theoriginal multispectral image of band k,MandFarethe mean brightness values of both images and are of size n m. BVis the brightness value of imagedata
Mand
F.To simplify the comparison of the
different fusion methods, the values of the
En, CC,
SNR, NRMSE and DI index of the fused images are provided as chart in Fig. 1
Table 1: Indices Used to Assess Fusion Images.
Equation
∑ ∑ ,
∑ ∑ , , ∑ ∑ , ∑ ∑ ,
)(2log)(1
0iPiP
I En
| , , | ,
∑ ∑ ,
∑ ∑, ,
, ,

7/31/2019 Arithmetic and Frequency Filtering Methods of Pixel-Based Image Fusion Techniques
http://slidepdf.com/reader/full/arithmetic-and-frequency-filtering-methods-of-pixel-based-image-fusion-techniques 6/10
IJCSI International Journal of Computer Science Issues, Vol. 8, Issue 3, No. 1, May 2011 ISSN (Online): 1694 ‐0814 www.IJCSI.org 118
6. Discussion Of Results
The Fig. 1 shows those parameters for the fusedimages using various methods. It can be seen thatfrom fig.1a. The SD of the fused images remains
constant for HFA and HFM. According to thecomputation results En, the increased En indicatesthe change in quantity of information content for radiometric resolution through the merging. Fromfig.1b, it is obvious that En of the fused images have been changed when compared to the originalmultispectral but some methods such as (BT andHPFA) decrease the En values to below the original.In Fig.1c.Correlation values also remain practicallyconstant, very near the maximum possible valueexcept BT and CN. The results of SNR,NRMSEandDIappear changing significantly. It can be observed,from the diagram of Fig. 1., that the results of
NRMSE&
DI, of the fused image,
show that the HFM
and HFA methods give the best results with respectto the other methods indicating that these methodsmaintain most of information spectral content of theoriginal multispectral data set which get the samevalues presented the lowest value of theNRMSE&DIas well as the higher of theSNR. Hence, thespectral qualities of fused images by HFM and HFAmethods are much better than the others. In contrast,it can also be noted that the BT, HPFA images produce highlyNRMSE& DIvalues indicate thatthese methods deteriorate spectral informationcontent for the reference image. In a comparison of spatial effects, it can be seen that the results of theHFM; HFA; WT and CN are better than other methods. Fig.3. shows the original images and thefused image results.By combining the visual inspection results, it can beseen that the experimental results overall method areThe HFM and HFA results which are the best result.The next higher the visual inspection results areobtained with WT, CN and MUL.
Fig. 1a: Chart Representation of SD of Fused Images
Fig. 1b: Chart Representation of En of Fused Images
Fig. 1c: Chart Representation of CC of Fused Images
Fig. 1d: Chart Representation of SNR of Fused Images
Fig. 1e: Chart Representation of NRMSE & DI of FusedImages
Fig. 1: Chart Representation of SD , En , CC ,NRMSE & DI of Fused Images
010
2030405060
1 2 3 1 2 3 1 2 3 1 2 3 1 2 3 1 2 3 1 2 3 1 2 3
ORIGIN BT CN MLT H PFA HFA HFM WT
SD
0
2
4
6
8
1 2 3 1 2 3 1 2 3 1 2 3 1 2 3 1 2 3 1 2 3 1 2 3
ORIGIN B T CN MLT HPFA HFA HFM WT
En
0
0.5
1
1.5
1 2 3 1 2 3 1 2 3 1 2 3 1 2 3 1 2 3 1 2 3
BT CN MLT HPFA HFA HFM WT
CC
0
2
4
6
8
10
1 2 3 1 2 3 1 2 3 1 2 3 1 2 3 1 2 3 1 2 3
BT CN MLT HPFA HFA HFM WT
SNR
00.1
0.2
0.3
0.4
0.5
0.6
0.7
1 2 3 1 2 3 1 2 3 1 2 3 1 2 3 1 2 3 1 2 3
BT CN MLT HPFA HFA HFM WT
NRMSE DI

7/31/2019 Arithmetic and Frequency Filtering Methods of Pixel-Based Image Fusion Techniques
http://slidepdf.com/reader/full/arithmetic-and-frequency-filtering-methods-of-pixel-based-image-fusion-techniques 7/10
IJCSI International Journal of Computer Science Issues, Vol. 8, Issue 3, No. 1, May 2011 ISSN (Online): 1694 ‐0814 www.IJCSI.org 119
Fig.2a. Original Panchromatic Fig.2b.Original Multispectral
Fig. 2c. BT Fig.2d. CN
Fig. 2f. MUL
Fig. 2g. HPF
Fig. 2e. HFA
Fig. 2f. HFM
Fig. 2i. WT Fig.2: The Representation of orginal
and Fused Images
Table 2: Quantitative Analysis of Original MS and Fused Image
Results Through the Different Methods
Method Band SD En SNR NRMSE DI CC
ORIGIN
1 51.018 5.20932 51.477 5.22633 51.983 5.2326
BT 1 13.185 4.1707 0.416 0.45 0.66 0.2742 13.204 4.0821 0.413 0.427 0.66 0.393
3 12.878 3.9963 0.406 0.405 0.66 0.482
CN 1 39.278 5.7552 2.547 0.221 0.323 0.2762 39.589 5.6629 2.579 0.205 0.324 0.3933 38.633 5.5767 2.57 0.192 0.324 0.481
MLT 1 37.009 5.7651 4.468 0.124 0.154 0.8322 37.949 5.7833 4.858 0.111 0.159 0.8593 38.444 5.7915 4.998 0.104 0.177 0.871
HPFA1 25.667 4.3176 1.03 0.306 0.491 0.9962 25.869 4.3331 1.032 0.289 0.49 0.9963 26.121 4.3424 1.033 0.273 0.489 0.996
HFA1 52.793 5.7651 9.05 0.068 0.08 0.9432 53.57 5.7833 8.466 0.07 0.087 0.9433 54.498 5.7915 7.9 0.071 0.095 0.943
HFM
1 52.76 5.9259 8.399 0.073 0.082 0.934
2 53.343 5.8979 8.286 0.071 0.084 0.943 54.136 5.8721 8.073 0.069 0.086 0.945
WT 1 37.666 5.7576 1.417 0.262 0.441 0.9072 37.554 5.7754 1.296 0.262 0.463 0.9133 37.875 5.7765 1.182 0.252 0.502 0.916
7/31/2019 Arithmetic and Frequency Filtering Methods of Pixel-Based Image Fusion Techniques
http://slidepdf.com/reader/full/arithmetic-and-frequency-filtering-methods-of-pixel-based-image-fusion-techniques 8/10
IJCSI International Journal of Computer Science Issues, Vol. 8, Issue 3, No. 1, May 2011 ISSN (Online): 1694 ‐0814 www.IJCSI.org 120
6. ConclusionImage Fusion aims at the integration of disparateand complementary data to enhance the informationapparent in the images as well as to increase thereliability of the interpretation. This leads to moreaccurate data and increased utility in application
fields like segmentation and classification. In this paper, the comparative studies undertaken by usingtwo types of pixel –based image fusion techniquesArithmetic Combination and Frequency FilteringMethods of Pixel-Based Image Fusion Techniquesas well as effectiveness based image fusion and the performance of these methods. The fusion procedures of the first type, which includes (BT;CN; MLT ) by using all PAN band, produce moredistortion of spectral characteristics because suchmethods depend on the degree of global correlation between the PAN and multispectral bands to beenhanced. Therefore, these fusion techniques are notadequate to preserve the spectral characteristics of original multispectral. But those methods enhancethe spatial quality of the imagery except BT. Thefusion procedures of the second type includesHPFA; HFA; HFM and the WT based fusionmethod by using selected (or Filtering) PAN bandfrequencies including HPF, HFA, HFM and WTalgorithms. The preceding analysis shows that theHFA and HFM methods maintain the spectralintegrity and enhance the spatial quality of theimagery. The HPF method does not maintain thespectral integrity and does not enhance the spatialquality of the imagery. The WTF method has beenshown in many published papers as an efficientimage fusion. In the present work, the WTF methodhas shown low results.In general types of the data fusion techniques, theuse of the HFM &HFA could, therefore, be stronglyrecommended if the goal of the merging is toachieve the best representation of the spectralinformation of multispectral image and the spatialdetails of a high-resolution panchromatic image.
References
[1] Wenbo W.,Y.Jing, K. Tingjun ,2008. “Study Of Remote
Sensing Image Fusion And Its Application In ImageClassification” The International Archives of thePhotogrammetry, Remote Sensing and SpatialInformation Sciences. Vol. XXXVII. Part B7. Beijing2008, pp.1141-1146.
[2] Pohl C., H. Touron, 1999. “Operational Applications of Multi-Sensor Image Fusion”. International Archives of Photogrammetry and Remote Sensing, Vol. 32, Part 7-4-3 w6, Valladolid, Spain.
[3] Steinnocher K., 1999.“Adaptive Fusion Of MultisourceRaster Data Applying Filter Techniques”.
International Archives of Photogrammetry andRemote Sensing, Vol. 32, Part 7-4-3 W6, Valladolid,Spain, 3-4 June, pp.108-115.
[4] Dou W., Chen Y., Li W., Daniel Z. Sui, 2007. “AGeneral Framework for Component SubstitutionImage Fusion: An Implementation Using the FastImage Fusion Method”. Computers & Geosciences 33
(2007), pp. 219–228.[5] Zhang Y., 2004.”Understanding Image Fusion”.Photogrammetric Engineering & Remote Sensing, pp.657-661.
[6] Wald L., 1999a, “Some Terms Of Reference In DataFusion”. IEEE Transactions on Geosciences andRemote Sensing, 37, 3, pp.1190- 1193.
[7] Hall D. L. and Llinas J., 1997. "An introduction tomultisensor data fusion,” (invited paper) inProceedings of the IEEE, Vol. 85, No 1, pp. 6-23.
[8] Pohl C. and Van Genderen J. L., 1998. “Multisensor Image Fusion In Remote Sensing: Concepts, MethodsAnd Applications”.(Review Article), InternationalJournal Of Remote Sensing, Vol. 19, No.5, pp. 823-854.
[9] Zhang Y., 2002. “PERFORMANCE ANALYSIS OFIMAGE FUSION TECHNIQUES BY IMAGE”.International Archives of Photogrammetry andRemote Sensing (IAPRS), Vol. 34, Part 4. WorkingGroup IV/7.
[11] Ranchin, T., L. Wald, M. Mangolini, 1996a, “TheARSIS method: A General Solution For ImprovingSpatial Resolution Of Images By The Means Of Sensor Fusion”. Fusion of Earth Data, ProceedingsEARSeL Conference, Cannes, France, 6- 8 February1996(Paris: European Space Agency).
[12] Ranchin T., L.Wald , M. Mangolini, C. Penicand,1996b. “On the assessment of merging processes for the improvement of the spatial resolution of multispectral SPOT XS images”. In Proceedings of theconference, Cannes, France, February 6-8, 1996, published by SEE/URISCA, Nice, France, pp. 59-67
[13] Wald L., 1999b, “Definitions And Terms Of ReferenceIn Data Fusion”. International Archives of Photogrammetry and Remote Sensing, Vol. 32, Part 7-4-3 W6, Valladolid, Spain, 3-4 June.
[14] Pohl C., 1999.” Tools And Methods For Fusion Of Images Of Different Spatial Resolution”. InternationalArchives of Photogrammetry and Remote Sensing,Vol. 32, Part 7-4-3 W6, Valladolid, Spain, 3-4 June.
[15] Hsu S. H., Gau P. W., I-Lin Wu I., and Jeng J. H.,2009,“Region-Based Image Fusion with Artificial Neural Network”. World Academy of Science,Engineering and Technology, 53, pp 156 -159.
[16] Zhang J., 2010. “Multi-source remote sensing datafusion: status and trends”, International Journal of Image and Data Fusion, Vol. 1, No. 1, pp. 5–24.
[17] Ehlers M., S. Klonusa, P. Johan A˚ strand and P.Rosso ,2010. “Multi-sensor image fusion for pansharpening in remote sensing”. InternationalJournal of Image and Data Fusion, Vol. 1, No. 1,March 2010, pp. 25–45
[18] Vijayaraj V., O’Hara C. G. And Younan N. H.,2004.“Quality Analysis Of Pansharpened Images”. 0-7803-8742-2/04/(C) 2004 IEEE,pp.85-88

7/31/2019 Arithmetic and Frequency Filtering Methods of Pixel-Based Image Fusion Techniques
http://slidepdf.com/reader/full/arithmetic-and-frequency-filtering-methods-of-pixel-based-image-fusion-techniques 9/10
IJCSI International Journal of Computer Science Issues, Vol. 8, Issue 3, No. 1, May 2011 ISSN (Online): 1694 ‐0814 www.IJCSI.org 121
[19] ŠVab A.and Oštir K., 2006. “High-Resolution ImageFusion: Methods To Preserve Spectral And SpatialResolution”. Photogrammetric Engineering & RemoteSensing, Vol. 72, No. 5, May 2006, pp. 565–572.
[20] Parcharidis I. and L. M. K. Tani, 2000. “Landsat TMand ERS Data Fusion: A Statistical ApproachEvaluation for Four Different Methods”. 0-7803-6359-
0/00/ 2000 IEEE, pp.2120-2122.[21] Ranchin T., Wald L., 2000. “Fusion of high spatial andspectral resolution images: the ARSIS concept and itsimplementation”. Photogrammetric Engineering andRemote Sensing, Vol.66, No.1, pp.49-61.
[22] Prasad N., S. Saran, S. P. S. Kushwaha and P. S. Roy,2001. “Evaluation Of Various Image FusionTechniques And Imaging Scales For Forest FeaturesInterpretation”. Current Science, Vol. 81, No. 9, pp.1218
[23] Alparone L., Baronti S., Garzelli A., Nencini F. , 2004.“ Landsat ETM+ and SAR Image Fusion Based onGeneralized Intensity Modulation”. IEEE Transactionson Geoscience and Remote Sensing, Vol. 42, No. 12, pp. 2832-2839
[24] Dong J.,Zhuang D., Huang Y.,Jingying Fu,2009.“Advances In Multi-Sensor Data Fusion: AlgorithmsAnd Applications “. Review , ISSN 1424-8220Sensors 2009, 9, pp.7771-7784.
[25] Amarsaikhan D., H.H. Blotevogel, J.L. van Genderen,M. Ganzorig, R. Gantuya and B. Nergui, 2010.“Fusing high-resolution SAR and optical imagery for improved urban land cover study and classification”.International Journal of Image and Data Fusion, Vol.1, No. 1, March 2010, pp. 83–97.
[26] Vrabel J., 1996. “Multispectral imagery bandsharpening study”. Photogrammetric Engineering andRemote Sensing, Vol. 62, No. 9, pp. 1075-1083.
[27] Vrabel J., 2000. “Multispectral imagery Advanced
band sharpening study”. PhotogrammetricEngineering and Remote Sensing, Vol. 66, No. 1, pp.73-79.
[28] Gangkofner U. G., P. S. Pradhan, and D. W. Holcomb,2008. “Optimizing the High-Pass Filter AdditionTechnique for Image Fusion”. PhotogrammetricEngineering & Remote Sensing, Vol. 74, No. 9, pp.1107–1118.
[29] Wald L., T. Ranchin and M. Mangolini, 1997. ‘Fusionof satellite images of different spatial resolutions:Assessing the quality of resulting images’,Photogrammetric Engineering and Remote Sensing,Vol. 63, No. 6, pp. 691–699.
[30] Li J., 2001. “Spatial Quality Evaluation Of Fusion Of Different Resolution Images”. International Archivesof Photogrammetry and Remote Sensing. Vol.XXXIII, Part B2, Amsterdam 2000, pp.339-346.
[31] Aiazzi, B., L. Alparone, S. Baronti, I. Pippi, and M.Selva, 2003. “Generalised Laplacian pyramid-basedfusion of MS + P image data with spectral distortionminimization”.URL:http://www.isprs.org/commission3/ proceedings02/papers/paper083.pdf (Last date accessed:8 Feb 2010).
[32] Hill J., C. Diemer, O. Stöver, Th. Udelhoven, 1999. “ALocal Correlation Approach for the Fusion of RemoteSensing Data with Different Spatial Resolutions in
Forestry Applications”. International Archives Of Photogrammetry And Remote Sensing, Vol. 32, Part7-4-3 W6, Valladolid, Spain, 3-4 June.
[33] Carter, D.B., 1998. “Analysis of Multiresolution DataFusion Techniques”. Master Thesis VirginiaPolytechnic Institute and State University, URL:http://scholar.lib.vt.edu/theses/available /etd-32198–
21323/unrestricted/Etd.pdf (last date accessed: 10May 2008).[34] Aiazzi B., S. Baronti , M. Selva,2008. “Image fusion
through multiresolution oversampleddecompositions”. in Image Fusion: Algorithms andApplications “.Edited by: Stathaki T. “Image Fusion:Algorithms and Applications”. 2008 Elsevier Ltd.
[35] Lillesand T., and Kiefer R.1994. “Remote Sensing AndImage Interpretation”. 3rd Edition, John Wiley AndSons Inc.,
[36] Gonzales R. C, and R. Woods, 1992. “Digital ImageProcessing”. A ddison-Wesley Publishing Company.
[37] Umbaugh S. E., 1998. “Computer Vision and ImageProcessing: Apractical Approach Using CVIP tools”.Prentic Hall.
[38] Green W. B., 1989. Digital Image processing A systemApproach”.2nd Edition. Van Nostrand Reinholld, NewYork.
[39] Sangwine S. J., and R.E.N. Horne, 1989. “The Colour Image Processing Handbook”. Chapman & Hall.
[40] Gross K. and C. Moulds, 1996. Digital ImageProcessing. (http://www.net/Digital ImageProcessing.htm). (last date accessed: 10 Jun 2008).
[41] Jensen J.R., 1986. “Introductory Digital ImageProcessing A Remote Sensing Perspective”.Englewood Cliffs, New Jersey: Prentice-Hall.
[42] Richards J. A., and Jia X., 1999. “Remote SensingDigital Image Analysis”. 3rd Edition. Springer -verlag Berlin Heidelberg New York.
[43] Cao D., Q. Yin, and P. Guo,2006. “Mallat Fusion for Multi-Source Remote Sensing Classification”.Proceedings of the Sixth International Conference onIntelligent Systems Design and Applications(ISDA'06)
[44] Hahn M. and F. Samadzadegan, 1999. “ Integration of DTMS Using Wavelets”. International Archives Of Photogrammetry And Remote Sensing, Vol. 32, Part7-4-3 W6, Valladolid, Spain, 3-4 June. 1999.
[45] King R. L. and Wang J., 2001. “A Wavelet BasedAlgorithm for Pan Sharpening Landsat 7 Imagery”. 0-7803-7031-7/01/ 02001 IEEE, pp. 849- 851
[46] Kumar Y. K.,. “Comparison Of Fusion TechniquesApplied To Preclinical Images: Fast Discrete CurveletTransform Using Wrapping Technique & WaveletTransform”. Journal Of Theoretical And AppliedInformation Technology.© 2005 - 2009 Jatit, pp. 668-673
[47] Malik N. H., S. Asif M. Gilani, Anwaar-ul-Haq, 2008.“Wavelet Based Exposure Fusion”. Proceedings of theWorld Congress on Engineering 2008 Vol I WCE2008, July 2 - 4, 2008, London, U.K
[48] Li S., Kwok J. T., Wang Y.., 2002. “Using The DiscreteWavelet Frame Transform To Merge Landsat TM AndSPOT Panchromatic Images”. Information Fusion 3(2002), pp.17–23.
7/31/2019 Arithmetic and Frequency Filtering Methods of Pixel-Based Image Fusion Techniques
http://slidepdf.com/reader/full/arithmetic-and-frequency-filtering-methods-of-pixel-based-image-fusion-techniques 10/10
IJCSI International Journal of Computer Science Issues, Vol. 8, Issue 3, No. 1, May 2011 ISSN (Online): 1694 ‐0814 www.IJCSI.org 122
[49] Garzelli, A. and Nencini, F., 2006. “Fusion of panchromatic and multispectral images by geneticAlgorithms”. IEEE Transactions on Geoscience andRemote Sensing, 40, 3810–3813.
[50] Aiazzi, B., Baronti, S., and Selva, M., 2007. “Improvingcomponent substitution pan-sharpening throughmultivariate regression of MS+Pan data”. IEEE
Transactions on Geoscience and Remote Sensing,Vol.45, No.10, pp. 3230–3239.[51] Das A. and Revathy K., 2007. “A Comparative
Analysis of Image Fusion Techniques for RemoteSensed Images”. Proceedings of the World Congresson Engineering 2007, Vol. I, WCE 2007, July 2 – 4,London, U.K.
[52] Pradhan P.S., King R.L., 2006. “Estimation of the Number of Decomposition Levels for a Wavelet-Based Multi-resolution Multi-sensor Image Fusion”.IEEE Transaction of Geosciences and RemoteSensing, Vol. 44, No. 12, pp. 3674-3686.
[53] Hu Deyong H. L., 1998. “A fusion Approach of Multi-Sensor Remote Sensing Data Based on WaveletTransform”. URL:
http://www.gisdevelopment.net/AARS/ACRS1998/Digital Image Processing (last date accessed: 15 Feb2009).
[54] Li S.,Li Z.,Gong J.,2010.“Multivariate statisticalanalysis of measures for assessing the quality of imagefusion”. International Journal of Image and DataFusion Vol. 1, No. 1, March 2010, pp. 47–66.
[55] Böhler W. and G. Heinz, 1998. “Integration of highResolution Satellite Images into ArchaeologicalDocmentation”. Proceeding International Archives of Photogrammetry and Remote Sensing, Commission V,Working Group V/5, CIPA International Symposium,Published by the Swedish Society for Photogrammetryand Remote Sensing, Goteborg. (URL:http://www.i3mainz.fh-mainz.de/publicat/cipa-98/sat-im.html (Last date accessed: 28 Oct. 2000).
AUTHORSMrs . Firouz Abdullah Al-Wassai1.Received the B.Sc. degree in,Physics from University of Sana’a, Yemen, Sana’a, in 1993. TheM.Sc.degree in, Physics from Bagdad University , Iraqe, in 2003,Research student.Ph.D in thedepartment of computer science(S.R.T.M.U), India, Nanded.
Dr. N.V. Kalyankar .B.Sc.Maths, Physics, Chemistry,Marathwada University, Aurangabad, India, 1978. M Sc.Nuclear Physics, Marathwada University, Aurangabad, India,1980.Diploma in Higher Education, Shivaji University, Kolhapur,India, 1984.Ph.D. in Physics, Dr.B.A.M.University, Aurangabad,India, 1995.Principal Yeshwant Mahavidyalaya College,Membership of Academic Bodies,Chairman, InformationTechnology Society State Level Organization, Life Member of Indian Laser Association, Member Indian Institute of PublicAdministration, New Delhi, Member Chinmay Education Society, Nanded.He has one publication book, seven journals papers, twoseminars Papers and three conferences papers.
Dr. Ali A. Al-Zuky. B.Sc Physics Mustansiriyah University,Baghdad , Iraq, 1990. M Sc. In1993 and Ph. D. in1998 fromUniversity of Baghdad, Iraq. He was supervision for 40 post-graduate students (MSc. & Ph.D.) in different fields (physics,computers and Computer Engineering and Medical Physics). He
has More than 60 scientific papers published in scientific journalsin several scientific conferences.
Related Documents