Argonia USD No. 359

Welcome message from author
This document is posted to help you gain knowledge. Please leave a comment to let me know what you think about it! Share it to your friends and learn new things together.
Transcript

Argonia USD No. 359

i
• Budget General Information (characteristics of district)
• Supplemental Information for Tables in Summary of Expenditures
• KSDE Website Information Available
• Summary of Expenditures (Sumexpen.xlsx)

1
2013-14 Budget General Information USD #: 359
Introduction Argonia USD 359 is a small rural school district located 40 miles southwest of Wichita, KS. The district has two schools: Argonia Elementary houses preschool through fifth grade and Argonia High School houses grades six through twelve. Our schools have a strong academic background as well as successful sports programs. The community is extremely supportive of our schools and staff members.
Board Members Dave Gaddie-President 253 S. Argonia Rd. Argonia, KS 67004 Scott Greenwood-VP 222 N. Blackstone Rd. Argonia, KS 67004 Joe Allen 1253 W. 40th Ave. N. Argonia, KS 67004 Rick Nafziger 720 S. Blackstone Rd. Freeport, KS 67049 Randy Simon 426 N. Eden Rd. Argonia, KS 67004 Sarah Vineyard 607 N. High St. Argonia, KS 67004 Ron Work PO Box 278 Argonia, KS 67004
Key Staff Superintendent/Elem. Principal: Dr. Julie Dolley Business Office Staff: Sue Randall JH/HS Principal: Travis Riebel
The District’s Accomplishments and Challenges Accomplishments: For a school district our size, we are able to provide our students comprehensive course offerings by utilizing our staff as well as the IDL (interactive distance learning) system. Our district maintains a high level of technology for students and staff. Both buildings and the district have met the state’s Adequate Yearly Progress standard in all assessed areas since 2003 and current scores continue to exceed the state’s AYP goals. In the 2013-14 school year the district will be providing iPad mini’s for all students in grades 6-12. New textbooks and resources will be in a digital platform. Challenges: Declining enrollment and cuts in the base budget per pupil are major challenges for the Argonia school district. The district has reduced staff and classified hours in an effort to save money. We are trying to stay competitive with salaries so that we will be able to retain the staff we have and recruit new staff as needed.

2
Supplemental Information for the Following Tables 1. Summary of Total Expenditures by Function (All Funds) 2. Summary of General Fund Expenditures by Function 3. Summary of Supplemental General Fund Expenditures by Function 4. Summary of General and Supplemental General Fund Expenditures by Function 5. Summary of Special Education Fund by Function 6. Instruction Expenditures (1000) 7. Student and Instructional Support Expenditures (2100 & 2200) 8. General Administration Expenditures (2300) 9. School Administration Expenditures (2400) 10. Operations and Maintenance Expenditures (2600) 11. Other Costs (2500 & 2900: Other Supplemental Services) (3000: Non-Instruction
Services) 12. Capital Improvements (4000) 13. Debt Services (5000)
14. Miscellaneous Information - Transfers 15. Miscellaneous Information Unencumbered Cash Balance by Fund 16. Reserve Funds Unencumbered Cash Balance 17. Other Information - FTE 18. Miscellaneous Information Mill Rates by Fund 19. Other Information – Assessed Valuation and Bonded Indebtedness Note: The FTE (full time equivalency) used in this report to calculate the “Amount Per Pupil” is defined as following: Enrollment (FTE) includes the enrollment of the district used for state aid and budget authority, and all other preschool enrollment and kindergarten students attending full time.

3
KSDE Website Information Available K-12 Statistics (Building, District or State Totals) http://svapp15586.ksde.org/k12/k12.aspx
• Attendance / Enrollment Reports • Staff Reports • Graduates / Dropouts Reports • Crime / Violence Reports
School Finance Reports and Publications http://www.ksde.org/Default.aspx?tabid=1870
• Certified Personnel • Enrollment • Dropouts • Graduates • Salary Reports
Kansas Building Report Card http://svapp15586.ksde.org/rcard/
• Attendance Rate • Graduation Rate • Dropout Rate • School Violence • Assessments
o Reading o Mathematics o Writing
• Graduates Passing Adv. Science Courses • Graduates Passing Adv. Math Courses

USD# 359
Summary of Total Expenditures By Function (All Funds)
% % % % %
2011-2012 of 2012-2013 of inc/ 2013-2014 of inc/
Actual Tot Actual Tot dec Budget Tot dec
Instruction 1,493,939 64% 1,566,491 64% 5% 1,724,623 59% 10%
Student Support Services 51,299 2% 44,553 2% -13% 44,254 2% -1%
Instructional Support Services 26,538 1% 26,005 1% -2% 27,091 1% 4%
General Administration 136,480 6% 126,444 5% -7% 129,525 4% 2%
School Administration (Building) 154,145 7% 155,619 6% 1% 162,322 6% 4%
Operations & Maintenance 208,598 9% 203,839 8% -2% 291,796 10% 43%
Transportation 125,118 5% 185,012 8% 48% 222,965 8% 21%
Food Services 89,322 4% 89,172 4% 0% 106,218 4% 19%
Capital Improvements 0 0% 17,412 1% 0% 155,000 5% 790%
Debt Services 0 0% 0 0% 0% 0 0% 0%
Other Costs 38,150 2% 37,883 2% -1% 46,067 2% 22%
Total Expenditures* 2,323,589 100% 2,452,430 100% 6% 2,909,861 100% 19%
Amount per Pupil $13,749 $15,000 9% $18,593 24%
Current Expenditures** 2,303,838 100% 2,362,404 100% 3% 2,419,861 100% 2%
Amount per Pupil $13,632 $14,449 6% $15,462 7%
Instruction*** (Total Expenditures) 1,474,188 63% 1,566,491 64% 1% 1,574,623 54% -10%
Instruction*** (Current Expenditures) 1,474,188 64% 1,566,491 66% 2% 1,574,623 65% -1%
Note: Percentages on charts are within +-1% due to rounding used. Pie graph percentages may differ from charts for this reason also.
Further definition of what goes into each category:
Instruction - 1000 Transportation - 2700
Student Support Services - 2100 Food Service - 3100
Instructional Support Services - 2200 Other Costs - 2500/2900 and 3300
General Administration - 2300 Capital Improvements - 4000
School Administration (Building) - 2400 Debt Services - 5100
Operations & Maintenance - 2600 Transfers - 5200
Percent of Expenditures
* The funds that are included in the categories above are: General, Supplemental General, Bilingual Education, At Risk(4yr Old), At Risk(K-12), Virtual Education, Capital
Outlay, Driver Education, Extraordinary School Program, Summer School, Special Education, Vocational Education, Professional Development, Bond & Interest #1, Bond &
Interest #2, No-Fund Warrant, Special Assessment, Parent Education, School Retirement, Student Materials Revolving & Textbook Rental, Tuition Reimbursement,
Gifts/Grants, KPERS Special Retirement Contribution, Contingency, Special Liability Expense, Federal Funds, Adult Education, Adult Supplemental Education, Activity Fund
and Special Education Coop Fund.
*** Instruction excludes Capital Outlay and Bond Debt expenditures (Code 16, Code 62, Code 63)
** Current Spending excludes Capital Outlay and Bond Debt expenditures (Code 16, Code 62, Code 63)
0
200,000
400,000
600,000
800,000
1,000,000
1,200,000
1,400,000
1,600,000
1,800,0001,724,623
44,254 27,091 129,525 162,322
291,796 222,965
106,218 155,000 0 46,067
Summary of Total Expenditures by Function (All Funds)
2011-2012
2012-2013
2013-2014
Instruction 59%
Student Support Services 1%
Instructional Support 1%
General Administration
4%
School Administration (Building)
6%
Operations & Maintenance 10%
Transportation 8%
Food Services 4% Capital Improvements
5% Other Costs 2%
2013-14 Summary of Total Expenditures by Function
Instruction
Student Support Services
Instructional Support
General Administration
School Administration (Building)
Operations & Maintenance
Transportation
Food Services
Capital Improvements
Debt Services
Other Costs
9/12/2013 1:42 PM Sumexpen.xlsx Page 1 of 24

USD# 359
Summary of General Fund Expenditures
by Function
% % % % %
2011-2012 of 2012-2013 of inc/ 2013-2014 of inc/
Actual Tot Actual Tot dec Budget Tot dec
Instruction 729,329 61% 786,697 65% 8% 806,901 68% 3%
Student Support 47,527 4% 41,178 3% -13% 40,170 3% -2%
Instructional Support 24,023 2% 23,755 2% -1% 24,368 2% 3%
General Administration 130,193 11% 121,292 10% -7% 123,291 10% 2%
School Administration (Building) 139,057 12% 142,321 12% 2% 146,231 12% 3%
Operations & Maintenance 2,635 0% 3,071 0% 17% 0 0% -100%
Transportation 87,882 7% 52,787 4% -40% 0 0% -100%
Capital Improvements 0 0% 0 0% 0% 0 0% 0%
Other Costs 35,635 3% 35,565 3% 0% 38,262 3% 8%
Total Expenditures 1,196,281 100% 1,206,666 100% 1% 1,179,223 100% -2%
Amount per Pupil $7,079 $7,380 4% $7,535 2%
The Summary of General Fund Expenditures chart information comes from pages 6-13 and only uses the 'General Fund' line items.
0
100,000
200,000
300,000
400,000
500,000
600,000
700,000
800,000
900,000806,901
40,170 24,368
123,291 146,231
0 0 0 38,262
Summary of General Fund Expenditures
2011-2012
2012-2013
2013-2014
Instruction 69%
Student Support 3%
Instructional Support 2%
General Administration 11%
School Administration (Building)
12%
Other Costs 3%
2013-14 Summary of General Fund Expenditures by Function
Instruction
Student Support
Instructional Support
General Administration
School Administration (Building)
Operations & Maintenance
Transportation
Capital Improvements
Other Costs
9/12/2013 1:42 PM Sumexpen.xlsx Page 2 of 24

USD# 359
Summary of Supplemental General Fund Expenditures
by Function
% % % % %
2011-2012 of 2012-2013 of inc/ 2013-2014 of inc/
Actual Tot Actual Tot dec Budget Tot dec
Instruction 117,245 34% 116,702 32% 0% 122,200 28% 5%
Student Support 0 0% 0 0% 0% 0 0% 0%
Instructional Support 0 0% 0 0% 0% 0 0% 0%
General Administration 0 0% 0 0% 0% 0 0% 0%
School Administration (Building) 0 0% 0 0% 0% 0 0% 0%
Operations & Maintenance 198,405 57% 193,840 53% -2% 203,496 46% 5%
Transportation 31,431 9% 55,111 15% 75% 117,520 27% 113%
Capital Improvements 0 0% 0 0% 0% 0 0% 0%
Other Costs 0 0% 0 0% 0% 0 0% 0%
Total Expenditures 347,081 100% 365,653 100% 5% 443,216 100% 21%
Amount per Pupil $2,054 $2,236 9% $2,832 27%
The Summary of Supplemental General Fund Expenditures chart information comes from pages 6-13 and only uses the 'Supplemental
General Fund' line items.
0
50,000
100,000
150,000
200,000
250,000
122,200
0 0 0 0
203,496
117,520
0 0
Summary of Supplemental General Expenditures by Function
2011-2012
2012-2013
2013-2014
Instruction 28%
Operations & Maintenance 46%
Transportation 26%
2013-14 Summary of Supplemental General Fund Expenditures by Function
Instruction
Student Support
Instructional Support
General Administration
School Administration (Building)
Operations & Maintenance
Transportation
Capital Improvements
Other Costs
9/12/2013 1:42 PM Sumexpen.xlsx Page 3 of 24

USD# 359
Summary of General and Supplemental General Fund
Expenditures by Function
% % % % %
2011-2012 of 2012-2013 of inc/ 2013-2014 of inc/
Actual Tot Actual Tot dec Budget Tot dec
Instruction 846,574 55% 903,399 57% 7% 929,101 57% 3%
Student Support 47,527 3% 41,178 3% -13% 40,170 2% -2%
Instructional Support 24,023 2% 23,755 2% -1% 24,368 2% 3%
General Administration 130,193 8% 121,292 8% -7% 123,291 8% 2%
School Administration (Building) 139,057 9% 142,321 9% 2% 146,231 9% 3%
Operations & Maintenance 201,040 13% 196,911 13% -2% 203,496 13% 3%
Transportation 119,313 8% 107,898 7% -10% 117,520 7% 9%
Capital Improvements 0 0% 0 0% 0% 0 0% 0%
Other Costs 35,635 2% 35,565 2% 0% 38,262 2% 8%
Total Expenditures 1,543,362 100% 1,572,319 100% 2% 1,622,439 100% 3%
Amount per Pupil $9,132 $9,617 5% $10,367 8%
The Summary of General and Supplemental General Fund Expenditures chart information comes from pages 6-13 and adds together
the 'General Fund' and 'Supplemental General Fund' line items.
0
100,000
200,000
300,000
400,000
500,000
600,000
700,000
800,000
900,000
1,000,000 929,101
40,170 24,368 123,291 146,231
203,496 117,520
0 38,262
Summary of General and Supplemental General Fund Expenditures by Function
2011-2012
2012-2013
2013-2014
Instruction 57%
Student Support 2%
Instructional Support 2%
General Administration 8%
School Administration (Building)
9%
Operations & Maintenance 13%
Transportation 7%
Other Costs 2%
2013-14 Summary of General and Supplemental General Fund Expenditures by Function
Instruction
Student Support
Instructional Support
General Administration
School Administration (Building)
Operations & Maintenance
Transportation
Capital Improvements
Other Costs
9/12/2013 1:42 PM Sumexpen.xlsx Page 4 of 24
USD# 359
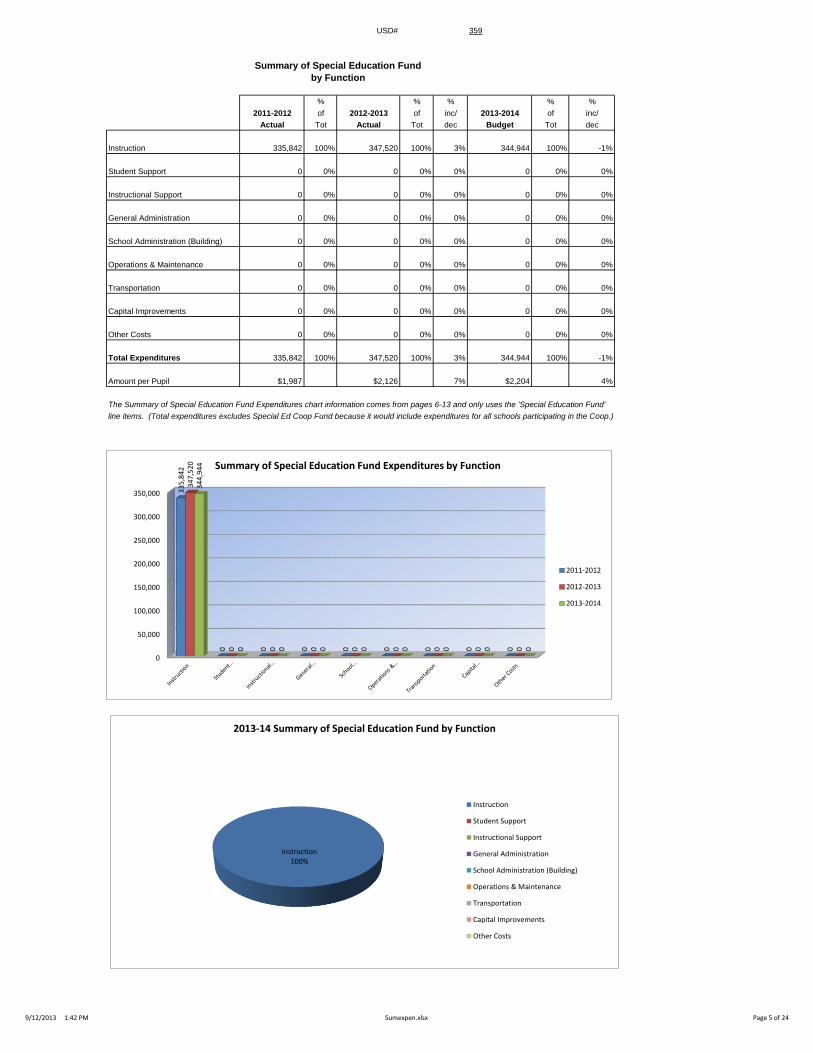
Summary of Special Education Fund
by Function
% % % % %
2011-2012 of 2012-2013 of inc/ 2013-2014 of inc/
Actual Tot Actual Tot dec Budget Tot dec
Instruction 335,842 100% 347,520 100% 3% 344,944 100% -1%
Student Support 0 0% 0 0% 0% 0 0% 0%
Instructional Support 0 0% 0 0% 0% 0 0% 0%
General Administration 0 0% 0 0% 0% 0 0% 0%
School Administration (Building) 0 0% 0 0% 0% 0 0% 0%
Operations & Maintenance 0 0% 0 0% 0% 0 0% 0%
Transportation 0 0% 0 0% 0% 0 0% 0%
Capital Improvements 0 0% 0 0% 0% 0 0% 0%
Other Costs 0 0% 0 0% 0% 0 0% 0%
Total Expenditures 335,842 100% 347,520 100% 3% 344,944 100% -1%
Amount per Pupil $1,987 $2,126 7% $2,204 4%
The Summary of Special Education Fund Expenditures chart information comes from pages 6-13 and only uses the 'Special Education Fund'
line items. (Total expenditures excludes Special Ed Coop Fund because it would include expenditures for all schools participating in the Coop.)
0
50,000
100,000
150,000
200,000
250,000
300,000
350,000 33
5,8
42
0
0
0
0
0
0
0
0
34
7,5
20
0
0
0
0
0
0
0
0
34
4,9
44
0
0
0
0
0
0
0
0
Summary of Special Education Fund Expenditures by Function
2011-2012
2012-2013
2013-2014
Instruction 100%
2013-14 Summary of Special Education Fund by Function
Instruction
Student Support
Instructional Support
General Administration
School Administration (Building)
Operations & Maintenance
Transportation
Capital Improvements
Other Costs
9/12/2013 1:42 PM Sumexpen.xlsx Page 5 of 24

USD# 359
Instruction Expenditures (1000)
% %
2011-2012 2012-2013 inc/ 2013-2014 inc/
Actual Actual dec Budget dec
General 729,329 786,697 8% 806,901 3%
Federal Funds 53,143 52,027 -2% 50,802 -2%
Supplemental General 117,245 116,702 0% 122,200 5%
At Risk (4yr Old) 742 700 -6% 1,000 43%
At Risk (K-12) 68,976 66,014 -4% 63,204 -4%
Bilingual Education 0 0 0% 0 0%
Virtual Education 0 0 0% 0 0%
Capital Outlay 19,751 0 -100% 150,000 0%
Driver Education 2,321 8 -100% 4,935 61588%
Declining Enrollment 0 0 0% 0 0%
Extraordinary School Program 0 0 0% 0 0%
Food Service 0 0 0% 0 0%
Professional Development 0 0 0% 0 0%
Parent Education Program 0 0 0% 0 0%
Summer School 0 0 0% 0 0%
Special Education 335,842 347,520 3% 344,944 -1%
Cost of Living 0 0 0% 0 0%
Vocational Education 50,086 86,696 73% 94,217 9%
Gifts/Grants 57 0 -100% 0 0%
Special Liability 0 0 0% 0 0%
School Retirement 0 0 0% 0 0%
Extraordinary Growth Facilities 0 0 0% 0 0%
Special Reserve 0 0 0%
KPERS Spec. Ret. Contribution 79,213 71,423 -10% 86,420 21%
Contingency Reserve 0 0 0%
Text Book & Student Material 16,683 23,310 40%
Activity Fund 20,551 15,394 -25% 0 -100%
Bond and Interest #1 0 0 0% 0 0%
Bond and Interest #2 0 0 0% 0 0%
No-Fund Warrant 0 0 0% 0 0%
Special Assessment 0 0 0% 0 0%
Temporary Note 0 0 0% 0 0%
SUBTOTAL 1,493,939 1,566,491 5% 1,724,623 10%
Enrollment (FTE)* 169.0 163.5 -3% 156.5 -4%
Amount per Pupil 8,840 9,581 8% 11,020 15%
Adult Education 0 0 0% 0 0%
Adult Supplemental Education 0 0 0% 0 0%
Tuition Reimbursement 0 0 0% 0 0%
Special Education Coop 0 0 0% 0 0%
TOTAL 1,493,939 1,566,491 5% 1,724,623 10%
NOTE: Gifts/Grants includes private grants and grants from nonfederal sources.
Amount per pupil excludes the following funds: Adult Education, Adult Supplemental Education, Special Education Coop
and Tuition Reimbursement.
*Enrollment (FTE) includes the enrollment of the district used for state aid and budget authority, and all other preschool enrollment
and kindergarten students attending full time.
0
200,000
400,000
600,000
800,000
1,000,000
2011-2012 2012-2013 2013-2014
729,329 786,697 806,901
117,245 116,702 122,200
335,842 347,520 344,944
Instruction Expenditures
GeneralSupplemental GeneralSpecial Education
1,350,000
1,400,000
1,450,000
1,500,000
1,550,000
1,600,000
1,650,000
1,700,000
1,750,000
2011-2012 2012-2013 2013-2014
1,493,939
1,566,491
1,724,623
Instruction Expenditures
9/12/2013 1:42 PM Sumexpen.xlsx Page 6 of 24

USD# 359
Student Support Expenditures (2100)
% %
2011-2012 2012-2013 inc/ 2013-2014 inc/
Actual Actual dec Budget dec
General 47,527 41,178 -13% 40,170 -2%
Federal Funds 0 0 0% 0 0%
Supplemental General 0 0 0% 0 0%
At Risk (4yr Old) 0 0 0% 0 0%
At Risk (K-12) 0 0 0% 0 0%
Bilingual Education 0 0 0% 0 0%
Virtual Education 0 0 0% 0 0%
Capital Outlay 0 0 0% 0 0%
Driver Training 0 0 0% 0 0%
Declining Enrollment 0 0 0% 0 0%
Extraordinary School Program 0 0 0% 0 0%
Food Service 0 0 0% 0 0%
Professional Development 0 0 0% 0 0%
Parent Education Program 0 0 0% 0 0%
Summer School 0 0 0% 0 0%
Special Education 0 0 0% 0 0%
Cost of Living 0 0 0% 0 0%
Vocational Education 0 0 0% 0 0%
Gifts/Grants 0 0 0% 0 0%
Special Liability 0 0 0% 0 0%
School Retirement 0 0 0% 0 0%
Extraordinary Growth Facilities 0 0 0% 0 0%
Special Reserve 0 0 0%
KPERS Spec. Ret. Contribution 3,772 3,375 -11% 4,084 21%
Contingency Reserve 0 0 0%
Text Book & Student Material 0 0 0%
Activity Fund 0 0 0% 0 0%
Bond and Interest #1 0 0 0% 0 0%
Bond and Interest #2 0 0 0% 0 0%
No-Fund Warrant 0 0 0% 0 0%
Special Assessment 0 0 0% 0 0%
Temporary Note 0 0 0% 0 0%
SUBTOTAL 51,299 44,553 -13% 44,254 -1%
Enrollment (FTE)* 169.0 163.5 -3% 156.5 -4%
Amount per Pupil 304 272 -10% 283 4%
Adult Education 0 0 0% 0 0%
Adult Supplemental Education 0 0 0% 0 0%
Tuition Reimbursement 0 0 0% 0 0%
Special Education Coop 0 0 0% 0 0%
TOTAL 51,299 44,553 -13% 44,254 -1%
Amount per Pupil $305 $276 -10% $286 4%
NOTE: Gifts/Grants includes private grants and grants from nonfederal sources.
Amount per pupil excludes the following funds: Adult Education, Adult Supplemental Education, Special Education Coop
and Tuition Reimbursement.
*Enrollment (FTE) includes the enrollment of the district used for state aid and budget authority, and all other preschool enrollment
and kindergarten students attending full time.
40,000
42,000
44,000
46,000
48,000
50,000
52,000
2011-2012 2012-2013 2013-2014
51,299
44,553 44,254
Student Support Expenditures
9/12/2013 1:42 PM Sumexpen.xlsx Page 7 of 24

USD# 359
Instructional Support Expenditures (2200)
% %
2011-2012 2012-2013 inc/ 2013-2014 inc/
Actual Actual dec Budget dec
General 24,023 23,755 -1% 24,368 3%
Federal Funds 0 0 0% 0 0%
Supplemental General 0 0 0% 0 0%
At Risk (4yr Old) 0 0 0% 0 0%
At Risk (K-12) 0 0 0% 0 0%
Bilingual Education 0 0 0% 0 0%
Virtual Education 0 0 0% 0 0%
Capital Outlay 0 0 0% 0 0%
Driver Training 0 0 0% 0 0%
Declining Enrollment 0 0 0% 0 0%
Extraordinary School Program 0 0 0% 0 0%
Food Service 0 0 0% 0 0%
Professional Development 0 0 0% 0 0%
Parent Education Program 0 0 0% 0 0%
Summer School 0 0 0% 0 0%
Special Education 0 0 0% 0 0%
Cost of Living 0 0 0% 0 0%
Vocational Education 0 0 0% 0 0%
Gifts/Grants 0 0 0% 0 0%
Special Liability 0 0 0% 0 0%
School Retirement 0 0 0% 0 0%
Extraordinary Growth Facilities 0 0 0% 0 0%
Special Reserve 0 0 0%
KPERS Spec. Ret. Contribution 2,515 2,250 -11% 2,723 21%
Contingency Reserve 0 0 0%
Text Book & Student Material 0 0 0%
Activity Fund 0 0 0% 0 0%
Bond and Interest #1 0 0 0% 0 0%
Bond and Interest #2 0 0 0% 0 0%
No-Fund Warrant 0 0 0% 0 0%
Special Assessment 0 0 0% 0 0%
Temporary Note 0 0 0% 0 0%
SUBTOTAL 26,538 26,005 -2% 27,091 4%
Enrollment (FTE)* 169.0 163.5 -3% 156.5 -4%
Amount per Pupil 157 159 1% 173 9%
Adult Education 0 0 0% 0 0%
Adult Supplemental Education 0 0 0% 0 0%
Tuition Reimbursement 0 0 0% 0 0%
Special Education Coop 0 0 0% 0 0%
TOTAL 26,538 26,005 -2% 27,091 4%
Amount per Pupil $157 $159 1% $173 9%
NOTE: Gifts/Grants includes private grants and grants from nonfederal sources.
Amount per pupil excludes the following funds: Adult Education, Adult Supplemental Education, Special Education Coop
and Tuition Reimbursement.
*Enrollment (FTE) includes the enrollment of the district used for state aid and budget authority, and all other preschool enrollment
and kindergarten students attending full time.
25,400
25,600
25,800
26,000
26,200
26,400
26,600
26,800
27,000
27,200
2011-2012 2012-2013 2013-2014
26,538
26,005
27,091
Instructional Support Expenditures
9/12/2013 1:42 PM Sumexpen.xlsx Page 8 of 24

USD# 359
General Administration Expenditures (2300)
% %
2011-2012 2012-2013 inc/ 2013-2014 inc/
Actual Actual dec Budget dec
General 130,193 121,292 -7% 123,291 2%
Federal Funds 0 0 0% 0 0%
Supplemental General 0 0 0% 0 0%
At Risk (4yr Old) 0 0 0% 0 0%
At Risk (K-12) 0 0 0% 0 0%
Bilingual Education 0 0 0% 0 0%
Virtual Education 0 0 0% 0 0%
Capital Outlay 0 0 0% 0 0%
Driver Training 0 0 0% 0 0%
Declining Enrollment 0 0 0% 0 0%
Extraordinary School Program 0 0 0% 0 0%
Food Service 0 0 0% 0 0%
Professional Development 0 0 0% 0 0%
Parent Education Program 0 0 0% 0 0%
Summer School 0 0 0% 0 0%
Special Education 0 0 0% 0 0%
Cost of Living 0 0 0% 0 0%
Vocational Education 0 0 0% 0 0%
Gifts/Grants 0 0 0% 0 0%
Special Liability Expense 0 0 0% 0 0%
School Retirement 0 0 0% 0 0%
Extraordinary Growth Facilities 0 0 0% 0 0%
Special Reserve 0 0 0%
KPERS Spec. Ret. Contribution 6,287 5,152 -18% 6,234 21%
Contingency Reserve 0 0 0%
Text Book & Student Material 0 0 0%
Activity Fund 0 0 0% 0 0%
Bond and Interest #1 0 0 0% 0 0%
Bond and Interest #2 0 0 0% 0 0%
No-Fund Warrant 0 0 0% 0 0%
Special Assessment 0 0 0% 0 0%
Temporary Note 0 0 0% 0 0%
SUBTOTAL 136,480 126,444 -7% 129,525 2%
Enrollment (FTE)* 169.0 163.5 -3% 156.5 -4%
Amount per Pupil 808 773 -4% 828 7%
Adult Education 0 0 0% 0 0%
Adult Supplemental Education 0 0 0% 0 0%
Tuition Reimbursement 0 0 0% 0 0%
Special Education Coop 0 0 0% 0 0%
TOTAL 136,480 126,444 -7% 129,525 2%
NOTE: Gifts/Grants includes private grants and grants from nonfederal sources.
Amount per pupil excludes the following funds: Adult Education, Adult Supplemental Education, Special Education Coop
and Tuition Reimbursement.
*Enrollment (FTE) includes the enrollment of the district used for state aid and budget authority, and all other preschool enrollment
and kindergarten students attending full time.
120,000
122,000
124,000
126,000
128,000
130,000
132,000
134,000
136,000
138,000
2011-2012 2012-2013 2013-2014
136,480
126,444
129,525
General Administration Expenditures
9/12/2013 1:42 PM Sumexpen.xlsx Page 9 of 24
USD# 359
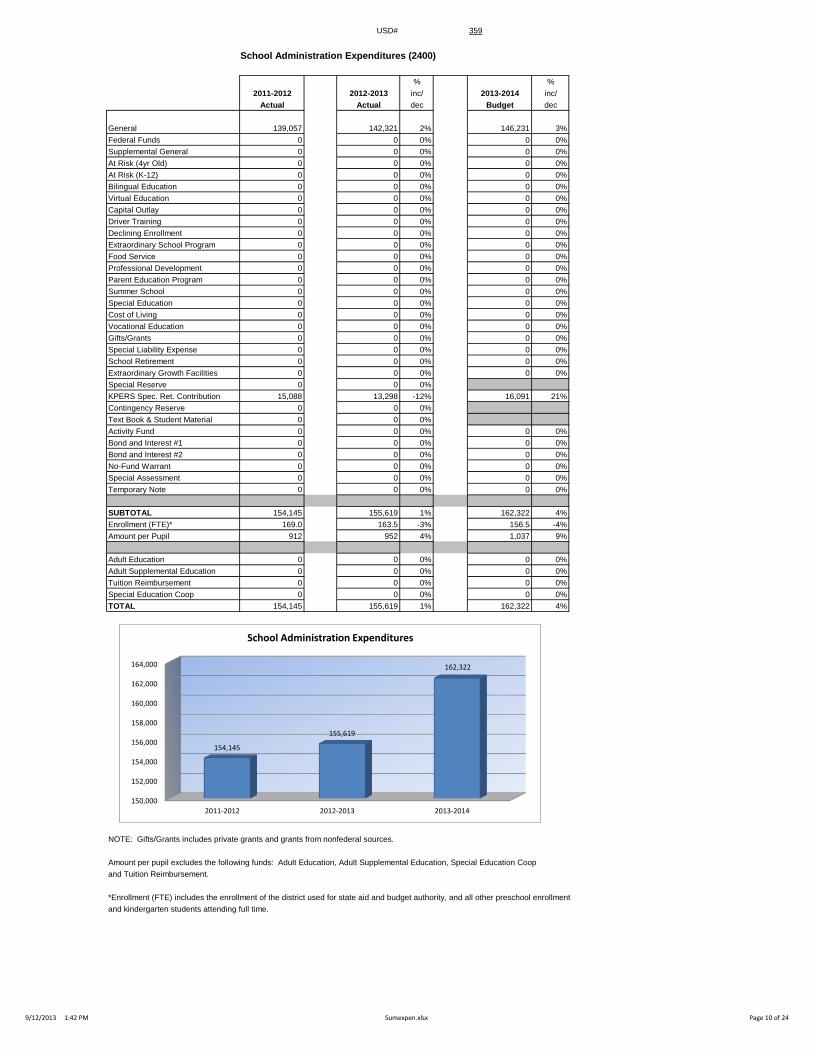
School Administration Expenditures (2400)
% %
2011-2012 2012-2013 inc/ 2013-2014 inc/
Actual Actual dec Budget dec
General 139,057 142,321 2% 146,231 3%
Federal Funds 0 0 0% 0 0%
Supplemental General 0 0 0% 0 0%
At Risk (4yr Old) 0 0 0% 0 0%
At Risk (K-12) 0 0 0% 0 0%
Bilingual Education 0 0 0% 0 0%
Virtual Education 0 0 0% 0 0%
Capital Outlay 0 0 0% 0 0%
Driver Training 0 0 0% 0 0%
Declining Enrollment 0 0 0% 0 0%
Extraordinary School Program 0 0 0% 0 0%
Food Service 0 0 0% 0 0%
Professional Development 0 0 0% 0 0%
Parent Education Program 0 0 0% 0 0%
Summer School 0 0 0% 0 0%
Special Education 0 0 0% 0 0%
Cost of Living 0 0 0% 0 0%
Vocational Education 0 0 0% 0 0%
Gifts/Grants 0 0 0% 0 0%
Special Liability Expense 0 0 0% 0 0%
School Retirement 0 0 0% 0 0%
Extraordinary Growth Facilities 0 0 0% 0 0%
Special Reserve 0 0 0%
KPERS Spec. Ret. Contribution 15,088 13,298 -12% 16,091 21%
Contingency Reserve 0 0 0%
Text Book & Student Material 0 0 0%
Activity Fund 0 0 0% 0 0%
Bond and Interest #1 0 0 0% 0 0%
Bond and Interest #2 0 0 0% 0 0%
No-Fund Warrant 0 0 0% 0 0%
Special Assessment 0 0 0% 0 0%
Temporary Note 0 0 0% 0 0%
SUBTOTAL 154,145 155,619 1% 162,322 4%
Enrollment (FTE)* 169.0 163.5 -3% 156.5 -4%
Amount per Pupil 912 952 4% 1,037 9%
Adult Education 0 0 0% 0 0%
Adult Supplemental Education 0 0 0% 0 0%
Tuition Reimbursement 0 0 0% 0 0%
Special Education Coop 0 0 0% 0 0%
TOTAL 154,145 155,619 1% 162,322 4%
NOTE: Gifts/Grants includes private grants and grants from nonfederal sources.
Amount per pupil excludes the following funds: Adult Education, Adult Supplemental Education, Special Education Coop
and Tuition Reimbursement.
*Enrollment (FTE) includes the enrollment of the district used for state aid and budget authority, and all other preschool enrollment
and kindergarten students attending full time.
150,000
152,000
154,000
156,000
158,000
160,000
162,000
164,000
2011-2012 2012-2013 2013-2014
154,145
155,619
162,322
School Administration Expenditures
9/12/2013 1:42 PM Sumexpen.xlsx Page 10 of 24

USD# 359
Operations and Maintenance Expenditures (2600)
% %
2011-2012 2012-2013 inc/ 2013-2014 inc/
Actual Actual dec Budget dec
General 2,635 3,071 17% 0 -100%
Federal Funds 0 0 0% 0 0%
Supplemental General 198,405 193,840 -2% 203,496 5%
At Risk (4yr Old) 0 0 0% 0 0%
At Risk (K-12) 0 0 0% 0 0%
Bilingual Education 0 0 0% 0 0%
Virtual Education 0 0 0% 0 0%
Capital Outlay 0 0 0% 80,000 0%
Driver Training 0 0 0% 0 0%
Declining Enrollment 0 0 0% 0 0%
Extraordinary School Program 0 0 0% 0 0%
Food Service 14 110 686% 50 -55%
Professional Development 0 0 0% 0 0%
Parent Education Program 0 0 0% 0 0%
Summer School 0 0 0% 0 0%
Special Education 0 0 0% 0 0%
Cost of Living 0 0 0% 0 0%
Vocational Education 0 0 0% 0 0%
Gifts/Grants 0 0 0% 0 0%
Special Liability 0 0 0% 0 0%
School Retirement 0 0 0% 0 0%
Extraordinary Growth Facilities 0 0 0% 0 0%
Special Reserve 0 0 0%
KPERS Spec. Ret. Contribution 7,544 6,818 -10% 8,250 21%
Contingency Reserve 0 0 0%
Text Book & Student Material 0 0 0%
Activity Fund 0 0 0% 0 0%
Bond and Interest #1 0 0 0% 0 0%
Bond and Interest #2 0 0 0% 0 0%
No-Fund Warrant 0 0 0% 0 0%
Special Assessment 0 0 0% 0 0%
Temporary Note 0 0 0% 0 0%
SUBTOTAL 208,598 203,839 -2% 291,796 43%
Enrollment (FTE)* 169.0 163.5 -3% 156.5 -4%
Amount per Pupil 1,234 1,247 1% 1,865 50%
Adult Education 0 0 0% 0 0%
Adult Supplemental Education 0 0 0% 0 0%
Tuition Reimbursement 0 0 0% 0 0%
Special Education Coop 0 0 0% 0 0%
TOTAL 208,598 203,839 -2% 291,796 43%
NOTE: Gifts/Grants includes private grants and grants from nonfederal sources.
Amount per pupil excludes the following funds: Adult Education, Adult Supplemental Education, Special Education Coop
and Tuition Reimbursement.
*Enrollment (FTE) includes the enrollment of the district used for state aid and budget authority, and all other preschool enrollment
and kindergarten students attending full time.
0
50,000
100,000
150,000
200,000
250,000
300,000
2011-2012 2012-2013 2013-2014
208,598 203,839
291,796
Operations and Maintenance Expenditures
9/12/2013 1:42 PM Sumexpen.xlsx Page 11 of 24

USD# 359
Transportation Expenditures (2700)
% %
2011-2012 2012-2013 inc/ 2013-2014 inc/
Actual Actual dec Budget dec
General 87,882 52,787 -40% 0 -100%
Federal Funds 0 0 0% 0 0%
Supplemental General 31,431 55,111 75% 117,520 113%
At Risk (4yr Old) 0 0 0% 0 0%
At Risk (K-12) 0 0 0% 0 0%
Bilingual Education 0 0 0% 0 0%
Virtual Education 0 0 0% 0 0%
Capital Outlay 0 72,614 0% 100,000 38%
Driver Training 0 0 0% 0 0%
Declining Enrollment 0 0 0% 0 0%
Extraordinary School Program 0 0 0% 0 0%
Food Service 0 0 0% 0 0%
Professional Development 0 0 0% 0 0%
Parent Education Program 0 0 0% 0 0%
Summer School 0 0 0% 0 0%
Special Education 0 0 0% 0 0%
Cost of Living 0 0 0% 0 0%
Vocational Education 0 0 0% 0 0%
Gifts/Grants 0 0 0% 0 0%
Special Liability 0 0 0% 0 0%
School Retirement 0 0 0% 0 0%
Extraordinary Growth Facilities 0 0 0% 0 0%
Special Reserve 0 0 0%
KPERS Spec. Ret. Contribution 5,805 4,500 -22% 5,445 21%
Contingency Reserve 0 0 0%
Text Book & Student Material 0 0 0%
Activity Fund 0 0 0%
Bond and Interest #1 0 0 0% 0 0%
Bond and Interest #2 0 0 0% 0 0%
No-Fund Warrant 0 0 0% 0 0%
Special Assessment 0 0 0% 0 0%
Temporary Note 0 0 0% 0 0%
SUBTOTAL 125,118 185,012 48% 222,965 21%
Enrollment (FTE)* 169.0 163.5 -3% 156.5 -4%
Amount per Pupil 740 1,132 53% 1,425 26%
Adult Education 0 0 0% 0 0%
Adult Supplemental Education 0 0 0% 0 0%
Tuition Reimbursement 0 0 0% 0 0%
Special Education Coop 0 0 0% 0 0%
TOTAL 125,118 185,012 48% 222,965 21%
NOTE: Gifts/Grants includes private grants and grants from nonfederal sources.
Amount per pupil excludes the following funds: Adult Education, Adult Supplemental Education, Special Education Coop
and Tuition Reimbursement.
*Enrollment (FTE) includes the enrollment of the district used for state aid and budget authority, and all other preschool enrollment
and kindergarten students attending full time.
0
50,000
100,000
150,000
200,000
250,000
2011-2012 2012-2013 2013-2014
125,118
185,012
222,965
Transportation Expenditures
9/12/2013 1:42 PM Sumexpen.xlsx Page 12 of 24

USD# 359
Food Services Expenditures (3100)
% %
2011-2012 2012-2013 inc/ 2013-2014 inc/
Actual Actual dec Budget dec
General 0 0 0% 0 0%
Federal Funds 0 0 0% 0 0%
Supplemental General 0 0 0% 0 0%
At Risk (4yr Old) 0 0 0% 0 0%
At Risk (K-12) 0 0 0% 0 0%
Bilingual Education 0 0 0% 0 0%
Virtual Education 0 0 0% 0 0%
Capital Outlay 0 0 0% 0 0%
Driver Training 0 0 0% 0 0%
Declining Enrollment 0 0 0% 0 0%
Extraordinary School Program 0 0 0% 0 0%
Food Service 86,326 85,797 -1% 102,134 19%
Professional Development 0 0 0% 0 0%
Parent Education Program 0 0 0% 0 0%
Summer School 0 0 0% 0 0%
Special Education 0 0 0% 0 0%
Cost of Living 0 0 0% 0 0%
Vocational Education 0 0 0% 0 0%
Gifts/Grants 0 0 0% 0 0%
Special Liability 0 0 0% 0 0%
School Retirement 0 0 0% 0 0%
Extraordinary Growth Facilities 0 0 0% 0 0%
Special Reserve 0 0 0%
KPERS Spec. Ret. Contribution 2,996 3,375 13% 4,084 21%
Contingency Reserve 0 0 0%
Text Book & Student Material 0 0 0%
Activity Fund 0 0 0%
Bond and Interest #1 0 0 0% 0 0%
Bond and Interest #2 0 0 0% 0 0%
No-Fund Warrant 0 0 0% 0 0%
Special Assessment 0 0 0% 0 0%
Temporary Note 0 0 0% 0 0%
SUBTOTAL 89,322 89,172 0% 106,218 19%
Enrollment (FTE)* 169.0 163.5 -3% 156.5 -4%
Amount per Pupil 529 545 3% 679 24%
Adult Education 0 0 0% 0 0%
Adult Supplemental Education 0 0 0% 0 0%
Tuition Reimbursement 0 0 0% 0 0%
Special Education Coop 0 0 0% 0 0%
TOTAL 89,322 89,172 0% 106,218 19%
NOTE: Gifts/Grants includes private grants and grants from nonfederal sources.
Amount per pupil excludes the following funds: Adult Education, Adult Supplemental Education, Special Education Coop
and Tuition Reimbursement.
*Enrollment (FTE) includes the enrollment of the district used for state aid and budget authority, and all other preschool enrollment
and kindergarten students attending full time.
80,000
85,000
90,000
95,000
100,000
105,000
110,000
2011-2012 2012-2013 2013-2014
89,322 89,172
106,218
Food Service Expenditures
9/12/2013 1:42 PM Sumexpen.xlsx Page 13 of 24

USD# 359
Other Costs
(2500 & 2900: Other Supplemental Services)
(3300: Community Services Operations)
% %
2011-2012 2012-2013 inc/ 2013-2014 inc/
Actual Actual dec Budget dec
General 35,635 35,565 0% 38,262 8%
Federal Funds 0 0 0% 0 0%
Supplemental General 0 0 0% 0 0%
At Risk (4yr Old) 0 0 0% 0 0%
At Risk (K-12) 0 0 0% 0 0%
Bilingual Education 0 0 0% 0 0%
Virtual Education 0 0 0% 0 0%
Capital Outlay 0 0 0% 5,000 0%
Driver Training 0 0 0% 0 0%
Declining Enrollment 0 0 0% 0 0%
Extraordinary School Program 0 0 0% 0 0%
Food Service 0 0 0% 0 0%
Professional Development 0 0 0% 0 0%
Parent Education Program 0 0 0% 0 0%
Summer School 0 0 0% 0 0%
Special Education 0 0 0% 0 0%
Cost of Living 0 0 0% 0 0%
Vocational Education 0 0 0% 0 0%
Gifts/Grants 0 0 0% 0 0%
Special Liability 0 0 0% 0 0%
School Retirement 0 0 0% 0 0%
Extraordinary Growth Facilities 0 0 0% 0 0%
Special Reserve 0 0 0%
KPERS Spec. Ret. Contribution 2,515 2,318 -8% 2,805 21%
Contingency Reserve 0 0 0%
Text Book & Student Material 0 0 0%
Activity Fund 0 0 0% 0 0%
Bond and Interest #1 0 0 0% 0 0%
Bond and Interest #2 0 0 0% 0 0%
No-Fund Warrant 0 0 0% 0 0%
Special Assessment 0 0 0% 0 0%
Temporary Note 0 0 0% 0 0%
SUBTOTAL 38,150 37,883 -1% 46,067 22%
Enrollment (FTE)* 169.0 163.5 -3% 156.5 -4%
Amount per Pupil 226 232 3% 294 27%
Adult Education 0 0 0% 0 0%
Adult Supplemental Education 0 0 0% 0 0%
Tuition Reimbursement 0 0 0% 0 0%
Special Education Coop 0 0 0% 0 0%
TOTAL 38,150 37,883 -1% 46,067 22%
NOTE: Gifts/Grants includes private grants and grants from nonfederal sources.
Amount per pupil excludes the following funds: Adult Education, Adult Supplemental Education, Special Education Coop
and Tuition Reimbursement.
*Enrollment (FTE) includes the enrollment of the district used for state aid and budget authority, and all other preschool enrollment
and kindergarten students attending full time.
0
5,000
10,000
15,000
20,000
25,000
30,000
35,000
40,000
45,000
50,000
2011-2012 2012-2013 2013-2014
38,150 37,883
46,067
Other Costs
9/12/2013 1:42 PM Sumexpen.xlsx Page 14 of 24

USD# 359
Capital Improvements Expenditures (4000)
% %
2011-2012 2012-2013 inc/ 2013-2014 inc/
Actual Actual dec Budget dec
General 0 0 0% 0 0%
Federal Funds 0 0 0% 0 0%
Supplemental General 0 0 0% 0 0%
At Risk (4yr Old) 0 0 0% 0 0%
At Risk (K-12) 0 0 0% 0 0%
Bilingual Education 0 0 0% 0 0%
Virtual Education 0 0 0% 0 0%
Capital Outlay 0 17,412 0% 155,000 790%
Driver Training 0 0 0% 0 0%
Declining Enrollment 0 0 0% 0 0%
Extraordinary School Program 0 0 0% 0 0%
Food Service 0 0 0% 0 0%
Professional Development 0 0 0% 0 0%
Parent Education Program 0 0 0% 0 0%
Summer School 0 0 0% 0 0%
Special Education 0 0 0% 0 0%
Cost of Living 0 0 0% 0 0%
Vocational Education 0 0 0% 0 0%
Gifts/Grants 0 0 0% 0 0%
Special Liability 0 0 0% 0 0%
School Retirement 0 0 0% 0 0%
Extraordinary Growth Facilities 0 0 0% 0 0%
Special Reserve 0 0 0%
KPERS Spec. Ret. Contribution 0 0 0% 0 0%
Contingency Reserve 0 0 0%
Text Book & Student Material 0 0 0%
Activity Fund 0 0 0% 0 0%
Bond and Interest #1 0 0 0% 0 0%
Bond and Interest #2 0 0 0% 0 0%
No-Fund Warrant 0 0 0% 0 0%
Special Assessment 0 0 0% 0 0%
Temporary Note 0 0 0% 0 0%
SUBTOTAL 0 17,412 0% 155,000 790%
Enrollment (FTE)* 169.0 163.5 -3% 156.5 -4%
Amount per Pupil 0 106 0% 990 830%
Adult Education 0 0 0% 0 0%
Adult Supplemental Education 0 0 0% 0 0%
Tuition Reimbursement 0 0 0% 0 0%
Special Education Coop 0 0 0% 0 0%
TOTAL 0 17,412 0% 155,000 790%
NOTE: Gifts/Grants includes private grants and grants from nonfederal sources.
Amount per pupil excludes the following funds: Adult Education, Adult Supplemental Education, Special Education Coop
and Tuition Reimbursement.
*Enrollment (FTE) includes the enrollment of the district used for state aid and budget authority, and all other preschool enrollment
and kindergarten students attending full time.
0
20,000
40,000
60,000
80,000
100,000
120,000
140,000
160,000
2011-2012 2012-2013 2013-2014
0
17,412
155,000
Capital Improvements (4000)
9/12/2013 1:42 PM Sumexpen.xlsx Page 15 of 24

USD# 359
Debt Services Expenditures (5100)
% %
2011-2012 2012-2013 inc/ 2013-2014 inc/
Actual Actual dec Budget dec
General 0 0 0% 0 0%
Federal Funds 0 0 0% 0 0%
Supplemental General 0 0 0% 0 0%
At Risk (4yr Old) 0 0 0% 0 0%
At Risk (K-12) 0 0 0% 0 0%
Bilingual Education 0 0 0% 0 0%
Virtual Education 0 0 0% 0 0%
Capital Outlay 0 0 0% 0 0%
Driver Training 0 0 0% 0 0%
Declining Enrollment 0 0 0% 0 0%
Extraordinary School Program 0 0 0% 0 0%
Food Service 0 0 0% 0 0%
Professional Development 0 0 0% 0 0%
Parent Education Program 0 0 0% 0 0%
Summer School 0 0 0% 0 0%
Special Education 0 0 0% 0 0%
Cost of Living 0 0 0% 0 0%
Vocational Education 0 0 0% 0 0%
Gifts/Grants 0 0 0% 0 0%
Special Liability 0 0 0% 0 0%
School Retirement 0 0 0% 0 0%
Extraordinary Growth Facilities 0 0 0% 0 0%
Special Reserve 0 0 0%
KPERS Spec. Ret. Contribution 0 0 0% 0 0%
Contingency Reserve 0 0 0%
Text Book & Student Material 0 0 0%
Activity Fund 0 0 0% 0 0%
Bond and Interest #1 0 0 0% 0 0%
Bond and Interest #2 0 0 0% 0 0%
No-Fund Warrant 0 0 0% 0 0%
Special Assessment 0 0 0% 0 0%
Temporary Note 0 0 0% 0 0%
SUBTOTAL 0 0 0% 0 0%
Enrollment (FTE)* 169.0 163.5 -3% 156.5 -4%
Amount per Pupil 0 0 0% 0 0%
Adult Education 0 0 0% 0 0%
Adult Supplemental Education 0 0 0% 0 0%
Tuition Reimbursement 0 0 0% 0 0%
Special Education Coop 0 0 0% 0 0%
TOTAL 0 0 0% 0 0%
NOTE: Gifts/Grants includes private grants and grants from nonfederal sources.
Amount per pupil excludes the following funds: Adult Education, Adult Supplemental Education, Special Education Coop
and Tuition Reimbursement.
*Enrollment (FTE) includes the enrollment of the district used for state aid and budget authority, and all other preschool enrollment
and kindergarten students attending full time.
0
0
0
0
0
1
1
1
1
1
1
2011-2012 2012-2013 2013-2014
0 0 0
Deb Services (5100)
9/12/2013 1:42 PM Sumexpen.xlsx Page 16 of 24

USD# 359
Transfers (5200)
% %
2011-2012 2012-2013 inc/ 2013-2014 inc/
Actual Actual dec Budget dec
General 426,413 457,040 7% 424,293 -7%
Federal Funds 0 0 0% 0 0%
Supplemental General 43,469 34,379 -21% 86,784 152%
At Risk (4yr Old) 0 0 0% 0 0%
At Risk (K-12) 0 0 0% 0 0%
Bilingual Education 0 0 0% 0 0%
Virtual Education 0 0 0% 0 0%
Capital Outlay
Driver Training 0 0 0% 0 0%
Declining Enrollment 0 0 0% 0 0%
Extraordinary School Program 0 0 0% 0 0%
Food Service 0 0 0% 0 0%
Professional Development 0 0 0% 0 0%
Parent Education Program 0 0 0% 0 0%
Summer School 0 0 0% 0 0%
Special Education 0 0 0% 0 0%
Cost of Living 0 0 0% 0 0%
Vocational Education 0 0 0% 0 0%
Gifts/Grants 0 0 0% 0 0%
Special Liability 0 0 0% 0 0%
School Retirement 0 0 0% 0 0%
Extraordinary Growth Facilities 0 0 0% 0 0%
Special Reserve 0 0 0%
KPERS Spec. Ret. Contribution 0 0 0% 0 0%
Contingency Reserve 0 0 0% 0 0%
Text Book & Student Material 0 0 0% 0 0%
Activity Fund 0 0 0% 0 0%
Bond and Interest #1 0 0 0% 0 0%
Bond and Interest #2 0 0 0% 0 0%
No-Fund Warrant 0 0 0% 0 0%
Special Assessment 0 0 0% 0 0%
Temporary Note 0 0 0% 0 0%
SUBTOTAL 469,882 491,419 5% 511,077 4%
Enrollment (FTE)* 169.0 163.5 -3% 156.5 -4%
Amount per Pupil 2,780 3,006 8% 3,266 9%
Adult Education 0 0 0% 0 0%
Adult Supplemental Education 0 0 0% 0 0%
Tuition Reimbursement 0 0 0% 0 0%
Special Education Coop 0 0 0% 0 0%
TOTAL 469,882 491,419 5% 511,077 4%
NOTE: Gifts/Grants includes private grants and grants from nonfederal sources.
Amount per pupil excludes the following funds: Adult Education, Adult Supplemental Education, Special Education Coop
and Tuition Reimbursement.
*Enrollment (FTE) includes the enrollment of the district used for state aid and budget authority, and all other preschool enrollment
and kindergarten students attending full time.
440,000
450,000
460,000
470,000
480,000
490,000
500,000
510,000
520,000
2011-2012 2012-2013 2013-2014
469,882
491,419
511,077
Transfers (5200)
9/12/2013 1:42 PM Sumexpen.xlsx Page 17 of 24

USD# 359
Miscellaneous Information
Unencumbered Cash Balance by Fund
July 1, 2011 July 1, 2012 July 1, 2013
General 0 0 1,380
Federal Funds 0 0 -2,131
Supplemental General 16,313 13,775 45,017
At Risk (4yr Old) 0 0 0
At Risk (K-12) 0 0 0
Bilingual Education 0 0 0
Virtual Education 0 0 0
Capital Outlay 424,472 506,804 476,313
Driver Training 658 0 736
Declining Enrollment 0 0 0
Extraordinary School Program 0 0 0
Food Service 28,176 26,982 28,100
Professional Development 0 0 0
Parent Education Program 0 0 0
Summer School 0 0 0
Special Education 187,438 135,953 99,982
Cost of Living 0 0 0
Vocational Education 0 0 0
Gifts/Grants 57 0 0
Special Liability 0 0 0
School Retirement 0 0 0
Extraordinary Growth Facilities 0 0 0
Special Reserve 0 0 0
KPERS Spec. Ret. Contribution 0 0 0
Contingency Reserve 110,000 110,000 110,000
Text Book & Student Material 46,781 57,828 44,255
Activity Fund 242 2,796 3,693
Bond and Interest #1 0 0 0
Bond and Interest #2 0 0 0
No Fund Warrant 0 0 0
Special Assessment 0 0 0
Temporary Note 0 0 0
SUBTOTAL 814,137 854,138 807,345
Enrollment (FTE)* 169.0 163.5 156.5
Amount per Pupil 4,817 5,224 5,159
Adult Education 0 0 0
Adult Supplemental Education 0 0 0
Tuition Reimbursement 0 0 0
Special Education Coop 0 0 0
TOTAL 814,137 854,138 807,345
NOTE: Gifts/Grants includes private grants and grants from nonfederal sources.
Amount per pupil excludes the following funds: Adult Education, Adult Supplemental Education, Special Education Coop
and Tuition Reimbursement.
*Enrollment (FTE) includes the enrollment of the district used for state aid and budget authority, and all other preschool enrollment
and kindergarten students attending full time.
0
100,000
200,000
300,000
400,000
500,000
600,000
700,000
800,000
900,000
July 1, 2011 July 1, 2012 July 1, 2013
814,137 854,138
807,345
Unencumbered Cash Balances by Fund
9/12/2013 1:42 PM Sumexpen.xlsx Page 18 of 24
USD# 359
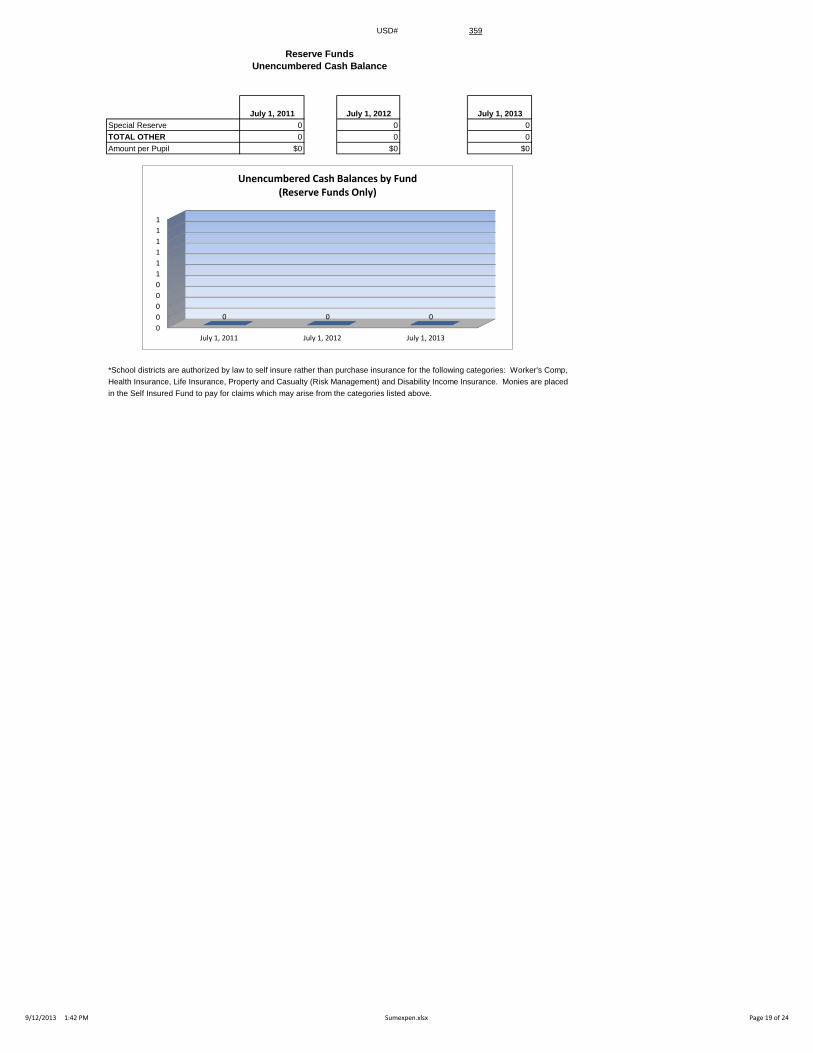
Reserve Funds
Unencumbered Cash Balance
July 1, 2011 July 1, 2012 July 1, 2013
Special Reserve 0 0 0
TOTAL OTHER 0 0 0
Amount per Pupil $0 $0 $0
*School districts are authorized by law to self insure rather than purchase insurance for the following categories: Worker's Comp,
Health Insurance, Life Insurance, Property and Casualty (Risk Management) and Disability Income Insurance. Monies are placed
in the Self Insured Fund to pay for claims which may arise from the categories listed above.
0
0
0
0
0
1
1
1
1
1
1
July 1, 2011 July 1, 2012 July 1, 2013
0 0 0
Unencumbered Cash Balances by Fund (Reserve Funds Only)
9/12/2013 1:42 PM Sumexpen.xlsx Page 19 of 24

USD# 359
2009-2010 2010-2011 % 2011-2012 % 2012-2013 % 2013-2014 %
Actual Actual inc/ Actual inc/ Actual inc/ Budget inc/
dec dec dec dec
Enrollment (FTE)* 177.5 169.9 -4% 168.0 -1% 161.5 -4% 154.5 -4%
Enrollment (FTE)** 179.5 169.9 -5% 169.0 -1% 163.5 -3% 156.5 -4%
Number of Students -
Free Meals 47 34 -28% 43 26% 48 12% 55 15%
Number of Students -
Reduced Meals 15 16 7% 18 13% 16 -11% 24 50%
*FTE for state aid and budget authority purposes for general fund (excludes 4 yr old at-risk).
** FTE includes 9/20 enrollment used for state aid purposes and adding the additional FTE for preschool programs, headstart, and all-day
kindergarten. For example, preschool students attending half days on September 20th would be counted as .5 FTE. Kindergarten
students attending full time every day would be counted as 1.0 FTE.
Enrollment Information
145.0
150.0
155.0
160.0
165.0
170.0
175.0
180.0
2009-2010 2010-2011 2011-2012 2012-2013 2013-2014
179.5
169.9 169.0
163.5
156.5
Enrollment (FTE)** Used for Calculating "Amount per Pupil"
0
10
20
30
40
50
60
2009-2010 2010-2011 2011-2012 2012-2013 2013-2014
47
34
43 48
55
15 16 18 16
24
Low Income Students
Free Meals
Reduced Meals
140.0
145.0
150.0
155.0
160.0
165.0
170.0
175.0
180.0
2009-2010 2010-2011 2011-2012 2012-2013 2013-2014
177.5
169.9 168.0
161.5
154.5
FTE Enrollment for Budget Authority
9/12/2013 1:42 PM Sumexpen.xlsx Page 20 of 24

USD# 359
Miscellaneous Information
Mill Rates by Fund
2011-2012 2012-2013 2013-2014
Actual Actual Budget
General 20.000 20.000 20.000
Supplemental General 21.520 23.040 26.287
Adult Education 0.000 0.000 0.000
Capital Outlay 3.040 2.500 0.000
Declining Enrollment 0.000 0.000 0.000
Cost of Living 0.000 0.000 0.000
Special Liability 0.000 0.000 0.000
School Retirement 0.000 0.000 0.000
Extraordinary Growth Facilities 0.000 0.000 0.000
Bond and Interest #1 0.000 0.000 0.000
Bond and Interest #2 0.000 0.000 0.000
No Fund Warrant 0.000 0.000 0.000
Special Assessment 0.000 0.000 0.000
Temporary Note 0.000 0.000 0.000
TOTAL USD 44.560 45.540 46.287
Historical Museum 0.000 0.000 0.000
Public Library Board 0.000 0.000 0.000
Public Library Brd & Emp Benf 0.000 0.000 0.000
Recreation Commission 2.500 2.500 2.500
Rec Comm Employee Bnfts 0.000 0.000 0.000
TOTAL OTHER 2.500 2.500 2.500
0.000
10.000
20.000
30.000
40.000
50.000
60.000
70.000
80.000
2011-2012 2012-2013 2013-2014
44.560 45.540 46.287
Total USD Mill Rates
General 43%
Supplemental General 57%
2013-14 Miscellaneous Information Mill Rates by Fund (Total USD)
General
Supplemental General
Adult Education
Capital Outlay
Special Liability
School Retirement
Declining Enrollment
Cost of Living
Bond and Interest #1
Bond and Interest #2
Extraordinary Growth Facilities
No Fund Warrant
Special Assessment
Temporary Note
9/12/2013 1:42 PM Sumexpen.xlsx Page 21 of 24
USD# 359
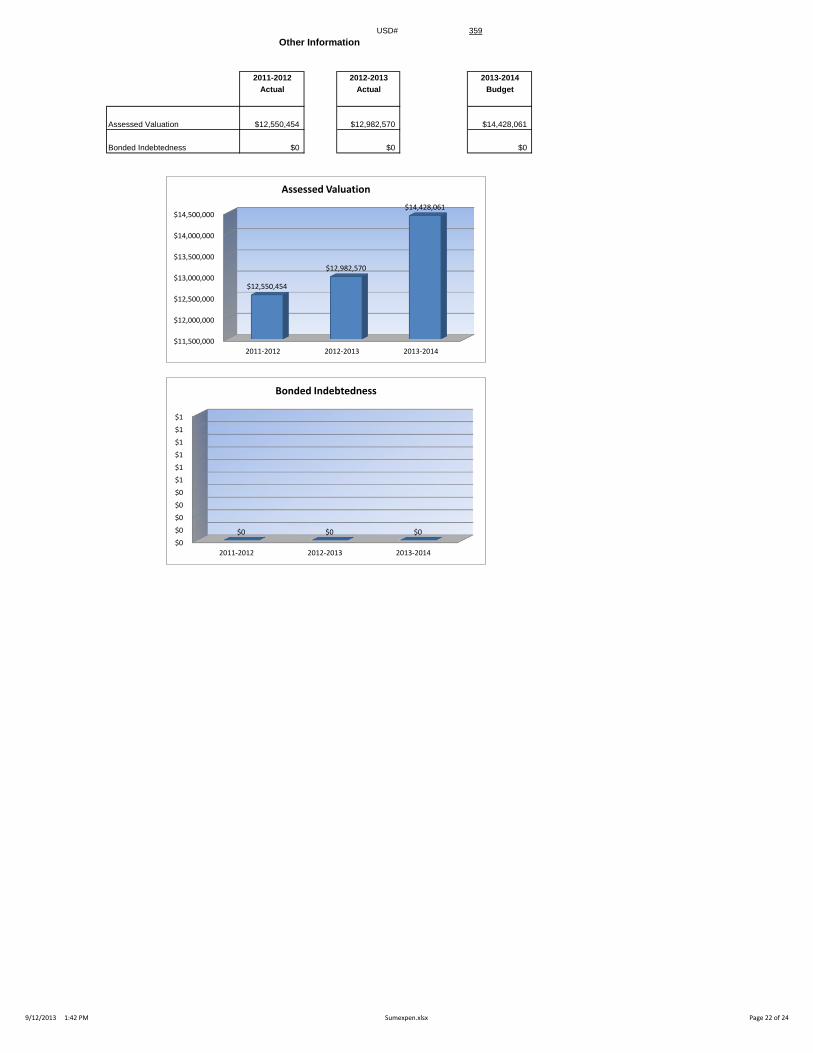
Other Information
2011-2012 2012-2013 2013-2014
Actual Actual Budget
Assessed Valuation $12,550,454 $12,982,570 $14,428,061
Bonded Indebtedness $0 $0 $0
$11,500,000
$12,000,000
$12,500,000
$13,000,000
$13,500,000
$14,000,000
$14,500,000
2011-2012 2012-2013 2013-2014
$12,550,454
$12,982,570
$14,428,061
Assessed Valuation
$0
$0
$0
$0
$0
$1
$1
$1
$1
$1
$1
2011-2012 2012-2013 2013-2014
$0 $0 $0
Bonded Indebtedness
9/12/2013 1:42 PM Sumexpen.xlsx Page 22 of 24

USD 359
2013-14 Estimated Sources of Revenue--2013-14 Estimated
Amount July 1, 2013 State Federal Local July 1, 2014
Fund Budgeted Cash Balance Interest Transfers Other Cash Balance
General 1,603,516 1,380 1,351,040 0 0 251,096 XXXXXXXX
Supplemental General 530,000 45,017 117,984 366,999 XXXXXXXX
Adult Education 0 0 0 0 0 0 0 0
At Risk (4yr Old) 1,000 0 0 0 1,000 0 0
Adult Supplemental Education 0 0 0 0 0 0
At Risk (K-12) 63,204 0 0 0 63,204 0 0
Bilingual Education 0 0 0 0 0 0 0
Virtual Education 0 0 0 0 0 0
Capital Outlay 490,000 476,313 0 740 25,000 13,071 25,124
Driver Training 4,935 736 1,725 0 0 974 1,500 0
Declining Enrollment 0 0 0 0 XXXXXXXX
Extraordinary School Program 0 0 0 0 0 0 0
Food Service 102,184 28,100 644 28,973 0 16,849 27,618 0
Professional Development 0 0 0 0 0 0 0
Parent Education Program 0 0 0 0 0 0 0 0
Summer School 0 0 0 0 0 0 0
Special Education 344,944 99,982 0 0 0 309,833 15,000 79,871
Vocational Education 94,217 0 0 0 0 94,217 0 0
Special Liability Expense Fund 0 0 0 0 0
Special Reserve Fund 0 XXXXXXXX
Gifts and Grants 0 0 0 0
Textbook & Student Materials Revolving 44,255 XXXXXXXX
School Retirement 0 0 0 0 0
Extraordinary Growth Facilities 0 0 0 0 XXXXXXXXX
KPERS Special Retirement Contribution 136,136 0 136,136 XXXXXXXXX
Contingency Reserve 110,000 XXXXXXXXX
Activity Funds 3,693 XXXXXXXXX
Tuition Reimbursement 0 0 0 0 0
Bond and Interest #1 0 0 0 0 0 0 0
Bond and Interest #2 0 0 0 0 0 0 0
No Fund Warrant 0 0 0 0
Special Assessment 0 0 0 0
Temporary Note 0 0 0 0 0
Coop Special Education 0 0 0 0 0 0 0
Federal Funds 50,802 -2,131 xxxxxxxxxxx 52,933 xxxxxxxxxxxx xxxxxxxxxxxx xxxxxxxxxxx 0
Cost of Living 0 0 xxxxxxxxxxx xxxxxxxxxxx xxxxxxxxxxxx 0 0 XXXXXXXXX
SUBTOTAL 3,420,938 807,345 1,607,529 81,906 740 511,077 675,284 104,995
Less Transfers 511,077
TOTAL Budget Expenditures $2,909,861
2011-2012 2012-2013 2013-2014
State Revenues 1,597,290 1,596,441 1,607,529
Federal Revenues 85,702 79,969 81,906
Local Revenues 1,150,480 1,220,646 1,187,101
Total Revenues 2,833,472 2,897,056 2,876,536
Revenues Per Pupil 16,766 17,719 18,380
Sources of Revenue and Proposed Budget for 2013-14
Sources of Revenue - - State, Federal, Local

Intentionally left blank
Related Documents