Introduction Arginine, traditionally considered to be a nutritionally dispensable (nonessential) amino acid, serves multiple functions in addition to its role in protein synthesis (1). It is the precursor of nitric oxide (NO) (2), creatine, agmatine, and other polyamines (3, 4), and is an inter- mediate in the urea cycle. The kidneys are thought to be the main site of net de novo arginine synthesis, which would contribute to the maintenance of whole- body arginine homeostasis (5–10). Despite the potential pathophysiologic significance of altered arginine metabolism in end-stage renal dis- ease (ESRD) (11–13), in which reduced arginine syn- thesis is hypothesized, there are no in vivo studies of the quantitative aspects of arginine and arginine-NO kinetics for this group of patients. However, such information is necessary for the development of safe and effective therapeutic strategies aimed at modulat- ing arginine metabolism and its several functions. Therefore, in this study we have examined plasma kinetics of arginine and assessed the activity of the L-argi- nine–NO pathway in adults with ESRD. The possible effects of hemodialysis on arginine and NO kinetics were also explored. Because maintenance hemodialysis has been thought to be responsible for protein (nitrogen) catabolic stress (14, 15), we also investigated leucine kinetics as an indicator of the dynamic status of whole- body protein metabolism (16). Our findings reveal that at the whole-body level, net de novo arginine synthesis is maintained in ESRD patients, possibly due to an adap- tive increase in citrulline availability and turnover. In addition, NO production in ESRD patients was signifi- cantly increased, when compared with healthy adults, but was apparently not influenced acutely by hemodialysis. Methods Study subjects and dialysis treatment. Eight African-Amer- ican patients, 4 women and 4 men, with ESRD treated by maintenance hemodialysis, were studied. All pa- tients were clinically stable and without intercurrent acute illness. Their clinical characteristics are shown in Table 1. Dialysis was performed 3 times a week during 3-hour sessions, using polysulfone dialyzers. Their urea clearance rate was maintained at ≥ 65%. The Journal of Clinical Investigation | May 2000 | Volume 105 | Number 9 1217 Arginine, citrulline, and nitric oxide metabolism in end-stage renal disease patients Titus Lau, 1 William Owen, 1 Yong Ming Yu, 2 Natan Noviski, 3 Jeremy Lyons, 4,5 David Zurakowski, 6 Rita Tsay, 5 Alfred Ajami, 7 Vernon R. Young, 5 and Leticia Castillo, 4,5 1 Renal Division, Department of Medicine, Brigham and Women’s Hospital, Boston, Massachusetts, USA 2 Shriners Burn Hospital, and 3 Pediatric Department, Massachusetts General Hospital, Boston, Massachusetts, USA 4 Department of Anesthesia, Children’s Hospital, Boston, Massachusetts, USA 5 Laboratory of Human Nutrition and Clinical Research Center, Massachusetts Institute of Technology, Cambridge, Massachusetts, USA 6 Department of Research Computing, Children’s Hospital, Boston, Massachusetts, USA 7 MassTrace Inc., Woburn, Massachusetts, USA Address correspondence to: L. Castillo, Department of Anesthesia, Children’s Hospital, Farley 517, 300 Longwood Avenue, Boston, Massachusetts 02115, USA. Phone: (617) 355-7327; Fax: (617) 734-3863; E-mail: [email protected]. Received for publication April 27, 1999, and accepted in revised form March 7, 2000. The kidneys are thought to be a major site of net de novo arginine synthesis, but the quantitative sta- tus of arginine metabolism and its substrate precursor relationship to nitric oxide (NO) synthesis in end stage renal disease (ESRD) patients have not been characterized. We have investigated kinetic aspects of whole body arginine metabolism in six patients with ESRD. They received two pre- and two post-hemodialysis intravenous tracer infusion studies with L-[guanidino- 15 N 2 ]arginine and L- [ 13 C]leucine during the first study, and L-[5- 13 C]arginine and L-[5- 13 C-ureido,5,5, 2 H 2 ]citrulline dur- ing the second study. Arginine homeostasis in ESRD patients was found to be associated with a lower rate of arginine oxidation, and despite the decrease in renal function, the rate of de novo arginine synthesis appeared to be preserved. Plasma citrulline concentrations and flux were also elevated in these subjects compared with healthy adults. The rate of whole body NO synthesis was increased in the ESRD patients, but apparently not different pre- and post-hemodialysis therapy. The anatomic site(s) responsible for the maintenance of net de novo arginine synthesis and for the elevated NO syn- thesis and its pathophysiological importance in ESRD remain to be established. J. Clin. Invest. 105:1217–1225 (2000).

Welcome message from author
This document is posted to help you gain knowledge. Please leave a comment to let me know what you think about it! Share it to your friends and learn new things together.
Transcript
IntroductionArginine, traditionally considered to be a nutritionallydispensable (nonessential) amino acid, serves multiplefunctions in addition to its role in protein synthesis (1).It is the precursor of nitric oxide (NO) (2), creatine,agmatine, and other polyamines (3, 4), and is an inter-mediate in the urea cycle. The kidneys are thought tobe the main site of net de novo arginine synthesis,which would contribute to the maintenance of whole-body arginine homeostasis (5–10).
Despite the potential pathophysiologic significanceof altered arginine metabolism in end-stage renal dis-ease (ESRD) (11–13), in which reduced arginine syn-thesis is hypothesized, there are no in vivo studies ofthe quantitative aspects of arginine and arginine-NOkinetics for this group of patients. However, suchinformation is necessary for the development of safeand effective therapeutic strategies aimed at modulat-ing arginine metabolism and its several functions.
Therefore, in this study we have examined plasmakinetics of arginine and assessed the activity of the L-argi-nine–NO pathway in adults with ESRD. The possible
effects of hemodialysis on arginine and NO kinetics werealso explored. Because maintenance hemodialysis hasbeen thought to be responsible for protein (nitrogen)catabolic stress (14, 15), we also investigated leucinekinetics as an indicator of the dynamic status of whole-body protein metabolism (16). Our findings reveal thatat the whole-body level, net de novo arginine synthesis ismaintained in ESRD patients, possibly due to an adap-tive increase in citrulline availability and turnover. Inaddition, NO production in ESRD patients was signifi-cantly increased, when compared with healthy adults, butwas apparently not influenced acutely by hemodialysis.
MethodsStudy subjects and dialysis treatment. Eight African-Amer-ican patients, 4 women and 4 men, with ESRD treatedby maintenance hemodialysis, were studied. All pa-tients were clinically stable and without intercurrentacute illness. Their clinical characteristics are shown inTable 1. Dialysis was performed 3 times a week during3-hour sessions, using polysulfone dialyzers. Their ureaclearance rate was maintained at ≥ 65%.
The Journal of Clinical Investigation | May 2000 | Volume 105 | Number 9 1217
Arginine, citrulline, and nitric oxide metabolism in end-stage renal disease patients
Titus Lau,1 William Owen,1 Yong Ming Yu,2 Natan Noviski,3 Jeremy Lyons,4,5
David Zurakowski,6 Rita Tsay,5 Alfred Ajami,7 Vernon R. Young,5 and Leticia Castillo,4,5
1Renal Division, Department of Medicine, Brigham and Women’s Hospital, Boston, Massachusetts, USA
2Shriners Burn Hospital, and 3Pediatric Department, Massachusetts General Hospital, Boston, Massachusetts, USA4Department of Anesthesia, Children’s Hospital, Boston, Massachusetts, USA5Laboratory of Human Nutrition and Clinical Research Center, Massachusetts Institute of Technology, Cambridge, Massachusetts, USA
6Department of Research Computing, Children’s Hospital, Boston, Massachusetts, USA7MassTrace Inc., Woburn, Massachusetts, USA
Address correspondence to: L. Castillo, Department of Anesthesia, Children’s Hospital, Farley 517, 300 Longwood Avenue, Boston, Massachusetts 02115, USA. Phone: (617) 355-7327; Fax: (617) 734-3863; E-mail: [email protected].
Received for publication April 27, 1999, and accepted in revised form March 7, 2000.
The kidneys are thought to be a major site of net de novo arginine synthesis, but the quantitative sta-tus of arginine metabolism and its substrate precursor relationship to nitric oxide (NO) synthesis inend stage renal disease (ESRD) patients have not been characterized. We have investigated kineticaspects of whole body arginine metabolism in six patients with ESRD. They received two pre- and twopost-hemodialysis intravenous tracer infusion studies with L-[guanidino-15N2]arginine and L-[13C]leucine during the first study, and L-[5-13C]arginine and L-[5-13C-ureido,5,5,2H2]citrulline dur-ing the second study. Arginine homeostasis in ESRD patients was found to be associated with a lowerrate of arginine oxidation, and despite the decrease in renal function, the rate of de novo argininesynthesis appeared to be preserved. Plasma citrulline concentrations and flux were also elevated inthese subjects compared with healthy adults. The rate of whole body NO synthesis was increased inthe ESRD patients, but apparently not different pre- and post-hemodialysis therapy. The anatomicsite(s) responsible for the maintenance of net de novo arginine synthesis and for the elevated NO syn-thesis and its pathophysiological importance in ESRD remain to be established.
J. Clin. Invest. 105:1217–1225 (2000).
For further evaluation of the results in this experi-ment, we refer to studies carried out previously in ourlaboratories in a control population of healthy sub-jects, using a similar tracer protocol (17, 18; and L.Castillo et al., unpublished data). These controlsincluded 12 healthy adults (age 21 ± 3 years; weight77.6 ± 19 kg); 6 subjects were studied for determina-tion of arginine homeostasis (17), and the other 6were used in a study aimed to determine the rates ofNO synthesis (18). There were some differences inexperimental design between this study and our earli-er studies in healthy subjects, as discussed below.
Materials. L-[guanidino-15N2]arginine (99 atom %), L-[5-13C]arginine (99 atom %), L-[5-13C-ureido,5,5,2H2]cit-rulline (99 atom %), L-[5-13C]glutamic acid (99 atom %),and L-[1-13C]leucine (99 atom %) were purchased fromMassTrace Inc. (Woburn, Massachusetts, USA).NaH13CO3 (95 atom %) was purchased from Cam-bridge Isotopes (Andover, Massachusetts, USA).
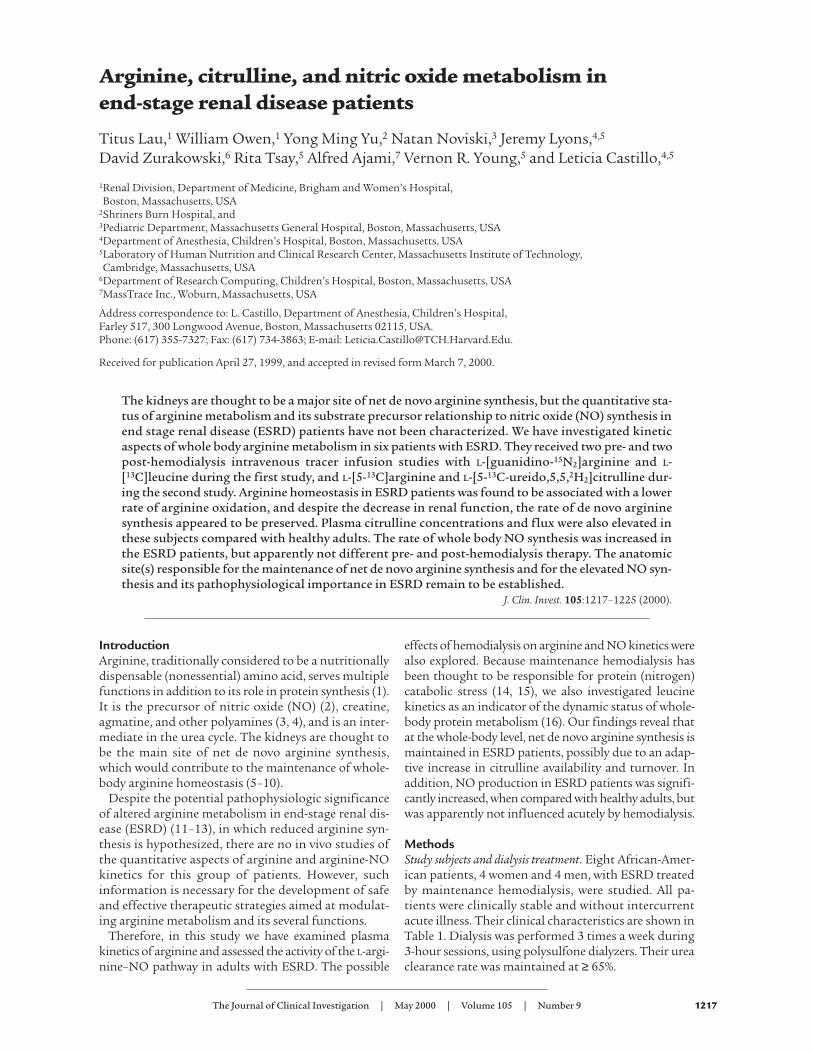
Study protocol. The study protocol was approved bythe Human Studies Committee and was conducted atthe Clinical Research Center (CRC), Brigham andWomen’s Hospital, Boston, Massachusetts, USA.After a description of the studies and the possiblerisks, the patients gave their written consent to pro-ceed. No dietary modifications were undertaken inthis study, with patients given their usual diets,intended to supply adequate intake of protein andenergy. The overall experimental design is shown inFigure 1, and an outline of the tracer infusion stud-ies are depicted in Figure 2. Six patients received 4tracer infusion studies of 8 hours each. Two otherpatients received 2 infusion studies for determinationof H13CO3 recovery from an infusion of L-[5-13C]glu-tamic acid. On the day of the tracer infusion study,dietary intake was recorded. Patients were given theirevening meal at 1700 hours (Figure 2a), and the trac-er infusion study began at 2200 hours. Blood draw-ings for plasma isotopic enrichment during the post-absorptive steady state were obtained every 20minutes from 0100 hours to 0200 hours. The tracer
infusion study continued, and at 0400 hours thepatients received a breakfast designed to provideabout 1/3 of their daily dietary intake. Actual intakeswere recorded and estimates of arginine and leucineintakes were made for that feeding period, duringwhich blood and expired air samples were collected asfollows. For purposes of estimating fed-state arginineand leucine kinetics, we assumed that the equivalentof 1/3 of the meal was absorbed during each hour.The tracer infusion study was stopped at 0600 hours,and the patients then received their conventionalhemodialysis treatment. Once hemodialysis was com-pleted, the patients returned to the CRC, and at 1200hours a post-hemodialysis infusion study was begun(Figure 2b) that lasted for 8 hours. Patients receivedlunch at the beginning of this tracer study, but did
1218 The Journal of Clinical Investigation | May 2000 | Volume 105 | Number 9
Figure 1Schematic outline of the time and order of the 4 tracer study protocols for ESRD patients. In addition, a pilot study with 2 patients wasundertaken to determine the recovery of 13CO2 in expired air after L-[5-13C]glutamic acid infusion.
Figure 2 Schematic representation of the pre- (a) and post-hemodialysis (b)tracer infusion studies including times of sampling and meals.
not consume additional food until the tracer studywas terminated. Blood drawings for isotopic enrich-ment during this fed/post-hemodialysis state wereobtained every 20 minutes from 1500 hours to 1600hours. Again we assumed, for purposes of approxi-mating leucine and arginine absorption during thissampling period, that absorption was equivalent to1/4 of the total amount consumed at lunch. The trac-er infusion study was continued until 2000 hours.From 1900 hours to 2000 hours blood samples werecollected to measure isotopic enrichment during thepost-absorptive/post-hemodialysis period, for com-parison with the equivalent predialysis phase (i.e.,0100–0200 hours).
Details of the procedures followed during the infu-sion studies have been described (18–22). Briefly, a 20-gauge antecubital angiocatheter was used for tracerinfusion, and blood was collected through a secondangiocatheter placed in a retrograde fashion in a dor-sal hand vein. The hand was placed in a custom-madewarming box at 68°C for ≥ 20 minutes before collec-tion of samples. Isotope tracers were infused by meansof a calibrated syringe pump (Harvard Apparatus Co.,South Natick, Massachusetts, USA).
For the 6 patients in the main study, the followingcombinations of isotopes were given: During the firsttracer day (Day 1 in Figure 1) the patients received(both pre- and post-hemodialysis) a primed, constant,intravenous infusion of L-[guanidino-15N2]arginineand L-[1-13C]leucine, at known rates of 5 µmol/kg(prime infusion) and 5 µmol/kg per hour (constantinfusion), and 4 µmol/kg (prime infusion) and 4µmol/kg per hour (constant infusion). During thesecond phase (day 3 in Figure 1), carried out 48 hourslater, the patients received (pre- and post-hemodialy-sis) primed, constant, intravenous infusions of L-[13C-ureido,5,5,2H2]citrulline and L-[5-13C]arginine atknown rates of about 1 µmol/kg and 1 µmol/kg perhour; and 5 µmol/kg and 5 µmol/kg per hour, respec-tively (prime and constant infusions). With thesecombinations of tracers we aimed to determine (a)plasma fluxes of arginine, citrulline, and leucine, andoxidation rates of arginine and leucine; (b) net rate ofde novo arginine synthesis, by measurement of con-
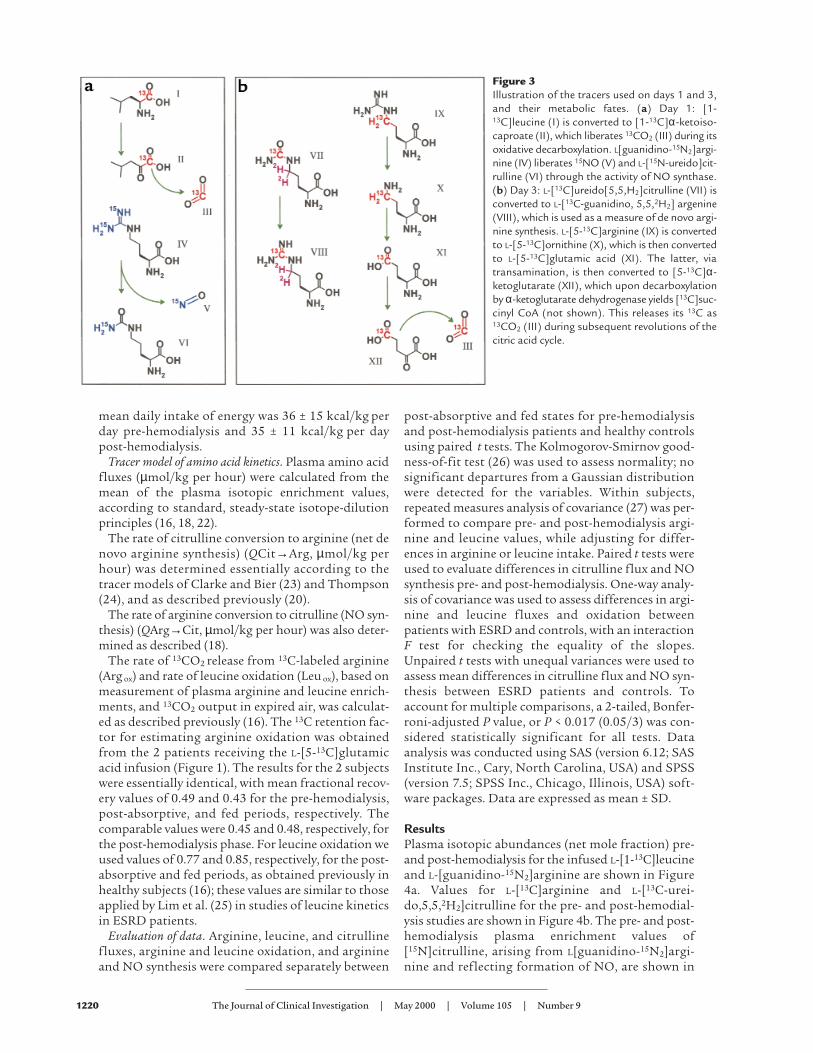
version of [13C-ureido,5,5,2H2]citrulline to [13C-guani-dino,5,5,2H2]arginine (19); (c) rates of NO production,as determined by the stoichiometric reaction involv-ing conversion of [15N2]arginine to [15N]citrulline(18). The relationships between the tracers used onday 1 and day 3 and their metabolic derivatives aredepicted in Figure 3, a and b, respectively.
The rate of arginine oxidation was determined fromthe appearance of 13C in expired air. However, not all ofthe 13C that leaves the arginine pool due to oxidationof arginine to form ornithine and then glutamic acidappears in the expired air. To correct for total 13C reten-tion, 2 patients received, pre- and post-hemodialysis, aprimed, constant intravenous infusion of L-[5-13C]glu-tamate (1 µmol/kg prime infusion and 1 µmol/kg perhour continuous infusion).
Blood and breath collection and analyses. Blood and breathsamples were obtained at time 0 and at 180, 200, 220,240, and then at 420, 440, 460, and 480 minutes duringeach tracer study, for determination of plasma aminoacid concentrations, isotopic enrichment of the aminoacid tracers, and 13CO2 enrichment in expired breathduring the post-absorptive and fed periods (Figure 2)respectively, all as described previously (16, 19, 22).
Indirect calorimetry. Carbon dioxide production(VCO2) and oxygen consumption (VO2) rates weredetermined with the aid of an indirect calorimeter(DeltaTrac; SensorMedics Corp., Anaheim, California,USA), as described previously (16). Six measurements(3 during the post-absorptive state and 3 during thefed states, pre- and post-hemodialysis), were obtainedover the 8-hour tracer infusion period. The systemwas calibrated using a standard gas sample providedby the manufacturer (96% O2 and 4% CO2).
Diet. No dietary manipulations were conducted inthis study, and before the tracer studies no restric-tions were required of the patients. They were offeredadequate protein and energy intakes in the form ofmixed meals; not all food given was consumed, butrecords of leavings were taken. Estimates of the totalintake of arginine and leucine during the tracer stud-ies are given in Results. The daily intake (mean ± SD)of protein was 1.1 ± 0.4 g/kg per day pre-hemodialysisand 1.5 ± 0.5 g/kg per day post-hemodialysis. The
The Journal of Clinical Investigation | May 2000 | Volume 105 | Number 9 1219
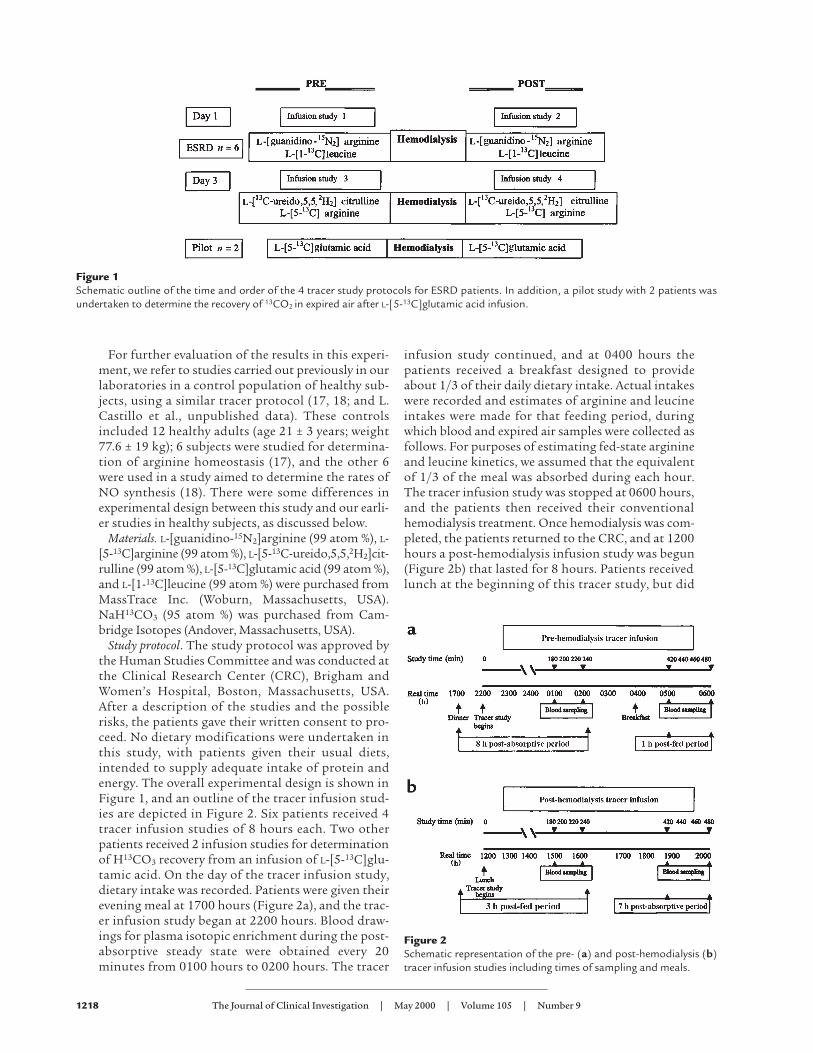
Table 1Clinical characteristics of patients with ESRD studied for arginine metabolism
Patient initial diagnosis Age/sex WeightA Venous pH TCO2B Serum
Number (years) (kg) albuminC
1 Hypertension 64/M 62 7.42 33 3.72 Hypertension 46/M 76 7.4 26 3.53 Focal glomerulosclerosis 31/M 58 7.42 36 4.14 Cryptogenic 62/F 76 7.41 30 4.05 Hypertension 68/F 46 7.37 37 4.16 Hypertension 68/F 79 7.39 34 4.67 Hypertension 73/M 75 7.39 31 3.78 Hypertension 68/F 72 7.40 26 4.1
Mean ± SD 53.5 ± 14 68 ± 10 7.40 ± 0.01 31.6 ± 3.9 3.9 ± 0.3
APre-dialysis. B Total CO2 (mmol/L). Cg/dL.
mean daily intake of energy was 36 ± 15 kcal/kg perday pre-hemodialysis and 35 ± 11 kcal/kg per daypost-hemodialysis.
Tracer model of amino acid kinetics. Plasma amino acidfluxes (µmol/kg per hour) were calculated from themean of the plasma isotopic enrichment values,according to standard, steady-state isotope-dilutionprinciples (16, 18, 22).
The rate of citrulline conversion to arginine (net denovo arginine synthesis) (QCit→Arg, µmol/kg perhour) was determined essentially according to thetracer models of Clarke and Bier (23) and Thompson(24), and as described previously (20).
The rate of arginine conversion to citrulline (NO syn-thesis) (QArg→Cit, µmol/kg per hour) was also deter-mined as described (18).
The rate of 13CO2 release from 13C-labeled arginine(Arg ox) and rate of leucine oxidation (Leu ox), based onmeasurement of plasma arginine and leucine enrich-ments, and 13CO2 output in expired air, was calculat-ed as described previously (16). The 13C retention fac-tor for estimating arginine oxidation was obtainedfrom the 2 patients receiving the L-[5-13C]glutamicacid infusion (Figure 1). The results for the 2 subjectswere essentially identical, with mean fractional recov-ery values of 0.49 and 0.43 for the pre-hemodialysis,post-absorptive, and fed periods, respectively. Thecomparable values were 0.45 and 0.48, respectively, forthe post-hemodialysis phase. For leucine oxidation weused values of 0.77 and 0.85, respectively, for the post-absorptive and fed periods, as obtained previously inhealthy subjects (16); these values are similar to thoseapplied by Lim et al. (25) in studies of leucine kineticsin ESRD patients.
Evaluation of data. Arginine, leucine, and citrullinefluxes, arginine and leucine oxidation, and arginineand NO synthesis were compared separately between
post-absorptive and fed states for pre-hemodialysisand post-hemodialysis patients and healthy controlsusing paired t tests. The Kolmogorov-Smirnov good-ness-of-fit test (26) was used to assess normality; nosignificant departures from a Gaussian distributionwere detected for the variables. Within subjects,repeated measures analysis of covariance (27) was per-formed to compare pre- and post-hemodialysis argi-nine and leucine values, while adjusting for differ-ences in arginine or leucine intake. Paired t tests wereused to evaluate differences in citrulline flux and NOsynthesis pre- and post-hemodialysis. One-way analy-sis of covariance was used to assess differences in argi-nine and leucine fluxes and oxidation betweenpatients with ESRD and controls, with an interactionF test for checking the equality of the slopes.Unpaired t tests with unequal variances were used toassess mean differences in citrulline flux and NO syn-thesis between ESRD patients and controls. Toaccount for multiple comparisons, a 2-tailed, Bonfer-roni-adjusted P value, or P < 0.017 (0.05/3) was con-sidered statistically significant for all tests. Dataanalysis was conducted using SAS (version 6.12; SASInstitute Inc., Cary, North Carolina, USA) and SPSS(version 7.5; SPSS Inc., Chicago, Illinois, USA) soft-ware packages. Data are expressed as mean ± SD.
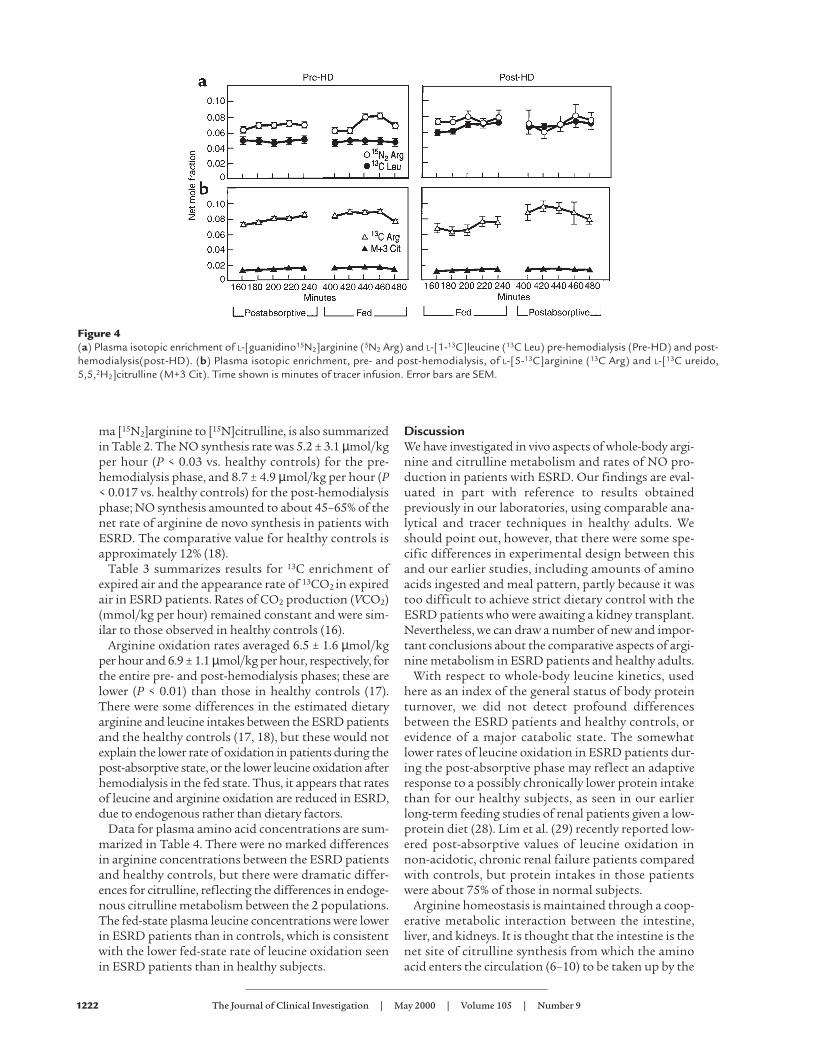
ResultsPlasma isotopic abundances (net mole fraction) pre-and post-hemodialysis for the infused L-[1-13C]leucineand L-[guanidino-15N2]arginine are shown in Figure4a. Values for L-[13C]arginine and L-[13C-urei-do,5,5,2H2]citrulline for the pre- and post-hemodial-ysis studies are shown in Figure 4b. The pre- and post-hemodialysis plasma enrichment values of[15N]citrulline, arising from L[guanidino-15N2]argi-nine and reflecting formation of NO, are shown in
1220 The Journal of Clinical Investigation | May 2000 | Volume 105 | Number 9
Figure 3Illustration of the tracers used on days 1 and 3,and their metabolic fates. (a) Day 1: [1-13C]leucine (I) is converted to [1-13C]α-ketoiso-caproate (II), which liberates 13CO2 (III) during itsoxidative decarboxylation. L[guanidino-15N2]argi-nine (IV) liberates 15NO (V) and L-[15N-ureido]cit-rulline (VI) through the activity of NO synthase.(b) Day 3: L-[13C]ureido[5,5,H2]citrulline (VII) isconverted to L-[13C-guanidino, 5,5,2H2] argenine(VIII), which is used as a measure of de novo argi-nine synthesis. L-[5-13C]arginine (IX) is convertedto L-[5-13C]ornithine (X), which is then convertedto L-[5-13C]glutamic acid (XI). The latter, viatransamination, is then converted to [5-13C]α-ketoglutarate (XII), which upon decarboxylationby α-ketoglutarate dehydrogenase yields [13C]suc-cinyl CoA (not shown). This releases its 13C as13CO2 (III) during subsequent revolutions of thecitric acid cycle.
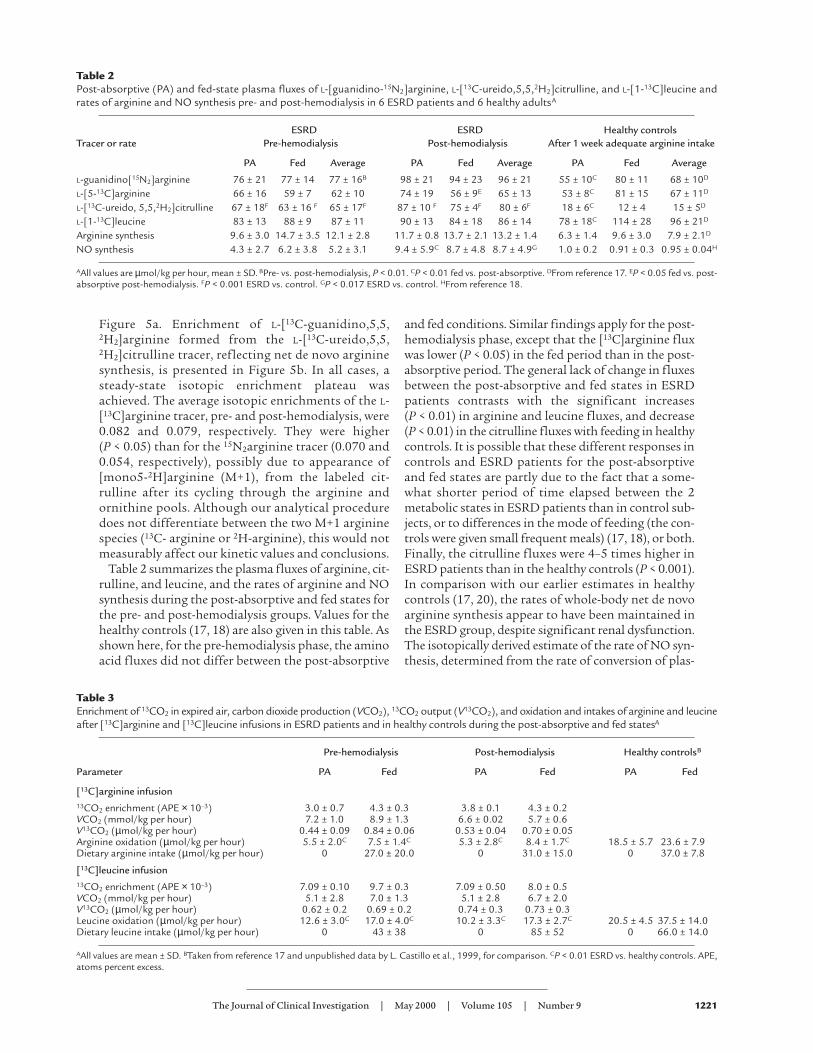
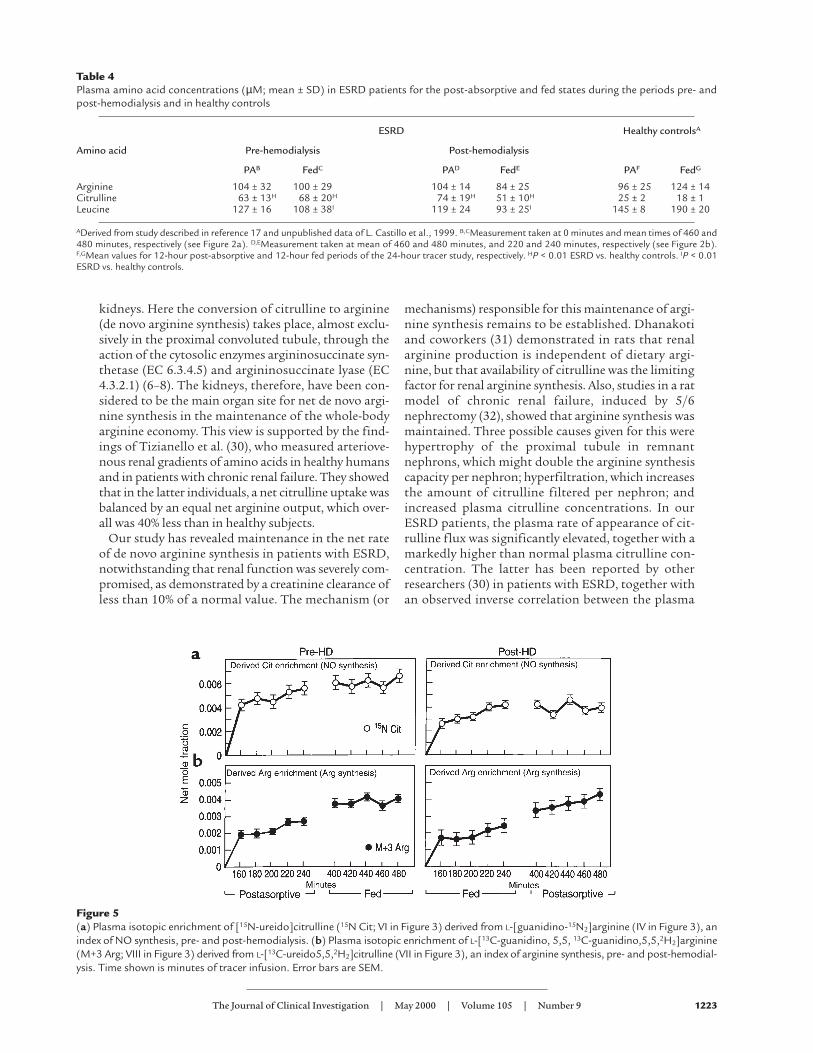
Figure 5a. Enrichment of L-[13C-guanidino,5,5,2H2]arginine formed from the L-[13C-ureido,5,5,2H2]citrulline tracer, reflecting net de novo argininesynthesis, is presented in Figure 5b. In all cases, asteady-state isotopic enrichment plateau wasachieved. The average isotopic enrichments of the L-[13C]arginine tracer, pre- and post-hemodialysis, were0.082 and 0.079, respectively. They were higher (P < 0.05) than for the 15N2arginine tracer (0.070 and0.054, respectively), possibly due to appearance of[mono5-2H]arginine (M+1), from the labeled cit-rulline after its cycling through the arginine andornithine pools. Although our analytical proceduredoes not differentiate between the two M+1 argininespecies (13C- arginine or 2H-arginine), this would notmeasurably affect our kinetic values and conclusions.
Table 2 summarizes the plasma fluxes of arginine, cit-rulline, and leucine, and the rates of arginine and NOsynthesis during the post-absorptive and fed states forthe pre- and post-hemodialysis groups. Values for thehealthy controls (17, 18) are also given in this table. Asshown here, for the pre-hemodialysis phase, the aminoacid fluxes did not differ between the post-absorptive
and fed conditions. Similar findings apply for the post-hemodialysis phase, except that the [13C]arginine fluxwas lower (P < 0.05) in the fed period than in the post-absorptive period. The general lack of change in fluxesbetween the post-absorptive and fed states in ESRDpatients contrasts with the significant increases (P < 0.01) in arginine and leucine fluxes, and decrease(P < 0.01) in the citrulline fluxes with feeding in healthycontrols. It is possible that these different responses incontrols and ESRD patients for the post-absorptiveand fed states are partly due to the fact that a some-what shorter period of time elapsed between the 2metabolic states in ESRD patients than in control sub-jects, or to differences in the mode of feeding (the con-trols were given small frequent meals) (17, 18), or both.Finally, the citrulline fluxes were 4–5 times higher inESRD patients than in the healthy controls (P < 0.001).In comparison with our earlier estimates in healthycontrols (17, 20), the rates of whole-body net de novoarginine synthesis appear to have been maintained inthe ESRD group, despite significant renal dysfunction.The isotopically derived estimate of the rate of NO syn-thesis, determined from the rate of conversion of plas-
The Journal of Clinical Investigation | May 2000 | Volume 105 | Number 9 1221
Table 2Post-absorptive (PA) and fed-state plasma fluxes of L-[guanidino-15N2]arginine, L-[13C-ureido,5,5,2H2]citrulline, and L-[1-13C]leucine andrates of arginine and NO synthesis pre- and post-hemodialysis in 6 ESRD patients and 6 healthy adultsA
ESRD ESRD Healthy controlsTracer or rate Pre-hemodialysis Post-hemodialysis After 1 week adequate arginine intake
PA Fed Average PA Fed Average PA Fed Average
L-guanidino[15N2]arginine 76 ± 21 77 ± 14 77 ± 16B 98 ± 21 94 ± 23 96 ± 21 55 ± 10C 80 ± 11 68 ± 10D
L-[5-13C]arginine 66 ± 16 59 ± 7 62 ± 10 74 ± 19 56 ± 9E 65 ± 13 53 ± 8C 81 ± 15 67 ± 11D
L-[13C-ureido, 5,5,2H2]citrulline 67 ± 18F 63 ± 16 F 65 ± 17F 87 ± 10 F 75 ± 4F 80 ± 6F 18 ± 6C 12 ± 4 15 ± 5D
L-[1-13C]leucine 83 ± 13 88 ± 9 87 ± 11 90 ± 13 84 ± 18 86 ± 14 78 ± 18C 114 ± 28 96 ± 21D
Arginine synthesis 9.6 ± 3.0 14.7 ± 3.5 12.1 ± 2.8 11.7 ± 0.8 13.7 ± 2.1 13.2 ± 1.4 6.3 ± 1.4 9.6 ± 3.0 7.9 ± 2.1D
NO synthesis 4.3 ± 2.7 6.2 ± 3.8 5.2 ± 3.1 9.4 ± 5.9C 8.7 ± 4.8 8.7 ± 4.9G 1.0 ± 0.2 0.91 ± 0.3 0.95 ± 0.04H
AAll values are µmol/kg per hour, mean ± SD. BPre- vs. post-hemodialysis, P < 0.01. CP < 0.01 fed vs. post-absorptive. DFrom reference 17. EP < 0.05 fed vs. post-absorptive post-hemodialysis. FP < 0.001 ESRD vs. control. GP < 0.017 ESRD vs. control. HFrom reference 18.
Table 3Enrichment of 13CO2 in expired air, carbon dioxide production (VCO2), 13CO2 output (V13CO2), and oxidation and intakes of arginine and leucineafter [13C]arginine and [13C]leucine infusions in ESRD patients and in healthy controls during the post-absorptive and fed statesA
Pre-hemodialysis Post-hemodialysis Healthy controlsB
Parameter PA Fed PA Fed PA Fed
[13C]arginine infusion13CO2 enrichment (APE × 10–3) 3.0 ± 0.7 4.3 ± 0.3 3.8 ± 0.1 4.3 ± 0.2VCO2 (mmol/kg per hour) 7.2 ± 1.0 8.9 ± 1.3 6.6 ± 0.02 5.7 ± 0.6V13CO2 (µmol/kg per hour) 0.44 ± 0.09 0.84 ± 0.06 0.53 ± 0.04 0.70 ± 0.05Arginine oxidation (µmol/kg per hour) 5.5 ± 2.0C 7.5 ± 1.4C 5.3 ± 2.8C 8.4 ± 1.7C 18.5 ± 5.7 23.6 ± 7.9Dietary arginine intake (µmol/kg per hour) 0 27.0 ± 20.0 0 31.0 ± 15.0 0 37.0 ± 7.8
[13C]leucine infusion13CO2 enrichment (APE × 10–3) 7.09 ± 0.10 9.7 ± 0.3 7.09 ± 0.50 8.0 ± 0.5VCO2 (mmol/kg per hour) 5.1 ± 2.8 7.0 ± 1.3 5.1 ± 2.8 6.7 ± 2.0V13CO2 (µmol/kg per hour) 0.62 ± 0.2 0.69 ± 0.2 0.74 ± 0.3 0.73 ± 0.3Leucine oxidation (µmol/kg per hour) 12.6 ± 3.0C 17.0 ± 4.0C 10.2 ± 3.3C 17.3 ± 2.7C 20.5 ± 4.5 37.5 ± 14.0Dietary leucine intake (µmol/kg per hour) 0 43 ± 38 0 85 ± 52 0 66.0 ± 14.0
AAll values are mean ± SD. BTaken from reference 17 and unpublished data by L. Castillo et al., 1999, for comparison. CP < 0.01 ESRD vs. healthy controls. APE,atoms percent excess.
ma [15N2]arginine to [15N]citrulline, is also summarizedin Table 2. The NO synthesis rate was 5.2 ± 3.1 µmol/kgper hour (P < 0.03 vs. healthy controls) for the pre-hemodialysis phase, and 8.7 ± 4.9 µmol/kg per hour (P< 0.017 vs. healthy controls) for the post-hemodialysisphase; NO synthesis amounted to about 45–65% of thenet rate of arginine de novo synthesis in patients withESRD. The comparative value for healthy controls isapproximately 12% (18).
Table 3 summarizes results for 13C enrichment ofexpired air and the appearance rate of 13CO2 in expiredair in ESRD patients. Rates of CO2 production (VCO2)(mmol/kg per hour) remained constant and were sim-ilar to those observed in healthy controls (16).
Arginine oxidation rates averaged 6.5 ± 1.6 µmol/kgper hour and 6.9 ± 1.1 µmol/kg per hour, respectively, forthe entire pre- and post-hemodialysis phases; these arelower (P < 0.01) than those in healthy controls (17).There were some differences in the estimated dietaryarginine and leucine intakes between the ESRD patientsand the healthy controls (17, 18), but these would notexplain the lower rate of oxidation in patients during thepost-absorptive state, or the lower leucine oxidation afterhemodialysis in the fed state. Thus, it appears that ratesof leucine and arginine oxidation are reduced in ESRD,due to endogenous rather than dietary factors.
Data for plasma amino acid concentrations are sum-marized in Table 4. There were no marked differencesin arginine concentrations between the ESRD patientsand healthy controls, but there were dramatic differ-ences for citrulline, reflecting the differences in endoge-nous citrulline metabolism between the 2 populations.The fed-state plasma leucine concentrations were lowerin ESRD patients than in controls, which is consistentwith the lower fed-state rate of leucine oxidation seenin ESRD patients than in healthy subjects.
DiscussionWe have investigated in vivo aspects of whole-body argi-nine and citrulline metabolism and rates of NO pro-duction in patients with ESRD. Our findings are eval-uated in part with reference to results obtainedpreviously in our laboratories, using comparable ana-lytical and tracer techniques in healthy adults. Weshould point out, however, that there were some spe-cific differences in experimental design between thisand our earlier studies, including amounts of aminoacids ingested and meal pattern, partly because it wastoo difficult to achieve strict dietary control with theESRD patients who were awaiting a kidney transplant.Nevertheless, we can draw a number of new and impor-tant conclusions about the comparative aspects of argi-nine metabolism in ESRD patients and healthy adults.
With respect to whole-body leucine kinetics, usedhere as an index of the general status of body proteinturnover, we did not detect profound differencesbetween the ESRD patients and healthy controls, orevidence of a major catabolic state. The somewhatlower rates of leucine oxidation in ESRD patients dur-ing the post-absorptive phase may reflect an adaptiveresponse to a possibly chronically lower protein intakethan for our healthy subjects, as seen in our earlierlong-term feeding studies of renal patients given a low-protein diet (28). Lim et al. (29) recently reported low-ered post-absorptive values of leucine oxidation innon-acidotic, chronic renal failure patients comparedwith controls, but protein intakes in those patientswere about 75% of those in normal subjects.
Arginine homeostasis is maintained through a coop-erative metabolic interaction between the intestine,liver, and kidneys. It is thought that the intestine is thenet site of citrulline synthesis from which the aminoacid enters the circulation (6–10) to be taken up by the
1222 The Journal of Clinical Investigation | May 2000 | Volume 105 | Number 9
Figure 4 (a) Plasma isotopic enrichment of L-[guanidino15N2]arginine (5N2 Arg) and L-[1-13C]leucine (13C Leu) pre-hemodialysis (Pre-HD) and post-hemodialysis(post-HD). (b) Plasma isotopic enrichment, pre- and post-hemodialysis, of L-[5-13C]arginine (13C Arg) and L-[13C ureido,5,5,2H2]citrulline (M+3 Cit). Time shown is minutes of tracer infusion. Error bars are SEM.
kidneys. Here the conversion of citrulline to arginine(de novo arginine synthesis) takes place, almost exclu-sively in the proximal convoluted tubule, through theaction of the cytosolic enzymes argininosuccinate syn-thetase (EC 6.3.4.5) and argininosuccinate lyase (EC4.3.2.1) (6–8). The kidneys, therefore, have been con-sidered to be the main organ site for net de novo argi-nine synthesis in the maintenance of the whole-bodyarginine economy. This view is supported by the find-ings of Tizianello et al. (30), who measured arteriove-nous renal gradients of amino acids in healthy humansand in patients with chronic renal failure. They showedthat in the latter individuals, a net citrulline uptake wasbalanced by an equal net arginine output, which over-all was 40% less than in healthy subjects.
Our study has revealed maintenance in the net rateof de novo arginine synthesis in patients with ESRD,notwithstanding that renal function was severely com-promised, as demonstrated by a creatinine clearance ofless than 10% of a normal value. The mechanism (or
mechanisms) responsible for this maintenance of argi-nine synthesis remains to be established. Dhanakotiand coworkers (31) demonstrated in rats that renalarginine production is independent of dietary argi-nine, but that availability of citrulline was the limitingfactor for renal arginine synthesis. Also, studies in a ratmodel of chronic renal failure, induced by 5/6nephrectomy (32), showed that arginine synthesis wasmaintained. Three possible causes given for this werehypertrophy of the proximal tubule in remnantnephrons, which might double the arginine synthesiscapacity per nephron; hyperfiltration, which increasesthe amount of citrulline filtered per nephron; andincreased plasma citrulline concentrations. In ourESRD patients, the plasma rate of appearance of cit-rulline flux was significantly elevated, together with amarkedly higher than normal plasma citrulline con-centration. The latter has been reported by otherresearchers (30) in patients with ESRD, together withan observed inverse correlation between the plasma
The Journal of Clinical Investigation | May 2000 | Volume 105 | Number 9 1223
Table 4Plasma amino acid concentrations (µM; mean ± SD) in ESRD patients for the post-absorptive and fed states during the periods pre- andpost-hemodialysis and in healthy controls
ESRD Healthy controlsA
Amino acid Pre-hemodialysis Post-hemodialysis
PAB FedC PAD FedE PAF FedG
Arginine 104 ± 32 100 ± 29 104 ± 14 84 ± 25 96 ± 25 124 ± 14Citrulline 63 ± 13H 68 ± 20H 74 ± 19H 51 ± 10H 25 ± 2 18 ± 1Leucine 127 ± 16 108 ± 38I 119 ± 24 93 ± 25I 145 ± 8 190 ± 20
ADerived from study described in reference 17 and unpublished data of L. Castillo et al., 1999. B,CMeasurement taken at 0 minutes and mean times of 460 and480 minutes, respectively (see Figure 2a). D,EMeasurement taken at mean of 460 and 480 minutes, and 220 and 240 minutes, respectively (see Figure 2b).F,GMean values for 12-hour post-absorptive and 12-hour fed periods of the 24-hour tracer study, respectively. HP < 0.01 ESRD vs. healthy controls. IP < 0.01ESRD vs. healthy controls.
Figure 5(a) Plasma isotopic enrichment of [15N-ureido]citrulline (15N Cit; VI in Figure 3) derived from L-[guanidino-15N2]arginine (IV in Figure 3), anindex of NO synthesis, pre- and post-hemodialysis. (b) Plasma isotopic enrichment of L-[13C-guanidino, 5,5, 13C-guanidino,5,5,2H2]arginine(M+3 Arg; VIII in Figure 3) derived from L-[13C-ureido5,5,2H2]citrulline (VII in Figure 3), an index of arginine synthesis, pre- and post-hemodial-ysis. Time shown is minutes of tracer infusion. Error bars are SEM.
citrulline concentrations and renal function (30).According to the findings of Bouby and coworkers(32), the higher citrulline turnover may be a peripher-al adaptation, enabling a reduced mass of functionaltissue in the kidney to maintain a constant rate of argi-nine synthesis.
The rate of citrulline appearance (and disappearance)was about 65–80 µmol/kg per hour in the ESRDpatients. This is about 4 or 5 times higher than inhealthy controls (20). It also exceeds the net rate of denovo arginine synthesis, which approximates 13µmol/kg per hour. Because the only route of citrullinecatabolism is arginine synthesis, this must indicate asignificant compartmentation of citrulline metabolismin vivo. Clearly, further detailed studies of citrullinemetabolism in ESRD would be worthwhile, possiblyusing compartmental modeling (33).
We observed that the rate of arginine oxidation dur-ing the post-absorptive state in patients with ESRDwas about 30% of that for healthy controls. In healthysubjects we have shown an adaptive reduction in argi-nine oxidation when they were fed an arginine-freediet (17, 22), which is associated with a lowered plas-ma arginine concentration (17, 22; unpublished data).In contrast, the lowered rate of arginine oxidation inthe ESRD patients was associated with a normal plas-ma arginine concentration. This implies a diet-inde-pendent change in arginine metabolism in patientswith severe renal dysfunction.
It can be seen from Table 3 that the rate of intake ofarginine exceeded the estimated rate of arginine oxi-dation over the combined post-absorptive and fedstates. On this basis, the patients were in marked pos-itive arginine balance during the tracer study. Becausea positive arginine balance would not be sustainedover a prolonged period, the possibility exists that wehave underestimated the rate of arginine oxidation.However, because this limitation would probably alsoapply to oxidation values for healthy controls, itseems that there are differences between the patientand control groups. Similarly, leucine oxidation forthe combined post-absorptive and fed states indicat-ed a positive leucine balance that tended to be greaterduring the post-hemodialysis phase. In comparison,the healthy subjects were close to leucine balance,again suggesting a retention of body protein in ESRDpatients during the period of the tracer studies.
Finally, we have observed increased rates of NO syn-thesis in ESRD patients, although acute hemodialysistreatment did not appear to change the rate of NOproduction. Yokokawa and coworkers (34) demon-strated increased production of NO, determined byplasma nitrite and nitrate concentrations, in patientswith ESRD and hemodialysis-induced hypotensiveepisodes. However, NO production evaluated in thisway did not appear to increase in their ESRD patientswho were undergoing hemodialysis but were withouthypotensive episodes. In contrast, our ESRD patientsreceiving hemodialysis treatment remained hemody-
namically stable, but presented a significant increasein NO production. Wever et al. (35), using L-[guanidi-no-15N2]arginine in a tracer paradigm comparable tothe one used here for determination of NO produc-tion, reported a reduced rate of NO production inpatients with chronic renal failure who were not onhemodialysis. Thus, the consequences for NO pro-duction of ESRD appear to be complex, and this willrequire additional study.
In summary, our findings indicate that argininehomeostasis under conditions of ESRD is supportedby maintenance in the rate of net de novo arginine syn-thesis, apparently due to an adaptive increase in therate of citrulline synthesis and maintenance of highplasma levels and turnover. The anatomic site or sitesresponsible for net arginine synthesis under these con-ditions remain to be established. Arginine may also beconserved in part by a lower post-absorptive rate ofoxidation. In addition, the rate of NO synthesis inpatients with ESRD was significantly elevated, andaccounted for a much higher fraction of arginine dis-posal than in healthy subjects. In comparison withhealthy subjects, the altered dynamic relationships inESRD among arginine and citrulline metabolism onthe one hand, and NO synthesis on the other, indicatethe need to further investigate the pathophysiologicalimplications of arginine and citrulline metabolism inpatients with severe renal disease.
AcknowledgmentsThis study was supported by funding from the Anes-thesia Research Foundation, by the Children’s Hospi-tal, the Lynne Reid Fellowship at Harvard MedicalSchool, and by National Institutes of Health grants RR-88, DK-15856, DK-40561, and P30-DK40561.
1. Barbul, A. 1986. Arginine: biochemistry, physiology and therapeuticimplications. JPEN J. Parenter. Enteral Nutr. 10:227–238.
2. Nathan, C. 1992. Nitric oxide as a secretory product of mammalian cells.FASEB J. 6:3051–3056.
3. Schwartz, D, et al. 1997. Agmatine affects glomerular filtration via a nitricoxide synthase-dependent mechanism. Am. J. Physiol. 272:F597–F601.
4. Morgan, D. 1994. Polyamines, arginine and nitric oxide. Biochem. Soc.Trans. 22:879–883.
5. Dhanakoti, S.N., Brosnan, M.E., Herzberg, G.R., and Brosnan, J.T. 1992.Cellular and subcellular localization of enzymes of arginine metabolismin rat kidney. Biochem. J. 282:369–375.
6. Featherston, W.R., Rogers, Q.R., and Freedland, R.A. 1973. Relativeimportance of kidney and liver in synthesis of arginine by the rat. Am. J.Physiol. 224:127–129.
7. Dhanakoti, S.N., Brosnan, J.T., Herzberg, G.R., and Brosnan, M.E. 1990.Renal arginine synthesis: studies in vitro and in vivo. Am. J. Physiol.259:E437–E442.
8. Levillain, O., Hus-Citharel, A., Morel, F., and Bankir, L. 1990. Localizationof arginine synthesis along rat nephron. Am. J. Physiol. 259:F916–F923.
9. Levillain, O., Hus-Citharel, A., Morel, A., and Bankir, L. 1993. Argininesynthesis in mouse and rabbit nephron: localization and functional sig-nificance. Am. J. Physiol. 264:F1038–F1045.
10. Wu, G., and Morris, S.M., Jr. 1998. Arginine metabolism: nitric oxide andbeyond. Biochem. J. 336:1–17.
11. Reyes, A.A., Karl, I.E., and Klahr, S. 1994. Role of arginine in health andin renal disease. Am. J. Physiol. 267:F331–F346.
12. Beasley, D., and Brenner, B.M. 1992. Role of nitric oxide in hemodialysishypotension. Kidney Int. 42:S96–S100.
13. Vallance, P., Leone, A., Calver, A., Collier, J., and Moncada, S. 1992. Accu-mulation of an endogenous inhibitor of nitric oxide synthesis in chron-ic renal failure. Lancet. 339:572–575.
14. Wolfson, M., Jones, M.R., and Kopple, J.D. 1982. Amino acid losses dur-
1224 The Journal of Clinical Investigation | May 2000 | Volume 105 | Number 9
ing hemodialysis with infusion of amino acids and glucose. Kidney Int.21:500–506.
15. Blumenkrantz, M.J., et al. 1981. Protein losses during peritoneal dialy-sis. Kidney Int. 19:593–602.
16. El-Khoury, A.E., et al. 1994. Validation of the tracer balance concept withreference to leucine: 24-h intravenous tracer studies with L-[1-13C]leucine and [15N-15N]urea. Am. J. Clin. Nutr. 59:1000–1011.
17. Castillo, L., Bedri, S., Beaumier, L., Ajami, A.M., and Young, V.R. 1997.Adaptation to a long term (4 weeks) arginine precursor-free diet in adulthumans. FASEB J. 11:439a. (Abstr.)
18. Castillo, L., Beaumier, L., Ajami, A.M., and Young, V.R. 1996. Whole bodynitric oxide synthesis in healthy men determined from [15N]arginine-to-[15N]citrulline labeling. Proc. Natl. Acad. Sci. USA. 93:11460–11465.
19. Castillo, L., et al. 1994. Plasma arginine kinetics in adult man: responseto an arginine-free diet. Metabolism. 43:114–120.
20. Castillo, L., et al. 1993. Plasma arginine and citrulline kinetics in adults givenadequate and arginine-free diets. Proc. Natl. Acad. Sci. USA. 90:7749–7753.
21. Castillo, L., et al. 1993. Splanchnic metabolism of dietary arginine inrelation to nitric oxide synthesis in normal man. Proc. Natl. Acad. Sci. USA.90:193–197.
22. Castillo, L., et al. 1994. The plasma flux and oxidation rate of ornithineadaptively decline with restricted arginine intake. Proc. Natl. Acad. Sci.USA. 91:6393–6397.
23. Clarke, J.T., and Bier, D.M. 1982. The conversion of phenylalanine totyrosine in man. Direct measurement by continuous intravenous tracerinfusions of L-[ring-2H5]phenylalanine and L-[1-13C]tyrosine in thepostabsorptive state. Metabolism. 31:999–1005.
24. Thompson, G.N., et al. 1989. Rapid measurement of whole body andforearm protein turnover using a [2H5]phenylalanine model. Am. J. Phys-
iol. 256:E473–E479.25. Lim, V.S., Bier, D.M., Flanigan, M.J., and Sum-Ping, S.T. 1993. The effect
of hemodialysis on protein metabolism. A leucine kinetic study. J. Clin.Invest. 91:2429–2436.
26. Zar, J.H.1966. Biostatistical analysis. 3rd edition. Prentice Hall. Upper Sad-dle River, NJ. 474–480.
27. Littell, R., Freund, R., and Spector, P. 1991. SAS systems for linear models.3rd edition. SAS Institute Inc. Cary, NC. 229–246.
28. Tom, K., et al. 1995. Long-term adaptive responses to dietary proteinrestriction in chronic renal failure. Am. J. Physiol. 268:E668–E677.
29. Lim, V.S., Yarasheski, K.E., and Flanigan, M.J. 1998. The effect ofuraemia, acidosis, and dialysis treatment on protein metabolism: a lon-gitudinal leucine kinetic study. Nephrol. Dial. Transplant. 13:1723–1730.
30. Tizianello, A., De Ferrari, G., Garibotto, G., Gurrei, G., and Robaudo, C.1980. Renal metabolism of amino acids and ammonia in subjects withnormal renal function and in patients with chronic renal insufficiency.J. Clin. Invest. 65:1162–1173.
31. Dhanakoti, S.N., Brosnan, J.T., Brosnan, M.E., and Herzberg, G.R. 1992.Net renal arginine flux in rats is not affected by dietary arginine ordietary protein intake. J. Nutr. 122:1127–1134.
32. Bouby, N., Hassler, C., Parvy, P., and Bankir, L. 1993. Renal synthesis ofarginine in chronic renal failure: In vivo and in vitro studies in rats with5/6 nephrectomy. Kidney Int. 44:676–683.
33. Cobelli, C., and Caumo, A. 1998. Using what is accessible to measure thatwhich is not: necessity of model of system. Metabolism. 47:1009–1035.
34. Yokokawa, K., et al. 1995. Increased nitric oxide production in patientswith hypotension during hemodialysis. Ann. Intern. Med. 123:35–37.
35. Wever, R., et al. 1999. Nitric oxide production is reduced in patients withchronic renal failure. Arterioscler. Thromb. Vasc. Biol. 19:1168–1172.
The Journal of Clinical Investigation | May 2000 | Volume 105 | Number 9 1225
Related Documents