Are Those Who Bring Work Home Really Working Longer Hours? Implications for BLS Productivity Measures* Lucy P. Eldridge U.S. Bureau of Labor Statistics 2 Massachusetts Ave., NE Rm. 2150 Washington, DC 20212 202-691-6598 [email protected] Sabrina Wulff Pabilonia U.S. Bureau of Labor Statistics 2 Massachusetts Ave., NE Rm. 2180 Washington, DC 20212 202-691-5614 [email protected] October 4, 2006 Abstract: An ongoing debate surrounding BLS productivity data is that official labor productivity measures may be overstated because of an increase in unmeasured hours worked outside the traditional workplace. This paper uses both the ATUS and May CPS Work Schedules and Work at Home Supplements to determine whether hours worked by non-farm business employees are underestimated and increasing due to unpaid hours worked at home. We find that roughly 6 - 8 percent of nonfarm business employees bring some work home from the workplace. In addition, those who bring work home report working longer hours than those who work exclusively in a workplace, resulting in a 0.5 - 0.7 percent understatement of measured hours worked. However, we find no conclusive evidence that the percent of unmeasured hours increased over the 2001-2005 period. * The authors thank Mike Giandrea, Anastasiya Osborne, Peter Meyer, Anne Polivka, Younghwan Song, Jay Stewart, Leo Sveikauskas, and Cindy Zoghi. All views expressed in this paper are those of the authors and do not necessarily reflect the views or policies of the U.S. Bureau of Labor Statistics.

Welcome message from author
This document is posted to help you gain knowledge. Please leave a comment to let me know what you think about it! Share it to your friends and learn new things together.
Transcript
Are Those Who Bring Work Home Really Working Longer Hours?
Implications for BLS Productivity Measures*
Lucy P. Eldridge U.S. Bureau of Labor Statistics
2 Massachusetts Ave., NE Rm. 2150 Washington, DC 20212
202-691-6598 [email protected]
Sabrina Wulff Pabilonia U.S. Bureau of Labor Statistics
2 Massachusetts Ave., NE Rm. 2180 Washington, DC 20212
202-691-5614 [email protected]
October 4, 2006
Abstract: An ongoing debate surrounding BLS productivity data is that official labor productivity measures may be overstated because of an increase in unmeasured hours worked outside the traditional workplace. This paper uses both the ATUS and May CPS Work Schedules and Work at Home Supplements to determine whether hours worked by non-farm business employees are underestimated and increasing due to unpaid hours worked at home. We find that roughly 6 - 8 percent of nonfarm business employees bring some work home from the workplace. In addition, those who bring work home report working longer hours than those who work exclusively in a workplace, resulting in a 0.5 - 0.7 percent understatement of measured hours worked. However, we find no conclusive evidence that the percent of unmeasured hours increased over the 2001-2005 period.
* The authors thank Mike Giandrea, Anastasiya Osborne, Peter Meyer, Anne Polivka, Younghwan Song, Jay Stewart, Leo Sveikauskas, and Cindy Zoghi. All views expressed in this paper are those of the authors and do not necessarily reflect the views or policies of the U.S. Bureau of Labor Statistics.

I. Introduction
Advancements in information technology have increased workers’ abilities to conduct
their jobs in multiple locations. An ongoing debate surrounding BLS productivity data is that
official productivity numbers may be overstated because of an increase in unmeasured hours
worked outside the traditional workplace. To shed light on this debate, this paper examines two
recent data sources — the 2003 - 2005 American Time Use Survey (ATUS) and the 2001 and
2004 May CPS Work Schedules and Work at Home Supplements (CPS Supplement) — for
information on U.S. workers who bring work home from their workplace. The ATUS provides
detailed information on time spent on work, work-related activities, and non-work activities on
one diary day, as well as locations for these activities. The CPS Supplements provide
information on the number of hours worked at home each week, whether work conducted at
home was paid or unpaid, and reasons for working at home.
The potential for bringing work home varies by the nature of work, the worker’s degree
of autonomy, and the job’s technology needs and availability. This is evident in the differences
in the tendencies of workers to bring work home depending on their occupation, industry, and
education level. Results indicate that highly-educated, salaried workers are more likely to bring
work home than their less-educated, hourly counterparts. However, contrary to popular
perceptions, not all work at home is done by white-collar office workers. One goal of this study
is to examine time-use behavior and respondent reports to determine whether workers bring
work home to balance work and family obligations better, or to gain an advantage over their
competitors. The majority of workers bring home unpaid work to finish or catch up on work.
We also find some support for a work/family balance explanation because fathers of young

children are more likely to bring work home, and some workers report watching their children as
a secondary activity while working at home as their primary activity. In addition, about five
percent of workers specifically reported that they work at home to coordinate their work
schedule with personal or family needs.
We also examine whether those who bring work home work longer hours, or whether
they are simply changing the location of work. In the ATUS, we find that those who work in a
workplace and bring work home on their diary day work longer total hours than those who work
exclusively in a workplace. Yet, those who bring work home work fewer daily hours at their
workplace than those who work only at their workplace. The ATUS and the CPS Supplement
both show that the average weekly hours of those who bring work home are greater than the
average weekly hours of those who work exclusively in a workplace. Thus, it appears that those
who bring work home reallocate some work from the traditional workplace setting to the home,
yet work more hours overall.
Finally, we assess whether the BLS captures the hours worked at home of those who
bring work home. Because the BLS uses different procedures to construct hours for non-
employees, production/nonsupervisory employees, and nonproduction/supervisory employees,
we examine each of these groups separately. BLS hours are constructed primarily from
employer reports of paid hours and supplemented with household reports of hours worked.
Therefore, if hours worked at home represent unpaid overtime, they may not be measured.
In both the CPS Supplement and ATUS, we find that nonproduction/supervisory
employees work longer hours and are more likely to bring work home than
production/supervisory employees. We also find that the CPS Supplement data generate slightly
larger shares of employees who work unpaid hours at home than do the ATUS data. This is not
2

surprising since the supplement question’s time frame for work at home is open-ended and the
time-use survey is specific to the interview diary day. For the nonfarm business sector, we find
that between 0.6 - 0.7 percent of hours worked on main jobs in 2004 may be unmeasured due to
unpaid hours worked at home. The understatement of hours does not appear to have increased
over the study period.
Section II reviews relevant literature. Section III describes the American Time Use
Survey and the CPS Supplement. Section IV provides descriptive statistics on workers who
bring work home and conducts a multivariate analysis to determine what characteristics affect
the probability of bringing work home. Section V discusses BLS methods for measuring labor
productivity and hours of work. Section VI analyzes the data to determine whether those who
bring work home work longer hours than those who work exclusively in a workplace. In
addition, it examines whether work done at home is captured by official productivity measures.
Section VII concludes this paper.
II. Prior Research
Previous research both on hours worked in other time-use surveys and on work-at-home
arrangements are relevant to this paper; however, only Callister and Dixon (2001) examined
workers who work both at the workplace and at home on the same day. In household surveys,
these workers may be more likely to inaccurately report their hours worked than are workers
who work exclusively at home. This could be the case because the work schedule of these
workers is more varied, and they may be less likely to be paid for their work at home.
3

Evidence from household time-use diaries shows that respondents to labor force surveys
similar to the CPS report higher hours worked compared to estimates from time-use diaries
(Hamermesh (1990) used Michigan time use diary data for 1975 and 1981; and Robinson and
Bostrom (1994) used three separate studies in 1965, 1975, and 1985).1 Robinson and Bostrom
(1994) showed that the difference between these surveys is greater for those who work long
hours. Hamermesh (1990) and Robinson and Bostrom (1994) both showed that this difference
increased over time. However, Jacobs (1998) found that independent, self-reported measures of
working time based on time of departures to and returns from work support the estimates
obtained from hours of work questions in labor force surveys. Until recently, no studies
compared hours worked from time diaries to hours reported to the post-redesign (1994) CPS
questions, but now presumably the discrepancy is less given the efforts taken to enhance
respondents’ recall on whether they worked and how many hours they worked in the prior
week.2 Using similar definitions of hours worked, Frazis and Stewart (2004) found that CPS
reported hours of work are similar to hours constructed from the ATUS for the 12 CPS reference
weeks in 2003.3 In part, this could occur because the 1994 redesign of the CPS questionnaire
attempted to improve respondent. However, Frazis and Stewart (2004) also found that ATUS
respondents worked five percent fewer hours per week than reported in the CPS for weeks other
than CPS reference weeks.4 This preliminary finding suggests use of CPS data to construct
monthly, quarterly, or annual hours could overstate the number of hours worked.
1 Note that the sample sizes in these studies are smaller than the ATUS sample. 2 In the 1994 revised CPS, the question on usual hours is asked first, followed by questions about overtime and taking time off for reasons such as illness, slack work, vacation or holiday. Polivka and Rothgeb (1993, p. 16) report that “The mean of reported hours measured with the current [pre-1994] wording was 39.0 compared to 37.9 hours measured with the revised [1994- and later] wording.” This is a combined survey effect of the employment and hours questions. 3 The CPS reference week is the calendar week of each month that contains the 12th. 4 Data have been compiled across all months due to the limited number of observations.
4

Workers around the globe work a significant number of hours at home. For example, the
1999 New Zealand Time-Use Survey showed 15.5 percent of non-agricultural weekday workers
combined office and home work on their diary day (Callister and Dixon 2001). Murphy and
Satherely (2000) found that a greater percentage of these workers lived in rural areas rather than
urban areas, and there was little gender difference in the likelihood of working at home.
Recent research on work-at-home arrangements is primarily based upon paid work done
by home-based workers or occasional telecommuters. Recently, Oettinger (2004) used the 1980,
1990, and 2000 Census to examine the growth in home-based employment. He showed that the
wage penalty for working at home has decreased over time and that the increase in home-based
work has been greatest for highly-educated workers. Using the May 1997 CPS Work at Home
supplement, Schroeder and Warren (2004) analyzed workers who did any work at home,
including home-based workers, occasional telecommuters, and those who bring their work home
in the evening. They found that compared to traditional office workers, workers who did any
work at home are likely to be older, better educated, married and white. They also found that
managers and professionals are more likely to report some work at home than other occupational
groups. Unlike New Zealand, U.S. workers who did some work at home are more likely to live
in an urban area. Using the Canadian Workplace and Employee Survey, Pabilonia (2005)
analyzed the decision of employees to do paid work at home during part of their normal working
hours (referred to as telecommuters) and the decision of firms to allow these employees to
telecommute. In 2001, the 5.9 percent of telecommuters among Canadian workers were more
likely to be tech-savvy, experienced white-collar workers than their non-telecommuting
counterparts.
5
III. Data Sources
The Current Population Survey (CPS) is collected monthly for individuals in a sample of
about 60,000 households. The CPS provides information on employment, hours worked, and
demographics. Employment and unemployment-related information refers to the reference week
that includes the 12th of the month. Information is collected monthly on actual hours worked,
separately for the main job and the secondary job. Information is also collected for total hours
on all jobs, and for usual hours worked. Households are in the survey for four months, out for
eight months, and back in for four months. Certain information is collected only from the
outgoing rotation groups, that is, from households currently in their fourth or eighth month in
sample. Data on special topics are gathered in periodic supplements.
We focus our study on nonfarm business employees in order to be consistent with the
BLS nonfarm business sector productivity statistics. This group consists of respondents who are
fifteen-years-old and older, work outside of the farm sector, and are classified as employees of
private for-profit entities. We exclude the self employed and unpaid family workers. 5
The American Time Use Survey
The American Time Use Survey, which began collecting data in 2003, is a survey of how
people living in the United States spend their time. The ATUS sample consists of one household
member aged fifteen or older from a subset of households completing their final month of
5 The nature of farming would suggest that one could not bring this type of work home, although some farm work is done exclusively at home on the family farm. In addition, there were only a couple of fifteen-year-olds who brought work home from the workplace, which is not surprising given the types of jobs fifteen-year-olds hold (Pabilonia 2001). Because the self-employed may have a vague demarcation between work and non-work activities as well as a muddied definition of the workplace, it is beyond the scope of this study to analyze unpaid overtime for the self-employed.
6

interviews for the CPS. In 2003, there were 20,720 ATUS interviews. Beginning in December
2003, the sample size was reduced by 35 percent, yielding 13,973 completed diaries in 2004. In
2005, approximately 13,000 individual diaries were completed. The ATUS collects a 24-hour
diary of activities that a respondent was engaged in starting at 4 A.M on the day prior to their
interview. These diaries include information on work time, such as time at work, time spent on
work activities at home, and interruptions of 15 minutes or longer that took place during the
work day.6 In addition to the types of activities and the time spent doing these activities, there is
information on the demographic characteristics of the respondents, the locations where the
activities took place, and the people who were with the respondent at the time of the activity.
In order to analyze hours of work, we aggregated minutes spent on activities coded as
work at main job for each ATUS respondent by location from the ATUS activity files, and
constructed measures of work time at the workplace and at home. We define those who bring
work home as respondents who report any minutes of work on their main job at the workplace
and at home on the same day. The restriction to the main job is necessary in order to allow us to
focus on those who bring work home rather than those who may be doing some part-time work
at home in the evenings. In addition, CPS supplement data is restricted to hours worked at home
on main job only.
We also restrict the ATUS sample to those who worked on their non-holiday weekday
diary day. This allows us to focus on the typical Monday thru Friday worker, as we do not know
whether the ATUS respondent whose diary day was on a weekend was working in a workplace
during the week and bringing some extra work home to do over the weekend. In the 2003
6 ATUS interviewers are trained to ask for work breaks of 15 minutes or longer any time a respondent reports that he or she worked. Beginning in January 2004, an automated probe was introduced into the survey instrument. If a respondent reports working for more than 4 hours at one time, the interviewer automatically is prompted to ask “Did you take any breaks of 15 minutes or longer?” If the respondent reports taking a break, the interviewer records the start and stop time and what was done on that break; if no break, the solid work episode is recorded.
7

ATUS, only 12 percent of the 280 respondents classified as bring-work-home individuals
worked on Saturday or Sunday. Similar percentages brought home work in 2004 and 2005.
The CPS Work Schedules and Work at Home Supplements
The Work Schedules and Work at Home Supplements were collected as part of the May
CPS in 1997, 2001 and 2004. We restrict our study to the 2001 and 2004 May supplement data
because changes in the wording of questions in 2001, as well as changes in industry and
occupational coding, affect the direct comparability of some of the data collected in previous
surveys; this also covers the period of increasing productivity growth under question. These
supplements only collected information on whether respondents do any work at home as part of
their main job. Wage and salary respondents who reported work at home were asked whether
they had a formal agreement with their employer to be paid for work at home or whether they
were just taking work home. We specifically focus our analysis on those who take unpaid work
home from the job, since their hours are those most likely to be mis-measured. Throughout the
paper, we refer to this work as unpaid work at home. However, we would like to note that this
question does not allow for the possibility that an employee had a formal arrangement to be paid
but also took home some unpaid work. Respondents were asked how frequently they worked at
home, as well as number of hours per week worked at home. However, one of the possible
responses was worded as “it varies”; therefore, it is not possible to determine a numerical
measure of work hours for some respondents. Respondents also provided their reasons for
working at home and what equipment they used to accomplish work at home.
ATUS and CPS Supplement Matched Data
8

CPS Supplement respondents in 2004 who were in their 5th through 8th months in the
CPS were eligible for an ATUS interview in 2004. We are able to directly match 1,345 non-
farm business employees who were in the same industry and occupation in both data sets and did
not change employers between their last month in the CPS and their ATUS intervie.
By examining the direct match, we are able to obtain some insights as to how much work
may be unpaid, as well as whether those who worked exclusively at home on a weekend diary
day were doing unpaid work over the weekend. Among matched employees, 45 worked at home
on the weekend, 39 exclusively at home. Surprisingly, only 27 of the 39 who worked
exclusively at home reported that they ever did work at home as part of their job in the
Supplement. Of these 27, 19 reported that they were taking work home while 4 reported that
they were home-based workers. However, there are definitely some limitations of the match.
Some respondents to the supplement questions answered that they did not do any work at home
as part of their job when their time diary clearly stated that they did some work at home. For
example, 45 individuals answered that they worked at home on their diary day in the ATUS, but
only 21 of these also reported that they did work at home as part of their job. This may be
because the nature of their job changed between the CPS Supplement and the ATUS, which were
up to 6 months apart. Alternatively, the questions may have been misinterpreted by the
respondents, or answers by be subject to proxy reporting bias.
IV. Who is Bringing Work Home?
ATUS Descriptive Statistics
9
From the ATUS, we find that 84 - 85 percent of nonfarm business employees work
exclusively in a workplace, 10 - 12 percent do some work at home, and the remaining 4-5
percent work at a workplace and a location other than the home on their diary day (Table 1).
According to the 2003 ATUS, 6 percent of nonfarm employees did work at a workplace and
brought some of their work home on their diary day; this share was 7 percent in 2004 and 2005.
Among those who bring work home in the ATUS, we find that more employees bring
work home in the middle of the week than on Mondays and Fridays. Table 2 presents the
portion of employees who bring work home by the time of day that this work at home was done.
We find that much of their work at home was done in the evenings. In 2003, 31 percent did
some work at home after 6 PM. A smaller percentage (13 percent) did some work at home prior
to 8 AM. This work reportedly done outside traditional working hours suggests that workers are
bringing home work (possibly unpaid). Thirteen percent of individuals who worked at home did
so while having a child in their care in 2003. Table 3 presents the portions of nonfarm business
employees that bring work home by the number of minutes worked at home. We find that the
amount of work done at home is economically significant. Of those who brought work home in
2003, 44 percent worked for more than one hour at home. Fifteen percent of employees who
brought work home did less than 15 minutes of work at home.
In Table 4, we examine the characteristics of nonfarm business employees in the ATUS,
by whether they brought work home. In all years, employees who brought work home from the
workplace were more likely to be non-white and non-black7, married, have a spouse who works,
have at least a bachelor’s degree and be in a management or professional occupation compared
to employees who did not bring work home. For example, among nonfarm employees in 2005,
7 This includes individuals of mixed-race categories, Asians, American Indians, Alaskan Natives, and Hawaiian/Pacific Islanders.
10

55 percent of those who brought work home held at least a bachelor’s degree. Of those who did
not bring work home, only 24 percent held at least a bachelor’s degree. Bring-work-home
employees were less likely to be black, Hispanic, or paid hourly. Of those who bring work
home, only 23 percent are considered to be paid hourly in 2003, while 64 percent of nonfarm
employees who did not bring work home were paid hourly. As mentioned in the introduction,
employees who work in workplaces other than an office building also bring work home. For
example, six percent of employees in construction brought work home in 2005.
CPS Supplement Descriptive Statistics
The CPS Supplement shows that approximately 87 - 88 percent of nonfarm business
employees do no work at home, while 12 percent do some work at home (Table 1). The
supplement specifically asked those who do work at home whether that work is unpaid; 9 percent
of employees reported some unpaid work at home in 2001 and 8 percent in 2004.
In Table 5, we examine the characteristics of nonfarm business employees using the 2001
and 2004 CPS supplement respondents, by bring-unpaid-work-home status. In both years,
employees who bring home unpaid work were more likely to be older, married, have a spouse
who works, have at least a bachelor’s degree, have a child, and to be in a management or
professional occupation compared to those employees who do not bring unpaid work home.
They were less likely to be female, black, Hispanic, or work part-time.
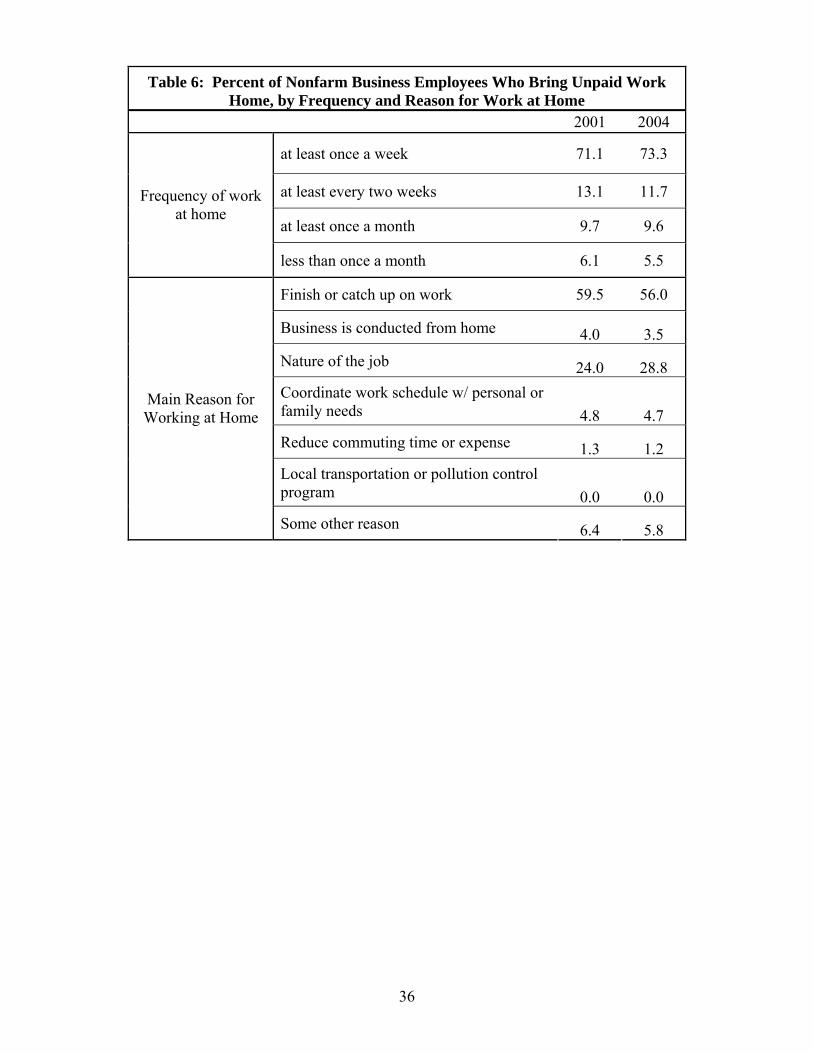
Among the 8 percent of nonfarm business employees who bring unpaid work home, we
find that over 70 percent report working at home at least once a week, about 12 - 13 percent
work from home at least every two weeks, 10 percent at least once a month and 5 - 6 percent less
than once a month (Table 6). Roughly 32 percent reported that their hours at home varied, 23
11

percent reported working 1 - 2 hours per week at home, 17 percent reported working 3 - 4 hours
per week at home, 11 percent reported 5 - 6 hours per week at home, and the remaining
respondents reported anywhere from 8 - 60 hours per week at home. The main reason reported
for doing unpaid work at home was to finish up on work not completed at the usual workplace.
Regression Analysis Using ATUS
In the regression analysis, the comparison group includes those who work exclusively in
a workplace on their diary day, those who work exclusively at home, and those who work at
other locations, since we cannot determine from one diary day if the worker is home-based or a
telecommuter. We estimated the following model on the pooled 2003-2005 ATUS data to
determine the demographic and job characteristics of employees associated with bringing work
home.
yit* = α + βXit+ εit (1)
y1it = 1 if yit*>0
y1it = 0 if yit*≤0
where yit* is the unobserved propensity to bring work home, y1it is an observed dichotomous
variable indicating whether or not a worker brings work home from a workplace on their diary
day (paid or unpaid), Xit is a vector of observed characteristics of i at time t; α and β are
parameters to be estimated; and εit is a random term assumed to have a normal distribution. Xit
includes educational degree attainment indicators, demographic characteristics (gender, age and
age squared, race, Hispanic ethnicity, an indicator for married or divorced, an indicator for
12

working spouse, an indicator for having a child, indicators for age of youngest child - infant,
preschooler, elementary school student, or adolescent, and indicators for the interaction of these
latter child variables with gender), job characteristics (indicators for paid hourly, six occupation
categories, and thirteen industry categories), four region indicators and a year indicator.
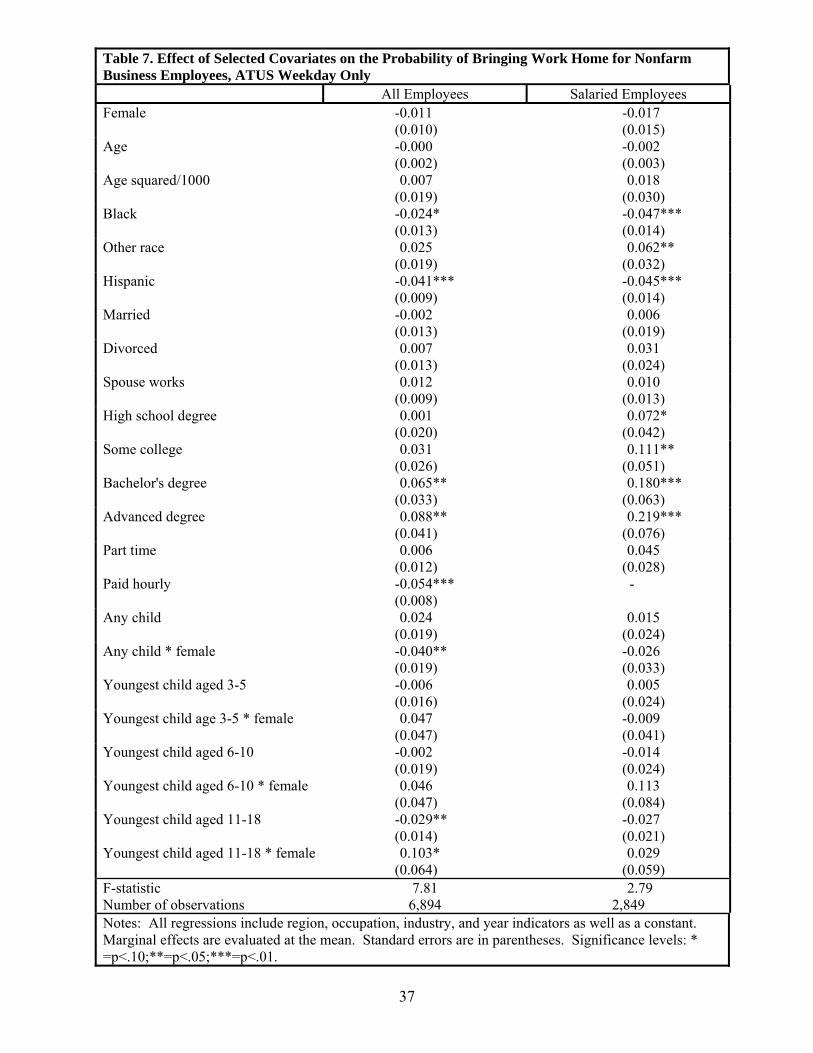
Marginal effects and standard errors from a reduced-form probit regression for all
employees and then for salaried employees only are reported in Table 7.8 All standard errors are
weighted to account for sample design. Holding all else equal, overall results indicate that
highly-educated, salaried employees are more likely to bring work home than less-educated,
hourly employees. Black employees are less likely to bring work home than whites, and
Hispanic employees are less likely to bring work home than non-Hispanic employees.
Results suggest that fathers who have an infant are more likely to bring work home than
men whose youngest child is an adolescent. Therefore, some fathers may bring work home to
better balance work and family responsibilities when the children are young. Mothers are less
likely to bring work home than women without children. It is possible that this result is biased
due to sample selection issues arising from mothers choosing not to participate in the labor force.
Alternatively, mothers as opposed to fathers may choose not to do any work at home because
they traditionally spend more time on childcare and household production than their male
spouses. Contrary to the descriptive statistics, married employees are not more likely to bring
work home than single employees and having a spouse who works does not increase the
probability of bringing home work. The previous result may be due to differences in the types of
jobs married employees hold, compared to their single counterparts.
We also examine salaried employees separately because they are more likely to bring
work home and more likely to have some unmeasured hours worked. In the direct matched data, 8 A test for whether all the coefficients in this model were identical for females and males could not be rejected.
13

76 percent of salaried workers working at home reported that they took unpaid work home in the
CPS Supplement, while only 58 percent of hourly workers working at home reported that they
took unpaid work home. Again, we find that black and Hispanic employees are less likely to
bring work home than white employees, and that highly-educated employees are more likely to
bring work home than their less-educated counterparts. In addition, we find that non-white/non-
black employees are more likely to bring work home than white employees. We do not find any
significant effects of having children on the probability of bringing work home.
Regression Analysis Using CPS Supplements
Next, we estimate the following model using each CPS Supplement sequentially (2001
and 2004) to determine the characteristics of employees associated with bringing unpaid work
home from their workplace — the group of employees we believe most likely to have mis-
measured hours:
Unpaidit* = α + βXit+ εit (2)
Unpaid1it = 1 if Unpaidit*>0
Unpaid1it = 0 if Unpaidit*≤0
where Unpaidit* is the unobserved propensity to bring unpaid work home, Unpaid1it is an
observed dichotomous variable indicating whether or not a worker ever brings unpaid work
home, Xit is a vector of observed characteristics of i at time t; α and β are parameters to be
estimated; and εit is a stochastic disturbance term assumed to follow a normal distribution. Xit
includes educational degree attainment indicators, demographic characteristics (gender, age and
14

age squared, race, Hispanic ethnicity, indicators for married or divorced, an indicator for
working spouse, indicators for having a child, indicators for age of youngest child - infant,
preschooler, elementary school student, or adolescent, and indicators for the interaction of these
latter child variables with gender), job characteristics (indicators for six occupations, and thirteen
industries), four region indicators and a year indicator.
We find that females are less likely to bring unpaid work home than males in 2004 only.
(Table 8) We also find that older employees are more likely to bring unpaid work home than
younger employees. Employees who are black or of other race are less likely to bring unpaid
work home than white employees, and Hispanic employees are less likely to bring unpaid work
home than non-Hispanic employees. Employees with a high school degree or higher are more
likely to bring unpaid work home than high school dropouts. Contrary to the descriptive
statistics, married employees are not more likely to bring unpaid work home than single
employees, and having a spouse who works does not increase the probability of bringing unpaid
work home. We find that fathers are more likely to bring unpaid work home than males without
children. Fathers whose youngest child is school-aged are less likely to bring unpaid work home
than fathers of infants. Finally, mothers of adolescent children are more likely to bring unpaid
work home than mothers of infants.
V. Use of Hours Data in U.S. Productivity Measurement
Productivity trends are watched closely by businessman, policymakers, and others
interested in business cycles and U.S. competitiveness. The BLS produces quarterly measures of
labor productivity for major sectors of the economy, including business, nonfarm business,
15

nonfinancial corporations, and durable, nondurable, and total manufacturing.9 Labor
productivity measures the difference between output and hours growth, and reflects many
sources, including increases in the quantities of nonlabor inputs (i.e., capital services, fuels, other
intermediate materials, and purchased services), changes in technology, economies of scale,
changes in management techniques, and changes in the skills of the labor force.
The BLS calculates labor productivity in the nonfarm business sector, by combining i real
output from the National Income and Product Accounts (NIPA) produced by the Bureau of
Economic Analysis (BEA) with quarterly measures of hours worked of all persons, prepared by
the Office of Productivity and Technology. Two surveys collect monthly measures of U.S. hours
and employment - the BLS Current Employment Statistics program (CES) and the Current
Population Survey (CPS). The CES is the primary source of data used to measure hours for
productivity purposes.10 The CES is a monthly payroll survey that collects data on employment
for all employees from a sample of 400,000 nonfarm establishments. The CES also collects data
on average weekly hours paid for production workers in goods industries and for nonsupervisory
workers in service industries.11 CES average weekly hours paid are adjusted to hours-at-work
using the hours-worked to hours-paid ratio estimated from the National Compensation Survey
(NCS). This adjustment ensures that changes in vacation, holiday, and sick pay, which are best
9 The BLS also produces measures of multifactor productivity for major sectors and labor productivity for select detailed industries. 10 The CES sample is more than six times larger than the CPS sample. In addition, the CES is benchmarked annually to levels based on administrative records of employees covered by state unemployment insurance tax records. There is no direct benchmark for CPS employment data. Adjustments to the CPS underlying population base are made annually using intercensal estimates and every ten years using the decennial census. Also, establishment hours data are more consistent with the measures of output used to produce productivity measures; output data are based on data collected from establishments. In addition, establishment data provide reliable reporting and coding on industries and thus are well-suited for producing industry-level measures. Measures for industries based on household reports tend to produce industry estimates with considerable variance, even in a survey as large as the CPS. Thus, the BLS’s official measures by industry come from establishment surveys wherever possible. 11 The BLS is planning to collect CES data on earnings and hours for all employees and publish estimates in 2006.
16

viewed as changes in labor costs, do not affect hours growth.12 Production/ nonsupervisory
hours are calculated as:
52** NAWH POPT
P
(3)
where AWHPP
OPT represents average weekly hours for production/nonsupervisory workers
obtained from CES hours and adjusted by the hours-worked to hours-paid ratio and an
adjustment to remove nonprofit institutions, and N is the employment of nonfarm business
production/nonsupervisory employees.
P
Because they are not collected in the CES, the BLS estimates average weekly hours of
nonproduction/supervisory employees from the CPS.13 Data from the CPS are used to construct
a ratio of the average weekly hours worked by nonproduction/supervisory employees relative to
the average weekly hours worked by production/nonsupervisory employees. 14 Together with
CES hours and employment data, this ratio is used to calculate the total hours worked by
nonproduction/supervisory employees. Nonproduction/supervisory hours are calculated as:
52*** NAWHAWHAWH NPCPS
P
CPSNPOPT
P
(4)
where AWHNPCPS
and AWHPP
CPS represent CPS measures of average weekly hours for
nonproduction/supervisory and production/nonsupervisory workers respectively, and N is the
employment of nonfarm business nonproduction/supervisory employees.
NP
12 The hours worked to hours paid ratio is constructed using information from the National Compensation Survey program; prior to 2000, the annual Hours at Work Survey was used. 13 In August 2004, BLS introduced this new method of constructing estimates of hours for nonproduction and supervisory workers. See Eldridge, Manser, and Otto (2004). 14 In goods-producing industries, workers are divided into production and nonproduction workers. Nonproduction workers include professional specialty and technical workers; executive, administrative, and managerial workers; sales workers, and administrative support workers, including clerical. In service-producing industries, workers are divided into supervisory and nonsupervisory workers. Supervisory workers include all executives and administrative and managerial workers.
17

Data on hours worked by farm workers, proprietors, and unpaid family workers are taken
directly from the CPS; remaining data are obtained from various sources.15 To construct hours
worked in the U.S. business sector, the BLS removes hours worked by employees of nonprofit
institutions.
VI. Implications for Productivity Measures
As U.S. productivity increased unexpectedly near the 2001 recession, observers
suggested the BLS official productivity numbers were overstated because they missed some
hours worked. Some critics suggested that IT innovations have allowed workers the flexibility to
work outside the traditional workplace and that these hours are not properly measured.16 This
concern was most frequently expressed about the most commonly used measure of productivity
—quarterly labor productivity in the nonfarm business sector. It is important to note that an
underestimation of hours worked affects measures of productivity growth only if underestimated
hours grow differently than measured hours and affect a significant portion of the working
population. Eldridge (2004) found that a hypothetical hours series constructed by combining
CPS average weekly hours and CES employment data produced slightly higher levels of hours,
but hours showed a comparable trend from 2000-2003.
Hours worked are constructed separately for nonemployees, production/nonsupervisory
employees, and nonproduction/supervisory employees. Therefore, we analyze hours for each of
15 Employment counts for employees in agricultural services, forestry and fishing come from the BLS’s 202 program, based on administrative records from the unemployment insurance system. These counts are moved forward in the current period using limited information on employment in agricultural services (part of SIC 07). The number of employees of government enterprises comes from the BEA. These are moved forward using information from the CES. Average weekly hours for employees of government enterprises are from the CPS. 16 Steven Roach of Morgan Stanley Dean Witter argued that the government may be undercounting the number of hours people are working. He wrote that many white collar workers are in fact working longer workdays than the official U.S. data show, as a result of the new portable technologies of the information age — laptops, cellular telephones, home fax machines, and beepers; see Roach (1998, p.6).
18

these group separately. Figure 1 shows each group’s share of nonfarm business sector hours
worked and employment. Production/nonsupervisory employees account for the majority of all
nonfarm business sector hours, while nonemployees account for the smallest share of hours.
Figure 1. Share of Nonfarm Business Sector Hours and Employment, by Type of Worker: 2004
69%
19%
12%
Production and Nonsupervisory
Nonproduction and Supervisory
Nonemployees
71%
17%
12%
Hours Worked Employment
Nonemployees
Nonemployees are 12 percent of nonfarm business sector hours and employment and are
obtained directly from the CPS. They include contractors and the self-employed. There is
reason to be skeptical of these data because of the small sample size and the occurrence of proxy
reporting; however, the CPS is the only potential source of information for these data. Since
previous research on household surveys and self-reporting indicates that there is a tendency
toward over-reporting hours worked, it is unlikely that nonemployee hours are biased downward.
Production and nonsupervisory employees
1) Do those who bring work home work more hours?
19
Using the 2003-2005 ATUS data, we find that approximately 95 percent of daily hours
worked by production/nonsupervisory employees were worked at a workplace on their diary day
(Table 9). Among production/nonsupervisory employees, 87 percent worked exclusively at their
workplace on the diary day, while 5 percent brought work home from the workplace in 2003 and
6 percent brought work home in 2004 and 2005. 17
We find that average daily hours for employees who bring work home are greater than
the average for those who work exclusively in a workplace; average daily hours are 6 percent
greater in 2003, 4 percent greater in 2004, and 12 percent greater in 2005. We also find that
daily hours worked at the workplace by those who bring work home are less than the daily hours
worked at the workplace for those who work exclusively at a workplace on their diary day — 17
percent less in 2003, 13 percent less in 2004, and 10 percent less in 2005. Thus, it appears that
those who bring work home reallocate work from their workplace to their home, but on balance
work more total hours. To see whether these workers who bring work home on their diary day
work more hours in general than those who work exclusively in a workplace, we compare CPS
average weekly hours of each group. We find that those who bring work home from their
workplace reported similar average weekly hours to those who work exclusively in a workplace
in 2003, but 7 percent higher average weekly hours in 2004, and 13 percent higher average
weekly hours in 2005.
Using the 2001 and 2004 CPS supplement, we find that approximately 91 percent of
production/nonsupervisory employees report no work at home (Table 10). Among the nine
percent who do some work at home, respondents are asked to indicate whether they were paid
for work at home or whether they were simply taking work home. About 3 percent of
17 To analyze hours data, we further restrict the sample to those who have the same employer, occupation and usual duties as they reported to the CPS.
20

production/nonsupervisory employees report some paid work at home and 5 percent indicate
unpaid work at home. Comparing average weekly hours for those who bring unpaid work home
with those who do no work at home, we find that those who bring unpaid work home have
statistically significant higher average weekly hours (17-18 percent higher) than those who never
work from home.
2) Are hours at home being measured?
Hours worked by production/nonsupervisory employees account for 69 percent of
nonfarm business sector hours worked and 71 percent of employment. The BLS constructs
annual hours worked for this group by multiplying average weekly hours paid from the CES,
employment from the CES, the hours-worked to hours-paid ratio, and 52 weeks per year. The
hours-worked to hours-paid ratio removes paid vacation, holidays and sick leave. If hours for
production/nonsupervisory employees are understated it is only to the extent that workers work
without pay.
The ATUS does not obtain information on whether work conducted at home is paid or
unpaid. Therefore, to assess whether workers work at home without pay, we must make several
assumptions. First, we assume that hours worked at the workplace are paid and thus measured.
Although workers may work some unpaid hours at their workplace, it is also possible that they
shirk on the job. Second, we assume that hourly workers are less likely to do unpaid work than
salaried workers. The CPS Supplement indicates that over 81 percent of
production/nonsupervisory workers who bring unpaid work home are not paid hourly.
Therefore, we present data separately for all employees who bring work home and salaried
employees who bring work home. The ATUS suggests that approximately 5 to 6 percent of
21

hours worked by production/nonsupervisory employees occur outside a workplace. We find that
3 to 3.5 percent of production/nonsupervisory workers were paid a salary and brought work
home. Among these employees, we find that average daily hours were 9 percent greater than
those who worked exclusively in a workplace in 2003, 7 percent greater in 2004 and 11 percent
greater in 2005. Among those who bring work home and are paid a salary, we find that average
weekly hours were 2 percent greater than those who worked exclusively in a workplace in 2003,
17 percent greater in 2004 and 14 percent greater in 2005. The CPS supplement specifically asks
respondents whether they were paid to work at home or whether they just took work home. The
CPS Supplement data indicate that almost 6 percent of production/nonsupervisory employees
brought unpaid work home in 2001 and over 5 percent in 2004. Average weekly hours for those
who brought unpaid work home were 18 percent greater than average weekly hours of those that
did no work at home in 2001, and 17 percent greater in 2004.
These findings suggest that there may exist unmeasured hours for production/
nonsupervisory employees who work outside the workplace. A measure of hours for
production/nonsupervisory employees that differentiates between those who bring work home
and those who do not can be written as:
( )AWHwAWHwN bwhP
bwhP
bwhP
bwhPP ***52 ~~* + (5)
where wPP
~bwh and AWH ~bwhPP represent the share of production/ nonsupervisory workers who do
not bring unpaid work home and their average weekly hours respectively and wPP
bwh and
AWH bwh PP represent the share of production/nonsupervisory workers who do bring unpaid work
home and their average weekly hours respectively. By construction, wPP
~bwh and w bwhPP sum to
one. In order to estimate the percentage of hours worked at home that are not captured in the
22

BLS measure of hours for production/nonsupervisory employees, we construct the ratio of
equation 5 to equation 3 minus 1. This can be written as:
( )1
** ~~−
+
AWHAWHwAWHw
OPTP
bwhP
bwhP
bwhP
bwhP (6)
If we think of the OPT average weekly hours series as capturing a weighted average of the
average weekly hours of those who do not bring work home and the average weekly hours
worked in a workplace of those who bring work home:
( )γ bwhworkplaceP
bwhP
bwhP
bwhP
bwhP AWHwAWHwAWH OPT
P += ~ ~ (7)
where γPbwhworkplace represents the percent of hours worked at a workplace by those who bring
work home. We then solve (7) for wPP
~bwh AWH ~bwhPP , substitute into (6) and rearrange terms, to
get:
AWH
AWHwOPTP
bwhworkplaceP
bwhP
bwhP ⎟
⎠⎞⎜
⎝⎛ ⎟
⎠⎞⎜
⎝⎛ −γ1 (8)
From the ATUS and CPS Supplement data, we can estimate AWHPP
bwh. However, there are
several reasons why we would not want to use these estimates directly. First, the sample sizes
for those who report work at home in the ATUS and CPS supplement are small. Next, both data
sources are derived from the CPS, which the literature suggests gives upward biased reports of
hours worked and is subject to proxy reporting bias. Therefore, in order to estimate AWH bwhPP ,
we construct a ratio of the average weekly hours of those who bring work home relative to the
average weekly hours for all production/nonsupervisory workers and multiply that by the best
available estimate of average weekly hours for production/nonsupervisory employees, i.e., the
current OPT series.
23
⎟⎟⎟
⎠
⎞
⎜⎜⎜
⎝
⎛= AWH
AWH
AWHAWH OPT
P
P
bwhPbwh
P *^
^ (9)
where ^
AWH PP
bwh /^
AWH P represents the ratio of average weekly hours of production/
nonsupervisory employees who bring unpaid work home relative to the average weekly hours for
all production/nonsupervisory workers. Substituting equation (9) into (8) and rearranging terms
generates an estimate of the proportion of hours worked that are not captured in the BLS measure
of hours for production/nonsupervisory employees as:
γ bwh eP
P
bwhPbwh
P
AWH
AWHw hom
^
^
⎟⎟⎟
⎠
⎞
⎜⎜⎜
⎝
⎛ (10)
where (1-γPP
bwhworkplace ) is replaced with γ bwhhomePP , the percent of hours worked at home by those
who bring work home.
Table 11 presents the estimates of the components of equation 10 and the estimates of the
shares of unmeasured production/nonsupervisory hours in each year. We calculate the percent of
hours worked at home in the CPS Supplement by subtracting usual average weekly hours worked
at home from usual average weekly hours worked in total for those respondents who do not
report that their hours vary. The ATUS suggests that there may exist a 1 percent downwards bias
in the measured hours for production/nonsupervisory employees, while the CPS Supplement
suggests that the bias may be closer to 2 percent. However, the quality of these additional hours
at home may not be of the same quality as those worked in the workplace, especially if workers
are doing secondary childcare while working at home.
Nonproduction and supervisory employees
1) Do those who bring work home work more hours?
24

Using the 2003-2005 ATUS data, we find that approximately 93 percent of daily hours
worked by nonproduction/supervisory employees were worked at the workplace on their diary
day (Table 12). Among nonproduction/supervisory employees, roughly 80 percent worked
exclusively in a workplace on their diary day while 12 percent brought work home from the
workplace on their diary day in 2003, 8 percent brought work home from the workplace in 2004,
and 10 percent in 2005.
As with the production/nonsupervisory results, we find that average daily hours among
nonproduction/ supervisory employees who brought work home are greater than the average for
those who worked exclusively in a workplace; average daily hours are 11 percent greater in
2003, and 9 percent greater in 2004 and 2005. We find that daily hours worked at a workplace
by those who bring some work home are less than the daily hours in a workplace for those who
work exclusively in a workplace on their diary day — 6 percent less in 2003, 7 percent less in
2004, and 13 percent less in 2005.
In order to examine whether those workers who bring work home on their diary day work
more hours in general than those who work exclusively in a workplace, we compare the CPS
average weekly hours of each group. We find that those who bring work home from a workplace
report 13 percent higher average weekly hours than those who worked exclusively in a
workplace in 2003, 11 percent higher average weekly hours in 2004, and 5 percent higher
average weekly hours in 2005.
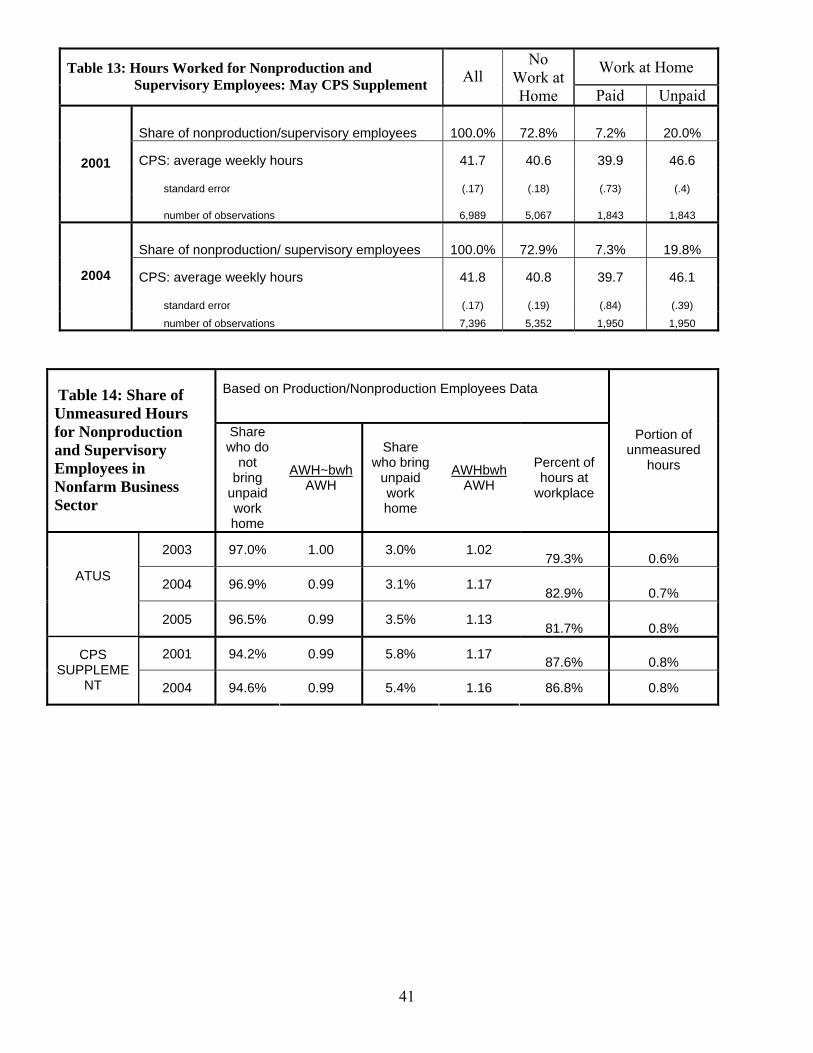
Using the 2001 and 2004 CPS supplement data, we find that approximately 73 percent of
nonproduction/supervisory employees reported no work done at home (Table 13). About 7
percent of nonproduction/supervisory employees reported doing some paid work at home and 20
percent reported that they bring unpaid work home. Comparing average weekly hours for those
25

who bring unpaid work home with those who do no work at home, we find that those who bring
unpaid work home have significantly higher average weekly hours than those who never work
from home — 15 percent greater in 2001 and 13 percent greater in 2004.
2) Are hours at home being measured?
Hours worked by nonproduction/supervisory employees account for approximately 19
percent of nonfarm business sector hours and 17 percent of employment. The BLS constructs
annual hours for these employees by multiplying the OPT measure of average weekly hours for
production/nonsupervisory employees by a ratio of the average weekly hours worked by
nonproduction/supervisory employees relative to the average weekly hours worked by
production/nonsupervisory employees from the CPS. Thus, any bias that exists in the
production/nonsupervisory hours measure will affect the nonproduction/supervisory employee
hours series.
Again, we assume that hours worked at a workplace are paid and thus measured, and that
hourly workers are less likely to do unpaid work than salaried workers. The CPS Supplement
indicates that over 94 percent of nonproduction/supervisory employees who bring unpaid work
home are not paid hourly. Using the ATUS, we find that approximately 7 to 9 percent of hours
worked by nonproduction/supervisory employees are worked outside of a workplace and that 7
to 10 percent of nonproduction/supervisory workers brought work home and were paid a salary.
Among these employees, we find that average daily hours were 11 percent greater than those
who worked exclusively in a workplace in 2003, 9 percent greater in 2004 and 2005. Among
those who bring work home and are paid a salary, we find that average weekly hours were 13
percent greater than those who worked exclusively in a workplace in 2003, 10 percent greater in
26

2004 and 9 percent greater in 2005. The CPS Supplement data indicate that almost 20 percent of
nonproduction/supervisory employees brought unpaid work home in 2001 and 2004. Average
weekly hours for those who bring unpaid work home are 15 percent greater than average weekly
hours for those who do no work at home in 2001, and 13 percent greater in 2004.
We find evidence that there may exist unpaid hours worked at home by nonproduction/
supervisory employees. If the necessary data existed, the measure of hours for
nonproduction/supervisory employees that differentiates between those who bring work home
and those who do not would be constructed as:
( )AWHwAWHwN bwhNP
bwhNP
bwhNP
bwhNPNP ***52 ~~* + (11)
where wNP~bwh and AWHNP
~bwh represent the share of nonproduction/supervisory workers who do
not bring unpaid work home and their average weekly hours respectively and wNPbwh and
AWHNPbwh represent the share of nonproduction/supervisory workers who do bring unpaid work
home and their average weekly hours respectively. By construction, wNP~bwh and wNP
bwh sum to
one. We estimate the percentage of hours worked that are not captured in the BLS measure of
hours for nonproduction/supervisory employees using the ratio of equation 11 to equation 4
minus 1. This can be written as:
( )1
** ~~
−
⎟⎟⎠
⎞⎜⎜⎝
⎛+
AWHAWH
AWH
AWHwAWHw
CPSP
CPSNPOPT
P
bwhNP
bwhNP
bwhNP
bwhNP (12)
Given that average weekly hours reported to the CPS should capture all hours for those who do
and do not bring work home, the numerator of the first term in equation (12) should be equal to
AWHNPCPS. Substituting AWHNP
CPS into equation (12) and rearranging terms, we construct a
measure of bias for nonproduction/supervisory workers as:
27

1
1−
⎟⎟⎠
⎞⎜⎜⎝
⎛
AWHAWH
CPSP
OPTP
(13)
Notice that the average weekly hours for nonproduction/supervisory employees cancels out, in
effect reducing the bias because OPT incorporates a portion of hours worked at home by
nonproduction/supervisory employees by using the CPS ratio in the construction of hours for
these employees. To estimate a value of (13) using ATUS and CPS Supplement data, we
substitute equation (7) into (13) and rearrange terms to get:
11~
~
−
+ γ bwhworkplace
PCPS
P
bwh
Pbwh
PCPS
P
bwh
Pbwh
P AWHAWHwAWH
AWHw
(14)
where γPP
bwhworkplace represents the percent of hours worked at a workplace by those who bring
work home. From the ATUS and CPS Supplement data, we can estimate the percentage of hours
worked that are not captured in the BLS measure of hours for nonproduction/supervisory
employees as:
11
^
^
^
^~
~
−
+ γ bwh workplace
P
P
bwh
Pbwh
P
P
bwh
Pbwh
P
AWHAWHw
AWHAWHw
(15)
where ^
AWH PP
bwh /^
AWH P represents the ratio of average weekly hours of production/
nonsupervisory employees who bring unpaid work home relative to the average weekly hours of
all production/nonsupervisory employees.
Table 14 presents the estimates of the components of equation 15 and the estimates of the
percentage of unmeasured hours in each year. We find that the ATUS suggests that there may
exist a 0.6 - 0.8 percent downwards bias in the measured hours for nonproduction/supervisory
employees, while the CPS Supplement suggests a slightly larger bias of 0.8 in 2001 and 2004.
28

Unmeasured hours
The effect of unmeasured hours for production/nonsupervisory employees and for
nonproduction/supervisory employees on BLS measures of nonfarm business sector productivity
must be weighted by the shares of hours that these groups of workers represent in measured total
hours. From Figure 1, we know that production/nonsupervisory employees account for the
majority of all hours worked, thus unmeasured hours by this group will be more heavily
weighted. Table 15 presents estimates of the percent of unmeasured hours worked at home.
From the ATUS, we estimate a 0.5 - 0.6 percent downward bias in the level of nonfarm business
sector hours measured, while the CPS Supplement gives a downward bias of 0.7 percent. Thus,
there appears to be support for the criticism that the BLS is not measuring all of the hours
worked; however, the evidence is not convincing that unmeasured hours are increasing over
time. In the ATUS we see a slight increase, while in the CPS there is no change.
VII. Conclusion
In this paper, we used both the ATUS and May CPS Work Schedules and Work at Home
Supplements to determine whether hours worked by non-farm business employees are
understated and increased between 2001-2005 due to unpaid and thus unreported hours worked
at home. The main advantage of using the CPS Supplement is that we can determine whether
work done at home is paid or unpaid. The main advantages of the ATUS are that we can observe
when during the day the work is being performed at home and get a more accurate measure of
the number of hours.
29
According to the ATUS, 7 percent of nonfarm employees did work at a workplace and
brought some of their work home on their diary day. From the CPS, we find that 8-9 percent of
nonfarm business employees did some unpaid work at home. A majority of CPS supplement
respondents indicated that they did work at home in order to finish or catch up on work. We find
evidence that suggests workers bring work home at least in part to better balance work and
family responsibilities. We find that fathers of young children are more likely to bring work
home than fathers of adolescents. In addition, 13 percent of bring-work-home workers reported
a child in their care while working at home in 2003. Five percent of respondents to the CPS
supplement directly indicated that they do unpaid work at home to better balance work and
family responsibilities. Results from the probit model also indicate that highly-educated, salaried
workers are much more likely to bring work home than their less-educated, hourly counterparts.
From both data sets we find that those who bring unpaid work home have higher average
weekly hours than those who work exclusively in a workplace. In addition, we find that total
hours at the workplace are lower than the hours at the workplace for those who do not bring
work home. Thus, it does appear that those who bring work home reallocate work from their
workplace to their home.
The ATUS suggests that there may exist a 0.5 - 0.6 percent downwards bias in measured
hours, while the CPS Supplement suggests that the bias may be slightly larger — 0.7 percent.
Although some hours worked at home are not captured by official hours series, neither the share
of employees working at home nor the percent of their hours worked at home has increased over
the period of study.
30

REFERENCES
Callister, Paul and Sylvia Dixon. “New Zealanders’ Work Time and Home Work Patterns: Evidence from the Time Use Survey” New Zealand Department of Labour. Occasional Paper 2001/5.
Eldridge, Lucy P., Marilyn E. Manser and Phyllis F. Otto, “Alternative Measures of Supervisory
Employee Hours and Productivity Growth,” Monthly Labor Review, April 2004, pp. 9-28. Eldridge, Lucy P. “Hours Measures for Productivity Measurement and National Accounting,” presented to Paris Group on Measuring Hours of Work, September 2004. Frazis, Harley and Jay Stewart. “What Can Time-Use Data Tell Us About Hours of Work?”
Monthly Labor Review, December 2004, pp. 3-9. Hamermesh, Daniel S. “Shirking or Productive Schmoozing: Wages and the Allocation of Time at Work.” Industrial and Labor Relations Review, 1990, vol. 43, no. 3, pp. 121S- 133S. Jacobs, Jerry A. “Measuring Time at Work: Are Self-Reports Accurate?” Monthly Labor Review, December 1998, pp. 42-53. Murphy, Bridget and Paul Satherley. “New Zealand Time Use Survey 1999” Key Statistics
2000, p. 7-9. Oettinger, Gerald. “The Growth in Home-Based Wage and Salary Employment in the United States, 1980-2000: How Much and Why?” Presentation at the Society of Labor Economist Meetings, 2004. Pabilonia, Sabrina Wulff. “Evidence on Youth Employment, Earnings, and Parental Transfers in the National Longitudinal Survey of Youth 1997,” Journal of Human Resources, 36(4) 2001. Pabilonia, Sabrina Wulff. “Working at Home: An Analysis of Telecommuting in Canada”,
Working Paper. 2005. Polivka, Anne E. and Jennifer M. Rothgeb. “Redesigning the CPS Questionnaire.” Monthly Labor Review, September 1993, pp. 10-28. Roach, Stephen S. “The Boom for Whom: Revisiting America’s Technology Paradox.” Morgan Stanley Dean Witter, Special Economic Study, January 9, 1998. Robinson, John and Ann Bostrom. “The Overestimated Workweek? What Time Diary Measures Suggest.” Monthly Labor Review, 1994, vol. 117, no. 8, pp. 11-23.
31

32
Schroeder, Christine and Ronald S. Warren, “The Effect of Home-Based Work on Earnings.” Unpublished manuscript. 2004.

33
Table 1: Percent of Nonfarm Business Employees by Location of Work
ATUS CPS Supplement
2003 2004 2005 2001 2004 Work exclusively at the workplace
85.1 85.0 83.9 No work at home 87.5 88.2
Do any work at home 9.8 11.2 11.7 Do any work at home 12.5 11.8 Work exclusively at home 2.9 3.6 4.1 Paid work at home 3.8 3.6 Bring work home 6.3 6.8 7.0 Unpaid work at home 8.7 8.2 Work at other locations 5.1 3.8 4.4 Number of respondents* 3,438 2,251 1,698 Number of respondents** 34,406 39,632* ATUS respondents represent only those whose diary day was a nonholiday, weekday. ** CPS Supplement respondents represent those who answered the question "As part of this job, do you do any of your work at home?"
Table 2. Proportion of Nonfarm Business Employees Who Bring Work Home, by Time of the Day Working at Home (Weekday Only) Time of Day 2003 2004 2005 4AM-6AM .04 .05 .03 6AM-8AM .09 .08 .12 8AM-10AM .07 .09 .05 10AM-12PM .03 .01 .02 12PM-2PM .04 .04 .06 2PM-4PM .03 .03 .01 4PM-6PM .06 .07 .09 6PM-8PM .10 .09 .19 8PM-10PM .15 .10 .09 10PM-12AM .06 .06 .05 Number of observations 246 175 110 Proportions are weighted to account for sampling design. Numbers are rounded and do not sum to 100 because a worker could be working in more than one time period.
Table 3. Proportion of Nonfarm Business Employees Who Bring Work Home, by Minutes Worked at Home (Weekday Only)
Minutes per day 2003 2004 2005 <15 .15 .17 .20 15-30 .15 .20 .17 30-60 .25 .29 .25 60-120 .21 .16 .12 120-180 .08 .09 .15 180-240 .05 .05 .04 240+ .10 .04 .08 Number of observations 246 175 110 Proportions are weighted to account for sampling design. Numbers are rounded.

34
Table 4. Means and Proportions of Nonfarm Business Employees in the ATUS, by Bring-Work-Home Status 2003 2004 2005 Bring
work home
Do not bring work
home
Bring work home
Do not bring work
home
Bring work home
Do not bring work
home Female .42 .41 .33 .43 .43 .50 Age 42.03
(0.90) 38.77 (0.29)
41.65 (1.04)
39.15 (0.35)
39.73 (1.77)
40.33 (0.50)
Black .03 .10 .06 .10 .06 .11 Other race .12 .05 .06 .05 .11 .05 Hispanic .05 .15 .04 .14 .05 .15 Married .69 .56 .66 .57 .58 .52 Divorced .14 .11 .09 .12 .09 .13 Spouse works .54 .46 .55 .47 .53 .44 Paid hourly .23 .64 .38 .65 .28 .65 EDUCATION High school dropout .04 .15 .02 .13 .06 .13 High school degree .19 .34 .23 .34 .10 .36 Some college .25 .28 .26 .29 .29 .27 Bachelor’s degree .33 .17 .30 .17 .40 .17 Advanced degree .19 .05 .19 .07 .15 .07 CHILDREN IN THE HOME Any child .45 .37 .46 .38 .20 .26 Infant .09 .07 .09 .07 .04 .05 Preschooler .16 .10 .12 .11 .05 .07 Elementary student .11 .09 .11 .10 .07 .06 Adolescent .09 .11 .14 .11 .05 .08 OCCUPATIONS Management and professional .58 .29 .45 .30 .48 .27 Service .06 .14 .05 .15 .06 .13 Sales and office .28 .26 .31 .25 .31 .29 Farming, fishing, and forestry .00 .00 .00 .00 .00 .00 Construction and maintenance .04 .12 .10 .12 .12 .12 Production, transportation, & material moving
.04 .20 .09 .17 .04 .19
INDUSTRY Agriculture, forestry, fishing & hunting
.00 .00 .00 .00 .00 .00
Mining .00 .00 .01 .01 .01 .01 Construction .05 .08 .08 .08 .06 .09 Manufacturing .21 .20 .15 .19 .11 .21 Wholesale and retail trade .16 .19 .24 .18 .18 .19 Transportation and utilities .03 .05 .04 .06 .04 .06 Information .08 .03 .08 .03 .07 .03 Financial activities .09 .09 .15 .11 .12 .08 Professional and business services
.14 .12 .10 .10 .17 .10
Educational and health services .16 .12 .10 .12 .09 .12 Leisure and hospitality .06 .08 .05 .09 .08 .07 Other services .03 .04 .02 .04 .05 .04 Public Administration .00 .00 .00 .00 .00 .00 Number of Observations 246 2,975 175 1,920 110 1,465 Note: Sampling weights are used to account for survey design. Standard errors in parentheses.

35
Table 5. Means and Proportions of Nonfarm Business Employees, by Bring-Home-Unpaid-Work Status CPS Supplement 2001 CPS Supplement 2004
Bring home unpaid work
Do not bring home
unpaid work
Bring home unpaid work
Do not bring home
unpaid work Female .39 .45 .38 .45 Age 40.96
(0.22) 37.60 (0.08)
42.52 (0.26)
38.23 (0.09)
Black .06 .12 .05 .12 Other race .05 .05 .07 .07 Hispanic1 .04 .13 .05 .16 Married .70 .54 .70 .53 Divorced .12 .13 .11 .13 Spouse works2 .52 .40 .49 .38 Part-time3 .06 .18 .07 .19 EDUCATION High school dropout .01 .16 .02 .16 High school degree .15 .35 .12 .34 Some college .23 .29 .23 .30 Bachelor’s degree .41 .16 .39 .16 Advanced degree .20 .04 .24 .05 PRESENCE OF CHILDREN IN THE HOME Any child .44 .33 .41 .32 Infant .08 .07 .08 .06 Preschooler .13 .09 .11 .09 Elementary student .11 .09 .09 .08 Adolescent .13 .09 .12 .09 OCCUPATIONS Management and professional .56 .19 .38 .17 Service .11 .06 .03 .18 Sales and office .13 .05 .25 .29 Farming, fishing, and forestry .55 .01 .00 .00 Construction and maintenance .02 .07 .03 .11 Production, transportation, & material moving .01 .01 .02 .18 INDUSTRY Agriculture, forestry, fishing & hunting .00 .00 .00 .00 Mining .01 01 .00 .00 Construction .01 .01 .05 .08 Manufacturing .04 .07 .15 .17 Wholesale and retail trade .11 .12 .16 .20 Transportation and utilities .07 .08 .03 .05 Information .03 .05 .05 .03 Financial activities .03 .02 .16 .08 Professional and business services .01 .01 .20 .10 Educational and health services .08 .05 .15 .12 Leisure and hospitality .10 .23 .03 .12 Other services .16 .07 .01 .04 Public administration .00 .01 .00 .00 Number of Observations 2,908 31,041 3,160 36,472 Note: Sampling weights are used to account for survey design. Standard errors in parentheses. 1. Hispanic proportions for 2001 are based upon 34,075 non-missing observations. 2. Spouse works proportions for 2004 are based upon 39,520 non-missing observations. 3. Part-time proportions for 2001 are based upon 31,895 non-missing observations on hours worked per week.
36
Table 6: Percent of Nonfarm Business Employees Who Bring Unpaid Work
Home, by Frequency and Reason for Work at Home 2001 2004
at least once a week 71.1 73.3
at least every two weeks 13.1 11.7
at least once a month 9.7 9.6
Frequency of work at home
less than once a month 6.1 5.5
Finish or catch up on work 59.5 56.0
Business is conducted from home 4.0 3.5
Nature of the job 24.0 28.8 Coordinate work schedule w/ personal or family needs 4.8 4.7
Reduce commuting time or expense 1.3 1.2 Local transportation or pollution control program 0.0 0.0
Main Reason for Working at Home
Some other reason 6.4 5.8
37
Table 7. Effect of Selected Covariates on the Probability of Bringing Work Home for Nonfarm Business Employees, ATUS Weekday Only All Employees Salaried Employees Female -0.011
(0.010) -0.017 (0.015)
Age -0.000 (0.002)
-0.002 (0.003)
Age squared/1000 0.007 (0.019)
0.018 (0.030)
Black -0.024* (0.013)
-0.047*** (0.014)
Other race 0.025 (0.019)
0.062** (0.032)
Hispanic -0.041*** (0.009)
-0.045*** (0.014)
Married -0.002 (0.013)
0.006 (0.019)
Divorced 0.007 (0.013)
0.031 (0.024)
Spouse works 0.012 (0.009)
0.010 (0.013)
High school degree 0.001 (0.020)
0.072* (0.042)
Some college 0.031 (0.026)
0.111** (0.051)
Bachelor's degree 0.065** (0.033)
0.180*** (0.063)
Advanced degree 0.088** (0.041)
0.219*** (0.076)
Part time 0.006 (0.012)
0.045 (0.028)
Paid hourly -0.054*** (0.008)
-
Any child 0.024 (0.019)
0.015 (0.024)
Any child * female -0.040** (0.019)
-0.026 (0.033)
Youngest child aged 3-5 -0.006 (0.016)
0.005 (0.024)
Youngest child age 3-5 * female 0.047 (0.047)
-0.009 (0.041)
Youngest child aged 6-10 -0.002 (0.019)
-0.014 (0.024)
Youngest child aged 6-10 * female 0.046 (0.047)
0.113 (0.084)
Youngest child aged 11-18 -0.029** (0.014)
-0.027 (0.021)
Youngest child aged 11-18 * female 0.103* (0.064)
0.029 (0.059)
F-statistic 7.81 2.79 Number of observations 6,894 2,849 Notes: All regressions include region, occupation, industry, and year indicators as well as a constant. Marginal effects are evaluated at the mean. Standard errors are in parentheses. Significance levels: * =p<.10;**=p<.05;***=p<.01.

38
Table 8. Effect of Selected Covariates on the Probability of Bringing Home Unpaid Work for Nonfarm Business Employees in the CPS Supplement, by Year 2001 2004 Female 0.002
(0.004) -0.015*** (0.004)
Age 0.006*** (0.001)
0.004*** (0.001)
Age squared/1000 -0.064*** (0.012)
-0.039*** (0.011)
Black -0.029*** (0.004)
-0.026*** (0.004)
Other race -0.032*** (0.004)
-0.015*** (0.005)
Hispanic -0.029** (0.005)
-0.019*** (0.004)
Married 0.009 (0.006)
0.004 (0.005)
Divorced 0.012 (0.006)
-0.000 (0.005)
Spouse works 0.004 (0.004)
-0.001 (0.004)
High school degree 0.058*** (0.011)
0.014 (0.009)
Some college 0.108*** (0.013)
0.040*** (0.010)
Bachelor's degree 0.259*** (0.021)
0.099*** (0.015)
Advanced degree 0.404*** (0.028)
0.182*** (0.024)
Part time -0.031*** (0.004)
-0.029*** (0.004)
Any child 0.017** (0.008)
0.024*** (0.008)
Any child * female -0.030*** (0.009)
-0.024*** (0.008)
Youngest child aged 3-5 0.008 (0.009)
-0.005 (0.007)
Youngest child age 3-5 * female 0.019 (0.018)
0.024 (0.018)
Youngest child aged 6-10 -0.002 (0.009)
-0.014** (0.006)
Youngest child aged 6-10 * female 0.012 (0.017)
0.018 (0.017)
Youngest child aged 11-18 -0.006 (0.008)
-0.016*** (0.006)
Youngest child aged 11-18 * female 0.036* (0.020)
0.031* (0.019)
F-statistic 51.76 62.53 Number of observations 31,593 39,520 Notes: All regressions include region, occupation, industry, and year indicators as well as a constant. Marginal effects are evaluated at the mean. Standard errors are in parentheses. Significance levels: * =p<.10;**=p<.05;***=p<.01.

39
Bring Work HomeTable 9: Hours Worked for Production and Nonsupervisory Employees: ATUS
All
Workplace
Only All Salaried Share of production/ nonsupervisory employees 100.0% 87.3% 4.7% 3.0% CPS: average weekly hours 37.1 37.1 37.4 38.1 standard error (0.33) (0.34) (1.63) (1.97)
number of observations 2,091 1,800 115 115 2003 ATUS: daily hours 8.0 8.1 8.7 8.9
% daily hours at office 95.2% 100.0% 78.4% 79.3% % daily hours at home 2.3% - 20.2% 19.4% Share of production/ nonsupervisory employees 100.0% 86.4% 6.4% 3.1% CPS: average weekly hours 36.7 36.7 39.3 42.8 standard error (0.44) (0.47) (2.06) (2.48) number of observations 1,385 1,167 103 103
2004 ATUS: daily hours 8.0 8.1 8.5 8.7 % daily hours at office 94.1% 100.0% 83.7% 82.9% % daily hours at home 3.8% - 15.6% 16.8% Share of production/ nonsupervisory employees 100.0% 86.4% 6.1% 3.5% CPS: average weekly hours 37.5 37.2 42.1 42.3 standard error (0.55) (0.61) (1.52) (2.08) number of observations 1,047 901 61 61
2005 ATUS: daily hours 8.0 8.1 9.1 9.0 % daily hours at office 95.1% 100.0% 80.3% 81.7% % daily hours at home 2.5% - 17.9% 17.4%
Work at Home Table 10: Hours Worked for Production and Nonsupervisory Employees: May CPS Supplement All No Work
at Home Paid Unpaid
Share of production/ nonsupervisory employees 100.0% 91.3% 2.9% 5.8% 2001
CPS: average weekly hours 36.4 36.0 37.8 42.5 standard error (.09) (.09) (.64) (.4)
number of observations 27,727 25,057 2,372 2,372
Share of production/ nonsupervisory employees 100.0% 91.7% 2.9% 5.4% 2004
CPS: average weekly hours 36.1 35.8 37.5 41.9 standard error (.09) (.1) (.67) (.44)
number of observations 32,581 29,540 2,707 2,707

40
Table 11: Share of Unmeasured Hours for Production and Nonsupervisory Employees in Nonsupervisory Employees in Nonfarm Business Sector
Those who bring unpaid work home
Share of production/
nonsupervisory employees
AWHbwh
AWH % of hours worked at
home
Percentage of unmeasured hours
2003 3.0% 1.02 19% 0.6%
2004 3.1% 1.17 17% 0.6% ATUS
2005 3.5% 1.13 17% 0.7%
2001 5.8% 1.17 13% 0.9% CPS SUPPLEMENT 2004 5.4% 1.16 13% 0.8%
Bring Work Home Table 12: Hours Worked for Nonproduction and Supervisory Employees: ATUS
All
Workplace
Only All Salaried Share of nonproduction/ supervisory employees 100.0% 76.9% 12.2% 10.4% CPS: average weekly hours 42.5 41.9 47.1 48.3 standard error (.52) (.56) (1.5) (1.53) number of observations 693 535 86 86 2003 ATUS: daily hours 8.6 8.8 9.7 9.9 % daily hours at office 92.5% 100.0% 84.4% 84.1% % daily hours at home 3.8% - 13.6% 13.8% Share of nonproduction/ supervisory employees 100.0% 80.5% 8.1% 6.6% CPS: average weekly hours 42.5 42.0 46.7 47.1 standard error (.58) (.62) (1.39) (1.58) number of observations 535 424 48 48 2004 ATUS: daily hours 8.5 8.6 9.4 9.4 % daily hours at office 90.8% 100.0% 84.7% 83.8% % daily hours at home 5.9% - 15.1% 16.0% Share of nonproduction/ supervisory employees 100.0% 75.1% 10.3% 7.9% CPS: average weekly hours 42.5 41.7 43.9 45.8 standard error (.62) (.69) (1.51) (1.45) number of observations 369 288 32 32 2005 ATUS: daily hours 8.2 8.6 9.4 9.4 % daily hours at office 93.0% 100.0% 79.9% 81.8% % daily hours at home 5.0% - 15.8% 13.0%
41
Work at Home Table 13: Hours Worked for Nonproduction and Supervisory Employees: May CPS Supplement All
No Work at Home Paid Unpaid
Share of nonproduction/supervisory employees 100.0% 72.8% 7.2% 20.0%
CPS: average weekly hours 41.7 40.6 39.9 46.6
standard error (.17) (.18) (.73) (.4)
2001
number of observations 6,989 5,067 1,843 1,843
Share of nonproduction/ supervisory employees 100.0% 72.9% 7.3% 19.8%
CPS: average weekly hours 41.8 40.8 39.7 46.1
standard error (.17) (.19) (.84) (.39)
2004
number of observations 7,396 5,352 1,950 1,950
Based on Production/Nonproduction Employees Data Table 14: Share of
Unmeasured Hours for Nonproduction and Supervisory Employees in Nonfarm Business Sector
Share who do
not bring
unpaid work home
AWH~bwh AWH
Share who bring
unpaid work home
AWHbwh AWH
Percent of hours at
workplace
Portion of unmeasured
hours
2003 97.0% 1.00 3.0% 1.02 79.3% 0.6%
2004 96.9% 0.99 3.1% 1.17 82.9% 0.7%
ATUS
2005 96.5% 0.99 3.5% 1.13 81.7% 0.8%
2001 94.2% 0.99 5.8% 1.17 87.6% 0.8% CPS SUPPLEME
NT 2004 94.6% 0.99 5.4% 1.16 86.8% 0.8%
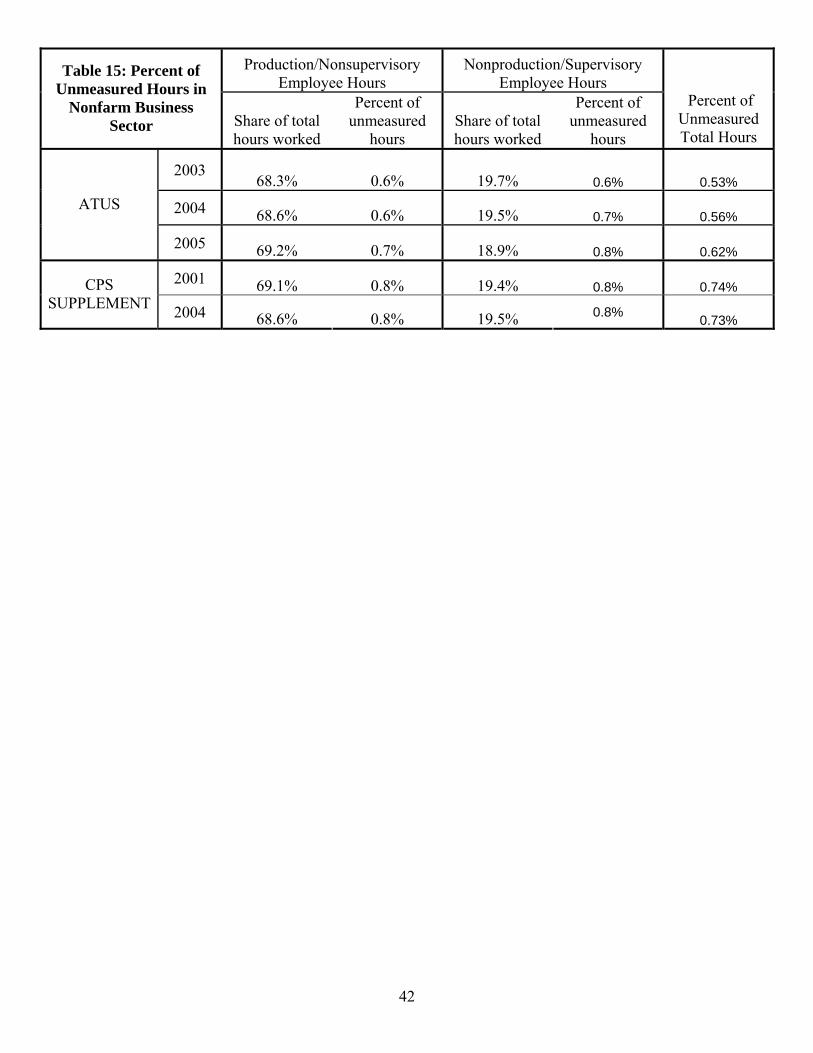
42
Production/Nonsupervisory Employee Hours
Nonproduction/Supervisory Employee Hours
Table 15: Percent of Unmeasured Hours in
Nonfarm Business Sector Share of total
hours worked
Percent of unmeasured
hours Share of total hours worked
Percent of unmeasured
hours
Percent of Unmeasured Total Hours
2003 68.3% 0.6% 19.7% 0.6% 0.53%
2004 68.6% 0.6% 19.5% 0.7% 0.56% ATUS
2005 69.2% 0.7% 18.9% 0.8% 0.62%
2001 69.1% 0.8% 19.4% 0.8% 0.74% CPS SUPPLEMENT 2004 68.6% 0.8% 19.5% 0.8% 0.73%
Related Documents


![How to Bring Purpose and Passion to Your Work [webcast]](https://static.cupdf.com/doc/110x72/588924f31a28ab77528b5edf/how-to-bring-purpose-and-passion-to-your-work-webcast.jpg)