Faculty of Business and Law School of Accounting, Economics and Finance ECONOMICS SERIES SWP 2008/08 Are the Female Headed Households More Food Insecure? Evidence from Bangladesh Debdulal Mallick Deakin University and BRAC and Mohammad Rafi* Research and Evaluation Division, BRAC The working papers are a series of manuscripts in their draft form. Please do not quote without obtaining the author’s consent as these works are in their draft form. The views expressed in this paper are those of the author and not necessarily endorsed by the School or IBISWorld Pty Ltd.

Welcome message from author
This document is posted to help you gain knowledge. Please leave a comment to let me know what you think about it! Share it to your friends and learn new things together.
Transcript
Faculty of Business and LawSchool of Accounting, Economics and Finance
ECONOMICS SERIES
SWP 2008/08
Are the Female Headed Households More Food
Insecure? Evidence from Bangladesh
Debdulal Mallick Deakin University and BRAC
and Mohammad Rafi* Research and Evaluation Division,
BRAC
The working papers are a series of manuscripts in their draft form. Please do not quote without obtaining the author’s consent as these works are in their draft form. The views expressed in this paper are those of the author and not necessarily endorsed by the School or IBISWorld Pty Ltd.
Are the Female Headed Households More Food Insecure?
Evidence from Bangladesh
Debdulal Mallick Deakin University and BRAC
and
Mohammad Rafi*
Research and Evaluation Division, BRAC
August 2008
* The authors would like to acknowledge the helpful comments and assistance offered by Prasad Bhattacharya, Matthew Clarke, Shyamal Chowdhury, Rajeev Dehejia, Chris Doucouliagos, Chris Geller, Mike Kidd, Atonu Rabbani, John Strauss and Mehmet Ulubasoglu. The Research and Evaluation Division of BRAC, Bangladesh has generously provided the dataset. All errors and omissions are the sole responsibility of the authors, and the conclusions do not necessarily reflect the views of the organizations with which they are associated.
Are the Female Headed Households More Food Insecure? Evidence from Bangladesh
Abstract
This paper uses household and village level survey data to investigate the food security of
male and female headed households in Bangladesh with particular attention to indigenous ethnic
groups. Given the broadness of the concept of food security and complexities of choosing any
particular metric, we depend on the perceptions of the respondents about their own food security
status. Based on food production, availability, purchasing power and access to common
resources, the respondents defined the food security status of their households in any of the four
categories—severe (chronic) food shortage, occasional (transitory) food shortage, breakeven, and
food surplus. Given the ordered nature of the responses, a generalized threshold model has been
estimated.
We do not find any significant difference in the food security between the male and
female headed households especially among the indigenous ethnic groups. This result contradicts
the conventional idea about the vulnerability of the female headed households. However, we find
that the female heads are “activity burdened” as they maintain household chores in addition to
working outside. Absence of social and cultural restrictions among the indigenous groups permits
greater freedom to their females to participate in the labor force. This coupled with lower
dependency ratio in the female headed households is attributed to their less food insecurity. This
result may be indicative in the sense that non-economic institutions can significantly impact upon
economic outcomes such as improving the food security of a household especially the female
headed one. This has important policy implications as well. Designing development assistance
programs should take into consideration the social and cultural heterogeneity even within a region
in a country.
JEL classification Nos.: C25, J15, J16
Key words: Food security, female headed households, generalized threshold model, indigenous ethnic group, South Asia, Bangladesh. Corresponding author:
Debdulal Mallick School of Accounting, Economics and Finance Deakin University 221 Burwood Hwy, Burwood Victoria 3125, Australia Phone: (+ 61 3) 92517808 Fax: (+ 61 3) 92446283 Email: [email protected]
Mohammad Rafi Research and Evaluation Division BRAC 75 Mohakhali Dhaka 1212, Bangladesh Email: [email protected]
2
Table of Contents
1 Introduction
2 Food security and gender of the household head
3 Chittagong Hill Tracts and the ethnic groups
4 Data
5 Descriptive Statistics
6 Analytical framework
7 Results
8 Conclusion
References
Tables
3
1 Introduction
It is generally observed that female headed households are more food insecure
than male headed households. The former are said to be more vulnerable to food
insecurity due to the “triple burden”, i) the female head who is the main income earner
faces various disadvantages in the labor market and many productive activities, ii) she is
also responsible for maintaining the household including household chores and child care
in addition to working outside, and thus she is “activity burdened”, and iii) she faces
higher dependency ratio for being the single income earner (Fuwa, 2000). In this paper
we investigate the food security of male and female headed households using household
and village level survey data for the Bengali and four indigenous ethnic groups living in
the Chittagong Hill Tracts (CHT) in Bangladesh.1
This paper departs from the existing literature in two respects. First, we use the
perception of the respondents about their own food security status because no single
observable measure can fully capture the broadness of the concept of food security
(Chung et al., 1997). Consumption (converted into calories) is sometimes used as a proxy
but given the seasonal volatility of consumption, data from a single survey systematically
under- or over-reports the true food security. Based on food production, availability,
purchasing power and access to common resources, the respondents defined the food
security status of their households in any of the following four categories—severe
(chronic) food shortage, occasional (transitory) food shortage, breakeven, and food
surplus. Second, we pay particular attention to the food security of the indigenous ethnic
groups. It has been observed that the indigenous ethnic groups have historically been
concentrated in certain geographical regions which are usually characterized by low
productivity and high incidence of poverty (Fuwa, 2000). These areas often lack adequate
public services such as health facilities, schools, and proper sanitation. Indigenous people
also face discrimination in the labor market, such as lower earnings after controlling for
education and other work characteristics (World Bank, 1999). The CHT is no exception,
justifying an independent investigation of the food security of the indigenous groups. 1 This paper uses data from the study conducted in 1999 by the Research and Evaluation Division of BRAC, Bangladesh. To the best of our knowledge, this is the first and only scientific survey conducted on the Chittagong Hill Tracts. For a detail discussion about the study, see Rafi and Chowdhury (2001, chapter 3).
4
Although the ethnic groups are heterogeneous in terms of food habit, language,
religion and cultural practices, there is remarkable homogeneity within each ethnic group.
The same factors contribute to the perceptions about food security of both male and
female headed households. Therefore, there is no reason that the perceptions of these two
types of households should differ systematically.
Given that the responses on food security are ordered, we estimate the generalized
threshold model introduced by Maddala (1983) and Terza (1985) that overcomes several
limitations of the ordered probit model. Since the coefficients estimated have no
meaningful interpretation without a bit of extra calculation, we calculate the elasticities
and marginal effects. Our main finding is that there is no significant difference in food
security between male and female headed households among the indigenous ethnic
groups, in contrast to the conventional view about the vulnerability of the female headed
households. However, this result does not hold if Bengalis are included in the sample and
is robust to alternative specifications. There may be very different causes of female
headship and in some instances headship may not be self-selected which can bias the
results. For example, widows usually become head of a household in the absence of adult
male. To account for such bias, if any, we estimate a probit model in the first stage that
regresses gender of the household head on dummies for their marital status and ethnicity
to obtain a predicted probability, and then replace gender by this predicted probability to
estimate the generalized threshold regression in the second stage. Our results are robust to
this endogeneity correction.
We explore several possible explanations from development literature and
provide two reasons. First, absence of social and cultural restrictions among the
indigenous groups in the CHT permits greater freedom to indigenous females to
participate in the labor force. The indigenous ethnic groups practise Buddhism, Hinduism
and animism, while the Bengalis are predominantly Muslim and they are socially and
culturally conservative (Khan, 1997). Females from indigenous groups engage in income
generating activities outside the household at a higher rate. Second, lower dependency
ratio in the female headed households reinforces the former. The marginal effect of the
gender of the household head is not significant for the indigenous groups but becomes
significant when interacted with demographic dependency ratio. Informal transfers to the
5
female headed households also take place in the CHT especially among the indigenous
ethnic groups. But we are not able to conclude that such redistribution mitigates food
insecurity on a continual basis. However, we find that female headed households are
“activity burdened” as they maintain household chores in addition to working outside and
thus corroborating one of the tenets of the “triple burden”.
The first reason is indicative in the sense that non-economic institutions can
significantly impact upon economic outcomes such as improving the food security of a
household especially the female headed one. This finding has important policy
implications as well. Designing development assistance programs should take into
consideration the social and cultural heterogeneity even within a region in a country.
The rest of the paper is organized as follows. Section 2 reviews the literature on
the incidence of and reasons for differential food security among male and female headed
households. Section 3 describes the CHT and different ethnic groups living therein.
Sampling procedures, data collection methods and variables considered are discussed in
section 4. Section 5 reports the descriptive statistics of food security for the ethnic
groups. We explain our estimation model in section 6, and results in section 7. Finally,
section 8 concludes.
2 Food security and gender of the household head
Concept of food security
Food security is a multifaceted concept. No single measure can encompass all of
its aspects (Chung et al., 1997, p. 8). However, briefly it can be defined as the peoples’
security against risks of not having access to required food. At the household level, food
security is defined as sustainable access to sufficient quantity and quality of food to
ensure adequate dietary intake and a healthy life for all household members (FAO, 1992).
At the national or regional level, food must be both available and accessible. Availability
is achieved through ensuring that domestic production, net food imports and national
food stocks are sufficient to cover national requirements. However, even when aggregate
food supplies are adequate, a number of factors may prevent poor households or
individuals from accessing food. They may lack purchasing power, may not have access
to land for own cultivation, or may lack the necessary assets or access to credit that helps
6
them smooth consumption. Furthermore, they may find themselves outside any public
assistance or other program that provides them with in-kind or cash transfers to
supplement their food acquisition capacity (Sen, 1981, 1995).
Food (in)security has also a temporal dimension. It is defined as transitory when a
population suffers from a temporary decline in food consumption and as chronic when a
population is continuously unable to acquire sufficient food (Chung et al., 1997, p. 5).
Depending on its asset endowments, a household adopts different strategies to cope with
transitory food insecurity that often involve borrowing money, and sale or consumption
of productive assets. These practices may undermine the long-term productive potential
of poor households and may eventually lead to chronic food insecurity. While transitory
food insecurity, famine in its extreme form, is more visible and draws more attention,
chronic food insecurity is a much deeper problem and is closely related to structural
factors associated with extreme poverty (Cathey, 2006, p. 179).
Households most vulnerable to food insecurity generally include those which lack
productive assets and depend on irregular income from daily wage labor. Groups such as
day laborers, casual fishermen and beggars fall into this category (Sen, 1981).
Households living in areas that are susceptible to natural disasters, or are inaccessible or
unsuitable for agricultural production are also vulnerable to food insecurity. Within
households, women, girls, elderly and disabled members are often the victims of
discrimination and therefore more vulnerable.2 Access to proper sanitation and health
care, general nutritional awareness, and caring practices are important determinants of an
individual’s capacity to absorb and utilize the nutrients in the diet and ultimately of one’s
food security status.
Food security and female headed households
It is generally considered that female headed households are more vulnerable to
food insecurity. In the introduction we mentioned the “triple burden” that results in
greater vulnerability for the female headed households. However, there is no empirical
regularity of the simultaneous presence of all three factors. For example, Barros, Fox and
2 For the difference in the calorie intake by male and female in the rural Bangladesh, see Table 2 in Chen, Huq and D’Souza (1981, p. 61).
7
Mendonça (1997, p. 232) observe in the context of urban Brazil that the main reason for
female headed households being poor is not a lower number of earners relative to family
size but the lower earning power of these earners. Since males earn more than females in
the same job, a household lacking male-earned income simply has a much higher
probability of being poor. In addition, socio-cultural factors can prohibit women’s
participation in the labor force. In some of the poorest areas of South Asia, cultural
restrictions on women’s ability to participate fully in food production activities have left
them particularly vulnerable in times of economic crisis (Kabeer, 1990, p. 1).
Female headed households are more vulnerable to non-income aspects of poverty
as well. Being “activity burdened” female headed households employ additional
household members including school going children in income generating activities. This
is reflected in the low attainment in schooling for children in the female headed
households (Buvinić and Rao Gupta, 1997, p. 268). McLanahan (1985, p. 883) also finds
that, after controlling for income, children in the female headed households have a lower
rate of socio-economic attainment than children in the male-headed households. If female
headed households utilize all available resources including existing human capital to
survive, then they cannot invest in future human capital formation so that the likelihood
of transmitting poverty to the next generation is higher. There is also heterogeneity
among the female headed households with different reasons for being the household
head. For example, Drèze and Srinivasan (1997) find evidence that widow headed
households are more disadvantaged than other types of female headed households.
There are also counter examples that female headed households are no less food
insecure than male headed households. Quisumbing et al. (1995), using household survey
data set for 10 developing countries, find no significantly (in a statistical sense) higher
incidence of poverty among the female headed households in two-thirds of the countries.
Among the exceptions is Bangladesh where female headed households have consistently
higher poverty among the bottom third of the population (this survey did not include the
indigenous ethnic groups living in the CHT).
The higher incidence of poverty among the female headed households is also
subject to the poverty indices used for measurement. For example, Drèze and Srinivasan
(1997, p. 227-228), in the context of rural India, find no evidence of higher incidence of
8
poverty among female headed households in terms of standard poverty indices based on
household per capita expenditure. This finding is robust to using adult equivalence
consumption for reasonable choice of consumption equivalence scales. But the female
headed households are poorer after controlling for economies of scale that accounts for
their smaller size. In other words, after controlling for household size and child-adult
ratio, female headed households are poorer than the male headed households. Ravallion
and Lanjouw (1995, p. 1413) find that the relationship between household size and
consumption (and therefore poverty) depends on the size elasticity of the cost of living.
Female controlled incomes have a more favorable impact on intra-household
allocation than male controlled income (Duflo, 2005). Unearned income in the hands of a
mother contributes greater improvement in child’s health and nutrition (Thomas, 1990),
and larger expenditure shares in household nutrients, health and housing (Thomas, 1992).
Buvinić and Rao Gupta (1997, p. 269), reviewing 65 studies carried out in the last
decade, conclude that female headed households prefer to invest scare resources in
children, which translates to increased child welfare relative to income. Duflo and Udry
(2004) find that a bigger share of women’s contribution to the household income is spent
on food and on private goods for women. On the other hand, a bigger share of men’s
contribution to the household income is spent on alcohol and tobacco and on private
goods for men.
3 The Chittagong Hill Tracts and the ethnic groups
The purpose of this section is to describe the overall economic
(under)development in the region, and also the ethnic and socio-cultural differences
between Bengalis and indigenous groups. These differences, as we argue later, are
important in explaining food security of the female headed households.
The Chittagong Hill Tracts (CHT), with an area of 13,181 square kilometres
representing 9.15% of Bangladesh, is located in the south-eastern tip of the country.
Altogether 11 small indigenous groups Mongoloid by ethnic origin live in the CHT. The
groups are Bawm, Chak, Chakma, Khumi, Kheyang, Lushei, Marma, Mro, Pankhua (or
Pankko), Tanchangya, and Tripura. The groups have closer resemblance with hill peoples
of the vast strip of land extending from Tibet to Indo-China (Khan, 1995, p. 3). The
9
ethnic origin, socio-cultural background and geographical features of the region make the
hill peoples different from Bengalis. However, there are also heterogeneity among the
indigenous groups in terms of language, cultural practices, religion and even food habit.
Insert Table 1 here
Table 1 shows that the population size varies widely among the ethnic groups. In
one extreme, Bengalis constitute about 49% of the total population. Among the
indigenous ethnic groups Chakma, Marma, Tripura, and Mro are more numerous each
with more than 20,000 people and together constitute 92.8% of the indigenous people in
the region.
As part of the policy of the Government of Bangladesh (GOB), Bengalis were
systematically settled in the CHT in three phases in 1980-84. By the end of this period
300,000-400,000 Bengalis had settled (The Guardian, 1984). Their settlement during the
period was so heavy that it made the Bengalis the dominant socio-cultural group in the
region. Although the indigenous population in the CHT increased annually on average by
2.4% during 1901-1991, their proportion to total population decreased from 93% to
51.4% during the same period.3 One may question from where was the land made
available for a large number of Bengalis? A few thousand acres of reserve forest
containing both mixed and hilly lands were released for settlement, but these lands hardly
amounted to one-tenth of what was required for the settlement (May, 1984; Rafi and
Chowdhury, 2001, p. 31). The rest were settled by evicting the indigenous people from
their lands by grossly violating their traditional rights and affecting their lifestyles. The
settlement policy of the GOB made 100,000 indigenous people homeless. About half of
them became refugees in the Indian states of Tripura and Mizoram. The rest scattered
themselves within the region living either as dependents on their relatives or moved into
the forest (Mohsin and Ahmed, 1996, p. 271).
3 This information is based on 1992 census. Since migration of Bengalis has been continuing, it is generally thought that the indigenous groups are now minority in the CHT.
10
The economy of the CHT is predominantly agricultural. The jhume (or swidden)4
cultivation is the traditional and predominant mode of cultivation practised by the
indigenous people. A Chakma Raja in the later part of 19th century, after realizing that
plough cultivation is more productive than jhuming, decided to introduce it in his
territory. Thereafter it gradually penetrated into the agricultural production system in the
CHT (Shelley, 1992, p. 65). The cultivation is done at the plains located in the river
valleys and stretch of plains between hills where irrigation is possible. In the recent
decades the indigenous groups have considerably been deprived of these lands because of
construction of a dam on the Karnofully river to generate hydroelectricity inundating
most of these lands and eviction from their lands for the settlement of Bengalis.
Very recently national NGOs such BRAC and Grameen Bank have extended
microfinance program in the region. International development agencies (such as UNDP,
USAID) have also undertaken several development programs both directly and indirectly
through the government.
4 Data This study addresses the ethnic groups having more than 20,000 people. The
selected ethnic groups are Bengali, Chakma, Marma, Mro and Tripura that constitute
more than 96% of total population in the CHT. Altogether 510 households were targeted
for survey from each of the five ethnic groups observed, totalling 2,550. A two step
sampling procedure was followed in selecting the households. First, 30 villages were
randomly selected from the total villages for each ethnic group under observation. A
general tradition in the CHT is that people of the same ethnic group usually live in a
particular village. Second, a list of all households in each village was prepared with the
4 The jhume is a mode of cultivation practised by the indigenous people in the CHT, neighboring Indian states and some other parts of the world such as the Amazon forest. In January/February a plot in the hill which is gentle in slope and covered with vegetation but not by a dense forest is selected for jhuming. The jungle and the bamboo are slashed down and lower parts of large trees are denuded. The chopped down vegetation is left there to dry and then set ablaze. The process fertilizes the top-soil of the plot as it gets burnt along with the dried plants. Next, small beds are prepared in the plot. In these beds paddy and a variety of seeds are sown all together in May. The harvesting of crops/vegetables is done throughout the year as they ripe at different times of the year. Jhuming is labour-intensive farming demanding constant care and nursing. Moreover, the jhume plot needs to be guarded from wild animals, birds and rats. The cycle ends in November/December and the land is left to revert to scrub and the cultivator moves to a new land for jhuming.
11
help of karbari/headman5 and other informed people such as school teachers, and then 17
households were randomly selected from the list.
Next, 30 field workers, six for each ethnic group, with equal number of male and
female, and equally fluent in Bengali and their own language, were hired. Field workers
of a particular ethnic group interviewed the respondents of the same ethnic group because
of language barriers.6
Data include demography, land ownership and cultivation, production and
exchange, savings, asset accumulation and food security at the household level, and
physical infrastructure at the village level such as distance of the village from the Thana
(lowest administrative unit) headquarters, nearest bazaar (or local market), all weather
pucca road and bus stand.
Given the complexities of choosing any particular observable metric of food
security discussed in section 2, we depend on the perception of the respondents about
their own food security status. Based on food production, availability, purchasing power
and access to common resources, the respondents defined the food security status of their
households in any of the following four categories—severe (chronic) food shortage,
occasional (transitory) food shortage, breakeven and food surplus. Intra-household
distribution of food among the members was not asked to consider because such a
sensitive issue might induce systematic errors in the responses.
5 The headman collects tax from the households in the villages. The headman is entitled to a percentage of this yearly tribute. (S)he and karbari are responsible for settling petty cases in the village. For this service they receive fees from the disputing parties. Previously there was a provision for remunerating these officers by assigning lands to them; for example the headman was entitled to 25 acres of tax-free land (Hosain, 1990, p. 120-121). 6 The field workers were trained about the techniques of data collection, methods of communication with respondents and the contents of the questionnaire. Upon receiving training they were sent for mock survey to the villages which were not selected in the sample (the respondents were not informed about this). The researchers accompanied them to closely monitor their performance and reviewed those after returning. This mock survey and review process continued until the research team was completely satisfied with their performances that good quality data would be collected. To monitor the field workers’ efforts, an additional team leader was assigned to each team. These team leaders were also trained along with the field workers although they had several years of previous experiences of data collection at the Research and Evaluation Division of BRAC. Most importantly they had verbal contracts with the Division in future projects upon successful completion of this survey. This helped ensure that the team leaders did not risk colluding with the field workers because of high opportunity costs on their part and that they actually visited the remote villages for survey. Finally, members of the research team randomly visited without prior notice to the villages where the field workers were scheduled to survey on a particular day. Due to mountainous and inaccessible terrain with no mechanical transportation available in many cases to reach the destination, a substantial amount of time was spent on moving from one village to another. The data collection took about three months.
12
Income has been found to be one of the important determinants of food security
(Iram and Butt, 2004, p. 763). It is well known that income data is difficult to collect. The
problem is more acute in this case given the level of underdevelopment in the CHT. Most
households in the CHT, especially those among the indigenous ethnic groups, do not
have any cash income. They produce for home consumption and in most instances
borrow and repay in kind. There are three district headquarters and only few bazaars in
the region. These places are inhabited by Bengalis. Most of the indigenous people live in
the hinterland and there is virtually no mechanical means to transport to the market.
Nonetheless, they sometimes travel to the market on foot to sell their agricultural
products and to buy what they do not produce. But they are deprived of the fair price for
their commodities because Bengalis control and manipulate the market against the
indigenous people (Anti-Slavery Society, 1984; Mohsin, 1997; Rafi and Chowdhury,
2001). As a result, market value of agricultural products cannot be imputed because of
the lack of price data. Since agriculture is the predominant economic activity in the
region, the main source of income whether cash or kind is agricultural production. It is
therefore reasonable to assume that the amount of land cultivated or rice produced is a
good proxy for income.
Consumption is sometimes used as a proxy for food security. These data were not
collected because seasonal fluctuations in consumption are so large that a single survey
must systematically under- or over-report true consumption. Food consumption is high in
the period immediately after harvest and low during the period between cultivation and
harvest.
Finally, it is imperative to clarify the definition of the household head. The
household members were asked to determine the headship based on a combination of two
criteria—gender of the main income earner and of the ultimate decision maker in the
family.
5 Descriptive statistics
In the section we provide descriptive statistics for food security status,
demographic characteristics, land ownership and cultivation, and agricultural production
for the male and female headed households.
13
Insert Table 2 here
Only 5.81% of all households in the CHT are female headed (column 2 in Table
2) with little variation among the ethnic groups. About 10% of the female heads are
married compared to 94% of the male heads (columns 3 and 4 in Table 2). Most females
are divorced, separated or widow, which is consistent with the findings by Fuwa (2000, p.
1519-20).
Insert Table 3 here
Table 3 provides some stylized facts about the food security status for the male
and female headed households and for different ethnic groups. Panel A classifies
households only in two categories—food insecure and secure.7 About 72% of all
households in the CHT do not have food security. Higher percentages of the female than
the male headed households are food insecure, these being 83% and 71% respectively.
This pattern is uniform across the ethnic groups. However, Pearson chi-square statistics
show that the difference is significant only for the Bengali and the Mro at the 5% and
10% level respectively.
The above picture does not reveal the intensity of food insecurity. Panel B of
Table 3 reports both chronic and transitory food insecurity. Higher percentage of the male
than the female headed households suffer from transitory food insecurity while higher
percentages of the female than the male headed households suffer from chronic food
insecurity. About 28% of the male headed households suffered from chronic food
insecurity compared to 47% of the female headed households. On the other hand, about
43% and 36% of the male and female headed households suffered from transitory food
insecurity respectively. But the Pearson chi-square statistics show that the difference is
significant only for the Bengalis and the Chakma. The above discussions reveal that the
7 Chronic and transitory food insecurity are combined into “food insecurity” and breakeven and food surplus are combined into “food security”.
14
Bengali is the only ethnic group in the region that has higher percentage of female headed
households significantly food insecure than male headed households.
6 Analytical framework
Given the ordered nature of the responses on food security, which is the
dependent variable, the natural choice is the ordered probit (or logit) model. Suppose, we
have the following regression: , where y* is the food security status and x is a
vector of covariates not containing a constant term. But y* is unobserved; what is
observed is the respondents’ answer y which is related to y* as:
*y = β + ε′x
*1
*1
*2 3
*3
y = 1 if - y κ ,
= 2 if κ y κ ,
= 3 if κ y κ ,
= 4 if κ y ,
∞ < ≤
< ≤
< ≤
< < ∞
2
′
--- (1)
where 1, 2, 3 and 4 (= j) are the responses in the order of chronic food insecurity,
transitory food insecurity, breakeven and food surplus respectively. The are three
unknown parameters known as cut points or threshold parameters, which are one less
than the number of possible outcomes and to be estimated jointly with . Assuming ε ~
N(0,1), the probability for the j-th outcome is given by:
κ's
β
-1Prob(y = ) = Φ(κ β ) Φ(κ β )j jj ′− − −x x --- (2)
where Φ is the cumulative standard normal distribution. The coefficients and the
threshold parameters are estimated by the Maximum Likelihood Estimation. The
coefficients do not have any direct interpretation; the marginal effect, i.e. how a change
in one of the x’s changes the predicted distribution of y*, is more convenient for
interpretation. The marginal effect of the m-th component of x vector (
β
β
mx ) for the j-th
response is given by
( ) ( )1
Prob[y = ]β βj j m
m
jx
φ κ φ κ−
∂ ⎡ ⎤′ ′= − − −⎣ ⎦∂x
x x β , ---(3)
where (.)φ is the standard normal density function. If mx is a dummy variable such as
gender then the marginal effect is calculated as
15
Pr[y = ] Pr[y = + ] Pr[y = ]mj j xΔ = Δ −x x j x . In words, we compare the probabilities
that result when the variable takes its two different values with those that occur with
other variables held at their sample means (Greene, 2000, p. 879).
Two restrictive properties of the marginal effects in the ordered probit model limit
its usefulness. First, relative marginal probabilities are constant across individuals, i.e.
they do not depend on individual i or h. Second, the marginal effects change sign exactly
once when moving from the smallest to the largest outcome (single crossing property).
More precisely, in our case the marginal effect of Pr [y = 1] has the opposite sign of β ,
and that of Pr [y = 4] has the same sign as β . This is because increasing one of elements
of x while holding β and constant is equivalent to shifting the distribution of y (or y*)
slightly to the right. But what happens to the sign of the marginal effects of the middle
outcomes is ambiguous (Greene, 2000, p.877; Boes and Winkelmann, 2006, p. 170).
κ
The limitations in analyzing the marginal effects are due to three assumptions of
the ordered probit model, viz., i) single index, ii) constant threshold, and iii)
distributional assumption that does not allows individual heterogeneity between
individual realizations (Boes and Winkelmann, 2006, p. 170-71). To overcome the
limitations, the generalized threshold model was introduced by Maddala (1983) and
Terza (1985) that relaxes the single threshold assumption and allows for different indices
across outcomes. In this model the threshold parameters are generalized by making them
dependent on the explanatory variables, which is given by: κ = κ γj j j′+ x% where γ j is a
( )-dimensional vector of response specific parameters. Substituting this expression
into equation (2) we obtain the probabilities as
k 1×
1 -1
1 1
Prob(y ) = (κ + γ β ) (κ + γ β )
= (κ δ ) (κ δ )j j j j
j j j j
j −
− −
′ ′ ′ ′= Φ − −Φ −
′ ′Φ − −Φ −
x x x x
x x
% %
% %
x, j = 1, 2, …, J. --- (4)
The marginal effects, shown below, do not rely on a single crossing property or constant
relative effects and therefore can be analyzed with much more flexibility than in the
ordered probit model.
( ) ( )-1 1 1, , 1 1, ,
Prob[y = ]κ δ κ δ ( ) ( )j j j m j j j m j j m j j
m
jx mφ δ φ δ φ δ φ δ− − − −
∂′ ′= − − − = ⋅ − ⋅
∂x
x x% % --- (5)
16
Comparison of equation (2) with (4) shows that the generalized threshold model contains
(J-2)*k additional parameters, where k is the number of variables included in the model.
This reduces the degrees of freedom but we have only four categories (j = 4) and also
deal with a relatively large sample.
The explanatory variables (x) are the following.
GEND = Gender of the household head (1 = Male, 0 = Female)
AGE = Age of the household head
AGE2 = Square of AGE
EDU = Education of the household head (years of schooling)
OCCU = Occupation of the household head (1= Non-farm, 0 = Farm)
STAT = Status of the household in the village (1 = Karbari/headman, 0 = General
household) indicating its involvement in the indigenous power structure
DDR = Demographic dependency ratio8
PLND = Amount of plain land cultivated last year (in acre)
JHUM = Amount of jhume land cultivated last year (in acre)
AMPR = Amount of rice produced (in maund)
VIBR = Economic infrastructure
There are reasons for excluding variables such as the value of savings and assets.
Only households with higher food security are able to save and accumulate assets.
Therefore, inclusion of these variables would induce endogeneity, for which we do not
have instruments to correct the bias and inconsistencies of the estimated coefficients.
The status of the household in the village does not induce endogeneity. Unlike in
the past the positions of headman and karbari are hereditary now. The change took place
during the British rule. Before that the headman was elected by the people. The position
8 Demographic dependency ratio is defined as the ratio of the number of members aged between one to 10 years and over 64 years to those aged between 10 to 64 years. Economic dependency ratio is defined as the ratio of economically inactive population to economically active population. Economically active population consists of population of age 10 years or above, who are employed or unemployed during the survey, excluding the disabled and retired persons, full time housewives and students, income recipients, beggars, and other persons who did not work for pay or profit at least one hour during the reference week (Bangladesh Bureau of Statistics, 1995).
17
of karbari was introduced by the British. Since both positions are hereditary, it cannot be
said that food security gave people the opportunity to be involved in the power structure.
The infrastructure variable (VIBR) has been constructed from four other
variables—distance of the village from the Thana headquarters, nearest bazaar, all
weather pucca road and bus stand. Since longer distance implies poor infrastructure, we
first calculate the reciprocal of each variable and then use principal component analysis
to calculate a score.
We use both the amount of rice produced and the amount of land cultivated as
proxies for income. The reason is that in the jhume land, which is less fertile than plain
land, several crops are cultivated together with rice. Therefore, the amount of rice
produced depends not only on total amount but also on the type of land cultivated. The
partial correlation between these two variables is around 0.3.
7 Results
We estimate both the ordered probit and generalized threshold models. Although
the former model suffers from some limitations, it is frequently estimated and serves as a
benchmark for comparison. All models include the ethnicity and district dummies to
account for the ethnic and geographical heterogeneity.
Ordered probit model
We begin with the results for the ordered probit model. Table 4 reports the results
for the full sample. Both the coefficients and elasticities9 are reported. Results show a
positive and significant coefficient of the education and occupation of the household
head, the involvement in the indigenous power structure, the amount of rice produced,
and the amount of both jhume and plain land cultivation. The coefficient of the gender of
the household head is weakly significant at the 10% level. By construction, elasticities
with respect to these variables are negative for j = 1 (chronic food insecurity) and positive
for j = 4 (food surplus). On the other hand, the coefficient of the demographic
dependency ratio is negative and significant indicating that elasticity is positive for j = 1
mxy log/log ∂9 Elasticities are calculated as ∂
mxy evaluated at the mean value of x using “eyex” command
in STATA. It is important to note that marginal effects ( ∂/ ) sum to 0 but not the elasticities. ∂
18
and negative for j = 4. Elasticities with respect to age of the household head and
infrastructure are not significant.
Insert Table 4 here
For the breakeven category (j = 3), the male headed households have about 26%
higher probability of food security than the female headed households. A percentage
point increase in educational attainment increases their food security by 0.12%. The same
increase in the amount of rice produced increases food security by 0.43%. Elasticities
with respect to the plain and jhume land cultivation are low at 0.07% and 0.04%
respectively. For the households suffering transitory food insecurity (j = 2) none of the
elasticities is significant.
Insert Table 5 here
Now we estimate the same model excluding the Bengali. The results reported in
Table 5 show that the sign and significance of the coefficients and elasticities for
different food security categories do not meaningfully change from those estimated in the
full sample. One major change in the results is that the coefficient of and the elasticity
with respect to the gender of the household head become insignificant.
Generalized threshold model
As mentioned, the ordered probit model suffers from several limitations and one
of the procedures to overcome is to estimate the generalized threshold model. But first we
test which of the two methods optimally uses information in our case. The null
hypothesis is that there are no category specific parameters. If this hypothesis is rejected
then it can be considered that the ordered probit model does not optimally use the
information contained in the data, but the generalized threshold model does. We test this
hypothesis by the likelihood ratio test, where the test statistic is
, which is asymptoticallyordered probit generalized threshold2(log log )LR L L= − − 2χ distributed with
(J-2)*k degrees of freedom (Boes and Winkelmann, 2006, p. 10). The value of the
19
statistics for the full sample is 240 with 34 degrees of freedom. We therefore reject the
null hypothesis in favor of the generalized threshold model.
Insert Table 6 here
The results for the full sample are reported in Table 6. There are some important
changes in the results from the ordered probit model. Elasticity with respect to the gender
of the household head is statistically significant only for the chronic food insecure
category (j = 1). For the transitory food insecure category (j = 2) for which none of the
predictors were significant in the ordered probit model, elasticities with respect to the
amount of rice produced and occupation of the household head turn out to become
significant. A percentage point increase in the amount of rice produced increases the
likelihood of food security by 0.10%. For the food surplus category, elasticities with
respect to the education of the household head, the demographic dependency ratio and the
amount of jhume land cultivated become insignificant. The household head employed in
the farm rather than non-farm sector increases the probability of food security by 4% for
the transitory food insecure category. On the other hand, the household head employed in
the non-farm than the farm sector increases the likelihood of food security by 10% and
22% for the breakeven and food surplus categories respectively.
Insert Table 7 here
We now estimate the model for only the indigenous ethnic groups excluding
Bengalis. For this reduced sample as well, the likelihood ratio test rejects the null
hypothesis of no category specific parameters thus suggesting the generalized threshold
model as the appropriate one. The value of the LR test statistics is 224 with 32 degrees of
freedom (one ethnicity dummy is excluded). The results are reported in Table 7. The
most important change in the result is that elasticity with respect to the gender of the
household head turns out to be insignificant for all food security categories; indeed it
becomes negative but not significant for j = 2.
20
We now discuss some general trends in the results. First, elasticities with respect
to the amount of rice produced is significant in almost all models. Second, elasticities
with respect to the age of the household head and infrastructure are insignificant in all
models. The CHT is still so underdeveloped that a marginal improvement in
infrastructure has no impact on adoption and diffusion of technology, and marketing of
agricultural products. On the other hand, significance of elasticities with respect to the
education and occupation of the household head, the demographic dependency ratio,
involvement in the indigenous power structure, and the amount of land cultivated vary
across models and food security categories. Finally, the predicted probabilities do not
change much across models. Predicted probability is the largest for the transitory food
insecure category at around 0.42 and the lowest for the food surplus category at around
0.05.
Robustness checks
The result that the gender of the household head is not significant for food
security contrasts the conventional idea and therefore, requires further investigation. In
the following, we perform several robustness checks by estimating alternative
specifications. Our attention is on the elasticity with respect to gender of the household
head.
Insert Tables 8 and 9 here
There may be very different causes of female headship and in many instances
headship may not be self-selected. For example, widows generally become head of a
household in the absence of adult male. Another concern is that whether any of the
control variables is outcome with respect to the treatment of being a female headed
household. These households usually own and cultivate less land. They have a smaller
family and lower dependency ratio. They are also not able to get involved in the rural
power structure. One can raise the question whether our results are driven by inclusion of
these variables. We address the above two issues in the following way. We first estimate
a probit model that regresses GEND on the dummies for marital status and ethnicity, and
obtain a predicted probability (GENDP). In the second stage we estimate the generalized
21
threshold model replacing GEND by GENDP but we also exclude PLND, JHUM, DDR
and STAT from the model. The results for the full sample and indigenous ethnic groups
are reported in Tables 8 and 9 respectively. The results do not meaningfully change thus
supporting our previous conclusion.
Insert Table 10 here
Number of female headed households becomes small when households are
disaggregated into four food security categories. To know if this small sample size drives
the result, we estimate a binary probit model after combining four food security
categories into two--food secure and insecure. Results, reported in Table 10, support the
results for the generalized threshold model. The coefficient of and the elasticity with
respect to the gender of the household head are significant for the full sample but become
insignificant when only the indigenous groups are retained.10
Towards an explanation
We examine several possible reasons from the literature and investigate those as
possible explanations of the result. We use descriptive statistics and indirect evidence.
We first verify whether the female headed households employ any costly coping
mechanism than the male headed households. Morduch (1995, p. 111) argues that in the
absence of well developed credit market, poor households smooth income rather than
consumption. The degree of income smoothing depends on the amount of risk, degree of
risk aversion and the extent to which consumption smoothing mechanisms are available.
The high risk-averse households will rely less on consumption smoothing; rather they
will rely on costly income smoothing mechanism such as taking children out of school
10 We included both the amount of rice produced and the amount of land cultivated as proxies for income. The partial correlation between these two variables is around 0.3. Results do not change if we re-estimate the model including only one proxy alternatively (not reported).
Drèze and Srinivasan (1997) observe in rural India that female headed households are poorer only after controlling for economies of scale that accounts for their smaller size. Our estimates should not be affected by economies of scale for two reasons. First, we do not use consumption or expenditure data. Second, respondents implicitly incorporate this issue in their perceptions about their own food security. Nonetheless, we re-estimate the model adding the household size. The elasticity with respect to the gender of the household head does not meaningfully change and that with respect to the household size is found to be insignificant except for the breakeven category in the sample excluding Bengalis (not reported).
22
(Chetty and Looney, 2006, p. 2352). Buvinić and Rao Gupta (1997, p. 268) also advance
a similar argument that to cope with food insecurity female headed households not only
work more hours but also employ higher number of household members including school
going children in income generating activities, thus hampering human capital
accumulation, which in turn transmits poverty to the next generation. In the CHT, a
credit market is underdeveloped,11 limiting the scope for consumption smoothing;
therefore we investigate scope for income smoothing. We compare the school enrolment
of the 6-15 years age group. For the full sample, 46.5% of children of the 6-15 years age
group from the female headed households are students compared to 43.2% from the male
headed households. These percentages decrease to 41.3% and 37.6% respectively for the
indigenous groups. However, in both cases Pearson chi-square tests show no significant
difference between the two types of households (p-values are 0.526 and 0.230
respectively for the full and reduced sample). Therefore, we do not find support for the
hypothesis of intergenerational transmission of poverty.
Another way of income smoothing is diversification of income sources.
Households facing greater volatility in farm profits are also more likely to have a
household member employed in steady wage income (Rosenzweig and Stark, 1989) or to
diversify occupation (Morduch, 1995, p. 104). We test the hypothesis by investigating
secondary occupation of the male and female heads. Only about 30% of the male heads
have any secondary occupation compared to about 60% of the female heads. But
household activity is the predominant secondary occupation for most female heads (about
40%). This finding does not support the argument for greater diversification of economic
activities. But it indicates that the females are “activity burdened” as they maintain
household chores in addition to working outside and thus corroborating one of the tenets
of the “triple burden”.
Risk-averse households also insure against income shocks by devoting a greater
share of land to safer, traditional varieties of crops or by choosing safer production
11 During the survey, NGOs and financial institutions such as BRAC and Grameen Bank were planning to launch the microfinance program in the CHT. Informal credit market is also not developed in the CHT. People of one ethnic group usually do not borrow from or lend to people of other ethnic groups (Rafi and Chowdhury, 2001). In addition, the moneylenders are predominantly Bengalis and the indigenous people do not trust them. Lewin (1869) and May (1980) described in detail how the indigenous people got trapped from Bengali traders and moneylenders.
23
techniques although this can result in significant loss of farm profits (Morduch, 1995, p.
110). Jhume cultivation may be a safer method of production for the region as a whole.
This method is less productive but since several crops are sown together, the risk of a
particular crop failure may be less for jhume compared to plain land cultivation where a
single crop is grown. If shocks or adverse events are particular to crop, then jhume
cultivation is a kind of insurance against the risk. But if shocks are aggregate, common to
all crops due to bad weather, insurance cannot be possible. Given the shortage of
cultivable land in the region, whether plain or jhume, people cultivate any type of land
without choice (Roy, 1992; Rafi and Chowdhury, 2001, p. 84-85). We are not aware of
any evidence that the female headed households prefer jhume over plain land cultivation.
Risk sharing at the village level may be another possible explanation. Townsend
(1994, p. 84) advances an argument that if the shocks or adverse effects are idiosyncratic
(for example, particular to a demographic group), then risk-averse households group
together to share the risks. However, in the ICRISAT (International Crops Research
Institute for the Semi-Arid Tropics) dataset, he finds that villagers do not pool risks at the
village level; instead they do so at the individual level by building up individual food
reserves. Townsend (1995) has proposed an indirect method to test risk sharing by
examining if individual level consumption varies from the village average. In the
presence of risk sharing at the village level, the regression coefficient of village level
consumption on the individual level consumption, after controlling other variables, will
not significantly differ from 1. We cannot perform such a test because food security
status which is a discrete variable cannot be averaged. But we provide below some
indirect evidences of insurance for the female headed households.
In the indigenous villages in the CHT, there are informal institutions12 such as
Khiang that may provide some kind of insurance for the poor. The vikkhus (Buddhist
monk) live on the food and other necessities provided to them by the community. They
redistribute the excess to the needy within the community. The female headed households
receive priority in food redistributions. The redistribution is done from the daily offerings
and those are done periodically during the festivals. Ethnic homogeneity can also play a
role in this regard. Miguel (2006, p. 172) argues that individuals from different ethnic
12 For a discussion about the role of non-market institutions for risk sharing, see Besley (1995).
24
groups may simply dislike mixing across ethnic lines, and this drives the poor collective
action and organizational outcomes in diverse areas. Alternatively, strong social and
cultural network among the people of the same ethnic group can provide insurance at bad
times. As mentioned earlier, in the CHT people of only the same ethnic group live in a
village thus cooperation among the villagers is deep rooted. But we are not able to
conclude that such redistribution and ethnic homogeneity are sufficient to mitigate food
shortage of a household on a continual basis.
Kabeer (1990, p. 1) attributed socio-cultural reasons to be an important factor for
the female headed households’ higher food insecurity. Women in some of the poorest
areas of South Asia are particularly vulnerable in times of economic crisis as they cannot
participate fully in food production activities due to cultural restrictions on them. The
Chakma and Marma practice Buddhism, the Tripura practice Hinduism (slightly different
from Bengali Hinduism) and some of them have converted to Christianity, and the Mro
practice animism (Rafi and Chowdhury, 2001, p. 13-19). The Bengalis in the region are
predominantly Muslim and are more conservative than the indigenous groups. The
females among the indigenous groups are culturally permitted greater freedom to engage
in economic activities outside the household (Khan, 1997, p. 101-102).
Given the above, we compare relevant demographic characteristics and
participation in the income generating activities of the two types of households.
Demographic dependency ratio is about 28% lower in the female than the male headed
households for the full sample and about 35% lower for the indigenous groups. This
implies that the female headed households have higher percentage of members in the 10-
64 years age group. Economic dependency ratio is also lower for female than male
headed households. It is 60% lower in the female headed households for the indigenous
groups, and 50% lower for the full sample. Higher percentages of household members
from the female than the male headed households are also engaged in income generating
activities. These are 55.6% and 45.8% for the female and male headed households
respectively for the full sample, and 63% and 50.3% respectively for the indigenous
ethnic groups.
To formally test this hypothesis, we also include the gender of the household head
interacted with the demographic dependency ratio in the full set of variables and re-
25
estimate the generalized threshold model. Now inclusion of the interaction term also
changes the formula for the marginal effect of the gender and the dependency ratio in
equation (5) (Mallick, 2008). To see this, we rewrite the distribution function in detail as
follows:
,1 1 ,2 2 , , ,(κ δ ) (κ )j j j j j j l l j p p j lp l px x x x x xδ δ δ δ δ′Φ − = Φ − − − − − −x% % LL , where lx and px are the two variables that are interacted. The marginal effect of lx is now given by
1 1, 1, , ,
Prob[y = ] ( ) ( )j j l j lp p j j l j lp p
l
jx x
xφ δ δ φ δ δ− − −
∂⎡ ⎤ ⎡= ⋅ + − ⋅ +⎣ ⎦ ⎣∂
x⎤⎦ --- (6).
We obtain a similar expression for the marginal effect of px . However, the marginal
effect of for ,mx m l p≠ is given by equation (5). The marginal effect of the interaction
term is more complicated and given by13 2
1 1, 1, 1, 1, 1, 1
, , , , ,
Prob[y = ] ( ) ( )
( ) ( )
j j lp j l j lp p j p j lp l jl p
j j lp j l j lp p j p j lp l j
jx x
x x
x x
φ δ δ δ δ δ φ
φ δ δ δ δ δ φ
− − − − − − −
∂′⎡ ⎤ ⎡ ⎤= ⋅ − + +⎣ ⎦ ⎣ ⎦∂ ∂
′⎡ ⎤ ⎡ ⎤− ⋅ + + + ⋅⎣ ⎦ ⎣ ⎦
x⋅
---- (7)
where ( )jφ′ ⋅ is the first derivative of the density function with respect to its argument. The
results for the full and reduced samples are reported in Tables 11 and 12. For the full
sample, as before, the marginal effect14 of the gender of the household head is significant
only for the chronic food insecure category but the sign has now reversed. The marginal
effect of the interaction term is also significant for only this category. For the indigenous
ethnic groups the marginal effect of the gender of the household head is not significant
for any of the food security categories. But the marginal effect of the interaction term is
positive and significant for both chronic and transitory food insecurity categories and the
magnitude is the same.
Insert Tables 11 and 12 here
Prob[y = ]
( )l p
jx x
∂∂
x13 Statistical software packages usually estimate for marginal effect of the interaction
term by default, which gives wrong results. Ai and Norton (2003) also raise similar concerns for binary probit and logit models. They reviewed 13 economics journals listed on JSTOR and found that 72 articles published between 1980 and 1999 used interaction terms in nonlinear models. None of the studies interpreted the coefficient on the interaction correctly. Mallick (2008) extends it in the context of ordered choice models. 14For equations 6 and 7, we calculate marginal effects evaluated at the mean value of x, not elasticities. Our conclusions do not change for this modification.
26
One may question whether there is a difference in the perception about the food
security among the male and female headed households. However, we do not see any
reason for such a difference to be systematic15. Each ethnic group is homogenous in
terms of food habit, language, religion and cultural practices. The same factors contribute
to the perceptions of both the male and female headed households. The heterogeneity
among the ethnic groups is captured by the ethnicity dummies. More importantly, the
ordered response models, unlike the OLS, are designed to account for the differential
attitudes of the respondents (Daykin and Moffatt, 2002, p. 159).
8 Conclusion
We have investigated the food security of the male and female headed households
for the Bengali and four indigenous ethnic groups in Bangladesh. By estimating the
generalized threshold model we find no significant difference in food security between
the male and female headed households especially among the indigenous ethnic groups.
This finding challenges the conventional idea the female headed households are
more vulnerable to food insecurity. The females among the indigenous groups are
culturally permitted greater freedom to participate in the labor force, and they indeed
participate at a higher rate than the males. This coupled with lower demographic
dependency ratio in the female headed households explains the result. This may be
indicative in the sense that non-economic institutions such as absence of cultural and
societal restrictions on women can significantly improve the food security of the female
headed households. This has important policy implications as well. Development
assistance programs should be designed taking into consideration the social and cultural
heterogeneity even within a region in a country.
15 Rose (1999) proposed a method to address systematic underreporting (of births of girls in rural India) in a binary probit model.
27
References
Ai, Chunrong and Edward C. Norton (2003), “Interaction Terms in Logit and Probit Models,” Economics Letters, 80 (1, July), 123-129. Anti-Slavery Society (1984), “The Chittagong Hill Tracts: Militarization, Oppression and the Tribes,” Series 2, London. Bangladesh Bureau of Statistics (1992), “Bangladesh Population Census,” 1991 Zila Series, Government of Bangladesh. Bangladesh Bureau of Statistics (1995), “Labour Force Survey,” Dhaka: Ministry of Planning, Statistics Division, Government of Bangladesh. Barros, Ricardo, Louise Fox and Rosane Mendonça (1997), “Female-Headed Households, Poverty, and Welfare of Children in Urban Brazil,” Economic Development and Cultural Change, 45 (2, January), 231-257. Besley, Timothy (1995), “Nonmarket Institutions for Credit and Risk Sharing in Low-Income Countries,” Journal of Economic Perspectives, 9 (3, Summer), 115-127. Boes, Stefan and Rainer Winkelmann (2006), “Ordered Response Models,” Allgemeines Statistisches Archiv, 90 (1, March), 167-181. Buvinić, Marya and Geeta Rao Gupta (1997), “Female-Headed Households and Female-Maintained Families: Are they Worth Targeting to Reduce Poverty in Developing Countries,” Economic Development and Cultural Change, 45 (2, January), 259-280. Cathey, John (2006), “Food Security,” in The Elgar Companion to Development Studies, Edited by David A. Clark, Edward Elgar Publishing Ltd., Cheltenham, UK, 178-182. Chen, Lincoln C., Emdadul Huq and Stan D'Souza (1981), “Sex Bias in the Family Allocation of Food and Health Care in Rural Bangladesh,” Population and Development Review, 7 (1, March), 55-70. Chetty, Raj and Adam Looney (2006), “Consumption Smoothing and the Welfare Consequences of Social Insurance in Developing Economics,” Journal of Public Economics, 90 (12, December), 2351-2356. Chung, Kimberly, Lawrence Haddad, Jayshree Ramakrishna and Frank Riely (1997), “Identifying the Food Insecure: The Application of Mixed-method Approach in India,” International Food Policy Research Institute, Washington DC. Daykin, Anne R. and Peter G. Moffatt (2002), “Analyzing Ordered Responses: A Review of the Ordered Probit Model,” Understanding Statistics, 1(3), 157-166.
28
Drèze, Jean and P. V. Srinivasan (1997), “Widowhood and Poverty in Rural India: Some Inferences from Household Survey Data,” Journal of Development Economics, 54 (2, December), 217-234. Duflo, Esther (2005), “Gender Equality in Development,” Department of Economics, MIT, Massachusetts. Duflo, Esther and Christopher Udry (2004), “Intrahousehold Resource Allocation in Cote D’ivoire: Social Norms, Separate Accounts and Consumption Choices,” NBER Working Paper No. 10498, Massachusetts. FAO (1992), “Major Issues in Nutritional Strategy,” International Conference on Nutrition, FAO, Rome. Fuwa, Nobuhiko (2000), “The Poverty and Heterogeneity Among Female-Headed Households Revisited: The Case of Panama,” World Development, 28 (8), 1515-1542. Greene, William H. (2000), “Econometric Analysis” 4th edition, Prentice Hall, New Jersey, USA. Guardian (1984), “The Guardian,” March 6, London, UK. Hosain, Sowkat A. (1990), “Parbatya Chattogramer Upajati Shamasha O Bangladesh Sarkar,” Bangladesh Asiatic Society (8), 118-137. Iram, Uzma and Muhammad S. Butt (2004), “Determinants of Household Food Security-An Empirical Analysis,” International Journal of Social Economics, 31 (7/8), 753-766. Kabeer, Naila, (1990), “Women, Household Food Security and Coping Strategies,” Nutrition Policy Discussion Paper (UN/ACC) No. 6, Geneva, Switzerland. Khan, M. R. (1995), “Chittagong Hill Tracts: A Socio-economic Profile,” Bangladesh Institute of Development Studies, Dhaka, Bangladesh. Khan, Sufia (1997), “Parbottya Chattogramer Upajati,” Bangla Academy, Dhaka, Bangladesh. Lewin, T. H. (1869), “The Hill Tracts of Chittagong and the Dwellers Therein, with Comparative Vocabularies of the Hill Districts,” Bengal Printing Company Ltd., Calcutta, India. Maddala, G. S. (1983), “Limited Dependent and Qualitative Variables in Econometrics,” Econometric Society Monograph, Cambridge University Press, New York.
29
Mallick, Debdulal (2008), “Marginal and Interaction Effects in Ordered Choice Models,” Deakin University, Burwood, Australia. May, Wolfgang (1980), “Parbatya Chattogramer Kaumasamaj: Ekti Artha-Samajik Itihas,” International Centre for Bengal Studies, Calcutta, India. May, Wolfgang (1984), “Genocide in the Chittagong Hill Tracts, Bangladesh,” IWGIA Document No. 51, IWGIA, Copenhagen, Denmark. McLanahan, Sara (1985), “Family Structure and the Reproduction of Poverty,” American Journal of Sociology, 990 (4, January), 873-901. Miguel, Edward (2006), “Ethnic Diversity and Poverty Reduction,” in Understanding Poverty, edited by Abhijit V. Banerjee, Ronald Bénabou and Dilip Mookherjee, Oxford University Press, New York, USA, 169-184. Mohsin, Amena (1997), “The Politics of Nationalism: The Case of Chittagong Hill Tracts,” University Press Limited, Dhaka, Bangladesh. Mohsin, Amena and Imtiaz Ahmed (1996), “Modernity, Alienation and the Environment: The Experience of the Hill People,” Journal of Asiatic Society of Bangladesh, 41 (2), 265-286. Morduch, Jonathan (1995), “Income Smoothing and Consumption Smoothing,” Journal of Economic Perspectives, 9 (3, Summer), 103-114. Quisumbing, Agnes R., Lawrence Haddad and Christine Peňa (1995), “Gender and Poverty: New Evidence from 10 Developing Countries,” Food Consumption and Nutrition Division Discussion Paper No, 9, International Food Policy Research Institute, Washington DC. Rafi, Mohammad and A. Mustaque R. Chowdhury (2001), “Counting the Hills: Assessing Development in Chittagong Hill Tracts,” University Press Limited, Dhaka, Bangladesh. Ravallion, Martin and Peter Lanjouw (1995), “Poverty and Household Size,” Economic Journal, 105 (433, November), 1415-1434. Rose, Elaina (1999), “Consumption Smoothing and Excess Female Mortality in Rural India,” Review of Economics and Statistics, 81 (1, February), 41-49. Rosenzweig, Mark and Oded Stark (1989), “Consumption Smoothing, Migration and Marriage: Evidence from Rural India,” Journal of Political Economy, 97 (4, August), 905-26.
30
Roy, Raja Devasish (1992), “The Erosion of Land and Constitutional Safeguards of the Hill Peoples of the CHT in Bangladesh: An Historical Account,” Paper presented at a seminar on The Chittagong Hill Tracts Problem in Bangladesh, organized by the Manoghar Shishu Sadan, Bangladesh. Sen, Amartya K. (1981), “Poverty and Famines,” Oxford University Press, Oxford, UK. Sen, Amartya K. (1995), “Food Economics and Entitlements,” in The Political Economy of Hunger, Edited by Jean Drèze, Amartya Sen and Aurther Hussain, Clarendon Press, Oxford, UK, 50-68. Shelley, Mizanur R. (1992), “The Chittagong Hill Tracts of Bangladesh: the Untold Story,” Centre for Development Research, Dhaka, Bangladesh. Terza, J. V. (1985), “Ordered Probit: A Generalization,” Communications in Statistics-A. Theory and Methods, 14, 1-11. Thomas, Duncan (1990), “Intra-Household Resource Allocation: An Inferential Approach,” Journal of Human Resources, 25 (4, Autumn), 635-664. Thomas, Duncan (1992), “The Distribution of Income and Expenditures within the Households,” Annals d’Economie et de Statistique, 29, 109-136. Townsend, Robert M. (1994), “Risk and Insurance in Village India,” Econometrica, 62 (3), 539-591. Townsend, Robert M. (1995), “Consumption Insurance: An Evaluation of Risk-Bearing Systems in Low-Income Economics,” Journal of Economic Perspectives, 9 (3, Summer), 83-102. White, Hallbert (1980), “A Heteroskedasticity-Consistent Matrix Estimator and A Direct Test for Heteroskedasticity,” Econometrica, 50 (March), 483-500. World Bank (1999), “Panama Poverty Assessment,” Washington DC.
31
Table 1: Ethnic groups in the CHT
Population in the CHT (%) Ethnic groups With Bengali Without Bengali
(1) (2) (3) Bengali 48.6 -Bawm 0.7 1.4Chak 0.2 .4Chakma 24.6 47.8Khumi 0.1 .1Kheyang 0.2 .2Lushei 0.1 .1Marma 14.6 28.4Mro 2.3 4.4Pankhua/Pankko 0.3 .6Tanchangya 2.0 3.8Tripura 6.3 12.2Others* 0.1 .2Total 100.0
(974,445)100.0
(501,144) Source: Bangladesh Bureau of Statistics, 1992. Figures in the parentheses are total population. * Includes Rakhain, Saotal, Asamis, etc., each with less than 0.02% of total population.
Table 2: Percentage of female headed households by ethnic groups and their marital status Ethnic group Female headed households (%) Percentage of household heads married Female Male
(1) (2) (3) (4) Bengali 7.39 (37) 20.0 95.7 Chakma 3.94 (20) 8.1 96.6 Marma 9.94 (50) 12.0 92.8 Mro 3.14 (16) 4.2 95.7 Tripura 4.72 (24) 6.3 90.3 All 5.81 (147) 10.2 94.2 Figures in the parentheses are the number of households
32
33
Table 3A: Food security status among male and female headed households by ethnic group (2 broad food security categories)
Food insecurity Food security Ethnic group Male Female Total Male Female Total
Pearson chi-square (p-value)
(1) (2) (3) (4) (5) (6) (7) (8) Bengali 74.35 (345) 89.19 (33) 75.45 (378) 25.65 (119) 10.81 (4) 24.55 (123) 0.044 Chakma 87.68 (427) 85.00 (17) 87.57 (444) 12.32 (60) 15.00 (3) 12.43 (63) 0.722 Marma 66.89 (303) 80.00 (40) 68.19 (343) 33.11 (150) 20.00 (10) 31.81 (160) 0.059 Mro 45.14 (223) 62.50 (10) 45.69 (233) 54.86 (271) 37.50 (6) 54.31 (277) 0.170 Tripura 82.06 (398) 91.67 (22) 82.51 (420) 17.94 (87) 8.33 (2) 17.49 (89) 0.227 All 71.17 (1696) 82.99 (122) 71.86 (1818) 28.83 (687) 17.01 (25) 28.14 (712) 0.002
Figures in the parentheses are the number of households. Table 3B: Food security status among male and female headed households by ethnic group (4 food security categories)
Chronic food insecurity Transitory food insecurity Breakeven Surplus Ethnic group Male Female Total Male Female Total Male Female Total Male Female Total
Pearson chi-square (p-value)
(1) (2) (3) (4) (5) (6) (7) (8) (9) (10) (11) (12) (13) (14) Bengali 20.04
(93) 54.05 (20)
22.55 (113)
54.31 (252)
35.14 (13)
52.89 (265)
21.34 (99)
5.41 (2)
20.16 (101)
4.31 (20)
5.41 (2)
4.39 (22)
0.000
Chakma 30.80 (150)
45.00 (9)
31.36 (159)
56.88 (277)
40.00 (8)
56.21 (285)
10.47 (51)
5.00 (1)
10.26 (52)
1.85 (9)
10.00 (2)
2.17 (11)
0.034
Marma 24.50 (111)
38.00 (19)
25.84 (130)
42.38 (192)
42.00 (21)
42.35 (213)
27.81 (126)
18.00 (9)
26.84 (135)
5.30 (24)
2.00 (1)
4.97 (25)
0.123
Mro 8.50 (42)
12.50 (2)
8.63 (44)
36.64 (181)
50.00 (8)
37.06 (189)
43.32 (214)
37.50 (6)
43.14 (220)
11.54 (57)
0.00 (0)
11.18 (57)
0.391
Tripura 58.35 (283)
79.17 (19)
59.33 (302)
23.71 (115)
12.50 (3)
23.18 (118)
15.26 (74)
8.33 (2)
14.93 (76)
2.68 (13)
0.00 (0)
2.55 (13)
0.232
All 28.49 (679)
46.94 (69)
29.57 (748)
42.68 (1017)
36.05 (53)
42.29 (1070)
23.67 (564)
13.61 (20)
23.08 (584)
5.16 (123)
3.40 (5)
5.06 (128)
0.000
Figures in the parentheses are the number of households.
Table 4: Results for the ordered probit model (All ethnic groups) Dependent variable: Food security status (1= Chronic food insecurity, 2= Transitory food insecurity, 3=Breakeven, 4=Food surplus)
Marginal effect Independent variables
Coefficient j=1 (Chronic food insecurity)
j=2 (Transitory food insecurity)
j=3 (Breakeven) j=4 (Food surplus)
(1) (2) (3) (4) (5) (6) GEND 0.222* (0.115) -0.274* (0.142) 0.001 (0.004) 0.258* (0.134) 0.527* (0.274)
AGE 0.007 (0.011) -0.369 (0.600) 0.002 (0.006) 0.347 (0.566) 0.708 (1.154)
AGE2 -0.000 (0.000) 0.056 (0.296) -0.000 (0.002) -0.053 (0.279) -0.108 (0.570)
EDU 0.068*** (0.009) -0.122*** (0.016) 0.001 (0.002) 0.115*** (0.016) 0.234*** (0.032)
OCCU 0.200*** (0.067) -0.061*** (0.021) 0.000 (0.001) 0.057*** (0.019) 0.117*** (0.039)
STAT 0.485*** (0.131) -0.018*** (0.005) 0.000 (0.000) 0.017*** (0.005) 0.034*** (0.009)
DDR -0.125*** (0.048) 0.087*** (0.034) -0.000 (0.001) -0.082*** (0.032) -0.168*** (0.064)
PLND 0.094** (0.039) -0.079** (0.033) 0.000 (0.001) 0.074** (0.031) 0.151** (0.063)
JHUM 0.037*** (0.012) -0.046*** (0.015) 0.000 (0.001) 0.043*** (0.015) 0.088*** (0.030)
AMPR 0.013*** (0.001) -0.456*** (0.046) 0.002 (0.007) 0.430*** (0.044) 0.876*** (0.09)
VIBR 0.012 (0.023) -0.000 (0.000) 0.000 (0.000) 0.000 (0.000) 0.000 (0.000)
Cut point 1 -0.090 (0.287)
Cut point 2 1.363 (0.289)
Cut point 3 2.779 (0.300)
Log likelihood -2477.98
Predicted
probabilities
0.293 0.437 0.219 0.051
N 748 1070 504 128
Figures in the parentheses are White (1980) corrected robust standard errors. The model includes ethnicity and district dummies but the coefficients are not reported. *** Significant at the 1% level, ** significant at the 5% level, * significant at the 10% level.
Table 5: Results for the ordered probit model (Indigenous ethnic groups only) Dependent variable: Food security status (1= Chronic food insecurity, 2= Transitory food insecurity, 3=Breakeven, 4=Food surplus)
Marginal effect Independent variables
Coefficient j=1 (Chronic food insecurity)
j=2 (Transitory food insecurity)
j=3 (Breakeven) j=4 (Food surplus)
(1) (2) (3) (4) (5) (6) GEND 0.101 (0.124) -0.123 (0.152) 0.001 (0.003) 0.118 (0.146) 0.246 (0.303)
AGE 0.003 (0.013) -0.159 (0.713) 0.002 (0.008) 0.152 (0.684) 0.316 (1.419)
AGE2 0.000 (0.000) -0.110 (0.351) 0.001 (0.004) 0.106 (0.336) 0.219 (0.698)
EDU 0.078*** (0.011) -0.115*** (0.016) 0.001 (0.002) 0.110*** (0.016) 0.228*** (0.034)
OCCU 0.258*** (0.086) -0.049*** (0.017) 0.001 (0.001) 0.047*** (0.016) 0.098*** (0.033)
STAT 0.459*** (0.131) -0.021*** (0.006) 0.000 (0.000) 0.020*** (0.006) 0.041*** (0.012)
DDR -0.134** (0.056) 0.088** (0.037) -0.001 (0.002) -0.085** (0.035) -0.176** (0.073)
PLND 0.088** (0.038) -0.080** (0.035) 0.001 (0.001) 0.077** (0.033) 0.160** (0.069)
JHUM 0.041*** (0.013) -0.062*** (0.020) 0.001 (0.001) 0.060*** (0.019) 0.124*** (0.040)
AMPR 0.013*** (0.001) -0.508*** (0.054) 0.006 (0.009) 0.488*** (0.052) 1.012*** (0.110)
VIBR 0.012 (0.024) 0.000 (0.000) -0.000 (0.000) -0.000 (0.000) -0.000 (0.001)
Cut point 1 0.492 (0.335)
Cut point 2 1.909 (0.340)
Cut point 3 3.389 (0.354)
Log likelihood -1954.65
Predicted
probabilities
0.310 0.411 0.226 0.053
N 635 805 483 106
Figures in the parentheses are White (1980) corrected robust standard errors. The model includes ethnicity and district dummies but the coefficients are not reported. *** Significant at the 1% level, ** significant at the 5% level, * significant at the 10% level.
35
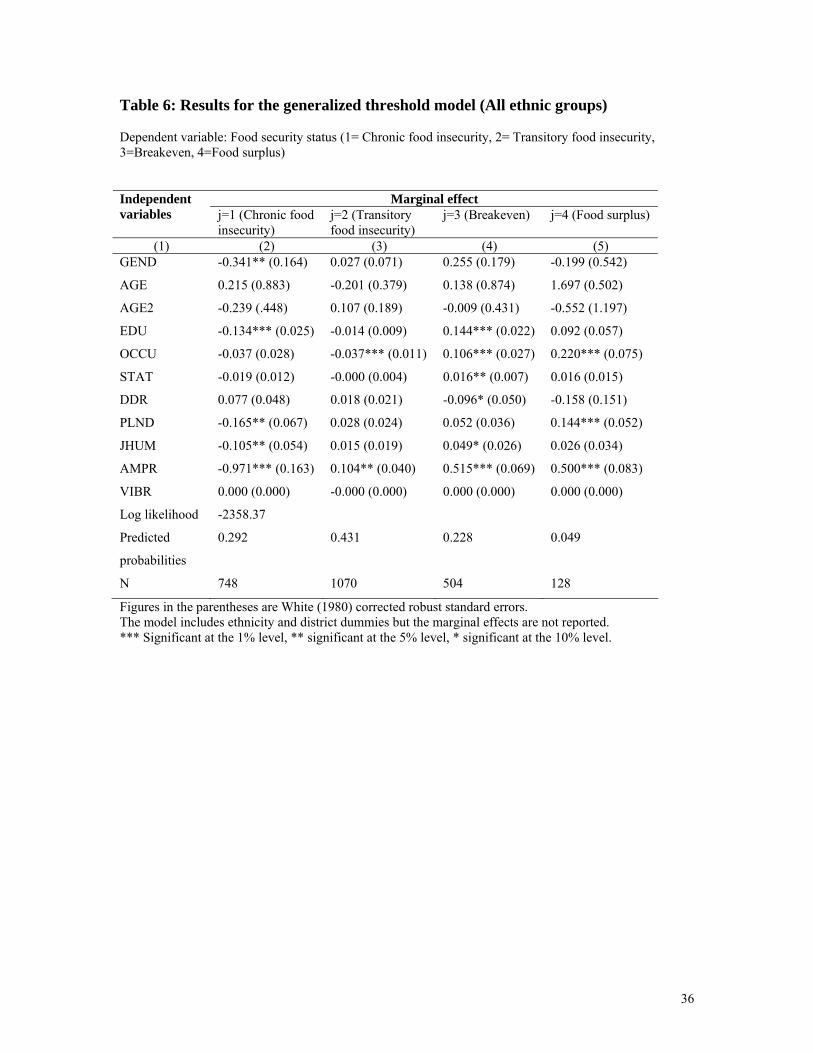
Table 6: Results for the generalized threshold model (All ethnic groups) Dependent variable: Food security status (1= Chronic food insecurity, 2= Transitory food insecurity, 3=Breakeven, 4=Food surplus)
Marginal effect Independent variables j=1 (Chronic food
insecurity) j=2 (Transitory food insecurity)
j=3 (Breakeven) j=4 (Food surplus)
(1) (2) (3) (4) (5) GEND -0.341** (0.164) 0.027 (0.071) 0.255 (0.179) -0.199 (0.542)
AGE 0.215 (0.883) -0.201 (0.379) 0.138 (0.874) 1.697 (0.502)
AGE2 -0.239 (.448) 0.107 (0.189) -0.009 (0.431) -0.552 (1.197)
EDU -0.134*** (0.025) -0.014 (0.009) 0.144*** (0.022) 0.092 (0.057)
OCCU -0.037 (0.028) -0.037*** (0.011) 0.106*** (0.027) 0.220*** (0.075)
STAT -0.019 (0.012) -0.000 (0.004) 0.016** (0.007) 0.016 (0.015)
DDR 0.077 (0.048) 0.018 (0.021) -0.096* (0.050) -0.158 (0.151)
PLND -0.165** (0.067) 0.028 (0.024) 0.052 (0.036) 0.144*** (0.052)
JHUM -0.105** (0.054) 0.015 (0.019) 0.049* (0.026) 0.026 (0.034)
AMPR -0.971*** (0.163) 0.104** (0.040) 0.515*** (0.069) 0.500*** (0.083)
VIBR 0.000 (0.000) -0.000 (0.000) 0.000 (0.000) 0.000 (0.000)
Log likelihood -2358.37
Predicted
probabilities
0.292 0.431 0.228 0.049
N 748 1070 504 128
Figures in the parentheses are White (1980) corrected robust standard errors. The model includes ethnicity and district dummies but the marginal effects are not reported. *** Significant at the 1% level, ** significant at the 5% level, * significant at the 10% level.
36
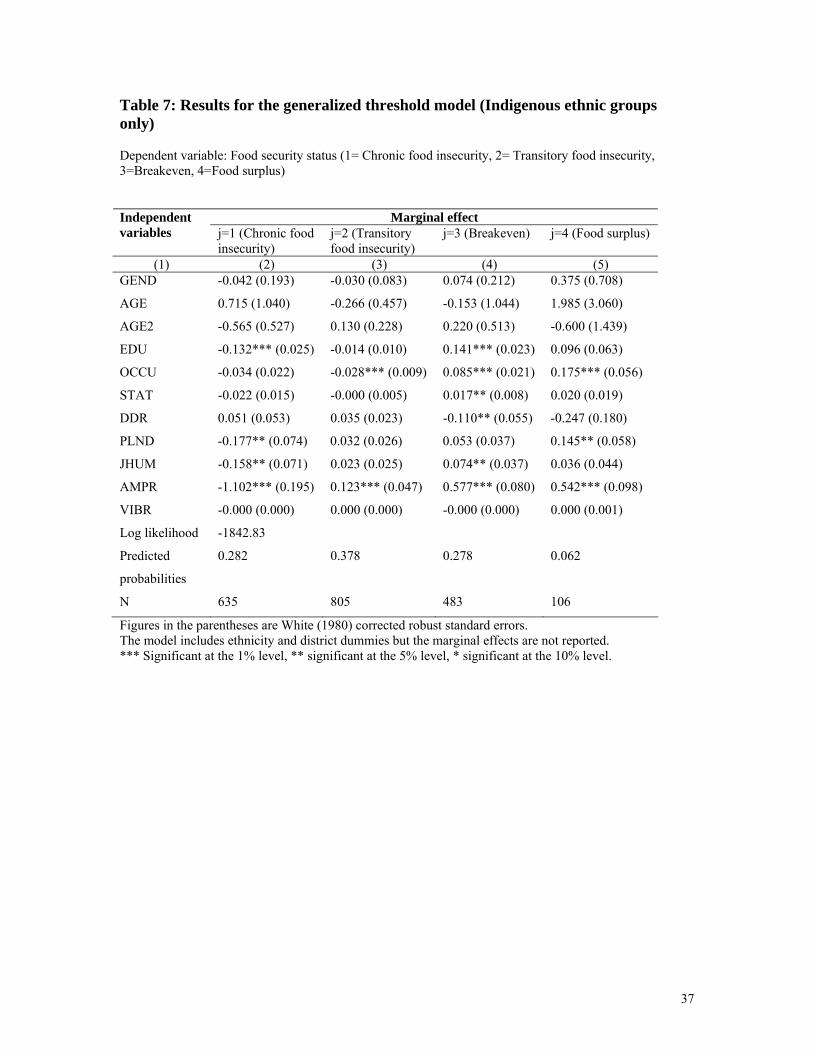
Table 7: Results for the generalized threshold model (Indigenous ethnic groups only) Dependent variable: Food security status (1= Chronic food insecurity, 2= Transitory food insecurity, 3=Breakeven, 4=Food surplus)
Marginal effect Independent variables j=1 (Chronic food
insecurity) j=2 (Transitory food insecurity)
j=3 (Breakeven) j=4 (Food surplus)
(1) (2) (3) (4) (5) GEND -0.042 (0.193) -0.030 (0.083) 0.074 (0.212) 0.375 (0.708)
AGE 0.715 (1.040) -0.266 (0.457) -0.153 (1.044) 1.985 (3.060)
AGE2 -0.565 (0.527) 0.130 (0.228) 0.220 (0.513) -0.600 (1.439)
EDU -0.132*** (0.025) -0.014 (0.010) 0.141*** (0.023) 0.096 (0.063)
OCCU -0.034 (0.022) -0.028*** (0.009) 0.085*** (0.021) 0.175*** (0.056)
STAT -0.022 (0.015) -0.000 (0.005) 0.017** (0.008) 0.020 (0.019)
DDR 0.051 (0.053) 0.035 (0.023) -0.110** (0.055) -0.247 (0.180)
PLND -0.177** (0.074) 0.032 (0.026) 0.053 (0.037) 0.145** (0.058)
JHUM -0.158** (0.071) 0.023 (0.025) 0.074** (0.037) 0.036 (0.044)
AMPR -1.102*** (0.195) 0.123*** (0.047) 0.577*** (0.080) 0.542*** (0.098)
VIBR -0.000 (0.000) 0.000 (0.000) -0.000 (0.000) 0.000 (0.001)
Log likelihood -1842.83
Predicted
probabilities
0.282 0.378 0.278 0.062
N 635 805 483 106
Figures in the parentheses are White (1980) corrected robust standard errors. The model includes ethnicity and district dummies but the marginal effects are not reported. *** Significant at the 1% level, ** significant at the 5% level, * significant at the 10% level.
37
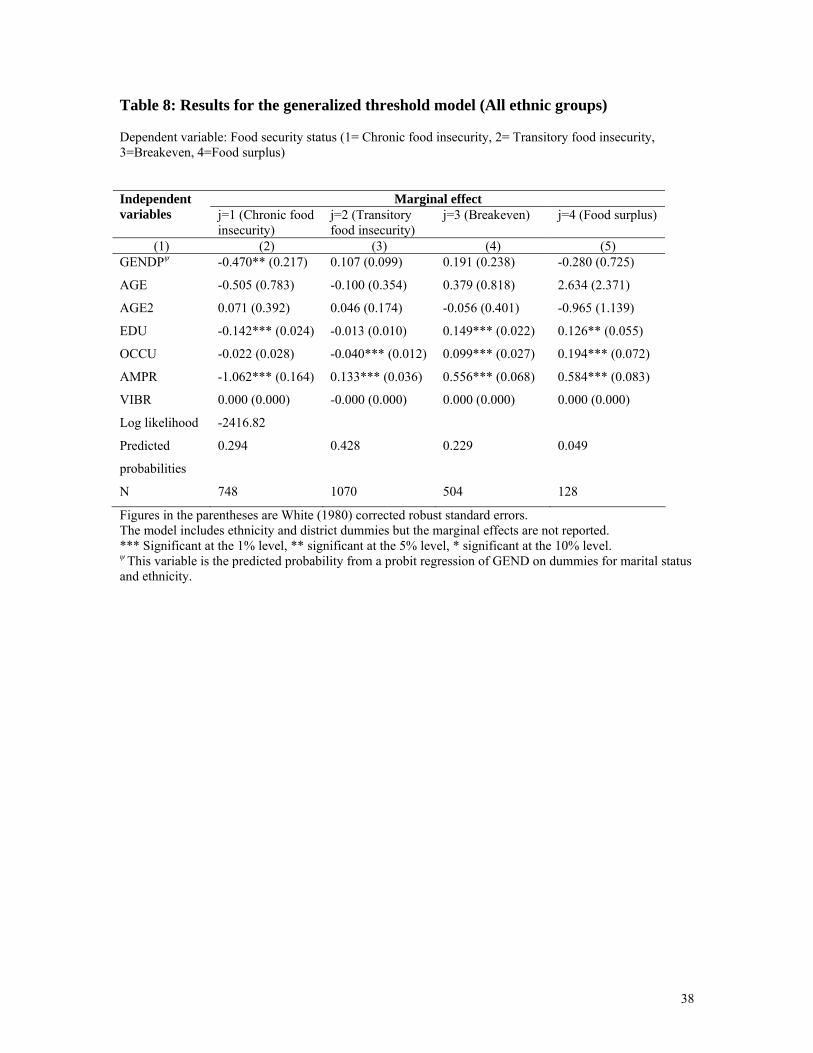
Table 8: Results for the generalized threshold model (All ethnic groups) Dependent variable: Food security status (1= Chronic food insecurity, 2= Transitory food insecurity, 3=Breakeven, 4=Food surplus)
Marginal effect Independent variables j=1 (Chronic food
insecurity) j=2 (Transitory food insecurity)
j=3 (Breakeven) j=4 (Food surplus)
(1) (2) (3) (4) (5) GENDPψ -0.470** (0.217) 0.107 (0.099) 0.191 (0.238) -0.280 (0.725)
AGE -0.505 (0.783) -0.100 (0.354) 0.379 (0.818) 2.634 (2.371)
AGE2 0.071 (0.392) 0.046 (0.174) -0.056 (0.401) -0.965 (1.139)
EDU -0.142*** (0.024) -0.013 (0.010) 0.149*** (0.022) 0.126** (0.055)
OCCU -0.022 (0.028) -0.040*** (0.012) 0.099*** (0.027) 0.194*** (0.072)
AMPR -1.062*** (0.164) 0.133*** (0.036) 0.556*** (0.068) 0.584*** (0.083)
VIBR 0.000 (0.000) -0.000 (0.000) 0.000 (0.000) 0.000 (0.000)
Log likelihood -2416.82
Predicted
probabilities
0.294 0.428 0.229 0.049
N 748 1070 504 128
Figures in the parentheses are White (1980) corrected robust standard errors. The model includes ethnicity and district dummies but the marginal effects are not reported. *** Significant at the 1% level, ** significant at the 5% level, * significant at the 10% level. ψ This variable is the predicted probability from a probit regression of GEND on dummies for marital status and ethnicity.
38
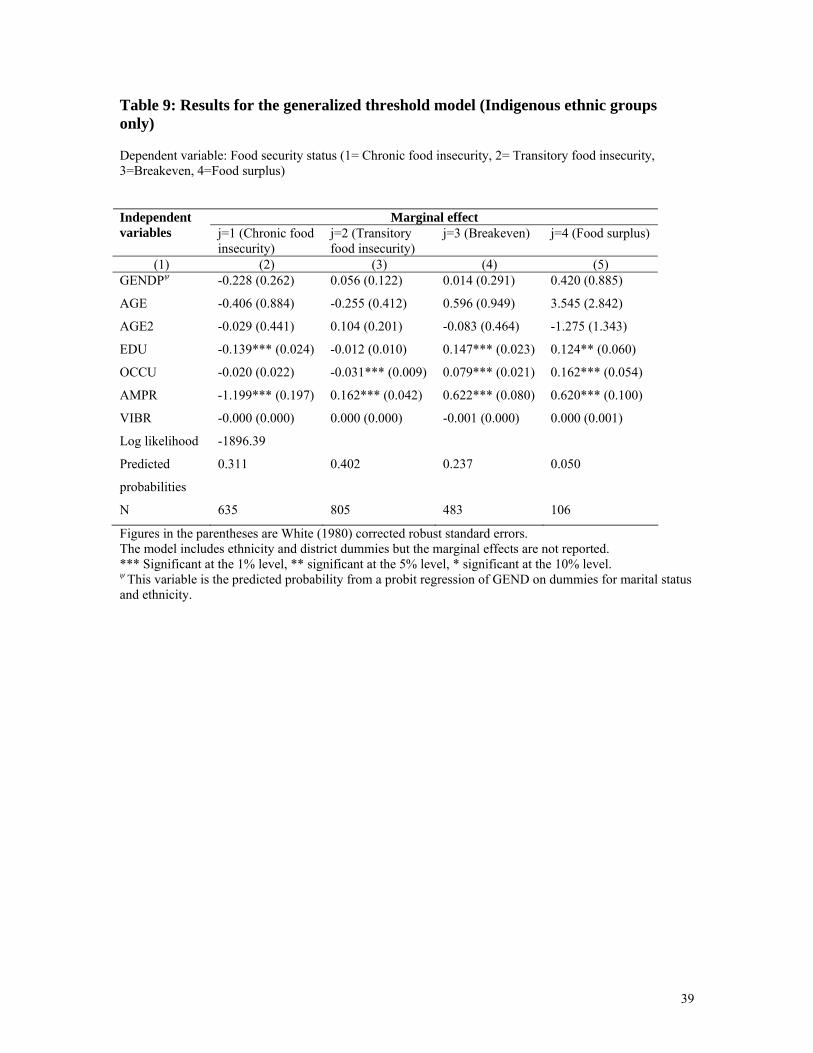
Table 9: Results for the generalized threshold model (Indigenous ethnic groups only) Dependent variable: Food security status (1= Chronic food insecurity, 2= Transitory food insecurity, 3=Breakeven, 4=Food surplus)
Marginal effect Independent variables j=1 (Chronic food
insecurity) j=2 (Transitory food insecurity)
j=3 (Breakeven) j=4 (Food surplus)
(1) (2) (3) (4) (5) GENDPψ -0.228 (0.262) 0.056 (0.122) 0.014 (0.291) 0.420 (0.885)
AGE -0.406 (0.884) -0.255 (0.412) 0.596 (0.949) 3.545 (2.842)
AGE2 -0.029 (0.441) 0.104 (0.201) -0.083 (0.464) -1.275 (1.343)
EDU -0.139*** (0.024) -0.012 (0.010) 0.147*** (0.023) 0.124** (0.060)
OCCU -0.020 (0.022) -0.031*** (0.009) 0.079*** (0.021) 0.162*** (0.054)
AMPR -1.199*** (0.197) 0.162*** (0.042) 0.622*** (0.080) 0.620*** (0.100)
VIBR -0.000 (0.000) 0.000 (0.000) -0.001 (0.000) 0.000 (0.001)
Log likelihood -1896.39
Predicted
probabilities
0.311 0.402 0.237 0.050
N 635 805 483 106
Figures in the parentheses are White (1980) corrected robust standard errors. The model includes ethnicity and district dummies but the marginal effects are not reported. *** Significant at the 1% level, ** significant at the 5% level, * significant at the 10% level. ψ This variable is the predicted probability from a probit regression of GEND on dummies for marital status and ethnicity.
39
Table 10: Results for the binary probit model Dependent variable: Food security status (1= Food security 0= No food security)
All ethnic groups Indigenous ethnic groups only Independent variables Coefficient Marginal effect Coefficient Marginal effect
(1) (2) (3) (4) (5) GEND 0.237* (0.143) 0.069* (0.038) 0.177 (0.163) 0.053 (0.046)
AGE 0.010 (0.013) 0.003 (0.004) 0.005 (0.016) 0.002 (0.005)
AGE2 -0.0000 (0.000) -0.000 (0.000) 0.000 (0.000) 0.000 (0.000)
EDU 0.084*** (0.011) 0.027*** (0.003) 0.105*** (0.013) 0.033*** (0.004)
OCCU 0.235*** (0.082) 0.077*** (0.028) 0.317*** (0.095) 0.107*** (0.034)
STAT 0.680*** (0.163) 0.250*** (0.065) 0.636*** (0.165) 0.233*** (0.065)
DDR -0.002** (0.0006) -0.0005** (0.0002) -0.002*** (0.0008) -0.0006*** (0.0002)
PLND 0.001* (0.0007) 0.0004* (0.0002) 0.001* (0.0007) 0.0004* (0.0002)
JHUM 0.001*** (0.000) 0.0003*** (0.000) 0.001*** (0.000) 0.0003*** (0.000)
VIBR 0.035 (0.027) 0.011 (0.008) 0.036 (0.028) 0.011 (0.009)
Constant -1.488 (0.352) -2.097*** (0.430)
Log
likelihood
-1219.61 -954.30
N 2450 1702
Figures in the parentheses are White (1980) corrected robust standard errors The model includes ethnicity and district dummies but the coefficients are not reported. *** Significant at the 1% level, ** significant at the 5% level, * significant at the 10% level.
40
Table 11: Results for the generalized threshold model (All ethnic groups) Dependent variable: Food security status (1= Chronic food insecurity, 2= Transitory food insecurity, 3=Breakeven, 4=Food surplus)
Marginal effect Independent variables j=1 (Chronic food
insecurity) j=2 (Transitory food insecurity)
j=3 (Breakeven) j=4 (Food surplus)
(1) (2) (3) (4) (5) GEND 0.094** (0.037) 0.034 (0.049) 0.068 (0.046) -0.008 (0.017)
AGE 0.448 (0.906) -0.271 (0.383) 0.127 (0.877) 1.657 (2.500)
AGE2 -0.354 (0.461) 0.143 (0.192) -0.006 (0.433) -0.530 (1.196)
EDU -0.134*** (0.025) -0.014 (0.010) 0.144*** (0.022) 0.091 (0.057)
OCCU -0.039 (0.028) -0.038*** (0.012) 0.108*** (0.027) 0.221*** (0.075)
STAT -0.019 (0.012) -0.000 (0.004) 0.015** (0.007) 0.016 (0.015)
DDR -0.000 (0.000) 0.000 (0.000) -0.0004* (0.0002) -0.000 (0.000)
GEND*DDR 0.002** (0.0008) 0.001 (0.001) 0.001 (0.001) 0.000 (0.000)
PLND -0.166** (0.068) 0.028 (0.024) 0.052 (0.036) 0.144*** (0.052)
JHUM -0.108* (0.054) 0.016 (0.019) 0.049* (0.026) 0.026 (0.034)
AMPR -0.976*** (0.162) 0.104** (0.040) 0.517*** (0.069) 0.500*** (0.083)
VIBR 0.000 (0.000) -0.000 (0.000) 0.000 (0.000) 0.000 (0.000)
Log likelihood -2353.42
Predicted
probabilities
0.292 0.431 0.2283 0.0489
N 748 1070 504 128
Figures in the parentheses are White (1980) corrected robust standard errors. The model includes ethnicity and district dummies but the marginal effects are not reported. *** Significant at the 1% level, ** significant at the 5% level, * significant at the 10% level.
41
42
Table 12: Results for the generalized threshold model (Indigenous ethnic groups only) Dependent variable: Food security status (1= Chronic food insecurity, 2= Transitory food insecurity, 3=Breakeven, 4=Food surplus)
Marginal effect Independent variables j=1 (Chronic food
insecurity) j=2 (Transitory food insecurity)
j=3 (Breakeven) j=4 (Food surplus)
(1) (2) (3) (4) (5) GEND 0.070 (0.047) 0.058 (0.063) 0.010 (0.062) 0.002 (0.019)
AGE 1.015 (1.056) -0.376 (0.462) -0.118 (1.047) 1.975 (3.055)
AGE2 -0.733 (0.537) 0.191 (0.231) 0.201 (0.515) -0.591 (1.438)
EDU -0.135*** (0.025) -0.013 (0.010) 0.141*** (0.023) 0.097 (0.063)
OCCU -0.033 (0.022) -0.029*** (0.009) 0.087*** (0.021) 0.175*** (0.056)
STAT -0.022 (0.015) -0.000 (0.005) 0.017** (0.008) 0.020 (0.019)
DDR -0.000 (0.000) 0.000 (0.000) -0.001* (0.0002) -0.000 (0.000)
GEND*DDR 0.003*** (0.001) 0.003** (0.001) 0.000 (0.001) -0.000 (0.000)
PLND -0.178** (0.074) 0.032 (0.026) 0.053 (0.037) 0.145** (0.058)
JHUM -0.161** (0.071) 0.023 (0.025) 0.075** (0.037) 0.036 (0.044)
AMPR -1.114*** (0.194) 0.125*** (0.047) 0.578*** (0.080) 0.542*** (0.098)
VIBR -0.000 (0.000) 0.000 (0.000) -0.000 (0.000) 0.000 (0.001)
Log likelihood -1836.17
Predicted
probabilities
0.283 0.377 0.278 0.063
N 635 805 483 106
Figures in the parentheses are White (1980) corrected robust standard errors. The model includes ethnicity and district dummies but the marginal effects are not reported. *** Significant at the 1% level, ** significant at the 5% level, * significant at the 10% level.
Related Documents