Contents lists available at ScienceDirect Journal of The Japanese and International Economies journal homepage: www.elsevier.com/locate/jjie Are short-sales constraints binding when there is a centralized lendable securities market? Evidence from Japan ☆ Mostafa Saidur Rahim Khan a , Marc Bremer b, ⁎ , Hideaki Kiyoshi Kato a a Graduate School of Economics, Nagoya University, Furo-cho, Chikusa-ku, Nagoya 464-8601, Japan b School of Business Administration, Nanzan University, 18 Yamazato-cho, Showa-ku, Nagoya 466-8673, Japan ARTICLE INFO Keywords: Short-sales Centralized securities lending Recall risk Overvaluation Pricing JEL classification: G14 G17 M4 ABSTRACT This study examines the significance of short-sales constraints in the presence of a centralized lendable securities market in Japan. We find evidence that a centralized lendable securities market experiences lower short sales constraints. The cost of borrowing stock is found to be lower in Japan's centralized lendable securities market compared with a non-centralized lendable securities market. We also find evidence that recall risk is lower in a centralized lendable securities market. Additionally, there is evidence that stocks are not systematically over- valued in the presence of the centralized lendable securities market. These results are robust when alternative measures of short-sales constraints are considered. 1. Introduction The ability to sell short plays an important role in the process of efficient price determination in stock markets. One of the explanations offered by researchers for apparent mispricing is that constraints on short sales impede the reflection of new information. A market with short-sales constraints may slow recognition of negative information by excluding informed investors from the market (Miller, 1977; Diamond and Verrecchia, 1987 and Duffie et al., 2002). Short-sales constraints also slow the speed of price adjustment to private information (Diamond and Verrecchia, 1987) and may make markets more sus- ceptible to crashes (Hong and Stein, 2003). However, concrete evidence of the negative impact of short-sales constraints is difficult to observe because of the institutional features of stock markets. Previous studies used indirect measures of short-sales constraints, such as the short in- terest ratio and the ownership structure of securities; these do not consider the actual cost of short sales. Although D’ Avolio (2002), Geczy et al. (2002), Jones and Lamont (2002) and Beneish et al. (2015) pro- vided evidence on the impact of short-sales constraints using the cost of borrowing, their data were collected from only a few custodial banks that did not represent the whole market. This limitation occurs because individual custodial banks conduct short-sales transactions in non- centralized lendable securities markets. Although the total demand for short sales of stock can be found by summing individual demands from custodian banks, the actual cost of borrowing stocks is difficult to de- termine for three reasons. First, lack of market-wide data makes it impossible to characterize the complete schedule of demand and supply (Kolasinski et al., 2013). Second, consistent pricing of securities bor- rowing fees might not be possible as the securities borrowing fees could be linked to other services provided to brokers (Saffi and Sigurdsson, 2011). And third, the cost of borrowing could be higher in a non-cen- tralized market because of higher search frictions (Jones and Lamont, 2002). To escape these limitations, we examine the significance of short-sales constraints in the presence of a centralized lendable secu- rities market. The lendable securities market in Japan provides a unique data set upon which to conduct our analysis because the market is centrally controlled by the Japan Securities Finance Company (JSFC). All securities firms and stock lenders are connected to the JSFC to lend and borrow stocks. Although a negotiable securities borrowing system exists (with costs mutually determined by lenders and borrowers), most short sales are conducted with a standardized trading system where the JSFC charges a uniform cost of borrowing to all stock borrowers. We hypothesize that the cost of borrowing securities is low in this cen- tralized lendable securities market because of low search frictions. We https://doi.org/10.1016/j.jjie.2017.11.003 Received 3 October 2017; Received in revised form 27 November 2017; Accepted 30 November 2017 ☆ The authors thank Mat Ringgenberg, Edmund Skrzypczak, Eriko Yamamoto and the anonymous referee. This paper also benefited from the insightful comments of participants in the 10th annual conference of the Association of Behavioral Economics and Finance as well as the Finance Camp-2017 organized by the Japan Finance Association. The authors have no relevant or material financial interests that relate to the research described in this paper. ⁎ Corresponding author. E-mail addresses: [email protected] (M.S.R. Khan), [email protected] (M. Bremer), [email protected] (H.K. Kato). Journal of The Japanese and International Economies 48 (2018) 85–96 Available online 09 December 2017 0889-1583/ © 2017 Elsevier Inc. All rights reserved. T

Welcome message from author
This document is posted to help you gain knowledge. Please leave a comment to let me know what you think about it! Share it to your friends and learn new things together.
Transcript
Contents lists available at ScienceDirect
Journal of The Japanese and International Economies
journal homepage: www.elsevier.com/locate/jjie
Are short-sales constraints binding when there is a centralized lendablesecurities market? Evidence from Japan☆
Mostafa Saidur Rahim Khana, Marc Bremerb,⁎, Hideaki Kiyoshi Katoa
aGraduate School of Economics, Nagoya University, Furo-cho, Chikusa-ku, Nagoya 464-8601, Japanb School of Business Administration, Nanzan University, 18 Yamazato-cho, Showa-ku, Nagoya 466-8673, Japan
A R T I C L E I N F O
Keywords:Short-salesCentralized securities lendingRecall riskOvervaluationPricing
JEL classification:G14G17M4
A B S T R A C T
This study examines the significance of short-sales constraints in the presence of a centralized lendable securitiesmarket in Japan. We find evidence that a centralized lendable securities market experiences lower short salesconstraints. The cost of borrowing stock is found to be lower in Japan's centralized lendable securities marketcompared with a non-centralized lendable securities market. We also find evidence that recall risk is lower in acentralized lendable securities market. Additionally, there is evidence that stocks are not systematically over-valued in the presence of the centralized lendable securities market. These results are robust when alternativemeasures of short-sales constraints are considered.
1. Introduction
The ability to sell short plays an important role in the process ofefficient price determination in stock markets. One of the explanationsoffered by researchers for apparent mispricing is that constraints onshort sales impede the reflection of new information. A market withshort-sales constraints may slow recognition of negative information byexcluding informed investors from the market (Miller, 1977; Diamondand Verrecchia, 1987 and Duffie et al., 2002). Short-sales constraintsalso slow the speed of price adjustment to private information(Diamond and Verrecchia, 1987) and may make markets more sus-ceptible to crashes (Hong and Stein, 2003). However, concrete evidenceof the negative impact of short-sales constraints is difficult to observebecause of the institutional features of stock markets. Previous studiesused indirect measures of short-sales constraints, such as the short in-terest ratio and the ownership structure of securities; these do notconsider the actual cost of short sales. Although D’ Avolio (2002), Geczyet al. (2002), Jones and Lamont (2002) and Beneish et al. (2015) pro-vided evidence on the impact of short-sales constraints using the cost ofborrowing, their data were collected from only a few custodial banksthat did not represent the whole market. This limitation occurs becauseindividual custodial banks conduct short-sales transactions in non-
centralized lendable securities markets. Although the total demand forshort sales of stock can be found by summing individual demands fromcustodian banks, the actual cost of borrowing stocks is difficult to de-termine for three reasons. First, lack of market-wide data makes itimpossible to characterize the complete schedule of demand and supply(Kolasinski et al., 2013). Second, consistent pricing of securities bor-rowing fees might not be possible as the securities borrowing fees couldbe linked to other services provided to brokers (Saffi and Sigurdsson,2011). And third, the cost of borrowing could be higher in a non-cen-tralized market because of higher search frictions (Jones and Lamont,2002). To escape these limitations, we examine the significance ofshort-sales constraints in the presence of a centralized lendable secu-rities market. The lendable securities market in Japan provides a uniquedata set upon which to conduct our analysis because the market iscentrally controlled by the Japan Securities Finance Company (JSFC).All securities firms and stock lenders are connected to the JSFC to lendand borrow stocks. Although a negotiable securities borrowing systemexists (with costs mutually determined by lenders and borrowers), mostshort sales are conducted with a standardized trading system where theJSFC charges a uniform cost of borrowing to all stock borrowers. Wehypothesize that the cost of borrowing securities is low in this cen-tralized lendable securities market because of low search frictions. We
https://doi.org/10.1016/j.jjie.2017.11.003Received 3 October 2017; Received in revised form 27 November 2017; Accepted 30 November 2017
☆ The authors thank Mat Ringgenberg, Edmund Skrzypczak, Eriko Yamamoto and the anonymous referee. This paper also benefited from the insightful comments of participants in the10th annual conference of the Association of Behavioral Economics and Finance as well as the Finance Camp-2017 organized by the Japan Finance Association. The authors have norelevant or material financial interests that relate to the research described in this paper.
⁎ Corresponding author.E-mail addresses: [email protected] (M.S.R. Khan), [email protected] (M. Bremer), [email protected] (H.K. Kato).
Journal of The Japanese and International Economies 48 (2018) 85–96
Available online 09 December 20170889-1583/ © 2017 Elsevier Inc. All rights reserved.
T
also hypothesize that likelihood of borrowed stock being recalled is lessin this centralized lendable securities market. Thus, short sales shouldbe less constrained in Japan's centralized lendable securities market.This suggests that superior pricing efficiency will result.
We provide new empirical evidence on the market for lendable se-curities in Japan. First, short-sales constraints are not generally bindingin Japan; the cost of borrowing is low, demand for short-sale of stocks isalso low and institutional ownership is high. Second, a near-directcomparison of the cost of borrowing securities listed on both a cen-tralized (Tokyo Stock Exchange) and a non-centralized (New York StockExchange) lendable securities market shows that the cost of borrowingis lower in the centralized market. Third, the demand for lendable se-curities has a greater impact on the cost of borrowing. Fourth, shortsellers demand the stock of large-capitalization firms and value stocksmore; demand for these securities often exceeds their supply. Fifth,recall risk, a situation when lenders demand that the shorted securitiesbe returned, is not observed in the centralized lendable securitiesmarket even when the aggregate short-sales position exceeds the supplyof lendable securities. And finally, the sixth result is that overvaluationof stocks is not observed in the centralized lendable securities marketeven when the cost of borrowing and the short interest ratio are high.
The most closely related studies to ours are D’ Avolio (2002) andBeneish et al. (2015). Both studies provided empirical evidence on themarket for borrowing stocks and the determinants of the cost of bor-rowing. Using 18 months of data from a leading custodial bank, D’Avolio (2002) found that evidence of high borrowing cost and recallwas rare in the U.S. but that the prevalence of short-sales increased withthe divergence of opinion among investors. Beneish et al. (2015), on theother hand, provided evidence on the economic determinants of short-sales supply using 114 months of data from Markit Data Explorer (DXL),which provided data on lendable equity from more than 100 institu-tional investors. They found that the supply of lendable securities in-creased with the cost of borrowing and that the supply of lendable se-curities explained stock returns more completely when the lendablesupply was binding.
We contribute to the existing literature on short-sales constraints inat least three ways. First, to the best of our knowledge, this is the firststudy that provides evidence of short-sales constraints under a cen-tralized lendable securities market. Second, we provide evidence onshort-sales constraints using daily data, which provides an opportunityto understand the daily movement of borrowing fees, the demand forborrowable securities and the supply of lendable securities. Moreover,our use of daily data is helpful in the study of short-term trading stra-tegies. Previous studies mostly used monthly data from custodial banks.The use of monthly data fails to capture the daily movements of the costof borrowing securities and does not permit analysis of short-termtrading strategies (Diether et al., 2009). Moreover, it is also likely thatsome short-sales transactions are omitted from analysis when shortsellers cover their positions quickly. Diether (2008) provided evidencethat almost half of securities lending contracts close out within twoweeks for the New York Stock Exchange. Third, we provide evidence onthe behavior of stock returns in Japan's centralized lendable securitiesmarket.
The remainder of this study is organized as follows. Section 2 pro-vides a literature review, Section 3 describes the theoretical argumentson how a centralized lendable securities system affects the cost ofborrowing stocks, Section 4 describes the data and the methodology,Section 5 provides empirical facts on the market for borrowing secu-rities in Japan, recall risk, and short-sales constraints, and finallySection 6 concludes the paper.
2. Literature review
Unconstrained short sales are a precondition for most rational assetpricing theories. Short-sales constraints generally refer to the variouslimits, costs and risks of shorting in addition to legal and institutional
restrictions. Previous studies used several methods to measure short-sales constraints. Short interest, measured as the actual short positionscaled by the number of outstanding shares, provides a demand-basedmeasure of short-sales constraints (Figlewski, 1981; Asquith andMeulbroek, 1995 and Desai et al., 2002). However, Chen et al. (2002)argued that short interest as a proxy for short-sales constraints is flawedand suggested using breadth of ownership to measure short-sales con-straints. Chen et al. (2002) used decline in the breadth of ownership asa proxy of short-sales constraints. Nagel (2005) used the variation of theownership structure of lendable stock as a proxy, noting that large in-stitutional investors are more likely to lend securities. Low institutionalownership thus means fewer securities can be borrowed and hence is aproxy for short-sales constraints. Demand and supply measures havebeen used to capture the effect of short-sales constraints. Asquith et al.(2005) defined short-sales constrained stocks as those having a highshort interest but low institutional ownership. D’ Avolio (2002), Jonesand Lamont (2002), Geczy et al. (2002) and Beneish et al. (2015) usedcost of borrowing securities to measure short-sales constraints.Reed (2015) argued that finding the incremental contribution of thesevarious measures of short-sales constraints is a major challenge for re-search in this area.
Several theories and hypotheses discuss how short sales affect thepricing of securities and the efficiency of the market. Miller (1977)argued that heterogeneous beliefs among investors under constrainedshort sales keeps pessimists out of the market, so market prices onlyreflect optimists’ valuations. As a result, stock prices become over-valued when short sales are constrained and the divergence of in-vestors’ opinions is high. Diamond and Verrecchia (1987) developed amodel to illustrate the effect of short-sales constraints on the distribu-tion and speed of adjustment by prices to private information. Theyargued that when short sales are constrained, both good news and badnews require more time to be reflected in prices but that bad newsrequires more time than good news. Since short-sales constraints limittrades by some informed investors, the speed of adjustment to bad newsbefore public release of the news is expected to be less. However, stockprice declines sharply when such information is made public. The ra-tional expectations model of Diamond and Verrecchia (1987) alsoconjectured that stocks are not systematically overvalued in equili-brium when short sales are constrained. Assuming that investors arerisk averse, Bai et al. (2006) found two possible contradictory valuationoutcomes. First, uninformed investors’ risk perceptions are changed bythe slower price discovery, leading them to expect higher returns thatcause lower prices. Second, short-sales constraints could impede in-vestors from taking short positions to hedge risks, which in turn, couldincrease the demand for stocks, thus leading to price rises. Hong andStein (2003) also developed a model based on the heterogeneous beliefsof investors. They argued that accumulated unrevealed negative in-formation held by investors who are prohibited from selling short willnot be reflected until prices begin to drop. The revelation of accumu-lated hidden negative information at the time of declining prices wouldaggravate market declines and ultimately lead to a market crash.
As was the case for models that attempted to predict the impact ofshort sales, empirical explorations have also failed to provide un-ambiguous evidence. In an early empirical study of Miller (1977),Harrison and Kreps (1978) argued that short-sales constraints can pushsecurities prices above the valuation of the most optimistic investors.Since then, several empirical studies have documented that short-salesconstraints as measured by high short interest actually lead to lowerfuture returns (Asquith and Meulbroek, 1995 and Desai et al., 2002).Short-sales constraints as measured by institutional ownership are alsofound to be associated with lower future returns (Nagel, 2005 andAsquith et al., 2005). Short-sales constrained stocks are not only linkedto lower future returns but are also found to be associated with evenlower returns when investors’ divergence of opinion is high(Boehme et al., 2006 and Blocher et al., 2013). Kato et al. (2015) ex-amined Japanese seasoned equity offerings (SEO) in the presence of
M.S.R. Khan et al. Journal of The Japanese and International Economies 48 (2018) 85–96
86
short-sales constraints and found that the SEOs of short-sales con-strained stocks have lower returns on both the announcement and theissue dates. Using a flow-based measure of short-sales constraints,Takahashi (2010) found that stocks with short-sales constraints ex-perience significantly lower subsequent returns in Japan. Lee andKo (2014) provided evidence that short-sales constrained stocks, asmeasured by the short interest, have temporary lower returns in theshort term. Using the cost of borrowing securities as a measure of short-sales constraints, Beneish et al. (2015), Jones and Lamont (2002), D’Avolio (2002), Geczy et al. (2002) and Ofek et al. (2004) showed thatstocks with substantially higher borrowing costs have lower subsequentreturns. Engelberg et al. (2015) documented that short-sales risksconstrain further short sales and that stocks with high short-sales riskearn lower returns in the future. Nevertheless, several other studiesfound no evidence of a relationship between high short interest andsubsequent stock returns (Figlewski, 1981; Woolridge and Dickson,1994; Brent et al., 1990 and Figlewski and Webb, 1993).
Besides the return behavior of short-sales constrained stocks, severalstudies have examined the distribution and speed of price adjustment toprivate information of short-sales constrained stocks. These studies alsoprovided evidence on how short-sales constraints restrict the efficiencyof the market. Most of the early studies on the effect of short-salesconstraints on pricing efficiency used option availability as a proxy ofshort-sales constraints to report that the introduction of options reducesshort-sales constraints and increases informational efficiency (Skinner,1990 and Damodaran and Lim, 1991). However, some of these studiesfound that short selling of stocks without options is more informative,suggesting that short-sales constraints might not reduce informationalefficiency (Aitken et al., 1998 and Senchak and Starks, 1993). As thepresence of options is an opaque proxy of short-sale constraints, laterstudies used short interest, ownership structure and the cost of bor-rowing securities to proxy short-sales constraints. Using monthly short-interest data, Desai et al. (2002) and Asquith et al. (2005) reported thatshort sellers improve informational efficiency. Using securities lendingfee data, Reed (2007) reported that short-sales constraints reduce theinformational efficiency of stock prices in the U.S. Bris et al. (2007)concluded that information is reflected in stock prices quickly incountries where short sales are not constrained. Using low lendablesecurity supply as a measure of the short-sales constraint, Saffi andSigurdsson (2011) reported that informational efficiency is lower forshort-sales constrained stocks. Using shorting flow data, Boehmer et al.(2008) and Diether et al. (2009) argued that short sellers help to correctovervaluation and increase the informational efficiency of stock prices.Isaka (2007) also provided similar evidence for Japan; short-salesconstraints reduce the speed of adjustment to negative information bystock prices. However, several studies found evidence that short salescan distort stock prices in special situations. Henry and Koski (2010)found that short sales contribute to stock price manipulation and de-stabilization around the time of seasoned equity offerings. Shkilko et al.(2008) also found that large price reversals are likely to occur whenshort-sale restrictions are lifted.
3. Theoretical arguments on how a centralized trading systemaffects the cost of borrowing securities
The literature has not examined whether the presence of a cen-tralized lendable securities trading system affects the cost and avail-ability of stocks available to short. In non-centralized lendable secu-rities markets when short sales are conducted through individualdealers, the demand for lendable securities from short sellers is metfrom the broker's own inventory or margin account stock kept withbrokers by other investors. If the total demand for lendable securitiescannot be satisfied from the broker's own sources, they ask other bro-kers or may contract with an institutional supplier. The broker's searchfor lendable securities can be conducted through an electronic locationsystem or by email, telephone or fax (Duffie et al., 2002). Locating the
appropriate stock could still be hard or it might not be possible to findthe desired quantity. As a result, in a non-centralized setup, locatingstocks can be time-consuming; demand might not be filled in-stantaneously and it could be costly if the securities are borrowed frominstitutional lenders. The cost of borrowing should reflect such fric-tions. Duffie et al. (2002) and Kolasinski et al. (2013) argued that thelocation issue is a part of the short-sale constraint as the time that isrequired to locate the stock after receiving the short-sale order could bequite long. They further argued that difficulty in locating stocks willlogically affect the price of the stock and borrowing fees. Jones andLamont (2002) also provided evidence that locating a willing lendercould be particularly difficult for illiquid, small-market-capitalizationstocks with low institutional ownership. Stock features such as marketcapitalization, float size, inclusion in an index, ownership concentra-tion, incidents like IPOs, mergers and curve-outs have also been foundto affect the level of difficulty of borrowing and locating securities(Duffie et al., 2002).
The centralized lendable securities market in Japan is controlled bythe Japan Securities Finance Company. Under this centralized tradingsystem, the terms and conditions are standardized and apply equally toevery short seller. We argue that the centralized system for securitiesborrowing and lending as exists in Japan resolves the frictions de-scribed above to a significant degree. Since all brokers have access tothe central trading system, any mismatch between the demand and thesupply of lendable securities will be quickly mitigated. Individualbrokers do not have to locate securities or spend time searching forsecurities to meet borrower's demands. If a broker fails to supply thedesired amount of lendable securities, it can immediately borrow stockfrom the JSFC, which holds a reserve of lendable securities from theexcess balances of other brokers. The only possibility of failing to satisfya borrower's demand for securities occurs when the total demand forlendable securities exceeds the total supply of lendable securities heldwithin the JSFC. In this situation, the JSFC can borrow securities fromoutside institutional lenders. As a consequence, we argue that thecentralized lendable securities system provides a consistent and reliablesupply of lendable securities that significantly reduces search frictions.Since, in most cases, the JSFC satisfies the entire demand for lendablesecurities from its own inventory, the cost of borrowing stock is neg-ligible. Significant borrowing costs, however, are incurred when theJSFC needs to borrow from outside institutional investors. We arguethat the borrowing costs for most securities are very low because theJSFC fails to fully satisfy lendable demand for only a few securities.
In non-centralized lendable securities trading systems, recall situa-tions arise when supply is less than demand for lendable securities (D’Avolio, 2002). Under recall situations, short sellers need to renegotiatethe loan at a higher cost or to close out the position. As a result, weexpect to observe higher borrowing fees or the return borrowed stock.The centralized lendable securities market reduces recall risk. We arguethat it is less likely that the demand for loanable securities would ex-ceed the supply of lendable securities because the JSFC controls thetotal supply of lendable securities. Even if a short squeeze occurs, theJSFC can mitigate the imbalance by borrowing securities from outsideinstitutions. Although a temporary increase in the cost of borrowingand the return of borrowed stocks occurs, such situations should notlast for long.
Finally, we argue that price efficiency is higher in a centralizedlendable securities market. Since the cost of borrowing securities is lessin the centralized system because of lower search frictions, there will befewer short-sale constraints, which in turn, will lead to greater pricingefficiency. As a result, more securities are expected to be priced effi-ciently.
4. Data and methodology
To examine the significance of short-sales constraints in a cen-tralized lendable securities market, we study all stocks listed on the
M.S.R. Khan et al. Journal of The Japanese and International Economies 48 (2018) 85–96
87
Tokyo Stock Exchange (TSE) and the Japan Securities DealersAssociation Quotation System exchange, but exclude real estate in-vestment trusts and exchange traded funds. We collect daily data onsecurities borrowing fees, amount of stock borrowed and the amount oflendable securities from the JSFC. Data on trading volume, the price-to-book ratio, the number of shares outstanding, market value of equity,institutional ownership and stock prices are from the Nikkei NEEDSdatabase. While trading volume, the price-to-book ratio, the number ofshares outstanding, market value of equity and stock prices are reportedon daily basis, institutional ownership is reported on semi-annual basis.Additionally, Nikkei NEEDS provides information on the top 30 stock-holders in each firm, which typically account for 60 to 70% of totalownership in Japan. The sample period of our study ranges fromNovember 12, 2015 to May 11, 2016. This period contains no change inregulations on short sales that could directly affect the cost of bor-rowing of securities.1
Using this daily data set, we test our hypotheses that a centralizedlendable securities market reduces the cost of borrowing and that this inturn reduces short-sales constraints compared to a non-centralizedlendable securities market. We initially define short-sales constraints interms of the cost of borrowing securities. To this end, we classify stocksinto specials (short-sales constrained) when the annual cost of bor-rowing is more than one percent, and general collateral (GC, short-salesunconstrained) when the annual cost of borrowing is less than 1%. Thisapproach is consistent with the literature. The cost of borrowing secu-rities in Japan is comprised of the basic interest rate (kashikabu-ryo) andthe premium charged on the lendable securities (shinakashi-ryo). Sincethe interest paid on the cash collateral kept as security against theborrowed stock is negligible under current Japanese monetary policy, itdoes not meaningfully reduce the cost of borrowing. The basic interestrate is determined each day by the JSFC and is fixed for all borrowedsecurities. We use only the premium charged on the lendable securitiesto measure the cost of borrowing securities.
We examine borrowing costs and supply constraints in a centralizedlendable securities market that is defined to be less supply-constrainedcompared to a non-centralized market, like that of the NYSE. To ex-amine the determinants of borrowing costs, we use an OLS regressionmodel with explanatory variables such as the short interest ratio (SIR),institutional ownership (IO), market capitalization (Size), the price-to-book ratio (P/B) and turnover (TO), with the actual cost of borrowing(COB) as the dependent variable. We also estimate a logit regressionmodel where the dependent variable is a dummy variable that assumesthe value one for special stocks and zero for GC stocks. We use the sameexplanatory variables as the OLS equation. The logit model is used toexamine the likelihood of the shorted stock being special. We follow themethodology of D’ Avolio (2002) and Beneish et al. (2015) to select thevariables for the OLS and logit regression models. The OLS and logitregression equations are:
= + + + + + +α α α α α αCOB SIR IO Size P/B TO ɛ, and0 1 2 3 4 5 (1)
= = = + + +
+ + +
GC Spec β β β β
β B β
Prob of Special (0 , 1 ) SIR IO Size
P/ TO ɛ.0 1 2 3
4 5 (2)
In the regression model to examine the short supply constraint, weuse the supply of lendable securities as the dependent variable and IO,the predicted value of COB, TO, Size and P/B as the independentvariables. We estimate three versions of the model to examine thesupply of lendable securities. The dependent variable remains the samein all three specifications. However, we use IO as the only explanatoryvariable in version 1; IO, COB, TO, Size and the P/B ratio as explanatoryvariables in version 2; and, the predicted value of COB along with IO,TO, Size and the P/B ratio in the third version of the model. Previousstudies suggested that IO is the most important predictor of the supplyof lendable securities (D’ Avolio, 2002 and Beneish et al., 2015). Thesestudies also found that security features such the COB of securities,turnover, size and the P/B ratio are also related to the supply of lend-able securities. Using the predicted value of the COB of securitiesshould reduce the potential endogeneity bias in the coefficients. Thegeneral form of the regression model used to explain the supply oflendable securities is:
= + + + +
+ +
γ γ γ γ γ
γ
Supply of Lendable Securities IO COB TO Size
P/B ɛ.0 1 2 3 4
5 (3)
To test our hypothesis that short-sales constraints are less in acentralized lendable securities market, we compare the cost of bor-rowing stocks listed on both the TSE and the New York Stock Exchange(NYSE). We used 15 Japanese stocks that are dual-listed on the NYSEfor this comparison. We use the premium charged on lendable securitiesas a measure of the cost of borrowing.
To test our hypothesis that recall risk is less in a centralized lendablesecurities market, we examine recall events and measure their impacton securities borrowing. In a non-centralized market, recall risk ariseswhen the aggregate short position cannot be covered by the balance oflendable securities (D’ Avolio, 2002). As a practical approach, we usethe presence of a ‘mismatch situation’ as a way to measure recall risk. Amismatch situation is defined to occur when the aggregate short posi-tion exceeds the inventory of lendable securities. In a non-centralizedmarket, lent securities are usually recalled in such a situation. Shortsellers must either cover their short position by actually buying thestock or renegotiate with the securities lender at a higher cost. We alsoexamine the cost of borrowing securities, the behavior of new stockborrowing and the return of borrowed securities following mismatchsituations. We measure short positions as the balance of borrowed se-curities and the inventory of lendable securities. At the beginning ofeach trading day, we organize stocks into mismatch and non-mismatchsituation categories and then on the basis of the difference between thebalance of borrowed securities and the supply of lendable securities. Wethen match this measure with the security's trading volume (TV),number of outstanding shares (NOS), Size, the P/B ratio, yield, the priceearnings ratio (P/E), the price to sales ratio (P/S), the price to cash flowratio (P/CF) and institutional ownership (IO). We also observe the be-havior of the trend of borrowing costs, new borrowings of securities andthe return of already borrowed securities following mismatch and non-mismatch events over the next 15 trading days.
Finally, we examine the future return behavior of specials and highSIR-securities to test our hypothesis that these stocks are priced effi-ciently (not systematically overvalued) in the centralized lendable se-curities market. The idea is that a lendable securities market reducesthe costs of borrowing securities and lowers recall risk to make theshort side of the market less constrained. We measure both stock-basedand flow-based SIR. The stock-based SIR is measured by the balance ofthe short position at the end of the day scaled by the number of out-standing shares while the flow-based SIR is measured as the daily short
1 While we argue that there were no unusual events that impacted the lendable secu-rities market, it is quite true that Japan's central bank was (and still is) pursuing a veryunusual monetary policy that influenced the stock market during the sample period. TheBank of Japan's (Bank of Japan, 2016) quantitative and qualitative easing monetarypolicy resulted in massive purchases of Japanese Government Bonds and exchange tradedfunds. The central bank's aggressive purchases of government bonds even exceeded theamount issued by the government. The central bank purchased bonds on the secondarymarket at prices in excess of par to create a negative interest rate policy. The Bank ofJapan also imposed a negative interest rate on excess reserves held by commercial banks.These policies had a pernicious effect on most financial institutions as well as caused thesecondary market for government bonds to shrink. While the negative interest rate policyis unprecedented and extremely significant in an historical sense, we argue that it did notcause an unusual disruption in Japan's lendable securities markets. The lendable secu-rities market continued to operate with essentially a zero interest rate; the kashikabu-ryowas zero. It did not become negative after the Bank of Japan implemented its negativeinterest rate policy in early 2016. Further, there were no changes in short-sales relatedregulations such as the uptick rule, rules on uncovered short sales and restrictions on theuse of IPO stock during the sample period.
M.S.R. Khan et al. Journal of The Japanese and International Economies 48 (2018) 85–96
88
position scaled by the number of outstanding shares. At the beginningof each trading day, we organize stocks into categories according to theshort-sales constraint variables such as specialness of the stock andstocks in the top decile of the SIR. We then observe their returns overthe next 15 days. We compare future returns of short-sale constrainedand unconstrained stocks by calculating the t values of these differ-ences. We also examine this relationship by using regressions. The re-gression equation used to explain the relationship between short-salesconstraints and future stock returns is:
= + − ++ + α β Short Sales Constraint VariablesReturn ɛ,t to t i1 15 (4)
where the Short-Sales Constraint Variables element in the regressionequation represents the specialness of the stock, the short interest ratioand institutional ownership. Returnt+1 to t+15 is the observed returns onstocks over the 15 days after organizing the stocks into categories.
5. Empirical results
5.1. Empirical evidence on the market for borrowing and the cost ofborrowing securities
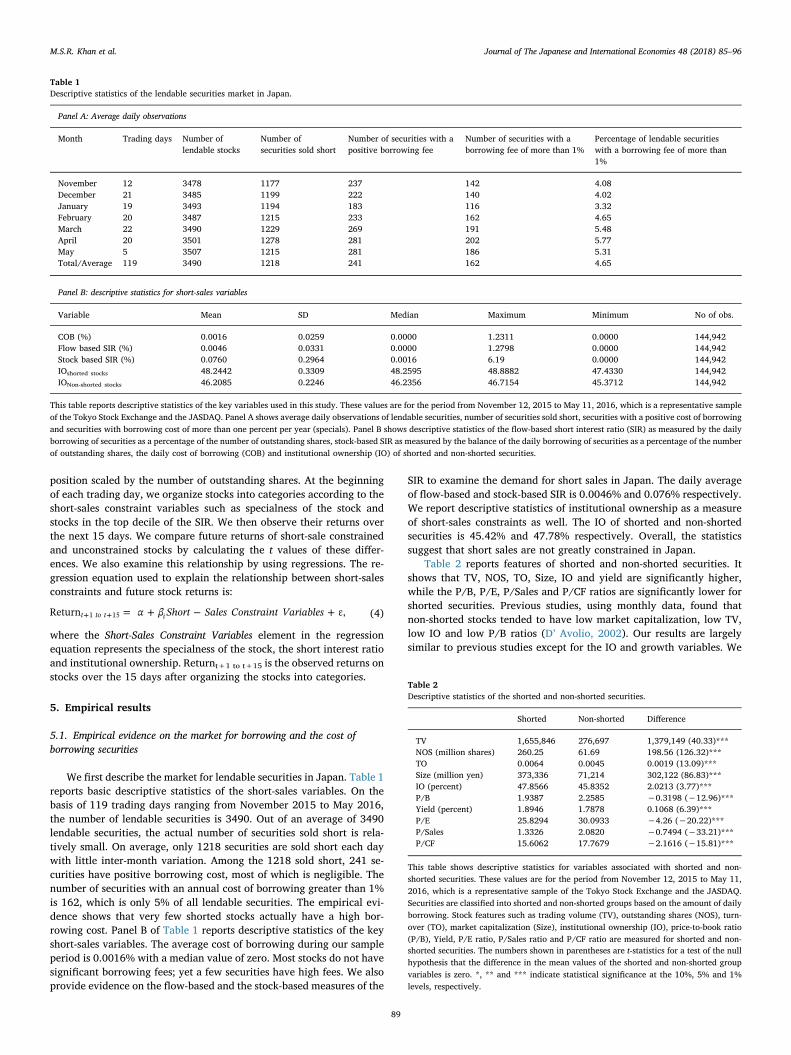
We first describe the market for lendable securities in Japan. Table 1reports basic descriptive statistics of the short-sales variables. On thebasis of 119 trading days ranging from November 2015 to May 2016,the number of lendable securities is 3490. Out of an average of 3490lendable securities, the actual number of securities sold short is rela-tively small. On average, only 1218 securities are sold short each daywith little inter-month variation. Among the 1218 sold short, 241 se-curities have positive borrowing cost, most of which is negligible. Thenumber of securities with an annual cost of borrowing greater than 1%is 162, which is only 5% of all lendable securities. The empirical evi-dence shows that very few shorted stocks actually have a high bor-rowing cost. Panel B of Table 1 reports descriptive statistics of the keyshort-sales variables. The average cost of borrowing during our sampleperiod is 0.0016% with a median value of zero. Most stocks do not havesignificant borrowing fees; yet a few securities have high fees. We alsoprovide evidence on the flow-based and the stock-based measures of the
SIR to examine the demand for short sales in Japan. The daily averageof flow-based and stock-based SIR is 0.0046% and 0.076% respectively.We report descriptive statistics of institutional ownership as a measureof short-sales constraints as well. The IO of shorted and non-shortedsecurities is 45.42% and 47.78% respectively. Overall, the statisticssuggest that short sales are not greatly constrained in Japan.
Table 2 reports features of shorted and non-shorted securities. Itshows that TV, NOS, TO, Size, IO and yield are significantly higher,while the P/B, P/E, P/Sales and P/CF ratios are significantly lower forshorted securities. Previous studies, using monthly data, found thatnon-shorted stocks tended to have low market capitalization, low TV,low IO and low P/B ratios (D’ Avolio, 2002). Our results are largelysimilar to previous studies except for the IO and growth variables. We
Table 1Descriptive statistics of the lendable securities market in Japan.
Panel A: Average daily observations
Month Trading days Number oflendable stocks
Number ofsecurities sold short
Number of securities with apositive borrowing fee
Number of securities with aborrowing fee of more than 1%
Percentage of lendable securitieswith a borrowing fee of more than1%
November 12 3478 1177 237 142 4.08December 21 3485 1199 222 140 4.02January 19 3493 1194 183 116 3.32February 20 3487 1215 233 162 4.65March 22 3490 1229 269 191 5.48April 20 3501 1278 281 202 5.77May 5 3507 1215 281 186 5.31Total/Average 119 3490 1218 241 162 4.65
Panel B: descriptive statistics for short-sales variables
Variable Mean SD Median Maximum Minimum No of obs.
COB (%) 0.0016 0.0259 0.0000 1.2311 0.0000 144,942Flow based SIR (%) 0.0046 0.0331 0.0000 1.2798 0.0000 144,942Stock based SIR (%) 0.0760 0.2964 0.0016 6.19 0.0000 144,942IOshorted stocks 48.2442 0.3309 48.2595 48.8882 47.4330 144,942IONon-shorted stocks 46.2085 0.2246 46.2356 46.7154 45.3712 144,942
This table reports descriptive statistics of the key variables used in this study. These values are for the period from November 12, 2015 to May 11, 2016, which is a representative sampleof the Tokyo Stock Exchange and the JASDAQ. Panel A shows average daily observations of lendable securities, number of securities sold short, securities with a positive cost of borrowingand securities with borrowing cost of more than one percent per year (specials). Panel B shows descriptive statistics of the flow-based short interest ratio (SIR) as measured by the dailyborrowing of securities as a percentage of the number of outstanding shares, stock-based SIR as measured by the balance of the daily borrowing of securities as a percentage of the numberof outstanding shares, the daily cost of borrowing (COB) and institutional ownership (IO) of shorted and non-shorted securities.
Table 2Descriptive statistics of the shorted and non-shorted securities.
Shorted Non-shorted Difference
TV 1,655,846 276,697 1,379,149 (40.33)***NOS (million shares) 260.25 61.69 198.56 (126.32)***TO 0.0064 0.0045 0.0019 (13.09)***Size (million yen) 373,336 71,214 302,122 (86.83)***IO (percent) 47.8566 45.8352 2.0213 (3.77)***P/B 1.9387 2.2585 −0.3198 (−12.96)***Yield (percent) 1.8946 1.7878 0.1068 (6.39)***P/E 25.8294 30.0933 −4.26 (−20.22)***P/Sales 1.3326 2.0820 −0.7494 (−33.21)***P/CF 15.6062 17.7679 −2.1616 (−15.81)***
This table shows descriptive statistics for variables associated with shorted and non-shorted securities. These values are for the period from November 12, 2015 to May 11,2016, which is a representative sample of the Tokyo Stock Exchange and the JASDAQ.Securities are classified into shorted and non-shorted groups based on the amount of dailyborrowing. Stock features such as trading volume (TV), outstanding shares (NOS), turn-over (TO), market capitalization (Size), institutional ownership (IO), price-to-book ratio(P/B), Yield, P/E ratio, P/Sales ratio and P/CF ratio are measured for shorted and non-shorted securities. The numbers shown in parentheses are t-statistics for a test of the nullhypothesis that the difference in the mean values of the shorted and non-shorted groupvariables is zero. *, ** and *** indicate statistical significance at the 10%, 5% and 1%levels, respectively.
M.S.R. Khan et al. Journal of The Japanese and International Economies 48 (2018) 85–96
89
find that growth variables such as the P/B, P/E, P/Sales and P/CF ratiosare significantly higher for non-shorted securities. Our results alsosuggest that conventional supply-side constraint measures, such aslower IO and NOS, do not stop short sellers from borrowing securities.We argue that centralized lendable securities markets make supply sideconstraints less important.
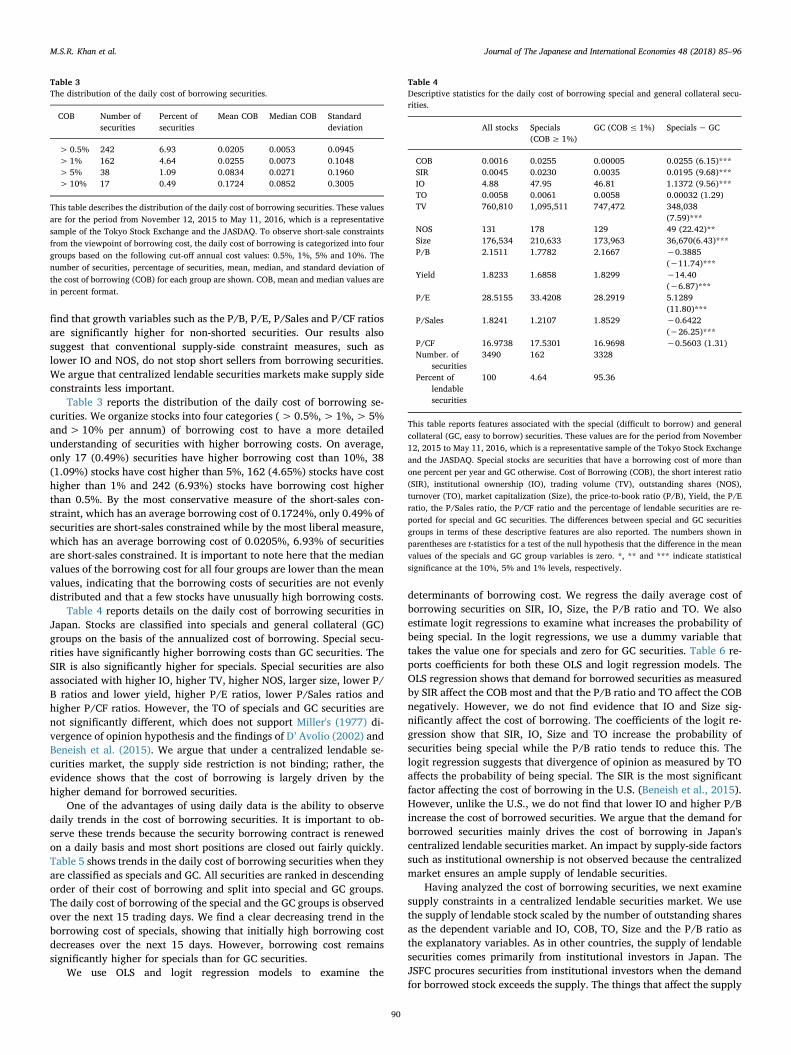
Table 3 reports the distribution of the daily cost of borrowing se-curities. We organize stocks into four categories (> 0.5%,>1%,> 5%and>10% per annum) of borrowing cost to have a more detailedunderstanding of securities with higher borrowing costs. On average,only 17 (0.49%) securities have higher borrowing cost than 10%, 38(1.09%) stocks have cost higher than 5%, 162 (4.65%) stocks have costhigher than 1% and 242 (6.93%) stocks have borrowing cost higherthan 0.5%. By the most conservative measure of the short-sales con-straint, which has an average borrowing cost of 0.1724%, only 0.49% ofsecurities are short-sales constrained while by the most liberal measure,which has an average borrowing cost of 0.0205%, 6.93% of securitiesare short-sales constrained. It is important to note here that the medianvalues of the borrowing cost for all four groups are lower than the meanvalues, indicating that the borrowing costs of securities are not evenlydistributed and that a few stocks have unusually high borrowing costs.
Table 4 reports details on the daily cost of borrowing securities inJapan. Stocks are classified into specials and general collateral (GC)groups on the basis of the annualized cost of borrowing. Special secu-rities have significantly higher borrowing costs than GC securities. TheSIR is also significantly higher for specials. Special securities are alsoassociated with higher IO, higher TV, higher NOS, larger size, lower P/B ratios and lower yield, higher P/E ratios, lower P/Sales ratios andhigher P/CF ratios. However, the TO of specials and GC securities arenot significantly different, which does not support Miller's (1977) di-vergence of opinion hypothesis and the findings of D’ Avolio (2002) andBeneish et al. (2015). We argue that under a centralized lendable se-curities market, the supply side restriction is not binding; rather, theevidence shows that the cost of borrowing is largely driven by thehigher demand for borrowed securities.
One of the advantages of using daily data is the ability to observedaily trends in the cost of borrowing securities. It is important to ob-serve these trends because the security borrowing contract is renewedon a daily basis and most short positions are closed out fairly quickly.Table 5 shows trends in the daily cost of borrowing securities when theyare classified as specials and GC. All securities are ranked in descendingorder of their cost of borrowing and split into special and GC groups.The daily cost of borrowing of the special and the GC groups is observedover the next 15 trading days. We find a clear decreasing trend in theborrowing cost of specials, showing that initially high borrowing costdecreases over the next 15 days. However, borrowing cost remainssignificantly higher for specials than for GC securities.
We use OLS and logit regression models to examine the
determinants of borrowing cost. We regress the daily average cost ofborrowing securities on SIR, IO, Size, the P/B ratio and TO. We alsoestimate logit regressions to examine what increases the probability ofbeing special. In the logit regressions, we use a dummy variable thattakes the value one for specials and zero for GC securities. Table 6 re-ports coefficients for both these OLS and logit regression models. TheOLS regression shows that demand for borrowed securities as measuredby SIR affect the COB most and that the P/B ratio and TO affect the COBnegatively. However, we do not find evidence that IO and Size sig-nificantly affect the cost of borrowing. The coefficients of the logit re-gression show that SIR, IO, Size and TO increase the probability ofsecurities being special while the P/B ratio tends to reduce this. Thelogit regression suggests that divergence of opinion as measured by TOaffects the probability of being special. The SIR is the most significantfactor affecting the cost of borrowing in the U.S. (Beneish et al., 2015).However, unlike the U.S., we do not find that lower IO and higher P/Bincrease the cost of borrowed securities. We argue that the demand forborrowed securities mainly drives the cost of borrowing in Japan'scentralized lendable securities market. An impact by supply-side factorssuch as institutional ownership is not observed because the centralizedmarket ensures an ample supply of lendable securities.
Having analyzed the cost of borrowing securities, we next examinesupply constraints in a centralized lendable securities market. We usethe supply of lendable stock scaled by the number of outstanding sharesas the dependent variable and IO, COB, TO, Size and the P/B ratio asthe explanatory variables. As in other countries, the supply of lendablesecurities comes primarily from institutional investors in Japan. TheJSFC procures securities from institutional investors when the demandfor borrowed stock exceeds the supply. The things that affect the supply
Table 3The distribution of the daily cost of borrowing securities.
COB Number ofsecurities
Percent ofsecurities
Mean COB Median COB Standarddeviation
> 0.5% 242 6.93 0.0205 0.0053 0.0945>1% 162 4.64 0.0255 0.0073 0.1048>5% 38 1.09 0.0834 0.0271 0.1960>10% 17 0.49 0.1724 0.0852 0.3005
This table describes the distribution of the daily cost of borrowing securities. These valuesare for the period from November 12, 2015 to May 11, 2016, which is a representativesample of the Tokyo Stock Exchange and the JASDAQ. To observe short-sale constraintsfrom the viewpoint of borrowing cost, the daily cost of borrowing is categorized into fourgroups based on the following cut-off annual cost values: 0.5%, 1%, 5% and 10%. Thenumber of securities, percentage of securities, mean, median, and standard deviation ofthe cost of borrowing (COB) for each group are shown. COB, mean and median values arein percent format.
Table 4Descriptive statistics for the daily cost of borrowing special and general collateral secu-rities.
All stocks Specials(COB≥ 1%)
GC (COB≤ 1%) Specials−GC
COB 0.0016 0.0255 0.00005 0.0255 (6.15)***SIR 0.0045 0.0230 0.0035 0.0195 (9.68)***IO 4.88 47.95 46.81 1.1372 (9.56)***TO 0.0058 0.0061 0.0058 0.00032 (1.29)TV 760,810 1,095,511 747,472 348,038
(7.59)***NOS 131 178 129 49 (22.42)**Size 176,534 210,633 173,963 36,670(6.43)***P/B 2.1511 1.7782 2.1667 −0.3885
(−11.74)***Yield 1.8233 1.6858 1.8299 −14.40
(−6.87)***P/E 28.5155 33.4208 28.2919 5.1289
(11.80)***P/Sales 1.8241 1.2107 1.8529 −0.6422
(−26.25)***P/CF 16.9738 17.5301 16.9698 −0.5603 (1.31)Number. of
securities3490 162 3328
Percent oflendablesecurities
100 4.64 95.36
This table reports features associated with the special (difficult to borrow) and generalcollateral (GC, easy to borrow) securities. These values are for the period from November12, 2015 to May 11, 2016, which is a representative sample of the Tokyo Stock Exchangeand the JASDAQ. Special stocks are securities that have a borrowing cost of more thanone percent per year and GC otherwise. Cost of Borrowing (COB), the short interest ratio(SIR), institutional ownership (IO), trading volume (TV), outstanding shares (NOS),turnover (TO), market capitalization (Size), the price-to-book ratio (P/B), Yield, the P/Eratio, the P/Sales ratio, the P/CF ratio and the percentage of lendable securities are re-ported for special and GC securities. The differences between special and GC securitiesgroups in terms of these descriptive features are also reported. The numbers shown inparentheses are t-statistics for a test of the null hypothesis that the difference in the meanvalues of the specials and GC group variables is zero. *, ** and *** indicate statisticalsignificance at the 10%, 5% and 1% levels, respectively.
M.S.R. Khan et al. Journal of The Japanese and International Economies 48 (2018) 85–96
90
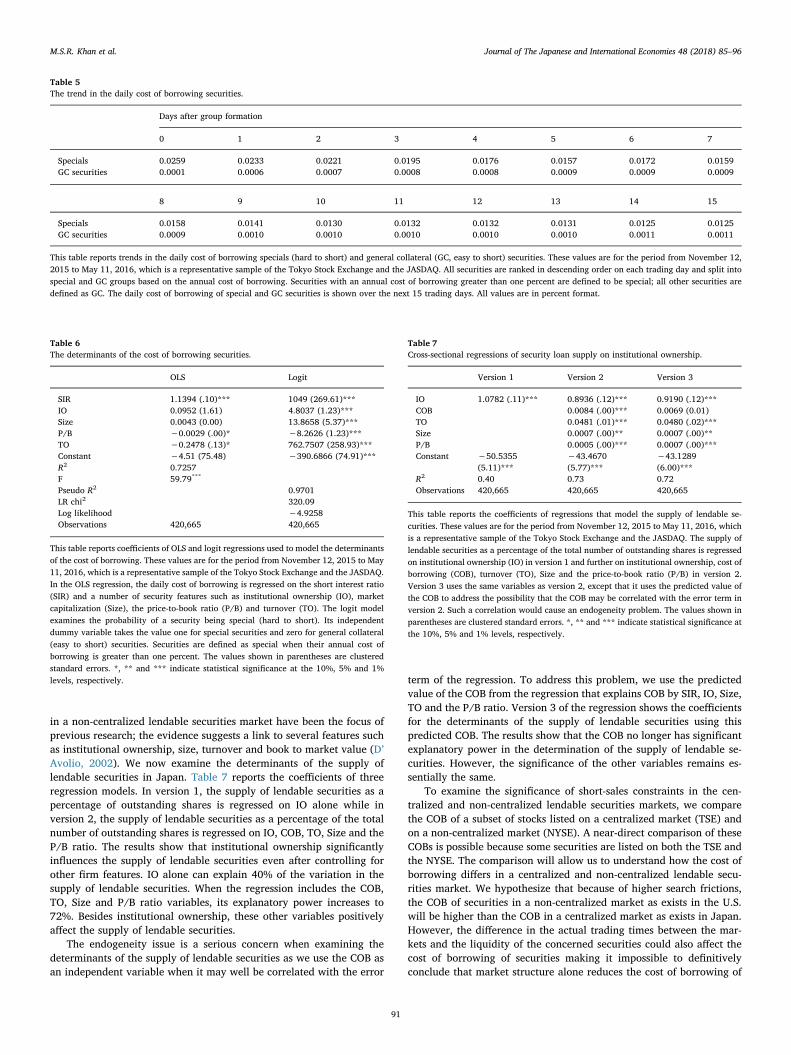
in a non-centralized lendable securities market have been the focus ofprevious research; the evidence suggests a link to several features suchas institutional ownership, size, turnover and book to market value (D’Avolio, 2002). We now examine the determinants of the supply oflendable securities in Japan. Table 7 reports the coefficients of threeregression models. In version 1, the supply of lendable securities as apercentage of outstanding shares is regressed on IO alone while inversion 2, the supply of lendable securities as a percentage of the totalnumber of outstanding shares is regressed on IO, COB, TO, Size and theP/B ratio. The results show that institutional ownership significantlyinfluences the supply of lendable securities even after controlling forother firm features. IO alone can explain 40% of the variation in thesupply of lendable securities. When the regression includes the COB,TO, Size and P/B ratio variables, its explanatory power increases to72%. Besides institutional ownership, these other variables positivelyaffect the supply of lendable securities.
The endogeneity issue is a serious concern when examining thedeterminants of the supply of lendable securities as we use the COB asan independent variable when it may well be correlated with the error
term of the regression. To address this problem, we use the predictedvalue of the COB from the regression that explains COB by SIR, IO, Size,TO and the P/B ratio. Version 3 of the regression shows the coefficientsfor the determinants of the supply of lendable securities using thispredicted COB. The results show that the COB no longer has significantexplanatory power in the determination of the supply of lendable se-curities. However, the significance of the other variables remains es-sentially the same.
To examine the significance of short-sales constraints in the cen-tralized and non-centralized lendable securities markets, we comparethe COB of a subset of stocks listed on a centralized market (TSE) andon a non-centralized market (NYSE). A near-direct comparison of theseCOBs is possible because some securities are listed on both the TSE andthe NYSE. The comparison will allow us to understand how the cost ofborrowing differs in a centralized and non-centralized lendable secu-rities market. We hypothesize that because of higher search frictions,the COB of securities in a non-centralized market as exists in the U.S.will be higher than the COB in a centralized market as exists in Japan.However, the difference in the actual trading times between the mar-kets and the liquidity of the concerned securities could also affect thecost of borrowing of securities making it impossible to definitivelyconclude that market structure alone reduces the cost of borrowing of
Table 5The trend in the daily cost of borrowing securities.
Days after group formation
0 1 2 3 4 5 6 7
Specials 0.0259 0.0233 0.0221 0.0195 0.0176 0.0157 0.0172 0.0159GC securities 0.0001 0.0006 0.0007 0.0008 0.0008 0.0009 0.0009 0.0009
8 9 10 11 12 13 14 15
Specials 0.0158 0.0141 0.0130 0.0132 0.0132 0.0131 0.0125 0.0125GC securities 0.0009 0.0010 0.0010 0.0010 0.0010 0.0010 0.0011 0.0011
This table reports trends in the daily cost of borrowing specials (hard to short) and general collateral (GC, easy to short) securities. These values are for the period from November 12,2015 to May 11, 2016, which is a representative sample of the Tokyo Stock Exchange and the JASDAQ. All securities are ranked in descending order on each trading day and split intospecial and GC groups based on the annual cost of borrowing. Securities with an annual cost of borrowing greater than one percent are defined to be special; all other securities aredefined as GC. The daily cost of borrowing of special and GC securities is shown over the next 15 trading days. All values are in percent format.
Table 6The determinants of the cost of borrowing securities.
OLS Logit
SIR 1.1394 (.10)*** 1049 (269.61)***IO 0.0952 (1.61) 4.8037 (1.23)***Size 0.0043 (0.00) 13.8658 (5.37)***P/B −0.0029 (.00)* −8.2626 (1.23)***TO −0.2478 (.13)* 762.7507 (258.93)***Constant −4.51 (75.48) −390.6866 (74.91)***R2 0.7257F 59.79***
Pseudo R2 0.9701LR chi2 320.09Log likelihood −4.9258Observations 420,665 420,665
This table reports coefficients of OLS and logit regressions used to model the determinantsof the cost of borrowing. These values are for the period from November 12, 2015 to May11, 2016, which is a representative sample of the Tokyo Stock Exchange and the JASDAQ.In the OLS regression, the daily cost of borrowing is regressed on the short interest ratio(SIR) and a number of security features such as institutional ownership (IO), marketcapitalization (Size), the price-to-book ratio (P/B) and turnover (TO). The logit modelexamines the probability of a security being special (hard to short). Its independentdummy variable takes the value one for special securities and zero for general collateral(easy to short) securities. Securities are defined as special when their annual cost ofborrowing is greater than one percent. The values shown in parentheses are clusteredstandard errors. *, ** and *** indicate statistical significance at the 10%, 5% and 1%levels, respectively.
Table 7Cross-sectional regressions of security loan supply on institutional ownership.
Version 1 Version 2 Version 3
IO 1.0782 (.11)*** 0.8936 (.12)*** 0.9190 (.12)***COB 0.0084 (.00)*** 0.0069 (0.01)TO 0.0481 (.01)*** 0.0480 (.02)***Size 0.0007 (.00)** 0.0007 (.00)**P/B 0.0005 (.00)*** 0.0007 (.00)***Constant −50.5355
(5.11)***−43.4670(5.77)***
−43.1289(6.00)***
R2 0.40 0.73 0.72Observations 420,665 420,665 420,665
This table reports the coefficients of regressions that model the supply of lendable se-curities. These values are for the period from November 12, 2015 to May 11, 2016, whichis a representative sample of the Tokyo Stock Exchange and the JASDAQ. The supply oflendable securities as a percentage of the total number of outstanding shares is regressedon institutional ownership (IO) in version 1 and further on institutional ownership, cost ofborrowing (COB), turnover (TO), Size and the price-to-book ratio (P/B) in version 2.Version 3 uses the same variables as version 2, except that it uses the predicted value ofthe COB to address the possibility that the COB may be correlated with the error term inversion 2. Such a correlation would cause an endogeneity problem. The values shown inparentheses are clustered standard errors. *, ** and *** indicate statistical significance atthe 10%, 5% and 1% levels, respectively.
M.S.R. Khan et al. Journal of The Japanese and International Economies 48 (2018) 85–96
91
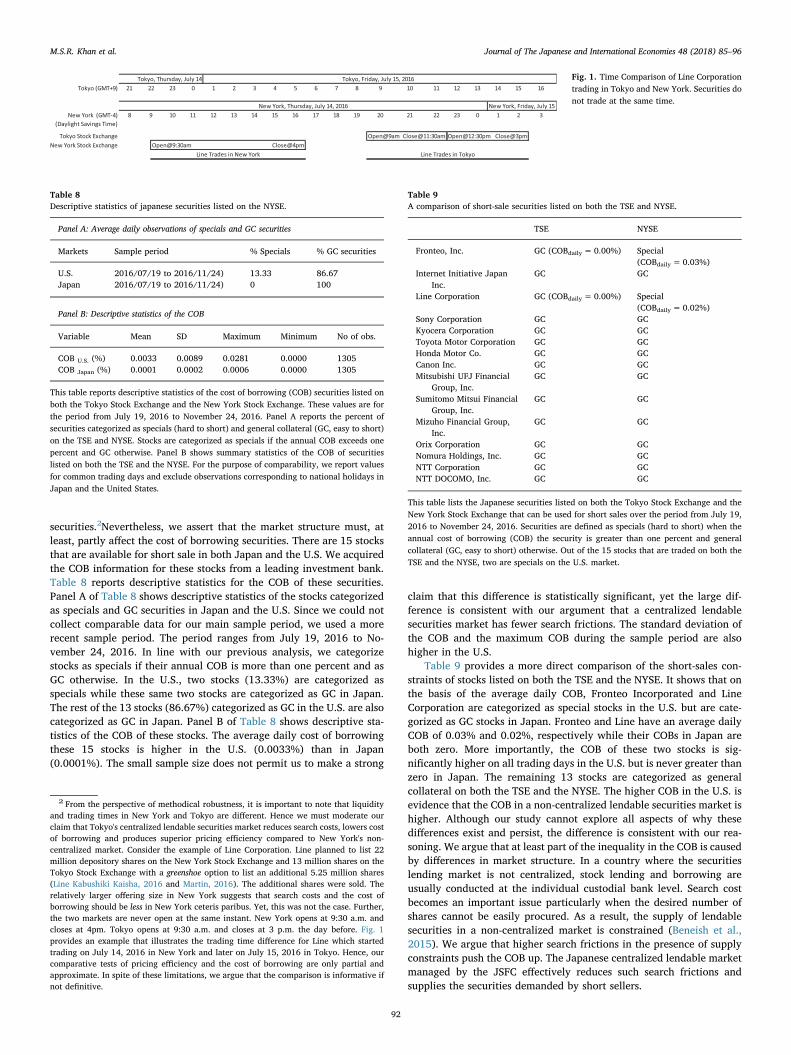
securities.2Nevertheless, we assert that the market structure must, atleast, partly affect the cost of borrowing securities. There are 15 stocksthat are available for short sale in both Japan and the U.S. We acquiredthe COB information for these stocks from a leading investment bank.Table 8 reports descriptive statistics for the COB of these securities.Panel A of Table 8 shows descriptive statistics of the stocks categorizedas specials and GC securities in Japan and the U.S. Since we could notcollect comparable data for our main sample period, we used a morerecent sample period. The period ranges from July 19, 2016 to No-vember 24, 2016. In line with our previous analysis, we categorizestocks as specials if their annual COB is more than one percent and asGC otherwise. In the U.S., two stocks (13.33%) are categorized asspecials while these same two stocks are categorized as GC in Japan.The rest of the 13 stocks (86.67%) categorized as GC in the U.S. are alsocategorized as GC in Japan. Panel B of Table 8 shows descriptive sta-tistics of the COB of these stocks. The average daily cost of borrowingthese 15 stocks is higher in the U.S. (0.0033%) than in Japan(0.0001%). The small sample size does not permit us to make a strong
claim that this difference is statistically significant, yet the large dif-ference is consistent with our argument that a centralized lendablesecurities market has fewer search frictions. The standard deviation ofthe COB and the maximum COB during the sample period are alsohigher in the U.S.
Table 9 provides a more direct comparison of the short-sales con-straints of stocks listed on both the TSE and the NYSE. It shows that onthe basis of the average daily COB, Fronteo Incorporated and LineCorporation are categorized as special stocks in the U.S. but are cate-gorized as GC stocks in Japan. Fronteo and Line have an average dailyCOB of 0.03% and 0.02%, respectively while their COBs in Japan areboth zero. More importantly, the COB of these two stocks is sig-nificantly higher on all trading days in the U.S. but is never greater thanzero in Japan. The remaining 13 stocks are categorized as generalcollateral on both the TSE and the NYSE. The higher COB in the U.S. isevidence that the COB in a non-centralized lendable securities market ishigher. Although our study cannot explore all aspects of why thesedifferences exist and persist, the difference is consistent with our rea-soning. We argue that at least part of the inequality in the COB is causedby differences in market structure. In a country where the securitieslending market is not centralized, stock lending and borrowing areusually conducted at the individual custodial bank level. Search costbecomes an important issue particularly when the desired number ofshares cannot be easily procured. As a result, the supply of lendablesecurities in a non-centralized market is constrained (Beneish et al.,2015). We argue that higher search frictions in the presence of supplyconstraints push the COB up. The Japanese centralized lendable marketmanaged by the JSFC effectively reduces such search frictions andsupplies the securities demanded by short sellers.
Tokyo (GMT+9) 21 23 0 1 2 3 4 5 6 7 8 9 10 11 12 13 14 15 16
New York (GMT-4) 8 10 11 12 13 14 15 16 17 18 19 20 21 22 23 0 1 2 3(Daylight Savings Time)
Tokyo Stock Exchange Open@9am Close@11:30am Open@12:30pm Close@3pmNew York Stock Exchange Open@9:30am Close@4pm
Tokyo, Friday, July 15, 201622
9
Line Trades in New York
New York, Thursday, July 14, 2016 New York, Friday, July 15
Line Trades in Tokyo
Tokyo, Thursday, July 14 Fig. 1. Time Comparison of Line Corporationtrading in Tokyo and New York. Securities donot trade at the same time.
Table 8Descriptive statistics of japanese securities listed on the NYSE.
Panel A: Average daily observations of specials and GC securities
Markets Sample period % Specials % GC securities
U.S. 2016/07/19 to 2016/11/24) 13.33 86.67Japan 2016/07/19 to 2016/11/24) 0 100
Panel B: Descriptive statistics of the COB
Variable Mean SD Maximum Minimum No of obs.
COB U.S. (%) 0.0033 0.0089 0.0281 0.0000 1305COB Japan (%) 0.0001 0.0002 0.0006 0.0000 1305
This table reports descriptive statistics of the cost of borrowing (COB) securities listed onboth the Tokyo Stock Exchange and the New York Stock Exchange. These values are forthe period from July 19, 2016 to November 24, 2016. Panel A reports the percent ofsecurities categorized as specials (hard to short) and general collateral (GC, easy to short)on the TSE and NYSE. Stocks are categorized as specials if the annual COB exceeds onepercent and GC otherwise. Panel B shows summary statistics of the COB of securitieslisted on both the TSE and the NYSE. For the purpose of comparability, we report valuesfor common trading days and exclude observations corresponding to national holidays inJapan and the United States.
Table 9A comparison of short-sale securities listed on both the TSE and NYSE.
TSE NYSE
Fronteo, Inc. GC (COBdaily = 0.00%) Special(COBdaily= 0.03%)
Internet Initiative JapanInc.
GC GC
Line Corporation GC (COBdaily = 0.00%) Special(COBdaily= 0.02%)
Sony Corporation GC GCKyocera Corporation GC GCToyota Motor Corporation GC GCHonda Motor Co. GC GCCanon Inc. GC GCMitsubishi UFJ Financial
Group, Inc.GC GC
Sumitomo Mitsui FinancialGroup, Inc.
GC GC
Mizuho Financial Group,Inc.
GC GC
Orix Corporation GC GCNomura Holdings, Inc. GC GCNTT Corporation GC GCNTT DOCOMO, Inc. GC GC
This table lists the Japanese securities listed on both the Tokyo Stock Exchange and theNew York Stock Exchange that can be used for short sales over the period from July 19,2016 to November 24, 2016. Securities are defined as specials (hard to short) when theannual cost of borrowing (COB) the security is greater than one percent and generalcollateral (GC, easy to short) otherwise. Out of the 15 stocks that are traded on both theTSE and the NYSE, two are specials on the U.S. market.
2 From the perspective of methodical robustness, it is important to note that liquidityand trading times in New York and Tokyo are different. Hence we must moderate ourclaim that Tokyo's centralized lendable securities market reduces search costs, lowers costof borrowing and produces superior pricing efficiency compared to New York's non-centralized market. Consider the example of Line Corporation. Line planned to list 22million depository shares on the New York Stock Exchange and 13 million shares on theTokyo Stock Exchange with a greenshoe option to list an additional 5.25 million shares(Line Kabushiki Kaisha, 2016 and Martin, 2016). The additional shares were sold. Therelatively larger offering size in New York suggests that search costs and the cost ofborrowing should be less in New York ceteris paribus. Yet, this was not the case. Further,the two markets are never open at the same instant. New York opens at 9:30 a.m. andcloses at 4pm. Tokyo opens at 9:30 a.m. and closes at 3 p.m. the day before. Fig. 1provides an example that illustrates the trading time difference for Line which startedtrading on July 14, 2016 in New York and later on July 15, 2016 in Tokyo. Hence, ourcomparative tests of pricing efficiency and the cost of borrowing are only partial andapproximate. In spite of these limitations, we argue that the comparison is informative ifnot definitive.
M.S.R. Khan et al. Journal of The Japanese and International Economies 48 (2018) 85–96
92
5.2. The behavior of securities facing recall risk in a centralized market
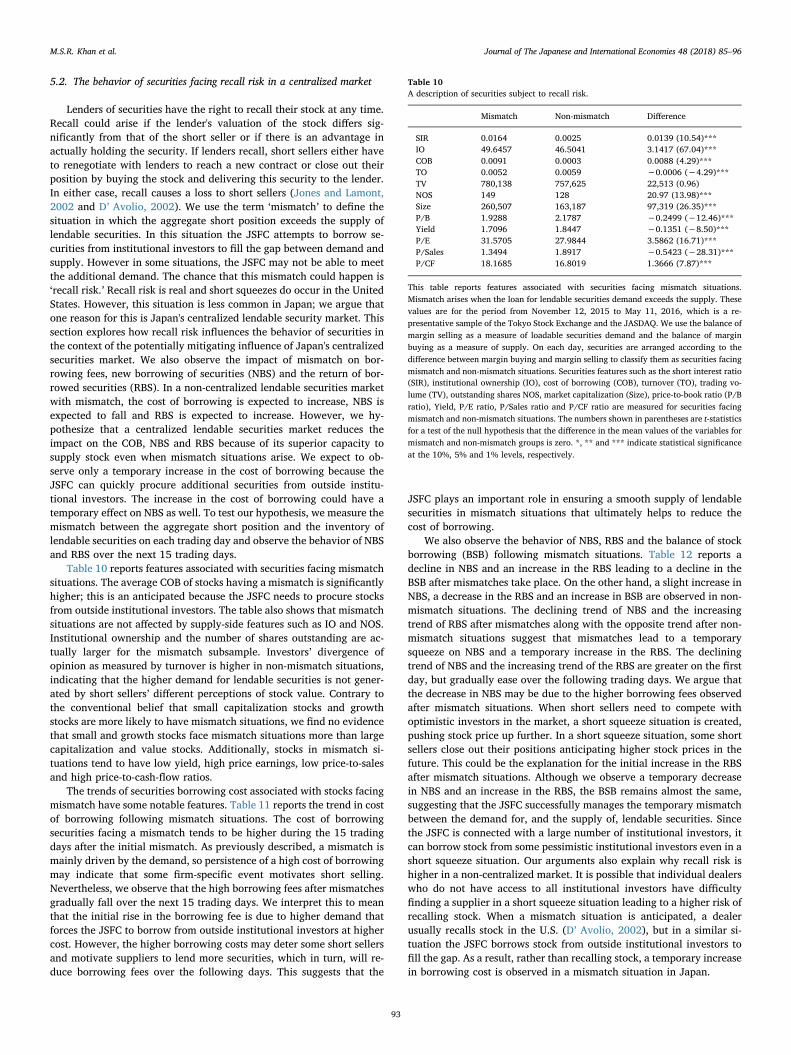
Lenders of securities have the right to recall their stock at any time.Recall could arise if the lender's valuation of the stock differs sig-nificantly from that of the short seller or if there is an advantage inactually holding the security. If lenders recall, short sellers either haveto renegotiate with lenders to reach a new contract or close out theirposition by buying the stock and delivering this security to the lender.In either case, recall causes a loss to short sellers (Jones and Lamont,2002 and D’ Avolio, 2002). We use the term ‘mismatch’ to define thesituation in which the aggregate short position exceeds the supply oflendable securities. In this situation the JSFC attempts to borrow se-curities from institutional investors to fill the gap between demand andsupply. However in some situations, the JSFC may not be able to meetthe additional demand. The chance that this mismatch could happen is‘recall risk.’ Recall risk is real and short squeezes do occur in the UnitedStates. However, this situation is less common in Japan; we argue thatone reason for this is Japan's centralized lendable security market. Thissection explores how recall risk influences the behavior of securities inthe context of the potentially mitigating influence of Japan's centralizedsecurities market. We also observe the impact of mismatch on bor-rowing fees, new borrowing of securities (NBS) and the return of bor-rowed securities (RBS). In a non-centralized lendable securities marketwith mismatch, the cost of borrowing is expected to increase, NBS isexpected to fall and RBS is expected to increase. However, we hy-pothesize that a centralized lendable securities market reduces theimpact on the COB, NBS and RBS because of its superior capacity tosupply stock even when mismatch situations arise. We expect to ob-serve only a temporary increase in the cost of borrowing because theJSFC can quickly procure additional securities from outside institu-tional investors. The increase in the cost of borrowing could have atemporary effect on NBS as well. To test our hypothesis, we measure themismatch between the aggregate short position and the inventory oflendable securities on each trading day and observe the behavior of NBSand RBS over the next 15 trading days.
Table 10 reports features associated with securities facing mismatchsituations. The average COB of stocks having a mismatch is significantlyhigher; this is an anticipated because the JSFC needs to procure stocksfrom outside institutional investors. The table also shows that mismatchsituations are not affected by supply-side features such as IO and NOS.Institutional ownership and the number of shares outstanding are ac-tually larger for the mismatch subsample. Investors’ divergence ofopinion as measured by turnover is higher in non-mismatch situations,indicating that the higher demand for lendable securities is not gener-ated by short sellers’ different perceptions of stock value. Contrary tothe conventional belief that small capitalization stocks and growthstocks are more likely to have mismatch situations, we find no evidencethat small and growth stocks face mismatch situations more than largecapitalization and value stocks. Additionally, stocks in mismatch si-tuations tend to have low yield, high price earnings, low price-to-salesand high price-to-cash-flow ratios.
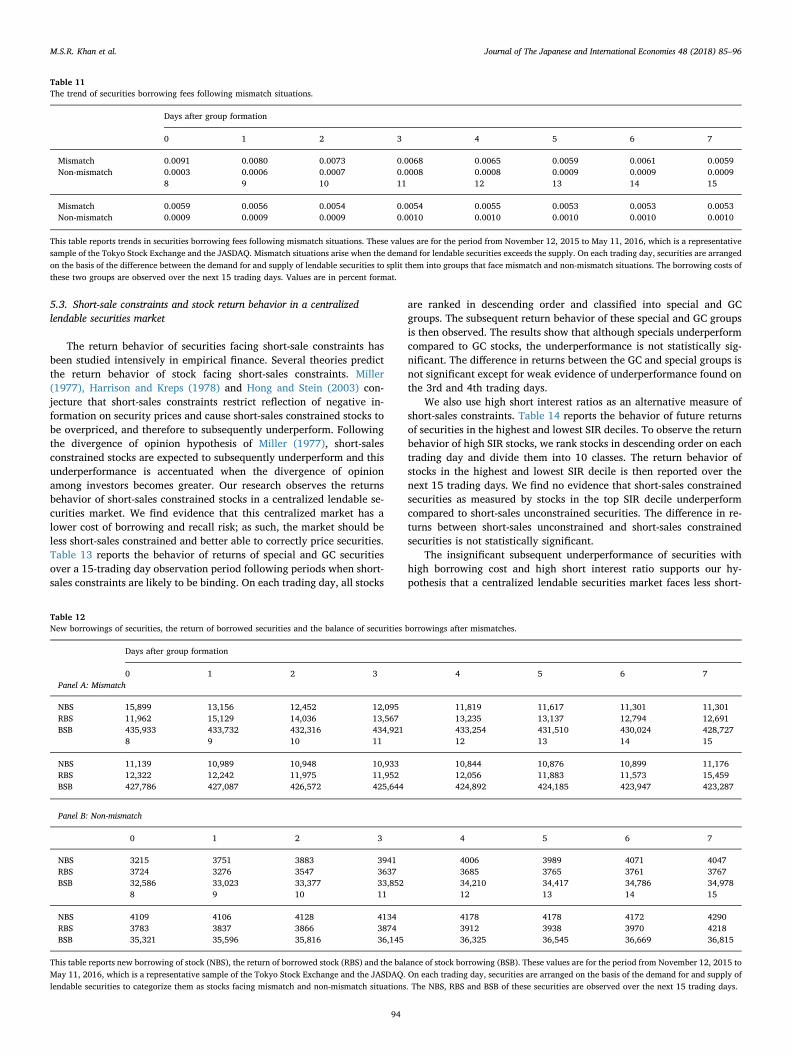
The trends of securities borrowing cost associated with stocks facingmismatch have some notable features. Table 11 reports the trend in costof borrowing following mismatch situations. The cost of borrowingsecurities facing a mismatch tends to be higher during the 15 tradingdays after the initial mismatch. As previously described, a mismatch ismainly driven by the demand, so persistence of a high cost of borrowingmay indicate that some firm-specific event motivates short selling.Nevertheless, we observe that the high borrowing fees after mismatchesgradually fall over the next 15 trading days. We interpret this to meanthat the initial rise in the borrowing fee is due to higher demand thatforces the JSFC to borrow from outside institutional investors at highercost. However, the higher borrowing costs may deter some short sellersand motivate suppliers to lend more securities, which in turn, will re-duce borrowing fees over the following days. This suggests that the
JSFC plays an important role in ensuring a smooth supply of lendablesecurities in mismatch situations that ultimately helps to reduce thecost of borrowing.
We also observe the behavior of NBS, RBS and the balance of stockborrowing (BSB) following mismatch situations. Table 12 reports adecline in NBS and an increase in the RBS leading to a decline in theBSB after mismatches take place. On the other hand, a slight increase inNBS, a decrease in the RBS and an increase in BSB are observed in non-mismatch situations. The declining trend of NBS and the increasingtrend of RBS after mismatches along with the opposite trend after non-mismatch situations suggest that mismatches lead to a temporarysqueeze on NBS and a temporary increase in the RBS. The decliningtrend of NBS and the increasing trend of the RBS are greater on the firstday, but gradually ease over the following trading days. We argue thatthe decrease in NBS may be due to the higher borrowing fees observedafter mismatch situations. When short sellers need to compete withoptimistic investors in the market, a short squeeze situation is created,pushing stock price up further. In a short squeeze situation, some shortsellers close out their positions anticipating higher stock prices in thefuture. This could be the explanation for the initial increase in the RBSafter mismatch situations. Although we observe a temporary decreasein NBS and an increase in the RBS, the BSB remains almost the same,suggesting that the JSFC successfully manages the temporary mismatchbetween the demand for, and the supply of, lendable securities. Sincethe JSFC is connected with a large number of institutional investors, itcan borrow stock from some pessimistic institutional investors even in ashort squeeze situation. Our arguments also explain why recall risk ishigher in a non-centralized market. It is possible that individual dealerswho do not have access to all institutional investors have difficultyfinding a supplier in a short squeeze situation leading to a higher risk ofrecalling stock. When a mismatch situation is anticipated, a dealerusually recalls stock in the U.S. (D’ Avolio, 2002), but in a similar si-tuation the JSFC borrows stock from outside institutional investors tofill the gap. As a result, rather than recalling stock, a temporary increasein borrowing cost is observed in a mismatch situation in Japan.
Table 10A description of securities subject to recall risk.
Mismatch Non-mismatch Difference
SIR 0.0164 0.0025 0.0139 (10.54)***IO 49.6457 46.5041 3.1417 (67.04)***COB 0.0091 0.0003 0.0088 (4.29)***TO 0.0052 0.0059 −0.0006 (−4.29)***TV 780,138 757,625 22,513 (0.96)NOS 149 128 20.97 (13.98)***Size 260,507 163,187 97,319 (26.35)***P/B 1.9288 2.1787 −0.2499 (−12.46)***Yield 1.7096 1.8447 −0.1351 (−8.50)***P/E 31.5705 27.9844 3.5862 (16.71)***P/Sales 1.3494 1.8917 −0.5423 (−28.31)***P/CF 18.1685 16.8019 1.3666 (7.87)***
This table reports features associated with securities facing mismatch situations.Mismatch arises when the loan for lendable securities demand exceeds the supply. Thesevalues are for the period from November 12, 2015 to May 11, 2016, which is a re-presentative sample of the Tokyo Stock Exchange and the JASDAQ. We use the balance ofmargin selling as a measure of loadable securities demand and the balance of marginbuying as a measure of supply. On each day, securities are arranged according to thedifference between margin buying and margin selling to classify them as securities facingmismatch and non-mismatch situations. Securities features such as the short interest ratio(SIR), institutional ownership (IO), cost of borrowing (COB), turnover (TO), trading vo-lume (TV), outstanding shares NOS, market capitalization (Size), price-to-book ratio (P/Bratio), Yield, P/E ratio, P/Sales ratio and P/CF ratio are measured for securities facingmismatch and non-mismatch situations. The numbers shown in parentheses are t-statisticsfor a test of the null hypothesis that the difference in the mean values of the variables formismatch and non-mismatch groups is zero. *, ** and *** indicate statistical significanceat the 10%, 5% and 1% levels, respectively.
M.S.R. Khan et al. Journal of The Japanese and International Economies 48 (2018) 85–96
93
5.3. Short-sale constraints and stock return behavior in a centralizedlendable securities market
The return behavior of securities facing short-sale constraints hasbeen studied intensively in empirical finance. Several theories predictthe return behavior of stock facing short-sales constraints. Miller(1977), Harrison and Kreps (1978) and Hong and Stein (2003) con-jecture that short-sales constraints restrict reflection of negative in-formation on security prices and cause short-sales constrained stocks tobe overpriced, and therefore to subsequently underperform. Followingthe divergence of opinion hypothesis of Miller (1977), short-salesconstrained stocks are expected to subsequently underperform and thisunderperformance is accentuated when the divergence of opinionamong investors becomes greater. Our research observes the returnsbehavior of short-sales constrained stocks in a centralized lendable se-curities market. We find evidence that this centralized market has alower cost of borrowing and recall risk; as such, the market should beless short-sales constrained and better able to correctly price securities.Table 13 reports the behavior of returns of special and GC securitiesover a 15-trading day observation period following periods when short-sales constraints are likely to be binding. On each trading day, all stocks
are ranked in descending order and classified into special and GCgroups. The subsequent return behavior of these special and GC groupsis then observed. The results show that although specials underperformcompared to GC stocks, the underperformance is not statistically sig-nificant. The difference in returns between the GC and special groups isnot significant except for weak evidence of underperformance found onthe 3rd and 4th trading days.
We also use high short interest ratios as an alternative measure ofshort-sales constraints. Table 14 reports the behavior of future returnsof securities in the highest and lowest SIR deciles. To observe the returnbehavior of high SIR stocks, we rank stocks in descending order on eachtrading day and divide them into 10 classes. The return behavior ofstocks in the highest and lowest SIR decile is then reported over thenext 15 trading days. We find no evidence that short-sales constrainedsecurities as measured by stocks in the top SIR decile underperformcompared to short-sales unconstrained securities. The difference in re-turns between short-sales unconstrained and short-sales constrainedsecurities is not statistically significant.
The insignificant subsequent underperformance of securities withhigh borrowing cost and high short interest ratio supports our hy-pothesis that a centralized lendable securities market faces less short-
Table 11The trend of securities borrowing fees following mismatch situations.
Days after group formation
0 1 2 3 4 5 6 7
Mismatch 0.0091 0.0080 0.0073 0.0068 0.0065 0.0059 0.0061 0.0059Non-mismatch 0.0003 0.0006 0.0007 0.0008 0.0008 0.0009 0.0009 0.0009
8 9 10 11 12 13 14 15
Mismatch 0.0059 0.0056 0.0054 0.0054 0.0055 0.0053 0.0053 0.0053Non-mismatch 0.0009 0.0009 0.0009 0.0010 0.0010 0.0010 0.0010 0.0010
This table reports trends in securities borrowing fees following mismatch situations. These values are for the period from November 12, 2015 to May 11, 2016, which is a representativesample of the Tokyo Stock Exchange and the JASDAQ. Mismatch situations arise when the demand for lendable securities exceeds the supply. On each trading day, securities are arrangedon the basis of the difference between the demand for and supply of lendable securities to split them into groups that face mismatch and non-mismatch situations. The borrowing costs ofthese two groups are observed over the next 15 trading days. Values are in percent format.
Table 12New borrowings of securities, the return of borrowed securities and the balance of securities borrowings after mismatches.
Days after group formation
0 1 2 3 4 5 6 7Panel A: Mismatch
NBS 15,899 13,156 12,452 12,095 11,819 11,617 11,301 11,301RBS 11,962 15,129 14,036 13,567 13,235 13,137 12,794 12,691BSB 435,933 433,732 432,316 434,921 433,254 431,510 430,024 428,727
8 9 10 11 12 13 14 15
NBS 11,139 10,989 10,948 10,933 10,844 10,876 10,899 11,176RBS 12,322 12,242 11,975 11,952 12,056 11,883 11,573 15,459BSB 427,786 427,087 426,572 425,644 424,892 424,185 423,947 423,287
Panel B: Non-mismatch
0 1 2 3 4 5 6 7
NBS 3215 3751 3883 3941 4006 3989 4071 4047RBS 3724 3276 3547 3637 3685 3765 3761 3767BSB 32,586 33,023 33,377 33,852 34,210 34,417 34,786 34,978
8 9 10 11 12 13 14 15
NBS 4109 4106 4128 4134 4178 4178 4172 4290RBS 3783 3837 3866 3874 3912 3938 3970 4218BSB 35,321 35,596 35,816 36,145 36,325 36,545 36,669 36,815
This table reports new borrowing of stock (NBS), the return of borrowed stock (RBS) and the balance of stock borrowing (BSB). These values are for the period from November 12, 2015 toMay 11, 2016, which is a representative sample of the Tokyo Stock Exchange and the JASDAQ. On each trading day, securities are arranged on the basis of the demand for and supply oflendable securities to categorize them as stocks facing mismatch and non-mismatch situations. The NBS, RBS and BSB of these securities are observed over the next 15 trading days.
M.S.R. Khan et al. Journal of The Japanese and International Economies 48 (2018) 85–96
94
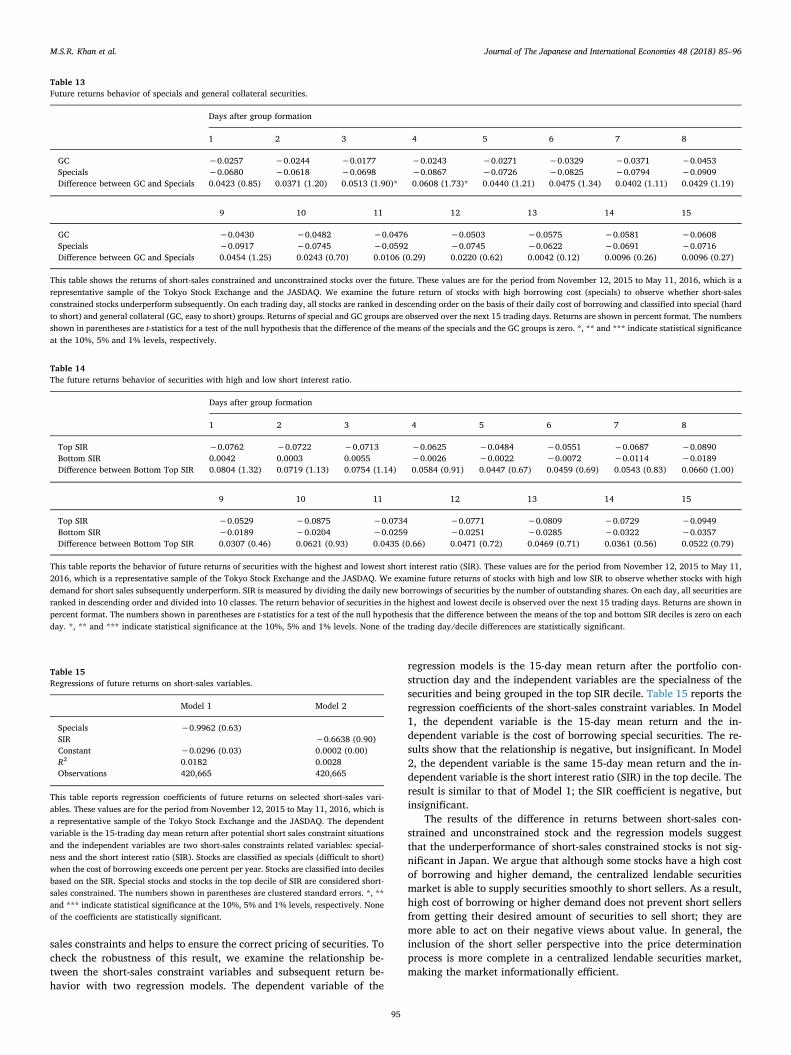
sales constraints and helps to ensure the correct pricing of securities. Tocheck the robustness of this result, we examine the relationship be-tween the short-sales constraint variables and subsequent return be-havior with two regression models. The dependent variable of the
regression models is the 15-day mean return after the portfolio con-struction day and the independent variables are the specialness of thesecurities and being grouped in the top SIR decile. Table 15 reports theregression coefficients of the short-sales constraint variables. In Model1, the dependent variable is the 15-day mean return and the in-dependent variable is the cost of borrowing special securities. The re-sults show that the relationship is negative, but insignificant. In Model2, the dependent variable is the same 15-day mean return and the in-dependent variable is the short interest ratio (SIR) in the top decile. Theresult is similar to that of Model 1; the SIR coefficient is negative, butinsignificant.
The results of the difference in returns between short-sales con-strained and unconstrained stock and the regression models suggestthat the underperformance of short-sales constrained stocks is not sig-nificant in Japan. We argue that although some stocks have a high costof borrowing and higher demand, the centralized lendable securitiesmarket is able to supply securities smoothly to short sellers. As a result,high cost of borrowing or higher demand does not prevent short sellersfrom getting their desired amount of securities to sell short; they aremore able to act on their negative views about value. In general, theinclusion of the short seller perspective into the price determinationprocess is more complete in a centralized lendable securities market,making the market informationally efficient.
Table 13Future returns behavior of specials and general collateral securities.
Days after group formation
1 2 3 4 5 6 7 8
GC −0.0257 −0.0244 −0.0177 −0.0243 −0.0271 −0.0329 −0.0371 −0.0453Specials −0.0680 −0.0618 −0.0698 −0.0867 −0.0726 −0.0825 −0.0794 −0.0909Difference between GC and Specials 0.0423 (0.85) 0.0371 (1.20) 0.0513 (1.90)* 0.0608 (1.73)* 0.0440 (1.21) 0.0475 (1.34) 0.0402 (1.11) 0.0429 (1.19)
9 10 11 12 13 14 15
GC −0.0430 −0.0482 −0.0476 −0.0503 −0.0575 −0.0581 −0.0608Specials −0.0917 −0.0745 −0.0592 −0.0745 −0.0622 −0.0691 −0.0716Difference between GC and Specials 0.0454 (1.25) 0.0243 (0.70) 0.0106 (0.29) 0.0220 (0.62) 0.0042 (0.12) 0.0096 (0.26) 0.0096 (0.27)
This table shows the returns of short-sales constrained and unconstrained stocks over the future. These values are for the period from November 12, 2015 to May 11, 2016, which is arepresentative sample of the Tokyo Stock Exchange and the JASDAQ. We examine the future return of stocks with high borrowing cost (specials) to observe whether short-salesconstrained stocks underperform subsequently. On each trading day, all stocks are ranked in descending order on the basis of their daily cost of borrowing and classified into special (hardto short) and general collateral (GC, easy to short) groups. Returns of special and GC groups are observed over the next 15 trading days. Returns are shown in percent format. The numbersshown in parentheses are t-statistics for a test of the null hypothesis that the difference of the means of the specials and the GC groups is zero. *, ** and *** indicate statistical significanceat the 10%, 5% and 1% levels, respectively.
Table 14The future returns behavior of securities with high and low short interest ratio.
Days after group formation
1 2 3 4 5 6 7 8
Top SIR −0.0762 −0.0722 −0.0713 −0.0625 −0.0484 −0.0551 −0.0687 −0.0890Bottom SIR 0.0042 0.0003 0.0055 −0.0026 −0.0022 −0.0072 −0.0114 −0.0189Difference between Bottom Top SIR 0.0804 (1.32) 0.0719 (1.13) 0.0754 (1.14) 0.0584 (0.91) 0.0447 (0.67) 0.0459 (0.69) 0.0543 (0.83) 0.0660 (1.00)
9 10 11 12 13 14 15
Top SIR −0.0529 −0.0875 −0.0734 −0.0771 −0.0809 −0.0729 −0.0949Bottom SIR −0.0189 −0.0204 −0.0259 −0.0251 −0.0285 −0.0322 −0.0357Difference between Bottom Top SIR 0.0307 (0.46) 0.0621 (0.93) 0.0435 (0.66) 0.0471 (0.72) 0.0469 (0.71) 0.0361 (0.56) 0.0522 (0.79)
This table reports the behavior of future returns of securities with the highest and lowest short interest ratio (SIR). These values are for the period from November 12, 2015 to May 11,2016, which is a representative sample of the Tokyo Stock Exchange and the JASDAQ. We examine future returns of stocks with high and low SIR to observe whether stocks with highdemand for short sales subsequently underperform. SIR is measured by dividing the daily new borrowings of securities by the number of outstanding shares. On each day, all securities areranked in descending order and divided into 10 classes. The return behavior of securities in the highest and lowest decile is observed over the next 15 trading days. Returns are shown inpercent format. The numbers shown in parentheses are t-statistics for a test of the null hypothesis that the difference between the means of the top and bottom SIR deciles is zero on eachday. *, ** and *** indicate statistical significance at the 10%, 5% and 1% levels. None of the trading day/decile differences are statistically significant.
Table 15Regressions of future returns on short-sales variables.
Model 1 Model 2
Specials −0.9962 (0.63)SIR −0.6638 (0.90)Constant −0.0296 (0.03) 0.0002 (0.00)R2 0.0182 0.0028Observations 420,665 420,665
This table reports regression coefficients of future returns on selected short-sales vari-ables. These values are for the period from November 12, 2015 to May 11, 2016, which isa representative sample of the Tokyo Stock Exchange and the JASDAQ. The dependentvariable is the 15-trading day mean return after potential short sales constraint situationsand the independent variables are two short-sales constraints related variables: special-ness and the short interest ratio (SIR). Stocks are classified as specials (difficult to short)when the cost of borrowing exceeds one percent per year. Stocks are classified into decilesbased on the SIR. Special stocks and stocks in the top decile of SIR are considered short-sales constrained. The numbers shown in parentheses are clustered standard errors. *, **and *** indicate statistical significance at the 10%, 5% and 1% levels, respectively. Noneof the coefficients are statistically significant.
M.S.R. Khan et al. Journal of The Japanese and International Economies 48 (2018) 85–96
95
6. Conclusion
This study examines the significance of short-sales constraints in thepresence of a centralized lendable securities market. The centralizedlendable securities market in Japan provides an opportunity to observehow costs and the demand and supply of lendable securities behave in amarket where search frictions are low. Using six months of daily data,we test our hypotheses that the cost of borrowing and recall risk is lowin a centralized lendable securities market. This should make themarket efficient in the sense that it uses all information. Our resultsshow that short sales are not constrained in Japan; only 4.65% of se-curities have an annual borrowing cost of more than one percent. Adirect comparison of the cost of borrowing stocks listed on both cen-tralized and non-centralized lendable securities markets also suggeststhat the cost of borrowing in the centralized market is lower than thatin the non-centralized market. We also find that the chance of beingspecial is higher for large market capitalization stocks, value stocks andsecurities with a high divergence of opinion. The supply of lendablesecurities is affected by institutional ownership, turnover, market ca-pitalization and the price-to-book ratio, but not by the cost of bor-rowing securities.
We find no evidence of conventional stock recall risk in a Japan. Weobserve the behavior of stocks facing mismatch situations in a cen-tralized lendable securities market as well. Mismatch means the de-mand for loanable securities may exceed the supply. In mismatch si-tuations, we observe an increase in the cost of borrowing and atemporary reduction in new securities borrowing compared to stocks innon-mismatch situations. However, we also find evidence that theJapan Securities Finance Corporation can manage mismatch situations.Although the cost of borrowing continues to be high, the balance ofborrowed securities remains essentially unchanged.
Finally, we observe the return behavior of short-sales constrainedsecurities in a centralized lendable securities market. We find thatshort-sales constrained securities do not subsequently underperformcompared to unconstrained securities. In tests of robustness, we find nomeaningful relationship between future stock returns and the short-sales constraint related variables. We argue that a centralized lendablesecurities market helps to ensure a smooth supply of lendable stock at alower cost by reducing search frictions; this makes markets less short-sales constrained. The main conclusion is that a centralized lendablesecurity market makes the stock market informationally efficient andsupports the insights of Kolasinski et al. (2013). Policy makers andsecurities market designers should consider the benefits of adopting acentralized lendable securities market.
References
Aitken, M., Frino, A., McCorry, M., Swan, P., 1998. Short sales are almost instantaneouslybad news: evidence from the Australian stock exchange. J. Financ. 53, 2205–2223.
Asquith, P., Meulbroek, L., 1995. “An Empirical Investigation of Short Interest.”Unpublished Working Paper, M.I.T.
Asquith, P., Pathak, P.A., Ritter, J.R., 2005. Short interest, institutional ownership, andstock returns. J. Financ. Econ. 78, 243–276.
Bai, Y., Chang, E.C., Wang, J., 2006. Asset Prices under Short Sale Constraints. Universityof Hong Kong Working Paper.
Bank of Japan. Introduction of “Quantitative and Qualitative Monetary Easing with aNegative Interest Rate”, (29 January 2016) Accessed from (29 October 2017) https://www.boj.or.jp/en/announcements/release_2016/k160129a.pdf.
Beneish, M.D., Lee, C.M.C., Nichols, C., 2015. In short supply: short sellers and stockreturns. J. Account. Econ. 60, 33–57.
Blocher, J., Reed, A.V., Van Wesep, E.D., 2013. Connecting two markets: an equilibriumframework for shorts, longs and stock loans. J. Financ. Econ. 108, 302–322.
Boehme, R., Danielsen, B., Sorescu, S., 2006. Short sale constraints, differences of
opinion, and overvaluation. J. Financ. Quant. Anal. 41, 455–487.Boehmer, E., Jones, C.M., Zhang, X., 2008. Which shorts are informed? J. Financ. 63,
491–527.Brent, A., Morse, D., Stice, K., 1990. Short interest: explanations and tests. J. Financ.
Quant. Anal. 25, 273–289.Bris, A., Goetzmann, W.N., Zhu, N., 2007. Efficiency and the bear: short sales and markets
around the world. J. Financ. 62, 1029–1079.Chen, J., Hong, H., Stein, J.C., 2002. Breadth of ownership and stock returns. J. Financ.
Econ. 66, 171–205.Damodaran, A., Lim, J., 1991. The effects of option listing on the underlying stocks’ re-
turn process. J. Bank. Financ. 15, 647–664.D'Avolio, G., 2002. The market for borrowing stock. J. Financ. Econ. 66, 271–306.Diamond, D.W., Verrecchia, R.E., 1987. Constraints on short-selling and asset price ad-
justment to private information. J. Financ. Econ. 18, 277–311.Diether, K., 2008. Short-Selling, Timing, and Profitability. Ohio State University Working
Paper.Diether, K.B., Lee, K-H., Werner, I.M., 2009. Short-sale strategies and return predict-
ability. Rev. Financ. Stud. 22, 575–607.Desai, H., Ramesh, K., Thiagarajan, S.R., Balachandran, B.V., 2002. An investigation of
the informational role of short interest in the NASDAQ market. J. Financ. 57,2263–2287.
Duffie, D., Gârleanu, N., Pedersen, L.H., 2002. Securities lending, shorting, and pricing. J.Financ. Econ. 66, 307–339.
Engelberg, J.E., Reed, A.V., Ringgenberg, M.C., 2015. Short Selling Risk. University ofNorth Carolina, Kenan-Flagler Business School Research Paper.
Figlewski, S., 1981. The informational effects of restrictions on short sales: some em-pirical evidence. J. Financ. Quant. Anal. 16, 463–476.
Figlewski, S., Webb, W.P., 1993. Options, short sales, and market completeness. J. Financ.48, 761–777.
Geczy, C.C., Musto, D.K., Reed, A.V., 2002. Stocks are special too: an analysis of theequity lending market. J. Financ. Econ. 66, 241–269.
Harrison, M.J., Kreps, D.M., 1978. Speculative investor behavior in a stock market withheterogeneous expectations. Q. J. Econ. 92, 323–336.
Henry, T.R., Koski, J.L., 2010. Short selling around seasoned equity offerings. Rev.Financ. Stud. 23, 4389–4418.
Hong, H., Stein, J.C., 2003. Differences of opinion, short-sales constraints, and marketcrashes. Rev. Financ. Stud. 16, 487–525.
Isaka, N., 2007. On the informational effect of short-sales constraints: evidence from theTokyo stock exchange. J. Financ. Res. 30, 455–471.
Jones, C.M., Lamont, O.A., 2002. Short-sale constraints and stock returns. J. Financ. Econ.66, 207–239.
Kato, H.K., Singh, A.K., Suzuki, K., 2015. Divergence of opinion, short-sales constraintsand stock returns: evidence from japanese seasoned equity offerings. In: 12th AIMSInternational Conference on Management. Indian Institute of Management (IIM)Kozhikode, India.
Kolasinski, A.C., Reed, A.V., Ringgenberg, M.C., 2013. A multiple lender approach tounderstanding supply and search in the equity lending market. J. Financ. 68,559–595.
Lee, B-S., Ko, K., 2014. Are japanese short sellers information detectives? J. Jpn. Int.Econ. 34, 89–97.
Line Kabushiki Kaisha. “Form F-1 Registration Statement Under the Securities Act of1933.” As filed with the Securities and Exchange Commission (June 10, 2016).
Martin, A., 2016. Line, a japanese messaging app, raises over $1 billion in IPO. Wall StreetJ 268 (8), B3.
Miller, E.M., 1977. Risk, uncertainty, and divergence of opinion. J. Financ. 32,1151–1168.
Nagel, S., 2005. Short sales, institutional investors and the cross-section of stock returns.J. Financ. Econ. 78, 277–309.
Ofek, E., Richardson, M., Whitelaw, R., 2004. Limited arbitrage and short sales restric-tions: evidence from the options markets. J. Financ. Econ. 74, 305–342.
Reed, A.V., 2007. Costly Short-Selling and Stock Price Reactions to EarningsAnnouncements. University of North Carolina Working Paper.
Reed, A.V., 2015. Connecting supply, short-sellers and stock returns: research challenges.J. Account. Econ. 60, 97–103.
Saffi, P.A.C., Sigurdsson, K., 2011. Price efficiency and short selling. Rev. Financ. Stud.24, 821–852.
Senchack, A., Starks, L., 1993. Short-sale restrictions and market reaction to short-interestannouncements. J. Financ. Quant. Anal. 28, 177–194.
Shkilko, A., Van Ness, B.F., Van Ness, R.A., 2008. Aggressive short selling and price re-versals. In: AFA 2008 New Orleans Meetings Paper, Available at. http://ssrn.com/abstract=971210.
Skinner, D.J., 1990. Options markets and the information content of accounting earningsreleases. J. Account. Econ. 13, 191–211.
Takahashi, H., 2010. Short-sale inflow and stock returns: evidence from Japan. J. Bank.Financ. 34, 2403–2412.
Woolridge, J.R., Dickinson, A., 1994. Short selling and common stock prices. Financ.Anal. J. 50, 20–28.
M.S.R. Khan et al. Journal of The Japanese and International Economies 48 (2018) 85–96
96
Related Documents