Are our results reliable enough to support a conclusion?

Are our results reliable enough to support a conclusion?
Jan 02, 2016
Are our results reliable enough to support a conclusion?. D8. C1. Imagine we chose two children at random from two class rooms…. … and compare their height …. D8. C1. … we find that one pupil is taller than the other. WHY?. D8. C1. - PowerPoint PPT Presentation
Welcome message from author
This document is posted to help you gain knowledge. Please leave a comment to let me know what you think about it! Share it to your friends and learn new things together.
Transcript
Are our results reliable enough to support a conclusion?

Imagine we chose two children at random from two class rooms…
D8 C1
… and compare their height …

D8 C1… we find that
one pupil is taller than the
other
WHY?
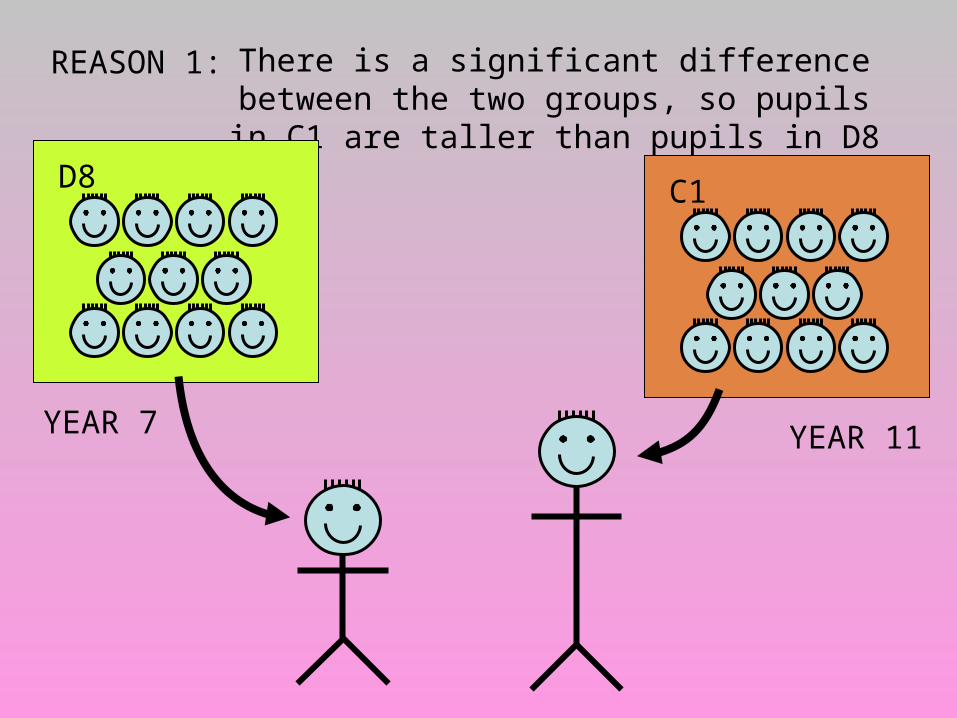
REASON 1: There is a significant difference between the two groups, so pupils in C1 are taller than
pupils in D8D8
YEAR 7
C1
YEAR 11

REASON 2: By chance, we picked a short pupil from D8 and a tall one from C1
D8 C1
TITCH
(Year 9)
HAGRID
(Year 9)

How do we decide which reason is most likely?
MEASURE MORE STUDENTS!!!

If there is a significant difference between the two groups…
D8 C1… the average or mean height of the two groups should
be very…
… DIFFERENT
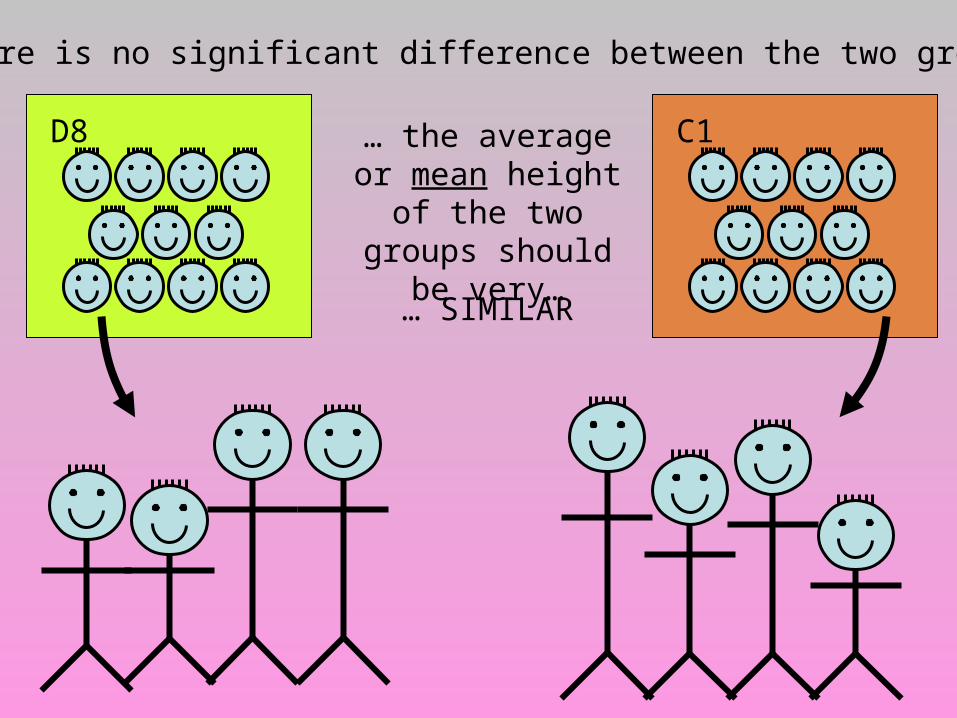
If there is no significant difference between the two groups…
D8 C1… the average or mean height of the two groups should
be very…
… SIMILAR

Remember:
Living things normally show a lot of variation, so…

It is VERY unlikely that the mean height of our two samples will be exactly the same
C1 Sample
Average height = 162 cm
D8 Sample
Average height = 168 cm
Is the difference in average height of the samples large enough to be significant?

We can analyse the spread of the heights of the students in the samples by drawing histograms
Here, the ranges of the two samples have a small overlap, so…
… the difference between the means of the two samples IS probably significant.
2
4
6
8
10
12
14
16
Fre
quen
cy
140-149
150-159
160-169
170-179
180-189
Height (cm)
C1 Sample
2
4
6
8
10
12
14
16
Fre
quen
cy
140-149
150-159
160-169
170-179
180-189
Height (cm)
D8 Sample
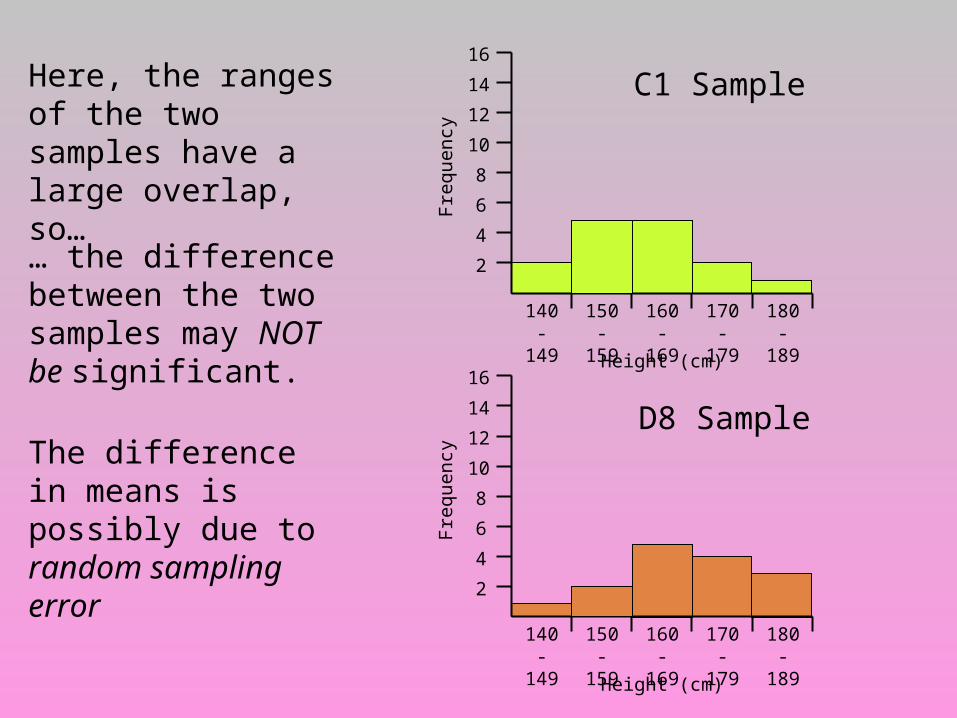
Here, the ranges of the two samples have a large overlap, so…
… the difference between the two samples may NOT be significant.
The difference in means is possibly due to random sampling error
2
4
6
8
10
12
14
16
Fre
quen
cy
140-149
150-159
160-169
170-179
180-189
Height (cm)
C1 Sample
2
4
6
8
10
12
14
16
Fre
quen
cy
140-149
150-159
160-169
170-179
180-189
Height (cm)
D8 Sample

To decide if there is a significant difference between two samples we must compare the mean height for each sample…
… and the spread of heights in each sample.
Statisticians calculate the standard deviation of a sample as a measure of the spread of a sample
Sx =Σx2 -
(Σx)2 n
n - 1
Where:Sx is the standard deviation of sampleΣ stands for ‘sum of’x stands for the individual measurements in
the samplen is the number of individuals in the sample
You can calculate standard deviation using the formula:

Student’s t-test
The Student’s t-test compares the averages and standard deviations of two samples to see if there is a significant difference between them.
We start by calculating a number, t
t can be calculated using the equation:
( x1 – x2 )
(s1)2
n1
(s2)2
n2
+
t =Where:
x1 is the mean of sample 1s1 is the standard deviation of sample 1n1 is the number of individuals in sample 1x2 is the mean of sample 2s2 is the standard deviation of sample 2n2 is the number of individuals in sample 2

Worked Example: Random samples were taken of pupils in C1 and D8
Their recorded heights are shown below…
Students in C1 Students in D8
Student Height (cm)
145 149 152 153 154 148 153 157 161 162
154 158 160 166 166 162 163 167 172 172
166 167 175 177 182 175 177 183 185 187
Step 1: Work out the mean height for each sample
161.60C1: x1 = 168.27D8: x2 =
Step 2: Work out the difference in means
6.67x2 – x1 = 168.27 – 161.60 =

Step 3: Work out the standard deviation for each sample
C1: s1 = 10.86 D8: s2 = 11.74
Step 4: Calculate s2/n for each sample
(s1)2
n1
=C1:
10.862 ÷ 15 = 7.86
(s2)2
n2
=D8:
11.742 ÷ 15 = 9.19
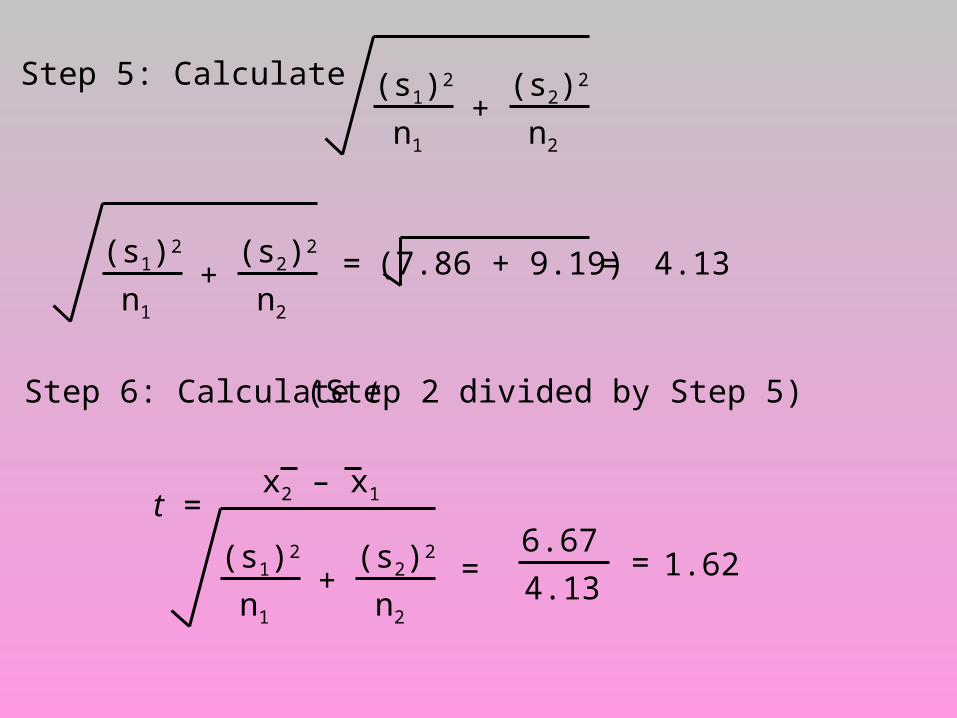
Step 5: Calculate (s1)2
n1
+(s2)2
n2
(s1)2
n1
+(s2)2
n2
= (7.86 + 9.19) = 4.13
Step 6: Calculate t (Step 2 divided by Step 5)
t =
(s1)2
n1
+(s2)2
n2
=
x2 – x1
6.67
4.13= 1.62

Step 7: Work out the number of degrees of freedom
d.f. = n1 + n2 – 2 = 15 + 15 – 2 = 28
Step 8: Find the critical value of t for the relevant number of degrees of freedom
Use the 95% (p=0.05) confidence limit
Critical value = 2.048
Our calculated value of t is below the critical value for 28d.f., therefore, there is no significant difference between the height of students in samples from C1 and D8

A one- or two-tailed t-test is determined by whether the total area of a is placed in one tail or divided equally between the two tails. The one-tailed t-test is performed if the results are interesting only if they turn
out in a particular direction.

The two-tailed t-test is performed if the results would be interesting in either direction. The choice of a one- or two-tailed t-test effects the hypothesis testing procedure in a number of different ways.
Related Documents