Are OBE students prepared for university mathematics? Ansie Harding & Johann Engelbrecht University of Pretoria

Are OBE students prepared for university mathematics? Ansie Harding & Johann Engelbrecht University of Pretoria.
Dec 29, 2015
Welcome message from author
This document is posted to help you gain knowledge. Please leave a comment to let me know what you think about it! Share it to your friends and learn new things together.
Transcript

Are OBE students prepared for university mathematics?
Ansie Harding & Johann EngelbrechtUniversity of Pretoria

The Education Crisis
“We have not yet begun to turn the corner”
“most unhappy with the disappointing results”
Minister of Basic Education, Ms Angie Motshegkaon the 2009 matric results

OBE history in South Africa
1998: Introduced for Grades 1-6
2004: Grades 8-10 revert back to the traditional curriculum
2007: Students with partial OBE exposure enter university
2009: Students with full OBE exposure enter university

Measuring university preparedness
Partial OBE exposure 2007
Full OBE exposure 2009 -2010

Partial exposure 2007 Partial exposure 2007

Early research: Partial OBE exposure
• Topics that are usually included in the school syllabus.
• Basic mathematical computations, elementary problems
• Results determine whether a student needs intervention to be successful in tertiary mathematics
Alternative Admissions Research Project (AARP)
Mathematics achievement test

Data
• Items grouped into 12 topics
• Some items ended up in more than one topic
• University of Pretoria students
• 2005 - 2007 intake
• More than 2000 students every year

2005 2006 2007
Number of students 2040 2176 2005
# of items
Mean student performance
Topic
Percentages 2 21.3 26.1 26.3
Number concept, manipulation 3 56.0 54.8 54.5
Modelling, word sums 3 28.3 28.7 19.9
Ratio and proportion 3 31.1 30.6 24.1
Algebraic manipulation 6 48.2 48.6 48.9
Exponents 3 40.0 43.8 43.8
Functions 3 51.5 52.5 53.8
Graphs 4 51.3 54.8 56.6
Geometry 5 31.3 35.1 47.0
Trigonometry 3 32.9 29.1 30.2
Logical thinking 3 41.2 41.2 43.4
2005 2006 2007
Number of students 2040 2176 2005
# of items
Topic
Percentages 2
Number concept, manipulation 3
Modelling, word sums 3
Ratio and proportion 3
Algebraic manipulation 6
Exponents 3
Functions 3
Graphs 4
Geometry 5
Trigonometry 3
Logical thinking 3

Modelling and word sums
Examples
• Tap A fills a drum in 1 hour. Tap A and tap B together are able to fill the drum in 20 minutes. How long will it take tap B alone to fill the drum?
• Deidre, Xoliswa and Igshaan share a certain amount of money in the ratio 1:2:3. If Deidre’s share and Igshaan’s share add up to R900, how much money
did Xoliswa get?
0.0
5.0
10.0
15.0
20.0
25.0
30.0
35.0
1
2005
2006
2007

Ratio and proportion
Examples
• The table shows values of x and y, where x is directly proportional to y. What is the value of p?
• If h oranges cost p cents, what is the cost of in rand of k oranges?
x 6 14
y 7 p
0.0
5.0
10.0
15.0
20.0
25.0
30.0
35.0
1
2005
2006
2007

Geometry
Examples
• Calculating angles from a diagram
• Calculating the diagonal of a rectangular prism with given sides.
0.0
5.0
10.0
15.0
20.0
25.0
30.0
35.0
40.0
45.0
50.0
1
2005
2006
2007

Full OBE exposure 2009Full OBE exposure 2009

2. Matric mathematics marks were somewhat inflated: 63 000 obtained a mark of more than 50% in contrast with 25 000 of
previous years
1. First to have completed their school education in the OBE system
The 2009 intake of studentsThe 2009 intake of students
3. 46% passed at the 30% hurdle and 29% passed at the 40% hurdle (15% of total taking the NSC exam)

Sample group:Sample group:
• A group of first year engineering maths – approx 1200 students
• Entrance requirement of more than 70% for matric maths (up from 60%)
• 72% of these students had distinctions in matric

0
5
10
15
20
25
30
35
40
10 20 30 40 50 60 70 80 90 100
2007
2008
2009
Matric mark distribution for 2009 intake of engineering first years

What happened in the first semester at university?2009
0
5
10
15
20
25
30
35
40
0 20 40 60 80 100
Grade 12
0
5
10
15
20
25
0 20 40 60 80 100
Semester Test 1
0
5
10
15
20
0 20 40 60 80 100
Semester Test 2
0
5
10
15
20
25
30
35
40
0 20 40 60 80 100
Grade 12
0
5
10
15
20
25
0 20 40 60 80 100
Semester Test 1
0
5
10
15
20
0 20 40 60 80 100
Semester Test 2
0
5
10
15
20
25
30
35
40
0 20 40 60 80 100
Grade 12
0
5
10
15
20
25
0 20 40 60 80 100
Semester Test 1
0
5
10
15
20
0 20 40 60 80 100
Semester Test 2

0
2
4
6
8
10
12
14
16
18
20
0 20 40 60 80 100
June Examination
0
5
10
15
20
25
30
35
40
0 20 40 60 80 100
Grade 12
0
5
10
15
20
25
0 20 40 60 80 100
Semester Test 1
0
5
10
15
20
0 20 40 60 80 100
Semester Test 2

Additional Assistance offered:Additional Assistance offered:• Orientation week
• Slightly decreased pace
• Restructured content somewhat in expectation
• Tutor programme
• One four assistant
• Web quizzes

What do the lecturers say about the OBE generation?What do the lecturers say about the OBE generation?
Increase in:• Self-confidence• Willingness to “experiment” • Wanting to do things “their” way • Technology dependency
DOTHINK

Decrease in :Decrease in :
• factual knowledge
eg logs, exponents, absolute value
• algebraic manipulation
5
1
3
1
2
1
bba
a
1
1
0
5
10
15
20
25
0 20 40 60 80 100
Algebraic manipulation
Sem Test 1 Sem Test 2

• graphical interpretation
• mathematical formulation “They speak about mathematics too loosely rather than
writing it out carefully.”
“Students write down everything that they can think about, without any coherence, and hope that somewhere there will be something that can earn them a mark.”
0
5
10
15
20
25
30
0 20 40 60 80 100
Graphical interpretation
Sem Test 1 Sem Test 2

Not only at Tuks ….Not only at Tuks ….
Wits mathematics lecturer Belinda Huntley:
• 71 percent of first-year engineering students had passed in 2008 compared with just 35 percent in the 2009 mid-year exams. In addition,
• the fact that more grade 12 learners than ever before had passed in 2008, caused record enrolments. This had led to enormous strain on the university’s ability to teach.

Remarks from staff members
• The students cannot write mathematics. This is definitely worse than other years (UP lecturer - engineers)
• There was a definite increase in the number of students who do not have the basic mathematical skills required for participating in this course. I am hoping for a miracle. In the meantime I think the only remedy is to redirect the worst achievers to the foundational stream as soon as possible (UP lecturer - BSc mainstream)
• The results are quite shocking. An average mark of about 12% below 2008, and they were just adequate at best, pass rate in mid 20% area (WITS lecturer Statistics)
• First term results were disastrous probably the worst in recent history (DUT lecturer)
• The gap between the high school and the first year curriculum is wider (Venda lecturer)

Implications for 2010?
• Awareness of content knowledge & skills
• Restructuring of content significantly
• Slower pace in the beginning
• Third hour tutoring sessions
0
5
10
15
20
25
30
35
40
10 20 30 40 50 60 70 80 90 100
2007
2008
2009
05
1015
2025
3035
4045
10 20 30 40 50 60 70 80 90 100
k
Matric marks 2007 - 2009 Matric marks 2010
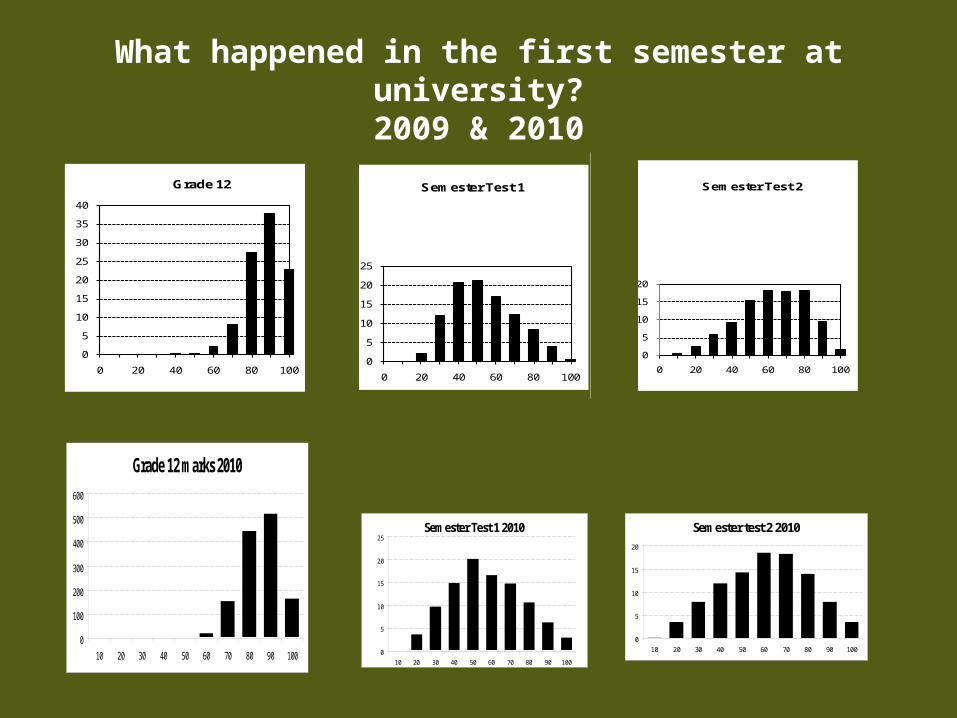
What happened in the first semester at university?2009 & 2010
0
5
10
15
20
25
30
35
40
0 20 40 60 80 100
Grade 12
0
5
10
15
20
25
0 20 40 60 80 100
Semester Test 1
0
5
10
15
20
0 20 40 60 80 100
Semester Test 2
0
5
10
15
20
25
30
35
40
0 20 40 60 80 100
Grade 12
0
5
10
15
20
25
0 20 40 60 80 100
Semester Test 1
0
5
10
15
20
0 20 40 60 80 100
Semester Test 2
0
5
10
15
20
25
30
35
40
0 20 40 60 80 100
Grade 12
0
5
10
15
20
25
0 20 40 60 80 100
Semester Test 1
0
5
10
15
20
0 20 40 60 80 100
Semester Test 2
Grade 12 marks 2010
0
100
200
300
400
500
600
10 20 30 40 50 60 70 80 90 100
Semester Test 1 2010
0
5
10
15
20
25
10 20 30 40 50 60 70 80 90 100
Semester test 2 2010
0
5
10
15
20
10 20 30 40 50 60 70 80 90 100

What now?
• There is definitely a problem – more so than in the past. Research to investigate details of the problem
• “Teach the students you have and not those you wish you had” (Lyn Steen, former president AMA):
Adapt tertiary curricula
• Additional assistance:Augmented programmesAdditional support programmes
Related Documents