Insights from Slums in Six States Are India’s Urban Poor Using Clean Cooking Fuels? Shaily Jha, Sasmita Patnaik, and Rithima Warrier Issue Brief March 2021

Welcome message from author
This document is posted to help you gain knowledge. Please leave a comment to let me know what you think about it! Share it to your friends and learn new things together.
Transcript
Insights from Slums in Six States
Are Indiarsquos Urban Poor Using Clean Cooking Fuels
Shaily Jha Sasmita Patnaik and Rithima Warrier
Issue Brief March 2021
Centre forEnergy Finance
Are Indiarsquos Urban Poor Using Clean Cooking Fuels Insights from Slums in Six States
Image CEEW
Between December 2019 to March 2020 CEEW surveyed the primary cook of households across urban slums from the six states of Bihar Jharkhand Uttar Pradesh Rajasthan Madhya Pradesh and Chhattisgarh
CEEW Issue Brief March 2021
ceewin
Insights from Slums in Six States
Are Indiarsquos Urban Poor Using Clean Cooking Fuels
Centre forEnergy Finance
Shaily Jha Sasmita Patnaik and Rithima Warrier
Are Indiarsquos Urban Poor Using Clean Cooking Fuels Insights from Slums in Six States
Copyright copy 2021 Council on Energy Environment and Water (CEEW)
Open access Some rights reserved This work is licensed under the Creative Commons
Attribution Noncommercial 40 International (CC BY-NC 40) license To view the full license visit
wwwcreativecommonsorglicensesby-nc40legalcode
Suggested citation Jha Shaily Sasmita Patnaik and Rithima Warrier 2021 Are Indiarsquos Urban Poor Using Clean Cooking Fuels
Insights from Slums in Six States New Delhi Council on Energy Environment and Water
Disclaimer The views expressed in this issue brief are those of the authors and do not necessarily reflect the views
and policies of Council on Energy Environment and Water The views analysis expressed in this study do
not necessarily reflect the views of the MacArthur Foundation The Foundation also does not guarantee
the accuracy of any data included in this publication nor does it accept any responsibility for the
consequences of its use
Cover image iStock
Peer reviewers Ashish Gupta PhD student University of Pennsylvania Vinaya Padmanabhan Consultant Oxford Policy
Management and Abhishek Jain Fellow and Director-Powering Livelihoods CEEW
Publication team Alina Sen (CEEW) The Clean Copy Twig Designs and Friends Digital
Organisation The Council on Energy Environment and Water (CEEW) is one of Asiarsquos leading not-for-profit policy
research institutions The Council uses data integrated analysis and strategic outreach to explain ndash and
change ndash the use reuse and misuse of resources It prides itself on the independence of its high-quality
research develops partnerships with public and private institutions and engages with wider public In
2021 CEEW once again featured extensively across ten categories in the 2020 Global Go To Think Tank
Index Report The Council has also been consistently ranked among the worldrsquos top climate change think
tanks Follow us on Twitter CEEWIndia for the latest updates
Council on Energy Environment and Water Sanskrit Bhawan A-10 Qutab Institutional Area Aruna Asaf Ali Marg New Delhi - 110067 India
About CEEW
The Council on Energy Environment and Water (CEEW) is one of Asiarsquos leading not-for-profit policy research institutions The Council uses data integrated analysis and strategic outreach to explain mdash and change mdash the use reuse and misuse of resources The Council addresses pressing global challenges through an integrated and internationally focused approach It prides itself on the independence of its high-quality research develops partnerships with public and private institutions and engages with the wider public
The Councilrsquos illustrious Board comprises Mr Jamshyd Godrej (Chairperson) Mr Tarun Das Dr Anil Kakodkar Mr S Ramadorai Mr Montek Singh Ahluwalia Dr Naushad Forbes Ambassador Nengcha Lhouvum Mukhopadhaya and Dr Janmejaya Sinha The 100 plus executive team is led by Dr Arunabha Ghosh CEEW is certified as a Great Place To Workreg
In 2021 CEEW once again featured extensively across ten categories in the 2020 Global Go To Think Tank Index Report including being ranked as South Asiarsquos top think tank (15th globally) in our category for the eighth year in a row CEEW has also been ranked as South Asiarsquos top energy and resource policy think tank for the third year running It has consistently featured among the worldrsquos best managed and independent think tanks and twice among the worldrsquos 20 best climate think tanks In ten years of operations The Council has engaged in 278 research projects published 212 peer-reviewed books policy reports and papers created 100+ new databases or improved access to data advised governments around the world nearly 700 times promoted bilateral and multilateral initiatives on 80+ occasions and organised 350+ seminars and conferences In July 2019 Minister Dharmendra Pradhan and Dr Fatih Birol (IEA) launched the CEEW Centre for Energy Finance In August 2020 Powering Livelihoods mdash a CEEW and Villgro initiative for rural start-ups mdash was launched by Minister Mr Piyush Goyal Dr Rajiv Kumar (NITI Aayog) and HE Ms Damilola Ogunbiyi (SEforAll) The Councilrsquos major contributions include The 584-page National Water Resources Framework Study for Indiarsquos 12th Five Year Plan the first independent evaluation of the National Solar Mission Indiarsquos first report on global governance submitted to the National Security Adviser irrigation reform for Bihar the birth of the Clean Energy Access Network work for the PMO on accelerated targets for renewables power sector reforms environmental clearances Swachh Bharat pathbreaking work for the Paris Agreement the HFC deal the aviation emissions agreement and international climate technology cooperation the concept and strategy for the International Solar Alliance (ISA) the Common Risk Mitigation Mechanism (CRMM) critical minerals for Make in India modelling uncertainties across 200+ scenarios for Indiarsquos low-carbon pathways Indiarsquos largest multidimensional energy access survey (ACCESS) climate geoengineering governance circular economy of water and waste and the flagship event Energy Horizons It recently published Jobs Growth and Sustainability A New Social Contract for Indiarsquos Recovery
The Councilrsquos current initiatives include A go-to-market programme for decentralised renewable energy-powered livelihood appliances examining country-wide residential energy consumption patterns raising consumer engagement on power issues piloting business models for solar rooftop adoption developing a renewable energy project performance dashboard green hydrogen for industry decarbonisation state-level modelling for energy and climate policy reallocating water for faster economic growth creating a democratic demand for clean air raising consumer awareness on sustainable cooling and supporting Indiarsquos electric vehicle and battery ambitions It also analyses the energy transition in emerging economies including Indonesia South Africa Sri Lanka and Viet Nam
The Council has a footprint in 21 Indian states working extensively with state governments and grassroots NGOs It is supporting power sector reforms in Uttar Pradesh and Tamil Nadu scaling up solar-powered irrigation in Chhattisgarh supporting climate action plans in Gujarat and Madhya Pradesh evaluating community-based natural farming in Andhra Pradesh examining crop residue burning in Punjab and promoting solar rooftops in Delhi and Bihar
Are Indiarsquos Urban Poor Using Clean Cooking Fuels Insights from Slums in Six States
Acknowledgments
The authors would like to thank the partners for this survey Initiative for Sustainable Energy Policy (ISEP) at the Johns Hopkins School of Advanced International Studies (SAIS) We would like to extend our gratitude to Prof Johannes Urpelainen (Johns Hopkins SAIS) Carlos F Gould (Columbia University) and Alice Tianbo Zhang (Washington and Lee University) for leading the design of the survey instrument and giving us regular inputs and feedback in various stages of survey planning and implementation We would also like to thank our colleagues at CEEW Kurinji Selvaraj and Tanushree Ganguly for providing the district level air quality data for the analysis
The authors would like to acknowledge the valuable support of Market Xcel Private Ltd the survey agency and its survey team for administering the survey and collecting data Our deepest gratitude goes to them Special thanks to Prasenjit Saha and Pooja Sirpaul (Market Xcel Private Ltd) who were instrumental in implementing the survey We would also like to thank the MacArthur Foundation for financially supporting the study
We want to thank our reviewersmdashAshish Gupta University of Pennsylvania Vinaya Padmanabhan Oxford Policy Management and Abhishek Jain CEEWmdashfor providing critical feedback and comments that went a long way in refining this report
Are Indiarsquos Urban Poor Using Clean Cooking Fuels Insights from Slums in Six States
Shaily Jha shailyjhaceewin
Shaily is a Research Analyst in the Energy Access team at The Council She works on access to clean cooking energy and livelihoods with a focus on gender and social inclusion Shaily holds a postgraduate degree in Disaster Management from the Tata Institute of Social Sciences (TISS) Mumbai and an undergraduate degree in Geography from Miranda House University of Delhi
Sasmita Patnaik sasmitaapatnaikgmailcom
Sasmita is a former Programme Lead of the Energy Access team at The Council She led the work on access to clean cooking and livelihoods with a focus on gender and social inclusion She holds an MSc in Development Studies from the School of Oriental and African Studies (SOAS) and a postgraduate diploma in Rural Management from Xavier Institute of Management Bhubaneswar (XIMB)
Rithima Warrier rithima2warriergmailcom
Rithima worked as Research Consultant at The Council where she analysed primary data on energy access for rural households and urban slums of India Rithima holds an MTech in Bioscience and Bioengineering with a specialisation in Energy from the Indian Institute of Technology Guwahati (IITG) and a BE in Chemical Engineering from MS Ramaiah Institute of Technology (MSRIT) Bangalore
The authors
ldquoEven though the use of LPG as an exclusive cooking fuel is more prominent in urban households than their rural counterparts a significant share of the urban population living in slums is struggling to incorporate the cost of using LPG into the household budget The pollution burden for these households is doubled as they are exposed to the high ambient particulate matter pollution of cities along with the household air pollution from the use of polluting cooking fuelsrdquo
ldquoDuring data analysis we realised that even within polluting fuel-using slum households the reasons for not transitioning towards cleaner fuel varied between the households that stacked LPG with polluting fuels and the ones that only used polluting fuels Moreover the economic impact of COVID-19 is expected to further hinder the transition to cleaner fuels in these slumsrdquo
ldquoPolicies on clean cooking energy access have not necessarily targeted energy poverty in urban slums In a rapidly urbanising country facing a crisis of air pollution and now recovering from the economic impacts of COVID-19 it is time that we target policies to alleviate energy poverty in urban slums particularly in Tier 2 and Tier 3 cities Women and children are the worst affected by the use of polluting fuels reinforcing the need to focus on womenrsquos ability to use clean cooking energy solutions even after schemes like Pradhan Mantri Ujjwala Yojanardquo
Are Indiarsquos Urban Poor Using Clean Cooking Fuels Insights from Slums in Six States
Image iStock
Urban slums suffer from the double burden of pollution as they are exposed to the high ambient particulate matter pollution of cities along with the household air pollution (HAP) from the using unclean cooking fuels
Contents
Executive summary
Annexures
References
2 Cooking fuel adoption and use in urban slum households
21 Households using LPG as their only fuel 22 Households stacking LPG with polluting fuels 23 Households using only polluting fuels
SPOTLIGHT I Household air pollution (HAP) in urban slums
SPOTLIGHT II Womenrsquos participation in intra-household decision-making regarding LPG use
SPOTLIGHT III A comparison of access to clean cooking energy between urban slum and non-slum households across six states
3 Way forward
11 Motivation and methodology 12 Socio-economic characteristics of the urban slums of the six states
1 Introduction state of Indiarsquos urban slums 1
7
17
20
21
23
26
30
24
8
1116
i
Are Indiarsquos Urban Poor Using Clean Cooking Fuels Insights from Slums in Six States
Tables
Table 1 Sample allocation across urban slums
Table 2 Less than one-third of urban slum households reported income from salaried jobs
Table 3 Scheduled Castes and Scheduled Tribes have the lowest economic status
Table 4 The poor economic condition of households in urban slums impacts the use of clean fuels exclusively for cooking
Figures
Figure ES1 To reduce the health impacts from HAP households that are stacking with polluting fuels will need to transition to exclusive use of clean cooking fuels
Figure ES2 While stacking is highest among the middle categories (second and third quintile) it is prevalent across all asset quintiles including the highest one
Figure 1 Within slums there are considerable state-level variations in householdsrsquo fuel usage patterns across states
Figure 2 While the majority of LPG-using households use the fuel primarily only half of them use it exclusively
Figure 3 Most households using LPG exclusively acquire six to eight cylinders per year
Figure 4 Of the households that stack fuels most use LPG as their primary fuel
Figure 5 Stacking is prevalent in households across asset quintile categories
Figure 6 Almost half of the households using polluting fuels use it every day
Figure 7 Proportion of urban slum households using solid fuels as the primary cooking fuel increases during the winters months aggravating householdsrsquo air pollution exposure due to unfavourable atmospheric conditions
Figure 8 Lack of awareness about receiving LPG refill subsidies poses a threat to the success of LPG subsidy schemes
Figure 9 More than half of the households currently without LPG do not know how to get a connection or whom to ask about it implying a lack of awareness
5
5
3
22
ii
iii
8
8
9
11
12
13
14
15
16
Acronyms
BPL below poverty line
CAAQMS continuous ambient air quality monitoring stations
COPD chronic obstructive pulmonary disease
COVID coronavirus disease
DALY disability-adjusted life year
DBTL Direct Benefit Transfer scheme for LPG
HAP household air pollution
IRES India Residential Energy Survey
LPG liquified petroleum gas
NSSO National Sample Survey Office
OBC Other Backward Castes
OMCs oil and marketing companies
PMUY Pradhan Mantri Ujjwala Yojana
SC Scheduled Caste
SDI socio-demographic index
ST Scheduled Tribes
Are Indiarsquos Urban Poor Using Clean Cooking Fuels Insights from Slums in Six States
Image iStock
To reduce the health impacts from household air pollution slum households that are stacking polluting fuels will need to transition using clean cooking fuels exclusively
With increased urbanisation India is experiencing acute air pollution in its urban centres Slum dwellers are doubly affected both by the higher concentration of
particulate matter in urban areas as well as indoor air pollution from the use of unclean cooking fuels With more than 137 million people living in slums in country (Census 2011) there is a strong impetus to understand the use of clean cooking fuels in such households Existing literature on energy access and use in slums across developing countries assume that energy infrastructure is available in these settlements as they are situated in urban environments (Butera et al 2016) Household air pollution (HAP) has an estimated average contribution of 30ndash50 per cent to ambient air quality across Indiarsquos urban and rural areas (Balakrishnan et al 2019) Addressing biomass burning for cooking water heating and space heating during the winters has the potential to help reach the national ambient air quality standards (Chowdhury et al 2019)
However our analysis shows that a large share of these households do not have access to clean fuels due to lack of afforability or patchy supply In this brief we discuss access to clean cooking energy in urban slums across six states (Bihar Uttar Pradesh Rajasthan Madhya Pradesh Jharkhand and Chhattisgarh) These states have a low socio-demographic index and a high disease burden due to air pollution (Balakrishnan et al 2019) The findings of this brief are based on a primary survey conducted in rural areas and urban slums in these states ndash Cooking Energy Access Survey 20201 The analysis focuses on the fuel use patterns of households the extent of use of LPG and solid fuels fuel stacking behaviour and the primary cookrsquos perception of various cooking fuels and their health impacts
Slum households vary widely in their use of clean cooking fuels Therefore to understand their cooking energy use patterns better we categorised these households into three groups
Using clean fuels exclusively
Stacking clean fuels with polluting fuels and
Using only polluting fuels
Use of LPG as primary fuel
82 (Cooking Energy Access Survey 2020)
47 (Census 2011)
Polluting fuel as primary fuel
16 (Cooking Energy Access Survey 2020)
52 (Census 2011)
i
Executive summary
1 This has been referred as lsquoour surveyrsquo thereafter
In this brief the use of clean cooking fuels is considered synonymous to use of LPG
Are Indiarsquos Urban Poor Using Clean Cooking Fuels Insights from Slums in Six States
1 Households using LPG as their only fuelWhile most urban slum households have an LPG connection exclusive use of LPG is limited to just over half of the total households The householdrsquos economic status (measured through asset ownership) and their access to doorstep delivery of LPG refills are two critical factors that determine their ability to use LPG exclusively We found that households with higher asset ownership have significantly higher odds of using LPG as an exclusive fuel
2 Households stacking LPG with polluting fuelsAlthough schemes like Pradhan Mantri Ujjwala Yojana (PMUY) have helped increase LPG adoption this has not resulted in the complete replacement of biomass-based fuels Despite 86 per cent of households having an LPG connection the data shows that over a third of slum households are stacking with polluting fuels (including firewood dung cakes agriculture residue charcoal and kerosene) Most of these households use polluting fuels daily or at least weekly which increases their exposure to household air pollution
Among the households stacking LPG with polluting fuels the reasons for stacking vary affordability free-of-cost availability of biomass seasonality and taste preferences Across asset quintiles we find that stacking is highest among the middle categories (second and third quintile) though most households in these categories have adopted LPG Still the affordability of the fuel remains a significant concern One-fourth of households who are stacking polluting fuels have a median annual refill rate of eight cylinders and above (same as exclusive LPG users) despite having a similar household size as those using LPG exclusively Most of such households fall in the wealthiest asset quintiles and use a chulha (mud stove) for cooking chapatis or vegetables suggesting that they are not necessarily using unclean fuels due to the unaffordability of LPG but due to other factors like taste
ii
Figure ES1 To reduce the health impacts from household air pollution (HAP) households that are stacking with polluting fuels will need to transition to exclusive use of clean cooking fuels
Source Authorsrsquo analysis
Exclusive clean fuel users
Stacking with LPG as the primary fuel
Only polluting fuel users
Stacking LPG with polluting fuels
Stacking with LPG as the secondary fuel
55
3388
12
12
63 LPG-using households receive doorstep delivery of cylinders
77
households receiving doorstep delivery of LPG cylinders are exclusive users of the fuel
Despite increased LPG adoption stacking is prevalent in more than one-third of the slum households
iiiExecutive summary
Figure ES2 While stacking is highest among the middle categories (second and third quintile) it is prevalent across all asset quintiles including the highest one
Source Authorsrsquo analysis
21 Non-cooking uses of polluting fuels Despite using LPG as the primary fuel for their cooking needs households that stack fuels use polluting fuels for non-cooking purposes like heating water for bathing (29 per cent) and space heating (10 per cent)
22 Seasonal variations in fuel use Most households (88 per cent) use LPG as their primary fuel in the rainy season while in winters less than 45 per cent of households do so The increased use of polluting fuels in winter could be because during these months the polluting fuel requirement for non-cooking tasks within the household like water heating for bathing and space heating increases ndash which leads to the increased use of polluting fuels for cooking as well Unfortunately the increased use of polluting fuels in winters exposes households to the double burden of high ambient and household air pollution due to unfavourable atmospheric conditions
21 households stacking fuels
have more than one LPG connections
25 households stacking fuels have two-cylinder connections
1 2 3 4 5
Asset quintile categories
0
20
40
60
80
100
Per
cent
age
of h
ouse
hold
s
Exclusive clean fuel users Stacking LPG with polluting fuels Only polluting fuel users
5348
52
6367
2441 37
3232
2311 11
51
Are Indiarsquos Urban Poor Using Clean Cooking Fuels Insights from Slums in Six States
3 Households using only polluting fuelsDespite large-scale government initiatives like PMUY 12 per cent of urban slum households do not use LPG and rely on polluting fuels While most of these households are aware of PMUY the high upfront LPG connection cost along with the high recurring expenditure on refills deter them from procuring an LPG connection
Way forwardWhile we see a progressive change in householdsrsquo energy-use patterns as we move from rural to urban issues like affordability availability preference seasonality and the end-uses of the fuel remain essential factors that determine household fuel choice Understanding user categories and fuel use patterns is crucial in enabling access to and sustained use of clean cooking fuels Also it is vital to recognise the implications of cooking being a gendered activity However womenrsquos participation in intrahousehold decision-making regarding LPG use is limited
Despite being in urban areas 37 per cent of slum households do not receive home delivery of cylinders ndash availability is an essential factor that determines the householdrsquos likelihood of using LPG exclusively To increase LPG use oil and marketing companies (OMCs) and distributors need to improve home delivery of LPG refills in slum areas
Emissions from household sources contribute hugely to the surrounding air quality (Harish et al 2019) which is already poor in congested slum areas Majority of households cook inside the main house without a chimney indicating high exposure to pollution from the use of unclean fuels for cooking
iv
30 householdsrsquo female members place the order for LPG refills
50 householdsrsquo female
members decide whether or when to purchase LPG refills
75 householdsrsquo
using polluting fuels cook inside
the main house
67 householdsrsquo using polluting fuels do not have a chimney for ventilation
vExecutive summary
Integrate the issue of lack of access to clean cooking energy with urban poverty This study reiterates the need to look at poverty in urban areas in the context of energy access The vulnerability of urban slum dwellers needs to be accounted for while designing and implementing policies including social protection schemes Given the health and economic impacts of pollution access to clean cooking energy schemes must be integrated with the social assistance programmes of other ministries (eg health education and nutrition assistance) to better target support for slum households Government programmes such as the National Urban Livelihoods Mission and social service allocations for housing should use existing targeting approaches to include access to clean cooking energy within their ambit of services for the poor
The economic impact from COVID-19 will push households into energy poverty leading to the increased use of free-of-cost biomass ndash consequently increasing the risk of exposure to emissions from fuel burning While the government has announced that it will provide up to three free refills under the PM-Garib Kalyan Yojana scheme to all PMUY households less than a quarter of households in urban slums have Ujjwala connections ndash effectively making them ineligible for relief support There is a need to expand the reach of PMUY to cover all slum households
Bring renewed emphasis on clean cooking during COVID-19 Increased poverty would mean increased use of polluting fuels ndash there is a need for a renewed emphasis on clean cooking energy access during the COVID-19 pandemic as increased use of polluting fuels has health implications (lower respiratory infections and coronary chronic obstructive disease (COPD)) that increase the risk of COVID-19 infections being more severe
There is a need for targeted effort to include the poor households in urban slums left out in the first phase of Ujjwala
Are Indiarsquos Urban Poor Using Clean Cooking Fuels Insights from Slums in Six States
Image iStock
Addressing biomass burning for cooking water heating and space heating during the winters has the potential to help reach the national ambient air quality standards
The Census of India (2011) estimates that India has about 137 million slum dwellers across the country However statistics on slum populations vary significantly based on how
a slum is defined (Nolan 2015) Therefore not only is there a lack of data about how many people live in slums and informal settlements but there is also limited information about living conditions in slums (Rains Krishna and Wibbels 2018) Rapid urbanisation in India has led to population spikes in urban centres Low-income households in urban areas are trapped in informal and sometimes lsquoillegalrsquo settlements with poor living conditions where access to essential services and infrastructure tends to be limited or badly deteriorated (Butera et al 2016) While slum dwellers are not a homogeneous population slum areas have high concentrations of poverty and social and economic deprivation and poor shelter and environmental conditions (UN-Habitat 2003)
1 Introduction state of Indiarsquos urban slums
1
The Census of India (2011) defines slums as ldquoresidential areas where dwellings are unfit for human habitation by
reasons of dilapidation overcrowding faulty arrangements and design of such buildings narrowness or faulty
arrangement of street lack of ventilation light or sanitation facilities or any combination of these factors which
are detrimental to the safety and healthrdquo The slums in India are officially categorised into three categories
identified recognised and notified1 (Chandramouli 2010) About 59 per cent of slum households in India are non-
notified and are not legally recognised by the government (Nolan Bloom and Subbaraman 2018)
BOX 1 Slums in India
The existing literature on energy access and use in slums across developing countries suggests that while energy infrastructure (electric grid LPG distribution system) is available in these settlements (by being urban) households cannot afford it andor the service is unreliable (frequent outages and low voltage for electricity uncertain availability of gas cylinders) (Butera et al 2016) This leads to households relying on illegal connections for electricity and using energy sources that are on the lower end of the energy ladder (such as kerosene charcoal wood and other biomass residues) for cooking (Butera et al 2016)
1 Areas notified as slums by the concerned municipalities corporations local bodies or development authorities were termed notified slums All areas recognised as lsquoSlumrsquo by State UT Administration or Local Government Housing and Slum Boards which may have not been formally notified as slum under any act While a compact area of at least 300 population or about 60-70 households of poorly built congested tenements in the unhygienic environment is termed as identified slums (National Sample Survey Office 2012)
Are Indiarsquos Urban Poor Using Clean Cooking Fuels Insights from Slums in Six States2
In India population growth and rapid urbanisation have resulted in the deepening of urban poverty and the increased growth of urban slums (GNESD 2008 Yenneti Wei and Chen 2017) As per the Census 2011 most slum dwellers are casual labourers engaged in works other than public works (ie informal sectors) as opposed to salaried employees in non-slum urban areas (National Buildings Organisation 2013) As per the National Sample Survey Office (NSSO 2011ndash2012) the average daily wage of casual labourers is as low as INR 170 in urban areas (Ministry of Housing and Urban Affairs 2019) Such households may be able to purchase cleaner and more efficient fuels whenever they can but are likely to fall back on less efficient ones when faced by budgetary constraints Studies suggest that despite the LPG subsidies provided by the government significant sections of the urban poor population are still struggling to incorporate the cost of LPG into their household budgets (R Singh et al 2015) Use of multiple fuels also provides security from price variations and unreliable service associated with a single fuel or technology (Shahadat Lipu and Bhuiyan 2014)
As per the Census 2011 only half of the urban slum households across the country use LPG as their cooking fuel the remaining rely on solid fuels and kerosene Since 2013 the LPG programme in India has undergone many modifications to improve delivery and targeting access to connections and the availability of LPG (CEEW 2020) Pradhan Mantri Ujjwala Yojana (PMUY) which focuses on tackling the high upfront cost of LPG by providing LPG connections to below poverty line (BPL) households with credit-linked subsidy support has played an instrumental role in increasing the penetration of LPG across the country As of November 2019 about 965 per cent of households in India have an LPG connection (PPAC 2019) Small towns and cities which have been experiencing a comparatively slow rate of urban growth but the high percentage of slum population mall towns and cities which have been experiencing a relatively slow rate of urban growth but a high percentage of slum population
However the dramatic increase in LPG coverage has led to increased fuel stacking (Cheng and Urpelainen 2014) The reliance on fuel stacking has significant implications as the health benefits of using clean fuels are reduced or perhaps even nullified in households that continue to use biomass (Cheng and Urpelainen 2014) Urban slums suffer from a double burden of pollution as they are exposed to high ambient particulate matter pollution in cities along with the household air pollution (HAP) from using unclean cooking fuels (WHO 2014) The Global Burden of Disease study notes that even with the substantial increase in the provision of clean cooking fuels in India more than half of Indiarsquos population is exposed to HAP from solid cooking fuels as of 2017 (Balakrishnan et al 2019) In the current context this is concerning since exposure to air pollution has been linked to developing lower respiratory infections and chronic obstructive pulmonary disease (Balakrishnan et al 2019) which are among the major risk factors for COVID-19 (Lippi and Henry 2020 Wang et al 2020)
11 Motivation and methodology While there have been various studies on energy access in rural areas there is minimal data on energy use and patterns in urban slum households Most studies on urban slums and energy access focus on specific slums in large metropolitan areas such as Delhi and Bangalore (Saksena et al 2003 Dhingra et al 2008 Roy et al 2018) Living conditions and access to resources vary across slums in smaller towns and cities compared to those in Tier I
Slum-dwellers suffer from the double burden of pollution as they are exposed to high ambient particulate matter in cities along with the HAP from using unclean cooking fuels
2 A summary measure that identifies where countries or other geographic areas fall on the spectrum of development Expressed on a scale of 0 to 1 SDI is a composite average of the countryrsquos rankings in terms of per capita income average educational attainment and fertility rates
3 These states account for six out of eight of the lowest socio-demographic index (SDI) states and exhibit the highest health impacts of household air pollution (HAP) These states also have the highest percentage of households covered under the flagship clean cooking energy programme in India ndash PMUY
4 Referred to as lsquoour surveyrsquo thereafter
5 In our sample about 82 per cent of households are from notified slums
6 About 98 per cent of the respondents were female members of the household
7 For further details on the survey sample and methodology refer to the technical document for the survey
3Introduction state of Indiarsquos urban slums
Table 1 Sample allocation across urban slums
Source Authorsrsquo compilation
Note The number of slums sampled within each state varied because the slums were picked from the same districts that were sampled under the India Residential Energy Survey (2020) across the six states This was done to ensure logistical ease in conducting both the surveys and to share the resources of the national-level survey The list of urban slums as per the Census 2011 in the districts sampled under IRES 2020 constitutes the urban sampling frame7
State Districts sampled Urban slums sampled Households surveyed
16
14
10
10
4
4
58
31
15
16
12
5
4
83
249
124
128
94
40
32
667
Uttar Pradesh
Bihar
Madhya Pradesh
Rajasthan
Jharkhand
Chhattisgarh
cities these towns have been experiencing a comparatively slow rate of urban growth but are home to large slum populations (Rahaman and Das 2017) Further existing sources on access to clean cooking energy among slum households are limited to primary fuel use and lack detailed information about fuel use and stacking patterns
In India states with the lowest socio-demographic index (SDI)2 also account for the highest level of disease burden due to air pollution (Balakrishnan et al 2019) The low SDI states in north India had some of the highest levels of ambient particulate matter and household air pollution ndash especially Bihar Uttar Pradesh Rajasthan and Jharkhand The disability-adjusted life year (DALY) rate attributable to HAP was highest in the low SDI states of Chhattisgarh Rajasthan and Madhya Pradesh (Balakrishnan et al 2019)
The findings of this brief are based on a primary survey conducted across rural areas and urban slums in six energy access deprived states in India ndash Bihar Jharkhand Uttar Pradesh Rajasthan Madhya Pradesh and Chhattisgarh3 The Cooking Energy Access Survey 20204 focused on householdrsquos clean cooking energy access and its barriers and drivers in rural areas and urban slums Based on the list of urban slums across districts in Census 2011 the survey covered 656 households across 83 urban slums (notified and non-notified)5 spread across 58 districts The survey was conducted with the primary cook of the household6
In this brief we focus on understanding access to clean cooking energy specifically across urban slum households The analysis focuses on the fuel use patterns of households the extent of use of LPG and solid fuels fuel stacking behaviour and the primary cookrsquos perception of various cooking fuels and their impact on health The results discussed below are representative of the urban slum population in six states We have refrained from state-level analysis because of the smaller sample size for urban slums in some states like Jharkhand and Chhattisgarh
Are Indiarsquos Urban Poor Using Clean Cooking Fuels Insights from Slums in Six States4
12 Socio-economic characteristics of the urban slums of the six states Non-farm casual labour is the primary source of income for more than 42 per cent of the households such households reported a median monthly expenditure of about INR 5000 In only 20 per cent of the households the primary cook is involved in income-generating activities primarily engaged in casual non-farm labour or are self-employed
Source Authorsrsquo analysis
60 households have a monthly income below
INR 10000
In 90 households all members have
Aadhar cards
94 households have a bank account
11 households are currently indebted
Median savings in the past year
INR 4000
Median monthly expenditure
INR 6000
MEDIAN HOUSEHOLD SIZE
6
5
Table 2 Less than one-third of urban slum households reported income from salaried jobs
Source Authorsrsquo analysis
Under self-employment some of the householdsrsquo report occupations like carpentry tailoring driver and priest
The primary source of income of urban slum households
Non-farmdaily wage casual labour
Private or government salaried job
Shop or own business or self-employed
Farm labour
Agriculture on own or leased land
Others (pension remittances cattle rearing none)
43
22
18
8
7
2
Scheduled Castes (SC) (30 per cent) and Other Backward Castes (OBC) (45 per cent) form the majority of the urban slum population While Scheduled Tribes (ST) constitute less than 10 per cent of the overall population a majority of them are in Madhya Pradesh and Rajasthan Less than 20 per cent of the urban slum population are from the General castes States like Bihar Jharkhand and Rajasthan have the least proportion of General castes living in slum areas
Within urban slum households OBC and General households are relatively better off economically as shown in Table 3 Occupational patterns also vary based on caste A higher proportion of OBCs and General households rely on running a business self-employment or salaried jobs for their primary source of income as compared to SC and ST households The latter are primarily engaged in farm and non-farm labour The socio-economic marginality of SCs and STs even within slums is a consequence of these communities being most deprived in terms of access to resources and education income housing etc (Chandrasekhar and Mitra 2018) We see a similar trend in our sample in education and income levels Slums often remain the permanent habitation of marginalised castes as opposed to serving as an entry point for persons from higher castes who get absorbed into relatively better jobs and eventually move out of the slums (Chandrasekhar and Mitra 2018)
Table 3 Scheduled Castes and Scheduled Tribes have the lowest economic status
Source Authorsrsquo analysis
We utilise an economic status or asset index as a measure of a householdrsquos relative wealth and economic status based on the Filmer and Pritchett (2001) approach The list of variables included in the economic status index can be found in Annexure I The index takes values between 0 and 10 where a higher value denotes a higher level of asset ownership
Caste Sample size
Mean of asset index
(Min ndash Max) of BPL cardholders
233
51
281
92
042
039
046
046
(0ndash084)
(008ndash077)
(003ndash1)
(008ndash09)
45
60
49
36
Scheduled Castes
Scheduled Tribes
Other Backward Classes
General
Introduction state of Indiarsquos urban slums
Are Indiarsquos Urban Poor Using Clean Cooking Fuels Insights from Slums in Six States652
Image iStock
Exclusive use of LPG is limited to just over half of the total slum households The householdrsquos economic status and its access to doorstep delivery of LPG refills are two critical factors that determine their ability to use LPG exclusively
7
The fuel use patterns in urban slum households across the six states show a significant improvement in LPG use over the past decade when compared with the data from
Census 2011 The share of households using polluting fuels (including firewood dung cake agriculture residue and kerosene) as their primary fuel has decreased significantly but we find that stacking is a common practice even among households using LPG as a primary fuel Unless they use clean fuels exclusively such slum households will still be exposed to the health risks associated with HAP
Across the six states the primary fuel used for cooking by slum households
For the analysis in this brief we have categorised the households into three based on their fuel choices and position on the energy ladder those that exclusively use clean cooking fuels (LPG and electricity) stack LPG with polluting fuels and use only polluting fuels The level of exposure to emissions from cooking increases from the first (least harmful) to the third category (most harmful)
2 Cooking fuel adoption and use in urban slum households
In this brief the use of clean cooking fuels is considered synonymous to use of LPG since other clean fuels comprise a negligible share of use
Source Authorsrsquo analysis
Households using clean fuel exclusivelyWhile the majority of these households use LPG two per cent of the households reported using electricity for cooking purposes
Households stacking LPG with polluting fuelsMost of these households reported using LPG as their primary fuel and polluting fuels as their secondary fuel About four per cent of slum households reported using polluting fuels as their primary fuel and LPG as their secondary fuel
Households using only polluting fuelsThese households only use firewood charcoal dung
agricultural residue kerosene or a stack of these fuels
5533
12
Fuel-use categories
Use of LPG as primary fuel
82 (Cooking Energy Access Survey 2020)
47 (Census 2011)
Polluting fuel as primary fuel
16 (Cooking Energy Access Survey 2020)
52 (Census 2011)
Are Indiarsquos Urban Poor Using Clean Cooking Fuels Insights from Slums in Six States8
In the following sections we explore factors such as socio-economic characteristics affordability and availability of fuel intra-household gender dynamics and fuel perceptions which influence the ability and likelihood of a household to use different fuels
21 Households using LPG as their only fuel In this section we focus on understanding the household characteristics and fuel use patterns of those using LPG exclusively for cooking Most urban slum households with an LPG connection report using LPG as their primary fuel While 55 per cent of the slum households (63 per cent of LPG-using households) use LPG exclusively others stack LPG with polluting fuels Uttar Pradesh has the highest
proportion (70 per cent) of slum households who are exclusive users of clean cooking fuels among the six states
Figure 1 Within slums there are considerable state-level variations in householdsrsquo fuel usage patterns across states
Source Authorsrsquo analysis
Note We have refrained from state-level analysis because of the smaller sample size for urban slums in states like Jharkhand and Chhattisgarh
Figure 2 While the majority of LPG-using households use the fuel primarily only half of them use it exclusively
Source Authorsrsquo analysis
0
0
10
10
20
20
30
30
40
40
50
50
60
60
70
70
80
80
90
90
100
100
8682
55
Bihar
LPG users
Chhattisgarh Jharkhand Madhya Pradesh
LPG as the primary fuel LPG as the exclusive fuel
Rajasthan Uttar Pradesh
States
Per
cent
age
of h
ouse
hold
s P
erce
ntag
e of
hou
seho
lds
Exclusive clean fuel users Stacking LPG with polluting fuels Only polluting fuel users
42
3
30
56
45
39
1611
40
4944
46
10 5
24
71
41
28
9Cooking fuel adoption and use in urban slum households
Over a fifth of households using LPG exclusively are PMUY households which suggests that these households have been able to transition to clean cooking fuels in less than four years PMUY households using LPG exclusively are of a relatively higher economic status than households that stack polluting fuels Unlike in rural areas the age of an LPG connection does not have a direct correlation with per capita LPG consumption in urban slum households suggesting that even households with recent LPG connections in urban slums are likely to use LPG exclusively Households in urban areas have been known to experience a direct transition to exclusive use of clean fuels from using traditional fuels (Kuo and Azam 2019) This could be due to the time-saving that comes with the adoption of clean cooking fuels like LPG ndash where urban households are more willing or need to spend more on convenience than rural households
Figure 3 Most households using LPG exclusively acquire six to eight cylinders per year
Source Authorsrsquo analysis
211 The economic status of the household determines exclusive LPG useA simple logistic regression (Annexure II) shows that households with higher asset ownership have significantly higher odds of using LPG as an exclusive fuel Even between primary and exclusive users of LPG asset ownership remains a significant differentiating factor This corroborates the findings of previous studies (Ranjan and Singh 2017) that state that households tend to switch their cooking fuel use patterns after a threshold level of income is achieved However this is not to suggest that all wealthy households shift to exclusive use of clean fuels We discuss the reasons for stacking among these households in the next section
Cooking energy in the household budget We find that households using LPG as their only fuel pay INR 496 per month8 This effectively translates to an average household spending almost eight per cent of their monthly expenses on cooking fuel
Oil and Marketing Companies (OMCs) are attempting to address the challenges around the recurring refilling
cost by encouraging low-income households to use a 5 kilograms (kg) cylinder to overcome the high upfront cost
associated with 145kg cylinders In our sample we find that only about two per cent of urban slum households use
small cylinders (5kg or 3kg)
BOX 2 Uptake of small cylinders
8 This is based on the upfront cost paid by the household for an LPG refill Given that only 40 per cent of the householdsrsquo report receiving LPG subsidy on refills ndash it has not been considered in the fuel expenditure calculation The share of fuel expenditure for the households receiving LPG subsidies would be accordingly less than the others
0
10
20
30
40
50
60
70
1
1 16 8 9
22
60
4350 50
14
34
15
2 3 4 5 6 7 8 9 10 11 12 13
Number of 14 kg LPG cylinder refills obtained by exclusive LPG users
Per
cent
age
of h
ouse
hold
s us
ing
LP
G e
xclu
sive
ly
households using LPG exclusively Median value
Are Indiarsquos Urban Poor Using Clean Cooking Fuels Insights from Slums in Six States
212 Home delivery for exclusive LPG users We find that households who receive doorstep delivery of LPG refills have higher odds of using LPG as their exclusive fuel Hassle-free doorstep delivery of LPG refills is known to influence the use of LPG as a primary secondary or exclusive fuel (PPAC-CRISIL 2016)
Additional expense on procurement of cylinders Almost half of the households who receive doorstep delivery of LPG pay an additional amount of INR 20 as a delivery charge However in households that do not receive doorstep delivery about 46 per cent report that one member must forgo their daily wages to procure the cylinder Most of such households depend on daily labour or private jobs for their income
Given that almost half of the households report having to forgo wages to procure the cylinders it could affect the householdrsquos ability to use LPG continually It may add to the average delay in the purchase of refills
Procurement of LPG cylinders during the COVID-19 pandemic Most households that do not receive doorstep delivery of LPG (58 per cent) use private vehicles (including motorcycles or bicycles) to transport LPG refills About one-third of the households procuring cylinders on their own use rented or shared vehicles The procurement constraints faced by these households would be further aggravated during the COVID-19 pandemic as using rented or shared vehicles comes with its own risks
10
About 18 per cent of the respondents in our survey reported that they resided in non-notified slums Such slums are not legally recognised as a lsquoslumrsquo by the government which makes the residents more vulnerable to eviction In our data we find that adoption and use of LPG is similar across households from notified and non-notified slums Qualitative interviews and field visits showed that most of the respondents were permanent residents of the slums who have been living there for more than 10 years
About 2 per cent of urban slum households use electricity as a source for cooking energy These households do not rely on any other fuels for cooking or non-cooking purposes They use electric stoves to prepare all meals including cooking roti rice and vegetables These households have been using electricity as their cooking fuel only in the past five years Most households report using either a coiled stove or induction stove Less than one per cent of households use other electric appliances such as hot water kettles and toasters for cooking needs
BOX 3
BOX 4
Status of slums impacting the fuel-use pattern
Electricity for cooking
77
households receiving doorstep delivery of LPG cylinders are exclusive users of the fuel
63LPG-using households receive doorstep delivery of cylinders
Male members have to travel to procure the cylinders in 87 households
11Cooking fuel adoption and use in urban slum households
About 4 per cent of urban slum households in the sample reported stacking with kerosene as their secondary fuel Most of these households are in Uttar Pradesh These households also use kerosene more than once a week for cooking
BOX 5 Use of kerosene as a cooking fuel
22 Households stacking LPG with polluting fuels Across the six states almost half of the households (45 per cent) reported using polluting fuels Here we discuss the characteristics and fuel use patterns of households that stack clean and unclean fuels
Though 86 per cent of the households surveyed have an LPG connection we find that over a third (33 per cent) of them stack it with polluting fuels (including firewood dung cakes agriculture residue charcoal and kerosene) The increased stacking could also be a result of more households adopting LPG since households tend to not replace biomass-based fuels completely (Cheng and Urpelainen 2014) These households would need to transition to exclusive use of clean cooking fuels to reduce the health impacts on women and children from household air pollution
About 44 per cent of the households that are stacking fuels rely on informal sources for refills Such households have not ordered any refills in the past one year from their LPG distributors These households mainly rely on recurring cylinders from their neighbours or relatives9
Figure 4 Of the households that stack fuels most use LPG as their primary fuel
Source Authorsrsquo analysis
9 It is important to note that sharing LPG cylinders among neighbours and extended family is a regular phenomenon in small towns and rural areas owing to availability challenges and it is not necessarily driven by an intention to siphon off subsidy amounts against the commodity ( Jain et al 2018)
Exclusive clean fuel users
Stacking with LPG as the primary fuel
Only polluting fuel users
Stacking LPG with polluting fuels
Stacking with LPG as the secondary fuel
55
3388
12
12
Are Indiarsquos Urban Poor Using Clean Cooking Fuels Insights from Slums in Six States12
221 Household factors that determine the decision to stack fuels Even within the stacking households the reason for stacking multiple fuels varies significantly Primarily households who stack can be divided into two categories ndash those that stack as they cannot afford LPG refills and those that stack due to other factors like taste preferences and alternate end-uses of the fuel
Households who are stacking primarily due to affordability concerns ndash Across asset quintiles we find that stacking is most common among the middle categories (second and third quintile) where most have adopted LPG Still the affordability of the fuel remains a significant concern More than 60 per cent of the households that are stacking fuels collect or prepare firewood or dung cakes free of cost rather than purchasing them from the market Those who buy biomass do not spend more than INR 100 per month on it Based on the responses of the primary cook we note that the high cost of LPG and free-of-cost availability of solid fuels are the most common factors that affect the fuel choices made by the household
Figure 5 Stacking is prevalent in households across asset quintile categories
Source Authorsrsquo analysis
1 2 3 4 5
Asset quintile categories
0
20
40
60
80
100
Per
cent
age
of h
ouse
hold
s
Exclusive clean fuel users Stacking LPG with polluting fuels Only polluting fuel users
5348
52
6367
2441 37
3232
2311 11
51
Households who use LPG primarily and polluting fuels as secondary fuels have a median annual refill rate of
6 cylinders
Households who use polluting fuels primarily and LPG as a secondary fuel have a median annual refill rate of
4 cylinders
13
Households that are stacking for reasons beyond affordability ndash More than one-fourth of the households that are stacking have a median annual refill rate of eight cylinders and above despite having a similar household size as others Most such households fall in the highest asset quintiles This suggests that they are not necessarily using unclean fuels due to the unaffordability of LPG but due to other factors such as taste preference for chulhas and fuel end-uses that influence the householdrsquos decision to use solidpolluting fuels Such households reported using LPG for a median period of six years The solid fuels are primarily used for cooking chapatis or vegetables in these households
Interestingly even households with multiple LPG connections and two cylinder connections report stacking with polluting fuels The possession of multiple LPG connections in these households may not necessarily be an indicator of diversion mdash the average family size of these households is more than eight indicating the high possibility of having separate kitchens within the same household Given that such households have a median annual refill rate of ten cylinders another plausible reason for multiple connections is that it prevents them from relying on just one distributor which increases their chances of getting refills whenever needed
222 End-uses of polluting fuels Across both the groups discussed above half of the households who stack with polluting fuels use these fuels at least once a day (Figure 6) Also almost 45 per cent of the households that stack fuels use multiple stoves at the same time while preparing a single meal This indicates that even if the household is using LPG for a particular meal they would be using their chulha simultaneously
Despite using LPG as the primary fuel for their cooking needs households that are stacking fuels use polluting fuels for non-cooking purposes like heating water for bathing (29 per cent) and space heating (10 per cent)
Figure 6 Almost half of the households using polluting fuels use it every day
Source Authorsrsquo analysis
0 5 10 15 20
19
11
21
20
29
25 30 35
Percentage of households
Freq
uenc
y of
use
of p
ollu
ting
fuel
s Several times a day
Once per day
Few times a week
Once a week
Occasionally
21 households stacking fuels
have more than one LPG connections
25 households stacking fuels have two-cylinder connections
Cooking fuel adoption and use in urban slum households
Are Indiarsquos Urban Poor Using Clean Cooking Fuels Insights from Slums in Six States14
223 Seasonal variations in the stacking of fuels We also noted a significant seasonal change in fuel use patterns LPG is most popular in the rainy season (88 per cent) and least popular in the winter months (45 per cent) (Figure 7) The dampness associated with solid fuels in the rainy season could be the reason for using LPG primarily during these months The literature also suggests that solid fuels are a popular choice during winter months (S Singh 2014 Baqir et al 2019) This could be because during winter months the solid fuel requirement for non-cooking tasks within the household likes water heating for bathing and space heating increases Since households are already using solid fuels for non-cooking tasks they may be using these fuels more for cooking during winter Unfortunately the increased use of solid fuels in winter exacerbates the much higher air pollution exposure of these households due to unfavourable atmospheric conditions
Figure 7 Proportion of urban slum households using solid fuels as the primary cooking fuel increases during the winters months aggravating household air pollution exposure due to unfavourable atmospheric conditions
Source Authorsrsquo analysis
About 3 per cent of urban slum households reported owning an electric water-heating device (geyser or immersion
rod) Similarly only 4 per cent of the households own an electric room heater
BOX 6 Electric devices for water heating and space heating
Summer Winter Rainy Festival0
20
40
60
80
100
120
Per
cent
age
of h
ouse
hold
s
LPG Solid fuel
78
45
88
67
22
55
1233
15
Figure 8 Lack of awareness about receiving LPG refill subsidies poses a threat to the success of LPG subsidy schemes
Source Authorsrsquo analysis
Connections under the Pradhan Mantri Ujjwala Yojana (PMUY) 23 per cent of these households reported receiving benefits under the PMUY
The six states included in the survey account for a significant share of PMUY coverage ndash 54 per cent of all connections provided under PMUY (PPAC 2019) However most of these connections cater to rural households One of the reasons for there being fewer PMUY connections in urban areas is that more than half of all urban slum households reported already having had LPG connections for over four years (before the launch of PMUY) Moreover over a quarter of PMUY households10 in urban slums reported having multiple LPG connections which suggests that not every household which was using LPG before the PMUY was prevented from accessing the schemersquos benefits
Government support during the COVID-19 pandemic During the COVID-19 lockdown the government announced the provision of three free-of-cost refills for PMUY households under the PM-Garib Kalyan Yojana While PMUY households in urban slums benefitted from this scheme non-PMUY households in urban slums did not As documented urban slum households faced a significant economic hit due to the loss of jobs and incomes during the pandemic (Patel 2020) Non-PMUY households that stack for economic reasons are more likely to use cheaper and freely available solid fuels without additional support from the government
PAHAL-Direct Benefit Transfer for LPG (DBTL)Overall about 42 per cent of active LPG users11 reported receiving a subsidy for their last LPG refill under the Direct Benefit Transfer for LPG scheme (DBTL) However about 28 per cent of urban slum households reported not knowing if they had received the subsidy amount for their last refill this suggests that the primary cook is often unaware of whether the subsidy is credited to the household Among the ones that reported receiving the LPG subsidy about 40 per cent of the primary cook were not aware of the amount of subsidy being credited into their account
10 This is a relatively smaller sample of 43 households from all the PMUY households in urban slums (131 households)
11 Households that have taken at least one refill in the past year
42
30
28
Received LPG refill subsidy
30 Still repaying PMUY loan
Did not receive LPG refill subsidy
10 Gave up LPG refill subsidy
Do not know
60 LPG refill susbsidy not received due to other reasons
Cooking fuel adoption and use in urban slum households
Are Indiarsquos Urban Poor Using Clean Cooking Fuels Insights from Slums in Six States16
23 Households using only polluting fuels About 12 per cent of urban slum households rely entirely on polluting fuels for all cooking and non-cooking purposes While the share of these households is relatively small the non-adoption of LPG in such households despite
programmes like the PMUY is concerning These households either use a combination of different polluting fuels (firewood dung cakes agricultural residue charcoal and kerosene) or just one of these fuels for all their energy needs Firewood is the most commonly used fuel in these households
231 Reasons for the non-adoption of LPGHouseholds that rely exclusively on polluting fuels reported not having an LPG connection Though three-fourths of these households were aware of PMUY the high upfront cost of an LPG connection along with the high recurring cost of procuring refills remain the two most important reasons for not procuring an LPG connection Repondents also mentioned a lack of information on how to procure a connection as a reason These reasons align with the common causes cited by rural households covered in the survey implying that the challenges faced by rural households and urban slum households in procuring connections are similar
Almost half of the households in this category use solid fuels for non-cooking purposes such as heating water for bathing space heating and preparing fodder for animals On the positive aspects of using polluting fuels households reported the following free-of-cost easy availability of fuels better tasting food and preference of family members for food cooked on the chulha
232 Fuel availability and affordabilityIn contrast with households that stack fuels households that use only solid fuels rely on purchasing fuels rather than collecting or preparing them For instance 60 per cent of firewood users in this category procure fuel by purchasing rather than collecting it
Households with low asset ownership rely on polluting fuels for cooking These households spend 2ndash3 per cent of their median monthly expenditure on fuel (INR 75 per month on fuel) which is much lower than what they would have to spend if they used LPG exclusively (INR 496 per month) Households that collect solid fuels spend about two hours on a single trip (three times a month) travelling a median one-way distance of 2 km This is equivalent to the distance travelled to procure LPG cylinders (if not delivered at home)
Figure 9 More than half of the households currently without LPG do not know how to get a connection or whom to ask about it implying a lack of awareness
Source Authorsrsquo analysis
0 10 20 30 40 50 60 70
39
53
63
68
80
Percentage of households
Rea
sons
for N
on-A
dop
tion
of L
PG Installation is expensive
Monthly expenditure on LPG is high
Do not know how to get or whom to ask
Not availabletoo far
17
12 See Annexure III for details on the districts and their PM25 concentrations The data for 15 districts (from Bihar Uttar Pradesh Madhya Pradesh and Rajasthan) overlapping with the survey sample have been analysed based on the availability of air quality data from continuous monitoring stations
13 Air quality categories based on PM25 concentration (in μgm3)
Good 0 to 30 Satisfactory 31 to 60 Moderately polluted 61 to 90 Poor 91 to 120 Very poor 121 to 250 Severe above 250 (Central Pollution Control Board 2014)
Cooking fuel adoption and use in urban slum households
Winter months have the highest PM25 concentrations coinciding with the sharp increase in use of polluting fuels for heating bath water and room heating
233 Gendered time use in households using solid fuelsIn urban slums both the male and female members of the household are equally involved in collecting firewood Still it is primarily the female members of the household who undertake dung cake preparation In addition to engaging in fuel collection and preparation women tend to spend more time cooking in households using solid fuels About 85 per cent of households that transitioned to LPG in the past four years reported having saved time while cooking compared to when they used solid fuels
SPOTLIGHT I Household air pollution (HAP) in urban slums
Burning solid fuels in three-stone fires and mud stoves with inadequate ventilation causes high levels of smoke exposure and negative health impacts particularly for women and young children (WHO 2014)
The double burden of ambient and household air pollution on the urban slum populationUsing the PM25 data from continuous ambient air quality monitoring stations (CAAQMS) for 15 districts12 in our sample we found that the ambient air quality remained in the lsquopoorrsquo or worse category13 for most districts throughout the year variation in the ambient air quality
Are Indiarsquos Urban Poor Using Clean Cooking Fuels Insights from Slums in Six States
Impact of ventilation
Indoor cooking and low adoption of chimney indicates high exposure to pollution from the use of unclean fuels for cooking The proportion of households with a chimney is high (52 per cent) among those who rely only on polluting fuels Smith and Pillarisetti (2017) explain that while having a good chimney lowers peak levels of indoor pollution long-term average exposure is reduced only by a factor of two Besides chimneys require regular maintenance to function correctly While more than 45 per cent of the households are using polluting fuels less than 20 per cent of the slum housheolds use improved cookstoves
Households also use solid fuels for non-cooking uses like space heating On average each house in a slum has two rooms this effectively exposes all members of the household to emissions from burning fuels Emissions from household sources contribute significantly to the surrounding air quality (Harish et al 2019) this concern is exacerbated in congested slum areas
the winter months (November to February) have the highest concentration of PM25 This leads to a double burden of exposure for slum households stacking solid fuels as they are more likely to increase use of solid fuels in winters (Figure 7) Alternatively the use of LPG as the primary source of fuel increases during the rainy season (June to September) these months record the least ambient air pollution
We also find that districts like Meerut Ghaziabad Patna Gautam Buddha Nagar (Noida and Greater Noida) and Muzaffarpur have the highest frequency of lsquovery poorrsquo air quality days throughout the year Across these districts one-third of households use polluting fuels for cooking In urban slums where households are more densely packed the emissions from burning solid fuels increase the risk of exposure inside households and deteriorate the ambient air quality for the community at large As a result these communities suffer from both increased household and ambient air pollution HAP has an estimated average contribution of 30ndash50 per cent to ambient air quality across Indiarsquos urban and rural areas (Balakrishnan et al 2019) Addressing biomass burning for cooking water heating and space heating during the winters has the potential to help reach the national ambient air quality standards (Chowdhury et al 2019) Despite that only 2 per cent of the action points in 44 city clean air plans mention cooking and heating as a sector to address air pollution (Ganguly Selvaraj and Guttikunda 2020)
18
75 householdsrsquo
using polluting fuels cook inside
the main house
67 householdsrsquo using polluting fuels do not have a chimney for ventilation
Awareness about the health impacts of using polluting fuelsAbout 60 per cent of households using only polluting fuels and 84 per cent of households that stack LPG with a polluting fuel report lsquotoo smokyrsquo as the most prominent negative aspect of using polluting fuels This suggests that as more households switch to clean cooking fuels perceptions regarding pollution fuels change
Three-fourths of primary cooks who use polluting fuels for cooking agree that smoke from solid fuels is harmful to them this implies that awareness of the adverse health impacts of polluting fuels does not necessarily lead to the uptake of clean fuels Primary cooks also agree that smoke from solid fuels causes coughing (49 per cent) and lung infections in children (39 per cent)
Exposure to air pollution is a known risk factor for underlying chronic diseases that predict the severity of
COVID-19 disease and patient outcomes (World Bank 2020) This linkage suggests a heightened risk for women
in all age groups who cook using traditional technologies and fuels (World Bank 2020) The highest number of
COVID-19 cases were recorded in the most polluted regions among patients with pre-existing health conditions
(Frontera et al 2020)
Results from a controlled study show a higher prevalence of chronic obstructive pulmonary disease (COPD)
among biomass fuel users than clean fuel users ( Johnson et al 2011) The available clinical data to date suggest
that cardiovascular disease diabetes chronic respiratory illness and hypertension ndash conditions all strongly
associated with exposure to HAP ndash are also risk factors for COVID-19 (World Bank 2020)
BOX 7 Impact of household air pollution on COVID-19
19Cooking fuel adoption and use in urban slum households
Are Indiarsquos Urban Poor Using Clean Cooking Fuels Insights from Slums in Six States
Traditionally women bear a disproportionate burden in collecting and preparing biomass for cooking While this burden reduces with the use of clean cooking fuels like LPG the fuel supply within the household is then determined by formal and monetised distribution networks involving an outlay of money (Patnaik and Jha 2020) Our data shows that womenrsquos status in the household (as heads of households)14 positively correlates with households using LPG as their primary fuel The existing literature also supports the idea that female-headed households prefer modern fuels to polluting ones (Farsi Filippini and Pachauri 2007 Rao and Reddy 2007 Kuo and Azam 2019) Other research also suggests that female-headed households are more willing to spend on LPG as a recurring expense (Kojima Bacon and Zhou 2011 Kuo and Azam 2019)
SPOTLIGHT II Womenrsquos participation in intra-household decision-making regarding LPG use
20
14 In almost half of the households surveyed the primary cook reported a female member being the head of the household The reason behind such high percentage of female-headed households could be because only the primary cook of every household (who is mostly female) was surveyed This does not mean that these households do not have any adult male members Traditionally headship refers to the head of household as the individual whose lsquoauthorityrsquo the household members recognise But this definition overlooks potential intra-household variations in the recognised authority in different realms of decision-making (Kilic Moylan and Koolwal 2020) Since cooking is a gendered activity the primary cookrsquos response to the head of household question may have been with respect to the recognised authority figure for that activity within the household
30 householdsrsquo female members place the order for LPG refills
50householdsrsquo female
members decide whether or when to purchase LPG refills
We also find that the decision of whether or when to purchase LPG refills is made by male members in half of urban slum households This holds for both male- and female-headed households In LPG-using households where the primary cook is involved in an income-generating activity more women are deciding to order the refills This pattern is similar irrespective of whether the household uses LPG exclusively or stacks it with other polluting fuels or are PMUY beneficiaries
SPOTLIGHT III A comparison of access to clean cooking energy between urban slum and non-slum households across six states
21
At the state level Bihar has significantly poor involvement of women in intra-household decision-making regarding
ordering refills with less than 10 per cent of households reporting that women decide whether or when to order
refills However more women than men are involved in decisions around LPG refills in Rajasthan Madhya Pradesh
and Jharkhand
Across caste groups the involvement of women is lowest (37 per cent) among the Scheduled Castes (SCs)
However more women in General and OBC households decide when to order LPG refills
BOX 8 Variations in intra-household decision-making across states and caste groups
Cooking fuel adoption and use in urban slum households
To compare the fuel use patterns of urban slum and non-slum households we used data from the India Residential Energy Survey (IRES 2020)15 The overlap in the sampling strategies of both IRES and our survey enabled a comparison of the findings There is a significant difference in the socio-economic status of slum and non-slum households which tends to affect their fuel use patterns Table 4 provides a comparison of cooking fuel usage in urban non-slum households (from IRES 2020) and urban slum households (Cooking Energy Access and Use survey 2020)
Are Indiarsquos Urban Poor Using Clean Cooking Fuels Insights from Slums in Six States22
Table 4 The poor economic condition of households in urban slums impacts the exclusive use of clean fuels for cooking
Source Authorsrsquo analysis
Fuel use categories Urban slum households (Cooking Energy Access Survey) ()
Non-slum urban households (IRES) ()
95 88
84 55
9 33
5 12
Clean fuel users (LPG PNG and electricity)
LPG as an exclusive fuel
Households that stack LPG with polluting fuels
Households that use only polluting fuels
We observed a significant gap in the exclusive use of LPG as a cooking fuel between urban slums and non-slum households explained mainly by the difference in their economic conditions Stacking is three times more common in slum households than non-slum households About 45 per cent of non-slum households using polluting fuels belong to marginalised social groups (SCs and STs) Households using polluting fuels have a lower median monthly expenditure than others and about 62 per cent of such households are semi-pucca or kuchha structures Among LPG users non-slum households have a slightly higher rate of doorstep delivery as compared to slum households
LPG-using households receiving home deliveries
Source Authorsrsquo analysis
239
6372
Urban slum households (Cooking Energy Access and Use)
()
Non-slum urban households (IRES)
()
Proportion of PMUY beneficiaries among LPG-using households
15 IRES 2020 was conducted in 21 large states of India including Bihar Jharkhand Rajasthan Madhya Pradesh Uttar Pradesh and Chhattisgarh While IRES 2020 focused on urban households the Cooking Energy Access and Use survey specifically attended to urban slums in the same districts Refer to the technical note for a detailed methodology of the survey
23
3 Way forward
Slums across the world are chronically ignored in public policy and suffer because of unauthorised and unsafe habitation without access to government services (Shahadat
Lipu and Bhuiyan 2014) In terms of energy access while we see a progressive change in householdsrsquo energy use patterns as we move from rural to urban issues like affordability availability preference and familiarity with the fuel and stove remain essential factors that determine householdsrsquo fuel choice
Image iStock
Are Indiarsquos Urban Poor Using Clean Cooking Fuels Insights from Slums in Six States24
Understanding categories of users is important for enabling access to and use of clean cooking fuels
We categorised the urban slum population based on their fuel usage patterns ndash using only clean fuels stacking clean fuels with polluting fuels and using only polluting fuels While most households in urban slums have an LPG connection only half of them use LPG exclusively The householdrsquos economic status and its access to doorstep delivery of LPG refills are two crucial factors that determine its ability to use LPG exclusively Despite being situated in urban areas 37 per cent of slum households do not receive home delivery of cylinders ndash availability is an essential factor in determining the householdrsquos likelihood of using LPG exclusively There is a strong impetus for the OMCs and distributors to improve their home delivery services of LPG refills in slum areas
Stacking is prevalent in about one-third of households ndash there is a need for a deeper understanding of householdsrsquo preferences fuel end-uses and awareness Most households reported using polluting fuels daily or at least weekly this effectively increases their exposure to household air pollution despite having access to clean cooking fuels Among households that stack LPG with polluting fuels the reasons for stacking differ ndash affordability seasonality and taste preference More than a quarter of households that stack have a similar level of LPG consumption as those that use LPG exclusively despite similar family sizes Such households use polluting fuels not because of their inability to afford LPG But other factors like free-of-cost availability of biomass taste preference for chulha and alternate end-uses of fuelmdashfor instance in space heatingmdashinfluence the householdrsquos decision to use solid fuels Among households that stack multiple fuels the use of polluting fuels increases during winter months this exposes the households to a double burden of high ambient and household air pollution in these months About 40 per cent of these households also use polluting fuels for non-cooking purposes like heating water for bathing and space heating especially in winter
Even with large-scale government initiatives like PMUY we find that more than 10 per cent of urban slum households do not use LPG They mainly rely on free-of-cost biomass for their cooking and non-cooking needs Despite awareness of PMUY among these households the high upfront cost of procuring an LPG connection and high recurring expenditure on refills deter them from using LPG Evidently there is a need to expand the reach of PMUY to cover households across slums
Integrating the issue of lack of access to clean cooking energy within the discussion on urban poverty
This study reiterates the need to look at poverty in urban areas in the context of energy access Given the heterogeneity of poverty in urban and semi-urban India it is essential to understand energy poverty in the context of access to resources for an enhanced quality of life for the urban poor Similarly slums dwellers in large and small cities alike may experience additional challenges of access Furthermore not all urban poor live in slums we know even less about the access issues of temporary residents or seasonal migrants in urban India Therefore in a rapidly urbanising India studies on the urban poor and air quality need to integrate a focus on energy access to address the vulnerability of women children and communities to HAP and the drudgery of using polluting fuels for cooking and other household energy needs
Access to clean cooking energy schemes must be integrated into the social assistance programmes focused on urban poverty alleviation to enhance its reach
25Way forward
Converging energy access in social protection policies for the urban poor
Accounting for the vulnerabilities of the urban poor is crucial in designing and implementing policies including social protection schemes As a health and economic imperative access to clean cooking energy schemes must be integrated into the social assistance programmes of other ministries (eg health education and nutrition assistance) to offer better support to slum households This would also reduce the burden on households of claiming and accessing multiple benefits across schemes thus freeing them to invest more time in productive activities (CEEW 2020) Government programmes such as the National Urban Livelihoods Mission and social service allocations for housing should use existing targeting approaches to include access to clean cooking energy within the ambit of services for the poor
Bringing a renewed emphasis on clean cooking energy access due to COVID-19 is essential
Most households in urban slums rely on daily wage labour or the gig economy for their household income During the COVID-19 pandemic these occupations have been among the worst impacted by the lockdown and the economic slowdown A survey conducted with over 2000 daily wage workers in urban slums during the lockdown suggests that only 7 per cent of respondents from this group received pay during the lockdown (Basu 2020) causing a massive shock to their livelihoods and wage earnings This kind of impact pushes households into energy poverty leading to the increased use of free-of-cost biomass and consequently increasing the risk of exposure to emissions from fuel burning While the government has committed to supplying up to three free refills to all PMUY households under PM-Garib Kalyan Yojana less than a quarter of households in urban slums have Ujjwala connections The low share of PMUY households effectively makes the majority of slum households ineligible for relief support given under the PM-Garib Kalyan Yojana during the lockdown There is a need to target vulnerable households ndash beyond PMUY beneficiaries ndash with differential subsidy support for using LPG in a sustained manner
Increased poverty would mean increased use of polluting fuels ndash there is a need for a renewed emphasis on clean cooking energy access during the COVID-19 pandemic as increased use of polluting fuels has health implications (lower respiratory infections and COPD) that increase the risk of COVID-19 infections being more severe
There is a need to target vulnerable households ndash beyond PMUY beneficiaries ndash with differential subsidy support for using LPG in a sustained manner
Are Indiarsquos Urban Poor Using Clean Cooking Fuels Insights from Slums in Six States
Balakrishnan Kalpana Sagnik Dey Tarun Gupta R S Dhaliwal Michael Brauer Aaron J Cohen Jeffrey D Stanaway et al 2019 ldquoThe Impact of Air Pollution on Deaths Disease Burden and Life Expectancy Across the States of India The Global Burden of Disease Study 2017rdquo The Lancet Planetary Health 3 (1) e26ndash39 httpsdoiorg101016S2542-5196(18)30261-4
Baqir M S K Bharti R Kothari and R P Singh 2019 ldquoAssessment of an Energy-efficient Metal Chulha for Solid Biomass Fuel and Evaluation of its Performancerdquo International Journal of Environmental Science and Technology 16 (11) 6773ndash6784 httpsdoiorg101007s13762-018-2028-9
Basu Anika Badyal 2020 ldquoLockdown Survey How The Covid-19 Crisis Has Affected Daily Wage WorkersmdashAIFrdquo American India Foundation June 28 httpsaiforglockdown-survey-how-the-covid-19-crisis-has-affected-daily-wage-workers
Butera F M P Caputo R Adhikari and A Facchini 2016 ldquoThe Challenge of Energy in Informal Settlements A Review of the Literature for Latin America and Africardquo Procedia Engineering 1ndash32 httpswwwenelfoundationorgcontentdamenel-foundtopic-downloadThe challenge of Energy in Informal settlementspdf
CEEW 2020 ldquoEnergy Safety Nets India Case Studyrdquo Vienna Sustainable Energy for All httpswwwceewinpublicationsenergy-safety-nets-india-case-study
Central Pollution Control Board 2014 ldquoNational Air Quality Indexrdquo New Delhi Central Pollution Control Board httpsappcpcbccrcomccr_docsFINAL-REPORT_AQI_pdf
Chafe Z S Mehta and K R Smith 2011 ldquoAmbient Fine Particulate (PM25) Air Pollution Attributable to Household Cooking Fuel in Asiardquo AGUFM A54Bndash03 httpsuiadsabsharvardeduabs2011AGUFMA54B03Cabstract
Chandramouli C 2010 ldquoCensus of India 2011 ndash Circular No 8rdquo New Delhi Ministry of Home Affairs httpscensusindiagovin2011-CircularsCircularsCircular-08pdf
Chandrasekhar S and Arup Mitra 2018 ldquoMigration Caste and Livelihood Evidence from Indian City-slumsrdquo Urban Research amp Practice 12 (2) 156ndash172 httpsdoiorg1010801753506920181426781
Cheng Chao Yo and Johannes Urpelainen 2014 ldquoFuel Stacking in India Changes in the Cooking and Lighting Mix 1987ndash2010rdquo Energy 76 (November) 306ndash317 httpsdoiorg101016jenergy201408023
Chowdhary Sourangsu Sagnik Dey Sarath Guttikunda Ajay Pillarisetti Kirk R Smith and Larry Di Girolamo 2019 ldquoIndian annual ambient air quality standard is achievable by completely mitigating emissions from household sourcesrdquo Proceedings of the National Academy of Sciences 116 (22) 10711-10716 httpsdoiorg101073pnas1900888116
Dhingra Chhavi Shikha Gandhi Akanksha Chaurey and P K Agarwal 2008 ldquoAccess to Clean Energy Services for the Urban and Peri-Urban Poor A Case-study of Delhi Indiardquo Energy for Sustainable Development 12 (4) 49ndash55 httpsdoiorg101016S0973-0826(09)60007-7
Farsi Mehdi Massimo Filippini and Shonali Pachauri 2007 ldquoFuel Choices in Urban Indian Householdsrdquo Environment and Development Economics 12 (6) 757ndash774 httpsdoiorg101017S1355770X07003932
References
26
Frontera Antonio Lorenzo Cianfanelli Konstantinos Vlachos Giovanni Landoni and George Cremona 2020 ldquoSevere Air Pollution Links to Higher Mortality in COVID-19 Patients The lsquoDouble-Hitrsquo Hypothesisrdquo Journal of Infection 81 (2) 255ndash259 httpsdoiorg101016jjinf202005031
Ganguly Tanushree Kurinj L Selvaraj Sarath K Guttikunda 2020 ldquoNational Clean Air Programme (NCAP) for Indian cities Review and outlook of clean air action plansrdquo Atmospheric Environment X Vol 8 httpsdoiorg101016jaeaoa2020100096
GNESD 2008 ldquoClean Energy for the Urban Poor An Urgent Issuerdquo Accessed 25 July 2020 httpswwwgooglecomurlsa=tamprct=jampq=ampesrc=sampsource=webampcd=ampved=2ahUKEwi1hf2ru dntAhUCOisKHQH7BtsQFjAAegQIAxACampurl=http3A2F2Fwwwgnesdorg2F-2Fmedia2FSites2FGNESD2FPublication- pdfs2FSPM_CleanEnergyashx3Fla3Dda26hash3DE4971C585B6798F17954F8B42E073 D9507F42A84ampusg=AOvVaw08kCDgOkTkYc6wRDxzsNyq
Guan Wei-Jie Wen-Hua Liang Yi Zhao Heng-Rui Liang Zi-Sheng Chen Yi-Min Li Xiao-Qing Liu et al 2020 ldquoComorbidity and its Impact on 1590 Patients with COVID-19 in China A Nationwide Analysisrdquo European Respiratory Journal 55 (5) 2000547 httpsdoiorg1011831399300300547-2020
Harish Santosh Kirk R Smith Sourangsu Chowdhury Zoe A Chafe Ajay Pillarisetti Jos Lelieveld Sarath Guttikunda Sagnik Dey and Andrew P Grieshop 2019 ldquoThe Contribution of Household Fuels to Ambient Air Pollution in India A Comparison of Recent Estimates Edited by CcapcOrgInrdquo Collaborative Clean Air Policy Centre May 30 httpsccapcorginpolicy-briefs2019530the-contribution-of-household-fuels-to-ambient-air-pollution-in-india-a-comparison-of-recent-estimates
Jain Abhishek Saurabh Tripathi Sunil Mani Sasmita Patnaik Tauseef Shahidi and Karthik Ganesan 2018 ldquoAccess to Clean Cooking Energy and Electricity Survey of States 2018rdquo New Delhi CEEW httpswwwceewinsitesdefaultfilesCEEW-Access-to-Clean-Cooking-Energy-and-Electricity-11Jan19_0pdf
Johnson Priscilla Kalpana Balakrishnan Padmavathi Ramaswamy Santu Ghosh Muthukumar Sadhasivam Omprakash Abirami Bernard W C Sathiasekaran Kirk R Smith Vijayalakshmi Thanasekaraan and Arcot S Subhashini 2011 ldquoPrevalence of Chronic Obstructive Pulmonary Disease in Rural Women of Tamilnadu Implications for Refining Disease Burden Assessments Attributable to Household Biomass Combustionrdquo Global Health Action 4 (1) 7226 httpsdoiorg103402ghav4i07226
Kilic Talip Heather Moylan and Gayatri Koolwal 2020 ldquoGetting the (Gender-disaggregated) Lay of the Land Impact of Survey Respondent Selection on Measuring Land Ownership and Rightsrdquo Washington DC The World Bank httpsdoiorg1015961813-9450-9151
Kojima Masami Robert Bacon and Xin Zhou 2011 ldquoWho Uses Bottled Gas Evidence from Households in Developing Countriesrdquo The World Bank Sustainable Energy Department Oil Gas and Mining Unit httpelibraryworldbankorgdoibook1015961813-9450-5731
Kuo Ying-Min and Mehtabul Azam 2019 ldquoHousehold Cooking Fuel Choice in India 2004ndash2012 A Panel Multinomial Analysisrdquo IZA Discussion Paper No 12682 httpsssrncomabstract=3468630
Lippi Giuseppe and Brandon Michael Henry 2020 ldquoChronic Obstructive Pulmonary Disease Is Associated with Severe Coronavirus Disease 2019 (COVID-19) COPD and COVID-19rdquo Respiratory Medicine 167 105941 httpsdoiorg101016jrmed2020105941
Ministry of Housing and Urban Affairs 2019 ldquoHandbook of Urban Statisticsrdquo New Delhi Government of India httpmohuagovinpdf5c80e2225a124Handbook of Urban Statistics 2019pdf
Rao M Narasimha and B Sudhakara Reddy 2007 ldquoVariations in Energy Use by Indian Households An Analysis of Micro Level Datardquo Energy 32 (2) 143ndash153 httpsdoiorg101016jenergy200603012
27References
Are Indiarsquos Urban Poor Using Clean Cooking Fuels Insights from Slums in Six States28
National Buildings Organisation 2013 ldquoState of Slums in India a Statistical Compendium 2013rdquo New Delhi Government of India httpnbonicinpdfSlums_in_India_Compendium_English_Versionpdf
National Sample Survey Office 2012 ldquoKey Indicators of Urban Slums in India ndash 69th Roundrdquo New Delhi National Data Bank for Socio-religious Categories httpmospinicinsitesdefaultfilesnational_data_bankndb-rpts-69htm
Nolan Laura B 2015 ldquoSlum Definitions in Urban India Implications for the Measurement of Health Inequalitiesrdquo Population and Development Review 41 (1) 59ndash84 httpsideasrepecorgablapopdevv41y2015i1p59-84html
Nolan Laura B David E Bloom and Ramnath Subbaraman 2018 ldquoLegal Status and Deprivation in Urban Slums Over Two Decadesrdquo HHS Public Access 53 (15) 47ndash55
Patel Amit 2020 ldquoPreventing COVID-19 Amid Public Health and Urban Planning Failures in Slums of Indian Citiesrdquo World Medical amp Health Policy 12 (3) httpsdoiorg101002wmh3351
Patnaik Sasmita and Shaily Jha 2020 ldquoCaste Class and Gender in Determining Access to Energy A Critical Review of LPG Adoption in Indiardquo Energy Research amp Social Science 67 (September) 101530 httpsdoiorg101016jerss2020101530
PPAC-CRISIL 2016 ldquoAssessment Report Primary Survey on Household Cooking Fuel Usage and Willingness to Convert to LPGrdquo New Delhi Petroleum Planning amp Analysis Cell Ministry of Petroleum and Natural Gas Government of India httpswwwppacgovinWriteReadDataReports201710310449342512219PrimarySurveyReportPPACpdf
PPAC 2019 ldquoOil Industry Information at a Glancerdquo New Delhi Ministry of Petroleum and Natural Gas Government of India httpswwwppacgovinWriteReadDataReports201912060336500305462ReadyReckonerNov2019WebVersionpdf
Rahaman Mehebub and Dipendra Nath Das 2017 ldquoNature of Slum Growth in Indian Citiesrdquo Urban India 37 (II) 100ndash116 httpswwwresearchgatenetpublication334051882_Nature_of_Slum_Growth_in_Indian_Citiesread
Rains Emily Anirudh Krishna and Erik Wibbels 2018 ldquoUrbanisation and Indiarsquos Slum Continuum Evidence on the Range of Policy Needs and Scope of Mobilityrdquo London International Growth Centre httpswwwtheigcorgwp-contentuploads201802Rains-et-al_Working-paper_coverpdf
Ranjan Rahul and Sudershan Singh 2017 ldquoEnergy Deprivation of Indian Households Evidence from NSSO Datardquo New Delhi Munich Personal RePEc Archive httpsmpraubuni-muenchende835661MPRA_paper_83566pdf
Roy Debraj Bharath Palavalli Niveditha Menon Robin King Karin Pfeffer Michael Lees and Peter M A Sloot 2018 ldquoSurvey-based Socio-economic Data from Slums in Bangalore Indiardquo Nature Publishing Group 5 1ndash9 httpsdoiorg101038sdata2017200
Saksena Sumeet P B Singh Raj Kumar Prasad Rakesh Prasad Preeti Malhotra Veena Joshi and R S Patil 2003 ldquoExposure of Infants to Outdoor and Indoor Air Pollution in Low-income Urban Areas A Case Study of Delhirdquo Journal of Exposure Science amp Environmental Epidemiology 13 219ndash30 httpsdoiorg101038sjjea7500273
Lipu Molla Shahadat Hossain and Arif Waliullah Bhuiyan 2014 ldquoElectricity Access in Urban Slum Households of Bangladesh A Case of Dhakardquo Journal of Renewable and Sustainable Energy 6 (053112) 1ndash15 httpsdoiorg10106314896697
29
Singh Rozita Xiao Wang Emmanuel Ackom and Juan Reyes 2015 ldquoEnergy Access Realities in Urban Poor Communities of Developing Countries Assessments and Recommendationsrdquo Global Network on Energy for Sustainable Development (GNESD) httpswwwgooglecomurlsa=tamprct=jampq=ampesrc=sampsource=webampcd=ampved=2ahUKEwj5nbqI wdntAhXUTX0KHZE6DboQFjAAegQIAhACampurl=https3A2F2Forbitdtudk2Ffiles2F10635 24942FEnergy_access_realities_v_final_updatedpdfampusg=AOvVaw0xNBAAo0bjLueY9FmoigKF
Singh Santosh 2014 ldquoThe Kaleidoscope of Cooking Understanding Cooking Behaviour and Stove Preferences in Rural Indiardquo New Delhi Deutsche Gesellschaft fuumlr Internationale Zusammenarbeit (GIZ) GmbH httpswwwgizdeendownloadsgiz2014-en-kaleidoscope-of-cooking-indiapdf
Smith Kirk R and Ajay Pillarisetti 2017 ldquoHousehold Air Pollution from Solid Cookfuels and its Effects on Healthrdquo Disease Control Priorities 7 (3) 133ndash52 httpsdoiorg101596978-1-4648-0522-6_ch7
UN-Habitat 2003 ldquoThe Challenge of Slums ndash Global Report on Human Settlements 2003rdquo Location of publishing London UN-Habitat httpsunhabitatorgthe-challenge-of-slums-global-report-on-human-settlements-2003
Wang Bolin Ruobao Li Zhong Lu and Yan Huang 2020 ldquoDoes Comorbidity Increase the Risk of Patients with COVID-19 Evidence from Meta-analysisrdquo Aging 12 (7) 6049ndash6057 httpsdoiorg1018632AGING103000
WHO 2014 ldquoWHO Guidelines for Indoor Air Quality Household Fuel Combustionrdquo WHO Accessed 25 July 2020 httpwwwwhointairpollutionguidelineshousehold-fuel-combustionen
World Bank 2020 ldquoThe State of Modern Energy Cooking Servicesrdquo Washington DC World Bank httpdocuments1worldbankorgcurateden937141600195758792pdfThe-State-of-Access-to-Modern-Energy-Cooking-Servicespdf
Yenneti Komali Yehua Dennis Wei and Wen Chen 2017 ldquoThe Urbanization of Poverty in India Spatio-temporal Disparities in Consumption Expendituresrdquo Geographical Review 107 (2) 360ndash383 httpsdoiorg101111j1931-0846201612167x
References
Are Indiarsquos Urban Poor Using Clean Cooking Fuels Insights from Slums in Six States
Annexure 1 Asset ownership index We used Filmer and Pritchettrsquos (2001) proposed approach to construct an asset ownership index using principal component analysis (PCA) We chose the indicators based on data from the Cooking Energy Access survey 2020 The variables we considered for the index were based on classifications by Caroline Moser and Andrew Felton (2007) and K Harttgen (2013) We computed the asset index using housing characteristics and consumer durables as follows
Variables not included in the asset index
Four types of variables were eliminated
1 Variables (such as grid electricity) that had high usage of greater than 95 per cent
2 Those (such as ownership of laptops or computers air conditioners etc) that had a low usage of less than 5 per cent
3 Variables (like house ownership) that have economically fluctuating values
4 Those that indicated a low correlation of less than 20 per cent variation between the top category (ie first) of the asset quintile and the bottom-most category (ie fifth) of the asset quintile
For ease of interpretation we rescaled this index such that the final index values range between 0 and 10 For this purpose we used a feature scaling (or minndashmax scaling) formula
Xnorm (or (IVx)) = (X ndash Xmin)(Xmax ndash Xmin)
where IVx is the normalised index value Xmin is the initial minimum value (-354) and Xmax is the initial maximum value (461) of the asset ownership index
30
Annexures
bull Crowding16 inside the house bull Toilet ownership and usage bull Source of water bull Number of pucca rooms
bull Ownership of two-wheeler bull Ownership of washing machine bull Ownership of television bull Ownership of refrigerator bull Ownership of cooker
16 A household with more than three members occupying a single room is considered crowded (World Health Organization 2018)
Housing characteristics
Consumer durables
Annexure 2 Explaining the use of LPG as the exclusive fuel (simple logistic regression model)
31Annexures
Dependent variable exclusive LPG use
Education of the primary cook (categorical base category is education beyond the school level)
Education of the household head (categorical base category is education beyond the school level)
State (categorical base category includes households from Rajasthan)
P gt z 95 confidence interval
Odds ratio (SE)
1299 (0112)
0659 (0202)
1399 (0394)
0970 (0038)
0994 (0011)
1003 (0013)
2042 (0508)
1011 (0046)
0782 (0441)
1198 (0608)
1377 (0664)
1345 (0566)
3141 (1103)
1213 (0500)
0309 (0211)
1165 (0565)
1703 (0680)
0002
0174
0233
0446
0583
0839
0004
0812
0663
0722
0507
0482
0001
0639
0086
0753
0182
1097
0361
0806
0898
0973
0977
1254
0924
0259
0443
0535
0589
1578
0541
0081
0450
0779
1540
1203
2428
1048
1016
1029
3327
1106
2361
3240
3545
3070
6251
2720
1181
3014
3723
Asset index
Primary cook involved in income-generating activity
Female-headed households
Household size
Age of household head
Age of primary cook
Doorstep delivery of LPG cylinders
PMUY customer
Primary cook is not educated
Primary cook has a school education
Household head is not educated
Household head has a school education
Uttar Pradesh
Bihar
Chhattisgarh
Jharkhand
Madhya Pradesh
Number of households (n) = 417
Log likelihood = -228777
Prob gt chi2 = 0000
Pseudo R2 = 0126
The dependent variable is a dummy variable where households using LPG exclusively are assigned a value of 1 and all other households are assigned the value of 0
The caste of the household has not been factored into the regression as a separate variable because of its underlying influence on economic status
Source Authorsrsquo analysis
Are Indiarsquos Urban Poor Using Clean Cooking Fuels Insights from Slums in Six States
Annexure 3 Air quality (PM25 concentration in μgm3) across 15 districts based on CAAQMS data
32
Dis
tric
tsM
ar-1
9A
pr-1
9M
ay-1
9Ju
n-19
Jul-1
9A
ug-1
9Se
p-19
Oct
-19
Nov
-19
Dec
-19
Jan-
20Fe
b-20
Mar
-20
794
5
988
5
866
7
-
645
329
2
453
7
388
1
769
1
886
4
661
5
950
9
834
4
-
823
4
611
7
569
9
535
7
-
270
4
589
4
571
5
293
1
705
4
839
2
614
9
970
1
826
8
-
844
9
622
1
597
1
564
0
-
235
3
414
3
619
1
414
3
653
9
834
7
568
8
104
90
739
8
-
894
9
630
9
342
2
450
4
-
476
465
2
474
6
429
2
592
3
566
1
-
674
6
531
4
501
5
568
7
450
8
-
320
3
-
846
506
3
349
5
332
4
369
1
387
2
-
430
4
393
6
353
7
446
2
406
8
335
2
339
1
-
102
9
497
2
261
8
269
1
431
4
294
1
-
351
6
277
3
-
336
5
315
5
248
3
392
8
149
7
144
9
462
3
270
5
331
3
273
4
276
0
106
6
391
7
326
2
-
368
6
625
3
875
2
101
64
521
2
183
1
380
4
556
2
544
1
558
2
102
24
104
33
156
44
128
73
146
62
137
71
109
14
183
70
201
80
896
7
190
1
457
7
581
2
583
5
815
4
135
00
126
41
239
94
208
15
158
51
221
86
121
35
192
46
218
43
848
0
205
2
448
5
509
4
582
0
704
5
177
01
613
1
244
01
215
80
136
87
230
54
964
2
201
52
122
30
725
5
120
6
435
4
454
7
481
2
111
37
147
45
537
3
175
53
162
86
111
21
170
08
583
8
132
10
866
2
513
1
112
5
511
3
507
5
511
8
879
4
120
22
502
1
135
53
116
39
994
7
120
45
410
5
792
1
674
8
326
3
177
6
385
0
408
5
335
9
497
2
594
2
429
9
673
2
547
5
540
8
559
4
Gay
a
Muz
affa
rpur
Pat
na
Bho
pal
Satn
a
Alw
ar
Ajm
er
Ud
aip
ur
Ag
ra
Bul
and
shah
r
Hap
ur
Gha
ziab
ad
Gre
ater
Noi
da
Mee
rut
Noi
da
Sour
ce C
onti
nuou
s am
bien
t air
qua
lity
mon
itor
ing
stat
ion
(Mar
ch 2
019
ndash M
arch
202
0)
In a rapidly urbanising India it would be imperative for policymakers and practitioners in energy and urban development sector to integrate access to clean cooking energy within the ambit of services for the urban poor
Image CEEW
Are Indiarsquos Urban Poor Using Clean Cooking Fuels Insights from Slums in Six States
COUNCIL ON ENERGY ENVIRONMENT AND WATER (CEEW)
Sanskrit Bhawan A-10 Aruna Asaf Ali Marg Qutab Institutional AreaNew Delhi - 110 067 IndiaT +91 11 4073 3300
infoceewin | ceewin | CEEWIndia
Are Indiarsquos Urban Poor Using Clean Cooking Fuels Insights from Slums in Six States
Image CEEW
Between December 2019 to March 2020 CEEW surveyed the primary cook of households across urban slums from the six states of Bihar Jharkhand Uttar Pradesh Rajasthan Madhya Pradesh and Chhattisgarh
CEEW Issue Brief March 2021
ceewin
Insights from Slums in Six States
Are Indiarsquos Urban Poor Using Clean Cooking Fuels
Centre forEnergy Finance
Shaily Jha Sasmita Patnaik and Rithima Warrier
Are Indiarsquos Urban Poor Using Clean Cooking Fuels Insights from Slums in Six States
Copyright copy 2021 Council on Energy Environment and Water (CEEW)
Open access Some rights reserved This work is licensed under the Creative Commons
Attribution Noncommercial 40 International (CC BY-NC 40) license To view the full license visit
wwwcreativecommonsorglicensesby-nc40legalcode
Suggested citation Jha Shaily Sasmita Patnaik and Rithima Warrier 2021 Are Indiarsquos Urban Poor Using Clean Cooking Fuels
Insights from Slums in Six States New Delhi Council on Energy Environment and Water
Disclaimer The views expressed in this issue brief are those of the authors and do not necessarily reflect the views
and policies of Council on Energy Environment and Water The views analysis expressed in this study do
not necessarily reflect the views of the MacArthur Foundation The Foundation also does not guarantee
the accuracy of any data included in this publication nor does it accept any responsibility for the
consequences of its use
Cover image iStock
Peer reviewers Ashish Gupta PhD student University of Pennsylvania Vinaya Padmanabhan Consultant Oxford Policy
Management and Abhishek Jain Fellow and Director-Powering Livelihoods CEEW
Publication team Alina Sen (CEEW) The Clean Copy Twig Designs and Friends Digital
Organisation The Council on Energy Environment and Water (CEEW) is one of Asiarsquos leading not-for-profit policy
research institutions The Council uses data integrated analysis and strategic outreach to explain ndash and
change ndash the use reuse and misuse of resources It prides itself on the independence of its high-quality
research develops partnerships with public and private institutions and engages with wider public In
2021 CEEW once again featured extensively across ten categories in the 2020 Global Go To Think Tank
Index Report The Council has also been consistently ranked among the worldrsquos top climate change think
tanks Follow us on Twitter CEEWIndia for the latest updates
Council on Energy Environment and Water Sanskrit Bhawan A-10 Qutab Institutional Area Aruna Asaf Ali Marg New Delhi - 110067 India
About CEEW
The Council on Energy Environment and Water (CEEW) is one of Asiarsquos leading not-for-profit policy research institutions The Council uses data integrated analysis and strategic outreach to explain mdash and change mdash the use reuse and misuse of resources The Council addresses pressing global challenges through an integrated and internationally focused approach It prides itself on the independence of its high-quality research develops partnerships with public and private institutions and engages with the wider public
The Councilrsquos illustrious Board comprises Mr Jamshyd Godrej (Chairperson) Mr Tarun Das Dr Anil Kakodkar Mr S Ramadorai Mr Montek Singh Ahluwalia Dr Naushad Forbes Ambassador Nengcha Lhouvum Mukhopadhaya and Dr Janmejaya Sinha The 100 plus executive team is led by Dr Arunabha Ghosh CEEW is certified as a Great Place To Workreg
In 2021 CEEW once again featured extensively across ten categories in the 2020 Global Go To Think Tank Index Report including being ranked as South Asiarsquos top think tank (15th globally) in our category for the eighth year in a row CEEW has also been ranked as South Asiarsquos top energy and resource policy think tank for the third year running It has consistently featured among the worldrsquos best managed and independent think tanks and twice among the worldrsquos 20 best climate think tanks In ten years of operations The Council has engaged in 278 research projects published 212 peer-reviewed books policy reports and papers created 100+ new databases or improved access to data advised governments around the world nearly 700 times promoted bilateral and multilateral initiatives on 80+ occasions and organised 350+ seminars and conferences In July 2019 Minister Dharmendra Pradhan and Dr Fatih Birol (IEA) launched the CEEW Centre for Energy Finance In August 2020 Powering Livelihoods mdash a CEEW and Villgro initiative for rural start-ups mdash was launched by Minister Mr Piyush Goyal Dr Rajiv Kumar (NITI Aayog) and HE Ms Damilola Ogunbiyi (SEforAll) The Councilrsquos major contributions include The 584-page National Water Resources Framework Study for Indiarsquos 12th Five Year Plan the first independent evaluation of the National Solar Mission Indiarsquos first report on global governance submitted to the National Security Adviser irrigation reform for Bihar the birth of the Clean Energy Access Network work for the PMO on accelerated targets for renewables power sector reforms environmental clearances Swachh Bharat pathbreaking work for the Paris Agreement the HFC deal the aviation emissions agreement and international climate technology cooperation the concept and strategy for the International Solar Alliance (ISA) the Common Risk Mitigation Mechanism (CRMM) critical minerals for Make in India modelling uncertainties across 200+ scenarios for Indiarsquos low-carbon pathways Indiarsquos largest multidimensional energy access survey (ACCESS) climate geoengineering governance circular economy of water and waste and the flagship event Energy Horizons It recently published Jobs Growth and Sustainability A New Social Contract for Indiarsquos Recovery
The Councilrsquos current initiatives include A go-to-market programme for decentralised renewable energy-powered livelihood appliances examining country-wide residential energy consumption patterns raising consumer engagement on power issues piloting business models for solar rooftop adoption developing a renewable energy project performance dashboard green hydrogen for industry decarbonisation state-level modelling for energy and climate policy reallocating water for faster economic growth creating a democratic demand for clean air raising consumer awareness on sustainable cooling and supporting Indiarsquos electric vehicle and battery ambitions It also analyses the energy transition in emerging economies including Indonesia South Africa Sri Lanka and Viet Nam
The Council has a footprint in 21 Indian states working extensively with state governments and grassroots NGOs It is supporting power sector reforms in Uttar Pradesh and Tamil Nadu scaling up solar-powered irrigation in Chhattisgarh supporting climate action plans in Gujarat and Madhya Pradesh evaluating community-based natural farming in Andhra Pradesh examining crop residue burning in Punjab and promoting solar rooftops in Delhi and Bihar
Are Indiarsquos Urban Poor Using Clean Cooking Fuels Insights from Slums in Six States
Acknowledgments
The authors would like to thank the partners for this survey Initiative for Sustainable Energy Policy (ISEP) at the Johns Hopkins School of Advanced International Studies (SAIS) We would like to extend our gratitude to Prof Johannes Urpelainen (Johns Hopkins SAIS) Carlos F Gould (Columbia University) and Alice Tianbo Zhang (Washington and Lee University) for leading the design of the survey instrument and giving us regular inputs and feedback in various stages of survey planning and implementation We would also like to thank our colleagues at CEEW Kurinji Selvaraj and Tanushree Ganguly for providing the district level air quality data for the analysis
The authors would like to acknowledge the valuable support of Market Xcel Private Ltd the survey agency and its survey team for administering the survey and collecting data Our deepest gratitude goes to them Special thanks to Prasenjit Saha and Pooja Sirpaul (Market Xcel Private Ltd) who were instrumental in implementing the survey We would also like to thank the MacArthur Foundation for financially supporting the study
We want to thank our reviewersmdashAshish Gupta University of Pennsylvania Vinaya Padmanabhan Oxford Policy Management and Abhishek Jain CEEWmdashfor providing critical feedback and comments that went a long way in refining this report
Are Indiarsquos Urban Poor Using Clean Cooking Fuels Insights from Slums in Six States
Shaily Jha shailyjhaceewin
Shaily is a Research Analyst in the Energy Access team at The Council She works on access to clean cooking energy and livelihoods with a focus on gender and social inclusion Shaily holds a postgraduate degree in Disaster Management from the Tata Institute of Social Sciences (TISS) Mumbai and an undergraduate degree in Geography from Miranda House University of Delhi
Sasmita Patnaik sasmitaapatnaikgmailcom
Sasmita is a former Programme Lead of the Energy Access team at The Council She led the work on access to clean cooking and livelihoods with a focus on gender and social inclusion She holds an MSc in Development Studies from the School of Oriental and African Studies (SOAS) and a postgraduate diploma in Rural Management from Xavier Institute of Management Bhubaneswar (XIMB)
Rithima Warrier rithima2warriergmailcom
Rithima worked as Research Consultant at The Council where she analysed primary data on energy access for rural households and urban slums of India Rithima holds an MTech in Bioscience and Bioengineering with a specialisation in Energy from the Indian Institute of Technology Guwahati (IITG) and a BE in Chemical Engineering from MS Ramaiah Institute of Technology (MSRIT) Bangalore
The authors
ldquoEven though the use of LPG as an exclusive cooking fuel is more prominent in urban households than their rural counterparts a significant share of the urban population living in slums is struggling to incorporate the cost of using LPG into the household budget The pollution burden for these households is doubled as they are exposed to the high ambient particulate matter pollution of cities along with the household air pollution from the use of polluting cooking fuelsrdquo
ldquoDuring data analysis we realised that even within polluting fuel-using slum households the reasons for not transitioning towards cleaner fuel varied between the households that stacked LPG with polluting fuels and the ones that only used polluting fuels Moreover the economic impact of COVID-19 is expected to further hinder the transition to cleaner fuels in these slumsrdquo
ldquoPolicies on clean cooking energy access have not necessarily targeted energy poverty in urban slums In a rapidly urbanising country facing a crisis of air pollution and now recovering from the economic impacts of COVID-19 it is time that we target policies to alleviate energy poverty in urban slums particularly in Tier 2 and Tier 3 cities Women and children are the worst affected by the use of polluting fuels reinforcing the need to focus on womenrsquos ability to use clean cooking energy solutions even after schemes like Pradhan Mantri Ujjwala Yojanardquo
Are Indiarsquos Urban Poor Using Clean Cooking Fuels Insights from Slums in Six States
Image iStock
Urban slums suffer from the double burden of pollution as they are exposed to the high ambient particulate matter pollution of cities along with the household air pollution (HAP) from the using unclean cooking fuels
Contents
Executive summary
Annexures
References
2 Cooking fuel adoption and use in urban slum households
21 Households using LPG as their only fuel 22 Households stacking LPG with polluting fuels 23 Households using only polluting fuels
SPOTLIGHT I Household air pollution (HAP) in urban slums
SPOTLIGHT II Womenrsquos participation in intra-household decision-making regarding LPG use
SPOTLIGHT III A comparison of access to clean cooking energy between urban slum and non-slum households across six states
3 Way forward
11 Motivation and methodology 12 Socio-economic characteristics of the urban slums of the six states
1 Introduction state of Indiarsquos urban slums 1
7
17
20
21
23
26
30
24
8
1116
i
Are Indiarsquos Urban Poor Using Clean Cooking Fuels Insights from Slums in Six States
Tables
Table 1 Sample allocation across urban slums
Table 2 Less than one-third of urban slum households reported income from salaried jobs
Table 3 Scheduled Castes and Scheduled Tribes have the lowest economic status
Table 4 The poor economic condition of households in urban slums impacts the use of clean fuels exclusively for cooking
Figures
Figure ES1 To reduce the health impacts from HAP households that are stacking with polluting fuels will need to transition to exclusive use of clean cooking fuels
Figure ES2 While stacking is highest among the middle categories (second and third quintile) it is prevalent across all asset quintiles including the highest one
Figure 1 Within slums there are considerable state-level variations in householdsrsquo fuel usage patterns across states
Figure 2 While the majority of LPG-using households use the fuel primarily only half of them use it exclusively
Figure 3 Most households using LPG exclusively acquire six to eight cylinders per year
Figure 4 Of the households that stack fuels most use LPG as their primary fuel
Figure 5 Stacking is prevalent in households across asset quintile categories
Figure 6 Almost half of the households using polluting fuels use it every day
Figure 7 Proportion of urban slum households using solid fuels as the primary cooking fuel increases during the winters months aggravating householdsrsquo air pollution exposure due to unfavourable atmospheric conditions
Figure 8 Lack of awareness about receiving LPG refill subsidies poses a threat to the success of LPG subsidy schemes
Figure 9 More than half of the households currently without LPG do not know how to get a connection or whom to ask about it implying a lack of awareness
5
5
3
22
ii
iii
8
8
9
11
12
13
14
15
16
Acronyms
BPL below poverty line
CAAQMS continuous ambient air quality monitoring stations
COPD chronic obstructive pulmonary disease
COVID coronavirus disease
DALY disability-adjusted life year
DBTL Direct Benefit Transfer scheme for LPG
HAP household air pollution
IRES India Residential Energy Survey
LPG liquified petroleum gas
NSSO National Sample Survey Office
OBC Other Backward Castes
OMCs oil and marketing companies
PMUY Pradhan Mantri Ujjwala Yojana
SC Scheduled Caste
SDI socio-demographic index
ST Scheduled Tribes
Are Indiarsquos Urban Poor Using Clean Cooking Fuels Insights from Slums in Six States
Image iStock
To reduce the health impacts from household air pollution slum households that are stacking polluting fuels will need to transition using clean cooking fuels exclusively
With increased urbanisation India is experiencing acute air pollution in its urban centres Slum dwellers are doubly affected both by the higher concentration of
particulate matter in urban areas as well as indoor air pollution from the use of unclean cooking fuels With more than 137 million people living in slums in country (Census 2011) there is a strong impetus to understand the use of clean cooking fuels in such households Existing literature on energy access and use in slums across developing countries assume that energy infrastructure is available in these settlements as they are situated in urban environments (Butera et al 2016) Household air pollution (HAP) has an estimated average contribution of 30ndash50 per cent to ambient air quality across Indiarsquos urban and rural areas (Balakrishnan et al 2019) Addressing biomass burning for cooking water heating and space heating during the winters has the potential to help reach the national ambient air quality standards (Chowdhury et al 2019)
However our analysis shows that a large share of these households do not have access to clean fuels due to lack of afforability or patchy supply In this brief we discuss access to clean cooking energy in urban slums across six states (Bihar Uttar Pradesh Rajasthan Madhya Pradesh Jharkhand and Chhattisgarh) These states have a low socio-demographic index and a high disease burden due to air pollution (Balakrishnan et al 2019) The findings of this brief are based on a primary survey conducted in rural areas and urban slums in these states ndash Cooking Energy Access Survey 20201 The analysis focuses on the fuel use patterns of households the extent of use of LPG and solid fuels fuel stacking behaviour and the primary cookrsquos perception of various cooking fuels and their health impacts
Slum households vary widely in their use of clean cooking fuels Therefore to understand their cooking energy use patterns better we categorised these households into three groups
Using clean fuels exclusively
Stacking clean fuels with polluting fuels and
Using only polluting fuels
Use of LPG as primary fuel
82 (Cooking Energy Access Survey 2020)
47 (Census 2011)
Polluting fuel as primary fuel
16 (Cooking Energy Access Survey 2020)
52 (Census 2011)
i
Executive summary
1 This has been referred as lsquoour surveyrsquo thereafter
In this brief the use of clean cooking fuels is considered synonymous to use of LPG
Are Indiarsquos Urban Poor Using Clean Cooking Fuels Insights from Slums in Six States
1 Households using LPG as their only fuelWhile most urban slum households have an LPG connection exclusive use of LPG is limited to just over half of the total households The householdrsquos economic status (measured through asset ownership) and their access to doorstep delivery of LPG refills are two critical factors that determine their ability to use LPG exclusively We found that households with higher asset ownership have significantly higher odds of using LPG as an exclusive fuel
2 Households stacking LPG with polluting fuelsAlthough schemes like Pradhan Mantri Ujjwala Yojana (PMUY) have helped increase LPG adoption this has not resulted in the complete replacement of biomass-based fuels Despite 86 per cent of households having an LPG connection the data shows that over a third of slum households are stacking with polluting fuels (including firewood dung cakes agriculture residue charcoal and kerosene) Most of these households use polluting fuels daily or at least weekly which increases their exposure to household air pollution
Among the households stacking LPG with polluting fuels the reasons for stacking vary affordability free-of-cost availability of biomass seasonality and taste preferences Across asset quintiles we find that stacking is highest among the middle categories (second and third quintile) though most households in these categories have adopted LPG Still the affordability of the fuel remains a significant concern One-fourth of households who are stacking polluting fuels have a median annual refill rate of eight cylinders and above (same as exclusive LPG users) despite having a similar household size as those using LPG exclusively Most of such households fall in the wealthiest asset quintiles and use a chulha (mud stove) for cooking chapatis or vegetables suggesting that they are not necessarily using unclean fuels due to the unaffordability of LPG but due to other factors like taste
ii
Figure ES1 To reduce the health impacts from household air pollution (HAP) households that are stacking with polluting fuels will need to transition to exclusive use of clean cooking fuels
Source Authorsrsquo analysis
Exclusive clean fuel users
Stacking with LPG as the primary fuel
Only polluting fuel users
Stacking LPG with polluting fuels
Stacking with LPG as the secondary fuel
55
3388
12
12
63 LPG-using households receive doorstep delivery of cylinders
77
households receiving doorstep delivery of LPG cylinders are exclusive users of the fuel
Despite increased LPG adoption stacking is prevalent in more than one-third of the slum households
iiiExecutive summary
Figure ES2 While stacking is highest among the middle categories (second and third quintile) it is prevalent across all asset quintiles including the highest one
Source Authorsrsquo analysis
21 Non-cooking uses of polluting fuels Despite using LPG as the primary fuel for their cooking needs households that stack fuels use polluting fuels for non-cooking purposes like heating water for bathing (29 per cent) and space heating (10 per cent)
22 Seasonal variations in fuel use Most households (88 per cent) use LPG as their primary fuel in the rainy season while in winters less than 45 per cent of households do so The increased use of polluting fuels in winter could be because during these months the polluting fuel requirement for non-cooking tasks within the household like water heating for bathing and space heating increases ndash which leads to the increased use of polluting fuels for cooking as well Unfortunately the increased use of polluting fuels in winters exposes households to the double burden of high ambient and household air pollution due to unfavourable atmospheric conditions
21 households stacking fuels
have more than one LPG connections
25 households stacking fuels have two-cylinder connections
1 2 3 4 5
Asset quintile categories
0
20
40
60
80
100
Per
cent
age
of h
ouse
hold
s
Exclusive clean fuel users Stacking LPG with polluting fuels Only polluting fuel users
5348
52
6367
2441 37
3232
2311 11
51
Are Indiarsquos Urban Poor Using Clean Cooking Fuels Insights from Slums in Six States
3 Households using only polluting fuelsDespite large-scale government initiatives like PMUY 12 per cent of urban slum households do not use LPG and rely on polluting fuels While most of these households are aware of PMUY the high upfront LPG connection cost along with the high recurring expenditure on refills deter them from procuring an LPG connection
Way forwardWhile we see a progressive change in householdsrsquo energy-use patterns as we move from rural to urban issues like affordability availability preference seasonality and the end-uses of the fuel remain essential factors that determine household fuel choice Understanding user categories and fuel use patterns is crucial in enabling access to and sustained use of clean cooking fuels Also it is vital to recognise the implications of cooking being a gendered activity However womenrsquos participation in intrahousehold decision-making regarding LPG use is limited
Despite being in urban areas 37 per cent of slum households do not receive home delivery of cylinders ndash availability is an essential factor that determines the householdrsquos likelihood of using LPG exclusively To increase LPG use oil and marketing companies (OMCs) and distributors need to improve home delivery of LPG refills in slum areas
Emissions from household sources contribute hugely to the surrounding air quality (Harish et al 2019) which is already poor in congested slum areas Majority of households cook inside the main house without a chimney indicating high exposure to pollution from the use of unclean fuels for cooking
iv
30 householdsrsquo female members place the order for LPG refills
50 householdsrsquo female
members decide whether or when to purchase LPG refills
75 householdsrsquo
using polluting fuels cook inside
the main house
67 householdsrsquo using polluting fuels do not have a chimney for ventilation
vExecutive summary
Integrate the issue of lack of access to clean cooking energy with urban poverty This study reiterates the need to look at poverty in urban areas in the context of energy access The vulnerability of urban slum dwellers needs to be accounted for while designing and implementing policies including social protection schemes Given the health and economic impacts of pollution access to clean cooking energy schemes must be integrated with the social assistance programmes of other ministries (eg health education and nutrition assistance) to better target support for slum households Government programmes such as the National Urban Livelihoods Mission and social service allocations for housing should use existing targeting approaches to include access to clean cooking energy within their ambit of services for the poor
The economic impact from COVID-19 will push households into energy poverty leading to the increased use of free-of-cost biomass ndash consequently increasing the risk of exposure to emissions from fuel burning While the government has announced that it will provide up to three free refills under the PM-Garib Kalyan Yojana scheme to all PMUY households less than a quarter of households in urban slums have Ujjwala connections ndash effectively making them ineligible for relief support There is a need to expand the reach of PMUY to cover all slum households
Bring renewed emphasis on clean cooking during COVID-19 Increased poverty would mean increased use of polluting fuels ndash there is a need for a renewed emphasis on clean cooking energy access during the COVID-19 pandemic as increased use of polluting fuels has health implications (lower respiratory infections and coronary chronic obstructive disease (COPD)) that increase the risk of COVID-19 infections being more severe
There is a need for targeted effort to include the poor households in urban slums left out in the first phase of Ujjwala
Are Indiarsquos Urban Poor Using Clean Cooking Fuels Insights from Slums in Six States
Image iStock
Addressing biomass burning for cooking water heating and space heating during the winters has the potential to help reach the national ambient air quality standards
The Census of India (2011) estimates that India has about 137 million slum dwellers across the country However statistics on slum populations vary significantly based on how
a slum is defined (Nolan 2015) Therefore not only is there a lack of data about how many people live in slums and informal settlements but there is also limited information about living conditions in slums (Rains Krishna and Wibbels 2018) Rapid urbanisation in India has led to population spikes in urban centres Low-income households in urban areas are trapped in informal and sometimes lsquoillegalrsquo settlements with poor living conditions where access to essential services and infrastructure tends to be limited or badly deteriorated (Butera et al 2016) While slum dwellers are not a homogeneous population slum areas have high concentrations of poverty and social and economic deprivation and poor shelter and environmental conditions (UN-Habitat 2003)
1 Introduction state of Indiarsquos urban slums
1
The Census of India (2011) defines slums as ldquoresidential areas where dwellings are unfit for human habitation by
reasons of dilapidation overcrowding faulty arrangements and design of such buildings narrowness or faulty
arrangement of street lack of ventilation light or sanitation facilities or any combination of these factors which
are detrimental to the safety and healthrdquo The slums in India are officially categorised into three categories
identified recognised and notified1 (Chandramouli 2010) About 59 per cent of slum households in India are non-
notified and are not legally recognised by the government (Nolan Bloom and Subbaraman 2018)
BOX 1 Slums in India
The existing literature on energy access and use in slums across developing countries suggests that while energy infrastructure (electric grid LPG distribution system) is available in these settlements (by being urban) households cannot afford it andor the service is unreliable (frequent outages and low voltage for electricity uncertain availability of gas cylinders) (Butera et al 2016) This leads to households relying on illegal connections for electricity and using energy sources that are on the lower end of the energy ladder (such as kerosene charcoal wood and other biomass residues) for cooking (Butera et al 2016)
1 Areas notified as slums by the concerned municipalities corporations local bodies or development authorities were termed notified slums All areas recognised as lsquoSlumrsquo by State UT Administration or Local Government Housing and Slum Boards which may have not been formally notified as slum under any act While a compact area of at least 300 population or about 60-70 households of poorly built congested tenements in the unhygienic environment is termed as identified slums (National Sample Survey Office 2012)
Are Indiarsquos Urban Poor Using Clean Cooking Fuels Insights from Slums in Six States2
In India population growth and rapid urbanisation have resulted in the deepening of urban poverty and the increased growth of urban slums (GNESD 2008 Yenneti Wei and Chen 2017) As per the Census 2011 most slum dwellers are casual labourers engaged in works other than public works (ie informal sectors) as opposed to salaried employees in non-slum urban areas (National Buildings Organisation 2013) As per the National Sample Survey Office (NSSO 2011ndash2012) the average daily wage of casual labourers is as low as INR 170 in urban areas (Ministry of Housing and Urban Affairs 2019) Such households may be able to purchase cleaner and more efficient fuels whenever they can but are likely to fall back on less efficient ones when faced by budgetary constraints Studies suggest that despite the LPG subsidies provided by the government significant sections of the urban poor population are still struggling to incorporate the cost of LPG into their household budgets (R Singh et al 2015) Use of multiple fuels also provides security from price variations and unreliable service associated with a single fuel or technology (Shahadat Lipu and Bhuiyan 2014)
As per the Census 2011 only half of the urban slum households across the country use LPG as their cooking fuel the remaining rely on solid fuels and kerosene Since 2013 the LPG programme in India has undergone many modifications to improve delivery and targeting access to connections and the availability of LPG (CEEW 2020) Pradhan Mantri Ujjwala Yojana (PMUY) which focuses on tackling the high upfront cost of LPG by providing LPG connections to below poverty line (BPL) households with credit-linked subsidy support has played an instrumental role in increasing the penetration of LPG across the country As of November 2019 about 965 per cent of households in India have an LPG connection (PPAC 2019) Small towns and cities which have been experiencing a comparatively slow rate of urban growth but the high percentage of slum population mall towns and cities which have been experiencing a relatively slow rate of urban growth but a high percentage of slum population
However the dramatic increase in LPG coverage has led to increased fuel stacking (Cheng and Urpelainen 2014) The reliance on fuel stacking has significant implications as the health benefits of using clean fuels are reduced or perhaps even nullified in households that continue to use biomass (Cheng and Urpelainen 2014) Urban slums suffer from a double burden of pollution as they are exposed to high ambient particulate matter pollution in cities along with the household air pollution (HAP) from using unclean cooking fuels (WHO 2014) The Global Burden of Disease study notes that even with the substantial increase in the provision of clean cooking fuels in India more than half of Indiarsquos population is exposed to HAP from solid cooking fuels as of 2017 (Balakrishnan et al 2019) In the current context this is concerning since exposure to air pollution has been linked to developing lower respiratory infections and chronic obstructive pulmonary disease (Balakrishnan et al 2019) which are among the major risk factors for COVID-19 (Lippi and Henry 2020 Wang et al 2020)
11 Motivation and methodology While there have been various studies on energy access in rural areas there is minimal data on energy use and patterns in urban slum households Most studies on urban slums and energy access focus on specific slums in large metropolitan areas such as Delhi and Bangalore (Saksena et al 2003 Dhingra et al 2008 Roy et al 2018) Living conditions and access to resources vary across slums in smaller towns and cities compared to those in Tier I
Slum-dwellers suffer from the double burden of pollution as they are exposed to high ambient particulate matter in cities along with the HAP from using unclean cooking fuels
2 A summary measure that identifies where countries or other geographic areas fall on the spectrum of development Expressed on a scale of 0 to 1 SDI is a composite average of the countryrsquos rankings in terms of per capita income average educational attainment and fertility rates
3 These states account for six out of eight of the lowest socio-demographic index (SDI) states and exhibit the highest health impacts of household air pollution (HAP) These states also have the highest percentage of households covered under the flagship clean cooking energy programme in India ndash PMUY
4 Referred to as lsquoour surveyrsquo thereafter
5 In our sample about 82 per cent of households are from notified slums
6 About 98 per cent of the respondents were female members of the household
7 For further details on the survey sample and methodology refer to the technical document for the survey
3Introduction state of Indiarsquos urban slums
Table 1 Sample allocation across urban slums
Source Authorsrsquo compilation
Note The number of slums sampled within each state varied because the slums were picked from the same districts that were sampled under the India Residential Energy Survey (2020) across the six states This was done to ensure logistical ease in conducting both the surveys and to share the resources of the national-level survey The list of urban slums as per the Census 2011 in the districts sampled under IRES 2020 constitutes the urban sampling frame7
State Districts sampled Urban slums sampled Households surveyed
16
14
10
10
4
4
58
31
15
16
12
5
4
83
249
124
128
94
40
32
667
Uttar Pradesh
Bihar
Madhya Pradesh
Rajasthan
Jharkhand
Chhattisgarh
cities these towns have been experiencing a comparatively slow rate of urban growth but are home to large slum populations (Rahaman and Das 2017) Further existing sources on access to clean cooking energy among slum households are limited to primary fuel use and lack detailed information about fuel use and stacking patterns
In India states with the lowest socio-demographic index (SDI)2 also account for the highest level of disease burden due to air pollution (Balakrishnan et al 2019) The low SDI states in north India had some of the highest levels of ambient particulate matter and household air pollution ndash especially Bihar Uttar Pradesh Rajasthan and Jharkhand The disability-adjusted life year (DALY) rate attributable to HAP was highest in the low SDI states of Chhattisgarh Rajasthan and Madhya Pradesh (Balakrishnan et al 2019)
The findings of this brief are based on a primary survey conducted across rural areas and urban slums in six energy access deprived states in India ndash Bihar Jharkhand Uttar Pradesh Rajasthan Madhya Pradesh and Chhattisgarh3 The Cooking Energy Access Survey 20204 focused on householdrsquos clean cooking energy access and its barriers and drivers in rural areas and urban slums Based on the list of urban slums across districts in Census 2011 the survey covered 656 households across 83 urban slums (notified and non-notified)5 spread across 58 districts The survey was conducted with the primary cook of the household6
In this brief we focus on understanding access to clean cooking energy specifically across urban slum households The analysis focuses on the fuel use patterns of households the extent of use of LPG and solid fuels fuel stacking behaviour and the primary cookrsquos perception of various cooking fuels and their impact on health The results discussed below are representative of the urban slum population in six states We have refrained from state-level analysis because of the smaller sample size for urban slums in some states like Jharkhand and Chhattisgarh
Are Indiarsquos Urban Poor Using Clean Cooking Fuels Insights from Slums in Six States4
12 Socio-economic characteristics of the urban slums of the six states Non-farm casual labour is the primary source of income for more than 42 per cent of the households such households reported a median monthly expenditure of about INR 5000 In only 20 per cent of the households the primary cook is involved in income-generating activities primarily engaged in casual non-farm labour or are self-employed
Source Authorsrsquo analysis
60 households have a monthly income below
INR 10000
In 90 households all members have
Aadhar cards
94 households have a bank account
11 households are currently indebted
Median savings in the past year
INR 4000
Median monthly expenditure
INR 6000
MEDIAN HOUSEHOLD SIZE
6
5
Table 2 Less than one-third of urban slum households reported income from salaried jobs
Source Authorsrsquo analysis
Under self-employment some of the householdsrsquo report occupations like carpentry tailoring driver and priest
The primary source of income of urban slum households
Non-farmdaily wage casual labour
Private or government salaried job
Shop or own business or self-employed
Farm labour
Agriculture on own or leased land
Others (pension remittances cattle rearing none)
43
22
18
8
7
2
Scheduled Castes (SC) (30 per cent) and Other Backward Castes (OBC) (45 per cent) form the majority of the urban slum population While Scheduled Tribes (ST) constitute less than 10 per cent of the overall population a majority of them are in Madhya Pradesh and Rajasthan Less than 20 per cent of the urban slum population are from the General castes States like Bihar Jharkhand and Rajasthan have the least proportion of General castes living in slum areas
Within urban slum households OBC and General households are relatively better off economically as shown in Table 3 Occupational patterns also vary based on caste A higher proportion of OBCs and General households rely on running a business self-employment or salaried jobs for their primary source of income as compared to SC and ST households The latter are primarily engaged in farm and non-farm labour The socio-economic marginality of SCs and STs even within slums is a consequence of these communities being most deprived in terms of access to resources and education income housing etc (Chandrasekhar and Mitra 2018) We see a similar trend in our sample in education and income levels Slums often remain the permanent habitation of marginalised castes as opposed to serving as an entry point for persons from higher castes who get absorbed into relatively better jobs and eventually move out of the slums (Chandrasekhar and Mitra 2018)
Table 3 Scheduled Castes and Scheduled Tribes have the lowest economic status
Source Authorsrsquo analysis
We utilise an economic status or asset index as a measure of a householdrsquos relative wealth and economic status based on the Filmer and Pritchett (2001) approach The list of variables included in the economic status index can be found in Annexure I The index takes values between 0 and 10 where a higher value denotes a higher level of asset ownership
Caste Sample size
Mean of asset index
(Min ndash Max) of BPL cardholders
233
51
281
92
042
039
046
046
(0ndash084)
(008ndash077)
(003ndash1)
(008ndash09)
45
60
49
36
Scheduled Castes
Scheduled Tribes
Other Backward Classes
General
Introduction state of Indiarsquos urban slums
Are Indiarsquos Urban Poor Using Clean Cooking Fuels Insights from Slums in Six States652
Image iStock
Exclusive use of LPG is limited to just over half of the total slum households The householdrsquos economic status and its access to doorstep delivery of LPG refills are two critical factors that determine their ability to use LPG exclusively
7
The fuel use patterns in urban slum households across the six states show a significant improvement in LPG use over the past decade when compared with the data from
Census 2011 The share of households using polluting fuels (including firewood dung cake agriculture residue and kerosene) as their primary fuel has decreased significantly but we find that stacking is a common practice even among households using LPG as a primary fuel Unless they use clean fuels exclusively such slum households will still be exposed to the health risks associated with HAP
Across the six states the primary fuel used for cooking by slum households
For the analysis in this brief we have categorised the households into three based on their fuel choices and position on the energy ladder those that exclusively use clean cooking fuels (LPG and electricity) stack LPG with polluting fuels and use only polluting fuels The level of exposure to emissions from cooking increases from the first (least harmful) to the third category (most harmful)
2 Cooking fuel adoption and use in urban slum households
In this brief the use of clean cooking fuels is considered synonymous to use of LPG since other clean fuels comprise a negligible share of use
Source Authorsrsquo analysis
Households using clean fuel exclusivelyWhile the majority of these households use LPG two per cent of the households reported using electricity for cooking purposes
Households stacking LPG with polluting fuelsMost of these households reported using LPG as their primary fuel and polluting fuels as their secondary fuel About four per cent of slum households reported using polluting fuels as their primary fuel and LPG as their secondary fuel
Households using only polluting fuelsThese households only use firewood charcoal dung
agricultural residue kerosene or a stack of these fuels
5533
12
Fuel-use categories
Use of LPG as primary fuel
82 (Cooking Energy Access Survey 2020)
47 (Census 2011)
Polluting fuel as primary fuel
16 (Cooking Energy Access Survey 2020)
52 (Census 2011)
Are Indiarsquos Urban Poor Using Clean Cooking Fuels Insights from Slums in Six States8
In the following sections we explore factors such as socio-economic characteristics affordability and availability of fuel intra-household gender dynamics and fuel perceptions which influence the ability and likelihood of a household to use different fuels
21 Households using LPG as their only fuel In this section we focus on understanding the household characteristics and fuel use patterns of those using LPG exclusively for cooking Most urban slum households with an LPG connection report using LPG as their primary fuel While 55 per cent of the slum households (63 per cent of LPG-using households) use LPG exclusively others stack LPG with polluting fuels Uttar Pradesh has the highest
proportion (70 per cent) of slum households who are exclusive users of clean cooking fuels among the six states
Figure 1 Within slums there are considerable state-level variations in householdsrsquo fuel usage patterns across states
Source Authorsrsquo analysis
Note We have refrained from state-level analysis because of the smaller sample size for urban slums in states like Jharkhand and Chhattisgarh
Figure 2 While the majority of LPG-using households use the fuel primarily only half of them use it exclusively
Source Authorsrsquo analysis
0
0
10
10
20
20
30
30
40
40
50
50
60
60
70
70
80
80
90
90
100
100
8682
55
Bihar
LPG users
Chhattisgarh Jharkhand Madhya Pradesh
LPG as the primary fuel LPG as the exclusive fuel
Rajasthan Uttar Pradesh
States
Per
cent
age
of h
ouse
hold
s P
erce
ntag
e of
hou
seho
lds
Exclusive clean fuel users Stacking LPG with polluting fuels Only polluting fuel users
42
3
30
56
45
39
1611
40
4944
46
10 5
24
71
41
28
9Cooking fuel adoption and use in urban slum households
Over a fifth of households using LPG exclusively are PMUY households which suggests that these households have been able to transition to clean cooking fuels in less than four years PMUY households using LPG exclusively are of a relatively higher economic status than households that stack polluting fuels Unlike in rural areas the age of an LPG connection does not have a direct correlation with per capita LPG consumption in urban slum households suggesting that even households with recent LPG connections in urban slums are likely to use LPG exclusively Households in urban areas have been known to experience a direct transition to exclusive use of clean fuels from using traditional fuels (Kuo and Azam 2019) This could be due to the time-saving that comes with the adoption of clean cooking fuels like LPG ndash where urban households are more willing or need to spend more on convenience than rural households
Figure 3 Most households using LPG exclusively acquire six to eight cylinders per year
Source Authorsrsquo analysis
211 The economic status of the household determines exclusive LPG useA simple logistic regression (Annexure II) shows that households with higher asset ownership have significantly higher odds of using LPG as an exclusive fuel Even between primary and exclusive users of LPG asset ownership remains a significant differentiating factor This corroborates the findings of previous studies (Ranjan and Singh 2017) that state that households tend to switch their cooking fuel use patterns after a threshold level of income is achieved However this is not to suggest that all wealthy households shift to exclusive use of clean fuels We discuss the reasons for stacking among these households in the next section
Cooking energy in the household budget We find that households using LPG as their only fuel pay INR 496 per month8 This effectively translates to an average household spending almost eight per cent of their monthly expenses on cooking fuel
Oil and Marketing Companies (OMCs) are attempting to address the challenges around the recurring refilling
cost by encouraging low-income households to use a 5 kilograms (kg) cylinder to overcome the high upfront cost
associated with 145kg cylinders In our sample we find that only about two per cent of urban slum households use
small cylinders (5kg or 3kg)
BOX 2 Uptake of small cylinders
8 This is based on the upfront cost paid by the household for an LPG refill Given that only 40 per cent of the householdsrsquo report receiving LPG subsidy on refills ndash it has not been considered in the fuel expenditure calculation The share of fuel expenditure for the households receiving LPG subsidies would be accordingly less than the others
0
10
20
30
40
50
60
70
1
1 16 8 9
22
60
4350 50
14
34
15
2 3 4 5 6 7 8 9 10 11 12 13
Number of 14 kg LPG cylinder refills obtained by exclusive LPG users
Per
cent
age
of h
ouse
hold
s us
ing
LP
G e
xclu
sive
ly
households using LPG exclusively Median value
Are Indiarsquos Urban Poor Using Clean Cooking Fuels Insights from Slums in Six States
212 Home delivery for exclusive LPG users We find that households who receive doorstep delivery of LPG refills have higher odds of using LPG as their exclusive fuel Hassle-free doorstep delivery of LPG refills is known to influence the use of LPG as a primary secondary or exclusive fuel (PPAC-CRISIL 2016)
Additional expense on procurement of cylinders Almost half of the households who receive doorstep delivery of LPG pay an additional amount of INR 20 as a delivery charge However in households that do not receive doorstep delivery about 46 per cent report that one member must forgo their daily wages to procure the cylinder Most of such households depend on daily labour or private jobs for their income
Given that almost half of the households report having to forgo wages to procure the cylinders it could affect the householdrsquos ability to use LPG continually It may add to the average delay in the purchase of refills
Procurement of LPG cylinders during the COVID-19 pandemic Most households that do not receive doorstep delivery of LPG (58 per cent) use private vehicles (including motorcycles or bicycles) to transport LPG refills About one-third of the households procuring cylinders on their own use rented or shared vehicles The procurement constraints faced by these households would be further aggravated during the COVID-19 pandemic as using rented or shared vehicles comes with its own risks
10
About 18 per cent of the respondents in our survey reported that they resided in non-notified slums Such slums are not legally recognised as a lsquoslumrsquo by the government which makes the residents more vulnerable to eviction In our data we find that adoption and use of LPG is similar across households from notified and non-notified slums Qualitative interviews and field visits showed that most of the respondents were permanent residents of the slums who have been living there for more than 10 years
About 2 per cent of urban slum households use electricity as a source for cooking energy These households do not rely on any other fuels for cooking or non-cooking purposes They use electric stoves to prepare all meals including cooking roti rice and vegetables These households have been using electricity as their cooking fuel only in the past five years Most households report using either a coiled stove or induction stove Less than one per cent of households use other electric appliances such as hot water kettles and toasters for cooking needs
BOX 3
BOX 4
Status of slums impacting the fuel-use pattern
Electricity for cooking
77
households receiving doorstep delivery of LPG cylinders are exclusive users of the fuel
63LPG-using households receive doorstep delivery of cylinders
Male members have to travel to procure the cylinders in 87 households
11Cooking fuel adoption and use in urban slum households
About 4 per cent of urban slum households in the sample reported stacking with kerosene as their secondary fuel Most of these households are in Uttar Pradesh These households also use kerosene more than once a week for cooking
BOX 5 Use of kerosene as a cooking fuel
22 Households stacking LPG with polluting fuels Across the six states almost half of the households (45 per cent) reported using polluting fuels Here we discuss the characteristics and fuel use patterns of households that stack clean and unclean fuels
Though 86 per cent of the households surveyed have an LPG connection we find that over a third (33 per cent) of them stack it with polluting fuels (including firewood dung cakes agriculture residue charcoal and kerosene) The increased stacking could also be a result of more households adopting LPG since households tend to not replace biomass-based fuels completely (Cheng and Urpelainen 2014) These households would need to transition to exclusive use of clean cooking fuels to reduce the health impacts on women and children from household air pollution
About 44 per cent of the households that are stacking fuels rely on informal sources for refills Such households have not ordered any refills in the past one year from their LPG distributors These households mainly rely on recurring cylinders from their neighbours or relatives9
Figure 4 Of the households that stack fuels most use LPG as their primary fuel
Source Authorsrsquo analysis
9 It is important to note that sharing LPG cylinders among neighbours and extended family is a regular phenomenon in small towns and rural areas owing to availability challenges and it is not necessarily driven by an intention to siphon off subsidy amounts against the commodity ( Jain et al 2018)
Exclusive clean fuel users
Stacking with LPG as the primary fuel
Only polluting fuel users
Stacking LPG with polluting fuels
Stacking with LPG as the secondary fuel
55
3388
12
12
Are Indiarsquos Urban Poor Using Clean Cooking Fuels Insights from Slums in Six States12
221 Household factors that determine the decision to stack fuels Even within the stacking households the reason for stacking multiple fuels varies significantly Primarily households who stack can be divided into two categories ndash those that stack as they cannot afford LPG refills and those that stack due to other factors like taste preferences and alternate end-uses of the fuel
Households who are stacking primarily due to affordability concerns ndash Across asset quintiles we find that stacking is most common among the middle categories (second and third quintile) where most have adopted LPG Still the affordability of the fuel remains a significant concern More than 60 per cent of the households that are stacking fuels collect or prepare firewood or dung cakes free of cost rather than purchasing them from the market Those who buy biomass do not spend more than INR 100 per month on it Based on the responses of the primary cook we note that the high cost of LPG and free-of-cost availability of solid fuels are the most common factors that affect the fuel choices made by the household
Figure 5 Stacking is prevalent in households across asset quintile categories
Source Authorsrsquo analysis
1 2 3 4 5
Asset quintile categories
0
20
40
60
80
100
Per
cent
age
of h
ouse
hold
s
Exclusive clean fuel users Stacking LPG with polluting fuels Only polluting fuel users
5348
52
6367
2441 37
3232
2311 11
51
Households who use LPG primarily and polluting fuels as secondary fuels have a median annual refill rate of
6 cylinders
Households who use polluting fuels primarily and LPG as a secondary fuel have a median annual refill rate of
4 cylinders
13
Households that are stacking for reasons beyond affordability ndash More than one-fourth of the households that are stacking have a median annual refill rate of eight cylinders and above despite having a similar household size as others Most such households fall in the highest asset quintiles This suggests that they are not necessarily using unclean fuels due to the unaffordability of LPG but due to other factors such as taste preference for chulhas and fuel end-uses that influence the householdrsquos decision to use solidpolluting fuels Such households reported using LPG for a median period of six years The solid fuels are primarily used for cooking chapatis or vegetables in these households
Interestingly even households with multiple LPG connections and two cylinder connections report stacking with polluting fuels The possession of multiple LPG connections in these households may not necessarily be an indicator of diversion mdash the average family size of these households is more than eight indicating the high possibility of having separate kitchens within the same household Given that such households have a median annual refill rate of ten cylinders another plausible reason for multiple connections is that it prevents them from relying on just one distributor which increases their chances of getting refills whenever needed
222 End-uses of polluting fuels Across both the groups discussed above half of the households who stack with polluting fuels use these fuels at least once a day (Figure 6) Also almost 45 per cent of the households that stack fuels use multiple stoves at the same time while preparing a single meal This indicates that even if the household is using LPG for a particular meal they would be using their chulha simultaneously
Despite using LPG as the primary fuel for their cooking needs households that are stacking fuels use polluting fuels for non-cooking purposes like heating water for bathing (29 per cent) and space heating (10 per cent)
Figure 6 Almost half of the households using polluting fuels use it every day
Source Authorsrsquo analysis
0 5 10 15 20
19
11
21
20
29
25 30 35
Percentage of households
Freq
uenc
y of
use
of p
ollu
ting
fuel
s Several times a day
Once per day
Few times a week
Once a week
Occasionally
21 households stacking fuels
have more than one LPG connections
25 households stacking fuels have two-cylinder connections
Cooking fuel adoption and use in urban slum households
Are Indiarsquos Urban Poor Using Clean Cooking Fuels Insights from Slums in Six States14
223 Seasonal variations in the stacking of fuels We also noted a significant seasonal change in fuel use patterns LPG is most popular in the rainy season (88 per cent) and least popular in the winter months (45 per cent) (Figure 7) The dampness associated with solid fuels in the rainy season could be the reason for using LPG primarily during these months The literature also suggests that solid fuels are a popular choice during winter months (S Singh 2014 Baqir et al 2019) This could be because during winter months the solid fuel requirement for non-cooking tasks within the household likes water heating for bathing and space heating increases Since households are already using solid fuels for non-cooking tasks they may be using these fuels more for cooking during winter Unfortunately the increased use of solid fuels in winter exacerbates the much higher air pollution exposure of these households due to unfavourable atmospheric conditions
Figure 7 Proportion of urban slum households using solid fuels as the primary cooking fuel increases during the winters months aggravating household air pollution exposure due to unfavourable atmospheric conditions
Source Authorsrsquo analysis
About 3 per cent of urban slum households reported owning an electric water-heating device (geyser or immersion
rod) Similarly only 4 per cent of the households own an electric room heater
BOX 6 Electric devices for water heating and space heating
Summer Winter Rainy Festival0
20
40
60
80
100
120
Per
cent
age
of h
ouse
hold
s
LPG Solid fuel
78
45
88
67
22
55
1233
15
Figure 8 Lack of awareness about receiving LPG refill subsidies poses a threat to the success of LPG subsidy schemes
Source Authorsrsquo analysis
Connections under the Pradhan Mantri Ujjwala Yojana (PMUY) 23 per cent of these households reported receiving benefits under the PMUY
The six states included in the survey account for a significant share of PMUY coverage ndash 54 per cent of all connections provided under PMUY (PPAC 2019) However most of these connections cater to rural households One of the reasons for there being fewer PMUY connections in urban areas is that more than half of all urban slum households reported already having had LPG connections for over four years (before the launch of PMUY) Moreover over a quarter of PMUY households10 in urban slums reported having multiple LPG connections which suggests that not every household which was using LPG before the PMUY was prevented from accessing the schemersquos benefits
Government support during the COVID-19 pandemic During the COVID-19 lockdown the government announced the provision of three free-of-cost refills for PMUY households under the PM-Garib Kalyan Yojana While PMUY households in urban slums benefitted from this scheme non-PMUY households in urban slums did not As documented urban slum households faced a significant economic hit due to the loss of jobs and incomes during the pandemic (Patel 2020) Non-PMUY households that stack for economic reasons are more likely to use cheaper and freely available solid fuels without additional support from the government
PAHAL-Direct Benefit Transfer for LPG (DBTL)Overall about 42 per cent of active LPG users11 reported receiving a subsidy for their last LPG refill under the Direct Benefit Transfer for LPG scheme (DBTL) However about 28 per cent of urban slum households reported not knowing if they had received the subsidy amount for their last refill this suggests that the primary cook is often unaware of whether the subsidy is credited to the household Among the ones that reported receiving the LPG subsidy about 40 per cent of the primary cook were not aware of the amount of subsidy being credited into their account
10 This is a relatively smaller sample of 43 households from all the PMUY households in urban slums (131 households)
11 Households that have taken at least one refill in the past year
42
30
28
Received LPG refill subsidy
30 Still repaying PMUY loan
Did not receive LPG refill subsidy
10 Gave up LPG refill subsidy
Do not know
60 LPG refill susbsidy not received due to other reasons
Cooking fuel adoption and use in urban slum households
Are Indiarsquos Urban Poor Using Clean Cooking Fuels Insights from Slums in Six States16
23 Households using only polluting fuels About 12 per cent of urban slum households rely entirely on polluting fuels for all cooking and non-cooking purposes While the share of these households is relatively small the non-adoption of LPG in such households despite
programmes like the PMUY is concerning These households either use a combination of different polluting fuels (firewood dung cakes agricultural residue charcoal and kerosene) or just one of these fuels for all their energy needs Firewood is the most commonly used fuel in these households
231 Reasons for the non-adoption of LPGHouseholds that rely exclusively on polluting fuels reported not having an LPG connection Though three-fourths of these households were aware of PMUY the high upfront cost of an LPG connection along with the high recurring cost of procuring refills remain the two most important reasons for not procuring an LPG connection Repondents also mentioned a lack of information on how to procure a connection as a reason These reasons align with the common causes cited by rural households covered in the survey implying that the challenges faced by rural households and urban slum households in procuring connections are similar
Almost half of the households in this category use solid fuels for non-cooking purposes such as heating water for bathing space heating and preparing fodder for animals On the positive aspects of using polluting fuels households reported the following free-of-cost easy availability of fuels better tasting food and preference of family members for food cooked on the chulha
232 Fuel availability and affordabilityIn contrast with households that stack fuels households that use only solid fuels rely on purchasing fuels rather than collecting or preparing them For instance 60 per cent of firewood users in this category procure fuel by purchasing rather than collecting it
Households with low asset ownership rely on polluting fuels for cooking These households spend 2ndash3 per cent of their median monthly expenditure on fuel (INR 75 per month on fuel) which is much lower than what they would have to spend if they used LPG exclusively (INR 496 per month) Households that collect solid fuels spend about two hours on a single trip (three times a month) travelling a median one-way distance of 2 km This is equivalent to the distance travelled to procure LPG cylinders (if not delivered at home)
Figure 9 More than half of the households currently without LPG do not know how to get a connection or whom to ask about it implying a lack of awareness
Source Authorsrsquo analysis
0 10 20 30 40 50 60 70
39
53
63
68
80
Percentage of households
Rea
sons
for N
on-A
dop
tion
of L
PG Installation is expensive
Monthly expenditure on LPG is high
Do not know how to get or whom to ask
Not availabletoo far
17
12 See Annexure III for details on the districts and their PM25 concentrations The data for 15 districts (from Bihar Uttar Pradesh Madhya Pradesh and Rajasthan) overlapping with the survey sample have been analysed based on the availability of air quality data from continuous monitoring stations
13 Air quality categories based on PM25 concentration (in μgm3)
Good 0 to 30 Satisfactory 31 to 60 Moderately polluted 61 to 90 Poor 91 to 120 Very poor 121 to 250 Severe above 250 (Central Pollution Control Board 2014)
Cooking fuel adoption and use in urban slum households
Winter months have the highest PM25 concentrations coinciding with the sharp increase in use of polluting fuels for heating bath water and room heating
233 Gendered time use in households using solid fuelsIn urban slums both the male and female members of the household are equally involved in collecting firewood Still it is primarily the female members of the household who undertake dung cake preparation In addition to engaging in fuel collection and preparation women tend to spend more time cooking in households using solid fuels About 85 per cent of households that transitioned to LPG in the past four years reported having saved time while cooking compared to when they used solid fuels
SPOTLIGHT I Household air pollution (HAP) in urban slums
Burning solid fuels in three-stone fires and mud stoves with inadequate ventilation causes high levels of smoke exposure and negative health impacts particularly for women and young children (WHO 2014)
The double burden of ambient and household air pollution on the urban slum populationUsing the PM25 data from continuous ambient air quality monitoring stations (CAAQMS) for 15 districts12 in our sample we found that the ambient air quality remained in the lsquopoorrsquo or worse category13 for most districts throughout the year variation in the ambient air quality
Are Indiarsquos Urban Poor Using Clean Cooking Fuels Insights from Slums in Six States
Impact of ventilation
Indoor cooking and low adoption of chimney indicates high exposure to pollution from the use of unclean fuels for cooking The proportion of households with a chimney is high (52 per cent) among those who rely only on polluting fuels Smith and Pillarisetti (2017) explain that while having a good chimney lowers peak levels of indoor pollution long-term average exposure is reduced only by a factor of two Besides chimneys require regular maintenance to function correctly While more than 45 per cent of the households are using polluting fuels less than 20 per cent of the slum housheolds use improved cookstoves
Households also use solid fuels for non-cooking uses like space heating On average each house in a slum has two rooms this effectively exposes all members of the household to emissions from burning fuels Emissions from household sources contribute significantly to the surrounding air quality (Harish et al 2019) this concern is exacerbated in congested slum areas
the winter months (November to February) have the highest concentration of PM25 This leads to a double burden of exposure for slum households stacking solid fuels as they are more likely to increase use of solid fuels in winters (Figure 7) Alternatively the use of LPG as the primary source of fuel increases during the rainy season (June to September) these months record the least ambient air pollution
We also find that districts like Meerut Ghaziabad Patna Gautam Buddha Nagar (Noida and Greater Noida) and Muzaffarpur have the highest frequency of lsquovery poorrsquo air quality days throughout the year Across these districts one-third of households use polluting fuels for cooking In urban slums where households are more densely packed the emissions from burning solid fuels increase the risk of exposure inside households and deteriorate the ambient air quality for the community at large As a result these communities suffer from both increased household and ambient air pollution HAP has an estimated average contribution of 30ndash50 per cent to ambient air quality across Indiarsquos urban and rural areas (Balakrishnan et al 2019) Addressing biomass burning for cooking water heating and space heating during the winters has the potential to help reach the national ambient air quality standards (Chowdhury et al 2019) Despite that only 2 per cent of the action points in 44 city clean air plans mention cooking and heating as a sector to address air pollution (Ganguly Selvaraj and Guttikunda 2020)
18
75 householdsrsquo
using polluting fuels cook inside
the main house
67 householdsrsquo using polluting fuels do not have a chimney for ventilation
Awareness about the health impacts of using polluting fuelsAbout 60 per cent of households using only polluting fuels and 84 per cent of households that stack LPG with a polluting fuel report lsquotoo smokyrsquo as the most prominent negative aspect of using polluting fuels This suggests that as more households switch to clean cooking fuels perceptions regarding pollution fuels change
Three-fourths of primary cooks who use polluting fuels for cooking agree that smoke from solid fuels is harmful to them this implies that awareness of the adverse health impacts of polluting fuels does not necessarily lead to the uptake of clean fuels Primary cooks also agree that smoke from solid fuels causes coughing (49 per cent) and lung infections in children (39 per cent)
Exposure to air pollution is a known risk factor for underlying chronic diseases that predict the severity of
COVID-19 disease and patient outcomes (World Bank 2020) This linkage suggests a heightened risk for women
in all age groups who cook using traditional technologies and fuels (World Bank 2020) The highest number of
COVID-19 cases were recorded in the most polluted regions among patients with pre-existing health conditions
(Frontera et al 2020)
Results from a controlled study show a higher prevalence of chronic obstructive pulmonary disease (COPD)
among biomass fuel users than clean fuel users ( Johnson et al 2011) The available clinical data to date suggest
that cardiovascular disease diabetes chronic respiratory illness and hypertension ndash conditions all strongly
associated with exposure to HAP ndash are also risk factors for COVID-19 (World Bank 2020)
BOX 7 Impact of household air pollution on COVID-19
19Cooking fuel adoption and use in urban slum households
Are Indiarsquos Urban Poor Using Clean Cooking Fuels Insights from Slums in Six States
Traditionally women bear a disproportionate burden in collecting and preparing biomass for cooking While this burden reduces with the use of clean cooking fuels like LPG the fuel supply within the household is then determined by formal and monetised distribution networks involving an outlay of money (Patnaik and Jha 2020) Our data shows that womenrsquos status in the household (as heads of households)14 positively correlates with households using LPG as their primary fuel The existing literature also supports the idea that female-headed households prefer modern fuels to polluting ones (Farsi Filippini and Pachauri 2007 Rao and Reddy 2007 Kuo and Azam 2019) Other research also suggests that female-headed households are more willing to spend on LPG as a recurring expense (Kojima Bacon and Zhou 2011 Kuo and Azam 2019)
SPOTLIGHT II Womenrsquos participation in intra-household decision-making regarding LPG use
20
14 In almost half of the households surveyed the primary cook reported a female member being the head of the household The reason behind such high percentage of female-headed households could be because only the primary cook of every household (who is mostly female) was surveyed This does not mean that these households do not have any adult male members Traditionally headship refers to the head of household as the individual whose lsquoauthorityrsquo the household members recognise But this definition overlooks potential intra-household variations in the recognised authority in different realms of decision-making (Kilic Moylan and Koolwal 2020) Since cooking is a gendered activity the primary cookrsquos response to the head of household question may have been with respect to the recognised authority figure for that activity within the household
30 householdsrsquo female members place the order for LPG refills
50householdsrsquo female
members decide whether or when to purchase LPG refills
We also find that the decision of whether or when to purchase LPG refills is made by male members in half of urban slum households This holds for both male- and female-headed households In LPG-using households where the primary cook is involved in an income-generating activity more women are deciding to order the refills This pattern is similar irrespective of whether the household uses LPG exclusively or stacks it with other polluting fuels or are PMUY beneficiaries
SPOTLIGHT III A comparison of access to clean cooking energy between urban slum and non-slum households across six states
21
At the state level Bihar has significantly poor involvement of women in intra-household decision-making regarding
ordering refills with less than 10 per cent of households reporting that women decide whether or when to order
refills However more women than men are involved in decisions around LPG refills in Rajasthan Madhya Pradesh
and Jharkhand
Across caste groups the involvement of women is lowest (37 per cent) among the Scheduled Castes (SCs)
However more women in General and OBC households decide when to order LPG refills
BOX 8 Variations in intra-household decision-making across states and caste groups
Cooking fuel adoption and use in urban slum households
To compare the fuel use patterns of urban slum and non-slum households we used data from the India Residential Energy Survey (IRES 2020)15 The overlap in the sampling strategies of both IRES and our survey enabled a comparison of the findings There is a significant difference in the socio-economic status of slum and non-slum households which tends to affect their fuel use patterns Table 4 provides a comparison of cooking fuel usage in urban non-slum households (from IRES 2020) and urban slum households (Cooking Energy Access and Use survey 2020)
Are Indiarsquos Urban Poor Using Clean Cooking Fuels Insights from Slums in Six States22
Table 4 The poor economic condition of households in urban slums impacts the exclusive use of clean fuels for cooking
Source Authorsrsquo analysis
Fuel use categories Urban slum households (Cooking Energy Access Survey) ()
Non-slum urban households (IRES) ()
95 88
84 55
9 33
5 12
Clean fuel users (LPG PNG and electricity)
LPG as an exclusive fuel
Households that stack LPG with polluting fuels
Households that use only polluting fuels
We observed a significant gap in the exclusive use of LPG as a cooking fuel between urban slums and non-slum households explained mainly by the difference in their economic conditions Stacking is three times more common in slum households than non-slum households About 45 per cent of non-slum households using polluting fuels belong to marginalised social groups (SCs and STs) Households using polluting fuels have a lower median monthly expenditure than others and about 62 per cent of such households are semi-pucca or kuchha structures Among LPG users non-slum households have a slightly higher rate of doorstep delivery as compared to slum households
LPG-using households receiving home deliveries
Source Authorsrsquo analysis
239
6372
Urban slum households (Cooking Energy Access and Use)
()
Non-slum urban households (IRES)
()
Proportion of PMUY beneficiaries among LPG-using households
15 IRES 2020 was conducted in 21 large states of India including Bihar Jharkhand Rajasthan Madhya Pradesh Uttar Pradesh and Chhattisgarh While IRES 2020 focused on urban households the Cooking Energy Access and Use survey specifically attended to urban slums in the same districts Refer to the technical note for a detailed methodology of the survey
23
3 Way forward
Slums across the world are chronically ignored in public policy and suffer because of unauthorised and unsafe habitation without access to government services (Shahadat
Lipu and Bhuiyan 2014) In terms of energy access while we see a progressive change in householdsrsquo energy use patterns as we move from rural to urban issues like affordability availability preference and familiarity with the fuel and stove remain essential factors that determine householdsrsquo fuel choice
Image iStock
Are Indiarsquos Urban Poor Using Clean Cooking Fuels Insights from Slums in Six States24
Understanding categories of users is important for enabling access to and use of clean cooking fuels
We categorised the urban slum population based on their fuel usage patterns ndash using only clean fuels stacking clean fuels with polluting fuels and using only polluting fuels While most households in urban slums have an LPG connection only half of them use LPG exclusively The householdrsquos economic status and its access to doorstep delivery of LPG refills are two crucial factors that determine its ability to use LPG exclusively Despite being situated in urban areas 37 per cent of slum households do not receive home delivery of cylinders ndash availability is an essential factor in determining the householdrsquos likelihood of using LPG exclusively There is a strong impetus for the OMCs and distributors to improve their home delivery services of LPG refills in slum areas
Stacking is prevalent in about one-third of households ndash there is a need for a deeper understanding of householdsrsquo preferences fuel end-uses and awareness Most households reported using polluting fuels daily or at least weekly this effectively increases their exposure to household air pollution despite having access to clean cooking fuels Among households that stack LPG with polluting fuels the reasons for stacking differ ndash affordability seasonality and taste preference More than a quarter of households that stack have a similar level of LPG consumption as those that use LPG exclusively despite similar family sizes Such households use polluting fuels not because of their inability to afford LPG But other factors like free-of-cost availability of biomass taste preference for chulha and alternate end-uses of fuelmdashfor instance in space heatingmdashinfluence the householdrsquos decision to use solid fuels Among households that stack multiple fuels the use of polluting fuels increases during winter months this exposes the households to a double burden of high ambient and household air pollution in these months About 40 per cent of these households also use polluting fuels for non-cooking purposes like heating water for bathing and space heating especially in winter
Even with large-scale government initiatives like PMUY we find that more than 10 per cent of urban slum households do not use LPG They mainly rely on free-of-cost biomass for their cooking and non-cooking needs Despite awareness of PMUY among these households the high upfront cost of procuring an LPG connection and high recurring expenditure on refills deter them from using LPG Evidently there is a need to expand the reach of PMUY to cover households across slums
Integrating the issue of lack of access to clean cooking energy within the discussion on urban poverty
This study reiterates the need to look at poverty in urban areas in the context of energy access Given the heterogeneity of poverty in urban and semi-urban India it is essential to understand energy poverty in the context of access to resources for an enhanced quality of life for the urban poor Similarly slums dwellers in large and small cities alike may experience additional challenges of access Furthermore not all urban poor live in slums we know even less about the access issues of temporary residents or seasonal migrants in urban India Therefore in a rapidly urbanising India studies on the urban poor and air quality need to integrate a focus on energy access to address the vulnerability of women children and communities to HAP and the drudgery of using polluting fuels for cooking and other household energy needs
Access to clean cooking energy schemes must be integrated into the social assistance programmes focused on urban poverty alleviation to enhance its reach
25Way forward
Converging energy access in social protection policies for the urban poor
Accounting for the vulnerabilities of the urban poor is crucial in designing and implementing policies including social protection schemes As a health and economic imperative access to clean cooking energy schemes must be integrated into the social assistance programmes of other ministries (eg health education and nutrition assistance) to offer better support to slum households This would also reduce the burden on households of claiming and accessing multiple benefits across schemes thus freeing them to invest more time in productive activities (CEEW 2020) Government programmes such as the National Urban Livelihoods Mission and social service allocations for housing should use existing targeting approaches to include access to clean cooking energy within the ambit of services for the poor
Bringing a renewed emphasis on clean cooking energy access due to COVID-19 is essential
Most households in urban slums rely on daily wage labour or the gig economy for their household income During the COVID-19 pandemic these occupations have been among the worst impacted by the lockdown and the economic slowdown A survey conducted with over 2000 daily wage workers in urban slums during the lockdown suggests that only 7 per cent of respondents from this group received pay during the lockdown (Basu 2020) causing a massive shock to their livelihoods and wage earnings This kind of impact pushes households into energy poverty leading to the increased use of free-of-cost biomass and consequently increasing the risk of exposure to emissions from fuel burning While the government has committed to supplying up to three free refills to all PMUY households under PM-Garib Kalyan Yojana less than a quarter of households in urban slums have Ujjwala connections The low share of PMUY households effectively makes the majority of slum households ineligible for relief support given under the PM-Garib Kalyan Yojana during the lockdown There is a need to target vulnerable households ndash beyond PMUY beneficiaries ndash with differential subsidy support for using LPG in a sustained manner
Increased poverty would mean increased use of polluting fuels ndash there is a need for a renewed emphasis on clean cooking energy access during the COVID-19 pandemic as increased use of polluting fuels has health implications (lower respiratory infections and COPD) that increase the risk of COVID-19 infections being more severe
There is a need to target vulnerable households ndash beyond PMUY beneficiaries ndash with differential subsidy support for using LPG in a sustained manner
Are Indiarsquos Urban Poor Using Clean Cooking Fuels Insights from Slums in Six States
Balakrishnan Kalpana Sagnik Dey Tarun Gupta R S Dhaliwal Michael Brauer Aaron J Cohen Jeffrey D Stanaway et al 2019 ldquoThe Impact of Air Pollution on Deaths Disease Burden and Life Expectancy Across the States of India The Global Burden of Disease Study 2017rdquo The Lancet Planetary Health 3 (1) e26ndash39 httpsdoiorg101016S2542-5196(18)30261-4
Baqir M S K Bharti R Kothari and R P Singh 2019 ldquoAssessment of an Energy-efficient Metal Chulha for Solid Biomass Fuel and Evaluation of its Performancerdquo International Journal of Environmental Science and Technology 16 (11) 6773ndash6784 httpsdoiorg101007s13762-018-2028-9
Basu Anika Badyal 2020 ldquoLockdown Survey How The Covid-19 Crisis Has Affected Daily Wage WorkersmdashAIFrdquo American India Foundation June 28 httpsaiforglockdown-survey-how-the-covid-19-crisis-has-affected-daily-wage-workers
Butera F M P Caputo R Adhikari and A Facchini 2016 ldquoThe Challenge of Energy in Informal Settlements A Review of the Literature for Latin America and Africardquo Procedia Engineering 1ndash32 httpswwwenelfoundationorgcontentdamenel-foundtopic-downloadThe challenge of Energy in Informal settlementspdf
CEEW 2020 ldquoEnergy Safety Nets India Case Studyrdquo Vienna Sustainable Energy for All httpswwwceewinpublicationsenergy-safety-nets-india-case-study
Central Pollution Control Board 2014 ldquoNational Air Quality Indexrdquo New Delhi Central Pollution Control Board httpsappcpcbccrcomccr_docsFINAL-REPORT_AQI_pdf
Chafe Z S Mehta and K R Smith 2011 ldquoAmbient Fine Particulate (PM25) Air Pollution Attributable to Household Cooking Fuel in Asiardquo AGUFM A54Bndash03 httpsuiadsabsharvardeduabs2011AGUFMA54B03Cabstract
Chandramouli C 2010 ldquoCensus of India 2011 ndash Circular No 8rdquo New Delhi Ministry of Home Affairs httpscensusindiagovin2011-CircularsCircularsCircular-08pdf
Chandrasekhar S and Arup Mitra 2018 ldquoMigration Caste and Livelihood Evidence from Indian City-slumsrdquo Urban Research amp Practice 12 (2) 156ndash172 httpsdoiorg1010801753506920181426781
Cheng Chao Yo and Johannes Urpelainen 2014 ldquoFuel Stacking in India Changes in the Cooking and Lighting Mix 1987ndash2010rdquo Energy 76 (November) 306ndash317 httpsdoiorg101016jenergy201408023
Chowdhary Sourangsu Sagnik Dey Sarath Guttikunda Ajay Pillarisetti Kirk R Smith and Larry Di Girolamo 2019 ldquoIndian annual ambient air quality standard is achievable by completely mitigating emissions from household sourcesrdquo Proceedings of the National Academy of Sciences 116 (22) 10711-10716 httpsdoiorg101073pnas1900888116
Dhingra Chhavi Shikha Gandhi Akanksha Chaurey and P K Agarwal 2008 ldquoAccess to Clean Energy Services for the Urban and Peri-Urban Poor A Case-study of Delhi Indiardquo Energy for Sustainable Development 12 (4) 49ndash55 httpsdoiorg101016S0973-0826(09)60007-7
Farsi Mehdi Massimo Filippini and Shonali Pachauri 2007 ldquoFuel Choices in Urban Indian Householdsrdquo Environment and Development Economics 12 (6) 757ndash774 httpsdoiorg101017S1355770X07003932
References
26
Frontera Antonio Lorenzo Cianfanelli Konstantinos Vlachos Giovanni Landoni and George Cremona 2020 ldquoSevere Air Pollution Links to Higher Mortality in COVID-19 Patients The lsquoDouble-Hitrsquo Hypothesisrdquo Journal of Infection 81 (2) 255ndash259 httpsdoiorg101016jjinf202005031
Ganguly Tanushree Kurinj L Selvaraj Sarath K Guttikunda 2020 ldquoNational Clean Air Programme (NCAP) for Indian cities Review and outlook of clean air action plansrdquo Atmospheric Environment X Vol 8 httpsdoiorg101016jaeaoa2020100096
GNESD 2008 ldquoClean Energy for the Urban Poor An Urgent Issuerdquo Accessed 25 July 2020 httpswwwgooglecomurlsa=tamprct=jampq=ampesrc=sampsource=webampcd=ampved=2ahUKEwi1hf2ru dntAhUCOisKHQH7BtsQFjAAegQIAxACampurl=http3A2F2Fwwwgnesdorg2F-2Fmedia2FSites2FGNESD2FPublication- pdfs2FSPM_CleanEnergyashx3Fla3Dda26hash3DE4971C585B6798F17954F8B42E073 D9507F42A84ampusg=AOvVaw08kCDgOkTkYc6wRDxzsNyq
Guan Wei-Jie Wen-Hua Liang Yi Zhao Heng-Rui Liang Zi-Sheng Chen Yi-Min Li Xiao-Qing Liu et al 2020 ldquoComorbidity and its Impact on 1590 Patients with COVID-19 in China A Nationwide Analysisrdquo European Respiratory Journal 55 (5) 2000547 httpsdoiorg1011831399300300547-2020
Harish Santosh Kirk R Smith Sourangsu Chowdhury Zoe A Chafe Ajay Pillarisetti Jos Lelieveld Sarath Guttikunda Sagnik Dey and Andrew P Grieshop 2019 ldquoThe Contribution of Household Fuels to Ambient Air Pollution in India A Comparison of Recent Estimates Edited by CcapcOrgInrdquo Collaborative Clean Air Policy Centre May 30 httpsccapcorginpolicy-briefs2019530the-contribution-of-household-fuels-to-ambient-air-pollution-in-india-a-comparison-of-recent-estimates
Jain Abhishek Saurabh Tripathi Sunil Mani Sasmita Patnaik Tauseef Shahidi and Karthik Ganesan 2018 ldquoAccess to Clean Cooking Energy and Electricity Survey of States 2018rdquo New Delhi CEEW httpswwwceewinsitesdefaultfilesCEEW-Access-to-Clean-Cooking-Energy-and-Electricity-11Jan19_0pdf
Johnson Priscilla Kalpana Balakrishnan Padmavathi Ramaswamy Santu Ghosh Muthukumar Sadhasivam Omprakash Abirami Bernard W C Sathiasekaran Kirk R Smith Vijayalakshmi Thanasekaraan and Arcot S Subhashini 2011 ldquoPrevalence of Chronic Obstructive Pulmonary Disease in Rural Women of Tamilnadu Implications for Refining Disease Burden Assessments Attributable to Household Biomass Combustionrdquo Global Health Action 4 (1) 7226 httpsdoiorg103402ghav4i07226
Kilic Talip Heather Moylan and Gayatri Koolwal 2020 ldquoGetting the (Gender-disaggregated) Lay of the Land Impact of Survey Respondent Selection on Measuring Land Ownership and Rightsrdquo Washington DC The World Bank httpsdoiorg1015961813-9450-9151
Kojima Masami Robert Bacon and Xin Zhou 2011 ldquoWho Uses Bottled Gas Evidence from Households in Developing Countriesrdquo The World Bank Sustainable Energy Department Oil Gas and Mining Unit httpelibraryworldbankorgdoibook1015961813-9450-5731
Kuo Ying-Min and Mehtabul Azam 2019 ldquoHousehold Cooking Fuel Choice in India 2004ndash2012 A Panel Multinomial Analysisrdquo IZA Discussion Paper No 12682 httpsssrncomabstract=3468630
Lippi Giuseppe and Brandon Michael Henry 2020 ldquoChronic Obstructive Pulmonary Disease Is Associated with Severe Coronavirus Disease 2019 (COVID-19) COPD and COVID-19rdquo Respiratory Medicine 167 105941 httpsdoiorg101016jrmed2020105941
Ministry of Housing and Urban Affairs 2019 ldquoHandbook of Urban Statisticsrdquo New Delhi Government of India httpmohuagovinpdf5c80e2225a124Handbook of Urban Statistics 2019pdf
Rao M Narasimha and B Sudhakara Reddy 2007 ldquoVariations in Energy Use by Indian Households An Analysis of Micro Level Datardquo Energy 32 (2) 143ndash153 httpsdoiorg101016jenergy200603012
27References
Are Indiarsquos Urban Poor Using Clean Cooking Fuels Insights from Slums in Six States28
National Buildings Organisation 2013 ldquoState of Slums in India a Statistical Compendium 2013rdquo New Delhi Government of India httpnbonicinpdfSlums_in_India_Compendium_English_Versionpdf
National Sample Survey Office 2012 ldquoKey Indicators of Urban Slums in India ndash 69th Roundrdquo New Delhi National Data Bank for Socio-religious Categories httpmospinicinsitesdefaultfilesnational_data_bankndb-rpts-69htm
Nolan Laura B 2015 ldquoSlum Definitions in Urban India Implications for the Measurement of Health Inequalitiesrdquo Population and Development Review 41 (1) 59ndash84 httpsideasrepecorgablapopdevv41y2015i1p59-84html
Nolan Laura B David E Bloom and Ramnath Subbaraman 2018 ldquoLegal Status and Deprivation in Urban Slums Over Two Decadesrdquo HHS Public Access 53 (15) 47ndash55
Patel Amit 2020 ldquoPreventing COVID-19 Amid Public Health and Urban Planning Failures in Slums of Indian Citiesrdquo World Medical amp Health Policy 12 (3) httpsdoiorg101002wmh3351
Patnaik Sasmita and Shaily Jha 2020 ldquoCaste Class and Gender in Determining Access to Energy A Critical Review of LPG Adoption in Indiardquo Energy Research amp Social Science 67 (September) 101530 httpsdoiorg101016jerss2020101530
PPAC-CRISIL 2016 ldquoAssessment Report Primary Survey on Household Cooking Fuel Usage and Willingness to Convert to LPGrdquo New Delhi Petroleum Planning amp Analysis Cell Ministry of Petroleum and Natural Gas Government of India httpswwwppacgovinWriteReadDataReports201710310449342512219PrimarySurveyReportPPACpdf
PPAC 2019 ldquoOil Industry Information at a Glancerdquo New Delhi Ministry of Petroleum and Natural Gas Government of India httpswwwppacgovinWriteReadDataReports201912060336500305462ReadyReckonerNov2019WebVersionpdf
Rahaman Mehebub and Dipendra Nath Das 2017 ldquoNature of Slum Growth in Indian Citiesrdquo Urban India 37 (II) 100ndash116 httpswwwresearchgatenetpublication334051882_Nature_of_Slum_Growth_in_Indian_Citiesread
Rains Emily Anirudh Krishna and Erik Wibbels 2018 ldquoUrbanisation and Indiarsquos Slum Continuum Evidence on the Range of Policy Needs and Scope of Mobilityrdquo London International Growth Centre httpswwwtheigcorgwp-contentuploads201802Rains-et-al_Working-paper_coverpdf
Ranjan Rahul and Sudershan Singh 2017 ldquoEnergy Deprivation of Indian Households Evidence from NSSO Datardquo New Delhi Munich Personal RePEc Archive httpsmpraubuni-muenchende835661MPRA_paper_83566pdf
Roy Debraj Bharath Palavalli Niveditha Menon Robin King Karin Pfeffer Michael Lees and Peter M A Sloot 2018 ldquoSurvey-based Socio-economic Data from Slums in Bangalore Indiardquo Nature Publishing Group 5 1ndash9 httpsdoiorg101038sdata2017200
Saksena Sumeet P B Singh Raj Kumar Prasad Rakesh Prasad Preeti Malhotra Veena Joshi and R S Patil 2003 ldquoExposure of Infants to Outdoor and Indoor Air Pollution in Low-income Urban Areas A Case Study of Delhirdquo Journal of Exposure Science amp Environmental Epidemiology 13 219ndash30 httpsdoiorg101038sjjea7500273
Lipu Molla Shahadat Hossain and Arif Waliullah Bhuiyan 2014 ldquoElectricity Access in Urban Slum Households of Bangladesh A Case of Dhakardquo Journal of Renewable and Sustainable Energy 6 (053112) 1ndash15 httpsdoiorg10106314896697
29
Singh Rozita Xiao Wang Emmanuel Ackom and Juan Reyes 2015 ldquoEnergy Access Realities in Urban Poor Communities of Developing Countries Assessments and Recommendationsrdquo Global Network on Energy for Sustainable Development (GNESD) httpswwwgooglecomurlsa=tamprct=jampq=ampesrc=sampsource=webampcd=ampved=2ahUKEwj5nbqI wdntAhXUTX0KHZE6DboQFjAAegQIAhACampurl=https3A2F2Forbitdtudk2Ffiles2F10635 24942FEnergy_access_realities_v_final_updatedpdfampusg=AOvVaw0xNBAAo0bjLueY9FmoigKF
Singh Santosh 2014 ldquoThe Kaleidoscope of Cooking Understanding Cooking Behaviour and Stove Preferences in Rural Indiardquo New Delhi Deutsche Gesellschaft fuumlr Internationale Zusammenarbeit (GIZ) GmbH httpswwwgizdeendownloadsgiz2014-en-kaleidoscope-of-cooking-indiapdf
Smith Kirk R and Ajay Pillarisetti 2017 ldquoHousehold Air Pollution from Solid Cookfuels and its Effects on Healthrdquo Disease Control Priorities 7 (3) 133ndash52 httpsdoiorg101596978-1-4648-0522-6_ch7
UN-Habitat 2003 ldquoThe Challenge of Slums ndash Global Report on Human Settlements 2003rdquo Location of publishing London UN-Habitat httpsunhabitatorgthe-challenge-of-slums-global-report-on-human-settlements-2003
Wang Bolin Ruobao Li Zhong Lu and Yan Huang 2020 ldquoDoes Comorbidity Increase the Risk of Patients with COVID-19 Evidence from Meta-analysisrdquo Aging 12 (7) 6049ndash6057 httpsdoiorg1018632AGING103000
WHO 2014 ldquoWHO Guidelines for Indoor Air Quality Household Fuel Combustionrdquo WHO Accessed 25 July 2020 httpwwwwhointairpollutionguidelineshousehold-fuel-combustionen
World Bank 2020 ldquoThe State of Modern Energy Cooking Servicesrdquo Washington DC World Bank httpdocuments1worldbankorgcurateden937141600195758792pdfThe-State-of-Access-to-Modern-Energy-Cooking-Servicespdf
Yenneti Komali Yehua Dennis Wei and Wen Chen 2017 ldquoThe Urbanization of Poverty in India Spatio-temporal Disparities in Consumption Expendituresrdquo Geographical Review 107 (2) 360ndash383 httpsdoiorg101111j1931-0846201612167x
References
Are Indiarsquos Urban Poor Using Clean Cooking Fuels Insights from Slums in Six States
Annexure 1 Asset ownership index We used Filmer and Pritchettrsquos (2001) proposed approach to construct an asset ownership index using principal component analysis (PCA) We chose the indicators based on data from the Cooking Energy Access survey 2020 The variables we considered for the index were based on classifications by Caroline Moser and Andrew Felton (2007) and K Harttgen (2013) We computed the asset index using housing characteristics and consumer durables as follows
Variables not included in the asset index
Four types of variables were eliminated
1 Variables (such as grid electricity) that had high usage of greater than 95 per cent
2 Those (such as ownership of laptops or computers air conditioners etc) that had a low usage of less than 5 per cent
3 Variables (like house ownership) that have economically fluctuating values
4 Those that indicated a low correlation of less than 20 per cent variation between the top category (ie first) of the asset quintile and the bottom-most category (ie fifth) of the asset quintile
For ease of interpretation we rescaled this index such that the final index values range between 0 and 10 For this purpose we used a feature scaling (or minndashmax scaling) formula
Xnorm (or (IVx)) = (X ndash Xmin)(Xmax ndash Xmin)
where IVx is the normalised index value Xmin is the initial minimum value (-354) and Xmax is the initial maximum value (461) of the asset ownership index
30
Annexures
bull Crowding16 inside the house bull Toilet ownership and usage bull Source of water bull Number of pucca rooms
bull Ownership of two-wheeler bull Ownership of washing machine bull Ownership of television bull Ownership of refrigerator bull Ownership of cooker
16 A household with more than three members occupying a single room is considered crowded (World Health Organization 2018)
Housing characteristics
Consumer durables
Annexure 2 Explaining the use of LPG as the exclusive fuel (simple logistic regression model)
31Annexures
Dependent variable exclusive LPG use
Education of the primary cook (categorical base category is education beyond the school level)
Education of the household head (categorical base category is education beyond the school level)
State (categorical base category includes households from Rajasthan)
P gt z 95 confidence interval
Odds ratio (SE)
1299 (0112)
0659 (0202)
1399 (0394)
0970 (0038)
0994 (0011)
1003 (0013)
2042 (0508)
1011 (0046)
0782 (0441)
1198 (0608)
1377 (0664)
1345 (0566)
3141 (1103)
1213 (0500)
0309 (0211)
1165 (0565)
1703 (0680)
0002
0174
0233
0446
0583
0839
0004
0812
0663
0722
0507
0482
0001
0639
0086
0753
0182
1097
0361
0806
0898
0973
0977
1254
0924
0259
0443
0535
0589
1578
0541
0081
0450
0779
1540
1203
2428
1048
1016
1029
3327
1106
2361
3240
3545
3070
6251
2720
1181
3014
3723
Asset index
Primary cook involved in income-generating activity
Female-headed households
Household size
Age of household head
Age of primary cook
Doorstep delivery of LPG cylinders
PMUY customer
Primary cook is not educated
Primary cook has a school education
Household head is not educated
Household head has a school education
Uttar Pradesh
Bihar
Chhattisgarh
Jharkhand
Madhya Pradesh
Number of households (n) = 417
Log likelihood = -228777
Prob gt chi2 = 0000
Pseudo R2 = 0126
The dependent variable is a dummy variable where households using LPG exclusively are assigned a value of 1 and all other households are assigned the value of 0
The caste of the household has not been factored into the regression as a separate variable because of its underlying influence on economic status
Source Authorsrsquo analysis
Are Indiarsquos Urban Poor Using Clean Cooking Fuels Insights from Slums in Six States
Annexure 3 Air quality (PM25 concentration in μgm3) across 15 districts based on CAAQMS data
32
Dis
tric
tsM
ar-1
9A
pr-1
9M
ay-1
9Ju
n-19
Jul-1
9A
ug-1
9Se
p-19
Oct
-19
Nov
-19
Dec
-19
Jan-
20Fe
b-20
Mar
-20
794
5
988
5
866
7
-
645
329
2
453
7
388
1
769
1
886
4
661
5
950
9
834
4
-
823
4
611
7
569
9
535
7
-
270
4
589
4
571
5
293
1
705
4
839
2
614
9
970
1
826
8
-
844
9
622
1
597
1
564
0
-
235
3
414
3
619
1
414
3
653
9
834
7
568
8
104
90
739
8
-
894
9
630
9
342
2
450
4
-
476
465
2
474
6
429
2
592
3
566
1
-
674
6
531
4
501
5
568
7
450
8
-
320
3
-
846
506
3
349
5
332
4
369
1
387
2
-
430
4
393
6
353
7
446
2
406
8
335
2
339
1
-
102
9
497
2
261
8
269
1
431
4
294
1
-
351
6
277
3
-
336
5
315
5
248
3
392
8
149
7
144
9
462
3
270
5
331
3
273
4
276
0
106
6
391
7
326
2
-
368
6
625
3
875
2
101
64
521
2
183
1
380
4
556
2
544
1
558
2
102
24
104
33
156
44
128
73
146
62
137
71
109
14
183
70
201
80
896
7
190
1
457
7
581
2
583
5
815
4
135
00
126
41
239
94
208
15
158
51
221
86
121
35
192
46
218
43
848
0
205
2
448
5
509
4
582
0
704
5
177
01
613
1
244
01
215
80
136
87
230
54
964
2
201
52
122
30
725
5
120
6
435
4
454
7
481
2
111
37
147
45
537
3
175
53
162
86
111
21
170
08
583
8
132
10
866
2
513
1
112
5
511
3
507
5
511
8
879
4
120
22
502
1
135
53
116
39
994
7
120
45
410
5
792
1
674
8
326
3
177
6
385
0
408
5
335
9
497
2
594
2
429
9
673
2
547
5
540
8
559
4
Gay
a
Muz
affa
rpur
Pat
na
Bho
pal
Satn
a
Alw
ar
Ajm
er
Ud
aip
ur
Ag
ra
Bul
and
shah
r
Hap
ur
Gha
ziab
ad
Gre
ater
Noi
da
Mee
rut
Noi
da
Sour
ce C
onti
nuou
s am
bien
t air
qua
lity
mon
itor
ing
stat
ion
(Mar
ch 2
019
ndash M
arch
202
0)
In a rapidly urbanising India it would be imperative for policymakers and practitioners in energy and urban development sector to integrate access to clean cooking energy within the ambit of services for the urban poor
Image CEEW
Are Indiarsquos Urban Poor Using Clean Cooking Fuels Insights from Slums in Six States
COUNCIL ON ENERGY ENVIRONMENT AND WATER (CEEW)
Sanskrit Bhawan A-10 Aruna Asaf Ali Marg Qutab Institutional AreaNew Delhi - 110 067 IndiaT +91 11 4073 3300
infoceewin | ceewin | CEEWIndia
Are Indiarsquos Urban Poor Using Clean Cooking Fuels Insights from Slums in Six States
Copyright copy 2021 Council on Energy Environment and Water (CEEW)
Open access Some rights reserved This work is licensed under the Creative Commons
Attribution Noncommercial 40 International (CC BY-NC 40) license To view the full license visit
wwwcreativecommonsorglicensesby-nc40legalcode
Suggested citation Jha Shaily Sasmita Patnaik and Rithima Warrier 2021 Are Indiarsquos Urban Poor Using Clean Cooking Fuels
Insights from Slums in Six States New Delhi Council on Energy Environment and Water
Disclaimer The views expressed in this issue brief are those of the authors and do not necessarily reflect the views
and policies of Council on Energy Environment and Water The views analysis expressed in this study do
not necessarily reflect the views of the MacArthur Foundation The Foundation also does not guarantee
the accuracy of any data included in this publication nor does it accept any responsibility for the
consequences of its use
Cover image iStock
Peer reviewers Ashish Gupta PhD student University of Pennsylvania Vinaya Padmanabhan Consultant Oxford Policy
Management and Abhishek Jain Fellow and Director-Powering Livelihoods CEEW
Publication team Alina Sen (CEEW) The Clean Copy Twig Designs and Friends Digital
Organisation The Council on Energy Environment and Water (CEEW) is one of Asiarsquos leading not-for-profit policy
research institutions The Council uses data integrated analysis and strategic outreach to explain ndash and
change ndash the use reuse and misuse of resources It prides itself on the independence of its high-quality
research develops partnerships with public and private institutions and engages with wider public In
2021 CEEW once again featured extensively across ten categories in the 2020 Global Go To Think Tank
Index Report The Council has also been consistently ranked among the worldrsquos top climate change think
tanks Follow us on Twitter CEEWIndia for the latest updates
Council on Energy Environment and Water Sanskrit Bhawan A-10 Qutab Institutional Area Aruna Asaf Ali Marg New Delhi - 110067 India
About CEEW
The Council on Energy Environment and Water (CEEW) is one of Asiarsquos leading not-for-profit policy research institutions The Council uses data integrated analysis and strategic outreach to explain mdash and change mdash the use reuse and misuse of resources The Council addresses pressing global challenges through an integrated and internationally focused approach It prides itself on the independence of its high-quality research develops partnerships with public and private institutions and engages with the wider public
The Councilrsquos illustrious Board comprises Mr Jamshyd Godrej (Chairperson) Mr Tarun Das Dr Anil Kakodkar Mr S Ramadorai Mr Montek Singh Ahluwalia Dr Naushad Forbes Ambassador Nengcha Lhouvum Mukhopadhaya and Dr Janmejaya Sinha The 100 plus executive team is led by Dr Arunabha Ghosh CEEW is certified as a Great Place To Workreg
In 2021 CEEW once again featured extensively across ten categories in the 2020 Global Go To Think Tank Index Report including being ranked as South Asiarsquos top think tank (15th globally) in our category for the eighth year in a row CEEW has also been ranked as South Asiarsquos top energy and resource policy think tank for the third year running It has consistently featured among the worldrsquos best managed and independent think tanks and twice among the worldrsquos 20 best climate think tanks In ten years of operations The Council has engaged in 278 research projects published 212 peer-reviewed books policy reports and papers created 100+ new databases or improved access to data advised governments around the world nearly 700 times promoted bilateral and multilateral initiatives on 80+ occasions and organised 350+ seminars and conferences In July 2019 Minister Dharmendra Pradhan and Dr Fatih Birol (IEA) launched the CEEW Centre for Energy Finance In August 2020 Powering Livelihoods mdash a CEEW and Villgro initiative for rural start-ups mdash was launched by Minister Mr Piyush Goyal Dr Rajiv Kumar (NITI Aayog) and HE Ms Damilola Ogunbiyi (SEforAll) The Councilrsquos major contributions include The 584-page National Water Resources Framework Study for Indiarsquos 12th Five Year Plan the first independent evaluation of the National Solar Mission Indiarsquos first report on global governance submitted to the National Security Adviser irrigation reform for Bihar the birth of the Clean Energy Access Network work for the PMO on accelerated targets for renewables power sector reforms environmental clearances Swachh Bharat pathbreaking work for the Paris Agreement the HFC deal the aviation emissions agreement and international climate technology cooperation the concept and strategy for the International Solar Alliance (ISA) the Common Risk Mitigation Mechanism (CRMM) critical minerals for Make in India modelling uncertainties across 200+ scenarios for Indiarsquos low-carbon pathways Indiarsquos largest multidimensional energy access survey (ACCESS) climate geoengineering governance circular economy of water and waste and the flagship event Energy Horizons It recently published Jobs Growth and Sustainability A New Social Contract for Indiarsquos Recovery
The Councilrsquos current initiatives include A go-to-market programme for decentralised renewable energy-powered livelihood appliances examining country-wide residential energy consumption patterns raising consumer engagement on power issues piloting business models for solar rooftop adoption developing a renewable energy project performance dashboard green hydrogen for industry decarbonisation state-level modelling for energy and climate policy reallocating water for faster economic growth creating a democratic demand for clean air raising consumer awareness on sustainable cooling and supporting Indiarsquos electric vehicle and battery ambitions It also analyses the energy transition in emerging economies including Indonesia South Africa Sri Lanka and Viet Nam
The Council has a footprint in 21 Indian states working extensively with state governments and grassroots NGOs It is supporting power sector reforms in Uttar Pradesh and Tamil Nadu scaling up solar-powered irrigation in Chhattisgarh supporting climate action plans in Gujarat and Madhya Pradesh evaluating community-based natural farming in Andhra Pradesh examining crop residue burning in Punjab and promoting solar rooftops in Delhi and Bihar
Are Indiarsquos Urban Poor Using Clean Cooking Fuels Insights from Slums in Six States
Acknowledgments
The authors would like to thank the partners for this survey Initiative for Sustainable Energy Policy (ISEP) at the Johns Hopkins School of Advanced International Studies (SAIS) We would like to extend our gratitude to Prof Johannes Urpelainen (Johns Hopkins SAIS) Carlos F Gould (Columbia University) and Alice Tianbo Zhang (Washington and Lee University) for leading the design of the survey instrument and giving us regular inputs and feedback in various stages of survey planning and implementation We would also like to thank our colleagues at CEEW Kurinji Selvaraj and Tanushree Ganguly for providing the district level air quality data for the analysis
The authors would like to acknowledge the valuable support of Market Xcel Private Ltd the survey agency and its survey team for administering the survey and collecting data Our deepest gratitude goes to them Special thanks to Prasenjit Saha and Pooja Sirpaul (Market Xcel Private Ltd) who were instrumental in implementing the survey We would also like to thank the MacArthur Foundation for financially supporting the study
We want to thank our reviewersmdashAshish Gupta University of Pennsylvania Vinaya Padmanabhan Oxford Policy Management and Abhishek Jain CEEWmdashfor providing critical feedback and comments that went a long way in refining this report
Are Indiarsquos Urban Poor Using Clean Cooking Fuels Insights from Slums in Six States
Shaily Jha shailyjhaceewin
Shaily is a Research Analyst in the Energy Access team at The Council She works on access to clean cooking energy and livelihoods with a focus on gender and social inclusion Shaily holds a postgraduate degree in Disaster Management from the Tata Institute of Social Sciences (TISS) Mumbai and an undergraduate degree in Geography from Miranda House University of Delhi
Sasmita Patnaik sasmitaapatnaikgmailcom
Sasmita is a former Programme Lead of the Energy Access team at The Council She led the work on access to clean cooking and livelihoods with a focus on gender and social inclusion She holds an MSc in Development Studies from the School of Oriental and African Studies (SOAS) and a postgraduate diploma in Rural Management from Xavier Institute of Management Bhubaneswar (XIMB)
Rithima Warrier rithima2warriergmailcom
Rithima worked as Research Consultant at The Council where she analysed primary data on energy access for rural households and urban slums of India Rithima holds an MTech in Bioscience and Bioengineering with a specialisation in Energy from the Indian Institute of Technology Guwahati (IITG) and a BE in Chemical Engineering from MS Ramaiah Institute of Technology (MSRIT) Bangalore
The authors
ldquoEven though the use of LPG as an exclusive cooking fuel is more prominent in urban households than their rural counterparts a significant share of the urban population living in slums is struggling to incorporate the cost of using LPG into the household budget The pollution burden for these households is doubled as they are exposed to the high ambient particulate matter pollution of cities along with the household air pollution from the use of polluting cooking fuelsrdquo
ldquoDuring data analysis we realised that even within polluting fuel-using slum households the reasons for not transitioning towards cleaner fuel varied between the households that stacked LPG with polluting fuels and the ones that only used polluting fuels Moreover the economic impact of COVID-19 is expected to further hinder the transition to cleaner fuels in these slumsrdquo
ldquoPolicies on clean cooking energy access have not necessarily targeted energy poverty in urban slums In a rapidly urbanising country facing a crisis of air pollution and now recovering from the economic impacts of COVID-19 it is time that we target policies to alleviate energy poverty in urban slums particularly in Tier 2 and Tier 3 cities Women and children are the worst affected by the use of polluting fuels reinforcing the need to focus on womenrsquos ability to use clean cooking energy solutions even after schemes like Pradhan Mantri Ujjwala Yojanardquo
Are Indiarsquos Urban Poor Using Clean Cooking Fuels Insights from Slums in Six States
Image iStock
Urban slums suffer from the double burden of pollution as they are exposed to the high ambient particulate matter pollution of cities along with the household air pollution (HAP) from the using unclean cooking fuels
Contents
Executive summary
Annexures
References
2 Cooking fuel adoption and use in urban slum households
21 Households using LPG as their only fuel 22 Households stacking LPG with polluting fuels 23 Households using only polluting fuels
SPOTLIGHT I Household air pollution (HAP) in urban slums
SPOTLIGHT II Womenrsquos participation in intra-household decision-making regarding LPG use
SPOTLIGHT III A comparison of access to clean cooking energy between urban slum and non-slum households across six states
3 Way forward
11 Motivation and methodology 12 Socio-economic characteristics of the urban slums of the six states
1 Introduction state of Indiarsquos urban slums 1
7
17
20
21
23
26
30
24
8
1116
i
Are Indiarsquos Urban Poor Using Clean Cooking Fuels Insights from Slums in Six States
Tables
Table 1 Sample allocation across urban slums
Table 2 Less than one-third of urban slum households reported income from salaried jobs
Table 3 Scheduled Castes and Scheduled Tribes have the lowest economic status
Table 4 The poor economic condition of households in urban slums impacts the use of clean fuels exclusively for cooking
Figures
Figure ES1 To reduce the health impacts from HAP households that are stacking with polluting fuels will need to transition to exclusive use of clean cooking fuels
Figure ES2 While stacking is highest among the middle categories (second and third quintile) it is prevalent across all asset quintiles including the highest one
Figure 1 Within slums there are considerable state-level variations in householdsrsquo fuel usage patterns across states
Figure 2 While the majority of LPG-using households use the fuel primarily only half of them use it exclusively
Figure 3 Most households using LPG exclusively acquire six to eight cylinders per year
Figure 4 Of the households that stack fuels most use LPG as their primary fuel
Figure 5 Stacking is prevalent in households across asset quintile categories
Figure 6 Almost half of the households using polluting fuels use it every day
Figure 7 Proportion of urban slum households using solid fuels as the primary cooking fuel increases during the winters months aggravating householdsrsquo air pollution exposure due to unfavourable atmospheric conditions
Figure 8 Lack of awareness about receiving LPG refill subsidies poses a threat to the success of LPG subsidy schemes
Figure 9 More than half of the households currently without LPG do not know how to get a connection or whom to ask about it implying a lack of awareness
5
5
3
22
ii
iii
8
8
9
11
12
13
14
15
16
Acronyms
BPL below poverty line
CAAQMS continuous ambient air quality monitoring stations
COPD chronic obstructive pulmonary disease
COVID coronavirus disease
DALY disability-adjusted life year
DBTL Direct Benefit Transfer scheme for LPG
HAP household air pollution
IRES India Residential Energy Survey
LPG liquified petroleum gas
NSSO National Sample Survey Office
OBC Other Backward Castes
OMCs oil and marketing companies
PMUY Pradhan Mantri Ujjwala Yojana
SC Scheduled Caste
SDI socio-demographic index
ST Scheduled Tribes
Are Indiarsquos Urban Poor Using Clean Cooking Fuels Insights from Slums in Six States
Image iStock
To reduce the health impacts from household air pollution slum households that are stacking polluting fuels will need to transition using clean cooking fuels exclusively
With increased urbanisation India is experiencing acute air pollution in its urban centres Slum dwellers are doubly affected both by the higher concentration of
particulate matter in urban areas as well as indoor air pollution from the use of unclean cooking fuels With more than 137 million people living in slums in country (Census 2011) there is a strong impetus to understand the use of clean cooking fuels in such households Existing literature on energy access and use in slums across developing countries assume that energy infrastructure is available in these settlements as they are situated in urban environments (Butera et al 2016) Household air pollution (HAP) has an estimated average contribution of 30ndash50 per cent to ambient air quality across Indiarsquos urban and rural areas (Balakrishnan et al 2019) Addressing biomass burning for cooking water heating and space heating during the winters has the potential to help reach the national ambient air quality standards (Chowdhury et al 2019)
However our analysis shows that a large share of these households do not have access to clean fuels due to lack of afforability or patchy supply In this brief we discuss access to clean cooking energy in urban slums across six states (Bihar Uttar Pradesh Rajasthan Madhya Pradesh Jharkhand and Chhattisgarh) These states have a low socio-demographic index and a high disease burden due to air pollution (Balakrishnan et al 2019) The findings of this brief are based on a primary survey conducted in rural areas and urban slums in these states ndash Cooking Energy Access Survey 20201 The analysis focuses on the fuel use patterns of households the extent of use of LPG and solid fuels fuel stacking behaviour and the primary cookrsquos perception of various cooking fuels and their health impacts
Slum households vary widely in their use of clean cooking fuels Therefore to understand their cooking energy use patterns better we categorised these households into three groups
Using clean fuels exclusively
Stacking clean fuels with polluting fuels and
Using only polluting fuels
Use of LPG as primary fuel
82 (Cooking Energy Access Survey 2020)
47 (Census 2011)
Polluting fuel as primary fuel
16 (Cooking Energy Access Survey 2020)
52 (Census 2011)
i
Executive summary
1 This has been referred as lsquoour surveyrsquo thereafter
In this brief the use of clean cooking fuels is considered synonymous to use of LPG
Are Indiarsquos Urban Poor Using Clean Cooking Fuels Insights from Slums in Six States
1 Households using LPG as their only fuelWhile most urban slum households have an LPG connection exclusive use of LPG is limited to just over half of the total households The householdrsquos economic status (measured through asset ownership) and their access to doorstep delivery of LPG refills are two critical factors that determine their ability to use LPG exclusively We found that households with higher asset ownership have significantly higher odds of using LPG as an exclusive fuel
2 Households stacking LPG with polluting fuelsAlthough schemes like Pradhan Mantri Ujjwala Yojana (PMUY) have helped increase LPG adoption this has not resulted in the complete replacement of biomass-based fuels Despite 86 per cent of households having an LPG connection the data shows that over a third of slum households are stacking with polluting fuels (including firewood dung cakes agriculture residue charcoal and kerosene) Most of these households use polluting fuels daily or at least weekly which increases their exposure to household air pollution
Among the households stacking LPG with polluting fuels the reasons for stacking vary affordability free-of-cost availability of biomass seasonality and taste preferences Across asset quintiles we find that stacking is highest among the middle categories (second and third quintile) though most households in these categories have adopted LPG Still the affordability of the fuel remains a significant concern One-fourth of households who are stacking polluting fuels have a median annual refill rate of eight cylinders and above (same as exclusive LPG users) despite having a similar household size as those using LPG exclusively Most of such households fall in the wealthiest asset quintiles and use a chulha (mud stove) for cooking chapatis or vegetables suggesting that they are not necessarily using unclean fuels due to the unaffordability of LPG but due to other factors like taste
ii
Figure ES1 To reduce the health impacts from household air pollution (HAP) households that are stacking with polluting fuels will need to transition to exclusive use of clean cooking fuels
Source Authorsrsquo analysis
Exclusive clean fuel users
Stacking with LPG as the primary fuel
Only polluting fuel users
Stacking LPG with polluting fuels
Stacking with LPG as the secondary fuel
55
3388
12
12
63 LPG-using households receive doorstep delivery of cylinders
77
households receiving doorstep delivery of LPG cylinders are exclusive users of the fuel
Despite increased LPG adoption stacking is prevalent in more than one-third of the slum households
iiiExecutive summary
Figure ES2 While stacking is highest among the middle categories (second and third quintile) it is prevalent across all asset quintiles including the highest one
Source Authorsrsquo analysis
21 Non-cooking uses of polluting fuels Despite using LPG as the primary fuel for their cooking needs households that stack fuels use polluting fuels for non-cooking purposes like heating water for bathing (29 per cent) and space heating (10 per cent)
22 Seasonal variations in fuel use Most households (88 per cent) use LPG as their primary fuel in the rainy season while in winters less than 45 per cent of households do so The increased use of polluting fuels in winter could be because during these months the polluting fuel requirement for non-cooking tasks within the household like water heating for bathing and space heating increases ndash which leads to the increased use of polluting fuels for cooking as well Unfortunately the increased use of polluting fuels in winters exposes households to the double burden of high ambient and household air pollution due to unfavourable atmospheric conditions
21 households stacking fuels
have more than one LPG connections
25 households stacking fuels have two-cylinder connections
1 2 3 4 5
Asset quintile categories
0
20
40
60
80
100
Per
cent
age
of h
ouse
hold
s
Exclusive clean fuel users Stacking LPG with polluting fuels Only polluting fuel users
5348
52
6367
2441 37
3232
2311 11
51
Are Indiarsquos Urban Poor Using Clean Cooking Fuels Insights from Slums in Six States
3 Households using only polluting fuelsDespite large-scale government initiatives like PMUY 12 per cent of urban slum households do not use LPG and rely on polluting fuels While most of these households are aware of PMUY the high upfront LPG connection cost along with the high recurring expenditure on refills deter them from procuring an LPG connection
Way forwardWhile we see a progressive change in householdsrsquo energy-use patterns as we move from rural to urban issues like affordability availability preference seasonality and the end-uses of the fuel remain essential factors that determine household fuel choice Understanding user categories and fuel use patterns is crucial in enabling access to and sustained use of clean cooking fuels Also it is vital to recognise the implications of cooking being a gendered activity However womenrsquos participation in intrahousehold decision-making regarding LPG use is limited
Despite being in urban areas 37 per cent of slum households do not receive home delivery of cylinders ndash availability is an essential factor that determines the householdrsquos likelihood of using LPG exclusively To increase LPG use oil and marketing companies (OMCs) and distributors need to improve home delivery of LPG refills in slum areas
Emissions from household sources contribute hugely to the surrounding air quality (Harish et al 2019) which is already poor in congested slum areas Majority of households cook inside the main house without a chimney indicating high exposure to pollution from the use of unclean fuels for cooking
iv
30 householdsrsquo female members place the order for LPG refills
50 householdsrsquo female
members decide whether or when to purchase LPG refills
75 householdsrsquo
using polluting fuels cook inside
the main house
67 householdsrsquo using polluting fuels do not have a chimney for ventilation
vExecutive summary
Integrate the issue of lack of access to clean cooking energy with urban poverty This study reiterates the need to look at poverty in urban areas in the context of energy access The vulnerability of urban slum dwellers needs to be accounted for while designing and implementing policies including social protection schemes Given the health and economic impacts of pollution access to clean cooking energy schemes must be integrated with the social assistance programmes of other ministries (eg health education and nutrition assistance) to better target support for slum households Government programmes such as the National Urban Livelihoods Mission and social service allocations for housing should use existing targeting approaches to include access to clean cooking energy within their ambit of services for the poor
The economic impact from COVID-19 will push households into energy poverty leading to the increased use of free-of-cost biomass ndash consequently increasing the risk of exposure to emissions from fuel burning While the government has announced that it will provide up to three free refills under the PM-Garib Kalyan Yojana scheme to all PMUY households less than a quarter of households in urban slums have Ujjwala connections ndash effectively making them ineligible for relief support There is a need to expand the reach of PMUY to cover all slum households
Bring renewed emphasis on clean cooking during COVID-19 Increased poverty would mean increased use of polluting fuels ndash there is a need for a renewed emphasis on clean cooking energy access during the COVID-19 pandemic as increased use of polluting fuels has health implications (lower respiratory infections and coronary chronic obstructive disease (COPD)) that increase the risk of COVID-19 infections being more severe
There is a need for targeted effort to include the poor households in urban slums left out in the first phase of Ujjwala
Are Indiarsquos Urban Poor Using Clean Cooking Fuels Insights from Slums in Six States
Image iStock
Addressing biomass burning for cooking water heating and space heating during the winters has the potential to help reach the national ambient air quality standards
The Census of India (2011) estimates that India has about 137 million slum dwellers across the country However statistics on slum populations vary significantly based on how
a slum is defined (Nolan 2015) Therefore not only is there a lack of data about how many people live in slums and informal settlements but there is also limited information about living conditions in slums (Rains Krishna and Wibbels 2018) Rapid urbanisation in India has led to population spikes in urban centres Low-income households in urban areas are trapped in informal and sometimes lsquoillegalrsquo settlements with poor living conditions where access to essential services and infrastructure tends to be limited or badly deteriorated (Butera et al 2016) While slum dwellers are not a homogeneous population slum areas have high concentrations of poverty and social and economic deprivation and poor shelter and environmental conditions (UN-Habitat 2003)
1 Introduction state of Indiarsquos urban slums
1
The Census of India (2011) defines slums as ldquoresidential areas where dwellings are unfit for human habitation by
reasons of dilapidation overcrowding faulty arrangements and design of such buildings narrowness or faulty
arrangement of street lack of ventilation light or sanitation facilities or any combination of these factors which
are detrimental to the safety and healthrdquo The slums in India are officially categorised into three categories
identified recognised and notified1 (Chandramouli 2010) About 59 per cent of slum households in India are non-
notified and are not legally recognised by the government (Nolan Bloom and Subbaraman 2018)
BOX 1 Slums in India
The existing literature on energy access and use in slums across developing countries suggests that while energy infrastructure (electric grid LPG distribution system) is available in these settlements (by being urban) households cannot afford it andor the service is unreliable (frequent outages and low voltage for electricity uncertain availability of gas cylinders) (Butera et al 2016) This leads to households relying on illegal connections for electricity and using energy sources that are on the lower end of the energy ladder (such as kerosene charcoal wood and other biomass residues) for cooking (Butera et al 2016)
1 Areas notified as slums by the concerned municipalities corporations local bodies or development authorities were termed notified slums All areas recognised as lsquoSlumrsquo by State UT Administration or Local Government Housing and Slum Boards which may have not been formally notified as slum under any act While a compact area of at least 300 population or about 60-70 households of poorly built congested tenements in the unhygienic environment is termed as identified slums (National Sample Survey Office 2012)
Are Indiarsquos Urban Poor Using Clean Cooking Fuels Insights from Slums in Six States2
In India population growth and rapid urbanisation have resulted in the deepening of urban poverty and the increased growth of urban slums (GNESD 2008 Yenneti Wei and Chen 2017) As per the Census 2011 most slum dwellers are casual labourers engaged in works other than public works (ie informal sectors) as opposed to salaried employees in non-slum urban areas (National Buildings Organisation 2013) As per the National Sample Survey Office (NSSO 2011ndash2012) the average daily wage of casual labourers is as low as INR 170 in urban areas (Ministry of Housing and Urban Affairs 2019) Such households may be able to purchase cleaner and more efficient fuels whenever they can but are likely to fall back on less efficient ones when faced by budgetary constraints Studies suggest that despite the LPG subsidies provided by the government significant sections of the urban poor population are still struggling to incorporate the cost of LPG into their household budgets (R Singh et al 2015) Use of multiple fuels also provides security from price variations and unreliable service associated with a single fuel or technology (Shahadat Lipu and Bhuiyan 2014)
As per the Census 2011 only half of the urban slum households across the country use LPG as their cooking fuel the remaining rely on solid fuels and kerosene Since 2013 the LPG programme in India has undergone many modifications to improve delivery and targeting access to connections and the availability of LPG (CEEW 2020) Pradhan Mantri Ujjwala Yojana (PMUY) which focuses on tackling the high upfront cost of LPG by providing LPG connections to below poverty line (BPL) households with credit-linked subsidy support has played an instrumental role in increasing the penetration of LPG across the country As of November 2019 about 965 per cent of households in India have an LPG connection (PPAC 2019) Small towns and cities which have been experiencing a comparatively slow rate of urban growth but the high percentage of slum population mall towns and cities which have been experiencing a relatively slow rate of urban growth but a high percentage of slum population
However the dramatic increase in LPG coverage has led to increased fuel stacking (Cheng and Urpelainen 2014) The reliance on fuel stacking has significant implications as the health benefits of using clean fuels are reduced or perhaps even nullified in households that continue to use biomass (Cheng and Urpelainen 2014) Urban slums suffer from a double burden of pollution as they are exposed to high ambient particulate matter pollution in cities along with the household air pollution (HAP) from using unclean cooking fuels (WHO 2014) The Global Burden of Disease study notes that even with the substantial increase in the provision of clean cooking fuels in India more than half of Indiarsquos population is exposed to HAP from solid cooking fuels as of 2017 (Balakrishnan et al 2019) In the current context this is concerning since exposure to air pollution has been linked to developing lower respiratory infections and chronic obstructive pulmonary disease (Balakrishnan et al 2019) which are among the major risk factors for COVID-19 (Lippi and Henry 2020 Wang et al 2020)
11 Motivation and methodology While there have been various studies on energy access in rural areas there is minimal data on energy use and patterns in urban slum households Most studies on urban slums and energy access focus on specific slums in large metropolitan areas such as Delhi and Bangalore (Saksena et al 2003 Dhingra et al 2008 Roy et al 2018) Living conditions and access to resources vary across slums in smaller towns and cities compared to those in Tier I
Slum-dwellers suffer from the double burden of pollution as they are exposed to high ambient particulate matter in cities along with the HAP from using unclean cooking fuels
2 A summary measure that identifies where countries or other geographic areas fall on the spectrum of development Expressed on a scale of 0 to 1 SDI is a composite average of the countryrsquos rankings in terms of per capita income average educational attainment and fertility rates
3 These states account for six out of eight of the lowest socio-demographic index (SDI) states and exhibit the highest health impacts of household air pollution (HAP) These states also have the highest percentage of households covered under the flagship clean cooking energy programme in India ndash PMUY
4 Referred to as lsquoour surveyrsquo thereafter
5 In our sample about 82 per cent of households are from notified slums
6 About 98 per cent of the respondents were female members of the household
7 For further details on the survey sample and methodology refer to the technical document for the survey
3Introduction state of Indiarsquos urban slums
Table 1 Sample allocation across urban slums
Source Authorsrsquo compilation
Note The number of slums sampled within each state varied because the slums were picked from the same districts that were sampled under the India Residential Energy Survey (2020) across the six states This was done to ensure logistical ease in conducting both the surveys and to share the resources of the national-level survey The list of urban slums as per the Census 2011 in the districts sampled under IRES 2020 constitutes the urban sampling frame7
State Districts sampled Urban slums sampled Households surveyed
16
14
10
10
4
4
58
31
15
16
12
5
4
83
249
124
128
94
40
32
667
Uttar Pradesh
Bihar
Madhya Pradesh
Rajasthan
Jharkhand
Chhattisgarh
cities these towns have been experiencing a comparatively slow rate of urban growth but are home to large slum populations (Rahaman and Das 2017) Further existing sources on access to clean cooking energy among slum households are limited to primary fuel use and lack detailed information about fuel use and stacking patterns
In India states with the lowest socio-demographic index (SDI)2 also account for the highest level of disease burden due to air pollution (Balakrishnan et al 2019) The low SDI states in north India had some of the highest levels of ambient particulate matter and household air pollution ndash especially Bihar Uttar Pradesh Rajasthan and Jharkhand The disability-adjusted life year (DALY) rate attributable to HAP was highest in the low SDI states of Chhattisgarh Rajasthan and Madhya Pradesh (Balakrishnan et al 2019)
The findings of this brief are based on a primary survey conducted across rural areas and urban slums in six energy access deprived states in India ndash Bihar Jharkhand Uttar Pradesh Rajasthan Madhya Pradesh and Chhattisgarh3 The Cooking Energy Access Survey 20204 focused on householdrsquos clean cooking energy access and its barriers and drivers in rural areas and urban slums Based on the list of urban slums across districts in Census 2011 the survey covered 656 households across 83 urban slums (notified and non-notified)5 spread across 58 districts The survey was conducted with the primary cook of the household6
In this brief we focus on understanding access to clean cooking energy specifically across urban slum households The analysis focuses on the fuel use patterns of households the extent of use of LPG and solid fuels fuel stacking behaviour and the primary cookrsquos perception of various cooking fuels and their impact on health The results discussed below are representative of the urban slum population in six states We have refrained from state-level analysis because of the smaller sample size for urban slums in some states like Jharkhand and Chhattisgarh
Are Indiarsquos Urban Poor Using Clean Cooking Fuels Insights from Slums in Six States4
12 Socio-economic characteristics of the urban slums of the six states Non-farm casual labour is the primary source of income for more than 42 per cent of the households such households reported a median monthly expenditure of about INR 5000 In only 20 per cent of the households the primary cook is involved in income-generating activities primarily engaged in casual non-farm labour or are self-employed
Source Authorsrsquo analysis
60 households have a monthly income below
INR 10000
In 90 households all members have
Aadhar cards
94 households have a bank account
11 households are currently indebted
Median savings in the past year
INR 4000
Median monthly expenditure
INR 6000
MEDIAN HOUSEHOLD SIZE
6
5
Table 2 Less than one-third of urban slum households reported income from salaried jobs
Source Authorsrsquo analysis
Under self-employment some of the householdsrsquo report occupations like carpentry tailoring driver and priest
The primary source of income of urban slum households
Non-farmdaily wage casual labour
Private or government salaried job
Shop or own business or self-employed
Farm labour
Agriculture on own or leased land
Others (pension remittances cattle rearing none)
43
22
18
8
7
2
Scheduled Castes (SC) (30 per cent) and Other Backward Castes (OBC) (45 per cent) form the majority of the urban slum population While Scheduled Tribes (ST) constitute less than 10 per cent of the overall population a majority of them are in Madhya Pradesh and Rajasthan Less than 20 per cent of the urban slum population are from the General castes States like Bihar Jharkhand and Rajasthan have the least proportion of General castes living in slum areas
Within urban slum households OBC and General households are relatively better off economically as shown in Table 3 Occupational patterns also vary based on caste A higher proportion of OBCs and General households rely on running a business self-employment or salaried jobs for their primary source of income as compared to SC and ST households The latter are primarily engaged in farm and non-farm labour The socio-economic marginality of SCs and STs even within slums is a consequence of these communities being most deprived in terms of access to resources and education income housing etc (Chandrasekhar and Mitra 2018) We see a similar trend in our sample in education and income levels Slums often remain the permanent habitation of marginalised castes as opposed to serving as an entry point for persons from higher castes who get absorbed into relatively better jobs and eventually move out of the slums (Chandrasekhar and Mitra 2018)
Table 3 Scheduled Castes and Scheduled Tribes have the lowest economic status
Source Authorsrsquo analysis
We utilise an economic status or asset index as a measure of a householdrsquos relative wealth and economic status based on the Filmer and Pritchett (2001) approach The list of variables included in the economic status index can be found in Annexure I The index takes values between 0 and 10 where a higher value denotes a higher level of asset ownership
Caste Sample size
Mean of asset index
(Min ndash Max) of BPL cardholders
233
51
281
92
042
039
046
046
(0ndash084)
(008ndash077)
(003ndash1)
(008ndash09)
45
60
49
36
Scheduled Castes
Scheduled Tribes
Other Backward Classes
General
Introduction state of Indiarsquos urban slums
Are Indiarsquos Urban Poor Using Clean Cooking Fuels Insights from Slums in Six States652
Image iStock
Exclusive use of LPG is limited to just over half of the total slum households The householdrsquos economic status and its access to doorstep delivery of LPG refills are two critical factors that determine their ability to use LPG exclusively
7
The fuel use patterns in urban slum households across the six states show a significant improvement in LPG use over the past decade when compared with the data from
Census 2011 The share of households using polluting fuels (including firewood dung cake agriculture residue and kerosene) as their primary fuel has decreased significantly but we find that stacking is a common practice even among households using LPG as a primary fuel Unless they use clean fuels exclusively such slum households will still be exposed to the health risks associated with HAP
Across the six states the primary fuel used for cooking by slum households
For the analysis in this brief we have categorised the households into three based on their fuel choices and position on the energy ladder those that exclusively use clean cooking fuels (LPG and electricity) stack LPG with polluting fuels and use only polluting fuels The level of exposure to emissions from cooking increases from the first (least harmful) to the third category (most harmful)
2 Cooking fuel adoption and use in urban slum households
In this brief the use of clean cooking fuels is considered synonymous to use of LPG since other clean fuels comprise a negligible share of use
Source Authorsrsquo analysis
Households using clean fuel exclusivelyWhile the majority of these households use LPG two per cent of the households reported using electricity for cooking purposes
Households stacking LPG with polluting fuelsMost of these households reported using LPG as their primary fuel and polluting fuels as their secondary fuel About four per cent of slum households reported using polluting fuels as their primary fuel and LPG as their secondary fuel
Households using only polluting fuelsThese households only use firewood charcoal dung
agricultural residue kerosene or a stack of these fuels
5533
12
Fuel-use categories
Use of LPG as primary fuel
82 (Cooking Energy Access Survey 2020)
47 (Census 2011)
Polluting fuel as primary fuel
16 (Cooking Energy Access Survey 2020)
52 (Census 2011)
Are Indiarsquos Urban Poor Using Clean Cooking Fuels Insights from Slums in Six States8
In the following sections we explore factors such as socio-economic characteristics affordability and availability of fuel intra-household gender dynamics and fuel perceptions which influence the ability and likelihood of a household to use different fuels
21 Households using LPG as their only fuel In this section we focus on understanding the household characteristics and fuel use patterns of those using LPG exclusively for cooking Most urban slum households with an LPG connection report using LPG as their primary fuel While 55 per cent of the slum households (63 per cent of LPG-using households) use LPG exclusively others stack LPG with polluting fuels Uttar Pradesh has the highest
proportion (70 per cent) of slum households who are exclusive users of clean cooking fuels among the six states
Figure 1 Within slums there are considerable state-level variations in householdsrsquo fuel usage patterns across states
Source Authorsrsquo analysis
Note We have refrained from state-level analysis because of the smaller sample size for urban slums in states like Jharkhand and Chhattisgarh
Figure 2 While the majority of LPG-using households use the fuel primarily only half of them use it exclusively
Source Authorsrsquo analysis
0
0
10
10
20
20
30
30
40
40
50
50
60
60
70
70
80
80
90
90
100
100
8682
55
Bihar
LPG users
Chhattisgarh Jharkhand Madhya Pradesh
LPG as the primary fuel LPG as the exclusive fuel
Rajasthan Uttar Pradesh
States
Per
cent
age
of h
ouse
hold
s P
erce
ntag
e of
hou
seho
lds
Exclusive clean fuel users Stacking LPG with polluting fuels Only polluting fuel users
42
3
30
56
45
39
1611
40
4944
46
10 5
24
71
41
28
9Cooking fuel adoption and use in urban slum households
Over a fifth of households using LPG exclusively are PMUY households which suggests that these households have been able to transition to clean cooking fuels in less than four years PMUY households using LPG exclusively are of a relatively higher economic status than households that stack polluting fuels Unlike in rural areas the age of an LPG connection does not have a direct correlation with per capita LPG consumption in urban slum households suggesting that even households with recent LPG connections in urban slums are likely to use LPG exclusively Households in urban areas have been known to experience a direct transition to exclusive use of clean fuels from using traditional fuels (Kuo and Azam 2019) This could be due to the time-saving that comes with the adoption of clean cooking fuels like LPG ndash where urban households are more willing or need to spend more on convenience than rural households
Figure 3 Most households using LPG exclusively acquire six to eight cylinders per year
Source Authorsrsquo analysis
211 The economic status of the household determines exclusive LPG useA simple logistic regression (Annexure II) shows that households with higher asset ownership have significantly higher odds of using LPG as an exclusive fuel Even between primary and exclusive users of LPG asset ownership remains a significant differentiating factor This corroborates the findings of previous studies (Ranjan and Singh 2017) that state that households tend to switch their cooking fuel use patterns after a threshold level of income is achieved However this is not to suggest that all wealthy households shift to exclusive use of clean fuels We discuss the reasons for stacking among these households in the next section
Cooking energy in the household budget We find that households using LPG as their only fuel pay INR 496 per month8 This effectively translates to an average household spending almost eight per cent of their monthly expenses on cooking fuel
Oil and Marketing Companies (OMCs) are attempting to address the challenges around the recurring refilling
cost by encouraging low-income households to use a 5 kilograms (kg) cylinder to overcome the high upfront cost
associated with 145kg cylinders In our sample we find that only about two per cent of urban slum households use
small cylinders (5kg or 3kg)
BOX 2 Uptake of small cylinders
8 This is based on the upfront cost paid by the household for an LPG refill Given that only 40 per cent of the householdsrsquo report receiving LPG subsidy on refills ndash it has not been considered in the fuel expenditure calculation The share of fuel expenditure for the households receiving LPG subsidies would be accordingly less than the others
0
10
20
30
40
50
60
70
1
1 16 8 9
22
60
4350 50
14
34
15
2 3 4 5 6 7 8 9 10 11 12 13
Number of 14 kg LPG cylinder refills obtained by exclusive LPG users
Per
cent
age
of h
ouse
hold
s us
ing
LP
G e
xclu
sive
ly
households using LPG exclusively Median value
Are Indiarsquos Urban Poor Using Clean Cooking Fuels Insights from Slums in Six States
212 Home delivery for exclusive LPG users We find that households who receive doorstep delivery of LPG refills have higher odds of using LPG as their exclusive fuel Hassle-free doorstep delivery of LPG refills is known to influence the use of LPG as a primary secondary or exclusive fuel (PPAC-CRISIL 2016)
Additional expense on procurement of cylinders Almost half of the households who receive doorstep delivery of LPG pay an additional amount of INR 20 as a delivery charge However in households that do not receive doorstep delivery about 46 per cent report that one member must forgo their daily wages to procure the cylinder Most of such households depend on daily labour or private jobs for their income
Given that almost half of the households report having to forgo wages to procure the cylinders it could affect the householdrsquos ability to use LPG continually It may add to the average delay in the purchase of refills
Procurement of LPG cylinders during the COVID-19 pandemic Most households that do not receive doorstep delivery of LPG (58 per cent) use private vehicles (including motorcycles or bicycles) to transport LPG refills About one-third of the households procuring cylinders on their own use rented or shared vehicles The procurement constraints faced by these households would be further aggravated during the COVID-19 pandemic as using rented or shared vehicles comes with its own risks
10
About 18 per cent of the respondents in our survey reported that they resided in non-notified slums Such slums are not legally recognised as a lsquoslumrsquo by the government which makes the residents more vulnerable to eviction In our data we find that adoption and use of LPG is similar across households from notified and non-notified slums Qualitative interviews and field visits showed that most of the respondents were permanent residents of the slums who have been living there for more than 10 years
About 2 per cent of urban slum households use electricity as a source for cooking energy These households do not rely on any other fuels for cooking or non-cooking purposes They use electric stoves to prepare all meals including cooking roti rice and vegetables These households have been using electricity as their cooking fuel only in the past five years Most households report using either a coiled stove or induction stove Less than one per cent of households use other electric appliances such as hot water kettles and toasters for cooking needs
BOX 3
BOX 4
Status of slums impacting the fuel-use pattern
Electricity for cooking
77
households receiving doorstep delivery of LPG cylinders are exclusive users of the fuel
63LPG-using households receive doorstep delivery of cylinders
Male members have to travel to procure the cylinders in 87 households
11Cooking fuel adoption and use in urban slum households
About 4 per cent of urban slum households in the sample reported stacking with kerosene as their secondary fuel Most of these households are in Uttar Pradesh These households also use kerosene more than once a week for cooking
BOX 5 Use of kerosene as a cooking fuel
22 Households stacking LPG with polluting fuels Across the six states almost half of the households (45 per cent) reported using polluting fuels Here we discuss the characteristics and fuel use patterns of households that stack clean and unclean fuels
Though 86 per cent of the households surveyed have an LPG connection we find that over a third (33 per cent) of them stack it with polluting fuels (including firewood dung cakes agriculture residue charcoal and kerosene) The increased stacking could also be a result of more households adopting LPG since households tend to not replace biomass-based fuels completely (Cheng and Urpelainen 2014) These households would need to transition to exclusive use of clean cooking fuels to reduce the health impacts on women and children from household air pollution
About 44 per cent of the households that are stacking fuels rely on informal sources for refills Such households have not ordered any refills in the past one year from their LPG distributors These households mainly rely on recurring cylinders from their neighbours or relatives9
Figure 4 Of the households that stack fuels most use LPG as their primary fuel
Source Authorsrsquo analysis
9 It is important to note that sharing LPG cylinders among neighbours and extended family is a regular phenomenon in small towns and rural areas owing to availability challenges and it is not necessarily driven by an intention to siphon off subsidy amounts against the commodity ( Jain et al 2018)
Exclusive clean fuel users
Stacking with LPG as the primary fuel
Only polluting fuel users
Stacking LPG with polluting fuels
Stacking with LPG as the secondary fuel
55
3388
12
12
Are Indiarsquos Urban Poor Using Clean Cooking Fuels Insights from Slums in Six States12
221 Household factors that determine the decision to stack fuels Even within the stacking households the reason for stacking multiple fuels varies significantly Primarily households who stack can be divided into two categories ndash those that stack as they cannot afford LPG refills and those that stack due to other factors like taste preferences and alternate end-uses of the fuel
Households who are stacking primarily due to affordability concerns ndash Across asset quintiles we find that stacking is most common among the middle categories (second and third quintile) where most have adopted LPG Still the affordability of the fuel remains a significant concern More than 60 per cent of the households that are stacking fuels collect or prepare firewood or dung cakes free of cost rather than purchasing them from the market Those who buy biomass do not spend more than INR 100 per month on it Based on the responses of the primary cook we note that the high cost of LPG and free-of-cost availability of solid fuels are the most common factors that affect the fuel choices made by the household
Figure 5 Stacking is prevalent in households across asset quintile categories
Source Authorsrsquo analysis
1 2 3 4 5
Asset quintile categories
0
20
40
60
80
100
Per
cent
age
of h
ouse
hold
s
Exclusive clean fuel users Stacking LPG with polluting fuels Only polluting fuel users
5348
52
6367
2441 37
3232
2311 11
51
Households who use LPG primarily and polluting fuels as secondary fuels have a median annual refill rate of
6 cylinders
Households who use polluting fuels primarily and LPG as a secondary fuel have a median annual refill rate of
4 cylinders
13
Households that are stacking for reasons beyond affordability ndash More than one-fourth of the households that are stacking have a median annual refill rate of eight cylinders and above despite having a similar household size as others Most such households fall in the highest asset quintiles This suggests that they are not necessarily using unclean fuels due to the unaffordability of LPG but due to other factors such as taste preference for chulhas and fuel end-uses that influence the householdrsquos decision to use solidpolluting fuels Such households reported using LPG for a median period of six years The solid fuels are primarily used for cooking chapatis or vegetables in these households
Interestingly even households with multiple LPG connections and two cylinder connections report stacking with polluting fuels The possession of multiple LPG connections in these households may not necessarily be an indicator of diversion mdash the average family size of these households is more than eight indicating the high possibility of having separate kitchens within the same household Given that such households have a median annual refill rate of ten cylinders another plausible reason for multiple connections is that it prevents them from relying on just one distributor which increases their chances of getting refills whenever needed
222 End-uses of polluting fuels Across both the groups discussed above half of the households who stack with polluting fuels use these fuels at least once a day (Figure 6) Also almost 45 per cent of the households that stack fuels use multiple stoves at the same time while preparing a single meal This indicates that even if the household is using LPG for a particular meal they would be using their chulha simultaneously
Despite using LPG as the primary fuel for their cooking needs households that are stacking fuels use polluting fuels for non-cooking purposes like heating water for bathing (29 per cent) and space heating (10 per cent)
Figure 6 Almost half of the households using polluting fuels use it every day
Source Authorsrsquo analysis
0 5 10 15 20
19
11
21
20
29
25 30 35
Percentage of households
Freq
uenc
y of
use
of p
ollu
ting
fuel
s Several times a day
Once per day
Few times a week
Once a week
Occasionally
21 households stacking fuels
have more than one LPG connections
25 households stacking fuels have two-cylinder connections
Cooking fuel adoption and use in urban slum households
Are Indiarsquos Urban Poor Using Clean Cooking Fuels Insights from Slums in Six States14
223 Seasonal variations in the stacking of fuels We also noted a significant seasonal change in fuel use patterns LPG is most popular in the rainy season (88 per cent) and least popular in the winter months (45 per cent) (Figure 7) The dampness associated with solid fuels in the rainy season could be the reason for using LPG primarily during these months The literature also suggests that solid fuels are a popular choice during winter months (S Singh 2014 Baqir et al 2019) This could be because during winter months the solid fuel requirement for non-cooking tasks within the household likes water heating for bathing and space heating increases Since households are already using solid fuels for non-cooking tasks they may be using these fuels more for cooking during winter Unfortunately the increased use of solid fuels in winter exacerbates the much higher air pollution exposure of these households due to unfavourable atmospheric conditions
Figure 7 Proportion of urban slum households using solid fuels as the primary cooking fuel increases during the winters months aggravating household air pollution exposure due to unfavourable atmospheric conditions
Source Authorsrsquo analysis
About 3 per cent of urban slum households reported owning an electric water-heating device (geyser or immersion
rod) Similarly only 4 per cent of the households own an electric room heater
BOX 6 Electric devices for water heating and space heating
Summer Winter Rainy Festival0
20
40
60
80
100
120
Per
cent
age
of h
ouse
hold
s
LPG Solid fuel
78
45
88
67
22
55
1233
15
Figure 8 Lack of awareness about receiving LPG refill subsidies poses a threat to the success of LPG subsidy schemes
Source Authorsrsquo analysis
Connections under the Pradhan Mantri Ujjwala Yojana (PMUY) 23 per cent of these households reported receiving benefits under the PMUY
The six states included in the survey account for a significant share of PMUY coverage ndash 54 per cent of all connections provided under PMUY (PPAC 2019) However most of these connections cater to rural households One of the reasons for there being fewer PMUY connections in urban areas is that more than half of all urban slum households reported already having had LPG connections for over four years (before the launch of PMUY) Moreover over a quarter of PMUY households10 in urban slums reported having multiple LPG connections which suggests that not every household which was using LPG before the PMUY was prevented from accessing the schemersquos benefits
Government support during the COVID-19 pandemic During the COVID-19 lockdown the government announced the provision of three free-of-cost refills for PMUY households under the PM-Garib Kalyan Yojana While PMUY households in urban slums benefitted from this scheme non-PMUY households in urban slums did not As documented urban slum households faced a significant economic hit due to the loss of jobs and incomes during the pandemic (Patel 2020) Non-PMUY households that stack for economic reasons are more likely to use cheaper and freely available solid fuels without additional support from the government
PAHAL-Direct Benefit Transfer for LPG (DBTL)Overall about 42 per cent of active LPG users11 reported receiving a subsidy for their last LPG refill under the Direct Benefit Transfer for LPG scheme (DBTL) However about 28 per cent of urban slum households reported not knowing if they had received the subsidy amount for their last refill this suggests that the primary cook is often unaware of whether the subsidy is credited to the household Among the ones that reported receiving the LPG subsidy about 40 per cent of the primary cook were not aware of the amount of subsidy being credited into their account
10 This is a relatively smaller sample of 43 households from all the PMUY households in urban slums (131 households)
11 Households that have taken at least one refill in the past year
42
30
28
Received LPG refill subsidy
30 Still repaying PMUY loan
Did not receive LPG refill subsidy
10 Gave up LPG refill subsidy
Do not know
60 LPG refill susbsidy not received due to other reasons
Cooking fuel adoption and use in urban slum households
Are Indiarsquos Urban Poor Using Clean Cooking Fuels Insights from Slums in Six States16
23 Households using only polluting fuels About 12 per cent of urban slum households rely entirely on polluting fuels for all cooking and non-cooking purposes While the share of these households is relatively small the non-adoption of LPG in such households despite
programmes like the PMUY is concerning These households either use a combination of different polluting fuels (firewood dung cakes agricultural residue charcoal and kerosene) or just one of these fuels for all their energy needs Firewood is the most commonly used fuel in these households
231 Reasons for the non-adoption of LPGHouseholds that rely exclusively on polluting fuels reported not having an LPG connection Though three-fourths of these households were aware of PMUY the high upfront cost of an LPG connection along with the high recurring cost of procuring refills remain the two most important reasons for not procuring an LPG connection Repondents also mentioned a lack of information on how to procure a connection as a reason These reasons align with the common causes cited by rural households covered in the survey implying that the challenges faced by rural households and urban slum households in procuring connections are similar
Almost half of the households in this category use solid fuels for non-cooking purposes such as heating water for bathing space heating and preparing fodder for animals On the positive aspects of using polluting fuels households reported the following free-of-cost easy availability of fuels better tasting food and preference of family members for food cooked on the chulha
232 Fuel availability and affordabilityIn contrast with households that stack fuels households that use only solid fuels rely on purchasing fuels rather than collecting or preparing them For instance 60 per cent of firewood users in this category procure fuel by purchasing rather than collecting it
Households with low asset ownership rely on polluting fuels for cooking These households spend 2ndash3 per cent of their median monthly expenditure on fuel (INR 75 per month on fuel) which is much lower than what they would have to spend if they used LPG exclusively (INR 496 per month) Households that collect solid fuels spend about two hours on a single trip (three times a month) travelling a median one-way distance of 2 km This is equivalent to the distance travelled to procure LPG cylinders (if not delivered at home)
Figure 9 More than half of the households currently without LPG do not know how to get a connection or whom to ask about it implying a lack of awareness
Source Authorsrsquo analysis
0 10 20 30 40 50 60 70
39
53
63
68
80
Percentage of households
Rea
sons
for N
on-A
dop
tion
of L
PG Installation is expensive
Monthly expenditure on LPG is high
Do not know how to get or whom to ask
Not availabletoo far
17
12 See Annexure III for details on the districts and their PM25 concentrations The data for 15 districts (from Bihar Uttar Pradesh Madhya Pradesh and Rajasthan) overlapping with the survey sample have been analysed based on the availability of air quality data from continuous monitoring stations
13 Air quality categories based on PM25 concentration (in μgm3)
Good 0 to 30 Satisfactory 31 to 60 Moderately polluted 61 to 90 Poor 91 to 120 Very poor 121 to 250 Severe above 250 (Central Pollution Control Board 2014)
Cooking fuel adoption and use in urban slum households
Winter months have the highest PM25 concentrations coinciding with the sharp increase in use of polluting fuels for heating bath water and room heating
233 Gendered time use in households using solid fuelsIn urban slums both the male and female members of the household are equally involved in collecting firewood Still it is primarily the female members of the household who undertake dung cake preparation In addition to engaging in fuel collection and preparation women tend to spend more time cooking in households using solid fuels About 85 per cent of households that transitioned to LPG in the past four years reported having saved time while cooking compared to when they used solid fuels
SPOTLIGHT I Household air pollution (HAP) in urban slums
Burning solid fuels in three-stone fires and mud stoves with inadequate ventilation causes high levels of smoke exposure and negative health impacts particularly for women and young children (WHO 2014)
The double burden of ambient and household air pollution on the urban slum populationUsing the PM25 data from continuous ambient air quality monitoring stations (CAAQMS) for 15 districts12 in our sample we found that the ambient air quality remained in the lsquopoorrsquo or worse category13 for most districts throughout the year variation in the ambient air quality
Are Indiarsquos Urban Poor Using Clean Cooking Fuels Insights from Slums in Six States
Impact of ventilation
Indoor cooking and low adoption of chimney indicates high exposure to pollution from the use of unclean fuels for cooking The proportion of households with a chimney is high (52 per cent) among those who rely only on polluting fuels Smith and Pillarisetti (2017) explain that while having a good chimney lowers peak levels of indoor pollution long-term average exposure is reduced only by a factor of two Besides chimneys require regular maintenance to function correctly While more than 45 per cent of the households are using polluting fuels less than 20 per cent of the slum housheolds use improved cookstoves
Households also use solid fuels for non-cooking uses like space heating On average each house in a slum has two rooms this effectively exposes all members of the household to emissions from burning fuels Emissions from household sources contribute significantly to the surrounding air quality (Harish et al 2019) this concern is exacerbated in congested slum areas
the winter months (November to February) have the highest concentration of PM25 This leads to a double burden of exposure for slum households stacking solid fuels as they are more likely to increase use of solid fuels in winters (Figure 7) Alternatively the use of LPG as the primary source of fuel increases during the rainy season (June to September) these months record the least ambient air pollution
We also find that districts like Meerut Ghaziabad Patna Gautam Buddha Nagar (Noida and Greater Noida) and Muzaffarpur have the highest frequency of lsquovery poorrsquo air quality days throughout the year Across these districts one-third of households use polluting fuels for cooking In urban slums where households are more densely packed the emissions from burning solid fuels increase the risk of exposure inside households and deteriorate the ambient air quality for the community at large As a result these communities suffer from both increased household and ambient air pollution HAP has an estimated average contribution of 30ndash50 per cent to ambient air quality across Indiarsquos urban and rural areas (Balakrishnan et al 2019) Addressing biomass burning for cooking water heating and space heating during the winters has the potential to help reach the national ambient air quality standards (Chowdhury et al 2019) Despite that only 2 per cent of the action points in 44 city clean air plans mention cooking and heating as a sector to address air pollution (Ganguly Selvaraj and Guttikunda 2020)
18
75 householdsrsquo
using polluting fuels cook inside
the main house
67 householdsrsquo using polluting fuels do not have a chimney for ventilation
Awareness about the health impacts of using polluting fuelsAbout 60 per cent of households using only polluting fuels and 84 per cent of households that stack LPG with a polluting fuel report lsquotoo smokyrsquo as the most prominent negative aspect of using polluting fuels This suggests that as more households switch to clean cooking fuels perceptions regarding pollution fuels change
Three-fourths of primary cooks who use polluting fuels for cooking agree that smoke from solid fuels is harmful to them this implies that awareness of the adverse health impacts of polluting fuels does not necessarily lead to the uptake of clean fuels Primary cooks also agree that smoke from solid fuels causes coughing (49 per cent) and lung infections in children (39 per cent)
Exposure to air pollution is a known risk factor for underlying chronic diseases that predict the severity of
COVID-19 disease and patient outcomes (World Bank 2020) This linkage suggests a heightened risk for women
in all age groups who cook using traditional technologies and fuels (World Bank 2020) The highest number of
COVID-19 cases were recorded in the most polluted regions among patients with pre-existing health conditions
(Frontera et al 2020)
Results from a controlled study show a higher prevalence of chronic obstructive pulmonary disease (COPD)
among biomass fuel users than clean fuel users ( Johnson et al 2011) The available clinical data to date suggest
that cardiovascular disease diabetes chronic respiratory illness and hypertension ndash conditions all strongly
associated with exposure to HAP ndash are also risk factors for COVID-19 (World Bank 2020)
BOX 7 Impact of household air pollution on COVID-19
19Cooking fuel adoption and use in urban slum households
Are Indiarsquos Urban Poor Using Clean Cooking Fuels Insights from Slums in Six States
Traditionally women bear a disproportionate burden in collecting and preparing biomass for cooking While this burden reduces with the use of clean cooking fuels like LPG the fuel supply within the household is then determined by formal and monetised distribution networks involving an outlay of money (Patnaik and Jha 2020) Our data shows that womenrsquos status in the household (as heads of households)14 positively correlates with households using LPG as their primary fuel The existing literature also supports the idea that female-headed households prefer modern fuels to polluting ones (Farsi Filippini and Pachauri 2007 Rao and Reddy 2007 Kuo and Azam 2019) Other research also suggests that female-headed households are more willing to spend on LPG as a recurring expense (Kojima Bacon and Zhou 2011 Kuo and Azam 2019)
SPOTLIGHT II Womenrsquos participation in intra-household decision-making regarding LPG use
20
14 In almost half of the households surveyed the primary cook reported a female member being the head of the household The reason behind such high percentage of female-headed households could be because only the primary cook of every household (who is mostly female) was surveyed This does not mean that these households do not have any adult male members Traditionally headship refers to the head of household as the individual whose lsquoauthorityrsquo the household members recognise But this definition overlooks potential intra-household variations in the recognised authority in different realms of decision-making (Kilic Moylan and Koolwal 2020) Since cooking is a gendered activity the primary cookrsquos response to the head of household question may have been with respect to the recognised authority figure for that activity within the household
30 householdsrsquo female members place the order for LPG refills
50householdsrsquo female
members decide whether or when to purchase LPG refills
We also find that the decision of whether or when to purchase LPG refills is made by male members in half of urban slum households This holds for both male- and female-headed households In LPG-using households where the primary cook is involved in an income-generating activity more women are deciding to order the refills This pattern is similar irrespective of whether the household uses LPG exclusively or stacks it with other polluting fuels or are PMUY beneficiaries
SPOTLIGHT III A comparison of access to clean cooking energy between urban slum and non-slum households across six states
21
At the state level Bihar has significantly poor involvement of women in intra-household decision-making regarding
ordering refills with less than 10 per cent of households reporting that women decide whether or when to order
refills However more women than men are involved in decisions around LPG refills in Rajasthan Madhya Pradesh
and Jharkhand
Across caste groups the involvement of women is lowest (37 per cent) among the Scheduled Castes (SCs)
However more women in General and OBC households decide when to order LPG refills
BOX 8 Variations in intra-household decision-making across states and caste groups
Cooking fuel adoption and use in urban slum households
To compare the fuel use patterns of urban slum and non-slum households we used data from the India Residential Energy Survey (IRES 2020)15 The overlap in the sampling strategies of both IRES and our survey enabled a comparison of the findings There is a significant difference in the socio-economic status of slum and non-slum households which tends to affect their fuel use patterns Table 4 provides a comparison of cooking fuel usage in urban non-slum households (from IRES 2020) and urban slum households (Cooking Energy Access and Use survey 2020)
Are Indiarsquos Urban Poor Using Clean Cooking Fuels Insights from Slums in Six States22
Table 4 The poor economic condition of households in urban slums impacts the exclusive use of clean fuels for cooking
Source Authorsrsquo analysis
Fuel use categories Urban slum households (Cooking Energy Access Survey) ()
Non-slum urban households (IRES) ()
95 88
84 55
9 33
5 12
Clean fuel users (LPG PNG and electricity)
LPG as an exclusive fuel
Households that stack LPG with polluting fuels
Households that use only polluting fuels
We observed a significant gap in the exclusive use of LPG as a cooking fuel between urban slums and non-slum households explained mainly by the difference in their economic conditions Stacking is three times more common in slum households than non-slum households About 45 per cent of non-slum households using polluting fuels belong to marginalised social groups (SCs and STs) Households using polluting fuels have a lower median monthly expenditure than others and about 62 per cent of such households are semi-pucca or kuchha structures Among LPG users non-slum households have a slightly higher rate of doorstep delivery as compared to slum households
LPG-using households receiving home deliveries
Source Authorsrsquo analysis
239
6372
Urban slum households (Cooking Energy Access and Use)
()
Non-slum urban households (IRES)
()
Proportion of PMUY beneficiaries among LPG-using households
15 IRES 2020 was conducted in 21 large states of India including Bihar Jharkhand Rajasthan Madhya Pradesh Uttar Pradesh and Chhattisgarh While IRES 2020 focused on urban households the Cooking Energy Access and Use survey specifically attended to urban slums in the same districts Refer to the technical note for a detailed methodology of the survey
23
3 Way forward
Slums across the world are chronically ignored in public policy and suffer because of unauthorised and unsafe habitation without access to government services (Shahadat
Lipu and Bhuiyan 2014) In terms of energy access while we see a progressive change in householdsrsquo energy use patterns as we move from rural to urban issues like affordability availability preference and familiarity with the fuel and stove remain essential factors that determine householdsrsquo fuel choice
Image iStock
Are Indiarsquos Urban Poor Using Clean Cooking Fuels Insights from Slums in Six States24
Understanding categories of users is important for enabling access to and use of clean cooking fuels
We categorised the urban slum population based on their fuel usage patterns ndash using only clean fuels stacking clean fuels with polluting fuels and using only polluting fuels While most households in urban slums have an LPG connection only half of them use LPG exclusively The householdrsquos economic status and its access to doorstep delivery of LPG refills are two crucial factors that determine its ability to use LPG exclusively Despite being situated in urban areas 37 per cent of slum households do not receive home delivery of cylinders ndash availability is an essential factor in determining the householdrsquos likelihood of using LPG exclusively There is a strong impetus for the OMCs and distributors to improve their home delivery services of LPG refills in slum areas
Stacking is prevalent in about one-third of households ndash there is a need for a deeper understanding of householdsrsquo preferences fuel end-uses and awareness Most households reported using polluting fuels daily or at least weekly this effectively increases their exposure to household air pollution despite having access to clean cooking fuels Among households that stack LPG with polluting fuels the reasons for stacking differ ndash affordability seasonality and taste preference More than a quarter of households that stack have a similar level of LPG consumption as those that use LPG exclusively despite similar family sizes Such households use polluting fuels not because of their inability to afford LPG But other factors like free-of-cost availability of biomass taste preference for chulha and alternate end-uses of fuelmdashfor instance in space heatingmdashinfluence the householdrsquos decision to use solid fuels Among households that stack multiple fuels the use of polluting fuels increases during winter months this exposes the households to a double burden of high ambient and household air pollution in these months About 40 per cent of these households also use polluting fuels for non-cooking purposes like heating water for bathing and space heating especially in winter
Even with large-scale government initiatives like PMUY we find that more than 10 per cent of urban slum households do not use LPG They mainly rely on free-of-cost biomass for their cooking and non-cooking needs Despite awareness of PMUY among these households the high upfront cost of procuring an LPG connection and high recurring expenditure on refills deter them from using LPG Evidently there is a need to expand the reach of PMUY to cover households across slums
Integrating the issue of lack of access to clean cooking energy within the discussion on urban poverty
This study reiterates the need to look at poverty in urban areas in the context of energy access Given the heterogeneity of poverty in urban and semi-urban India it is essential to understand energy poverty in the context of access to resources for an enhanced quality of life for the urban poor Similarly slums dwellers in large and small cities alike may experience additional challenges of access Furthermore not all urban poor live in slums we know even less about the access issues of temporary residents or seasonal migrants in urban India Therefore in a rapidly urbanising India studies on the urban poor and air quality need to integrate a focus on energy access to address the vulnerability of women children and communities to HAP and the drudgery of using polluting fuels for cooking and other household energy needs
Access to clean cooking energy schemes must be integrated into the social assistance programmes focused on urban poverty alleviation to enhance its reach
25Way forward
Converging energy access in social protection policies for the urban poor
Accounting for the vulnerabilities of the urban poor is crucial in designing and implementing policies including social protection schemes As a health and economic imperative access to clean cooking energy schemes must be integrated into the social assistance programmes of other ministries (eg health education and nutrition assistance) to offer better support to slum households This would also reduce the burden on households of claiming and accessing multiple benefits across schemes thus freeing them to invest more time in productive activities (CEEW 2020) Government programmes such as the National Urban Livelihoods Mission and social service allocations for housing should use existing targeting approaches to include access to clean cooking energy within the ambit of services for the poor
Bringing a renewed emphasis on clean cooking energy access due to COVID-19 is essential
Most households in urban slums rely on daily wage labour or the gig economy for their household income During the COVID-19 pandemic these occupations have been among the worst impacted by the lockdown and the economic slowdown A survey conducted with over 2000 daily wage workers in urban slums during the lockdown suggests that only 7 per cent of respondents from this group received pay during the lockdown (Basu 2020) causing a massive shock to their livelihoods and wage earnings This kind of impact pushes households into energy poverty leading to the increased use of free-of-cost biomass and consequently increasing the risk of exposure to emissions from fuel burning While the government has committed to supplying up to three free refills to all PMUY households under PM-Garib Kalyan Yojana less than a quarter of households in urban slums have Ujjwala connections The low share of PMUY households effectively makes the majority of slum households ineligible for relief support given under the PM-Garib Kalyan Yojana during the lockdown There is a need to target vulnerable households ndash beyond PMUY beneficiaries ndash with differential subsidy support for using LPG in a sustained manner
Increased poverty would mean increased use of polluting fuels ndash there is a need for a renewed emphasis on clean cooking energy access during the COVID-19 pandemic as increased use of polluting fuels has health implications (lower respiratory infections and COPD) that increase the risk of COVID-19 infections being more severe
There is a need to target vulnerable households ndash beyond PMUY beneficiaries ndash with differential subsidy support for using LPG in a sustained manner
Are Indiarsquos Urban Poor Using Clean Cooking Fuels Insights from Slums in Six States
Balakrishnan Kalpana Sagnik Dey Tarun Gupta R S Dhaliwal Michael Brauer Aaron J Cohen Jeffrey D Stanaway et al 2019 ldquoThe Impact of Air Pollution on Deaths Disease Burden and Life Expectancy Across the States of India The Global Burden of Disease Study 2017rdquo The Lancet Planetary Health 3 (1) e26ndash39 httpsdoiorg101016S2542-5196(18)30261-4
Baqir M S K Bharti R Kothari and R P Singh 2019 ldquoAssessment of an Energy-efficient Metal Chulha for Solid Biomass Fuel and Evaluation of its Performancerdquo International Journal of Environmental Science and Technology 16 (11) 6773ndash6784 httpsdoiorg101007s13762-018-2028-9
Basu Anika Badyal 2020 ldquoLockdown Survey How The Covid-19 Crisis Has Affected Daily Wage WorkersmdashAIFrdquo American India Foundation June 28 httpsaiforglockdown-survey-how-the-covid-19-crisis-has-affected-daily-wage-workers
Butera F M P Caputo R Adhikari and A Facchini 2016 ldquoThe Challenge of Energy in Informal Settlements A Review of the Literature for Latin America and Africardquo Procedia Engineering 1ndash32 httpswwwenelfoundationorgcontentdamenel-foundtopic-downloadThe challenge of Energy in Informal settlementspdf
CEEW 2020 ldquoEnergy Safety Nets India Case Studyrdquo Vienna Sustainable Energy for All httpswwwceewinpublicationsenergy-safety-nets-india-case-study
Central Pollution Control Board 2014 ldquoNational Air Quality Indexrdquo New Delhi Central Pollution Control Board httpsappcpcbccrcomccr_docsFINAL-REPORT_AQI_pdf
Chafe Z S Mehta and K R Smith 2011 ldquoAmbient Fine Particulate (PM25) Air Pollution Attributable to Household Cooking Fuel in Asiardquo AGUFM A54Bndash03 httpsuiadsabsharvardeduabs2011AGUFMA54B03Cabstract
Chandramouli C 2010 ldquoCensus of India 2011 ndash Circular No 8rdquo New Delhi Ministry of Home Affairs httpscensusindiagovin2011-CircularsCircularsCircular-08pdf
Chandrasekhar S and Arup Mitra 2018 ldquoMigration Caste and Livelihood Evidence from Indian City-slumsrdquo Urban Research amp Practice 12 (2) 156ndash172 httpsdoiorg1010801753506920181426781
Cheng Chao Yo and Johannes Urpelainen 2014 ldquoFuel Stacking in India Changes in the Cooking and Lighting Mix 1987ndash2010rdquo Energy 76 (November) 306ndash317 httpsdoiorg101016jenergy201408023
Chowdhary Sourangsu Sagnik Dey Sarath Guttikunda Ajay Pillarisetti Kirk R Smith and Larry Di Girolamo 2019 ldquoIndian annual ambient air quality standard is achievable by completely mitigating emissions from household sourcesrdquo Proceedings of the National Academy of Sciences 116 (22) 10711-10716 httpsdoiorg101073pnas1900888116
Dhingra Chhavi Shikha Gandhi Akanksha Chaurey and P K Agarwal 2008 ldquoAccess to Clean Energy Services for the Urban and Peri-Urban Poor A Case-study of Delhi Indiardquo Energy for Sustainable Development 12 (4) 49ndash55 httpsdoiorg101016S0973-0826(09)60007-7
Farsi Mehdi Massimo Filippini and Shonali Pachauri 2007 ldquoFuel Choices in Urban Indian Householdsrdquo Environment and Development Economics 12 (6) 757ndash774 httpsdoiorg101017S1355770X07003932
References
26
Frontera Antonio Lorenzo Cianfanelli Konstantinos Vlachos Giovanni Landoni and George Cremona 2020 ldquoSevere Air Pollution Links to Higher Mortality in COVID-19 Patients The lsquoDouble-Hitrsquo Hypothesisrdquo Journal of Infection 81 (2) 255ndash259 httpsdoiorg101016jjinf202005031
Ganguly Tanushree Kurinj L Selvaraj Sarath K Guttikunda 2020 ldquoNational Clean Air Programme (NCAP) for Indian cities Review and outlook of clean air action plansrdquo Atmospheric Environment X Vol 8 httpsdoiorg101016jaeaoa2020100096
GNESD 2008 ldquoClean Energy for the Urban Poor An Urgent Issuerdquo Accessed 25 July 2020 httpswwwgooglecomurlsa=tamprct=jampq=ampesrc=sampsource=webampcd=ampved=2ahUKEwi1hf2ru dntAhUCOisKHQH7BtsQFjAAegQIAxACampurl=http3A2F2Fwwwgnesdorg2F-2Fmedia2FSites2FGNESD2FPublication- pdfs2FSPM_CleanEnergyashx3Fla3Dda26hash3DE4971C585B6798F17954F8B42E073 D9507F42A84ampusg=AOvVaw08kCDgOkTkYc6wRDxzsNyq
Guan Wei-Jie Wen-Hua Liang Yi Zhao Heng-Rui Liang Zi-Sheng Chen Yi-Min Li Xiao-Qing Liu et al 2020 ldquoComorbidity and its Impact on 1590 Patients with COVID-19 in China A Nationwide Analysisrdquo European Respiratory Journal 55 (5) 2000547 httpsdoiorg1011831399300300547-2020
Harish Santosh Kirk R Smith Sourangsu Chowdhury Zoe A Chafe Ajay Pillarisetti Jos Lelieveld Sarath Guttikunda Sagnik Dey and Andrew P Grieshop 2019 ldquoThe Contribution of Household Fuels to Ambient Air Pollution in India A Comparison of Recent Estimates Edited by CcapcOrgInrdquo Collaborative Clean Air Policy Centre May 30 httpsccapcorginpolicy-briefs2019530the-contribution-of-household-fuels-to-ambient-air-pollution-in-india-a-comparison-of-recent-estimates
Jain Abhishek Saurabh Tripathi Sunil Mani Sasmita Patnaik Tauseef Shahidi and Karthik Ganesan 2018 ldquoAccess to Clean Cooking Energy and Electricity Survey of States 2018rdquo New Delhi CEEW httpswwwceewinsitesdefaultfilesCEEW-Access-to-Clean-Cooking-Energy-and-Electricity-11Jan19_0pdf
Johnson Priscilla Kalpana Balakrishnan Padmavathi Ramaswamy Santu Ghosh Muthukumar Sadhasivam Omprakash Abirami Bernard W C Sathiasekaran Kirk R Smith Vijayalakshmi Thanasekaraan and Arcot S Subhashini 2011 ldquoPrevalence of Chronic Obstructive Pulmonary Disease in Rural Women of Tamilnadu Implications for Refining Disease Burden Assessments Attributable to Household Biomass Combustionrdquo Global Health Action 4 (1) 7226 httpsdoiorg103402ghav4i07226
Kilic Talip Heather Moylan and Gayatri Koolwal 2020 ldquoGetting the (Gender-disaggregated) Lay of the Land Impact of Survey Respondent Selection on Measuring Land Ownership and Rightsrdquo Washington DC The World Bank httpsdoiorg1015961813-9450-9151
Kojima Masami Robert Bacon and Xin Zhou 2011 ldquoWho Uses Bottled Gas Evidence from Households in Developing Countriesrdquo The World Bank Sustainable Energy Department Oil Gas and Mining Unit httpelibraryworldbankorgdoibook1015961813-9450-5731
Kuo Ying-Min and Mehtabul Azam 2019 ldquoHousehold Cooking Fuel Choice in India 2004ndash2012 A Panel Multinomial Analysisrdquo IZA Discussion Paper No 12682 httpsssrncomabstract=3468630
Lippi Giuseppe and Brandon Michael Henry 2020 ldquoChronic Obstructive Pulmonary Disease Is Associated with Severe Coronavirus Disease 2019 (COVID-19) COPD and COVID-19rdquo Respiratory Medicine 167 105941 httpsdoiorg101016jrmed2020105941
Ministry of Housing and Urban Affairs 2019 ldquoHandbook of Urban Statisticsrdquo New Delhi Government of India httpmohuagovinpdf5c80e2225a124Handbook of Urban Statistics 2019pdf
Rao M Narasimha and B Sudhakara Reddy 2007 ldquoVariations in Energy Use by Indian Households An Analysis of Micro Level Datardquo Energy 32 (2) 143ndash153 httpsdoiorg101016jenergy200603012
27References
Are Indiarsquos Urban Poor Using Clean Cooking Fuels Insights from Slums in Six States28
National Buildings Organisation 2013 ldquoState of Slums in India a Statistical Compendium 2013rdquo New Delhi Government of India httpnbonicinpdfSlums_in_India_Compendium_English_Versionpdf
National Sample Survey Office 2012 ldquoKey Indicators of Urban Slums in India ndash 69th Roundrdquo New Delhi National Data Bank for Socio-religious Categories httpmospinicinsitesdefaultfilesnational_data_bankndb-rpts-69htm
Nolan Laura B 2015 ldquoSlum Definitions in Urban India Implications for the Measurement of Health Inequalitiesrdquo Population and Development Review 41 (1) 59ndash84 httpsideasrepecorgablapopdevv41y2015i1p59-84html
Nolan Laura B David E Bloom and Ramnath Subbaraman 2018 ldquoLegal Status and Deprivation in Urban Slums Over Two Decadesrdquo HHS Public Access 53 (15) 47ndash55
Patel Amit 2020 ldquoPreventing COVID-19 Amid Public Health and Urban Planning Failures in Slums of Indian Citiesrdquo World Medical amp Health Policy 12 (3) httpsdoiorg101002wmh3351
Patnaik Sasmita and Shaily Jha 2020 ldquoCaste Class and Gender in Determining Access to Energy A Critical Review of LPG Adoption in Indiardquo Energy Research amp Social Science 67 (September) 101530 httpsdoiorg101016jerss2020101530
PPAC-CRISIL 2016 ldquoAssessment Report Primary Survey on Household Cooking Fuel Usage and Willingness to Convert to LPGrdquo New Delhi Petroleum Planning amp Analysis Cell Ministry of Petroleum and Natural Gas Government of India httpswwwppacgovinWriteReadDataReports201710310449342512219PrimarySurveyReportPPACpdf
PPAC 2019 ldquoOil Industry Information at a Glancerdquo New Delhi Ministry of Petroleum and Natural Gas Government of India httpswwwppacgovinWriteReadDataReports201912060336500305462ReadyReckonerNov2019WebVersionpdf
Rahaman Mehebub and Dipendra Nath Das 2017 ldquoNature of Slum Growth in Indian Citiesrdquo Urban India 37 (II) 100ndash116 httpswwwresearchgatenetpublication334051882_Nature_of_Slum_Growth_in_Indian_Citiesread
Rains Emily Anirudh Krishna and Erik Wibbels 2018 ldquoUrbanisation and Indiarsquos Slum Continuum Evidence on the Range of Policy Needs and Scope of Mobilityrdquo London International Growth Centre httpswwwtheigcorgwp-contentuploads201802Rains-et-al_Working-paper_coverpdf
Ranjan Rahul and Sudershan Singh 2017 ldquoEnergy Deprivation of Indian Households Evidence from NSSO Datardquo New Delhi Munich Personal RePEc Archive httpsmpraubuni-muenchende835661MPRA_paper_83566pdf
Roy Debraj Bharath Palavalli Niveditha Menon Robin King Karin Pfeffer Michael Lees and Peter M A Sloot 2018 ldquoSurvey-based Socio-economic Data from Slums in Bangalore Indiardquo Nature Publishing Group 5 1ndash9 httpsdoiorg101038sdata2017200
Saksena Sumeet P B Singh Raj Kumar Prasad Rakesh Prasad Preeti Malhotra Veena Joshi and R S Patil 2003 ldquoExposure of Infants to Outdoor and Indoor Air Pollution in Low-income Urban Areas A Case Study of Delhirdquo Journal of Exposure Science amp Environmental Epidemiology 13 219ndash30 httpsdoiorg101038sjjea7500273
Lipu Molla Shahadat Hossain and Arif Waliullah Bhuiyan 2014 ldquoElectricity Access in Urban Slum Households of Bangladesh A Case of Dhakardquo Journal of Renewable and Sustainable Energy 6 (053112) 1ndash15 httpsdoiorg10106314896697
29
Singh Rozita Xiao Wang Emmanuel Ackom and Juan Reyes 2015 ldquoEnergy Access Realities in Urban Poor Communities of Developing Countries Assessments and Recommendationsrdquo Global Network on Energy for Sustainable Development (GNESD) httpswwwgooglecomurlsa=tamprct=jampq=ampesrc=sampsource=webampcd=ampved=2ahUKEwj5nbqI wdntAhXUTX0KHZE6DboQFjAAegQIAhACampurl=https3A2F2Forbitdtudk2Ffiles2F10635 24942FEnergy_access_realities_v_final_updatedpdfampusg=AOvVaw0xNBAAo0bjLueY9FmoigKF
Singh Santosh 2014 ldquoThe Kaleidoscope of Cooking Understanding Cooking Behaviour and Stove Preferences in Rural Indiardquo New Delhi Deutsche Gesellschaft fuumlr Internationale Zusammenarbeit (GIZ) GmbH httpswwwgizdeendownloadsgiz2014-en-kaleidoscope-of-cooking-indiapdf
Smith Kirk R and Ajay Pillarisetti 2017 ldquoHousehold Air Pollution from Solid Cookfuels and its Effects on Healthrdquo Disease Control Priorities 7 (3) 133ndash52 httpsdoiorg101596978-1-4648-0522-6_ch7
UN-Habitat 2003 ldquoThe Challenge of Slums ndash Global Report on Human Settlements 2003rdquo Location of publishing London UN-Habitat httpsunhabitatorgthe-challenge-of-slums-global-report-on-human-settlements-2003
Wang Bolin Ruobao Li Zhong Lu and Yan Huang 2020 ldquoDoes Comorbidity Increase the Risk of Patients with COVID-19 Evidence from Meta-analysisrdquo Aging 12 (7) 6049ndash6057 httpsdoiorg1018632AGING103000
WHO 2014 ldquoWHO Guidelines for Indoor Air Quality Household Fuel Combustionrdquo WHO Accessed 25 July 2020 httpwwwwhointairpollutionguidelineshousehold-fuel-combustionen
World Bank 2020 ldquoThe State of Modern Energy Cooking Servicesrdquo Washington DC World Bank httpdocuments1worldbankorgcurateden937141600195758792pdfThe-State-of-Access-to-Modern-Energy-Cooking-Servicespdf
Yenneti Komali Yehua Dennis Wei and Wen Chen 2017 ldquoThe Urbanization of Poverty in India Spatio-temporal Disparities in Consumption Expendituresrdquo Geographical Review 107 (2) 360ndash383 httpsdoiorg101111j1931-0846201612167x
References
Are Indiarsquos Urban Poor Using Clean Cooking Fuels Insights from Slums in Six States
Annexure 1 Asset ownership index We used Filmer and Pritchettrsquos (2001) proposed approach to construct an asset ownership index using principal component analysis (PCA) We chose the indicators based on data from the Cooking Energy Access survey 2020 The variables we considered for the index were based on classifications by Caroline Moser and Andrew Felton (2007) and K Harttgen (2013) We computed the asset index using housing characteristics and consumer durables as follows
Variables not included in the asset index
Four types of variables were eliminated
1 Variables (such as grid electricity) that had high usage of greater than 95 per cent
2 Those (such as ownership of laptops or computers air conditioners etc) that had a low usage of less than 5 per cent
3 Variables (like house ownership) that have economically fluctuating values
4 Those that indicated a low correlation of less than 20 per cent variation between the top category (ie first) of the asset quintile and the bottom-most category (ie fifth) of the asset quintile
For ease of interpretation we rescaled this index such that the final index values range between 0 and 10 For this purpose we used a feature scaling (or minndashmax scaling) formula
Xnorm (or (IVx)) = (X ndash Xmin)(Xmax ndash Xmin)
where IVx is the normalised index value Xmin is the initial minimum value (-354) and Xmax is the initial maximum value (461) of the asset ownership index
30
Annexures
bull Crowding16 inside the house bull Toilet ownership and usage bull Source of water bull Number of pucca rooms
bull Ownership of two-wheeler bull Ownership of washing machine bull Ownership of television bull Ownership of refrigerator bull Ownership of cooker
16 A household with more than three members occupying a single room is considered crowded (World Health Organization 2018)
Housing characteristics
Consumer durables
Annexure 2 Explaining the use of LPG as the exclusive fuel (simple logistic regression model)
31Annexures
Dependent variable exclusive LPG use
Education of the primary cook (categorical base category is education beyond the school level)
Education of the household head (categorical base category is education beyond the school level)
State (categorical base category includes households from Rajasthan)
P gt z 95 confidence interval
Odds ratio (SE)
1299 (0112)
0659 (0202)
1399 (0394)
0970 (0038)
0994 (0011)
1003 (0013)
2042 (0508)
1011 (0046)
0782 (0441)
1198 (0608)
1377 (0664)
1345 (0566)
3141 (1103)
1213 (0500)
0309 (0211)
1165 (0565)
1703 (0680)
0002
0174
0233
0446
0583
0839
0004
0812
0663
0722
0507
0482
0001
0639
0086
0753
0182
1097
0361
0806
0898
0973
0977
1254
0924
0259
0443
0535
0589
1578
0541
0081
0450
0779
1540
1203
2428
1048
1016
1029
3327
1106
2361
3240
3545
3070
6251
2720
1181
3014
3723
Asset index
Primary cook involved in income-generating activity
Female-headed households
Household size
Age of household head
Age of primary cook
Doorstep delivery of LPG cylinders
PMUY customer
Primary cook is not educated
Primary cook has a school education
Household head is not educated
Household head has a school education
Uttar Pradesh
Bihar
Chhattisgarh
Jharkhand
Madhya Pradesh
Number of households (n) = 417
Log likelihood = -228777
Prob gt chi2 = 0000
Pseudo R2 = 0126
The dependent variable is a dummy variable where households using LPG exclusively are assigned a value of 1 and all other households are assigned the value of 0
The caste of the household has not been factored into the regression as a separate variable because of its underlying influence on economic status
Source Authorsrsquo analysis
Are Indiarsquos Urban Poor Using Clean Cooking Fuels Insights from Slums in Six States
Annexure 3 Air quality (PM25 concentration in μgm3) across 15 districts based on CAAQMS data
32
Dis
tric
tsM
ar-1
9A
pr-1
9M
ay-1
9Ju
n-19
Jul-1
9A
ug-1
9Se
p-19
Oct
-19
Nov
-19
Dec
-19
Jan-
20Fe
b-20
Mar
-20
794
5
988
5
866
7
-
645
329
2
453
7
388
1
769
1
886
4
661
5
950
9
834
4
-
823
4
611
7
569
9
535
7
-
270
4
589
4
571
5
293
1
705
4
839
2
614
9
970
1
826
8
-
844
9
622
1
597
1
564
0
-
235
3
414
3
619
1
414
3
653
9
834
7
568
8
104
90
739
8
-
894
9
630
9
342
2
450
4
-
476
465
2
474
6
429
2
592
3
566
1
-
674
6
531
4
501
5
568
7
450
8
-
320
3
-
846
506
3
349
5
332
4
369
1
387
2
-
430
4
393
6
353
7
446
2
406
8
335
2
339
1
-
102
9
497
2
261
8
269
1
431
4
294
1
-
351
6
277
3
-
336
5
315
5
248
3
392
8
149
7
144
9
462
3
270
5
331
3
273
4
276
0
106
6
391
7
326
2
-
368
6
625
3
875
2
101
64
521
2
183
1
380
4
556
2
544
1
558
2
102
24
104
33
156
44
128
73
146
62
137
71
109
14
183
70
201
80
896
7
190
1
457
7
581
2
583
5
815
4
135
00
126
41
239
94
208
15
158
51
221
86
121
35
192
46
218
43
848
0
205
2
448
5
509
4
582
0
704
5
177
01
613
1
244
01
215
80
136
87
230
54
964
2
201
52
122
30
725
5
120
6
435
4
454
7
481
2
111
37
147
45
537
3
175
53
162
86
111
21
170
08
583
8
132
10
866
2
513
1
112
5
511
3
507
5
511
8
879
4
120
22
502
1
135
53
116
39
994
7
120
45
410
5
792
1
674
8
326
3
177
6
385
0
408
5
335
9
497
2
594
2
429
9
673
2
547
5
540
8
559
4
Gay
a
Muz
affa
rpur
Pat
na
Bho
pal
Satn
a
Alw
ar
Ajm
er
Ud
aip
ur
Ag
ra
Bul
and
shah
r
Hap
ur
Gha
ziab
ad
Gre
ater
Noi
da
Mee
rut
Noi
da
Sour
ce C
onti
nuou
s am
bien
t air
qua
lity
mon
itor
ing
stat
ion
(Mar
ch 2
019
ndash M
arch
202
0)
In a rapidly urbanising India it would be imperative for policymakers and practitioners in energy and urban development sector to integrate access to clean cooking energy within the ambit of services for the urban poor
Image CEEW
Are Indiarsquos Urban Poor Using Clean Cooking Fuels Insights from Slums in Six States
COUNCIL ON ENERGY ENVIRONMENT AND WATER (CEEW)
Sanskrit Bhawan A-10 Aruna Asaf Ali Marg Qutab Institutional AreaNew Delhi - 110 067 IndiaT +91 11 4073 3300
infoceewin | ceewin | CEEWIndia

Are Indiarsquos Urban Poor Using Clean Cooking Fuels Insights from Slums in Six States
Acknowledgments
The authors would like to thank the partners for this survey Initiative for Sustainable Energy Policy (ISEP) at the Johns Hopkins School of Advanced International Studies (SAIS) We would like to extend our gratitude to Prof Johannes Urpelainen (Johns Hopkins SAIS) Carlos F Gould (Columbia University) and Alice Tianbo Zhang (Washington and Lee University) for leading the design of the survey instrument and giving us regular inputs and feedback in various stages of survey planning and implementation We would also like to thank our colleagues at CEEW Kurinji Selvaraj and Tanushree Ganguly for providing the district level air quality data for the analysis
The authors would like to acknowledge the valuable support of Market Xcel Private Ltd the survey agency and its survey team for administering the survey and collecting data Our deepest gratitude goes to them Special thanks to Prasenjit Saha and Pooja Sirpaul (Market Xcel Private Ltd) who were instrumental in implementing the survey We would also like to thank the MacArthur Foundation for financially supporting the study
We want to thank our reviewersmdashAshish Gupta University of Pennsylvania Vinaya Padmanabhan Oxford Policy Management and Abhishek Jain CEEWmdashfor providing critical feedback and comments that went a long way in refining this report
Are Indiarsquos Urban Poor Using Clean Cooking Fuels Insights from Slums in Six States
Shaily Jha shailyjhaceewin
Shaily is a Research Analyst in the Energy Access team at The Council She works on access to clean cooking energy and livelihoods with a focus on gender and social inclusion Shaily holds a postgraduate degree in Disaster Management from the Tata Institute of Social Sciences (TISS) Mumbai and an undergraduate degree in Geography from Miranda House University of Delhi
Sasmita Patnaik sasmitaapatnaikgmailcom
Sasmita is a former Programme Lead of the Energy Access team at The Council She led the work on access to clean cooking and livelihoods with a focus on gender and social inclusion She holds an MSc in Development Studies from the School of Oriental and African Studies (SOAS) and a postgraduate diploma in Rural Management from Xavier Institute of Management Bhubaneswar (XIMB)
Rithima Warrier rithima2warriergmailcom
Rithima worked as Research Consultant at The Council where she analysed primary data on energy access for rural households and urban slums of India Rithima holds an MTech in Bioscience and Bioengineering with a specialisation in Energy from the Indian Institute of Technology Guwahati (IITG) and a BE in Chemical Engineering from MS Ramaiah Institute of Technology (MSRIT) Bangalore
The authors
ldquoEven though the use of LPG as an exclusive cooking fuel is more prominent in urban households than their rural counterparts a significant share of the urban population living in slums is struggling to incorporate the cost of using LPG into the household budget The pollution burden for these households is doubled as they are exposed to the high ambient particulate matter pollution of cities along with the household air pollution from the use of polluting cooking fuelsrdquo
ldquoDuring data analysis we realised that even within polluting fuel-using slum households the reasons for not transitioning towards cleaner fuel varied between the households that stacked LPG with polluting fuels and the ones that only used polluting fuels Moreover the economic impact of COVID-19 is expected to further hinder the transition to cleaner fuels in these slumsrdquo
ldquoPolicies on clean cooking energy access have not necessarily targeted energy poverty in urban slums In a rapidly urbanising country facing a crisis of air pollution and now recovering from the economic impacts of COVID-19 it is time that we target policies to alleviate energy poverty in urban slums particularly in Tier 2 and Tier 3 cities Women and children are the worst affected by the use of polluting fuels reinforcing the need to focus on womenrsquos ability to use clean cooking energy solutions even after schemes like Pradhan Mantri Ujjwala Yojanardquo
Are Indiarsquos Urban Poor Using Clean Cooking Fuels Insights from Slums in Six States
Image iStock
Urban slums suffer from the double burden of pollution as they are exposed to the high ambient particulate matter pollution of cities along with the household air pollution (HAP) from the using unclean cooking fuels
Contents
Executive summary
Annexures
References
2 Cooking fuel adoption and use in urban slum households
21 Households using LPG as their only fuel 22 Households stacking LPG with polluting fuels 23 Households using only polluting fuels
SPOTLIGHT I Household air pollution (HAP) in urban slums
SPOTLIGHT II Womenrsquos participation in intra-household decision-making regarding LPG use
SPOTLIGHT III A comparison of access to clean cooking energy between urban slum and non-slum households across six states
3 Way forward
11 Motivation and methodology 12 Socio-economic characteristics of the urban slums of the six states
1 Introduction state of Indiarsquos urban slums 1
7
17
20
21
23
26
30
24
8
1116
i
Are Indiarsquos Urban Poor Using Clean Cooking Fuels Insights from Slums in Six States
Tables
Table 1 Sample allocation across urban slums
Table 2 Less than one-third of urban slum households reported income from salaried jobs
Table 3 Scheduled Castes and Scheduled Tribes have the lowest economic status
Table 4 The poor economic condition of households in urban slums impacts the use of clean fuels exclusively for cooking
Figures
Figure ES1 To reduce the health impacts from HAP households that are stacking with polluting fuels will need to transition to exclusive use of clean cooking fuels
Figure ES2 While stacking is highest among the middle categories (second and third quintile) it is prevalent across all asset quintiles including the highest one
Figure 1 Within slums there are considerable state-level variations in householdsrsquo fuel usage patterns across states
Figure 2 While the majority of LPG-using households use the fuel primarily only half of them use it exclusively
Figure 3 Most households using LPG exclusively acquire six to eight cylinders per year
Figure 4 Of the households that stack fuels most use LPG as their primary fuel
Figure 5 Stacking is prevalent in households across asset quintile categories
Figure 6 Almost half of the households using polluting fuels use it every day
Figure 7 Proportion of urban slum households using solid fuels as the primary cooking fuel increases during the winters months aggravating householdsrsquo air pollution exposure due to unfavourable atmospheric conditions
Figure 8 Lack of awareness about receiving LPG refill subsidies poses a threat to the success of LPG subsidy schemes
Figure 9 More than half of the households currently without LPG do not know how to get a connection or whom to ask about it implying a lack of awareness
5
5
3
22
ii
iii
8
8
9
11
12
13
14
15
16
Acronyms
BPL below poverty line
CAAQMS continuous ambient air quality monitoring stations
COPD chronic obstructive pulmonary disease
COVID coronavirus disease
DALY disability-adjusted life year
DBTL Direct Benefit Transfer scheme for LPG
HAP household air pollution
IRES India Residential Energy Survey
LPG liquified petroleum gas
NSSO National Sample Survey Office
OBC Other Backward Castes
OMCs oil and marketing companies
PMUY Pradhan Mantri Ujjwala Yojana
SC Scheduled Caste
SDI socio-demographic index
ST Scheduled Tribes
Are Indiarsquos Urban Poor Using Clean Cooking Fuels Insights from Slums in Six States
Image iStock
To reduce the health impacts from household air pollution slum households that are stacking polluting fuels will need to transition using clean cooking fuels exclusively
With increased urbanisation India is experiencing acute air pollution in its urban centres Slum dwellers are doubly affected both by the higher concentration of
particulate matter in urban areas as well as indoor air pollution from the use of unclean cooking fuels With more than 137 million people living in slums in country (Census 2011) there is a strong impetus to understand the use of clean cooking fuels in such households Existing literature on energy access and use in slums across developing countries assume that energy infrastructure is available in these settlements as they are situated in urban environments (Butera et al 2016) Household air pollution (HAP) has an estimated average contribution of 30ndash50 per cent to ambient air quality across Indiarsquos urban and rural areas (Balakrishnan et al 2019) Addressing biomass burning for cooking water heating and space heating during the winters has the potential to help reach the national ambient air quality standards (Chowdhury et al 2019)
However our analysis shows that a large share of these households do not have access to clean fuels due to lack of afforability or patchy supply In this brief we discuss access to clean cooking energy in urban slums across six states (Bihar Uttar Pradesh Rajasthan Madhya Pradesh Jharkhand and Chhattisgarh) These states have a low socio-demographic index and a high disease burden due to air pollution (Balakrishnan et al 2019) The findings of this brief are based on a primary survey conducted in rural areas and urban slums in these states ndash Cooking Energy Access Survey 20201 The analysis focuses on the fuel use patterns of households the extent of use of LPG and solid fuels fuel stacking behaviour and the primary cookrsquos perception of various cooking fuels and their health impacts
Slum households vary widely in their use of clean cooking fuels Therefore to understand their cooking energy use patterns better we categorised these households into three groups
Using clean fuels exclusively
Stacking clean fuels with polluting fuels and
Using only polluting fuels
Use of LPG as primary fuel
82 (Cooking Energy Access Survey 2020)
47 (Census 2011)
Polluting fuel as primary fuel
16 (Cooking Energy Access Survey 2020)
52 (Census 2011)
i
Executive summary
1 This has been referred as lsquoour surveyrsquo thereafter
In this brief the use of clean cooking fuels is considered synonymous to use of LPG
Are Indiarsquos Urban Poor Using Clean Cooking Fuels Insights from Slums in Six States
1 Households using LPG as their only fuelWhile most urban slum households have an LPG connection exclusive use of LPG is limited to just over half of the total households The householdrsquos economic status (measured through asset ownership) and their access to doorstep delivery of LPG refills are two critical factors that determine their ability to use LPG exclusively We found that households with higher asset ownership have significantly higher odds of using LPG as an exclusive fuel
2 Households stacking LPG with polluting fuelsAlthough schemes like Pradhan Mantri Ujjwala Yojana (PMUY) have helped increase LPG adoption this has not resulted in the complete replacement of biomass-based fuels Despite 86 per cent of households having an LPG connection the data shows that over a third of slum households are stacking with polluting fuels (including firewood dung cakes agriculture residue charcoal and kerosene) Most of these households use polluting fuels daily or at least weekly which increases their exposure to household air pollution
Among the households stacking LPG with polluting fuels the reasons for stacking vary affordability free-of-cost availability of biomass seasonality and taste preferences Across asset quintiles we find that stacking is highest among the middle categories (second and third quintile) though most households in these categories have adopted LPG Still the affordability of the fuel remains a significant concern One-fourth of households who are stacking polluting fuels have a median annual refill rate of eight cylinders and above (same as exclusive LPG users) despite having a similar household size as those using LPG exclusively Most of such households fall in the wealthiest asset quintiles and use a chulha (mud stove) for cooking chapatis or vegetables suggesting that they are not necessarily using unclean fuels due to the unaffordability of LPG but due to other factors like taste
ii
Figure ES1 To reduce the health impacts from household air pollution (HAP) households that are stacking with polluting fuels will need to transition to exclusive use of clean cooking fuels
Source Authorsrsquo analysis
Exclusive clean fuel users
Stacking with LPG as the primary fuel
Only polluting fuel users
Stacking LPG with polluting fuels
Stacking with LPG as the secondary fuel
55
3388
12
12
63 LPG-using households receive doorstep delivery of cylinders
77
households receiving doorstep delivery of LPG cylinders are exclusive users of the fuel
Despite increased LPG adoption stacking is prevalent in more than one-third of the slum households
iiiExecutive summary
Figure ES2 While stacking is highest among the middle categories (second and third quintile) it is prevalent across all asset quintiles including the highest one
Source Authorsrsquo analysis
21 Non-cooking uses of polluting fuels Despite using LPG as the primary fuel for their cooking needs households that stack fuels use polluting fuels for non-cooking purposes like heating water for bathing (29 per cent) and space heating (10 per cent)
22 Seasonal variations in fuel use Most households (88 per cent) use LPG as their primary fuel in the rainy season while in winters less than 45 per cent of households do so The increased use of polluting fuels in winter could be because during these months the polluting fuel requirement for non-cooking tasks within the household like water heating for bathing and space heating increases ndash which leads to the increased use of polluting fuels for cooking as well Unfortunately the increased use of polluting fuels in winters exposes households to the double burden of high ambient and household air pollution due to unfavourable atmospheric conditions
21 households stacking fuels
have more than one LPG connections
25 households stacking fuels have two-cylinder connections
1 2 3 4 5
Asset quintile categories
0
20
40
60
80
100
Per
cent
age
of h
ouse
hold
s
Exclusive clean fuel users Stacking LPG with polluting fuels Only polluting fuel users
5348
52
6367
2441 37
3232
2311 11
51
Are Indiarsquos Urban Poor Using Clean Cooking Fuels Insights from Slums in Six States
3 Households using only polluting fuelsDespite large-scale government initiatives like PMUY 12 per cent of urban slum households do not use LPG and rely on polluting fuels While most of these households are aware of PMUY the high upfront LPG connection cost along with the high recurring expenditure on refills deter them from procuring an LPG connection
Way forwardWhile we see a progressive change in householdsrsquo energy-use patterns as we move from rural to urban issues like affordability availability preference seasonality and the end-uses of the fuel remain essential factors that determine household fuel choice Understanding user categories and fuel use patterns is crucial in enabling access to and sustained use of clean cooking fuels Also it is vital to recognise the implications of cooking being a gendered activity However womenrsquos participation in intrahousehold decision-making regarding LPG use is limited
Despite being in urban areas 37 per cent of slum households do not receive home delivery of cylinders ndash availability is an essential factor that determines the householdrsquos likelihood of using LPG exclusively To increase LPG use oil and marketing companies (OMCs) and distributors need to improve home delivery of LPG refills in slum areas
Emissions from household sources contribute hugely to the surrounding air quality (Harish et al 2019) which is already poor in congested slum areas Majority of households cook inside the main house without a chimney indicating high exposure to pollution from the use of unclean fuels for cooking
iv
30 householdsrsquo female members place the order for LPG refills
50 householdsrsquo female
members decide whether or when to purchase LPG refills
75 householdsrsquo
using polluting fuels cook inside
the main house
67 householdsrsquo using polluting fuels do not have a chimney for ventilation
vExecutive summary
Integrate the issue of lack of access to clean cooking energy with urban poverty This study reiterates the need to look at poverty in urban areas in the context of energy access The vulnerability of urban slum dwellers needs to be accounted for while designing and implementing policies including social protection schemes Given the health and economic impacts of pollution access to clean cooking energy schemes must be integrated with the social assistance programmes of other ministries (eg health education and nutrition assistance) to better target support for slum households Government programmes such as the National Urban Livelihoods Mission and social service allocations for housing should use existing targeting approaches to include access to clean cooking energy within their ambit of services for the poor
The economic impact from COVID-19 will push households into energy poverty leading to the increased use of free-of-cost biomass ndash consequently increasing the risk of exposure to emissions from fuel burning While the government has announced that it will provide up to three free refills under the PM-Garib Kalyan Yojana scheme to all PMUY households less than a quarter of households in urban slums have Ujjwala connections ndash effectively making them ineligible for relief support There is a need to expand the reach of PMUY to cover all slum households
Bring renewed emphasis on clean cooking during COVID-19 Increased poverty would mean increased use of polluting fuels ndash there is a need for a renewed emphasis on clean cooking energy access during the COVID-19 pandemic as increased use of polluting fuels has health implications (lower respiratory infections and coronary chronic obstructive disease (COPD)) that increase the risk of COVID-19 infections being more severe
There is a need for targeted effort to include the poor households in urban slums left out in the first phase of Ujjwala
Are Indiarsquos Urban Poor Using Clean Cooking Fuels Insights from Slums in Six States
Image iStock
Addressing biomass burning for cooking water heating and space heating during the winters has the potential to help reach the national ambient air quality standards
The Census of India (2011) estimates that India has about 137 million slum dwellers across the country However statistics on slum populations vary significantly based on how
a slum is defined (Nolan 2015) Therefore not only is there a lack of data about how many people live in slums and informal settlements but there is also limited information about living conditions in slums (Rains Krishna and Wibbels 2018) Rapid urbanisation in India has led to population spikes in urban centres Low-income households in urban areas are trapped in informal and sometimes lsquoillegalrsquo settlements with poor living conditions where access to essential services and infrastructure tends to be limited or badly deteriorated (Butera et al 2016) While slum dwellers are not a homogeneous population slum areas have high concentrations of poverty and social and economic deprivation and poor shelter and environmental conditions (UN-Habitat 2003)
1 Introduction state of Indiarsquos urban slums
1
The Census of India (2011) defines slums as ldquoresidential areas where dwellings are unfit for human habitation by
reasons of dilapidation overcrowding faulty arrangements and design of such buildings narrowness or faulty
arrangement of street lack of ventilation light or sanitation facilities or any combination of these factors which
are detrimental to the safety and healthrdquo The slums in India are officially categorised into three categories
identified recognised and notified1 (Chandramouli 2010) About 59 per cent of slum households in India are non-
notified and are not legally recognised by the government (Nolan Bloom and Subbaraman 2018)
BOX 1 Slums in India
The existing literature on energy access and use in slums across developing countries suggests that while energy infrastructure (electric grid LPG distribution system) is available in these settlements (by being urban) households cannot afford it andor the service is unreliable (frequent outages and low voltage for electricity uncertain availability of gas cylinders) (Butera et al 2016) This leads to households relying on illegal connections for electricity and using energy sources that are on the lower end of the energy ladder (such as kerosene charcoal wood and other biomass residues) for cooking (Butera et al 2016)
1 Areas notified as slums by the concerned municipalities corporations local bodies or development authorities were termed notified slums All areas recognised as lsquoSlumrsquo by State UT Administration or Local Government Housing and Slum Boards which may have not been formally notified as slum under any act While a compact area of at least 300 population or about 60-70 households of poorly built congested tenements in the unhygienic environment is termed as identified slums (National Sample Survey Office 2012)
Are Indiarsquos Urban Poor Using Clean Cooking Fuels Insights from Slums in Six States2
In India population growth and rapid urbanisation have resulted in the deepening of urban poverty and the increased growth of urban slums (GNESD 2008 Yenneti Wei and Chen 2017) As per the Census 2011 most slum dwellers are casual labourers engaged in works other than public works (ie informal sectors) as opposed to salaried employees in non-slum urban areas (National Buildings Organisation 2013) As per the National Sample Survey Office (NSSO 2011ndash2012) the average daily wage of casual labourers is as low as INR 170 in urban areas (Ministry of Housing and Urban Affairs 2019) Such households may be able to purchase cleaner and more efficient fuels whenever they can but are likely to fall back on less efficient ones when faced by budgetary constraints Studies suggest that despite the LPG subsidies provided by the government significant sections of the urban poor population are still struggling to incorporate the cost of LPG into their household budgets (R Singh et al 2015) Use of multiple fuels also provides security from price variations and unreliable service associated with a single fuel or technology (Shahadat Lipu and Bhuiyan 2014)
As per the Census 2011 only half of the urban slum households across the country use LPG as their cooking fuel the remaining rely on solid fuels and kerosene Since 2013 the LPG programme in India has undergone many modifications to improve delivery and targeting access to connections and the availability of LPG (CEEW 2020) Pradhan Mantri Ujjwala Yojana (PMUY) which focuses on tackling the high upfront cost of LPG by providing LPG connections to below poverty line (BPL) households with credit-linked subsidy support has played an instrumental role in increasing the penetration of LPG across the country As of November 2019 about 965 per cent of households in India have an LPG connection (PPAC 2019) Small towns and cities which have been experiencing a comparatively slow rate of urban growth but the high percentage of slum population mall towns and cities which have been experiencing a relatively slow rate of urban growth but a high percentage of slum population
However the dramatic increase in LPG coverage has led to increased fuel stacking (Cheng and Urpelainen 2014) The reliance on fuel stacking has significant implications as the health benefits of using clean fuels are reduced or perhaps even nullified in households that continue to use biomass (Cheng and Urpelainen 2014) Urban slums suffer from a double burden of pollution as they are exposed to high ambient particulate matter pollution in cities along with the household air pollution (HAP) from using unclean cooking fuels (WHO 2014) The Global Burden of Disease study notes that even with the substantial increase in the provision of clean cooking fuels in India more than half of Indiarsquos population is exposed to HAP from solid cooking fuels as of 2017 (Balakrishnan et al 2019) In the current context this is concerning since exposure to air pollution has been linked to developing lower respiratory infections and chronic obstructive pulmonary disease (Balakrishnan et al 2019) which are among the major risk factors for COVID-19 (Lippi and Henry 2020 Wang et al 2020)
11 Motivation and methodology While there have been various studies on energy access in rural areas there is minimal data on energy use and patterns in urban slum households Most studies on urban slums and energy access focus on specific slums in large metropolitan areas such as Delhi and Bangalore (Saksena et al 2003 Dhingra et al 2008 Roy et al 2018) Living conditions and access to resources vary across slums in smaller towns and cities compared to those in Tier I
Slum-dwellers suffer from the double burden of pollution as they are exposed to high ambient particulate matter in cities along with the HAP from using unclean cooking fuels
2 A summary measure that identifies where countries or other geographic areas fall on the spectrum of development Expressed on a scale of 0 to 1 SDI is a composite average of the countryrsquos rankings in terms of per capita income average educational attainment and fertility rates
3 These states account for six out of eight of the lowest socio-demographic index (SDI) states and exhibit the highest health impacts of household air pollution (HAP) These states also have the highest percentage of households covered under the flagship clean cooking energy programme in India ndash PMUY
4 Referred to as lsquoour surveyrsquo thereafter
5 In our sample about 82 per cent of households are from notified slums
6 About 98 per cent of the respondents were female members of the household
7 For further details on the survey sample and methodology refer to the technical document for the survey
3Introduction state of Indiarsquos urban slums
Table 1 Sample allocation across urban slums
Source Authorsrsquo compilation
Note The number of slums sampled within each state varied because the slums were picked from the same districts that were sampled under the India Residential Energy Survey (2020) across the six states This was done to ensure logistical ease in conducting both the surveys and to share the resources of the national-level survey The list of urban slums as per the Census 2011 in the districts sampled under IRES 2020 constitutes the urban sampling frame7
State Districts sampled Urban slums sampled Households surveyed
16
14
10
10
4
4
58
31
15
16
12
5
4
83
249
124
128
94
40
32
667
Uttar Pradesh
Bihar
Madhya Pradesh
Rajasthan
Jharkhand
Chhattisgarh
cities these towns have been experiencing a comparatively slow rate of urban growth but are home to large slum populations (Rahaman and Das 2017) Further existing sources on access to clean cooking energy among slum households are limited to primary fuel use and lack detailed information about fuel use and stacking patterns
In India states with the lowest socio-demographic index (SDI)2 also account for the highest level of disease burden due to air pollution (Balakrishnan et al 2019) The low SDI states in north India had some of the highest levels of ambient particulate matter and household air pollution ndash especially Bihar Uttar Pradesh Rajasthan and Jharkhand The disability-adjusted life year (DALY) rate attributable to HAP was highest in the low SDI states of Chhattisgarh Rajasthan and Madhya Pradesh (Balakrishnan et al 2019)
The findings of this brief are based on a primary survey conducted across rural areas and urban slums in six energy access deprived states in India ndash Bihar Jharkhand Uttar Pradesh Rajasthan Madhya Pradesh and Chhattisgarh3 The Cooking Energy Access Survey 20204 focused on householdrsquos clean cooking energy access and its barriers and drivers in rural areas and urban slums Based on the list of urban slums across districts in Census 2011 the survey covered 656 households across 83 urban slums (notified and non-notified)5 spread across 58 districts The survey was conducted with the primary cook of the household6
In this brief we focus on understanding access to clean cooking energy specifically across urban slum households The analysis focuses on the fuel use patterns of households the extent of use of LPG and solid fuels fuel stacking behaviour and the primary cookrsquos perception of various cooking fuels and their impact on health The results discussed below are representative of the urban slum population in six states We have refrained from state-level analysis because of the smaller sample size for urban slums in some states like Jharkhand and Chhattisgarh
Are Indiarsquos Urban Poor Using Clean Cooking Fuels Insights from Slums in Six States4
12 Socio-economic characteristics of the urban slums of the six states Non-farm casual labour is the primary source of income for more than 42 per cent of the households such households reported a median monthly expenditure of about INR 5000 In only 20 per cent of the households the primary cook is involved in income-generating activities primarily engaged in casual non-farm labour or are self-employed
Source Authorsrsquo analysis
60 households have a monthly income below
INR 10000
In 90 households all members have
Aadhar cards
94 households have a bank account
11 households are currently indebted
Median savings in the past year
INR 4000
Median monthly expenditure
INR 6000
MEDIAN HOUSEHOLD SIZE
6
5
Table 2 Less than one-third of urban slum households reported income from salaried jobs
Source Authorsrsquo analysis
Under self-employment some of the householdsrsquo report occupations like carpentry tailoring driver and priest
The primary source of income of urban slum households
Non-farmdaily wage casual labour
Private or government salaried job
Shop or own business or self-employed
Farm labour
Agriculture on own or leased land
Others (pension remittances cattle rearing none)
43
22
18
8
7
2
Scheduled Castes (SC) (30 per cent) and Other Backward Castes (OBC) (45 per cent) form the majority of the urban slum population While Scheduled Tribes (ST) constitute less than 10 per cent of the overall population a majority of them are in Madhya Pradesh and Rajasthan Less than 20 per cent of the urban slum population are from the General castes States like Bihar Jharkhand and Rajasthan have the least proportion of General castes living in slum areas
Within urban slum households OBC and General households are relatively better off economically as shown in Table 3 Occupational patterns also vary based on caste A higher proportion of OBCs and General households rely on running a business self-employment or salaried jobs for their primary source of income as compared to SC and ST households The latter are primarily engaged in farm and non-farm labour The socio-economic marginality of SCs and STs even within slums is a consequence of these communities being most deprived in terms of access to resources and education income housing etc (Chandrasekhar and Mitra 2018) We see a similar trend in our sample in education and income levels Slums often remain the permanent habitation of marginalised castes as opposed to serving as an entry point for persons from higher castes who get absorbed into relatively better jobs and eventually move out of the slums (Chandrasekhar and Mitra 2018)
Table 3 Scheduled Castes and Scheduled Tribes have the lowest economic status
Source Authorsrsquo analysis
We utilise an economic status or asset index as a measure of a householdrsquos relative wealth and economic status based on the Filmer and Pritchett (2001) approach The list of variables included in the economic status index can be found in Annexure I The index takes values between 0 and 10 where a higher value denotes a higher level of asset ownership
Caste Sample size
Mean of asset index
(Min ndash Max) of BPL cardholders
233
51
281
92
042
039
046
046
(0ndash084)
(008ndash077)
(003ndash1)
(008ndash09)
45
60
49
36
Scheduled Castes
Scheduled Tribes
Other Backward Classes
General
Introduction state of Indiarsquos urban slums
Are Indiarsquos Urban Poor Using Clean Cooking Fuels Insights from Slums in Six States652
Image iStock
Exclusive use of LPG is limited to just over half of the total slum households The householdrsquos economic status and its access to doorstep delivery of LPG refills are two critical factors that determine their ability to use LPG exclusively
7
The fuel use patterns in urban slum households across the six states show a significant improvement in LPG use over the past decade when compared with the data from
Census 2011 The share of households using polluting fuels (including firewood dung cake agriculture residue and kerosene) as their primary fuel has decreased significantly but we find that stacking is a common practice even among households using LPG as a primary fuel Unless they use clean fuels exclusively such slum households will still be exposed to the health risks associated with HAP
Across the six states the primary fuel used for cooking by slum households
For the analysis in this brief we have categorised the households into three based on their fuel choices and position on the energy ladder those that exclusively use clean cooking fuels (LPG and electricity) stack LPG with polluting fuels and use only polluting fuels The level of exposure to emissions from cooking increases from the first (least harmful) to the third category (most harmful)
2 Cooking fuel adoption and use in urban slum households
In this brief the use of clean cooking fuels is considered synonymous to use of LPG since other clean fuels comprise a negligible share of use
Source Authorsrsquo analysis
Households using clean fuel exclusivelyWhile the majority of these households use LPG two per cent of the households reported using electricity for cooking purposes
Households stacking LPG with polluting fuelsMost of these households reported using LPG as their primary fuel and polluting fuels as their secondary fuel About four per cent of slum households reported using polluting fuels as their primary fuel and LPG as their secondary fuel
Households using only polluting fuelsThese households only use firewood charcoal dung
agricultural residue kerosene or a stack of these fuels
5533
12
Fuel-use categories
Use of LPG as primary fuel
82 (Cooking Energy Access Survey 2020)
47 (Census 2011)
Polluting fuel as primary fuel
16 (Cooking Energy Access Survey 2020)
52 (Census 2011)
Are Indiarsquos Urban Poor Using Clean Cooking Fuels Insights from Slums in Six States8
In the following sections we explore factors such as socio-economic characteristics affordability and availability of fuel intra-household gender dynamics and fuel perceptions which influence the ability and likelihood of a household to use different fuels
21 Households using LPG as their only fuel In this section we focus on understanding the household characteristics and fuel use patterns of those using LPG exclusively for cooking Most urban slum households with an LPG connection report using LPG as their primary fuel While 55 per cent of the slum households (63 per cent of LPG-using households) use LPG exclusively others stack LPG with polluting fuels Uttar Pradesh has the highest
proportion (70 per cent) of slum households who are exclusive users of clean cooking fuels among the six states
Figure 1 Within slums there are considerable state-level variations in householdsrsquo fuel usage patterns across states
Source Authorsrsquo analysis
Note We have refrained from state-level analysis because of the smaller sample size for urban slums in states like Jharkhand and Chhattisgarh
Figure 2 While the majority of LPG-using households use the fuel primarily only half of them use it exclusively
Source Authorsrsquo analysis
0
0
10
10
20
20
30
30
40
40
50
50
60
60
70
70
80
80
90
90
100
100
8682
55
Bihar
LPG users
Chhattisgarh Jharkhand Madhya Pradesh
LPG as the primary fuel LPG as the exclusive fuel
Rajasthan Uttar Pradesh
States
Per
cent
age
of h
ouse
hold
s P
erce
ntag
e of
hou
seho
lds
Exclusive clean fuel users Stacking LPG with polluting fuels Only polluting fuel users
42
3
30
56
45
39
1611
40
4944
46
10 5
24
71
41
28
9Cooking fuel adoption and use in urban slum households
Over a fifth of households using LPG exclusively are PMUY households which suggests that these households have been able to transition to clean cooking fuels in less than four years PMUY households using LPG exclusively are of a relatively higher economic status than households that stack polluting fuels Unlike in rural areas the age of an LPG connection does not have a direct correlation with per capita LPG consumption in urban slum households suggesting that even households with recent LPG connections in urban slums are likely to use LPG exclusively Households in urban areas have been known to experience a direct transition to exclusive use of clean fuels from using traditional fuels (Kuo and Azam 2019) This could be due to the time-saving that comes with the adoption of clean cooking fuels like LPG ndash where urban households are more willing or need to spend more on convenience than rural households
Figure 3 Most households using LPG exclusively acquire six to eight cylinders per year
Source Authorsrsquo analysis
211 The economic status of the household determines exclusive LPG useA simple logistic regression (Annexure II) shows that households with higher asset ownership have significantly higher odds of using LPG as an exclusive fuel Even between primary and exclusive users of LPG asset ownership remains a significant differentiating factor This corroborates the findings of previous studies (Ranjan and Singh 2017) that state that households tend to switch their cooking fuel use patterns after a threshold level of income is achieved However this is not to suggest that all wealthy households shift to exclusive use of clean fuels We discuss the reasons for stacking among these households in the next section
Cooking energy in the household budget We find that households using LPG as their only fuel pay INR 496 per month8 This effectively translates to an average household spending almost eight per cent of their monthly expenses on cooking fuel
Oil and Marketing Companies (OMCs) are attempting to address the challenges around the recurring refilling
cost by encouraging low-income households to use a 5 kilograms (kg) cylinder to overcome the high upfront cost
associated with 145kg cylinders In our sample we find that only about two per cent of urban slum households use
small cylinders (5kg or 3kg)
BOX 2 Uptake of small cylinders
8 This is based on the upfront cost paid by the household for an LPG refill Given that only 40 per cent of the householdsrsquo report receiving LPG subsidy on refills ndash it has not been considered in the fuel expenditure calculation The share of fuel expenditure for the households receiving LPG subsidies would be accordingly less than the others
0
10
20
30
40
50
60
70
1
1 16 8 9
22
60
4350 50
14
34
15
2 3 4 5 6 7 8 9 10 11 12 13
Number of 14 kg LPG cylinder refills obtained by exclusive LPG users
Per
cent
age
of h
ouse
hold
s us
ing
LP
G e
xclu
sive
ly
households using LPG exclusively Median value
Are Indiarsquos Urban Poor Using Clean Cooking Fuels Insights from Slums in Six States
212 Home delivery for exclusive LPG users We find that households who receive doorstep delivery of LPG refills have higher odds of using LPG as their exclusive fuel Hassle-free doorstep delivery of LPG refills is known to influence the use of LPG as a primary secondary or exclusive fuel (PPAC-CRISIL 2016)
Additional expense on procurement of cylinders Almost half of the households who receive doorstep delivery of LPG pay an additional amount of INR 20 as a delivery charge However in households that do not receive doorstep delivery about 46 per cent report that one member must forgo their daily wages to procure the cylinder Most of such households depend on daily labour or private jobs for their income
Given that almost half of the households report having to forgo wages to procure the cylinders it could affect the householdrsquos ability to use LPG continually It may add to the average delay in the purchase of refills
Procurement of LPG cylinders during the COVID-19 pandemic Most households that do not receive doorstep delivery of LPG (58 per cent) use private vehicles (including motorcycles or bicycles) to transport LPG refills About one-third of the households procuring cylinders on their own use rented or shared vehicles The procurement constraints faced by these households would be further aggravated during the COVID-19 pandemic as using rented or shared vehicles comes with its own risks
10
About 18 per cent of the respondents in our survey reported that they resided in non-notified slums Such slums are not legally recognised as a lsquoslumrsquo by the government which makes the residents more vulnerable to eviction In our data we find that adoption and use of LPG is similar across households from notified and non-notified slums Qualitative interviews and field visits showed that most of the respondents were permanent residents of the slums who have been living there for more than 10 years
About 2 per cent of urban slum households use electricity as a source for cooking energy These households do not rely on any other fuels for cooking or non-cooking purposes They use electric stoves to prepare all meals including cooking roti rice and vegetables These households have been using electricity as their cooking fuel only in the past five years Most households report using either a coiled stove or induction stove Less than one per cent of households use other electric appliances such as hot water kettles and toasters for cooking needs
BOX 3
BOX 4
Status of slums impacting the fuel-use pattern
Electricity for cooking
77
households receiving doorstep delivery of LPG cylinders are exclusive users of the fuel
63LPG-using households receive doorstep delivery of cylinders
Male members have to travel to procure the cylinders in 87 households
11Cooking fuel adoption and use in urban slum households
About 4 per cent of urban slum households in the sample reported stacking with kerosene as their secondary fuel Most of these households are in Uttar Pradesh These households also use kerosene more than once a week for cooking
BOX 5 Use of kerosene as a cooking fuel
22 Households stacking LPG with polluting fuels Across the six states almost half of the households (45 per cent) reported using polluting fuels Here we discuss the characteristics and fuel use patterns of households that stack clean and unclean fuels
Though 86 per cent of the households surveyed have an LPG connection we find that over a third (33 per cent) of them stack it with polluting fuels (including firewood dung cakes agriculture residue charcoal and kerosene) The increased stacking could also be a result of more households adopting LPG since households tend to not replace biomass-based fuels completely (Cheng and Urpelainen 2014) These households would need to transition to exclusive use of clean cooking fuels to reduce the health impacts on women and children from household air pollution
About 44 per cent of the households that are stacking fuels rely on informal sources for refills Such households have not ordered any refills in the past one year from their LPG distributors These households mainly rely on recurring cylinders from their neighbours or relatives9
Figure 4 Of the households that stack fuels most use LPG as their primary fuel
Source Authorsrsquo analysis
9 It is important to note that sharing LPG cylinders among neighbours and extended family is a regular phenomenon in small towns and rural areas owing to availability challenges and it is not necessarily driven by an intention to siphon off subsidy amounts against the commodity ( Jain et al 2018)
Exclusive clean fuel users
Stacking with LPG as the primary fuel
Only polluting fuel users
Stacking LPG with polluting fuels
Stacking with LPG as the secondary fuel
55
3388
12
12
Are Indiarsquos Urban Poor Using Clean Cooking Fuels Insights from Slums in Six States12
221 Household factors that determine the decision to stack fuels Even within the stacking households the reason for stacking multiple fuels varies significantly Primarily households who stack can be divided into two categories ndash those that stack as they cannot afford LPG refills and those that stack due to other factors like taste preferences and alternate end-uses of the fuel
Households who are stacking primarily due to affordability concerns ndash Across asset quintiles we find that stacking is most common among the middle categories (second and third quintile) where most have adopted LPG Still the affordability of the fuel remains a significant concern More than 60 per cent of the households that are stacking fuels collect or prepare firewood or dung cakes free of cost rather than purchasing them from the market Those who buy biomass do not spend more than INR 100 per month on it Based on the responses of the primary cook we note that the high cost of LPG and free-of-cost availability of solid fuels are the most common factors that affect the fuel choices made by the household
Figure 5 Stacking is prevalent in households across asset quintile categories
Source Authorsrsquo analysis
1 2 3 4 5
Asset quintile categories
0
20
40
60
80
100
Per
cent
age
of h
ouse
hold
s
Exclusive clean fuel users Stacking LPG with polluting fuels Only polluting fuel users
5348
52
6367
2441 37
3232
2311 11
51
Households who use LPG primarily and polluting fuels as secondary fuels have a median annual refill rate of
6 cylinders
Households who use polluting fuels primarily and LPG as a secondary fuel have a median annual refill rate of
4 cylinders
13
Households that are stacking for reasons beyond affordability ndash More than one-fourth of the households that are stacking have a median annual refill rate of eight cylinders and above despite having a similar household size as others Most such households fall in the highest asset quintiles This suggests that they are not necessarily using unclean fuels due to the unaffordability of LPG but due to other factors such as taste preference for chulhas and fuel end-uses that influence the householdrsquos decision to use solidpolluting fuels Such households reported using LPG for a median period of six years The solid fuels are primarily used for cooking chapatis or vegetables in these households
Interestingly even households with multiple LPG connections and two cylinder connections report stacking with polluting fuels The possession of multiple LPG connections in these households may not necessarily be an indicator of diversion mdash the average family size of these households is more than eight indicating the high possibility of having separate kitchens within the same household Given that such households have a median annual refill rate of ten cylinders another plausible reason for multiple connections is that it prevents them from relying on just one distributor which increases their chances of getting refills whenever needed
222 End-uses of polluting fuels Across both the groups discussed above half of the households who stack with polluting fuels use these fuels at least once a day (Figure 6) Also almost 45 per cent of the households that stack fuels use multiple stoves at the same time while preparing a single meal This indicates that even if the household is using LPG for a particular meal they would be using their chulha simultaneously
Despite using LPG as the primary fuel for their cooking needs households that are stacking fuels use polluting fuels for non-cooking purposes like heating water for bathing (29 per cent) and space heating (10 per cent)
Figure 6 Almost half of the households using polluting fuels use it every day
Source Authorsrsquo analysis
0 5 10 15 20
19
11
21
20
29
25 30 35
Percentage of households
Freq
uenc
y of
use
of p
ollu
ting
fuel
s Several times a day
Once per day
Few times a week
Once a week
Occasionally
21 households stacking fuels
have more than one LPG connections
25 households stacking fuels have two-cylinder connections
Cooking fuel adoption and use in urban slum households
Are Indiarsquos Urban Poor Using Clean Cooking Fuels Insights from Slums in Six States14
223 Seasonal variations in the stacking of fuels We also noted a significant seasonal change in fuel use patterns LPG is most popular in the rainy season (88 per cent) and least popular in the winter months (45 per cent) (Figure 7) The dampness associated with solid fuels in the rainy season could be the reason for using LPG primarily during these months The literature also suggests that solid fuels are a popular choice during winter months (S Singh 2014 Baqir et al 2019) This could be because during winter months the solid fuel requirement for non-cooking tasks within the household likes water heating for bathing and space heating increases Since households are already using solid fuels for non-cooking tasks they may be using these fuels more for cooking during winter Unfortunately the increased use of solid fuels in winter exacerbates the much higher air pollution exposure of these households due to unfavourable atmospheric conditions
Figure 7 Proportion of urban slum households using solid fuels as the primary cooking fuel increases during the winters months aggravating household air pollution exposure due to unfavourable atmospheric conditions
Source Authorsrsquo analysis
About 3 per cent of urban slum households reported owning an electric water-heating device (geyser or immersion
rod) Similarly only 4 per cent of the households own an electric room heater
BOX 6 Electric devices for water heating and space heating
Summer Winter Rainy Festival0
20
40
60
80
100
120
Per
cent
age
of h
ouse
hold
s
LPG Solid fuel
78
45
88
67
22
55
1233
15
Figure 8 Lack of awareness about receiving LPG refill subsidies poses a threat to the success of LPG subsidy schemes
Source Authorsrsquo analysis
Connections under the Pradhan Mantri Ujjwala Yojana (PMUY) 23 per cent of these households reported receiving benefits under the PMUY
The six states included in the survey account for a significant share of PMUY coverage ndash 54 per cent of all connections provided under PMUY (PPAC 2019) However most of these connections cater to rural households One of the reasons for there being fewer PMUY connections in urban areas is that more than half of all urban slum households reported already having had LPG connections for over four years (before the launch of PMUY) Moreover over a quarter of PMUY households10 in urban slums reported having multiple LPG connections which suggests that not every household which was using LPG before the PMUY was prevented from accessing the schemersquos benefits
Government support during the COVID-19 pandemic During the COVID-19 lockdown the government announced the provision of three free-of-cost refills for PMUY households under the PM-Garib Kalyan Yojana While PMUY households in urban slums benefitted from this scheme non-PMUY households in urban slums did not As documented urban slum households faced a significant economic hit due to the loss of jobs and incomes during the pandemic (Patel 2020) Non-PMUY households that stack for economic reasons are more likely to use cheaper and freely available solid fuels without additional support from the government
PAHAL-Direct Benefit Transfer for LPG (DBTL)Overall about 42 per cent of active LPG users11 reported receiving a subsidy for their last LPG refill under the Direct Benefit Transfer for LPG scheme (DBTL) However about 28 per cent of urban slum households reported not knowing if they had received the subsidy amount for their last refill this suggests that the primary cook is often unaware of whether the subsidy is credited to the household Among the ones that reported receiving the LPG subsidy about 40 per cent of the primary cook were not aware of the amount of subsidy being credited into their account
10 This is a relatively smaller sample of 43 households from all the PMUY households in urban slums (131 households)
11 Households that have taken at least one refill in the past year
42
30
28
Received LPG refill subsidy
30 Still repaying PMUY loan
Did not receive LPG refill subsidy
10 Gave up LPG refill subsidy
Do not know
60 LPG refill susbsidy not received due to other reasons
Cooking fuel adoption and use in urban slum households
Are Indiarsquos Urban Poor Using Clean Cooking Fuels Insights from Slums in Six States16
23 Households using only polluting fuels About 12 per cent of urban slum households rely entirely on polluting fuels for all cooking and non-cooking purposes While the share of these households is relatively small the non-adoption of LPG in such households despite
programmes like the PMUY is concerning These households either use a combination of different polluting fuels (firewood dung cakes agricultural residue charcoal and kerosene) or just one of these fuels for all their energy needs Firewood is the most commonly used fuel in these households
231 Reasons for the non-adoption of LPGHouseholds that rely exclusively on polluting fuels reported not having an LPG connection Though three-fourths of these households were aware of PMUY the high upfront cost of an LPG connection along with the high recurring cost of procuring refills remain the two most important reasons for not procuring an LPG connection Repondents also mentioned a lack of information on how to procure a connection as a reason These reasons align with the common causes cited by rural households covered in the survey implying that the challenges faced by rural households and urban slum households in procuring connections are similar
Almost half of the households in this category use solid fuels for non-cooking purposes such as heating water for bathing space heating and preparing fodder for animals On the positive aspects of using polluting fuels households reported the following free-of-cost easy availability of fuels better tasting food and preference of family members for food cooked on the chulha
232 Fuel availability and affordabilityIn contrast with households that stack fuels households that use only solid fuels rely on purchasing fuels rather than collecting or preparing them For instance 60 per cent of firewood users in this category procure fuel by purchasing rather than collecting it
Households with low asset ownership rely on polluting fuels for cooking These households spend 2ndash3 per cent of their median monthly expenditure on fuel (INR 75 per month on fuel) which is much lower than what they would have to spend if they used LPG exclusively (INR 496 per month) Households that collect solid fuels spend about two hours on a single trip (three times a month) travelling a median one-way distance of 2 km This is equivalent to the distance travelled to procure LPG cylinders (if not delivered at home)
Figure 9 More than half of the households currently without LPG do not know how to get a connection or whom to ask about it implying a lack of awareness
Source Authorsrsquo analysis
0 10 20 30 40 50 60 70
39
53
63
68
80
Percentage of households
Rea
sons
for N
on-A
dop
tion
of L
PG Installation is expensive
Monthly expenditure on LPG is high
Do not know how to get or whom to ask
Not availabletoo far
17
12 See Annexure III for details on the districts and their PM25 concentrations The data for 15 districts (from Bihar Uttar Pradesh Madhya Pradesh and Rajasthan) overlapping with the survey sample have been analysed based on the availability of air quality data from continuous monitoring stations
13 Air quality categories based on PM25 concentration (in μgm3)
Good 0 to 30 Satisfactory 31 to 60 Moderately polluted 61 to 90 Poor 91 to 120 Very poor 121 to 250 Severe above 250 (Central Pollution Control Board 2014)
Cooking fuel adoption and use in urban slum households
Winter months have the highest PM25 concentrations coinciding with the sharp increase in use of polluting fuels for heating bath water and room heating
233 Gendered time use in households using solid fuelsIn urban slums both the male and female members of the household are equally involved in collecting firewood Still it is primarily the female members of the household who undertake dung cake preparation In addition to engaging in fuel collection and preparation women tend to spend more time cooking in households using solid fuels About 85 per cent of households that transitioned to LPG in the past four years reported having saved time while cooking compared to when they used solid fuels
SPOTLIGHT I Household air pollution (HAP) in urban slums
Burning solid fuels in three-stone fires and mud stoves with inadequate ventilation causes high levels of smoke exposure and negative health impacts particularly for women and young children (WHO 2014)
The double burden of ambient and household air pollution on the urban slum populationUsing the PM25 data from continuous ambient air quality monitoring stations (CAAQMS) for 15 districts12 in our sample we found that the ambient air quality remained in the lsquopoorrsquo or worse category13 for most districts throughout the year variation in the ambient air quality
Are Indiarsquos Urban Poor Using Clean Cooking Fuels Insights from Slums in Six States
Impact of ventilation
Indoor cooking and low adoption of chimney indicates high exposure to pollution from the use of unclean fuels for cooking The proportion of households with a chimney is high (52 per cent) among those who rely only on polluting fuels Smith and Pillarisetti (2017) explain that while having a good chimney lowers peak levels of indoor pollution long-term average exposure is reduced only by a factor of two Besides chimneys require regular maintenance to function correctly While more than 45 per cent of the households are using polluting fuels less than 20 per cent of the slum housheolds use improved cookstoves
Households also use solid fuels for non-cooking uses like space heating On average each house in a slum has two rooms this effectively exposes all members of the household to emissions from burning fuels Emissions from household sources contribute significantly to the surrounding air quality (Harish et al 2019) this concern is exacerbated in congested slum areas
the winter months (November to February) have the highest concentration of PM25 This leads to a double burden of exposure for slum households stacking solid fuels as they are more likely to increase use of solid fuels in winters (Figure 7) Alternatively the use of LPG as the primary source of fuel increases during the rainy season (June to September) these months record the least ambient air pollution
We also find that districts like Meerut Ghaziabad Patna Gautam Buddha Nagar (Noida and Greater Noida) and Muzaffarpur have the highest frequency of lsquovery poorrsquo air quality days throughout the year Across these districts one-third of households use polluting fuels for cooking In urban slums where households are more densely packed the emissions from burning solid fuels increase the risk of exposure inside households and deteriorate the ambient air quality for the community at large As a result these communities suffer from both increased household and ambient air pollution HAP has an estimated average contribution of 30ndash50 per cent to ambient air quality across Indiarsquos urban and rural areas (Balakrishnan et al 2019) Addressing biomass burning for cooking water heating and space heating during the winters has the potential to help reach the national ambient air quality standards (Chowdhury et al 2019) Despite that only 2 per cent of the action points in 44 city clean air plans mention cooking and heating as a sector to address air pollution (Ganguly Selvaraj and Guttikunda 2020)
18
75 householdsrsquo
using polluting fuels cook inside
the main house
67 householdsrsquo using polluting fuels do not have a chimney for ventilation
Awareness about the health impacts of using polluting fuelsAbout 60 per cent of households using only polluting fuels and 84 per cent of households that stack LPG with a polluting fuel report lsquotoo smokyrsquo as the most prominent negative aspect of using polluting fuels This suggests that as more households switch to clean cooking fuels perceptions regarding pollution fuels change
Three-fourths of primary cooks who use polluting fuels for cooking agree that smoke from solid fuels is harmful to them this implies that awareness of the adverse health impacts of polluting fuels does not necessarily lead to the uptake of clean fuels Primary cooks also agree that smoke from solid fuels causes coughing (49 per cent) and lung infections in children (39 per cent)
Exposure to air pollution is a known risk factor for underlying chronic diseases that predict the severity of
COVID-19 disease and patient outcomes (World Bank 2020) This linkage suggests a heightened risk for women
in all age groups who cook using traditional technologies and fuels (World Bank 2020) The highest number of
COVID-19 cases were recorded in the most polluted regions among patients with pre-existing health conditions
(Frontera et al 2020)
Results from a controlled study show a higher prevalence of chronic obstructive pulmonary disease (COPD)
among biomass fuel users than clean fuel users ( Johnson et al 2011) The available clinical data to date suggest
that cardiovascular disease diabetes chronic respiratory illness and hypertension ndash conditions all strongly
associated with exposure to HAP ndash are also risk factors for COVID-19 (World Bank 2020)
BOX 7 Impact of household air pollution on COVID-19
19Cooking fuel adoption and use in urban slum households
Are Indiarsquos Urban Poor Using Clean Cooking Fuels Insights from Slums in Six States
Traditionally women bear a disproportionate burden in collecting and preparing biomass for cooking While this burden reduces with the use of clean cooking fuels like LPG the fuel supply within the household is then determined by formal and monetised distribution networks involving an outlay of money (Patnaik and Jha 2020) Our data shows that womenrsquos status in the household (as heads of households)14 positively correlates with households using LPG as their primary fuel The existing literature also supports the idea that female-headed households prefer modern fuels to polluting ones (Farsi Filippini and Pachauri 2007 Rao and Reddy 2007 Kuo and Azam 2019) Other research also suggests that female-headed households are more willing to spend on LPG as a recurring expense (Kojima Bacon and Zhou 2011 Kuo and Azam 2019)
SPOTLIGHT II Womenrsquos participation in intra-household decision-making regarding LPG use
20
14 In almost half of the households surveyed the primary cook reported a female member being the head of the household The reason behind such high percentage of female-headed households could be because only the primary cook of every household (who is mostly female) was surveyed This does not mean that these households do not have any adult male members Traditionally headship refers to the head of household as the individual whose lsquoauthorityrsquo the household members recognise But this definition overlooks potential intra-household variations in the recognised authority in different realms of decision-making (Kilic Moylan and Koolwal 2020) Since cooking is a gendered activity the primary cookrsquos response to the head of household question may have been with respect to the recognised authority figure for that activity within the household
30 householdsrsquo female members place the order for LPG refills
50householdsrsquo female
members decide whether or when to purchase LPG refills
We also find that the decision of whether or when to purchase LPG refills is made by male members in half of urban slum households This holds for both male- and female-headed households In LPG-using households where the primary cook is involved in an income-generating activity more women are deciding to order the refills This pattern is similar irrespective of whether the household uses LPG exclusively or stacks it with other polluting fuels or are PMUY beneficiaries
SPOTLIGHT III A comparison of access to clean cooking energy between urban slum and non-slum households across six states
21
At the state level Bihar has significantly poor involvement of women in intra-household decision-making regarding
ordering refills with less than 10 per cent of households reporting that women decide whether or when to order
refills However more women than men are involved in decisions around LPG refills in Rajasthan Madhya Pradesh
and Jharkhand
Across caste groups the involvement of women is lowest (37 per cent) among the Scheduled Castes (SCs)
However more women in General and OBC households decide when to order LPG refills
BOX 8 Variations in intra-household decision-making across states and caste groups
Cooking fuel adoption and use in urban slum households
To compare the fuel use patterns of urban slum and non-slum households we used data from the India Residential Energy Survey (IRES 2020)15 The overlap in the sampling strategies of both IRES and our survey enabled a comparison of the findings There is a significant difference in the socio-economic status of slum and non-slum households which tends to affect their fuel use patterns Table 4 provides a comparison of cooking fuel usage in urban non-slum households (from IRES 2020) and urban slum households (Cooking Energy Access and Use survey 2020)
Are Indiarsquos Urban Poor Using Clean Cooking Fuels Insights from Slums in Six States22
Table 4 The poor economic condition of households in urban slums impacts the exclusive use of clean fuels for cooking
Source Authorsrsquo analysis
Fuel use categories Urban slum households (Cooking Energy Access Survey) ()
Non-slum urban households (IRES) ()
95 88
84 55
9 33
5 12
Clean fuel users (LPG PNG and electricity)
LPG as an exclusive fuel
Households that stack LPG with polluting fuels
Households that use only polluting fuels
We observed a significant gap in the exclusive use of LPG as a cooking fuel between urban slums and non-slum households explained mainly by the difference in their economic conditions Stacking is three times more common in slum households than non-slum households About 45 per cent of non-slum households using polluting fuels belong to marginalised social groups (SCs and STs) Households using polluting fuels have a lower median monthly expenditure than others and about 62 per cent of such households are semi-pucca or kuchha structures Among LPG users non-slum households have a slightly higher rate of doorstep delivery as compared to slum households
LPG-using households receiving home deliveries
Source Authorsrsquo analysis
239
6372
Urban slum households (Cooking Energy Access and Use)
()
Non-slum urban households (IRES)
()
Proportion of PMUY beneficiaries among LPG-using households
15 IRES 2020 was conducted in 21 large states of India including Bihar Jharkhand Rajasthan Madhya Pradesh Uttar Pradesh and Chhattisgarh While IRES 2020 focused on urban households the Cooking Energy Access and Use survey specifically attended to urban slums in the same districts Refer to the technical note for a detailed methodology of the survey
23
3 Way forward
Slums across the world are chronically ignored in public policy and suffer because of unauthorised and unsafe habitation without access to government services (Shahadat
Lipu and Bhuiyan 2014) In terms of energy access while we see a progressive change in householdsrsquo energy use patterns as we move from rural to urban issues like affordability availability preference and familiarity with the fuel and stove remain essential factors that determine householdsrsquo fuel choice
Image iStock
Are Indiarsquos Urban Poor Using Clean Cooking Fuels Insights from Slums in Six States24
Understanding categories of users is important for enabling access to and use of clean cooking fuels
We categorised the urban slum population based on their fuel usage patterns ndash using only clean fuels stacking clean fuels with polluting fuels and using only polluting fuels While most households in urban slums have an LPG connection only half of them use LPG exclusively The householdrsquos economic status and its access to doorstep delivery of LPG refills are two crucial factors that determine its ability to use LPG exclusively Despite being situated in urban areas 37 per cent of slum households do not receive home delivery of cylinders ndash availability is an essential factor in determining the householdrsquos likelihood of using LPG exclusively There is a strong impetus for the OMCs and distributors to improve their home delivery services of LPG refills in slum areas
Stacking is prevalent in about one-third of households ndash there is a need for a deeper understanding of householdsrsquo preferences fuel end-uses and awareness Most households reported using polluting fuels daily or at least weekly this effectively increases their exposure to household air pollution despite having access to clean cooking fuels Among households that stack LPG with polluting fuels the reasons for stacking differ ndash affordability seasonality and taste preference More than a quarter of households that stack have a similar level of LPG consumption as those that use LPG exclusively despite similar family sizes Such households use polluting fuels not because of their inability to afford LPG But other factors like free-of-cost availability of biomass taste preference for chulha and alternate end-uses of fuelmdashfor instance in space heatingmdashinfluence the householdrsquos decision to use solid fuels Among households that stack multiple fuels the use of polluting fuels increases during winter months this exposes the households to a double burden of high ambient and household air pollution in these months About 40 per cent of these households also use polluting fuels for non-cooking purposes like heating water for bathing and space heating especially in winter
Even with large-scale government initiatives like PMUY we find that more than 10 per cent of urban slum households do not use LPG They mainly rely on free-of-cost biomass for their cooking and non-cooking needs Despite awareness of PMUY among these households the high upfront cost of procuring an LPG connection and high recurring expenditure on refills deter them from using LPG Evidently there is a need to expand the reach of PMUY to cover households across slums
Integrating the issue of lack of access to clean cooking energy within the discussion on urban poverty
This study reiterates the need to look at poverty in urban areas in the context of energy access Given the heterogeneity of poverty in urban and semi-urban India it is essential to understand energy poverty in the context of access to resources for an enhanced quality of life for the urban poor Similarly slums dwellers in large and small cities alike may experience additional challenges of access Furthermore not all urban poor live in slums we know even less about the access issues of temporary residents or seasonal migrants in urban India Therefore in a rapidly urbanising India studies on the urban poor and air quality need to integrate a focus on energy access to address the vulnerability of women children and communities to HAP and the drudgery of using polluting fuels for cooking and other household energy needs
Access to clean cooking energy schemes must be integrated into the social assistance programmes focused on urban poverty alleviation to enhance its reach
25Way forward
Converging energy access in social protection policies for the urban poor
Accounting for the vulnerabilities of the urban poor is crucial in designing and implementing policies including social protection schemes As a health and economic imperative access to clean cooking energy schemes must be integrated into the social assistance programmes of other ministries (eg health education and nutrition assistance) to offer better support to slum households This would also reduce the burden on households of claiming and accessing multiple benefits across schemes thus freeing them to invest more time in productive activities (CEEW 2020) Government programmes such as the National Urban Livelihoods Mission and social service allocations for housing should use existing targeting approaches to include access to clean cooking energy within the ambit of services for the poor
Bringing a renewed emphasis on clean cooking energy access due to COVID-19 is essential
Most households in urban slums rely on daily wage labour or the gig economy for their household income During the COVID-19 pandemic these occupations have been among the worst impacted by the lockdown and the economic slowdown A survey conducted with over 2000 daily wage workers in urban slums during the lockdown suggests that only 7 per cent of respondents from this group received pay during the lockdown (Basu 2020) causing a massive shock to their livelihoods and wage earnings This kind of impact pushes households into energy poverty leading to the increased use of free-of-cost biomass and consequently increasing the risk of exposure to emissions from fuel burning While the government has committed to supplying up to three free refills to all PMUY households under PM-Garib Kalyan Yojana less than a quarter of households in urban slums have Ujjwala connections The low share of PMUY households effectively makes the majority of slum households ineligible for relief support given under the PM-Garib Kalyan Yojana during the lockdown There is a need to target vulnerable households ndash beyond PMUY beneficiaries ndash with differential subsidy support for using LPG in a sustained manner
Increased poverty would mean increased use of polluting fuels ndash there is a need for a renewed emphasis on clean cooking energy access during the COVID-19 pandemic as increased use of polluting fuels has health implications (lower respiratory infections and COPD) that increase the risk of COVID-19 infections being more severe
There is a need to target vulnerable households ndash beyond PMUY beneficiaries ndash with differential subsidy support for using LPG in a sustained manner
Are Indiarsquos Urban Poor Using Clean Cooking Fuels Insights from Slums in Six States
Balakrishnan Kalpana Sagnik Dey Tarun Gupta R S Dhaliwal Michael Brauer Aaron J Cohen Jeffrey D Stanaway et al 2019 ldquoThe Impact of Air Pollution on Deaths Disease Burden and Life Expectancy Across the States of India The Global Burden of Disease Study 2017rdquo The Lancet Planetary Health 3 (1) e26ndash39 httpsdoiorg101016S2542-5196(18)30261-4
Baqir M S K Bharti R Kothari and R P Singh 2019 ldquoAssessment of an Energy-efficient Metal Chulha for Solid Biomass Fuel and Evaluation of its Performancerdquo International Journal of Environmental Science and Technology 16 (11) 6773ndash6784 httpsdoiorg101007s13762-018-2028-9
Basu Anika Badyal 2020 ldquoLockdown Survey How The Covid-19 Crisis Has Affected Daily Wage WorkersmdashAIFrdquo American India Foundation June 28 httpsaiforglockdown-survey-how-the-covid-19-crisis-has-affected-daily-wage-workers
Butera F M P Caputo R Adhikari and A Facchini 2016 ldquoThe Challenge of Energy in Informal Settlements A Review of the Literature for Latin America and Africardquo Procedia Engineering 1ndash32 httpswwwenelfoundationorgcontentdamenel-foundtopic-downloadThe challenge of Energy in Informal settlementspdf
CEEW 2020 ldquoEnergy Safety Nets India Case Studyrdquo Vienna Sustainable Energy for All httpswwwceewinpublicationsenergy-safety-nets-india-case-study
Central Pollution Control Board 2014 ldquoNational Air Quality Indexrdquo New Delhi Central Pollution Control Board httpsappcpcbccrcomccr_docsFINAL-REPORT_AQI_pdf
Chafe Z S Mehta and K R Smith 2011 ldquoAmbient Fine Particulate (PM25) Air Pollution Attributable to Household Cooking Fuel in Asiardquo AGUFM A54Bndash03 httpsuiadsabsharvardeduabs2011AGUFMA54B03Cabstract
Chandramouli C 2010 ldquoCensus of India 2011 ndash Circular No 8rdquo New Delhi Ministry of Home Affairs httpscensusindiagovin2011-CircularsCircularsCircular-08pdf
Chandrasekhar S and Arup Mitra 2018 ldquoMigration Caste and Livelihood Evidence from Indian City-slumsrdquo Urban Research amp Practice 12 (2) 156ndash172 httpsdoiorg1010801753506920181426781
Cheng Chao Yo and Johannes Urpelainen 2014 ldquoFuel Stacking in India Changes in the Cooking and Lighting Mix 1987ndash2010rdquo Energy 76 (November) 306ndash317 httpsdoiorg101016jenergy201408023
Chowdhary Sourangsu Sagnik Dey Sarath Guttikunda Ajay Pillarisetti Kirk R Smith and Larry Di Girolamo 2019 ldquoIndian annual ambient air quality standard is achievable by completely mitigating emissions from household sourcesrdquo Proceedings of the National Academy of Sciences 116 (22) 10711-10716 httpsdoiorg101073pnas1900888116
Dhingra Chhavi Shikha Gandhi Akanksha Chaurey and P K Agarwal 2008 ldquoAccess to Clean Energy Services for the Urban and Peri-Urban Poor A Case-study of Delhi Indiardquo Energy for Sustainable Development 12 (4) 49ndash55 httpsdoiorg101016S0973-0826(09)60007-7
Farsi Mehdi Massimo Filippini and Shonali Pachauri 2007 ldquoFuel Choices in Urban Indian Householdsrdquo Environment and Development Economics 12 (6) 757ndash774 httpsdoiorg101017S1355770X07003932
References
26
Frontera Antonio Lorenzo Cianfanelli Konstantinos Vlachos Giovanni Landoni and George Cremona 2020 ldquoSevere Air Pollution Links to Higher Mortality in COVID-19 Patients The lsquoDouble-Hitrsquo Hypothesisrdquo Journal of Infection 81 (2) 255ndash259 httpsdoiorg101016jjinf202005031
Ganguly Tanushree Kurinj L Selvaraj Sarath K Guttikunda 2020 ldquoNational Clean Air Programme (NCAP) for Indian cities Review and outlook of clean air action plansrdquo Atmospheric Environment X Vol 8 httpsdoiorg101016jaeaoa2020100096
GNESD 2008 ldquoClean Energy for the Urban Poor An Urgent Issuerdquo Accessed 25 July 2020 httpswwwgooglecomurlsa=tamprct=jampq=ampesrc=sampsource=webampcd=ampved=2ahUKEwi1hf2ru dntAhUCOisKHQH7BtsQFjAAegQIAxACampurl=http3A2F2Fwwwgnesdorg2F-2Fmedia2FSites2FGNESD2FPublication- pdfs2FSPM_CleanEnergyashx3Fla3Dda26hash3DE4971C585B6798F17954F8B42E073 D9507F42A84ampusg=AOvVaw08kCDgOkTkYc6wRDxzsNyq
Guan Wei-Jie Wen-Hua Liang Yi Zhao Heng-Rui Liang Zi-Sheng Chen Yi-Min Li Xiao-Qing Liu et al 2020 ldquoComorbidity and its Impact on 1590 Patients with COVID-19 in China A Nationwide Analysisrdquo European Respiratory Journal 55 (5) 2000547 httpsdoiorg1011831399300300547-2020
Harish Santosh Kirk R Smith Sourangsu Chowdhury Zoe A Chafe Ajay Pillarisetti Jos Lelieveld Sarath Guttikunda Sagnik Dey and Andrew P Grieshop 2019 ldquoThe Contribution of Household Fuels to Ambient Air Pollution in India A Comparison of Recent Estimates Edited by CcapcOrgInrdquo Collaborative Clean Air Policy Centre May 30 httpsccapcorginpolicy-briefs2019530the-contribution-of-household-fuels-to-ambient-air-pollution-in-india-a-comparison-of-recent-estimates
Jain Abhishek Saurabh Tripathi Sunil Mani Sasmita Patnaik Tauseef Shahidi and Karthik Ganesan 2018 ldquoAccess to Clean Cooking Energy and Electricity Survey of States 2018rdquo New Delhi CEEW httpswwwceewinsitesdefaultfilesCEEW-Access-to-Clean-Cooking-Energy-and-Electricity-11Jan19_0pdf
Johnson Priscilla Kalpana Balakrishnan Padmavathi Ramaswamy Santu Ghosh Muthukumar Sadhasivam Omprakash Abirami Bernard W C Sathiasekaran Kirk R Smith Vijayalakshmi Thanasekaraan and Arcot S Subhashini 2011 ldquoPrevalence of Chronic Obstructive Pulmonary Disease in Rural Women of Tamilnadu Implications for Refining Disease Burden Assessments Attributable to Household Biomass Combustionrdquo Global Health Action 4 (1) 7226 httpsdoiorg103402ghav4i07226
Kilic Talip Heather Moylan and Gayatri Koolwal 2020 ldquoGetting the (Gender-disaggregated) Lay of the Land Impact of Survey Respondent Selection on Measuring Land Ownership and Rightsrdquo Washington DC The World Bank httpsdoiorg1015961813-9450-9151
Kojima Masami Robert Bacon and Xin Zhou 2011 ldquoWho Uses Bottled Gas Evidence from Households in Developing Countriesrdquo The World Bank Sustainable Energy Department Oil Gas and Mining Unit httpelibraryworldbankorgdoibook1015961813-9450-5731
Kuo Ying-Min and Mehtabul Azam 2019 ldquoHousehold Cooking Fuel Choice in India 2004ndash2012 A Panel Multinomial Analysisrdquo IZA Discussion Paper No 12682 httpsssrncomabstract=3468630
Lippi Giuseppe and Brandon Michael Henry 2020 ldquoChronic Obstructive Pulmonary Disease Is Associated with Severe Coronavirus Disease 2019 (COVID-19) COPD and COVID-19rdquo Respiratory Medicine 167 105941 httpsdoiorg101016jrmed2020105941
Ministry of Housing and Urban Affairs 2019 ldquoHandbook of Urban Statisticsrdquo New Delhi Government of India httpmohuagovinpdf5c80e2225a124Handbook of Urban Statistics 2019pdf
Rao M Narasimha and B Sudhakara Reddy 2007 ldquoVariations in Energy Use by Indian Households An Analysis of Micro Level Datardquo Energy 32 (2) 143ndash153 httpsdoiorg101016jenergy200603012
27References
Are Indiarsquos Urban Poor Using Clean Cooking Fuels Insights from Slums in Six States28
National Buildings Organisation 2013 ldquoState of Slums in India a Statistical Compendium 2013rdquo New Delhi Government of India httpnbonicinpdfSlums_in_India_Compendium_English_Versionpdf
National Sample Survey Office 2012 ldquoKey Indicators of Urban Slums in India ndash 69th Roundrdquo New Delhi National Data Bank for Socio-religious Categories httpmospinicinsitesdefaultfilesnational_data_bankndb-rpts-69htm
Nolan Laura B 2015 ldquoSlum Definitions in Urban India Implications for the Measurement of Health Inequalitiesrdquo Population and Development Review 41 (1) 59ndash84 httpsideasrepecorgablapopdevv41y2015i1p59-84html
Nolan Laura B David E Bloom and Ramnath Subbaraman 2018 ldquoLegal Status and Deprivation in Urban Slums Over Two Decadesrdquo HHS Public Access 53 (15) 47ndash55
Patel Amit 2020 ldquoPreventing COVID-19 Amid Public Health and Urban Planning Failures in Slums of Indian Citiesrdquo World Medical amp Health Policy 12 (3) httpsdoiorg101002wmh3351
Patnaik Sasmita and Shaily Jha 2020 ldquoCaste Class and Gender in Determining Access to Energy A Critical Review of LPG Adoption in Indiardquo Energy Research amp Social Science 67 (September) 101530 httpsdoiorg101016jerss2020101530
PPAC-CRISIL 2016 ldquoAssessment Report Primary Survey on Household Cooking Fuel Usage and Willingness to Convert to LPGrdquo New Delhi Petroleum Planning amp Analysis Cell Ministry of Petroleum and Natural Gas Government of India httpswwwppacgovinWriteReadDataReports201710310449342512219PrimarySurveyReportPPACpdf
PPAC 2019 ldquoOil Industry Information at a Glancerdquo New Delhi Ministry of Petroleum and Natural Gas Government of India httpswwwppacgovinWriteReadDataReports201912060336500305462ReadyReckonerNov2019WebVersionpdf
Rahaman Mehebub and Dipendra Nath Das 2017 ldquoNature of Slum Growth in Indian Citiesrdquo Urban India 37 (II) 100ndash116 httpswwwresearchgatenetpublication334051882_Nature_of_Slum_Growth_in_Indian_Citiesread
Rains Emily Anirudh Krishna and Erik Wibbels 2018 ldquoUrbanisation and Indiarsquos Slum Continuum Evidence on the Range of Policy Needs and Scope of Mobilityrdquo London International Growth Centre httpswwwtheigcorgwp-contentuploads201802Rains-et-al_Working-paper_coverpdf
Ranjan Rahul and Sudershan Singh 2017 ldquoEnergy Deprivation of Indian Households Evidence from NSSO Datardquo New Delhi Munich Personal RePEc Archive httpsmpraubuni-muenchende835661MPRA_paper_83566pdf
Roy Debraj Bharath Palavalli Niveditha Menon Robin King Karin Pfeffer Michael Lees and Peter M A Sloot 2018 ldquoSurvey-based Socio-economic Data from Slums in Bangalore Indiardquo Nature Publishing Group 5 1ndash9 httpsdoiorg101038sdata2017200
Saksena Sumeet P B Singh Raj Kumar Prasad Rakesh Prasad Preeti Malhotra Veena Joshi and R S Patil 2003 ldquoExposure of Infants to Outdoor and Indoor Air Pollution in Low-income Urban Areas A Case Study of Delhirdquo Journal of Exposure Science amp Environmental Epidemiology 13 219ndash30 httpsdoiorg101038sjjea7500273
Lipu Molla Shahadat Hossain and Arif Waliullah Bhuiyan 2014 ldquoElectricity Access in Urban Slum Households of Bangladesh A Case of Dhakardquo Journal of Renewable and Sustainable Energy 6 (053112) 1ndash15 httpsdoiorg10106314896697
29
Singh Rozita Xiao Wang Emmanuel Ackom and Juan Reyes 2015 ldquoEnergy Access Realities in Urban Poor Communities of Developing Countries Assessments and Recommendationsrdquo Global Network on Energy for Sustainable Development (GNESD) httpswwwgooglecomurlsa=tamprct=jampq=ampesrc=sampsource=webampcd=ampved=2ahUKEwj5nbqI wdntAhXUTX0KHZE6DboQFjAAegQIAhACampurl=https3A2F2Forbitdtudk2Ffiles2F10635 24942FEnergy_access_realities_v_final_updatedpdfampusg=AOvVaw0xNBAAo0bjLueY9FmoigKF
Singh Santosh 2014 ldquoThe Kaleidoscope of Cooking Understanding Cooking Behaviour and Stove Preferences in Rural Indiardquo New Delhi Deutsche Gesellschaft fuumlr Internationale Zusammenarbeit (GIZ) GmbH httpswwwgizdeendownloadsgiz2014-en-kaleidoscope-of-cooking-indiapdf
Smith Kirk R and Ajay Pillarisetti 2017 ldquoHousehold Air Pollution from Solid Cookfuels and its Effects on Healthrdquo Disease Control Priorities 7 (3) 133ndash52 httpsdoiorg101596978-1-4648-0522-6_ch7
UN-Habitat 2003 ldquoThe Challenge of Slums ndash Global Report on Human Settlements 2003rdquo Location of publishing London UN-Habitat httpsunhabitatorgthe-challenge-of-slums-global-report-on-human-settlements-2003
Wang Bolin Ruobao Li Zhong Lu and Yan Huang 2020 ldquoDoes Comorbidity Increase the Risk of Patients with COVID-19 Evidence from Meta-analysisrdquo Aging 12 (7) 6049ndash6057 httpsdoiorg1018632AGING103000
WHO 2014 ldquoWHO Guidelines for Indoor Air Quality Household Fuel Combustionrdquo WHO Accessed 25 July 2020 httpwwwwhointairpollutionguidelineshousehold-fuel-combustionen
World Bank 2020 ldquoThe State of Modern Energy Cooking Servicesrdquo Washington DC World Bank httpdocuments1worldbankorgcurateden937141600195758792pdfThe-State-of-Access-to-Modern-Energy-Cooking-Servicespdf
Yenneti Komali Yehua Dennis Wei and Wen Chen 2017 ldquoThe Urbanization of Poverty in India Spatio-temporal Disparities in Consumption Expendituresrdquo Geographical Review 107 (2) 360ndash383 httpsdoiorg101111j1931-0846201612167x
References
Are Indiarsquos Urban Poor Using Clean Cooking Fuels Insights from Slums in Six States
Annexure 1 Asset ownership index We used Filmer and Pritchettrsquos (2001) proposed approach to construct an asset ownership index using principal component analysis (PCA) We chose the indicators based on data from the Cooking Energy Access survey 2020 The variables we considered for the index were based on classifications by Caroline Moser and Andrew Felton (2007) and K Harttgen (2013) We computed the asset index using housing characteristics and consumer durables as follows
Variables not included in the asset index
Four types of variables were eliminated
1 Variables (such as grid electricity) that had high usage of greater than 95 per cent
2 Those (such as ownership of laptops or computers air conditioners etc) that had a low usage of less than 5 per cent
3 Variables (like house ownership) that have economically fluctuating values
4 Those that indicated a low correlation of less than 20 per cent variation between the top category (ie first) of the asset quintile and the bottom-most category (ie fifth) of the asset quintile
For ease of interpretation we rescaled this index such that the final index values range between 0 and 10 For this purpose we used a feature scaling (or minndashmax scaling) formula
Xnorm (or (IVx)) = (X ndash Xmin)(Xmax ndash Xmin)
where IVx is the normalised index value Xmin is the initial minimum value (-354) and Xmax is the initial maximum value (461) of the asset ownership index
30
Annexures
bull Crowding16 inside the house bull Toilet ownership and usage bull Source of water bull Number of pucca rooms
bull Ownership of two-wheeler bull Ownership of washing machine bull Ownership of television bull Ownership of refrigerator bull Ownership of cooker
16 A household with more than three members occupying a single room is considered crowded (World Health Organization 2018)
Housing characteristics
Consumer durables
Annexure 2 Explaining the use of LPG as the exclusive fuel (simple logistic regression model)
31Annexures
Dependent variable exclusive LPG use
Education of the primary cook (categorical base category is education beyond the school level)
Education of the household head (categorical base category is education beyond the school level)
State (categorical base category includes households from Rajasthan)
P gt z 95 confidence interval
Odds ratio (SE)
1299 (0112)
0659 (0202)
1399 (0394)
0970 (0038)
0994 (0011)
1003 (0013)
2042 (0508)
1011 (0046)
0782 (0441)
1198 (0608)
1377 (0664)
1345 (0566)
3141 (1103)
1213 (0500)
0309 (0211)
1165 (0565)
1703 (0680)
0002
0174
0233
0446
0583
0839
0004
0812
0663
0722
0507
0482
0001
0639
0086
0753
0182
1097
0361
0806
0898
0973
0977
1254
0924
0259
0443
0535
0589
1578
0541
0081
0450
0779
1540
1203
2428
1048
1016
1029
3327
1106
2361
3240
3545
3070
6251
2720
1181
3014
3723
Asset index
Primary cook involved in income-generating activity
Female-headed households
Household size
Age of household head
Age of primary cook
Doorstep delivery of LPG cylinders
PMUY customer
Primary cook is not educated
Primary cook has a school education
Household head is not educated
Household head has a school education
Uttar Pradesh
Bihar
Chhattisgarh
Jharkhand
Madhya Pradesh
Number of households (n) = 417
Log likelihood = -228777
Prob gt chi2 = 0000
Pseudo R2 = 0126
The dependent variable is a dummy variable where households using LPG exclusively are assigned a value of 1 and all other households are assigned the value of 0
The caste of the household has not been factored into the regression as a separate variable because of its underlying influence on economic status
Source Authorsrsquo analysis
Are Indiarsquos Urban Poor Using Clean Cooking Fuels Insights from Slums in Six States
Annexure 3 Air quality (PM25 concentration in μgm3) across 15 districts based on CAAQMS data
32
Dis
tric
tsM
ar-1
9A
pr-1
9M
ay-1
9Ju
n-19
Jul-1
9A
ug-1
9Se
p-19
Oct
-19
Nov
-19
Dec
-19
Jan-
20Fe
b-20
Mar
-20
794
5
988
5
866
7
-
645
329
2
453
7
388
1
769
1
886
4
661
5
950
9
834
4
-
823
4
611
7
569
9
535
7
-
270
4
589
4
571
5
293
1
705
4
839
2
614
9
970
1
826
8
-
844
9
622
1
597
1
564
0
-
235
3
414
3
619
1
414
3
653
9
834
7
568
8
104
90
739
8
-
894
9
630
9
342
2
450
4
-
476
465
2
474
6
429
2
592
3
566
1
-
674
6
531
4
501
5
568
7
450
8
-
320
3
-
846
506
3
349
5
332
4
369
1
387
2
-
430
4
393
6
353
7
446
2
406
8
335
2
339
1
-
102
9
497
2
261
8
269
1
431
4
294
1
-
351
6
277
3
-
336
5
315
5
248
3
392
8
149
7
144
9
462
3
270
5
331
3
273
4
276
0
106
6
391
7
326
2
-
368
6
625
3
875
2
101
64
521
2
183
1
380
4
556
2
544
1
558
2
102
24
104
33
156
44
128
73
146
62
137
71
109
14
183
70
201
80
896
7
190
1
457
7
581
2
583
5
815
4
135
00
126
41
239
94
208
15
158
51
221
86
121
35
192
46
218
43
848
0
205
2
448
5
509
4
582
0
704
5
177
01
613
1
244
01
215
80
136
87
230
54
964
2
201
52
122
30
725
5
120
6
435
4
454
7
481
2
111
37
147
45
537
3
175
53
162
86
111
21
170
08
583
8
132
10
866
2
513
1
112
5
511
3
507
5
511
8
879
4
120
22
502
1
135
53
116
39
994
7
120
45
410
5
792
1
674
8
326
3
177
6
385
0
408
5
335
9
497
2
594
2
429
9
673
2
547
5
540
8
559
4
Gay
a
Muz
affa
rpur
Pat
na
Bho
pal
Satn
a
Alw
ar
Ajm
er
Ud
aip
ur
Ag
ra
Bul
and
shah
r
Hap
ur
Gha
ziab
ad
Gre
ater
Noi
da
Mee
rut
Noi
da
Sour
ce C
onti
nuou
s am
bien
t air
qua
lity
mon
itor
ing
stat
ion
(Mar
ch 2
019
ndash M
arch
202
0)
In a rapidly urbanising India it would be imperative for policymakers and practitioners in energy and urban development sector to integrate access to clean cooking energy within the ambit of services for the urban poor
Image CEEW
Are Indiarsquos Urban Poor Using Clean Cooking Fuels Insights from Slums in Six States
COUNCIL ON ENERGY ENVIRONMENT AND WATER (CEEW)
Sanskrit Bhawan A-10 Aruna Asaf Ali Marg Qutab Institutional AreaNew Delhi - 110 067 IndiaT +91 11 4073 3300
infoceewin | ceewin | CEEWIndia

Are Indiarsquos Urban Poor Using Clean Cooking Fuels Insights from Slums in Six States
Shaily Jha shailyjhaceewin
Shaily is a Research Analyst in the Energy Access team at The Council She works on access to clean cooking energy and livelihoods with a focus on gender and social inclusion Shaily holds a postgraduate degree in Disaster Management from the Tata Institute of Social Sciences (TISS) Mumbai and an undergraduate degree in Geography from Miranda House University of Delhi
Sasmita Patnaik sasmitaapatnaikgmailcom
Sasmita is a former Programme Lead of the Energy Access team at The Council She led the work on access to clean cooking and livelihoods with a focus on gender and social inclusion She holds an MSc in Development Studies from the School of Oriental and African Studies (SOAS) and a postgraduate diploma in Rural Management from Xavier Institute of Management Bhubaneswar (XIMB)
Rithima Warrier rithima2warriergmailcom
Rithima worked as Research Consultant at The Council where she analysed primary data on energy access for rural households and urban slums of India Rithima holds an MTech in Bioscience and Bioengineering with a specialisation in Energy from the Indian Institute of Technology Guwahati (IITG) and a BE in Chemical Engineering from MS Ramaiah Institute of Technology (MSRIT) Bangalore
The authors
ldquoEven though the use of LPG as an exclusive cooking fuel is more prominent in urban households than their rural counterparts a significant share of the urban population living in slums is struggling to incorporate the cost of using LPG into the household budget The pollution burden for these households is doubled as they are exposed to the high ambient particulate matter pollution of cities along with the household air pollution from the use of polluting cooking fuelsrdquo
ldquoDuring data analysis we realised that even within polluting fuel-using slum households the reasons for not transitioning towards cleaner fuel varied between the households that stacked LPG with polluting fuels and the ones that only used polluting fuels Moreover the economic impact of COVID-19 is expected to further hinder the transition to cleaner fuels in these slumsrdquo
ldquoPolicies on clean cooking energy access have not necessarily targeted energy poverty in urban slums In a rapidly urbanising country facing a crisis of air pollution and now recovering from the economic impacts of COVID-19 it is time that we target policies to alleviate energy poverty in urban slums particularly in Tier 2 and Tier 3 cities Women and children are the worst affected by the use of polluting fuels reinforcing the need to focus on womenrsquos ability to use clean cooking energy solutions even after schemes like Pradhan Mantri Ujjwala Yojanardquo
Are Indiarsquos Urban Poor Using Clean Cooking Fuels Insights from Slums in Six States
Image iStock
Urban slums suffer from the double burden of pollution as they are exposed to the high ambient particulate matter pollution of cities along with the household air pollution (HAP) from the using unclean cooking fuels
Contents
Executive summary
Annexures
References
2 Cooking fuel adoption and use in urban slum households
21 Households using LPG as their only fuel 22 Households stacking LPG with polluting fuels 23 Households using only polluting fuels
SPOTLIGHT I Household air pollution (HAP) in urban slums
SPOTLIGHT II Womenrsquos participation in intra-household decision-making regarding LPG use
SPOTLIGHT III A comparison of access to clean cooking energy between urban slum and non-slum households across six states
3 Way forward
11 Motivation and methodology 12 Socio-economic characteristics of the urban slums of the six states
1 Introduction state of Indiarsquos urban slums 1
7
17
20
21
23
26
30
24
8
1116
i
Are Indiarsquos Urban Poor Using Clean Cooking Fuels Insights from Slums in Six States
Tables
Table 1 Sample allocation across urban slums
Table 2 Less than one-third of urban slum households reported income from salaried jobs
Table 3 Scheduled Castes and Scheduled Tribes have the lowest economic status
Table 4 The poor economic condition of households in urban slums impacts the use of clean fuels exclusively for cooking
Figures
Figure ES1 To reduce the health impacts from HAP households that are stacking with polluting fuels will need to transition to exclusive use of clean cooking fuels
Figure ES2 While stacking is highest among the middle categories (second and third quintile) it is prevalent across all asset quintiles including the highest one
Figure 1 Within slums there are considerable state-level variations in householdsrsquo fuel usage patterns across states
Figure 2 While the majority of LPG-using households use the fuel primarily only half of them use it exclusively
Figure 3 Most households using LPG exclusively acquire six to eight cylinders per year
Figure 4 Of the households that stack fuels most use LPG as their primary fuel
Figure 5 Stacking is prevalent in households across asset quintile categories
Figure 6 Almost half of the households using polluting fuels use it every day
Figure 7 Proportion of urban slum households using solid fuels as the primary cooking fuel increases during the winters months aggravating householdsrsquo air pollution exposure due to unfavourable atmospheric conditions
Figure 8 Lack of awareness about receiving LPG refill subsidies poses a threat to the success of LPG subsidy schemes
Figure 9 More than half of the households currently without LPG do not know how to get a connection or whom to ask about it implying a lack of awareness
5
5
3
22
ii
iii
8
8
9
11
12
13
14
15
16
Acronyms
BPL below poverty line
CAAQMS continuous ambient air quality monitoring stations
COPD chronic obstructive pulmonary disease
COVID coronavirus disease
DALY disability-adjusted life year
DBTL Direct Benefit Transfer scheme for LPG
HAP household air pollution
IRES India Residential Energy Survey
LPG liquified petroleum gas
NSSO National Sample Survey Office
OBC Other Backward Castes
OMCs oil and marketing companies
PMUY Pradhan Mantri Ujjwala Yojana
SC Scheduled Caste
SDI socio-demographic index
ST Scheduled Tribes
Are Indiarsquos Urban Poor Using Clean Cooking Fuels Insights from Slums in Six States
Image iStock
To reduce the health impacts from household air pollution slum households that are stacking polluting fuels will need to transition using clean cooking fuels exclusively
With increased urbanisation India is experiencing acute air pollution in its urban centres Slum dwellers are doubly affected both by the higher concentration of
particulate matter in urban areas as well as indoor air pollution from the use of unclean cooking fuels With more than 137 million people living in slums in country (Census 2011) there is a strong impetus to understand the use of clean cooking fuels in such households Existing literature on energy access and use in slums across developing countries assume that energy infrastructure is available in these settlements as they are situated in urban environments (Butera et al 2016) Household air pollution (HAP) has an estimated average contribution of 30ndash50 per cent to ambient air quality across Indiarsquos urban and rural areas (Balakrishnan et al 2019) Addressing biomass burning for cooking water heating and space heating during the winters has the potential to help reach the national ambient air quality standards (Chowdhury et al 2019)
However our analysis shows that a large share of these households do not have access to clean fuels due to lack of afforability or patchy supply In this brief we discuss access to clean cooking energy in urban slums across six states (Bihar Uttar Pradesh Rajasthan Madhya Pradesh Jharkhand and Chhattisgarh) These states have a low socio-demographic index and a high disease burden due to air pollution (Balakrishnan et al 2019) The findings of this brief are based on a primary survey conducted in rural areas and urban slums in these states ndash Cooking Energy Access Survey 20201 The analysis focuses on the fuel use patterns of households the extent of use of LPG and solid fuels fuel stacking behaviour and the primary cookrsquos perception of various cooking fuels and their health impacts
Slum households vary widely in their use of clean cooking fuels Therefore to understand their cooking energy use patterns better we categorised these households into three groups
Using clean fuels exclusively
Stacking clean fuels with polluting fuels and
Using only polluting fuels
Use of LPG as primary fuel
82 (Cooking Energy Access Survey 2020)
47 (Census 2011)
Polluting fuel as primary fuel
16 (Cooking Energy Access Survey 2020)
52 (Census 2011)
i
Executive summary
1 This has been referred as lsquoour surveyrsquo thereafter
In this brief the use of clean cooking fuels is considered synonymous to use of LPG
Are Indiarsquos Urban Poor Using Clean Cooking Fuels Insights from Slums in Six States
1 Households using LPG as their only fuelWhile most urban slum households have an LPG connection exclusive use of LPG is limited to just over half of the total households The householdrsquos economic status (measured through asset ownership) and their access to doorstep delivery of LPG refills are two critical factors that determine their ability to use LPG exclusively We found that households with higher asset ownership have significantly higher odds of using LPG as an exclusive fuel
2 Households stacking LPG with polluting fuelsAlthough schemes like Pradhan Mantri Ujjwala Yojana (PMUY) have helped increase LPG adoption this has not resulted in the complete replacement of biomass-based fuels Despite 86 per cent of households having an LPG connection the data shows that over a third of slum households are stacking with polluting fuels (including firewood dung cakes agriculture residue charcoal and kerosene) Most of these households use polluting fuels daily or at least weekly which increases their exposure to household air pollution
Among the households stacking LPG with polluting fuels the reasons for stacking vary affordability free-of-cost availability of biomass seasonality and taste preferences Across asset quintiles we find that stacking is highest among the middle categories (second and third quintile) though most households in these categories have adopted LPG Still the affordability of the fuel remains a significant concern One-fourth of households who are stacking polluting fuels have a median annual refill rate of eight cylinders and above (same as exclusive LPG users) despite having a similar household size as those using LPG exclusively Most of such households fall in the wealthiest asset quintiles and use a chulha (mud stove) for cooking chapatis or vegetables suggesting that they are not necessarily using unclean fuels due to the unaffordability of LPG but due to other factors like taste
ii
Figure ES1 To reduce the health impacts from household air pollution (HAP) households that are stacking with polluting fuels will need to transition to exclusive use of clean cooking fuels
Source Authorsrsquo analysis
Exclusive clean fuel users
Stacking with LPG as the primary fuel
Only polluting fuel users
Stacking LPG with polluting fuels
Stacking with LPG as the secondary fuel
55
3388
12
12
63 LPG-using households receive doorstep delivery of cylinders
77
households receiving doorstep delivery of LPG cylinders are exclusive users of the fuel
Despite increased LPG adoption stacking is prevalent in more than one-third of the slum households
iiiExecutive summary
Figure ES2 While stacking is highest among the middle categories (second and third quintile) it is prevalent across all asset quintiles including the highest one
Source Authorsrsquo analysis
21 Non-cooking uses of polluting fuels Despite using LPG as the primary fuel for their cooking needs households that stack fuels use polluting fuels for non-cooking purposes like heating water for bathing (29 per cent) and space heating (10 per cent)
22 Seasonal variations in fuel use Most households (88 per cent) use LPG as their primary fuel in the rainy season while in winters less than 45 per cent of households do so The increased use of polluting fuels in winter could be because during these months the polluting fuel requirement for non-cooking tasks within the household like water heating for bathing and space heating increases ndash which leads to the increased use of polluting fuels for cooking as well Unfortunately the increased use of polluting fuels in winters exposes households to the double burden of high ambient and household air pollution due to unfavourable atmospheric conditions
21 households stacking fuels
have more than one LPG connections
25 households stacking fuels have two-cylinder connections
1 2 3 4 5
Asset quintile categories
0
20
40
60
80
100
Per
cent
age
of h
ouse
hold
s
Exclusive clean fuel users Stacking LPG with polluting fuels Only polluting fuel users
5348
52
6367
2441 37
3232
2311 11
51
Are Indiarsquos Urban Poor Using Clean Cooking Fuels Insights from Slums in Six States
3 Households using only polluting fuelsDespite large-scale government initiatives like PMUY 12 per cent of urban slum households do not use LPG and rely on polluting fuels While most of these households are aware of PMUY the high upfront LPG connection cost along with the high recurring expenditure on refills deter them from procuring an LPG connection
Way forwardWhile we see a progressive change in householdsrsquo energy-use patterns as we move from rural to urban issues like affordability availability preference seasonality and the end-uses of the fuel remain essential factors that determine household fuel choice Understanding user categories and fuel use patterns is crucial in enabling access to and sustained use of clean cooking fuels Also it is vital to recognise the implications of cooking being a gendered activity However womenrsquos participation in intrahousehold decision-making regarding LPG use is limited
Despite being in urban areas 37 per cent of slum households do not receive home delivery of cylinders ndash availability is an essential factor that determines the householdrsquos likelihood of using LPG exclusively To increase LPG use oil and marketing companies (OMCs) and distributors need to improve home delivery of LPG refills in slum areas
Emissions from household sources contribute hugely to the surrounding air quality (Harish et al 2019) which is already poor in congested slum areas Majority of households cook inside the main house without a chimney indicating high exposure to pollution from the use of unclean fuels for cooking
iv
30 householdsrsquo female members place the order for LPG refills
50 householdsrsquo female
members decide whether or when to purchase LPG refills
75 householdsrsquo
using polluting fuels cook inside
the main house
67 householdsrsquo using polluting fuels do not have a chimney for ventilation
vExecutive summary
Integrate the issue of lack of access to clean cooking energy with urban poverty This study reiterates the need to look at poverty in urban areas in the context of energy access The vulnerability of urban slum dwellers needs to be accounted for while designing and implementing policies including social protection schemes Given the health and economic impacts of pollution access to clean cooking energy schemes must be integrated with the social assistance programmes of other ministries (eg health education and nutrition assistance) to better target support for slum households Government programmes such as the National Urban Livelihoods Mission and social service allocations for housing should use existing targeting approaches to include access to clean cooking energy within their ambit of services for the poor
The economic impact from COVID-19 will push households into energy poverty leading to the increased use of free-of-cost biomass ndash consequently increasing the risk of exposure to emissions from fuel burning While the government has announced that it will provide up to three free refills under the PM-Garib Kalyan Yojana scheme to all PMUY households less than a quarter of households in urban slums have Ujjwala connections ndash effectively making them ineligible for relief support There is a need to expand the reach of PMUY to cover all slum households
Bring renewed emphasis on clean cooking during COVID-19 Increased poverty would mean increased use of polluting fuels ndash there is a need for a renewed emphasis on clean cooking energy access during the COVID-19 pandemic as increased use of polluting fuels has health implications (lower respiratory infections and coronary chronic obstructive disease (COPD)) that increase the risk of COVID-19 infections being more severe
There is a need for targeted effort to include the poor households in urban slums left out in the first phase of Ujjwala
Are Indiarsquos Urban Poor Using Clean Cooking Fuels Insights from Slums in Six States
Image iStock
Addressing biomass burning for cooking water heating and space heating during the winters has the potential to help reach the national ambient air quality standards
The Census of India (2011) estimates that India has about 137 million slum dwellers across the country However statistics on slum populations vary significantly based on how
a slum is defined (Nolan 2015) Therefore not only is there a lack of data about how many people live in slums and informal settlements but there is also limited information about living conditions in slums (Rains Krishna and Wibbels 2018) Rapid urbanisation in India has led to population spikes in urban centres Low-income households in urban areas are trapped in informal and sometimes lsquoillegalrsquo settlements with poor living conditions where access to essential services and infrastructure tends to be limited or badly deteriorated (Butera et al 2016) While slum dwellers are not a homogeneous population slum areas have high concentrations of poverty and social and economic deprivation and poor shelter and environmental conditions (UN-Habitat 2003)
1 Introduction state of Indiarsquos urban slums
1
The Census of India (2011) defines slums as ldquoresidential areas where dwellings are unfit for human habitation by
reasons of dilapidation overcrowding faulty arrangements and design of such buildings narrowness or faulty
arrangement of street lack of ventilation light or sanitation facilities or any combination of these factors which
are detrimental to the safety and healthrdquo The slums in India are officially categorised into three categories
identified recognised and notified1 (Chandramouli 2010) About 59 per cent of slum households in India are non-
notified and are not legally recognised by the government (Nolan Bloom and Subbaraman 2018)
BOX 1 Slums in India
The existing literature on energy access and use in slums across developing countries suggests that while energy infrastructure (electric grid LPG distribution system) is available in these settlements (by being urban) households cannot afford it andor the service is unreliable (frequent outages and low voltage for electricity uncertain availability of gas cylinders) (Butera et al 2016) This leads to households relying on illegal connections for electricity and using energy sources that are on the lower end of the energy ladder (such as kerosene charcoal wood and other biomass residues) for cooking (Butera et al 2016)
1 Areas notified as slums by the concerned municipalities corporations local bodies or development authorities were termed notified slums All areas recognised as lsquoSlumrsquo by State UT Administration or Local Government Housing and Slum Boards which may have not been formally notified as slum under any act While a compact area of at least 300 population or about 60-70 households of poorly built congested tenements in the unhygienic environment is termed as identified slums (National Sample Survey Office 2012)
Are Indiarsquos Urban Poor Using Clean Cooking Fuels Insights from Slums in Six States2
In India population growth and rapid urbanisation have resulted in the deepening of urban poverty and the increased growth of urban slums (GNESD 2008 Yenneti Wei and Chen 2017) As per the Census 2011 most slum dwellers are casual labourers engaged in works other than public works (ie informal sectors) as opposed to salaried employees in non-slum urban areas (National Buildings Organisation 2013) As per the National Sample Survey Office (NSSO 2011ndash2012) the average daily wage of casual labourers is as low as INR 170 in urban areas (Ministry of Housing and Urban Affairs 2019) Such households may be able to purchase cleaner and more efficient fuels whenever they can but are likely to fall back on less efficient ones when faced by budgetary constraints Studies suggest that despite the LPG subsidies provided by the government significant sections of the urban poor population are still struggling to incorporate the cost of LPG into their household budgets (R Singh et al 2015) Use of multiple fuels also provides security from price variations and unreliable service associated with a single fuel or technology (Shahadat Lipu and Bhuiyan 2014)
As per the Census 2011 only half of the urban slum households across the country use LPG as their cooking fuel the remaining rely on solid fuels and kerosene Since 2013 the LPG programme in India has undergone many modifications to improve delivery and targeting access to connections and the availability of LPG (CEEW 2020) Pradhan Mantri Ujjwala Yojana (PMUY) which focuses on tackling the high upfront cost of LPG by providing LPG connections to below poverty line (BPL) households with credit-linked subsidy support has played an instrumental role in increasing the penetration of LPG across the country As of November 2019 about 965 per cent of households in India have an LPG connection (PPAC 2019) Small towns and cities which have been experiencing a comparatively slow rate of urban growth but the high percentage of slum population mall towns and cities which have been experiencing a relatively slow rate of urban growth but a high percentage of slum population
However the dramatic increase in LPG coverage has led to increased fuel stacking (Cheng and Urpelainen 2014) The reliance on fuel stacking has significant implications as the health benefits of using clean fuels are reduced or perhaps even nullified in households that continue to use biomass (Cheng and Urpelainen 2014) Urban slums suffer from a double burden of pollution as they are exposed to high ambient particulate matter pollution in cities along with the household air pollution (HAP) from using unclean cooking fuels (WHO 2014) The Global Burden of Disease study notes that even with the substantial increase in the provision of clean cooking fuels in India more than half of Indiarsquos population is exposed to HAP from solid cooking fuels as of 2017 (Balakrishnan et al 2019) In the current context this is concerning since exposure to air pollution has been linked to developing lower respiratory infections and chronic obstructive pulmonary disease (Balakrishnan et al 2019) which are among the major risk factors for COVID-19 (Lippi and Henry 2020 Wang et al 2020)
11 Motivation and methodology While there have been various studies on energy access in rural areas there is minimal data on energy use and patterns in urban slum households Most studies on urban slums and energy access focus on specific slums in large metropolitan areas such as Delhi and Bangalore (Saksena et al 2003 Dhingra et al 2008 Roy et al 2018) Living conditions and access to resources vary across slums in smaller towns and cities compared to those in Tier I
Slum-dwellers suffer from the double burden of pollution as they are exposed to high ambient particulate matter in cities along with the HAP from using unclean cooking fuels
2 A summary measure that identifies where countries or other geographic areas fall on the spectrum of development Expressed on a scale of 0 to 1 SDI is a composite average of the countryrsquos rankings in terms of per capita income average educational attainment and fertility rates
3 These states account for six out of eight of the lowest socio-demographic index (SDI) states and exhibit the highest health impacts of household air pollution (HAP) These states also have the highest percentage of households covered under the flagship clean cooking energy programme in India ndash PMUY
4 Referred to as lsquoour surveyrsquo thereafter
5 In our sample about 82 per cent of households are from notified slums
6 About 98 per cent of the respondents were female members of the household
7 For further details on the survey sample and methodology refer to the technical document for the survey
3Introduction state of Indiarsquos urban slums
Table 1 Sample allocation across urban slums
Source Authorsrsquo compilation
Note The number of slums sampled within each state varied because the slums were picked from the same districts that were sampled under the India Residential Energy Survey (2020) across the six states This was done to ensure logistical ease in conducting both the surveys and to share the resources of the national-level survey The list of urban slums as per the Census 2011 in the districts sampled under IRES 2020 constitutes the urban sampling frame7
State Districts sampled Urban slums sampled Households surveyed
16
14
10
10
4
4
58
31
15
16
12
5
4
83
249
124
128
94
40
32
667
Uttar Pradesh
Bihar
Madhya Pradesh
Rajasthan
Jharkhand
Chhattisgarh
cities these towns have been experiencing a comparatively slow rate of urban growth but are home to large slum populations (Rahaman and Das 2017) Further existing sources on access to clean cooking energy among slum households are limited to primary fuel use and lack detailed information about fuel use and stacking patterns
In India states with the lowest socio-demographic index (SDI)2 also account for the highest level of disease burden due to air pollution (Balakrishnan et al 2019) The low SDI states in north India had some of the highest levels of ambient particulate matter and household air pollution ndash especially Bihar Uttar Pradesh Rajasthan and Jharkhand The disability-adjusted life year (DALY) rate attributable to HAP was highest in the low SDI states of Chhattisgarh Rajasthan and Madhya Pradesh (Balakrishnan et al 2019)
The findings of this brief are based on a primary survey conducted across rural areas and urban slums in six energy access deprived states in India ndash Bihar Jharkhand Uttar Pradesh Rajasthan Madhya Pradesh and Chhattisgarh3 The Cooking Energy Access Survey 20204 focused on householdrsquos clean cooking energy access and its barriers and drivers in rural areas and urban slums Based on the list of urban slums across districts in Census 2011 the survey covered 656 households across 83 urban slums (notified and non-notified)5 spread across 58 districts The survey was conducted with the primary cook of the household6
In this brief we focus on understanding access to clean cooking energy specifically across urban slum households The analysis focuses on the fuel use patterns of households the extent of use of LPG and solid fuels fuel stacking behaviour and the primary cookrsquos perception of various cooking fuels and their impact on health The results discussed below are representative of the urban slum population in six states We have refrained from state-level analysis because of the smaller sample size for urban slums in some states like Jharkhand and Chhattisgarh
Are Indiarsquos Urban Poor Using Clean Cooking Fuels Insights from Slums in Six States4
12 Socio-economic characteristics of the urban slums of the six states Non-farm casual labour is the primary source of income for more than 42 per cent of the households such households reported a median monthly expenditure of about INR 5000 In only 20 per cent of the households the primary cook is involved in income-generating activities primarily engaged in casual non-farm labour or are self-employed
Source Authorsrsquo analysis
60 households have a monthly income below
INR 10000
In 90 households all members have
Aadhar cards
94 households have a bank account
11 households are currently indebted
Median savings in the past year
INR 4000
Median monthly expenditure
INR 6000
MEDIAN HOUSEHOLD SIZE
6
5
Table 2 Less than one-third of urban slum households reported income from salaried jobs
Source Authorsrsquo analysis
Under self-employment some of the householdsrsquo report occupations like carpentry tailoring driver and priest
The primary source of income of urban slum households
Non-farmdaily wage casual labour
Private or government salaried job
Shop or own business or self-employed
Farm labour
Agriculture on own or leased land
Others (pension remittances cattle rearing none)
43
22
18
8
7
2
Scheduled Castes (SC) (30 per cent) and Other Backward Castes (OBC) (45 per cent) form the majority of the urban slum population While Scheduled Tribes (ST) constitute less than 10 per cent of the overall population a majority of them are in Madhya Pradesh and Rajasthan Less than 20 per cent of the urban slum population are from the General castes States like Bihar Jharkhand and Rajasthan have the least proportion of General castes living in slum areas
Within urban slum households OBC and General households are relatively better off economically as shown in Table 3 Occupational patterns also vary based on caste A higher proportion of OBCs and General households rely on running a business self-employment or salaried jobs for their primary source of income as compared to SC and ST households The latter are primarily engaged in farm and non-farm labour The socio-economic marginality of SCs and STs even within slums is a consequence of these communities being most deprived in terms of access to resources and education income housing etc (Chandrasekhar and Mitra 2018) We see a similar trend in our sample in education and income levels Slums often remain the permanent habitation of marginalised castes as opposed to serving as an entry point for persons from higher castes who get absorbed into relatively better jobs and eventually move out of the slums (Chandrasekhar and Mitra 2018)
Table 3 Scheduled Castes and Scheduled Tribes have the lowest economic status
Source Authorsrsquo analysis
We utilise an economic status or asset index as a measure of a householdrsquos relative wealth and economic status based on the Filmer and Pritchett (2001) approach The list of variables included in the economic status index can be found in Annexure I The index takes values between 0 and 10 where a higher value denotes a higher level of asset ownership
Caste Sample size
Mean of asset index
(Min ndash Max) of BPL cardholders
233
51
281
92
042
039
046
046
(0ndash084)
(008ndash077)
(003ndash1)
(008ndash09)
45
60
49
36
Scheduled Castes
Scheduled Tribes
Other Backward Classes
General
Introduction state of Indiarsquos urban slums
Are Indiarsquos Urban Poor Using Clean Cooking Fuels Insights from Slums in Six States652
Image iStock
Exclusive use of LPG is limited to just over half of the total slum households The householdrsquos economic status and its access to doorstep delivery of LPG refills are two critical factors that determine their ability to use LPG exclusively
7
The fuel use patterns in urban slum households across the six states show a significant improvement in LPG use over the past decade when compared with the data from
Census 2011 The share of households using polluting fuels (including firewood dung cake agriculture residue and kerosene) as their primary fuel has decreased significantly but we find that stacking is a common practice even among households using LPG as a primary fuel Unless they use clean fuels exclusively such slum households will still be exposed to the health risks associated with HAP
Across the six states the primary fuel used for cooking by slum households
For the analysis in this brief we have categorised the households into three based on their fuel choices and position on the energy ladder those that exclusively use clean cooking fuels (LPG and electricity) stack LPG with polluting fuels and use only polluting fuels The level of exposure to emissions from cooking increases from the first (least harmful) to the third category (most harmful)
2 Cooking fuel adoption and use in urban slum households
In this brief the use of clean cooking fuels is considered synonymous to use of LPG since other clean fuels comprise a negligible share of use
Source Authorsrsquo analysis
Households using clean fuel exclusivelyWhile the majority of these households use LPG two per cent of the households reported using electricity for cooking purposes
Households stacking LPG with polluting fuelsMost of these households reported using LPG as their primary fuel and polluting fuels as their secondary fuel About four per cent of slum households reported using polluting fuels as their primary fuel and LPG as their secondary fuel
Households using only polluting fuelsThese households only use firewood charcoal dung
agricultural residue kerosene or a stack of these fuels
5533
12
Fuel-use categories
Use of LPG as primary fuel
82 (Cooking Energy Access Survey 2020)
47 (Census 2011)
Polluting fuel as primary fuel
16 (Cooking Energy Access Survey 2020)
52 (Census 2011)
Are Indiarsquos Urban Poor Using Clean Cooking Fuels Insights from Slums in Six States8
In the following sections we explore factors such as socio-economic characteristics affordability and availability of fuel intra-household gender dynamics and fuel perceptions which influence the ability and likelihood of a household to use different fuels
21 Households using LPG as their only fuel In this section we focus on understanding the household characteristics and fuel use patterns of those using LPG exclusively for cooking Most urban slum households with an LPG connection report using LPG as their primary fuel While 55 per cent of the slum households (63 per cent of LPG-using households) use LPG exclusively others stack LPG with polluting fuels Uttar Pradesh has the highest
proportion (70 per cent) of slum households who are exclusive users of clean cooking fuels among the six states
Figure 1 Within slums there are considerable state-level variations in householdsrsquo fuel usage patterns across states
Source Authorsrsquo analysis
Note We have refrained from state-level analysis because of the smaller sample size for urban slums in states like Jharkhand and Chhattisgarh
Figure 2 While the majority of LPG-using households use the fuel primarily only half of them use it exclusively
Source Authorsrsquo analysis
0
0
10
10
20
20
30
30
40
40
50
50
60
60
70
70
80
80
90
90
100
100
8682
55
Bihar
LPG users
Chhattisgarh Jharkhand Madhya Pradesh
LPG as the primary fuel LPG as the exclusive fuel
Rajasthan Uttar Pradesh
States
Per
cent
age
of h
ouse
hold
s P
erce
ntag
e of
hou
seho
lds
Exclusive clean fuel users Stacking LPG with polluting fuels Only polluting fuel users
42
3
30
56
45
39
1611
40
4944
46
10 5
24
71
41
28
9Cooking fuel adoption and use in urban slum households
Over a fifth of households using LPG exclusively are PMUY households which suggests that these households have been able to transition to clean cooking fuels in less than four years PMUY households using LPG exclusively are of a relatively higher economic status than households that stack polluting fuels Unlike in rural areas the age of an LPG connection does not have a direct correlation with per capita LPG consumption in urban slum households suggesting that even households with recent LPG connections in urban slums are likely to use LPG exclusively Households in urban areas have been known to experience a direct transition to exclusive use of clean fuels from using traditional fuels (Kuo and Azam 2019) This could be due to the time-saving that comes with the adoption of clean cooking fuels like LPG ndash where urban households are more willing or need to spend more on convenience than rural households
Figure 3 Most households using LPG exclusively acquire six to eight cylinders per year
Source Authorsrsquo analysis
211 The economic status of the household determines exclusive LPG useA simple logistic regression (Annexure II) shows that households with higher asset ownership have significantly higher odds of using LPG as an exclusive fuel Even between primary and exclusive users of LPG asset ownership remains a significant differentiating factor This corroborates the findings of previous studies (Ranjan and Singh 2017) that state that households tend to switch their cooking fuel use patterns after a threshold level of income is achieved However this is not to suggest that all wealthy households shift to exclusive use of clean fuels We discuss the reasons for stacking among these households in the next section
Cooking energy in the household budget We find that households using LPG as their only fuel pay INR 496 per month8 This effectively translates to an average household spending almost eight per cent of their monthly expenses on cooking fuel
Oil and Marketing Companies (OMCs) are attempting to address the challenges around the recurring refilling
cost by encouraging low-income households to use a 5 kilograms (kg) cylinder to overcome the high upfront cost
associated with 145kg cylinders In our sample we find that only about two per cent of urban slum households use
small cylinders (5kg or 3kg)
BOX 2 Uptake of small cylinders
8 This is based on the upfront cost paid by the household for an LPG refill Given that only 40 per cent of the householdsrsquo report receiving LPG subsidy on refills ndash it has not been considered in the fuel expenditure calculation The share of fuel expenditure for the households receiving LPG subsidies would be accordingly less than the others
0
10
20
30
40
50
60
70
1
1 16 8 9
22
60
4350 50
14
34
15
2 3 4 5 6 7 8 9 10 11 12 13
Number of 14 kg LPG cylinder refills obtained by exclusive LPG users
Per
cent
age
of h
ouse
hold
s us
ing
LP
G e
xclu
sive
ly
households using LPG exclusively Median value
Are Indiarsquos Urban Poor Using Clean Cooking Fuels Insights from Slums in Six States
212 Home delivery for exclusive LPG users We find that households who receive doorstep delivery of LPG refills have higher odds of using LPG as their exclusive fuel Hassle-free doorstep delivery of LPG refills is known to influence the use of LPG as a primary secondary or exclusive fuel (PPAC-CRISIL 2016)
Additional expense on procurement of cylinders Almost half of the households who receive doorstep delivery of LPG pay an additional amount of INR 20 as a delivery charge However in households that do not receive doorstep delivery about 46 per cent report that one member must forgo their daily wages to procure the cylinder Most of such households depend on daily labour or private jobs for their income
Given that almost half of the households report having to forgo wages to procure the cylinders it could affect the householdrsquos ability to use LPG continually It may add to the average delay in the purchase of refills
Procurement of LPG cylinders during the COVID-19 pandemic Most households that do not receive doorstep delivery of LPG (58 per cent) use private vehicles (including motorcycles or bicycles) to transport LPG refills About one-third of the households procuring cylinders on their own use rented or shared vehicles The procurement constraints faced by these households would be further aggravated during the COVID-19 pandemic as using rented or shared vehicles comes with its own risks
10
About 18 per cent of the respondents in our survey reported that they resided in non-notified slums Such slums are not legally recognised as a lsquoslumrsquo by the government which makes the residents more vulnerable to eviction In our data we find that adoption and use of LPG is similar across households from notified and non-notified slums Qualitative interviews and field visits showed that most of the respondents were permanent residents of the slums who have been living there for more than 10 years
About 2 per cent of urban slum households use electricity as a source for cooking energy These households do not rely on any other fuels for cooking or non-cooking purposes They use electric stoves to prepare all meals including cooking roti rice and vegetables These households have been using electricity as their cooking fuel only in the past five years Most households report using either a coiled stove or induction stove Less than one per cent of households use other electric appliances such as hot water kettles and toasters for cooking needs
BOX 3
BOX 4
Status of slums impacting the fuel-use pattern
Electricity for cooking
77
households receiving doorstep delivery of LPG cylinders are exclusive users of the fuel
63LPG-using households receive doorstep delivery of cylinders
Male members have to travel to procure the cylinders in 87 households
11Cooking fuel adoption and use in urban slum households
About 4 per cent of urban slum households in the sample reported stacking with kerosene as their secondary fuel Most of these households are in Uttar Pradesh These households also use kerosene more than once a week for cooking
BOX 5 Use of kerosene as a cooking fuel
22 Households stacking LPG with polluting fuels Across the six states almost half of the households (45 per cent) reported using polluting fuels Here we discuss the characteristics and fuel use patterns of households that stack clean and unclean fuels
Though 86 per cent of the households surveyed have an LPG connection we find that over a third (33 per cent) of them stack it with polluting fuels (including firewood dung cakes agriculture residue charcoal and kerosene) The increased stacking could also be a result of more households adopting LPG since households tend to not replace biomass-based fuels completely (Cheng and Urpelainen 2014) These households would need to transition to exclusive use of clean cooking fuels to reduce the health impacts on women and children from household air pollution
About 44 per cent of the households that are stacking fuels rely on informal sources for refills Such households have not ordered any refills in the past one year from their LPG distributors These households mainly rely on recurring cylinders from their neighbours or relatives9
Figure 4 Of the households that stack fuels most use LPG as their primary fuel
Source Authorsrsquo analysis
9 It is important to note that sharing LPG cylinders among neighbours and extended family is a regular phenomenon in small towns and rural areas owing to availability challenges and it is not necessarily driven by an intention to siphon off subsidy amounts against the commodity ( Jain et al 2018)
Exclusive clean fuel users
Stacking with LPG as the primary fuel
Only polluting fuel users
Stacking LPG with polluting fuels
Stacking with LPG as the secondary fuel
55
3388
12
12
Are Indiarsquos Urban Poor Using Clean Cooking Fuels Insights from Slums in Six States12
221 Household factors that determine the decision to stack fuels Even within the stacking households the reason for stacking multiple fuels varies significantly Primarily households who stack can be divided into two categories ndash those that stack as they cannot afford LPG refills and those that stack due to other factors like taste preferences and alternate end-uses of the fuel
Households who are stacking primarily due to affordability concerns ndash Across asset quintiles we find that stacking is most common among the middle categories (second and third quintile) where most have adopted LPG Still the affordability of the fuel remains a significant concern More than 60 per cent of the households that are stacking fuels collect or prepare firewood or dung cakes free of cost rather than purchasing them from the market Those who buy biomass do not spend more than INR 100 per month on it Based on the responses of the primary cook we note that the high cost of LPG and free-of-cost availability of solid fuels are the most common factors that affect the fuel choices made by the household
Figure 5 Stacking is prevalent in households across asset quintile categories
Source Authorsrsquo analysis
1 2 3 4 5
Asset quintile categories
0
20
40
60
80
100
Per
cent
age
of h
ouse
hold
s
Exclusive clean fuel users Stacking LPG with polluting fuels Only polluting fuel users
5348
52
6367
2441 37
3232
2311 11
51
Households who use LPG primarily and polluting fuels as secondary fuels have a median annual refill rate of
6 cylinders
Households who use polluting fuels primarily and LPG as a secondary fuel have a median annual refill rate of
4 cylinders
13
Households that are stacking for reasons beyond affordability ndash More than one-fourth of the households that are stacking have a median annual refill rate of eight cylinders and above despite having a similar household size as others Most such households fall in the highest asset quintiles This suggests that they are not necessarily using unclean fuels due to the unaffordability of LPG but due to other factors such as taste preference for chulhas and fuel end-uses that influence the householdrsquos decision to use solidpolluting fuels Such households reported using LPG for a median period of six years The solid fuels are primarily used for cooking chapatis or vegetables in these households
Interestingly even households with multiple LPG connections and two cylinder connections report stacking with polluting fuels The possession of multiple LPG connections in these households may not necessarily be an indicator of diversion mdash the average family size of these households is more than eight indicating the high possibility of having separate kitchens within the same household Given that such households have a median annual refill rate of ten cylinders another plausible reason for multiple connections is that it prevents them from relying on just one distributor which increases their chances of getting refills whenever needed
222 End-uses of polluting fuels Across both the groups discussed above half of the households who stack with polluting fuels use these fuels at least once a day (Figure 6) Also almost 45 per cent of the households that stack fuels use multiple stoves at the same time while preparing a single meal This indicates that even if the household is using LPG for a particular meal they would be using their chulha simultaneously
Despite using LPG as the primary fuel for their cooking needs households that are stacking fuels use polluting fuels for non-cooking purposes like heating water for bathing (29 per cent) and space heating (10 per cent)
Figure 6 Almost half of the households using polluting fuels use it every day
Source Authorsrsquo analysis
0 5 10 15 20
19
11
21
20
29
25 30 35
Percentage of households
Freq
uenc
y of
use
of p
ollu
ting
fuel
s Several times a day
Once per day
Few times a week
Once a week
Occasionally
21 households stacking fuels
have more than one LPG connections
25 households stacking fuels have two-cylinder connections
Cooking fuel adoption and use in urban slum households
Are Indiarsquos Urban Poor Using Clean Cooking Fuels Insights from Slums in Six States14
223 Seasonal variations in the stacking of fuels We also noted a significant seasonal change in fuel use patterns LPG is most popular in the rainy season (88 per cent) and least popular in the winter months (45 per cent) (Figure 7) The dampness associated with solid fuels in the rainy season could be the reason for using LPG primarily during these months The literature also suggests that solid fuels are a popular choice during winter months (S Singh 2014 Baqir et al 2019) This could be because during winter months the solid fuel requirement for non-cooking tasks within the household likes water heating for bathing and space heating increases Since households are already using solid fuels for non-cooking tasks they may be using these fuels more for cooking during winter Unfortunately the increased use of solid fuels in winter exacerbates the much higher air pollution exposure of these households due to unfavourable atmospheric conditions
Figure 7 Proportion of urban slum households using solid fuels as the primary cooking fuel increases during the winters months aggravating household air pollution exposure due to unfavourable atmospheric conditions
Source Authorsrsquo analysis
About 3 per cent of urban slum households reported owning an electric water-heating device (geyser or immersion
rod) Similarly only 4 per cent of the households own an electric room heater
BOX 6 Electric devices for water heating and space heating
Summer Winter Rainy Festival0
20
40
60
80
100
120
Per
cent
age
of h
ouse
hold
s
LPG Solid fuel
78
45
88
67
22
55
1233
15
Figure 8 Lack of awareness about receiving LPG refill subsidies poses a threat to the success of LPG subsidy schemes
Source Authorsrsquo analysis
Connections under the Pradhan Mantri Ujjwala Yojana (PMUY) 23 per cent of these households reported receiving benefits under the PMUY
The six states included in the survey account for a significant share of PMUY coverage ndash 54 per cent of all connections provided under PMUY (PPAC 2019) However most of these connections cater to rural households One of the reasons for there being fewer PMUY connections in urban areas is that more than half of all urban slum households reported already having had LPG connections for over four years (before the launch of PMUY) Moreover over a quarter of PMUY households10 in urban slums reported having multiple LPG connections which suggests that not every household which was using LPG before the PMUY was prevented from accessing the schemersquos benefits
Government support during the COVID-19 pandemic During the COVID-19 lockdown the government announced the provision of three free-of-cost refills for PMUY households under the PM-Garib Kalyan Yojana While PMUY households in urban slums benefitted from this scheme non-PMUY households in urban slums did not As documented urban slum households faced a significant economic hit due to the loss of jobs and incomes during the pandemic (Patel 2020) Non-PMUY households that stack for economic reasons are more likely to use cheaper and freely available solid fuels without additional support from the government
PAHAL-Direct Benefit Transfer for LPG (DBTL)Overall about 42 per cent of active LPG users11 reported receiving a subsidy for their last LPG refill under the Direct Benefit Transfer for LPG scheme (DBTL) However about 28 per cent of urban slum households reported not knowing if they had received the subsidy amount for their last refill this suggests that the primary cook is often unaware of whether the subsidy is credited to the household Among the ones that reported receiving the LPG subsidy about 40 per cent of the primary cook were not aware of the amount of subsidy being credited into their account
10 This is a relatively smaller sample of 43 households from all the PMUY households in urban slums (131 households)
11 Households that have taken at least one refill in the past year
42
30
28
Received LPG refill subsidy
30 Still repaying PMUY loan
Did not receive LPG refill subsidy
10 Gave up LPG refill subsidy
Do not know
60 LPG refill susbsidy not received due to other reasons
Cooking fuel adoption and use in urban slum households
Are Indiarsquos Urban Poor Using Clean Cooking Fuels Insights from Slums in Six States16
23 Households using only polluting fuels About 12 per cent of urban slum households rely entirely on polluting fuels for all cooking and non-cooking purposes While the share of these households is relatively small the non-adoption of LPG in such households despite
programmes like the PMUY is concerning These households either use a combination of different polluting fuels (firewood dung cakes agricultural residue charcoal and kerosene) or just one of these fuels for all their energy needs Firewood is the most commonly used fuel in these households
231 Reasons for the non-adoption of LPGHouseholds that rely exclusively on polluting fuels reported not having an LPG connection Though three-fourths of these households were aware of PMUY the high upfront cost of an LPG connection along with the high recurring cost of procuring refills remain the two most important reasons for not procuring an LPG connection Repondents also mentioned a lack of information on how to procure a connection as a reason These reasons align with the common causes cited by rural households covered in the survey implying that the challenges faced by rural households and urban slum households in procuring connections are similar
Almost half of the households in this category use solid fuels for non-cooking purposes such as heating water for bathing space heating and preparing fodder for animals On the positive aspects of using polluting fuels households reported the following free-of-cost easy availability of fuels better tasting food and preference of family members for food cooked on the chulha
232 Fuel availability and affordabilityIn contrast with households that stack fuels households that use only solid fuels rely on purchasing fuels rather than collecting or preparing them For instance 60 per cent of firewood users in this category procure fuel by purchasing rather than collecting it
Households with low asset ownership rely on polluting fuels for cooking These households spend 2ndash3 per cent of their median monthly expenditure on fuel (INR 75 per month on fuel) which is much lower than what they would have to spend if they used LPG exclusively (INR 496 per month) Households that collect solid fuels spend about two hours on a single trip (three times a month) travelling a median one-way distance of 2 km This is equivalent to the distance travelled to procure LPG cylinders (if not delivered at home)
Figure 9 More than half of the households currently without LPG do not know how to get a connection or whom to ask about it implying a lack of awareness
Source Authorsrsquo analysis
0 10 20 30 40 50 60 70
39
53
63
68
80
Percentage of households
Rea
sons
for N
on-A
dop
tion
of L
PG Installation is expensive
Monthly expenditure on LPG is high
Do not know how to get or whom to ask
Not availabletoo far
17
12 See Annexure III for details on the districts and their PM25 concentrations The data for 15 districts (from Bihar Uttar Pradesh Madhya Pradesh and Rajasthan) overlapping with the survey sample have been analysed based on the availability of air quality data from continuous monitoring stations
13 Air quality categories based on PM25 concentration (in μgm3)
Good 0 to 30 Satisfactory 31 to 60 Moderately polluted 61 to 90 Poor 91 to 120 Very poor 121 to 250 Severe above 250 (Central Pollution Control Board 2014)
Cooking fuel adoption and use in urban slum households
Winter months have the highest PM25 concentrations coinciding with the sharp increase in use of polluting fuels for heating bath water and room heating
233 Gendered time use in households using solid fuelsIn urban slums both the male and female members of the household are equally involved in collecting firewood Still it is primarily the female members of the household who undertake dung cake preparation In addition to engaging in fuel collection and preparation women tend to spend more time cooking in households using solid fuels About 85 per cent of households that transitioned to LPG in the past four years reported having saved time while cooking compared to when they used solid fuels
SPOTLIGHT I Household air pollution (HAP) in urban slums
Burning solid fuels in three-stone fires and mud stoves with inadequate ventilation causes high levels of smoke exposure and negative health impacts particularly for women and young children (WHO 2014)
The double burden of ambient and household air pollution on the urban slum populationUsing the PM25 data from continuous ambient air quality monitoring stations (CAAQMS) for 15 districts12 in our sample we found that the ambient air quality remained in the lsquopoorrsquo or worse category13 for most districts throughout the year variation in the ambient air quality
Are Indiarsquos Urban Poor Using Clean Cooking Fuels Insights from Slums in Six States
Impact of ventilation
Indoor cooking and low adoption of chimney indicates high exposure to pollution from the use of unclean fuels for cooking The proportion of households with a chimney is high (52 per cent) among those who rely only on polluting fuels Smith and Pillarisetti (2017) explain that while having a good chimney lowers peak levels of indoor pollution long-term average exposure is reduced only by a factor of two Besides chimneys require regular maintenance to function correctly While more than 45 per cent of the households are using polluting fuels less than 20 per cent of the slum housheolds use improved cookstoves
Households also use solid fuels for non-cooking uses like space heating On average each house in a slum has two rooms this effectively exposes all members of the household to emissions from burning fuels Emissions from household sources contribute significantly to the surrounding air quality (Harish et al 2019) this concern is exacerbated in congested slum areas
the winter months (November to February) have the highest concentration of PM25 This leads to a double burden of exposure for slum households stacking solid fuels as they are more likely to increase use of solid fuels in winters (Figure 7) Alternatively the use of LPG as the primary source of fuel increases during the rainy season (June to September) these months record the least ambient air pollution
We also find that districts like Meerut Ghaziabad Patna Gautam Buddha Nagar (Noida and Greater Noida) and Muzaffarpur have the highest frequency of lsquovery poorrsquo air quality days throughout the year Across these districts one-third of households use polluting fuels for cooking In urban slums where households are more densely packed the emissions from burning solid fuels increase the risk of exposure inside households and deteriorate the ambient air quality for the community at large As a result these communities suffer from both increased household and ambient air pollution HAP has an estimated average contribution of 30ndash50 per cent to ambient air quality across Indiarsquos urban and rural areas (Balakrishnan et al 2019) Addressing biomass burning for cooking water heating and space heating during the winters has the potential to help reach the national ambient air quality standards (Chowdhury et al 2019) Despite that only 2 per cent of the action points in 44 city clean air plans mention cooking and heating as a sector to address air pollution (Ganguly Selvaraj and Guttikunda 2020)
18
75 householdsrsquo
using polluting fuels cook inside
the main house
67 householdsrsquo using polluting fuels do not have a chimney for ventilation
Awareness about the health impacts of using polluting fuelsAbout 60 per cent of households using only polluting fuels and 84 per cent of households that stack LPG with a polluting fuel report lsquotoo smokyrsquo as the most prominent negative aspect of using polluting fuels This suggests that as more households switch to clean cooking fuels perceptions regarding pollution fuels change
Three-fourths of primary cooks who use polluting fuels for cooking agree that smoke from solid fuels is harmful to them this implies that awareness of the adverse health impacts of polluting fuels does not necessarily lead to the uptake of clean fuels Primary cooks also agree that smoke from solid fuels causes coughing (49 per cent) and lung infections in children (39 per cent)
Exposure to air pollution is a known risk factor for underlying chronic diseases that predict the severity of
COVID-19 disease and patient outcomes (World Bank 2020) This linkage suggests a heightened risk for women
in all age groups who cook using traditional technologies and fuels (World Bank 2020) The highest number of
COVID-19 cases were recorded in the most polluted regions among patients with pre-existing health conditions
(Frontera et al 2020)
Results from a controlled study show a higher prevalence of chronic obstructive pulmonary disease (COPD)
among biomass fuel users than clean fuel users ( Johnson et al 2011) The available clinical data to date suggest
that cardiovascular disease diabetes chronic respiratory illness and hypertension ndash conditions all strongly
associated with exposure to HAP ndash are also risk factors for COVID-19 (World Bank 2020)
BOX 7 Impact of household air pollution on COVID-19
19Cooking fuel adoption and use in urban slum households
Are Indiarsquos Urban Poor Using Clean Cooking Fuels Insights from Slums in Six States
Traditionally women bear a disproportionate burden in collecting and preparing biomass for cooking While this burden reduces with the use of clean cooking fuels like LPG the fuel supply within the household is then determined by formal and monetised distribution networks involving an outlay of money (Patnaik and Jha 2020) Our data shows that womenrsquos status in the household (as heads of households)14 positively correlates with households using LPG as their primary fuel The existing literature also supports the idea that female-headed households prefer modern fuels to polluting ones (Farsi Filippini and Pachauri 2007 Rao and Reddy 2007 Kuo and Azam 2019) Other research also suggests that female-headed households are more willing to spend on LPG as a recurring expense (Kojima Bacon and Zhou 2011 Kuo and Azam 2019)
SPOTLIGHT II Womenrsquos participation in intra-household decision-making regarding LPG use
20
14 In almost half of the households surveyed the primary cook reported a female member being the head of the household The reason behind such high percentage of female-headed households could be because only the primary cook of every household (who is mostly female) was surveyed This does not mean that these households do not have any adult male members Traditionally headship refers to the head of household as the individual whose lsquoauthorityrsquo the household members recognise But this definition overlooks potential intra-household variations in the recognised authority in different realms of decision-making (Kilic Moylan and Koolwal 2020) Since cooking is a gendered activity the primary cookrsquos response to the head of household question may have been with respect to the recognised authority figure for that activity within the household
30 householdsrsquo female members place the order for LPG refills
50householdsrsquo female
members decide whether or when to purchase LPG refills
We also find that the decision of whether or when to purchase LPG refills is made by male members in half of urban slum households This holds for both male- and female-headed households In LPG-using households where the primary cook is involved in an income-generating activity more women are deciding to order the refills This pattern is similar irrespective of whether the household uses LPG exclusively or stacks it with other polluting fuels or are PMUY beneficiaries
SPOTLIGHT III A comparison of access to clean cooking energy between urban slum and non-slum households across six states
21
At the state level Bihar has significantly poor involvement of women in intra-household decision-making regarding
ordering refills with less than 10 per cent of households reporting that women decide whether or when to order
refills However more women than men are involved in decisions around LPG refills in Rajasthan Madhya Pradesh
and Jharkhand
Across caste groups the involvement of women is lowest (37 per cent) among the Scheduled Castes (SCs)
However more women in General and OBC households decide when to order LPG refills
BOX 8 Variations in intra-household decision-making across states and caste groups
Cooking fuel adoption and use in urban slum households
To compare the fuel use patterns of urban slum and non-slum households we used data from the India Residential Energy Survey (IRES 2020)15 The overlap in the sampling strategies of both IRES and our survey enabled a comparison of the findings There is a significant difference in the socio-economic status of slum and non-slum households which tends to affect their fuel use patterns Table 4 provides a comparison of cooking fuel usage in urban non-slum households (from IRES 2020) and urban slum households (Cooking Energy Access and Use survey 2020)
Are Indiarsquos Urban Poor Using Clean Cooking Fuels Insights from Slums in Six States22
Table 4 The poor economic condition of households in urban slums impacts the exclusive use of clean fuels for cooking
Source Authorsrsquo analysis
Fuel use categories Urban slum households (Cooking Energy Access Survey) ()
Non-slum urban households (IRES) ()
95 88
84 55
9 33
5 12
Clean fuel users (LPG PNG and electricity)
LPG as an exclusive fuel
Households that stack LPG with polluting fuels
Households that use only polluting fuels
We observed a significant gap in the exclusive use of LPG as a cooking fuel between urban slums and non-slum households explained mainly by the difference in their economic conditions Stacking is three times more common in slum households than non-slum households About 45 per cent of non-slum households using polluting fuels belong to marginalised social groups (SCs and STs) Households using polluting fuels have a lower median monthly expenditure than others and about 62 per cent of such households are semi-pucca or kuchha structures Among LPG users non-slum households have a slightly higher rate of doorstep delivery as compared to slum households
LPG-using households receiving home deliveries
Source Authorsrsquo analysis
239
6372
Urban slum households (Cooking Energy Access and Use)
()
Non-slum urban households (IRES)
()
Proportion of PMUY beneficiaries among LPG-using households
15 IRES 2020 was conducted in 21 large states of India including Bihar Jharkhand Rajasthan Madhya Pradesh Uttar Pradesh and Chhattisgarh While IRES 2020 focused on urban households the Cooking Energy Access and Use survey specifically attended to urban slums in the same districts Refer to the technical note for a detailed methodology of the survey
23
3 Way forward
Slums across the world are chronically ignored in public policy and suffer because of unauthorised and unsafe habitation without access to government services (Shahadat
Lipu and Bhuiyan 2014) In terms of energy access while we see a progressive change in householdsrsquo energy use patterns as we move from rural to urban issues like affordability availability preference and familiarity with the fuel and stove remain essential factors that determine householdsrsquo fuel choice
Image iStock
Are Indiarsquos Urban Poor Using Clean Cooking Fuels Insights from Slums in Six States24
Understanding categories of users is important for enabling access to and use of clean cooking fuels
We categorised the urban slum population based on their fuel usage patterns ndash using only clean fuels stacking clean fuels with polluting fuels and using only polluting fuels While most households in urban slums have an LPG connection only half of them use LPG exclusively The householdrsquos economic status and its access to doorstep delivery of LPG refills are two crucial factors that determine its ability to use LPG exclusively Despite being situated in urban areas 37 per cent of slum households do not receive home delivery of cylinders ndash availability is an essential factor in determining the householdrsquos likelihood of using LPG exclusively There is a strong impetus for the OMCs and distributors to improve their home delivery services of LPG refills in slum areas
Stacking is prevalent in about one-third of households ndash there is a need for a deeper understanding of householdsrsquo preferences fuel end-uses and awareness Most households reported using polluting fuels daily or at least weekly this effectively increases their exposure to household air pollution despite having access to clean cooking fuels Among households that stack LPG with polluting fuels the reasons for stacking differ ndash affordability seasonality and taste preference More than a quarter of households that stack have a similar level of LPG consumption as those that use LPG exclusively despite similar family sizes Such households use polluting fuels not because of their inability to afford LPG But other factors like free-of-cost availability of biomass taste preference for chulha and alternate end-uses of fuelmdashfor instance in space heatingmdashinfluence the householdrsquos decision to use solid fuels Among households that stack multiple fuels the use of polluting fuels increases during winter months this exposes the households to a double burden of high ambient and household air pollution in these months About 40 per cent of these households also use polluting fuels for non-cooking purposes like heating water for bathing and space heating especially in winter
Even with large-scale government initiatives like PMUY we find that more than 10 per cent of urban slum households do not use LPG They mainly rely on free-of-cost biomass for their cooking and non-cooking needs Despite awareness of PMUY among these households the high upfront cost of procuring an LPG connection and high recurring expenditure on refills deter them from using LPG Evidently there is a need to expand the reach of PMUY to cover households across slums
Integrating the issue of lack of access to clean cooking energy within the discussion on urban poverty
This study reiterates the need to look at poverty in urban areas in the context of energy access Given the heterogeneity of poverty in urban and semi-urban India it is essential to understand energy poverty in the context of access to resources for an enhanced quality of life for the urban poor Similarly slums dwellers in large and small cities alike may experience additional challenges of access Furthermore not all urban poor live in slums we know even less about the access issues of temporary residents or seasonal migrants in urban India Therefore in a rapidly urbanising India studies on the urban poor and air quality need to integrate a focus on energy access to address the vulnerability of women children and communities to HAP and the drudgery of using polluting fuels for cooking and other household energy needs
Access to clean cooking energy schemes must be integrated into the social assistance programmes focused on urban poverty alleviation to enhance its reach
25Way forward
Converging energy access in social protection policies for the urban poor
Accounting for the vulnerabilities of the urban poor is crucial in designing and implementing policies including social protection schemes As a health and economic imperative access to clean cooking energy schemes must be integrated into the social assistance programmes of other ministries (eg health education and nutrition assistance) to offer better support to slum households This would also reduce the burden on households of claiming and accessing multiple benefits across schemes thus freeing them to invest more time in productive activities (CEEW 2020) Government programmes such as the National Urban Livelihoods Mission and social service allocations for housing should use existing targeting approaches to include access to clean cooking energy within the ambit of services for the poor
Bringing a renewed emphasis on clean cooking energy access due to COVID-19 is essential
Most households in urban slums rely on daily wage labour or the gig economy for their household income During the COVID-19 pandemic these occupations have been among the worst impacted by the lockdown and the economic slowdown A survey conducted with over 2000 daily wage workers in urban slums during the lockdown suggests that only 7 per cent of respondents from this group received pay during the lockdown (Basu 2020) causing a massive shock to their livelihoods and wage earnings This kind of impact pushes households into energy poverty leading to the increased use of free-of-cost biomass and consequently increasing the risk of exposure to emissions from fuel burning While the government has committed to supplying up to three free refills to all PMUY households under PM-Garib Kalyan Yojana less than a quarter of households in urban slums have Ujjwala connections The low share of PMUY households effectively makes the majority of slum households ineligible for relief support given under the PM-Garib Kalyan Yojana during the lockdown There is a need to target vulnerable households ndash beyond PMUY beneficiaries ndash with differential subsidy support for using LPG in a sustained manner
Increased poverty would mean increased use of polluting fuels ndash there is a need for a renewed emphasis on clean cooking energy access during the COVID-19 pandemic as increased use of polluting fuels has health implications (lower respiratory infections and COPD) that increase the risk of COVID-19 infections being more severe
There is a need to target vulnerable households ndash beyond PMUY beneficiaries ndash with differential subsidy support for using LPG in a sustained manner
Are Indiarsquos Urban Poor Using Clean Cooking Fuels Insights from Slums in Six States
Balakrishnan Kalpana Sagnik Dey Tarun Gupta R S Dhaliwal Michael Brauer Aaron J Cohen Jeffrey D Stanaway et al 2019 ldquoThe Impact of Air Pollution on Deaths Disease Burden and Life Expectancy Across the States of India The Global Burden of Disease Study 2017rdquo The Lancet Planetary Health 3 (1) e26ndash39 httpsdoiorg101016S2542-5196(18)30261-4
Baqir M S K Bharti R Kothari and R P Singh 2019 ldquoAssessment of an Energy-efficient Metal Chulha for Solid Biomass Fuel and Evaluation of its Performancerdquo International Journal of Environmental Science and Technology 16 (11) 6773ndash6784 httpsdoiorg101007s13762-018-2028-9
Basu Anika Badyal 2020 ldquoLockdown Survey How The Covid-19 Crisis Has Affected Daily Wage WorkersmdashAIFrdquo American India Foundation June 28 httpsaiforglockdown-survey-how-the-covid-19-crisis-has-affected-daily-wage-workers
Butera F M P Caputo R Adhikari and A Facchini 2016 ldquoThe Challenge of Energy in Informal Settlements A Review of the Literature for Latin America and Africardquo Procedia Engineering 1ndash32 httpswwwenelfoundationorgcontentdamenel-foundtopic-downloadThe challenge of Energy in Informal settlementspdf
CEEW 2020 ldquoEnergy Safety Nets India Case Studyrdquo Vienna Sustainable Energy for All httpswwwceewinpublicationsenergy-safety-nets-india-case-study
Central Pollution Control Board 2014 ldquoNational Air Quality Indexrdquo New Delhi Central Pollution Control Board httpsappcpcbccrcomccr_docsFINAL-REPORT_AQI_pdf
Chafe Z S Mehta and K R Smith 2011 ldquoAmbient Fine Particulate (PM25) Air Pollution Attributable to Household Cooking Fuel in Asiardquo AGUFM A54Bndash03 httpsuiadsabsharvardeduabs2011AGUFMA54B03Cabstract
Chandramouli C 2010 ldquoCensus of India 2011 ndash Circular No 8rdquo New Delhi Ministry of Home Affairs httpscensusindiagovin2011-CircularsCircularsCircular-08pdf
Chandrasekhar S and Arup Mitra 2018 ldquoMigration Caste and Livelihood Evidence from Indian City-slumsrdquo Urban Research amp Practice 12 (2) 156ndash172 httpsdoiorg1010801753506920181426781
Cheng Chao Yo and Johannes Urpelainen 2014 ldquoFuel Stacking in India Changes in the Cooking and Lighting Mix 1987ndash2010rdquo Energy 76 (November) 306ndash317 httpsdoiorg101016jenergy201408023
Chowdhary Sourangsu Sagnik Dey Sarath Guttikunda Ajay Pillarisetti Kirk R Smith and Larry Di Girolamo 2019 ldquoIndian annual ambient air quality standard is achievable by completely mitigating emissions from household sourcesrdquo Proceedings of the National Academy of Sciences 116 (22) 10711-10716 httpsdoiorg101073pnas1900888116
Dhingra Chhavi Shikha Gandhi Akanksha Chaurey and P K Agarwal 2008 ldquoAccess to Clean Energy Services for the Urban and Peri-Urban Poor A Case-study of Delhi Indiardquo Energy for Sustainable Development 12 (4) 49ndash55 httpsdoiorg101016S0973-0826(09)60007-7
Farsi Mehdi Massimo Filippini and Shonali Pachauri 2007 ldquoFuel Choices in Urban Indian Householdsrdquo Environment and Development Economics 12 (6) 757ndash774 httpsdoiorg101017S1355770X07003932
References
26
Frontera Antonio Lorenzo Cianfanelli Konstantinos Vlachos Giovanni Landoni and George Cremona 2020 ldquoSevere Air Pollution Links to Higher Mortality in COVID-19 Patients The lsquoDouble-Hitrsquo Hypothesisrdquo Journal of Infection 81 (2) 255ndash259 httpsdoiorg101016jjinf202005031
Ganguly Tanushree Kurinj L Selvaraj Sarath K Guttikunda 2020 ldquoNational Clean Air Programme (NCAP) for Indian cities Review and outlook of clean air action plansrdquo Atmospheric Environment X Vol 8 httpsdoiorg101016jaeaoa2020100096
GNESD 2008 ldquoClean Energy for the Urban Poor An Urgent Issuerdquo Accessed 25 July 2020 httpswwwgooglecomurlsa=tamprct=jampq=ampesrc=sampsource=webampcd=ampved=2ahUKEwi1hf2ru dntAhUCOisKHQH7BtsQFjAAegQIAxACampurl=http3A2F2Fwwwgnesdorg2F-2Fmedia2FSites2FGNESD2FPublication- pdfs2FSPM_CleanEnergyashx3Fla3Dda26hash3DE4971C585B6798F17954F8B42E073 D9507F42A84ampusg=AOvVaw08kCDgOkTkYc6wRDxzsNyq
Guan Wei-Jie Wen-Hua Liang Yi Zhao Heng-Rui Liang Zi-Sheng Chen Yi-Min Li Xiao-Qing Liu et al 2020 ldquoComorbidity and its Impact on 1590 Patients with COVID-19 in China A Nationwide Analysisrdquo European Respiratory Journal 55 (5) 2000547 httpsdoiorg1011831399300300547-2020
Harish Santosh Kirk R Smith Sourangsu Chowdhury Zoe A Chafe Ajay Pillarisetti Jos Lelieveld Sarath Guttikunda Sagnik Dey and Andrew P Grieshop 2019 ldquoThe Contribution of Household Fuels to Ambient Air Pollution in India A Comparison of Recent Estimates Edited by CcapcOrgInrdquo Collaborative Clean Air Policy Centre May 30 httpsccapcorginpolicy-briefs2019530the-contribution-of-household-fuels-to-ambient-air-pollution-in-india-a-comparison-of-recent-estimates
Jain Abhishek Saurabh Tripathi Sunil Mani Sasmita Patnaik Tauseef Shahidi and Karthik Ganesan 2018 ldquoAccess to Clean Cooking Energy and Electricity Survey of States 2018rdquo New Delhi CEEW httpswwwceewinsitesdefaultfilesCEEW-Access-to-Clean-Cooking-Energy-and-Electricity-11Jan19_0pdf
Johnson Priscilla Kalpana Balakrishnan Padmavathi Ramaswamy Santu Ghosh Muthukumar Sadhasivam Omprakash Abirami Bernard W C Sathiasekaran Kirk R Smith Vijayalakshmi Thanasekaraan and Arcot S Subhashini 2011 ldquoPrevalence of Chronic Obstructive Pulmonary Disease in Rural Women of Tamilnadu Implications for Refining Disease Burden Assessments Attributable to Household Biomass Combustionrdquo Global Health Action 4 (1) 7226 httpsdoiorg103402ghav4i07226
Kilic Talip Heather Moylan and Gayatri Koolwal 2020 ldquoGetting the (Gender-disaggregated) Lay of the Land Impact of Survey Respondent Selection on Measuring Land Ownership and Rightsrdquo Washington DC The World Bank httpsdoiorg1015961813-9450-9151
Kojima Masami Robert Bacon and Xin Zhou 2011 ldquoWho Uses Bottled Gas Evidence from Households in Developing Countriesrdquo The World Bank Sustainable Energy Department Oil Gas and Mining Unit httpelibraryworldbankorgdoibook1015961813-9450-5731
Kuo Ying-Min and Mehtabul Azam 2019 ldquoHousehold Cooking Fuel Choice in India 2004ndash2012 A Panel Multinomial Analysisrdquo IZA Discussion Paper No 12682 httpsssrncomabstract=3468630
Lippi Giuseppe and Brandon Michael Henry 2020 ldquoChronic Obstructive Pulmonary Disease Is Associated with Severe Coronavirus Disease 2019 (COVID-19) COPD and COVID-19rdquo Respiratory Medicine 167 105941 httpsdoiorg101016jrmed2020105941
Ministry of Housing and Urban Affairs 2019 ldquoHandbook of Urban Statisticsrdquo New Delhi Government of India httpmohuagovinpdf5c80e2225a124Handbook of Urban Statistics 2019pdf
Rao M Narasimha and B Sudhakara Reddy 2007 ldquoVariations in Energy Use by Indian Households An Analysis of Micro Level Datardquo Energy 32 (2) 143ndash153 httpsdoiorg101016jenergy200603012
27References
Are Indiarsquos Urban Poor Using Clean Cooking Fuels Insights from Slums in Six States28
National Buildings Organisation 2013 ldquoState of Slums in India a Statistical Compendium 2013rdquo New Delhi Government of India httpnbonicinpdfSlums_in_India_Compendium_English_Versionpdf
National Sample Survey Office 2012 ldquoKey Indicators of Urban Slums in India ndash 69th Roundrdquo New Delhi National Data Bank for Socio-religious Categories httpmospinicinsitesdefaultfilesnational_data_bankndb-rpts-69htm
Nolan Laura B 2015 ldquoSlum Definitions in Urban India Implications for the Measurement of Health Inequalitiesrdquo Population and Development Review 41 (1) 59ndash84 httpsideasrepecorgablapopdevv41y2015i1p59-84html
Nolan Laura B David E Bloom and Ramnath Subbaraman 2018 ldquoLegal Status and Deprivation in Urban Slums Over Two Decadesrdquo HHS Public Access 53 (15) 47ndash55
Patel Amit 2020 ldquoPreventing COVID-19 Amid Public Health and Urban Planning Failures in Slums of Indian Citiesrdquo World Medical amp Health Policy 12 (3) httpsdoiorg101002wmh3351
Patnaik Sasmita and Shaily Jha 2020 ldquoCaste Class and Gender in Determining Access to Energy A Critical Review of LPG Adoption in Indiardquo Energy Research amp Social Science 67 (September) 101530 httpsdoiorg101016jerss2020101530
PPAC-CRISIL 2016 ldquoAssessment Report Primary Survey on Household Cooking Fuel Usage and Willingness to Convert to LPGrdquo New Delhi Petroleum Planning amp Analysis Cell Ministry of Petroleum and Natural Gas Government of India httpswwwppacgovinWriteReadDataReports201710310449342512219PrimarySurveyReportPPACpdf
PPAC 2019 ldquoOil Industry Information at a Glancerdquo New Delhi Ministry of Petroleum and Natural Gas Government of India httpswwwppacgovinWriteReadDataReports201912060336500305462ReadyReckonerNov2019WebVersionpdf
Rahaman Mehebub and Dipendra Nath Das 2017 ldquoNature of Slum Growth in Indian Citiesrdquo Urban India 37 (II) 100ndash116 httpswwwresearchgatenetpublication334051882_Nature_of_Slum_Growth_in_Indian_Citiesread
Rains Emily Anirudh Krishna and Erik Wibbels 2018 ldquoUrbanisation and Indiarsquos Slum Continuum Evidence on the Range of Policy Needs and Scope of Mobilityrdquo London International Growth Centre httpswwwtheigcorgwp-contentuploads201802Rains-et-al_Working-paper_coverpdf
Ranjan Rahul and Sudershan Singh 2017 ldquoEnergy Deprivation of Indian Households Evidence from NSSO Datardquo New Delhi Munich Personal RePEc Archive httpsmpraubuni-muenchende835661MPRA_paper_83566pdf
Roy Debraj Bharath Palavalli Niveditha Menon Robin King Karin Pfeffer Michael Lees and Peter M A Sloot 2018 ldquoSurvey-based Socio-economic Data from Slums in Bangalore Indiardquo Nature Publishing Group 5 1ndash9 httpsdoiorg101038sdata2017200
Saksena Sumeet P B Singh Raj Kumar Prasad Rakesh Prasad Preeti Malhotra Veena Joshi and R S Patil 2003 ldquoExposure of Infants to Outdoor and Indoor Air Pollution in Low-income Urban Areas A Case Study of Delhirdquo Journal of Exposure Science amp Environmental Epidemiology 13 219ndash30 httpsdoiorg101038sjjea7500273
Lipu Molla Shahadat Hossain and Arif Waliullah Bhuiyan 2014 ldquoElectricity Access in Urban Slum Households of Bangladesh A Case of Dhakardquo Journal of Renewable and Sustainable Energy 6 (053112) 1ndash15 httpsdoiorg10106314896697
29
Singh Rozita Xiao Wang Emmanuel Ackom and Juan Reyes 2015 ldquoEnergy Access Realities in Urban Poor Communities of Developing Countries Assessments and Recommendationsrdquo Global Network on Energy for Sustainable Development (GNESD) httpswwwgooglecomurlsa=tamprct=jampq=ampesrc=sampsource=webampcd=ampved=2ahUKEwj5nbqI wdntAhXUTX0KHZE6DboQFjAAegQIAhACampurl=https3A2F2Forbitdtudk2Ffiles2F10635 24942FEnergy_access_realities_v_final_updatedpdfampusg=AOvVaw0xNBAAo0bjLueY9FmoigKF
Singh Santosh 2014 ldquoThe Kaleidoscope of Cooking Understanding Cooking Behaviour and Stove Preferences in Rural Indiardquo New Delhi Deutsche Gesellschaft fuumlr Internationale Zusammenarbeit (GIZ) GmbH httpswwwgizdeendownloadsgiz2014-en-kaleidoscope-of-cooking-indiapdf
Smith Kirk R and Ajay Pillarisetti 2017 ldquoHousehold Air Pollution from Solid Cookfuels and its Effects on Healthrdquo Disease Control Priorities 7 (3) 133ndash52 httpsdoiorg101596978-1-4648-0522-6_ch7
UN-Habitat 2003 ldquoThe Challenge of Slums ndash Global Report on Human Settlements 2003rdquo Location of publishing London UN-Habitat httpsunhabitatorgthe-challenge-of-slums-global-report-on-human-settlements-2003
Wang Bolin Ruobao Li Zhong Lu and Yan Huang 2020 ldquoDoes Comorbidity Increase the Risk of Patients with COVID-19 Evidence from Meta-analysisrdquo Aging 12 (7) 6049ndash6057 httpsdoiorg1018632AGING103000
WHO 2014 ldquoWHO Guidelines for Indoor Air Quality Household Fuel Combustionrdquo WHO Accessed 25 July 2020 httpwwwwhointairpollutionguidelineshousehold-fuel-combustionen
World Bank 2020 ldquoThe State of Modern Energy Cooking Servicesrdquo Washington DC World Bank httpdocuments1worldbankorgcurateden937141600195758792pdfThe-State-of-Access-to-Modern-Energy-Cooking-Servicespdf
Yenneti Komali Yehua Dennis Wei and Wen Chen 2017 ldquoThe Urbanization of Poverty in India Spatio-temporal Disparities in Consumption Expendituresrdquo Geographical Review 107 (2) 360ndash383 httpsdoiorg101111j1931-0846201612167x
References
Are Indiarsquos Urban Poor Using Clean Cooking Fuels Insights from Slums in Six States
Annexure 1 Asset ownership index We used Filmer and Pritchettrsquos (2001) proposed approach to construct an asset ownership index using principal component analysis (PCA) We chose the indicators based on data from the Cooking Energy Access survey 2020 The variables we considered for the index were based on classifications by Caroline Moser and Andrew Felton (2007) and K Harttgen (2013) We computed the asset index using housing characteristics and consumer durables as follows
Variables not included in the asset index
Four types of variables were eliminated
1 Variables (such as grid electricity) that had high usage of greater than 95 per cent
2 Those (such as ownership of laptops or computers air conditioners etc) that had a low usage of less than 5 per cent
3 Variables (like house ownership) that have economically fluctuating values
4 Those that indicated a low correlation of less than 20 per cent variation between the top category (ie first) of the asset quintile and the bottom-most category (ie fifth) of the asset quintile
For ease of interpretation we rescaled this index such that the final index values range between 0 and 10 For this purpose we used a feature scaling (or minndashmax scaling) formula
Xnorm (or (IVx)) = (X ndash Xmin)(Xmax ndash Xmin)
where IVx is the normalised index value Xmin is the initial minimum value (-354) and Xmax is the initial maximum value (461) of the asset ownership index
30
Annexures
bull Crowding16 inside the house bull Toilet ownership and usage bull Source of water bull Number of pucca rooms
bull Ownership of two-wheeler bull Ownership of washing machine bull Ownership of television bull Ownership of refrigerator bull Ownership of cooker
16 A household with more than three members occupying a single room is considered crowded (World Health Organization 2018)
Housing characteristics
Consumer durables
Annexure 2 Explaining the use of LPG as the exclusive fuel (simple logistic regression model)
31Annexures
Dependent variable exclusive LPG use
Education of the primary cook (categorical base category is education beyond the school level)
Education of the household head (categorical base category is education beyond the school level)
State (categorical base category includes households from Rajasthan)
P gt z 95 confidence interval
Odds ratio (SE)
1299 (0112)
0659 (0202)
1399 (0394)
0970 (0038)
0994 (0011)
1003 (0013)
2042 (0508)
1011 (0046)
0782 (0441)
1198 (0608)
1377 (0664)
1345 (0566)
3141 (1103)
1213 (0500)
0309 (0211)
1165 (0565)
1703 (0680)
0002
0174
0233
0446
0583
0839
0004
0812
0663
0722
0507
0482
0001
0639
0086
0753
0182
1097
0361
0806
0898
0973
0977
1254
0924
0259
0443
0535
0589
1578
0541
0081
0450
0779
1540
1203
2428
1048
1016
1029
3327
1106
2361
3240
3545
3070
6251
2720
1181
3014
3723
Asset index
Primary cook involved in income-generating activity
Female-headed households
Household size
Age of household head
Age of primary cook
Doorstep delivery of LPG cylinders
PMUY customer
Primary cook is not educated
Primary cook has a school education
Household head is not educated
Household head has a school education
Uttar Pradesh
Bihar
Chhattisgarh
Jharkhand
Madhya Pradesh
Number of households (n) = 417
Log likelihood = -228777
Prob gt chi2 = 0000
Pseudo R2 = 0126
The dependent variable is a dummy variable where households using LPG exclusively are assigned a value of 1 and all other households are assigned the value of 0
The caste of the household has not been factored into the regression as a separate variable because of its underlying influence on economic status
Source Authorsrsquo analysis
Are Indiarsquos Urban Poor Using Clean Cooking Fuels Insights from Slums in Six States
Annexure 3 Air quality (PM25 concentration in μgm3) across 15 districts based on CAAQMS data
32
Dis
tric
tsM
ar-1
9A
pr-1
9M
ay-1
9Ju
n-19
Jul-1
9A
ug-1
9Se
p-19
Oct
-19
Nov
-19
Dec
-19
Jan-
20Fe
b-20
Mar
-20
794
5
988
5
866
7
-
645
329
2
453
7
388
1
769
1
886
4
661
5
950
9
834
4
-
823
4
611
7
569
9
535
7
-
270
4
589
4
571
5
293
1
705
4
839
2
614
9
970
1
826
8
-
844
9
622
1
597
1
564
0
-
235
3
414
3
619
1
414
3
653
9
834
7
568
8
104
90
739
8
-
894
9
630
9
342
2
450
4
-
476
465
2
474
6
429
2
592
3
566
1
-
674
6
531
4
501
5
568
7
450
8
-
320
3
-
846
506
3
349
5
332
4
369
1
387
2
-
430
4
393
6
353
7
446
2
406
8
335
2
339
1
-
102
9
497
2
261
8
269
1
431
4
294
1
-
351
6
277
3
-
336
5
315
5
248
3
392
8
149
7
144
9
462
3
270
5
331
3
273
4
276
0
106
6
391
7
326
2
-
368
6
625
3
875
2
101
64
521
2
183
1
380
4
556
2
544
1
558
2
102
24
104
33
156
44
128
73
146
62
137
71
109
14
183
70
201
80
896
7
190
1
457
7
581
2
583
5
815
4
135
00
126
41
239
94
208
15
158
51
221
86
121
35
192
46
218
43
848
0
205
2
448
5
509
4
582
0
704
5
177
01
613
1
244
01
215
80
136
87
230
54
964
2
201
52
122
30
725
5
120
6
435
4
454
7
481
2
111
37
147
45
537
3
175
53
162
86
111
21
170
08
583
8
132
10
866
2
513
1
112
5
511
3
507
5
511
8
879
4
120
22
502
1
135
53
116
39
994
7
120
45
410
5
792
1
674
8
326
3
177
6
385
0
408
5
335
9
497
2
594
2
429
9
673
2
547
5
540
8
559
4
Gay
a
Muz
affa
rpur
Pat
na
Bho
pal
Satn
a
Alw
ar
Ajm
er
Ud
aip
ur
Ag
ra
Bul
and
shah
r
Hap
ur
Gha
ziab
ad
Gre
ater
Noi
da
Mee
rut
Noi
da
Sour
ce C
onti
nuou
s am
bien
t air
qua
lity
mon
itor
ing
stat
ion
(Mar
ch 2
019
ndash M
arch
202
0)
In a rapidly urbanising India it would be imperative for policymakers and practitioners in energy and urban development sector to integrate access to clean cooking energy within the ambit of services for the urban poor
Image CEEW
Are Indiarsquos Urban Poor Using Clean Cooking Fuels Insights from Slums in Six States
COUNCIL ON ENERGY ENVIRONMENT AND WATER (CEEW)
Sanskrit Bhawan A-10 Aruna Asaf Ali Marg Qutab Institutional AreaNew Delhi - 110 067 IndiaT +91 11 4073 3300
infoceewin | ceewin | CEEWIndia
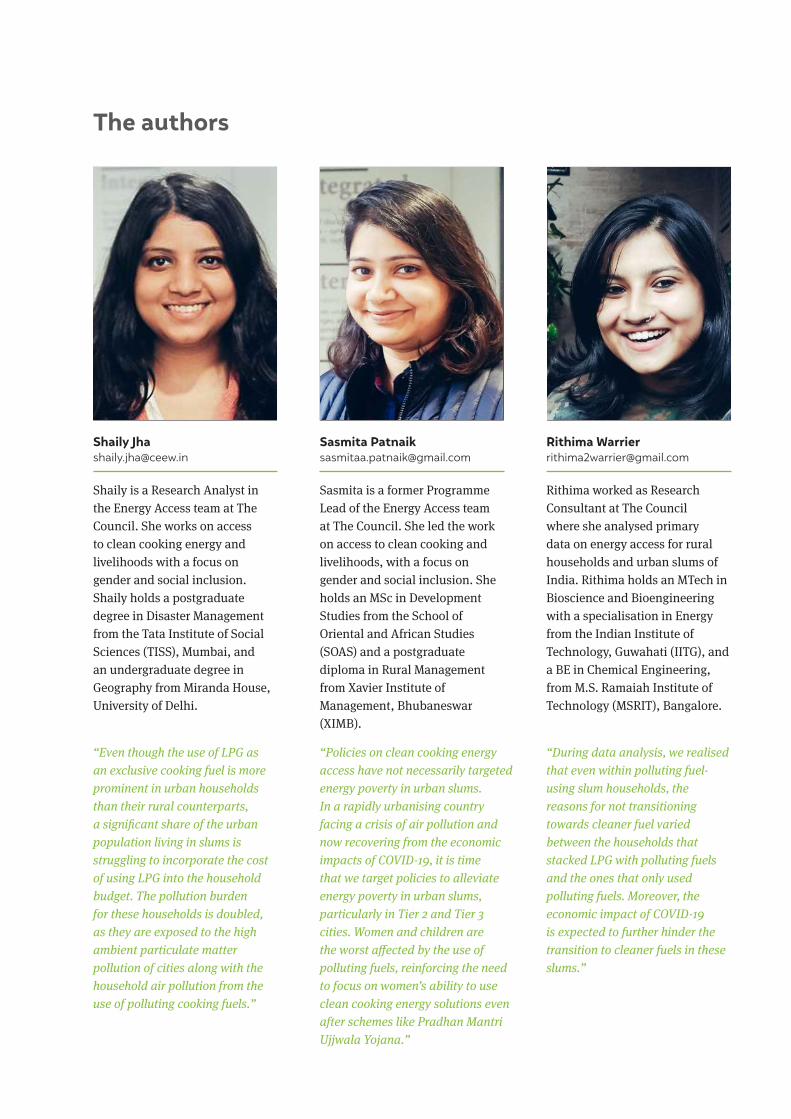
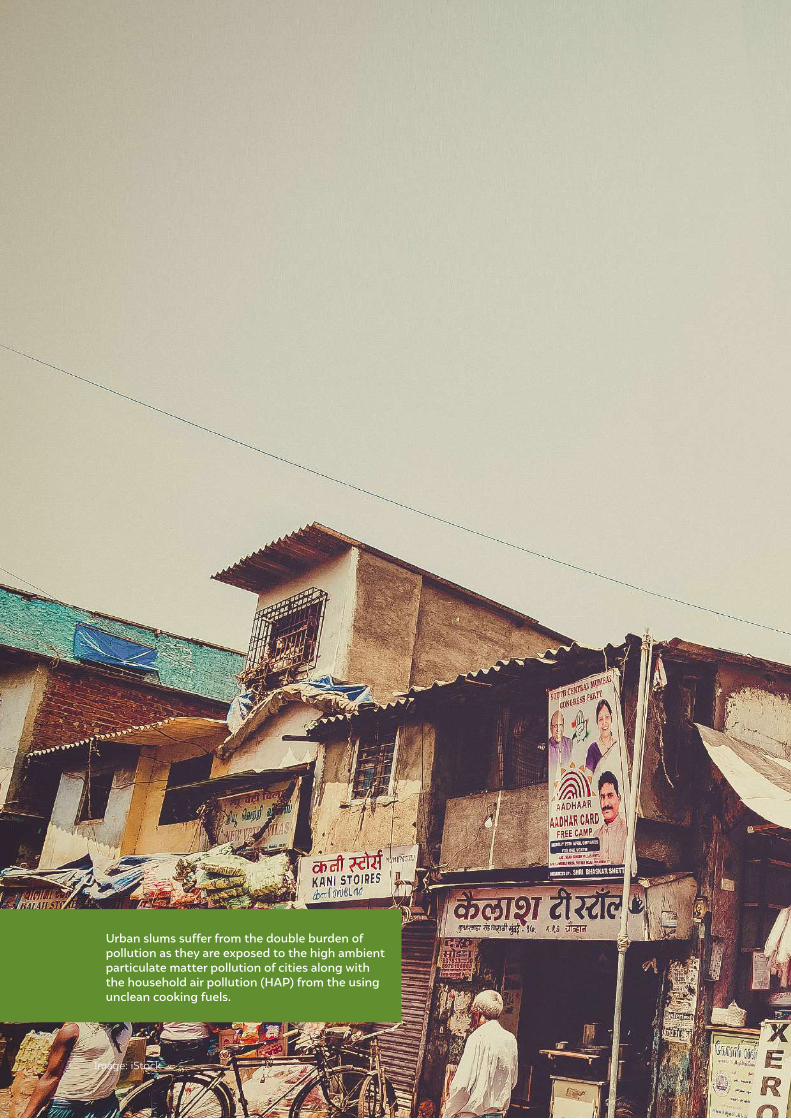
Are Indiarsquos Urban Poor Using Clean Cooking Fuels Insights from Slums in Six States
Image iStock
Urban slums suffer from the double burden of pollution as they are exposed to the high ambient particulate matter pollution of cities along with the household air pollution (HAP) from the using unclean cooking fuels
Contents
Executive summary
Annexures
References
2 Cooking fuel adoption and use in urban slum households
21 Households using LPG as their only fuel 22 Households stacking LPG with polluting fuels 23 Households using only polluting fuels
SPOTLIGHT I Household air pollution (HAP) in urban slums
SPOTLIGHT II Womenrsquos participation in intra-household decision-making regarding LPG use
SPOTLIGHT III A comparison of access to clean cooking energy between urban slum and non-slum households across six states
3 Way forward
11 Motivation and methodology 12 Socio-economic characteristics of the urban slums of the six states
1 Introduction state of Indiarsquos urban slums 1
7
17
20
21
23
26
30
24
8
1116
i
Are Indiarsquos Urban Poor Using Clean Cooking Fuels Insights from Slums in Six States
Tables
Table 1 Sample allocation across urban slums
Table 2 Less than one-third of urban slum households reported income from salaried jobs
Table 3 Scheduled Castes and Scheduled Tribes have the lowest economic status
Table 4 The poor economic condition of households in urban slums impacts the use of clean fuels exclusively for cooking
Figures
Figure ES1 To reduce the health impacts from HAP households that are stacking with polluting fuels will need to transition to exclusive use of clean cooking fuels
Figure ES2 While stacking is highest among the middle categories (second and third quintile) it is prevalent across all asset quintiles including the highest one
Figure 1 Within slums there are considerable state-level variations in householdsrsquo fuel usage patterns across states
Figure 2 While the majority of LPG-using households use the fuel primarily only half of them use it exclusively
Figure 3 Most households using LPG exclusively acquire six to eight cylinders per year
Figure 4 Of the households that stack fuels most use LPG as their primary fuel
Figure 5 Stacking is prevalent in households across asset quintile categories
Figure 6 Almost half of the households using polluting fuels use it every day
Figure 7 Proportion of urban slum households using solid fuels as the primary cooking fuel increases during the winters months aggravating householdsrsquo air pollution exposure due to unfavourable atmospheric conditions
Figure 8 Lack of awareness about receiving LPG refill subsidies poses a threat to the success of LPG subsidy schemes
Figure 9 More than half of the households currently without LPG do not know how to get a connection or whom to ask about it implying a lack of awareness
5
5
3
22
ii
iii
8
8
9
11
12
13
14
15
16
Acronyms
BPL below poverty line
CAAQMS continuous ambient air quality monitoring stations
COPD chronic obstructive pulmonary disease
COVID coronavirus disease
DALY disability-adjusted life year
DBTL Direct Benefit Transfer scheme for LPG
HAP household air pollution
IRES India Residential Energy Survey
LPG liquified petroleum gas
NSSO National Sample Survey Office
OBC Other Backward Castes
OMCs oil and marketing companies
PMUY Pradhan Mantri Ujjwala Yojana
SC Scheduled Caste
SDI socio-demographic index
ST Scheduled Tribes
Are Indiarsquos Urban Poor Using Clean Cooking Fuels Insights from Slums in Six States
Image iStock
To reduce the health impacts from household air pollution slum households that are stacking polluting fuels will need to transition using clean cooking fuels exclusively
With increased urbanisation India is experiencing acute air pollution in its urban centres Slum dwellers are doubly affected both by the higher concentration of
particulate matter in urban areas as well as indoor air pollution from the use of unclean cooking fuels With more than 137 million people living in slums in country (Census 2011) there is a strong impetus to understand the use of clean cooking fuels in such households Existing literature on energy access and use in slums across developing countries assume that energy infrastructure is available in these settlements as they are situated in urban environments (Butera et al 2016) Household air pollution (HAP) has an estimated average contribution of 30ndash50 per cent to ambient air quality across Indiarsquos urban and rural areas (Balakrishnan et al 2019) Addressing biomass burning for cooking water heating and space heating during the winters has the potential to help reach the national ambient air quality standards (Chowdhury et al 2019)
However our analysis shows that a large share of these households do not have access to clean fuels due to lack of afforability or patchy supply In this brief we discuss access to clean cooking energy in urban slums across six states (Bihar Uttar Pradesh Rajasthan Madhya Pradesh Jharkhand and Chhattisgarh) These states have a low socio-demographic index and a high disease burden due to air pollution (Balakrishnan et al 2019) The findings of this brief are based on a primary survey conducted in rural areas and urban slums in these states ndash Cooking Energy Access Survey 20201 The analysis focuses on the fuel use patterns of households the extent of use of LPG and solid fuels fuel stacking behaviour and the primary cookrsquos perception of various cooking fuels and their health impacts
Slum households vary widely in their use of clean cooking fuels Therefore to understand their cooking energy use patterns better we categorised these households into three groups
Using clean fuels exclusively
Stacking clean fuels with polluting fuels and
Using only polluting fuels
Use of LPG as primary fuel
82 (Cooking Energy Access Survey 2020)
47 (Census 2011)
Polluting fuel as primary fuel
16 (Cooking Energy Access Survey 2020)
52 (Census 2011)
i
Executive summary
1 This has been referred as lsquoour surveyrsquo thereafter
In this brief the use of clean cooking fuels is considered synonymous to use of LPG
Are Indiarsquos Urban Poor Using Clean Cooking Fuels Insights from Slums in Six States
1 Households using LPG as their only fuelWhile most urban slum households have an LPG connection exclusive use of LPG is limited to just over half of the total households The householdrsquos economic status (measured through asset ownership) and their access to doorstep delivery of LPG refills are two critical factors that determine their ability to use LPG exclusively We found that households with higher asset ownership have significantly higher odds of using LPG as an exclusive fuel
2 Households stacking LPG with polluting fuelsAlthough schemes like Pradhan Mantri Ujjwala Yojana (PMUY) have helped increase LPG adoption this has not resulted in the complete replacement of biomass-based fuels Despite 86 per cent of households having an LPG connection the data shows that over a third of slum households are stacking with polluting fuels (including firewood dung cakes agriculture residue charcoal and kerosene) Most of these households use polluting fuels daily or at least weekly which increases their exposure to household air pollution
Among the households stacking LPG with polluting fuels the reasons for stacking vary affordability free-of-cost availability of biomass seasonality and taste preferences Across asset quintiles we find that stacking is highest among the middle categories (second and third quintile) though most households in these categories have adopted LPG Still the affordability of the fuel remains a significant concern One-fourth of households who are stacking polluting fuels have a median annual refill rate of eight cylinders and above (same as exclusive LPG users) despite having a similar household size as those using LPG exclusively Most of such households fall in the wealthiest asset quintiles and use a chulha (mud stove) for cooking chapatis or vegetables suggesting that they are not necessarily using unclean fuels due to the unaffordability of LPG but due to other factors like taste
ii
Figure ES1 To reduce the health impacts from household air pollution (HAP) households that are stacking with polluting fuels will need to transition to exclusive use of clean cooking fuels
Source Authorsrsquo analysis
Exclusive clean fuel users
Stacking with LPG as the primary fuel
Only polluting fuel users
Stacking LPG with polluting fuels
Stacking with LPG as the secondary fuel
55
3388
12
12
63 LPG-using households receive doorstep delivery of cylinders
77
households receiving doorstep delivery of LPG cylinders are exclusive users of the fuel
Despite increased LPG adoption stacking is prevalent in more than one-third of the slum households
iiiExecutive summary
Figure ES2 While stacking is highest among the middle categories (second and third quintile) it is prevalent across all asset quintiles including the highest one
Source Authorsrsquo analysis
21 Non-cooking uses of polluting fuels Despite using LPG as the primary fuel for their cooking needs households that stack fuels use polluting fuels for non-cooking purposes like heating water for bathing (29 per cent) and space heating (10 per cent)
22 Seasonal variations in fuel use Most households (88 per cent) use LPG as their primary fuel in the rainy season while in winters less than 45 per cent of households do so The increased use of polluting fuels in winter could be because during these months the polluting fuel requirement for non-cooking tasks within the household like water heating for bathing and space heating increases ndash which leads to the increased use of polluting fuels for cooking as well Unfortunately the increased use of polluting fuels in winters exposes households to the double burden of high ambient and household air pollution due to unfavourable atmospheric conditions
21 households stacking fuels
have more than one LPG connections
25 households stacking fuels have two-cylinder connections
1 2 3 4 5
Asset quintile categories
0
20
40
60
80
100
Per
cent
age
of h
ouse
hold
s
Exclusive clean fuel users Stacking LPG with polluting fuels Only polluting fuel users
5348
52
6367
2441 37
3232
2311 11
51
Are Indiarsquos Urban Poor Using Clean Cooking Fuels Insights from Slums in Six States
3 Households using only polluting fuelsDespite large-scale government initiatives like PMUY 12 per cent of urban slum households do not use LPG and rely on polluting fuels While most of these households are aware of PMUY the high upfront LPG connection cost along with the high recurring expenditure on refills deter them from procuring an LPG connection
Way forwardWhile we see a progressive change in householdsrsquo energy-use patterns as we move from rural to urban issues like affordability availability preference seasonality and the end-uses of the fuel remain essential factors that determine household fuel choice Understanding user categories and fuel use patterns is crucial in enabling access to and sustained use of clean cooking fuels Also it is vital to recognise the implications of cooking being a gendered activity However womenrsquos participation in intrahousehold decision-making regarding LPG use is limited
Despite being in urban areas 37 per cent of slum households do not receive home delivery of cylinders ndash availability is an essential factor that determines the householdrsquos likelihood of using LPG exclusively To increase LPG use oil and marketing companies (OMCs) and distributors need to improve home delivery of LPG refills in slum areas
Emissions from household sources contribute hugely to the surrounding air quality (Harish et al 2019) which is already poor in congested slum areas Majority of households cook inside the main house without a chimney indicating high exposure to pollution from the use of unclean fuels for cooking
iv
30 householdsrsquo female members place the order for LPG refills
50 householdsrsquo female
members decide whether or when to purchase LPG refills
75 householdsrsquo
using polluting fuels cook inside
the main house
67 householdsrsquo using polluting fuels do not have a chimney for ventilation
vExecutive summary
Integrate the issue of lack of access to clean cooking energy with urban poverty This study reiterates the need to look at poverty in urban areas in the context of energy access The vulnerability of urban slum dwellers needs to be accounted for while designing and implementing policies including social protection schemes Given the health and economic impacts of pollution access to clean cooking energy schemes must be integrated with the social assistance programmes of other ministries (eg health education and nutrition assistance) to better target support for slum households Government programmes such as the National Urban Livelihoods Mission and social service allocations for housing should use existing targeting approaches to include access to clean cooking energy within their ambit of services for the poor
The economic impact from COVID-19 will push households into energy poverty leading to the increased use of free-of-cost biomass ndash consequently increasing the risk of exposure to emissions from fuel burning While the government has announced that it will provide up to three free refills under the PM-Garib Kalyan Yojana scheme to all PMUY households less than a quarter of households in urban slums have Ujjwala connections ndash effectively making them ineligible for relief support There is a need to expand the reach of PMUY to cover all slum households
Bring renewed emphasis on clean cooking during COVID-19 Increased poverty would mean increased use of polluting fuels ndash there is a need for a renewed emphasis on clean cooking energy access during the COVID-19 pandemic as increased use of polluting fuels has health implications (lower respiratory infections and coronary chronic obstructive disease (COPD)) that increase the risk of COVID-19 infections being more severe
There is a need for targeted effort to include the poor households in urban slums left out in the first phase of Ujjwala
Are Indiarsquos Urban Poor Using Clean Cooking Fuels Insights from Slums in Six States
Image iStock
Addressing biomass burning for cooking water heating and space heating during the winters has the potential to help reach the national ambient air quality standards
The Census of India (2011) estimates that India has about 137 million slum dwellers across the country However statistics on slum populations vary significantly based on how
a slum is defined (Nolan 2015) Therefore not only is there a lack of data about how many people live in slums and informal settlements but there is also limited information about living conditions in slums (Rains Krishna and Wibbels 2018) Rapid urbanisation in India has led to population spikes in urban centres Low-income households in urban areas are trapped in informal and sometimes lsquoillegalrsquo settlements with poor living conditions where access to essential services and infrastructure tends to be limited or badly deteriorated (Butera et al 2016) While slum dwellers are not a homogeneous population slum areas have high concentrations of poverty and social and economic deprivation and poor shelter and environmental conditions (UN-Habitat 2003)
1 Introduction state of Indiarsquos urban slums
1
The Census of India (2011) defines slums as ldquoresidential areas where dwellings are unfit for human habitation by
reasons of dilapidation overcrowding faulty arrangements and design of such buildings narrowness or faulty
arrangement of street lack of ventilation light or sanitation facilities or any combination of these factors which
are detrimental to the safety and healthrdquo The slums in India are officially categorised into three categories
identified recognised and notified1 (Chandramouli 2010) About 59 per cent of slum households in India are non-
notified and are not legally recognised by the government (Nolan Bloom and Subbaraman 2018)
BOX 1 Slums in India
The existing literature on energy access and use in slums across developing countries suggests that while energy infrastructure (electric grid LPG distribution system) is available in these settlements (by being urban) households cannot afford it andor the service is unreliable (frequent outages and low voltage for electricity uncertain availability of gas cylinders) (Butera et al 2016) This leads to households relying on illegal connections for electricity and using energy sources that are on the lower end of the energy ladder (such as kerosene charcoal wood and other biomass residues) for cooking (Butera et al 2016)
1 Areas notified as slums by the concerned municipalities corporations local bodies or development authorities were termed notified slums All areas recognised as lsquoSlumrsquo by State UT Administration or Local Government Housing and Slum Boards which may have not been formally notified as slum under any act While a compact area of at least 300 population or about 60-70 households of poorly built congested tenements in the unhygienic environment is termed as identified slums (National Sample Survey Office 2012)
Are Indiarsquos Urban Poor Using Clean Cooking Fuels Insights from Slums in Six States2
In India population growth and rapid urbanisation have resulted in the deepening of urban poverty and the increased growth of urban slums (GNESD 2008 Yenneti Wei and Chen 2017) As per the Census 2011 most slum dwellers are casual labourers engaged in works other than public works (ie informal sectors) as opposed to salaried employees in non-slum urban areas (National Buildings Organisation 2013) As per the National Sample Survey Office (NSSO 2011ndash2012) the average daily wage of casual labourers is as low as INR 170 in urban areas (Ministry of Housing and Urban Affairs 2019) Such households may be able to purchase cleaner and more efficient fuels whenever they can but are likely to fall back on less efficient ones when faced by budgetary constraints Studies suggest that despite the LPG subsidies provided by the government significant sections of the urban poor population are still struggling to incorporate the cost of LPG into their household budgets (R Singh et al 2015) Use of multiple fuels also provides security from price variations and unreliable service associated with a single fuel or technology (Shahadat Lipu and Bhuiyan 2014)
As per the Census 2011 only half of the urban slum households across the country use LPG as their cooking fuel the remaining rely on solid fuels and kerosene Since 2013 the LPG programme in India has undergone many modifications to improve delivery and targeting access to connections and the availability of LPG (CEEW 2020) Pradhan Mantri Ujjwala Yojana (PMUY) which focuses on tackling the high upfront cost of LPG by providing LPG connections to below poverty line (BPL) households with credit-linked subsidy support has played an instrumental role in increasing the penetration of LPG across the country As of November 2019 about 965 per cent of households in India have an LPG connection (PPAC 2019) Small towns and cities which have been experiencing a comparatively slow rate of urban growth but the high percentage of slum population mall towns and cities which have been experiencing a relatively slow rate of urban growth but a high percentage of slum population
However the dramatic increase in LPG coverage has led to increased fuel stacking (Cheng and Urpelainen 2014) The reliance on fuel stacking has significant implications as the health benefits of using clean fuels are reduced or perhaps even nullified in households that continue to use biomass (Cheng and Urpelainen 2014) Urban slums suffer from a double burden of pollution as they are exposed to high ambient particulate matter pollution in cities along with the household air pollution (HAP) from using unclean cooking fuels (WHO 2014) The Global Burden of Disease study notes that even with the substantial increase in the provision of clean cooking fuels in India more than half of Indiarsquos population is exposed to HAP from solid cooking fuels as of 2017 (Balakrishnan et al 2019) In the current context this is concerning since exposure to air pollution has been linked to developing lower respiratory infections and chronic obstructive pulmonary disease (Balakrishnan et al 2019) which are among the major risk factors for COVID-19 (Lippi and Henry 2020 Wang et al 2020)
11 Motivation and methodology While there have been various studies on energy access in rural areas there is minimal data on energy use and patterns in urban slum households Most studies on urban slums and energy access focus on specific slums in large metropolitan areas such as Delhi and Bangalore (Saksena et al 2003 Dhingra et al 2008 Roy et al 2018) Living conditions and access to resources vary across slums in smaller towns and cities compared to those in Tier I
Slum-dwellers suffer from the double burden of pollution as they are exposed to high ambient particulate matter in cities along with the HAP from using unclean cooking fuels
2 A summary measure that identifies where countries or other geographic areas fall on the spectrum of development Expressed on a scale of 0 to 1 SDI is a composite average of the countryrsquos rankings in terms of per capita income average educational attainment and fertility rates
3 These states account for six out of eight of the lowest socio-demographic index (SDI) states and exhibit the highest health impacts of household air pollution (HAP) These states also have the highest percentage of households covered under the flagship clean cooking energy programme in India ndash PMUY
4 Referred to as lsquoour surveyrsquo thereafter
5 In our sample about 82 per cent of households are from notified slums
6 About 98 per cent of the respondents were female members of the household
7 For further details on the survey sample and methodology refer to the technical document for the survey
3Introduction state of Indiarsquos urban slums
Table 1 Sample allocation across urban slums
Source Authorsrsquo compilation
Note The number of slums sampled within each state varied because the slums were picked from the same districts that were sampled under the India Residential Energy Survey (2020) across the six states This was done to ensure logistical ease in conducting both the surveys and to share the resources of the national-level survey The list of urban slums as per the Census 2011 in the districts sampled under IRES 2020 constitutes the urban sampling frame7
State Districts sampled Urban slums sampled Households surveyed
16
14
10
10
4
4
58
31
15
16
12
5
4
83
249
124
128
94
40
32
667
Uttar Pradesh
Bihar
Madhya Pradesh
Rajasthan
Jharkhand
Chhattisgarh
cities these towns have been experiencing a comparatively slow rate of urban growth but are home to large slum populations (Rahaman and Das 2017) Further existing sources on access to clean cooking energy among slum households are limited to primary fuel use and lack detailed information about fuel use and stacking patterns
In India states with the lowest socio-demographic index (SDI)2 also account for the highest level of disease burden due to air pollution (Balakrishnan et al 2019) The low SDI states in north India had some of the highest levels of ambient particulate matter and household air pollution ndash especially Bihar Uttar Pradesh Rajasthan and Jharkhand The disability-adjusted life year (DALY) rate attributable to HAP was highest in the low SDI states of Chhattisgarh Rajasthan and Madhya Pradesh (Balakrishnan et al 2019)
The findings of this brief are based on a primary survey conducted across rural areas and urban slums in six energy access deprived states in India ndash Bihar Jharkhand Uttar Pradesh Rajasthan Madhya Pradesh and Chhattisgarh3 The Cooking Energy Access Survey 20204 focused on householdrsquos clean cooking energy access and its barriers and drivers in rural areas and urban slums Based on the list of urban slums across districts in Census 2011 the survey covered 656 households across 83 urban slums (notified and non-notified)5 spread across 58 districts The survey was conducted with the primary cook of the household6
In this brief we focus on understanding access to clean cooking energy specifically across urban slum households The analysis focuses on the fuel use patterns of households the extent of use of LPG and solid fuels fuel stacking behaviour and the primary cookrsquos perception of various cooking fuels and their impact on health The results discussed below are representative of the urban slum population in six states We have refrained from state-level analysis because of the smaller sample size for urban slums in some states like Jharkhand and Chhattisgarh
Are Indiarsquos Urban Poor Using Clean Cooking Fuels Insights from Slums in Six States4
12 Socio-economic characteristics of the urban slums of the six states Non-farm casual labour is the primary source of income for more than 42 per cent of the households such households reported a median monthly expenditure of about INR 5000 In only 20 per cent of the households the primary cook is involved in income-generating activities primarily engaged in casual non-farm labour or are self-employed
Source Authorsrsquo analysis
60 households have a monthly income below
INR 10000
In 90 households all members have
Aadhar cards
94 households have a bank account
11 households are currently indebted
Median savings in the past year
INR 4000
Median monthly expenditure
INR 6000
MEDIAN HOUSEHOLD SIZE
6
5
Table 2 Less than one-third of urban slum households reported income from salaried jobs
Source Authorsrsquo analysis
Under self-employment some of the householdsrsquo report occupations like carpentry tailoring driver and priest
The primary source of income of urban slum households
Non-farmdaily wage casual labour
Private or government salaried job
Shop or own business or self-employed
Farm labour
Agriculture on own or leased land
Others (pension remittances cattle rearing none)
43
22
18
8
7
2
Scheduled Castes (SC) (30 per cent) and Other Backward Castes (OBC) (45 per cent) form the majority of the urban slum population While Scheduled Tribes (ST) constitute less than 10 per cent of the overall population a majority of them are in Madhya Pradesh and Rajasthan Less than 20 per cent of the urban slum population are from the General castes States like Bihar Jharkhand and Rajasthan have the least proportion of General castes living in slum areas
Within urban slum households OBC and General households are relatively better off economically as shown in Table 3 Occupational patterns also vary based on caste A higher proportion of OBCs and General households rely on running a business self-employment or salaried jobs for their primary source of income as compared to SC and ST households The latter are primarily engaged in farm and non-farm labour The socio-economic marginality of SCs and STs even within slums is a consequence of these communities being most deprived in terms of access to resources and education income housing etc (Chandrasekhar and Mitra 2018) We see a similar trend in our sample in education and income levels Slums often remain the permanent habitation of marginalised castes as opposed to serving as an entry point for persons from higher castes who get absorbed into relatively better jobs and eventually move out of the slums (Chandrasekhar and Mitra 2018)
Table 3 Scheduled Castes and Scheduled Tribes have the lowest economic status
Source Authorsrsquo analysis
We utilise an economic status or asset index as a measure of a householdrsquos relative wealth and economic status based on the Filmer and Pritchett (2001) approach The list of variables included in the economic status index can be found in Annexure I The index takes values between 0 and 10 where a higher value denotes a higher level of asset ownership
Caste Sample size
Mean of asset index
(Min ndash Max) of BPL cardholders
233
51
281
92
042
039
046
046
(0ndash084)
(008ndash077)
(003ndash1)
(008ndash09)
45
60
49
36
Scheduled Castes
Scheduled Tribes
Other Backward Classes
General
Introduction state of Indiarsquos urban slums
Are Indiarsquos Urban Poor Using Clean Cooking Fuels Insights from Slums in Six States652
Image iStock
Exclusive use of LPG is limited to just over half of the total slum households The householdrsquos economic status and its access to doorstep delivery of LPG refills are two critical factors that determine their ability to use LPG exclusively
7
The fuel use patterns in urban slum households across the six states show a significant improvement in LPG use over the past decade when compared with the data from
Census 2011 The share of households using polluting fuels (including firewood dung cake agriculture residue and kerosene) as their primary fuel has decreased significantly but we find that stacking is a common practice even among households using LPG as a primary fuel Unless they use clean fuels exclusively such slum households will still be exposed to the health risks associated with HAP
Across the six states the primary fuel used for cooking by slum households
For the analysis in this brief we have categorised the households into three based on their fuel choices and position on the energy ladder those that exclusively use clean cooking fuels (LPG and electricity) stack LPG with polluting fuels and use only polluting fuels The level of exposure to emissions from cooking increases from the first (least harmful) to the third category (most harmful)
2 Cooking fuel adoption and use in urban slum households
In this brief the use of clean cooking fuels is considered synonymous to use of LPG since other clean fuels comprise a negligible share of use
Source Authorsrsquo analysis
Households using clean fuel exclusivelyWhile the majority of these households use LPG two per cent of the households reported using electricity for cooking purposes
Households stacking LPG with polluting fuelsMost of these households reported using LPG as their primary fuel and polluting fuels as their secondary fuel About four per cent of slum households reported using polluting fuels as their primary fuel and LPG as their secondary fuel
Households using only polluting fuelsThese households only use firewood charcoal dung
agricultural residue kerosene or a stack of these fuels
5533
12
Fuel-use categories
Use of LPG as primary fuel
82 (Cooking Energy Access Survey 2020)
47 (Census 2011)
Polluting fuel as primary fuel
16 (Cooking Energy Access Survey 2020)
52 (Census 2011)
Are Indiarsquos Urban Poor Using Clean Cooking Fuels Insights from Slums in Six States8
In the following sections we explore factors such as socio-economic characteristics affordability and availability of fuel intra-household gender dynamics and fuel perceptions which influence the ability and likelihood of a household to use different fuels
21 Households using LPG as their only fuel In this section we focus on understanding the household characteristics and fuel use patterns of those using LPG exclusively for cooking Most urban slum households with an LPG connection report using LPG as their primary fuel While 55 per cent of the slum households (63 per cent of LPG-using households) use LPG exclusively others stack LPG with polluting fuels Uttar Pradesh has the highest
proportion (70 per cent) of slum households who are exclusive users of clean cooking fuels among the six states
Figure 1 Within slums there are considerable state-level variations in householdsrsquo fuel usage patterns across states
Source Authorsrsquo analysis
Note We have refrained from state-level analysis because of the smaller sample size for urban slums in states like Jharkhand and Chhattisgarh
Figure 2 While the majority of LPG-using households use the fuel primarily only half of them use it exclusively
Source Authorsrsquo analysis
0
0
10
10
20
20
30
30
40
40
50
50
60
60
70
70
80
80
90
90
100
100
8682
55
Bihar
LPG users
Chhattisgarh Jharkhand Madhya Pradesh
LPG as the primary fuel LPG as the exclusive fuel
Rajasthan Uttar Pradesh
States
Per
cent
age
of h
ouse
hold
s P
erce
ntag
e of
hou
seho
lds
Exclusive clean fuel users Stacking LPG with polluting fuels Only polluting fuel users
42
3
30
56
45
39
1611
40
4944
46
10 5
24
71
41
28
9Cooking fuel adoption and use in urban slum households
Over a fifth of households using LPG exclusively are PMUY households which suggests that these households have been able to transition to clean cooking fuels in less than four years PMUY households using LPG exclusively are of a relatively higher economic status than households that stack polluting fuels Unlike in rural areas the age of an LPG connection does not have a direct correlation with per capita LPG consumption in urban slum households suggesting that even households with recent LPG connections in urban slums are likely to use LPG exclusively Households in urban areas have been known to experience a direct transition to exclusive use of clean fuels from using traditional fuels (Kuo and Azam 2019) This could be due to the time-saving that comes with the adoption of clean cooking fuels like LPG ndash where urban households are more willing or need to spend more on convenience than rural households
Figure 3 Most households using LPG exclusively acquire six to eight cylinders per year
Source Authorsrsquo analysis
211 The economic status of the household determines exclusive LPG useA simple logistic regression (Annexure II) shows that households with higher asset ownership have significantly higher odds of using LPG as an exclusive fuel Even between primary and exclusive users of LPG asset ownership remains a significant differentiating factor This corroborates the findings of previous studies (Ranjan and Singh 2017) that state that households tend to switch their cooking fuel use patterns after a threshold level of income is achieved However this is not to suggest that all wealthy households shift to exclusive use of clean fuels We discuss the reasons for stacking among these households in the next section
Cooking energy in the household budget We find that households using LPG as their only fuel pay INR 496 per month8 This effectively translates to an average household spending almost eight per cent of their monthly expenses on cooking fuel
Oil and Marketing Companies (OMCs) are attempting to address the challenges around the recurring refilling
cost by encouraging low-income households to use a 5 kilograms (kg) cylinder to overcome the high upfront cost
associated with 145kg cylinders In our sample we find that only about two per cent of urban slum households use
small cylinders (5kg or 3kg)
BOX 2 Uptake of small cylinders
8 This is based on the upfront cost paid by the household for an LPG refill Given that only 40 per cent of the householdsrsquo report receiving LPG subsidy on refills ndash it has not been considered in the fuel expenditure calculation The share of fuel expenditure for the households receiving LPG subsidies would be accordingly less than the others
0
10
20
30
40
50
60
70
1
1 16 8 9
22
60
4350 50
14
34
15
2 3 4 5 6 7 8 9 10 11 12 13
Number of 14 kg LPG cylinder refills obtained by exclusive LPG users
Per
cent
age
of h
ouse
hold
s us
ing
LP
G e
xclu
sive
ly
households using LPG exclusively Median value
Are Indiarsquos Urban Poor Using Clean Cooking Fuels Insights from Slums in Six States
212 Home delivery for exclusive LPG users We find that households who receive doorstep delivery of LPG refills have higher odds of using LPG as their exclusive fuel Hassle-free doorstep delivery of LPG refills is known to influence the use of LPG as a primary secondary or exclusive fuel (PPAC-CRISIL 2016)
Additional expense on procurement of cylinders Almost half of the households who receive doorstep delivery of LPG pay an additional amount of INR 20 as a delivery charge However in households that do not receive doorstep delivery about 46 per cent report that one member must forgo their daily wages to procure the cylinder Most of such households depend on daily labour or private jobs for their income
Given that almost half of the households report having to forgo wages to procure the cylinders it could affect the householdrsquos ability to use LPG continually It may add to the average delay in the purchase of refills
Procurement of LPG cylinders during the COVID-19 pandemic Most households that do not receive doorstep delivery of LPG (58 per cent) use private vehicles (including motorcycles or bicycles) to transport LPG refills About one-third of the households procuring cylinders on their own use rented or shared vehicles The procurement constraints faced by these households would be further aggravated during the COVID-19 pandemic as using rented or shared vehicles comes with its own risks
10
About 18 per cent of the respondents in our survey reported that they resided in non-notified slums Such slums are not legally recognised as a lsquoslumrsquo by the government which makes the residents more vulnerable to eviction In our data we find that adoption and use of LPG is similar across households from notified and non-notified slums Qualitative interviews and field visits showed that most of the respondents were permanent residents of the slums who have been living there for more than 10 years
About 2 per cent of urban slum households use electricity as a source for cooking energy These households do not rely on any other fuels for cooking or non-cooking purposes They use electric stoves to prepare all meals including cooking roti rice and vegetables These households have been using electricity as their cooking fuel only in the past five years Most households report using either a coiled stove or induction stove Less than one per cent of households use other electric appliances such as hot water kettles and toasters for cooking needs
BOX 3
BOX 4
Status of slums impacting the fuel-use pattern
Electricity for cooking
77
households receiving doorstep delivery of LPG cylinders are exclusive users of the fuel
63LPG-using households receive doorstep delivery of cylinders
Male members have to travel to procure the cylinders in 87 households
11Cooking fuel adoption and use in urban slum households
About 4 per cent of urban slum households in the sample reported stacking with kerosene as their secondary fuel Most of these households are in Uttar Pradesh These households also use kerosene more than once a week for cooking
BOX 5 Use of kerosene as a cooking fuel
22 Households stacking LPG with polluting fuels Across the six states almost half of the households (45 per cent) reported using polluting fuels Here we discuss the characteristics and fuel use patterns of households that stack clean and unclean fuels
Though 86 per cent of the households surveyed have an LPG connection we find that over a third (33 per cent) of them stack it with polluting fuels (including firewood dung cakes agriculture residue charcoal and kerosene) The increased stacking could also be a result of more households adopting LPG since households tend to not replace biomass-based fuels completely (Cheng and Urpelainen 2014) These households would need to transition to exclusive use of clean cooking fuels to reduce the health impacts on women and children from household air pollution
About 44 per cent of the households that are stacking fuels rely on informal sources for refills Such households have not ordered any refills in the past one year from their LPG distributors These households mainly rely on recurring cylinders from their neighbours or relatives9
Figure 4 Of the households that stack fuels most use LPG as their primary fuel
Source Authorsrsquo analysis
9 It is important to note that sharing LPG cylinders among neighbours and extended family is a regular phenomenon in small towns and rural areas owing to availability challenges and it is not necessarily driven by an intention to siphon off subsidy amounts against the commodity ( Jain et al 2018)
Exclusive clean fuel users
Stacking with LPG as the primary fuel
Only polluting fuel users
Stacking LPG with polluting fuels
Stacking with LPG as the secondary fuel
55
3388
12
12
Are Indiarsquos Urban Poor Using Clean Cooking Fuels Insights from Slums in Six States12
221 Household factors that determine the decision to stack fuels Even within the stacking households the reason for stacking multiple fuels varies significantly Primarily households who stack can be divided into two categories ndash those that stack as they cannot afford LPG refills and those that stack due to other factors like taste preferences and alternate end-uses of the fuel
Households who are stacking primarily due to affordability concerns ndash Across asset quintiles we find that stacking is most common among the middle categories (second and third quintile) where most have adopted LPG Still the affordability of the fuel remains a significant concern More than 60 per cent of the households that are stacking fuels collect or prepare firewood or dung cakes free of cost rather than purchasing them from the market Those who buy biomass do not spend more than INR 100 per month on it Based on the responses of the primary cook we note that the high cost of LPG and free-of-cost availability of solid fuels are the most common factors that affect the fuel choices made by the household
Figure 5 Stacking is prevalent in households across asset quintile categories
Source Authorsrsquo analysis
1 2 3 4 5
Asset quintile categories
0
20
40
60
80
100
Per
cent
age
of h
ouse
hold
s
Exclusive clean fuel users Stacking LPG with polluting fuels Only polluting fuel users
5348
52
6367
2441 37
3232
2311 11
51
Households who use LPG primarily and polluting fuels as secondary fuels have a median annual refill rate of
6 cylinders
Households who use polluting fuels primarily and LPG as a secondary fuel have a median annual refill rate of
4 cylinders
13
Households that are stacking for reasons beyond affordability ndash More than one-fourth of the households that are stacking have a median annual refill rate of eight cylinders and above despite having a similar household size as others Most such households fall in the highest asset quintiles This suggests that they are not necessarily using unclean fuels due to the unaffordability of LPG but due to other factors such as taste preference for chulhas and fuel end-uses that influence the householdrsquos decision to use solidpolluting fuels Such households reported using LPG for a median period of six years The solid fuels are primarily used for cooking chapatis or vegetables in these households
Interestingly even households with multiple LPG connections and two cylinder connections report stacking with polluting fuels The possession of multiple LPG connections in these households may not necessarily be an indicator of diversion mdash the average family size of these households is more than eight indicating the high possibility of having separate kitchens within the same household Given that such households have a median annual refill rate of ten cylinders another plausible reason for multiple connections is that it prevents them from relying on just one distributor which increases their chances of getting refills whenever needed
222 End-uses of polluting fuels Across both the groups discussed above half of the households who stack with polluting fuels use these fuels at least once a day (Figure 6) Also almost 45 per cent of the households that stack fuels use multiple stoves at the same time while preparing a single meal This indicates that even if the household is using LPG for a particular meal they would be using their chulha simultaneously
Despite using LPG as the primary fuel for their cooking needs households that are stacking fuels use polluting fuels for non-cooking purposes like heating water for bathing (29 per cent) and space heating (10 per cent)
Figure 6 Almost half of the households using polluting fuels use it every day
Source Authorsrsquo analysis
0 5 10 15 20
19
11
21
20
29
25 30 35
Percentage of households
Freq
uenc
y of
use
of p
ollu
ting
fuel
s Several times a day
Once per day
Few times a week
Once a week
Occasionally
21 households stacking fuels
have more than one LPG connections
25 households stacking fuels have two-cylinder connections
Cooking fuel adoption and use in urban slum households
Are Indiarsquos Urban Poor Using Clean Cooking Fuels Insights from Slums in Six States14
223 Seasonal variations in the stacking of fuels We also noted a significant seasonal change in fuel use patterns LPG is most popular in the rainy season (88 per cent) and least popular in the winter months (45 per cent) (Figure 7) The dampness associated with solid fuels in the rainy season could be the reason for using LPG primarily during these months The literature also suggests that solid fuels are a popular choice during winter months (S Singh 2014 Baqir et al 2019) This could be because during winter months the solid fuel requirement for non-cooking tasks within the household likes water heating for bathing and space heating increases Since households are already using solid fuels for non-cooking tasks they may be using these fuels more for cooking during winter Unfortunately the increased use of solid fuels in winter exacerbates the much higher air pollution exposure of these households due to unfavourable atmospheric conditions
Figure 7 Proportion of urban slum households using solid fuels as the primary cooking fuel increases during the winters months aggravating household air pollution exposure due to unfavourable atmospheric conditions
Source Authorsrsquo analysis
About 3 per cent of urban slum households reported owning an electric water-heating device (geyser or immersion
rod) Similarly only 4 per cent of the households own an electric room heater
BOX 6 Electric devices for water heating and space heating
Summer Winter Rainy Festival0
20
40
60
80
100
120
Per
cent
age
of h
ouse
hold
s
LPG Solid fuel
78
45
88
67
22
55
1233
15
Figure 8 Lack of awareness about receiving LPG refill subsidies poses a threat to the success of LPG subsidy schemes
Source Authorsrsquo analysis
Connections under the Pradhan Mantri Ujjwala Yojana (PMUY) 23 per cent of these households reported receiving benefits under the PMUY
The six states included in the survey account for a significant share of PMUY coverage ndash 54 per cent of all connections provided under PMUY (PPAC 2019) However most of these connections cater to rural households One of the reasons for there being fewer PMUY connections in urban areas is that more than half of all urban slum households reported already having had LPG connections for over four years (before the launch of PMUY) Moreover over a quarter of PMUY households10 in urban slums reported having multiple LPG connections which suggests that not every household which was using LPG before the PMUY was prevented from accessing the schemersquos benefits
Government support during the COVID-19 pandemic During the COVID-19 lockdown the government announced the provision of three free-of-cost refills for PMUY households under the PM-Garib Kalyan Yojana While PMUY households in urban slums benefitted from this scheme non-PMUY households in urban slums did not As documented urban slum households faced a significant economic hit due to the loss of jobs and incomes during the pandemic (Patel 2020) Non-PMUY households that stack for economic reasons are more likely to use cheaper and freely available solid fuels without additional support from the government
PAHAL-Direct Benefit Transfer for LPG (DBTL)Overall about 42 per cent of active LPG users11 reported receiving a subsidy for their last LPG refill under the Direct Benefit Transfer for LPG scheme (DBTL) However about 28 per cent of urban slum households reported not knowing if they had received the subsidy amount for their last refill this suggests that the primary cook is often unaware of whether the subsidy is credited to the household Among the ones that reported receiving the LPG subsidy about 40 per cent of the primary cook were not aware of the amount of subsidy being credited into their account
10 This is a relatively smaller sample of 43 households from all the PMUY households in urban slums (131 households)
11 Households that have taken at least one refill in the past year
42
30
28
Received LPG refill subsidy
30 Still repaying PMUY loan
Did not receive LPG refill subsidy
10 Gave up LPG refill subsidy
Do not know
60 LPG refill susbsidy not received due to other reasons
Cooking fuel adoption and use in urban slum households
Are Indiarsquos Urban Poor Using Clean Cooking Fuels Insights from Slums in Six States16
23 Households using only polluting fuels About 12 per cent of urban slum households rely entirely on polluting fuels for all cooking and non-cooking purposes While the share of these households is relatively small the non-adoption of LPG in such households despite
programmes like the PMUY is concerning These households either use a combination of different polluting fuels (firewood dung cakes agricultural residue charcoal and kerosene) or just one of these fuels for all their energy needs Firewood is the most commonly used fuel in these households
231 Reasons for the non-adoption of LPGHouseholds that rely exclusively on polluting fuels reported not having an LPG connection Though three-fourths of these households were aware of PMUY the high upfront cost of an LPG connection along with the high recurring cost of procuring refills remain the two most important reasons for not procuring an LPG connection Repondents also mentioned a lack of information on how to procure a connection as a reason These reasons align with the common causes cited by rural households covered in the survey implying that the challenges faced by rural households and urban slum households in procuring connections are similar
Almost half of the households in this category use solid fuels for non-cooking purposes such as heating water for bathing space heating and preparing fodder for animals On the positive aspects of using polluting fuels households reported the following free-of-cost easy availability of fuels better tasting food and preference of family members for food cooked on the chulha
232 Fuel availability and affordabilityIn contrast with households that stack fuels households that use only solid fuels rely on purchasing fuels rather than collecting or preparing them For instance 60 per cent of firewood users in this category procure fuel by purchasing rather than collecting it
Households with low asset ownership rely on polluting fuels for cooking These households spend 2ndash3 per cent of their median monthly expenditure on fuel (INR 75 per month on fuel) which is much lower than what they would have to spend if they used LPG exclusively (INR 496 per month) Households that collect solid fuels spend about two hours on a single trip (three times a month) travelling a median one-way distance of 2 km This is equivalent to the distance travelled to procure LPG cylinders (if not delivered at home)
Figure 9 More than half of the households currently without LPG do not know how to get a connection or whom to ask about it implying a lack of awareness
Source Authorsrsquo analysis
0 10 20 30 40 50 60 70
39
53
63
68
80
Percentage of households
Rea
sons
for N
on-A
dop
tion
of L
PG Installation is expensive
Monthly expenditure on LPG is high
Do not know how to get or whom to ask
Not availabletoo far
17
12 See Annexure III for details on the districts and their PM25 concentrations The data for 15 districts (from Bihar Uttar Pradesh Madhya Pradesh and Rajasthan) overlapping with the survey sample have been analysed based on the availability of air quality data from continuous monitoring stations
13 Air quality categories based on PM25 concentration (in μgm3)
Good 0 to 30 Satisfactory 31 to 60 Moderately polluted 61 to 90 Poor 91 to 120 Very poor 121 to 250 Severe above 250 (Central Pollution Control Board 2014)
Cooking fuel adoption and use in urban slum households
Winter months have the highest PM25 concentrations coinciding with the sharp increase in use of polluting fuels for heating bath water and room heating
233 Gendered time use in households using solid fuelsIn urban slums both the male and female members of the household are equally involved in collecting firewood Still it is primarily the female members of the household who undertake dung cake preparation In addition to engaging in fuel collection and preparation women tend to spend more time cooking in households using solid fuels About 85 per cent of households that transitioned to LPG in the past four years reported having saved time while cooking compared to when they used solid fuels
SPOTLIGHT I Household air pollution (HAP) in urban slums
Burning solid fuels in three-stone fires and mud stoves with inadequate ventilation causes high levels of smoke exposure and negative health impacts particularly for women and young children (WHO 2014)
The double burden of ambient and household air pollution on the urban slum populationUsing the PM25 data from continuous ambient air quality monitoring stations (CAAQMS) for 15 districts12 in our sample we found that the ambient air quality remained in the lsquopoorrsquo or worse category13 for most districts throughout the year variation in the ambient air quality
Are Indiarsquos Urban Poor Using Clean Cooking Fuels Insights from Slums in Six States
Impact of ventilation
Indoor cooking and low adoption of chimney indicates high exposure to pollution from the use of unclean fuels for cooking The proportion of households with a chimney is high (52 per cent) among those who rely only on polluting fuels Smith and Pillarisetti (2017) explain that while having a good chimney lowers peak levels of indoor pollution long-term average exposure is reduced only by a factor of two Besides chimneys require regular maintenance to function correctly While more than 45 per cent of the households are using polluting fuels less than 20 per cent of the slum housheolds use improved cookstoves
Households also use solid fuels for non-cooking uses like space heating On average each house in a slum has two rooms this effectively exposes all members of the household to emissions from burning fuels Emissions from household sources contribute significantly to the surrounding air quality (Harish et al 2019) this concern is exacerbated in congested slum areas
the winter months (November to February) have the highest concentration of PM25 This leads to a double burden of exposure for slum households stacking solid fuels as they are more likely to increase use of solid fuels in winters (Figure 7) Alternatively the use of LPG as the primary source of fuel increases during the rainy season (June to September) these months record the least ambient air pollution
We also find that districts like Meerut Ghaziabad Patna Gautam Buddha Nagar (Noida and Greater Noida) and Muzaffarpur have the highest frequency of lsquovery poorrsquo air quality days throughout the year Across these districts one-third of households use polluting fuels for cooking In urban slums where households are more densely packed the emissions from burning solid fuels increase the risk of exposure inside households and deteriorate the ambient air quality for the community at large As a result these communities suffer from both increased household and ambient air pollution HAP has an estimated average contribution of 30ndash50 per cent to ambient air quality across Indiarsquos urban and rural areas (Balakrishnan et al 2019) Addressing biomass burning for cooking water heating and space heating during the winters has the potential to help reach the national ambient air quality standards (Chowdhury et al 2019) Despite that only 2 per cent of the action points in 44 city clean air plans mention cooking and heating as a sector to address air pollution (Ganguly Selvaraj and Guttikunda 2020)
18
75 householdsrsquo
using polluting fuels cook inside
the main house
67 householdsrsquo using polluting fuels do not have a chimney for ventilation
Awareness about the health impacts of using polluting fuelsAbout 60 per cent of households using only polluting fuels and 84 per cent of households that stack LPG with a polluting fuel report lsquotoo smokyrsquo as the most prominent negative aspect of using polluting fuels This suggests that as more households switch to clean cooking fuels perceptions regarding pollution fuels change
Three-fourths of primary cooks who use polluting fuels for cooking agree that smoke from solid fuels is harmful to them this implies that awareness of the adverse health impacts of polluting fuels does not necessarily lead to the uptake of clean fuels Primary cooks also agree that smoke from solid fuels causes coughing (49 per cent) and lung infections in children (39 per cent)
Exposure to air pollution is a known risk factor for underlying chronic diseases that predict the severity of
COVID-19 disease and patient outcomes (World Bank 2020) This linkage suggests a heightened risk for women
in all age groups who cook using traditional technologies and fuels (World Bank 2020) The highest number of
COVID-19 cases were recorded in the most polluted regions among patients with pre-existing health conditions
(Frontera et al 2020)
Results from a controlled study show a higher prevalence of chronic obstructive pulmonary disease (COPD)
among biomass fuel users than clean fuel users ( Johnson et al 2011) The available clinical data to date suggest
that cardiovascular disease diabetes chronic respiratory illness and hypertension ndash conditions all strongly
associated with exposure to HAP ndash are also risk factors for COVID-19 (World Bank 2020)
BOX 7 Impact of household air pollution on COVID-19
19Cooking fuel adoption and use in urban slum households
Are Indiarsquos Urban Poor Using Clean Cooking Fuels Insights from Slums in Six States
Traditionally women bear a disproportionate burden in collecting and preparing biomass for cooking While this burden reduces with the use of clean cooking fuels like LPG the fuel supply within the household is then determined by formal and monetised distribution networks involving an outlay of money (Patnaik and Jha 2020) Our data shows that womenrsquos status in the household (as heads of households)14 positively correlates with households using LPG as their primary fuel The existing literature also supports the idea that female-headed households prefer modern fuels to polluting ones (Farsi Filippini and Pachauri 2007 Rao and Reddy 2007 Kuo and Azam 2019) Other research also suggests that female-headed households are more willing to spend on LPG as a recurring expense (Kojima Bacon and Zhou 2011 Kuo and Azam 2019)
SPOTLIGHT II Womenrsquos participation in intra-household decision-making regarding LPG use
20
14 In almost half of the households surveyed the primary cook reported a female member being the head of the household The reason behind such high percentage of female-headed households could be because only the primary cook of every household (who is mostly female) was surveyed This does not mean that these households do not have any adult male members Traditionally headship refers to the head of household as the individual whose lsquoauthorityrsquo the household members recognise But this definition overlooks potential intra-household variations in the recognised authority in different realms of decision-making (Kilic Moylan and Koolwal 2020) Since cooking is a gendered activity the primary cookrsquos response to the head of household question may have been with respect to the recognised authority figure for that activity within the household
30 householdsrsquo female members place the order for LPG refills
50householdsrsquo female
members decide whether or when to purchase LPG refills
We also find that the decision of whether or when to purchase LPG refills is made by male members in half of urban slum households This holds for both male- and female-headed households In LPG-using households where the primary cook is involved in an income-generating activity more women are deciding to order the refills This pattern is similar irrespective of whether the household uses LPG exclusively or stacks it with other polluting fuels or are PMUY beneficiaries
SPOTLIGHT III A comparison of access to clean cooking energy between urban slum and non-slum households across six states
21
At the state level Bihar has significantly poor involvement of women in intra-household decision-making regarding
ordering refills with less than 10 per cent of households reporting that women decide whether or when to order
refills However more women than men are involved in decisions around LPG refills in Rajasthan Madhya Pradesh
and Jharkhand
Across caste groups the involvement of women is lowest (37 per cent) among the Scheduled Castes (SCs)
However more women in General and OBC households decide when to order LPG refills
BOX 8 Variations in intra-household decision-making across states and caste groups
Cooking fuel adoption and use in urban slum households
To compare the fuel use patterns of urban slum and non-slum households we used data from the India Residential Energy Survey (IRES 2020)15 The overlap in the sampling strategies of both IRES and our survey enabled a comparison of the findings There is a significant difference in the socio-economic status of slum and non-slum households which tends to affect their fuel use patterns Table 4 provides a comparison of cooking fuel usage in urban non-slum households (from IRES 2020) and urban slum households (Cooking Energy Access and Use survey 2020)
Are Indiarsquos Urban Poor Using Clean Cooking Fuels Insights from Slums in Six States22
Table 4 The poor economic condition of households in urban slums impacts the exclusive use of clean fuels for cooking
Source Authorsrsquo analysis
Fuel use categories Urban slum households (Cooking Energy Access Survey) ()
Non-slum urban households (IRES) ()
95 88
84 55
9 33
5 12
Clean fuel users (LPG PNG and electricity)
LPG as an exclusive fuel
Households that stack LPG with polluting fuels
Households that use only polluting fuels
We observed a significant gap in the exclusive use of LPG as a cooking fuel between urban slums and non-slum households explained mainly by the difference in their economic conditions Stacking is three times more common in slum households than non-slum households About 45 per cent of non-slum households using polluting fuels belong to marginalised social groups (SCs and STs) Households using polluting fuels have a lower median monthly expenditure than others and about 62 per cent of such households are semi-pucca or kuchha structures Among LPG users non-slum households have a slightly higher rate of doorstep delivery as compared to slum households
LPG-using households receiving home deliveries
Source Authorsrsquo analysis
239
6372
Urban slum households (Cooking Energy Access and Use)
()
Non-slum urban households (IRES)
()
Proportion of PMUY beneficiaries among LPG-using households
15 IRES 2020 was conducted in 21 large states of India including Bihar Jharkhand Rajasthan Madhya Pradesh Uttar Pradesh and Chhattisgarh While IRES 2020 focused on urban households the Cooking Energy Access and Use survey specifically attended to urban slums in the same districts Refer to the technical note for a detailed methodology of the survey
23
3 Way forward
Slums across the world are chronically ignored in public policy and suffer because of unauthorised and unsafe habitation without access to government services (Shahadat
Lipu and Bhuiyan 2014) In terms of energy access while we see a progressive change in householdsrsquo energy use patterns as we move from rural to urban issues like affordability availability preference and familiarity with the fuel and stove remain essential factors that determine householdsrsquo fuel choice
Image iStock
Are Indiarsquos Urban Poor Using Clean Cooking Fuels Insights from Slums in Six States24
Understanding categories of users is important for enabling access to and use of clean cooking fuels
We categorised the urban slum population based on their fuel usage patterns ndash using only clean fuels stacking clean fuels with polluting fuels and using only polluting fuels While most households in urban slums have an LPG connection only half of them use LPG exclusively The householdrsquos economic status and its access to doorstep delivery of LPG refills are two crucial factors that determine its ability to use LPG exclusively Despite being situated in urban areas 37 per cent of slum households do not receive home delivery of cylinders ndash availability is an essential factor in determining the householdrsquos likelihood of using LPG exclusively There is a strong impetus for the OMCs and distributors to improve their home delivery services of LPG refills in slum areas
Stacking is prevalent in about one-third of households ndash there is a need for a deeper understanding of householdsrsquo preferences fuel end-uses and awareness Most households reported using polluting fuels daily or at least weekly this effectively increases their exposure to household air pollution despite having access to clean cooking fuels Among households that stack LPG with polluting fuels the reasons for stacking differ ndash affordability seasonality and taste preference More than a quarter of households that stack have a similar level of LPG consumption as those that use LPG exclusively despite similar family sizes Such households use polluting fuels not because of their inability to afford LPG But other factors like free-of-cost availability of biomass taste preference for chulha and alternate end-uses of fuelmdashfor instance in space heatingmdashinfluence the householdrsquos decision to use solid fuels Among households that stack multiple fuels the use of polluting fuels increases during winter months this exposes the households to a double burden of high ambient and household air pollution in these months About 40 per cent of these households also use polluting fuels for non-cooking purposes like heating water for bathing and space heating especially in winter
Even with large-scale government initiatives like PMUY we find that more than 10 per cent of urban slum households do not use LPG They mainly rely on free-of-cost biomass for their cooking and non-cooking needs Despite awareness of PMUY among these households the high upfront cost of procuring an LPG connection and high recurring expenditure on refills deter them from using LPG Evidently there is a need to expand the reach of PMUY to cover households across slums
Integrating the issue of lack of access to clean cooking energy within the discussion on urban poverty
This study reiterates the need to look at poverty in urban areas in the context of energy access Given the heterogeneity of poverty in urban and semi-urban India it is essential to understand energy poverty in the context of access to resources for an enhanced quality of life for the urban poor Similarly slums dwellers in large and small cities alike may experience additional challenges of access Furthermore not all urban poor live in slums we know even less about the access issues of temporary residents or seasonal migrants in urban India Therefore in a rapidly urbanising India studies on the urban poor and air quality need to integrate a focus on energy access to address the vulnerability of women children and communities to HAP and the drudgery of using polluting fuels for cooking and other household energy needs
Access to clean cooking energy schemes must be integrated into the social assistance programmes focused on urban poverty alleviation to enhance its reach
25Way forward
Converging energy access in social protection policies for the urban poor
Accounting for the vulnerabilities of the urban poor is crucial in designing and implementing policies including social protection schemes As a health and economic imperative access to clean cooking energy schemes must be integrated into the social assistance programmes of other ministries (eg health education and nutrition assistance) to offer better support to slum households This would also reduce the burden on households of claiming and accessing multiple benefits across schemes thus freeing them to invest more time in productive activities (CEEW 2020) Government programmes such as the National Urban Livelihoods Mission and social service allocations for housing should use existing targeting approaches to include access to clean cooking energy within the ambit of services for the poor
Bringing a renewed emphasis on clean cooking energy access due to COVID-19 is essential
Most households in urban slums rely on daily wage labour or the gig economy for their household income During the COVID-19 pandemic these occupations have been among the worst impacted by the lockdown and the economic slowdown A survey conducted with over 2000 daily wage workers in urban slums during the lockdown suggests that only 7 per cent of respondents from this group received pay during the lockdown (Basu 2020) causing a massive shock to their livelihoods and wage earnings This kind of impact pushes households into energy poverty leading to the increased use of free-of-cost biomass and consequently increasing the risk of exposure to emissions from fuel burning While the government has committed to supplying up to three free refills to all PMUY households under PM-Garib Kalyan Yojana less than a quarter of households in urban slums have Ujjwala connections The low share of PMUY households effectively makes the majority of slum households ineligible for relief support given under the PM-Garib Kalyan Yojana during the lockdown There is a need to target vulnerable households ndash beyond PMUY beneficiaries ndash with differential subsidy support for using LPG in a sustained manner
Increased poverty would mean increased use of polluting fuels ndash there is a need for a renewed emphasis on clean cooking energy access during the COVID-19 pandemic as increased use of polluting fuels has health implications (lower respiratory infections and COPD) that increase the risk of COVID-19 infections being more severe
There is a need to target vulnerable households ndash beyond PMUY beneficiaries ndash with differential subsidy support for using LPG in a sustained manner
Are Indiarsquos Urban Poor Using Clean Cooking Fuels Insights from Slums in Six States
Balakrishnan Kalpana Sagnik Dey Tarun Gupta R S Dhaliwal Michael Brauer Aaron J Cohen Jeffrey D Stanaway et al 2019 ldquoThe Impact of Air Pollution on Deaths Disease Burden and Life Expectancy Across the States of India The Global Burden of Disease Study 2017rdquo The Lancet Planetary Health 3 (1) e26ndash39 httpsdoiorg101016S2542-5196(18)30261-4
Baqir M S K Bharti R Kothari and R P Singh 2019 ldquoAssessment of an Energy-efficient Metal Chulha for Solid Biomass Fuel and Evaluation of its Performancerdquo International Journal of Environmental Science and Technology 16 (11) 6773ndash6784 httpsdoiorg101007s13762-018-2028-9
Basu Anika Badyal 2020 ldquoLockdown Survey How The Covid-19 Crisis Has Affected Daily Wage WorkersmdashAIFrdquo American India Foundation June 28 httpsaiforglockdown-survey-how-the-covid-19-crisis-has-affected-daily-wage-workers
Butera F M P Caputo R Adhikari and A Facchini 2016 ldquoThe Challenge of Energy in Informal Settlements A Review of the Literature for Latin America and Africardquo Procedia Engineering 1ndash32 httpswwwenelfoundationorgcontentdamenel-foundtopic-downloadThe challenge of Energy in Informal settlementspdf
CEEW 2020 ldquoEnergy Safety Nets India Case Studyrdquo Vienna Sustainable Energy for All httpswwwceewinpublicationsenergy-safety-nets-india-case-study
Central Pollution Control Board 2014 ldquoNational Air Quality Indexrdquo New Delhi Central Pollution Control Board httpsappcpcbccrcomccr_docsFINAL-REPORT_AQI_pdf
Chafe Z S Mehta and K R Smith 2011 ldquoAmbient Fine Particulate (PM25) Air Pollution Attributable to Household Cooking Fuel in Asiardquo AGUFM A54Bndash03 httpsuiadsabsharvardeduabs2011AGUFMA54B03Cabstract
Chandramouli C 2010 ldquoCensus of India 2011 ndash Circular No 8rdquo New Delhi Ministry of Home Affairs httpscensusindiagovin2011-CircularsCircularsCircular-08pdf
Chandrasekhar S and Arup Mitra 2018 ldquoMigration Caste and Livelihood Evidence from Indian City-slumsrdquo Urban Research amp Practice 12 (2) 156ndash172 httpsdoiorg1010801753506920181426781
Cheng Chao Yo and Johannes Urpelainen 2014 ldquoFuel Stacking in India Changes in the Cooking and Lighting Mix 1987ndash2010rdquo Energy 76 (November) 306ndash317 httpsdoiorg101016jenergy201408023
Chowdhary Sourangsu Sagnik Dey Sarath Guttikunda Ajay Pillarisetti Kirk R Smith and Larry Di Girolamo 2019 ldquoIndian annual ambient air quality standard is achievable by completely mitigating emissions from household sourcesrdquo Proceedings of the National Academy of Sciences 116 (22) 10711-10716 httpsdoiorg101073pnas1900888116
Dhingra Chhavi Shikha Gandhi Akanksha Chaurey and P K Agarwal 2008 ldquoAccess to Clean Energy Services for the Urban and Peri-Urban Poor A Case-study of Delhi Indiardquo Energy for Sustainable Development 12 (4) 49ndash55 httpsdoiorg101016S0973-0826(09)60007-7
Farsi Mehdi Massimo Filippini and Shonali Pachauri 2007 ldquoFuel Choices in Urban Indian Householdsrdquo Environment and Development Economics 12 (6) 757ndash774 httpsdoiorg101017S1355770X07003932
References
26
Frontera Antonio Lorenzo Cianfanelli Konstantinos Vlachos Giovanni Landoni and George Cremona 2020 ldquoSevere Air Pollution Links to Higher Mortality in COVID-19 Patients The lsquoDouble-Hitrsquo Hypothesisrdquo Journal of Infection 81 (2) 255ndash259 httpsdoiorg101016jjinf202005031
Ganguly Tanushree Kurinj L Selvaraj Sarath K Guttikunda 2020 ldquoNational Clean Air Programme (NCAP) for Indian cities Review and outlook of clean air action plansrdquo Atmospheric Environment X Vol 8 httpsdoiorg101016jaeaoa2020100096
GNESD 2008 ldquoClean Energy for the Urban Poor An Urgent Issuerdquo Accessed 25 July 2020 httpswwwgooglecomurlsa=tamprct=jampq=ampesrc=sampsource=webampcd=ampved=2ahUKEwi1hf2ru dntAhUCOisKHQH7BtsQFjAAegQIAxACampurl=http3A2F2Fwwwgnesdorg2F-2Fmedia2FSites2FGNESD2FPublication- pdfs2FSPM_CleanEnergyashx3Fla3Dda26hash3DE4971C585B6798F17954F8B42E073 D9507F42A84ampusg=AOvVaw08kCDgOkTkYc6wRDxzsNyq
Guan Wei-Jie Wen-Hua Liang Yi Zhao Heng-Rui Liang Zi-Sheng Chen Yi-Min Li Xiao-Qing Liu et al 2020 ldquoComorbidity and its Impact on 1590 Patients with COVID-19 in China A Nationwide Analysisrdquo European Respiratory Journal 55 (5) 2000547 httpsdoiorg1011831399300300547-2020
Harish Santosh Kirk R Smith Sourangsu Chowdhury Zoe A Chafe Ajay Pillarisetti Jos Lelieveld Sarath Guttikunda Sagnik Dey and Andrew P Grieshop 2019 ldquoThe Contribution of Household Fuels to Ambient Air Pollution in India A Comparison of Recent Estimates Edited by CcapcOrgInrdquo Collaborative Clean Air Policy Centre May 30 httpsccapcorginpolicy-briefs2019530the-contribution-of-household-fuels-to-ambient-air-pollution-in-india-a-comparison-of-recent-estimates
Jain Abhishek Saurabh Tripathi Sunil Mani Sasmita Patnaik Tauseef Shahidi and Karthik Ganesan 2018 ldquoAccess to Clean Cooking Energy and Electricity Survey of States 2018rdquo New Delhi CEEW httpswwwceewinsitesdefaultfilesCEEW-Access-to-Clean-Cooking-Energy-and-Electricity-11Jan19_0pdf
Johnson Priscilla Kalpana Balakrishnan Padmavathi Ramaswamy Santu Ghosh Muthukumar Sadhasivam Omprakash Abirami Bernard W C Sathiasekaran Kirk R Smith Vijayalakshmi Thanasekaraan and Arcot S Subhashini 2011 ldquoPrevalence of Chronic Obstructive Pulmonary Disease in Rural Women of Tamilnadu Implications for Refining Disease Burden Assessments Attributable to Household Biomass Combustionrdquo Global Health Action 4 (1) 7226 httpsdoiorg103402ghav4i07226
Kilic Talip Heather Moylan and Gayatri Koolwal 2020 ldquoGetting the (Gender-disaggregated) Lay of the Land Impact of Survey Respondent Selection on Measuring Land Ownership and Rightsrdquo Washington DC The World Bank httpsdoiorg1015961813-9450-9151
Kojima Masami Robert Bacon and Xin Zhou 2011 ldquoWho Uses Bottled Gas Evidence from Households in Developing Countriesrdquo The World Bank Sustainable Energy Department Oil Gas and Mining Unit httpelibraryworldbankorgdoibook1015961813-9450-5731
Kuo Ying-Min and Mehtabul Azam 2019 ldquoHousehold Cooking Fuel Choice in India 2004ndash2012 A Panel Multinomial Analysisrdquo IZA Discussion Paper No 12682 httpsssrncomabstract=3468630
Lippi Giuseppe and Brandon Michael Henry 2020 ldquoChronic Obstructive Pulmonary Disease Is Associated with Severe Coronavirus Disease 2019 (COVID-19) COPD and COVID-19rdquo Respiratory Medicine 167 105941 httpsdoiorg101016jrmed2020105941
Ministry of Housing and Urban Affairs 2019 ldquoHandbook of Urban Statisticsrdquo New Delhi Government of India httpmohuagovinpdf5c80e2225a124Handbook of Urban Statistics 2019pdf
Rao M Narasimha and B Sudhakara Reddy 2007 ldquoVariations in Energy Use by Indian Households An Analysis of Micro Level Datardquo Energy 32 (2) 143ndash153 httpsdoiorg101016jenergy200603012
27References
Are Indiarsquos Urban Poor Using Clean Cooking Fuels Insights from Slums in Six States28
National Buildings Organisation 2013 ldquoState of Slums in India a Statistical Compendium 2013rdquo New Delhi Government of India httpnbonicinpdfSlums_in_India_Compendium_English_Versionpdf
National Sample Survey Office 2012 ldquoKey Indicators of Urban Slums in India ndash 69th Roundrdquo New Delhi National Data Bank for Socio-religious Categories httpmospinicinsitesdefaultfilesnational_data_bankndb-rpts-69htm
Nolan Laura B 2015 ldquoSlum Definitions in Urban India Implications for the Measurement of Health Inequalitiesrdquo Population and Development Review 41 (1) 59ndash84 httpsideasrepecorgablapopdevv41y2015i1p59-84html
Nolan Laura B David E Bloom and Ramnath Subbaraman 2018 ldquoLegal Status and Deprivation in Urban Slums Over Two Decadesrdquo HHS Public Access 53 (15) 47ndash55
Patel Amit 2020 ldquoPreventing COVID-19 Amid Public Health and Urban Planning Failures in Slums of Indian Citiesrdquo World Medical amp Health Policy 12 (3) httpsdoiorg101002wmh3351
Patnaik Sasmita and Shaily Jha 2020 ldquoCaste Class and Gender in Determining Access to Energy A Critical Review of LPG Adoption in Indiardquo Energy Research amp Social Science 67 (September) 101530 httpsdoiorg101016jerss2020101530
PPAC-CRISIL 2016 ldquoAssessment Report Primary Survey on Household Cooking Fuel Usage and Willingness to Convert to LPGrdquo New Delhi Petroleum Planning amp Analysis Cell Ministry of Petroleum and Natural Gas Government of India httpswwwppacgovinWriteReadDataReports201710310449342512219PrimarySurveyReportPPACpdf
PPAC 2019 ldquoOil Industry Information at a Glancerdquo New Delhi Ministry of Petroleum and Natural Gas Government of India httpswwwppacgovinWriteReadDataReports201912060336500305462ReadyReckonerNov2019WebVersionpdf
Rahaman Mehebub and Dipendra Nath Das 2017 ldquoNature of Slum Growth in Indian Citiesrdquo Urban India 37 (II) 100ndash116 httpswwwresearchgatenetpublication334051882_Nature_of_Slum_Growth_in_Indian_Citiesread
Rains Emily Anirudh Krishna and Erik Wibbels 2018 ldquoUrbanisation and Indiarsquos Slum Continuum Evidence on the Range of Policy Needs and Scope of Mobilityrdquo London International Growth Centre httpswwwtheigcorgwp-contentuploads201802Rains-et-al_Working-paper_coverpdf
Ranjan Rahul and Sudershan Singh 2017 ldquoEnergy Deprivation of Indian Households Evidence from NSSO Datardquo New Delhi Munich Personal RePEc Archive httpsmpraubuni-muenchende835661MPRA_paper_83566pdf
Roy Debraj Bharath Palavalli Niveditha Menon Robin King Karin Pfeffer Michael Lees and Peter M A Sloot 2018 ldquoSurvey-based Socio-economic Data from Slums in Bangalore Indiardquo Nature Publishing Group 5 1ndash9 httpsdoiorg101038sdata2017200
Saksena Sumeet P B Singh Raj Kumar Prasad Rakesh Prasad Preeti Malhotra Veena Joshi and R S Patil 2003 ldquoExposure of Infants to Outdoor and Indoor Air Pollution in Low-income Urban Areas A Case Study of Delhirdquo Journal of Exposure Science amp Environmental Epidemiology 13 219ndash30 httpsdoiorg101038sjjea7500273
Lipu Molla Shahadat Hossain and Arif Waliullah Bhuiyan 2014 ldquoElectricity Access in Urban Slum Households of Bangladesh A Case of Dhakardquo Journal of Renewable and Sustainable Energy 6 (053112) 1ndash15 httpsdoiorg10106314896697
29
Singh Rozita Xiao Wang Emmanuel Ackom and Juan Reyes 2015 ldquoEnergy Access Realities in Urban Poor Communities of Developing Countries Assessments and Recommendationsrdquo Global Network on Energy for Sustainable Development (GNESD) httpswwwgooglecomurlsa=tamprct=jampq=ampesrc=sampsource=webampcd=ampved=2ahUKEwj5nbqI wdntAhXUTX0KHZE6DboQFjAAegQIAhACampurl=https3A2F2Forbitdtudk2Ffiles2F10635 24942FEnergy_access_realities_v_final_updatedpdfampusg=AOvVaw0xNBAAo0bjLueY9FmoigKF
Singh Santosh 2014 ldquoThe Kaleidoscope of Cooking Understanding Cooking Behaviour and Stove Preferences in Rural Indiardquo New Delhi Deutsche Gesellschaft fuumlr Internationale Zusammenarbeit (GIZ) GmbH httpswwwgizdeendownloadsgiz2014-en-kaleidoscope-of-cooking-indiapdf
Smith Kirk R and Ajay Pillarisetti 2017 ldquoHousehold Air Pollution from Solid Cookfuels and its Effects on Healthrdquo Disease Control Priorities 7 (3) 133ndash52 httpsdoiorg101596978-1-4648-0522-6_ch7
UN-Habitat 2003 ldquoThe Challenge of Slums ndash Global Report on Human Settlements 2003rdquo Location of publishing London UN-Habitat httpsunhabitatorgthe-challenge-of-slums-global-report-on-human-settlements-2003
Wang Bolin Ruobao Li Zhong Lu and Yan Huang 2020 ldquoDoes Comorbidity Increase the Risk of Patients with COVID-19 Evidence from Meta-analysisrdquo Aging 12 (7) 6049ndash6057 httpsdoiorg1018632AGING103000
WHO 2014 ldquoWHO Guidelines for Indoor Air Quality Household Fuel Combustionrdquo WHO Accessed 25 July 2020 httpwwwwhointairpollutionguidelineshousehold-fuel-combustionen
World Bank 2020 ldquoThe State of Modern Energy Cooking Servicesrdquo Washington DC World Bank httpdocuments1worldbankorgcurateden937141600195758792pdfThe-State-of-Access-to-Modern-Energy-Cooking-Servicespdf
Yenneti Komali Yehua Dennis Wei and Wen Chen 2017 ldquoThe Urbanization of Poverty in India Spatio-temporal Disparities in Consumption Expendituresrdquo Geographical Review 107 (2) 360ndash383 httpsdoiorg101111j1931-0846201612167x
References
Are Indiarsquos Urban Poor Using Clean Cooking Fuels Insights from Slums in Six States
Annexure 1 Asset ownership index We used Filmer and Pritchettrsquos (2001) proposed approach to construct an asset ownership index using principal component analysis (PCA) We chose the indicators based on data from the Cooking Energy Access survey 2020 The variables we considered for the index were based on classifications by Caroline Moser and Andrew Felton (2007) and K Harttgen (2013) We computed the asset index using housing characteristics and consumer durables as follows
Variables not included in the asset index
Four types of variables were eliminated
1 Variables (such as grid electricity) that had high usage of greater than 95 per cent
2 Those (such as ownership of laptops or computers air conditioners etc) that had a low usage of less than 5 per cent
3 Variables (like house ownership) that have economically fluctuating values
4 Those that indicated a low correlation of less than 20 per cent variation between the top category (ie first) of the asset quintile and the bottom-most category (ie fifth) of the asset quintile
For ease of interpretation we rescaled this index such that the final index values range between 0 and 10 For this purpose we used a feature scaling (or minndashmax scaling) formula
Xnorm (or (IVx)) = (X ndash Xmin)(Xmax ndash Xmin)
where IVx is the normalised index value Xmin is the initial minimum value (-354) and Xmax is the initial maximum value (461) of the asset ownership index
30
Annexures
bull Crowding16 inside the house bull Toilet ownership and usage bull Source of water bull Number of pucca rooms
bull Ownership of two-wheeler bull Ownership of washing machine bull Ownership of television bull Ownership of refrigerator bull Ownership of cooker
16 A household with more than three members occupying a single room is considered crowded (World Health Organization 2018)
Housing characteristics
Consumer durables
Annexure 2 Explaining the use of LPG as the exclusive fuel (simple logistic regression model)
31Annexures
Dependent variable exclusive LPG use
Education of the primary cook (categorical base category is education beyond the school level)
Education of the household head (categorical base category is education beyond the school level)
State (categorical base category includes households from Rajasthan)
P gt z 95 confidence interval
Odds ratio (SE)
1299 (0112)
0659 (0202)
1399 (0394)
0970 (0038)
0994 (0011)
1003 (0013)
2042 (0508)
1011 (0046)
0782 (0441)
1198 (0608)
1377 (0664)
1345 (0566)
3141 (1103)
1213 (0500)
0309 (0211)
1165 (0565)
1703 (0680)
0002
0174
0233
0446
0583
0839
0004
0812
0663
0722
0507
0482
0001
0639
0086
0753
0182
1097
0361
0806
0898
0973
0977
1254
0924
0259
0443
0535
0589
1578
0541
0081
0450
0779
1540
1203
2428
1048
1016
1029
3327
1106
2361
3240
3545
3070
6251
2720
1181
3014
3723
Asset index
Primary cook involved in income-generating activity
Female-headed households
Household size
Age of household head
Age of primary cook
Doorstep delivery of LPG cylinders
PMUY customer
Primary cook is not educated
Primary cook has a school education
Household head is not educated
Household head has a school education
Uttar Pradesh
Bihar
Chhattisgarh
Jharkhand
Madhya Pradesh
Number of households (n) = 417
Log likelihood = -228777
Prob gt chi2 = 0000
Pseudo R2 = 0126
The dependent variable is a dummy variable where households using LPG exclusively are assigned a value of 1 and all other households are assigned the value of 0
The caste of the household has not been factored into the regression as a separate variable because of its underlying influence on economic status
Source Authorsrsquo analysis
Are Indiarsquos Urban Poor Using Clean Cooking Fuels Insights from Slums in Six States
Annexure 3 Air quality (PM25 concentration in μgm3) across 15 districts based on CAAQMS data
32
Dis
tric
tsM
ar-1
9A
pr-1
9M
ay-1
9Ju
n-19
Jul-1
9A
ug-1
9Se
p-19
Oct
-19
Nov
-19
Dec
-19
Jan-
20Fe
b-20
Mar
-20
794
5
988
5
866
7
-
645
329
2
453
7
388
1
769
1
886
4
661
5
950
9
834
4
-
823
4
611
7
569
9
535
7
-
270
4
589
4
571
5
293
1
705
4
839
2
614
9
970
1
826
8
-
844
9
622
1
597
1
564
0
-
235
3
414
3
619
1
414
3
653
9
834
7
568
8
104
90
739
8
-
894
9
630
9
342
2
450
4
-
476
465
2
474
6
429
2
592
3
566
1
-
674
6
531
4
501
5
568
7
450
8
-
320
3
-
846
506
3
349
5
332
4
369
1
387
2
-
430
4
393
6
353
7
446
2
406
8
335
2
339
1
-
102
9
497
2
261
8
269
1
431
4
294
1
-
351
6
277
3
-
336
5
315
5
248
3
392
8
149
7
144
9
462
3
270
5
331
3
273
4
276
0
106
6
391
7
326
2
-
368
6
625
3
875
2
101
64
521
2
183
1
380
4
556
2
544
1
558
2
102
24
104
33
156
44
128
73
146
62
137
71
109
14
183
70
201
80
896
7
190
1
457
7
581
2
583
5
815
4
135
00
126
41
239
94
208
15
158
51
221
86
121
35
192
46
218
43
848
0
205
2
448
5
509
4
582
0
704
5
177
01
613
1
244
01
215
80
136
87
230
54
964
2
201
52
122
30
725
5
120
6
435
4
454
7
481
2
111
37
147
45
537
3
175
53
162
86
111
21
170
08
583
8
132
10
866
2
513
1
112
5
511
3
507
5
511
8
879
4
120
22
502
1
135
53
116
39
994
7
120
45
410
5
792
1
674
8
326
3
177
6
385
0
408
5
335
9
497
2
594
2
429
9
673
2
547
5
540
8
559
4
Gay
a
Muz
affa
rpur
Pat
na
Bho
pal
Satn
a
Alw
ar
Ajm
er
Ud
aip
ur
Ag
ra
Bul
and
shah
r
Hap
ur
Gha
ziab
ad
Gre
ater
Noi
da
Mee
rut
Noi
da
Sour
ce C
onti
nuou
s am
bien
t air
qua
lity
mon
itor
ing
stat
ion
(Mar
ch 2
019
ndash M
arch
202
0)
In a rapidly urbanising India it would be imperative for policymakers and practitioners in energy and urban development sector to integrate access to clean cooking energy within the ambit of services for the urban poor
Image CEEW
Are Indiarsquos Urban Poor Using Clean Cooking Fuels Insights from Slums in Six States
COUNCIL ON ENERGY ENVIRONMENT AND WATER (CEEW)
Sanskrit Bhawan A-10 Aruna Asaf Ali Marg Qutab Institutional AreaNew Delhi - 110 067 IndiaT +91 11 4073 3300
infoceewin | ceewin | CEEWIndia
Are Indiarsquos Urban Poor Using Clean Cooking Fuels Insights from Slums in Six States
Tables
Table 1 Sample allocation across urban slums
Table 2 Less than one-third of urban slum households reported income from salaried jobs
Table 3 Scheduled Castes and Scheduled Tribes have the lowest economic status
Table 4 The poor economic condition of households in urban slums impacts the use of clean fuels exclusively for cooking
Figures
Figure ES1 To reduce the health impacts from HAP households that are stacking with polluting fuels will need to transition to exclusive use of clean cooking fuels
Figure ES2 While stacking is highest among the middle categories (second and third quintile) it is prevalent across all asset quintiles including the highest one
Figure 1 Within slums there are considerable state-level variations in householdsrsquo fuel usage patterns across states
Figure 2 While the majority of LPG-using households use the fuel primarily only half of them use it exclusively
Figure 3 Most households using LPG exclusively acquire six to eight cylinders per year
Figure 4 Of the households that stack fuels most use LPG as their primary fuel
Figure 5 Stacking is prevalent in households across asset quintile categories
Figure 6 Almost half of the households using polluting fuels use it every day
Figure 7 Proportion of urban slum households using solid fuels as the primary cooking fuel increases during the winters months aggravating householdsrsquo air pollution exposure due to unfavourable atmospheric conditions
Figure 8 Lack of awareness about receiving LPG refill subsidies poses a threat to the success of LPG subsidy schemes
Figure 9 More than half of the households currently without LPG do not know how to get a connection or whom to ask about it implying a lack of awareness
5
5
3
22
ii
iii
8
8
9
11
12
13
14
15
16
Acronyms
BPL below poverty line
CAAQMS continuous ambient air quality monitoring stations
COPD chronic obstructive pulmonary disease
COVID coronavirus disease
DALY disability-adjusted life year
DBTL Direct Benefit Transfer scheme for LPG
HAP household air pollution
IRES India Residential Energy Survey
LPG liquified petroleum gas
NSSO National Sample Survey Office
OBC Other Backward Castes
OMCs oil and marketing companies
PMUY Pradhan Mantri Ujjwala Yojana
SC Scheduled Caste
SDI socio-demographic index
ST Scheduled Tribes
Are Indiarsquos Urban Poor Using Clean Cooking Fuels Insights from Slums in Six States
Image iStock
To reduce the health impacts from household air pollution slum households that are stacking polluting fuels will need to transition using clean cooking fuels exclusively
With increased urbanisation India is experiencing acute air pollution in its urban centres Slum dwellers are doubly affected both by the higher concentration of
particulate matter in urban areas as well as indoor air pollution from the use of unclean cooking fuels With more than 137 million people living in slums in country (Census 2011) there is a strong impetus to understand the use of clean cooking fuels in such households Existing literature on energy access and use in slums across developing countries assume that energy infrastructure is available in these settlements as they are situated in urban environments (Butera et al 2016) Household air pollution (HAP) has an estimated average contribution of 30ndash50 per cent to ambient air quality across Indiarsquos urban and rural areas (Balakrishnan et al 2019) Addressing biomass burning for cooking water heating and space heating during the winters has the potential to help reach the national ambient air quality standards (Chowdhury et al 2019)
However our analysis shows that a large share of these households do not have access to clean fuels due to lack of afforability or patchy supply In this brief we discuss access to clean cooking energy in urban slums across six states (Bihar Uttar Pradesh Rajasthan Madhya Pradesh Jharkhand and Chhattisgarh) These states have a low socio-demographic index and a high disease burden due to air pollution (Balakrishnan et al 2019) The findings of this brief are based on a primary survey conducted in rural areas and urban slums in these states ndash Cooking Energy Access Survey 20201 The analysis focuses on the fuel use patterns of households the extent of use of LPG and solid fuels fuel stacking behaviour and the primary cookrsquos perception of various cooking fuels and their health impacts
Slum households vary widely in their use of clean cooking fuels Therefore to understand their cooking energy use patterns better we categorised these households into three groups
Using clean fuels exclusively
Stacking clean fuels with polluting fuels and
Using only polluting fuels
Use of LPG as primary fuel
82 (Cooking Energy Access Survey 2020)
47 (Census 2011)
Polluting fuel as primary fuel
16 (Cooking Energy Access Survey 2020)
52 (Census 2011)
i
Executive summary
1 This has been referred as lsquoour surveyrsquo thereafter
In this brief the use of clean cooking fuels is considered synonymous to use of LPG
Are Indiarsquos Urban Poor Using Clean Cooking Fuels Insights from Slums in Six States
1 Households using LPG as their only fuelWhile most urban slum households have an LPG connection exclusive use of LPG is limited to just over half of the total households The householdrsquos economic status (measured through asset ownership) and their access to doorstep delivery of LPG refills are two critical factors that determine their ability to use LPG exclusively We found that households with higher asset ownership have significantly higher odds of using LPG as an exclusive fuel
2 Households stacking LPG with polluting fuelsAlthough schemes like Pradhan Mantri Ujjwala Yojana (PMUY) have helped increase LPG adoption this has not resulted in the complete replacement of biomass-based fuels Despite 86 per cent of households having an LPG connection the data shows that over a third of slum households are stacking with polluting fuels (including firewood dung cakes agriculture residue charcoal and kerosene) Most of these households use polluting fuels daily or at least weekly which increases their exposure to household air pollution
Among the households stacking LPG with polluting fuels the reasons for stacking vary affordability free-of-cost availability of biomass seasonality and taste preferences Across asset quintiles we find that stacking is highest among the middle categories (second and third quintile) though most households in these categories have adopted LPG Still the affordability of the fuel remains a significant concern One-fourth of households who are stacking polluting fuels have a median annual refill rate of eight cylinders and above (same as exclusive LPG users) despite having a similar household size as those using LPG exclusively Most of such households fall in the wealthiest asset quintiles and use a chulha (mud stove) for cooking chapatis or vegetables suggesting that they are not necessarily using unclean fuels due to the unaffordability of LPG but due to other factors like taste
ii
Figure ES1 To reduce the health impacts from household air pollution (HAP) households that are stacking with polluting fuels will need to transition to exclusive use of clean cooking fuels
Source Authorsrsquo analysis
Exclusive clean fuel users
Stacking with LPG as the primary fuel
Only polluting fuel users
Stacking LPG with polluting fuels
Stacking with LPG as the secondary fuel
55
3388
12
12
63 LPG-using households receive doorstep delivery of cylinders
77
households receiving doorstep delivery of LPG cylinders are exclusive users of the fuel
Despite increased LPG adoption stacking is prevalent in more than one-third of the slum households
iiiExecutive summary
Figure ES2 While stacking is highest among the middle categories (second and third quintile) it is prevalent across all asset quintiles including the highest one
Source Authorsrsquo analysis
21 Non-cooking uses of polluting fuels Despite using LPG as the primary fuel for their cooking needs households that stack fuels use polluting fuels for non-cooking purposes like heating water for bathing (29 per cent) and space heating (10 per cent)
22 Seasonal variations in fuel use Most households (88 per cent) use LPG as their primary fuel in the rainy season while in winters less than 45 per cent of households do so The increased use of polluting fuels in winter could be because during these months the polluting fuel requirement for non-cooking tasks within the household like water heating for bathing and space heating increases ndash which leads to the increased use of polluting fuels for cooking as well Unfortunately the increased use of polluting fuels in winters exposes households to the double burden of high ambient and household air pollution due to unfavourable atmospheric conditions
21 households stacking fuels
have more than one LPG connections
25 households stacking fuels have two-cylinder connections
1 2 3 4 5
Asset quintile categories
0
20
40
60
80
100
Per
cent
age
of h
ouse
hold
s
Exclusive clean fuel users Stacking LPG with polluting fuels Only polluting fuel users
5348
52
6367
2441 37
3232
2311 11
51
Are Indiarsquos Urban Poor Using Clean Cooking Fuels Insights from Slums in Six States
3 Households using only polluting fuelsDespite large-scale government initiatives like PMUY 12 per cent of urban slum households do not use LPG and rely on polluting fuels While most of these households are aware of PMUY the high upfront LPG connection cost along with the high recurring expenditure on refills deter them from procuring an LPG connection
Way forwardWhile we see a progressive change in householdsrsquo energy-use patterns as we move from rural to urban issues like affordability availability preference seasonality and the end-uses of the fuel remain essential factors that determine household fuel choice Understanding user categories and fuel use patterns is crucial in enabling access to and sustained use of clean cooking fuels Also it is vital to recognise the implications of cooking being a gendered activity However womenrsquos participation in intrahousehold decision-making regarding LPG use is limited
Despite being in urban areas 37 per cent of slum households do not receive home delivery of cylinders ndash availability is an essential factor that determines the householdrsquos likelihood of using LPG exclusively To increase LPG use oil and marketing companies (OMCs) and distributors need to improve home delivery of LPG refills in slum areas
Emissions from household sources contribute hugely to the surrounding air quality (Harish et al 2019) which is already poor in congested slum areas Majority of households cook inside the main house without a chimney indicating high exposure to pollution from the use of unclean fuels for cooking
iv
30 householdsrsquo female members place the order for LPG refills
50 householdsrsquo female
members decide whether or when to purchase LPG refills
75 householdsrsquo
using polluting fuels cook inside
the main house
67 householdsrsquo using polluting fuels do not have a chimney for ventilation
vExecutive summary
Integrate the issue of lack of access to clean cooking energy with urban poverty This study reiterates the need to look at poverty in urban areas in the context of energy access The vulnerability of urban slum dwellers needs to be accounted for while designing and implementing policies including social protection schemes Given the health and economic impacts of pollution access to clean cooking energy schemes must be integrated with the social assistance programmes of other ministries (eg health education and nutrition assistance) to better target support for slum households Government programmes such as the National Urban Livelihoods Mission and social service allocations for housing should use existing targeting approaches to include access to clean cooking energy within their ambit of services for the poor
The economic impact from COVID-19 will push households into energy poverty leading to the increased use of free-of-cost biomass ndash consequently increasing the risk of exposure to emissions from fuel burning While the government has announced that it will provide up to three free refills under the PM-Garib Kalyan Yojana scheme to all PMUY households less than a quarter of households in urban slums have Ujjwala connections ndash effectively making them ineligible for relief support There is a need to expand the reach of PMUY to cover all slum households
Bring renewed emphasis on clean cooking during COVID-19 Increased poverty would mean increased use of polluting fuels ndash there is a need for a renewed emphasis on clean cooking energy access during the COVID-19 pandemic as increased use of polluting fuels has health implications (lower respiratory infections and coronary chronic obstructive disease (COPD)) that increase the risk of COVID-19 infections being more severe
There is a need for targeted effort to include the poor households in urban slums left out in the first phase of Ujjwala
Are Indiarsquos Urban Poor Using Clean Cooking Fuels Insights from Slums in Six States
Image iStock
Addressing biomass burning for cooking water heating and space heating during the winters has the potential to help reach the national ambient air quality standards
The Census of India (2011) estimates that India has about 137 million slum dwellers across the country However statistics on slum populations vary significantly based on how
a slum is defined (Nolan 2015) Therefore not only is there a lack of data about how many people live in slums and informal settlements but there is also limited information about living conditions in slums (Rains Krishna and Wibbels 2018) Rapid urbanisation in India has led to population spikes in urban centres Low-income households in urban areas are trapped in informal and sometimes lsquoillegalrsquo settlements with poor living conditions where access to essential services and infrastructure tends to be limited or badly deteriorated (Butera et al 2016) While slum dwellers are not a homogeneous population slum areas have high concentrations of poverty and social and economic deprivation and poor shelter and environmental conditions (UN-Habitat 2003)
1 Introduction state of Indiarsquos urban slums
1
The Census of India (2011) defines slums as ldquoresidential areas where dwellings are unfit for human habitation by
reasons of dilapidation overcrowding faulty arrangements and design of such buildings narrowness or faulty
arrangement of street lack of ventilation light or sanitation facilities or any combination of these factors which
are detrimental to the safety and healthrdquo The slums in India are officially categorised into three categories
identified recognised and notified1 (Chandramouli 2010) About 59 per cent of slum households in India are non-
notified and are not legally recognised by the government (Nolan Bloom and Subbaraman 2018)
BOX 1 Slums in India
The existing literature on energy access and use in slums across developing countries suggests that while energy infrastructure (electric grid LPG distribution system) is available in these settlements (by being urban) households cannot afford it andor the service is unreliable (frequent outages and low voltage for electricity uncertain availability of gas cylinders) (Butera et al 2016) This leads to households relying on illegal connections for electricity and using energy sources that are on the lower end of the energy ladder (such as kerosene charcoal wood and other biomass residues) for cooking (Butera et al 2016)
1 Areas notified as slums by the concerned municipalities corporations local bodies or development authorities were termed notified slums All areas recognised as lsquoSlumrsquo by State UT Administration or Local Government Housing and Slum Boards which may have not been formally notified as slum under any act While a compact area of at least 300 population or about 60-70 households of poorly built congested tenements in the unhygienic environment is termed as identified slums (National Sample Survey Office 2012)
Are Indiarsquos Urban Poor Using Clean Cooking Fuels Insights from Slums in Six States2
In India population growth and rapid urbanisation have resulted in the deepening of urban poverty and the increased growth of urban slums (GNESD 2008 Yenneti Wei and Chen 2017) As per the Census 2011 most slum dwellers are casual labourers engaged in works other than public works (ie informal sectors) as opposed to salaried employees in non-slum urban areas (National Buildings Organisation 2013) As per the National Sample Survey Office (NSSO 2011ndash2012) the average daily wage of casual labourers is as low as INR 170 in urban areas (Ministry of Housing and Urban Affairs 2019) Such households may be able to purchase cleaner and more efficient fuels whenever they can but are likely to fall back on less efficient ones when faced by budgetary constraints Studies suggest that despite the LPG subsidies provided by the government significant sections of the urban poor population are still struggling to incorporate the cost of LPG into their household budgets (R Singh et al 2015) Use of multiple fuels also provides security from price variations and unreliable service associated with a single fuel or technology (Shahadat Lipu and Bhuiyan 2014)
As per the Census 2011 only half of the urban slum households across the country use LPG as their cooking fuel the remaining rely on solid fuels and kerosene Since 2013 the LPG programme in India has undergone many modifications to improve delivery and targeting access to connections and the availability of LPG (CEEW 2020) Pradhan Mantri Ujjwala Yojana (PMUY) which focuses on tackling the high upfront cost of LPG by providing LPG connections to below poverty line (BPL) households with credit-linked subsidy support has played an instrumental role in increasing the penetration of LPG across the country As of November 2019 about 965 per cent of households in India have an LPG connection (PPAC 2019) Small towns and cities which have been experiencing a comparatively slow rate of urban growth but the high percentage of slum population mall towns and cities which have been experiencing a relatively slow rate of urban growth but a high percentage of slum population
However the dramatic increase in LPG coverage has led to increased fuel stacking (Cheng and Urpelainen 2014) The reliance on fuel stacking has significant implications as the health benefits of using clean fuels are reduced or perhaps even nullified in households that continue to use biomass (Cheng and Urpelainen 2014) Urban slums suffer from a double burden of pollution as they are exposed to high ambient particulate matter pollution in cities along with the household air pollution (HAP) from using unclean cooking fuels (WHO 2014) The Global Burden of Disease study notes that even with the substantial increase in the provision of clean cooking fuels in India more than half of Indiarsquos population is exposed to HAP from solid cooking fuels as of 2017 (Balakrishnan et al 2019) In the current context this is concerning since exposure to air pollution has been linked to developing lower respiratory infections and chronic obstructive pulmonary disease (Balakrishnan et al 2019) which are among the major risk factors for COVID-19 (Lippi and Henry 2020 Wang et al 2020)
11 Motivation and methodology While there have been various studies on energy access in rural areas there is minimal data on energy use and patterns in urban slum households Most studies on urban slums and energy access focus on specific slums in large metropolitan areas such as Delhi and Bangalore (Saksena et al 2003 Dhingra et al 2008 Roy et al 2018) Living conditions and access to resources vary across slums in smaller towns and cities compared to those in Tier I
Slum-dwellers suffer from the double burden of pollution as they are exposed to high ambient particulate matter in cities along with the HAP from using unclean cooking fuels
2 A summary measure that identifies where countries or other geographic areas fall on the spectrum of development Expressed on a scale of 0 to 1 SDI is a composite average of the countryrsquos rankings in terms of per capita income average educational attainment and fertility rates
3 These states account for six out of eight of the lowest socio-demographic index (SDI) states and exhibit the highest health impacts of household air pollution (HAP) These states also have the highest percentage of households covered under the flagship clean cooking energy programme in India ndash PMUY
4 Referred to as lsquoour surveyrsquo thereafter
5 In our sample about 82 per cent of households are from notified slums
6 About 98 per cent of the respondents were female members of the household
7 For further details on the survey sample and methodology refer to the technical document for the survey
3Introduction state of Indiarsquos urban slums
Table 1 Sample allocation across urban slums
Source Authorsrsquo compilation
Note The number of slums sampled within each state varied because the slums were picked from the same districts that were sampled under the India Residential Energy Survey (2020) across the six states This was done to ensure logistical ease in conducting both the surveys and to share the resources of the national-level survey The list of urban slums as per the Census 2011 in the districts sampled under IRES 2020 constitutes the urban sampling frame7
State Districts sampled Urban slums sampled Households surveyed
16
14
10
10
4
4
58
31
15
16
12
5
4
83
249
124
128
94
40
32
667
Uttar Pradesh
Bihar
Madhya Pradesh
Rajasthan
Jharkhand
Chhattisgarh
cities these towns have been experiencing a comparatively slow rate of urban growth but are home to large slum populations (Rahaman and Das 2017) Further existing sources on access to clean cooking energy among slum households are limited to primary fuel use and lack detailed information about fuel use and stacking patterns
In India states with the lowest socio-demographic index (SDI)2 also account for the highest level of disease burden due to air pollution (Balakrishnan et al 2019) The low SDI states in north India had some of the highest levels of ambient particulate matter and household air pollution ndash especially Bihar Uttar Pradesh Rajasthan and Jharkhand The disability-adjusted life year (DALY) rate attributable to HAP was highest in the low SDI states of Chhattisgarh Rajasthan and Madhya Pradesh (Balakrishnan et al 2019)
The findings of this brief are based on a primary survey conducted across rural areas and urban slums in six energy access deprived states in India ndash Bihar Jharkhand Uttar Pradesh Rajasthan Madhya Pradesh and Chhattisgarh3 The Cooking Energy Access Survey 20204 focused on householdrsquos clean cooking energy access and its barriers and drivers in rural areas and urban slums Based on the list of urban slums across districts in Census 2011 the survey covered 656 households across 83 urban slums (notified and non-notified)5 spread across 58 districts The survey was conducted with the primary cook of the household6
In this brief we focus on understanding access to clean cooking energy specifically across urban slum households The analysis focuses on the fuel use patterns of households the extent of use of LPG and solid fuels fuel stacking behaviour and the primary cookrsquos perception of various cooking fuels and their impact on health The results discussed below are representative of the urban slum population in six states We have refrained from state-level analysis because of the smaller sample size for urban slums in some states like Jharkhand and Chhattisgarh
Are Indiarsquos Urban Poor Using Clean Cooking Fuels Insights from Slums in Six States4
12 Socio-economic characteristics of the urban slums of the six states Non-farm casual labour is the primary source of income for more than 42 per cent of the households such households reported a median monthly expenditure of about INR 5000 In only 20 per cent of the households the primary cook is involved in income-generating activities primarily engaged in casual non-farm labour or are self-employed
Source Authorsrsquo analysis
60 households have a monthly income below
INR 10000
In 90 households all members have
Aadhar cards
94 households have a bank account
11 households are currently indebted
Median savings in the past year
INR 4000
Median monthly expenditure
INR 6000
MEDIAN HOUSEHOLD SIZE
6
5
Table 2 Less than one-third of urban slum households reported income from salaried jobs
Source Authorsrsquo analysis
Under self-employment some of the householdsrsquo report occupations like carpentry tailoring driver and priest
The primary source of income of urban slum households
Non-farmdaily wage casual labour
Private or government salaried job
Shop or own business or self-employed
Farm labour
Agriculture on own or leased land
Others (pension remittances cattle rearing none)
43
22
18
8
7
2
Scheduled Castes (SC) (30 per cent) and Other Backward Castes (OBC) (45 per cent) form the majority of the urban slum population While Scheduled Tribes (ST) constitute less than 10 per cent of the overall population a majority of them are in Madhya Pradesh and Rajasthan Less than 20 per cent of the urban slum population are from the General castes States like Bihar Jharkhand and Rajasthan have the least proportion of General castes living in slum areas
Within urban slum households OBC and General households are relatively better off economically as shown in Table 3 Occupational patterns also vary based on caste A higher proportion of OBCs and General households rely on running a business self-employment or salaried jobs for their primary source of income as compared to SC and ST households The latter are primarily engaged in farm and non-farm labour The socio-economic marginality of SCs and STs even within slums is a consequence of these communities being most deprived in terms of access to resources and education income housing etc (Chandrasekhar and Mitra 2018) We see a similar trend in our sample in education and income levels Slums often remain the permanent habitation of marginalised castes as opposed to serving as an entry point for persons from higher castes who get absorbed into relatively better jobs and eventually move out of the slums (Chandrasekhar and Mitra 2018)
Table 3 Scheduled Castes and Scheduled Tribes have the lowest economic status
Source Authorsrsquo analysis
We utilise an economic status or asset index as a measure of a householdrsquos relative wealth and economic status based on the Filmer and Pritchett (2001) approach The list of variables included in the economic status index can be found in Annexure I The index takes values between 0 and 10 where a higher value denotes a higher level of asset ownership
Caste Sample size
Mean of asset index
(Min ndash Max) of BPL cardholders
233
51
281
92
042
039
046
046
(0ndash084)
(008ndash077)
(003ndash1)
(008ndash09)
45
60
49
36
Scheduled Castes
Scheduled Tribes
Other Backward Classes
General
Introduction state of Indiarsquos urban slums
Are Indiarsquos Urban Poor Using Clean Cooking Fuels Insights from Slums in Six States652
Image iStock
Exclusive use of LPG is limited to just over half of the total slum households The householdrsquos economic status and its access to doorstep delivery of LPG refills are two critical factors that determine their ability to use LPG exclusively
7
The fuel use patterns in urban slum households across the six states show a significant improvement in LPG use over the past decade when compared with the data from
Census 2011 The share of households using polluting fuels (including firewood dung cake agriculture residue and kerosene) as their primary fuel has decreased significantly but we find that stacking is a common practice even among households using LPG as a primary fuel Unless they use clean fuels exclusively such slum households will still be exposed to the health risks associated with HAP
Across the six states the primary fuel used for cooking by slum households
For the analysis in this brief we have categorised the households into three based on their fuel choices and position on the energy ladder those that exclusively use clean cooking fuels (LPG and electricity) stack LPG with polluting fuels and use only polluting fuels The level of exposure to emissions from cooking increases from the first (least harmful) to the third category (most harmful)
2 Cooking fuel adoption and use in urban slum households
In this brief the use of clean cooking fuels is considered synonymous to use of LPG since other clean fuels comprise a negligible share of use
Source Authorsrsquo analysis
Households using clean fuel exclusivelyWhile the majority of these households use LPG two per cent of the households reported using electricity for cooking purposes
Households stacking LPG with polluting fuelsMost of these households reported using LPG as their primary fuel and polluting fuels as their secondary fuel About four per cent of slum households reported using polluting fuels as their primary fuel and LPG as their secondary fuel
Households using only polluting fuelsThese households only use firewood charcoal dung
agricultural residue kerosene or a stack of these fuels
5533
12
Fuel-use categories
Use of LPG as primary fuel
82 (Cooking Energy Access Survey 2020)
47 (Census 2011)
Polluting fuel as primary fuel
16 (Cooking Energy Access Survey 2020)
52 (Census 2011)
Are Indiarsquos Urban Poor Using Clean Cooking Fuels Insights from Slums in Six States8
In the following sections we explore factors such as socio-economic characteristics affordability and availability of fuel intra-household gender dynamics and fuel perceptions which influence the ability and likelihood of a household to use different fuels
21 Households using LPG as their only fuel In this section we focus on understanding the household characteristics and fuel use patterns of those using LPG exclusively for cooking Most urban slum households with an LPG connection report using LPG as their primary fuel While 55 per cent of the slum households (63 per cent of LPG-using households) use LPG exclusively others stack LPG with polluting fuels Uttar Pradesh has the highest
proportion (70 per cent) of slum households who are exclusive users of clean cooking fuels among the six states
Figure 1 Within slums there are considerable state-level variations in householdsrsquo fuel usage patterns across states
Source Authorsrsquo analysis
Note We have refrained from state-level analysis because of the smaller sample size for urban slums in states like Jharkhand and Chhattisgarh
Figure 2 While the majority of LPG-using households use the fuel primarily only half of them use it exclusively
Source Authorsrsquo analysis
0
0
10
10
20
20
30
30
40
40
50
50
60
60
70
70
80
80
90
90
100
100
8682
55
Bihar
LPG users
Chhattisgarh Jharkhand Madhya Pradesh
LPG as the primary fuel LPG as the exclusive fuel
Rajasthan Uttar Pradesh
States
Per
cent
age
of h
ouse
hold
s P
erce
ntag
e of
hou
seho
lds
Exclusive clean fuel users Stacking LPG with polluting fuels Only polluting fuel users
42
3
30
56
45
39
1611
40
4944
46
10 5
24
71
41
28
9Cooking fuel adoption and use in urban slum households
Over a fifth of households using LPG exclusively are PMUY households which suggests that these households have been able to transition to clean cooking fuels in less than four years PMUY households using LPG exclusively are of a relatively higher economic status than households that stack polluting fuels Unlike in rural areas the age of an LPG connection does not have a direct correlation with per capita LPG consumption in urban slum households suggesting that even households with recent LPG connections in urban slums are likely to use LPG exclusively Households in urban areas have been known to experience a direct transition to exclusive use of clean fuels from using traditional fuels (Kuo and Azam 2019) This could be due to the time-saving that comes with the adoption of clean cooking fuels like LPG ndash where urban households are more willing or need to spend more on convenience than rural households
Figure 3 Most households using LPG exclusively acquire six to eight cylinders per year
Source Authorsrsquo analysis
211 The economic status of the household determines exclusive LPG useA simple logistic regression (Annexure II) shows that households with higher asset ownership have significantly higher odds of using LPG as an exclusive fuel Even between primary and exclusive users of LPG asset ownership remains a significant differentiating factor This corroborates the findings of previous studies (Ranjan and Singh 2017) that state that households tend to switch their cooking fuel use patterns after a threshold level of income is achieved However this is not to suggest that all wealthy households shift to exclusive use of clean fuels We discuss the reasons for stacking among these households in the next section
Cooking energy in the household budget We find that households using LPG as their only fuel pay INR 496 per month8 This effectively translates to an average household spending almost eight per cent of their monthly expenses on cooking fuel
Oil and Marketing Companies (OMCs) are attempting to address the challenges around the recurring refilling
cost by encouraging low-income households to use a 5 kilograms (kg) cylinder to overcome the high upfront cost
associated with 145kg cylinders In our sample we find that only about two per cent of urban slum households use
small cylinders (5kg or 3kg)
BOX 2 Uptake of small cylinders
8 This is based on the upfront cost paid by the household for an LPG refill Given that only 40 per cent of the householdsrsquo report receiving LPG subsidy on refills ndash it has not been considered in the fuel expenditure calculation The share of fuel expenditure for the households receiving LPG subsidies would be accordingly less than the others
0
10
20
30
40
50
60
70
1
1 16 8 9
22
60
4350 50
14
34
15
2 3 4 5 6 7 8 9 10 11 12 13
Number of 14 kg LPG cylinder refills obtained by exclusive LPG users
Per
cent
age
of h
ouse
hold
s us
ing
LP
G e
xclu
sive
ly
households using LPG exclusively Median value
Are Indiarsquos Urban Poor Using Clean Cooking Fuels Insights from Slums in Six States
212 Home delivery for exclusive LPG users We find that households who receive doorstep delivery of LPG refills have higher odds of using LPG as their exclusive fuel Hassle-free doorstep delivery of LPG refills is known to influence the use of LPG as a primary secondary or exclusive fuel (PPAC-CRISIL 2016)
Additional expense on procurement of cylinders Almost half of the households who receive doorstep delivery of LPG pay an additional amount of INR 20 as a delivery charge However in households that do not receive doorstep delivery about 46 per cent report that one member must forgo their daily wages to procure the cylinder Most of such households depend on daily labour or private jobs for their income
Given that almost half of the households report having to forgo wages to procure the cylinders it could affect the householdrsquos ability to use LPG continually It may add to the average delay in the purchase of refills
Procurement of LPG cylinders during the COVID-19 pandemic Most households that do not receive doorstep delivery of LPG (58 per cent) use private vehicles (including motorcycles or bicycles) to transport LPG refills About one-third of the households procuring cylinders on their own use rented or shared vehicles The procurement constraints faced by these households would be further aggravated during the COVID-19 pandemic as using rented or shared vehicles comes with its own risks
10
About 18 per cent of the respondents in our survey reported that they resided in non-notified slums Such slums are not legally recognised as a lsquoslumrsquo by the government which makes the residents more vulnerable to eviction In our data we find that adoption and use of LPG is similar across households from notified and non-notified slums Qualitative interviews and field visits showed that most of the respondents were permanent residents of the slums who have been living there for more than 10 years
About 2 per cent of urban slum households use electricity as a source for cooking energy These households do not rely on any other fuels for cooking or non-cooking purposes They use electric stoves to prepare all meals including cooking roti rice and vegetables These households have been using electricity as their cooking fuel only in the past five years Most households report using either a coiled stove or induction stove Less than one per cent of households use other electric appliances such as hot water kettles and toasters for cooking needs
BOX 3
BOX 4
Status of slums impacting the fuel-use pattern
Electricity for cooking
77
households receiving doorstep delivery of LPG cylinders are exclusive users of the fuel
63LPG-using households receive doorstep delivery of cylinders
Male members have to travel to procure the cylinders in 87 households
11Cooking fuel adoption and use in urban slum households
About 4 per cent of urban slum households in the sample reported stacking with kerosene as their secondary fuel Most of these households are in Uttar Pradesh These households also use kerosene more than once a week for cooking
BOX 5 Use of kerosene as a cooking fuel
22 Households stacking LPG with polluting fuels Across the six states almost half of the households (45 per cent) reported using polluting fuels Here we discuss the characteristics and fuel use patterns of households that stack clean and unclean fuels
Though 86 per cent of the households surveyed have an LPG connection we find that over a third (33 per cent) of them stack it with polluting fuels (including firewood dung cakes agriculture residue charcoal and kerosene) The increased stacking could also be a result of more households adopting LPG since households tend to not replace biomass-based fuels completely (Cheng and Urpelainen 2014) These households would need to transition to exclusive use of clean cooking fuels to reduce the health impacts on women and children from household air pollution
About 44 per cent of the households that are stacking fuels rely on informal sources for refills Such households have not ordered any refills in the past one year from their LPG distributors These households mainly rely on recurring cylinders from their neighbours or relatives9
Figure 4 Of the households that stack fuels most use LPG as their primary fuel
Source Authorsrsquo analysis
9 It is important to note that sharing LPG cylinders among neighbours and extended family is a regular phenomenon in small towns and rural areas owing to availability challenges and it is not necessarily driven by an intention to siphon off subsidy amounts against the commodity ( Jain et al 2018)
Exclusive clean fuel users
Stacking with LPG as the primary fuel
Only polluting fuel users
Stacking LPG with polluting fuels
Stacking with LPG as the secondary fuel
55
3388
12
12
Are Indiarsquos Urban Poor Using Clean Cooking Fuels Insights from Slums in Six States12
221 Household factors that determine the decision to stack fuels Even within the stacking households the reason for stacking multiple fuels varies significantly Primarily households who stack can be divided into two categories ndash those that stack as they cannot afford LPG refills and those that stack due to other factors like taste preferences and alternate end-uses of the fuel
Households who are stacking primarily due to affordability concerns ndash Across asset quintiles we find that stacking is most common among the middle categories (second and third quintile) where most have adopted LPG Still the affordability of the fuel remains a significant concern More than 60 per cent of the households that are stacking fuels collect or prepare firewood or dung cakes free of cost rather than purchasing them from the market Those who buy biomass do not spend more than INR 100 per month on it Based on the responses of the primary cook we note that the high cost of LPG and free-of-cost availability of solid fuels are the most common factors that affect the fuel choices made by the household
Figure 5 Stacking is prevalent in households across asset quintile categories
Source Authorsrsquo analysis
1 2 3 4 5
Asset quintile categories
0
20
40
60
80
100
Per
cent
age
of h
ouse
hold
s
Exclusive clean fuel users Stacking LPG with polluting fuels Only polluting fuel users
5348
52
6367
2441 37
3232
2311 11
51
Households who use LPG primarily and polluting fuels as secondary fuels have a median annual refill rate of
6 cylinders
Households who use polluting fuels primarily and LPG as a secondary fuel have a median annual refill rate of
4 cylinders
13
Households that are stacking for reasons beyond affordability ndash More than one-fourth of the households that are stacking have a median annual refill rate of eight cylinders and above despite having a similar household size as others Most such households fall in the highest asset quintiles This suggests that they are not necessarily using unclean fuels due to the unaffordability of LPG but due to other factors such as taste preference for chulhas and fuel end-uses that influence the householdrsquos decision to use solidpolluting fuels Such households reported using LPG for a median period of six years The solid fuels are primarily used for cooking chapatis or vegetables in these households
Interestingly even households with multiple LPG connections and two cylinder connections report stacking with polluting fuels The possession of multiple LPG connections in these households may not necessarily be an indicator of diversion mdash the average family size of these households is more than eight indicating the high possibility of having separate kitchens within the same household Given that such households have a median annual refill rate of ten cylinders another plausible reason for multiple connections is that it prevents them from relying on just one distributor which increases their chances of getting refills whenever needed
222 End-uses of polluting fuels Across both the groups discussed above half of the households who stack with polluting fuels use these fuels at least once a day (Figure 6) Also almost 45 per cent of the households that stack fuels use multiple stoves at the same time while preparing a single meal This indicates that even if the household is using LPG for a particular meal they would be using their chulha simultaneously
Despite using LPG as the primary fuel for their cooking needs households that are stacking fuels use polluting fuels for non-cooking purposes like heating water for bathing (29 per cent) and space heating (10 per cent)
Figure 6 Almost half of the households using polluting fuels use it every day
Source Authorsrsquo analysis
0 5 10 15 20
19
11
21
20
29
25 30 35
Percentage of households
Freq
uenc
y of
use
of p
ollu
ting
fuel
s Several times a day
Once per day
Few times a week
Once a week
Occasionally
21 households stacking fuels
have more than one LPG connections
25 households stacking fuels have two-cylinder connections
Cooking fuel adoption and use in urban slum households
Are Indiarsquos Urban Poor Using Clean Cooking Fuels Insights from Slums in Six States14
223 Seasonal variations in the stacking of fuels We also noted a significant seasonal change in fuel use patterns LPG is most popular in the rainy season (88 per cent) and least popular in the winter months (45 per cent) (Figure 7) The dampness associated with solid fuels in the rainy season could be the reason for using LPG primarily during these months The literature also suggests that solid fuels are a popular choice during winter months (S Singh 2014 Baqir et al 2019) This could be because during winter months the solid fuel requirement for non-cooking tasks within the household likes water heating for bathing and space heating increases Since households are already using solid fuels for non-cooking tasks they may be using these fuels more for cooking during winter Unfortunately the increased use of solid fuels in winter exacerbates the much higher air pollution exposure of these households due to unfavourable atmospheric conditions
Figure 7 Proportion of urban slum households using solid fuels as the primary cooking fuel increases during the winters months aggravating household air pollution exposure due to unfavourable atmospheric conditions
Source Authorsrsquo analysis
About 3 per cent of urban slum households reported owning an electric water-heating device (geyser or immersion
rod) Similarly only 4 per cent of the households own an electric room heater
BOX 6 Electric devices for water heating and space heating
Summer Winter Rainy Festival0
20
40
60
80
100
120
Per
cent
age
of h
ouse
hold
s
LPG Solid fuel
78
45
88
67
22
55
1233
15
Figure 8 Lack of awareness about receiving LPG refill subsidies poses a threat to the success of LPG subsidy schemes
Source Authorsrsquo analysis
Connections under the Pradhan Mantri Ujjwala Yojana (PMUY) 23 per cent of these households reported receiving benefits under the PMUY
The six states included in the survey account for a significant share of PMUY coverage ndash 54 per cent of all connections provided under PMUY (PPAC 2019) However most of these connections cater to rural households One of the reasons for there being fewer PMUY connections in urban areas is that more than half of all urban slum households reported already having had LPG connections for over four years (before the launch of PMUY) Moreover over a quarter of PMUY households10 in urban slums reported having multiple LPG connections which suggests that not every household which was using LPG before the PMUY was prevented from accessing the schemersquos benefits
Government support during the COVID-19 pandemic During the COVID-19 lockdown the government announced the provision of three free-of-cost refills for PMUY households under the PM-Garib Kalyan Yojana While PMUY households in urban slums benefitted from this scheme non-PMUY households in urban slums did not As documented urban slum households faced a significant economic hit due to the loss of jobs and incomes during the pandemic (Patel 2020) Non-PMUY households that stack for economic reasons are more likely to use cheaper and freely available solid fuels without additional support from the government
PAHAL-Direct Benefit Transfer for LPG (DBTL)Overall about 42 per cent of active LPG users11 reported receiving a subsidy for their last LPG refill under the Direct Benefit Transfer for LPG scheme (DBTL) However about 28 per cent of urban slum households reported not knowing if they had received the subsidy amount for their last refill this suggests that the primary cook is often unaware of whether the subsidy is credited to the household Among the ones that reported receiving the LPG subsidy about 40 per cent of the primary cook were not aware of the amount of subsidy being credited into their account
10 This is a relatively smaller sample of 43 households from all the PMUY households in urban slums (131 households)
11 Households that have taken at least one refill in the past year
42
30
28
Received LPG refill subsidy
30 Still repaying PMUY loan
Did not receive LPG refill subsidy
10 Gave up LPG refill subsidy
Do not know
60 LPG refill susbsidy not received due to other reasons
Cooking fuel adoption and use in urban slum households
Are Indiarsquos Urban Poor Using Clean Cooking Fuels Insights from Slums in Six States16
23 Households using only polluting fuels About 12 per cent of urban slum households rely entirely on polluting fuels for all cooking and non-cooking purposes While the share of these households is relatively small the non-adoption of LPG in such households despite
programmes like the PMUY is concerning These households either use a combination of different polluting fuels (firewood dung cakes agricultural residue charcoal and kerosene) or just one of these fuels for all their energy needs Firewood is the most commonly used fuel in these households
231 Reasons for the non-adoption of LPGHouseholds that rely exclusively on polluting fuels reported not having an LPG connection Though three-fourths of these households were aware of PMUY the high upfront cost of an LPG connection along with the high recurring cost of procuring refills remain the two most important reasons for not procuring an LPG connection Repondents also mentioned a lack of information on how to procure a connection as a reason These reasons align with the common causes cited by rural households covered in the survey implying that the challenges faced by rural households and urban slum households in procuring connections are similar
Almost half of the households in this category use solid fuels for non-cooking purposes such as heating water for bathing space heating and preparing fodder for animals On the positive aspects of using polluting fuels households reported the following free-of-cost easy availability of fuels better tasting food and preference of family members for food cooked on the chulha
232 Fuel availability and affordabilityIn contrast with households that stack fuels households that use only solid fuels rely on purchasing fuels rather than collecting or preparing them For instance 60 per cent of firewood users in this category procure fuel by purchasing rather than collecting it
Households with low asset ownership rely on polluting fuels for cooking These households spend 2ndash3 per cent of their median monthly expenditure on fuel (INR 75 per month on fuel) which is much lower than what they would have to spend if they used LPG exclusively (INR 496 per month) Households that collect solid fuels spend about two hours on a single trip (three times a month) travelling a median one-way distance of 2 km This is equivalent to the distance travelled to procure LPG cylinders (if not delivered at home)
Figure 9 More than half of the households currently without LPG do not know how to get a connection or whom to ask about it implying a lack of awareness
Source Authorsrsquo analysis
0 10 20 30 40 50 60 70
39
53
63
68
80
Percentage of households
Rea
sons
for N
on-A
dop
tion
of L
PG Installation is expensive
Monthly expenditure on LPG is high
Do not know how to get or whom to ask
Not availabletoo far
17
12 See Annexure III for details on the districts and their PM25 concentrations The data for 15 districts (from Bihar Uttar Pradesh Madhya Pradesh and Rajasthan) overlapping with the survey sample have been analysed based on the availability of air quality data from continuous monitoring stations
13 Air quality categories based on PM25 concentration (in μgm3)
Good 0 to 30 Satisfactory 31 to 60 Moderately polluted 61 to 90 Poor 91 to 120 Very poor 121 to 250 Severe above 250 (Central Pollution Control Board 2014)
Cooking fuel adoption and use in urban slum households
Winter months have the highest PM25 concentrations coinciding with the sharp increase in use of polluting fuels for heating bath water and room heating
233 Gendered time use in households using solid fuelsIn urban slums both the male and female members of the household are equally involved in collecting firewood Still it is primarily the female members of the household who undertake dung cake preparation In addition to engaging in fuel collection and preparation women tend to spend more time cooking in households using solid fuels About 85 per cent of households that transitioned to LPG in the past four years reported having saved time while cooking compared to when they used solid fuels
SPOTLIGHT I Household air pollution (HAP) in urban slums
Burning solid fuels in three-stone fires and mud stoves with inadequate ventilation causes high levels of smoke exposure and negative health impacts particularly for women and young children (WHO 2014)
The double burden of ambient and household air pollution on the urban slum populationUsing the PM25 data from continuous ambient air quality monitoring stations (CAAQMS) for 15 districts12 in our sample we found that the ambient air quality remained in the lsquopoorrsquo or worse category13 for most districts throughout the year variation in the ambient air quality
Are Indiarsquos Urban Poor Using Clean Cooking Fuels Insights from Slums in Six States
Impact of ventilation
Indoor cooking and low adoption of chimney indicates high exposure to pollution from the use of unclean fuels for cooking The proportion of households with a chimney is high (52 per cent) among those who rely only on polluting fuels Smith and Pillarisetti (2017) explain that while having a good chimney lowers peak levels of indoor pollution long-term average exposure is reduced only by a factor of two Besides chimneys require regular maintenance to function correctly While more than 45 per cent of the households are using polluting fuels less than 20 per cent of the slum housheolds use improved cookstoves
Households also use solid fuels for non-cooking uses like space heating On average each house in a slum has two rooms this effectively exposes all members of the household to emissions from burning fuels Emissions from household sources contribute significantly to the surrounding air quality (Harish et al 2019) this concern is exacerbated in congested slum areas
the winter months (November to February) have the highest concentration of PM25 This leads to a double burden of exposure for slum households stacking solid fuels as they are more likely to increase use of solid fuels in winters (Figure 7) Alternatively the use of LPG as the primary source of fuel increases during the rainy season (June to September) these months record the least ambient air pollution
We also find that districts like Meerut Ghaziabad Patna Gautam Buddha Nagar (Noida and Greater Noida) and Muzaffarpur have the highest frequency of lsquovery poorrsquo air quality days throughout the year Across these districts one-third of households use polluting fuels for cooking In urban slums where households are more densely packed the emissions from burning solid fuels increase the risk of exposure inside households and deteriorate the ambient air quality for the community at large As a result these communities suffer from both increased household and ambient air pollution HAP has an estimated average contribution of 30ndash50 per cent to ambient air quality across Indiarsquos urban and rural areas (Balakrishnan et al 2019) Addressing biomass burning for cooking water heating and space heating during the winters has the potential to help reach the national ambient air quality standards (Chowdhury et al 2019) Despite that only 2 per cent of the action points in 44 city clean air plans mention cooking and heating as a sector to address air pollution (Ganguly Selvaraj and Guttikunda 2020)
18
75 householdsrsquo
using polluting fuels cook inside
the main house
67 householdsrsquo using polluting fuels do not have a chimney for ventilation
Awareness about the health impacts of using polluting fuelsAbout 60 per cent of households using only polluting fuels and 84 per cent of households that stack LPG with a polluting fuel report lsquotoo smokyrsquo as the most prominent negative aspect of using polluting fuels This suggests that as more households switch to clean cooking fuels perceptions regarding pollution fuels change
Three-fourths of primary cooks who use polluting fuels for cooking agree that smoke from solid fuels is harmful to them this implies that awareness of the adverse health impacts of polluting fuels does not necessarily lead to the uptake of clean fuels Primary cooks also agree that smoke from solid fuels causes coughing (49 per cent) and lung infections in children (39 per cent)
Exposure to air pollution is a known risk factor for underlying chronic diseases that predict the severity of
COVID-19 disease and patient outcomes (World Bank 2020) This linkage suggests a heightened risk for women
in all age groups who cook using traditional technologies and fuels (World Bank 2020) The highest number of
COVID-19 cases were recorded in the most polluted regions among patients with pre-existing health conditions
(Frontera et al 2020)
Results from a controlled study show a higher prevalence of chronic obstructive pulmonary disease (COPD)
among biomass fuel users than clean fuel users ( Johnson et al 2011) The available clinical data to date suggest
that cardiovascular disease diabetes chronic respiratory illness and hypertension ndash conditions all strongly
associated with exposure to HAP ndash are also risk factors for COVID-19 (World Bank 2020)
BOX 7 Impact of household air pollution on COVID-19
19Cooking fuel adoption and use in urban slum households
Are Indiarsquos Urban Poor Using Clean Cooking Fuels Insights from Slums in Six States
Traditionally women bear a disproportionate burden in collecting and preparing biomass for cooking While this burden reduces with the use of clean cooking fuels like LPG the fuel supply within the household is then determined by formal and monetised distribution networks involving an outlay of money (Patnaik and Jha 2020) Our data shows that womenrsquos status in the household (as heads of households)14 positively correlates with households using LPG as their primary fuel The existing literature also supports the idea that female-headed households prefer modern fuels to polluting ones (Farsi Filippini and Pachauri 2007 Rao and Reddy 2007 Kuo and Azam 2019) Other research also suggests that female-headed households are more willing to spend on LPG as a recurring expense (Kojima Bacon and Zhou 2011 Kuo and Azam 2019)
SPOTLIGHT II Womenrsquos participation in intra-household decision-making regarding LPG use
20
14 In almost half of the households surveyed the primary cook reported a female member being the head of the household The reason behind such high percentage of female-headed households could be because only the primary cook of every household (who is mostly female) was surveyed This does not mean that these households do not have any adult male members Traditionally headship refers to the head of household as the individual whose lsquoauthorityrsquo the household members recognise But this definition overlooks potential intra-household variations in the recognised authority in different realms of decision-making (Kilic Moylan and Koolwal 2020) Since cooking is a gendered activity the primary cookrsquos response to the head of household question may have been with respect to the recognised authority figure for that activity within the household
30 householdsrsquo female members place the order for LPG refills
50householdsrsquo female
members decide whether or when to purchase LPG refills
We also find that the decision of whether or when to purchase LPG refills is made by male members in half of urban slum households This holds for both male- and female-headed households In LPG-using households where the primary cook is involved in an income-generating activity more women are deciding to order the refills This pattern is similar irrespective of whether the household uses LPG exclusively or stacks it with other polluting fuels or are PMUY beneficiaries
SPOTLIGHT III A comparison of access to clean cooking energy between urban slum and non-slum households across six states
21
At the state level Bihar has significantly poor involvement of women in intra-household decision-making regarding
ordering refills with less than 10 per cent of households reporting that women decide whether or when to order
refills However more women than men are involved in decisions around LPG refills in Rajasthan Madhya Pradesh
and Jharkhand
Across caste groups the involvement of women is lowest (37 per cent) among the Scheduled Castes (SCs)
However more women in General and OBC households decide when to order LPG refills
BOX 8 Variations in intra-household decision-making across states and caste groups
Cooking fuel adoption and use in urban slum households
To compare the fuel use patterns of urban slum and non-slum households we used data from the India Residential Energy Survey (IRES 2020)15 The overlap in the sampling strategies of both IRES and our survey enabled a comparison of the findings There is a significant difference in the socio-economic status of slum and non-slum households which tends to affect their fuel use patterns Table 4 provides a comparison of cooking fuel usage in urban non-slum households (from IRES 2020) and urban slum households (Cooking Energy Access and Use survey 2020)
Are Indiarsquos Urban Poor Using Clean Cooking Fuels Insights from Slums in Six States22
Table 4 The poor economic condition of households in urban slums impacts the exclusive use of clean fuels for cooking
Source Authorsrsquo analysis
Fuel use categories Urban slum households (Cooking Energy Access Survey) ()
Non-slum urban households (IRES) ()
95 88
84 55
9 33
5 12
Clean fuel users (LPG PNG and electricity)
LPG as an exclusive fuel
Households that stack LPG with polluting fuels
Households that use only polluting fuels
We observed a significant gap in the exclusive use of LPG as a cooking fuel between urban slums and non-slum households explained mainly by the difference in their economic conditions Stacking is three times more common in slum households than non-slum households About 45 per cent of non-slum households using polluting fuels belong to marginalised social groups (SCs and STs) Households using polluting fuels have a lower median monthly expenditure than others and about 62 per cent of such households are semi-pucca or kuchha structures Among LPG users non-slum households have a slightly higher rate of doorstep delivery as compared to slum households
LPG-using households receiving home deliveries
Source Authorsrsquo analysis
239
6372
Urban slum households (Cooking Energy Access and Use)
()
Non-slum urban households (IRES)
()
Proportion of PMUY beneficiaries among LPG-using households
15 IRES 2020 was conducted in 21 large states of India including Bihar Jharkhand Rajasthan Madhya Pradesh Uttar Pradesh and Chhattisgarh While IRES 2020 focused on urban households the Cooking Energy Access and Use survey specifically attended to urban slums in the same districts Refer to the technical note for a detailed methodology of the survey
23
3 Way forward
Slums across the world are chronically ignored in public policy and suffer because of unauthorised and unsafe habitation without access to government services (Shahadat
Lipu and Bhuiyan 2014) In terms of energy access while we see a progressive change in householdsrsquo energy use patterns as we move from rural to urban issues like affordability availability preference and familiarity with the fuel and stove remain essential factors that determine householdsrsquo fuel choice
Image iStock
Are Indiarsquos Urban Poor Using Clean Cooking Fuels Insights from Slums in Six States24
Understanding categories of users is important for enabling access to and use of clean cooking fuels
We categorised the urban slum population based on their fuel usage patterns ndash using only clean fuels stacking clean fuels with polluting fuels and using only polluting fuels While most households in urban slums have an LPG connection only half of them use LPG exclusively The householdrsquos economic status and its access to doorstep delivery of LPG refills are two crucial factors that determine its ability to use LPG exclusively Despite being situated in urban areas 37 per cent of slum households do not receive home delivery of cylinders ndash availability is an essential factor in determining the householdrsquos likelihood of using LPG exclusively There is a strong impetus for the OMCs and distributors to improve their home delivery services of LPG refills in slum areas
Stacking is prevalent in about one-third of households ndash there is a need for a deeper understanding of householdsrsquo preferences fuel end-uses and awareness Most households reported using polluting fuels daily or at least weekly this effectively increases their exposure to household air pollution despite having access to clean cooking fuels Among households that stack LPG with polluting fuels the reasons for stacking differ ndash affordability seasonality and taste preference More than a quarter of households that stack have a similar level of LPG consumption as those that use LPG exclusively despite similar family sizes Such households use polluting fuels not because of their inability to afford LPG But other factors like free-of-cost availability of biomass taste preference for chulha and alternate end-uses of fuelmdashfor instance in space heatingmdashinfluence the householdrsquos decision to use solid fuels Among households that stack multiple fuels the use of polluting fuels increases during winter months this exposes the households to a double burden of high ambient and household air pollution in these months About 40 per cent of these households also use polluting fuels for non-cooking purposes like heating water for bathing and space heating especially in winter
Even with large-scale government initiatives like PMUY we find that more than 10 per cent of urban slum households do not use LPG They mainly rely on free-of-cost biomass for their cooking and non-cooking needs Despite awareness of PMUY among these households the high upfront cost of procuring an LPG connection and high recurring expenditure on refills deter them from using LPG Evidently there is a need to expand the reach of PMUY to cover households across slums
Integrating the issue of lack of access to clean cooking energy within the discussion on urban poverty
This study reiterates the need to look at poverty in urban areas in the context of energy access Given the heterogeneity of poverty in urban and semi-urban India it is essential to understand energy poverty in the context of access to resources for an enhanced quality of life for the urban poor Similarly slums dwellers in large and small cities alike may experience additional challenges of access Furthermore not all urban poor live in slums we know even less about the access issues of temporary residents or seasonal migrants in urban India Therefore in a rapidly urbanising India studies on the urban poor and air quality need to integrate a focus on energy access to address the vulnerability of women children and communities to HAP and the drudgery of using polluting fuels for cooking and other household energy needs
Access to clean cooking energy schemes must be integrated into the social assistance programmes focused on urban poverty alleviation to enhance its reach
25Way forward
Converging energy access in social protection policies for the urban poor
Accounting for the vulnerabilities of the urban poor is crucial in designing and implementing policies including social protection schemes As a health and economic imperative access to clean cooking energy schemes must be integrated into the social assistance programmes of other ministries (eg health education and nutrition assistance) to offer better support to slum households This would also reduce the burden on households of claiming and accessing multiple benefits across schemes thus freeing them to invest more time in productive activities (CEEW 2020) Government programmes such as the National Urban Livelihoods Mission and social service allocations for housing should use existing targeting approaches to include access to clean cooking energy within the ambit of services for the poor
Bringing a renewed emphasis on clean cooking energy access due to COVID-19 is essential
Most households in urban slums rely on daily wage labour or the gig economy for their household income During the COVID-19 pandemic these occupations have been among the worst impacted by the lockdown and the economic slowdown A survey conducted with over 2000 daily wage workers in urban slums during the lockdown suggests that only 7 per cent of respondents from this group received pay during the lockdown (Basu 2020) causing a massive shock to their livelihoods and wage earnings This kind of impact pushes households into energy poverty leading to the increased use of free-of-cost biomass and consequently increasing the risk of exposure to emissions from fuel burning While the government has committed to supplying up to three free refills to all PMUY households under PM-Garib Kalyan Yojana less than a quarter of households in urban slums have Ujjwala connections The low share of PMUY households effectively makes the majority of slum households ineligible for relief support given under the PM-Garib Kalyan Yojana during the lockdown There is a need to target vulnerable households ndash beyond PMUY beneficiaries ndash with differential subsidy support for using LPG in a sustained manner
Increased poverty would mean increased use of polluting fuels ndash there is a need for a renewed emphasis on clean cooking energy access during the COVID-19 pandemic as increased use of polluting fuels has health implications (lower respiratory infections and COPD) that increase the risk of COVID-19 infections being more severe
There is a need to target vulnerable households ndash beyond PMUY beneficiaries ndash with differential subsidy support for using LPG in a sustained manner
Are Indiarsquos Urban Poor Using Clean Cooking Fuels Insights from Slums in Six States
Balakrishnan Kalpana Sagnik Dey Tarun Gupta R S Dhaliwal Michael Brauer Aaron J Cohen Jeffrey D Stanaway et al 2019 ldquoThe Impact of Air Pollution on Deaths Disease Burden and Life Expectancy Across the States of India The Global Burden of Disease Study 2017rdquo The Lancet Planetary Health 3 (1) e26ndash39 httpsdoiorg101016S2542-5196(18)30261-4
Baqir M S K Bharti R Kothari and R P Singh 2019 ldquoAssessment of an Energy-efficient Metal Chulha for Solid Biomass Fuel and Evaluation of its Performancerdquo International Journal of Environmental Science and Technology 16 (11) 6773ndash6784 httpsdoiorg101007s13762-018-2028-9
Basu Anika Badyal 2020 ldquoLockdown Survey How The Covid-19 Crisis Has Affected Daily Wage WorkersmdashAIFrdquo American India Foundation June 28 httpsaiforglockdown-survey-how-the-covid-19-crisis-has-affected-daily-wage-workers
Butera F M P Caputo R Adhikari and A Facchini 2016 ldquoThe Challenge of Energy in Informal Settlements A Review of the Literature for Latin America and Africardquo Procedia Engineering 1ndash32 httpswwwenelfoundationorgcontentdamenel-foundtopic-downloadThe challenge of Energy in Informal settlementspdf
CEEW 2020 ldquoEnergy Safety Nets India Case Studyrdquo Vienna Sustainable Energy for All httpswwwceewinpublicationsenergy-safety-nets-india-case-study
Central Pollution Control Board 2014 ldquoNational Air Quality Indexrdquo New Delhi Central Pollution Control Board httpsappcpcbccrcomccr_docsFINAL-REPORT_AQI_pdf
Chafe Z S Mehta and K R Smith 2011 ldquoAmbient Fine Particulate (PM25) Air Pollution Attributable to Household Cooking Fuel in Asiardquo AGUFM A54Bndash03 httpsuiadsabsharvardeduabs2011AGUFMA54B03Cabstract
Chandramouli C 2010 ldquoCensus of India 2011 ndash Circular No 8rdquo New Delhi Ministry of Home Affairs httpscensusindiagovin2011-CircularsCircularsCircular-08pdf
Chandrasekhar S and Arup Mitra 2018 ldquoMigration Caste and Livelihood Evidence from Indian City-slumsrdquo Urban Research amp Practice 12 (2) 156ndash172 httpsdoiorg1010801753506920181426781
Cheng Chao Yo and Johannes Urpelainen 2014 ldquoFuel Stacking in India Changes in the Cooking and Lighting Mix 1987ndash2010rdquo Energy 76 (November) 306ndash317 httpsdoiorg101016jenergy201408023
Chowdhary Sourangsu Sagnik Dey Sarath Guttikunda Ajay Pillarisetti Kirk R Smith and Larry Di Girolamo 2019 ldquoIndian annual ambient air quality standard is achievable by completely mitigating emissions from household sourcesrdquo Proceedings of the National Academy of Sciences 116 (22) 10711-10716 httpsdoiorg101073pnas1900888116
Dhingra Chhavi Shikha Gandhi Akanksha Chaurey and P K Agarwal 2008 ldquoAccess to Clean Energy Services for the Urban and Peri-Urban Poor A Case-study of Delhi Indiardquo Energy for Sustainable Development 12 (4) 49ndash55 httpsdoiorg101016S0973-0826(09)60007-7
Farsi Mehdi Massimo Filippini and Shonali Pachauri 2007 ldquoFuel Choices in Urban Indian Householdsrdquo Environment and Development Economics 12 (6) 757ndash774 httpsdoiorg101017S1355770X07003932
References
26
Frontera Antonio Lorenzo Cianfanelli Konstantinos Vlachos Giovanni Landoni and George Cremona 2020 ldquoSevere Air Pollution Links to Higher Mortality in COVID-19 Patients The lsquoDouble-Hitrsquo Hypothesisrdquo Journal of Infection 81 (2) 255ndash259 httpsdoiorg101016jjinf202005031
Ganguly Tanushree Kurinj L Selvaraj Sarath K Guttikunda 2020 ldquoNational Clean Air Programme (NCAP) for Indian cities Review and outlook of clean air action plansrdquo Atmospheric Environment X Vol 8 httpsdoiorg101016jaeaoa2020100096
GNESD 2008 ldquoClean Energy for the Urban Poor An Urgent Issuerdquo Accessed 25 July 2020 httpswwwgooglecomurlsa=tamprct=jampq=ampesrc=sampsource=webampcd=ampved=2ahUKEwi1hf2ru dntAhUCOisKHQH7BtsQFjAAegQIAxACampurl=http3A2F2Fwwwgnesdorg2F-2Fmedia2FSites2FGNESD2FPublication- pdfs2FSPM_CleanEnergyashx3Fla3Dda26hash3DE4971C585B6798F17954F8B42E073 D9507F42A84ampusg=AOvVaw08kCDgOkTkYc6wRDxzsNyq
Guan Wei-Jie Wen-Hua Liang Yi Zhao Heng-Rui Liang Zi-Sheng Chen Yi-Min Li Xiao-Qing Liu et al 2020 ldquoComorbidity and its Impact on 1590 Patients with COVID-19 in China A Nationwide Analysisrdquo European Respiratory Journal 55 (5) 2000547 httpsdoiorg1011831399300300547-2020
Harish Santosh Kirk R Smith Sourangsu Chowdhury Zoe A Chafe Ajay Pillarisetti Jos Lelieveld Sarath Guttikunda Sagnik Dey and Andrew P Grieshop 2019 ldquoThe Contribution of Household Fuels to Ambient Air Pollution in India A Comparison of Recent Estimates Edited by CcapcOrgInrdquo Collaborative Clean Air Policy Centre May 30 httpsccapcorginpolicy-briefs2019530the-contribution-of-household-fuels-to-ambient-air-pollution-in-india-a-comparison-of-recent-estimates
Jain Abhishek Saurabh Tripathi Sunil Mani Sasmita Patnaik Tauseef Shahidi and Karthik Ganesan 2018 ldquoAccess to Clean Cooking Energy and Electricity Survey of States 2018rdquo New Delhi CEEW httpswwwceewinsitesdefaultfilesCEEW-Access-to-Clean-Cooking-Energy-and-Electricity-11Jan19_0pdf
Johnson Priscilla Kalpana Balakrishnan Padmavathi Ramaswamy Santu Ghosh Muthukumar Sadhasivam Omprakash Abirami Bernard W C Sathiasekaran Kirk R Smith Vijayalakshmi Thanasekaraan and Arcot S Subhashini 2011 ldquoPrevalence of Chronic Obstructive Pulmonary Disease in Rural Women of Tamilnadu Implications for Refining Disease Burden Assessments Attributable to Household Biomass Combustionrdquo Global Health Action 4 (1) 7226 httpsdoiorg103402ghav4i07226
Kilic Talip Heather Moylan and Gayatri Koolwal 2020 ldquoGetting the (Gender-disaggregated) Lay of the Land Impact of Survey Respondent Selection on Measuring Land Ownership and Rightsrdquo Washington DC The World Bank httpsdoiorg1015961813-9450-9151
Kojima Masami Robert Bacon and Xin Zhou 2011 ldquoWho Uses Bottled Gas Evidence from Households in Developing Countriesrdquo The World Bank Sustainable Energy Department Oil Gas and Mining Unit httpelibraryworldbankorgdoibook1015961813-9450-5731
Kuo Ying-Min and Mehtabul Azam 2019 ldquoHousehold Cooking Fuel Choice in India 2004ndash2012 A Panel Multinomial Analysisrdquo IZA Discussion Paper No 12682 httpsssrncomabstract=3468630
Lippi Giuseppe and Brandon Michael Henry 2020 ldquoChronic Obstructive Pulmonary Disease Is Associated with Severe Coronavirus Disease 2019 (COVID-19) COPD and COVID-19rdquo Respiratory Medicine 167 105941 httpsdoiorg101016jrmed2020105941
Ministry of Housing and Urban Affairs 2019 ldquoHandbook of Urban Statisticsrdquo New Delhi Government of India httpmohuagovinpdf5c80e2225a124Handbook of Urban Statistics 2019pdf
Rao M Narasimha and B Sudhakara Reddy 2007 ldquoVariations in Energy Use by Indian Households An Analysis of Micro Level Datardquo Energy 32 (2) 143ndash153 httpsdoiorg101016jenergy200603012
27References
Are Indiarsquos Urban Poor Using Clean Cooking Fuels Insights from Slums in Six States28
National Buildings Organisation 2013 ldquoState of Slums in India a Statistical Compendium 2013rdquo New Delhi Government of India httpnbonicinpdfSlums_in_India_Compendium_English_Versionpdf
National Sample Survey Office 2012 ldquoKey Indicators of Urban Slums in India ndash 69th Roundrdquo New Delhi National Data Bank for Socio-religious Categories httpmospinicinsitesdefaultfilesnational_data_bankndb-rpts-69htm
Nolan Laura B 2015 ldquoSlum Definitions in Urban India Implications for the Measurement of Health Inequalitiesrdquo Population and Development Review 41 (1) 59ndash84 httpsideasrepecorgablapopdevv41y2015i1p59-84html
Nolan Laura B David E Bloom and Ramnath Subbaraman 2018 ldquoLegal Status and Deprivation in Urban Slums Over Two Decadesrdquo HHS Public Access 53 (15) 47ndash55
Patel Amit 2020 ldquoPreventing COVID-19 Amid Public Health and Urban Planning Failures in Slums of Indian Citiesrdquo World Medical amp Health Policy 12 (3) httpsdoiorg101002wmh3351
Patnaik Sasmita and Shaily Jha 2020 ldquoCaste Class and Gender in Determining Access to Energy A Critical Review of LPG Adoption in Indiardquo Energy Research amp Social Science 67 (September) 101530 httpsdoiorg101016jerss2020101530
PPAC-CRISIL 2016 ldquoAssessment Report Primary Survey on Household Cooking Fuel Usage and Willingness to Convert to LPGrdquo New Delhi Petroleum Planning amp Analysis Cell Ministry of Petroleum and Natural Gas Government of India httpswwwppacgovinWriteReadDataReports201710310449342512219PrimarySurveyReportPPACpdf
PPAC 2019 ldquoOil Industry Information at a Glancerdquo New Delhi Ministry of Petroleum and Natural Gas Government of India httpswwwppacgovinWriteReadDataReports201912060336500305462ReadyReckonerNov2019WebVersionpdf
Rahaman Mehebub and Dipendra Nath Das 2017 ldquoNature of Slum Growth in Indian Citiesrdquo Urban India 37 (II) 100ndash116 httpswwwresearchgatenetpublication334051882_Nature_of_Slum_Growth_in_Indian_Citiesread
Rains Emily Anirudh Krishna and Erik Wibbels 2018 ldquoUrbanisation and Indiarsquos Slum Continuum Evidence on the Range of Policy Needs and Scope of Mobilityrdquo London International Growth Centre httpswwwtheigcorgwp-contentuploads201802Rains-et-al_Working-paper_coverpdf
Ranjan Rahul and Sudershan Singh 2017 ldquoEnergy Deprivation of Indian Households Evidence from NSSO Datardquo New Delhi Munich Personal RePEc Archive httpsmpraubuni-muenchende835661MPRA_paper_83566pdf
Roy Debraj Bharath Palavalli Niveditha Menon Robin King Karin Pfeffer Michael Lees and Peter M A Sloot 2018 ldquoSurvey-based Socio-economic Data from Slums in Bangalore Indiardquo Nature Publishing Group 5 1ndash9 httpsdoiorg101038sdata2017200
Saksena Sumeet P B Singh Raj Kumar Prasad Rakesh Prasad Preeti Malhotra Veena Joshi and R S Patil 2003 ldquoExposure of Infants to Outdoor and Indoor Air Pollution in Low-income Urban Areas A Case Study of Delhirdquo Journal of Exposure Science amp Environmental Epidemiology 13 219ndash30 httpsdoiorg101038sjjea7500273
Lipu Molla Shahadat Hossain and Arif Waliullah Bhuiyan 2014 ldquoElectricity Access in Urban Slum Households of Bangladesh A Case of Dhakardquo Journal of Renewable and Sustainable Energy 6 (053112) 1ndash15 httpsdoiorg10106314896697
29
Singh Rozita Xiao Wang Emmanuel Ackom and Juan Reyes 2015 ldquoEnergy Access Realities in Urban Poor Communities of Developing Countries Assessments and Recommendationsrdquo Global Network on Energy for Sustainable Development (GNESD) httpswwwgooglecomurlsa=tamprct=jampq=ampesrc=sampsource=webampcd=ampved=2ahUKEwj5nbqI wdntAhXUTX0KHZE6DboQFjAAegQIAhACampurl=https3A2F2Forbitdtudk2Ffiles2F10635 24942FEnergy_access_realities_v_final_updatedpdfampusg=AOvVaw0xNBAAo0bjLueY9FmoigKF
Singh Santosh 2014 ldquoThe Kaleidoscope of Cooking Understanding Cooking Behaviour and Stove Preferences in Rural Indiardquo New Delhi Deutsche Gesellschaft fuumlr Internationale Zusammenarbeit (GIZ) GmbH httpswwwgizdeendownloadsgiz2014-en-kaleidoscope-of-cooking-indiapdf
Smith Kirk R and Ajay Pillarisetti 2017 ldquoHousehold Air Pollution from Solid Cookfuels and its Effects on Healthrdquo Disease Control Priorities 7 (3) 133ndash52 httpsdoiorg101596978-1-4648-0522-6_ch7
UN-Habitat 2003 ldquoThe Challenge of Slums ndash Global Report on Human Settlements 2003rdquo Location of publishing London UN-Habitat httpsunhabitatorgthe-challenge-of-slums-global-report-on-human-settlements-2003
Wang Bolin Ruobao Li Zhong Lu and Yan Huang 2020 ldquoDoes Comorbidity Increase the Risk of Patients with COVID-19 Evidence from Meta-analysisrdquo Aging 12 (7) 6049ndash6057 httpsdoiorg1018632AGING103000
WHO 2014 ldquoWHO Guidelines for Indoor Air Quality Household Fuel Combustionrdquo WHO Accessed 25 July 2020 httpwwwwhointairpollutionguidelineshousehold-fuel-combustionen
World Bank 2020 ldquoThe State of Modern Energy Cooking Servicesrdquo Washington DC World Bank httpdocuments1worldbankorgcurateden937141600195758792pdfThe-State-of-Access-to-Modern-Energy-Cooking-Servicespdf
Yenneti Komali Yehua Dennis Wei and Wen Chen 2017 ldquoThe Urbanization of Poverty in India Spatio-temporal Disparities in Consumption Expendituresrdquo Geographical Review 107 (2) 360ndash383 httpsdoiorg101111j1931-0846201612167x
References
Are Indiarsquos Urban Poor Using Clean Cooking Fuels Insights from Slums in Six States
Annexure 1 Asset ownership index We used Filmer and Pritchettrsquos (2001) proposed approach to construct an asset ownership index using principal component analysis (PCA) We chose the indicators based on data from the Cooking Energy Access survey 2020 The variables we considered for the index were based on classifications by Caroline Moser and Andrew Felton (2007) and K Harttgen (2013) We computed the asset index using housing characteristics and consumer durables as follows
Variables not included in the asset index
Four types of variables were eliminated
1 Variables (such as grid electricity) that had high usage of greater than 95 per cent
2 Those (such as ownership of laptops or computers air conditioners etc) that had a low usage of less than 5 per cent
3 Variables (like house ownership) that have economically fluctuating values
4 Those that indicated a low correlation of less than 20 per cent variation between the top category (ie first) of the asset quintile and the bottom-most category (ie fifth) of the asset quintile
For ease of interpretation we rescaled this index such that the final index values range between 0 and 10 For this purpose we used a feature scaling (or minndashmax scaling) formula
Xnorm (or (IVx)) = (X ndash Xmin)(Xmax ndash Xmin)
where IVx is the normalised index value Xmin is the initial minimum value (-354) and Xmax is the initial maximum value (461) of the asset ownership index
30
Annexures
bull Crowding16 inside the house bull Toilet ownership and usage bull Source of water bull Number of pucca rooms
bull Ownership of two-wheeler bull Ownership of washing machine bull Ownership of television bull Ownership of refrigerator bull Ownership of cooker
16 A household with more than three members occupying a single room is considered crowded (World Health Organization 2018)
Housing characteristics
Consumer durables
Annexure 2 Explaining the use of LPG as the exclusive fuel (simple logistic regression model)
31Annexures
Dependent variable exclusive LPG use
Education of the primary cook (categorical base category is education beyond the school level)
Education of the household head (categorical base category is education beyond the school level)
State (categorical base category includes households from Rajasthan)
P gt z 95 confidence interval
Odds ratio (SE)
1299 (0112)
0659 (0202)
1399 (0394)
0970 (0038)
0994 (0011)
1003 (0013)
2042 (0508)
1011 (0046)
0782 (0441)
1198 (0608)
1377 (0664)
1345 (0566)
3141 (1103)
1213 (0500)
0309 (0211)
1165 (0565)
1703 (0680)
0002
0174
0233
0446
0583
0839
0004
0812
0663
0722
0507
0482
0001
0639
0086
0753
0182
1097
0361
0806
0898
0973
0977
1254
0924
0259
0443
0535
0589
1578
0541
0081
0450
0779
1540
1203
2428
1048
1016
1029
3327
1106
2361
3240
3545
3070
6251
2720
1181
3014
3723
Asset index
Primary cook involved in income-generating activity
Female-headed households
Household size
Age of household head
Age of primary cook
Doorstep delivery of LPG cylinders
PMUY customer
Primary cook is not educated
Primary cook has a school education
Household head is not educated
Household head has a school education
Uttar Pradesh
Bihar
Chhattisgarh
Jharkhand
Madhya Pradesh
Number of households (n) = 417
Log likelihood = -228777
Prob gt chi2 = 0000
Pseudo R2 = 0126
The dependent variable is a dummy variable where households using LPG exclusively are assigned a value of 1 and all other households are assigned the value of 0
The caste of the household has not been factored into the regression as a separate variable because of its underlying influence on economic status
Source Authorsrsquo analysis
Are Indiarsquos Urban Poor Using Clean Cooking Fuels Insights from Slums in Six States
Annexure 3 Air quality (PM25 concentration in μgm3) across 15 districts based on CAAQMS data
32
Dis
tric
tsM
ar-1
9A
pr-1
9M
ay-1
9Ju
n-19
Jul-1
9A
ug-1
9Se
p-19
Oct
-19
Nov
-19
Dec
-19
Jan-
20Fe
b-20
Mar
-20
794
5
988
5
866
7
-
645
329
2
453
7
388
1
769
1
886
4
661
5
950
9
834
4
-
823
4
611
7
569
9
535
7
-
270
4
589
4
571
5
293
1
705
4
839
2
614
9
970
1
826
8
-
844
9
622
1
597
1
564
0
-
235
3
414
3
619
1
414
3
653
9
834
7
568
8
104
90
739
8
-
894
9
630
9
342
2
450
4
-
476
465
2
474
6
429
2
592
3
566
1
-
674
6
531
4
501
5
568
7
450
8
-
320
3
-
846
506
3
349
5
332
4
369
1
387
2
-
430
4
393
6
353
7
446
2
406
8
335
2
339
1
-
102
9
497
2
261
8
269
1
431
4
294
1
-
351
6
277
3
-
336
5
315
5
248
3
392
8
149
7
144
9
462
3
270
5
331
3
273
4
276
0
106
6
391
7
326
2
-
368
6
625
3
875
2
101
64
521
2
183
1
380
4
556
2
544
1
558
2
102
24
104
33
156
44
128
73
146
62
137
71
109
14
183
70
201
80
896
7
190
1
457
7
581
2
583
5
815
4
135
00
126
41
239
94
208
15
158
51
221
86
121
35
192
46
218
43
848
0
205
2
448
5
509
4
582
0
704
5
177
01
613
1
244
01
215
80
136
87
230
54
964
2
201
52
122
30
725
5
120
6
435
4
454
7
481
2
111
37
147
45
537
3
175
53
162
86
111
21
170
08
583
8
132
10
866
2
513
1
112
5
511
3
507
5
511
8
879
4
120
22
502
1
135
53
116
39
994
7
120
45
410
5
792
1
674
8
326
3
177
6
385
0
408
5
335
9
497
2
594
2
429
9
673
2
547
5
540
8
559
4
Gay
a
Muz
affa
rpur
Pat
na
Bho
pal
Satn
a
Alw
ar
Ajm
er
Ud
aip
ur
Ag
ra
Bul
and
shah
r
Hap
ur
Gha
ziab
ad
Gre
ater
Noi
da
Mee
rut
Noi
da
Sour
ce C
onti
nuou
s am
bien
t air
qua
lity
mon
itor
ing
stat
ion
(Mar
ch 2
019
ndash M
arch
202
0)
In a rapidly urbanising India it would be imperative for policymakers and practitioners in energy and urban development sector to integrate access to clean cooking energy within the ambit of services for the urban poor
Image CEEW
Are Indiarsquos Urban Poor Using Clean Cooking Fuels Insights from Slums in Six States
COUNCIL ON ENERGY ENVIRONMENT AND WATER (CEEW)
Sanskrit Bhawan A-10 Aruna Asaf Ali Marg Qutab Institutional AreaNew Delhi - 110 067 IndiaT +91 11 4073 3300
infoceewin | ceewin | CEEWIndia
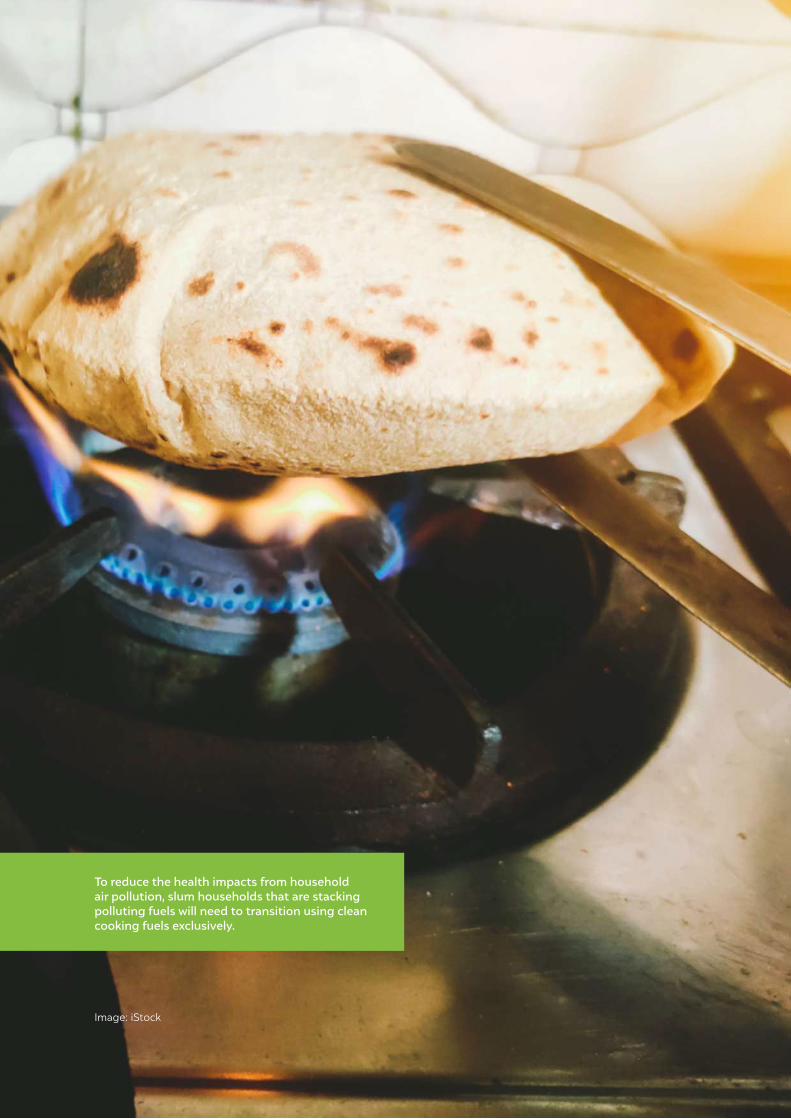
Are Indiarsquos Urban Poor Using Clean Cooking Fuels Insights from Slums in Six States
Image iStock
To reduce the health impacts from household air pollution slum households that are stacking polluting fuels will need to transition using clean cooking fuels exclusively
With increased urbanisation India is experiencing acute air pollution in its urban centres Slum dwellers are doubly affected both by the higher concentration of
particulate matter in urban areas as well as indoor air pollution from the use of unclean cooking fuels With more than 137 million people living in slums in country (Census 2011) there is a strong impetus to understand the use of clean cooking fuels in such households Existing literature on energy access and use in slums across developing countries assume that energy infrastructure is available in these settlements as they are situated in urban environments (Butera et al 2016) Household air pollution (HAP) has an estimated average contribution of 30ndash50 per cent to ambient air quality across Indiarsquos urban and rural areas (Balakrishnan et al 2019) Addressing biomass burning for cooking water heating and space heating during the winters has the potential to help reach the national ambient air quality standards (Chowdhury et al 2019)
However our analysis shows that a large share of these households do not have access to clean fuels due to lack of afforability or patchy supply In this brief we discuss access to clean cooking energy in urban slums across six states (Bihar Uttar Pradesh Rajasthan Madhya Pradesh Jharkhand and Chhattisgarh) These states have a low socio-demographic index and a high disease burden due to air pollution (Balakrishnan et al 2019) The findings of this brief are based on a primary survey conducted in rural areas and urban slums in these states ndash Cooking Energy Access Survey 20201 The analysis focuses on the fuel use patterns of households the extent of use of LPG and solid fuels fuel stacking behaviour and the primary cookrsquos perception of various cooking fuels and their health impacts
Slum households vary widely in their use of clean cooking fuels Therefore to understand their cooking energy use patterns better we categorised these households into three groups
Using clean fuels exclusively
Stacking clean fuels with polluting fuels and
Using only polluting fuels
Use of LPG as primary fuel
82 (Cooking Energy Access Survey 2020)
47 (Census 2011)
Polluting fuel as primary fuel
16 (Cooking Energy Access Survey 2020)
52 (Census 2011)
i
Executive summary
1 This has been referred as lsquoour surveyrsquo thereafter
In this brief the use of clean cooking fuels is considered synonymous to use of LPG
Are Indiarsquos Urban Poor Using Clean Cooking Fuels Insights from Slums in Six States
1 Households using LPG as their only fuelWhile most urban slum households have an LPG connection exclusive use of LPG is limited to just over half of the total households The householdrsquos economic status (measured through asset ownership) and their access to doorstep delivery of LPG refills are two critical factors that determine their ability to use LPG exclusively We found that households with higher asset ownership have significantly higher odds of using LPG as an exclusive fuel
2 Households stacking LPG with polluting fuelsAlthough schemes like Pradhan Mantri Ujjwala Yojana (PMUY) have helped increase LPG adoption this has not resulted in the complete replacement of biomass-based fuels Despite 86 per cent of households having an LPG connection the data shows that over a third of slum households are stacking with polluting fuels (including firewood dung cakes agriculture residue charcoal and kerosene) Most of these households use polluting fuels daily or at least weekly which increases their exposure to household air pollution
Among the households stacking LPG with polluting fuels the reasons for stacking vary affordability free-of-cost availability of biomass seasonality and taste preferences Across asset quintiles we find that stacking is highest among the middle categories (second and third quintile) though most households in these categories have adopted LPG Still the affordability of the fuel remains a significant concern One-fourth of households who are stacking polluting fuels have a median annual refill rate of eight cylinders and above (same as exclusive LPG users) despite having a similar household size as those using LPG exclusively Most of such households fall in the wealthiest asset quintiles and use a chulha (mud stove) for cooking chapatis or vegetables suggesting that they are not necessarily using unclean fuels due to the unaffordability of LPG but due to other factors like taste
ii
Figure ES1 To reduce the health impacts from household air pollution (HAP) households that are stacking with polluting fuels will need to transition to exclusive use of clean cooking fuels
Source Authorsrsquo analysis
Exclusive clean fuel users
Stacking with LPG as the primary fuel
Only polluting fuel users
Stacking LPG with polluting fuels
Stacking with LPG as the secondary fuel
55
3388
12
12
63 LPG-using households receive doorstep delivery of cylinders
77
households receiving doorstep delivery of LPG cylinders are exclusive users of the fuel
Despite increased LPG adoption stacking is prevalent in more than one-third of the slum households
iiiExecutive summary
Figure ES2 While stacking is highest among the middle categories (second and third quintile) it is prevalent across all asset quintiles including the highest one
Source Authorsrsquo analysis
21 Non-cooking uses of polluting fuels Despite using LPG as the primary fuel for their cooking needs households that stack fuels use polluting fuels for non-cooking purposes like heating water for bathing (29 per cent) and space heating (10 per cent)
22 Seasonal variations in fuel use Most households (88 per cent) use LPG as their primary fuel in the rainy season while in winters less than 45 per cent of households do so The increased use of polluting fuels in winter could be because during these months the polluting fuel requirement for non-cooking tasks within the household like water heating for bathing and space heating increases ndash which leads to the increased use of polluting fuels for cooking as well Unfortunately the increased use of polluting fuels in winters exposes households to the double burden of high ambient and household air pollution due to unfavourable atmospheric conditions
21 households stacking fuels
have more than one LPG connections
25 households stacking fuels have two-cylinder connections
1 2 3 4 5
Asset quintile categories
0
20
40
60
80
100
Per
cent
age
of h
ouse
hold
s
Exclusive clean fuel users Stacking LPG with polluting fuels Only polluting fuel users
5348
52
6367
2441 37
3232
2311 11
51
Are Indiarsquos Urban Poor Using Clean Cooking Fuels Insights from Slums in Six States
3 Households using only polluting fuelsDespite large-scale government initiatives like PMUY 12 per cent of urban slum households do not use LPG and rely on polluting fuels While most of these households are aware of PMUY the high upfront LPG connection cost along with the high recurring expenditure on refills deter them from procuring an LPG connection
Way forwardWhile we see a progressive change in householdsrsquo energy-use patterns as we move from rural to urban issues like affordability availability preference seasonality and the end-uses of the fuel remain essential factors that determine household fuel choice Understanding user categories and fuel use patterns is crucial in enabling access to and sustained use of clean cooking fuels Also it is vital to recognise the implications of cooking being a gendered activity However womenrsquos participation in intrahousehold decision-making regarding LPG use is limited
Despite being in urban areas 37 per cent of slum households do not receive home delivery of cylinders ndash availability is an essential factor that determines the householdrsquos likelihood of using LPG exclusively To increase LPG use oil and marketing companies (OMCs) and distributors need to improve home delivery of LPG refills in slum areas
Emissions from household sources contribute hugely to the surrounding air quality (Harish et al 2019) which is already poor in congested slum areas Majority of households cook inside the main house without a chimney indicating high exposure to pollution from the use of unclean fuels for cooking
iv
30 householdsrsquo female members place the order for LPG refills
50 householdsrsquo female
members decide whether or when to purchase LPG refills
75 householdsrsquo
using polluting fuels cook inside
the main house
67 householdsrsquo using polluting fuels do not have a chimney for ventilation
vExecutive summary
Integrate the issue of lack of access to clean cooking energy with urban poverty This study reiterates the need to look at poverty in urban areas in the context of energy access The vulnerability of urban slum dwellers needs to be accounted for while designing and implementing policies including social protection schemes Given the health and economic impacts of pollution access to clean cooking energy schemes must be integrated with the social assistance programmes of other ministries (eg health education and nutrition assistance) to better target support for slum households Government programmes such as the National Urban Livelihoods Mission and social service allocations for housing should use existing targeting approaches to include access to clean cooking energy within their ambit of services for the poor
The economic impact from COVID-19 will push households into energy poverty leading to the increased use of free-of-cost biomass ndash consequently increasing the risk of exposure to emissions from fuel burning While the government has announced that it will provide up to three free refills under the PM-Garib Kalyan Yojana scheme to all PMUY households less than a quarter of households in urban slums have Ujjwala connections ndash effectively making them ineligible for relief support There is a need to expand the reach of PMUY to cover all slum households
Bring renewed emphasis on clean cooking during COVID-19 Increased poverty would mean increased use of polluting fuels ndash there is a need for a renewed emphasis on clean cooking energy access during the COVID-19 pandemic as increased use of polluting fuels has health implications (lower respiratory infections and coronary chronic obstructive disease (COPD)) that increase the risk of COVID-19 infections being more severe
There is a need for targeted effort to include the poor households in urban slums left out in the first phase of Ujjwala
Are Indiarsquos Urban Poor Using Clean Cooking Fuels Insights from Slums in Six States
Image iStock
Addressing biomass burning for cooking water heating and space heating during the winters has the potential to help reach the national ambient air quality standards
The Census of India (2011) estimates that India has about 137 million slum dwellers across the country However statistics on slum populations vary significantly based on how
a slum is defined (Nolan 2015) Therefore not only is there a lack of data about how many people live in slums and informal settlements but there is also limited information about living conditions in slums (Rains Krishna and Wibbels 2018) Rapid urbanisation in India has led to population spikes in urban centres Low-income households in urban areas are trapped in informal and sometimes lsquoillegalrsquo settlements with poor living conditions where access to essential services and infrastructure tends to be limited or badly deteriorated (Butera et al 2016) While slum dwellers are not a homogeneous population slum areas have high concentrations of poverty and social and economic deprivation and poor shelter and environmental conditions (UN-Habitat 2003)
1 Introduction state of Indiarsquos urban slums
1
The Census of India (2011) defines slums as ldquoresidential areas where dwellings are unfit for human habitation by
reasons of dilapidation overcrowding faulty arrangements and design of such buildings narrowness or faulty
arrangement of street lack of ventilation light or sanitation facilities or any combination of these factors which
are detrimental to the safety and healthrdquo The slums in India are officially categorised into three categories
identified recognised and notified1 (Chandramouli 2010) About 59 per cent of slum households in India are non-
notified and are not legally recognised by the government (Nolan Bloom and Subbaraman 2018)
BOX 1 Slums in India
The existing literature on energy access and use in slums across developing countries suggests that while energy infrastructure (electric grid LPG distribution system) is available in these settlements (by being urban) households cannot afford it andor the service is unreliable (frequent outages and low voltage for electricity uncertain availability of gas cylinders) (Butera et al 2016) This leads to households relying on illegal connections for electricity and using energy sources that are on the lower end of the energy ladder (such as kerosene charcoal wood and other biomass residues) for cooking (Butera et al 2016)
1 Areas notified as slums by the concerned municipalities corporations local bodies or development authorities were termed notified slums All areas recognised as lsquoSlumrsquo by State UT Administration or Local Government Housing and Slum Boards which may have not been formally notified as slum under any act While a compact area of at least 300 population or about 60-70 households of poorly built congested tenements in the unhygienic environment is termed as identified slums (National Sample Survey Office 2012)
Are Indiarsquos Urban Poor Using Clean Cooking Fuels Insights from Slums in Six States2
In India population growth and rapid urbanisation have resulted in the deepening of urban poverty and the increased growth of urban slums (GNESD 2008 Yenneti Wei and Chen 2017) As per the Census 2011 most slum dwellers are casual labourers engaged in works other than public works (ie informal sectors) as opposed to salaried employees in non-slum urban areas (National Buildings Organisation 2013) As per the National Sample Survey Office (NSSO 2011ndash2012) the average daily wage of casual labourers is as low as INR 170 in urban areas (Ministry of Housing and Urban Affairs 2019) Such households may be able to purchase cleaner and more efficient fuels whenever they can but are likely to fall back on less efficient ones when faced by budgetary constraints Studies suggest that despite the LPG subsidies provided by the government significant sections of the urban poor population are still struggling to incorporate the cost of LPG into their household budgets (R Singh et al 2015) Use of multiple fuels also provides security from price variations and unreliable service associated with a single fuel or technology (Shahadat Lipu and Bhuiyan 2014)
As per the Census 2011 only half of the urban slum households across the country use LPG as their cooking fuel the remaining rely on solid fuels and kerosene Since 2013 the LPG programme in India has undergone many modifications to improve delivery and targeting access to connections and the availability of LPG (CEEW 2020) Pradhan Mantri Ujjwala Yojana (PMUY) which focuses on tackling the high upfront cost of LPG by providing LPG connections to below poverty line (BPL) households with credit-linked subsidy support has played an instrumental role in increasing the penetration of LPG across the country As of November 2019 about 965 per cent of households in India have an LPG connection (PPAC 2019) Small towns and cities which have been experiencing a comparatively slow rate of urban growth but the high percentage of slum population mall towns and cities which have been experiencing a relatively slow rate of urban growth but a high percentage of slum population
However the dramatic increase in LPG coverage has led to increased fuel stacking (Cheng and Urpelainen 2014) The reliance on fuel stacking has significant implications as the health benefits of using clean fuels are reduced or perhaps even nullified in households that continue to use biomass (Cheng and Urpelainen 2014) Urban slums suffer from a double burden of pollution as they are exposed to high ambient particulate matter pollution in cities along with the household air pollution (HAP) from using unclean cooking fuels (WHO 2014) The Global Burden of Disease study notes that even with the substantial increase in the provision of clean cooking fuels in India more than half of Indiarsquos population is exposed to HAP from solid cooking fuels as of 2017 (Balakrishnan et al 2019) In the current context this is concerning since exposure to air pollution has been linked to developing lower respiratory infections and chronic obstructive pulmonary disease (Balakrishnan et al 2019) which are among the major risk factors for COVID-19 (Lippi and Henry 2020 Wang et al 2020)
11 Motivation and methodology While there have been various studies on energy access in rural areas there is minimal data on energy use and patterns in urban slum households Most studies on urban slums and energy access focus on specific slums in large metropolitan areas such as Delhi and Bangalore (Saksena et al 2003 Dhingra et al 2008 Roy et al 2018) Living conditions and access to resources vary across slums in smaller towns and cities compared to those in Tier I
Slum-dwellers suffer from the double burden of pollution as they are exposed to high ambient particulate matter in cities along with the HAP from using unclean cooking fuels
2 A summary measure that identifies where countries or other geographic areas fall on the spectrum of development Expressed on a scale of 0 to 1 SDI is a composite average of the countryrsquos rankings in terms of per capita income average educational attainment and fertility rates
3 These states account for six out of eight of the lowest socio-demographic index (SDI) states and exhibit the highest health impacts of household air pollution (HAP) These states also have the highest percentage of households covered under the flagship clean cooking energy programme in India ndash PMUY
4 Referred to as lsquoour surveyrsquo thereafter
5 In our sample about 82 per cent of households are from notified slums
6 About 98 per cent of the respondents were female members of the household
7 For further details on the survey sample and methodology refer to the technical document for the survey
3Introduction state of Indiarsquos urban slums
Table 1 Sample allocation across urban slums
Source Authorsrsquo compilation
Note The number of slums sampled within each state varied because the slums were picked from the same districts that were sampled under the India Residential Energy Survey (2020) across the six states This was done to ensure logistical ease in conducting both the surveys and to share the resources of the national-level survey The list of urban slums as per the Census 2011 in the districts sampled under IRES 2020 constitutes the urban sampling frame7
State Districts sampled Urban slums sampled Households surveyed
16
14
10
10
4
4
58
31
15
16
12
5
4
83
249
124
128
94
40
32
667
Uttar Pradesh
Bihar
Madhya Pradesh
Rajasthan
Jharkhand
Chhattisgarh
cities these towns have been experiencing a comparatively slow rate of urban growth but are home to large slum populations (Rahaman and Das 2017) Further existing sources on access to clean cooking energy among slum households are limited to primary fuel use and lack detailed information about fuel use and stacking patterns
In India states with the lowest socio-demographic index (SDI)2 also account for the highest level of disease burden due to air pollution (Balakrishnan et al 2019) The low SDI states in north India had some of the highest levels of ambient particulate matter and household air pollution ndash especially Bihar Uttar Pradesh Rajasthan and Jharkhand The disability-adjusted life year (DALY) rate attributable to HAP was highest in the low SDI states of Chhattisgarh Rajasthan and Madhya Pradesh (Balakrishnan et al 2019)
The findings of this brief are based on a primary survey conducted across rural areas and urban slums in six energy access deprived states in India ndash Bihar Jharkhand Uttar Pradesh Rajasthan Madhya Pradesh and Chhattisgarh3 The Cooking Energy Access Survey 20204 focused on householdrsquos clean cooking energy access and its barriers and drivers in rural areas and urban slums Based on the list of urban slums across districts in Census 2011 the survey covered 656 households across 83 urban slums (notified and non-notified)5 spread across 58 districts The survey was conducted with the primary cook of the household6
In this brief we focus on understanding access to clean cooking energy specifically across urban slum households The analysis focuses on the fuel use patterns of households the extent of use of LPG and solid fuels fuel stacking behaviour and the primary cookrsquos perception of various cooking fuels and their impact on health The results discussed below are representative of the urban slum population in six states We have refrained from state-level analysis because of the smaller sample size for urban slums in some states like Jharkhand and Chhattisgarh
Are Indiarsquos Urban Poor Using Clean Cooking Fuels Insights from Slums in Six States4
12 Socio-economic characteristics of the urban slums of the six states Non-farm casual labour is the primary source of income for more than 42 per cent of the households such households reported a median monthly expenditure of about INR 5000 In only 20 per cent of the households the primary cook is involved in income-generating activities primarily engaged in casual non-farm labour or are self-employed
Source Authorsrsquo analysis
60 households have a monthly income below
INR 10000
In 90 households all members have
Aadhar cards
94 households have a bank account
11 households are currently indebted
Median savings in the past year
INR 4000
Median monthly expenditure
INR 6000
MEDIAN HOUSEHOLD SIZE
6
5
Table 2 Less than one-third of urban slum households reported income from salaried jobs
Source Authorsrsquo analysis
Under self-employment some of the householdsrsquo report occupations like carpentry tailoring driver and priest
The primary source of income of urban slum households
Non-farmdaily wage casual labour
Private or government salaried job
Shop or own business or self-employed
Farm labour
Agriculture on own or leased land
Others (pension remittances cattle rearing none)
43
22
18
8
7
2
Scheduled Castes (SC) (30 per cent) and Other Backward Castes (OBC) (45 per cent) form the majority of the urban slum population While Scheduled Tribes (ST) constitute less than 10 per cent of the overall population a majority of them are in Madhya Pradesh and Rajasthan Less than 20 per cent of the urban slum population are from the General castes States like Bihar Jharkhand and Rajasthan have the least proportion of General castes living in slum areas
Within urban slum households OBC and General households are relatively better off economically as shown in Table 3 Occupational patterns also vary based on caste A higher proportion of OBCs and General households rely on running a business self-employment or salaried jobs for their primary source of income as compared to SC and ST households The latter are primarily engaged in farm and non-farm labour The socio-economic marginality of SCs and STs even within slums is a consequence of these communities being most deprived in terms of access to resources and education income housing etc (Chandrasekhar and Mitra 2018) We see a similar trend in our sample in education and income levels Slums often remain the permanent habitation of marginalised castes as opposed to serving as an entry point for persons from higher castes who get absorbed into relatively better jobs and eventually move out of the slums (Chandrasekhar and Mitra 2018)
Table 3 Scheduled Castes and Scheduled Tribes have the lowest economic status
Source Authorsrsquo analysis
We utilise an economic status or asset index as a measure of a householdrsquos relative wealth and economic status based on the Filmer and Pritchett (2001) approach The list of variables included in the economic status index can be found in Annexure I The index takes values between 0 and 10 where a higher value denotes a higher level of asset ownership
Caste Sample size
Mean of asset index
(Min ndash Max) of BPL cardholders
233
51
281
92
042
039
046
046
(0ndash084)
(008ndash077)
(003ndash1)
(008ndash09)
45
60
49
36
Scheduled Castes
Scheduled Tribes
Other Backward Classes
General
Introduction state of Indiarsquos urban slums
Are Indiarsquos Urban Poor Using Clean Cooking Fuels Insights from Slums in Six States652
Image iStock
Exclusive use of LPG is limited to just over half of the total slum households The householdrsquos economic status and its access to doorstep delivery of LPG refills are two critical factors that determine their ability to use LPG exclusively
7
The fuel use patterns in urban slum households across the six states show a significant improvement in LPG use over the past decade when compared with the data from
Census 2011 The share of households using polluting fuels (including firewood dung cake agriculture residue and kerosene) as their primary fuel has decreased significantly but we find that stacking is a common practice even among households using LPG as a primary fuel Unless they use clean fuels exclusively such slum households will still be exposed to the health risks associated with HAP
Across the six states the primary fuel used for cooking by slum households
For the analysis in this brief we have categorised the households into three based on their fuel choices and position on the energy ladder those that exclusively use clean cooking fuels (LPG and electricity) stack LPG with polluting fuels and use only polluting fuels The level of exposure to emissions from cooking increases from the first (least harmful) to the third category (most harmful)
2 Cooking fuel adoption and use in urban slum households
In this brief the use of clean cooking fuels is considered synonymous to use of LPG since other clean fuels comprise a negligible share of use
Source Authorsrsquo analysis
Households using clean fuel exclusivelyWhile the majority of these households use LPG two per cent of the households reported using electricity for cooking purposes
Households stacking LPG with polluting fuelsMost of these households reported using LPG as their primary fuel and polluting fuels as their secondary fuel About four per cent of slum households reported using polluting fuels as their primary fuel and LPG as their secondary fuel
Households using only polluting fuelsThese households only use firewood charcoal dung
agricultural residue kerosene or a stack of these fuels
5533
12
Fuel-use categories
Use of LPG as primary fuel
82 (Cooking Energy Access Survey 2020)
47 (Census 2011)
Polluting fuel as primary fuel
16 (Cooking Energy Access Survey 2020)
52 (Census 2011)
Are Indiarsquos Urban Poor Using Clean Cooking Fuels Insights from Slums in Six States8
In the following sections we explore factors such as socio-economic characteristics affordability and availability of fuel intra-household gender dynamics and fuel perceptions which influence the ability and likelihood of a household to use different fuels
21 Households using LPG as their only fuel In this section we focus on understanding the household characteristics and fuel use patterns of those using LPG exclusively for cooking Most urban slum households with an LPG connection report using LPG as their primary fuel While 55 per cent of the slum households (63 per cent of LPG-using households) use LPG exclusively others stack LPG with polluting fuels Uttar Pradesh has the highest
proportion (70 per cent) of slum households who are exclusive users of clean cooking fuels among the six states
Figure 1 Within slums there are considerable state-level variations in householdsrsquo fuel usage patterns across states
Source Authorsrsquo analysis
Note We have refrained from state-level analysis because of the smaller sample size for urban slums in states like Jharkhand and Chhattisgarh
Figure 2 While the majority of LPG-using households use the fuel primarily only half of them use it exclusively
Source Authorsrsquo analysis
0
0
10
10
20
20
30
30
40
40
50
50
60
60
70
70
80
80
90
90
100
100
8682
55
Bihar
LPG users
Chhattisgarh Jharkhand Madhya Pradesh
LPG as the primary fuel LPG as the exclusive fuel
Rajasthan Uttar Pradesh
States
Per
cent
age
of h
ouse
hold
s P
erce
ntag
e of
hou
seho
lds
Exclusive clean fuel users Stacking LPG with polluting fuels Only polluting fuel users
42
3
30
56
45
39
1611
40
4944
46
10 5
24
71
41
28
9Cooking fuel adoption and use in urban slum households
Over a fifth of households using LPG exclusively are PMUY households which suggests that these households have been able to transition to clean cooking fuels in less than four years PMUY households using LPG exclusively are of a relatively higher economic status than households that stack polluting fuels Unlike in rural areas the age of an LPG connection does not have a direct correlation with per capita LPG consumption in urban slum households suggesting that even households with recent LPG connections in urban slums are likely to use LPG exclusively Households in urban areas have been known to experience a direct transition to exclusive use of clean fuels from using traditional fuels (Kuo and Azam 2019) This could be due to the time-saving that comes with the adoption of clean cooking fuels like LPG ndash where urban households are more willing or need to spend more on convenience than rural households
Figure 3 Most households using LPG exclusively acquire six to eight cylinders per year
Source Authorsrsquo analysis
211 The economic status of the household determines exclusive LPG useA simple logistic regression (Annexure II) shows that households with higher asset ownership have significantly higher odds of using LPG as an exclusive fuel Even between primary and exclusive users of LPG asset ownership remains a significant differentiating factor This corroborates the findings of previous studies (Ranjan and Singh 2017) that state that households tend to switch their cooking fuel use patterns after a threshold level of income is achieved However this is not to suggest that all wealthy households shift to exclusive use of clean fuels We discuss the reasons for stacking among these households in the next section
Cooking energy in the household budget We find that households using LPG as their only fuel pay INR 496 per month8 This effectively translates to an average household spending almost eight per cent of their monthly expenses on cooking fuel
Oil and Marketing Companies (OMCs) are attempting to address the challenges around the recurring refilling
cost by encouraging low-income households to use a 5 kilograms (kg) cylinder to overcome the high upfront cost
associated with 145kg cylinders In our sample we find that only about two per cent of urban slum households use
small cylinders (5kg or 3kg)
BOX 2 Uptake of small cylinders
8 This is based on the upfront cost paid by the household for an LPG refill Given that only 40 per cent of the householdsrsquo report receiving LPG subsidy on refills ndash it has not been considered in the fuel expenditure calculation The share of fuel expenditure for the households receiving LPG subsidies would be accordingly less than the others
0
10
20
30
40
50
60
70
1
1 16 8 9
22
60
4350 50
14
34
15
2 3 4 5 6 7 8 9 10 11 12 13
Number of 14 kg LPG cylinder refills obtained by exclusive LPG users
Per
cent
age
of h
ouse
hold
s us
ing
LP
G e
xclu
sive
ly
households using LPG exclusively Median value
Are Indiarsquos Urban Poor Using Clean Cooking Fuels Insights from Slums in Six States
212 Home delivery for exclusive LPG users We find that households who receive doorstep delivery of LPG refills have higher odds of using LPG as their exclusive fuel Hassle-free doorstep delivery of LPG refills is known to influence the use of LPG as a primary secondary or exclusive fuel (PPAC-CRISIL 2016)
Additional expense on procurement of cylinders Almost half of the households who receive doorstep delivery of LPG pay an additional amount of INR 20 as a delivery charge However in households that do not receive doorstep delivery about 46 per cent report that one member must forgo their daily wages to procure the cylinder Most of such households depend on daily labour or private jobs for their income
Given that almost half of the households report having to forgo wages to procure the cylinders it could affect the householdrsquos ability to use LPG continually It may add to the average delay in the purchase of refills
Procurement of LPG cylinders during the COVID-19 pandemic Most households that do not receive doorstep delivery of LPG (58 per cent) use private vehicles (including motorcycles or bicycles) to transport LPG refills About one-third of the households procuring cylinders on their own use rented or shared vehicles The procurement constraints faced by these households would be further aggravated during the COVID-19 pandemic as using rented or shared vehicles comes with its own risks
10
About 18 per cent of the respondents in our survey reported that they resided in non-notified slums Such slums are not legally recognised as a lsquoslumrsquo by the government which makes the residents more vulnerable to eviction In our data we find that adoption and use of LPG is similar across households from notified and non-notified slums Qualitative interviews and field visits showed that most of the respondents were permanent residents of the slums who have been living there for more than 10 years
About 2 per cent of urban slum households use electricity as a source for cooking energy These households do not rely on any other fuels for cooking or non-cooking purposes They use electric stoves to prepare all meals including cooking roti rice and vegetables These households have been using electricity as their cooking fuel only in the past five years Most households report using either a coiled stove or induction stove Less than one per cent of households use other electric appliances such as hot water kettles and toasters for cooking needs
BOX 3
BOX 4
Status of slums impacting the fuel-use pattern
Electricity for cooking
77
households receiving doorstep delivery of LPG cylinders are exclusive users of the fuel
63LPG-using households receive doorstep delivery of cylinders
Male members have to travel to procure the cylinders in 87 households
11Cooking fuel adoption and use in urban slum households
About 4 per cent of urban slum households in the sample reported stacking with kerosene as their secondary fuel Most of these households are in Uttar Pradesh These households also use kerosene more than once a week for cooking
BOX 5 Use of kerosene as a cooking fuel
22 Households stacking LPG with polluting fuels Across the six states almost half of the households (45 per cent) reported using polluting fuels Here we discuss the characteristics and fuel use patterns of households that stack clean and unclean fuels
Though 86 per cent of the households surveyed have an LPG connection we find that over a third (33 per cent) of them stack it with polluting fuels (including firewood dung cakes agriculture residue charcoal and kerosene) The increased stacking could also be a result of more households adopting LPG since households tend to not replace biomass-based fuels completely (Cheng and Urpelainen 2014) These households would need to transition to exclusive use of clean cooking fuels to reduce the health impacts on women and children from household air pollution
About 44 per cent of the households that are stacking fuels rely on informal sources for refills Such households have not ordered any refills in the past one year from their LPG distributors These households mainly rely on recurring cylinders from their neighbours or relatives9
Figure 4 Of the households that stack fuels most use LPG as their primary fuel
Source Authorsrsquo analysis
9 It is important to note that sharing LPG cylinders among neighbours and extended family is a regular phenomenon in small towns and rural areas owing to availability challenges and it is not necessarily driven by an intention to siphon off subsidy amounts against the commodity ( Jain et al 2018)
Exclusive clean fuel users
Stacking with LPG as the primary fuel
Only polluting fuel users
Stacking LPG with polluting fuels
Stacking with LPG as the secondary fuel
55
3388
12
12
Are Indiarsquos Urban Poor Using Clean Cooking Fuels Insights from Slums in Six States12
221 Household factors that determine the decision to stack fuels Even within the stacking households the reason for stacking multiple fuels varies significantly Primarily households who stack can be divided into two categories ndash those that stack as they cannot afford LPG refills and those that stack due to other factors like taste preferences and alternate end-uses of the fuel
Households who are stacking primarily due to affordability concerns ndash Across asset quintiles we find that stacking is most common among the middle categories (second and third quintile) where most have adopted LPG Still the affordability of the fuel remains a significant concern More than 60 per cent of the households that are stacking fuels collect or prepare firewood or dung cakes free of cost rather than purchasing them from the market Those who buy biomass do not spend more than INR 100 per month on it Based on the responses of the primary cook we note that the high cost of LPG and free-of-cost availability of solid fuels are the most common factors that affect the fuel choices made by the household
Figure 5 Stacking is prevalent in households across asset quintile categories
Source Authorsrsquo analysis
1 2 3 4 5
Asset quintile categories
0
20
40
60
80
100
Per
cent
age
of h
ouse
hold
s
Exclusive clean fuel users Stacking LPG with polluting fuels Only polluting fuel users
5348
52
6367
2441 37
3232
2311 11
51
Households who use LPG primarily and polluting fuels as secondary fuels have a median annual refill rate of
6 cylinders
Households who use polluting fuels primarily and LPG as a secondary fuel have a median annual refill rate of
4 cylinders
13
Households that are stacking for reasons beyond affordability ndash More than one-fourth of the households that are stacking have a median annual refill rate of eight cylinders and above despite having a similar household size as others Most such households fall in the highest asset quintiles This suggests that they are not necessarily using unclean fuels due to the unaffordability of LPG but due to other factors such as taste preference for chulhas and fuel end-uses that influence the householdrsquos decision to use solidpolluting fuels Such households reported using LPG for a median period of six years The solid fuels are primarily used for cooking chapatis or vegetables in these households
Interestingly even households with multiple LPG connections and two cylinder connections report stacking with polluting fuels The possession of multiple LPG connections in these households may not necessarily be an indicator of diversion mdash the average family size of these households is more than eight indicating the high possibility of having separate kitchens within the same household Given that such households have a median annual refill rate of ten cylinders another plausible reason for multiple connections is that it prevents them from relying on just one distributor which increases their chances of getting refills whenever needed
222 End-uses of polluting fuels Across both the groups discussed above half of the households who stack with polluting fuels use these fuels at least once a day (Figure 6) Also almost 45 per cent of the households that stack fuels use multiple stoves at the same time while preparing a single meal This indicates that even if the household is using LPG for a particular meal they would be using their chulha simultaneously
Despite using LPG as the primary fuel for their cooking needs households that are stacking fuels use polluting fuels for non-cooking purposes like heating water for bathing (29 per cent) and space heating (10 per cent)
Figure 6 Almost half of the households using polluting fuels use it every day
Source Authorsrsquo analysis
0 5 10 15 20
19
11
21
20
29
25 30 35
Percentage of households
Freq
uenc
y of
use
of p
ollu
ting
fuel
s Several times a day
Once per day
Few times a week
Once a week
Occasionally
21 households stacking fuels
have more than one LPG connections
25 households stacking fuels have two-cylinder connections
Cooking fuel adoption and use in urban slum households
Are Indiarsquos Urban Poor Using Clean Cooking Fuels Insights from Slums in Six States14
223 Seasonal variations in the stacking of fuels We also noted a significant seasonal change in fuel use patterns LPG is most popular in the rainy season (88 per cent) and least popular in the winter months (45 per cent) (Figure 7) The dampness associated with solid fuels in the rainy season could be the reason for using LPG primarily during these months The literature also suggests that solid fuels are a popular choice during winter months (S Singh 2014 Baqir et al 2019) This could be because during winter months the solid fuel requirement for non-cooking tasks within the household likes water heating for bathing and space heating increases Since households are already using solid fuels for non-cooking tasks they may be using these fuels more for cooking during winter Unfortunately the increased use of solid fuels in winter exacerbates the much higher air pollution exposure of these households due to unfavourable atmospheric conditions
Figure 7 Proportion of urban slum households using solid fuels as the primary cooking fuel increases during the winters months aggravating household air pollution exposure due to unfavourable atmospheric conditions
Source Authorsrsquo analysis
About 3 per cent of urban slum households reported owning an electric water-heating device (geyser or immersion
rod) Similarly only 4 per cent of the households own an electric room heater
BOX 6 Electric devices for water heating and space heating
Summer Winter Rainy Festival0
20
40
60
80
100
120
Per
cent
age
of h
ouse
hold
s
LPG Solid fuel
78
45
88
67
22
55
1233
15
Figure 8 Lack of awareness about receiving LPG refill subsidies poses a threat to the success of LPG subsidy schemes
Source Authorsrsquo analysis
Connections under the Pradhan Mantri Ujjwala Yojana (PMUY) 23 per cent of these households reported receiving benefits under the PMUY
The six states included in the survey account for a significant share of PMUY coverage ndash 54 per cent of all connections provided under PMUY (PPAC 2019) However most of these connections cater to rural households One of the reasons for there being fewer PMUY connections in urban areas is that more than half of all urban slum households reported already having had LPG connections for over four years (before the launch of PMUY) Moreover over a quarter of PMUY households10 in urban slums reported having multiple LPG connections which suggests that not every household which was using LPG before the PMUY was prevented from accessing the schemersquos benefits
Government support during the COVID-19 pandemic During the COVID-19 lockdown the government announced the provision of three free-of-cost refills for PMUY households under the PM-Garib Kalyan Yojana While PMUY households in urban slums benefitted from this scheme non-PMUY households in urban slums did not As documented urban slum households faced a significant economic hit due to the loss of jobs and incomes during the pandemic (Patel 2020) Non-PMUY households that stack for economic reasons are more likely to use cheaper and freely available solid fuels without additional support from the government
PAHAL-Direct Benefit Transfer for LPG (DBTL)Overall about 42 per cent of active LPG users11 reported receiving a subsidy for their last LPG refill under the Direct Benefit Transfer for LPG scheme (DBTL) However about 28 per cent of urban slum households reported not knowing if they had received the subsidy amount for their last refill this suggests that the primary cook is often unaware of whether the subsidy is credited to the household Among the ones that reported receiving the LPG subsidy about 40 per cent of the primary cook were not aware of the amount of subsidy being credited into their account
10 This is a relatively smaller sample of 43 households from all the PMUY households in urban slums (131 households)
11 Households that have taken at least one refill in the past year
42
30
28
Received LPG refill subsidy
30 Still repaying PMUY loan
Did not receive LPG refill subsidy
10 Gave up LPG refill subsidy
Do not know
60 LPG refill susbsidy not received due to other reasons
Cooking fuel adoption and use in urban slum households
Are Indiarsquos Urban Poor Using Clean Cooking Fuels Insights from Slums in Six States16
23 Households using only polluting fuels About 12 per cent of urban slum households rely entirely on polluting fuels for all cooking and non-cooking purposes While the share of these households is relatively small the non-adoption of LPG in such households despite
programmes like the PMUY is concerning These households either use a combination of different polluting fuels (firewood dung cakes agricultural residue charcoal and kerosene) or just one of these fuels for all their energy needs Firewood is the most commonly used fuel in these households
231 Reasons for the non-adoption of LPGHouseholds that rely exclusively on polluting fuels reported not having an LPG connection Though three-fourths of these households were aware of PMUY the high upfront cost of an LPG connection along with the high recurring cost of procuring refills remain the two most important reasons for not procuring an LPG connection Repondents also mentioned a lack of information on how to procure a connection as a reason These reasons align with the common causes cited by rural households covered in the survey implying that the challenges faced by rural households and urban slum households in procuring connections are similar
Almost half of the households in this category use solid fuels for non-cooking purposes such as heating water for bathing space heating and preparing fodder for animals On the positive aspects of using polluting fuels households reported the following free-of-cost easy availability of fuels better tasting food and preference of family members for food cooked on the chulha
232 Fuel availability and affordabilityIn contrast with households that stack fuels households that use only solid fuels rely on purchasing fuels rather than collecting or preparing them For instance 60 per cent of firewood users in this category procure fuel by purchasing rather than collecting it
Households with low asset ownership rely on polluting fuels for cooking These households spend 2ndash3 per cent of their median monthly expenditure on fuel (INR 75 per month on fuel) which is much lower than what they would have to spend if they used LPG exclusively (INR 496 per month) Households that collect solid fuels spend about two hours on a single trip (three times a month) travelling a median one-way distance of 2 km This is equivalent to the distance travelled to procure LPG cylinders (if not delivered at home)
Figure 9 More than half of the households currently without LPG do not know how to get a connection or whom to ask about it implying a lack of awareness
Source Authorsrsquo analysis
0 10 20 30 40 50 60 70
39
53
63
68
80
Percentage of households
Rea
sons
for N
on-A
dop
tion
of L
PG Installation is expensive
Monthly expenditure on LPG is high
Do not know how to get or whom to ask
Not availabletoo far
17
12 See Annexure III for details on the districts and their PM25 concentrations The data for 15 districts (from Bihar Uttar Pradesh Madhya Pradesh and Rajasthan) overlapping with the survey sample have been analysed based on the availability of air quality data from continuous monitoring stations
13 Air quality categories based on PM25 concentration (in μgm3)
Good 0 to 30 Satisfactory 31 to 60 Moderately polluted 61 to 90 Poor 91 to 120 Very poor 121 to 250 Severe above 250 (Central Pollution Control Board 2014)
Cooking fuel adoption and use in urban slum households
Winter months have the highest PM25 concentrations coinciding with the sharp increase in use of polluting fuels for heating bath water and room heating
233 Gendered time use in households using solid fuelsIn urban slums both the male and female members of the household are equally involved in collecting firewood Still it is primarily the female members of the household who undertake dung cake preparation In addition to engaging in fuel collection and preparation women tend to spend more time cooking in households using solid fuels About 85 per cent of households that transitioned to LPG in the past four years reported having saved time while cooking compared to when they used solid fuels
SPOTLIGHT I Household air pollution (HAP) in urban slums
Burning solid fuels in three-stone fires and mud stoves with inadequate ventilation causes high levels of smoke exposure and negative health impacts particularly for women and young children (WHO 2014)
The double burden of ambient and household air pollution on the urban slum populationUsing the PM25 data from continuous ambient air quality monitoring stations (CAAQMS) for 15 districts12 in our sample we found that the ambient air quality remained in the lsquopoorrsquo or worse category13 for most districts throughout the year variation in the ambient air quality
Are Indiarsquos Urban Poor Using Clean Cooking Fuels Insights from Slums in Six States
Impact of ventilation
Indoor cooking and low adoption of chimney indicates high exposure to pollution from the use of unclean fuels for cooking The proportion of households with a chimney is high (52 per cent) among those who rely only on polluting fuels Smith and Pillarisetti (2017) explain that while having a good chimney lowers peak levels of indoor pollution long-term average exposure is reduced only by a factor of two Besides chimneys require regular maintenance to function correctly While more than 45 per cent of the households are using polluting fuels less than 20 per cent of the slum housheolds use improved cookstoves
Households also use solid fuels for non-cooking uses like space heating On average each house in a slum has two rooms this effectively exposes all members of the household to emissions from burning fuels Emissions from household sources contribute significantly to the surrounding air quality (Harish et al 2019) this concern is exacerbated in congested slum areas
the winter months (November to February) have the highest concentration of PM25 This leads to a double burden of exposure for slum households stacking solid fuels as they are more likely to increase use of solid fuels in winters (Figure 7) Alternatively the use of LPG as the primary source of fuel increases during the rainy season (June to September) these months record the least ambient air pollution
We also find that districts like Meerut Ghaziabad Patna Gautam Buddha Nagar (Noida and Greater Noida) and Muzaffarpur have the highest frequency of lsquovery poorrsquo air quality days throughout the year Across these districts one-third of households use polluting fuels for cooking In urban slums where households are more densely packed the emissions from burning solid fuels increase the risk of exposure inside households and deteriorate the ambient air quality for the community at large As a result these communities suffer from both increased household and ambient air pollution HAP has an estimated average contribution of 30ndash50 per cent to ambient air quality across Indiarsquos urban and rural areas (Balakrishnan et al 2019) Addressing biomass burning for cooking water heating and space heating during the winters has the potential to help reach the national ambient air quality standards (Chowdhury et al 2019) Despite that only 2 per cent of the action points in 44 city clean air plans mention cooking and heating as a sector to address air pollution (Ganguly Selvaraj and Guttikunda 2020)
18
75 householdsrsquo
using polluting fuels cook inside
the main house
67 householdsrsquo using polluting fuels do not have a chimney for ventilation
Awareness about the health impacts of using polluting fuelsAbout 60 per cent of households using only polluting fuels and 84 per cent of households that stack LPG with a polluting fuel report lsquotoo smokyrsquo as the most prominent negative aspect of using polluting fuels This suggests that as more households switch to clean cooking fuels perceptions regarding pollution fuels change
Three-fourths of primary cooks who use polluting fuels for cooking agree that smoke from solid fuels is harmful to them this implies that awareness of the adverse health impacts of polluting fuels does not necessarily lead to the uptake of clean fuels Primary cooks also agree that smoke from solid fuels causes coughing (49 per cent) and lung infections in children (39 per cent)
Exposure to air pollution is a known risk factor for underlying chronic diseases that predict the severity of
COVID-19 disease and patient outcomes (World Bank 2020) This linkage suggests a heightened risk for women
in all age groups who cook using traditional technologies and fuels (World Bank 2020) The highest number of
COVID-19 cases were recorded in the most polluted regions among patients with pre-existing health conditions
(Frontera et al 2020)
Results from a controlled study show a higher prevalence of chronic obstructive pulmonary disease (COPD)
among biomass fuel users than clean fuel users ( Johnson et al 2011) The available clinical data to date suggest
that cardiovascular disease diabetes chronic respiratory illness and hypertension ndash conditions all strongly
associated with exposure to HAP ndash are also risk factors for COVID-19 (World Bank 2020)
BOX 7 Impact of household air pollution on COVID-19
19Cooking fuel adoption and use in urban slum households
Are Indiarsquos Urban Poor Using Clean Cooking Fuels Insights from Slums in Six States
Traditionally women bear a disproportionate burden in collecting and preparing biomass for cooking While this burden reduces with the use of clean cooking fuels like LPG the fuel supply within the household is then determined by formal and monetised distribution networks involving an outlay of money (Patnaik and Jha 2020) Our data shows that womenrsquos status in the household (as heads of households)14 positively correlates with households using LPG as their primary fuel The existing literature also supports the idea that female-headed households prefer modern fuels to polluting ones (Farsi Filippini and Pachauri 2007 Rao and Reddy 2007 Kuo and Azam 2019) Other research also suggests that female-headed households are more willing to spend on LPG as a recurring expense (Kojima Bacon and Zhou 2011 Kuo and Azam 2019)
SPOTLIGHT II Womenrsquos participation in intra-household decision-making regarding LPG use
20
14 In almost half of the households surveyed the primary cook reported a female member being the head of the household The reason behind such high percentage of female-headed households could be because only the primary cook of every household (who is mostly female) was surveyed This does not mean that these households do not have any adult male members Traditionally headship refers to the head of household as the individual whose lsquoauthorityrsquo the household members recognise But this definition overlooks potential intra-household variations in the recognised authority in different realms of decision-making (Kilic Moylan and Koolwal 2020) Since cooking is a gendered activity the primary cookrsquos response to the head of household question may have been with respect to the recognised authority figure for that activity within the household
30 householdsrsquo female members place the order for LPG refills
50householdsrsquo female
members decide whether or when to purchase LPG refills
We also find that the decision of whether or when to purchase LPG refills is made by male members in half of urban slum households This holds for both male- and female-headed households In LPG-using households where the primary cook is involved in an income-generating activity more women are deciding to order the refills This pattern is similar irrespective of whether the household uses LPG exclusively or stacks it with other polluting fuels or are PMUY beneficiaries
SPOTLIGHT III A comparison of access to clean cooking energy between urban slum and non-slum households across six states
21
At the state level Bihar has significantly poor involvement of women in intra-household decision-making regarding
ordering refills with less than 10 per cent of households reporting that women decide whether or when to order
refills However more women than men are involved in decisions around LPG refills in Rajasthan Madhya Pradesh
and Jharkhand
Across caste groups the involvement of women is lowest (37 per cent) among the Scheduled Castes (SCs)
However more women in General and OBC households decide when to order LPG refills
BOX 8 Variations in intra-household decision-making across states and caste groups
Cooking fuel adoption and use in urban slum households
To compare the fuel use patterns of urban slum and non-slum households we used data from the India Residential Energy Survey (IRES 2020)15 The overlap in the sampling strategies of both IRES and our survey enabled a comparison of the findings There is a significant difference in the socio-economic status of slum and non-slum households which tends to affect their fuel use patterns Table 4 provides a comparison of cooking fuel usage in urban non-slum households (from IRES 2020) and urban slum households (Cooking Energy Access and Use survey 2020)
Are Indiarsquos Urban Poor Using Clean Cooking Fuels Insights from Slums in Six States22
Table 4 The poor economic condition of households in urban slums impacts the exclusive use of clean fuels for cooking
Source Authorsrsquo analysis
Fuel use categories Urban slum households (Cooking Energy Access Survey) ()
Non-slum urban households (IRES) ()
95 88
84 55
9 33
5 12
Clean fuel users (LPG PNG and electricity)
LPG as an exclusive fuel
Households that stack LPG with polluting fuels
Households that use only polluting fuels
We observed a significant gap in the exclusive use of LPG as a cooking fuel between urban slums and non-slum households explained mainly by the difference in their economic conditions Stacking is three times more common in slum households than non-slum households About 45 per cent of non-slum households using polluting fuels belong to marginalised social groups (SCs and STs) Households using polluting fuels have a lower median monthly expenditure than others and about 62 per cent of such households are semi-pucca or kuchha structures Among LPG users non-slum households have a slightly higher rate of doorstep delivery as compared to slum households
LPG-using households receiving home deliveries
Source Authorsrsquo analysis
239
6372
Urban slum households (Cooking Energy Access and Use)
()
Non-slum urban households (IRES)
()
Proportion of PMUY beneficiaries among LPG-using households
15 IRES 2020 was conducted in 21 large states of India including Bihar Jharkhand Rajasthan Madhya Pradesh Uttar Pradesh and Chhattisgarh While IRES 2020 focused on urban households the Cooking Energy Access and Use survey specifically attended to urban slums in the same districts Refer to the technical note for a detailed methodology of the survey
23
3 Way forward
Slums across the world are chronically ignored in public policy and suffer because of unauthorised and unsafe habitation without access to government services (Shahadat
Lipu and Bhuiyan 2014) In terms of energy access while we see a progressive change in householdsrsquo energy use patterns as we move from rural to urban issues like affordability availability preference and familiarity with the fuel and stove remain essential factors that determine householdsrsquo fuel choice
Image iStock
Are Indiarsquos Urban Poor Using Clean Cooking Fuels Insights from Slums in Six States24
Understanding categories of users is important for enabling access to and use of clean cooking fuels
We categorised the urban slum population based on their fuel usage patterns ndash using only clean fuels stacking clean fuels with polluting fuels and using only polluting fuels While most households in urban slums have an LPG connection only half of them use LPG exclusively The householdrsquos economic status and its access to doorstep delivery of LPG refills are two crucial factors that determine its ability to use LPG exclusively Despite being situated in urban areas 37 per cent of slum households do not receive home delivery of cylinders ndash availability is an essential factor in determining the householdrsquos likelihood of using LPG exclusively There is a strong impetus for the OMCs and distributors to improve their home delivery services of LPG refills in slum areas
Stacking is prevalent in about one-third of households ndash there is a need for a deeper understanding of householdsrsquo preferences fuel end-uses and awareness Most households reported using polluting fuels daily or at least weekly this effectively increases their exposure to household air pollution despite having access to clean cooking fuels Among households that stack LPG with polluting fuels the reasons for stacking differ ndash affordability seasonality and taste preference More than a quarter of households that stack have a similar level of LPG consumption as those that use LPG exclusively despite similar family sizes Such households use polluting fuels not because of their inability to afford LPG But other factors like free-of-cost availability of biomass taste preference for chulha and alternate end-uses of fuelmdashfor instance in space heatingmdashinfluence the householdrsquos decision to use solid fuels Among households that stack multiple fuels the use of polluting fuels increases during winter months this exposes the households to a double burden of high ambient and household air pollution in these months About 40 per cent of these households also use polluting fuels for non-cooking purposes like heating water for bathing and space heating especially in winter
Even with large-scale government initiatives like PMUY we find that more than 10 per cent of urban slum households do not use LPG They mainly rely on free-of-cost biomass for their cooking and non-cooking needs Despite awareness of PMUY among these households the high upfront cost of procuring an LPG connection and high recurring expenditure on refills deter them from using LPG Evidently there is a need to expand the reach of PMUY to cover households across slums
Integrating the issue of lack of access to clean cooking energy within the discussion on urban poverty
This study reiterates the need to look at poverty in urban areas in the context of energy access Given the heterogeneity of poverty in urban and semi-urban India it is essential to understand energy poverty in the context of access to resources for an enhanced quality of life for the urban poor Similarly slums dwellers in large and small cities alike may experience additional challenges of access Furthermore not all urban poor live in slums we know even less about the access issues of temporary residents or seasonal migrants in urban India Therefore in a rapidly urbanising India studies on the urban poor and air quality need to integrate a focus on energy access to address the vulnerability of women children and communities to HAP and the drudgery of using polluting fuels for cooking and other household energy needs
Access to clean cooking energy schemes must be integrated into the social assistance programmes focused on urban poverty alleviation to enhance its reach
25Way forward
Converging energy access in social protection policies for the urban poor
Accounting for the vulnerabilities of the urban poor is crucial in designing and implementing policies including social protection schemes As a health and economic imperative access to clean cooking energy schemes must be integrated into the social assistance programmes of other ministries (eg health education and nutrition assistance) to offer better support to slum households This would also reduce the burden on households of claiming and accessing multiple benefits across schemes thus freeing them to invest more time in productive activities (CEEW 2020) Government programmes such as the National Urban Livelihoods Mission and social service allocations for housing should use existing targeting approaches to include access to clean cooking energy within the ambit of services for the poor
Bringing a renewed emphasis on clean cooking energy access due to COVID-19 is essential
Most households in urban slums rely on daily wage labour or the gig economy for their household income During the COVID-19 pandemic these occupations have been among the worst impacted by the lockdown and the economic slowdown A survey conducted with over 2000 daily wage workers in urban slums during the lockdown suggests that only 7 per cent of respondents from this group received pay during the lockdown (Basu 2020) causing a massive shock to their livelihoods and wage earnings This kind of impact pushes households into energy poverty leading to the increased use of free-of-cost biomass and consequently increasing the risk of exposure to emissions from fuel burning While the government has committed to supplying up to three free refills to all PMUY households under PM-Garib Kalyan Yojana less than a quarter of households in urban slums have Ujjwala connections The low share of PMUY households effectively makes the majority of slum households ineligible for relief support given under the PM-Garib Kalyan Yojana during the lockdown There is a need to target vulnerable households ndash beyond PMUY beneficiaries ndash with differential subsidy support for using LPG in a sustained manner
Increased poverty would mean increased use of polluting fuels ndash there is a need for a renewed emphasis on clean cooking energy access during the COVID-19 pandemic as increased use of polluting fuels has health implications (lower respiratory infections and COPD) that increase the risk of COVID-19 infections being more severe
There is a need to target vulnerable households ndash beyond PMUY beneficiaries ndash with differential subsidy support for using LPG in a sustained manner
Are Indiarsquos Urban Poor Using Clean Cooking Fuels Insights from Slums in Six States
Balakrishnan Kalpana Sagnik Dey Tarun Gupta R S Dhaliwal Michael Brauer Aaron J Cohen Jeffrey D Stanaway et al 2019 ldquoThe Impact of Air Pollution on Deaths Disease Burden and Life Expectancy Across the States of India The Global Burden of Disease Study 2017rdquo The Lancet Planetary Health 3 (1) e26ndash39 httpsdoiorg101016S2542-5196(18)30261-4
Baqir M S K Bharti R Kothari and R P Singh 2019 ldquoAssessment of an Energy-efficient Metal Chulha for Solid Biomass Fuel and Evaluation of its Performancerdquo International Journal of Environmental Science and Technology 16 (11) 6773ndash6784 httpsdoiorg101007s13762-018-2028-9
Basu Anika Badyal 2020 ldquoLockdown Survey How The Covid-19 Crisis Has Affected Daily Wage WorkersmdashAIFrdquo American India Foundation June 28 httpsaiforglockdown-survey-how-the-covid-19-crisis-has-affected-daily-wage-workers
Butera F M P Caputo R Adhikari and A Facchini 2016 ldquoThe Challenge of Energy in Informal Settlements A Review of the Literature for Latin America and Africardquo Procedia Engineering 1ndash32 httpswwwenelfoundationorgcontentdamenel-foundtopic-downloadThe challenge of Energy in Informal settlementspdf
CEEW 2020 ldquoEnergy Safety Nets India Case Studyrdquo Vienna Sustainable Energy for All httpswwwceewinpublicationsenergy-safety-nets-india-case-study
Central Pollution Control Board 2014 ldquoNational Air Quality Indexrdquo New Delhi Central Pollution Control Board httpsappcpcbccrcomccr_docsFINAL-REPORT_AQI_pdf
Chafe Z S Mehta and K R Smith 2011 ldquoAmbient Fine Particulate (PM25) Air Pollution Attributable to Household Cooking Fuel in Asiardquo AGUFM A54Bndash03 httpsuiadsabsharvardeduabs2011AGUFMA54B03Cabstract
Chandramouli C 2010 ldquoCensus of India 2011 ndash Circular No 8rdquo New Delhi Ministry of Home Affairs httpscensusindiagovin2011-CircularsCircularsCircular-08pdf
Chandrasekhar S and Arup Mitra 2018 ldquoMigration Caste and Livelihood Evidence from Indian City-slumsrdquo Urban Research amp Practice 12 (2) 156ndash172 httpsdoiorg1010801753506920181426781
Cheng Chao Yo and Johannes Urpelainen 2014 ldquoFuel Stacking in India Changes in the Cooking and Lighting Mix 1987ndash2010rdquo Energy 76 (November) 306ndash317 httpsdoiorg101016jenergy201408023
Chowdhary Sourangsu Sagnik Dey Sarath Guttikunda Ajay Pillarisetti Kirk R Smith and Larry Di Girolamo 2019 ldquoIndian annual ambient air quality standard is achievable by completely mitigating emissions from household sourcesrdquo Proceedings of the National Academy of Sciences 116 (22) 10711-10716 httpsdoiorg101073pnas1900888116
Dhingra Chhavi Shikha Gandhi Akanksha Chaurey and P K Agarwal 2008 ldquoAccess to Clean Energy Services for the Urban and Peri-Urban Poor A Case-study of Delhi Indiardquo Energy for Sustainable Development 12 (4) 49ndash55 httpsdoiorg101016S0973-0826(09)60007-7
Farsi Mehdi Massimo Filippini and Shonali Pachauri 2007 ldquoFuel Choices in Urban Indian Householdsrdquo Environment and Development Economics 12 (6) 757ndash774 httpsdoiorg101017S1355770X07003932
References
26
Frontera Antonio Lorenzo Cianfanelli Konstantinos Vlachos Giovanni Landoni and George Cremona 2020 ldquoSevere Air Pollution Links to Higher Mortality in COVID-19 Patients The lsquoDouble-Hitrsquo Hypothesisrdquo Journal of Infection 81 (2) 255ndash259 httpsdoiorg101016jjinf202005031
Ganguly Tanushree Kurinj L Selvaraj Sarath K Guttikunda 2020 ldquoNational Clean Air Programme (NCAP) for Indian cities Review and outlook of clean air action plansrdquo Atmospheric Environment X Vol 8 httpsdoiorg101016jaeaoa2020100096
GNESD 2008 ldquoClean Energy for the Urban Poor An Urgent Issuerdquo Accessed 25 July 2020 httpswwwgooglecomurlsa=tamprct=jampq=ampesrc=sampsource=webampcd=ampved=2ahUKEwi1hf2ru dntAhUCOisKHQH7BtsQFjAAegQIAxACampurl=http3A2F2Fwwwgnesdorg2F-2Fmedia2FSites2FGNESD2FPublication- pdfs2FSPM_CleanEnergyashx3Fla3Dda26hash3DE4971C585B6798F17954F8B42E073 D9507F42A84ampusg=AOvVaw08kCDgOkTkYc6wRDxzsNyq
Guan Wei-Jie Wen-Hua Liang Yi Zhao Heng-Rui Liang Zi-Sheng Chen Yi-Min Li Xiao-Qing Liu et al 2020 ldquoComorbidity and its Impact on 1590 Patients with COVID-19 in China A Nationwide Analysisrdquo European Respiratory Journal 55 (5) 2000547 httpsdoiorg1011831399300300547-2020
Harish Santosh Kirk R Smith Sourangsu Chowdhury Zoe A Chafe Ajay Pillarisetti Jos Lelieveld Sarath Guttikunda Sagnik Dey and Andrew P Grieshop 2019 ldquoThe Contribution of Household Fuels to Ambient Air Pollution in India A Comparison of Recent Estimates Edited by CcapcOrgInrdquo Collaborative Clean Air Policy Centre May 30 httpsccapcorginpolicy-briefs2019530the-contribution-of-household-fuels-to-ambient-air-pollution-in-india-a-comparison-of-recent-estimates
Jain Abhishek Saurabh Tripathi Sunil Mani Sasmita Patnaik Tauseef Shahidi and Karthik Ganesan 2018 ldquoAccess to Clean Cooking Energy and Electricity Survey of States 2018rdquo New Delhi CEEW httpswwwceewinsitesdefaultfilesCEEW-Access-to-Clean-Cooking-Energy-and-Electricity-11Jan19_0pdf
Johnson Priscilla Kalpana Balakrishnan Padmavathi Ramaswamy Santu Ghosh Muthukumar Sadhasivam Omprakash Abirami Bernard W C Sathiasekaran Kirk R Smith Vijayalakshmi Thanasekaraan and Arcot S Subhashini 2011 ldquoPrevalence of Chronic Obstructive Pulmonary Disease in Rural Women of Tamilnadu Implications for Refining Disease Burden Assessments Attributable to Household Biomass Combustionrdquo Global Health Action 4 (1) 7226 httpsdoiorg103402ghav4i07226
Kilic Talip Heather Moylan and Gayatri Koolwal 2020 ldquoGetting the (Gender-disaggregated) Lay of the Land Impact of Survey Respondent Selection on Measuring Land Ownership and Rightsrdquo Washington DC The World Bank httpsdoiorg1015961813-9450-9151
Kojima Masami Robert Bacon and Xin Zhou 2011 ldquoWho Uses Bottled Gas Evidence from Households in Developing Countriesrdquo The World Bank Sustainable Energy Department Oil Gas and Mining Unit httpelibraryworldbankorgdoibook1015961813-9450-5731
Kuo Ying-Min and Mehtabul Azam 2019 ldquoHousehold Cooking Fuel Choice in India 2004ndash2012 A Panel Multinomial Analysisrdquo IZA Discussion Paper No 12682 httpsssrncomabstract=3468630
Lippi Giuseppe and Brandon Michael Henry 2020 ldquoChronic Obstructive Pulmonary Disease Is Associated with Severe Coronavirus Disease 2019 (COVID-19) COPD and COVID-19rdquo Respiratory Medicine 167 105941 httpsdoiorg101016jrmed2020105941
Ministry of Housing and Urban Affairs 2019 ldquoHandbook of Urban Statisticsrdquo New Delhi Government of India httpmohuagovinpdf5c80e2225a124Handbook of Urban Statistics 2019pdf
Rao M Narasimha and B Sudhakara Reddy 2007 ldquoVariations in Energy Use by Indian Households An Analysis of Micro Level Datardquo Energy 32 (2) 143ndash153 httpsdoiorg101016jenergy200603012
27References
Are Indiarsquos Urban Poor Using Clean Cooking Fuels Insights from Slums in Six States28
National Buildings Organisation 2013 ldquoState of Slums in India a Statistical Compendium 2013rdquo New Delhi Government of India httpnbonicinpdfSlums_in_India_Compendium_English_Versionpdf
National Sample Survey Office 2012 ldquoKey Indicators of Urban Slums in India ndash 69th Roundrdquo New Delhi National Data Bank for Socio-religious Categories httpmospinicinsitesdefaultfilesnational_data_bankndb-rpts-69htm
Nolan Laura B 2015 ldquoSlum Definitions in Urban India Implications for the Measurement of Health Inequalitiesrdquo Population and Development Review 41 (1) 59ndash84 httpsideasrepecorgablapopdevv41y2015i1p59-84html
Nolan Laura B David E Bloom and Ramnath Subbaraman 2018 ldquoLegal Status and Deprivation in Urban Slums Over Two Decadesrdquo HHS Public Access 53 (15) 47ndash55
Patel Amit 2020 ldquoPreventing COVID-19 Amid Public Health and Urban Planning Failures in Slums of Indian Citiesrdquo World Medical amp Health Policy 12 (3) httpsdoiorg101002wmh3351
Patnaik Sasmita and Shaily Jha 2020 ldquoCaste Class and Gender in Determining Access to Energy A Critical Review of LPG Adoption in Indiardquo Energy Research amp Social Science 67 (September) 101530 httpsdoiorg101016jerss2020101530
PPAC-CRISIL 2016 ldquoAssessment Report Primary Survey on Household Cooking Fuel Usage and Willingness to Convert to LPGrdquo New Delhi Petroleum Planning amp Analysis Cell Ministry of Petroleum and Natural Gas Government of India httpswwwppacgovinWriteReadDataReports201710310449342512219PrimarySurveyReportPPACpdf
PPAC 2019 ldquoOil Industry Information at a Glancerdquo New Delhi Ministry of Petroleum and Natural Gas Government of India httpswwwppacgovinWriteReadDataReports201912060336500305462ReadyReckonerNov2019WebVersionpdf
Rahaman Mehebub and Dipendra Nath Das 2017 ldquoNature of Slum Growth in Indian Citiesrdquo Urban India 37 (II) 100ndash116 httpswwwresearchgatenetpublication334051882_Nature_of_Slum_Growth_in_Indian_Citiesread
Rains Emily Anirudh Krishna and Erik Wibbels 2018 ldquoUrbanisation and Indiarsquos Slum Continuum Evidence on the Range of Policy Needs and Scope of Mobilityrdquo London International Growth Centre httpswwwtheigcorgwp-contentuploads201802Rains-et-al_Working-paper_coverpdf
Ranjan Rahul and Sudershan Singh 2017 ldquoEnergy Deprivation of Indian Households Evidence from NSSO Datardquo New Delhi Munich Personal RePEc Archive httpsmpraubuni-muenchende835661MPRA_paper_83566pdf
Roy Debraj Bharath Palavalli Niveditha Menon Robin King Karin Pfeffer Michael Lees and Peter M A Sloot 2018 ldquoSurvey-based Socio-economic Data from Slums in Bangalore Indiardquo Nature Publishing Group 5 1ndash9 httpsdoiorg101038sdata2017200
Saksena Sumeet P B Singh Raj Kumar Prasad Rakesh Prasad Preeti Malhotra Veena Joshi and R S Patil 2003 ldquoExposure of Infants to Outdoor and Indoor Air Pollution in Low-income Urban Areas A Case Study of Delhirdquo Journal of Exposure Science amp Environmental Epidemiology 13 219ndash30 httpsdoiorg101038sjjea7500273
Lipu Molla Shahadat Hossain and Arif Waliullah Bhuiyan 2014 ldquoElectricity Access in Urban Slum Households of Bangladesh A Case of Dhakardquo Journal of Renewable and Sustainable Energy 6 (053112) 1ndash15 httpsdoiorg10106314896697
29
Singh Rozita Xiao Wang Emmanuel Ackom and Juan Reyes 2015 ldquoEnergy Access Realities in Urban Poor Communities of Developing Countries Assessments and Recommendationsrdquo Global Network on Energy for Sustainable Development (GNESD) httpswwwgooglecomurlsa=tamprct=jampq=ampesrc=sampsource=webampcd=ampved=2ahUKEwj5nbqI wdntAhXUTX0KHZE6DboQFjAAegQIAhACampurl=https3A2F2Forbitdtudk2Ffiles2F10635 24942FEnergy_access_realities_v_final_updatedpdfampusg=AOvVaw0xNBAAo0bjLueY9FmoigKF
Singh Santosh 2014 ldquoThe Kaleidoscope of Cooking Understanding Cooking Behaviour and Stove Preferences in Rural Indiardquo New Delhi Deutsche Gesellschaft fuumlr Internationale Zusammenarbeit (GIZ) GmbH httpswwwgizdeendownloadsgiz2014-en-kaleidoscope-of-cooking-indiapdf
Smith Kirk R and Ajay Pillarisetti 2017 ldquoHousehold Air Pollution from Solid Cookfuels and its Effects on Healthrdquo Disease Control Priorities 7 (3) 133ndash52 httpsdoiorg101596978-1-4648-0522-6_ch7
UN-Habitat 2003 ldquoThe Challenge of Slums ndash Global Report on Human Settlements 2003rdquo Location of publishing London UN-Habitat httpsunhabitatorgthe-challenge-of-slums-global-report-on-human-settlements-2003
Wang Bolin Ruobao Li Zhong Lu and Yan Huang 2020 ldquoDoes Comorbidity Increase the Risk of Patients with COVID-19 Evidence from Meta-analysisrdquo Aging 12 (7) 6049ndash6057 httpsdoiorg1018632AGING103000
WHO 2014 ldquoWHO Guidelines for Indoor Air Quality Household Fuel Combustionrdquo WHO Accessed 25 July 2020 httpwwwwhointairpollutionguidelineshousehold-fuel-combustionen
World Bank 2020 ldquoThe State of Modern Energy Cooking Servicesrdquo Washington DC World Bank httpdocuments1worldbankorgcurateden937141600195758792pdfThe-State-of-Access-to-Modern-Energy-Cooking-Servicespdf
Yenneti Komali Yehua Dennis Wei and Wen Chen 2017 ldquoThe Urbanization of Poverty in India Spatio-temporal Disparities in Consumption Expendituresrdquo Geographical Review 107 (2) 360ndash383 httpsdoiorg101111j1931-0846201612167x
References
Are Indiarsquos Urban Poor Using Clean Cooking Fuels Insights from Slums in Six States
Annexure 1 Asset ownership index We used Filmer and Pritchettrsquos (2001) proposed approach to construct an asset ownership index using principal component analysis (PCA) We chose the indicators based on data from the Cooking Energy Access survey 2020 The variables we considered for the index were based on classifications by Caroline Moser and Andrew Felton (2007) and K Harttgen (2013) We computed the asset index using housing characteristics and consumer durables as follows
Variables not included in the asset index
Four types of variables were eliminated
1 Variables (such as grid electricity) that had high usage of greater than 95 per cent
2 Those (such as ownership of laptops or computers air conditioners etc) that had a low usage of less than 5 per cent
3 Variables (like house ownership) that have economically fluctuating values
4 Those that indicated a low correlation of less than 20 per cent variation between the top category (ie first) of the asset quintile and the bottom-most category (ie fifth) of the asset quintile
For ease of interpretation we rescaled this index such that the final index values range between 0 and 10 For this purpose we used a feature scaling (or minndashmax scaling) formula
Xnorm (or (IVx)) = (X ndash Xmin)(Xmax ndash Xmin)
where IVx is the normalised index value Xmin is the initial minimum value (-354) and Xmax is the initial maximum value (461) of the asset ownership index
30
Annexures
bull Crowding16 inside the house bull Toilet ownership and usage bull Source of water bull Number of pucca rooms
bull Ownership of two-wheeler bull Ownership of washing machine bull Ownership of television bull Ownership of refrigerator bull Ownership of cooker
16 A household with more than three members occupying a single room is considered crowded (World Health Organization 2018)
Housing characteristics
Consumer durables
Annexure 2 Explaining the use of LPG as the exclusive fuel (simple logistic regression model)
31Annexures
Dependent variable exclusive LPG use
Education of the primary cook (categorical base category is education beyond the school level)
Education of the household head (categorical base category is education beyond the school level)
State (categorical base category includes households from Rajasthan)
P gt z 95 confidence interval
Odds ratio (SE)
1299 (0112)
0659 (0202)
1399 (0394)
0970 (0038)
0994 (0011)
1003 (0013)
2042 (0508)
1011 (0046)
0782 (0441)
1198 (0608)
1377 (0664)
1345 (0566)
3141 (1103)
1213 (0500)
0309 (0211)
1165 (0565)
1703 (0680)
0002
0174
0233
0446
0583
0839
0004
0812
0663
0722
0507
0482
0001
0639
0086
0753
0182
1097
0361
0806
0898
0973
0977
1254
0924
0259
0443
0535
0589
1578
0541
0081
0450
0779
1540
1203
2428
1048
1016
1029
3327
1106
2361
3240
3545
3070
6251
2720
1181
3014
3723
Asset index
Primary cook involved in income-generating activity
Female-headed households
Household size
Age of household head
Age of primary cook
Doorstep delivery of LPG cylinders
PMUY customer
Primary cook is not educated
Primary cook has a school education
Household head is not educated
Household head has a school education
Uttar Pradesh
Bihar
Chhattisgarh
Jharkhand
Madhya Pradesh
Number of households (n) = 417
Log likelihood = -228777
Prob gt chi2 = 0000
Pseudo R2 = 0126
The dependent variable is a dummy variable where households using LPG exclusively are assigned a value of 1 and all other households are assigned the value of 0
The caste of the household has not been factored into the regression as a separate variable because of its underlying influence on economic status
Source Authorsrsquo analysis
Are Indiarsquos Urban Poor Using Clean Cooking Fuels Insights from Slums in Six States
Annexure 3 Air quality (PM25 concentration in μgm3) across 15 districts based on CAAQMS data
32
Dis
tric
tsM
ar-1
9A
pr-1
9M
ay-1
9Ju
n-19
Jul-1
9A
ug-1
9Se
p-19
Oct
-19
Nov
-19
Dec
-19
Jan-
20Fe
b-20
Mar
-20
794
5
988
5
866
7
-
645
329
2
453
7
388
1
769
1
886
4
661
5
950
9
834
4
-
823
4
611
7
569
9
535
7
-
270
4
589
4
571
5
293
1
705
4
839
2
614
9
970
1
826
8
-
844
9
622
1
597
1
564
0
-
235
3
414
3
619
1
414
3
653
9
834
7
568
8
104
90
739
8
-
894
9
630
9
342
2
450
4
-
476
465
2
474
6
429
2
592
3
566
1
-
674
6
531
4
501
5
568
7
450
8
-
320
3
-
846
506
3
349
5
332
4
369
1
387
2
-
430
4
393
6
353
7
446
2
406
8
335
2
339
1
-
102
9
497
2
261
8
269
1
431
4
294
1
-
351
6
277
3
-
336
5
315
5
248
3
392
8
149
7
144
9
462
3
270
5
331
3
273
4
276
0
106
6
391
7
326
2
-
368
6
625
3
875
2
101
64
521
2
183
1
380
4
556
2
544
1
558
2
102
24
104
33
156
44
128
73
146
62
137
71
109
14
183
70
201
80
896
7
190
1
457
7
581
2
583
5
815
4
135
00
126
41
239
94
208
15
158
51
221
86
121
35
192
46
218
43
848
0
205
2
448
5
509
4
582
0
704
5
177
01
613
1
244
01
215
80
136
87
230
54
964
2
201
52
122
30
725
5
120
6
435
4
454
7
481
2
111
37
147
45
537
3
175
53
162
86
111
21
170
08
583
8
132
10
866
2
513
1
112
5
511
3
507
5
511
8
879
4
120
22
502
1
135
53
116
39
994
7
120
45
410
5
792
1
674
8
326
3
177
6
385
0
408
5
335
9
497
2
594
2
429
9
673
2
547
5
540
8
559
4
Gay
a
Muz
affa
rpur
Pat
na
Bho
pal
Satn
a
Alw
ar
Ajm
er
Ud
aip
ur
Ag
ra
Bul
and
shah
r
Hap
ur
Gha
ziab
ad
Gre
ater
Noi
da
Mee
rut
Noi
da
Sour
ce C
onti
nuou
s am
bien
t air
qua
lity
mon
itor
ing
stat
ion
(Mar
ch 2
019
ndash M
arch
202
0)
In a rapidly urbanising India it would be imperative for policymakers and practitioners in energy and urban development sector to integrate access to clean cooking energy within the ambit of services for the urban poor
Image CEEW
Are Indiarsquos Urban Poor Using Clean Cooking Fuels Insights from Slums in Six States
COUNCIL ON ENERGY ENVIRONMENT AND WATER (CEEW)
Sanskrit Bhawan A-10 Aruna Asaf Ali Marg Qutab Institutional AreaNew Delhi - 110 067 IndiaT +91 11 4073 3300
infoceewin | ceewin | CEEWIndia
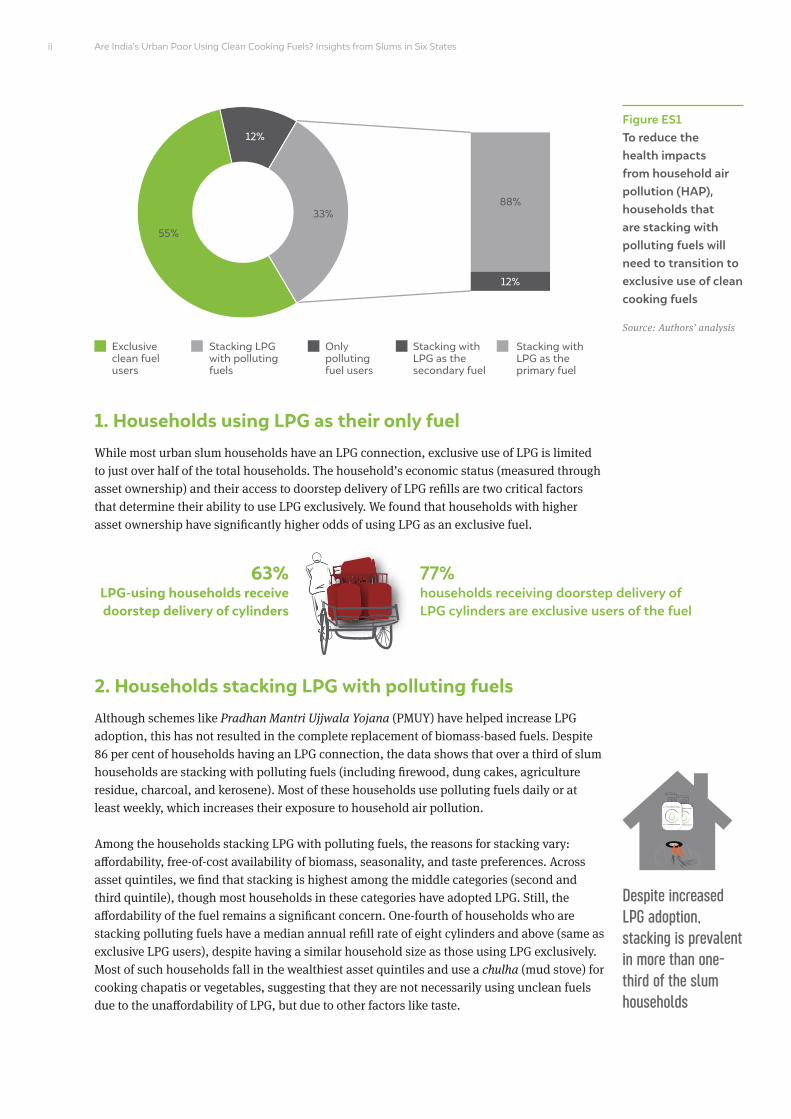
Are Indiarsquos Urban Poor Using Clean Cooking Fuels Insights from Slums in Six States
1 Households using LPG as their only fuelWhile most urban slum households have an LPG connection exclusive use of LPG is limited to just over half of the total households The householdrsquos economic status (measured through asset ownership) and their access to doorstep delivery of LPG refills are two critical factors that determine their ability to use LPG exclusively We found that households with higher asset ownership have significantly higher odds of using LPG as an exclusive fuel
2 Households stacking LPG with polluting fuelsAlthough schemes like Pradhan Mantri Ujjwala Yojana (PMUY) have helped increase LPG adoption this has not resulted in the complete replacement of biomass-based fuels Despite 86 per cent of households having an LPG connection the data shows that over a third of slum households are stacking with polluting fuels (including firewood dung cakes agriculture residue charcoal and kerosene) Most of these households use polluting fuels daily or at least weekly which increases their exposure to household air pollution
Among the households stacking LPG with polluting fuels the reasons for stacking vary affordability free-of-cost availability of biomass seasonality and taste preferences Across asset quintiles we find that stacking is highest among the middle categories (second and third quintile) though most households in these categories have adopted LPG Still the affordability of the fuel remains a significant concern One-fourth of households who are stacking polluting fuels have a median annual refill rate of eight cylinders and above (same as exclusive LPG users) despite having a similar household size as those using LPG exclusively Most of such households fall in the wealthiest asset quintiles and use a chulha (mud stove) for cooking chapatis or vegetables suggesting that they are not necessarily using unclean fuels due to the unaffordability of LPG but due to other factors like taste
ii
Figure ES1 To reduce the health impacts from household air pollution (HAP) households that are stacking with polluting fuels will need to transition to exclusive use of clean cooking fuels
Source Authorsrsquo analysis
Exclusive clean fuel users
Stacking with LPG as the primary fuel
Only polluting fuel users
Stacking LPG with polluting fuels
Stacking with LPG as the secondary fuel
55
3388
12
12
63 LPG-using households receive doorstep delivery of cylinders
77
households receiving doorstep delivery of LPG cylinders are exclusive users of the fuel
Despite increased LPG adoption stacking is prevalent in more than one-third of the slum households
iiiExecutive summary
Figure ES2 While stacking is highest among the middle categories (second and third quintile) it is prevalent across all asset quintiles including the highest one
Source Authorsrsquo analysis
21 Non-cooking uses of polluting fuels Despite using LPG as the primary fuel for their cooking needs households that stack fuels use polluting fuels for non-cooking purposes like heating water for bathing (29 per cent) and space heating (10 per cent)
22 Seasonal variations in fuel use Most households (88 per cent) use LPG as their primary fuel in the rainy season while in winters less than 45 per cent of households do so The increased use of polluting fuels in winter could be because during these months the polluting fuel requirement for non-cooking tasks within the household like water heating for bathing and space heating increases ndash which leads to the increased use of polluting fuels for cooking as well Unfortunately the increased use of polluting fuels in winters exposes households to the double burden of high ambient and household air pollution due to unfavourable atmospheric conditions
21 households stacking fuels
have more than one LPG connections
25 households stacking fuels have two-cylinder connections
1 2 3 4 5
Asset quintile categories
0
20
40
60
80
100
Per
cent
age
of h
ouse
hold
s
Exclusive clean fuel users Stacking LPG with polluting fuels Only polluting fuel users
5348
52
6367
2441 37
3232
2311 11
51
Are Indiarsquos Urban Poor Using Clean Cooking Fuels Insights from Slums in Six States
3 Households using only polluting fuelsDespite large-scale government initiatives like PMUY 12 per cent of urban slum households do not use LPG and rely on polluting fuels While most of these households are aware of PMUY the high upfront LPG connection cost along with the high recurring expenditure on refills deter them from procuring an LPG connection
Way forwardWhile we see a progressive change in householdsrsquo energy-use patterns as we move from rural to urban issues like affordability availability preference seasonality and the end-uses of the fuel remain essential factors that determine household fuel choice Understanding user categories and fuel use patterns is crucial in enabling access to and sustained use of clean cooking fuels Also it is vital to recognise the implications of cooking being a gendered activity However womenrsquos participation in intrahousehold decision-making regarding LPG use is limited
Despite being in urban areas 37 per cent of slum households do not receive home delivery of cylinders ndash availability is an essential factor that determines the householdrsquos likelihood of using LPG exclusively To increase LPG use oil and marketing companies (OMCs) and distributors need to improve home delivery of LPG refills in slum areas
Emissions from household sources contribute hugely to the surrounding air quality (Harish et al 2019) which is already poor in congested slum areas Majority of households cook inside the main house without a chimney indicating high exposure to pollution from the use of unclean fuels for cooking
iv
30 householdsrsquo female members place the order for LPG refills
50 householdsrsquo female
members decide whether or when to purchase LPG refills
75 householdsrsquo
using polluting fuels cook inside
the main house
67 householdsrsquo using polluting fuels do not have a chimney for ventilation
vExecutive summary
Integrate the issue of lack of access to clean cooking energy with urban poverty This study reiterates the need to look at poverty in urban areas in the context of energy access The vulnerability of urban slum dwellers needs to be accounted for while designing and implementing policies including social protection schemes Given the health and economic impacts of pollution access to clean cooking energy schemes must be integrated with the social assistance programmes of other ministries (eg health education and nutrition assistance) to better target support for slum households Government programmes such as the National Urban Livelihoods Mission and social service allocations for housing should use existing targeting approaches to include access to clean cooking energy within their ambit of services for the poor
The economic impact from COVID-19 will push households into energy poverty leading to the increased use of free-of-cost biomass ndash consequently increasing the risk of exposure to emissions from fuel burning While the government has announced that it will provide up to three free refills under the PM-Garib Kalyan Yojana scheme to all PMUY households less than a quarter of households in urban slums have Ujjwala connections ndash effectively making them ineligible for relief support There is a need to expand the reach of PMUY to cover all slum households
Bring renewed emphasis on clean cooking during COVID-19 Increased poverty would mean increased use of polluting fuels ndash there is a need for a renewed emphasis on clean cooking energy access during the COVID-19 pandemic as increased use of polluting fuels has health implications (lower respiratory infections and coronary chronic obstructive disease (COPD)) that increase the risk of COVID-19 infections being more severe
There is a need for targeted effort to include the poor households in urban slums left out in the first phase of Ujjwala
Are Indiarsquos Urban Poor Using Clean Cooking Fuels Insights from Slums in Six States
Image iStock
Addressing biomass burning for cooking water heating and space heating during the winters has the potential to help reach the national ambient air quality standards
The Census of India (2011) estimates that India has about 137 million slum dwellers across the country However statistics on slum populations vary significantly based on how
a slum is defined (Nolan 2015) Therefore not only is there a lack of data about how many people live in slums and informal settlements but there is also limited information about living conditions in slums (Rains Krishna and Wibbels 2018) Rapid urbanisation in India has led to population spikes in urban centres Low-income households in urban areas are trapped in informal and sometimes lsquoillegalrsquo settlements with poor living conditions where access to essential services and infrastructure tends to be limited or badly deteriorated (Butera et al 2016) While slum dwellers are not a homogeneous population slum areas have high concentrations of poverty and social and economic deprivation and poor shelter and environmental conditions (UN-Habitat 2003)
1 Introduction state of Indiarsquos urban slums
1
The Census of India (2011) defines slums as ldquoresidential areas where dwellings are unfit for human habitation by
reasons of dilapidation overcrowding faulty arrangements and design of such buildings narrowness or faulty
arrangement of street lack of ventilation light or sanitation facilities or any combination of these factors which
are detrimental to the safety and healthrdquo The slums in India are officially categorised into three categories
identified recognised and notified1 (Chandramouli 2010) About 59 per cent of slum households in India are non-
notified and are not legally recognised by the government (Nolan Bloom and Subbaraman 2018)
BOX 1 Slums in India
The existing literature on energy access and use in slums across developing countries suggests that while energy infrastructure (electric grid LPG distribution system) is available in these settlements (by being urban) households cannot afford it andor the service is unreliable (frequent outages and low voltage for electricity uncertain availability of gas cylinders) (Butera et al 2016) This leads to households relying on illegal connections for electricity and using energy sources that are on the lower end of the energy ladder (such as kerosene charcoal wood and other biomass residues) for cooking (Butera et al 2016)
1 Areas notified as slums by the concerned municipalities corporations local bodies or development authorities were termed notified slums All areas recognised as lsquoSlumrsquo by State UT Administration or Local Government Housing and Slum Boards which may have not been formally notified as slum under any act While a compact area of at least 300 population or about 60-70 households of poorly built congested tenements in the unhygienic environment is termed as identified slums (National Sample Survey Office 2012)
Are Indiarsquos Urban Poor Using Clean Cooking Fuels Insights from Slums in Six States2
In India population growth and rapid urbanisation have resulted in the deepening of urban poverty and the increased growth of urban slums (GNESD 2008 Yenneti Wei and Chen 2017) As per the Census 2011 most slum dwellers are casual labourers engaged in works other than public works (ie informal sectors) as opposed to salaried employees in non-slum urban areas (National Buildings Organisation 2013) As per the National Sample Survey Office (NSSO 2011ndash2012) the average daily wage of casual labourers is as low as INR 170 in urban areas (Ministry of Housing and Urban Affairs 2019) Such households may be able to purchase cleaner and more efficient fuels whenever they can but are likely to fall back on less efficient ones when faced by budgetary constraints Studies suggest that despite the LPG subsidies provided by the government significant sections of the urban poor population are still struggling to incorporate the cost of LPG into their household budgets (R Singh et al 2015) Use of multiple fuels also provides security from price variations and unreliable service associated with a single fuel or technology (Shahadat Lipu and Bhuiyan 2014)
As per the Census 2011 only half of the urban slum households across the country use LPG as their cooking fuel the remaining rely on solid fuels and kerosene Since 2013 the LPG programme in India has undergone many modifications to improve delivery and targeting access to connections and the availability of LPG (CEEW 2020) Pradhan Mantri Ujjwala Yojana (PMUY) which focuses on tackling the high upfront cost of LPG by providing LPG connections to below poverty line (BPL) households with credit-linked subsidy support has played an instrumental role in increasing the penetration of LPG across the country As of November 2019 about 965 per cent of households in India have an LPG connection (PPAC 2019) Small towns and cities which have been experiencing a comparatively slow rate of urban growth but the high percentage of slum population mall towns and cities which have been experiencing a relatively slow rate of urban growth but a high percentage of slum population
However the dramatic increase in LPG coverage has led to increased fuel stacking (Cheng and Urpelainen 2014) The reliance on fuel stacking has significant implications as the health benefits of using clean fuels are reduced or perhaps even nullified in households that continue to use biomass (Cheng and Urpelainen 2014) Urban slums suffer from a double burden of pollution as they are exposed to high ambient particulate matter pollution in cities along with the household air pollution (HAP) from using unclean cooking fuels (WHO 2014) The Global Burden of Disease study notes that even with the substantial increase in the provision of clean cooking fuels in India more than half of Indiarsquos population is exposed to HAP from solid cooking fuels as of 2017 (Balakrishnan et al 2019) In the current context this is concerning since exposure to air pollution has been linked to developing lower respiratory infections and chronic obstructive pulmonary disease (Balakrishnan et al 2019) which are among the major risk factors for COVID-19 (Lippi and Henry 2020 Wang et al 2020)
11 Motivation and methodology While there have been various studies on energy access in rural areas there is minimal data on energy use and patterns in urban slum households Most studies on urban slums and energy access focus on specific slums in large metropolitan areas such as Delhi and Bangalore (Saksena et al 2003 Dhingra et al 2008 Roy et al 2018) Living conditions and access to resources vary across slums in smaller towns and cities compared to those in Tier I
Slum-dwellers suffer from the double burden of pollution as they are exposed to high ambient particulate matter in cities along with the HAP from using unclean cooking fuels
2 A summary measure that identifies where countries or other geographic areas fall on the spectrum of development Expressed on a scale of 0 to 1 SDI is a composite average of the countryrsquos rankings in terms of per capita income average educational attainment and fertility rates
3 These states account for six out of eight of the lowest socio-demographic index (SDI) states and exhibit the highest health impacts of household air pollution (HAP) These states also have the highest percentage of households covered under the flagship clean cooking energy programme in India ndash PMUY
4 Referred to as lsquoour surveyrsquo thereafter
5 In our sample about 82 per cent of households are from notified slums
6 About 98 per cent of the respondents were female members of the household
7 For further details on the survey sample and methodology refer to the technical document for the survey
3Introduction state of Indiarsquos urban slums
Table 1 Sample allocation across urban slums
Source Authorsrsquo compilation
Note The number of slums sampled within each state varied because the slums were picked from the same districts that were sampled under the India Residential Energy Survey (2020) across the six states This was done to ensure logistical ease in conducting both the surveys and to share the resources of the national-level survey The list of urban slums as per the Census 2011 in the districts sampled under IRES 2020 constitutes the urban sampling frame7
State Districts sampled Urban slums sampled Households surveyed
16
14
10
10
4
4
58
31
15
16
12
5
4
83
249
124
128
94
40
32
667
Uttar Pradesh
Bihar
Madhya Pradesh
Rajasthan
Jharkhand
Chhattisgarh
cities these towns have been experiencing a comparatively slow rate of urban growth but are home to large slum populations (Rahaman and Das 2017) Further existing sources on access to clean cooking energy among slum households are limited to primary fuel use and lack detailed information about fuel use and stacking patterns
In India states with the lowest socio-demographic index (SDI)2 also account for the highest level of disease burden due to air pollution (Balakrishnan et al 2019) The low SDI states in north India had some of the highest levels of ambient particulate matter and household air pollution ndash especially Bihar Uttar Pradesh Rajasthan and Jharkhand The disability-adjusted life year (DALY) rate attributable to HAP was highest in the low SDI states of Chhattisgarh Rajasthan and Madhya Pradesh (Balakrishnan et al 2019)
The findings of this brief are based on a primary survey conducted across rural areas and urban slums in six energy access deprived states in India ndash Bihar Jharkhand Uttar Pradesh Rajasthan Madhya Pradesh and Chhattisgarh3 The Cooking Energy Access Survey 20204 focused on householdrsquos clean cooking energy access and its barriers and drivers in rural areas and urban slums Based on the list of urban slums across districts in Census 2011 the survey covered 656 households across 83 urban slums (notified and non-notified)5 spread across 58 districts The survey was conducted with the primary cook of the household6
In this brief we focus on understanding access to clean cooking energy specifically across urban slum households The analysis focuses on the fuel use patterns of households the extent of use of LPG and solid fuels fuel stacking behaviour and the primary cookrsquos perception of various cooking fuels and their impact on health The results discussed below are representative of the urban slum population in six states We have refrained from state-level analysis because of the smaller sample size for urban slums in some states like Jharkhand and Chhattisgarh
Are Indiarsquos Urban Poor Using Clean Cooking Fuels Insights from Slums in Six States4
12 Socio-economic characteristics of the urban slums of the six states Non-farm casual labour is the primary source of income for more than 42 per cent of the households such households reported a median monthly expenditure of about INR 5000 In only 20 per cent of the households the primary cook is involved in income-generating activities primarily engaged in casual non-farm labour or are self-employed
Source Authorsrsquo analysis
60 households have a monthly income below
INR 10000
In 90 households all members have
Aadhar cards
94 households have a bank account
11 households are currently indebted
Median savings in the past year
INR 4000
Median monthly expenditure
INR 6000
MEDIAN HOUSEHOLD SIZE
6
5
Table 2 Less than one-third of urban slum households reported income from salaried jobs
Source Authorsrsquo analysis
Under self-employment some of the householdsrsquo report occupations like carpentry tailoring driver and priest
The primary source of income of urban slum households
Non-farmdaily wage casual labour
Private or government salaried job
Shop or own business or self-employed
Farm labour
Agriculture on own or leased land
Others (pension remittances cattle rearing none)
43
22
18
8
7
2
Scheduled Castes (SC) (30 per cent) and Other Backward Castes (OBC) (45 per cent) form the majority of the urban slum population While Scheduled Tribes (ST) constitute less than 10 per cent of the overall population a majority of them are in Madhya Pradesh and Rajasthan Less than 20 per cent of the urban slum population are from the General castes States like Bihar Jharkhand and Rajasthan have the least proportion of General castes living in slum areas
Within urban slum households OBC and General households are relatively better off economically as shown in Table 3 Occupational patterns also vary based on caste A higher proportion of OBCs and General households rely on running a business self-employment or salaried jobs for their primary source of income as compared to SC and ST households The latter are primarily engaged in farm and non-farm labour The socio-economic marginality of SCs and STs even within slums is a consequence of these communities being most deprived in terms of access to resources and education income housing etc (Chandrasekhar and Mitra 2018) We see a similar trend in our sample in education and income levels Slums often remain the permanent habitation of marginalised castes as opposed to serving as an entry point for persons from higher castes who get absorbed into relatively better jobs and eventually move out of the slums (Chandrasekhar and Mitra 2018)
Table 3 Scheduled Castes and Scheduled Tribes have the lowest economic status
Source Authorsrsquo analysis
We utilise an economic status or asset index as a measure of a householdrsquos relative wealth and economic status based on the Filmer and Pritchett (2001) approach The list of variables included in the economic status index can be found in Annexure I The index takes values between 0 and 10 where a higher value denotes a higher level of asset ownership
Caste Sample size
Mean of asset index
(Min ndash Max) of BPL cardholders
233
51
281
92
042
039
046
046
(0ndash084)
(008ndash077)
(003ndash1)
(008ndash09)
45
60
49
36
Scheduled Castes
Scheduled Tribes
Other Backward Classes
General
Introduction state of Indiarsquos urban slums
Are Indiarsquos Urban Poor Using Clean Cooking Fuels Insights from Slums in Six States652
Image iStock
Exclusive use of LPG is limited to just over half of the total slum households The householdrsquos economic status and its access to doorstep delivery of LPG refills are two critical factors that determine their ability to use LPG exclusively
7
The fuel use patterns in urban slum households across the six states show a significant improvement in LPG use over the past decade when compared with the data from
Census 2011 The share of households using polluting fuels (including firewood dung cake agriculture residue and kerosene) as their primary fuel has decreased significantly but we find that stacking is a common practice even among households using LPG as a primary fuel Unless they use clean fuels exclusively such slum households will still be exposed to the health risks associated with HAP
Across the six states the primary fuel used for cooking by slum households
For the analysis in this brief we have categorised the households into three based on their fuel choices and position on the energy ladder those that exclusively use clean cooking fuels (LPG and electricity) stack LPG with polluting fuels and use only polluting fuels The level of exposure to emissions from cooking increases from the first (least harmful) to the third category (most harmful)
2 Cooking fuel adoption and use in urban slum households
In this brief the use of clean cooking fuels is considered synonymous to use of LPG since other clean fuels comprise a negligible share of use
Source Authorsrsquo analysis
Households using clean fuel exclusivelyWhile the majority of these households use LPG two per cent of the households reported using electricity for cooking purposes
Households stacking LPG with polluting fuelsMost of these households reported using LPG as their primary fuel and polluting fuels as their secondary fuel About four per cent of slum households reported using polluting fuels as their primary fuel and LPG as their secondary fuel
Households using only polluting fuelsThese households only use firewood charcoal dung
agricultural residue kerosene or a stack of these fuels
5533
12
Fuel-use categories
Use of LPG as primary fuel
82 (Cooking Energy Access Survey 2020)
47 (Census 2011)
Polluting fuel as primary fuel
16 (Cooking Energy Access Survey 2020)
52 (Census 2011)
Are Indiarsquos Urban Poor Using Clean Cooking Fuels Insights from Slums in Six States8
In the following sections we explore factors such as socio-economic characteristics affordability and availability of fuel intra-household gender dynamics and fuel perceptions which influence the ability and likelihood of a household to use different fuels
21 Households using LPG as their only fuel In this section we focus on understanding the household characteristics and fuel use patterns of those using LPG exclusively for cooking Most urban slum households with an LPG connection report using LPG as their primary fuel While 55 per cent of the slum households (63 per cent of LPG-using households) use LPG exclusively others stack LPG with polluting fuels Uttar Pradesh has the highest
proportion (70 per cent) of slum households who are exclusive users of clean cooking fuels among the six states
Figure 1 Within slums there are considerable state-level variations in householdsrsquo fuel usage patterns across states
Source Authorsrsquo analysis
Note We have refrained from state-level analysis because of the smaller sample size for urban slums in states like Jharkhand and Chhattisgarh
Figure 2 While the majority of LPG-using households use the fuel primarily only half of them use it exclusively
Source Authorsrsquo analysis
0
0
10
10
20
20
30
30
40
40
50
50
60
60
70
70
80
80
90
90
100
100
8682
55
Bihar
LPG users
Chhattisgarh Jharkhand Madhya Pradesh
LPG as the primary fuel LPG as the exclusive fuel
Rajasthan Uttar Pradesh
States
Per
cent
age
of h
ouse
hold
s P
erce
ntag
e of
hou
seho
lds
Exclusive clean fuel users Stacking LPG with polluting fuels Only polluting fuel users
42
3
30
56
45
39
1611
40
4944
46
10 5
24
71
41
28
9Cooking fuel adoption and use in urban slum households
Over a fifth of households using LPG exclusively are PMUY households which suggests that these households have been able to transition to clean cooking fuels in less than four years PMUY households using LPG exclusively are of a relatively higher economic status than households that stack polluting fuels Unlike in rural areas the age of an LPG connection does not have a direct correlation with per capita LPG consumption in urban slum households suggesting that even households with recent LPG connections in urban slums are likely to use LPG exclusively Households in urban areas have been known to experience a direct transition to exclusive use of clean fuels from using traditional fuels (Kuo and Azam 2019) This could be due to the time-saving that comes with the adoption of clean cooking fuels like LPG ndash where urban households are more willing or need to spend more on convenience than rural households
Figure 3 Most households using LPG exclusively acquire six to eight cylinders per year
Source Authorsrsquo analysis
211 The economic status of the household determines exclusive LPG useA simple logistic regression (Annexure II) shows that households with higher asset ownership have significantly higher odds of using LPG as an exclusive fuel Even between primary and exclusive users of LPG asset ownership remains a significant differentiating factor This corroborates the findings of previous studies (Ranjan and Singh 2017) that state that households tend to switch their cooking fuel use patterns after a threshold level of income is achieved However this is not to suggest that all wealthy households shift to exclusive use of clean fuels We discuss the reasons for stacking among these households in the next section
Cooking energy in the household budget We find that households using LPG as their only fuel pay INR 496 per month8 This effectively translates to an average household spending almost eight per cent of their monthly expenses on cooking fuel
Oil and Marketing Companies (OMCs) are attempting to address the challenges around the recurring refilling
cost by encouraging low-income households to use a 5 kilograms (kg) cylinder to overcome the high upfront cost
associated with 145kg cylinders In our sample we find that only about two per cent of urban slum households use
small cylinders (5kg or 3kg)
BOX 2 Uptake of small cylinders
8 This is based on the upfront cost paid by the household for an LPG refill Given that only 40 per cent of the householdsrsquo report receiving LPG subsidy on refills ndash it has not been considered in the fuel expenditure calculation The share of fuel expenditure for the households receiving LPG subsidies would be accordingly less than the others
0
10
20
30
40
50
60
70
1
1 16 8 9
22
60
4350 50
14
34
15
2 3 4 5 6 7 8 9 10 11 12 13
Number of 14 kg LPG cylinder refills obtained by exclusive LPG users
Per
cent
age
of h
ouse
hold
s us
ing
LP
G e
xclu
sive
ly
households using LPG exclusively Median value
Are Indiarsquos Urban Poor Using Clean Cooking Fuels Insights from Slums in Six States
212 Home delivery for exclusive LPG users We find that households who receive doorstep delivery of LPG refills have higher odds of using LPG as their exclusive fuel Hassle-free doorstep delivery of LPG refills is known to influence the use of LPG as a primary secondary or exclusive fuel (PPAC-CRISIL 2016)
Additional expense on procurement of cylinders Almost half of the households who receive doorstep delivery of LPG pay an additional amount of INR 20 as a delivery charge However in households that do not receive doorstep delivery about 46 per cent report that one member must forgo their daily wages to procure the cylinder Most of such households depend on daily labour or private jobs for their income
Given that almost half of the households report having to forgo wages to procure the cylinders it could affect the householdrsquos ability to use LPG continually It may add to the average delay in the purchase of refills
Procurement of LPG cylinders during the COVID-19 pandemic Most households that do not receive doorstep delivery of LPG (58 per cent) use private vehicles (including motorcycles or bicycles) to transport LPG refills About one-third of the households procuring cylinders on their own use rented or shared vehicles The procurement constraints faced by these households would be further aggravated during the COVID-19 pandemic as using rented or shared vehicles comes with its own risks
10
About 18 per cent of the respondents in our survey reported that they resided in non-notified slums Such slums are not legally recognised as a lsquoslumrsquo by the government which makes the residents more vulnerable to eviction In our data we find that adoption and use of LPG is similar across households from notified and non-notified slums Qualitative interviews and field visits showed that most of the respondents were permanent residents of the slums who have been living there for more than 10 years
About 2 per cent of urban slum households use electricity as a source for cooking energy These households do not rely on any other fuels for cooking or non-cooking purposes They use electric stoves to prepare all meals including cooking roti rice and vegetables These households have been using electricity as their cooking fuel only in the past five years Most households report using either a coiled stove or induction stove Less than one per cent of households use other electric appliances such as hot water kettles and toasters for cooking needs
BOX 3
BOX 4
Status of slums impacting the fuel-use pattern
Electricity for cooking
77
households receiving doorstep delivery of LPG cylinders are exclusive users of the fuel
63LPG-using households receive doorstep delivery of cylinders
Male members have to travel to procure the cylinders in 87 households
11Cooking fuel adoption and use in urban slum households
About 4 per cent of urban slum households in the sample reported stacking with kerosene as their secondary fuel Most of these households are in Uttar Pradesh These households also use kerosene more than once a week for cooking
BOX 5 Use of kerosene as a cooking fuel
22 Households stacking LPG with polluting fuels Across the six states almost half of the households (45 per cent) reported using polluting fuels Here we discuss the characteristics and fuel use patterns of households that stack clean and unclean fuels
Though 86 per cent of the households surveyed have an LPG connection we find that over a third (33 per cent) of them stack it with polluting fuels (including firewood dung cakes agriculture residue charcoal and kerosene) The increased stacking could also be a result of more households adopting LPG since households tend to not replace biomass-based fuels completely (Cheng and Urpelainen 2014) These households would need to transition to exclusive use of clean cooking fuels to reduce the health impacts on women and children from household air pollution
About 44 per cent of the households that are stacking fuels rely on informal sources for refills Such households have not ordered any refills in the past one year from their LPG distributors These households mainly rely on recurring cylinders from their neighbours or relatives9
Figure 4 Of the households that stack fuels most use LPG as their primary fuel
Source Authorsrsquo analysis
9 It is important to note that sharing LPG cylinders among neighbours and extended family is a regular phenomenon in small towns and rural areas owing to availability challenges and it is not necessarily driven by an intention to siphon off subsidy amounts against the commodity ( Jain et al 2018)
Exclusive clean fuel users
Stacking with LPG as the primary fuel
Only polluting fuel users
Stacking LPG with polluting fuels
Stacking with LPG as the secondary fuel
55
3388
12
12
Are Indiarsquos Urban Poor Using Clean Cooking Fuels Insights from Slums in Six States12
221 Household factors that determine the decision to stack fuels Even within the stacking households the reason for stacking multiple fuels varies significantly Primarily households who stack can be divided into two categories ndash those that stack as they cannot afford LPG refills and those that stack due to other factors like taste preferences and alternate end-uses of the fuel
Households who are stacking primarily due to affordability concerns ndash Across asset quintiles we find that stacking is most common among the middle categories (second and third quintile) where most have adopted LPG Still the affordability of the fuel remains a significant concern More than 60 per cent of the households that are stacking fuels collect or prepare firewood or dung cakes free of cost rather than purchasing them from the market Those who buy biomass do not spend more than INR 100 per month on it Based on the responses of the primary cook we note that the high cost of LPG and free-of-cost availability of solid fuels are the most common factors that affect the fuel choices made by the household
Figure 5 Stacking is prevalent in households across asset quintile categories
Source Authorsrsquo analysis
1 2 3 4 5
Asset quintile categories
0
20
40
60
80
100
Per
cent
age
of h
ouse
hold
s
Exclusive clean fuel users Stacking LPG with polluting fuels Only polluting fuel users
5348
52
6367
2441 37
3232
2311 11
51
Households who use LPG primarily and polluting fuels as secondary fuels have a median annual refill rate of
6 cylinders
Households who use polluting fuels primarily and LPG as a secondary fuel have a median annual refill rate of
4 cylinders
13
Households that are stacking for reasons beyond affordability ndash More than one-fourth of the households that are stacking have a median annual refill rate of eight cylinders and above despite having a similar household size as others Most such households fall in the highest asset quintiles This suggests that they are not necessarily using unclean fuels due to the unaffordability of LPG but due to other factors such as taste preference for chulhas and fuel end-uses that influence the householdrsquos decision to use solidpolluting fuels Such households reported using LPG for a median period of six years The solid fuels are primarily used for cooking chapatis or vegetables in these households
Interestingly even households with multiple LPG connections and two cylinder connections report stacking with polluting fuels The possession of multiple LPG connections in these households may not necessarily be an indicator of diversion mdash the average family size of these households is more than eight indicating the high possibility of having separate kitchens within the same household Given that such households have a median annual refill rate of ten cylinders another plausible reason for multiple connections is that it prevents them from relying on just one distributor which increases their chances of getting refills whenever needed
222 End-uses of polluting fuels Across both the groups discussed above half of the households who stack with polluting fuels use these fuels at least once a day (Figure 6) Also almost 45 per cent of the households that stack fuels use multiple stoves at the same time while preparing a single meal This indicates that even if the household is using LPG for a particular meal they would be using their chulha simultaneously
Despite using LPG as the primary fuel for their cooking needs households that are stacking fuels use polluting fuels for non-cooking purposes like heating water for bathing (29 per cent) and space heating (10 per cent)
Figure 6 Almost half of the households using polluting fuels use it every day
Source Authorsrsquo analysis
0 5 10 15 20
19
11
21
20
29
25 30 35
Percentage of households
Freq
uenc
y of
use
of p
ollu
ting
fuel
s Several times a day
Once per day
Few times a week
Once a week
Occasionally
21 households stacking fuels
have more than one LPG connections
25 households stacking fuels have two-cylinder connections
Cooking fuel adoption and use in urban slum households
Are Indiarsquos Urban Poor Using Clean Cooking Fuels Insights from Slums in Six States14
223 Seasonal variations in the stacking of fuels We also noted a significant seasonal change in fuel use patterns LPG is most popular in the rainy season (88 per cent) and least popular in the winter months (45 per cent) (Figure 7) The dampness associated with solid fuels in the rainy season could be the reason for using LPG primarily during these months The literature also suggests that solid fuels are a popular choice during winter months (S Singh 2014 Baqir et al 2019) This could be because during winter months the solid fuel requirement for non-cooking tasks within the household likes water heating for bathing and space heating increases Since households are already using solid fuels for non-cooking tasks they may be using these fuels more for cooking during winter Unfortunately the increased use of solid fuels in winter exacerbates the much higher air pollution exposure of these households due to unfavourable atmospheric conditions
Figure 7 Proportion of urban slum households using solid fuels as the primary cooking fuel increases during the winters months aggravating household air pollution exposure due to unfavourable atmospheric conditions
Source Authorsrsquo analysis
About 3 per cent of urban slum households reported owning an electric water-heating device (geyser or immersion
rod) Similarly only 4 per cent of the households own an electric room heater
BOX 6 Electric devices for water heating and space heating
Summer Winter Rainy Festival0
20
40
60
80
100
120
Per
cent
age
of h
ouse
hold
s
LPG Solid fuel
78
45
88
67
22
55
1233
15
Figure 8 Lack of awareness about receiving LPG refill subsidies poses a threat to the success of LPG subsidy schemes
Source Authorsrsquo analysis
Connections under the Pradhan Mantri Ujjwala Yojana (PMUY) 23 per cent of these households reported receiving benefits under the PMUY
The six states included in the survey account for a significant share of PMUY coverage ndash 54 per cent of all connections provided under PMUY (PPAC 2019) However most of these connections cater to rural households One of the reasons for there being fewer PMUY connections in urban areas is that more than half of all urban slum households reported already having had LPG connections for over four years (before the launch of PMUY) Moreover over a quarter of PMUY households10 in urban slums reported having multiple LPG connections which suggests that not every household which was using LPG before the PMUY was prevented from accessing the schemersquos benefits
Government support during the COVID-19 pandemic During the COVID-19 lockdown the government announced the provision of three free-of-cost refills for PMUY households under the PM-Garib Kalyan Yojana While PMUY households in urban slums benefitted from this scheme non-PMUY households in urban slums did not As documented urban slum households faced a significant economic hit due to the loss of jobs and incomes during the pandemic (Patel 2020) Non-PMUY households that stack for economic reasons are more likely to use cheaper and freely available solid fuels without additional support from the government
PAHAL-Direct Benefit Transfer for LPG (DBTL)Overall about 42 per cent of active LPG users11 reported receiving a subsidy for their last LPG refill under the Direct Benefit Transfer for LPG scheme (DBTL) However about 28 per cent of urban slum households reported not knowing if they had received the subsidy amount for their last refill this suggests that the primary cook is often unaware of whether the subsidy is credited to the household Among the ones that reported receiving the LPG subsidy about 40 per cent of the primary cook were not aware of the amount of subsidy being credited into their account
10 This is a relatively smaller sample of 43 households from all the PMUY households in urban slums (131 households)
11 Households that have taken at least one refill in the past year
42
30
28
Received LPG refill subsidy
30 Still repaying PMUY loan
Did not receive LPG refill subsidy
10 Gave up LPG refill subsidy
Do not know
60 LPG refill susbsidy not received due to other reasons
Cooking fuel adoption and use in urban slum households
Are Indiarsquos Urban Poor Using Clean Cooking Fuels Insights from Slums in Six States16
23 Households using only polluting fuels About 12 per cent of urban slum households rely entirely on polluting fuels for all cooking and non-cooking purposes While the share of these households is relatively small the non-adoption of LPG in such households despite
programmes like the PMUY is concerning These households either use a combination of different polluting fuels (firewood dung cakes agricultural residue charcoal and kerosene) or just one of these fuels for all their energy needs Firewood is the most commonly used fuel in these households
231 Reasons for the non-adoption of LPGHouseholds that rely exclusively on polluting fuels reported not having an LPG connection Though three-fourths of these households were aware of PMUY the high upfront cost of an LPG connection along with the high recurring cost of procuring refills remain the two most important reasons for not procuring an LPG connection Repondents also mentioned a lack of information on how to procure a connection as a reason These reasons align with the common causes cited by rural households covered in the survey implying that the challenges faced by rural households and urban slum households in procuring connections are similar
Almost half of the households in this category use solid fuels for non-cooking purposes such as heating water for bathing space heating and preparing fodder for animals On the positive aspects of using polluting fuels households reported the following free-of-cost easy availability of fuels better tasting food and preference of family members for food cooked on the chulha
232 Fuel availability and affordabilityIn contrast with households that stack fuels households that use only solid fuels rely on purchasing fuels rather than collecting or preparing them For instance 60 per cent of firewood users in this category procure fuel by purchasing rather than collecting it
Households with low asset ownership rely on polluting fuels for cooking These households spend 2ndash3 per cent of their median monthly expenditure on fuel (INR 75 per month on fuel) which is much lower than what they would have to spend if they used LPG exclusively (INR 496 per month) Households that collect solid fuels spend about two hours on a single trip (three times a month) travelling a median one-way distance of 2 km This is equivalent to the distance travelled to procure LPG cylinders (if not delivered at home)
Figure 9 More than half of the households currently without LPG do not know how to get a connection or whom to ask about it implying a lack of awareness
Source Authorsrsquo analysis
0 10 20 30 40 50 60 70
39
53
63
68
80
Percentage of households
Rea
sons
for N
on-A
dop
tion
of L
PG Installation is expensive
Monthly expenditure on LPG is high
Do not know how to get or whom to ask
Not availabletoo far
17
12 See Annexure III for details on the districts and their PM25 concentrations The data for 15 districts (from Bihar Uttar Pradesh Madhya Pradesh and Rajasthan) overlapping with the survey sample have been analysed based on the availability of air quality data from continuous monitoring stations
13 Air quality categories based on PM25 concentration (in μgm3)
Good 0 to 30 Satisfactory 31 to 60 Moderately polluted 61 to 90 Poor 91 to 120 Very poor 121 to 250 Severe above 250 (Central Pollution Control Board 2014)
Cooking fuel adoption and use in urban slum households
Winter months have the highest PM25 concentrations coinciding with the sharp increase in use of polluting fuels for heating bath water and room heating
233 Gendered time use in households using solid fuelsIn urban slums both the male and female members of the household are equally involved in collecting firewood Still it is primarily the female members of the household who undertake dung cake preparation In addition to engaging in fuel collection and preparation women tend to spend more time cooking in households using solid fuels About 85 per cent of households that transitioned to LPG in the past four years reported having saved time while cooking compared to when they used solid fuels
SPOTLIGHT I Household air pollution (HAP) in urban slums
Burning solid fuels in three-stone fires and mud stoves with inadequate ventilation causes high levels of smoke exposure and negative health impacts particularly for women and young children (WHO 2014)
The double burden of ambient and household air pollution on the urban slum populationUsing the PM25 data from continuous ambient air quality monitoring stations (CAAQMS) for 15 districts12 in our sample we found that the ambient air quality remained in the lsquopoorrsquo or worse category13 for most districts throughout the year variation in the ambient air quality
Are Indiarsquos Urban Poor Using Clean Cooking Fuels Insights from Slums in Six States
Impact of ventilation
Indoor cooking and low adoption of chimney indicates high exposure to pollution from the use of unclean fuels for cooking The proportion of households with a chimney is high (52 per cent) among those who rely only on polluting fuels Smith and Pillarisetti (2017) explain that while having a good chimney lowers peak levels of indoor pollution long-term average exposure is reduced only by a factor of two Besides chimneys require regular maintenance to function correctly While more than 45 per cent of the households are using polluting fuels less than 20 per cent of the slum housheolds use improved cookstoves
Households also use solid fuels for non-cooking uses like space heating On average each house in a slum has two rooms this effectively exposes all members of the household to emissions from burning fuels Emissions from household sources contribute significantly to the surrounding air quality (Harish et al 2019) this concern is exacerbated in congested slum areas
the winter months (November to February) have the highest concentration of PM25 This leads to a double burden of exposure for slum households stacking solid fuels as they are more likely to increase use of solid fuels in winters (Figure 7) Alternatively the use of LPG as the primary source of fuel increases during the rainy season (June to September) these months record the least ambient air pollution
We also find that districts like Meerut Ghaziabad Patna Gautam Buddha Nagar (Noida and Greater Noida) and Muzaffarpur have the highest frequency of lsquovery poorrsquo air quality days throughout the year Across these districts one-third of households use polluting fuels for cooking In urban slums where households are more densely packed the emissions from burning solid fuels increase the risk of exposure inside households and deteriorate the ambient air quality for the community at large As a result these communities suffer from both increased household and ambient air pollution HAP has an estimated average contribution of 30ndash50 per cent to ambient air quality across Indiarsquos urban and rural areas (Balakrishnan et al 2019) Addressing biomass burning for cooking water heating and space heating during the winters has the potential to help reach the national ambient air quality standards (Chowdhury et al 2019) Despite that only 2 per cent of the action points in 44 city clean air plans mention cooking and heating as a sector to address air pollution (Ganguly Selvaraj and Guttikunda 2020)
18
75 householdsrsquo
using polluting fuels cook inside
the main house
67 householdsrsquo using polluting fuels do not have a chimney for ventilation
Awareness about the health impacts of using polluting fuelsAbout 60 per cent of households using only polluting fuels and 84 per cent of households that stack LPG with a polluting fuel report lsquotoo smokyrsquo as the most prominent negative aspect of using polluting fuels This suggests that as more households switch to clean cooking fuels perceptions regarding pollution fuels change
Three-fourths of primary cooks who use polluting fuels for cooking agree that smoke from solid fuels is harmful to them this implies that awareness of the adverse health impacts of polluting fuels does not necessarily lead to the uptake of clean fuels Primary cooks also agree that smoke from solid fuels causes coughing (49 per cent) and lung infections in children (39 per cent)
Exposure to air pollution is a known risk factor for underlying chronic diseases that predict the severity of
COVID-19 disease and patient outcomes (World Bank 2020) This linkage suggests a heightened risk for women
in all age groups who cook using traditional technologies and fuels (World Bank 2020) The highest number of
COVID-19 cases were recorded in the most polluted regions among patients with pre-existing health conditions
(Frontera et al 2020)
Results from a controlled study show a higher prevalence of chronic obstructive pulmonary disease (COPD)
among biomass fuel users than clean fuel users ( Johnson et al 2011) The available clinical data to date suggest
that cardiovascular disease diabetes chronic respiratory illness and hypertension ndash conditions all strongly
associated with exposure to HAP ndash are also risk factors for COVID-19 (World Bank 2020)
BOX 7 Impact of household air pollution on COVID-19
19Cooking fuel adoption and use in urban slum households
Are Indiarsquos Urban Poor Using Clean Cooking Fuels Insights from Slums in Six States
Traditionally women bear a disproportionate burden in collecting and preparing biomass for cooking While this burden reduces with the use of clean cooking fuels like LPG the fuel supply within the household is then determined by formal and monetised distribution networks involving an outlay of money (Patnaik and Jha 2020) Our data shows that womenrsquos status in the household (as heads of households)14 positively correlates with households using LPG as their primary fuel The existing literature also supports the idea that female-headed households prefer modern fuels to polluting ones (Farsi Filippini and Pachauri 2007 Rao and Reddy 2007 Kuo and Azam 2019) Other research also suggests that female-headed households are more willing to spend on LPG as a recurring expense (Kojima Bacon and Zhou 2011 Kuo and Azam 2019)
SPOTLIGHT II Womenrsquos participation in intra-household decision-making regarding LPG use
20
14 In almost half of the households surveyed the primary cook reported a female member being the head of the household The reason behind such high percentage of female-headed households could be because only the primary cook of every household (who is mostly female) was surveyed This does not mean that these households do not have any adult male members Traditionally headship refers to the head of household as the individual whose lsquoauthorityrsquo the household members recognise But this definition overlooks potential intra-household variations in the recognised authority in different realms of decision-making (Kilic Moylan and Koolwal 2020) Since cooking is a gendered activity the primary cookrsquos response to the head of household question may have been with respect to the recognised authority figure for that activity within the household
30 householdsrsquo female members place the order for LPG refills
50householdsrsquo female
members decide whether or when to purchase LPG refills
We also find that the decision of whether or when to purchase LPG refills is made by male members in half of urban slum households This holds for both male- and female-headed households In LPG-using households where the primary cook is involved in an income-generating activity more women are deciding to order the refills This pattern is similar irrespective of whether the household uses LPG exclusively or stacks it with other polluting fuels or are PMUY beneficiaries
SPOTLIGHT III A comparison of access to clean cooking energy between urban slum and non-slum households across six states
21
At the state level Bihar has significantly poor involvement of women in intra-household decision-making regarding
ordering refills with less than 10 per cent of households reporting that women decide whether or when to order
refills However more women than men are involved in decisions around LPG refills in Rajasthan Madhya Pradesh
and Jharkhand
Across caste groups the involvement of women is lowest (37 per cent) among the Scheduled Castes (SCs)
However more women in General and OBC households decide when to order LPG refills
BOX 8 Variations in intra-household decision-making across states and caste groups
Cooking fuel adoption and use in urban slum households
To compare the fuel use patterns of urban slum and non-slum households we used data from the India Residential Energy Survey (IRES 2020)15 The overlap in the sampling strategies of both IRES and our survey enabled a comparison of the findings There is a significant difference in the socio-economic status of slum and non-slum households which tends to affect their fuel use patterns Table 4 provides a comparison of cooking fuel usage in urban non-slum households (from IRES 2020) and urban slum households (Cooking Energy Access and Use survey 2020)
Are Indiarsquos Urban Poor Using Clean Cooking Fuels Insights from Slums in Six States22
Table 4 The poor economic condition of households in urban slums impacts the exclusive use of clean fuels for cooking
Source Authorsrsquo analysis
Fuel use categories Urban slum households (Cooking Energy Access Survey) ()
Non-slum urban households (IRES) ()
95 88
84 55
9 33
5 12
Clean fuel users (LPG PNG and electricity)
LPG as an exclusive fuel
Households that stack LPG with polluting fuels
Households that use only polluting fuels
We observed a significant gap in the exclusive use of LPG as a cooking fuel between urban slums and non-slum households explained mainly by the difference in their economic conditions Stacking is three times more common in slum households than non-slum households About 45 per cent of non-slum households using polluting fuels belong to marginalised social groups (SCs and STs) Households using polluting fuels have a lower median monthly expenditure than others and about 62 per cent of such households are semi-pucca or kuchha structures Among LPG users non-slum households have a slightly higher rate of doorstep delivery as compared to slum households
LPG-using households receiving home deliveries
Source Authorsrsquo analysis
239
6372
Urban slum households (Cooking Energy Access and Use)
()
Non-slum urban households (IRES)
()
Proportion of PMUY beneficiaries among LPG-using households
15 IRES 2020 was conducted in 21 large states of India including Bihar Jharkhand Rajasthan Madhya Pradesh Uttar Pradesh and Chhattisgarh While IRES 2020 focused on urban households the Cooking Energy Access and Use survey specifically attended to urban slums in the same districts Refer to the technical note for a detailed methodology of the survey
23
3 Way forward
Slums across the world are chronically ignored in public policy and suffer because of unauthorised and unsafe habitation without access to government services (Shahadat
Lipu and Bhuiyan 2014) In terms of energy access while we see a progressive change in householdsrsquo energy use patterns as we move from rural to urban issues like affordability availability preference and familiarity with the fuel and stove remain essential factors that determine householdsrsquo fuel choice
Image iStock
Are Indiarsquos Urban Poor Using Clean Cooking Fuels Insights from Slums in Six States24
Understanding categories of users is important for enabling access to and use of clean cooking fuels
We categorised the urban slum population based on their fuel usage patterns ndash using only clean fuels stacking clean fuels with polluting fuels and using only polluting fuels While most households in urban slums have an LPG connection only half of them use LPG exclusively The householdrsquos economic status and its access to doorstep delivery of LPG refills are two crucial factors that determine its ability to use LPG exclusively Despite being situated in urban areas 37 per cent of slum households do not receive home delivery of cylinders ndash availability is an essential factor in determining the householdrsquos likelihood of using LPG exclusively There is a strong impetus for the OMCs and distributors to improve their home delivery services of LPG refills in slum areas
Stacking is prevalent in about one-third of households ndash there is a need for a deeper understanding of householdsrsquo preferences fuel end-uses and awareness Most households reported using polluting fuels daily or at least weekly this effectively increases their exposure to household air pollution despite having access to clean cooking fuels Among households that stack LPG with polluting fuels the reasons for stacking differ ndash affordability seasonality and taste preference More than a quarter of households that stack have a similar level of LPG consumption as those that use LPG exclusively despite similar family sizes Such households use polluting fuels not because of their inability to afford LPG But other factors like free-of-cost availability of biomass taste preference for chulha and alternate end-uses of fuelmdashfor instance in space heatingmdashinfluence the householdrsquos decision to use solid fuels Among households that stack multiple fuels the use of polluting fuels increases during winter months this exposes the households to a double burden of high ambient and household air pollution in these months About 40 per cent of these households also use polluting fuels for non-cooking purposes like heating water for bathing and space heating especially in winter
Even with large-scale government initiatives like PMUY we find that more than 10 per cent of urban slum households do not use LPG They mainly rely on free-of-cost biomass for their cooking and non-cooking needs Despite awareness of PMUY among these households the high upfront cost of procuring an LPG connection and high recurring expenditure on refills deter them from using LPG Evidently there is a need to expand the reach of PMUY to cover households across slums
Integrating the issue of lack of access to clean cooking energy within the discussion on urban poverty
This study reiterates the need to look at poverty in urban areas in the context of energy access Given the heterogeneity of poverty in urban and semi-urban India it is essential to understand energy poverty in the context of access to resources for an enhanced quality of life for the urban poor Similarly slums dwellers in large and small cities alike may experience additional challenges of access Furthermore not all urban poor live in slums we know even less about the access issues of temporary residents or seasonal migrants in urban India Therefore in a rapidly urbanising India studies on the urban poor and air quality need to integrate a focus on energy access to address the vulnerability of women children and communities to HAP and the drudgery of using polluting fuels for cooking and other household energy needs
Access to clean cooking energy schemes must be integrated into the social assistance programmes focused on urban poverty alleviation to enhance its reach
25Way forward
Converging energy access in social protection policies for the urban poor
Accounting for the vulnerabilities of the urban poor is crucial in designing and implementing policies including social protection schemes As a health and economic imperative access to clean cooking energy schemes must be integrated into the social assistance programmes of other ministries (eg health education and nutrition assistance) to offer better support to slum households This would also reduce the burden on households of claiming and accessing multiple benefits across schemes thus freeing them to invest more time in productive activities (CEEW 2020) Government programmes such as the National Urban Livelihoods Mission and social service allocations for housing should use existing targeting approaches to include access to clean cooking energy within the ambit of services for the poor
Bringing a renewed emphasis on clean cooking energy access due to COVID-19 is essential
Most households in urban slums rely on daily wage labour or the gig economy for their household income During the COVID-19 pandemic these occupations have been among the worst impacted by the lockdown and the economic slowdown A survey conducted with over 2000 daily wage workers in urban slums during the lockdown suggests that only 7 per cent of respondents from this group received pay during the lockdown (Basu 2020) causing a massive shock to their livelihoods and wage earnings This kind of impact pushes households into energy poverty leading to the increased use of free-of-cost biomass and consequently increasing the risk of exposure to emissions from fuel burning While the government has committed to supplying up to three free refills to all PMUY households under PM-Garib Kalyan Yojana less than a quarter of households in urban slums have Ujjwala connections The low share of PMUY households effectively makes the majority of slum households ineligible for relief support given under the PM-Garib Kalyan Yojana during the lockdown There is a need to target vulnerable households ndash beyond PMUY beneficiaries ndash with differential subsidy support for using LPG in a sustained manner
Increased poverty would mean increased use of polluting fuels ndash there is a need for a renewed emphasis on clean cooking energy access during the COVID-19 pandemic as increased use of polluting fuels has health implications (lower respiratory infections and COPD) that increase the risk of COVID-19 infections being more severe
There is a need to target vulnerable households ndash beyond PMUY beneficiaries ndash with differential subsidy support for using LPG in a sustained manner
Are Indiarsquos Urban Poor Using Clean Cooking Fuels Insights from Slums in Six States
Balakrishnan Kalpana Sagnik Dey Tarun Gupta R S Dhaliwal Michael Brauer Aaron J Cohen Jeffrey D Stanaway et al 2019 ldquoThe Impact of Air Pollution on Deaths Disease Burden and Life Expectancy Across the States of India The Global Burden of Disease Study 2017rdquo The Lancet Planetary Health 3 (1) e26ndash39 httpsdoiorg101016S2542-5196(18)30261-4
Baqir M S K Bharti R Kothari and R P Singh 2019 ldquoAssessment of an Energy-efficient Metal Chulha for Solid Biomass Fuel and Evaluation of its Performancerdquo International Journal of Environmental Science and Technology 16 (11) 6773ndash6784 httpsdoiorg101007s13762-018-2028-9
Basu Anika Badyal 2020 ldquoLockdown Survey How The Covid-19 Crisis Has Affected Daily Wage WorkersmdashAIFrdquo American India Foundation June 28 httpsaiforglockdown-survey-how-the-covid-19-crisis-has-affected-daily-wage-workers
Butera F M P Caputo R Adhikari and A Facchini 2016 ldquoThe Challenge of Energy in Informal Settlements A Review of the Literature for Latin America and Africardquo Procedia Engineering 1ndash32 httpswwwenelfoundationorgcontentdamenel-foundtopic-downloadThe challenge of Energy in Informal settlementspdf
CEEW 2020 ldquoEnergy Safety Nets India Case Studyrdquo Vienna Sustainable Energy for All httpswwwceewinpublicationsenergy-safety-nets-india-case-study
Central Pollution Control Board 2014 ldquoNational Air Quality Indexrdquo New Delhi Central Pollution Control Board httpsappcpcbccrcomccr_docsFINAL-REPORT_AQI_pdf
Chafe Z S Mehta and K R Smith 2011 ldquoAmbient Fine Particulate (PM25) Air Pollution Attributable to Household Cooking Fuel in Asiardquo AGUFM A54Bndash03 httpsuiadsabsharvardeduabs2011AGUFMA54B03Cabstract
Chandramouli C 2010 ldquoCensus of India 2011 ndash Circular No 8rdquo New Delhi Ministry of Home Affairs httpscensusindiagovin2011-CircularsCircularsCircular-08pdf
Chandrasekhar S and Arup Mitra 2018 ldquoMigration Caste and Livelihood Evidence from Indian City-slumsrdquo Urban Research amp Practice 12 (2) 156ndash172 httpsdoiorg1010801753506920181426781
Cheng Chao Yo and Johannes Urpelainen 2014 ldquoFuel Stacking in India Changes in the Cooking and Lighting Mix 1987ndash2010rdquo Energy 76 (November) 306ndash317 httpsdoiorg101016jenergy201408023
Chowdhary Sourangsu Sagnik Dey Sarath Guttikunda Ajay Pillarisetti Kirk R Smith and Larry Di Girolamo 2019 ldquoIndian annual ambient air quality standard is achievable by completely mitigating emissions from household sourcesrdquo Proceedings of the National Academy of Sciences 116 (22) 10711-10716 httpsdoiorg101073pnas1900888116
Dhingra Chhavi Shikha Gandhi Akanksha Chaurey and P K Agarwal 2008 ldquoAccess to Clean Energy Services for the Urban and Peri-Urban Poor A Case-study of Delhi Indiardquo Energy for Sustainable Development 12 (4) 49ndash55 httpsdoiorg101016S0973-0826(09)60007-7
Farsi Mehdi Massimo Filippini and Shonali Pachauri 2007 ldquoFuel Choices in Urban Indian Householdsrdquo Environment and Development Economics 12 (6) 757ndash774 httpsdoiorg101017S1355770X07003932
References
26
Frontera Antonio Lorenzo Cianfanelli Konstantinos Vlachos Giovanni Landoni and George Cremona 2020 ldquoSevere Air Pollution Links to Higher Mortality in COVID-19 Patients The lsquoDouble-Hitrsquo Hypothesisrdquo Journal of Infection 81 (2) 255ndash259 httpsdoiorg101016jjinf202005031
Ganguly Tanushree Kurinj L Selvaraj Sarath K Guttikunda 2020 ldquoNational Clean Air Programme (NCAP) for Indian cities Review and outlook of clean air action plansrdquo Atmospheric Environment X Vol 8 httpsdoiorg101016jaeaoa2020100096
GNESD 2008 ldquoClean Energy for the Urban Poor An Urgent Issuerdquo Accessed 25 July 2020 httpswwwgooglecomurlsa=tamprct=jampq=ampesrc=sampsource=webampcd=ampved=2ahUKEwi1hf2ru dntAhUCOisKHQH7BtsQFjAAegQIAxACampurl=http3A2F2Fwwwgnesdorg2F-2Fmedia2FSites2FGNESD2FPublication- pdfs2FSPM_CleanEnergyashx3Fla3Dda26hash3DE4971C585B6798F17954F8B42E073 D9507F42A84ampusg=AOvVaw08kCDgOkTkYc6wRDxzsNyq
Guan Wei-Jie Wen-Hua Liang Yi Zhao Heng-Rui Liang Zi-Sheng Chen Yi-Min Li Xiao-Qing Liu et al 2020 ldquoComorbidity and its Impact on 1590 Patients with COVID-19 in China A Nationwide Analysisrdquo European Respiratory Journal 55 (5) 2000547 httpsdoiorg1011831399300300547-2020
Harish Santosh Kirk R Smith Sourangsu Chowdhury Zoe A Chafe Ajay Pillarisetti Jos Lelieveld Sarath Guttikunda Sagnik Dey and Andrew P Grieshop 2019 ldquoThe Contribution of Household Fuels to Ambient Air Pollution in India A Comparison of Recent Estimates Edited by CcapcOrgInrdquo Collaborative Clean Air Policy Centre May 30 httpsccapcorginpolicy-briefs2019530the-contribution-of-household-fuels-to-ambient-air-pollution-in-india-a-comparison-of-recent-estimates
Jain Abhishek Saurabh Tripathi Sunil Mani Sasmita Patnaik Tauseef Shahidi and Karthik Ganesan 2018 ldquoAccess to Clean Cooking Energy and Electricity Survey of States 2018rdquo New Delhi CEEW httpswwwceewinsitesdefaultfilesCEEW-Access-to-Clean-Cooking-Energy-and-Electricity-11Jan19_0pdf
Johnson Priscilla Kalpana Balakrishnan Padmavathi Ramaswamy Santu Ghosh Muthukumar Sadhasivam Omprakash Abirami Bernard W C Sathiasekaran Kirk R Smith Vijayalakshmi Thanasekaraan and Arcot S Subhashini 2011 ldquoPrevalence of Chronic Obstructive Pulmonary Disease in Rural Women of Tamilnadu Implications for Refining Disease Burden Assessments Attributable to Household Biomass Combustionrdquo Global Health Action 4 (1) 7226 httpsdoiorg103402ghav4i07226
Kilic Talip Heather Moylan and Gayatri Koolwal 2020 ldquoGetting the (Gender-disaggregated) Lay of the Land Impact of Survey Respondent Selection on Measuring Land Ownership and Rightsrdquo Washington DC The World Bank httpsdoiorg1015961813-9450-9151
Kojima Masami Robert Bacon and Xin Zhou 2011 ldquoWho Uses Bottled Gas Evidence from Households in Developing Countriesrdquo The World Bank Sustainable Energy Department Oil Gas and Mining Unit httpelibraryworldbankorgdoibook1015961813-9450-5731
Kuo Ying-Min and Mehtabul Azam 2019 ldquoHousehold Cooking Fuel Choice in India 2004ndash2012 A Panel Multinomial Analysisrdquo IZA Discussion Paper No 12682 httpsssrncomabstract=3468630
Lippi Giuseppe and Brandon Michael Henry 2020 ldquoChronic Obstructive Pulmonary Disease Is Associated with Severe Coronavirus Disease 2019 (COVID-19) COPD and COVID-19rdquo Respiratory Medicine 167 105941 httpsdoiorg101016jrmed2020105941
Ministry of Housing and Urban Affairs 2019 ldquoHandbook of Urban Statisticsrdquo New Delhi Government of India httpmohuagovinpdf5c80e2225a124Handbook of Urban Statistics 2019pdf
Rao M Narasimha and B Sudhakara Reddy 2007 ldquoVariations in Energy Use by Indian Households An Analysis of Micro Level Datardquo Energy 32 (2) 143ndash153 httpsdoiorg101016jenergy200603012
27References
Are Indiarsquos Urban Poor Using Clean Cooking Fuels Insights from Slums in Six States28
National Buildings Organisation 2013 ldquoState of Slums in India a Statistical Compendium 2013rdquo New Delhi Government of India httpnbonicinpdfSlums_in_India_Compendium_English_Versionpdf
National Sample Survey Office 2012 ldquoKey Indicators of Urban Slums in India ndash 69th Roundrdquo New Delhi National Data Bank for Socio-religious Categories httpmospinicinsitesdefaultfilesnational_data_bankndb-rpts-69htm
Nolan Laura B 2015 ldquoSlum Definitions in Urban India Implications for the Measurement of Health Inequalitiesrdquo Population and Development Review 41 (1) 59ndash84 httpsideasrepecorgablapopdevv41y2015i1p59-84html
Nolan Laura B David E Bloom and Ramnath Subbaraman 2018 ldquoLegal Status and Deprivation in Urban Slums Over Two Decadesrdquo HHS Public Access 53 (15) 47ndash55
Patel Amit 2020 ldquoPreventing COVID-19 Amid Public Health and Urban Planning Failures in Slums of Indian Citiesrdquo World Medical amp Health Policy 12 (3) httpsdoiorg101002wmh3351
Patnaik Sasmita and Shaily Jha 2020 ldquoCaste Class and Gender in Determining Access to Energy A Critical Review of LPG Adoption in Indiardquo Energy Research amp Social Science 67 (September) 101530 httpsdoiorg101016jerss2020101530
PPAC-CRISIL 2016 ldquoAssessment Report Primary Survey on Household Cooking Fuel Usage and Willingness to Convert to LPGrdquo New Delhi Petroleum Planning amp Analysis Cell Ministry of Petroleum and Natural Gas Government of India httpswwwppacgovinWriteReadDataReports201710310449342512219PrimarySurveyReportPPACpdf
PPAC 2019 ldquoOil Industry Information at a Glancerdquo New Delhi Ministry of Petroleum and Natural Gas Government of India httpswwwppacgovinWriteReadDataReports201912060336500305462ReadyReckonerNov2019WebVersionpdf
Rahaman Mehebub and Dipendra Nath Das 2017 ldquoNature of Slum Growth in Indian Citiesrdquo Urban India 37 (II) 100ndash116 httpswwwresearchgatenetpublication334051882_Nature_of_Slum_Growth_in_Indian_Citiesread
Rains Emily Anirudh Krishna and Erik Wibbels 2018 ldquoUrbanisation and Indiarsquos Slum Continuum Evidence on the Range of Policy Needs and Scope of Mobilityrdquo London International Growth Centre httpswwwtheigcorgwp-contentuploads201802Rains-et-al_Working-paper_coverpdf
Ranjan Rahul and Sudershan Singh 2017 ldquoEnergy Deprivation of Indian Households Evidence from NSSO Datardquo New Delhi Munich Personal RePEc Archive httpsmpraubuni-muenchende835661MPRA_paper_83566pdf
Roy Debraj Bharath Palavalli Niveditha Menon Robin King Karin Pfeffer Michael Lees and Peter M A Sloot 2018 ldquoSurvey-based Socio-economic Data from Slums in Bangalore Indiardquo Nature Publishing Group 5 1ndash9 httpsdoiorg101038sdata2017200
Saksena Sumeet P B Singh Raj Kumar Prasad Rakesh Prasad Preeti Malhotra Veena Joshi and R S Patil 2003 ldquoExposure of Infants to Outdoor and Indoor Air Pollution in Low-income Urban Areas A Case Study of Delhirdquo Journal of Exposure Science amp Environmental Epidemiology 13 219ndash30 httpsdoiorg101038sjjea7500273
Lipu Molla Shahadat Hossain and Arif Waliullah Bhuiyan 2014 ldquoElectricity Access in Urban Slum Households of Bangladesh A Case of Dhakardquo Journal of Renewable and Sustainable Energy 6 (053112) 1ndash15 httpsdoiorg10106314896697
29
Singh Rozita Xiao Wang Emmanuel Ackom and Juan Reyes 2015 ldquoEnergy Access Realities in Urban Poor Communities of Developing Countries Assessments and Recommendationsrdquo Global Network on Energy for Sustainable Development (GNESD) httpswwwgooglecomurlsa=tamprct=jampq=ampesrc=sampsource=webampcd=ampved=2ahUKEwj5nbqI wdntAhXUTX0KHZE6DboQFjAAegQIAhACampurl=https3A2F2Forbitdtudk2Ffiles2F10635 24942FEnergy_access_realities_v_final_updatedpdfampusg=AOvVaw0xNBAAo0bjLueY9FmoigKF
Singh Santosh 2014 ldquoThe Kaleidoscope of Cooking Understanding Cooking Behaviour and Stove Preferences in Rural Indiardquo New Delhi Deutsche Gesellschaft fuumlr Internationale Zusammenarbeit (GIZ) GmbH httpswwwgizdeendownloadsgiz2014-en-kaleidoscope-of-cooking-indiapdf
Smith Kirk R and Ajay Pillarisetti 2017 ldquoHousehold Air Pollution from Solid Cookfuels and its Effects on Healthrdquo Disease Control Priorities 7 (3) 133ndash52 httpsdoiorg101596978-1-4648-0522-6_ch7
UN-Habitat 2003 ldquoThe Challenge of Slums ndash Global Report on Human Settlements 2003rdquo Location of publishing London UN-Habitat httpsunhabitatorgthe-challenge-of-slums-global-report-on-human-settlements-2003
Wang Bolin Ruobao Li Zhong Lu and Yan Huang 2020 ldquoDoes Comorbidity Increase the Risk of Patients with COVID-19 Evidence from Meta-analysisrdquo Aging 12 (7) 6049ndash6057 httpsdoiorg1018632AGING103000
WHO 2014 ldquoWHO Guidelines for Indoor Air Quality Household Fuel Combustionrdquo WHO Accessed 25 July 2020 httpwwwwhointairpollutionguidelineshousehold-fuel-combustionen
World Bank 2020 ldquoThe State of Modern Energy Cooking Servicesrdquo Washington DC World Bank httpdocuments1worldbankorgcurateden937141600195758792pdfThe-State-of-Access-to-Modern-Energy-Cooking-Servicespdf
Yenneti Komali Yehua Dennis Wei and Wen Chen 2017 ldquoThe Urbanization of Poverty in India Spatio-temporal Disparities in Consumption Expendituresrdquo Geographical Review 107 (2) 360ndash383 httpsdoiorg101111j1931-0846201612167x
References
Are Indiarsquos Urban Poor Using Clean Cooking Fuels Insights from Slums in Six States
Annexure 1 Asset ownership index We used Filmer and Pritchettrsquos (2001) proposed approach to construct an asset ownership index using principal component analysis (PCA) We chose the indicators based on data from the Cooking Energy Access survey 2020 The variables we considered for the index were based on classifications by Caroline Moser and Andrew Felton (2007) and K Harttgen (2013) We computed the asset index using housing characteristics and consumer durables as follows
Variables not included in the asset index
Four types of variables were eliminated
1 Variables (such as grid electricity) that had high usage of greater than 95 per cent
2 Those (such as ownership of laptops or computers air conditioners etc) that had a low usage of less than 5 per cent
3 Variables (like house ownership) that have economically fluctuating values
4 Those that indicated a low correlation of less than 20 per cent variation between the top category (ie first) of the asset quintile and the bottom-most category (ie fifth) of the asset quintile
For ease of interpretation we rescaled this index such that the final index values range between 0 and 10 For this purpose we used a feature scaling (or minndashmax scaling) formula
Xnorm (or (IVx)) = (X ndash Xmin)(Xmax ndash Xmin)
where IVx is the normalised index value Xmin is the initial minimum value (-354) and Xmax is the initial maximum value (461) of the asset ownership index
30
Annexures
bull Crowding16 inside the house bull Toilet ownership and usage bull Source of water bull Number of pucca rooms
bull Ownership of two-wheeler bull Ownership of washing machine bull Ownership of television bull Ownership of refrigerator bull Ownership of cooker
16 A household with more than three members occupying a single room is considered crowded (World Health Organization 2018)
Housing characteristics
Consumer durables
Annexure 2 Explaining the use of LPG as the exclusive fuel (simple logistic regression model)
31Annexures
Dependent variable exclusive LPG use
Education of the primary cook (categorical base category is education beyond the school level)
Education of the household head (categorical base category is education beyond the school level)
State (categorical base category includes households from Rajasthan)
P gt z 95 confidence interval
Odds ratio (SE)
1299 (0112)
0659 (0202)
1399 (0394)
0970 (0038)
0994 (0011)
1003 (0013)
2042 (0508)
1011 (0046)
0782 (0441)
1198 (0608)
1377 (0664)
1345 (0566)
3141 (1103)
1213 (0500)
0309 (0211)
1165 (0565)
1703 (0680)
0002
0174
0233
0446
0583
0839
0004
0812
0663
0722
0507
0482
0001
0639
0086
0753
0182
1097
0361
0806
0898
0973
0977
1254
0924
0259
0443
0535
0589
1578
0541
0081
0450
0779
1540
1203
2428
1048
1016
1029
3327
1106
2361
3240
3545
3070
6251
2720
1181
3014
3723
Asset index
Primary cook involved in income-generating activity
Female-headed households
Household size
Age of household head
Age of primary cook
Doorstep delivery of LPG cylinders
PMUY customer
Primary cook is not educated
Primary cook has a school education
Household head is not educated
Household head has a school education
Uttar Pradesh
Bihar
Chhattisgarh
Jharkhand
Madhya Pradesh
Number of households (n) = 417
Log likelihood = -228777
Prob gt chi2 = 0000
Pseudo R2 = 0126
The dependent variable is a dummy variable where households using LPG exclusively are assigned a value of 1 and all other households are assigned the value of 0
The caste of the household has not been factored into the regression as a separate variable because of its underlying influence on economic status
Source Authorsrsquo analysis
Are Indiarsquos Urban Poor Using Clean Cooking Fuels Insights from Slums in Six States
Annexure 3 Air quality (PM25 concentration in μgm3) across 15 districts based on CAAQMS data
32
Dis
tric
tsM
ar-1
9A
pr-1
9M
ay-1
9Ju
n-19
Jul-1
9A
ug-1
9Se
p-19
Oct
-19
Nov
-19
Dec
-19
Jan-
20Fe
b-20
Mar
-20
794
5
988
5
866
7
-
645
329
2
453
7
388
1
769
1
886
4
661
5
950
9
834
4
-
823
4
611
7
569
9
535
7
-
270
4
589
4
571
5
293
1
705
4
839
2
614
9
970
1
826
8
-
844
9
622
1
597
1
564
0
-
235
3
414
3
619
1
414
3
653
9
834
7
568
8
104
90
739
8
-
894
9
630
9
342
2
450
4
-
476
465
2
474
6
429
2
592
3
566
1
-
674
6
531
4
501
5
568
7
450
8
-
320
3
-
846
506
3
349
5
332
4
369
1
387
2
-
430
4
393
6
353
7
446
2
406
8
335
2
339
1
-
102
9
497
2
261
8
269
1
431
4
294
1
-
351
6
277
3
-
336
5
315
5
248
3
392
8
149
7
144
9
462
3
270
5
331
3
273
4
276
0
106
6
391
7
326
2
-
368
6
625
3
875
2
101
64
521
2
183
1
380
4
556
2
544
1
558
2
102
24
104
33
156
44
128
73
146
62
137
71
109
14
183
70
201
80
896
7
190
1
457
7
581
2
583
5
815
4
135
00
126
41
239
94
208
15
158
51
221
86
121
35
192
46
218
43
848
0
205
2
448
5
509
4
582
0
704
5
177
01
613
1
244
01
215
80
136
87
230
54
964
2
201
52
122
30
725
5
120
6
435
4
454
7
481
2
111
37
147
45
537
3
175
53
162
86
111
21
170
08
583
8
132
10
866
2
513
1
112
5
511
3
507
5
511
8
879
4
120
22
502
1
135
53
116
39
994
7
120
45
410
5
792
1
674
8
326
3
177
6
385
0
408
5
335
9
497
2
594
2
429
9
673
2
547
5
540
8
559
4
Gay
a
Muz
affa
rpur
Pat
na
Bho
pal
Satn
a
Alw
ar
Ajm
er
Ud
aip
ur
Ag
ra
Bul
and
shah
r
Hap
ur
Gha
ziab
ad
Gre
ater
Noi
da
Mee
rut
Noi
da
Sour
ce C
onti
nuou
s am
bien
t air
qua
lity
mon
itor
ing
stat
ion
(Mar
ch 2
019
ndash M
arch
202
0)
In a rapidly urbanising India it would be imperative for policymakers and practitioners in energy and urban development sector to integrate access to clean cooking energy within the ambit of services for the urban poor
Image CEEW
Are Indiarsquos Urban Poor Using Clean Cooking Fuels Insights from Slums in Six States
COUNCIL ON ENERGY ENVIRONMENT AND WATER (CEEW)
Sanskrit Bhawan A-10 Aruna Asaf Ali Marg Qutab Institutional AreaNew Delhi - 110 067 IndiaT +91 11 4073 3300
infoceewin | ceewin | CEEWIndia
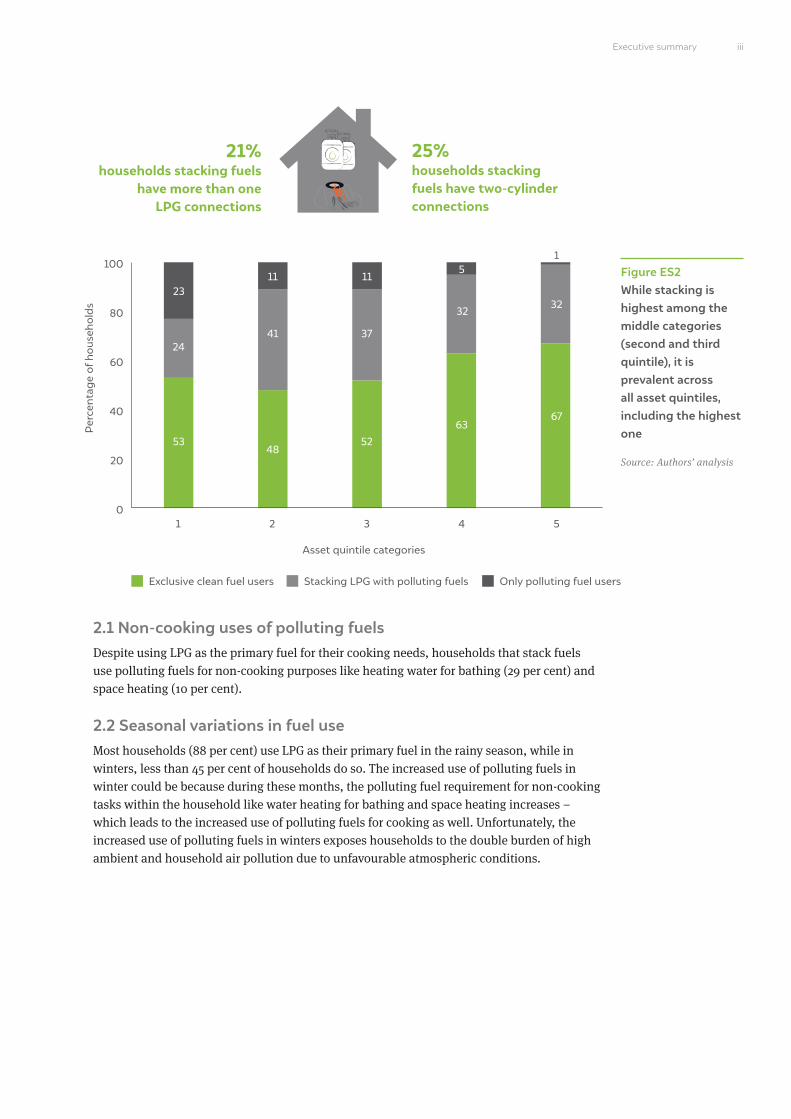
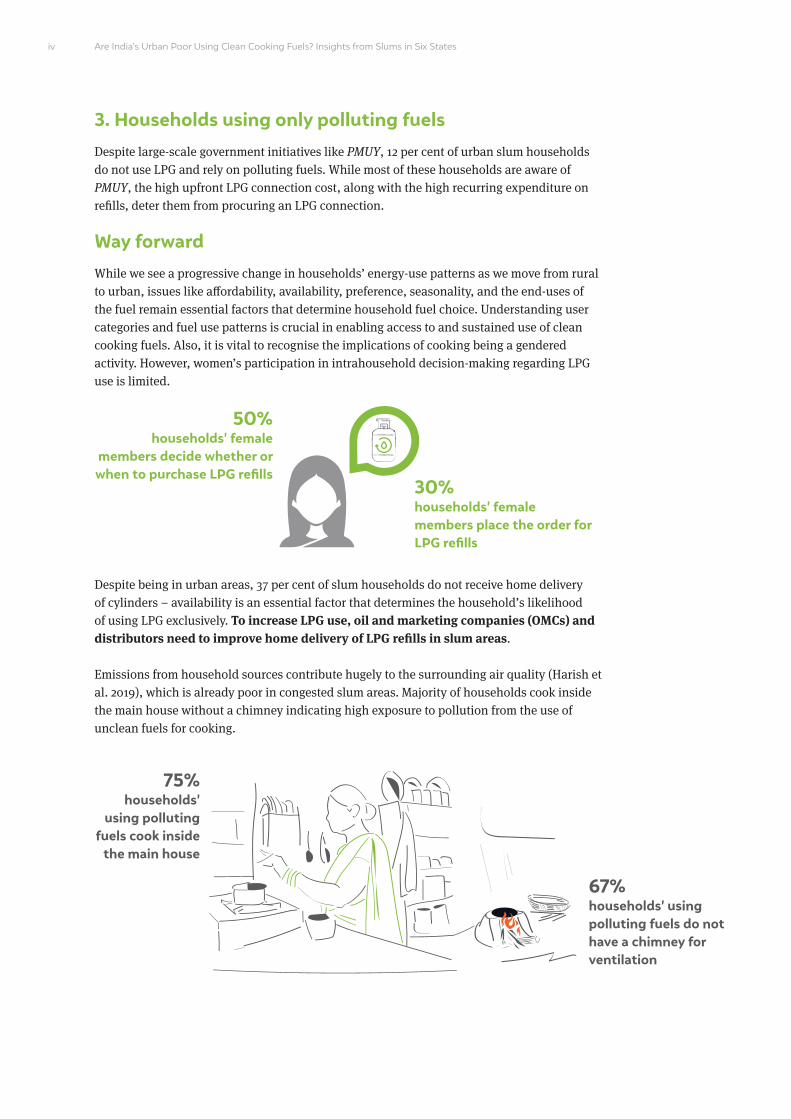
Are Indiarsquos Urban Poor Using Clean Cooking Fuels Insights from Slums in Six States
3 Households using only polluting fuelsDespite large-scale government initiatives like PMUY 12 per cent of urban slum households do not use LPG and rely on polluting fuels While most of these households are aware of PMUY the high upfront LPG connection cost along with the high recurring expenditure on refills deter them from procuring an LPG connection
Way forwardWhile we see a progressive change in householdsrsquo energy-use patterns as we move from rural to urban issues like affordability availability preference seasonality and the end-uses of the fuel remain essential factors that determine household fuel choice Understanding user categories and fuel use patterns is crucial in enabling access to and sustained use of clean cooking fuels Also it is vital to recognise the implications of cooking being a gendered activity However womenrsquos participation in intrahousehold decision-making regarding LPG use is limited
Despite being in urban areas 37 per cent of slum households do not receive home delivery of cylinders ndash availability is an essential factor that determines the householdrsquos likelihood of using LPG exclusively To increase LPG use oil and marketing companies (OMCs) and distributors need to improve home delivery of LPG refills in slum areas
Emissions from household sources contribute hugely to the surrounding air quality (Harish et al 2019) which is already poor in congested slum areas Majority of households cook inside the main house without a chimney indicating high exposure to pollution from the use of unclean fuels for cooking
iv
30 householdsrsquo female members place the order for LPG refills
50 householdsrsquo female
members decide whether or when to purchase LPG refills
75 householdsrsquo
using polluting fuels cook inside
the main house
67 householdsrsquo using polluting fuels do not have a chimney for ventilation
vExecutive summary
Integrate the issue of lack of access to clean cooking energy with urban poverty This study reiterates the need to look at poverty in urban areas in the context of energy access The vulnerability of urban slum dwellers needs to be accounted for while designing and implementing policies including social protection schemes Given the health and economic impacts of pollution access to clean cooking energy schemes must be integrated with the social assistance programmes of other ministries (eg health education and nutrition assistance) to better target support for slum households Government programmes such as the National Urban Livelihoods Mission and social service allocations for housing should use existing targeting approaches to include access to clean cooking energy within their ambit of services for the poor
The economic impact from COVID-19 will push households into energy poverty leading to the increased use of free-of-cost biomass ndash consequently increasing the risk of exposure to emissions from fuel burning While the government has announced that it will provide up to three free refills under the PM-Garib Kalyan Yojana scheme to all PMUY households less than a quarter of households in urban slums have Ujjwala connections ndash effectively making them ineligible for relief support There is a need to expand the reach of PMUY to cover all slum households
Bring renewed emphasis on clean cooking during COVID-19 Increased poverty would mean increased use of polluting fuels ndash there is a need for a renewed emphasis on clean cooking energy access during the COVID-19 pandemic as increased use of polluting fuels has health implications (lower respiratory infections and coronary chronic obstructive disease (COPD)) that increase the risk of COVID-19 infections being more severe
There is a need for targeted effort to include the poor households in urban slums left out in the first phase of Ujjwala
Are Indiarsquos Urban Poor Using Clean Cooking Fuels Insights from Slums in Six States
Image iStock
Addressing biomass burning for cooking water heating and space heating during the winters has the potential to help reach the national ambient air quality standards
The Census of India (2011) estimates that India has about 137 million slum dwellers across the country However statistics on slum populations vary significantly based on how
a slum is defined (Nolan 2015) Therefore not only is there a lack of data about how many people live in slums and informal settlements but there is also limited information about living conditions in slums (Rains Krishna and Wibbels 2018) Rapid urbanisation in India has led to population spikes in urban centres Low-income households in urban areas are trapped in informal and sometimes lsquoillegalrsquo settlements with poor living conditions where access to essential services and infrastructure tends to be limited or badly deteriorated (Butera et al 2016) While slum dwellers are not a homogeneous population slum areas have high concentrations of poverty and social and economic deprivation and poor shelter and environmental conditions (UN-Habitat 2003)
1 Introduction state of Indiarsquos urban slums
1
The Census of India (2011) defines slums as ldquoresidential areas where dwellings are unfit for human habitation by
reasons of dilapidation overcrowding faulty arrangements and design of such buildings narrowness or faulty
arrangement of street lack of ventilation light or sanitation facilities or any combination of these factors which
are detrimental to the safety and healthrdquo The slums in India are officially categorised into three categories
identified recognised and notified1 (Chandramouli 2010) About 59 per cent of slum households in India are non-
notified and are not legally recognised by the government (Nolan Bloom and Subbaraman 2018)
BOX 1 Slums in India
The existing literature on energy access and use in slums across developing countries suggests that while energy infrastructure (electric grid LPG distribution system) is available in these settlements (by being urban) households cannot afford it andor the service is unreliable (frequent outages and low voltage for electricity uncertain availability of gas cylinders) (Butera et al 2016) This leads to households relying on illegal connections for electricity and using energy sources that are on the lower end of the energy ladder (such as kerosene charcoal wood and other biomass residues) for cooking (Butera et al 2016)
1 Areas notified as slums by the concerned municipalities corporations local bodies or development authorities were termed notified slums All areas recognised as lsquoSlumrsquo by State UT Administration or Local Government Housing and Slum Boards which may have not been formally notified as slum under any act While a compact area of at least 300 population or about 60-70 households of poorly built congested tenements in the unhygienic environment is termed as identified slums (National Sample Survey Office 2012)
Are Indiarsquos Urban Poor Using Clean Cooking Fuels Insights from Slums in Six States2
In India population growth and rapid urbanisation have resulted in the deepening of urban poverty and the increased growth of urban slums (GNESD 2008 Yenneti Wei and Chen 2017) As per the Census 2011 most slum dwellers are casual labourers engaged in works other than public works (ie informal sectors) as opposed to salaried employees in non-slum urban areas (National Buildings Organisation 2013) As per the National Sample Survey Office (NSSO 2011ndash2012) the average daily wage of casual labourers is as low as INR 170 in urban areas (Ministry of Housing and Urban Affairs 2019) Such households may be able to purchase cleaner and more efficient fuels whenever they can but are likely to fall back on less efficient ones when faced by budgetary constraints Studies suggest that despite the LPG subsidies provided by the government significant sections of the urban poor population are still struggling to incorporate the cost of LPG into their household budgets (R Singh et al 2015) Use of multiple fuels also provides security from price variations and unreliable service associated with a single fuel or technology (Shahadat Lipu and Bhuiyan 2014)
As per the Census 2011 only half of the urban slum households across the country use LPG as their cooking fuel the remaining rely on solid fuels and kerosene Since 2013 the LPG programme in India has undergone many modifications to improve delivery and targeting access to connections and the availability of LPG (CEEW 2020) Pradhan Mantri Ujjwala Yojana (PMUY) which focuses on tackling the high upfront cost of LPG by providing LPG connections to below poverty line (BPL) households with credit-linked subsidy support has played an instrumental role in increasing the penetration of LPG across the country As of November 2019 about 965 per cent of households in India have an LPG connection (PPAC 2019) Small towns and cities which have been experiencing a comparatively slow rate of urban growth but the high percentage of slum population mall towns and cities which have been experiencing a relatively slow rate of urban growth but a high percentage of slum population
However the dramatic increase in LPG coverage has led to increased fuel stacking (Cheng and Urpelainen 2014) The reliance on fuel stacking has significant implications as the health benefits of using clean fuels are reduced or perhaps even nullified in households that continue to use biomass (Cheng and Urpelainen 2014) Urban slums suffer from a double burden of pollution as they are exposed to high ambient particulate matter pollution in cities along with the household air pollution (HAP) from using unclean cooking fuels (WHO 2014) The Global Burden of Disease study notes that even with the substantial increase in the provision of clean cooking fuels in India more than half of Indiarsquos population is exposed to HAP from solid cooking fuels as of 2017 (Balakrishnan et al 2019) In the current context this is concerning since exposure to air pollution has been linked to developing lower respiratory infections and chronic obstructive pulmonary disease (Balakrishnan et al 2019) which are among the major risk factors for COVID-19 (Lippi and Henry 2020 Wang et al 2020)
11 Motivation and methodology While there have been various studies on energy access in rural areas there is minimal data on energy use and patterns in urban slum households Most studies on urban slums and energy access focus on specific slums in large metropolitan areas such as Delhi and Bangalore (Saksena et al 2003 Dhingra et al 2008 Roy et al 2018) Living conditions and access to resources vary across slums in smaller towns and cities compared to those in Tier I
Slum-dwellers suffer from the double burden of pollution as they are exposed to high ambient particulate matter in cities along with the HAP from using unclean cooking fuels
2 A summary measure that identifies where countries or other geographic areas fall on the spectrum of development Expressed on a scale of 0 to 1 SDI is a composite average of the countryrsquos rankings in terms of per capita income average educational attainment and fertility rates
3 These states account for six out of eight of the lowest socio-demographic index (SDI) states and exhibit the highest health impacts of household air pollution (HAP) These states also have the highest percentage of households covered under the flagship clean cooking energy programme in India ndash PMUY
4 Referred to as lsquoour surveyrsquo thereafter
5 In our sample about 82 per cent of households are from notified slums
6 About 98 per cent of the respondents were female members of the household
7 For further details on the survey sample and methodology refer to the technical document for the survey
3Introduction state of Indiarsquos urban slums
Table 1 Sample allocation across urban slums
Source Authorsrsquo compilation
Note The number of slums sampled within each state varied because the slums were picked from the same districts that were sampled under the India Residential Energy Survey (2020) across the six states This was done to ensure logistical ease in conducting both the surveys and to share the resources of the national-level survey The list of urban slums as per the Census 2011 in the districts sampled under IRES 2020 constitutes the urban sampling frame7
State Districts sampled Urban slums sampled Households surveyed
16
14
10
10
4
4
58
31
15
16
12
5
4
83
249
124
128
94
40
32
667
Uttar Pradesh
Bihar
Madhya Pradesh
Rajasthan
Jharkhand
Chhattisgarh
cities these towns have been experiencing a comparatively slow rate of urban growth but are home to large slum populations (Rahaman and Das 2017) Further existing sources on access to clean cooking energy among slum households are limited to primary fuel use and lack detailed information about fuel use and stacking patterns
In India states with the lowest socio-demographic index (SDI)2 also account for the highest level of disease burden due to air pollution (Balakrishnan et al 2019) The low SDI states in north India had some of the highest levels of ambient particulate matter and household air pollution ndash especially Bihar Uttar Pradesh Rajasthan and Jharkhand The disability-adjusted life year (DALY) rate attributable to HAP was highest in the low SDI states of Chhattisgarh Rajasthan and Madhya Pradesh (Balakrishnan et al 2019)
The findings of this brief are based on a primary survey conducted across rural areas and urban slums in six energy access deprived states in India ndash Bihar Jharkhand Uttar Pradesh Rajasthan Madhya Pradesh and Chhattisgarh3 The Cooking Energy Access Survey 20204 focused on householdrsquos clean cooking energy access and its barriers and drivers in rural areas and urban slums Based on the list of urban slums across districts in Census 2011 the survey covered 656 households across 83 urban slums (notified and non-notified)5 spread across 58 districts The survey was conducted with the primary cook of the household6
In this brief we focus on understanding access to clean cooking energy specifically across urban slum households The analysis focuses on the fuel use patterns of households the extent of use of LPG and solid fuels fuel stacking behaviour and the primary cookrsquos perception of various cooking fuels and their impact on health The results discussed below are representative of the urban slum population in six states We have refrained from state-level analysis because of the smaller sample size for urban slums in some states like Jharkhand and Chhattisgarh
Are Indiarsquos Urban Poor Using Clean Cooking Fuels Insights from Slums in Six States4
12 Socio-economic characteristics of the urban slums of the six states Non-farm casual labour is the primary source of income for more than 42 per cent of the households such households reported a median monthly expenditure of about INR 5000 In only 20 per cent of the households the primary cook is involved in income-generating activities primarily engaged in casual non-farm labour or are self-employed
Source Authorsrsquo analysis
60 households have a monthly income below
INR 10000
In 90 households all members have
Aadhar cards
94 households have a bank account
11 households are currently indebted
Median savings in the past year
INR 4000
Median monthly expenditure
INR 6000
MEDIAN HOUSEHOLD SIZE
6
5
Table 2 Less than one-third of urban slum households reported income from salaried jobs
Source Authorsrsquo analysis
Under self-employment some of the householdsrsquo report occupations like carpentry tailoring driver and priest
The primary source of income of urban slum households
Non-farmdaily wage casual labour
Private or government salaried job
Shop or own business or self-employed
Farm labour
Agriculture on own or leased land
Others (pension remittances cattle rearing none)
43
22
18
8
7
2
Scheduled Castes (SC) (30 per cent) and Other Backward Castes (OBC) (45 per cent) form the majority of the urban slum population While Scheduled Tribes (ST) constitute less than 10 per cent of the overall population a majority of them are in Madhya Pradesh and Rajasthan Less than 20 per cent of the urban slum population are from the General castes States like Bihar Jharkhand and Rajasthan have the least proportion of General castes living in slum areas
Within urban slum households OBC and General households are relatively better off economically as shown in Table 3 Occupational patterns also vary based on caste A higher proportion of OBCs and General households rely on running a business self-employment or salaried jobs for their primary source of income as compared to SC and ST households The latter are primarily engaged in farm and non-farm labour The socio-economic marginality of SCs and STs even within slums is a consequence of these communities being most deprived in terms of access to resources and education income housing etc (Chandrasekhar and Mitra 2018) We see a similar trend in our sample in education and income levels Slums often remain the permanent habitation of marginalised castes as opposed to serving as an entry point for persons from higher castes who get absorbed into relatively better jobs and eventually move out of the slums (Chandrasekhar and Mitra 2018)
Table 3 Scheduled Castes and Scheduled Tribes have the lowest economic status
Source Authorsrsquo analysis
We utilise an economic status or asset index as a measure of a householdrsquos relative wealth and economic status based on the Filmer and Pritchett (2001) approach The list of variables included in the economic status index can be found in Annexure I The index takes values between 0 and 10 where a higher value denotes a higher level of asset ownership
Caste Sample size
Mean of asset index
(Min ndash Max) of BPL cardholders
233
51
281
92
042
039
046
046
(0ndash084)
(008ndash077)
(003ndash1)
(008ndash09)
45
60
49
36
Scheduled Castes
Scheduled Tribes
Other Backward Classes
General
Introduction state of Indiarsquos urban slums
Are Indiarsquos Urban Poor Using Clean Cooking Fuels Insights from Slums in Six States652
Image iStock
Exclusive use of LPG is limited to just over half of the total slum households The householdrsquos economic status and its access to doorstep delivery of LPG refills are two critical factors that determine their ability to use LPG exclusively
7
The fuel use patterns in urban slum households across the six states show a significant improvement in LPG use over the past decade when compared with the data from
Census 2011 The share of households using polluting fuels (including firewood dung cake agriculture residue and kerosene) as their primary fuel has decreased significantly but we find that stacking is a common practice even among households using LPG as a primary fuel Unless they use clean fuels exclusively such slum households will still be exposed to the health risks associated with HAP
Across the six states the primary fuel used for cooking by slum households
For the analysis in this brief we have categorised the households into three based on their fuel choices and position on the energy ladder those that exclusively use clean cooking fuels (LPG and electricity) stack LPG with polluting fuels and use only polluting fuels The level of exposure to emissions from cooking increases from the first (least harmful) to the third category (most harmful)
2 Cooking fuel adoption and use in urban slum households
In this brief the use of clean cooking fuels is considered synonymous to use of LPG since other clean fuels comprise a negligible share of use
Source Authorsrsquo analysis
Households using clean fuel exclusivelyWhile the majority of these households use LPG two per cent of the households reported using electricity for cooking purposes
Households stacking LPG with polluting fuelsMost of these households reported using LPG as their primary fuel and polluting fuels as their secondary fuel About four per cent of slum households reported using polluting fuels as their primary fuel and LPG as their secondary fuel
Households using only polluting fuelsThese households only use firewood charcoal dung
agricultural residue kerosene or a stack of these fuels
5533
12
Fuel-use categories
Use of LPG as primary fuel
82 (Cooking Energy Access Survey 2020)
47 (Census 2011)
Polluting fuel as primary fuel
16 (Cooking Energy Access Survey 2020)
52 (Census 2011)
Are Indiarsquos Urban Poor Using Clean Cooking Fuels Insights from Slums in Six States8
In the following sections we explore factors such as socio-economic characteristics affordability and availability of fuel intra-household gender dynamics and fuel perceptions which influence the ability and likelihood of a household to use different fuels
21 Households using LPG as their only fuel In this section we focus on understanding the household characteristics and fuel use patterns of those using LPG exclusively for cooking Most urban slum households with an LPG connection report using LPG as their primary fuel While 55 per cent of the slum households (63 per cent of LPG-using households) use LPG exclusively others stack LPG with polluting fuels Uttar Pradesh has the highest
proportion (70 per cent) of slum households who are exclusive users of clean cooking fuels among the six states
Figure 1 Within slums there are considerable state-level variations in householdsrsquo fuel usage patterns across states
Source Authorsrsquo analysis
Note We have refrained from state-level analysis because of the smaller sample size for urban slums in states like Jharkhand and Chhattisgarh
Figure 2 While the majority of LPG-using households use the fuel primarily only half of them use it exclusively
Source Authorsrsquo analysis
0
0
10
10
20
20
30
30
40
40
50
50
60
60
70
70
80
80
90
90
100
100
8682
55
Bihar
LPG users
Chhattisgarh Jharkhand Madhya Pradesh
LPG as the primary fuel LPG as the exclusive fuel
Rajasthan Uttar Pradesh
States
Per
cent
age
of h
ouse
hold
s P
erce
ntag
e of
hou
seho
lds
Exclusive clean fuel users Stacking LPG with polluting fuels Only polluting fuel users
42
3
30
56
45
39
1611
40
4944
46
10 5
24
71
41
28
9Cooking fuel adoption and use in urban slum households
Over a fifth of households using LPG exclusively are PMUY households which suggests that these households have been able to transition to clean cooking fuels in less than four years PMUY households using LPG exclusively are of a relatively higher economic status than households that stack polluting fuels Unlike in rural areas the age of an LPG connection does not have a direct correlation with per capita LPG consumption in urban slum households suggesting that even households with recent LPG connections in urban slums are likely to use LPG exclusively Households in urban areas have been known to experience a direct transition to exclusive use of clean fuels from using traditional fuels (Kuo and Azam 2019) This could be due to the time-saving that comes with the adoption of clean cooking fuels like LPG ndash where urban households are more willing or need to spend more on convenience than rural households
Figure 3 Most households using LPG exclusively acquire six to eight cylinders per year
Source Authorsrsquo analysis
211 The economic status of the household determines exclusive LPG useA simple logistic regression (Annexure II) shows that households with higher asset ownership have significantly higher odds of using LPG as an exclusive fuel Even between primary and exclusive users of LPG asset ownership remains a significant differentiating factor This corroborates the findings of previous studies (Ranjan and Singh 2017) that state that households tend to switch their cooking fuel use patterns after a threshold level of income is achieved However this is not to suggest that all wealthy households shift to exclusive use of clean fuels We discuss the reasons for stacking among these households in the next section
Cooking energy in the household budget We find that households using LPG as their only fuel pay INR 496 per month8 This effectively translates to an average household spending almost eight per cent of their monthly expenses on cooking fuel
Oil and Marketing Companies (OMCs) are attempting to address the challenges around the recurring refilling
cost by encouraging low-income households to use a 5 kilograms (kg) cylinder to overcome the high upfront cost
associated with 145kg cylinders In our sample we find that only about two per cent of urban slum households use
small cylinders (5kg or 3kg)
BOX 2 Uptake of small cylinders
8 This is based on the upfront cost paid by the household for an LPG refill Given that only 40 per cent of the householdsrsquo report receiving LPG subsidy on refills ndash it has not been considered in the fuel expenditure calculation The share of fuel expenditure for the households receiving LPG subsidies would be accordingly less than the others
0
10
20
30
40
50
60
70
1
1 16 8 9
22
60
4350 50
14
34
15
2 3 4 5 6 7 8 9 10 11 12 13
Number of 14 kg LPG cylinder refills obtained by exclusive LPG users
Per
cent
age
of h
ouse
hold
s us
ing
LP
G e
xclu
sive
ly
households using LPG exclusively Median value
Are Indiarsquos Urban Poor Using Clean Cooking Fuels Insights from Slums in Six States
212 Home delivery for exclusive LPG users We find that households who receive doorstep delivery of LPG refills have higher odds of using LPG as their exclusive fuel Hassle-free doorstep delivery of LPG refills is known to influence the use of LPG as a primary secondary or exclusive fuel (PPAC-CRISIL 2016)
Additional expense on procurement of cylinders Almost half of the households who receive doorstep delivery of LPG pay an additional amount of INR 20 as a delivery charge However in households that do not receive doorstep delivery about 46 per cent report that one member must forgo their daily wages to procure the cylinder Most of such households depend on daily labour or private jobs for their income
Given that almost half of the households report having to forgo wages to procure the cylinders it could affect the householdrsquos ability to use LPG continually It may add to the average delay in the purchase of refills
Procurement of LPG cylinders during the COVID-19 pandemic Most households that do not receive doorstep delivery of LPG (58 per cent) use private vehicles (including motorcycles or bicycles) to transport LPG refills About one-third of the households procuring cylinders on their own use rented or shared vehicles The procurement constraints faced by these households would be further aggravated during the COVID-19 pandemic as using rented or shared vehicles comes with its own risks
10
About 18 per cent of the respondents in our survey reported that they resided in non-notified slums Such slums are not legally recognised as a lsquoslumrsquo by the government which makes the residents more vulnerable to eviction In our data we find that adoption and use of LPG is similar across households from notified and non-notified slums Qualitative interviews and field visits showed that most of the respondents were permanent residents of the slums who have been living there for more than 10 years
About 2 per cent of urban slum households use electricity as a source for cooking energy These households do not rely on any other fuels for cooking or non-cooking purposes They use electric stoves to prepare all meals including cooking roti rice and vegetables These households have been using electricity as their cooking fuel only in the past five years Most households report using either a coiled stove or induction stove Less than one per cent of households use other electric appliances such as hot water kettles and toasters for cooking needs
BOX 3
BOX 4
Status of slums impacting the fuel-use pattern
Electricity for cooking
77
households receiving doorstep delivery of LPG cylinders are exclusive users of the fuel
63LPG-using households receive doorstep delivery of cylinders
Male members have to travel to procure the cylinders in 87 households
11Cooking fuel adoption and use in urban slum households
About 4 per cent of urban slum households in the sample reported stacking with kerosene as their secondary fuel Most of these households are in Uttar Pradesh These households also use kerosene more than once a week for cooking
BOX 5 Use of kerosene as a cooking fuel
22 Households stacking LPG with polluting fuels Across the six states almost half of the households (45 per cent) reported using polluting fuels Here we discuss the characteristics and fuel use patterns of households that stack clean and unclean fuels
Though 86 per cent of the households surveyed have an LPG connection we find that over a third (33 per cent) of them stack it with polluting fuels (including firewood dung cakes agriculture residue charcoal and kerosene) The increased stacking could also be a result of more households adopting LPG since households tend to not replace biomass-based fuels completely (Cheng and Urpelainen 2014) These households would need to transition to exclusive use of clean cooking fuels to reduce the health impacts on women and children from household air pollution
About 44 per cent of the households that are stacking fuels rely on informal sources for refills Such households have not ordered any refills in the past one year from their LPG distributors These households mainly rely on recurring cylinders from their neighbours or relatives9
Figure 4 Of the households that stack fuels most use LPG as their primary fuel
Source Authorsrsquo analysis
9 It is important to note that sharing LPG cylinders among neighbours and extended family is a regular phenomenon in small towns and rural areas owing to availability challenges and it is not necessarily driven by an intention to siphon off subsidy amounts against the commodity ( Jain et al 2018)
Exclusive clean fuel users
Stacking with LPG as the primary fuel
Only polluting fuel users
Stacking LPG with polluting fuels
Stacking with LPG as the secondary fuel
55
3388
12
12
Are Indiarsquos Urban Poor Using Clean Cooking Fuels Insights from Slums in Six States12
221 Household factors that determine the decision to stack fuels Even within the stacking households the reason for stacking multiple fuels varies significantly Primarily households who stack can be divided into two categories ndash those that stack as they cannot afford LPG refills and those that stack due to other factors like taste preferences and alternate end-uses of the fuel
Households who are stacking primarily due to affordability concerns ndash Across asset quintiles we find that stacking is most common among the middle categories (second and third quintile) where most have adopted LPG Still the affordability of the fuel remains a significant concern More than 60 per cent of the households that are stacking fuels collect or prepare firewood or dung cakes free of cost rather than purchasing them from the market Those who buy biomass do not spend more than INR 100 per month on it Based on the responses of the primary cook we note that the high cost of LPG and free-of-cost availability of solid fuels are the most common factors that affect the fuel choices made by the household
Figure 5 Stacking is prevalent in households across asset quintile categories
Source Authorsrsquo analysis
1 2 3 4 5
Asset quintile categories
0
20
40
60
80
100
Per
cent
age
of h
ouse
hold
s
Exclusive clean fuel users Stacking LPG with polluting fuels Only polluting fuel users
5348
52
6367
2441 37
3232
2311 11
51
Households who use LPG primarily and polluting fuels as secondary fuels have a median annual refill rate of
6 cylinders
Households who use polluting fuels primarily and LPG as a secondary fuel have a median annual refill rate of
4 cylinders
13
Households that are stacking for reasons beyond affordability ndash More than one-fourth of the households that are stacking have a median annual refill rate of eight cylinders and above despite having a similar household size as others Most such households fall in the highest asset quintiles This suggests that they are not necessarily using unclean fuels due to the unaffordability of LPG but due to other factors such as taste preference for chulhas and fuel end-uses that influence the householdrsquos decision to use solidpolluting fuels Such households reported using LPG for a median period of six years The solid fuels are primarily used for cooking chapatis or vegetables in these households
Interestingly even households with multiple LPG connections and two cylinder connections report stacking with polluting fuels The possession of multiple LPG connections in these households may not necessarily be an indicator of diversion mdash the average family size of these households is more than eight indicating the high possibility of having separate kitchens within the same household Given that such households have a median annual refill rate of ten cylinders another plausible reason for multiple connections is that it prevents them from relying on just one distributor which increases their chances of getting refills whenever needed
222 End-uses of polluting fuels Across both the groups discussed above half of the households who stack with polluting fuels use these fuels at least once a day (Figure 6) Also almost 45 per cent of the households that stack fuels use multiple stoves at the same time while preparing a single meal This indicates that even if the household is using LPG for a particular meal they would be using their chulha simultaneously
Despite using LPG as the primary fuel for their cooking needs households that are stacking fuels use polluting fuels for non-cooking purposes like heating water for bathing (29 per cent) and space heating (10 per cent)
Figure 6 Almost half of the households using polluting fuels use it every day
Source Authorsrsquo analysis
0 5 10 15 20
19
11
21
20
29
25 30 35
Percentage of households
Freq
uenc
y of
use
of p
ollu
ting
fuel
s Several times a day
Once per day
Few times a week
Once a week
Occasionally
21 households stacking fuels
have more than one LPG connections
25 households stacking fuels have two-cylinder connections
Cooking fuel adoption and use in urban slum households
Are Indiarsquos Urban Poor Using Clean Cooking Fuels Insights from Slums in Six States14
223 Seasonal variations in the stacking of fuels We also noted a significant seasonal change in fuel use patterns LPG is most popular in the rainy season (88 per cent) and least popular in the winter months (45 per cent) (Figure 7) The dampness associated with solid fuels in the rainy season could be the reason for using LPG primarily during these months The literature also suggests that solid fuels are a popular choice during winter months (S Singh 2014 Baqir et al 2019) This could be because during winter months the solid fuel requirement for non-cooking tasks within the household likes water heating for bathing and space heating increases Since households are already using solid fuels for non-cooking tasks they may be using these fuels more for cooking during winter Unfortunately the increased use of solid fuels in winter exacerbates the much higher air pollution exposure of these households due to unfavourable atmospheric conditions
Figure 7 Proportion of urban slum households using solid fuels as the primary cooking fuel increases during the winters months aggravating household air pollution exposure due to unfavourable atmospheric conditions
Source Authorsrsquo analysis
About 3 per cent of urban slum households reported owning an electric water-heating device (geyser or immersion
rod) Similarly only 4 per cent of the households own an electric room heater
BOX 6 Electric devices for water heating and space heating
Summer Winter Rainy Festival0
20
40
60
80
100
120
Per
cent
age
of h
ouse
hold
s
LPG Solid fuel
78
45
88
67
22
55
1233
15
Figure 8 Lack of awareness about receiving LPG refill subsidies poses a threat to the success of LPG subsidy schemes
Source Authorsrsquo analysis
Connections under the Pradhan Mantri Ujjwala Yojana (PMUY) 23 per cent of these households reported receiving benefits under the PMUY
The six states included in the survey account for a significant share of PMUY coverage ndash 54 per cent of all connections provided under PMUY (PPAC 2019) However most of these connections cater to rural households One of the reasons for there being fewer PMUY connections in urban areas is that more than half of all urban slum households reported already having had LPG connections for over four years (before the launch of PMUY) Moreover over a quarter of PMUY households10 in urban slums reported having multiple LPG connections which suggests that not every household which was using LPG before the PMUY was prevented from accessing the schemersquos benefits
Government support during the COVID-19 pandemic During the COVID-19 lockdown the government announced the provision of three free-of-cost refills for PMUY households under the PM-Garib Kalyan Yojana While PMUY households in urban slums benefitted from this scheme non-PMUY households in urban slums did not As documented urban slum households faced a significant economic hit due to the loss of jobs and incomes during the pandemic (Patel 2020) Non-PMUY households that stack for economic reasons are more likely to use cheaper and freely available solid fuels without additional support from the government
PAHAL-Direct Benefit Transfer for LPG (DBTL)Overall about 42 per cent of active LPG users11 reported receiving a subsidy for their last LPG refill under the Direct Benefit Transfer for LPG scheme (DBTL) However about 28 per cent of urban slum households reported not knowing if they had received the subsidy amount for their last refill this suggests that the primary cook is often unaware of whether the subsidy is credited to the household Among the ones that reported receiving the LPG subsidy about 40 per cent of the primary cook were not aware of the amount of subsidy being credited into their account
10 This is a relatively smaller sample of 43 households from all the PMUY households in urban slums (131 households)
11 Households that have taken at least one refill in the past year
42
30
28
Received LPG refill subsidy
30 Still repaying PMUY loan
Did not receive LPG refill subsidy
10 Gave up LPG refill subsidy
Do not know
60 LPG refill susbsidy not received due to other reasons
Cooking fuel adoption and use in urban slum households
Are Indiarsquos Urban Poor Using Clean Cooking Fuels Insights from Slums in Six States16
23 Households using only polluting fuels About 12 per cent of urban slum households rely entirely on polluting fuels for all cooking and non-cooking purposes While the share of these households is relatively small the non-adoption of LPG in such households despite
programmes like the PMUY is concerning These households either use a combination of different polluting fuels (firewood dung cakes agricultural residue charcoal and kerosene) or just one of these fuels for all their energy needs Firewood is the most commonly used fuel in these households
231 Reasons for the non-adoption of LPGHouseholds that rely exclusively on polluting fuels reported not having an LPG connection Though three-fourths of these households were aware of PMUY the high upfront cost of an LPG connection along with the high recurring cost of procuring refills remain the two most important reasons for not procuring an LPG connection Repondents also mentioned a lack of information on how to procure a connection as a reason These reasons align with the common causes cited by rural households covered in the survey implying that the challenges faced by rural households and urban slum households in procuring connections are similar
Almost half of the households in this category use solid fuels for non-cooking purposes such as heating water for bathing space heating and preparing fodder for animals On the positive aspects of using polluting fuels households reported the following free-of-cost easy availability of fuels better tasting food and preference of family members for food cooked on the chulha
232 Fuel availability and affordabilityIn contrast with households that stack fuels households that use only solid fuels rely on purchasing fuels rather than collecting or preparing them For instance 60 per cent of firewood users in this category procure fuel by purchasing rather than collecting it
Households with low asset ownership rely on polluting fuels for cooking These households spend 2ndash3 per cent of their median monthly expenditure on fuel (INR 75 per month on fuel) which is much lower than what they would have to spend if they used LPG exclusively (INR 496 per month) Households that collect solid fuels spend about two hours on a single trip (three times a month) travelling a median one-way distance of 2 km This is equivalent to the distance travelled to procure LPG cylinders (if not delivered at home)
Figure 9 More than half of the households currently without LPG do not know how to get a connection or whom to ask about it implying a lack of awareness
Source Authorsrsquo analysis
0 10 20 30 40 50 60 70
39
53
63
68
80
Percentage of households
Rea
sons
for N
on-A
dop
tion
of L
PG Installation is expensive
Monthly expenditure on LPG is high
Do not know how to get or whom to ask
Not availabletoo far
17
12 See Annexure III for details on the districts and their PM25 concentrations The data for 15 districts (from Bihar Uttar Pradesh Madhya Pradesh and Rajasthan) overlapping with the survey sample have been analysed based on the availability of air quality data from continuous monitoring stations
13 Air quality categories based on PM25 concentration (in μgm3)
Good 0 to 30 Satisfactory 31 to 60 Moderately polluted 61 to 90 Poor 91 to 120 Very poor 121 to 250 Severe above 250 (Central Pollution Control Board 2014)
Cooking fuel adoption and use in urban slum households
Winter months have the highest PM25 concentrations coinciding with the sharp increase in use of polluting fuels for heating bath water and room heating
233 Gendered time use in households using solid fuelsIn urban slums both the male and female members of the household are equally involved in collecting firewood Still it is primarily the female members of the household who undertake dung cake preparation In addition to engaging in fuel collection and preparation women tend to spend more time cooking in households using solid fuels About 85 per cent of households that transitioned to LPG in the past four years reported having saved time while cooking compared to when they used solid fuels
SPOTLIGHT I Household air pollution (HAP) in urban slums
Burning solid fuels in three-stone fires and mud stoves with inadequate ventilation causes high levels of smoke exposure and negative health impacts particularly for women and young children (WHO 2014)
The double burden of ambient and household air pollution on the urban slum populationUsing the PM25 data from continuous ambient air quality monitoring stations (CAAQMS) for 15 districts12 in our sample we found that the ambient air quality remained in the lsquopoorrsquo or worse category13 for most districts throughout the year variation in the ambient air quality
Are Indiarsquos Urban Poor Using Clean Cooking Fuels Insights from Slums in Six States
Impact of ventilation
Indoor cooking and low adoption of chimney indicates high exposure to pollution from the use of unclean fuels for cooking The proportion of households with a chimney is high (52 per cent) among those who rely only on polluting fuels Smith and Pillarisetti (2017) explain that while having a good chimney lowers peak levels of indoor pollution long-term average exposure is reduced only by a factor of two Besides chimneys require regular maintenance to function correctly While more than 45 per cent of the households are using polluting fuels less than 20 per cent of the slum housheolds use improved cookstoves
Households also use solid fuels for non-cooking uses like space heating On average each house in a slum has two rooms this effectively exposes all members of the household to emissions from burning fuels Emissions from household sources contribute significantly to the surrounding air quality (Harish et al 2019) this concern is exacerbated in congested slum areas
the winter months (November to February) have the highest concentration of PM25 This leads to a double burden of exposure for slum households stacking solid fuels as they are more likely to increase use of solid fuels in winters (Figure 7) Alternatively the use of LPG as the primary source of fuel increases during the rainy season (June to September) these months record the least ambient air pollution
We also find that districts like Meerut Ghaziabad Patna Gautam Buddha Nagar (Noida and Greater Noida) and Muzaffarpur have the highest frequency of lsquovery poorrsquo air quality days throughout the year Across these districts one-third of households use polluting fuels for cooking In urban slums where households are more densely packed the emissions from burning solid fuels increase the risk of exposure inside households and deteriorate the ambient air quality for the community at large As a result these communities suffer from both increased household and ambient air pollution HAP has an estimated average contribution of 30ndash50 per cent to ambient air quality across Indiarsquos urban and rural areas (Balakrishnan et al 2019) Addressing biomass burning for cooking water heating and space heating during the winters has the potential to help reach the national ambient air quality standards (Chowdhury et al 2019) Despite that only 2 per cent of the action points in 44 city clean air plans mention cooking and heating as a sector to address air pollution (Ganguly Selvaraj and Guttikunda 2020)
18
75 householdsrsquo
using polluting fuels cook inside
the main house
67 householdsrsquo using polluting fuels do not have a chimney for ventilation
Awareness about the health impacts of using polluting fuelsAbout 60 per cent of households using only polluting fuels and 84 per cent of households that stack LPG with a polluting fuel report lsquotoo smokyrsquo as the most prominent negative aspect of using polluting fuels This suggests that as more households switch to clean cooking fuels perceptions regarding pollution fuels change
Three-fourths of primary cooks who use polluting fuels for cooking agree that smoke from solid fuels is harmful to them this implies that awareness of the adverse health impacts of polluting fuels does not necessarily lead to the uptake of clean fuels Primary cooks also agree that smoke from solid fuels causes coughing (49 per cent) and lung infections in children (39 per cent)
Exposure to air pollution is a known risk factor for underlying chronic diseases that predict the severity of
COVID-19 disease and patient outcomes (World Bank 2020) This linkage suggests a heightened risk for women
in all age groups who cook using traditional technologies and fuels (World Bank 2020) The highest number of
COVID-19 cases were recorded in the most polluted regions among patients with pre-existing health conditions
(Frontera et al 2020)
Results from a controlled study show a higher prevalence of chronic obstructive pulmonary disease (COPD)
among biomass fuel users than clean fuel users ( Johnson et al 2011) The available clinical data to date suggest
that cardiovascular disease diabetes chronic respiratory illness and hypertension ndash conditions all strongly
associated with exposure to HAP ndash are also risk factors for COVID-19 (World Bank 2020)
BOX 7 Impact of household air pollution on COVID-19
19Cooking fuel adoption and use in urban slum households
Are Indiarsquos Urban Poor Using Clean Cooking Fuels Insights from Slums in Six States
Traditionally women bear a disproportionate burden in collecting and preparing biomass for cooking While this burden reduces with the use of clean cooking fuels like LPG the fuel supply within the household is then determined by formal and monetised distribution networks involving an outlay of money (Patnaik and Jha 2020) Our data shows that womenrsquos status in the household (as heads of households)14 positively correlates with households using LPG as their primary fuel The existing literature also supports the idea that female-headed households prefer modern fuels to polluting ones (Farsi Filippini and Pachauri 2007 Rao and Reddy 2007 Kuo and Azam 2019) Other research also suggests that female-headed households are more willing to spend on LPG as a recurring expense (Kojima Bacon and Zhou 2011 Kuo and Azam 2019)
SPOTLIGHT II Womenrsquos participation in intra-household decision-making regarding LPG use
20
14 In almost half of the households surveyed the primary cook reported a female member being the head of the household The reason behind such high percentage of female-headed households could be because only the primary cook of every household (who is mostly female) was surveyed This does not mean that these households do not have any adult male members Traditionally headship refers to the head of household as the individual whose lsquoauthorityrsquo the household members recognise But this definition overlooks potential intra-household variations in the recognised authority in different realms of decision-making (Kilic Moylan and Koolwal 2020) Since cooking is a gendered activity the primary cookrsquos response to the head of household question may have been with respect to the recognised authority figure for that activity within the household
30 householdsrsquo female members place the order for LPG refills
50householdsrsquo female
members decide whether or when to purchase LPG refills
We also find that the decision of whether or when to purchase LPG refills is made by male members in half of urban slum households This holds for both male- and female-headed households In LPG-using households where the primary cook is involved in an income-generating activity more women are deciding to order the refills This pattern is similar irrespective of whether the household uses LPG exclusively or stacks it with other polluting fuels or are PMUY beneficiaries
SPOTLIGHT III A comparison of access to clean cooking energy between urban slum and non-slum households across six states
21
At the state level Bihar has significantly poor involvement of women in intra-household decision-making regarding
ordering refills with less than 10 per cent of households reporting that women decide whether or when to order
refills However more women than men are involved in decisions around LPG refills in Rajasthan Madhya Pradesh
and Jharkhand
Across caste groups the involvement of women is lowest (37 per cent) among the Scheduled Castes (SCs)
However more women in General and OBC households decide when to order LPG refills
BOX 8 Variations in intra-household decision-making across states and caste groups
Cooking fuel adoption and use in urban slum households
To compare the fuel use patterns of urban slum and non-slum households we used data from the India Residential Energy Survey (IRES 2020)15 The overlap in the sampling strategies of both IRES and our survey enabled a comparison of the findings There is a significant difference in the socio-economic status of slum and non-slum households which tends to affect their fuel use patterns Table 4 provides a comparison of cooking fuel usage in urban non-slum households (from IRES 2020) and urban slum households (Cooking Energy Access and Use survey 2020)
Are Indiarsquos Urban Poor Using Clean Cooking Fuels Insights from Slums in Six States22
Table 4 The poor economic condition of households in urban slums impacts the exclusive use of clean fuels for cooking
Source Authorsrsquo analysis
Fuel use categories Urban slum households (Cooking Energy Access Survey) ()
Non-slum urban households (IRES) ()
95 88
84 55
9 33
5 12
Clean fuel users (LPG PNG and electricity)
LPG as an exclusive fuel
Households that stack LPG with polluting fuels
Households that use only polluting fuels
We observed a significant gap in the exclusive use of LPG as a cooking fuel between urban slums and non-slum households explained mainly by the difference in their economic conditions Stacking is three times more common in slum households than non-slum households About 45 per cent of non-slum households using polluting fuels belong to marginalised social groups (SCs and STs) Households using polluting fuels have a lower median monthly expenditure than others and about 62 per cent of such households are semi-pucca or kuchha structures Among LPG users non-slum households have a slightly higher rate of doorstep delivery as compared to slum households
LPG-using households receiving home deliveries
Source Authorsrsquo analysis
239
6372
Urban slum households (Cooking Energy Access and Use)
()
Non-slum urban households (IRES)
()
Proportion of PMUY beneficiaries among LPG-using households
15 IRES 2020 was conducted in 21 large states of India including Bihar Jharkhand Rajasthan Madhya Pradesh Uttar Pradesh and Chhattisgarh While IRES 2020 focused on urban households the Cooking Energy Access and Use survey specifically attended to urban slums in the same districts Refer to the technical note for a detailed methodology of the survey
23
3 Way forward
Slums across the world are chronically ignored in public policy and suffer because of unauthorised and unsafe habitation without access to government services (Shahadat
Lipu and Bhuiyan 2014) In terms of energy access while we see a progressive change in householdsrsquo energy use patterns as we move from rural to urban issues like affordability availability preference and familiarity with the fuel and stove remain essential factors that determine householdsrsquo fuel choice
Image iStock
Are Indiarsquos Urban Poor Using Clean Cooking Fuels Insights from Slums in Six States24
Understanding categories of users is important for enabling access to and use of clean cooking fuels
We categorised the urban slum population based on their fuel usage patterns ndash using only clean fuels stacking clean fuels with polluting fuels and using only polluting fuels While most households in urban slums have an LPG connection only half of them use LPG exclusively The householdrsquos economic status and its access to doorstep delivery of LPG refills are two crucial factors that determine its ability to use LPG exclusively Despite being situated in urban areas 37 per cent of slum households do not receive home delivery of cylinders ndash availability is an essential factor in determining the householdrsquos likelihood of using LPG exclusively There is a strong impetus for the OMCs and distributors to improve their home delivery services of LPG refills in slum areas
Stacking is prevalent in about one-third of households ndash there is a need for a deeper understanding of householdsrsquo preferences fuel end-uses and awareness Most households reported using polluting fuels daily or at least weekly this effectively increases their exposure to household air pollution despite having access to clean cooking fuels Among households that stack LPG with polluting fuels the reasons for stacking differ ndash affordability seasonality and taste preference More than a quarter of households that stack have a similar level of LPG consumption as those that use LPG exclusively despite similar family sizes Such households use polluting fuels not because of their inability to afford LPG But other factors like free-of-cost availability of biomass taste preference for chulha and alternate end-uses of fuelmdashfor instance in space heatingmdashinfluence the householdrsquos decision to use solid fuels Among households that stack multiple fuels the use of polluting fuels increases during winter months this exposes the households to a double burden of high ambient and household air pollution in these months About 40 per cent of these households also use polluting fuels for non-cooking purposes like heating water for bathing and space heating especially in winter
Even with large-scale government initiatives like PMUY we find that more than 10 per cent of urban slum households do not use LPG They mainly rely on free-of-cost biomass for their cooking and non-cooking needs Despite awareness of PMUY among these households the high upfront cost of procuring an LPG connection and high recurring expenditure on refills deter them from using LPG Evidently there is a need to expand the reach of PMUY to cover households across slums
Integrating the issue of lack of access to clean cooking energy within the discussion on urban poverty
This study reiterates the need to look at poverty in urban areas in the context of energy access Given the heterogeneity of poverty in urban and semi-urban India it is essential to understand energy poverty in the context of access to resources for an enhanced quality of life for the urban poor Similarly slums dwellers in large and small cities alike may experience additional challenges of access Furthermore not all urban poor live in slums we know even less about the access issues of temporary residents or seasonal migrants in urban India Therefore in a rapidly urbanising India studies on the urban poor and air quality need to integrate a focus on energy access to address the vulnerability of women children and communities to HAP and the drudgery of using polluting fuels for cooking and other household energy needs
Access to clean cooking energy schemes must be integrated into the social assistance programmes focused on urban poverty alleviation to enhance its reach
25Way forward
Converging energy access in social protection policies for the urban poor
Accounting for the vulnerabilities of the urban poor is crucial in designing and implementing policies including social protection schemes As a health and economic imperative access to clean cooking energy schemes must be integrated into the social assistance programmes of other ministries (eg health education and nutrition assistance) to offer better support to slum households This would also reduce the burden on households of claiming and accessing multiple benefits across schemes thus freeing them to invest more time in productive activities (CEEW 2020) Government programmes such as the National Urban Livelihoods Mission and social service allocations for housing should use existing targeting approaches to include access to clean cooking energy within the ambit of services for the poor
Bringing a renewed emphasis on clean cooking energy access due to COVID-19 is essential
Most households in urban slums rely on daily wage labour or the gig economy for their household income During the COVID-19 pandemic these occupations have been among the worst impacted by the lockdown and the economic slowdown A survey conducted with over 2000 daily wage workers in urban slums during the lockdown suggests that only 7 per cent of respondents from this group received pay during the lockdown (Basu 2020) causing a massive shock to their livelihoods and wage earnings This kind of impact pushes households into energy poverty leading to the increased use of free-of-cost biomass and consequently increasing the risk of exposure to emissions from fuel burning While the government has committed to supplying up to three free refills to all PMUY households under PM-Garib Kalyan Yojana less than a quarter of households in urban slums have Ujjwala connections The low share of PMUY households effectively makes the majority of slum households ineligible for relief support given under the PM-Garib Kalyan Yojana during the lockdown There is a need to target vulnerable households ndash beyond PMUY beneficiaries ndash with differential subsidy support for using LPG in a sustained manner
Increased poverty would mean increased use of polluting fuels ndash there is a need for a renewed emphasis on clean cooking energy access during the COVID-19 pandemic as increased use of polluting fuels has health implications (lower respiratory infections and COPD) that increase the risk of COVID-19 infections being more severe
There is a need to target vulnerable households ndash beyond PMUY beneficiaries ndash with differential subsidy support for using LPG in a sustained manner
Are Indiarsquos Urban Poor Using Clean Cooking Fuels Insights from Slums in Six States
Balakrishnan Kalpana Sagnik Dey Tarun Gupta R S Dhaliwal Michael Brauer Aaron J Cohen Jeffrey D Stanaway et al 2019 ldquoThe Impact of Air Pollution on Deaths Disease Burden and Life Expectancy Across the States of India The Global Burden of Disease Study 2017rdquo The Lancet Planetary Health 3 (1) e26ndash39 httpsdoiorg101016S2542-5196(18)30261-4
Baqir M S K Bharti R Kothari and R P Singh 2019 ldquoAssessment of an Energy-efficient Metal Chulha for Solid Biomass Fuel and Evaluation of its Performancerdquo International Journal of Environmental Science and Technology 16 (11) 6773ndash6784 httpsdoiorg101007s13762-018-2028-9
Basu Anika Badyal 2020 ldquoLockdown Survey How The Covid-19 Crisis Has Affected Daily Wage WorkersmdashAIFrdquo American India Foundation June 28 httpsaiforglockdown-survey-how-the-covid-19-crisis-has-affected-daily-wage-workers
Butera F M P Caputo R Adhikari and A Facchini 2016 ldquoThe Challenge of Energy in Informal Settlements A Review of the Literature for Latin America and Africardquo Procedia Engineering 1ndash32 httpswwwenelfoundationorgcontentdamenel-foundtopic-downloadThe challenge of Energy in Informal settlementspdf
CEEW 2020 ldquoEnergy Safety Nets India Case Studyrdquo Vienna Sustainable Energy for All httpswwwceewinpublicationsenergy-safety-nets-india-case-study
Central Pollution Control Board 2014 ldquoNational Air Quality Indexrdquo New Delhi Central Pollution Control Board httpsappcpcbccrcomccr_docsFINAL-REPORT_AQI_pdf
Chafe Z S Mehta and K R Smith 2011 ldquoAmbient Fine Particulate (PM25) Air Pollution Attributable to Household Cooking Fuel in Asiardquo AGUFM A54Bndash03 httpsuiadsabsharvardeduabs2011AGUFMA54B03Cabstract
Chandramouli C 2010 ldquoCensus of India 2011 ndash Circular No 8rdquo New Delhi Ministry of Home Affairs httpscensusindiagovin2011-CircularsCircularsCircular-08pdf
Chandrasekhar S and Arup Mitra 2018 ldquoMigration Caste and Livelihood Evidence from Indian City-slumsrdquo Urban Research amp Practice 12 (2) 156ndash172 httpsdoiorg1010801753506920181426781
Cheng Chao Yo and Johannes Urpelainen 2014 ldquoFuel Stacking in India Changes in the Cooking and Lighting Mix 1987ndash2010rdquo Energy 76 (November) 306ndash317 httpsdoiorg101016jenergy201408023
Chowdhary Sourangsu Sagnik Dey Sarath Guttikunda Ajay Pillarisetti Kirk R Smith and Larry Di Girolamo 2019 ldquoIndian annual ambient air quality standard is achievable by completely mitigating emissions from household sourcesrdquo Proceedings of the National Academy of Sciences 116 (22) 10711-10716 httpsdoiorg101073pnas1900888116
Dhingra Chhavi Shikha Gandhi Akanksha Chaurey and P K Agarwal 2008 ldquoAccess to Clean Energy Services for the Urban and Peri-Urban Poor A Case-study of Delhi Indiardquo Energy for Sustainable Development 12 (4) 49ndash55 httpsdoiorg101016S0973-0826(09)60007-7
Farsi Mehdi Massimo Filippini and Shonali Pachauri 2007 ldquoFuel Choices in Urban Indian Householdsrdquo Environment and Development Economics 12 (6) 757ndash774 httpsdoiorg101017S1355770X07003932
References
26
Frontera Antonio Lorenzo Cianfanelli Konstantinos Vlachos Giovanni Landoni and George Cremona 2020 ldquoSevere Air Pollution Links to Higher Mortality in COVID-19 Patients The lsquoDouble-Hitrsquo Hypothesisrdquo Journal of Infection 81 (2) 255ndash259 httpsdoiorg101016jjinf202005031
Ganguly Tanushree Kurinj L Selvaraj Sarath K Guttikunda 2020 ldquoNational Clean Air Programme (NCAP) for Indian cities Review and outlook of clean air action plansrdquo Atmospheric Environment X Vol 8 httpsdoiorg101016jaeaoa2020100096
GNESD 2008 ldquoClean Energy for the Urban Poor An Urgent Issuerdquo Accessed 25 July 2020 httpswwwgooglecomurlsa=tamprct=jampq=ampesrc=sampsource=webampcd=ampved=2ahUKEwi1hf2ru dntAhUCOisKHQH7BtsQFjAAegQIAxACampurl=http3A2F2Fwwwgnesdorg2F-2Fmedia2FSites2FGNESD2FPublication- pdfs2FSPM_CleanEnergyashx3Fla3Dda26hash3DE4971C585B6798F17954F8B42E073 D9507F42A84ampusg=AOvVaw08kCDgOkTkYc6wRDxzsNyq
Guan Wei-Jie Wen-Hua Liang Yi Zhao Heng-Rui Liang Zi-Sheng Chen Yi-Min Li Xiao-Qing Liu et al 2020 ldquoComorbidity and its Impact on 1590 Patients with COVID-19 in China A Nationwide Analysisrdquo European Respiratory Journal 55 (5) 2000547 httpsdoiorg1011831399300300547-2020
Harish Santosh Kirk R Smith Sourangsu Chowdhury Zoe A Chafe Ajay Pillarisetti Jos Lelieveld Sarath Guttikunda Sagnik Dey and Andrew P Grieshop 2019 ldquoThe Contribution of Household Fuels to Ambient Air Pollution in India A Comparison of Recent Estimates Edited by CcapcOrgInrdquo Collaborative Clean Air Policy Centre May 30 httpsccapcorginpolicy-briefs2019530the-contribution-of-household-fuels-to-ambient-air-pollution-in-india-a-comparison-of-recent-estimates
Jain Abhishek Saurabh Tripathi Sunil Mani Sasmita Patnaik Tauseef Shahidi and Karthik Ganesan 2018 ldquoAccess to Clean Cooking Energy and Electricity Survey of States 2018rdquo New Delhi CEEW httpswwwceewinsitesdefaultfilesCEEW-Access-to-Clean-Cooking-Energy-and-Electricity-11Jan19_0pdf
Johnson Priscilla Kalpana Balakrishnan Padmavathi Ramaswamy Santu Ghosh Muthukumar Sadhasivam Omprakash Abirami Bernard W C Sathiasekaran Kirk R Smith Vijayalakshmi Thanasekaraan and Arcot S Subhashini 2011 ldquoPrevalence of Chronic Obstructive Pulmonary Disease in Rural Women of Tamilnadu Implications for Refining Disease Burden Assessments Attributable to Household Biomass Combustionrdquo Global Health Action 4 (1) 7226 httpsdoiorg103402ghav4i07226
Kilic Talip Heather Moylan and Gayatri Koolwal 2020 ldquoGetting the (Gender-disaggregated) Lay of the Land Impact of Survey Respondent Selection on Measuring Land Ownership and Rightsrdquo Washington DC The World Bank httpsdoiorg1015961813-9450-9151
Kojima Masami Robert Bacon and Xin Zhou 2011 ldquoWho Uses Bottled Gas Evidence from Households in Developing Countriesrdquo The World Bank Sustainable Energy Department Oil Gas and Mining Unit httpelibraryworldbankorgdoibook1015961813-9450-5731
Kuo Ying-Min and Mehtabul Azam 2019 ldquoHousehold Cooking Fuel Choice in India 2004ndash2012 A Panel Multinomial Analysisrdquo IZA Discussion Paper No 12682 httpsssrncomabstract=3468630
Lippi Giuseppe and Brandon Michael Henry 2020 ldquoChronic Obstructive Pulmonary Disease Is Associated with Severe Coronavirus Disease 2019 (COVID-19) COPD and COVID-19rdquo Respiratory Medicine 167 105941 httpsdoiorg101016jrmed2020105941
Ministry of Housing and Urban Affairs 2019 ldquoHandbook of Urban Statisticsrdquo New Delhi Government of India httpmohuagovinpdf5c80e2225a124Handbook of Urban Statistics 2019pdf
Rao M Narasimha and B Sudhakara Reddy 2007 ldquoVariations in Energy Use by Indian Households An Analysis of Micro Level Datardquo Energy 32 (2) 143ndash153 httpsdoiorg101016jenergy200603012
27References
Are Indiarsquos Urban Poor Using Clean Cooking Fuels Insights from Slums in Six States28
National Buildings Organisation 2013 ldquoState of Slums in India a Statistical Compendium 2013rdquo New Delhi Government of India httpnbonicinpdfSlums_in_India_Compendium_English_Versionpdf
National Sample Survey Office 2012 ldquoKey Indicators of Urban Slums in India ndash 69th Roundrdquo New Delhi National Data Bank for Socio-religious Categories httpmospinicinsitesdefaultfilesnational_data_bankndb-rpts-69htm
Nolan Laura B 2015 ldquoSlum Definitions in Urban India Implications for the Measurement of Health Inequalitiesrdquo Population and Development Review 41 (1) 59ndash84 httpsideasrepecorgablapopdevv41y2015i1p59-84html
Nolan Laura B David E Bloom and Ramnath Subbaraman 2018 ldquoLegal Status and Deprivation in Urban Slums Over Two Decadesrdquo HHS Public Access 53 (15) 47ndash55
Patel Amit 2020 ldquoPreventing COVID-19 Amid Public Health and Urban Planning Failures in Slums of Indian Citiesrdquo World Medical amp Health Policy 12 (3) httpsdoiorg101002wmh3351
Patnaik Sasmita and Shaily Jha 2020 ldquoCaste Class and Gender in Determining Access to Energy A Critical Review of LPG Adoption in Indiardquo Energy Research amp Social Science 67 (September) 101530 httpsdoiorg101016jerss2020101530
PPAC-CRISIL 2016 ldquoAssessment Report Primary Survey on Household Cooking Fuel Usage and Willingness to Convert to LPGrdquo New Delhi Petroleum Planning amp Analysis Cell Ministry of Petroleum and Natural Gas Government of India httpswwwppacgovinWriteReadDataReports201710310449342512219PrimarySurveyReportPPACpdf
PPAC 2019 ldquoOil Industry Information at a Glancerdquo New Delhi Ministry of Petroleum and Natural Gas Government of India httpswwwppacgovinWriteReadDataReports201912060336500305462ReadyReckonerNov2019WebVersionpdf
Rahaman Mehebub and Dipendra Nath Das 2017 ldquoNature of Slum Growth in Indian Citiesrdquo Urban India 37 (II) 100ndash116 httpswwwresearchgatenetpublication334051882_Nature_of_Slum_Growth_in_Indian_Citiesread
Rains Emily Anirudh Krishna and Erik Wibbels 2018 ldquoUrbanisation and Indiarsquos Slum Continuum Evidence on the Range of Policy Needs and Scope of Mobilityrdquo London International Growth Centre httpswwwtheigcorgwp-contentuploads201802Rains-et-al_Working-paper_coverpdf
Ranjan Rahul and Sudershan Singh 2017 ldquoEnergy Deprivation of Indian Households Evidence from NSSO Datardquo New Delhi Munich Personal RePEc Archive httpsmpraubuni-muenchende835661MPRA_paper_83566pdf
Roy Debraj Bharath Palavalli Niveditha Menon Robin King Karin Pfeffer Michael Lees and Peter M A Sloot 2018 ldquoSurvey-based Socio-economic Data from Slums in Bangalore Indiardquo Nature Publishing Group 5 1ndash9 httpsdoiorg101038sdata2017200
Saksena Sumeet P B Singh Raj Kumar Prasad Rakesh Prasad Preeti Malhotra Veena Joshi and R S Patil 2003 ldquoExposure of Infants to Outdoor and Indoor Air Pollution in Low-income Urban Areas A Case Study of Delhirdquo Journal of Exposure Science amp Environmental Epidemiology 13 219ndash30 httpsdoiorg101038sjjea7500273
Lipu Molla Shahadat Hossain and Arif Waliullah Bhuiyan 2014 ldquoElectricity Access in Urban Slum Households of Bangladesh A Case of Dhakardquo Journal of Renewable and Sustainable Energy 6 (053112) 1ndash15 httpsdoiorg10106314896697
29
Singh Rozita Xiao Wang Emmanuel Ackom and Juan Reyes 2015 ldquoEnergy Access Realities in Urban Poor Communities of Developing Countries Assessments and Recommendationsrdquo Global Network on Energy for Sustainable Development (GNESD) httpswwwgooglecomurlsa=tamprct=jampq=ampesrc=sampsource=webampcd=ampved=2ahUKEwj5nbqI wdntAhXUTX0KHZE6DboQFjAAegQIAhACampurl=https3A2F2Forbitdtudk2Ffiles2F10635 24942FEnergy_access_realities_v_final_updatedpdfampusg=AOvVaw0xNBAAo0bjLueY9FmoigKF
Singh Santosh 2014 ldquoThe Kaleidoscope of Cooking Understanding Cooking Behaviour and Stove Preferences in Rural Indiardquo New Delhi Deutsche Gesellschaft fuumlr Internationale Zusammenarbeit (GIZ) GmbH httpswwwgizdeendownloadsgiz2014-en-kaleidoscope-of-cooking-indiapdf
Smith Kirk R and Ajay Pillarisetti 2017 ldquoHousehold Air Pollution from Solid Cookfuels and its Effects on Healthrdquo Disease Control Priorities 7 (3) 133ndash52 httpsdoiorg101596978-1-4648-0522-6_ch7
UN-Habitat 2003 ldquoThe Challenge of Slums ndash Global Report on Human Settlements 2003rdquo Location of publishing London UN-Habitat httpsunhabitatorgthe-challenge-of-slums-global-report-on-human-settlements-2003
Wang Bolin Ruobao Li Zhong Lu and Yan Huang 2020 ldquoDoes Comorbidity Increase the Risk of Patients with COVID-19 Evidence from Meta-analysisrdquo Aging 12 (7) 6049ndash6057 httpsdoiorg1018632AGING103000
WHO 2014 ldquoWHO Guidelines for Indoor Air Quality Household Fuel Combustionrdquo WHO Accessed 25 July 2020 httpwwwwhointairpollutionguidelineshousehold-fuel-combustionen
World Bank 2020 ldquoThe State of Modern Energy Cooking Servicesrdquo Washington DC World Bank httpdocuments1worldbankorgcurateden937141600195758792pdfThe-State-of-Access-to-Modern-Energy-Cooking-Servicespdf
Yenneti Komali Yehua Dennis Wei and Wen Chen 2017 ldquoThe Urbanization of Poverty in India Spatio-temporal Disparities in Consumption Expendituresrdquo Geographical Review 107 (2) 360ndash383 httpsdoiorg101111j1931-0846201612167x
References
Are Indiarsquos Urban Poor Using Clean Cooking Fuels Insights from Slums in Six States
Annexure 1 Asset ownership index We used Filmer and Pritchettrsquos (2001) proposed approach to construct an asset ownership index using principal component analysis (PCA) We chose the indicators based on data from the Cooking Energy Access survey 2020 The variables we considered for the index were based on classifications by Caroline Moser and Andrew Felton (2007) and K Harttgen (2013) We computed the asset index using housing characteristics and consumer durables as follows
Variables not included in the asset index
Four types of variables were eliminated
1 Variables (such as grid electricity) that had high usage of greater than 95 per cent
2 Those (such as ownership of laptops or computers air conditioners etc) that had a low usage of less than 5 per cent
3 Variables (like house ownership) that have economically fluctuating values
4 Those that indicated a low correlation of less than 20 per cent variation between the top category (ie first) of the asset quintile and the bottom-most category (ie fifth) of the asset quintile
For ease of interpretation we rescaled this index such that the final index values range between 0 and 10 For this purpose we used a feature scaling (or minndashmax scaling) formula
Xnorm (or (IVx)) = (X ndash Xmin)(Xmax ndash Xmin)
where IVx is the normalised index value Xmin is the initial minimum value (-354) and Xmax is the initial maximum value (461) of the asset ownership index
30
Annexures
bull Crowding16 inside the house bull Toilet ownership and usage bull Source of water bull Number of pucca rooms
bull Ownership of two-wheeler bull Ownership of washing machine bull Ownership of television bull Ownership of refrigerator bull Ownership of cooker
16 A household with more than three members occupying a single room is considered crowded (World Health Organization 2018)
Housing characteristics
Consumer durables
Annexure 2 Explaining the use of LPG as the exclusive fuel (simple logistic regression model)
31Annexures
Dependent variable exclusive LPG use
Education of the primary cook (categorical base category is education beyond the school level)
Education of the household head (categorical base category is education beyond the school level)
State (categorical base category includes households from Rajasthan)
P gt z 95 confidence interval
Odds ratio (SE)
1299 (0112)
0659 (0202)
1399 (0394)
0970 (0038)
0994 (0011)
1003 (0013)
2042 (0508)
1011 (0046)
0782 (0441)
1198 (0608)
1377 (0664)
1345 (0566)
3141 (1103)
1213 (0500)
0309 (0211)
1165 (0565)
1703 (0680)
0002
0174
0233
0446
0583
0839
0004
0812
0663
0722
0507
0482
0001
0639
0086
0753
0182
1097
0361
0806
0898
0973
0977
1254
0924
0259
0443
0535
0589
1578
0541
0081
0450
0779
1540
1203
2428
1048
1016
1029
3327
1106
2361
3240
3545
3070
6251
2720
1181
3014
3723
Asset index
Primary cook involved in income-generating activity
Female-headed households
Household size
Age of household head
Age of primary cook
Doorstep delivery of LPG cylinders
PMUY customer
Primary cook is not educated
Primary cook has a school education
Household head is not educated
Household head has a school education
Uttar Pradesh
Bihar
Chhattisgarh
Jharkhand
Madhya Pradesh
Number of households (n) = 417
Log likelihood = -228777
Prob gt chi2 = 0000
Pseudo R2 = 0126
The dependent variable is a dummy variable where households using LPG exclusively are assigned a value of 1 and all other households are assigned the value of 0
The caste of the household has not been factored into the regression as a separate variable because of its underlying influence on economic status
Source Authorsrsquo analysis
Are Indiarsquos Urban Poor Using Clean Cooking Fuels Insights from Slums in Six States
Annexure 3 Air quality (PM25 concentration in μgm3) across 15 districts based on CAAQMS data
32
Dis
tric
tsM
ar-1
9A
pr-1
9M
ay-1
9Ju
n-19
Jul-1
9A
ug-1
9Se
p-19
Oct
-19
Nov
-19
Dec
-19
Jan-
20Fe
b-20
Mar
-20
794
5
988
5
866
7
-
645
329
2
453
7
388
1
769
1
886
4
661
5
950
9
834
4
-
823
4
611
7
569
9
535
7
-
270
4
589
4
571
5
293
1
705
4
839
2
614
9
970
1
826
8
-
844
9
622
1
597
1
564
0
-
235
3
414
3
619
1
414
3
653
9
834
7
568
8
104
90
739
8
-
894
9
630
9
342
2
450
4
-
476
465
2
474
6
429
2
592
3
566
1
-
674
6
531
4
501
5
568
7
450
8
-
320
3
-
846
506
3
349
5
332
4
369
1
387
2
-
430
4
393
6
353
7
446
2
406
8
335
2
339
1
-
102
9
497
2
261
8
269
1
431
4
294
1
-
351
6
277
3
-
336
5
315
5
248
3
392
8
149
7
144
9
462
3
270
5
331
3
273
4
276
0
106
6
391
7
326
2
-
368
6
625
3
875
2
101
64
521
2
183
1
380
4
556
2
544
1
558
2
102
24
104
33
156
44
128
73
146
62
137
71
109
14
183
70
201
80
896
7
190
1
457
7
581
2
583
5
815
4
135
00
126
41
239
94
208
15
158
51
221
86
121
35
192
46
218
43
848
0
205
2
448
5
509
4
582
0
704
5
177
01
613
1
244
01
215
80
136
87
230
54
964
2
201
52
122
30
725
5
120
6
435
4
454
7
481
2
111
37
147
45
537
3
175
53
162
86
111
21
170
08
583
8
132
10
866
2
513
1
112
5
511
3
507
5
511
8
879
4
120
22
502
1
135
53
116
39
994
7
120
45
410
5
792
1
674
8
326
3
177
6
385
0
408
5
335
9
497
2
594
2
429
9
673
2
547
5
540
8
559
4
Gay
a
Muz
affa
rpur
Pat
na
Bho
pal
Satn
a
Alw
ar
Ajm
er
Ud
aip
ur
Ag
ra
Bul
and
shah
r
Hap
ur
Gha
ziab
ad
Gre
ater
Noi
da
Mee
rut
Noi
da
Sour
ce C
onti
nuou
s am
bien
t air
qua
lity
mon
itor
ing
stat
ion
(Mar
ch 2
019
ndash M
arch
202
0)
In a rapidly urbanising India it would be imperative for policymakers and practitioners in energy and urban development sector to integrate access to clean cooking energy within the ambit of services for the urban poor
Image CEEW
Are Indiarsquos Urban Poor Using Clean Cooking Fuels Insights from Slums in Six States
COUNCIL ON ENERGY ENVIRONMENT AND WATER (CEEW)
Sanskrit Bhawan A-10 Aruna Asaf Ali Marg Qutab Institutional AreaNew Delhi - 110 067 IndiaT +91 11 4073 3300
infoceewin | ceewin | CEEWIndia
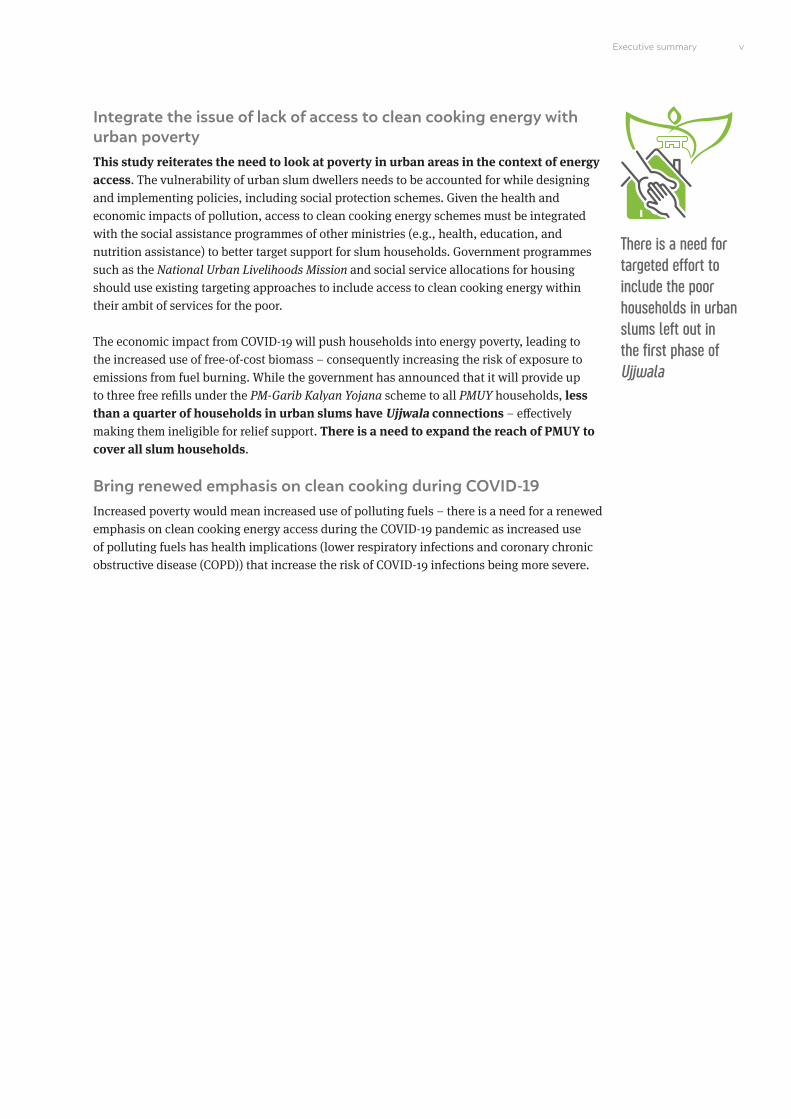
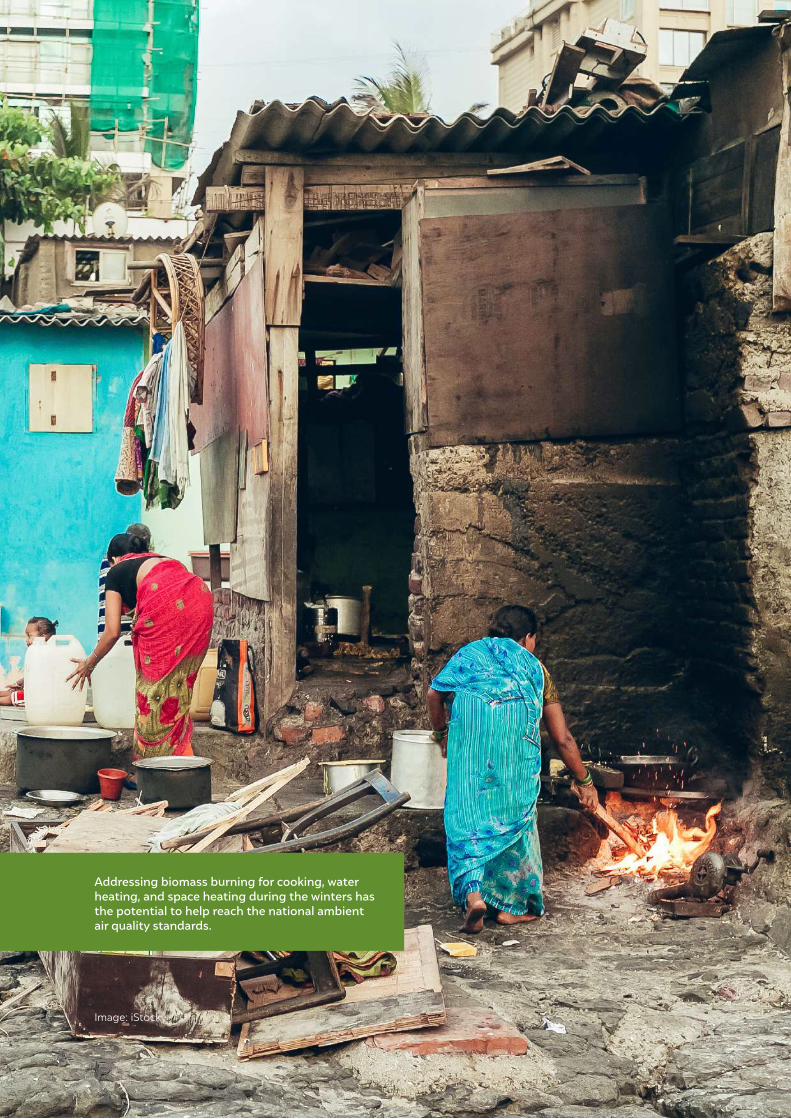
Are Indiarsquos Urban Poor Using Clean Cooking Fuels Insights from Slums in Six States
Image iStock
Addressing biomass burning for cooking water heating and space heating during the winters has the potential to help reach the national ambient air quality standards
The Census of India (2011) estimates that India has about 137 million slum dwellers across the country However statistics on slum populations vary significantly based on how
a slum is defined (Nolan 2015) Therefore not only is there a lack of data about how many people live in slums and informal settlements but there is also limited information about living conditions in slums (Rains Krishna and Wibbels 2018) Rapid urbanisation in India has led to population spikes in urban centres Low-income households in urban areas are trapped in informal and sometimes lsquoillegalrsquo settlements with poor living conditions where access to essential services and infrastructure tends to be limited or badly deteriorated (Butera et al 2016) While slum dwellers are not a homogeneous population slum areas have high concentrations of poverty and social and economic deprivation and poor shelter and environmental conditions (UN-Habitat 2003)
1 Introduction state of Indiarsquos urban slums
1
The Census of India (2011) defines slums as ldquoresidential areas where dwellings are unfit for human habitation by
reasons of dilapidation overcrowding faulty arrangements and design of such buildings narrowness or faulty
arrangement of street lack of ventilation light or sanitation facilities or any combination of these factors which
are detrimental to the safety and healthrdquo The slums in India are officially categorised into three categories
identified recognised and notified1 (Chandramouli 2010) About 59 per cent of slum households in India are non-
notified and are not legally recognised by the government (Nolan Bloom and Subbaraman 2018)
BOX 1 Slums in India
The existing literature on energy access and use in slums across developing countries suggests that while energy infrastructure (electric grid LPG distribution system) is available in these settlements (by being urban) households cannot afford it andor the service is unreliable (frequent outages and low voltage for electricity uncertain availability of gas cylinders) (Butera et al 2016) This leads to households relying on illegal connections for electricity and using energy sources that are on the lower end of the energy ladder (such as kerosene charcoal wood and other biomass residues) for cooking (Butera et al 2016)
1 Areas notified as slums by the concerned municipalities corporations local bodies or development authorities were termed notified slums All areas recognised as lsquoSlumrsquo by State UT Administration or Local Government Housing and Slum Boards which may have not been formally notified as slum under any act While a compact area of at least 300 population or about 60-70 households of poorly built congested tenements in the unhygienic environment is termed as identified slums (National Sample Survey Office 2012)
Are Indiarsquos Urban Poor Using Clean Cooking Fuels Insights from Slums in Six States2
In India population growth and rapid urbanisation have resulted in the deepening of urban poverty and the increased growth of urban slums (GNESD 2008 Yenneti Wei and Chen 2017) As per the Census 2011 most slum dwellers are casual labourers engaged in works other than public works (ie informal sectors) as opposed to salaried employees in non-slum urban areas (National Buildings Organisation 2013) As per the National Sample Survey Office (NSSO 2011ndash2012) the average daily wage of casual labourers is as low as INR 170 in urban areas (Ministry of Housing and Urban Affairs 2019) Such households may be able to purchase cleaner and more efficient fuels whenever they can but are likely to fall back on less efficient ones when faced by budgetary constraints Studies suggest that despite the LPG subsidies provided by the government significant sections of the urban poor population are still struggling to incorporate the cost of LPG into their household budgets (R Singh et al 2015) Use of multiple fuels also provides security from price variations and unreliable service associated with a single fuel or technology (Shahadat Lipu and Bhuiyan 2014)
As per the Census 2011 only half of the urban slum households across the country use LPG as their cooking fuel the remaining rely on solid fuels and kerosene Since 2013 the LPG programme in India has undergone many modifications to improve delivery and targeting access to connections and the availability of LPG (CEEW 2020) Pradhan Mantri Ujjwala Yojana (PMUY) which focuses on tackling the high upfront cost of LPG by providing LPG connections to below poverty line (BPL) households with credit-linked subsidy support has played an instrumental role in increasing the penetration of LPG across the country As of November 2019 about 965 per cent of households in India have an LPG connection (PPAC 2019) Small towns and cities which have been experiencing a comparatively slow rate of urban growth but the high percentage of slum population mall towns and cities which have been experiencing a relatively slow rate of urban growth but a high percentage of slum population
However the dramatic increase in LPG coverage has led to increased fuel stacking (Cheng and Urpelainen 2014) The reliance on fuel stacking has significant implications as the health benefits of using clean fuels are reduced or perhaps even nullified in households that continue to use biomass (Cheng and Urpelainen 2014) Urban slums suffer from a double burden of pollution as they are exposed to high ambient particulate matter pollution in cities along with the household air pollution (HAP) from using unclean cooking fuels (WHO 2014) The Global Burden of Disease study notes that even with the substantial increase in the provision of clean cooking fuels in India more than half of Indiarsquos population is exposed to HAP from solid cooking fuels as of 2017 (Balakrishnan et al 2019) In the current context this is concerning since exposure to air pollution has been linked to developing lower respiratory infections and chronic obstructive pulmonary disease (Balakrishnan et al 2019) which are among the major risk factors for COVID-19 (Lippi and Henry 2020 Wang et al 2020)
11 Motivation and methodology While there have been various studies on energy access in rural areas there is minimal data on energy use and patterns in urban slum households Most studies on urban slums and energy access focus on specific slums in large metropolitan areas such as Delhi and Bangalore (Saksena et al 2003 Dhingra et al 2008 Roy et al 2018) Living conditions and access to resources vary across slums in smaller towns and cities compared to those in Tier I
Slum-dwellers suffer from the double burden of pollution as they are exposed to high ambient particulate matter in cities along with the HAP from using unclean cooking fuels
2 A summary measure that identifies where countries or other geographic areas fall on the spectrum of development Expressed on a scale of 0 to 1 SDI is a composite average of the countryrsquos rankings in terms of per capita income average educational attainment and fertility rates
3 These states account for six out of eight of the lowest socio-demographic index (SDI) states and exhibit the highest health impacts of household air pollution (HAP) These states also have the highest percentage of households covered under the flagship clean cooking energy programme in India ndash PMUY
4 Referred to as lsquoour surveyrsquo thereafter
5 In our sample about 82 per cent of households are from notified slums
6 About 98 per cent of the respondents were female members of the household
7 For further details on the survey sample and methodology refer to the technical document for the survey
3Introduction state of Indiarsquos urban slums
Table 1 Sample allocation across urban slums
Source Authorsrsquo compilation
Note The number of slums sampled within each state varied because the slums were picked from the same districts that were sampled under the India Residential Energy Survey (2020) across the six states This was done to ensure logistical ease in conducting both the surveys and to share the resources of the national-level survey The list of urban slums as per the Census 2011 in the districts sampled under IRES 2020 constitutes the urban sampling frame7
State Districts sampled Urban slums sampled Households surveyed
16
14
10
10
4
4
58
31
15
16
12
5
4
83
249
124
128
94
40
32
667
Uttar Pradesh
Bihar
Madhya Pradesh
Rajasthan
Jharkhand
Chhattisgarh
cities these towns have been experiencing a comparatively slow rate of urban growth but are home to large slum populations (Rahaman and Das 2017) Further existing sources on access to clean cooking energy among slum households are limited to primary fuel use and lack detailed information about fuel use and stacking patterns
In India states with the lowest socio-demographic index (SDI)2 also account for the highest level of disease burden due to air pollution (Balakrishnan et al 2019) The low SDI states in north India had some of the highest levels of ambient particulate matter and household air pollution ndash especially Bihar Uttar Pradesh Rajasthan and Jharkhand The disability-adjusted life year (DALY) rate attributable to HAP was highest in the low SDI states of Chhattisgarh Rajasthan and Madhya Pradesh (Balakrishnan et al 2019)
The findings of this brief are based on a primary survey conducted across rural areas and urban slums in six energy access deprived states in India ndash Bihar Jharkhand Uttar Pradesh Rajasthan Madhya Pradesh and Chhattisgarh3 The Cooking Energy Access Survey 20204 focused on householdrsquos clean cooking energy access and its barriers and drivers in rural areas and urban slums Based on the list of urban slums across districts in Census 2011 the survey covered 656 households across 83 urban slums (notified and non-notified)5 spread across 58 districts The survey was conducted with the primary cook of the household6
In this brief we focus on understanding access to clean cooking energy specifically across urban slum households The analysis focuses on the fuel use patterns of households the extent of use of LPG and solid fuels fuel stacking behaviour and the primary cookrsquos perception of various cooking fuels and their impact on health The results discussed below are representative of the urban slum population in six states We have refrained from state-level analysis because of the smaller sample size for urban slums in some states like Jharkhand and Chhattisgarh
Are Indiarsquos Urban Poor Using Clean Cooking Fuels Insights from Slums in Six States4
12 Socio-economic characteristics of the urban slums of the six states Non-farm casual labour is the primary source of income for more than 42 per cent of the households such households reported a median monthly expenditure of about INR 5000 In only 20 per cent of the households the primary cook is involved in income-generating activities primarily engaged in casual non-farm labour or are self-employed
Source Authorsrsquo analysis
60 households have a monthly income below
INR 10000
In 90 households all members have
Aadhar cards
94 households have a bank account
11 households are currently indebted
Median savings in the past year
INR 4000
Median monthly expenditure
INR 6000
MEDIAN HOUSEHOLD SIZE
6
5
Table 2 Less than one-third of urban slum households reported income from salaried jobs
Source Authorsrsquo analysis
Under self-employment some of the householdsrsquo report occupations like carpentry tailoring driver and priest
The primary source of income of urban slum households
Non-farmdaily wage casual labour
Private or government salaried job
Shop or own business or self-employed
Farm labour
Agriculture on own or leased land
Others (pension remittances cattle rearing none)
43
22
18
8
7
2
Scheduled Castes (SC) (30 per cent) and Other Backward Castes (OBC) (45 per cent) form the majority of the urban slum population While Scheduled Tribes (ST) constitute less than 10 per cent of the overall population a majority of them are in Madhya Pradesh and Rajasthan Less than 20 per cent of the urban slum population are from the General castes States like Bihar Jharkhand and Rajasthan have the least proportion of General castes living in slum areas
Within urban slum households OBC and General households are relatively better off economically as shown in Table 3 Occupational patterns also vary based on caste A higher proportion of OBCs and General households rely on running a business self-employment or salaried jobs for their primary source of income as compared to SC and ST households The latter are primarily engaged in farm and non-farm labour The socio-economic marginality of SCs and STs even within slums is a consequence of these communities being most deprived in terms of access to resources and education income housing etc (Chandrasekhar and Mitra 2018) We see a similar trend in our sample in education and income levels Slums often remain the permanent habitation of marginalised castes as opposed to serving as an entry point for persons from higher castes who get absorbed into relatively better jobs and eventually move out of the slums (Chandrasekhar and Mitra 2018)
Table 3 Scheduled Castes and Scheduled Tribes have the lowest economic status
Source Authorsrsquo analysis
We utilise an economic status or asset index as a measure of a householdrsquos relative wealth and economic status based on the Filmer and Pritchett (2001) approach The list of variables included in the economic status index can be found in Annexure I The index takes values between 0 and 10 where a higher value denotes a higher level of asset ownership
Caste Sample size
Mean of asset index
(Min ndash Max) of BPL cardholders
233
51
281
92
042
039
046
046
(0ndash084)
(008ndash077)
(003ndash1)
(008ndash09)
45
60
49
36
Scheduled Castes
Scheduled Tribes
Other Backward Classes
General
Introduction state of Indiarsquos urban slums
Are Indiarsquos Urban Poor Using Clean Cooking Fuels Insights from Slums in Six States652
Image iStock
Exclusive use of LPG is limited to just over half of the total slum households The householdrsquos economic status and its access to doorstep delivery of LPG refills are two critical factors that determine their ability to use LPG exclusively
7
The fuel use patterns in urban slum households across the six states show a significant improvement in LPG use over the past decade when compared with the data from
Census 2011 The share of households using polluting fuels (including firewood dung cake agriculture residue and kerosene) as their primary fuel has decreased significantly but we find that stacking is a common practice even among households using LPG as a primary fuel Unless they use clean fuels exclusively such slum households will still be exposed to the health risks associated with HAP
Across the six states the primary fuel used for cooking by slum households
For the analysis in this brief we have categorised the households into three based on their fuel choices and position on the energy ladder those that exclusively use clean cooking fuels (LPG and electricity) stack LPG with polluting fuels and use only polluting fuels The level of exposure to emissions from cooking increases from the first (least harmful) to the third category (most harmful)
2 Cooking fuel adoption and use in urban slum households
In this brief the use of clean cooking fuels is considered synonymous to use of LPG since other clean fuels comprise a negligible share of use
Source Authorsrsquo analysis
Households using clean fuel exclusivelyWhile the majority of these households use LPG two per cent of the households reported using electricity for cooking purposes
Households stacking LPG with polluting fuelsMost of these households reported using LPG as their primary fuel and polluting fuels as their secondary fuel About four per cent of slum households reported using polluting fuels as their primary fuel and LPG as their secondary fuel
Households using only polluting fuelsThese households only use firewood charcoal dung
agricultural residue kerosene or a stack of these fuels
5533
12
Fuel-use categories
Use of LPG as primary fuel
82 (Cooking Energy Access Survey 2020)
47 (Census 2011)
Polluting fuel as primary fuel
16 (Cooking Energy Access Survey 2020)
52 (Census 2011)
Are Indiarsquos Urban Poor Using Clean Cooking Fuels Insights from Slums in Six States8
In the following sections we explore factors such as socio-economic characteristics affordability and availability of fuel intra-household gender dynamics and fuel perceptions which influence the ability and likelihood of a household to use different fuels
21 Households using LPG as their only fuel In this section we focus on understanding the household characteristics and fuel use patterns of those using LPG exclusively for cooking Most urban slum households with an LPG connection report using LPG as their primary fuel While 55 per cent of the slum households (63 per cent of LPG-using households) use LPG exclusively others stack LPG with polluting fuels Uttar Pradesh has the highest
proportion (70 per cent) of slum households who are exclusive users of clean cooking fuels among the six states
Figure 1 Within slums there are considerable state-level variations in householdsrsquo fuel usage patterns across states
Source Authorsrsquo analysis
Note We have refrained from state-level analysis because of the smaller sample size for urban slums in states like Jharkhand and Chhattisgarh
Figure 2 While the majority of LPG-using households use the fuel primarily only half of them use it exclusively
Source Authorsrsquo analysis
0
0
10
10
20
20
30
30
40
40
50
50
60
60
70
70
80
80
90
90
100
100
8682
55
Bihar
LPG users
Chhattisgarh Jharkhand Madhya Pradesh
LPG as the primary fuel LPG as the exclusive fuel
Rajasthan Uttar Pradesh
States
Per
cent
age
of h
ouse
hold
s P
erce
ntag
e of
hou
seho
lds
Exclusive clean fuel users Stacking LPG with polluting fuels Only polluting fuel users
42
3
30
56
45
39
1611
40
4944
46
10 5
24
71
41
28
9Cooking fuel adoption and use in urban slum households
Over a fifth of households using LPG exclusively are PMUY households which suggests that these households have been able to transition to clean cooking fuels in less than four years PMUY households using LPG exclusively are of a relatively higher economic status than households that stack polluting fuels Unlike in rural areas the age of an LPG connection does not have a direct correlation with per capita LPG consumption in urban slum households suggesting that even households with recent LPG connections in urban slums are likely to use LPG exclusively Households in urban areas have been known to experience a direct transition to exclusive use of clean fuels from using traditional fuels (Kuo and Azam 2019) This could be due to the time-saving that comes with the adoption of clean cooking fuels like LPG ndash where urban households are more willing or need to spend more on convenience than rural households
Figure 3 Most households using LPG exclusively acquire six to eight cylinders per year
Source Authorsrsquo analysis
211 The economic status of the household determines exclusive LPG useA simple logistic regression (Annexure II) shows that households with higher asset ownership have significantly higher odds of using LPG as an exclusive fuel Even between primary and exclusive users of LPG asset ownership remains a significant differentiating factor This corroborates the findings of previous studies (Ranjan and Singh 2017) that state that households tend to switch their cooking fuel use patterns after a threshold level of income is achieved However this is not to suggest that all wealthy households shift to exclusive use of clean fuels We discuss the reasons for stacking among these households in the next section
Cooking energy in the household budget We find that households using LPG as their only fuel pay INR 496 per month8 This effectively translates to an average household spending almost eight per cent of their monthly expenses on cooking fuel
Oil and Marketing Companies (OMCs) are attempting to address the challenges around the recurring refilling
cost by encouraging low-income households to use a 5 kilograms (kg) cylinder to overcome the high upfront cost
associated with 145kg cylinders In our sample we find that only about two per cent of urban slum households use
small cylinders (5kg or 3kg)
BOX 2 Uptake of small cylinders
8 This is based on the upfront cost paid by the household for an LPG refill Given that only 40 per cent of the householdsrsquo report receiving LPG subsidy on refills ndash it has not been considered in the fuel expenditure calculation The share of fuel expenditure for the households receiving LPG subsidies would be accordingly less than the others
0
10
20
30
40
50
60
70
1
1 16 8 9
22
60
4350 50
14
34
15
2 3 4 5 6 7 8 9 10 11 12 13
Number of 14 kg LPG cylinder refills obtained by exclusive LPG users
Per
cent
age
of h
ouse
hold
s us
ing
LP
G e
xclu
sive
ly
households using LPG exclusively Median value
Are Indiarsquos Urban Poor Using Clean Cooking Fuels Insights from Slums in Six States
212 Home delivery for exclusive LPG users We find that households who receive doorstep delivery of LPG refills have higher odds of using LPG as their exclusive fuel Hassle-free doorstep delivery of LPG refills is known to influence the use of LPG as a primary secondary or exclusive fuel (PPAC-CRISIL 2016)
Additional expense on procurement of cylinders Almost half of the households who receive doorstep delivery of LPG pay an additional amount of INR 20 as a delivery charge However in households that do not receive doorstep delivery about 46 per cent report that one member must forgo their daily wages to procure the cylinder Most of such households depend on daily labour or private jobs for their income
Given that almost half of the households report having to forgo wages to procure the cylinders it could affect the householdrsquos ability to use LPG continually It may add to the average delay in the purchase of refills
Procurement of LPG cylinders during the COVID-19 pandemic Most households that do not receive doorstep delivery of LPG (58 per cent) use private vehicles (including motorcycles or bicycles) to transport LPG refills About one-third of the households procuring cylinders on their own use rented or shared vehicles The procurement constraints faced by these households would be further aggravated during the COVID-19 pandemic as using rented or shared vehicles comes with its own risks
10
About 18 per cent of the respondents in our survey reported that they resided in non-notified slums Such slums are not legally recognised as a lsquoslumrsquo by the government which makes the residents more vulnerable to eviction In our data we find that adoption and use of LPG is similar across households from notified and non-notified slums Qualitative interviews and field visits showed that most of the respondents were permanent residents of the slums who have been living there for more than 10 years
About 2 per cent of urban slum households use electricity as a source for cooking energy These households do not rely on any other fuels for cooking or non-cooking purposes They use electric stoves to prepare all meals including cooking roti rice and vegetables These households have been using electricity as their cooking fuel only in the past five years Most households report using either a coiled stove or induction stove Less than one per cent of households use other electric appliances such as hot water kettles and toasters for cooking needs
BOX 3
BOX 4
Status of slums impacting the fuel-use pattern
Electricity for cooking
77
households receiving doorstep delivery of LPG cylinders are exclusive users of the fuel
63LPG-using households receive doorstep delivery of cylinders
Male members have to travel to procure the cylinders in 87 households
11Cooking fuel adoption and use in urban slum households
About 4 per cent of urban slum households in the sample reported stacking with kerosene as their secondary fuel Most of these households are in Uttar Pradesh These households also use kerosene more than once a week for cooking
BOX 5 Use of kerosene as a cooking fuel
22 Households stacking LPG with polluting fuels Across the six states almost half of the households (45 per cent) reported using polluting fuels Here we discuss the characteristics and fuel use patterns of households that stack clean and unclean fuels
Though 86 per cent of the households surveyed have an LPG connection we find that over a third (33 per cent) of them stack it with polluting fuels (including firewood dung cakes agriculture residue charcoal and kerosene) The increased stacking could also be a result of more households adopting LPG since households tend to not replace biomass-based fuels completely (Cheng and Urpelainen 2014) These households would need to transition to exclusive use of clean cooking fuels to reduce the health impacts on women and children from household air pollution
About 44 per cent of the households that are stacking fuels rely on informal sources for refills Such households have not ordered any refills in the past one year from their LPG distributors These households mainly rely on recurring cylinders from their neighbours or relatives9
Figure 4 Of the households that stack fuels most use LPG as their primary fuel
Source Authorsrsquo analysis
9 It is important to note that sharing LPG cylinders among neighbours and extended family is a regular phenomenon in small towns and rural areas owing to availability challenges and it is not necessarily driven by an intention to siphon off subsidy amounts against the commodity ( Jain et al 2018)
Exclusive clean fuel users
Stacking with LPG as the primary fuel
Only polluting fuel users
Stacking LPG with polluting fuels
Stacking with LPG as the secondary fuel
55
3388
12
12
Are Indiarsquos Urban Poor Using Clean Cooking Fuels Insights from Slums in Six States12
221 Household factors that determine the decision to stack fuels Even within the stacking households the reason for stacking multiple fuels varies significantly Primarily households who stack can be divided into two categories ndash those that stack as they cannot afford LPG refills and those that stack due to other factors like taste preferences and alternate end-uses of the fuel
Households who are stacking primarily due to affordability concerns ndash Across asset quintiles we find that stacking is most common among the middle categories (second and third quintile) where most have adopted LPG Still the affordability of the fuel remains a significant concern More than 60 per cent of the households that are stacking fuels collect or prepare firewood or dung cakes free of cost rather than purchasing them from the market Those who buy biomass do not spend more than INR 100 per month on it Based on the responses of the primary cook we note that the high cost of LPG and free-of-cost availability of solid fuels are the most common factors that affect the fuel choices made by the household
Figure 5 Stacking is prevalent in households across asset quintile categories
Source Authorsrsquo analysis
1 2 3 4 5
Asset quintile categories
0
20
40
60
80
100
Per
cent
age
of h
ouse
hold
s
Exclusive clean fuel users Stacking LPG with polluting fuels Only polluting fuel users
5348
52
6367
2441 37
3232
2311 11
51
Households who use LPG primarily and polluting fuels as secondary fuels have a median annual refill rate of
6 cylinders
Households who use polluting fuels primarily and LPG as a secondary fuel have a median annual refill rate of
4 cylinders
13
Households that are stacking for reasons beyond affordability ndash More than one-fourth of the households that are stacking have a median annual refill rate of eight cylinders and above despite having a similar household size as others Most such households fall in the highest asset quintiles This suggests that they are not necessarily using unclean fuels due to the unaffordability of LPG but due to other factors such as taste preference for chulhas and fuel end-uses that influence the householdrsquos decision to use solidpolluting fuels Such households reported using LPG for a median period of six years The solid fuels are primarily used for cooking chapatis or vegetables in these households
Interestingly even households with multiple LPG connections and two cylinder connections report stacking with polluting fuels The possession of multiple LPG connections in these households may not necessarily be an indicator of diversion mdash the average family size of these households is more than eight indicating the high possibility of having separate kitchens within the same household Given that such households have a median annual refill rate of ten cylinders another plausible reason for multiple connections is that it prevents them from relying on just one distributor which increases their chances of getting refills whenever needed
222 End-uses of polluting fuels Across both the groups discussed above half of the households who stack with polluting fuels use these fuels at least once a day (Figure 6) Also almost 45 per cent of the households that stack fuels use multiple stoves at the same time while preparing a single meal This indicates that even if the household is using LPG for a particular meal they would be using their chulha simultaneously
Despite using LPG as the primary fuel for their cooking needs households that are stacking fuels use polluting fuels for non-cooking purposes like heating water for bathing (29 per cent) and space heating (10 per cent)
Figure 6 Almost half of the households using polluting fuels use it every day
Source Authorsrsquo analysis
0 5 10 15 20
19
11
21
20
29
25 30 35
Percentage of households
Freq
uenc
y of
use
of p
ollu
ting
fuel
s Several times a day
Once per day
Few times a week
Once a week
Occasionally
21 households stacking fuels
have more than one LPG connections
25 households stacking fuels have two-cylinder connections
Cooking fuel adoption and use in urban slum households
Are Indiarsquos Urban Poor Using Clean Cooking Fuels Insights from Slums in Six States14
223 Seasonal variations in the stacking of fuels We also noted a significant seasonal change in fuel use patterns LPG is most popular in the rainy season (88 per cent) and least popular in the winter months (45 per cent) (Figure 7) The dampness associated with solid fuels in the rainy season could be the reason for using LPG primarily during these months The literature also suggests that solid fuels are a popular choice during winter months (S Singh 2014 Baqir et al 2019) This could be because during winter months the solid fuel requirement for non-cooking tasks within the household likes water heating for bathing and space heating increases Since households are already using solid fuels for non-cooking tasks they may be using these fuels more for cooking during winter Unfortunately the increased use of solid fuels in winter exacerbates the much higher air pollution exposure of these households due to unfavourable atmospheric conditions
Figure 7 Proportion of urban slum households using solid fuels as the primary cooking fuel increases during the winters months aggravating household air pollution exposure due to unfavourable atmospheric conditions
Source Authorsrsquo analysis
About 3 per cent of urban slum households reported owning an electric water-heating device (geyser or immersion
rod) Similarly only 4 per cent of the households own an electric room heater
BOX 6 Electric devices for water heating and space heating
Summer Winter Rainy Festival0
20
40
60
80
100
120
Per
cent
age
of h
ouse
hold
s
LPG Solid fuel
78
45
88
67
22
55
1233
15
Figure 8 Lack of awareness about receiving LPG refill subsidies poses a threat to the success of LPG subsidy schemes
Source Authorsrsquo analysis
Connections under the Pradhan Mantri Ujjwala Yojana (PMUY) 23 per cent of these households reported receiving benefits under the PMUY
The six states included in the survey account for a significant share of PMUY coverage ndash 54 per cent of all connections provided under PMUY (PPAC 2019) However most of these connections cater to rural households One of the reasons for there being fewer PMUY connections in urban areas is that more than half of all urban slum households reported already having had LPG connections for over four years (before the launch of PMUY) Moreover over a quarter of PMUY households10 in urban slums reported having multiple LPG connections which suggests that not every household which was using LPG before the PMUY was prevented from accessing the schemersquos benefits
Government support during the COVID-19 pandemic During the COVID-19 lockdown the government announced the provision of three free-of-cost refills for PMUY households under the PM-Garib Kalyan Yojana While PMUY households in urban slums benefitted from this scheme non-PMUY households in urban slums did not As documented urban slum households faced a significant economic hit due to the loss of jobs and incomes during the pandemic (Patel 2020) Non-PMUY households that stack for economic reasons are more likely to use cheaper and freely available solid fuels without additional support from the government
PAHAL-Direct Benefit Transfer for LPG (DBTL)Overall about 42 per cent of active LPG users11 reported receiving a subsidy for their last LPG refill under the Direct Benefit Transfer for LPG scheme (DBTL) However about 28 per cent of urban slum households reported not knowing if they had received the subsidy amount for their last refill this suggests that the primary cook is often unaware of whether the subsidy is credited to the household Among the ones that reported receiving the LPG subsidy about 40 per cent of the primary cook were not aware of the amount of subsidy being credited into their account
10 This is a relatively smaller sample of 43 households from all the PMUY households in urban slums (131 households)
11 Households that have taken at least one refill in the past year
42
30
28
Received LPG refill subsidy
30 Still repaying PMUY loan
Did not receive LPG refill subsidy
10 Gave up LPG refill subsidy
Do not know
60 LPG refill susbsidy not received due to other reasons
Cooking fuel adoption and use in urban slum households
Are Indiarsquos Urban Poor Using Clean Cooking Fuels Insights from Slums in Six States16
23 Households using only polluting fuels About 12 per cent of urban slum households rely entirely on polluting fuels for all cooking and non-cooking purposes While the share of these households is relatively small the non-adoption of LPG in such households despite
programmes like the PMUY is concerning These households either use a combination of different polluting fuels (firewood dung cakes agricultural residue charcoal and kerosene) or just one of these fuels for all their energy needs Firewood is the most commonly used fuel in these households
231 Reasons for the non-adoption of LPGHouseholds that rely exclusively on polluting fuels reported not having an LPG connection Though three-fourths of these households were aware of PMUY the high upfront cost of an LPG connection along with the high recurring cost of procuring refills remain the two most important reasons for not procuring an LPG connection Repondents also mentioned a lack of information on how to procure a connection as a reason These reasons align with the common causes cited by rural households covered in the survey implying that the challenges faced by rural households and urban slum households in procuring connections are similar
Almost half of the households in this category use solid fuels for non-cooking purposes such as heating water for bathing space heating and preparing fodder for animals On the positive aspects of using polluting fuels households reported the following free-of-cost easy availability of fuels better tasting food and preference of family members for food cooked on the chulha
232 Fuel availability and affordabilityIn contrast with households that stack fuels households that use only solid fuels rely on purchasing fuels rather than collecting or preparing them For instance 60 per cent of firewood users in this category procure fuel by purchasing rather than collecting it
Households with low asset ownership rely on polluting fuels for cooking These households spend 2ndash3 per cent of their median monthly expenditure on fuel (INR 75 per month on fuel) which is much lower than what they would have to spend if they used LPG exclusively (INR 496 per month) Households that collect solid fuels spend about two hours on a single trip (three times a month) travelling a median one-way distance of 2 km This is equivalent to the distance travelled to procure LPG cylinders (if not delivered at home)
Figure 9 More than half of the households currently without LPG do not know how to get a connection or whom to ask about it implying a lack of awareness
Source Authorsrsquo analysis
0 10 20 30 40 50 60 70
39
53
63
68
80
Percentage of households
Rea
sons
for N
on-A
dop
tion
of L
PG Installation is expensive
Monthly expenditure on LPG is high
Do not know how to get or whom to ask
Not availabletoo far
17
12 See Annexure III for details on the districts and their PM25 concentrations The data for 15 districts (from Bihar Uttar Pradesh Madhya Pradesh and Rajasthan) overlapping with the survey sample have been analysed based on the availability of air quality data from continuous monitoring stations
13 Air quality categories based on PM25 concentration (in μgm3)
Good 0 to 30 Satisfactory 31 to 60 Moderately polluted 61 to 90 Poor 91 to 120 Very poor 121 to 250 Severe above 250 (Central Pollution Control Board 2014)
Cooking fuel adoption and use in urban slum households
Winter months have the highest PM25 concentrations coinciding with the sharp increase in use of polluting fuels for heating bath water and room heating
233 Gendered time use in households using solid fuelsIn urban slums both the male and female members of the household are equally involved in collecting firewood Still it is primarily the female members of the household who undertake dung cake preparation In addition to engaging in fuel collection and preparation women tend to spend more time cooking in households using solid fuels About 85 per cent of households that transitioned to LPG in the past four years reported having saved time while cooking compared to when they used solid fuels
SPOTLIGHT I Household air pollution (HAP) in urban slums
Burning solid fuels in three-stone fires and mud stoves with inadequate ventilation causes high levels of smoke exposure and negative health impacts particularly for women and young children (WHO 2014)
The double burden of ambient and household air pollution on the urban slum populationUsing the PM25 data from continuous ambient air quality monitoring stations (CAAQMS) for 15 districts12 in our sample we found that the ambient air quality remained in the lsquopoorrsquo or worse category13 for most districts throughout the year variation in the ambient air quality
Are Indiarsquos Urban Poor Using Clean Cooking Fuels Insights from Slums in Six States
Impact of ventilation
Indoor cooking and low adoption of chimney indicates high exposure to pollution from the use of unclean fuels for cooking The proportion of households with a chimney is high (52 per cent) among those who rely only on polluting fuels Smith and Pillarisetti (2017) explain that while having a good chimney lowers peak levels of indoor pollution long-term average exposure is reduced only by a factor of two Besides chimneys require regular maintenance to function correctly While more than 45 per cent of the households are using polluting fuels less than 20 per cent of the slum housheolds use improved cookstoves
Households also use solid fuels for non-cooking uses like space heating On average each house in a slum has two rooms this effectively exposes all members of the household to emissions from burning fuels Emissions from household sources contribute significantly to the surrounding air quality (Harish et al 2019) this concern is exacerbated in congested slum areas
the winter months (November to February) have the highest concentration of PM25 This leads to a double burden of exposure for slum households stacking solid fuels as they are more likely to increase use of solid fuels in winters (Figure 7) Alternatively the use of LPG as the primary source of fuel increases during the rainy season (June to September) these months record the least ambient air pollution
We also find that districts like Meerut Ghaziabad Patna Gautam Buddha Nagar (Noida and Greater Noida) and Muzaffarpur have the highest frequency of lsquovery poorrsquo air quality days throughout the year Across these districts one-third of households use polluting fuels for cooking In urban slums where households are more densely packed the emissions from burning solid fuels increase the risk of exposure inside households and deteriorate the ambient air quality for the community at large As a result these communities suffer from both increased household and ambient air pollution HAP has an estimated average contribution of 30ndash50 per cent to ambient air quality across Indiarsquos urban and rural areas (Balakrishnan et al 2019) Addressing biomass burning for cooking water heating and space heating during the winters has the potential to help reach the national ambient air quality standards (Chowdhury et al 2019) Despite that only 2 per cent of the action points in 44 city clean air plans mention cooking and heating as a sector to address air pollution (Ganguly Selvaraj and Guttikunda 2020)
18
75 householdsrsquo
using polluting fuels cook inside
the main house
67 householdsrsquo using polluting fuels do not have a chimney for ventilation
Awareness about the health impacts of using polluting fuelsAbout 60 per cent of households using only polluting fuels and 84 per cent of households that stack LPG with a polluting fuel report lsquotoo smokyrsquo as the most prominent negative aspect of using polluting fuels This suggests that as more households switch to clean cooking fuels perceptions regarding pollution fuels change
Three-fourths of primary cooks who use polluting fuels for cooking agree that smoke from solid fuels is harmful to them this implies that awareness of the adverse health impacts of polluting fuels does not necessarily lead to the uptake of clean fuels Primary cooks also agree that smoke from solid fuels causes coughing (49 per cent) and lung infections in children (39 per cent)
Exposure to air pollution is a known risk factor for underlying chronic diseases that predict the severity of
COVID-19 disease and patient outcomes (World Bank 2020) This linkage suggests a heightened risk for women
in all age groups who cook using traditional technologies and fuels (World Bank 2020) The highest number of
COVID-19 cases were recorded in the most polluted regions among patients with pre-existing health conditions
(Frontera et al 2020)
Results from a controlled study show a higher prevalence of chronic obstructive pulmonary disease (COPD)
among biomass fuel users than clean fuel users ( Johnson et al 2011) The available clinical data to date suggest
that cardiovascular disease diabetes chronic respiratory illness and hypertension ndash conditions all strongly
associated with exposure to HAP ndash are also risk factors for COVID-19 (World Bank 2020)
BOX 7 Impact of household air pollution on COVID-19
19Cooking fuel adoption and use in urban slum households
Are Indiarsquos Urban Poor Using Clean Cooking Fuels Insights from Slums in Six States
Traditionally women bear a disproportionate burden in collecting and preparing biomass for cooking While this burden reduces with the use of clean cooking fuels like LPG the fuel supply within the household is then determined by formal and monetised distribution networks involving an outlay of money (Patnaik and Jha 2020) Our data shows that womenrsquos status in the household (as heads of households)14 positively correlates with households using LPG as their primary fuel The existing literature also supports the idea that female-headed households prefer modern fuels to polluting ones (Farsi Filippini and Pachauri 2007 Rao and Reddy 2007 Kuo and Azam 2019) Other research also suggests that female-headed households are more willing to spend on LPG as a recurring expense (Kojima Bacon and Zhou 2011 Kuo and Azam 2019)
SPOTLIGHT II Womenrsquos participation in intra-household decision-making regarding LPG use
20
14 In almost half of the households surveyed the primary cook reported a female member being the head of the household The reason behind such high percentage of female-headed households could be because only the primary cook of every household (who is mostly female) was surveyed This does not mean that these households do not have any adult male members Traditionally headship refers to the head of household as the individual whose lsquoauthorityrsquo the household members recognise But this definition overlooks potential intra-household variations in the recognised authority in different realms of decision-making (Kilic Moylan and Koolwal 2020) Since cooking is a gendered activity the primary cookrsquos response to the head of household question may have been with respect to the recognised authority figure for that activity within the household
30 householdsrsquo female members place the order for LPG refills
50householdsrsquo female
members decide whether or when to purchase LPG refills
We also find that the decision of whether or when to purchase LPG refills is made by male members in half of urban slum households This holds for both male- and female-headed households In LPG-using households where the primary cook is involved in an income-generating activity more women are deciding to order the refills This pattern is similar irrespective of whether the household uses LPG exclusively or stacks it with other polluting fuels or are PMUY beneficiaries
SPOTLIGHT III A comparison of access to clean cooking energy between urban slum and non-slum households across six states
21
At the state level Bihar has significantly poor involvement of women in intra-household decision-making regarding
ordering refills with less than 10 per cent of households reporting that women decide whether or when to order
refills However more women than men are involved in decisions around LPG refills in Rajasthan Madhya Pradesh
and Jharkhand
Across caste groups the involvement of women is lowest (37 per cent) among the Scheduled Castes (SCs)
However more women in General and OBC households decide when to order LPG refills
BOX 8 Variations in intra-household decision-making across states and caste groups
Cooking fuel adoption and use in urban slum households
To compare the fuel use patterns of urban slum and non-slum households we used data from the India Residential Energy Survey (IRES 2020)15 The overlap in the sampling strategies of both IRES and our survey enabled a comparison of the findings There is a significant difference in the socio-economic status of slum and non-slum households which tends to affect their fuel use patterns Table 4 provides a comparison of cooking fuel usage in urban non-slum households (from IRES 2020) and urban slum households (Cooking Energy Access and Use survey 2020)
Are Indiarsquos Urban Poor Using Clean Cooking Fuels Insights from Slums in Six States22
Table 4 The poor economic condition of households in urban slums impacts the exclusive use of clean fuels for cooking
Source Authorsrsquo analysis
Fuel use categories Urban slum households (Cooking Energy Access Survey) ()
Non-slum urban households (IRES) ()
95 88
84 55
9 33
5 12
Clean fuel users (LPG PNG and electricity)
LPG as an exclusive fuel
Households that stack LPG with polluting fuels
Households that use only polluting fuels
We observed a significant gap in the exclusive use of LPG as a cooking fuel between urban slums and non-slum households explained mainly by the difference in their economic conditions Stacking is three times more common in slum households than non-slum households About 45 per cent of non-slum households using polluting fuels belong to marginalised social groups (SCs and STs) Households using polluting fuels have a lower median monthly expenditure than others and about 62 per cent of such households are semi-pucca or kuchha structures Among LPG users non-slum households have a slightly higher rate of doorstep delivery as compared to slum households
LPG-using households receiving home deliveries
Source Authorsrsquo analysis
239
6372
Urban slum households (Cooking Energy Access and Use)
()
Non-slum urban households (IRES)
()
Proportion of PMUY beneficiaries among LPG-using households
15 IRES 2020 was conducted in 21 large states of India including Bihar Jharkhand Rajasthan Madhya Pradesh Uttar Pradesh and Chhattisgarh While IRES 2020 focused on urban households the Cooking Energy Access and Use survey specifically attended to urban slums in the same districts Refer to the technical note for a detailed methodology of the survey
23
3 Way forward
Slums across the world are chronically ignored in public policy and suffer because of unauthorised and unsafe habitation without access to government services (Shahadat
Lipu and Bhuiyan 2014) In terms of energy access while we see a progressive change in householdsrsquo energy use patterns as we move from rural to urban issues like affordability availability preference and familiarity with the fuel and stove remain essential factors that determine householdsrsquo fuel choice
Image iStock
Are Indiarsquos Urban Poor Using Clean Cooking Fuels Insights from Slums in Six States24
Understanding categories of users is important for enabling access to and use of clean cooking fuels
We categorised the urban slum population based on their fuel usage patterns ndash using only clean fuels stacking clean fuels with polluting fuels and using only polluting fuels While most households in urban slums have an LPG connection only half of them use LPG exclusively The householdrsquos economic status and its access to doorstep delivery of LPG refills are two crucial factors that determine its ability to use LPG exclusively Despite being situated in urban areas 37 per cent of slum households do not receive home delivery of cylinders ndash availability is an essential factor in determining the householdrsquos likelihood of using LPG exclusively There is a strong impetus for the OMCs and distributors to improve their home delivery services of LPG refills in slum areas
Stacking is prevalent in about one-third of households ndash there is a need for a deeper understanding of householdsrsquo preferences fuel end-uses and awareness Most households reported using polluting fuels daily or at least weekly this effectively increases their exposure to household air pollution despite having access to clean cooking fuels Among households that stack LPG with polluting fuels the reasons for stacking differ ndash affordability seasonality and taste preference More than a quarter of households that stack have a similar level of LPG consumption as those that use LPG exclusively despite similar family sizes Such households use polluting fuels not because of their inability to afford LPG But other factors like free-of-cost availability of biomass taste preference for chulha and alternate end-uses of fuelmdashfor instance in space heatingmdashinfluence the householdrsquos decision to use solid fuels Among households that stack multiple fuels the use of polluting fuels increases during winter months this exposes the households to a double burden of high ambient and household air pollution in these months About 40 per cent of these households also use polluting fuels for non-cooking purposes like heating water for bathing and space heating especially in winter
Even with large-scale government initiatives like PMUY we find that more than 10 per cent of urban slum households do not use LPG They mainly rely on free-of-cost biomass for their cooking and non-cooking needs Despite awareness of PMUY among these households the high upfront cost of procuring an LPG connection and high recurring expenditure on refills deter them from using LPG Evidently there is a need to expand the reach of PMUY to cover households across slums
Integrating the issue of lack of access to clean cooking energy within the discussion on urban poverty
This study reiterates the need to look at poverty in urban areas in the context of energy access Given the heterogeneity of poverty in urban and semi-urban India it is essential to understand energy poverty in the context of access to resources for an enhanced quality of life for the urban poor Similarly slums dwellers in large and small cities alike may experience additional challenges of access Furthermore not all urban poor live in slums we know even less about the access issues of temporary residents or seasonal migrants in urban India Therefore in a rapidly urbanising India studies on the urban poor and air quality need to integrate a focus on energy access to address the vulnerability of women children and communities to HAP and the drudgery of using polluting fuels for cooking and other household energy needs
Access to clean cooking energy schemes must be integrated into the social assistance programmes focused on urban poverty alleviation to enhance its reach
25Way forward
Converging energy access in social protection policies for the urban poor
Accounting for the vulnerabilities of the urban poor is crucial in designing and implementing policies including social protection schemes As a health and economic imperative access to clean cooking energy schemes must be integrated into the social assistance programmes of other ministries (eg health education and nutrition assistance) to offer better support to slum households This would also reduce the burden on households of claiming and accessing multiple benefits across schemes thus freeing them to invest more time in productive activities (CEEW 2020) Government programmes such as the National Urban Livelihoods Mission and social service allocations for housing should use existing targeting approaches to include access to clean cooking energy within the ambit of services for the poor
Bringing a renewed emphasis on clean cooking energy access due to COVID-19 is essential
Most households in urban slums rely on daily wage labour or the gig economy for their household income During the COVID-19 pandemic these occupations have been among the worst impacted by the lockdown and the economic slowdown A survey conducted with over 2000 daily wage workers in urban slums during the lockdown suggests that only 7 per cent of respondents from this group received pay during the lockdown (Basu 2020) causing a massive shock to their livelihoods and wage earnings This kind of impact pushes households into energy poverty leading to the increased use of free-of-cost biomass and consequently increasing the risk of exposure to emissions from fuel burning While the government has committed to supplying up to three free refills to all PMUY households under PM-Garib Kalyan Yojana less than a quarter of households in urban slums have Ujjwala connections The low share of PMUY households effectively makes the majority of slum households ineligible for relief support given under the PM-Garib Kalyan Yojana during the lockdown There is a need to target vulnerable households ndash beyond PMUY beneficiaries ndash with differential subsidy support for using LPG in a sustained manner
Increased poverty would mean increased use of polluting fuels ndash there is a need for a renewed emphasis on clean cooking energy access during the COVID-19 pandemic as increased use of polluting fuels has health implications (lower respiratory infections and COPD) that increase the risk of COVID-19 infections being more severe
There is a need to target vulnerable households ndash beyond PMUY beneficiaries ndash with differential subsidy support for using LPG in a sustained manner
Are Indiarsquos Urban Poor Using Clean Cooking Fuels Insights from Slums in Six States
Balakrishnan Kalpana Sagnik Dey Tarun Gupta R S Dhaliwal Michael Brauer Aaron J Cohen Jeffrey D Stanaway et al 2019 ldquoThe Impact of Air Pollution on Deaths Disease Burden and Life Expectancy Across the States of India The Global Burden of Disease Study 2017rdquo The Lancet Planetary Health 3 (1) e26ndash39 httpsdoiorg101016S2542-5196(18)30261-4
Baqir M S K Bharti R Kothari and R P Singh 2019 ldquoAssessment of an Energy-efficient Metal Chulha for Solid Biomass Fuel and Evaluation of its Performancerdquo International Journal of Environmental Science and Technology 16 (11) 6773ndash6784 httpsdoiorg101007s13762-018-2028-9
Basu Anika Badyal 2020 ldquoLockdown Survey How The Covid-19 Crisis Has Affected Daily Wage WorkersmdashAIFrdquo American India Foundation June 28 httpsaiforglockdown-survey-how-the-covid-19-crisis-has-affected-daily-wage-workers
Butera F M P Caputo R Adhikari and A Facchini 2016 ldquoThe Challenge of Energy in Informal Settlements A Review of the Literature for Latin America and Africardquo Procedia Engineering 1ndash32 httpswwwenelfoundationorgcontentdamenel-foundtopic-downloadThe challenge of Energy in Informal settlementspdf
CEEW 2020 ldquoEnergy Safety Nets India Case Studyrdquo Vienna Sustainable Energy for All httpswwwceewinpublicationsenergy-safety-nets-india-case-study
Central Pollution Control Board 2014 ldquoNational Air Quality Indexrdquo New Delhi Central Pollution Control Board httpsappcpcbccrcomccr_docsFINAL-REPORT_AQI_pdf
Chafe Z S Mehta and K R Smith 2011 ldquoAmbient Fine Particulate (PM25) Air Pollution Attributable to Household Cooking Fuel in Asiardquo AGUFM A54Bndash03 httpsuiadsabsharvardeduabs2011AGUFMA54B03Cabstract
Chandramouli C 2010 ldquoCensus of India 2011 ndash Circular No 8rdquo New Delhi Ministry of Home Affairs httpscensusindiagovin2011-CircularsCircularsCircular-08pdf
Chandrasekhar S and Arup Mitra 2018 ldquoMigration Caste and Livelihood Evidence from Indian City-slumsrdquo Urban Research amp Practice 12 (2) 156ndash172 httpsdoiorg1010801753506920181426781
Cheng Chao Yo and Johannes Urpelainen 2014 ldquoFuel Stacking in India Changes in the Cooking and Lighting Mix 1987ndash2010rdquo Energy 76 (November) 306ndash317 httpsdoiorg101016jenergy201408023
Chowdhary Sourangsu Sagnik Dey Sarath Guttikunda Ajay Pillarisetti Kirk R Smith and Larry Di Girolamo 2019 ldquoIndian annual ambient air quality standard is achievable by completely mitigating emissions from household sourcesrdquo Proceedings of the National Academy of Sciences 116 (22) 10711-10716 httpsdoiorg101073pnas1900888116
Dhingra Chhavi Shikha Gandhi Akanksha Chaurey and P K Agarwal 2008 ldquoAccess to Clean Energy Services for the Urban and Peri-Urban Poor A Case-study of Delhi Indiardquo Energy for Sustainable Development 12 (4) 49ndash55 httpsdoiorg101016S0973-0826(09)60007-7
Farsi Mehdi Massimo Filippini and Shonali Pachauri 2007 ldquoFuel Choices in Urban Indian Householdsrdquo Environment and Development Economics 12 (6) 757ndash774 httpsdoiorg101017S1355770X07003932
References
26
Frontera Antonio Lorenzo Cianfanelli Konstantinos Vlachos Giovanni Landoni and George Cremona 2020 ldquoSevere Air Pollution Links to Higher Mortality in COVID-19 Patients The lsquoDouble-Hitrsquo Hypothesisrdquo Journal of Infection 81 (2) 255ndash259 httpsdoiorg101016jjinf202005031
Ganguly Tanushree Kurinj L Selvaraj Sarath K Guttikunda 2020 ldquoNational Clean Air Programme (NCAP) for Indian cities Review and outlook of clean air action plansrdquo Atmospheric Environment X Vol 8 httpsdoiorg101016jaeaoa2020100096
GNESD 2008 ldquoClean Energy for the Urban Poor An Urgent Issuerdquo Accessed 25 July 2020 httpswwwgooglecomurlsa=tamprct=jampq=ampesrc=sampsource=webampcd=ampved=2ahUKEwi1hf2ru dntAhUCOisKHQH7BtsQFjAAegQIAxACampurl=http3A2F2Fwwwgnesdorg2F-2Fmedia2FSites2FGNESD2FPublication- pdfs2FSPM_CleanEnergyashx3Fla3Dda26hash3DE4971C585B6798F17954F8B42E073 D9507F42A84ampusg=AOvVaw08kCDgOkTkYc6wRDxzsNyq
Guan Wei-Jie Wen-Hua Liang Yi Zhao Heng-Rui Liang Zi-Sheng Chen Yi-Min Li Xiao-Qing Liu et al 2020 ldquoComorbidity and its Impact on 1590 Patients with COVID-19 in China A Nationwide Analysisrdquo European Respiratory Journal 55 (5) 2000547 httpsdoiorg1011831399300300547-2020
Harish Santosh Kirk R Smith Sourangsu Chowdhury Zoe A Chafe Ajay Pillarisetti Jos Lelieveld Sarath Guttikunda Sagnik Dey and Andrew P Grieshop 2019 ldquoThe Contribution of Household Fuels to Ambient Air Pollution in India A Comparison of Recent Estimates Edited by CcapcOrgInrdquo Collaborative Clean Air Policy Centre May 30 httpsccapcorginpolicy-briefs2019530the-contribution-of-household-fuels-to-ambient-air-pollution-in-india-a-comparison-of-recent-estimates
Jain Abhishek Saurabh Tripathi Sunil Mani Sasmita Patnaik Tauseef Shahidi and Karthik Ganesan 2018 ldquoAccess to Clean Cooking Energy and Electricity Survey of States 2018rdquo New Delhi CEEW httpswwwceewinsitesdefaultfilesCEEW-Access-to-Clean-Cooking-Energy-and-Electricity-11Jan19_0pdf
Johnson Priscilla Kalpana Balakrishnan Padmavathi Ramaswamy Santu Ghosh Muthukumar Sadhasivam Omprakash Abirami Bernard W C Sathiasekaran Kirk R Smith Vijayalakshmi Thanasekaraan and Arcot S Subhashini 2011 ldquoPrevalence of Chronic Obstructive Pulmonary Disease in Rural Women of Tamilnadu Implications for Refining Disease Burden Assessments Attributable to Household Biomass Combustionrdquo Global Health Action 4 (1) 7226 httpsdoiorg103402ghav4i07226
Kilic Talip Heather Moylan and Gayatri Koolwal 2020 ldquoGetting the (Gender-disaggregated) Lay of the Land Impact of Survey Respondent Selection on Measuring Land Ownership and Rightsrdquo Washington DC The World Bank httpsdoiorg1015961813-9450-9151
Kojima Masami Robert Bacon and Xin Zhou 2011 ldquoWho Uses Bottled Gas Evidence from Households in Developing Countriesrdquo The World Bank Sustainable Energy Department Oil Gas and Mining Unit httpelibraryworldbankorgdoibook1015961813-9450-5731
Kuo Ying-Min and Mehtabul Azam 2019 ldquoHousehold Cooking Fuel Choice in India 2004ndash2012 A Panel Multinomial Analysisrdquo IZA Discussion Paper No 12682 httpsssrncomabstract=3468630
Lippi Giuseppe and Brandon Michael Henry 2020 ldquoChronic Obstructive Pulmonary Disease Is Associated with Severe Coronavirus Disease 2019 (COVID-19) COPD and COVID-19rdquo Respiratory Medicine 167 105941 httpsdoiorg101016jrmed2020105941
Ministry of Housing and Urban Affairs 2019 ldquoHandbook of Urban Statisticsrdquo New Delhi Government of India httpmohuagovinpdf5c80e2225a124Handbook of Urban Statistics 2019pdf
Rao M Narasimha and B Sudhakara Reddy 2007 ldquoVariations in Energy Use by Indian Households An Analysis of Micro Level Datardquo Energy 32 (2) 143ndash153 httpsdoiorg101016jenergy200603012
27References
Are Indiarsquos Urban Poor Using Clean Cooking Fuels Insights from Slums in Six States28
National Buildings Organisation 2013 ldquoState of Slums in India a Statistical Compendium 2013rdquo New Delhi Government of India httpnbonicinpdfSlums_in_India_Compendium_English_Versionpdf
National Sample Survey Office 2012 ldquoKey Indicators of Urban Slums in India ndash 69th Roundrdquo New Delhi National Data Bank for Socio-religious Categories httpmospinicinsitesdefaultfilesnational_data_bankndb-rpts-69htm
Nolan Laura B 2015 ldquoSlum Definitions in Urban India Implications for the Measurement of Health Inequalitiesrdquo Population and Development Review 41 (1) 59ndash84 httpsideasrepecorgablapopdevv41y2015i1p59-84html
Nolan Laura B David E Bloom and Ramnath Subbaraman 2018 ldquoLegal Status and Deprivation in Urban Slums Over Two Decadesrdquo HHS Public Access 53 (15) 47ndash55
Patel Amit 2020 ldquoPreventing COVID-19 Amid Public Health and Urban Planning Failures in Slums of Indian Citiesrdquo World Medical amp Health Policy 12 (3) httpsdoiorg101002wmh3351
Patnaik Sasmita and Shaily Jha 2020 ldquoCaste Class and Gender in Determining Access to Energy A Critical Review of LPG Adoption in Indiardquo Energy Research amp Social Science 67 (September) 101530 httpsdoiorg101016jerss2020101530
PPAC-CRISIL 2016 ldquoAssessment Report Primary Survey on Household Cooking Fuel Usage and Willingness to Convert to LPGrdquo New Delhi Petroleum Planning amp Analysis Cell Ministry of Petroleum and Natural Gas Government of India httpswwwppacgovinWriteReadDataReports201710310449342512219PrimarySurveyReportPPACpdf
PPAC 2019 ldquoOil Industry Information at a Glancerdquo New Delhi Ministry of Petroleum and Natural Gas Government of India httpswwwppacgovinWriteReadDataReports201912060336500305462ReadyReckonerNov2019WebVersionpdf
Rahaman Mehebub and Dipendra Nath Das 2017 ldquoNature of Slum Growth in Indian Citiesrdquo Urban India 37 (II) 100ndash116 httpswwwresearchgatenetpublication334051882_Nature_of_Slum_Growth_in_Indian_Citiesread
Rains Emily Anirudh Krishna and Erik Wibbels 2018 ldquoUrbanisation and Indiarsquos Slum Continuum Evidence on the Range of Policy Needs and Scope of Mobilityrdquo London International Growth Centre httpswwwtheigcorgwp-contentuploads201802Rains-et-al_Working-paper_coverpdf
Ranjan Rahul and Sudershan Singh 2017 ldquoEnergy Deprivation of Indian Households Evidence from NSSO Datardquo New Delhi Munich Personal RePEc Archive httpsmpraubuni-muenchende835661MPRA_paper_83566pdf
Roy Debraj Bharath Palavalli Niveditha Menon Robin King Karin Pfeffer Michael Lees and Peter M A Sloot 2018 ldquoSurvey-based Socio-economic Data from Slums in Bangalore Indiardquo Nature Publishing Group 5 1ndash9 httpsdoiorg101038sdata2017200
Saksena Sumeet P B Singh Raj Kumar Prasad Rakesh Prasad Preeti Malhotra Veena Joshi and R S Patil 2003 ldquoExposure of Infants to Outdoor and Indoor Air Pollution in Low-income Urban Areas A Case Study of Delhirdquo Journal of Exposure Science amp Environmental Epidemiology 13 219ndash30 httpsdoiorg101038sjjea7500273
Lipu Molla Shahadat Hossain and Arif Waliullah Bhuiyan 2014 ldquoElectricity Access in Urban Slum Households of Bangladesh A Case of Dhakardquo Journal of Renewable and Sustainable Energy 6 (053112) 1ndash15 httpsdoiorg10106314896697
29
Singh Rozita Xiao Wang Emmanuel Ackom and Juan Reyes 2015 ldquoEnergy Access Realities in Urban Poor Communities of Developing Countries Assessments and Recommendationsrdquo Global Network on Energy for Sustainable Development (GNESD) httpswwwgooglecomurlsa=tamprct=jampq=ampesrc=sampsource=webampcd=ampved=2ahUKEwj5nbqI wdntAhXUTX0KHZE6DboQFjAAegQIAhACampurl=https3A2F2Forbitdtudk2Ffiles2F10635 24942FEnergy_access_realities_v_final_updatedpdfampusg=AOvVaw0xNBAAo0bjLueY9FmoigKF
Singh Santosh 2014 ldquoThe Kaleidoscope of Cooking Understanding Cooking Behaviour and Stove Preferences in Rural Indiardquo New Delhi Deutsche Gesellschaft fuumlr Internationale Zusammenarbeit (GIZ) GmbH httpswwwgizdeendownloadsgiz2014-en-kaleidoscope-of-cooking-indiapdf
Smith Kirk R and Ajay Pillarisetti 2017 ldquoHousehold Air Pollution from Solid Cookfuels and its Effects on Healthrdquo Disease Control Priorities 7 (3) 133ndash52 httpsdoiorg101596978-1-4648-0522-6_ch7
UN-Habitat 2003 ldquoThe Challenge of Slums ndash Global Report on Human Settlements 2003rdquo Location of publishing London UN-Habitat httpsunhabitatorgthe-challenge-of-slums-global-report-on-human-settlements-2003
Wang Bolin Ruobao Li Zhong Lu and Yan Huang 2020 ldquoDoes Comorbidity Increase the Risk of Patients with COVID-19 Evidence from Meta-analysisrdquo Aging 12 (7) 6049ndash6057 httpsdoiorg1018632AGING103000
WHO 2014 ldquoWHO Guidelines for Indoor Air Quality Household Fuel Combustionrdquo WHO Accessed 25 July 2020 httpwwwwhointairpollutionguidelineshousehold-fuel-combustionen
World Bank 2020 ldquoThe State of Modern Energy Cooking Servicesrdquo Washington DC World Bank httpdocuments1worldbankorgcurateden937141600195758792pdfThe-State-of-Access-to-Modern-Energy-Cooking-Servicespdf
Yenneti Komali Yehua Dennis Wei and Wen Chen 2017 ldquoThe Urbanization of Poverty in India Spatio-temporal Disparities in Consumption Expendituresrdquo Geographical Review 107 (2) 360ndash383 httpsdoiorg101111j1931-0846201612167x
References
Are Indiarsquos Urban Poor Using Clean Cooking Fuels Insights from Slums in Six States
Annexure 1 Asset ownership index We used Filmer and Pritchettrsquos (2001) proposed approach to construct an asset ownership index using principal component analysis (PCA) We chose the indicators based on data from the Cooking Energy Access survey 2020 The variables we considered for the index were based on classifications by Caroline Moser and Andrew Felton (2007) and K Harttgen (2013) We computed the asset index using housing characteristics and consumer durables as follows
Variables not included in the asset index
Four types of variables were eliminated
1 Variables (such as grid electricity) that had high usage of greater than 95 per cent
2 Those (such as ownership of laptops or computers air conditioners etc) that had a low usage of less than 5 per cent
3 Variables (like house ownership) that have economically fluctuating values
4 Those that indicated a low correlation of less than 20 per cent variation between the top category (ie first) of the asset quintile and the bottom-most category (ie fifth) of the asset quintile
For ease of interpretation we rescaled this index such that the final index values range between 0 and 10 For this purpose we used a feature scaling (or minndashmax scaling) formula
Xnorm (or (IVx)) = (X ndash Xmin)(Xmax ndash Xmin)
where IVx is the normalised index value Xmin is the initial minimum value (-354) and Xmax is the initial maximum value (461) of the asset ownership index
30
Annexures
bull Crowding16 inside the house bull Toilet ownership and usage bull Source of water bull Number of pucca rooms
bull Ownership of two-wheeler bull Ownership of washing machine bull Ownership of television bull Ownership of refrigerator bull Ownership of cooker
16 A household with more than three members occupying a single room is considered crowded (World Health Organization 2018)
Housing characteristics
Consumer durables
Annexure 2 Explaining the use of LPG as the exclusive fuel (simple logistic regression model)
31Annexures
Dependent variable exclusive LPG use
Education of the primary cook (categorical base category is education beyond the school level)
Education of the household head (categorical base category is education beyond the school level)
State (categorical base category includes households from Rajasthan)
P gt z 95 confidence interval
Odds ratio (SE)
1299 (0112)
0659 (0202)
1399 (0394)
0970 (0038)
0994 (0011)
1003 (0013)
2042 (0508)
1011 (0046)
0782 (0441)
1198 (0608)
1377 (0664)
1345 (0566)
3141 (1103)
1213 (0500)
0309 (0211)
1165 (0565)
1703 (0680)
0002
0174
0233
0446
0583
0839
0004
0812
0663
0722
0507
0482
0001
0639
0086
0753
0182
1097
0361
0806
0898
0973
0977
1254
0924
0259
0443
0535
0589
1578
0541
0081
0450
0779
1540
1203
2428
1048
1016
1029
3327
1106
2361
3240
3545
3070
6251
2720
1181
3014
3723
Asset index
Primary cook involved in income-generating activity
Female-headed households
Household size
Age of household head
Age of primary cook
Doorstep delivery of LPG cylinders
PMUY customer
Primary cook is not educated
Primary cook has a school education
Household head is not educated
Household head has a school education
Uttar Pradesh
Bihar
Chhattisgarh
Jharkhand
Madhya Pradesh
Number of households (n) = 417
Log likelihood = -228777
Prob gt chi2 = 0000
Pseudo R2 = 0126
The dependent variable is a dummy variable where households using LPG exclusively are assigned a value of 1 and all other households are assigned the value of 0
The caste of the household has not been factored into the regression as a separate variable because of its underlying influence on economic status
Source Authorsrsquo analysis
Are Indiarsquos Urban Poor Using Clean Cooking Fuels Insights from Slums in Six States
Annexure 3 Air quality (PM25 concentration in μgm3) across 15 districts based on CAAQMS data
32
Dis
tric
tsM
ar-1
9A
pr-1
9M
ay-1
9Ju
n-19
Jul-1
9A
ug-1
9Se
p-19
Oct
-19
Nov
-19
Dec
-19
Jan-
20Fe
b-20
Mar
-20
794
5
988
5
866
7
-
645
329
2
453
7
388
1
769
1
886
4
661
5
950
9
834
4
-
823
4
611
7
569
9
535
7
-
270
4
589
4
571
5
293
1
705
4
839
2
614
9
970
1
826
8
-
844
9
622
1
597
1
564
0
-
235
3
414
3
619
1
414
3
653
9
834
7
568
8
104
90
739
8
-
894
9
630
9
342
2
450
4
-
476
465
2
474
6
429
2
592
3
566
1
-
674
6
531
4
501
5
568
7
450
8
-
320
3
-
846
506
3
349
5
332
4
369
1
387
2
-
430
4
393
6
353
7
446
2
406
8
335
2
339
1
-
102
9
497
2
261
8
269
1
431
4
294
1
-
351
6
277
3
-
336
5
315
5
248
3
392
8
149
7
144
9
462
3
270
5
331
3
273
4
276
0
106
6
391
7
326
2
-
368
6
625
3
875
2
101
64
521
2
183
1
380
4
556
2
544
1
558
2
102
24
104
33
156
44
128
73
146
62
137
71
109
14
183
70
201
80
896
7
190
1
457
7
581
2
583
5
815
4
135
00
126
41
239
94
208
15
158
51
221
86
121
35
192
46
218
43
848
0
205
2
448
5
509
4
582
0
704
5
177
01
613
1
244
01
215
80
136
87
230
54
964
2
201
52
122
30
725
5
120
6
435
4
454
7
481
2
111
37
147
45
537
3
175
53
162
86
111
21
170
08
583
8
132
10
866
2
513
1
112
5
511
3
507
5
511
8
879
4
120
22
502
1
135
53
116
39
994
7
120
45
410
5
792
1
674
8
326
3
177
6
385
0
408
5
335
9
497
2
594
2
429
9
673
2
547
5
540
8
559
4
Gay
a
Muz
affa
rpur
Pat
na
Bho
pal
Satn
a
Alw
ar
Ajm
er
Ud
aip
ur
Ag
ra
Bul
and
shah
r
Hap
ur
Gha
ziab
ad
Gre
ater
Noi
da
Mee
rut
Noi
da
Sour
ce C
onti
nuou
s am
bien
t air
qua
lity
mon
itor
ing
stat
ion
(Mar
ch 2
019
ndash M
arch
202
0)
In a rapidly urbanising India it would be imperative for policymakers and practitioners in energy and urban development sector to integrate access to clean cooking energy within the ambit of services for the urban poor
Image CEEW
Are Indiarsquos Urban Poor Using Clean Cooking Fuels Insights from Slums in Six States
COUNCIL ON ENERGY ENVIRONMENT AND WATER (CEEW)
Sanskrit Bhawan A-10 Aruna Asaf Ali Marg Qutab Institutional AreaNew Delhi - 110 067 IndiaT +91 11 4073 3300
infoceewin | ceewin | CEEWIndia
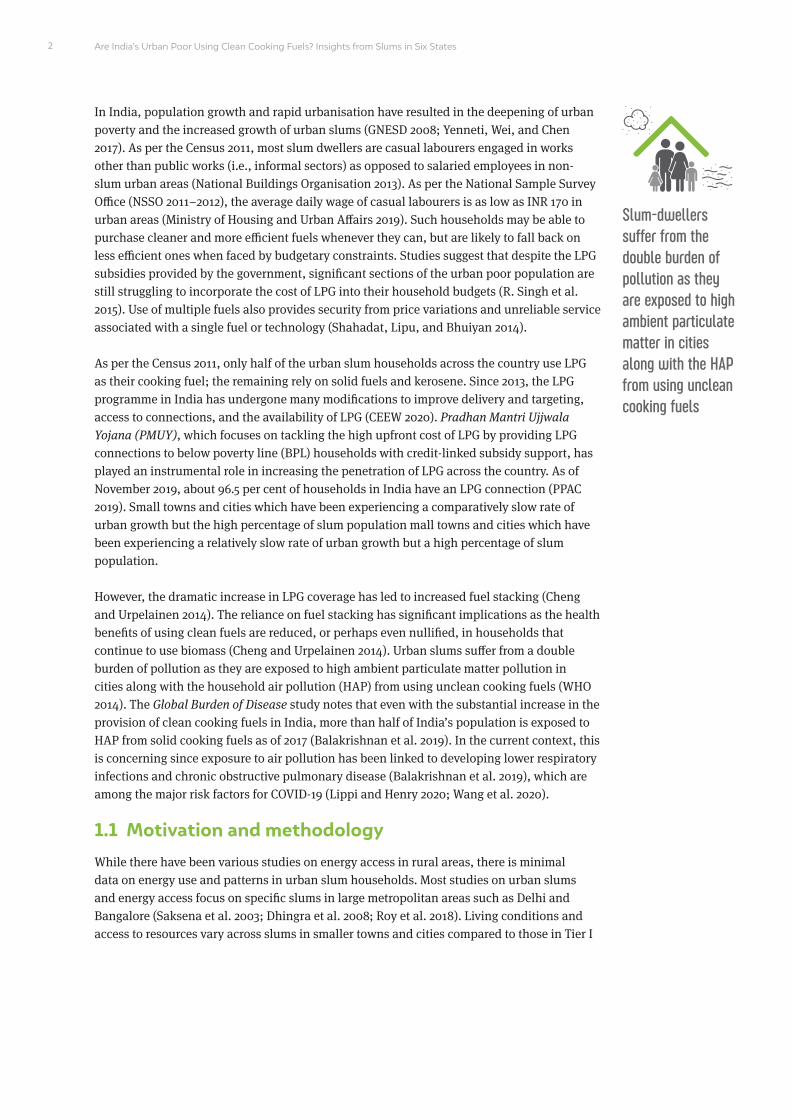
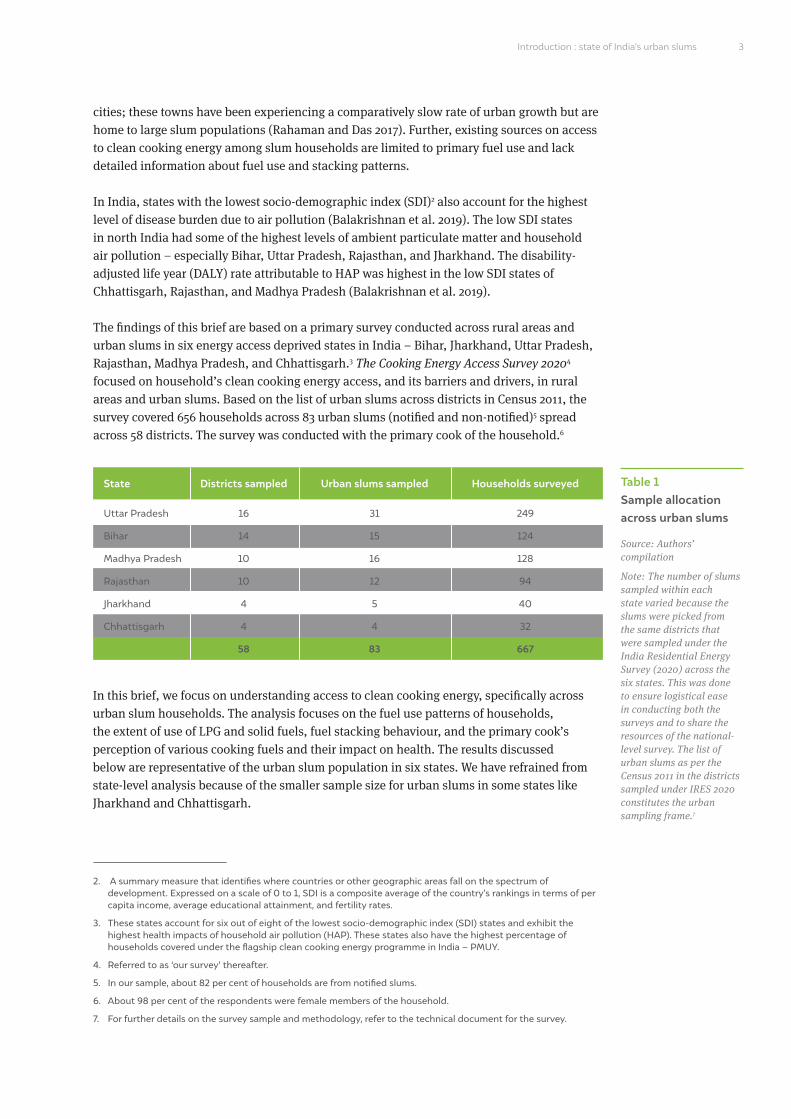
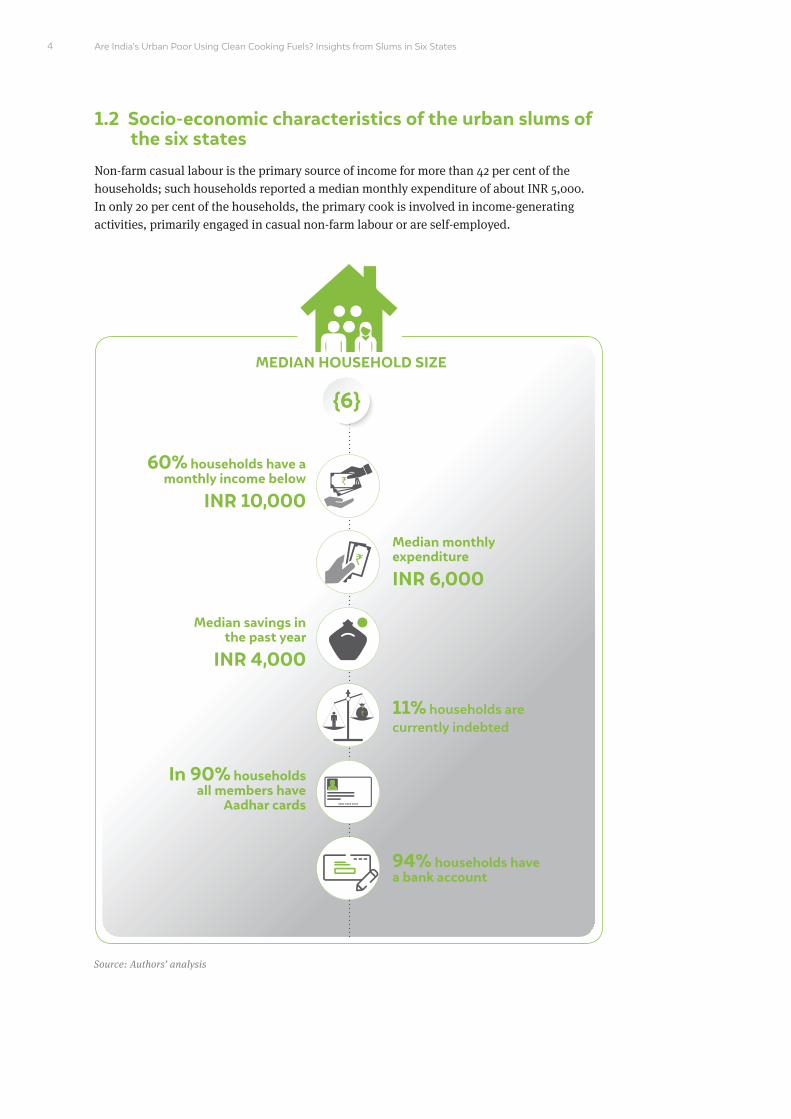
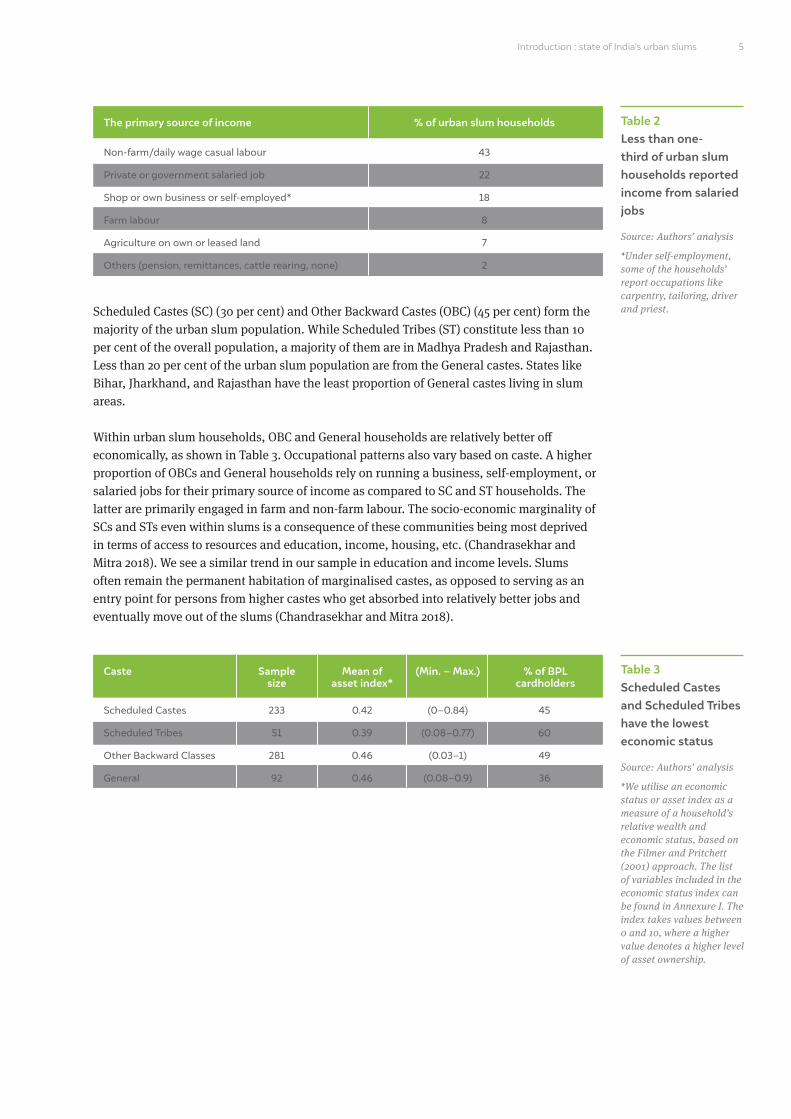
5
Table 2 Less than one-third of urban slum households reported income from salaried jobs
Source Authorsrsquo analysis
Under self-employment some of the householdsrsquo report occupations like carpentry tailoring driver and priest
The primary source of income of urban slum households
Non-farmdaily wage casual labour
Private or government salaried job
Shop or own business or self-employed
Farm labour
Agriculture on own or leased land
Others (pension remittances cattle rearing none)
43
22
18
8
7
2
Scheduled Castes (SC) (30 per cent) and Other Backward Castes (OBC) (45 per cent) form the majority of the urban slum population While Scheduled Tribes (ST) constitute less than 10 per cent of the overall population a majority of them are in Madhya Pradesh and Rajasthan Less than 20 per cent of the urban slum population are from the General castes States like Bihar Jharkhand and Rajasthan have the least proportion of General castes living in slum areas
Within urban slum households OBC and General households are relatively better off economically as shown in Table 3 Occupational patterns also vary based on caste A higher proportion of OBCs and General households rely on running a business self-employment or salaried jobs for their primary source of income as compared to SC and ST households The latter are primarily engaged in farm and non-farm labour The socio-economic marginality of SCs and STs even within slums is a consequence of these communities being most deprived in terms of access to resources and education income housing etc (Chandrasekhar and Mitra 2018) We see a similar trend in our sample in education and income levels Slums often remain the permanent habitation of marginalised castes as opposed to serving as an entry point for persons from higher castes who get absorbed into relatively better jobs and eventually move out of the slums (Chandrasekhar and Mitra 2018)
Table 3 Scheduled Castes and Scheduled Tribes have the lowest economic status
Source Authorsrsquo analysis
We utilise an economic status or asset index as a measure of a householdrsquos relative wealth and economic status based on the Filmer and Pritchett (2001) approach The list of variables included in the economic status index can be found in Annexure I The index takes values between 0 and 10 where a higher value denotes a higher level of asset ownership
Caste Sample size
Mean of asset index
(Min ndash Max) of BPL cardholders
233
51
281
92
042
039
046
046
(0ndash084)
(008ndash077)
(003ndash1)
(008ndash09)
45
60
49
36
Scheduled Castes
Scheduled Tribes
Other Backward Classes
General
Introduction state of Indiarsquos urban slums
Are Indiarsquos Urban Poor Using Clean Cooking Fuels Insights from Slums in Six States652
Image iStock
Exclusive use of LPG is limited to just over half of the total slum households The householdrsquos economic status and its access to doorstep delivery of LPG refills are two critical factors that determine their ability to use LPG exclusively
7
The fuel use patterns in urban slum households across the six states show a significant improvement in LPG use over the past decade when compared with the data from
Census 2011 The share of households using polluting fuels (including firewood dung cake agriculture residue and kerosene) as their primary fuel has decreased significantly but we find that stacking is a common practice even among households using LPG as a primary fuel Unless they use clean fuels exclusively such slum households will still be exposed to the health risks associated with HAP
Across the six states the primary fuel used for cooking by slum households
For the analysis in this brief we have categorised the households into three based on their fuel choices and position on the energy ladder those that exclusively use clean cooking fuels (LPG and electricity) stack LPG with polluting fuels and use only polluting fuels The level of exposure to emissions from cooking increases from the first (least harmful) to the third category (most harmful)
2 Cooking fuel adoption and use in urban slum households
In this brief the use of clean cooking fuels is considered synonymous to use of LPG since other clean fuels comprise a negligible share of use
Source Authorsrsquo analysis
Households using clean fuel exclusivelyWhile the majority of these households use LPG two per cent of the households reported using electricity for cooking purposes
Households stacking LPG with polluting fuelsMost of these households reported using LPG as their primary fuel and polluting fuels as their secondary fuel About four per cent of slum households reported using polluting fuels as their primary fuel and LPG as their secondary fuel
Households using only polluting fuelsThese households only use firewood charcoal dung
agricultural residue kerosene or a stack of these fuels
5533
12
Fuel-use categories
Use of LPG as primary fuel
82 (Cooking Energy Access Survey 2020)
47 (Census 2011)
Polluting fuel as primary fuel
16 (Cooking Energy Access Survey 2020)
52 (Census 2011)
Are Indiarsquos Urban Poor Using Clean Cooking Fuels Insights from Slums in Six States8
In the following sections we explore factors such as socio-economic characteristics affordability and availability of fuel intra-household gender dynamics and fuel perceptions which influence the ability and likelihood of a household to use different fuels
21 Households using LPG as their only fuel In this section we focus on understanding the household characteristics and fuel use patterns of those using LPG exclusively for cooking Most urban slum households with an LPG connection report using LPG as their primary fuel While 55 per cent of the slum households (63 per cent of LPG-using households) use LPG exclusively others stack LPG with polluting fuels Uttar Pradesh has the highest
proportion (70 per cent) of slum households who are exclusive users of clean cooking fuels among the six states
Figure 1 Within slums there are considerable state-level variations in householdsrsquo fuel usage patterns across states
Source Authorsrsquo analysis
Note We have refrained from state-level analysis because of the smaller sample size for urban slums in states like Jharkhand and Chhattisgarh
Figure 2 While the majority of LPG-using households use the fuel primarily only half of them use it exclusively
Source Authorsrsquo analysis
0
0
10
10
20
20
30
30
40
40
50
50
60
60
70
70
80
80
90
90
100
100
8682
55
Bihar
LPG users
Chhattisgarh Jharkhand Madhya Pradesh
LPG as the primary fuel LPG as the exclusive fuel
Rajasthan Uttar Pradesh
States
Per
cent
age
of h
ouse
hold
s P
erce
ntag
e of
hou
seho
lds
Exclusive clean fuel users Stacking LPG with polluting fuels Only polluting fuel users
42
3
30
56
45
39
1611
40
4944
46
10 5
24
71
41
28
9Cooking fuel adoption and use in urban slum households
Over a fifth of households using LPG exclusively are PMUY households which suggests that these households have been able to transition to clean cooking fuels in less than four years PMUY households using LPG exclusively are of a relatively higher economic status than households that stack polluting fuels Unlike in rural areas the age of an LPG connection does not have a direct correlation with per capita LPG consumption in urban slum households suggesting that even households with recent LPG connections in urban slums are likely to use LPG exclusively Households in urban areas have been known to experience a direct transition to exclusive use of clean fuels from using traditional fuels (Kuo and Azam 2019) This could be due to the time-saving that comes with the adoption of clean cooking fuels like LPG ndash where urban households are more willing or need to spend more on convenience than rural households
Figure 3 Most households using LPG exclusively acquire six to eight cylinders per year
Source Authorsrsquo analysis
211 The economic status of the household determines exclusive LPG useA simple logistic regression (Annexure II) shows that households with higher asset ownership have significantly higher odds of using LPG as an exclusive fuel Even between primary and exclusive users of LPG asset ownership remains a significant differentiating factor This corroborates the findings of previous studies (Ranjan and Singh 2017) that state that households tend to switch their cooking fuel use patterns after a threshold level of income is achieved However this is not to suggest that all wealthy households shift to exclusive use of clean fuels We discuss the reasons for stacking among these households in the next section
Cooking energy in the household budget We find that households using LPG as their only fuel pay INR 496 per month8 This effectively translates to an average household spending almost eight per cent of their monthly expenses on cooking fuel
Oil and Marketing Companies (OMCs) are attempting to address the challenges around the recurring refilling
cost by encouraging low-income households to use a 5 kilograms (kg) cylinder to overcome the high upfront cost
associated with 145kg cylinders In our sample we find that only about two per cent of urban slum households use
small cylinders (5kg or 3kg)
BOX 2 Uptake of small cylinders
8 This is based on the upfront cost paid by the household for an LPG refill Given that only 40 per cent of the householdsrsquo report receiving LPG subsidy on refills ndash it has not been considered in the fuel expenditure calculation The share of fuel expenditure for the households receiving LPG subsidies would be accordingly less than the others
0
10
20
30
40
50
60
70
1
1 16 8 9
22
60
4350 50
14
34
15
2 3 4 5 6 7 8 9 10 11 12 13
Number of 14 kg LPG cylinder refills obtained by exclusive LPG users
Per
cent
age
of h
ouse
hold
s us
ing
LP
G e
xclu
sive
ly
households using LPG exclusively Median value
Are Indiarsquos Urban Poor Using Clean Cooking Fuels Insights from Slums in Six States
212 Home delivery for exclusive LPG users We find that households who receive doorstep delivery of LPG refills have higher odds of using LPG as their exclusive fuel Hassle-free doorstep delivery of LPG refills is known to influence the use of LPG as a primary secondary or exclusive fuel (PPAC-CRISIL 2016)
Additional expense on procurement of cylinders Almost half of the households who receive doorstep delivery of LPG pay an additional amount of INR 20 as a delivery charge However in households that do not receive doorstep delivery about 46 per cent report that one member must forgo their daily wages to procure the cylinder Most of such households depend on daily labour or private jobs for their income
Given that almost half of the households report having to forgo wages to procure the cylinders it could affect the householdrsquos ability to use LPG continually It may add to the average delay in the purchase of refills
Procurement of LPG cylinders during the COVID-19 pandemic Most households that do not receive doorstep delivery of LPG (58 per cent) use private vehicles (including motorcycles or bicycles) to transport LPG refills About one-third of the households procuring cylinders on their own use rented or shared vehicles The procurement constraints faced by these households would be further aggravated during the COVID-19 pandemic as using rented or shared vehicles comes with its own risks
10
About 18 per cent of the respondents in our survey reported that they resided in non-notified slums Such slums are not legally recognised as a lsquoslumrsquo by the government which makes the residents more vulnerable to eviction In our data we find that adoption and use of LPG is similar across households from notified and non-notified slums Qualitative interviews and field visits showed that most of the respondents were permanent residents of the slums who have been living there for more than 10 years
About 2 per cent of urban slum households use electricity as a source for cooking energy These households do not rely on any other fuels for cooking or non-cooking purposes They use electric stoves to prepare all meals including cooking roti rice and vegetables These households have been using electricity as their cooking fuel only in the past five years Most households report using either a coiled stove or induction stove Less than one per cent of households use other electric appliances such as hot water kettles and toasters for cooking needs
BOX 3
BOX 4
Status of slums impacting the fuel-use pattern
Electricity for cooking
77
households receiving doorstep delivery of LPG cylinders are exclusive users of the fuel
63LPG-using households receive doorstep delivery of cylinders
Male members have to travel to procure the cylinders in 87 households
11Cooking fuel adoption and use in urban slum households
About 4 per cent of urban slum households in the sample reported stacking with kerosene as their secondary fuel Most of these households are in Uttar Pradesh These households also use kerosene more than once a week for cooking
BOX 5 Use of kerosene as a cooking fuel
22 Households stacking LPG with polluting fuels Across the six states almost half of the households (45 per cent) reported using polluting fuels Here we discuss the characteristics and fuel use patterns of households that stack clean and unclean fuels
Though 86 per cent of the households surveyed have an LPG connection we find that over a third (33 per cent) of them stack it with polluting fuels (including firewood dung cakes agriculture residue charcoal and kerosene) The increased stacking could also be a result of more households adopting LPG since households tend to not replace biomass-based fuels completely (Cheng and Urpelainen 2014) These households would need to transition to exclusive use of clean cooking fuels to reduce the health impacts on women and children from household air pollution
About 44 per cent of the households that are stacking fuels rely on informal sources for refills Such households have not ordered any refills in the past one year from their LPG distributors These households mainly rely on recurring cylinders from their neighbours or relatives9
Figure 4 Of the households that stack fuels most use LPG as their primary fuel
Source Authorsrsquo analysis
9 It is important to note that sharing LPG cylinders among neighbours and extended family is a regular phenomenon in small towns and rural areas owing to availability challenges and it is not necessarily driven by an intention to siphon off subsidy amounts against the commodity ( Jain et al 2018)
Exclusive clean fuel users
Stacking with LPG as the primary fuel
Only polluting fuel users
Stacking LPG with polluting fuels
Stacking with LPG as the secondary fuel
55
3388
12
12
Are Indiarsquos Urban Poor Using Clean Cooking Fuels Insights from Slums in Six States12
221 Household factors that determine the decision to stack fuels Even within the stacking households the reason for stacking multiple fuels varies significantly Primarily households who stack can be divided into two categories ndash those that stack as they cannot afford LPG refills and those that stack due to other factors like taste preferences and alternate end-uses of the fuel
Households who are stacking primarily due to affordability concerns ndash Across asset quintiles we find that stacking is most common among the middle categories (second and third quintile) where most have adopted LPG Still the affordability of the fuel remains a significant concern More than 60 per cent of the households that are stacking fuels collect or prepare firewood or dung cakes free of cost rather than purchasing them from the market Those who buy biomass do not spend more than INR 100 per month on it Based on the responses of the primary cook we note that the high cost of LPG and free-of-cost availability of solid fuels are the most common factors that affect the fuel choices made by the household
Figure 5 Stacking is prevalent in households across asset quintile categories
Source Authorsrsquo analysis
1 2 3 4 5
Asset quintile categories
0
20
40
60
80
100
Per
cent
age
of h
ouse
hold
s
Exclusive clean fuel users Stacking LPG with polluting fuels Only polluting fuel users
5348
52
6367
2441 37
3232
2311 11
51
Households who use LPG primarily and polluting fuels as secondary fuels have a median annual refill rate of
6 cylinders
Households who use polluting fuels primarily and LPG as a secondary fuel have a median annual refill rate of
4 cylinders
13
Households that are stacking for reasons beyond affordability ndash More than one-fourth of the households that are stacking have a median annual refill rate of eight cylinders and above despite having a similar household size as others Most such households fall in the highest asset quintiles This suggests that they are not necessarily using unclean fuels due to the unaffordability of LPG but due to other factors such as taste preference for chulhas and fuel end-uses that influence the householdrsquos decision to use solidpolluting fuels Such households reported using LPG for a median period of six years The solid fuels are primarily used for cooking chapatis or vegetables in these households
Interestingly even households with multiple LPG connections and two cylinder connections report stacking with polluting fuels The possession of multiple LPG connections in these households may not necessarily be an indicator of diversion mdash the average family size of these households is more than eight indicating the high possibility of having separate kitchens within the same household Given that such households have a median annual refill rate of ten cylinders another plausible reason for multiple connections is that it prevents them from relying on just one distributor which increases their chances of getting refills whenever needed
222 End-uses of polluting fuels Across both the groups discussed above half of the households who stack with polluting fuels use these fuels at least once a day (Figure 6) Also almost 45 per cent of the households that stack fuels use multiple stoves at the same time while preparing a single meal This indicates that even if the household is using LPG for a particular meal they would be using their chulha simultaneously
Despite using LPG as the primary fuel for their cooking needs households that are stacking fuels use polluting fuels for non-cooking purposes like heating water for bathing (29 per cent) and space heating (10 per cent)
Figure 6 Almost half of the households using polluting fuels use it every day
Source Authorsrsquo analysis
0 5 10 15 20
19
11
21
20
29
25 30 35
Percentage of households
Freq
uenc
y of
use
of p
ollu
ting
fuel
s Several times a day
Once per day
Few times a week
Once a week
Occasionally
21 households stacking fuels
have more than one LPG connections
25 households stacking fuels have two-cylinder connections
Cooking fuel adoption and use in urban slum households
Are Indiarsquos Urban Poor Using Clean Cooking Fuels Insights from Slums in Six States14
223 Seasonal variations in the stacking of fuels We also noted a significant seasonal change in fuel use patterns LPG is most popular in the rainy season (88 per cent) and least popular in the winter months (45 per cent) (Figure 7) The dampness associated with solid fuels in the rainy season could be the reason for using LPG primarily during these months The literature also suggests that solid fuels are a popular choice during winter months (S Singh 2014 Baqir et al 2019) This could be because during winter months the solid fuel requirement for non-cooking tasks within the household likes water heating for bathing and space heating increases Since households are already using solid fuels for non-cooking tasks they may be using these fuels more for cooking during winter Unfortunately the increased use of solid fuels in winter exacerbates the much higher air pollution exposure of these households due to unfavourable atmospheric conditions
Figure 7 Proportion of urban slum households using solid fuels as the primary cooking fuel increases during the winters months aggravating household air pollution exposure due to unfavourable atmospheric conditions
Source Authorsrsquo analysis
About 3 per cent of urban slum households reported owning an electric water-heating device (geyser or immersion
rod) Similarly only 4 per cent of the households own an electric room heater
BOX 6 Electric devices for water heating and space heating
Summer Winter Rainy Festival0
20
40
60
80
100
120
Per
cent
age
of h
ouse
hold
s
LPG Solid fuel
78
45
88
67
22
55
1233
15
Figure 8 Lack of awareness about receiving LPG refill subsidies poses a threat to the success of LPG subsidy schemes
Source Authorsrsquo analysis
Connections under the Pradhan Mantri Ujjwala Yojana (PMUY) 23 per cent of these households reported receiving benefits under the PMUY
The six states included in the survey account for a significant share of PMUY coverage ndash 54 per cent of all connections provided under PMUY (PPAC 2019) However most of these connections cater to rural households One of the reasons for there being fewer PMUY connections in urban areas is that more than half of all urban slum households reported already having had LPG connections for over four years (before the launch of PMUY) Moreover over a quarter of PMUY households10 in urban slums reported having multiple LPG connections which suggests that not every household which was using LPG before the PMUY was prevented from accessing the schemersquos benefits
Government support during the COVID-19 pandemic During the COVID-19 lockdown the government announced the provision of three free-of-cost refills for PMUY households under the PM-Garib Kalyan Yojana While PMUY households in urban slums benefitted from this scheme non-PMUY households in urban slums did not As documented urban slum households faced a significant economic hit due to the loss of jobs and incomes during the pandemic (Patel 2020) Non-PMUY households that stack for economic reasons are more likely to use cheaper and freely available solid fuels without additional support from the government
PAHAL-Direct Benefit Transfer for LPG (DBTL)Overall about 42 per cent of active LPG users11 reported receiving a subsidy for their last LPG refill under the Direct Benefit Transfer for LPG scheme (DBTL) However about 28 per cent of urban slum households reported not knowing if they had received the subsidy amount for their last refill this suggests that the primary cook is often unaware of whether the subsidy is credited to the household Among the ones that reported receiving the LPG subsidy about 40 per cent of the primary cook were not aware of the amount of subsidy being credited into their account
10 This is a relatively smaller sample of 43 households from all the PMUY households in urban slums (131 households)
11 Households that have taken at least one refill in the past year
42
30
28
Received LPG refill subsidy
30 Still repaying PMUY loan
Did not receive LPG refill subsidy
10 Gave up LPG refill subsidy
Do not know
60 LPG refill susbsidy not received due to other reasons
Cooking fuel adoption and use in urban slum households
Are Indiarsquos Urban Poor Using Clean Cooking Fuels Insights from Slums in Six States16
23 Households using only polluting fuels About 12 per cent of urban slum households rely entirely on polluting fuels for all cooking and non-cooking purposes While the share of these households is relatively small the non-adoption of LPG in such households despite
programmes like the PMUY is concerning These households either use a combination of different polluting fuels (firewood dung cakes agricultural residue charcoal and kerosene) or just one of these fuels for all their energy needs Firewood is the most commonly used fuel in these households
231 Reasons for the non-adoption of LPGHouseholds that rely exclusively on polluting fuels reported not having an LPG connection Though three-fourths of these households were aware of PMUY the high upfront cost of an LPG connection along with the high recurring cost of procuring refills remain the two most important reasons for not procuring an LPG connection Repondents also mentioned a lack of information on how to procure a connection as a reason These reasons align with the common causes cited by rural households covered in the survey implying that the challenges faced by rural households and urban slum households in procuring connections are similar
Almost half of the households in this category use solid fuels for non-cooking purposes such as heating water for bathing space heating and preparing fodder for animals On the positive aspects of using polluting fuels households reported the following free-of-cost easy availability of fuels better tasting food and preference of family members for food cooked on the chulha
232 Fuel availability and affordabilityIn contrast with households that stack fuels households that use only solid fuels rely on purchasing fuels rather than collecting or preparing them For instance 60 per cent of firewood users in this category procure fuel by purchasing rather than collecting it
Households with low asset ownership rely on polluting fuels for cooking These households spend 2ndash3 per cent of their median monthly expenditure on fuel (INR 75 per month on fuel) which is much lower than what they would have to spend if they used LPG exclusively (INR 496 per month) Households that collect solid fuels spend about two hours on a single trip (three times a month) travelling a median one-way distance of 2 km This is equivalent to the distance travelled to procure LPG cylinders (if not delivered at home)
Figure 9 More than half of the households currently without LPG do not know how to get a connection or whom to ask about it implying a lack of awareness
Source Authorsrsquo analysis
0 10 20 30 40 50 60 70
39
53
63
68
80
Percentage of households
Rea
sons
for N
on-A
dop
tion
of L
PG Installation is expensive
Monthly expenditure on LPG is high
Do not know how to get or whom to ask
Not availabletoo far
17
12 See Annexure III for details on the districts and their PM25 concentrations The data for 15 districts (from Bihar Uttar Pradesh Madhya Pradesh and Rajasthan) overlapping with the survey sample have been analysed based on the availability of air quality data from continuous monitoring stations
13 Air quality categories based on PM25 concentration (in μgm3)
Good 0 to 30 Satisfactory 31 to 60 Moderately polluted 61 to 90 Poor 91 to 120 Very poor 121 to 250 Severe above 250 (Central Pollution Control Board 2014)
Cooking fuel adoption and use in urban slum households
Winter months have the highest PM25 concentrations coinciding with the sharp increase in use of polluting fuels for heating bath water and room heating
233 Gendered time use in households using solid fuelsIn urban slums both the male and female members of the household are equally involved in collecting firewood Still it is primarily the female members of the household who undertake dung cake preparation In addition to engaging in fuel collection and preparation women tend to spend more time cooking in households using solid fuels About 85 per cent of households that transitioned to LPG in the past four years reported having saved time while cooking compared to when they used solid fuels
SPOTLIGHT I Household air pollution (HAP) in urban slums
Burning solid fuels in three-stone fires and mud stoves with inadequate ventilation causes high levels of smoke exposure and negative health impacts particularly for women and young children (WHO 2014)
The double burden of ambient and household air pollution on the urban slum populationUsing the PM25 data from continuous ambient air quality monitoring stations (CAAQMS) for 15 districts12 in our sample we found that the ambient air quality remained in the lsquopoorrsquo or worse category13 for most districts throughout the year variation in the ambient air quality
Are Indiarsquos Urban Poor Using Clean Cooking Fuels Insights from Slums in Six States
Impact of ventilation
Indoor cooking and low adoption of chimney indicates high exposure to pollution from the use of unclean fuels for cooking The proportion of households with a chimney is high (52 per cent) among those who rely only on polluting fuels Smith and Pillarisetti (2017) explain that while having a good chimney lowers peak levels of indoor pollution long-term average exposure is reduced only by a factor of two Besides chimneys require regular maintenance to function correctly While more than 45 per cent of the households are using polluting fuels less than 20 per cent of the slum housheolds use improved cookstoves
Households also use solid fuels for non-cooking uses like space heating On average each house in a slum has two rooms this effectively exposes all members of the household to emissions from burning fuels Emissions from household sources contribute significantly to the surrounding air quality (Harish et al 2019) this concern is exacerbated in congested slum areas
the winter months (November to February) have the highest concentration of PM25 This leads to a double burden of exposure for slum households stacking solid fuels as they are more likely to increase use of solid fuels in winters (Figure 7) Alternatively the use of LPG as the primary source of fuel increases during the rainy season (June to September) these months record the least ambient air pollution
We also find that districts like Meerut Ghaziabad Patna Gautam Buddha Nagar (Noida and Greater Noida) and Muzaffarpur have the highest frequency of lsquovery poorrsquo air quality days throughout the year Across these districts one-third of households use polluting fuels for cooking In urban slums where households are more densely packed the emissions from burning solid fuels increase the risk of exposure inside households and deteriorate the ambient air quality for the community at large As a result these communities suffer from both increased household and ambient air pollution HAP has an estimated average contribution of 30ndash50 per cent to ambient air quality across Indiarsquos urban and rural areas (Balakrishnan et al 2019) Addressing biomass burning for cooking water heating and space heating during the winters has the potential to help reach the national ambient air quality standards (Chowdhury et al 2019) Despite that only 2 per cent of the action points in 44 city clean air plans mention cooking and heating as a sector to address air pollution (Ganguly Selvaraj and Guttikunda 2020)
18
75 householdsrsquo
using polluting fuels cook inside
the main house
67 householdsrsquo using polluting fuels do not have a chimney for ventilation
Awareness about the health impacts of using polluting fuelsAbout 60 per cent of households using only polluting fuels and 84 per cent of households that stack LPG with a polluting fuel report lsquotoo smokyrsquo as the most prominent negative aspect of using polluting fuels This suggests that as more households switch to clean cooking fuels perceptions regarding pollution fuels change
Three-fourths of primary cooks who use polluting fuels for cooking agree that smoke from solid fuels is harmful to them this implies that awareness of the adverse health impacts of polluting fuels does not necessarily lead to the uptake of clean fuels Primary cooks also agree that smoke from solid fuels causes coughing (49 per cent) and lung infections in children (39 per cent)
Exposure to air pollution is a known risk factor for underlying chronic diseases that predict the severity of
COVID-19 disease and patient outcomes (World Bank 2020) This linkage suggests a heightened risk for women
in all age groups who cook using traditional technologies and fuels (World Bank 2020) The highest number of
COVID-19 cases were recorded in the most polluted regions among patients with pre-existing health conditions
(Frontera et al 2020)
Results from a controlled study show a higher prevalence of chronic obstructive pulmonary disease (COPD)
among biomass fuel users than clean fuel users ( Johnson et al 2011) The available clinical data to date suggest
that cardiovascular disease diabetes chronic respiratory illness and hypertension ndash conditions all strongly
associated with exposure to HAP ndash are also risk factors for COVID-19 (World Bank 2020)
BOX 7 Impact of household air pollution on COVID-19
19Cooking fuel adoption and use in urban slum households
Are Indiarsquos Urban Poor Using Clean Cooking Fuels Insights from Slums in Six States
Traditionally women bear a disproportionate burden in collecting and preparing biomass for cooking While this burden reduces with the use of clean cooking fuels like LPG the fuel supply within the household is then determined by formal and monetised distribution networks involving an outlay of money (Patnaik and Jha 2020) Our data shows that womenrsquos status in the household (as heads of households)14 positively correlates with households using LPG as their primary fuel The existing literature also supports the idea that female-headed households prefer modern fuels to polluting ones (Farsi Filippini and Pachauri 2007 Rao and Reddy 2007 Kuo and Azam 2019) Other research also suggests that female-headed households are more willing to spend on LPG as a recurring expense (Kojima Bacon and Zhou 2011 Kuo and Azam 2019)
SPOTLIGHT II Womenrsquos participation in intra-household decision-making regarding LPG use
20
14 In almost half of the households surveyed the primary cook reported a female member being the head of the household The reason behind such high percentage of female-headed households could be because only the primary cook of every household (who is mostly female) was surveyed This does not mean that these households do not have any adult male members Traditionally headship refers to the head of household as the individual whose lsquoauthorityrsquo the household members recognise But this definition overlooks potential intra-household variations in the recognised authority in different realms of decision-making (Kilic Moylan and Koolwal 2020) Since cooking is a gendered activity the primary cookrsquos response to the head of household question may have been with respect to the recognised authority figure for that activity within the household
30 householdsrsquo female members place the order for LPG refills
50householdsrsquo female
members decide whether or when to purchase LPG refills
We also find that the decision of whether or when to purchase LPG refills is made by male members in half of urban slum households This holds for both male- and female-headed households In LPG-using households where the primary cook is involved in an income-generating activity more women are deciding to order the refills This pattern is similar irrespective of whether the household uses LPG exclusively or stacks it with other polluting fuels or are PMUY beneficiaries
SPOTLIGHT III A comparison of access to clean cooking energy between urban slum and non-slum households across six states
21
At the state level Bihar has significantly poor involvement of women in intra-household decision-making regarding
ordering refills with less than 10 per cent of households reporting that women decide whether or when to order
refills However more women than men are involved in decisions around LPG refills in Rajasthan Madhya Pradesh
and Jharkhand
Across caste groups the involvement of women is lowest (37 per cent) among the Scheduled Castes (SCs)
However more women in General and OBC households decide when to order LPG refills
BOX 8 Variations in intra-household decision-making across states and caste groups
Cooking fuel adoption and use in urban slum households
To compare the fuel use patterns of urban slum and non-slum households we used data from the India Residential Energy Survey (IRES 2020)15 The overlap in the sampling strategies of both IRES and our survey enabled a comparison of the findings There is a significant difference in the socio-economic status of slum and non-slum households which tends to affect their fuel use patterns Table 4 provides a comparison of cooking fuel usage in urban non-slum households (from IRES 2020) and urban slum households (Cooking Energy Access and Use survey 2020)
Are Indiarsquos Urban Poor Using Clean Cooking Fuels Insights from Slums in Six States22
Table 4 The poor economic condition of households in urban slums impacts the exclusive use of clean fuels for cooking
Source Authorsrsquo analysis
Fuel use categories Urban slum households (Cooking Energy Access Survey) ()
Non-slum urban households (IRES) ()
95 88
84 55
9 33
5 12
Clean fuel users (LPG PNG and electricity)
LPG as an exclusive fuel
Households that stack LPG with polluting fuels
Households that use only polluting fuels
We observed a significant gap in the exclusive use of LPG as a cooking fuel between urban slums and non-slum households explained mainly by the difference in their economic conditions Stacking is three times more common in slum households than non-slum households About 45 per cent of non-slum households using polluting fuels belong to marginalised social groups (SCs and STs) Households using polluting fuels have a lower median monthly expenditure than others and about 62 per cent of such households are semi-pucca or kuchha structures Among LPG users non-slum households have a slightly higher rate of doorstep delivery as compared to slum households
LPG-using households receiving home deliveries
Source Authorsrsquo analysis
239
6372
Urban slum households (Cooking Energy Access and Use)
()
Non-slum urban households (IRES)
()
Proportion of PMUY beneficiaries among LPG-using households
15 IRES 2020 was conducted in 21 large states of India including Bihar Jharkhand Rajasthan Madhya Pradesh Uttar Pradesh and Chhattisgarh While IRES 2020 focused on urban households the Cooking Energy Access and Use survey specifically attended to urban slums in the same districts Refer to the technical note for a detailed methodology of the survey
23
3 Way forward
Slums across the world are chronically ignored in public policy and suffer because of unauthorised and unsafe habitation without access to government services (Shahadat
Lipu and Bhuiyan 2014) In terms of energy access while we see a progressive change in householdsrsquo energy use patterns as we move from rural to urban issues like affordability availability preference and familiarity with the fuel and stove remain essential factors that determine householdsrsquo fuel choice
Image iStock
Are Indiarsquos Urban Poor Using Clean Cooking Fuels Insights from Slums in Six States24
Understanding categories of users is important for enabling access to and use of clean cooking fuels
We categorised the urban slum population based on their fuel usage patterns ndash using only clean fuels stacking clean fuels with polluting fuels and using only polluting fuels While most households in urban slums have an LPG connection only half of them use LPG exclusively The householdrsquos economic status and its access to doorstep delivery of LPG refills are two crucial factors that determine its ability to use LPG exclusively Despite being situated in urban areas 37 per cent of slum households do not receive home delivery of cylinders ndash availability is an essential factor in determining the householdrsquos likelihood of using LPG exclusively There is a strong impetus for the OMCs and distributors to improve their home delivery services of LPG refills in slum areas
Stacking is prevalent in about one-third of households ndash there is a need for a deeper understanding of householdsrsquo preferences fuel end-uses and awareness Most households reported using polluting fuels daily or at least weekly this effectively increases their exposure to household air pollution despite having access to clean cooking fuels Among households that stack LPG with polluting fuels the reasons for stacking differ ndash affordability seasonality and taste preference More than a quarter of households that stack have a similar level of LPG consumption as those that use LPG exclusively despite similar family sizes Such households use polluting fuels not because of their inability to afford LPG But other factors like free-of-cost availability of biomass taste preference for chulha and alternate end-uses of fuelmdashfor instance in space heatingmdashinfluence the householdrsquos decision to use solid fuels Among households that stack multiple fuels the use of polluting fuels increases during winter months this exposes the households to a double burden of high ambient and household air pollution in these months About 40 per cent of these households also use polluting fuels for non-cooking purposes like heating water for bathing and space heating especially in winter
Even with large-scale government initiatives like PMUY we find that more than 10 per cent of urban slum households do not use LPG They mainly rely on free-of-cost biomass for their cooking and non-cooking needs Despite awareness of PMUY among these households the high upfront cost of procuring an LPG connection and high recurring expenditure on refills deter them from using LPG Evidently there is a need to expand the reach of PMUY to cover households across slums
Integrating the issue of lack of access to clean cooking energy within the discussion on urban poverty
This study reiterates the need to look at poverty in urban areas in the context of energy access Given the heterogeneity of poverty in urban and semi-urban India it is essential to understand energy poverty in the context of access to resources for an enhanced quality of life for the urban poor Similarly slums dwellers in large and small cities alike may experience additional challenges of access Furthermore not all urban poor live in slums we know even less about the access issues of temporary residents or seasonal migrants in urban India Therefore in a rapidly urbanising India studies on the urban poor and air quality need to integrate a focus on energy access to address the vulnerability of women children and communities to HAP and the drudgery of using polluting fuels for cooking and other household energy needs
Access to clean cooking energy schemes must be integrated into the social assistance programmes focused on urban poverty alleviation to enhance its reach
25Way forward
Converging energy access in social protection policies for the urban poor
Accounting for the vulnerabilities of the urban poor is crucial in designing and implementing policies including social protection schemes As a health and economic imperative access to clean cooking energy schemes must be integrated into the social assistance programmes of other ministries (eg health education and nutrition assistance) to offer better support to slum households This would also reduce the burden on households of claiming and accessing multiple benefits across schemes thus freeing them to invest more time in productive activities (CEEW 2020) Government programmes such as the National Urban Livelihoods Mission and social service allocations for housing should use existing targeting approaches to include access to clean cooking energy within the ambit of services for the poor
Bringing a renewed emphasis on clean cooking energy access due to COVID-19 is essential
Most households in urban slums rely on daily wage labour or the gig economy for their household income During the COVID-19 pandemic these occupations have been among the worst impacted by the lockdown and the economic slowdown A survey conducted with over 2000 daily wage workers in urban slums during the lockdown suggests that only 7 per cent of respondents from this group received pay during the lockdown (Basu 2020) causing a massive shock to their livelihoods and wage earnings This kind of impact pushes households into energy poverty leading to the increased use of free-of-cost biomass and consequently increasing the risk of exposure to emissions from fuel burning While the government has committed to supplying up to three free refills to all PMUY households under PM-Garib Kalyan Yojana less than a quarter of households in urban slums have Ujjwala connections The low share of PMUY households effectively makes the majority of slum households ineligible for relief support given under the PM-Garib Kalyan Yojana during the lockdown There is a need to target vulnerable households ndash beyond PMUY beneficiaries ndash with differential subsidy support for using LPG in a sustained manner
Increased poverty would mean increased use of polluting fuels ndash there is a need for a renewed emphasis on clean cooking energy access during the COVID-19 pandemic as increased use of polluting fuels has health implications (lower respiratory infections and COPD) that increase the risk of COVID-19 infections being more severe
There is a need to target vulnerable households ndash beyond PMUY beneficiaries ndash with differential subsidy support for using LPG in a sustained manner
Are Indiarsquos Urban Poor Using Clean Cooking Fuels Insights from Slums in Six States
Balakrishnan Kalpana Sagnik Dey Tarun Gupta R S Dhaliwal Michael Brauer Aaron J Cohen Jeffrey D Stanaway et al 2019 ldquoThe Impact of Air Pollution on Deaths Disease Burden and Life Expectancy Across the States of India The Global Burden of Disease Study 2017rdquo The Lancet Planetary Health 3 (1) e26ndash39 httpsdoiorg101016S2542-5196(18)30261-4
Baqir M S K Bharti R Kothari and R P Singh 2019 ldquoAssessment of an Energy-efficient Metal Chulha for Solid Biomass Fuel and Evaluation of its Performancerdquo International Journal of Environmental Science and Technology 16 (11) 6773ndash6784 httpsdoiorg101007s13762-018-2028-9
Basu Anika Badyal 2020 ldquoLockdown Survey How The Covid-19 Crisis Has Affected Daily Wage WorkersmdashAIFrdquo American India Foundation June 28 httpsaiforglockdown-survey-how-the-covid-19-crisis-has-affected-daily-wage-workers
Butera F M P Caputo R Adhikari and A Facchini 2016 ldquoThe Challenge of Energy in Informal Settlements A Review of the Literature for Latin America and Africardquo Procedia Engineering 1ndash32 httpswwwenelfoundationorgcontentdamenel-foundtopic-downloadThe challenge of Energy in Informal settlementspdf
CEEW 2020 ldquoEnergy Safety Nets India Case Studyrdquo Vienna Sustainable Energy for All httpswwwceewinpublicationsenergy-safety-nets-india-case-study
Central Pollution Control Board 2014 ldquoNational Air Quality Indexrdquo New Delhi Central Pollution Control Board httpsappcpcbccrcomccr_docsFINAL-REPORT_AQI_pdf
Chafe Z S Mehta and K R Smith 2011 ldquoAmbient Fine Particulate (PM25) Air Pollution Attributable to Household Cooking Fuel in Asiardquo AGUFM A54Bndash03 httpsuiadsabsharvardeduabs2011AGUFMA54B03Cabstract
Chandramouli C 2010 ldquoCensus of India 2011 ndash Circular No 8rdquo New Delhi Ministry of Home Affairs httpscensusindiagovin2011-CircularsCircularsCircular-08pdf
Chandrasekhar S and Arup Mitra 2018 ldquoMigration Caste and Livelihood Evidence from Indian City-slumsrdquo Urban Research amp Practice 12 (2) 156ndash172 httpsdoiorg1010801753506920181426781
Cheng Chao Yo and Johannes Urpelainen 2014 ldquoFuel Stacking in India Changes in the Cooking and Lighting Mix 1987ndash2010rdquo Energy 76 (November) 306ndash317 httpsdoiorg101016jenergy201408023
Chowdhary Sourangsu Sagnik Dey Sarath Guttikunda Ajay Pillarisetti Kirk R Smith and Larry Di Girolamo 2019 ldquoIndian annual ambient air quality standard is achievable by completely mitigating emissions from household sourcesrdquo Proceedings of the National Academy of Sciences 116 (22) 10711-10716 httpsdoiorg101073pnas1900888116
Dhingra Chhavi Shikha Gandhi Akanksha Chaurey and P K Agarwal 2008 ldquoAccess to Clean Energy Services for the Urban and Peri-Urban Poor A Case-study of Delhi Indiardquo Energy for Sustainable Development 12 (4) 49ndash55 httpsdoiorg101016S0973-0826(09)60007-7
Farsi Mehdi Massimo Filippini and Shonali Pachauri 2007 ldquoFuel Choices in Urban Indian Householdsrdquo Environment and Development Economics 12 (6) 757ndash774 httpsdoiorg101017S1355770X07003932
References
26
Frontera Antonio Lorenzo Cianfanelli Konstantinos Vlachos Giovanni Landoni and George Cremona 2020 ldquoSevere Air Pollution Links to Higher Mortality in COVID-19 Patients The lsquoDouble-Hitrsquo Hypothesisrdquo Journal of Infection 81 (2) 255ndash259 httpsdoiorg101016jjinf202005031
Ganguly Tanushree Kurinj L Selvaraj Sarath K Guttikunda 2020 ldquoNational Clean Air Programme (NCAP) for Indian cities Review and outlook of clean air action plansrdquo Atmospheric Environment X Vol 8 httpsdoiorg101016jaeaoa2020100096
GNESD 2008 ldquoClean Energy for the Urban Poor An Urgent Issuerdquo Accessed 25 July 2020 httpswwwgooglecomurlsa=tamprct=jampq=ampesrc=sampsource=webampcd=ampved=2ahUKEwi1hf2ru dntAhUCOisKHQH7BtsQFjAAegQIAxACampurl=http3A2F2Fwwwgnesdorg2F-2Fmedia2FSites2FGNESD2FPublication- pdfs2FSPM_CleanEnergyashx3Fla3Dda26hash3DE4971C585B6798F17954F8B42E073 D9507F42A84ampusg=AOvVaw08kCDgOkTkYc6wRDxzsNyq
Guan Wei-Jie Wen-Hua Liang Yi Zhao Heng-Rui Liang Zi-Sheng Chen Yi-Min Li Xiao-Qing Liu et al 2020 ldquoComorbidity and its Impact on 1590 Patients with COVID-19 in China A Nationwide Analysisrdquo European Respiratory Journal 55 (5) 2000547 httpsdoiorg1011831399300300547-2020
Harish Santosh Kirk R Smith Sourangsu Chowdhury Zoe A Chafe Ajay Pillarisetti Jos Lelieveld Sarath Guttikunda Sagnik Dey and Andrew P Grieshop 2019 ldquoThe Contribution of Household Fuels to Ambient Air Pollution in India A Comparison of Recent Estimates Edited by CcapcOrgInrdquo Collaborative Clean Air Policy Centre May 30 httpsccapcorginpolicy-briefs2019530the-contribution-of-household-fuels-to-ambient-air-pollution-in-india-a-comparison-of-recent-estimates
Jain Abhishek Saurabh Tripathi Sunil Mani Sasmita Patnaik Tauseef Shahidi and Karthik Ganesan 2018 ldquoAccess to Clean Cooking Energy and Electricity Survey of States 2018rdquo New Delhi CEEW httpswwwceewinsitesdefaultfilesCEEW-Access-to-Clean-Cooking-Energy-and-Electricity-11Jan19_0pdf
Johnson Priscilla Kalpana Balakrishnan Padmavathi Ramaswamy Santu Ghosh Muthukumar Sadhasivam Omprakash Abirami Bernard W C Sathiasekaran Kirk R Smith Vijayalakshmi Thanasekaraan and Arcot S Subhashini 2011 ldquoPrevalence of Chronic Obstructive Pulmonary Disease in Rural Women of Tamilnadu Implications for Refining Disease Burden Assessments Attributable to Household Biomass Combustionrdquo Global Health Action 4 (1) 7226 httpsdoiorg103402ghav4i07226
Kilic Talip Heather Moylan and Gayatri Koolwal 2020 ldquoGetting the (Gender-disaggregated) Lay of the Land Impact of Survey Respondent Selection on Measuring Land Ownership and Rightsrdquo Washington DC The World Bank httpsdoiorg1015961813-9450-9151
Kojima Masami Robert Bacon and Xin Zhou 2011 ldquoWho Uses Bottled Gas Evidence from Households in Developing Countriesrdquo The World Bank Sustainable Energy Department Oil Gas and Mining Unit httpelibraryworldbankorgdoibook1015961813-9450-5731
Kuo Ying-Min and Mehtabul Azam 2019 ldquoHousehold Cooking Fuel Choice in India 2004ndash2012 A Panel Multinomial Analysisrdquo IZA Discussion Paper No 12682 httpsssrncomabstract=3468630
Lippi Giuseppe and Brandon Michael Henry 2020 ldquoChronic Obstructive Pulmonary Disease Is Associated with Severe Coronavirus Disease 2019 (COVID-19) COPD and COVID-19rdquo Respiratory Medicine 167 105941 httpsdoiorg101016jrmed2020105941
Ministry of Housing and Urban Affairs 2019 ldquoHandbook of Urban Statisticsrdquo New Delhi Government of India httpmohuagovinpdf5c80e2225a124Handbook of Urban Statistics 2019pdf
Rao M Narasimha and B Sudhakara Reddy 2007 ldquoVariations in Energy Use by Indian Households An Analysis of Micro Level Datardquo Energy 32 (2) 143ndash153 httpsdoiorg101016jenergy200603012
27References
Are Indiarsquos Urban Poor Using Clean Cooking Fuels Insights from Slums in Six States28
National Buildings Organisation 2013 ldquoState of Slums in India a Statistical Compendium 2013rdquo New Delhi Government of India httpnbonicinpdfSlums_in_India_Compendium_English_Versionpdf
National Sample Survey Office 2012 ldquoKey Indicators of Urban Slums in India ndash 69th Roundrdquo New Delhi National Data Bank for Socio-religious Categories httpmospinicinsitesdefaultfilesnational_data_bankndb-rpts-69htm
Nolan Laura B 2015 ldquoSlum Definitions in Urban India Implications for the Measurement of Health Inequalitiesrdquo Population and Development Review 41 (1) 59ndash84 httpsideasrepecorgablapopdevv41y2015i1p59-84html
Nolan Laura B David E Bloom and Ramnath Subbaraman 2018 ldquoLegal Status and Deprivation in Urban Slums Over Two Decadesrdquo HHS Public Access 53 (15) 47ndash55
Patel Amit 2020 ldquoPreventing COVID-19 Amid Public Health and Urban Planning Failures in Slums of Indian Citiesrdquo World Medical amp Health Policy 12 (3) httpsdoiorg101002wmh3351
Patnaik Sasmita and Shaily Jha 2020 ldquoCaste Class and Gender in Determining Access to Energy A Critical Review of LPG Adoption in Indiardquo Energy Research amp Social Science 67 (September) 101530 httpsdoiorg101016jerss2020101530
PPAC-CRISIL 2016 ldquoAssessment Report Primary Survey on Household Cooking Fuel Usage and Willingness to Convert to LPGrdquo New Delhi Petroleum Planning amp Analysis Cell Ministry of Petroleum and Natural Gas Government of India httpswwwppacgovinWriteReadDataReports201710310449342512219PrimarySurveyReportPPACpdf
PPAC 2019 ldquoOil Industry Information at a Glancerdquo New Delhi Ministry of Petroleum and Natural Gas Government of India httpswwwppacgovinWriteReadDataReports201912060336500305462ReadyReckonerNov2019WebVersionpdf
Rahaman Mehebub and Dipendra Nath Das 2017 ldquoNature of Slum Growth in Indian Citiesrdquo Urban India 37 (II) 100ndash116 httpswwwresearchgatenetpublication334051882_Nature_of_Slum_Growth_in_Indian_Citiesread
Rains Emily Anirudh Krishna and Erik Wibbels 2018 ldquoUrbanisation and Indiarsquos Slum Continuum Evidence on the Range of Policy Needs and Scope of Mobilityrdquo London International Growth Centre httpswwwtheigcorgwp-contentuploads201802Rains-et-al_Working-paper_coverpdf
Ranjan Rahul and Sudershan Singh 2017 ldquoEnergy Deprivation of Indian Households Evidence from NSSO Datardquo New Delhi Munich Personal RePEc Archive httpsmpraubuni-muenchende835661MPRA_paper_83566pdf
Roy Debraj Bharath Palavalli Niveditha Menon Robin King Karin Pfeffer Michael Lees and Peter M A Sloot 2018 ldquoSurvey-based Socio-economic Data from Slums in Bangalore Indiardquo Nature Publishing Group 5 1ndash9 httpsdoiorg101038sdata2017200
Saksena Sumeet P B Singh Raj Kumar Prasad Rakesh Prasad Preeti Malhotra Veena Joshi and R S Patil 2003 ldquoExposure of Infants to Outdoor and Indoor Air Pollution in Low-income Urban Areas A Case Study of Delhirdquo Journal of Exposure Science amp Environmental Epidemiology 13 219ndash30 httpsdoiorg101038sjjea7500273
Lipu Molla Shahadat Hossain and Arif Waliullah Bhuiyan 2014 ldquoElectricity Access in Urban Slum Households of Bangladesh A Case of Dhakardquo Journal of Renewable and Sustainable Energy 6 (053112) 1ndash15 httpsdoiorg10106314896697
29
Singh Rozita Xiao Wang Emmanuel Ackom and Juan Reyes 2015 ldquoEnergy Access Realities in Urban Poor Communities of Developing Countries Assessments and Recommendationsrdquo Global Network on Energy for Sustainable Development (GNESD) httpswwwgooglecomurlsa=tamprct=jampq=ampesrc=sampsource=webampcd=ampved=2ahUKEwj5nbqI wdntAhXUTX0KHZE6DboQFjAAegQIAhACampurl=https3A2F2Forbitdtudk2Ffiles2F10635 24942FEnergy_access_realities_v_final_updatedpdfampusg=AOvVaw0xNBAAo0bjLueY9FmoigKF
Singh Santosh 2014 ldquoThe Kaleidoscope of Cooking Understanding Cooking Behaviour and Stove Preferences in Rural Indiardquo New Delhi Deutsche Gesellschaft fuumlr Internationale Zusammenarbeit (GIZ) GmbH httpswwwgizdeendownloadsgiz2014-en-kaleidoscope-of-cooking-indiapdf
Smith Kirk R and Ajay Pillarisetti 2017 ldquoHousehold Air Pollution from Solid Cookfuels and its Effects on Healthrdquo Disease Control Priorities 7 (3) 133ndash52 httpsdoiorg101596978-1-4648-0522-6_ch7
UN-Habitat 2003 ldquoThe Challenge of Slums ndash Global Report on Human Settlements 2003rdquo Location of publishing London UN-Habitat httpsunhabitatorgthe-challenge-of-slums-global-report-on-human-settlements-2003
Wang Bolin Ruobao Li Zhong Lu and Yan Huang 2020 ldquoDoes Comorbidity Increase the Risk of Patients with COVID-19 Evidence from Meta-analysisrdquo Aging 12 (7) 6049ndash6057 httpsdoiorg1018632AGING103000
WHO 2014 ldquoWHO Guidelines for Indoor Air Quality Household Fuel Combustionrdquo WHO Accessed 25 July 2020 httpwwwwhointairpollutionguidelineshousehold-fuel-combustionen
World Bank 2020 ldquoThe State of Modern Energy Cooking Servicesrdquo Washington DC World Bank httpdocuments1worldbankorgcurateden937141600195758792pdfThe-State-of-Access-to-Modern-Energy-Cooking-Servicespdf
Yenneti Komali Yehua Dennis Wei and Wen Chen 2017 ldquoThe Urbanization of Poverty in India Spatio-temporal Disparities in Consumption Expendituresrdquo Geographical Review 107 (2) 360ndash383 httpsdoiorg101111j1931-0846201612167x
References
Are Indiarsquos Urban Poor Using Clean Cooking Fuels Insights from Slums in Six States
Annexure 1 Asset ownership index We used Filmer and Pritchettrsquos (2001) proposed approach to construct an asset ownership index using principal component analysis (PCA) We chose the indicators based on data from the Cooking Energy Access survey 2020 The variables we considered for the index were based on classifications by Caroline Moser and Andrew Felton (2007) and K Harttgen (2013) We computed the asset index using housing characteristics and consumer durables as follows
Variables not included in the asset index
Four types of variables were eliminated
1 Variables (such as grid electricity) that had high usage of greater than 95 per cent
2 Those (such as ownership of laptops or computers air conditioners etc) that had a low usage of less than 5 per cent
3 Variables (like house ownership) that have economically fluctuating values
4 Those that indicated a low correlation of less than 20 per cent variation between the top category (ie first) of the asset quintile and the bottom-most category (ie fifth) of the asset quintile
For ease of interpretation we rescaled this index such that the final index values range between 0 and 10 For this purpose we used a feature scaling (or minndashmax scaling) formula
Xnorm (or (IVx)) = (X ndash Xmin)(Xmax ndash Xmin)
where IVx is the normalised index value Xmin is the initial minimum value (-354) and Xmax is the initial maximum value (461) of the asset ownership index
30
Annexures
bull Crowding16 inside the house bull Toilet ownership and usage bull Source of water bull Number of pucca rooms
bull Ownership of two-wheeler bull Ownership of washing machine bull Ownership of television bull Ownership of refrigerator bull Ownership of cooker
16 A household with more than three members occupying a single room is considered crowded (World Health Organization 2018)
Housing characteristics
Consumer durables
Annexure 2 Explaining the use of LPG as the exclusive fuel (simple logistic regression model)
31Annexures
Dependent variable exclusive LPG use
Education of the primary cook (categorical base category is education beyond the school level)
Education of the household head (categorical base category is education beyond the school level)
State (categorical base category includes households from Rajasthan)
P gt z 95 confidence interval
Odds ratio (SE)
1299 (0112)
0659 (0202)
1399 (0394)
0970 (0038)
0994 (0011)
1003 (0013)
2042 (0508)
1011 (0046)
0782 (0441)
1198 (0608)
1377 (0664)
1345 (0566)
3141 (1103)
1213 (0500)
0309 (0211)
1165 (0565)
1703 (0680)
0002
0174
0233
0446
0583
0839
0004
0812
0663
0722
0507
0482
0001
0639
0086
0753
0182
1097
0361
0806
0898
0973
0977
1254
0924
0259
0443
0535
0589
1578
0541
0081
0450
0779
1540
1203
2428
1048
1016
1029
3327
1106
2361
3240
3545
3070
6251
2720
1181
3014
3723
Asset index
Primary cook involved in income-generating activity
Female-headed households
Household size
Age of household head
Age of primary cook
Doorstep delivery of LPG cylinders
PMUY customer
Primary cook is not educated
Primary cook has a school education
Household head is not educated
Household head has a school education
Uttar Pradesh
Bihar
Chhattisgarh
Jharkhand
Madhya Pradesh
Number of households (n) = 417
Log likelihood = -228777
Prob gt chi2 = 0000
Pseudo R2 = 0126
The dependent variable is a dummy variable where households using LPG exclusively are assigned a value of 1 and all other households are assigned the value of 0
The caste of the household has not been factored into the regression as a separate variable because of its underlying influence on economic status
Source Authorsrsquo analysis
Are Indiarsquos Urban Poor Using Clean Cooking Fuels Insights from Slums in Six States
Annexure 3 Air quality (PM25 concentration in μgm3) across 15 districts based on CAAQMS data
32
Dis
tric
tsM
ar-1
9A
pr-1
9M
ay-1
9Ju
n-19
Jul-1
9A
ug-1
9Se
p-19
Oct
-19
Nov
-19
Dec
-19
Jan-
20Fe
b-20
Mar
-20
794
5
988
5
866
7
-
645
329
2
453
7
388
1
769
1
886
4
661
5
950
9
834
4
-
823
4
611
7
569
9
535
7
-
270
4
589
4
571
5
293
1
705
4
839
2
614
9
970
1
826
8
-
844
9
622
1
597
1
564
0
-
235
3
414
3
619
1
414
3
653
9
834
7
568
8
104
90
739
8
-
894
9
630
9
342
2
450
4
-
476
465
2
474
6
429
2
592
3
566
1
-
674
6
531
4
501
5
568
7
450
8
-
320
3
-
846
506
3
349
5
332
4
369
1
387
2
-
430
4
393
6
353
7
446
2
406
8
335
2
339
1
-
102
9
497
2
261
8
269
1
431
4
294
1
-
351
6
277
3
-
336
5
315
5
248
3
392
8
149
7
144
9
462
3
270
5
331
3
273
4
276
0
106
6
391
7
326
2
-
368
6
625
3
875
2
101
64
521
2
183
1
380
4
556
2
544
1
558
2
102
24
104
33
156
44
128
73
146
62
137
71
109
14
183
70
201
80
896
7
190
1
457
7
581
2
583
5
815
4
135
00
126
41
239
94
208
15
158
51
221
86
121
35
192
46
218
43
848
0
205
2
448
5
509
4
582
0
704
5
177
01
613
1
244
01
215
80
136
87
230
54
964
2
201
52
122
30
725
5
120
6
435
4
454
7
481
2
111
37
147
45
537
3
175
53
162
86
111
21
170
08
583
8
132
10
866
2
513
1
112
5
511
3
507
5
511
8
879
4
120
22
502
1
135
53
116
39
994
7
120
45
410
5
792
1
674
8
326
3
177
6
385
0
408
5
335
9
497
2
594
2
429
9
673
2
547
5
540
8
559
4
Gay
a
Muz
affa
rpur
Pat
na
Bho
pal
Satn
a
Alw
ar
Ajm
er
Ud
aip
ur
Ag
ra
Bul
and
shah
r
Hap
ur
Gha
ziab
ad
Gre
ater
Noi
da
Mee
rut
Noi
da
Sour
ce C
onti
nuou
s am
bien
t air
qua
lity
mon
itor
ing
stat
ion
(Mar
ch 2
019
ndash M
arch
202
0)
In a rapidly urbanising India it would be imperative for policymakers and practitioners in energy and urban development sector to integrate access to clean cooking energy within the ambit of services for the urban poor
Image CEEW
Are Indiarsquos Urban Poor Using Clean Cooking Fuels Insights from Slums in Six States
COUNCIL ON ENERGY ENVIRONMENT AND WATER (CEEW)
Sanskrit Bhawan A-10 Aruna Asaf Ali Marg Qutab Institutional AreaNew Delhi - 110 067 IndiaT +91 11 4073 3300
infoceewin | ceewin | CEEWIndia
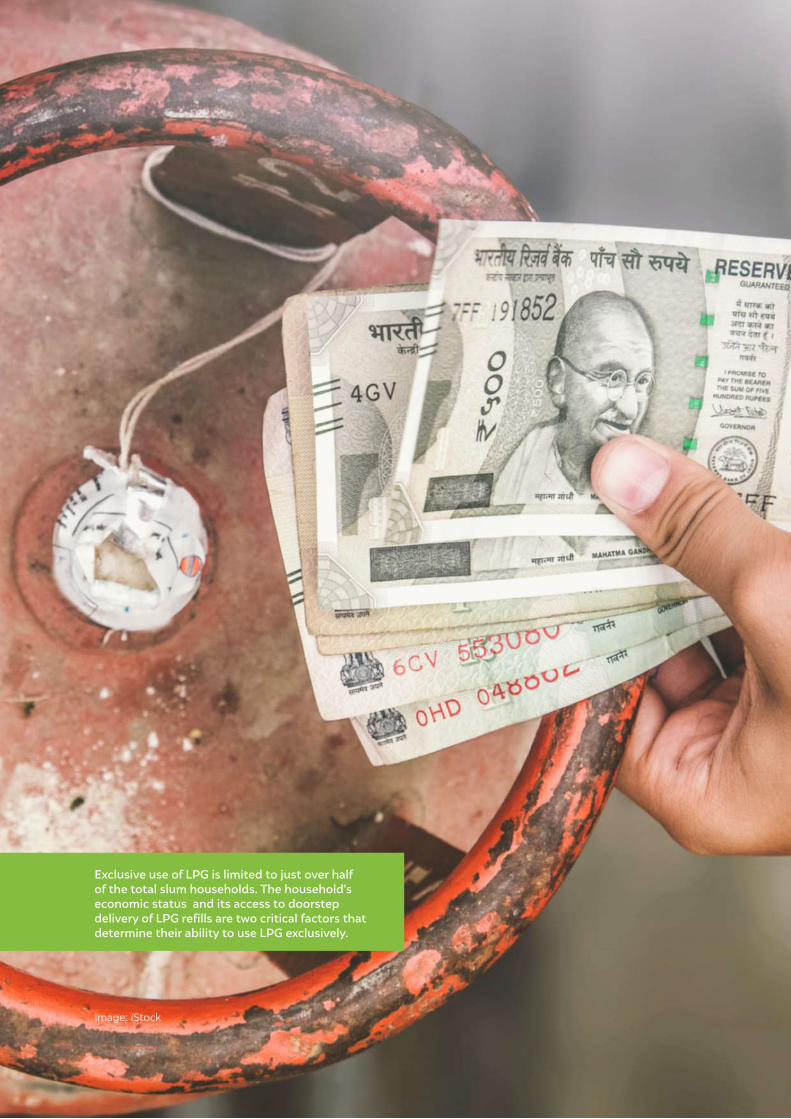
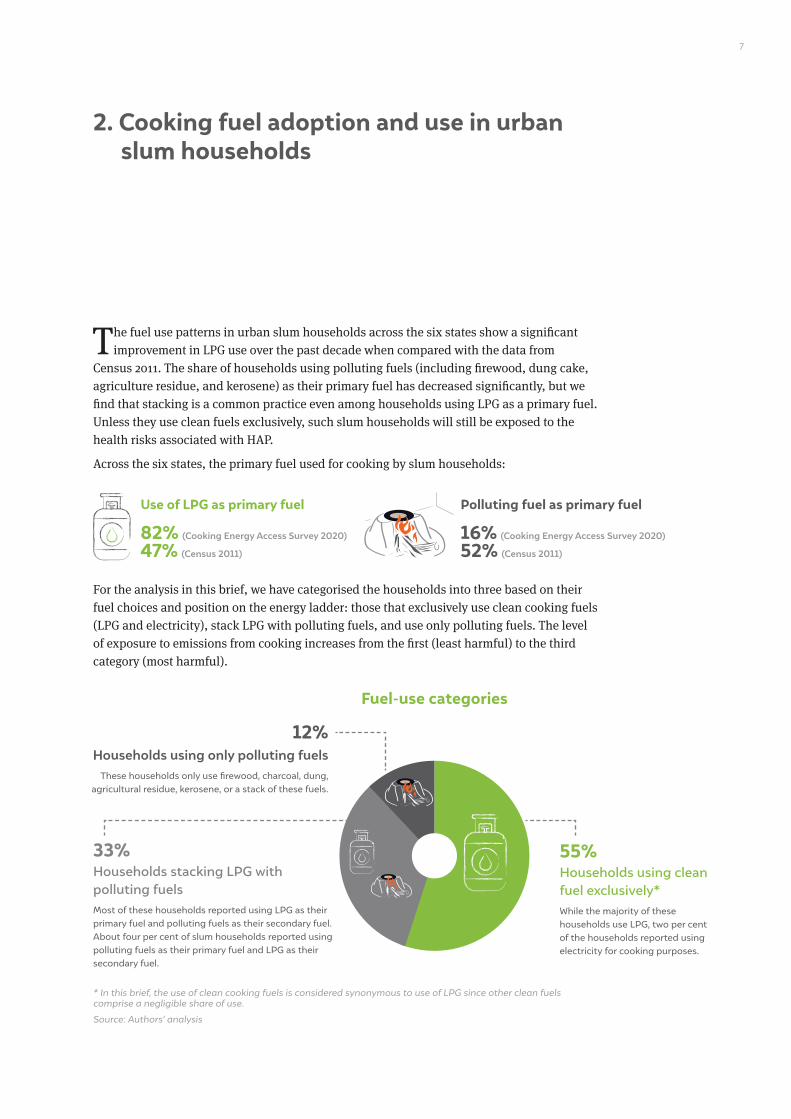
7
The fuel use patterns in urban slum households across the six states show a significant improvement in LPG use over the past decade when compared with the data from
Census 2011 The share of households using polluting fuels (including firewood dung cake agriculture residue and kerosene) as their primary fuel has decreased significantly but we find that stacking is a common practice even among households using LPG as a primary fuel Unless they use clean fuels exclusively such slum households will still be exposed to the health risks associated with HAP
Across the six states the primary fuel used for cooking by slum households
For the analysis in this brief we have categorised the households into three based on their fuel choices and position on the energy ladder those that exclusively use clean cooking fuels (LPG and electricity) stack LPG with polluting fuels and use only polluting fuels The level of exposure to emissions from cooking increases from the first (least harmful) to the third category (most harmful)
2 Cooking fuel adoption and use in urban slum households
In this brief the use of clean cooking fuels is considered synonymous to use of LPG since other clean fuels comprise a negligible share of use
Source Authorsrsquo analysis
Households using clean fuel exclusivelyWhile the majority of these households use LPG two per cent of the households reported using electricity for cooking purposes
Households stacking LPG with polluting fuelsMost of these households reported using LPG as their primary fuel and polluting fuels as their secondary fuel About four per cent of slum households reported using polluting fuels as their primary fuel and LPG as their secondary fuel
Households using only polluting fuelsThese households only use firewood charcoal dung
agricultural residue kerosene or a stack of these fuels
5533
12
Fuel-use categories
Use of LPG as primary fuel
82 (Cooking Energy Access Survey 2020)
47 (Census 2011)
Polluting fuel as primary fuel
16 (Cooking Energy Access Survey 2020)
52 (Census 2011)
Are Indiarsquos Urban Poor Using Clean Cooking Fuels Insights from Slums in Six States8
In the following sections we explore factors such as socio-economic characteristics affordability and availability of fuel intra-household gender dynamics and fuel perceptions which influence the ability and likelihood of a household to use different fuels
21 Households using LPG as their only fuel In this section we focus on understanding the household characteristics and fuel use patterns of those using LPG exclusively for cooking Most urban slum households with an LPG connection report using LPG as their primary fuel While 55 per cent of the slum households (63 per cent of LPG-using households) use LPG exclusively others stack LPG with polluting fuels Uttar Pradesh has the highest
proportion (70 per cent) of slum households who are exclusive users of clean cooking fuels among the six states
Figure 1 Within slums there are considerable state-level variations in householdsrsquo fuel usage patterns across states
Source Authorsrsquo analysis
Note We have refrained from state-level analysis because of the smaller sample size for urban slums in states like Jharkhand and Chhattisgarh
Figure 2 While the majority of LPG-using households use the fuel primarily only half of them use it exclusively
Source Authorsrsquo analysis
0
0
10
10
20
20
30
30
40
40
50
50
60
60
70
70
80
80
90
90
100
100
8682
55
Bihar
LPG users
Chhattisgarh Jharkhand Madhya Pradesh
LPG as the primary fuel LPG as the exclusive fuel
Rajasthan Uttar Pradesh
States
Per
cent
age
of h
ouse
hold
s P
erce
ntag
e of
hou
seho
lds
Exclusive clean fuel users Stacking LPG with polluting fuels Only polluting fuel users
42
3
30
56
45
39
1611
40
4944
46
10 5
24
71
41
28
9Cooking fuel adoption and use in urban slum households
Over a fifth of households using LPG exclusively are PMUY households which suggests that these households have been able to transition to clean cooking fuels in less than four years PMUY households using LPG exclusively are of a relatively higher economic status than households that stack polluting fuels Unlike in rural areas the age of an LPG connection does not have a direct correlation with per capita LPG consumption in urban slum households suggesting that even households with recent LPG connections in urban slums are likely to use LPG exclusively Households in urban areas have been known to experience a direct transition to exclusive use of clean fuels from using traditional fuels (Kuo and Azam 2019) This could be due to the time-saving that comes with the adoption of clean cooking fuels like LPG ndash where urban households are more willing or need to spend more on convenience than rural households
Figure 3 Most households using LPG exclusively acquire six to eight cylinders per year
Source Authorsrsquo analysis
211 The economic status of the household determines exclusive LPG useA simple logistic regression (Annexure II) shows that households with higher asset ownership have significantly higher odds of using LPG as an exclusive fuel Even between primary and exclusive users of LPG asset ownership remains a significant differentiating factor This corroborates the findings of previous studies (Ranjan and Singh 2017) that state that households tend to switch their cooking fuel use patterns after a threshold level of income is achieved However this is not to suggest that all wealthy households shift to exclusive use of clean fuels We discuss the reasons for stacking among these households in the next section
Cooking energy in the household budget We find that households using LPG as their only fuel pay INR 496 per month8 This effectively translates to an average household spending almost eight per cent of their monthly expenses on cooking fuel
Oil and Marketing Companies (OMCs) are attempting to address the challenges around the recurring refilling
cost by encouraging low-income households to use a 5 kilograms (kg) cylinder to overcome the high upfront cost
associated with 145kg cylinders In our sample we find that only about two per cent of urban slum households use
small cylinders (5kg or 3kg)
BOX 2 Uptake of small cylinders
8 This is based on the upfront cost paid by the household for an LPG refill Given that only 40 per cent of the householdsrsquo report receiving LPG subsidy on refills ndash it has not been considered in the fuel expenditure calculation The share of fuel expenditure for the households receiving LPG subsidies would be accordingly less than the others
0
10
20
30
40
50
60
70
1
1 16 8 9
22
60
4350 50
14
34
15
2 3 4 5 6 7 8 9 10 11 12 13
Number of 14 kg LPG cylinder refills obtained by exclusive LPG users
Per
cent
age
of h
ouse
hold
s us
ing
LP
G e
xclu
sive
ly
households using LPG exclusively Median value
Are Indiarsquos Urban Poor Using Clean Cooking Fuels Insights from Slums in Six States
212 Home delivery for exclusive LPG users We find that households who receive doorstep delivery of LPG refills have higher odds of using LPG as their exclusive fuel Hassle-free doorstep delivery of LPG refills is known to influence the use of LPG as a primary secondary or exclusive fuel (PPAC-CRISIL 2016)
Additional expense on procurement of cylinders Almost half of the households who receive doorstep delivery of LPG pay an additional amount of INR 20 as a delivery charge However in households that do not receive doorstep delivery about 46 per cent report that one member must forgo their daily wages to procure the cylinder Most of such households depend on daily labour or private jobs for their income
Given that almost half of the households report having to forgo wages to procure the cylinders it could affect the householdrsquos ability to use LPG continually It may add to the average delay in the purchase of refills
Procurement of LPG cylinders during the COVID-19 pandemic Most households that do not receive doorstep delivery of LPG (58 per cent) use private vehicles (including motorcycles or bicycles) to transport LPG refills About one-third of the households procuring cylinders on their own use rented or shared vehicles The procurement constraints faced by these households would be further aggravated during the COVID-19 pandemic as using rented or shared vehicles comes with its own risks
10
About 18 per cent of the respondents in our survey reported that they resided in non-notified slums Such slums are not legally recognised as a lsquoslumrsquo by the government which makes the residents more vulnerable to eviction In our data we find that adoption and use of LPG is similar across households from notified and non-notified slums Qualitative interviews and field visits showed that most of the respondents were permanent residents of the slums who have been living there for more than 10 years
About 2 per cent of urban slum households use electricity as a source for cooking energy These households do not rely on any other fuels for cooking or non-cooking purposes They use electric stoves to prepare all meals including cooking roti rice and vegetables These households have been using electricity as their cooking fuel only in the past five years Most households report using either a coiled stove or induction stove Less than one per cent of households use other electric appliances such as hot water kettles and toasters for cooking needs
BOX 3
BOX 4
Status of slums impacting the fuel-use pattern
Electricity for cooking
77
households receiving doorstep delivery of LPG cylinders are exclusive users of the fuel
63LPG-using households receive doorstep delivery of cylinders
Male members have to travel to procure the cylinders in 87 households
11Cooking fuel adoption and use in urban slum households
About 4 per cent of urban slum households in the sample reported stacking with kerosene as their secondary fuel Most of these households are in Uttar Pradesh These households also use kerosene more than once a week for cooking
BOX 5 Use of kerosene as a cooking fuel
22 Households stacking LPG with polluting fuels Across the six states almost half of the households (45 per cent) reported using polluting fuels Here we discuss the characteristics and fuel use patterns of households that stack clean and unclean fuels
Though 86 per cent of the households surveyed have an LPG connection we find that over a third (33 per cent) of them stack it with polluting fuels (including firewood dung cakes agriculture residue charcoal and kerosene) The increased stacking could also be a result of more households adopting LPG since households tend to not replace biomass-based fuels completely (Cheng and Urpelainen 2014) These households would need to transition to exclusive use of clean cooking fuels to reduce the health impacts on women and children from household air pollution
About 44 per cent of the households that are stacking fuels rely on informal sources for refills Such households have not ordered any refills in the past one year from their LPG distributors These households mainly rely on recurring cylinders from their neighbours or relatives9
Figure 4 Of the households that stack fuels most use LPG as their primary fuel
Source Authorsrsquo analysis
9 It is important to note that sharing LPG cylinders among neighbours and extended family is a regular phenomenon in small towns and rural areas owing to availability challenges and it is not necessarily driven by an intention to siphon off subsidy amounts against the commodity ( Jain et al 2018)
Exclusive clean fuel users
Stacking with LPG as the primary fuel
Only polluting fuel users
Stacking LPG with polluting fuels
Stacking with LPG as the secondary fuel
55
3388
12
12
Are Indiarsquos Urban Poor Using Clean Cooking Fuels Insights from Slums in Six States12
221 Household factors that determine the decision to stack fuels Even within the stacking households the reason for stacking multiple fuels varies significantly Primarily households who stack can be divided into two categories ndash those that stack as they cannot afford LPG refills and those that stack due to other factors like taste preferences and alternate end-uses of the fuel
Households who are stacking primarily due to affordability concerns ndash Across asset quintiles we find that stacking is most common among the middle categories (second and third quintile) where most have adopted LPG Still the affordability of the fuel remains a significant concern More than 60 per cent of the households that are stacking fuels collect or prepare firewood or dung cakes free of cost rather than purchasing them from the market Those who buy biomass do not spend more than INR 100 per month on it Based on the responses of the primary cook we note that the high cost of LPG and free-of-cost availability of solid fuels are the most common factors that affect the fuel choices made by the household
Figure 5 Stacking is prevalent in households across asset quintile categories
Source Authorsrsquo analysis
1 2 3 4 5
Asset quintile categories
0
20
40
60
80
100
Per
cent
age
of h
ouse
hold
s
Exclusive clean fuel users Stacking LPG with polluting fuels Only polluting fuel users
5348
52
6367
2441 37
3232
2311 11
51
Households who use LPG primarily and polluting fuels as secondary fuels have a median annual refill rate of
6 cylinders
Households who use polluting fuels primarily and LPG as a secondary fuel have a median annual refill rate of
4 cylinders
13
Households that are stacking for reasons beyond affordability ndash More than one-fourth of the households that are stacking have a median annual refill rate of eight cylinders and above despite having a similar household size as others Most such households fall in the highest asset quintiles This suggests that they are not necessarily using unclean fuels due to the unaffordability of LPG but due to other factors such as taste preference for chulhas and fuel end-uses that influence the householdrsquos decision to use solidpolluting fuels Such households reported using LPG for a median period of six years The solid fuels are primarily used for cooking chapatis or vegetables in these households
Interestingly even households with multiple LPG connections and two cylinder connections report stacking with polluting fuels The possession of multiple LPG connections in these households may not necessarily be an indicator of diversion mdash the average family size of these households is more than eight indicating the high possibility of having separate kitchens within the same household Given that such households have a median annual refill rate of ten cylinders another plausible reason for multiple connections is that it prevents them from relying on just one distributor which increases their chances of getting refills whenever needed
222 End-uses of polluting fuels Across both the groups discussed above half of the households who stack with polluting fuels use these fuels at least once a day (Figure 6) Also almost 45 per cent of the households that stack fuels use multiple stoves at the same time while preparing a single meal This indicates that even if the household is using LPG for a particular meal they would be using their chulha simultaneously
Despite using LPG as the primary fuel for their cooking needs households that are stacking fuels use polluting fuels for non-cooking purposes like heating water for bathing (29 per cent) and space heating (10 per cent)
Figure 6 Almost half of the households using polluting fuels use it every day
Source Authorsrsquo analysis
0 5 10 15 20
19
11
21
20
29
25 30 35
Percentage of households
Freq
uenc
y of
use
of p
ollu
ting
fuel
s Several times a day
Once per day
Few times a week
Once a week
Occasionally
21 households stacking fuels
have more than one LPG connections
25 households stacking fuels have two-cylinder connections
Cooking fuel adoption and use in urban slum households
Are Indiarsquos Urban Poor Using Clean Cooking Fuels Insights from Slums in Six States14
223 Seasonal variations in the stacking of fuels We also noted a significant seasonal change in fuel use patterns LPG is most popular in the rainy season (88 per cent) and least popular in the winter months (45 per cent) (Figure 7) The dampness associated with solid fuels in the rainy season could be the reason for using LPG primarily during these months The literature also suggests that solid fuels are a popular choice during winter months (S Singh 2014 Baqir et al 2019) This could be because during winter months the solid fuel requirement for non-cooking tasks within the household likes water heating for bathing and space heating increases Since households are already using solid fuels for non-cooking tasks they may be using these fuels more for cooking during winter Unfortunately the increased use of solid fuels in winter exacerbates the much higher air pollution exposure of these households due to unfavourable atmospheric conditions
Figure 7 Proportion of urban slum households using solid fuels as the primary cooking fuel increases during the winters months aggravating household air pollution exposure due to unfavourable atmospheric conditions
Source Authorsrsquo analysis
About 3 per cent of urban slum households reported owning an electric water-heating device (geyser or immersion
rod) Similarly only 4 per cent of the households own an electric room heater
BOX 6 Electric devices for water heating and space heating
Summer Winter Rainy Festival0
20
40
60
80
100
120
Per
cent
age
of h
ouse
hold
s
LPG Solid fuel
78
45
88
67
22
55
1233
15
Figure 8 Lack of awareness about receiving LPG refill subsidies poses a threat to the success of LPG subsidy schemes
Source Authorsrsquo analysis
Connections under the Pradhan Mantri Ujjwala Yojana (PMUY) 23 per cent of these households reported receiving benefits under the PMUY
The six states included in the survey account for a significant share of PMUY coverage ndash 54 per cent of all connections provided under PMUY (PPAC 2019) However most of these connections cater to rural households One of the reasons for there being fewer PMUY connections in urban areas is that more than half of all urban slum households reported already having had LPG connections for over four years (before the launch of PMUY) Moreover over a quarter of PMUY households10 in urban slums reported having multiple LPG connections which suggests that not every household which was using LPG before the PMUY was prevented from accessing the schemersquos benefits
Government support during the COVID-19 pandemic During the COVID-19 lockdown the government announced the provision of three free-of-cost refills for PMUY households under the PM-Garib Kalyan Yojana While PMUY households in urban slums benefitted from this scheme non-PMUY households in urban slums did not As documented urban slum households faced a significant economic hit due to the loss of jobs and incomes during the pandemic (Patel 2020) Non-PMUY households that stack for economic reasons are more likely to use cheaper and freely available solid fuels without additional support from the government
PAHAL-Direct Benefit Transfer for LPG (DBTL)Overall about 42 per cent of active LPG users11 reported receiving a subsidy for their last LPG refill under the Direct Benefit Transfer for LPG scheme (DBTL) However about 28 per cent of urban slum households reported not knowing if they had received the subsidy amount for their last refill this suggests that the primary cook is often unaware of whether the subsidy is credited to the household Among the ones that reported receiving the LPG subsidy about 40 per cent of the primary cook were not aware of the amount of subsidy being credited into their account
10 This is a relatively smaller sample of 43 households from all the PMUY households in urban slums (131 households)
11 Households that have taken at least one refill in the past year
42
30
28
Received LPG refill subsidy
30 Still repaying PMUY loan
Did not receive LPG refill subsidy
10 Gave up LPG refill subsidy
Do not know
60 LPG refill susbsidy not received due to other reasons
Cooking fuel adoption and use in urban slum households
Are Indiarsquos Urban Poor Using Clean Cooking Fuels Insights from Slums in Six States16
23 Households using only polluting fuels About 12 per cent of urban slum households rely entirely on polluting fuels for all cooking and non-cooking purposes While the share of these households is relatively small the non-adoption of LPG in such households despite
programmes like the PMUY is concerning These households either use a combination of different polluting fuels (firewood dung cakes agricultural residue charcoal and kerosene) or just one of these fuels for all their energy needs Firewood is the most commonly used fuel in these households
231 Reasons for the non-adoption of LPGHouseholds that rely exclusively on polluting fuels reported not having an LPG connection Though three-fourths of these households were aware of PMUY the high upfront cost of an LPG connection along with the high recurring cost of procuring refills remain the two most important reasons for not procuring an LPG connection Repondents also mentioned a lack of information on how to procure a connection as a reason These reasons align with the common causes cited by rural households covered in the survey implying that the challenges faced by rural households and urban slum households in procuring connections are similar
Almost half of the households in this category use solid fuels for non-cooking purposes such as heating water for bathing space heating and preparing fodder for animals On the positive aspects of using polluting fuels households reported the following free-of-cost easy availability of fuels better tasting food and preference of family members for food cooked on the chulha
232 Fuel availability and affordabilityIn contrast with households that stack fuels households that use only solid fuels rely on purchasing fuels rather than collecting or preparing them For instance 60 per cent of firewood users in this category procure fuel by purchasing rather than collecting it
Households with low asset ownership rely on polluting fuels for cooking These households spend 2ndash3 per cent of their median monthly expenditure on fuel (INR 75 per month on fuel) which is much lower than what they would have to spend if they used LPG exclusively (INR 496 per month) Households that collect solid fuels spend about two hours on a single trip (three times a month) travelling a median one-way distance of 2 km This is equivalent to the distance travelled to procure LPG cylinders (if not delivered at home)
Figure 9 More than half of the households currently without LPG do not know how to get a connection or whom to ask about it implying a lack of awareness
Source Authorsrsquo analysis
0 10 20 30 40 50 60 70
39
53
63
68
80
Percentage of households
Rea
sons
for N
on-A
dop
tion
of L
PG Installation is expensive
Monthly expenditure on LPG is high
Do not know how to get or whom to ask
Not availabletoo far
17
12 See Annexure III for details on the districts and their PM25 concentrations The data for 15 districts (from Bihar Uttar Pradesh Madhya Pradesh and Rajasthan) overlapping with the survey sample have been analysed based on the availability of air quality data from continuous monitoring stations
13 Air quality categories based on PM25 concentration (in μgm3)
Good 0 to 30 Satisfactory 31 to 60 Moderately polluted 61 to 90 Poor 91 to 120 Very poor 121 to 250 Severe above 250 (Central Pollution Control Board 2014)
Cooking fuel adoption and use in urban slum households
Winter months have the highest PM25 concentrations coinciding with the sharp increase in use of polluting fuels for heating bath water and room heating
233 Gendered time use in households using solid fuelsIn urban slums both the male and female members of the household are equally involved in collecting firewood Still it is primarily the female members of the household who undertake dung cake preparation In addition to engaging in fuel collection and preparation women tend to spend more time cooking in households using solid fuels About 85 per cent of households that transitioned to LPG in the past four years reported having saved time while cooking compared to when they used solid fuels
SPOTLIGHT I Household air pollution (HAP) in urban slums
Burning solid fuels in three-stone fires and mud stoves with inadequate ventilation causes high levels of smoke exposure and negative health impacts particularly for women and young children (WHO 2014)
The double burden of ambient and household air pollution on the urban slum populationUsing the PM25 data from continuous ambient air quality monitoring stations (CAAQMS) for 15 districts12 in our sample we found that the ambient air quality remained in the lsquopoorrsquo or worse category13 for most districts throughout the year variation in the ambient air quality
Are Indiarsquos Urban Poor Using Clean Cooking Fuels Insights from Slums in Six States
Impact of ventilation
Indoor cooking and low adoption of chimney indicates high exposure to pollution from the use of unclean fuels for cooking The proportion of households with a chimney is high (52 per cent) among those who rely only on polluting fuels Smith and Pillarisetti (2017) explain that while having a good chimney lowers peak levels of indoor pollution long-term average exposure is reduced only by a factor of two Besides chimneys require regular maintenance to function correctly While more than 45 per cent of the households are using polluting fuels less than 20 per cent of the slum housheolds use improved cookstoves
Households also use solid fuels for non-cooking uses like space heating On average each house in a slum has two rooms this effectively exposes all members of the household to emissions from burning fuels Emissions from household sources contribute significantly to the surrounding air quality (Harish et al 2019) this concern is exacerbated in congested slum areas
the winter months (November to February) have the highest concentration of PM25 This leads to a double burden of exposure for slum households stacking solid fuels as they are more likely to increase use of solid fuels in winters (Figure 7) Alternatively the use of LPG as the primary source of fuel increases during the rainy season (June to September) these months record the least ambient air pollution
We also find that districts like Meerut Ghaziabad Patna Gautam Buddha Nagar (Noida and Greater Noida) and Muzaffarpur have the highest frequency of lsquovery poorrsquo air quality days throughout the year Across these districts one-third of households use polluting fuels for cooking In urban slums where households are more densely packed the emissions from burning solid fuels increase the risk of exposure inside households and deteriorate the ambient air quality for the community at large As a result these communities suffer from both increased household and ambient air pollution HAP has an estimated average contribution of 30ndash50 per cent to ambient air quality across Indiarsquos urban and rural areas (Balakrishnan et al 2019) Addressing biomass burning for cooking water heating and space heating during the winters has the potential to help reach the national ambient air quality standards (Chowdhury et al 2019) Despite that only 2 per cent of the action points in 44 city clean air plans mention cooking and heating as a sector to address air pollution (Ganguly Selvaraj and Guttikunda 2020)
18
75 householdsrsquo
using polluting fuels cook inside
the main house
67 householdsrsquo using polluting fuels do not have a chimney for ventilation
Awareness about the health impacts of using polluting fuelsAbout 60 per cent of households using only polluting fuels and 84 per cent of households that stack LPG with a polluting fuel report lsquotoo smokyrsquo as the most prominent negative aspect of using polluting fuels This suggests that as more households switch to clean cooking fuels perceptions regarding pollution fuels change
Three-fourths of primary cooks who use polluting fuels for cooking agree that smoke from solid fuels is harmful to them this implies that awareness of the adverse health impacts of polluting fuels does not necessarily lead to the uptake of clean fuels Primary cooks also agree that smoke from solid fuels causes coughing (49 per cent) and lung infections in children (39 per cent)
Exposure to air pollution is a known risk factor for underlying chronic diseases that predict the severity of
COVID-19 disease and patient outcomes (World Bank 2020) This linkage suggests a heightened risk for women
in all age groups who cook using traditional technologies and fuels (World Bank 2020) The highest number of
COVID-19 cases were recorded in the most polluted regions among patients with pre-existing health conditions
(Frontera et al 2020)
Results from a controlled study show a higher prevalence of chronic obstructive pulmonary disease (COPD)
among biomass fuel users than clean fuel users ( Johnson et al 2011) The available clinical data to date suggest
that cardiovascular disease diabetes chronic respiratory illness and hypertension ndash conditions all strongly
associated with exposure to HAP ndash are also risk factors for COVID-19 (World Bank 2020)
BOX 7 Impact of household air pollution on COVID-19
19Cooking fuel adoption and use in urban slum households
Are Indiarsquos Urban Poor Using Clean Cooking Fuels Insights from Slums in Six States
Traditionally women bear a disproportionate burden in collecting and preparing biomass for cooking While this burden reduces with the use of clean cooking fuels like LPG the fuel supply within the household is then determined by formal and monetised distribution networks involving an outlay of money (Patnaik and Jha 2020) Our data shows that womenrsquos status in the household (as heads of households)14 positively correlates with households using LPG as their primary fuel The existing literature also supports the idea that female-headed households prefer modern fuels to polluting ones (Farsi Filippini and Pachauri 2007 Rao and Reddy 2007 Kuo and Azam 2019) Other research also suggests that female-headed households are more willing to spend on LPG as a recurring expense (Kojima Bacon and Zhou 2011 Kuo and Azam 2019)
SPOTLIGHT II Womenrsquos participation in intra-household decision-making regarding LPG use
20
14 In almost half of the households surveyed the primary cook reported a female member being the head of the household The reason behind such high percentage of female-headed households could be because only the primary cook of every household (who is mostly female) was surveyed This does not mean that these households do not have any adult male members Traditionally headship refers to the head of household as the individual whose lsquoauthorityrsquo the household members recognise But this definition overlooks potential intra-household variations in the recognised authority in different realms of decision-making (Kilic Moylan and Koolwal 2020) Since cooking is a gendered activity the primary cookrsquos response to the head of household question may have been with respect to the recognised authority figure for that activity within the household
30 householdsrsquo female members place the order for LPG refills
50householdsrsquo female
members decide whether or when to purchase LPG refills
We also find that the decision of whether or when to purchase LPG refills is made by male members in half of urban slum households This holds for both male- and female-headed households In LPG-using households where the primary cook is involved in an income-generating activity more women are deciding to order the refills This pattern is similar irrespective of whether the household uses LPG exclusively or stacks it with other polluting fuels or are PMUY beneficiaries
SPOTLIGHT III A comparison of access to clean cooking energy between urban slum and non-slum households across six states
21
At the state level Bihar has significantly poor involvement of women in intra-household decision-making regarding
ordering refills with less than 10 per cent of households reporting that women decide whether or when to order
refills However more women than men are involved in decisions around LPG refills in Rajasthan Madhya Pradesh
and Jharkhand
Across caste groups the involvement of women is lowest (37 per cent) among the Scheduled Castes (SCs)
However more women in General and OBC households decide when to order LPG refills
BOX 8 Variations in intra-household decision-making across states and caste groups
Cooking fuel adoption and use in urban slum households
To compare the fuel use patterns of urban slum and non-slum households we used data from the India Residential Energy Survey (IRES 2020)15 The overlap in the sampling strategies of both IRES and our survey enabled a comparison of the findings There is a significant difference in the socio-economic status of slum and non-slum households which tends to affect their fuel use patterns Table 4 provides a comparison of cooking fuel usage in urban non-slum households (from IRES 2020) and urban slum households (Cooking Energy Access and Use survey 2020)
Are Indiarsquos Urban Poor Using Clean Cooking Fuels Insights from Slums in Six States22
Table 4 The poor economic condition of households in urban slums impacts the exclusive use of clean fuels for cooking
Source Authorsrsquo analysis
Fuel use categories Urban slum households (Cooking Energy Access Survey) ()
Non-slum urban households (IRES) ()
95 88
84 55
9 33
5 12
Clean fuel users (LPG PNG and electricity)
LPG as an exclusive fuel
Households that stack LPG with polluting fuels
Households that use only polluting fuels
We observed a significant gap in the exclusive use of LPG as a cooking fuel between urban slums and non-slum households explained mainly by the difference in their economic conditions Stacking is three times more common in slum households than non-slum households About 45 per cent of non-slum households using polluting fuels belong to marginalised social groups (SCs and STs) Households using polluting fuels have a lower median monthly expenditure than others and about 62 per cent of such households are semi-pucca or kuchha structures Among LPG users non-slum households have a slightly higher rate of doorstep delivery as compared to slum households
LPG-using households receiving home deliveries
Source Authorsrsquo analysis
239
6372
Urban slum households (Cooking Energy Access and Use)
()
Non-slum urban households (IRES)
()
Proportion of PMUY beneficiaries among LPG-using households
15 IRES 2020 was conducted in 21 large states of India including Bihar Jharkhand Rajasthan Madhya Pradesh Uttar Pradesh and Chhattisgarh While IRES 2020 focused on urban households the Cooking Energy Access and Use survey specifically attended to urban slums in the same districts Refer to the technical note for a detailed methodology of the survey
23
3 Way forward
Slums across the world are chronically ignored in public policy and suffer because of unauthorised and unsafe habitation without access to government services (Shahadat
Lipu and Bhuiyan 2014) In terms of energy access while we see a progressive change in householdsrsquo energy use patterns as we move from rural to urban issues like affordability availability preference and familiarity with the fuel and stove remain essential factors that determine householdsrsquo fuel choice
Image iStock
Are Indiarsquos Urban Poor Using Clean Cooking Fuels Insights from Slums in Six States24
Understanding categories of users is important for enabling access to and use of clean cooking fuels
We categorised the urban slum population based on their fuel usage patterns ndash using only clean fuels stacking clean fuels with polluting fuels and using only polluting fuels While most households in urban slums have an LPG connection only half of them use LPG exclusively The householdrsquos economic status and its access to doorstep delivery of LPG refills are two crucial factors that determine its ability to use LPG exclusively Despite being situated in urban areas 37 per cent of slum households do not receive home delivery of cylinders ndash availability is an essential factor in determining the householdrsquos likelihood of using LPG exclusively There is a strong impetus for the OMCs and distributors to improve their home delivery services of LPG refills in slum areas
Stacking is prevalent in about one-third of households ndash there is a need for a deeper understanding of householdsrsquo preferences fuel end-uses and awareness Most households reported using polluting fuels daily or at least weekly this effectively increases their exposure to household air pollution despite having access to clean cooking fuels Among households that stack LPG with polluting fuels the reasons for stacking differ ndash affordability seasonality and taste preference More than a quarter of households that stack have a similar level of LPG consumption as those that use LPG exclusively despite similar family sizes Such households use polluting fuels not because of their inability to afford LPG But other factors like free-of-cost availability of biomass taste preference for chulha and alternate end-uses of fuelmdashfor instance in space heatingmdashinfluence the householdrsquos decision to use solid fuels Among households that stack multiple fuels the use of polluting fuels increases during winter months this exposes the households to a double burden of high ambient and household air pollution in these months About 40 per cent of these households also use polluting fuels for non-cooking purposes like heating water for bathing and space heating especially in winter
Even with large-scale government initiatives like PMUY we find that more than 10 per cent of urban slum households do not use LPG They mainly rely on free-of-cost biomass for their cooking and non-cooking needs Despite awareness of PMUY among these households the high upfront cost of procuring an LPG connection and high recurring expenditure on refills deter them from using LPG Evidently there is a need to expand the reach of PMUY to cover households across slums
Integrating the issue of lack of access to clean cooking energy within the discussion on urban poverty
This study reiterates the need to look at poverty in urban areas in the context of energy access Given the heterogeneity of poverty in urban and semi-urban India it is essential to understand energy poverty in the context of access to resources for an enhanced quality of life for the urban poor Similarly slums dwellers in large and small cities alike may experience additional challenges of access Furthermore not all urban poor live in slums we know even less about the access issues of temporary residents or seasonal migrants in urban India Therefore in a rapidly urbanising India studies on the urban poor and air quality need to integrate a focus on energy access to address the vulnerability of women children and communities to HAP and the drudgery of using polluting fuels for cooking and other household energy needs
Access to clean cooking energy schemes must be integrated into the social assistance programmes focused on urban poverty alleviation to enhance its reach
25Way forward
Converging energy access in social protection policies for the urban poor
Accounting for the vulnerabilities of the urban poor is crucial in designing and implementing policies including social protection schemes As a health and economic imperative access to clean cooking energy schemes must be integrated into the social assistance programmes of other ministries (eg health education and nutrition assistance) to offer better support to slum households This would also reduce the burden on households of claiming and accessing multiple benefits across schemes thus freeing them to invest more time in productive activities (CEEW 2020) Government programmes such as the National Urban Livelihoods Mission and social service allocations for housing should use existing targeting approaches to include access to clean cooking energy within the ambit of services for the poor
Bringing a renewed emphasis on clean cooking energy access due to COVID-19 is essential
Most households in urban slums rely on daily wage labour or the gig economy for their household income During the COVID-19 pandemic these occupations have been among the worst impacted by the lockdown and the economic slowdown A survey conducted with over 2000 daily wage workers in urban slums during the lockdown suggests that only 7 per cent of respondents from this group received pay during the lockdown (Basu 2020) causing a massive shock to their livelihoods and wage earnings This kind of impact pushes households into energy poverty leading to the increased use of free-of-cost biomass and consequently increasing the risk of exposure to emissions from fuel burning While the government has committed to supplying up to three free refills to all PMUY households under PM-Garib Kalyan Yojana less than a quarter of households in urban slums have Ujjwala connections The low share of PMUY households effectively makes the majority of slum households ineligible for relief support given under the PM-Garib Kalyan Yojana during the lockdown There is a need to target vulnerable households ndash beyond PMUY beneficiaries ndash with differential subsidy support for using LPG in a sustained manner
Increased poverty would mean increased use of polluting fuels ndash there is a need for a renewed emphasis on clean cooking energy access during the COVID-19 pandemic as increased use of polluting fuels has health implications (lower respiratory infections and COPD) that increase the risk of COVID-19 infections being more severe
There is a need to target vulnerable households ndash beyond PMUY beneficiaries ndash with differential subsidy support for using LPG in a sustained manner
Are Indiarsquos Urban Poor Using Clean Cooking Fuels Insights from Slums in Six States
Balakrishnan Kalpana Sagnik Dey Tarun Gupta R S Dhaliwal Michael Brauer Aaron J Cohen Jeffrey D Stanaway et al 2019 ldquoThe Impact of Air Pollution on Deaths Disease Burden and Life Expectancy Across the States of India The Global Burden of Disease Study 2017rdquo The Lancet Planetary Health 3 (1) e26ndash39 httpsdoiorg101016S2542-5196(18)30261-4
Baqir M S K Bharti R Kothari and R P Singh 2019 ldquoAssessment of an Energy-efficient Metal Chulha for Solid Biomass Fuel and Evaluation of its Performancerdquo International Journal of Environmental Science and Technology 16 (11) 6773ndash6784 httpsdoiorg101007s13762-018-2028-9
Basu Anika Badyal 2020 ldquoLockdown Survey How The Covid-19 Crisis Has Affected Daily Wage WorkersmdashAIFrdquo American India Foundation June 28 httpsaiforglockdown-survey-how-the-covid-19-crisis-has-affected-daily-wage-workers
Butera F M P Caputo R Adhikari and A Facchini 2016 ldquoThe Challenge of Energy in Informal Settlements A Review of the Literature for Latin America and Africardquo Procedia Engineering 1ndash32 httpswwwenelfoundationorgcontentdamenel-foundtopic-downloadThe challenge of Energy in Informal settlementspdf
CEEW 2020 ldquoEnergy Safety Nets India Case Studyrdquo Vienna Sustainable Energy for All httpswwwceewinpublicationsenergy-safety-nets-india-case-study
Central Pollution Control Board 2014 ldquoNational Air Quality Indexrdquo New Delhi Central Pollution Control Board httpsappcpcbccrcomccr_docsFINAL-REPORT_AQI_pdf
Chafe Z S Mehta and K R Smith 2011 ldquoAmbient Fine Particulate (PM25) Air Pollution Attributable to Household Cooking Fuel in Asiardquo AGUFM A54Bndash03 httpsuiadsabsharvardeduabs2011AGUFMA54B03Cabstract
Chandramouli C 2010 ldquoCensus of India 2011 ndash Circular No 8rdquo New Delhi Ministry of Home Affairs httpscensusindiagovin2011-CircularsCircularsCircular-08pdf
Chandrasekhar S and Arup Mitra 2018 ldquoMigration Caste and Livelihood Evidence from Indian City-slumsrdquo Urban Research amp Practice 12 (2) 156ndash172 httpsdoiorg1010801753506920181426781
Cheng Chao Yo and Johannes Urpelainen 2014 ldquoFuel Stacking in India Changes in the Cooking and Lighting Mix 1987ndash2010rdquo Energy 76 (November) 306ndash317 httpsdoiorg101016jenergy201408023
Chowdhary Sourangsu Sagnik Dey Sarath Guttikunda Ajay Pillarisetti Kirk R Smith and Larry Di Girolamo 2019 ldquoIndian annual ambient air quality standard is achievable by completely mitigating emissions from household sourcesrdquo Proceedings of the National Academy of Sciences 116 (22) 10711-10716 httpsdoiorg101073pnas1900888116
Dhingra Chhavi Shikha Gandhi Akanksha Chaurey and P K Agarwal 2008 ldquoAccess to Clean Energy Services for the Urban and Peri-Urban Poor A Case-study of Delhi Indiardquo Energy for Sustainable Development 12 (4) 49ndash55 httpsdoiorg101016S0973-0826(09)60007-7
Farsi Mehdi Massimo Filippini and Shonali Pachauri 2007 ldquoFuel Choices in Urban Indian Householdsrdquo Environment and Development Economics 12 (6) 757ndash774 httpsdoiorg101017S1355770X07003932
References
26
Frontera Antonio Lorenzo Cianfanelli Konstantinos Vlachos Giovanni Landoni and George Cremona 2020 ldquoSevere Air Pollution Links to Higher Mortality in COVID-19 Patients The lsquoDouble-Hitrsquo Hypothesisrdquo Journal of Infection 81 (2) 255ndash259 httpsdoiorg101016jjinf202005031
Ganguly Tanushree Kurinj L Selvaraj Sarath K Guttikunda 2020 ldquoNational Clean Air Programme (NCAP) for Indian cities Review and outlook of clean air action plansrdquo Atmospheric Environment X Vol 8 httpsdoiorg101016jaeaoa2020100096
GNESD 2008 ldquoClean Energy for the Urban Poor An Urgent Issuerdquo Accessed 25 July 2020 httpswwwgooglecomurlsa=tamprct=jampq=ampesrc=sampsource=webampcd=ampved=2ahUKEwi1hf2ru dntAhUCOisKHQH7BtsQFjAAegQIAxACampurl=http3A2F2Fwwwgnesdorg2F-2Fmedia2FSites2FGNESD2FPublication- pdfs2FSPM_CleanEnergyashx3Fla3Dda26hash3DE4971C585B6798F17954F8B42E073 D9507F42A84ampusg=AOvVaw08kCDgOkTkYc6wRDxzsNyq
Guan Wei-Jie Wen-Hua Liang Yi Zhao Heng-Rui Liang Zi-Sheng Chen Yi-Min Li Xiao-Qing Liu et al 2020 ldquoComorbidity and its Impact on 1590 Patients with COVID-19 in China A Nationwide Analysisrdquo European Respiratory Journal 55 (5) 2000547 httpsdoiorg1011831399300300547-2020
Harish Santosh Kirk R Smith Sourangsu Chowdhury Zoe A Chafe Ajay Pillarisetti Jos Lelieveld Sarath Guttikunda Sagnik Dey and Andrew P Grieshop 2019 ldquoThe Contribution of Household Fuels to Ambient Air Pollution in India A Comparison of Recent Estimates Edited by CcapcOrgInrdquo Collaborative Clean Air Policy Centre May 30 httpsccapcorginpolicy-briefs2019530the-contribution-of-household-fuels-to-ambient-air-pollution-in-india-a-comparison-of-recent-estimates
Jain Abhishek Saurabh Tripathi Sunil Mani Sasmita Patnaik Tauseef Shahidi and Karthik Ganesan 2018 ldquoAccess to Clean Cooking Energy and Electricity Survey of States 2018rdquo New Delhi CEEW httpswwwceewinsitesdefaultfilesCEEW-Access-to-Clean-Cooking-Energy-and-Electricity-11Jan19_0pdf
Johnson Priscilla Kalpana Balakrishnan Padmavathi Ramaswamy Santu Ghosh Muthukumar Sadhasivam Omprakash Abirami Bernard W C Sathiasekaran Kirk R Smith Vijayalakshmi Thanasekaraan and Arcot S Subhashini 2011 ldquoPrevalence of Chronic Obstructive Pulmonary Disease in Rural Women of Tamilnadu Implications for Refining Disease Burden Assessments Attributable to Household Biomass Combustionrdquo Global Health Action 4 (1) 7226 httpsdoiorg103402ghav4i07226
Kilic Talip Heather Moylan and Gayatri Koolwal 2020 ldquoGetting the (Gender-disaggregated) Lay of the Land Impact of Survey Respondent Selection on Measuring Land Ownership and Rightsrdquo Washington DC The World Bank httpsdoiorg1015961813-9450-9151
Kojima Masami Robert Bacon and Xin Zhou 2011 ldquoWho Uses Bottled Gas Evidence from Households in Developing Countriesrdquo The World Bank Sustainable Energy Department Oil Gas and Mining Unit httpelibraryworldbankorgdoibook1015961813-9450-5731
Kuo Ying-Min and Mehtabul Azam 2019 ldquoHousehold Cooking Fuel Choice in India 2004ndash2012 A Panel Multinomial Analysisrdquo IZA Discussion Paper No 12682 httpsssrncomabstract=3468630
Lippi Giuseppe and Brandon Michael Henry 2020 ldquoChronic Obstructive Pulmonary Disease Is Associated with Severe Coronavirus Disease 2019 (COVID-19) COPD and COVID-19rdquo Respiratory Medicine 167 105941 httpsdoiorg101016jrmed2020105941
Ministry of Housing and Urban Affairs 2019 ldquoHandbook of Urban Statisticsrdquo New Delhi Government of India httpmohuagovinpdf5c80e2225a124Handbook of Urban Statistics 2019pdf
Rao M Narasimha and B Sudhakara Reddy 2007 ldquoVariations in Energy Use by Indian Households An Analysis of Micro Level Datardquo Energy 32 (2) 143ndash153 httpsdoiorg101016jenergy200603012
27References
Are Indiarsquos Urban Poor Using Clean Cooking Fuels Insights from Slums in Six States28
National Buildings Organisation 2013 ldquoState of Slums in India a Statistical Compendium 2013rdquo New Delhi Government of India httpnbonicinpdfSlums_in_India_Compendium_English_Versionpdf
National Sample Survey Office 2012 ldquoKey Indicators of Urban Slums in India ndash 69th Roundrdquo New Delhi National Data Bank for Socio-religious Categories httpmospinicinsitesdefaultfilesnational_data_bankndb-rpts-69htm
Nolan Laura B 2015 ldquoSlum Definitions in Urban India Implications for the Measurement of Health Inequalitiesrdquo Population and Development Review 41 (1) 59ndash84 httpsideasrepecorgablapopdevv41y2015i1p59-84html
Nolan Laura B David E Bloom and Ramnath Subbaraman 2018 ldquoLegal Status and Deprivation in Urban Slums Over Two Decadesrdquo HHS Public Access 53 (15) 47ndash55
Patel Amit 2020 ldquoPreventing COVID-19 Amid Public Health and Urban Planning Failures in Slums of Indian Citiesrdquo World Medical amp Health Policy 12 (3) httpsdoiorg101002wmh3351
Patnaik Sasmita and Shaily Jha 2020 ldquoCaste Class and Gender in Determining Access to Energy A Critical Review of LPG Adoption in Indiardquo Energy Research amp Social Science 67 (September) 101530 httpsdoiorg101016jerss2020101530
PPAC-CRISIL 2016 ldquoAssessment Report Primary Survey on Household Cooking Fuel Usage and Willingness to Convert to LPGrdquo New Delhi Petroleum Planning amp Analysis Cell Ministry of Petroleum and Natural Gas Government of India httpswwwppacgovinWriteReadDataReports201710310449342512219PrimarySurveyReportPPACpdf
PPAC 2019 ldquoOil Industry Information at a Glancerdquo New Delhi Ministry of Petroleum and Natural Gas Government of India httpswwwppacgovinWriteReadDataReports201912060336500305462ReadyReckonerNov2019WebVersionpdf
Rahaman Mehebub and Dipendra Nath Das 2017 ldquoNature of Slum Growth in Indian Citiesrdquo Urban India 37 (II) 100ndash116 httpswwwresearchgatenetpublication334051882_Nature_of_Slum_Growth_in_Indian_Citiesread
Rains Emily Anirudh Krishna and Erik Wibbels 2018 ldquoUrbanisation and Indiarsquos Slum Continuum Evidence on the Range of Policy Needs and Scope of Mobilityrdquo London International Growth Centre httpswwwtheigcorgwp-contentuploads201802Rains-et-al_Working-paper_coverpdf
Ranjan Rahul and Sudershan Singh 2017 ldquoEnergy Deprivation of Indian Households Evidence from NSSO Datardquo New Delhi Munich Personal RePEc Archive httpsmpraubuni-muenchende835661MPRA_paper_83566pdf
Roy Debraj Bharath Palavalli Niveditha Menon Robin King Karin Pfeffer Michael Lees and Peter M A Sloot 2018 ldquoSurvey-based Socio-economic Data from Slums in Bangalore Indiardquo Nature Publishing Group 5 1ndash9 httpsdoiorg101038sdata2017200
Saksena Sumeet P B Singh Raj Kumar Prasad Rakesh Prasad Preeti Malhotra Veena Joshi and R S Patil 2003 ldquoExposure of Infants to Outdoor and Indoor Air Pollution in Low-income Urban Areas A Case Study of Delhirdquo Journal of Exposure Science amp Environmental Epidemiology 13 219ndash30 httpsdoiorg101038sjjea7500273
Lipu Molla Shahadat Hossain and Arif Waliullah Bhuiyan 2014 ldquoElectricity Access in Urban Slum Households of Bangladesh A Case of Dhakardquo Journal of Renewable and Sustainable Energy 6 (053112) 1ndash15 httpsdoiorg10106314896697
29
Singh Rozita Xiao Wang Emmanuel Ackom and Juan Reyes 2015 ldquoEnergy Access Realities in Urban Poor Communities of Developing Countries Assessments and Recommendationsrdquo Global Network on Energy for Sustainable Development (GNESD) httpswwwgooglecomurlsa=tamprct=jampq=ampesrc=sampsource=webampcd=ampved=2ahUKEwj5nbqI wdntAhXUTX0KHZE6DboQFjAAegQIAhACampurl=https3A2F2Forbitdtudk2Ffiles2F10635 24942FEnergy_access_realities_v_final_updatedpdfampusg=AOvVaw0xNBAAo0bjLueY9FmoigKF
Singh Santosh 2014 ldquoThe Kaleidoscope of Cooking Understanding Cooking Behaviour and Stove Preferences in Rural Indiardquo New Delhi Deutsche Gesellschaft fuumlr Internationale Zusammenarbeit (GIZ) GmbH httpswwwgizdeendownloadsgiz2014-en-kaleidoscope-of-cooking-indiapdf
Smith Kirk R and Ajay Pillarisetti 2017 ldquoHousehold Air Pollution from Solid Cookfuels and its Effects on Healthrdquo Disease Control Priorities 7 (3) 133ndash52 httpsdoiorg101596978-1-4648-0522-6_ch7
UN-Habitat 2003 ldquoThe Challenge of Slums ndash Global Report on Human Settlements 2003rdquo Location of publishing London UN-Habitat httpsunhabitatorgthe-challenge-of-slums-global-report-on-human-settlements-2003
Wang Bolin Ruobao Li Zhong Lu and Yan Huang 2020 ldquoDoes Comorbidity Increase the Risk of Patients with COVID-19 Evidence from Meta-analysisrdquo Aging 12 (7) 6049ndash6057 httpsdoiorg1018632AGING103000
WHO 2014 ldquoWHO Guidelines for Indoor Air Quality Household Fuel Combustionrdquo WHO Accessed 25 July 2020 httpwwwwhointairpollutionguidelineshousehold-fuel-combustionen
World Bank 2020 ldquoThe State of Modern Energy Cooking Servicesrdquo Washington DC World Bank httpdocuments1worldbankorgcurateden937141600195758792pdfThe-State-of-Access-to-Modern-Energy-Cooking-Servicespdf
Yenneti Komali Yehua Dennis Wei and Wen Chen 2017 ldquoThe Urbanization of Poverty in India Spatio-temporal Disparities in Consumption Expendituresrdquo Geographical Review 107 (2) 360ndash383 httpsdoiorg101111j1931-0846201612167x
References
Are Indiarsquos Urban Poor Using Clean Cooking Fuels Insights from Slums in Six States
Annexure 1 Asset ownership index We used Filmer and Pritchettrsquos (2001) proposed approach to construct an asset ownership index using principal component analysis (PCA) We chose the indicators based on data from the Cooking Energy Access survey 2020 The variables we considered for the index were based on classifications by Caroline Moser and Andrew Felton (2007) and K Harttgen (2013) We computed the asset index using housing characteristics and consumer durables as follows
Variables not included in the asset index
Four types of variables were eliminated
1 Variables (such as grid electricity) that had high usage of greater than 95 per cent
2 Those (such as ownership of laptops or computers air conditioners etc) that had a low usage of less than 5 per cent
3 Variables (like house ownership) that have economically fluctuating values
4 Those that indicated a low correlation of less than 20 per cent variation between the top category (ie first) of the asset quintile and the bottom-most category (ie fifth) of the asset quintile
For ease of interpretation we rescaled this index such that the final index values range between 0 and 10 For this purpose we used a feature scaling (or minndashmax scaling) formula
Xnorm (or (IVx)) = (X ndash Xmin)(Xmax ndash Xmin)
where IVx is the normalised index value Xmin is the initial minimum value (-354) and Xmax is the initial maximum value (461) of the asset ownership index
30
Annexures
bull Crowding16 inside the house bull Toilet ownership and usage bull Source of water bull Number of pucca rooms
bull Ownership of two-wheeler bull Ownership of washing machine bull Ownership of television bull Ownership of refrigerator bull Ownership of cooker
16 A household with more than three members occupying a single room is considered crowded (World Health Organization 2018)
Housing characteristics
Consumer durables
Annexure 2 Explaining the use of LPG as the exclusive fuel (simple logistic regression model)
31Annexures
Dependent variable exclusive LPG use
Education of the primary cook (categorical base category is education beyond the school level)
Education of the household head (categorical base category is education beyond the school level)
State (categorical base category includes households from Rajasthan)
P gt z 95 confidence interval
Odds ratio (SE)
1299 (0112)
0659 (0202)
1399 (0394)
0970 (0038)
0994 (0011)
1003 (0013)
2042 (0508)
1011 (0046)
0782 (0441)
1198 (0608)
1377 (0664)
1345 (0566)
3141 (1103)
1213 (0500)
0309 (0211)
1165 (0565)
1703 (0680)
0002
0174
0233
0446
0583
0839
0004
0812
0663
0722
0507
0482
0001
0639
0086
0753
0182
1097
0361
0806
0898
0973
0977
1254
0924
0259
0443
0535
0589
1578
0541
0081
0450
0779
1540
1203
2428
1048
1016
1029
3327
1106
2361
3240
3545
3070
6251
2720
1181
3014
3723
Asset index
Primary cook involved in income-generating activity
Female-headed households
Household size
Age of household head
Age of primary cook
Doorstep delivery of LPG cylinders
PMUY customer
Primary cook is not educated
Primary cook has a school education
Household head is not educated
Household head has a school education
Uttar Pradesh
Bihar
Chhattisgarh
Jharkhand
Madhya Pradesh
Number of households (n) = 417
Log likelihood = -228777
Prob gt chi2 = 0000
Pseudo R2 = 0126
The dependent variable is a dummy variable where households using LPG exclusively are assigned a value of 1 and all other households are assigned the value of 0
The caste of the household has not been factored into the regression as a separate variable because of its underlying influence on economic status
Source Authorsrsquo analysis
Are Indiarsquos Urban Poor Using Clean Cooking Fuels Insights from Slums in Six States
Annexure 3 Air quality (PM25 concentration in μgm3) across 15 districts based on CAAQMS data
32
Dis
tric
tsM
ar-1
9A
pr-1
9M
ay-1
9Ju
n-19
Jul-1
9A
ug-1
9Se
p-19
Oct
-19
Nov
-19
Dec
-19
Jan-
20Fe
b-20
Mar
-20
794
5
988
5
866
7
-
645
329
2
453
7
388
1
769
1
886
4
661
5
950
9
834
4
-
823
4
611
7
569
9
535
7
-
270
4
589
4
571
5
293
1
705
4
839
2
614
9
970
1
826
8
-
844
9
622
1
597
1
564
0
-
235
3
414
3
619
1
414
3
653
9
834
7
568
8
104
90
739
8
-
894
9
630
9
342
2
450
4
-
476
465
2
474
6
429
2
592
3
566
1
-
674
6
531
4
501
5
568
7
450
8
-
320
3
-
846
506
3
349
5
332
4
369
1
387
2
-
430
4
393
6
353
7
446
2
406
8
335
2
339
1
-
102
9
497
2
261
8
269
1
431
4
294
1
-
351
6
277
3
-
336
5
315
5
248
3
392
8
149
7
144
9
462
3
270
5
331
3
273
4
276
0
106
6
391
7
326
2
-
368
6
625
3
875
2
101
64
521
2
183
1
380
4
556
2
544
1
558
2
102
24
104
33
156
44
128
73
146
62
137
71
109
14
183
70
201
80
896
7
190
1
457
7
581
2
583
5
815
4
135
00
126
41
239
94
208
15
158
51
221
86
121
35
192
46
218
43
848
0
205
2
448
5
509
4
582
0
704
5
177
01
613
1
244
01
215
80
136
87
230
54
964
2
201
52
122
30
725
5
120
6
435
4
454
7
481
2
111
37
147
45
537
3
175
53
162
86
111
21
170
08
583
8
132
10
866
2
513
1
112
5
511
3
507
5
511
8
879
4
120
22
502
1
135
53
116
39
994
7
120
45
410
5
792
1
674
8
326
3
177
6
385
0
408
5
335
9
497
2
594
2
429
9
673
2
547
5
540
8
559
4
Gay
a
Muz
affa
rpur
Pat
na
Bho
pal
Satn
a
Alw
ar
Ajm
er
Ud
aip
ur
Ag
ra
Bul
and
shah
r
Hap
ur
Gha
ziab
ad
Gre
ater
Noi
da
Mee
rut
Noi
da
Sour
ce C
onti
nuou
s am
bien
t air
qua
lity
mon
itor
ing
stat
ion
(Mar
ch 2
019
ndash M
arch
202
0)
In a rapidly urbanising India it would be imperative for policymakers and practitioners in energy and urban development sector to integrate access to clean cooking energy within the ambit of services for the urban poor
Image CEEW
Are Indiarsquos Urban Poor Using Clean Cooking Fuels Insights from Slums in Six States
COUNCIL ON ENERGY ENVIRONMENT AND WATER (CEEW)
Sanskrit Bhawan A-10 Aruna Asaf Ali Marg Qutab Institutional AreaNew Delhi - 110 067 IndiaT +91 11 4073 3300
infoceewin | ceewin | CEEWIndia
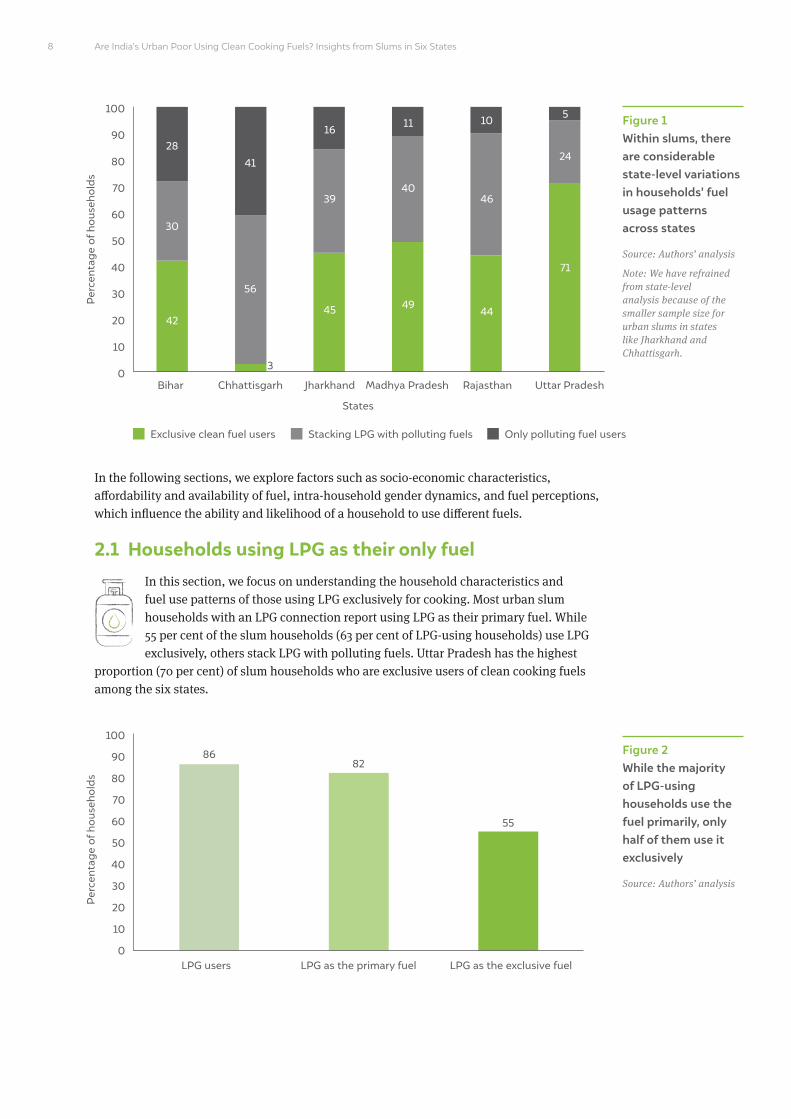
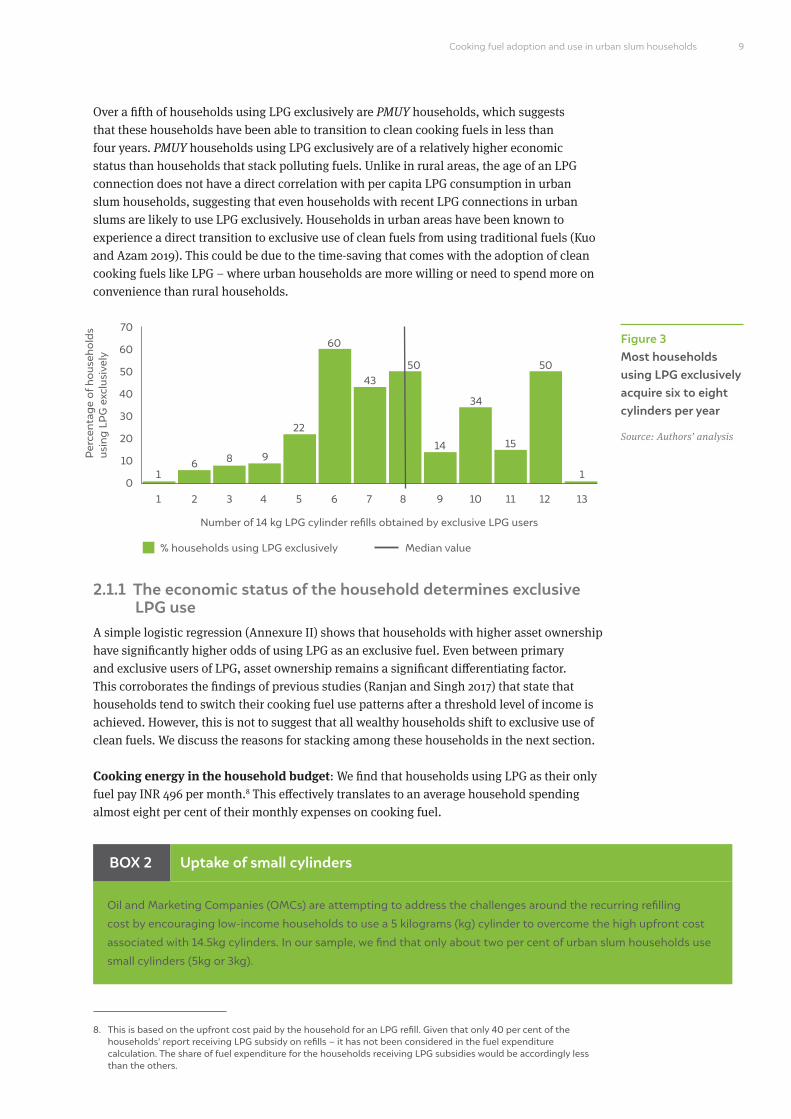
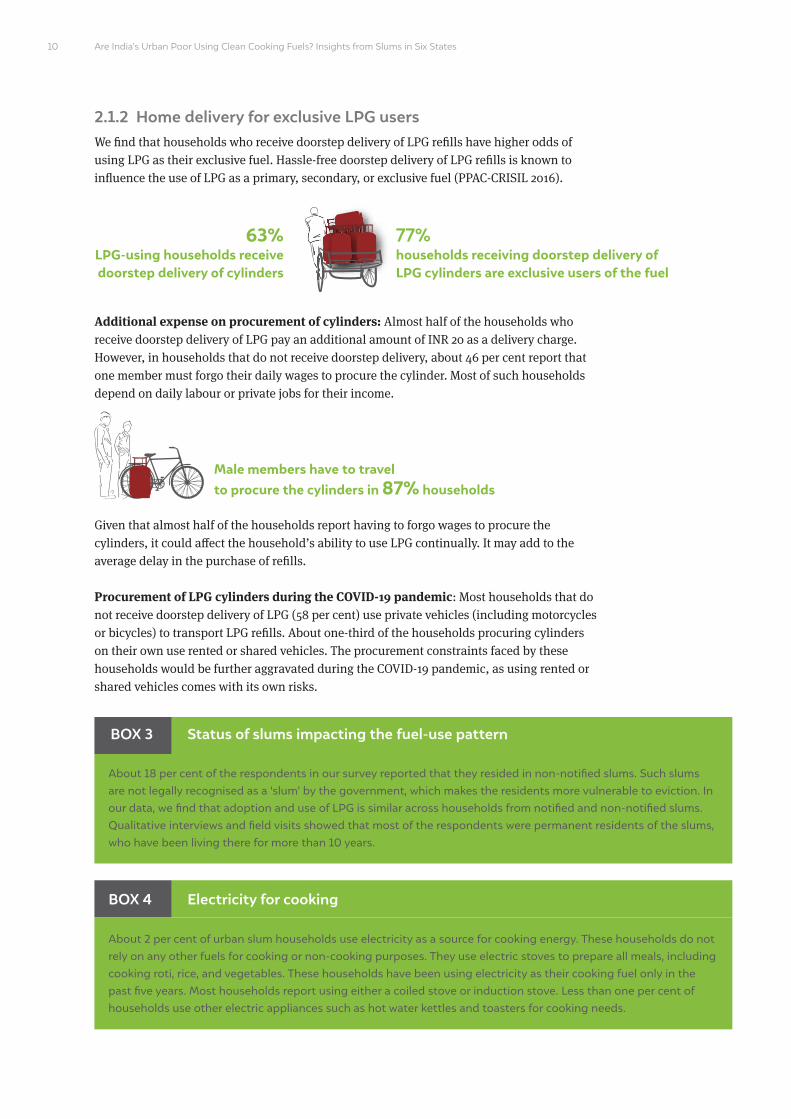
Are Indiarsquos Urban Poor Using Clean Cooking Fuels Insights from Slums in Six States
212 Home delivery for exclusive LPG users We find that households who receive doorstep delivery of LPG refills have higher odds of using LPG as their exclusive fuel Hassle-free doorstep delivery of LPG refills is known to influence the use of LPG as a primary secondary or exclusive fuel (PPAC-CRISIL 2016)
Additional expense on procurement of cylinders Almost half of the households who receive doorstep delivery of LPG pay an additional amount of INR 20 as a delivery charge However in households that do not receive doorstep delivery about 46 per cent report that one member must forgo their daily wages to procure the cylinder Most of such households depend on daily labour or private jobs for their income
Given that almost half of the households report having to forgo wages to procure the cylinders it could affect the householdrsquos ability to use LPG continually It may add to the average delay in the purchase of refills
Procurement of LPG cylinders during the COVID-19 pandemic Most households that do not receive doorstep delivery of LPG (58 per cent) use private vehicles (including motorcycles or bicycles) to transport LPG refills About one-third of the households procuring cylinders on their own use rented or shared vehicles The procurement constraints faced by these households would be further aggravated during the COVID-19 pandemic as using rented or shared vehicles comes with its own risks
10
About 18 per cent of the respondents in our survey reported that they resided in non-notified slums Such slums are not legally recognised as a lsquoslumrsquo by the government which makes the residents more vulnerable to eviction In our data we find that adoption and use of LPG is similar across households from notified and non-notified slums Qualitative interviews and field visits showed that most of the respondents were permanent residents of the slums who have been living there for more than 10 years
About 2 per cent of urban slum households use electricity as a source for cooking energy These households do not rely on any other fuels for cooking or non-cooking purposes They use electric stoves to prepare all meals including cooking roti rice and vegetables These households have been using electricity as their cooking fuel only in the past five years Most households report using either a coiled stove or induction stove Less than one per cent of households use other electric appliances such as hot water kettles and toasters for cooking needs
BOX 3
BOX 4
Status of slums impacting the fuel-use pattern
Electricity for cooking
77
households receiving doorstep delivery of LPG cylinders are exclusive users of the fuel
63LPG-using households receive doorstep delivery of cylinders
Male members have to travel to procure the cylinders in 87 households
11Cooking fuel adoption and use in urban slum households
About 4 per cent of urban slum households in the sample reported stacking with kerosene as their secondary fuel Most of these households are in Uttar Pradesh These households also use kerosene more than once a week for cooking
BOX 5 Use of kerosene as a cooking fuel
22 Households stacking LPG with polluting fuels Across the six states almost half of the households (45 per cent) reported using polluting fuels Here we discuss the characteristics and fuel use patterns of households that stack clean and unclean fuels
Though 86 per cent of the households surveyed have an LPG connection we find that over a third (33 per cent) of them stack it with polluting fuels (including firewood dung cakes agriculture residue charcoal and kerosene) The increased stacking could also be a result of more households adopting LPG since households tend to not replace biomass-based fuels completely (Cheng and Urpelainen 2014) These households would need to transition to exclusive use of clean cooking fuels to reduce the health impacts on women and children from household air pollution
About 44 per cent of the households that are stacking fuels rely on informal sources for refills Such households have not ordered any refills in the past one year from their LPG distributors These households mainly rely on recurring cylinders from their neighbours or relatives9
Figure 4 Of the households that stack fuels most use LPG as their primary fuel
Source Authorsrsquo analysis
9 It is important to note that sharing LPG cylinders among neighbours and extended family is a regular phenomenon in small towns and rural areas owing to availability challenges and it is not necessarily driven by an intention to siphon off subsidy amounts against the commodity ( Jain et al 2018)
Exclusive clean fuel users
Stacking with LPG as the primary fuel
Only polluting fuel users
Stacking LPG with polluting fuels
Stacking with LPG as the secondary fuel
55
3388
12
12
Are Indiarsquos Urban Poor Using Clean Cooking Fuels Insights from Slums in Six States12
221 Household factors that determine the decision to stack fuels Even within the stacking households the reason for stacking multiple fuels varies significantly Primarily households who stack can be divided into two categories ndash those that stack as they cannot afford LPG refills and those that stack due to other factors like taste preferences and alternate end-uses of the fuel
Households who are stacking primarily due to affordability concerns ndash Across asset quintiles we find that stacking is most common among the middle categories (second and third quintile) where most have adopted LPG Still the affordability of the fuel remains a significant concern More than 60 per cent of the households that are stacking fuels collect or prepare firewood or dung cakes free of cost rather than purchasing them from the market Those who buy biomass do not spend more than INR 100 per month on it Based on the responses of the primary cook we note that the high cost of LPG and free-of-cost availability of solid fuels are the most common factors that affect the fuel choices made by the household
Figure 5 Stacking is prevalent in households across asset quintile categories
Source Authorsrsquo analysis
1 2 3 4 5
Asset quintile categories
0
20
40
60
80
100
Per
cent
age
of h
ouse
hold
s
Exclusive clean fuel users Stacking LPG with polluting fuels Only polluting fuel users
5348
52
6367
2441 37
3232
2311 11
51
Households who use LPG primarily and polluting fuels as secondary fuels have a median annual refill rate of
6 cylinders
Households who use polluting fuels primarily and LPG as a secondary fuel have a median annual refill rate of
4 cylinders
13
Households that are stacking for reasons beyond affordability ndash More than one-fourth of the households that are stacking have a median annual refill rate of eight cylinders and above despite having a similar household size as others Most such households fall in the highest asset quintiles This suggests that they are not necessarily using unclean fuels due to the unaffordability of LPG but due to other factors such as taste preference for chulhas and fuel end-uses that influence the householdrsquos decision to use solidpolluting fuels Such households reported using LPG for a median period of six years The solid fuels are primarily used for cooking chapatis or vegetables in these households
Interestingly even households with multiple LPG connections and two cylinder connections report stacking with polluting fuels The possession of multiple LPG connections in these households may not necessarily be an indicator of diversion mdash the average family size of these households is more than eight indicating the high possibility of having separate kitchens within the same household Given that such households have a median annual refill rate of ten cylinders another plausible reason for multiple connections is that it prevents them from relying on just one distributor which increases their chances of getting refills whenever needed
222 End-uses of polluting fuels Across both the groups discussed above half of the households who stack with polluting fuels use these fuels at least once a day (Figure 6) Also almost 45 per cent of the households that stack fuels use multiple stoves at the same time while preparing a single meal This indicates that even if the household is using LPG for a particular meal they would be using their chulha simultaneously
Despite using LPG as the primary fuel for their cooking needs households that are stacking fuels use polluting fuels for non-cooking purposes like heating water for bathing (29 per cent) and space heating (10 per cent)
Figure 6 Almost half of the households using polluting fuels use it every day
Source Authorsrsquo analysis
0 5 10 15 20
19
11
21
20
29
25 30 35
Percentage of households
Freq
uenc
y of
use
of p
ollu
ting
fuel
s Several times a day
Once per day
Few times a week
Once a week
Occasionally
21 households stacking fuels
have more than one LPG connections
25 households stacking fuels have two-cylinder connections
Cooking fuel adoption and use in urban slum households
Are Indiarsquos Urban Poor Using Clean Cooking Fuels Insights from Slums in Six States14
223 Seasonal variations in the stacking of fuels We also noted a significant seasonal change in fuel use patterns LPG is most popular in the rainy season (88 per cent) and least popular in the winter months (45 per cent) (Figure 7) The dampness associated with solid fuels in the rainy season could be the reason for using LPG primarily during these months The literature also suggests that solid fuels are a popular choice during winter months (S Singh 2014 Baqir et al 2019) This could be because during winter months the solid fuel requirement for non-cooking tasks within the household likes water heating for bathing and space heating increases Since households are already using solid fuels for non-cooking tasks they may be using these fuels more for cooking during winter Unfortunately the increased use of solid fuels in winter exacerbates the much higher air pollution exposure of these households due to unfavourable atmospheric conditions
Figure 7 Proportion of urban slum households using solid fuels as the primary cooking fuel increases during the winters months aggravating household air pollution exposure due to unfavourable atmospheric conditions
Source Authorsrsquo analysis
About 3 per cent of urban slum households reported owning an electric water-heating device (geyser or immersion
rod) Similarly only 4 per cent of the households own an electric room heater
BOX 6 Electric devices for water heating and space heating
Summer Winter Rainy Festival0
20
40
60
80
100
120
Per
cent
age
of h
ouse
hold
s
LPG Solid fuel
78
45
88
67
22
55
1233
15
Figure 8 Lack of awareness about receiving LPG refill subsidies poses a threat to the success of LPG subsidy schemes
Source Authorsrsquo analysis
Connections under the Pradhan Mantri Ujjwala Yojana (PMUY) 23 per cent of these households reported receiving benefits under the PMUY
The six states included in the survey account for a significant share of PMUY coverage ndash 54 per cent of all connections provided under PMUY (PPAC 2019) However most of these connections cater to rural households One of the reasons for there being fewer PMUY connections in urban areas is that more than half of all urban slum households reported already having had LPG connections for over four years (before the launch of PMUY) Moreover over a quarter of PMUY households10 in urban slums reported having multiple LPG connections which suggests that not every household which was using LPG before the PMUY was prevented from accessing the schemersquos benefits
Government support during the COVID-19 pandemic During the COVID-19 lockdown the government announced the provision of three free-of-cost refills for PMUY households under the PM-Garib Kalyan Yojana While PMUY households in urban slums benefitted from this scheme non-PMUY households in urban slums did not As documented urban slum households faced a significant economic hit due to the loss of jobs and incomes during the pandemic (Patel 2020) Non-PMUY households that stack for economic reasons are more likely to use cheaper and freely available solid fuels without additional support from the government
PAHAL-Direct Benefit Transfer for LPG (DBTL)Overall about 42 per cent of active LPG users11 reported receiving a subsidy for their last LPG refill under the Direct Benefit Transfer for LPG scheme (DBTL) However about 28 per cent of urban slum households reported not knowing if they had received the subsidy amount for their last refill this suggests that the primary cook is often unaware of whether the subsidy is credited to the household Among the ones that reported receiving the LPG subsidy about 40 per cent of the primary cook were not aware of the amount of subsidy being credited into their account
10 This is a relatively smaller sample of 43 households from all the PMUY households in urban slums (131 households)
11 Households that have taken at least one refill in the past year
42
30
28
Received LPG refill subsidy
30 Still repaying PMUY loan
Did not receive LPG refill subsidy
10 Gave up LPG refill subsidy
Do not know
60 LPG refill susbsidy not received due to other reasons
Cooking fuel adoption and use in urban slum households
Are Indiarsquos Urban Poor Using Clean Cooking Fuels Insights from Slums in Six States16
23 Households using only polluting fuels About 12 per cent of urban slum households rely entirely on polluting fuels for all cooking and non-cooking purposes While the share of these households is relatively small the non-adoption of LPG in such households despite
programmes like the PMUY is concerning These households either use a combination of different polluting fuels (firewood dung cakes agricultural residue charcoal and kerosene) or just one of these fuels for all their energy needs Firewood is the most commonly used fuel in these households
231 Reasons for the non-adoption of LPGHouseholds that rely exclusively on polluting fuels reported not having an LPG connection Though three-fourths of these households were aware of PMUY the high upfront cost of an LPG connection along with the high recurring cost of procuring refills remain the two most important reasons for not procuring an LPG connection Repondents also mentioned a lack of information on how to procure a connection as a reason These reasons align with the common causes cited by rural households covered in the survey implying that the challenges faced by rural households and urban slum households in procuring connections are similar
Almost half of the households in this category use solid fuels for non-cooking purposes such as heating water for bathing space heating and preparing fodder for animals On the positive aspects of using polluting fuels households reported the following free-of-cost easy availability of fuels better tasting food and preference of family members for food cooked on the chulha
232 Fuel availability and affordabilityIn contrast with households that stack fuels households that use only solid fuels rely on purchasing fuels rather than collecting or preparing them For instance 60 per cent of firewood users in this category procure fuel by purchasing rather than collecting it
Households with low asset ownership rely on polluting fuels for cooking These households spend 2ndash3 per cent of their median monthly expenditure on fuel (INR 75 per month on fuel) which is much lower than what they would have to spend if they used LPG exclusively (INR 496 per month) Households that collect solid fuels spend about two hours on a single trip (three times a month) travelling a median one-way distance of 2 km This is equivalent to the distance travelled to procure LPG cylinders (if not delivered at home)
Figure 9 More than half of the households currently without LPG do not know how to get a connection or whom to ask about it implying a lack of awareness
Source Authorsrsquo analysis
0 10 20 30 40 50 60 70
39
53
63
68
80
Percentage of households
Rea
sons
for N
on-A
dop
tion
of L
PG Installation is expensive
Monthly expenditure on LPG is high
Do not know how to get or whom to ask
Not availabletoo far
17
12 See Annexure III for details on the districts and their PM25 concentrations The data for 15 districts (from Bihar Uttar Pradesh Madhya Pradesh and Rajasthan) overlapping with the survey sample have been analysed based on the availability of air quality data from continuous monitoring stations
13 Air quality categories based on PM25 concentration (in μgm3)
Good 0 to 30 Satisfactory 31 to 60 Moderately polluted 61 to 90 Poor 91 to 120 Very poor 121 to 250 Severe above 250 (Central Pollution Control Board 2014)
Cooking fuel adoption and use in urban slum households
Winter months have the highest PM25 concentrations coinciding with the sharp increase in use of polluting fuels for heating bath water and room heating
233 Gendered time use in households using solid fuelsIn urban slums both the male and female members of the household are equally involved in collecting firewood Still it is primarily the female members of the household who undertake dung cake preparation In addition to engaging in fuel collection and preparation women tend to spend more time cooking in households using solid fuels About 85 per cent of households that transitioned to LPG in the past four years reported having saved time while cooking compared to when they used solid fuels
SPOTLIGHT I Household air pollution (HAP) in urban slums
Burning solid fuels in three-stone fires and mud stoves with inadequate ventilation causes high levels of smoke exposure and negative health impacts particularly for women and young children (WHO 2014)
The double burden of ambient and household air pollution on the urban slum populationUsing the PM25 data from continuous ambient air quality monitoring stations (CAAQMS) for 15 districts12 in our sample we found that the ambient air quality remained in the lsquopoorrsquo or worse category13 for most districts throughout the year variation in the ambient air quality
Are Indiarsquos Urban Poor Using Clean Cooking Fuels Insights from Slums in Six States
Impact of ventilation
Indoor cooking and low adoption of chimney indicates high exposure to pollution from the use of unclean fuels for cooking The proportion of households with a chimney is high (52 per cent) among those who rely only on polluting fuels Smith and Pillarisetti (2017) explain that while having a good chimney lowers peak levels of indoor pollution long-term average exposure is reduced only by a factor of two Besides chimneys require regular maintenance to function correctly While more than 45 per cent of the households are using polluting fuels less than 20 per cent of the slum housheolds use improved cookstoves
Households also use solid fuels for non-cooking uses like space heating On average each house in a slum has two rooms this effectively exposes all members of the household to emissions from burning fuels Emissions from household sources contribute significantly to the surrounding air quality (Harish et al 2019) this concern is exacerbated in congested slum areas
the winter months (November to February) have the highest concentration of PM25 This leads to a double burden of exposure for slum households stacking solid fuels as they are more likely to increase use of solid fuels in winters (Figure 7) Alternatively the use of LPG as the primary source of fuel increases during the rainy season (June to September) these months record the least ambient air pollution
We also find that districts like Meerut Ghaziabad Patna Gautam Buddha Nagar (Noida and Greater Noida) and Muzaffarpur have the highest frequency of lsquovery poorrsquo air quality days throughout the year Across these districts one-third of households use polluting fuels for cooking In urban slums where households are more densely packed the emissions from burning solid fuels increase the risk of exposure inside households and deteriorate the ambient air quality for the community at large As a result these communities suffer from both increased household and ambient air pollution HAP has an estimated average contribution of 30ndash50 per cent to ambient air quality across Indiarsquos urban and rural areas (Balakrishnan et al 2019) Addressing biomass burning for cooking water heating and space heating during the winters has the potential to help reach the national ambient air quality standards (Chowdhury et al 2019) Despite that only 2 per cent of the action points in 44 city clean air plans mention cooking and heating as a sector to address air pollution (Ganguly Selvaraj and Guttikunda 2020)
18
75 householdsrsquo
using polluting fuels cook inside
the main house
67 householdsrsquo using polluting fuels do not have a chimney for ventilation
Awareness about the health impacts of using polluting fuelsAbout 60 per cent of households using only polluting fuels and 84 per cent of households that stack LPG with a polluting fuel report lsquotoo smokyrsquo as the most prominent negative aspect of using polluting fuels This suggests that as more households switch to clean cooking fuels perceptions regarding pollution fuels change
Three-fourths of primary cooks who use polluting fuels for cooking agree that smoke from solid fuels is harmful to them this implies that awareness of the adverse health impacts of polluting fuels does not necessarily lead to the uptake of clean fuels Primary cooks also agree that smoke from solid fuels causes coughing (49 per cent) and lung infections in children (39 per cent)
Exposure to air pollution is a known risk factor for underlying chronic diseases that predict the severity of
COVID-19 disease and patient outcomes (World Bank 2020) This linkage suggests a heightened risk for women
in all age groups who cook using traditional technologies and fuels (World Bank 2020) The highest number of
COVID-19 cases were recorded in the most polluted regions among patients with pre-existing health conditions
(Frontera et al 2020)
Results from a controlled study show a higher prevalence of chronic obstructive pulmonary disease (COPD)
among biomass fuel users than clean fuel users ( Johnson et al 2011) The available clinical data to date suggest
that cardiovascular disease diabetes chronic respiratory illness and hypertension ndash conditions all strongly
associated with exposure to HAP ndash are also risk factors for COVID-19 (World Bank 2020)
BOX 7 Impact of household air pollution on COVID-19
19Cooking fuel adoption and use in urban slum households
Are Indiarsquos Urban Poor Using Clean Cooking Fuels Insights from Slums in Six States
Traditionally women bear a disproportionate burden in collecting and preparing biomass for cooking While this burden reduces with the use of clean cooking fuels like LPG the fuel supply within the household is then determined by formal and monetised distribution networks involving an outlay of money (Patnaik and Jha 2020) Our data shows that womenrsquos status in the household (as heads of households)14 positively correlates with households using LPG as their primary fuel The existing literature also supports the idea that female-headed households prefer modern fuels to polluting ones (Farsi Filippini and Pachauri 2007 Rao and Reddy 2007 Kuo and Azam 2019) Other research also suggests that female-headed households are more willing to spend on LPG as a recurring expense (Kojima Bacon and Zhou 2011 Kuo and Azam 2019)
SPOTLIGHT II Womenrsquos participation in intra-household decision-making regarding LPG use
20
14 In almost half of the households surveyed the primary cook reported a female member being the head of the household The reason behind such high percentage of female-headed households could be because only the primary cook of every household (who is mostly female) was surveyed This does not mean that these households do not have any adult male members Traditionally headship refers to the head of household as the individual whose lsquoauthorityrsquo the household members recognise But this definition overlooks potential intra-household variations in the recognised authority in different realms of decision-making (Kilic Moylan and Koolwal 2020) Since cooking is a gendered activity the primary cookrsquos response to the head of household question may have been with respect to the recognised authority figure for that activity within the household
30 householdsrsquo female members place the order for LPG refills
50householdsrsquo female
members decide whether or when to purchase LPG refills
We also find that the decision of whether or when to purchase LPG refills is made by male members in half of urban slum households This holds for both male- and female-headed households In LPG-using households where the primary cook is involved in an income-generating activity more women are deciding to order the refills This pattern is similar irrespective of whether the household uses LPG exclusively or stacks it with other polluting fuels or are PMUY beneficiaries
SPOTLIGHT III A comparison of access to clean cooking energy between urban slum and non-slum households across six states
21
At the state level Bihar has significantly poor involvement of women in intra-household decision-making regarding
ordering refills with less than 10 per cent of households reporting that women decide whether or when to order
refills However more women than men are involved in decisions around LPG refills in Rajasthan Madhya Pradesh
and Jharkhand
Across caste groups the involvement of women is lowest (37 per cent) among the Scheduled Castes (SCs)
However more women in General and OBC households decide when to order LPG refills
BOX 8 Variations in intra-household decision-making across states and caste groups
Cooking fuel adoption and use in urban slum households
To compare the fuel use patterns of urban slum and non-slum households we used data from the India Residential Energy Survey (IRES 2020)15 The overlap in the sampling strategies of both IRES and our survey enabled a comparison of the findings There is a significant difference in the socio-economic status of slum and non-slum households which tends to affect their fuel use patterns Table 4 provides a comparison of cooking fuel usage in urban non-slum households (from IRES 2020) and urban slum households (Cooking Energy Access and Use survey 2020)
Are Indiarsquos Urban Poor Using Clean Cooking Fuels Insights from Slums in Six States22
Table 4 The poor economic condition of households in urban slums impacts the exclusive use of clean fuels for cooking
Source Authorsrsquo analysis
Fuel use categories Urban slum households (Cooking Energy Access Survey) ()
Non-slum urban households (IRES) ()
95 88
84 55
9 33
5 12
Clean fuel users (LPG PNG and electricity)
LPG as an exclusive fuel
Households that stack LPG with polluting fuels
Households that use only polluting fuels
We observed a significant gap in the exclusive use of LPG as a cooking fuel between urban slums and non-slum households explained mainly by the difference in their economic conditions Stacking is three times more common in slum households than non-slum households About 45 per cent of non-slum households using polluting fuels belong to marginalised social groups (SCs and STs) Households using polluting fuels have a lower median monthly expenditure than others and about 62 per cent of such households are semi-pucca or kuchha structures Among LPG users non-slum households have a slightly higher rate of doorstep delivery as compared to slum households
LPG-using households receiving home deliveries
Source Authorsrsquo analysis
239
6372
Urban slum households (Cooking Energy Access and Use)
()
Non-slum urban households (IRES)
()
Proportion of PMUY beneficiaries among LPG-using households
15 IRES 2020 was conducted in 21 large states of India including Bihar Jharkhand Rajasthan Madhya Pradesh Uttar Pradesh and Chhattisgarh While IRES 2020 focused on urban households the Cooking Energy Access and Use survey specifically attended to urban slums in the same districts Refer to the technical note for a detailed methodology of the survey
23
3 Way forward
Slums across the world are chronically ignored in public policy and suffer because of unauthorised and unsafe habitation without access to government services (Shahadat
Lipu and Bhuiyan 2014) In terms of energy access while we see a progressive change in householdsrsquo energy use patterns as we move from rural to urban issues like affordability availability preference and familiarity with the fuel and stove remain essential factors that determine householdsrsquo fuel choice
Image iStock
Are Indiarsquos Urban Poor Using Clean Cooking Fuels Insights from Slums in Six States24
Understanding categories of users is important for enabling access to and use of clean cooking fuels
We categorised the urban slum population based on their fuel usage patterns ndash using only clean fuels stacking clean fuels with polluting fuels and using only polluting fuels While most households in urban slums have an LPG connection only half of them use LPG exclusively The householdrsquos economic status and its access to doorstep delivery of LPG refills are two crucial factors that determine its ability to use LPG exclusively Despite being situated in urban areas 37 per cent of slum households do not receive home delivery of cylinders ndash availability is an essential factor in determining the householdrsquos likelihood of using LPG exclusively There is a strong impetus for the OMCs and distributors to improve their home delivery services of LPG refills in slum areas
Stacking is prevalent in about one-third of households ndash there is a need for a deeper understanding of householdsrsquo preferences fuel end-uses and awareness Most households reported using polluting fuels daily or at least weekly this effectively increases their exposure to household air pollution despite having access to clean cooking fuels Among households that stack LPG with polluting fuels the reasons for stacking differ ndash affordability seasonality and taste preference More than a quarter of households that stack have a similar level of LPG consumption as those that use LPG exclusively despite similar family sizes Such households use polluting fuels not because of their inability to afford LPG But other factors like free-of-cost availability of biomass taste preference for chulha and alternate end-uses of fuelmdashfor instance in space heatingmdashinfluence the householdrsquos decision to use solid fuels Among households that stack multiple fuels the use of polluting fuels increases during winter months this exposes the households to a double burden of high ambient and household air pollution in these months About 40 per cent of these households also use polluting fuels for non-cooking purposes like heating water for bathing and space heating especially in winter
Even with large-scale government initiatives like PMUY we find that more than 10 per cent of urban slum households do not use LPG They mainly rely on free-of-cost biomass for their cooking and non-cooking needs Despite awareness of PMUY among these households the high upfront cost of procuring an LPG connection and high recurring expenditure on refills deter them from using LPG Evidently there is a need to expand the reach of PMUY to cover households across slums
Integrating the issue of lack of access to clean cooking energy within the discussion on urban poverty
This study reiterates the need to look at poverty in urban areas in the context of energy access Given the heterogeneity of poverty in urban and semi-urban India it is essential to understand energy poverty in the context of access to resources for an enhanced quality of life for the urban poor Similarly slums dwellers in large and small cities alike may experience additional challenges of access Furthermore not all urban poor live in slums we know even less about the access issues of temporary residents or seasonal migrants in urban India Therefore in a rapidly urbanising India studies on the urban poor and air quality need to integrate a focus on energy access to address the vulnerability of women children and communities to HAP and the drudgery of using polluting fuels for cooking and other household energy needs
Access to clean cooking energy schemes must be integrated into the social assistance programmes focused on urban poverty alleviation to enhance its reach
25Way forward
Converging energy access in social protection policies for the urban poor
Accounting for the vulnerabilities of the urban poor is crucial in designing and implementing policies including social protection schemes As a health and economic imperative access to clean cooking energy schemes must be integrated into the social assistance programmes of other ministries (eg health education and nutrition assistance) to offer better support to slum households This would also reduce the burden on households of claiming and accessing multiple benefits across schemes thus freeing them to invest more time in productive activities (CEEW 2020) Government programmes such as the National Urban Livelihoods Mission and social service allocations for housing should use existing targeting approaches to include access to clean cooking energy within the ambit of services for the poor
Bringing a renewed emphasis on clean cooking energy access due to COVID-19 is essential
Most households in urban slums rely on daily wage labour or the gig economy for their household income During the COVID-19 pandemic these occupations have been among the worst impacted by the lockdown and the economic slowdown A survey conducted with over 2000 daily wage workers in urban slums during the lockdown suggests that only 7 per cent of respondents from this group received pay during the lockdown (Basu 2020) causing a massive shock to their livelihoods and wage earnings This kind of impact pushes households into energy poverty leading to the increased use of free-of-cost biomass and consequently increasing the risk of exposure to emissions from fuel burning While the government has committed to supplying up to three free refills to all PMUY households under PM-Garib Kalyan Yojana less than a quarter of households in urban slums have Ujjwala connections The low share of PMUY households effectively makes the majority of slum households ineligible for relief support given under the PM-Garib Kalyan Yojana during the lockdown There is a need to target vulnerable households ndash beyond PMUY beneficiaries ndash with differential subsidy support for using LPG in a sustained manner
Increased poverty would mean increased use of polluting fuels ndash there is a need for a renewed emphasis on clean cooking energy access during the COVID-19 pandemic as increased use of polluting fuels has health implications (lower respiratory infections and COPD) that increase the risk of COVID-19 infections being more severe
There is a need to target vulnerable households ndash beyond PMUY beneficiaries ndash with differential subsidy support for using LPG in a sustained manner
Are Indiarsquos Urban Poor Using Clean Cooking Fuels Insights from Slums in Six States
Balakrishnan Kalpana Sagnik Dey Tarun Gupta R S Dhaliwal Michael Brauer Aaron J Cohen Jeffrey D Stanaway et al 2019 ldquoThe Impact of Air Pollution on Deaths Disease Burden and Life Expectancy Across the States of India The Global Burden of Disease Study 2017rdquo The Lancet Planetary Health 3 (1) e26ndash39 httpsdoiorg101016S2542-5196(18)30261-4
Baqir M S K Bharti R Kothari and R P Singh 2019 ldquoAssessment of an Energy-efficient Metal Chulha for Solid Biomass Fuel and Evaluation of its Performancerdquo International Journal of Environmental Science and Technology 16 (11) 6773ndash6784 httpsdoiorg101007s13762-018-2028-9
Basu Anika Badyal 2020 ldquoLockdown Survey How The Covid-19 Crisis Has Affected Daily Wage WorkersmdashAIFrdquo American India Foundation June 28 httpsaiforglockdown-survey-how-the-covid-19-crisis-has-affected-daily-wage-workers
Butera F M P Caputo R Adhikari and A Facchini 2016 ldquoThe Challenge of Energy in Informal Settlements A Review of the Literature for Latin America and Africardquo Procedia Engineering 1ndash32 httpswwwenelfoundationorgcontentdamenel-foundtopic-downloadThe challenge of Energy in Informal settlementspdf
CEEW 2020 ldquoEnergy Safety Nets India Case Studyrdquo Vienna Sustainable Energy for All httpswwwceewinpublicationsenergy-safety-nets-india-case-study
Central Pollution Control Board 2014 ldquoNational Air Quality Indexrdquo New Delhi Central Pollution Control Board httpsappcpcbccrcomccr_docsFINAL-REPORT_AQI_pdf
Chafe Z S Mehta and K R Smith 2011 ldquoAmbient Fine Particulate (PM25) Air Pollution Attributable to Household Cooking Fuel in Asiardquo AGUFM A54Bndash03 httpsuiadsabsharvardeduabs2011AGUFMA54B03Cabstract
Chandramouli C 2010 ldquoCensus of India 2011 ndash Circular No 8rdquo New Delhi Ministry of Home Affairs httpscensusindiagovin2011-CircularsCircularsCircular-08pdf
Chandrasekhar S and Arup Mitra 2018 ldquoMigration Caste and Livelihood Evidence from Indian City-slumsrdquo Urban Research amp Practice 12 (2) 156ndash172 httpsdoiorg1010801753506920181426781
Cheng Chao Yo and Johannes Urpelainen 2014 ldquoFuel Stacking in India Changes in the Cooking and Lighting Mix 1987ndash2010rdquo Energy 76 (November) 306ndash317 httpsdoiorg101016jenergy201408023
Chowdhary Sourangsu Sagnik Dey Sarath Guttikunda Ajay Pillarisetti Kirk R Smith and Larry Di Girolamo 2019 ldquoIndian annual ambient air quality standard is achievable by completely mitigating emissions from household sourcesrdquo Proceedings of the National Academy of Sciences 116 (22) 10711-10716 httpsdoiorg101073pnas1900888116
Dhingra Chhavi Shikha Gandhi Akanksha Chaurey and P K Agarwal 2008 ldquoAccess to Clean Energy Services for the Urban and Peri-Urban Poor A Case-study of Delhi Indiardquo Energy for Sustainable Development 12 (4) 49ndash55 httpsdoiorg101016S0973-0826(09)60007-7
Farsi Mehdi Massimo Filippini and Shonali Pachauri 2007 ldquoFuel Choices in Urban Indian Householdsrdquo Environment and Development Economics 12 (6) 757ndash774 httpsdoiorg101017S1355770X07003932
References
26
Frontera Antonio Lorenzo Cianfanelli Konstantinos Vlachos Giovanni Landoni and George Cremona 2020 ldquoSevere Air Pollution Links to Higher Mortality in COVID-19 Patients The lsquoDouble-Hitrsquo Hypothesisrdquo Journal of Infection 81 (2) 255ndash259 httpsdoiorg101016jjinf202005031
Ganguly Tanushree Kurinj L Selvaraj Sarath K Guttikunda 2020 ldquoNational Clean Air Programme (NCAP) for Indian cities Review and outlook of clean air action plansrdquo Atmospheric Environment X Vol 8 httpsdoiorg101016jaeaoa2020100096
GNESD 2008 ldquoClean Energy for the Urban Poor An Urgent Issuerdquo Accessed 25 July 2020 httpswwwgooglecomurlsa=tamprct=jampq=ampesrc=sampsource=webampcd=ampved=2ahUKEwi1hf2ru dntAhUCOisKHQH7BtsQFjAAegQIAxACampurl=http3A2F2Fwwwgnesdorg2F-2Fmedia2FSites2FGNESD2FPublication- pdfs2FSPM_CleanEnergyashx3Fla3Dda26hash3DE4971C585B6798F17954F8B42E073 D9507F42A84ampusg=AOvVaw08kCDgOkTkYc6wRDxzsNyq
Guan Wei-Jie Wen-Hua Liang Yi Zhao Heng-Rui Liang Zi-Sheng Chen Yi-Min Li Xiao-Qing Liu et al 2020 ldquoComorbidity and its Impact on 1590 Patients with COVID-19 in China A Nationwide Analysisrdquo European Respiratory Journal 55 (5) 2000547 httpsdoiorg1011831399300300547-2020
Harish Santosh Kirk R Smith Sourangsu Chowdhury Zoe A Chafe Ajay Pillarisetti Jos Lelieveld Sarath Guttikunda Sagnik Dey and Andrew P Grieshop 2019 ldquoThe Contribution of Household Fuels to Ambient Air Pollution in India A Comparison of Recent Estimates Edited by CcapcOrgInrdquo Collaborative Clean Air Policy Centre May 30 httpsccapcorginpolicy-briefs2019530the-contribution-of-household-fuels-to-ambient-air-pollution-in-india-a-comparison-of-recent-estimates
Jain Abhishek Saurabh Tripathi Sunil Mani Sasmita Patnaik Tauseef Shahidi and Karthik Ganesan 2018 ldquoAccess to Clean Cooking Energy and Electricity Survey of States 2018rdquo New Delhi CEEW httpswwwceewinsitesdefaultfilesCEEW-Access-to-Clean-Cooking-Energy-and-Electricity-11Jan19_0pdf
Johnson Priscilla Kalpana Balakrishnan Padmavathi Ramaswamy Santu Ghosh Muthukumar Sadhasivam Omprakash Abirami Bernard W C Sathiasekaran Kirk R Smith Vijayalakshmi Thanasekaraan and Arcot S Subhashini 2011 ldquoPrevalence of Chronic Obstructive Pulmonary Disease in Rural Women of Tamilnadu Implications for Refining Disease Burden Assessments Attributable to Household Biomass Combustionrdquo Global Health Action 4 (1) 7226 httpsdoiorg103402ghav4i07226
Kilic Talip Heather Moylan and Gayatri Koolwal 2020 ldquoGetting the (Gender-disaggregated) Lay of the Land Impact of Survey Respondent Selection on Measuring Land Ownership and Rightsrdquo Washington DC The World Bank httpsdoiorg1015961813-9450-9151
Kojima Masami Robert Bacon and Xin Zhou 2011 ldquoWho Uses Bottled Gas Evidence from Households in Developing Countriesrdquo The World Bank Sustainable Energy Department Oil Gas and Mining Unit httpelibraryworldbankorgdoibook1015961813-9450-5731
Kuo Ying-Min and Mehtabul Azam 2019 ldquoHousehold Cooking Fuel Choice in India 2004ndash2012 A Panel Multinomial Analysisrdquo IZA Discussion Paper No 12682 httpsssrncomabstract=3468630
Lippi Giuseppe and Brandon Michael Henry 2020 ldquoChronic Obstructive Pulmonary Disease Is Associated with Severe Coronavirus Disease 2019 (COVID-19) COPD and COVID-19rdquo Respiratory Medicine 167 105941 httpsdoiorg101016jrmed2020105941
Ministry of Housing and Urban Affairs 2019 ldquoHandbook of Urban Statisticsrdquo New Delhi Government of India httpmohuagovinpdf5c80e2225a124Handbook of Urban Statistics 2019pdf
Rao M Narasimha and B Sudhakara Reddy 2007 ldquoVariations in Energy Use by Indian Households An Analysis of Micro Level Datardquo Energy 32 (2) 143ndash153 httpsdoiorg101016jenergy200603012
27References
Are Indiarsquos Urban Poor Using Clean Cooking Fuels Insights from Slums in Six States28
National Buildings Organisation 2013 ldquoState of Slums in India a Statistical Compendium 2013rdquo New Delhi Government of India httpnbonicinpdfSlums_in_India_Compendium_English_Versionpdf
National Sample Survey Office 2012 ldquoKey Indicators of Urban Slums in India ndash 69th Roundrdquo New Delhi National Data Bank for Socio-religious Categories httpmospinicinsitesdefaultfilesnational_data_bankndb-rpts-69htm
Nolan Laura B 2015 ldquoSlum Definitions in Urban India Implications for the Measurement of Health Inequalitiesrdquo Population and Development Review 41 (1) 59ndash84 httpsideasrepecorgablapopdevv41y2015i1p59-84html
Nolan Laura B David E Bloom and Ramnath Subbaraman 2018 ldquoLegal Status and Deprivation in Urban Slums Over Two Decadesrdquo HHS Public Access 53 (15) 47ndash55
Patel Amit 2020 ldquoPreventing COVID-19 Amid Public Health and Urban Planning Failures in Slums of Indian Citiesrdquo World Medical amp Health Policy 12 (3) httpsdoiorg101002wmh3351
Patnaik Sasmita and Shaily Jha 2020 ldquoCaste Class and Gender in Determining Access to Energy A Critical Review of LPG Adoption in Indiardquo Energy Research amp Social Science 67 (September) 101530 httpsdoiorg101016jerss2020101530
PPAC-CRISIL 2016 ldquoAssessment Report Primary Survey on Household Cooking Fuel Usage and Willingness to Convert to LPGrdquo New Delhi Petroleum Planning amp Analysis Cell Ministry of Petroleum and Natural Gas Government of India httpswwwppacgovinWriteReadDataReports201710310449342512219PrimarySurveyReportPPACpdf
PPAC 2019 ldquoOil Industry Information at a Glancerdquo New Delhi Ministry of Petroleum and Natural Gas Government of India httpswwwppacgovinWriteReadDataReports201912060336500305462ReadyReckonerNov2019WebVersionpdf
Rahaman Mehebub and Dipendra Nath Das 2017 ldquoNature of Slum Growth in Indian Citiesrdquo Urban India 37 (II) 100ndash116 httpswwwresearchgatenetpublication334051882_Nature_of_Slum_Growth_in_Indian_Citiesread
Rains Emily Anirudh Krishna and Erik Wibbels 2018 ldquoUrbanisation and Indiarsquos Slum Continuum Evidence on the Range of Policy Needs and Scope of Mobilityrdquo London International Growth Centre httpswwwtheigcorgwp-contentuploads201802Rains-et-al_Working-paper_coverpdf
Ranjan Rahul and Sudershan Singh 2017 ldquoEnergy Deprivation of Indian Households Evidence from NSSO Datardquo New Delhi Munich Personal RePEc Archive httpsmpraubuni-muenchende835661MPRA_paper_83566pdf
Roy Debraj Bharath Palavalli Niveditha Menon Robin King Karin Pfeffer Michael Lees and Peter M A Sloot 2018 ldquoSurvey-based Socio-economic Data from Slums in Bangalore Indiardquo Nature Publishing Group 5 1ndash9 httpsdoiorg101038sdata2017200
Saksena Sumeet P B Singh Raj Kumar Prasad Rakesh Prasad Preeti Malhotra Veena Joshi and R S Patil 2003 ldquoExposure of Infants to Outdoor and Indoor Air Pollution in Low-income Urban Areas A Case Study of Delhirdquo Journal of Exposure Science amp Environmental Epidemiology 13 219ndash30 httpsdoiorg101038sjjea7500273
Lipu Molla Shahadat Hossain and Arif Waliullah Bhuiyan 2014 ldquoElectricity Access in Urban Slum Households of Bangladesh A Case of Dhakardquo Journal of Renewable and Sustainable Energy 6 (053112) 1ndash15 httpsdoiorg10106314896697
29
Singh Rozita Xiao Wang Emmanuel Ackom and Juan Reyes 2015 ldquoEnergy Access Realities in Urban Poor Communities of Developing Countries Assessments and Recommendationsrdquo Global Network on Energy for Sustainable Development (GNESD) httpswwwgooglecomurlsa=tamprct=jampq=ampesrc=sampsource=webampcd=ampved=2ahUKEwj5nbqI wdntAhXUTX0KHZE6DboQFjAAegQIAhACampurl=https3A2F2Forbitdtudk2Ffiles2F10635 24942FEnergy_access_realities_v_final_updatedpdfampusg=AOvVaw0xNBAAo0bjLueY9FmoigKF
Singh Santosh 2014 ldquoThe Kaleidoscope of Cooking Understanding Cooking Behaviour and Stove Preferences in Rural Indiardquo New Delhi Deutsche Gesellschaft fuumlr Internationale Zusammenarbeit (GIZ) GmbH httpswwwgizdeendownloadsgiz2014-en-kaleidoscope-of-cooking-indiapdf
Smith Kirk R and Ajay Pillarisetti 2017 ldquoHousehold Air Pollution from Solid Cookfuels and its Effects on Healthrdquo Disease Control Priorities 7 (3) 133ndash52 httpsdoiorg101596978-1-4648-0522-6_ch7
UN-Habitat 2003 ldquoThe Challenge of Slums ndash Global Report on Human Settlements 2003rdquo Location of publishing London UN-Habitat httpsunhabitatorgthe-challenge-of-slums-global-report-on-human-settlements-2003
Wang Bolin Ruobao Li Zhong Lu and Yan Huang 2020 ldquoDoes Comorbidity Increase the Risk of Patients with COVID-19 Evidence from Meta-analysisrdquo Aging 12 (7) 6049ndash6057 httpsdoiorg1018632AGING103000
WHO 2014 ldquoWHO Guidelines for Indoor Air Quality Household Fuel Combustionrdquo WHO Accessed 25 July 2020 httpwwwwhointairpollutionguidelineshousehold-fuel-combustionen
World Bank 2020 ldquoThe State of Modern Energy Cooking Servicesrdquo Washington DC World Bank httpdocuments1worldbankorgcurateden937141600195758792pdfThe-State-of-Access-to-Modern-Energy-Cooking-Servicespdf
Yenneti Komali Yehua Dennis Wei and Wen Chen 2017 ldquoThe Urbanization of Poverty in India Spatio-temporal Disparities in Consumption Expendituresrdquo Geographical Review 107 (2) 360ndash383 httpsdoiorg101111j1931-0846201612167x
References
Are Indiarsquos Urban Poor Using Clean Cooking Fuels Insights from Slums in Six States
Annexure 1 Asset ownership index We used Filmer and Pritchettrsquos (2001) proposed approach to construct an asset ownership index using principal component analysis (PCA) We chose the indicators based on data from the Cooking Energy Access survey 2020 The variables we considered for the index were based on classifications by Caroline Moser and Andrew Felton (2007) and K Harttgen (2013) We computed the asset index using housing characteristics and consumer durables as follows
Variables not included in the asset index
Four types of variables were eliminated
1 Variables (such as grid electricity) that had high usage of greater than 95 per cent
2 Those (such as ownership of laptops or computers air conditioners etc) that had a low usage of less than 5 per cent
3 Variables (like house ownership) that have economically fluctuating values
4 Those that indicated a low correlation of less than 20 per cent variation between the top category (ie first) of the asset quintile and the bottom-most category (ie fifth) of the asset quintile
For ease of interpretation we rescaled this index such that the final index values range between 0 and 10 For this purpose we used a feature scaling (or minndashmax scaling) formula
Xnorm (or (IVx)) = (X ndash Xmin)(Xmax ndash Xmin)
where IVx is the normalised index value Xmin is the initial minimum value (-354) and Xmax is the initial maximum value (461) of the asset ownership index
30
Annexures
bull Crowding16 inside the house bull Toilet ownership and usage bull Source of water bull Number of pucca rooms
bull Ownership of two-wheeler bull Ownership of washing machine bull Ownership of television bull Ownership of refrigerator bull Ownership of cooker
16 A household with more than three members occupying a single room is considered crowded (World Health Organization 2018)
Housing characteristics
Consumer durables
Annexure 2 Explaining the use of LPG as the exclusive fuel (simple logistic regression model)
31Annexures
Dependent variable exclusive LPG use
Education of the primary cook (categorical base category is education beyond the school level)
Education of the household head (categorical base category is education beyond the school level)
State (categorical base category includes households from Rajasthan)
P gt z 95 confidence interval
Odds ratio (SE)
1299 (0112)
0659 (0202)
1399 (0394)
0970 (0038)
0994 (0011)
1003 (0013)
2042 (0508)
1011 (0046)
0782 (0441)
1198 (0608)
1377 (0664)
1345 (0566)
3141 (1103)
1213 (0500)
0309 (0211)
1165 (0565)
1703 (0680)
0002
0174
0233
0446
0583
0839
0004
0812
0663
0722
0507
0482
0001
0639
0086
0753
0182
1097
0361
0806
0898
0973
0977
1254
0924
0259
0443
0535
0589
1578
0541
0081
0450
0779
1540
1203
2428
1048
1016
1029
3327
1106
2361
3240
3545
3070
6251
2720
1181
3014
3723
Asset index
Primary cook involved in income-generating activity
Female-headed households
Household size
Age of household head
Age of primary cook
Doorstep delivery of LPG cylinders
PMUY customer
Primary cook is not educated
Primary cook has a school education
Household head is not educated
Household head has a school education
Uttar Pradesh
Bihar
Chhattisgarh
Jharkhand
Madhya Pradesh
Number of households (n) = 417
Log likelihood = -228777
Prob gt chi2 = 0000
Pseudo R2 = 0126
The dependent variable is a dummy variable where households using LPG exclusively are assigned a value of 1 and all other households are assigned the value of 0
The caste of the household has not been factored into the regression as a separate variable because of its underlying influence on economic status
Source Authorsrsquo analysis
Are Indiarsquos Urban Poor Using Clean Cooking Fuels Insights from Slums in Six States
Annexure 3 Air quality (PM25 concentration in μgm3) across 15 districts based on CAAQMS data
32
Dis
tric
tsM
ar-1
9A
pr-1
9M
ay-1
9Ju
n-19
Jul-1
9A
ug-1
9Se
p-19
Oct
-19
Nov
-19
Dec
-19
Jan-
20Fe
b-20
Mar
-20
794
5
988
5
866
7
-
645
329
2
453
7
388
1
769
1
886
4
661
5
950
9
834
4
-
823
4
611
7
569
9
535
7
-
270
4
589
4
571
5
293
1
705
4
839
2
614
9
970
1
826
8
-
844
9
622
1
597
1
564
0
-
235
3
414
3
619
1
414
3
653
9
834
7
568
8
104
90
739
8
-
894
9
630
9
342
2
450
4
-
476
465
2
474
6
429
2
592
3
566
1
-
674
6
531
4
501
5
568
7
450
8
-
320
3
-
846
506
3
349
5
332
4
369
1
387
2
-
430
4
393
6
353
7
446
2
406
8
335
2
339
1
-
102
9
497
2
261
8
269
1
431
4
294
1
-
351
6
277
3
-
336
5
315
5
248
3
392
8
149
7
144
9
462
3
270
5
331
3
273
4
276
0
106
6
391
7
326
2
-
368
6
625
3
875
2
101
64
521
2
183
1
380
4
556
2
544
1
558
2
102
24
104
33
156
44
128
73
146
62
137
71
109
14
183
70
201
80
896
7
190
1
457
7
581
2
583
5
815
4
135
00
126
41
239
94
208
15
158
51
221
86
121
35
192
46
218
43
848
0
205
2
448
5
509
4
582
0
704
5
177
01
613
1
244
01
215
80
136
87
230
54
964
2
201
52
122
30
725
5
120
6
435
4
454
7
481
2
111
37
147
45
537
3
175
53
162
86
111
21
170
08
583
8
132
10
866
2
513
1
112
5
511
3
507
5
511
8
879
4
120
22
502
1
135
53
116
39
994
7
120
45
410
5
792
1
674
8
326
3
177
6
385
0
408
5
335
9
497
2
594
2
429
9
673
2
547
5
540
8
559
4
Gay
a
Muz
affa
rpur
Pat
na
Bho
pal
Satn
a
Alw
ar
Ajm
er
Ud
aip
ur
Ag
ra
Bul
and
shah
r
Hap
ur
Gha
ziab
ad
Gre
ater
Noi
da
Mee
rut
Noi
da
Sour
ce C
onti
nuou
s am
bien
t air
qua
lity
mon
itor
ing
stat
ion
(Mar
ch 2
019
ndash M
arch
202
0)
In a rapidly urbanising India it would be imperative for policymakers and practitioners in energy and urban development sector to integrate access to clean cooking energy within the ambit of services for the urban poor
Image CEEW
Are Indiarsquos Urban Poor Using Clean Cooking Fuels Insights from Slums in Six States
COUNCIL ON ENERGY ENVIRONMENT AND WATER (CEEW)
Sanskrit Bhawan A-10 Aruna Asaf Ali Marg Qutab Institutional AreaNew Delhi - 110 067 IndiaT +91 11 4073 3300
infoceewin | ceewin | CEEWIndia
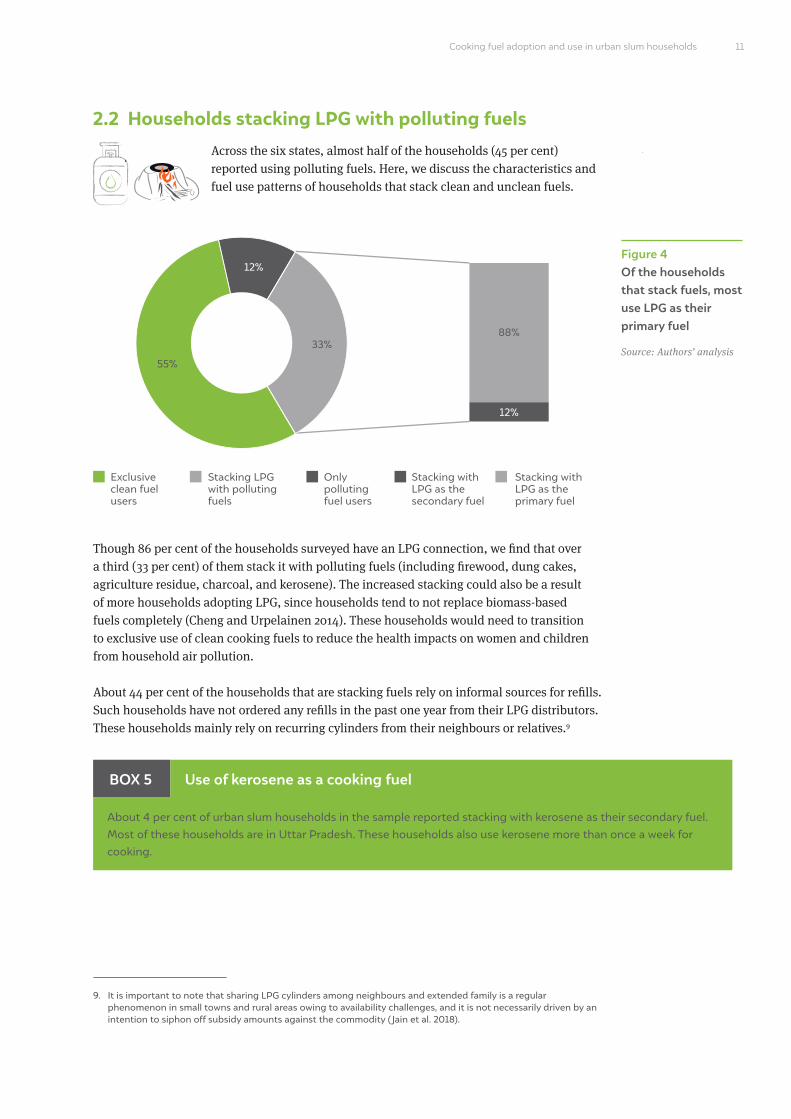
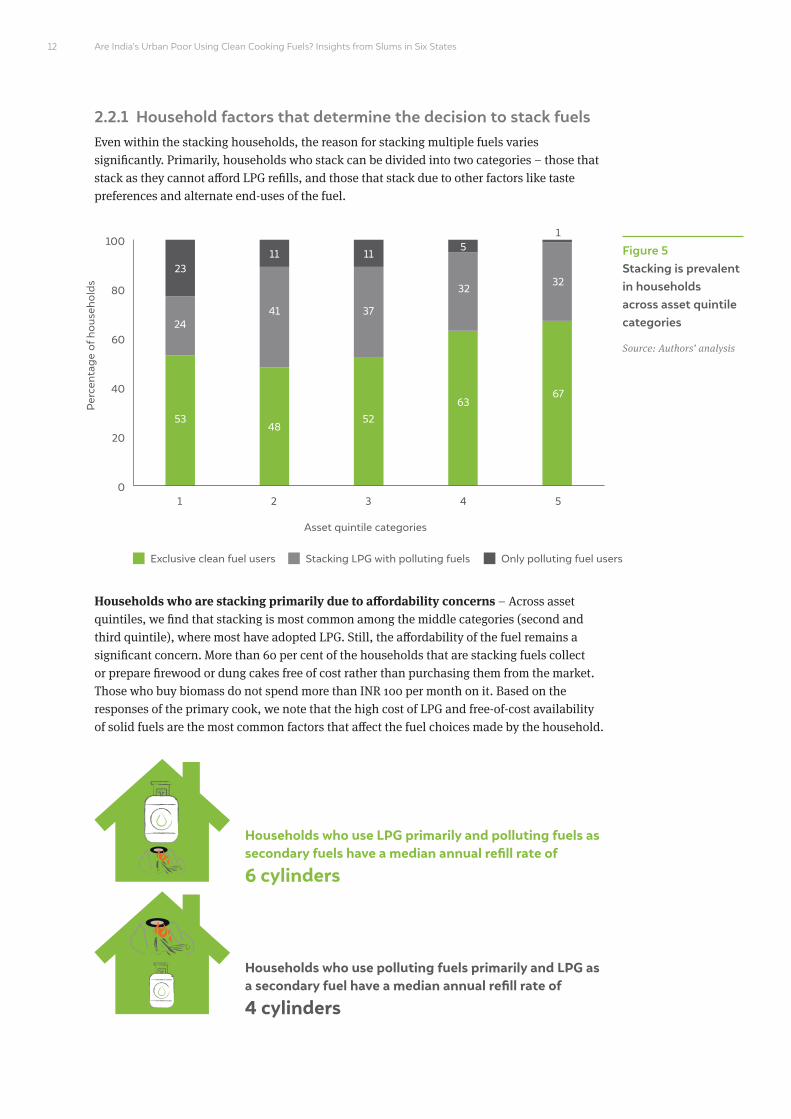
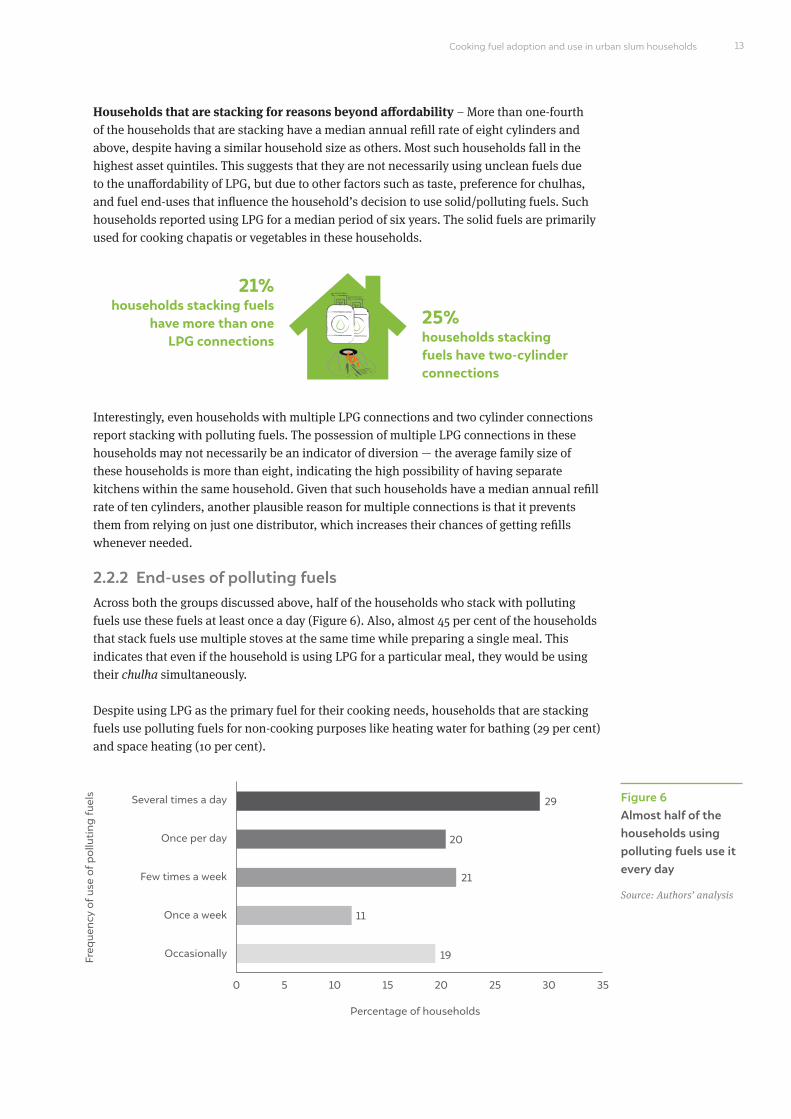
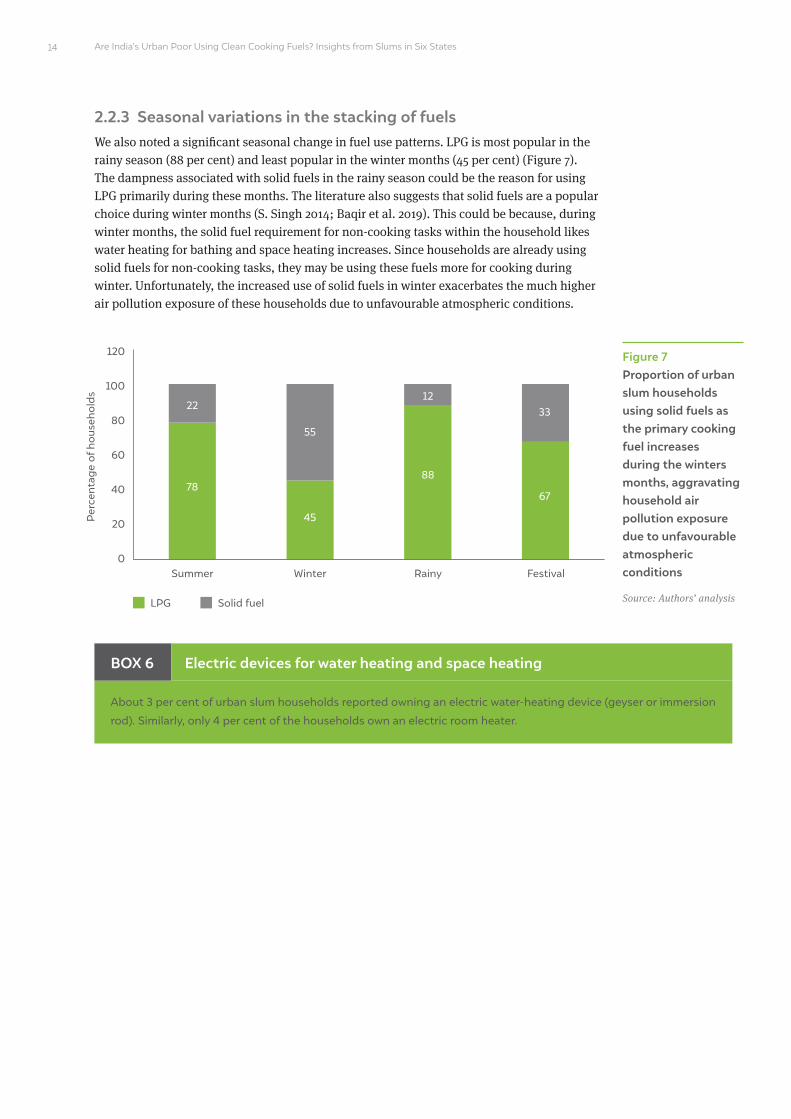
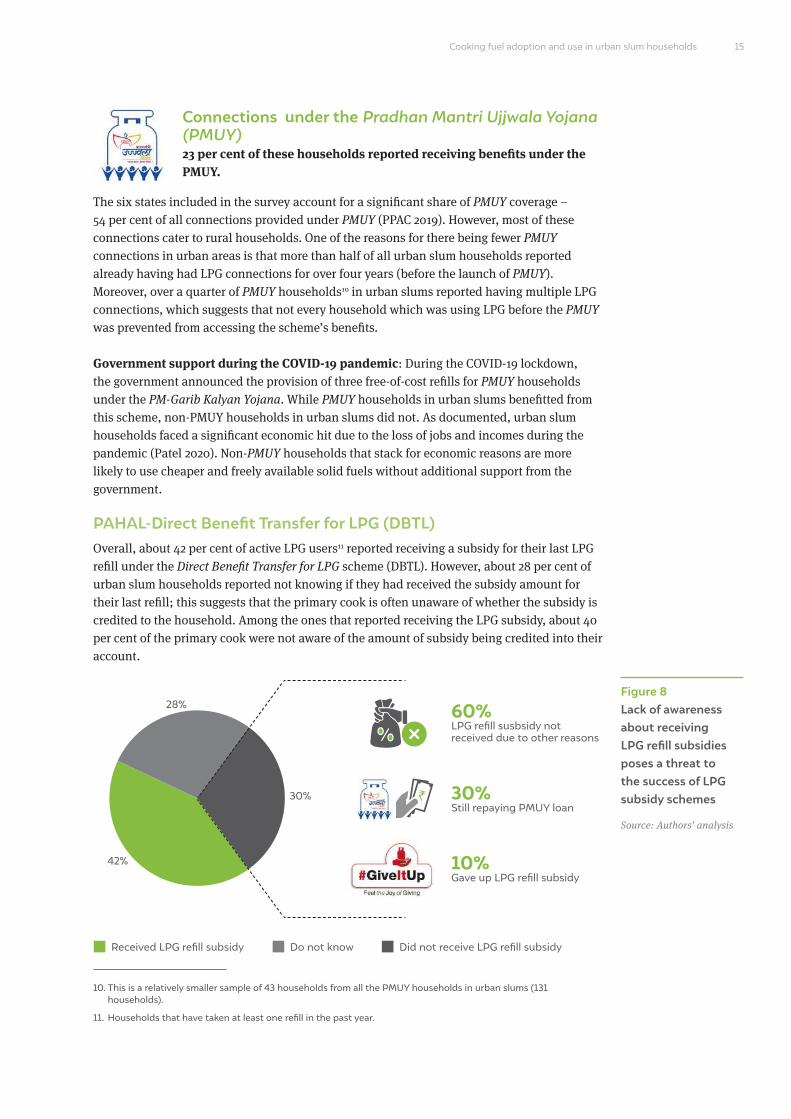
15
Figure 8 Lack of awareness about receiving LPG refill subsidies poses a threat to the success of LPG subsidy schemes
Source Authorsrsquo analysis
Connections under the Pradhan Mantri Ujjwala Yojana (PMUY) 23 per cent of these households reported receiving benefits under the PMUY
The six states included in the survey account for a significant share of PMUY coverage ndash 54 per cent of all connections provided under PMUY (PPAC 2019) However most of these connections cater to rural households One of the reasons for there being fewer PMUY connections in urban areas is that more than half of all urban slum households reported already having had LPG connections for over four years (before the launch of PMUY) Moreover over a quarter of PMUY households10 in urban slums reported having multiple LPG connections which suggests that not every household which was using LPG before the PMUY was prevented from accessing the schemersquos benefits
Government support during the COVID-19 pandemic During the COVID-19 lockdown the government announced the provision of three free-of-cost refills for PMUY households under the PM-Garib Kalyan Yojana While PMUY households in urban slums benefitted from this scheme non-PMUY households in urban slums did not As documented urban slum households faced a significant economic hit due to the loss of jobs and incomes during the pandemic (Patel 2020) Non-PMUY households that stack for economic reasons are more likely to use cheaper and freely available solid fuels without additional support from the government
PAHAL-Direct Benefit Transfer for LPG (DBTL)Overall about 42 per cent of active LPG users11 reported receiving a subsidy for their last LPG refill under the Direct Benefit Transfer for LPG scheme (DBTL) However about 28 per cent of urban slum households reported not knowing if they had received the subsidy amount for their last refill this suggests that the primary cook is often unaware of whether the subsidy is credited to the household Among the ones that reported receiving the LPG subsidy about 40 per cent of the primary cook were not aware of the amount of subsidy being credited into their account
10 This is a relatively smaller sample of 43 households from all the PMUY households in urban slums (131 households)
11 Households that have taken at least one refill in the past year
42
30
28
Received LPG refill subsidy
30 Still repaying PMUY loan
Did not receive LPG refill subsidy
10 Gave up LPG refill subsidy
Do not know
60 LPG refill susbsidy not received due to other reasons
Cooking fuel adoption and use in urban slum households
Are Indiarsquos Urban Poor Using Clean Cooking Fuels Insights from Slums in Six States16
23 Households using only polluting fuels About 12 per cent of urban slum households rely entirely on polluting fuels for all cooking and non-cooking purposes While the share of these households is relatively small the non-adoption of LPG in such households despite
programmes like the PMUY is concerning These households either use a combination of different polluting fuels (firewood dung cakes agricultural residue charcoal and kerosene) or just one of these fuels for all their energy needs Firewood is the most commonly used fuel in these households
231 Reasons for the non-adoption of LPGHouseholds that rely exclusively on polluting fuels reported not having an LPG connection Though three-fourths of these households were aware of PMUY the high upfront cost of an LPG connection along with the high recurring cost of procuring refills remain the two most important reasons for not procuring an LPG connection Repondents also mentioned a lack of information on how to procure a connection as a reason These reasons align with the common causes cited by rural households covered in the survey implying that the challenges faced by rural households and urban slum households in procuring connections are similar
Almost half of the households in this category use solid fuels for non-cooking purposes such as heating water for bathing space heating and preparing fodder for animals On the positive aspects of using polluting fuels households reported the following free-of-cost easy availability of fuels better tasting food and preference of family members for food cooked on the chulha
232 Fuel availability and affordabilityIn contrast with households that stack fuels households that use only solid fuels rely on purchasing fuels rather than collecting or preparing them For instance 60 per cent of firewood users in this category procure fuel by purchasing rather than collecting it
Households with low asset ownership rely on polluting fuels for cooking These households spend 2ndash3 per cent of their median monthly expenditure on fuel (INR 75 per month on fuel) which is much lower than what they would have to spend if they used LPG exclusively (INR 496 per month) Households that collect solid fuels spend about two hours on a single trip (three times a month) travelling a median one-way distance of 2 km This is equivalent to the distance travelled to procure LPG cylinders (if not delivered at home)
Figure 9 More than half of the households currently without LPG do not know how to get a connection or whom to ask about it implying a lack of awareness
Source Authorsrsquo analysis
0 10 20 30 40 50 60 70
39
53
63
68
80
Percentage of households
Rea
sons
for N
on-A
dop
tion
of L
PG Installation is expensive
Monthly expenditure on LPG is high
Do not know how to get or whom to ask
Not availabletoo far
17
12 See Annexure III for details on the districts and their PM25 concentrations The data for 15 districts (from Bihar Uttar Pradesh Madhya Pradesh and Rajasthan) overlapping with the survey sample have been analysed based on the availability of air quality data from continuous monitoring stations
13 Air quality categories based on PM25 concentration (in μgm3)
Good 0 to 30 Satisfactory 31 to 60 Moderately polluted 61 to 90 Poor 91 to 120 Very poor 121 to 250 Severe above 250 (Central Pollution Control Board 2014)
Cooking fuel adoption and use in urban slum households
Winter months have the highest PM25 concentrations coinciding with the sharp increase in use of polluting fuels for heating bath water and room heating
233 Gendered time use in households using solid fuelsIn urban slums both the male and female members of the household are equally involved in collecting firewood Still it is primarily the female members of the household who undertake dung cake preparation In addition to engaging in fuel collection and preparation women tend to spend more time cooking in households using solid fuels About 85 per cent of households that transitioned to LPG in the past four years reported having saved time while cooking compared to when they used solid fuels
SPOTLIGHT I Household air pollution (HAP) in urban slums
Burning solid fuels in three-stone fires and mud stoves with inadequate ventilation causes high levels of smoke exposure and negative health impacts particularly for women and young children (WHO 2014)
The double burden of ambient and household air pollution on the urban slum populationUsing the PM25 data from continuous ambient air quality monitoring stations (CAAQMS) for 15 districts12 in our sample we found that the ambient air quality remained in the lsquopoorrsquo or worse category13 for most districts throughout the year variation in the ambient air quality
Are Indiarsquos Urban Poor Using Clean Cooking Fuels Insights from Slums in Six States
Impact of ventilation
Indoor cooking and low adoption of chimney indicates high exposure to pollution from the use of unclean fuels for cooking The proportion of households with a chimney is high (52 per cent) among those who rely only on polluting fuels Smith and Pillarisetti (2017) explain that while having a good chimney lowers peak levels of indoor pollution long-term average exposure is reduced only by a factor of two Besides chimneys require regular maintenance to function correctly While more than 45 per cent of the households are using polluting fuels less than 20 per cent of the slum housheolds use improved cookstoves
Households also use solid fuels for non-cooking uses like space heating On average each house in a slum has two rooms this effectively exposes all members of the household to emissions from burning fuels Emissions from household sources contribute significantly to the surrounding air quality (Harish et al 2019) this concern is exacerbated in congested slum areas
the winter months (November to February) have the highest concentration of PM25 This leads to a double burden of exposure for slum households stacking solid fuels as they are more likely to increase use of solid fuels in winters (Figure 7) Alternatively the use of LPG as the primary source of fuel increases during the rainy season (June to September) these months record the least ambient air pollution
We also find that districts like Meerut Ghaziabad Patna Gautam Buddha Nagar (Noida and Greater Noida) and Muzaffarpur have the highest frequency of lsquovery poorrsquo air quality days throughout the year Across these districts one-third of households use polluting fuels for cooking In urban slums where households are more densely packed the emissions from burning solid fuels increase the risk of exposure inside households and deteriorate the ambient air quality for the community at large As a result these communities suffer from both increased household and ambient air pollution HAP has an estimated average contribution of 30ndash50 per cent to ambient air quality across Indiarsquos urban and rural areas (Balakrishnan et al 2019) Addressing biomass burning for cooking water heating and space heating during the winters has the potential to help reach the national ambient air quality standards (Chowdhury et al 2019) Despite that only 2 per cent of the action points in 44 city clean air plans mention cooking and heating as a sector to address air pollution (Ganguly Selvaraj and Guttikunda 2020)
18
75 householdsrsquo
using polluting fuels cook inside
the main house
67 householdsrsquo using polluting fuels do not have a chimney for ventilation
Awareness about the health impacts of using polluting fuelsAbout 60 per cent of households using only polluting fuels and 84 per cent of households that stack LPG with a polluting fuel report lsquotoo smokyrsquo as the most prominent negative aspect of using polluting fuels This suggests that as more households switch to clean cooking fuels perceptions regarding pollution fuels change
Three-fourths of primary cooks who use polluting fuels for cooking agree that smoke from solid fuels is harmful to them this implies that awareness of the adverse health impacts of polluting fuels does not necessarily lead to the uptake of clean fuels Primary cooks also agree that smoke from solid fuels causes coughing (49 per cent) and lung infections in children (39 per cent)
Exposure to air pollution is a known risk factor for underlying chronic diseases that predict the severity of
COVID-19 disease and patient outcomes (World Bank 2020) This linkage suggests a heightened risk for women
in all age groups who cook using traditional technologies and fuels (World Bank 2020) The highest number of
COVID-19 cases were recorded in the most polluted regions among patients with pre-existing health conditions
(Frontera et al 2020)
Results from a controlled study show a higher prevalence of chronic obstructive pulmonary disease (COPD)
among biomass fuel users than clean fuel users ( Johnson et al 2011) The available clinical data to date suggest
that cardiovascular disease diabetes chronic respiratory illness and hypertension ndash conditions all strongly
associated with exposure to HAP ndash are also risk factors for COVID-19 (World Bank 2020)
BOX 7 Impact of household air pollution on COVID-19
19Cooking fuel adoption and use in urban slum households
Are Indiarsquos Urban Poor Using Clean Cooking Fuels Insights from Slums in Six States
Traditionally women bear a disproportionate burden in collecting and preparing biomass for cooking While this burden reduces with the use of clean cooking fuels like LPG the fuel supply within the household is then determined by formal and monetised distribution networks involving an outlay of money (Patnaik and Jha 2020) Our data shows that womenrsquos status in the household (as heads of households)14 positively correlates with households using LPG as their primary fuel The existing literature also supports the idea that female-headed households prefer modern fuels to polluting ones (Farsi Filippini and Pachauri 2007 Rao and Reddy 2007 Kuo and Azam 2019) Other research also suggests that female-headed households are more willing to spend on LPG as a recurring expense (Kojima Bacon and Zhou 2011 Kuo and Azam 2019)
SPOTLIGHT II Womenrsquos participation in intra-household decision-making regarding LPG use
20
14 In almost half of the households surveyed the primary cook reported a female member being the head of the household The reason behind such high percentage of female-headed households could be because only the primary cook of every household (who is mostly female) was surveyed This does not mean that these households do not have any adult male members Traditionally headship refers to the head of household as the individual whose lsquoauthorityrsquo the household members recognise But this definition overlooks potential intra-household variations in the recognised authority in different realms of decision-making (Kilic Moylan and Koolwal 2020) Since cooking is a gendered activity the primary cookrsquos response to the head of household question may have been with respect to the recognised authority figure for that activity within the household
30 householdsrsquo female members place the order for LPG refills
50householdsrsquo female
members decide whether or when to purchase LPG refills
We also find that the decision of whether or when to purchase LPG refills is made by male members in half of urban slum households This holds for both male- and female-headed households In LPG-using households where the primary cook is involved in an income-generating activity more women are deciding to order the refills This pattern is similar irrespective of whether the household uses LPG exclusively or stacks it with other polluting fuels or are PMUY beneficiaries
SPOTLIGHT III A comparison of access to clean cooking energy between urban slum and non-slum households across six states
21
At the state level Bihar has significantly poor involvement of women in intra-household decision-making regarding
ordering refills with less than 10 per cent of households reporting that women decide whether or when to order
refills However more women than men are involved in decisions around LPG refills in Rajasthan Madhya Pradesh
and Jharkhand
Across caste groups the involvement of women is lowest (37 per cent) among the Scheduled Castes (SCs)
However more women in General and OBC households decide when to order LPG refills
BOX 8 Variations in intra-household decision-making across states and caste groups
Cooking fuel adoption and use in urban slum households
To compare the fuel use patterns of urban slum and non-slum households we used data from the India Residential Energy Survey (IRES 2020)15 The overlap in the sampling strategies of both IRES and our survey enabled a comparison of the findings There is a significant difference in the socio-economic status of slum and non-slum households which tends to affect their fuel use patterns Table 4 provides a comparison of cooking fuel usage in urban non-slum households (from IRES 2020) and urban slum households (Cooking Energy Access and Use survey 2020)
Are Indiarsquos Urban Poor Using Clean Cooking Fuels Insights from Slums in Six States22
Table 4 The poor economic condition of households in urban slums impacts the exclusive use of clean fuels for cooking
Source Authorsrsquo analysis
Fuel use categories Urban slum households (Cooking Energy Access Survey) ()
Non-slum urban households (IRES) ()
95 88
84 55
9 33
5 12
Clean fuel users (LPG PNG and electricity)
LPG as an exclusive fuel
Households that stack LPG with polluting fuels
Households that use only polluting fuels
We observed a significant gap in the exclusive use of LPG as a cooking fuel between urban slums and non-slum households explained mainly by the difference in their economic conditions Stacking is three times more common in slum households than non-slum households About 45 per cent of non-slum households using polluting fuels belong to marginalised social groups (SCs and STs) Households using polluting fuels have a lower median monthly expenditure than others and about 62 per cent of such households are semi-pucca or kuchha structures Among LPG users non-slum households have a slightly higher rate of doorstep delivery as compared to slum households
LPG-using households receiving home deliveries
Source Authorsrsquo analysis
239
6372
Urban slum households (Cooking Energy Access and Use)
()
Non-slum urban households (IRES)
()
Proportion of PMUY beneficiaries among LPG-using households
15 IRES 2020 was conducted in 21 large states of India including Bihar Jharkhand Rajasthan Madhya Pradesh Uttar Pradesh and Chhattisgarh While IRES 2020 focused on urban households the Cooking Energy Access and Use survey specifically attended to urban slums in the same districts Refer to the technical note for a detailed methodology of the survey
23
3 Way forward
Slums across the world are chronically ignored in public policy and suffer because of unauthorised and unsafe habitation without access to government services (Shahadat
Lipu and Bhuiyan 2014) In terms of energy access while we see a progressive change in householdsrsquo energy use patterns as we move from rural to urban issues like affordability availability preference and familiarity with the fuel and stove remain essential factors that determine householdsrsquo fuel choice
Image iStock
Are Indiarsquos Urban Poor Using Clean Cooking Fuels Insights from Slums in Six States24
Understanding categories of users is important for enabling access to and use of clean cooking fuels
We categorised the urban slum population based on their fuel usage patterns ndash using only clean fuels stacking clean fuels with polluting fuels and using only polluting fuels While most households in urban slums have an LPG connection only half of them use LPG exclusively The householdrsquos economic status and its access to doorstep delivery of LPG refills are two crucial factors that determine its ability to use LPG exclusively Despite being situated in urban areas 37 per cent of slum households do not receive home delivery of cylinders ndash availability is an essential factor in determining the householdrsquos likelihood of using LPG exclusively There is a strong impetus for the OMCs and distributors to improve their home delivery services of LPG refills in slum areas
Stacking is prevalent in about one-third of households ndash there is a need for a deeper understanding of householdsrsquo preferences fuel end-uses and awareness Most households reported using polluting fuels daily or at least weekly this effectively increases their exposure to household air pollution despite having access to clean cooking fuels Among households that stack LPG with polluting fuels the reasons for stacking differ ndash affordability seasonality and taste preference More than a quarter of households that stack have a similar level of LPG consumption as those that use LPG exclusively despite similar family sizes Such households use polluting fuels not because of their inability to afford LPG But other factors like free-of-cost availability of biomass taste preference for chulha and alternate end-uses of fuelmdashfor instance in space heatingmdashinfluence the householdrsquos decision to use solid fuels Among households that stack multiple fuels the use of polluting fuels increases during winter months this exposes the households to a double burden of high ambient and household air pollution in these months About 40 per cent of these households also use polluting fuels for non-cooking purposes like heating water for bathing and space heating especially in winter
Even with large-scale government initiatives like PMUY we find that more than 10 per cent of urban slum households do not use LPG They mainly rely on free-of-cost biomass for their cooking and non-cooking needs Despite awareness of PMUY among these households the high upfront cost of procuring an LPG connection and high recurring expenditure on refills deter them from using LPG Evidently there is a need to expand the reach of PMUY to cover households across slums
Integrating the issue of lack of access to clean cooking energy within the discussion on urban poverty
This study reiterates the need to look at poverty in urban areas in the context of energy access Given the heterogeneity of poverty in urban and semi-urban India it is essential to understand energy poverty in the context of access to resources for an enhanced quality of life for the urban poor Similarly slums dwellers in large and small cities alike may experience additional challenges of access Furthermore not all urban poor live in slums we know even less about the access issues of temporary residents or seasonal migrants in urban India Therefore in a rapidly urbanising India studies on the urban poor and air quality need to integrate a focus on energy access to address the vulnerability of women children and communities to HAP and the drudgery of using polluting fuels for cooking and other household energy needs
Access to clean cooking energy schemes must be integrated into the social assistance programmes focused on urban poverty alleviation to enhance its reach
25Way forward
Converging energy access in social protection policies for the urban poor
Accounting for the vulnerabilities of the urban poor is crucial in designing and implementing policies including social protection schemes As a health and economic imperative access to clean cooking energy schemes must be integrated into the social assistance programmes of other ministries (eg health education and nutrition assistance) to offer better support to slum households This would also reduce the burden on households of claiming and accessing multiple benefits across schemes thus freeing them to invest more time in productive activities (CEEW 2020) Government programmes such as the National Urban Livelihoods Mission and social service allocations for housing should use existing targeting approaches to include access to clean cooking energy within the ambit of services for the poor
Bringing a renewed emphasis on clean cooking energy access due to COVID-19 is essential
Most households in urban slums rely on daily wage labour or the gig economy for their household income During the COVID-19 pandemic these occupations have been among the worst impacted by the lockdown and the economic slowdown A survey conducted with over 2000 daily wage workers in urban slums during the lockdown suggests that only 7 per cent of respondents from this group received pay during the lockdown (Basu 2020) causing a massive shock to their livelihoods and wage earnings This kind of impact pushes households into energy poverty leading to the increased use of free-of-cost biomass and consequently increasing the risk of exposure to emissions from fuel burning While the government has committed to supplying up to three free refills to all PMUY households under PM-Garib Kalyan Yojana less than a quarter of households in urban slums have Ujjwala connections The low share of PMUY households effectively makes the majority of slum households ineligible for relief support given under the PM-Garib Kalyan Yojana during the lockdown There is a need to target vulnerable households ndash beyond PMUY beneficiaries ndash with differential subsidy support for using LPG in a sustained manner
Increased poverty would mean increased use of polluting fuels ndash there is a need for a renewed emphasis on clean cooking energy access during the COVID-19 pandemic as increased use of polluting fuels has health implications (lower respiratory infections and COPD) that increase the risk of COVID-19 infections being more severe
There is a need to target vulnerable households ndash beyond PMUY beneficiaries ndash with differential subsidy support for using LPG in a sustained manner
Are Indiarsquos Urban Poor Using Clean Cooking Fuels Insights from Slums in Six States
Balakrishnan Kalpana Sagnik Dey Tarun Gupta R S Dhaliwal Michael Brauer Aaron J Cohen Jeffrey D Stanaway et al 2019 ldquoThe Impact of Air Pollution on Deaths Disease Burden and Life Expectancy Across the States of India The Global Burden of Disease Study 2017rdquo The Lancet Planetary Health 3 (1) e26ndash39 httpsdoiorg101016S2542-5196(18)30261-4
Baqir M S K Bharti R Kothari and R P Singh 2019 ldquoAssessment of an Energy-efficient Metal Chulha for Solid Biomass Fuel and Evaluation of its Performancerdquo International Journal of Environmental Science and Technology 16 (11) 6773ndash6784 httpsdoiorg101007s13762-018-2028-9
Basu Anika Badyal 2020 ldquoLockdown Survey How The Covid-19 Crisis Has Affected Daily Wage WorkersmdashAIFrdquo American India Foundation June 28 httpsaiforglockdown-survey-how-the-covid-19-crisis-has-affected-daily-wage-workers
Butera F M P Caputo R Adhikari and A Facchini 2016 ldquoThe Challenge of Energy in Informal Settlements A Review of the Literature for Latin America and Africardquo Procedia Engineering 1ndash32 httpswwwenelfoundationorgcontentdamenel-foundtopic-downloadThe challenge of Energy in Informal settlementspdf
CEEW 2020 ldquoEnergy Safety Nets India Case Studyrdquo Vienna Sustainable Energy for All httpswwwceewinpublicationsenergy-safety-nets-india-case-study
Central Pollution Control Board 2014 ldquoNational Air Quality Indexrdquo New Delhi Central Pollution Control Board httpsappcpcbccrcomccr_docsFINAL-REPORT_AQI_pdf
Chafe Z S Mehta and K R Smith 2011 ldquoAmbient Fine Particulate (PM25) Air Pollution Attributable to Household Cooking Fuel in Asiardquo AGUFM A54Bndash03 httpsuiadsabsharvardeduabs2011AGUFMA54B03Cabstract
Chandramouli C 2010 ldquoCensus of India 2011 ndash Circular No 8rdquo New Delhi Ministry of Home Affairs httpscensusindiagovin2011-CircularsCircularsCircular-08pdf
Chandrasekhar S and Arup Mitra 2018 ldquoMigration Caste and Livelihood Evidence from Indian City-slumsrdquo Urban Research amp Practice 12 (2) 156ndash172 httpsdoiorg1010801753506920181426781
Cheng Chao Yo and Johannes Urpelainen 2014 ldquoFuel Stacking in India Changes in the Cooking and Lighting Mix 1987ndash2010rdquo Energy 76 (November) 306ndash317 httpsdoiorg101016jenergy201408023
Chowdhary Sourangsu Sagnik Dey Sarath Guttikunda Ajay Pillarisetti Kirk R Smith and Larry Di Girolamo 2019 ldquoIndian annual ambient air quality standard is achievable by completely mitigating emissions from household sourcesrdquo Proceedings of the National Academy of Sciences 116 (22) 10711-10716 httpsdoiorg101073pnas1900888116
Dhingra Chhavi Shikha Gandhi Akanksha Chaurey and P K Agarwal 2008 ldquoAccess to Clean Energy Services for the Urban and Peri-Urban Poor A Case-study of Delhi Indiardquo Energy for Sustainable Development 12 (4) 49ndash55 httpsdoiorg101016S0973-0826(09)60007-7
Farsi Mehdi Massimo Filippini and Shonali Pachauri 2007 ldquoFuel Choices in Urban Indian Householdsrdquo Environment and Development Economics 12 (6) 757ndash774 httpsdoiorg101017S1355770X07003932
References
26
Frontera Antonio Lorenzo Cianfanelli Konstantinos Vlachos Giovanni Landoni and George Cremona 2020 ldquoSevere Air Pollution Links to Higher Mortality in COVID-19 Patients The lsquoDouble-Hitrsquo Hypothesisrdquo Journal of Infection 81 (2) 255ndash259 httpsdoiorg101016jjinf202005031
Ganguly Tanushree Kurinj L Selvaraj Sarath K Guttikunda 2020 ldquoNational Clean Air Programme (NCAP) for Indian cities Review and outlook of clean air action plansrdquo Atmospheric Environment X Vol 8 httpsdoiorg101016jaeaoa2020100096
GNESD 2008 ldquoClean Energy for the Urban Poor An Urgent Issuerdquo Accessed 25 July 2020 httpswwwgooglecomurlsa=tamprct=jampq=ampesrc=sampsource=webampcd=ampved=2ahUKEwi1hf2ru dntAhUCOisKHQH7BtsQFjAAegQIAxACampurl=http3A2F2Fwwwgnesdorg2F-2Fmedia2FSites2FGNESD2FPublication- pdfs2FSPM_CleanEnergyashx3Fla3Dda26hash3DE4971C585B6798F17954F8B42E073 D9507F42A84ampusg=AOvVaw08kCDgOkTkYc6wRDxzsNyq
Guan Wei-Jie Wen-Hua Liang Yi Zhao Heng-Rui Liang Zi-Sheng Chen Yi-Min Li Xiao-Qing Liu et al 2020 ldquoComorbidity and its Impact on 1590 Patients with COVID-19 in China A Nationwide Analysisrdquo European Respiratory Journal 55 (5) 2000547 httpsdoiorg1011831399300300547-2020
Harish Santosh Kirk R Smith Sourangsu Chowdhury Zoe A Chafe Ajay Pillarisetti Jos Lelieveld Sarath Guttikunda Sagnik Dey and Andrew P Grieshop 2019 ldquoThe Contribution of Household Fuels to Ambient Air Pollution in India A Comparison of Recent Estimates Edited by CcapcOrgInrdquo Collaborative Clean Air Policy Centre May 30 httpsccapcorginpolicy-briefs2019530the-contribution-of-household-fuels-to-ambient-air-pollution-in-india-a-comparison-of-recent-estimates
Jain Abhishek Saurabh Tripathi Sunil Mani Sasmita Patnaik Tauseef Shahidi and Karthik Ganesan 2018 ldquoAccess to Clean Cooking Energy and Electricity Survey of States 2018rdquo New Delhi CEEW httpswwwceewinsitesdefaultfilesCEEW-Access-to-Clean-Cooking-Energy-and-Electricity-11Jan19_0pdf
Johnson Priscilla Kalpana Balakrishnan Padmavathi Ramaswamy Santu Ghosh Muthukumar Sadhasivam Omprakash Abirami Bernard W C Sathiasekaran Kirk R Smith Vijayalakshmi Thanasekaraan and Arcot S Subhashini 2011 ldquoPrevalence of Chronic Obstructive Pulmonary Disease in Rural Women of Tamilnadu Implications for Refining Disease Burden Assessments Attributable to Household Biomass Combustionrdquo Global Health Action 4 (1) 7226 httpsdoiorg103402ghav4i07226
Kilic Talip Heather Moylan and Gayatri Koolwal 2020 ldquoGetting the (Gender-disaggregated) Lay of the Land Impact of Survey Respondent Selection on Measuring Land Ownership and Rightsrdquo Washington DC The World Bank httpsdoiorg1015961813-9450-9151
Kojima Masami Robert Bacon and Xin Zhou 2011 ldquoWho Uses Bottled Gas Evidence from Households in Developing Countriesrdquo The World Bank Sustainable Energy Department Oil Gas and Mining Unit httpelibraryworldbankorgdoibook1015961813-9450-5731
Kuo Ying-Min and Mehtabul Azam 2019 ldquoHousehold Cooking Fuel Choice in India 2004ndash2012 A Panel Multinomial Analysisrdquo IZA Discussion Paper No 12682 httpsssrncomabstract=3468630
Lippi Giuseppe and Brandon Michael Henry 2020 ldquoChronic Obstructive Pulmonary Disease Is Associated with Severe Coronavirus Disease 2019 (COVID-19) COPD and COVID-19rdquo Respiratory Medicine 167 105941 httpsdoiorg101016jrmed2020105941
Ministry of Housing and Urban Affairs 2019 ldquoHandbook of Urban Statisticsrdquo New Delhi Government of India httpmohuagovinpdf5c80e2225a124Handbook of Urban Statistics 2019pdf
Rao M Narasimha and B Sudhakara Reddy 2007 ldquoVariations in Energy Use by Indian Households An Analysis of Micro Level Datardquo Energy 32 (2) 143ndash153 httpsdoiorg101016jenergy200603012
27References
Are Indiarsquos Urban Poor Using Clean Cooking Fuels Insights from Slums in Six States28
National Buildings Organisation 2013 ldquoState of Slums in India a Statistical Compendium 2013rdquo New Delhi Government of India httpnbonicinpdfSlums_in_India_Compendium_English_Versionpdf
National Sample Survey Office 2012 ldquoKey Indicators of Urban Slums in India ndash 69th Roundrdquo New Delhi National Data Bank for Socio-religious Categories httpmospinicinsitesdefaultfilesnational_data_bankndb-rpts-69htm
Nolan Laura B 2015 ldquoSlum Definitions in Urban India Implications for the Measurement of Health Inequalitiesrdquo Population and Development Review 41 (1) 59ndash84 httpsideasrepecorgablapopdevv41y2015i1p59-84html
Nolan Laura B David E Bloom and Ramnath Subbaraman 2018 ldquoLegal Status and Deprivation in Urban Slums Over Two Decadesrdquo HHS Public Access 53 (15) 47ndash55
Patel Amit 2020 ldquoPreventing COVID-19 Amid Public Health and Urban Planning Failures in Slums of Indian Citiesrdquo World Medical amp Health Policy 12 (3) httpsdoiorg101002wmh3351
Patnaik Sasmita and Shaily Jha 2020 ldquoCaste Class and Gender in Determining Access to Energy A Critical Review of LPG Adoption in Indiardquo Energy Research amp Social Science 67 (September) 101530 httpsdoiorg101016jerss2020101530
PPAC-CRISIL 2016 ldquoAssessment Report Primary Survey on Household Cooking Fuel Usage and Willingness to Convert to LPGrdquo New Delhi Petroleum Planning amp Analysis Cell Ministry of Petroleum and Natural Gas Government of India httpswwwppacgovinWriteReadDataReports201710310449342512219PrimarySurveyReportPPACpdf
PPAC 2019 ldquoOil Industry Information at a Glancerdquo New Delhi Ministry of Petroleum and Natural Gas Government of India httpswwwppacgovinWriteReadDataReports201912060336500305462ReadyReckonerNov2019WebVersionpdf
Rahaman Mehebub and Dipendra Nath Das 2017 ldquoNature of Slum Growth in Indian Citiesrdquo Urban India 37 (II) 100ndash116 httpswwwresearchgatenetpublication334051882_Nature_of_Slum_Growth_in_Indian_Citiesread
Rains Emily Anirudh Krishna and Erik Wibbels 2018 ldquoUrbanisation and Indiarsquos Slum Continuum Evidence on the Range of Policy Needs and Scope of Mobilityrdquo London International Growth Centre httpswwwtheigcorgwp-contentuploads201802Rains-et-al_Working-paper_coverpdf
Ranjan Rahul and Sudershan Singh 2017 ldquoEnergy Deprivation of Indian Households Evidence from NSSO Datardquo New Delhi Munich Personal RePEc Archive httpsmpraubuni-muenchende835661MPRA_paper_83566pdf
Roy Debraj Bharath Palavalli Niveditha Menon Robin King Karin Pfeffer Michael Lees and Peter M A Sloot 2018 ldquoSurvey-based Socio-economic Data from Slums in Bangalore Indiardquo Nature Publishing Group 5 1ndash9 httpsdoiorg101038sdata2017200
Saksena Sumeet P B Singh Raj Kumar Prasad Rakesh Prasad Preeti Malhotra Veena Joshi and R S Patil 2003 ldquoExposure of Infants to Outdoor and Indoor Air Pollution in Low-income Urban Areas A Case Study of Delhirdquo Journal of Exposure Science amp Environmental Epidemiology 13 219ndash30 httpsdoiorg101038sjjea7500273
Lipu Molla Shahadat Hossain and Arif Waliullah Bhuiyan 2014 ldquoElectricity Access in Urban Slum Households of Bangladesh A Case of Dhakardquo Journal of Renewable and Sustainable Energy 6 (053112) 1ndash15 httpsdoiorg10106314896697
29
Singh Rozita Xiao Wang Emmanuel Ackom and Juan Reyes 2015 ldquoEnergy Access Realities in Urban Poor Communities of Developing Countries Assessments and Recommendationsrdquo Global Network on Energy for Sustainable Development (GNESD) httpswwwgooglecomurlsa=tamprct=jampq=ampesrc=sampsource=webampcd=ampved=2ahUKEwj5nbqI wdntAhXUTX0KHZE6DboQFjAAegQIAhACampurl=https3A2F2Forbitdtudk2Ffiles2F10635 24942FEnergy_access_realities_v_final_updatedpdfampusg=AOvVaw0xNBAAo0bjLueY9FmoigKF
Singh Santosh 2014 ldquoThe Kaleidoscope of Cooking Understanding Cooking Behaviour and Stove Preferences in Rural Indiardquo New Delhi Deutsche Gesellschaft fuumlr Internationale Zusammenarbeit (GIZ) GmbH httpswwwgizdeendownloadsgiz2014-en-kaleidoscope-of-cooking-indiapdf
Smith Kirk R and Ajay Pillarisetti 2017 ldquoHousehold Air Pollution from Solid Cookfuels and its Effects on Healthrdquo Disease Control Priorities 7 (3) 133ndash52 httpsdoiorg101596978-1-4648-0522-6_ch7
UN-Habitat 2003 ldquoThe Challenge of Slums ndash Global Report on Human Settlements 2003rdquo Location of publishing London UN-Habitat httpsunhabitatorgthe-challenge-of-slums-global-report-on-human-settlements-2003
Wang Bolin Ruobao Li Zhong Lu and Yan Huang 2020 ldquoDoes Comorbidity Increase the Risk of Patients with COVID-19 Evidence from Meta-analysisrdquo Aging 12 (7) 6049ndash6057 httpsdoiorg1018632AGING103000
WHO 2014 ldquoWHO Guidelines for Indoor Air Quality Household Fuel Combustionrdquo WHO Accessed 25 July 2020 httpwwwwhointairpollutionguidelineshousehold-fuel-combustionen
World Bank 2020 ldquoThe State of Modern Energy Cooking Servicesrdquo Washington DC World Bank httpdocuments1worldbankorgcurateden937141600195758792pdfThe-State-of-Access-to-Modern-Energy-Cooking-Servicespdf
Yenneti Komali Yehua Dennis Wei and Wen Chen 2017 ldquoThe Urbanization of Poverty in India Spatio-temporal Disparities in Consumption Expendituresrdquo Geographical Review 107 (2) 360ndash383 httpsdoiorg101111j1931-0846201612167x
References
Are Indiarsquos Urban Poor Using Clean Cooking Fuels Insights from Slums in Six States
Annexure 1 Asset ownership index We used Filmer and Pritchettrsquos (2001) proposed approach to construct an asset ownership index using principal component analysis (PCA) We chose the indicators based on data from the Cooking Energy Access survey 2020 The variables we considered for the index were based on classifications by Caroline Moser and Andrew Felton (2007) and K Harttgen (2013) We computed the asset index using housing characteristics and consumer durables as follows
Variables not included in the asset index
Four types of variables were eliminated
1 Variables (such as grid electricity) that had high usage of greater than 95 per cent
2 Those (such as ownership of laptops or computers air conditioners etc) that had a low usage of less than 5 per cent
3 Variables (like house ownership) that have economically fluctuating values
4 Those that indicated a low correlation of less than 20 per cent variation between the top category (ie first) of the asset quintile and the bottom-most category (ie fifth) of the asset quintile
For ease of interpretation we rescaled this index such that the final index values range between 0 and 10 For this purpose we used a feature scaling (or minndashmax scaling) formula
Xnorm (or (IVx)) = (X ndash Xmin)(Xmax ndash Xmin)
where IVx is the normalised index value Xmin is the initial minimum value (-354) and Xmax is the initial maximum value (461) of the asset ownership index
30
Annexures
bull Crowding16 inside the house bull Toilet ownership and usage bull Source of water bull Number of pucca rooms
bull Ownership of two-wheeler bull Ownership of washing machine bull Ownership of television bull Ownership of refrigerator bull Ownership of cooker
16 A household with more than three members occupying a single room is considered crowded (World Health Organization 2018)
Housing characteristics
Consumer durables
Annexure 2 Explaining the use of LPG as the exclusive fuel (simple logistic regression model)
31Annexures
Dependent variable exclusive LPG use
Education of the primary cook (categorical base category is education beyond the school level)
Education of the household head (categorical base category is education beyond the school level)
State (categorical base category includes households from Rajasthan)
P gt z 95 confidence interval
Odds ratio (SE)
1299 (0112)
0659 (0202)
1399 (0394)
0970 (0038)
0994 (0011)
1003 (0013)
2042 (0508)
1011 (0046)
0782 (0441)
1198 (0608)
1377 (0664)
1345 (0566)
3141 (1103)
1213 (0500)
0309 (0211)
1165 (0565)
1703 (0680)
0002
0174
0233
0446
0583
0839
0004
0812
0663
0722
0507
0482
0001
0639
0086
0753
0182
1097
0361
0806
0898
0973
0977
1254
0924
0259
0443
0535
0589
1578
0541
0081
0450
0779
1540
1203
2428
1048
1016
1029
3327
1106
2361
3240
3545
3070
6251
2720
1181
3014
3723
Asset index
Primary cook involved in income-generating activity
Female-headed households
Household size
Age of household head
Age of primary cook
Doorstep delivery of LPG cylinders
PMUY customer
Primary cook is not educated
Primary cook has a school education
Household head is not educated
Household head has a school education
Uttar Pradesh
Bihar
Chhattisgarh
Jharkhand
Madhya Pradesh
Number of households (n) = 417
Log likelihood = -228777
Prob gt chi2 = 0000
Pseudo R2 = 0126
The dependent variable is a dummy variable where households using LPG exclusively are assigned a value of 1 and all other households are assigned the value of 0
The caste of the household has not been factored into the regression as a separate variable because of its underlying influence on economic status
Source Authorsrsquo analysis
Are Indiarsquos Urban Poor Using Clean Cooking Fuels Insights from Slums in Six States
Annexure 3 Air quality (PM25 concentration in μgm3) across 15 districts based on CAAQMS data
32
Dis
tric
tsM
ar-1
9A
pr-1
9M
ay-1
9Ju
n-19
Jul-1
9A
ug-1
9Se
p-19
Oct
-19
Nov
-19
Dec
-19
Jan-
20Fe
b-20
Mar
-20
794
5
988
5
866
7
-
645
329
2
453
7
388
1
769
1
886
4
661
5
950
9
834
4
-
823
4
611
7
569
9
535
7
-
270
4
589
4
571
5
293
1
705
4
839
2
614
9
970
1
826
8
-
844
9
622
1
597
1
564
0
-
235
3
414
3
619
1
414
3
653
9
834
7
568
8
104
90
739
8
-
894
9
630
9
342
2
450
4
-
476
465
2
474
6
429
2
592
3
566
1
-
674
6
531
4
501
5
568
7
450
8
-
320
3
-
846
506
3
349
5
332
4
369
1
387
2
-
430
4
393
6
353
7
446
2
406
8
335
2
339
1
-
102
9
497
2
261
8
269
1
431
4
294
1
-
351
6
277
3
-
336
5
315
5
248
3
392
8
149
7
144
9
462
3
270
5
331
3
273
4
276
0
106
6
391
7
326
2
-
368
6
625
3
875
2
101
64
521
2
183
1
380
4
556
2
544
1
558
2
102
24
104
33
156
44
128
73
146
62
137
71
109
14
183
70
201
80
896
7
190
1
457
7
581
2
583
5
815
4
135
00
126
41
239
94
208
15
158
51
221
86
121
35
192
46
218
43
848
0
205
2
448
5
509
4
582
0
704
5
177
01
613
1
244
01
215
80
136
87
230
54
964
2
201
52
122
30
725
5
120
6
435
4
454
7
481
2
111
37
147
45
537
3
175
53
162
86
111
21
170
08
583
8
132
10
866
2
513
1
112
5
511
3
507
5
511
8
879
4
120
22
502
1
135
53
116
39
994
7
120
45
410
5
792
1
674
8
326
3
177
6
385
0
408
5
335
9
497
2
594
2
429
9
673
2
547
5
540
8
559
4
Gay
a
Muz
affa
rpur
Pat
na
Bho
pal
Satn
a
Alw
ar
Ajm
er
Ud
aip
ur
Ag
ra
Bul
and
shah
r
Hap
ur
Gha
ziab
ad
Gre
ater
Noi
da
Mee
rut
Noi
da
Sour
ce C
onti
nuou
s am
bien
t air
qua
lity
mon
itor
ing
stat
ion
(Mar
ch 2
019
ndash M
arch
202
0)
In a rapidly urbanising India it would be imperative for policymakers and practitioners in energy and urban development sector to integrate access to clean cooking energy within the ambit of services for the urban poor
Image CEEW
Are Indiarsquos Urban Poor Using Clean Cooking Fuels Insights from Slums in Six States
COUNCIL ON ENERGY ENVIRONMENT AND WATER (CEEW)
Sanskrit Bhawan A-10 Aruna Asaf Ali Marg Qutab Institutional AreaNew Delhi - 110 067 IndiaT +91 11 4073 3300
infoceewin | ceewin | CEEWIndia
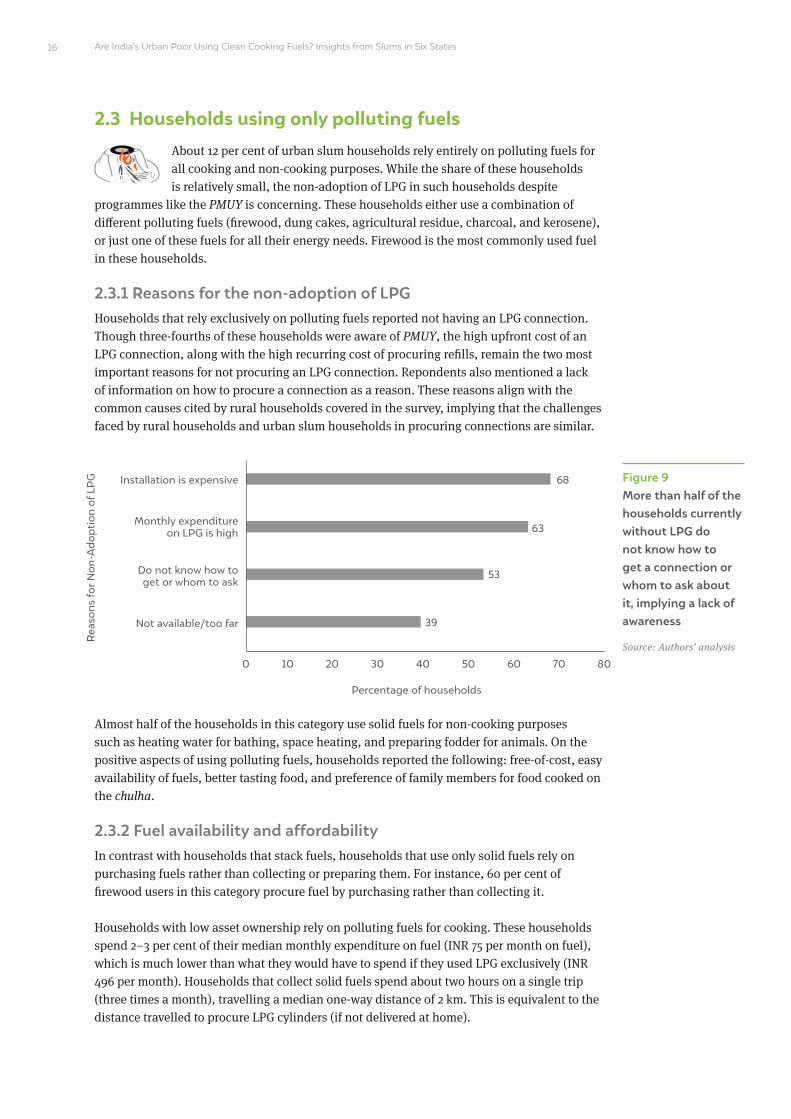
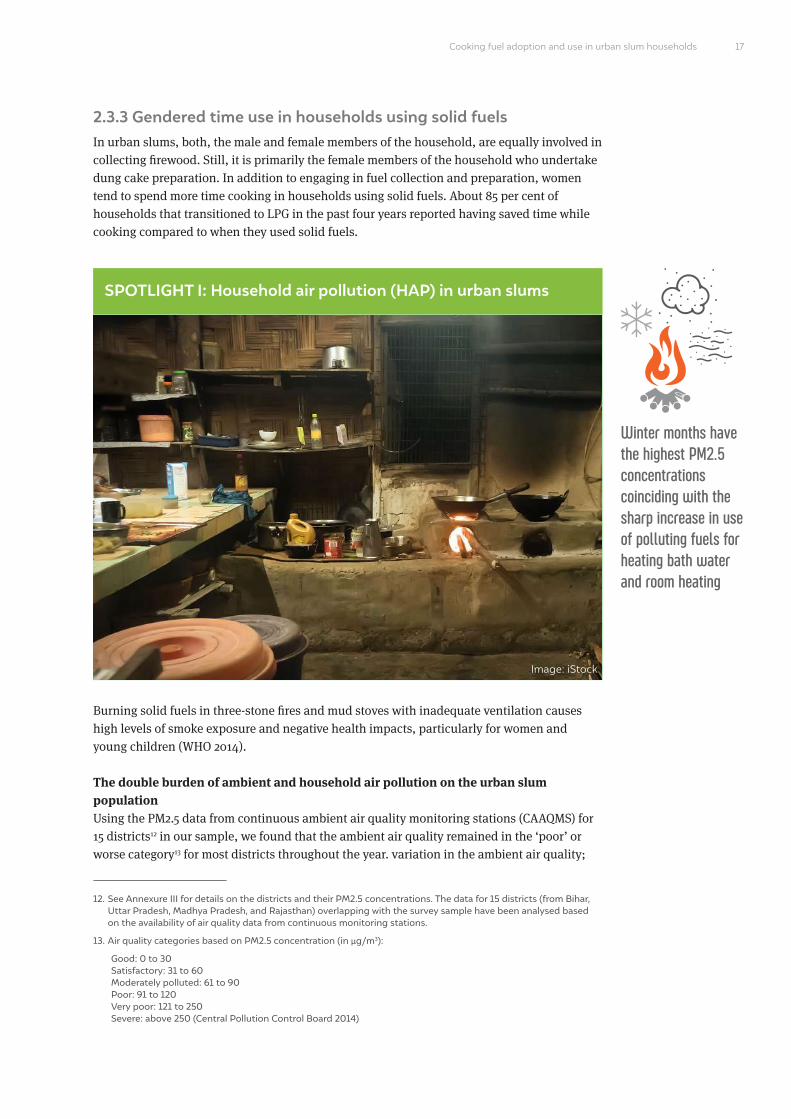
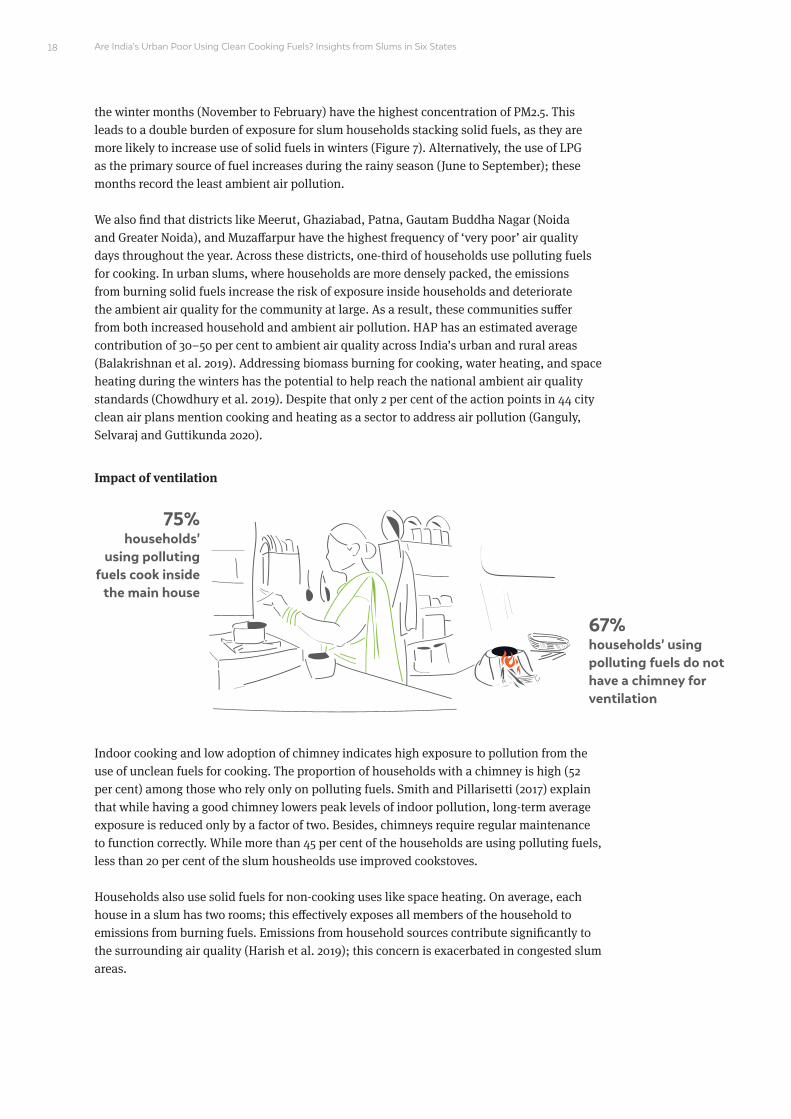
Are Indiarsquos Urban Poor Using Clean Cooking Fuels Insights from Slums in Six States
Impact of ventilation
Indoor cooking and low adoption of chimney indicates high exposure to pollution from the use of unclean fuels for cooking The proportion of households with a chimney is high (52 per cent) among those who rely only on polluting fuels Smith and Pillarisetti (2017) explain that while having a good chimney lowers peak levels of indoor pollution long-term average exposure is reduced only by a factor of two Besides chimneys require regular maintenance to function correctly While more than 45 per cent of the households are using polluting fuels less than 20 per cent of the slum housheolds use improved cookstoves
Households also use solid fuels for non-cooking uses like space heating On average each house in a slum has two rooms this effectively exposes all members of the household to emissions from burning fuels Emissions from household sources contribute significantly to the surrounding air quality (Harish et al 2019) this concern is exacerbated in congested slum areas
the winter months (November to February) have the highest concentration of PM25 This leads to a double burden of exposure for slum households stacking solid fuels as they are more likely to increase use of solid fuels in winters (Figure 7) Alternatively the use of LPG as the primary source of fuel increases during the rainy season (June to September) these months record the least ambient air pollution
We also find that districts like Meerut Ghaziabad Patna Gautam Buddha Nagar (Noida and Greater Noida) and Muzaffarpur have the highest frequency of lsquovery poorrsquo air quality days throughout the year Across these districts one-third of households use polluting fuels for cooking In urban slums where households are more densely packed the emissions from burning solid fuels increase the risk of exposure inside households and deteriorate the ambient air quality for the community at large As a result these communities suffer from both increased household and ambient air pollution HAP has an estimated average contribution of 30ndash50 per cent to ambient air quality across Indiarsquos urban and rural areas (Balakrishnan et al 2019) Addressing biomass burning for cooking water heating and space heating during the winters has the potential to help reach the national ambient air quality standards (Chowdhury et al 2019) Despite that only 2 per cent of the action points in 44 city clean air plans mention cooking and heating as a sector to address air pollution (Ganguly Selvaraj and Guttikunda 2020)
18
75 householdsrsquo
using polluting fuels cook inside
the main house
67 householdsrsquo using polluting fuels do not have a chimney for ventilation
Awareness about the health impacts of using polluting fuelsAbout 60 per cent of households using only polluting fuels and 84 per cent of households that stack LPG with a polluting fuel report lsquotoo smokyrsquo as the most prominent negative aspect of using polluting fuels This suggests that as more households switch to clean cooking fuels perceptions regarding pollution fuels change
Three-fourths of primary cooks who use polluting fuels for cooking agree that smoke from solid fuels is harmful to them this implies that awareness of the adverse health impacts of polluting fuels does not necessarily lead to the uptake of clean fuels Primary cooks also agree that smoke from solid fuels causes coughing (49 per cent) and lung infections in children (39 per cent)
Exposure to air pollution is a known risk factor for underlying chronic diseases that predict the severity of
COVID-19 disease and patient outcomes (World Bank 2020) This linkage suggests a heightened risk for women
in all age groups who cook using traditional technologies and fuels (World Bank 2020) The highest number of
COVID-19 cases were recorded in the most polluted regions among patients with pre-existing health conditions
(Frontera et al 2020)
Results from a controlled study show a higher prevalence of chronic obstructive pulmonary disease (COPD)
among biomass fuel users than clean fuel users ( Johnson et al 2011) The available clinical data to date suggest
that cardiovascular disease diabetes chronic respiratory illness and hypertension ndash conditions all strongly
associated with exposure to HAP ndash are also risk factors for COVID-19 (World Bank 2020)
BOX 7 Impact of household air pollution on COVID-19
19Cooking fuel adoption and use in urban slum households
Are Indiarsquos Urban Poor Using Clean Cooking Fuels Insights from Slums in Six States
Traditionally women bear a disproportionate burden in collecting and preparing biomass for cooking While this burden reduces with the use of clean cooking fuels like LPG the fuel supply within the household is then determined by formal and monetised distribution networks involving an outlay of money (Patnaik and Jha 2020) Our data shows that womenrsquos status in the household (as heads of households)14 positively correlates with households using LPG as their primary fuel The existing literature also supports the idea that female-headed households prefer modern fuels to polluting ones (Farsi Filippini and Pachauri 2007 Rao and Reddy 2007 Kuo and Azam 2019) Other research also suggests that female-headed households are more willing to spend on LPG as a recurring expense (Kojima Bacon and Zhou 2011 Kuo and Azam 2019)
SPOTLIGHT II Womenrsquos participation in intra-household decision-making regarding LPG use
20
14 In almost half of the households surveyed the primary cook reported a female member being the head of the household The reason behind such high percentage of female-headed households could be because only the primary cook of every household (who is mostly female) was surveyed This does not mean that these households do not have any adult male members Traditionally headship refers to the head of household as the individual whose lsquoauthorityrsquo the household members recognise But this definition overlooks potential intra-household variations in the recognised authority in different realms of decision-making (Kilic Moylan and Koolwal 2020) Since cooking is a gendered activity the primary cookrsquos response to the head of household question may have been with respect to the recognised authority figure for that activity within the household
30 householdsrsquo female members place the order for LPG refills
50householdsrsquo female
members decide whether or when to purchase LPG refills
We also find that the decision of whether or when to purchase LPG refills is made by male members in half of urban slum households This holds for both male- and female-headed households In LPG-using households where the primary cook is involved in an income-generating activity more women are deciding to order the refills This pattern is similar irrespective of whether the household uses LPG exclusively or stacks it with other polluting fuels or are PMUY beneficiaries
SPOTLIGHT III A comparison of access to clean cooking energy between urban slum and non-slum households across six states
21
At the state level Bihar has significantly poor involvement of women in intra-household decision-making regarding
ordering refills with less than 10 per cent of households reporting that women decide whether or when to order
refills However more women than men are involved in decisions around LPG refills in Rajasthan Madhya Pradesh
and Jharkhand
Across caste groups the involvement of women is lowest (37 per cent) among the Scheduled Castes (SCs)
However more women in General and OBC households decide when to order LPG refills
BOX 8 Variations in intra-household decision-making across states and caste groups
Cooking fuel adoption and use in urban slum households
To compare the fuel use patterns of urban slum and non-slum households we used data from the India Residential Energy Survey (IRES 2020)15 The overlap in the sampling strategies of both IRES and our survey enabled a comparison of the findings There is a significant difference in the socio-economic status of slum and non-slum households which tends to affect their fuel use patterns Table 4 provides a comparison of cooking fuel usage in urban non-slum households (from IRES 2020) and urban slum households (Cooking Energy Access and Use survey 2020)
Are Indiarsquos Urban Poor Using Clean Cooking Fuels Insights from Slums in Six States22
Table 4 The poor economic condition of households in urban slums impacts the exclusive use of clean fuels for cooking
Source Authorsrsquo analysis
Fuel use categories Urban slum households (Cooking Energy Access Survey) ()
Non-slum urban households (IRES) ()
95 88
84 55
9 33
5 12
Clean fuel users (LPG PNG and electricity)
LPG as an exclusive fuel
Households that stack LPG with polluting fuels
Households that use only polluting fuels
We observed a significant gap in the exclusive use of LPG as a cooking fuel between urban slums and non-slum households explained mainly by the difference in their economic conditions Stacking is three times more common in slum households than non-slum households About 45 per cent of non-slum households using polluting fuels belong to marginalised social groups (SCs and STs) Households using polluting fuels have a lower median monthly expenditure than others and about 62 per cent of such households are semi-pucca or kuchha structures Among LPG users non-slum households have a slightly higher rate of doorstep delivery as compared to slum households
LPG-using households receiving home deliveries
Source Authorsrsquo analysis
239
6372
Urban slum households (Cooking Energy Access and Use)
()
Non-slum urban households (IRES)
()
Proportion of PMUY beneficiaries among LPG-using households
15 IRES 2020 was conducted in 21 large states of India including Bihar Jharkhand Rajasthan Madhya Pradesh Uttar Pradesh and Chhattisgarh While IRES 2020 focused on urban households the Cooking Energy Access and Use survey specifically attended to urban slums in the same districts Refer to the technical note for a detailed methodology of the survey
23
3 Way forward
Slums across the world are chronically ignored in public policy and suffer because of unauthorised and unsafe habitation without access to government services (Shahadat
Lipu and Bhuiyan 2014) In terms of energy access while we see a progressive change in householdsrsquo energy use patterns as we move from rural to urban issues like affordability availability preference and familiarity with the fuel and stove remain essential factors that determine householdsrsquo fuel choice
Image iStock
Are Indiarsquos Urban Poor Using Clean Cooking Fuels Insights from Slums in Six States24
Understanding categories of users is important for enabling access to and use of clean cooking fuels
We categorised the urban slum population based on their fuel usage patterns ndash using only clean fuels stacking clean fuels with polluting fuels and using only polluting fuels While most households in urban slums have an LPG connection only half of them use LPG exclusively The householdrsquos economic status and its access to doorstep delivery of LPG refills are two crucial factors that determine its ability to use LPG exclusively Despite being situated in urban areas 37 per cent of slum households do not receive home delivery of cylinders ndash availability is an essential factor in determining the householdrsquos likelihood of using LPG exclusively There is a strong impetus for the OMCs and distributors to improve their home delivery services of LPG refills in slum areas
Stacking is prevalent in about one-third of households ndash there is a need for a deeper understanding of householdsrsquo preferences fuel end-uses and awareness Most households reported using polluting fuels daily or at least weekly this effectively increases their exposure to household air pollution despite having access to clean cooking fuels Among households that stack LPG with polluting fuels the reasons for stacking differ ndash affordability seasonality and taste preference More than a quarter of households that stack have a similar level of LPG consumption as those that use LPG exclusively despite similar family sizes Such households use polluting fuels not because of their inability to afford LPG But other factors like free-of-cost availability of biomass taste preference for chulha and alternate end-uses of fuelmdashfor instance in space heatingmdashinfluence the householdrsquos decision to use solid fuels Among households that stack multiple fuels the use of polluting fuels increases during winter months this exposes the households to a double burden of high ambient and household air pollution in these months About 40 per cent of these households also use polluting fuels for non-cooking purposes like heating water for bathing and space heating especially in winter
Even with large-scale government initiatives like PMUY we find that more than 10 per cent of urban slum households do not use LPG They mainly rely on free-of-cost biomass for their cooking and non-cooking needs Despite awareness of PMUY among these households the high upfront cost of procuring an LPG connection and high recurring expenditure on refills deter them from using LPG Evidently there is a need to expand the reach of PMUY to cover households across slums
Integrating the issue of lack of access to clean cooking energy within the discussion on urban poverty
This study reiterates the need to look at poverty in urban areas in the context of energy access Given the heterogeneity of poverty in urban and semi-urban India it is essential to understand energy poverty in the context of access to resources for an enhanced quality of life for the urban poor Similarly slums dwellers in large and small cities alike may experience additional challenges of access Furthermore not all urban poor live in slums we know even less about the access issues of temporary residents or seasonal migrants in urban India Therefore in a rapidly urbanising India studies on the urban poor and air quality need to integrate a focus on energy access to address the vulnerability of women children and communities to HAP and the drudgery of using polluting fuels for cooking and other household energy needs
Access to clean cooking energy schemes must be integrated into the social assistance programmes focused on urban poverty alleviation to enhance its reach
25Way forward
Converging energy access in social protection policies for the urban poor
Accounting for the vulnerabilities of the urban poor is crucial in designing and implementing policies including social protection schemes As a health and economic imperative access to clean cooking energy schemes must be integrated into the social assistance programmes of other ministries (eg health education and nutrition assistance) to offer better support to slum households This would also reduce the burden on households of claiming and accessing multiple benefits across schemes thus freeing them to invest more time in productive activities (CEEW 2020) Government programmes such as the National Urban Livelihoods Mission and social service allocations for housing should use existing targeting approaches to include access to clean cooking energy within the ambit of services for the poor
Bringing a renewed emphasis on clean cooking energy access due to COVID-19 is essential
Most households in urban slums rely on daily wage labour or the gig economy for their household income During the COVID-19 pandemic these occupations have been among the worst impacted by the lockdown and the economic slowdown A survey conducted with over 2000 daily wage workers in urban slums during the lockdown suggests that only 7 per cent of respondents from this group received pay during the lockdown (Basu 2020) causing a massive shock to their livelihoods and wage earnings This kind of impact pushes households into energy poverty leading to the increased use of free-of-cost biomass and consequently increasing the risk of exposure to emissions from fuel burning While the government has committed to supplying up to three free refills to all PMUY households under PM-Garib Kalyan Yojana less than a quarter of households in urban slums have Ujjwala connections The low share of PMUY households effectively makes the majority of slum households ineligible for relief support given under the PM-Garib Kalyan Yojana during the lockdown There is a need to target vulnerable households ndash beyond PMUY beneficiaries ndash with differential subsidy support for using LPG in a sustained manner
Increased poverty would mean increased use of polluting fuels ndash there is a need for a renewed emphasis on clean cooking energy access during the COVID-19 pandemic as increased use of polluting fuels has health implications (lower respiratory infections and COPD) that increase the risk of COVID-19 infections being more severe
There is a need to target vulnerable households ndash beyond PMUY beneficiaries ndash with differential subsidy support for using LPG in a sustained manner
Are Indiarsquos Urban Poor Using Clean Cooking Fuels Insights from Slums in Six States
Balakrishnan Kalpana Sagnik Dey Tarun Gupta R S Dhaliwal Michael Brauer Aaron J Cohen Jeffrey D Stanaway et al 2019 ldquoThe Impact of Air Pollution on Deaths Disease Burden and Life Expectancy Across the States of India The Global Burden of Disease Study 2017rdquo The Lancet Planetary Health 3 (1) e26ndash39 httpsdoiorg101016S2542-5196(18)30261-4
Baqir M S K Bharti R Kothari and R P Singh 2019 ldquoAssessment of an Energy-efficient Metal Chulha for Solid Biomass Fuel and Evaluation of its Performancerdquo International Journal of Environmental Science and Technology 16 (11) 6773ndash6784 httpsdoiorg101007s13762-018-2028-9
Basu Anika Badyal 2020 ldquoLockdown Survey How The Covid-19 Crisis Has Affected Daily Wage WorkersmdashAIFrdquo American India Foundation June 28 httpsaiforglockdown-survey-how-the-covid-19-crisis-has-affected-daily-wage-workers
Butera F M P Caputo R Adhikari and A Facchini 2016 ldquoThe Challenge of Energy in Informal Settlements A Review of the Literature for Latin America and Africardquo Procedia Engineering 1ndash32 httpswwwenelfoundationorgcontentdamenel-foundtopic-downloadThe challenge of Energy in Informal settlementspdf
CEEW 2020 ldquoEnergy Safety Nets India Case Studyrdquo Vienna Sustainable Energy for All httpswwwceewinpublicationsenergy-safety-nets-india-case-study
Central Pollution Control Board 2014 ldquoNational Air Quality Indexrdquo New Delhi Central Pollution Control Board httpsappcpcbccrcomccr_docsFINAL-REPORT_AQI_pdf
Chafe Z S Mehta and K R Smith 2011 ldquoAmbient Fine Particulate (PM25) Air Pollution Attributable to Household Cooking Fuel in Asiardquo AGUFM A54Bndash03 httpsuiadsabsharvardeduabs2011AGUFMA54B03Cabstract
Chandramouli C 2010 ldquoCensus of India 2011 ndash Circular No 8rdquo New Delhi Ministry of Home Affairs httpscensusindiagovin2011-CircularsCircularsCircular-08pdf
Chandrasekhar S and Arup Mitra 2018 ldquoMigration Caste and Livelihood Evidence from Indian City-slumsrdquo Urban Research amp Practice 12 (2) 156ndash172 httpsdoiorg1010801753506920181426781
Cheng Chao Yo and Johannes Urpelainen 2014 ldquoFuel Stacking in India Changes in the Cooking and Lighting Mix 1987ndash2010rdquo Energy 76 (November) 306ndash317 httpsdoiorg101016jenergy201408023
Chowdhary Sourangsu Sagnik Dey Sarath Guttikunda Ajay Pillarisetti Kirk R Smith and Larry Di Girolamo 2019 ldquoIndian annual ambient air quality standard is achievable by completely mitigating emissions from household sourcesrdquo Proceedings of the National Academy of Sciences 116 (22) 10711-10716 httpsdoiorg101073pnas1900888116
Dhingra Chhavi Shikha Gandhi Akanksha Chaurey and P K Agarwal 2008 ldquoAccess to Clean Energy Services for the Urban and Peri-Urban Poor A Case-study of Delhi Indiardquo Energy for Sustainable Development 12 (4) 49ndash55 httpsdoiorg101016S0973-0826(09)60007-7
Farsi Mehdi Massimo Filippini and Shonali Pachauri 2007 ldquoFuel Choices in Urban Indian Householdsrdquo Environment and Development Economics 12 (6) 757ndash774 httpsdoiorg101017S1355770X07003932
References
26
Frontera Antonio Lorenzo Cianfanelli Konstantinos Vlachos Giovanni Landoni and George Cremona 2020 ldquoSevere Air Pollution Links to Higher Mortality in COVID-19 Patients The lsquoDouble-Hitrsquo Hypothesisrdquo Journal of Infection 81 (2) 255ndash259 httpsdoiorg101016jjinf202005031
Ganguly Tanushree Kurinj L Selvaraj Sarath K Guttikunda 2020 ldquoNational Clean Air Programme (NCAP) for Indian cities Review and outlook of clean air action plansrdquo Atmospheric Environment X Vol 8 httpsdoiorg101016jaeaoa2020100096
GNESD 2008 ldquoClean Energy for the Urban Poor An Urgent Issuerdquo Accessed 25 July 2020 httpswwwgooglecomurlsa=tamprct=jampq=ampesrc=sampsource=webampcd=ampved=2ahUKEwi1hf2ru dntAhUCOisKHQH7BtsQFjAAegQIAxACampurl=http3A2F2Fwwwgnesdorg2F-2Fmedia2FSites2FGNESD2FPublication- pdfs2FSPM_CleanEnergyashx3Fla3Dda26hash3DE4971C585B6798F17954F8B42E073 D9507F42A84ampusg=AOvVaw08kCDgOkTkYc6wRDxzsNyq
Guan Wei-Jie Wen-Hua Liang Yi Zhao Heng-Rui Liang Zi-Sheng Chen Yi-Min Li Xiao-Qing Liu et al 2020 ldquoComorbidity and its Impact on 1590 Patients with COVID-19 in China A Nationwide Analysisrdquo European Respiratory Journal 55 (5) 2000547 httpsdoiorg1011831399300300547-2020
Harish Santosh Kirk R Smith Sourangsu Chowdhury Zoe A Chafe Ajay Pillarisetti Jos Lelieveld Sarath Guttikunda Sagnik Dey and Andrew P Grieshop 2019 ldquoThe Contribution of Household Fuels to Ambient Air Pollution in India A Comparison of Recent Estimates Edited by CcapcOrgInrdquo Collaborative Clean Air Policy Centre May 30 httpsccapcorginpolicy-briefs2019530the-contribution-of-household-fuels-to-ambient-air-pollution-in-india-a-comparison-of-recent-estimates
Jain Abhishek Saurabh Tripathi Sunil Mani Sasmita Patnaik Tauseef Shahidi and Karthik Ganesan 2018 ldquoAccess to Clean Cooking Energy and Electricity Survey of States 2018rdquo New Delhi CEEW httpswwwceewinsitesdefaultfilesCEEW-Access-to-Clean-Cooking-Energy-and-Electricity-11Jan19_0pdf
Johnson Priscilla Kalpana Balakrishnan Padmavathi Ramaswamy Santu Ghosh Muthukumar Sadhasivam Omprakash Abirami Bernard W C Sathiasekaran Kirk R Smith Vijayalakshmi Thanasekaraan and Arcot S Subhashini 2011 ldquoPrevalence of Chronic Obstructive Pulmonary Disease in Rural Women of Tamilnadu Implications for Refining Disease Burden Assessments Attributable to Household Biomass Combustionrdquo Global Health Action 4 (1) 7226 httpsdoiorg103402ghav4i07226
Kilic Talip Heather Moylan and Gayatri Koolwal 2020 ldquoGetting the (Gender-disaggregated) Lay of the Land Impact of Survey Respondent Selection on Measuring Land Ownership and Rightsrdquo Washington DC The World Bank httpsdoiorg1015961813-9450-9151
Kojima Masami Robert Bacon and Xin Zhou 2011 ldquoWho Uses Bottled Gas Evidence from Households in Developing Countriesrdquo The World Bank Sustainable Energy Department Oil Gas and Mining Unit httpelibraryworldbankorgdoibook1015961813-9450-5731
Kuo Ying-Min and Mehtabul Azam 2019 ldquoHousehold Cooking Fuel Choice in India 2004ndash2012 A Panel Multinomial Analysisrdquo IZA Discussion Paper No 12682 httpsssrncomabstract=3468630
Lippi Giuseppe and Brandon Michael Henry 2020 ldquoChronic Obstructive Pulmonary Disease Is Associated with Severe Coronavirus Disease 2019 (COVID-19) COPD and COVID-19rdquo Respiratory Medicine 167 105941 httpsdoiorg101016jrmed2020105941
Ministry of Housing and Urban Affairs 2019 ldquoHandbook of Urban Statisticsrdquo New Delhi Government of India httpmohuagovinpdf5c80e2225a124Handbook of Urban Statistics 2019pdf
Rao M Narasimha and B Sudhakara Reddy 2007 ldquoVariations in Energy Use by Indian Households An Analysis of Micro Level Datardquo Energy 32 (2) 143ndash153 httpsdoiorg101016jenergy200603012
27References
Are Indiarsquos Urban Poor Using Clean Cooking Fuels Insights from Slums in Six States28
National Buildings Organisation 2013 ldquoState of Slums in India a Statistical Compendium 2013rdquo New Delhi Government of India httpnbonicinpdfSlums_in_India_Compendium_English_Versionpdf
National Sample Survey Office 2012 ldquoKey Indicators of Urban Slums in India ndash 69th Roundrdquo New Delhi National Data Bank for Socio-religious Categories httpmospinicinsitesdefaultfilesnational_data_bankndb-rpts-69htm
Nolan Laura B 2015 ldquoSlum Definitions in Urban India Implications for the Measurement of Health Inequalitiesrdquo Population and Development Review 41 (1) 59ndash84 httpsideasrepecorgablapopdevv41y2015i1p59-84html
Nolan Laura B David E Bloom and Ramnath Subbaraman 2018 ldquoLegal Status and Deprivation in Urban Slums Over Two Decadesrdquo HHS Public Access 53 (15) 47ndash55
Patel Amit 2020 ldquoPreventing COVID-19 Amid Public Health and Urban Planning Failures in Slums of Indian Citiesrdquo World Medical amp Health Policy 12 (3) httpsdoiorg101002wmh3351
Patnaik Sasmita and Shaily Jha 2020 ldquoCaste Class and Gender in Determining Access to Energy A Critical Review of LPG Adoption in Indiardquo Energy Research amp Social Science 67 (September) 101530 httpsdoiorg101016jerss2020101530
PPAC-CRISIL 2016 ldquoAssessment Report Primary Survey on Household Cooking Fuel Usage and Willingness to Convert to LPGrdquo New Delhi Petroleum Planning amp Analysis Cell Ministry of Petroleum and Natural Gas Government of India httpswwwppacgovinWriteReadDataReports201710310449342512219PrimarySurveyReportPPACpdf
PPAC 2019 ldquoOil Industry Information at a Glancerdquo New Delhi Ministry of Petroleum and Natural Gas Government of India httpswwwppacgovinWriteReadDataReports201912060336500305462ReadyReckonerNov2019WebVersionpdf
Rahaman Mehebub and Dipendra Nath Das 2017 ldquoNature of Slum Growth in Indian Citiesrdquo Urban India 37 (II) 100ndash116 httpswwwresearchgatenetpublication334051882_Nature_of_Slum_Growth_in_Indian_Citiesread
Rains Emily Anirudh Krishna and Erik Wibbels 2018 ldquoUrbanisation and Indiarsquos Slum Continuum Evidence on the Range of Policy Needs and Scope of Mobilityrdquo London International Growth Centre httpswwwtheigcorgwp-contentuploads201802Rains-et-al_Working-paper_coverpdf
Ranjan Rahul and Sudershan Singh 2017 ldquoEnergy Deprivation of Indian Households Evidence from NSSO Datardquo New Delhi Munich Personal RePEc Archive httpsmpraubuni-muenchende835661MPRA_paper_83566pdf
Roy Debraj Bharath Palavalli Niveditha Menon Robin King Karin Pfeffer Michael Lees and Peter M A Sloot 2018 ldquoSurvey-based Socio-economic Data from Slums in Bangalore Indiardquo Nature Publishing Group 5 1ndash9 httpsdoiorg101038sdata2017200
Saksena Sumeet P B Singh Raj Kumar Prasad Rakesh Prasad Preeti Malhotra Veena Joshi and R S Patil 2003 ldquoExposure of Infants to Outdoor and Indoor Air Pollution in Low-income Urban Areas A Case Study of Delhirdquo Journal of Exposure Science amp Environmental Epidemiology 13 219ndash30 httpsdoiorg101038sjjea7500273
Lipu Molla Shahadat Hossain and Arif Waliullah Bhuiyan 2014 ldquoElectricity Access in Urban Slum Households of Bangladesh A Case of Dhakardquo Journal of Renewable and Sustainable Energy 6 (053112) 1ndash15 httpsdoiorg10106314896697
29
Singh Rozita Xiao Wang Emmanuel Ackom and Juan Reyes 2015 ldquoEnergy Access Realities in Urban Poor Communities of Developing Countries Assessments and Recommendationsrdquo Global Network on Energy for Sustainable Development (GNESD) httpswwwgooglecomurlsa=tamprct=jampq=ampesrc=sampsource=webampcd=ampved=2ahUKEwj5nbqI wdntAhXUTX0KHZE6DboQFjAAegQIAhACampurl=https3A2F2Forbitdtudk2Ffiles2F10635 24942FEnergy_access_realities_v_final_updatedpdfampusg=AOvVaw0xNBAAo0bjLueY9FmoigKF
Singh Santosh 2014 ldquoThe Kaleidoscope of Cooking Understanding Cooking Behaviour and Stove Preferences in Rural Indiardquo New Delhi Deutsche Gesellschaft fuumlr Internationale Zusammenarbeit (GIZ) GmbH httpswwwgizdeendownloadsgiz2014-en-kaleidoscope-of-cooking-indiapdf
Smith Kirk R and Ajay Pillarisetti 2017 ldquoHousehold Air Pollution from Solid Cookfuels and its Effects on Healthrdquo Disease Control Priorities 7 (3) 133ndash52 httpsdoiorg101596978-1-4648-0522-6_ch7
UN-Habitat 2003 ldquoThe Challenge of Slums ndash Global Report on Human Settlements 2003rdquo Location of publishing London UN-Habitat httpsunhabitatorgthe-challenge-of-slums-global-report-on-human-settlements-2003
Wang Bolin Ruobao Li Zhong Lu and Yan Huang 2020 ldquoDoes Comorbidity Increase the Risk of Patients with COVID-19 Evidence from Meta-analysisrdquo Aging 12 (7) 6049ndash6057 httpsdoiorg1018632AGING103000
WHO 2014 ldquoWHO Guidelines for Indoor Air Quality Household Fuel Combustionrdquo WHO Accessed 25 July 2020 httpwwwwhointairpollutionguidelineshousehold-fuel-combustionen
World Bank 2020 ldquoThe State of Modern Energy Cooking Servicesrdquo Washington DC World Bank httpdocuments1worldbankorgcurateden937141600195758792pdfThe-State-of-Access-to-Modern-Energy-Cooking-Servicespdf
Yenneti Komali Yehua Dennis Wei and Wen Chen 2017 ldquoThe Urbanization of Poverty in India Spatio-temporal Disparities in Consumption Expendituresrdquo Geographical Review 107 (2) 360ndash383 httpsdoiorg101111j1931-0846201612167x
References
Are Indiarsquos Urban Poor Using Clean Cooking Fuels Insights from Slums in Six States
Annexure 1 Asset ownership index We used Filmer and Pritchettrsquos (2001) proposed approach to construct an asset ownership index using principal component analysis (PCA) We chose the indicators based on data from the Cooking Energy Access survey 2020 The variables we considered for the index were based on classifications by Caroline Moser and Andrew Felton (2007) and K Harttgen (2013) We computed the asset index using housing characteristics and consumer durables as follows
Variables not included in the asset index
Four types of variables were eliminated
1 Variables (such as grid electricity) that had high usage of greater than 95 per cent
2 Those (such as ownership of laptops or computers air conditioners etc) that had a low usage of less than 5 per cent
3 Variables (like house ownership) that have economically fluctuating values
4 Those that indicated a low correlation of less than 20 per cent variation between the top category (ie first) of the asset quintile and the bottom-most category (ie fifth) of the asset quintile
For ease of interpretation we rescaled this index such that the final index values range between 0 and 10 For this purpose we used a feature scaling (or minndashmax scaling) formula
Xnorm (or (IVx)) = (X ndash Xmin)(Xmax ndash Xmin)
where IVx is the normalised index value Xmin is the initial minimum value (-354) and Xmax is the initial maximum value (461) of the asset ownership index
30
Annexures
bull Crowding16 inside the house bull Toilet ownership and usage bull Source of water bull Number of pucca rooms
bull Ownership of two-wheeler bull Ownership of washing machine bull Ownership of television bull Ownership of refrigerator bull Ownership of cooker
16 A household with more than three members occupying a single room is considered crowded (World Health Organization 2018)
Housing characteristics
Consumer durables
Annexure 2 Explaining the use of LPG as the exclusive fuel (simple logistic regression model)
31Annexures
Dependent variable exclusive LPG use
Education of the primary cook (categorical base category is education beyond the school level)
Education of the household head (categorical base category is education beyond the school level)
State (categorical base category includes households from Rajasthan)
P gt z 95 confidence interval
Odds ratio (SE)
1299 (0112)
0659 (0202)
1399 (0394)
0970 (0038)
0994 (0011)
1003 (0013)
2042 (0508)
1011 (0046)
0782 (0441)
1198 (0608)
1377 (0664)
1345 (0566)
3141 (1103)
1213 (0500)
0309 (0211)
1165 (0565)
1703 (0680)
0002
0174
0233
0446
0583
0839
0004
0812
0663
0722
0507
0482
0001
0639
0086
0753
0182
1097
0361
0806
0898
0973
0977
1254
0924
0259
0443
0535
0589
1578
0541
0081
0450
0779
1540
1203
2428
1048
1016
1029
3327
1106
2361
3240
3545
3070
6251
2720
1181
3014
3723
Asset index
Primary cook involved in income-generating activity
Female-headed households
Household size
Age of household head
Age of primary cook
Doorstep delivery of LPG cylinders
PMUY customer
Primary cook is not educated
Primary cook has a school education
Household head is not educated
Household head has a school education
Uttar Pradesh
Bihar
Chhattisgarh
Jharkhand
Madhya Pradesh
Number of households (n) = 417
Log likelihood = -228777
Prob gt chi2 = 0000
Pseudo R2 = 0126
The dependent variable is a dummy variable where households using LPG exclusively are assigned a value of 1 and all other households are assigned the value of 0
The caste of the household has not been factored into the regression as a separate variable because of its underlying influence on economic status
Source Authorsrsquo analysis
Are Indiarsquos Urban Poor Using Clean Cooking Fuels Insights from Slums in Six States
Annexure 3 Air quality (PM25 concentration in μgm3) across 15 districts based on CAAQMS data
32
Dis
tric
tsM
ar-1
9A
pr-1
9M
ay-1
9Ju
n-19
Jul-1
9A
ug-1
9Se
p-19
Oct
-19
Nov
-19
Dec
-19
Jan-
20Fe
b-20
Mar
-20
794
5
988
5
866
7
-
645
329
2
453
7
388
1
769
1
886
4
661
5
950
9
834
4
-
823
4
611
7
569
9
535
7
-
270
4
589
4
571
5
293
1
705
4
839
2
614
9
970
1
826
8
-
844
9
622
1
597
1
564
0
-
235
3
414
3
619
1
414
3
653
9
834
7
568
8
104
90
739
8
-
894
9
630
9
342
2
450
4
-
476
465
2
474
6
429
2
592
3
566
1
-
674
6
531
4
501
5
568
7
450
8
-
320
3
-
846
506
3
349
5
332
4
369
1
387
2
-
430
4
393
6
353
7
446
2
406
8
335
2
339
1
-
102
9
497
2
261
8
269
1
431
4
294
1
-
351
6
277
3
-
336
5
315
5
248
3
392
8
149
7
144
9
462
3
270
5
331
3
273
4
276
0
106
6
391
7
326
2
-
368
6
625
3
875
2
101
64
521
2
183
1
380
4
556
2
544
1
558
2
102
24
104
33
156
44
128
73
146
62
137
71
109
14
183
70
201
80
896
7
190
1
457
7
581
2
583
5
815
4
135
00
126
41
239
94
208
15
158
51
221
86
121
35
192
46
218
43
848
0
205
2
448
5
509
4
582
0
704
5
177
01
613
1
244
01
215
80
136
87
230
54
964
2
201
52
122
30
725
5
120
6
435
4
454
7
481
2
111
37
147
45
537
3
175
53
162
86
111
21
170
08
583
8
132
10
866
2
513
1
112
5
511
3
507
5
511
8
879
4
120
22
502
1
135
53
116
39
994
7
120
45
410
5
792
1
674
8
326
3
177
6
385
0
408
5
335
9
497
2
594
2
429
9
673
2
547
5
540
8
559
4
Gay
a
Muz
affa
rpur
Pat
na
Bho
pal
Satn
a
Alw
ar
Ajm
er
Ud
aip
ur
Ag
ra
Bul
and
shah
r
Hap
ur
Gha
ziab
ad
Gre
ater
Noi
da
Mee
rut
Noi
da
Sour
ce C
onti
nuou
s am
bien
t air
qua
lity
mon
itor
ing
stat
ion
(Mar
ch 2
019
ndash M
arch
202
0)
In a rapidly urbanising India it would be imperative for policymakers and practitioners in energy and urban development sector to integrate access to clean cooking energy within the ambit of services for the urban poor
Image CEEW
Are Indiarsquos Urban Poor Using Clean Cooking Fuels Insights from Slums in Six States
COUNCIL ON ENERGY ENVIRONMENT AND WATER (CEEW)
Sanskrit Bhawan A-10 Aruna Asaf Ali Marg Qutab Institutional AreaNew Delhi - 110 067 IndiaT +91 11 4073 3300
infoceewin | ceewin | CEEWIndia
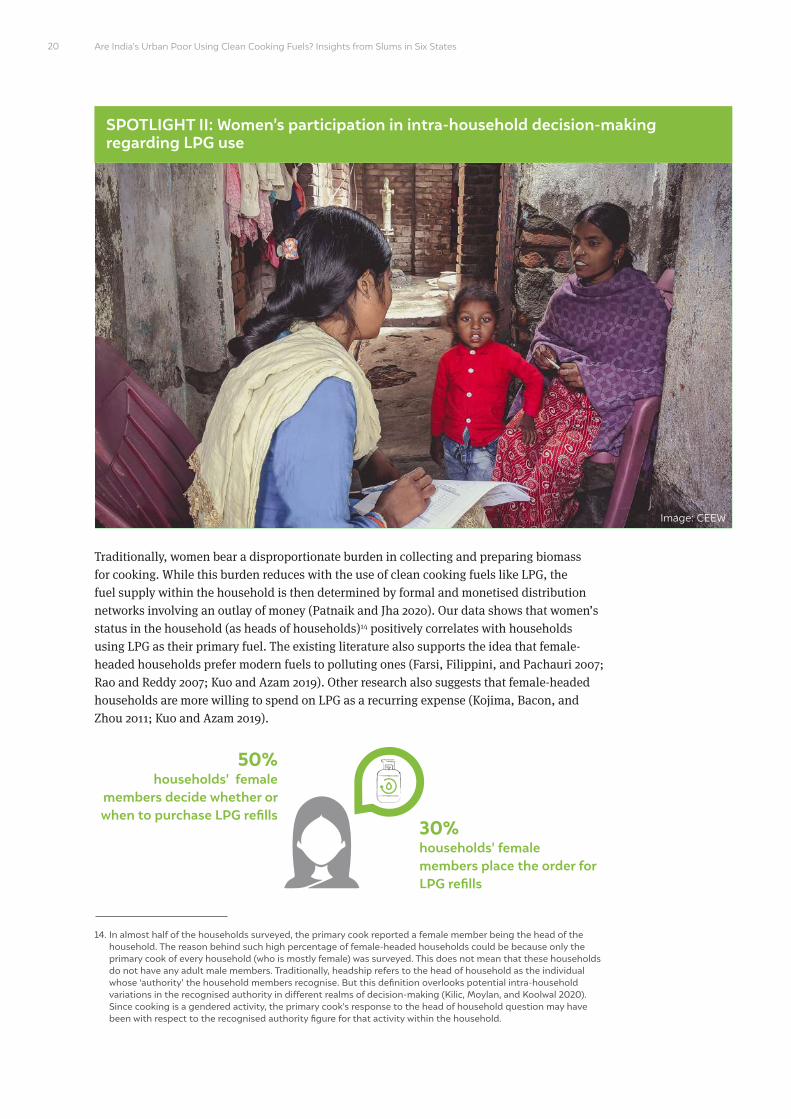
Are Indiarsquos Urban Poor Using Clean Cooking Fuels Insights from Slums in Six States
Traditionally women bear a disproportionate burden in collecting and preparing biomass for cooking While this burden reduces with the use of clean cooking fuels like LPG the fuel supply within the household is then determined by formal and monetised distribution networks involving an outlay of money (Patnaik and Jha 2020) Our data shows that womenrsquos status in the household (as heads of households)14 positively correlates with households using LPG as their primary fuel The existing literature also supports the idea that female-headed households prefer modern fuels to polluting ones (Farsi Filippini and Pachauri 2007 Rao and Reddy 2007 Kuo and Azam 2019) Other research also suggests that female-headed households are more willing to spend on LPG as a recurring expense (Kojima Bacon and Zhou 2011 Kuo and Azam 2019)
SPOTLIGHT II Womenrsquos participation in intra-household decision-making regarding LPG use
20
14 In almost half of the households surveyed the primary cook reported a female member being the head of the household The reason behind such high percentage of female-headed households could be because only the primary cook of every household (who is mostly female) was surveyed This does not mean that these households do not have any adult male members Traditionally headship refers to the head of household as the individual whose lsquoauthorityrsquo the household members recognise But this definition overlooks potential intra-household variations in the recognised authority in different realms of decision-making (Kilic Moylan and Koolwal 2020) Since cooking is a gendered activity the primary cookrsquos response to the head of household question may have been with respect to the recognised authority figure for that activity within the household
30 householdsrsquo female members place the order for LPG refills
50householdsrsquo female
members decide whether or when to purchase LPG refills
We also find that the decision of whether or when to purchase LPG refills is made by male members in half of urban slum households This holds for both male- and female-headed households In LPG-using households where the primary cook is involved in an income-generating activity more women are deciding to order the refills This pattern is similar irrespective of whether the household uses LPG exclusively or stacks it with other polluting fuels or are PMUY beneficiaries
SPOTLIGHT III A comparison of access to clean cooking energy between urban slum and non-slum households across six states
21
At the state level Bihar has significantly poor involvement of women in intra-household decision-making regarding
ordering refills with less than 10 per cent of households reporting that women decide whether or when to order
refills However more women than men are involved in decisions around LPG refills in Rajasthan Madhya Pradesh
and Jharkhand
Across caste groups the involvement of women is lowest (37 per cent) among the Scheduled Castes (SCs)
However more women in General and OBC households decide when to order LPG refills
BOX 8 Variations in intra-household decision-making across states and caste groups
Cooking fuel adoption and use in urban slum households
To compare the fuel use patterns of urban slum and non-slum households we used data from the India Residential Energy Survey (IRES 2020)15 The overlap in the sampling strategies of both IRES and our survey enabled a comparison of the findings There is a significant difference in the socio-economic status of slum and non-slum households which tends to affect their fuel use patterns Table 4 provides a comparison of cooking fuel usage in urban non-slum households (from IRES 2020) and urban slum households (Cooking Energy Access and Use survey 2020)
Are Indiarsquos Urban Poor Using Clean Cooking Fuels Insights from Slums in Six States22
Table 4 The poor economic condition of households in urban slums impacts the exclusive use of clean fuels for cooking
Source Authorsrsquo analysis
Fuel use categories Urban slum households (Cooking Energy Access Survey) ()
Non-slum urban households (IRES) ()
95 88
84 55
9 33
5 12
Clean fuel users (LPG PNG and electricity)
LPG as an exclusive fuel
Households that stack LPG with polluting fuels
Households that use only polluting fuels
We observed a significant gap in the exclusive use of LPG as a cooking fuel between urban slums and non-slum households explained mainly by the difference in their economic conditions Stacking is three times more common in slum households than non-slum households About 45 per cent of non-slum households using polluting fuels belong to marginalised social groups (SCs and STs) Households using polluting fuels have a lower median monthly expenditure than others and about 62 per cent of such households are semi-pucca or kuchha structures Among LPG users non-slum households have a slightly higher rate of doorstep delivery as compared to slum households
LPG-using households receiving home deliveries
Source Authorsrsquo analysis
239
6372
Urban slum households (Cooking Energy Access and Use)
()
Non-slum urban households (IRES)
()
Proportion of PMUY beneficiaries among LPG-using households
15 IRES 2020 was conducted in 21 large states of India including Bihar Jharkhand Rajasthan Madhya Pradesh Uttar Pradesh and Chhattisgarh While IRES 2020 focused on urban households the Cooking Energy Access and Use survey specifically attended to urban slums in the same districts Refer to the technical note for a detailed methodology of the survey
23
3 Way forward
Slums across the world are chronically ignored in public policy and suffer because of unauthorised and unsafe habitation without access to government services (Shahadat
Lipu and Bhuiyan 2014) In terms of energy access while we see a progressive change in householdsrsquo energy use patterns as we move from rural to urban issues like affordability availability preference and familiarity with the fuel and stove remain essential factors that determine householdsrsquo fuel choice
Image iStock
Are Indiarsquos Urban Poor Using Clean Cooking Fuels Insights from Slums in Six States24
Understanding categories of users is important for enabling access to and use of clean cooking fuels
We categorised the urban slum population based on their fuel usage patterns ndash using only clean fuels stacking clean fuels with polluting fuels and using only polluting fuels While most households in urban slums have an LPG connection only half of them use LPG exclusively The householdrsquos economic status and its access to doorstep delivery of LPG refills are two crucial factors that determine its ability to use LPG exclusively Despite being situated in urban areas 37 per cent of slum households do not receive home delivery of cylinders ndash availability is an essential factor in determining the householdrsquos likelihood of using LPG exclusively There is a strong impetus for the OMCs and distributors to improve their home delivery services of LPG refills in slum areas
Stacking is prevalent in about one-third of households ndash there is a need for a deeper understanding of householdsrsquo preferences fuel end-uses and awareness Most households reported using polluting fuels daily or at least weekly this effectively increases their exposure to household air pollution despite having access to clean cooking fuels Among households that stack LPG with polluting fuels the reasons for stacking differ ndash affordability seasonality and taste preference More than a quarter of households that stack have a similar level of LPG consumption as those that use LPG exclusively despite similar family sizes Such households use polluting fuels not because of their inability to afford LPG But other factors like free-of-cost availability of biomass taste preference for chulha and alternate end-uses of fuelmdashfor instance in space heatingmdashinfluence the householdrsquos decision to use solid fuels Among households that stack multiple fuels the use of polluting fuels increases during winter months this exposes the households to a double burden of high ambient and household air pollution in these months About 40 per cent of these households also use polluting fuels for non-cooking purposes like heating water for bathing and space heating especially in winter
Even with large-scale government initiatives like PMUY we find that more than 10 per cent of urban slum households do not use LPG They mainly rely on free-of-cost biomass for their cooking and non-cooking needs Despite awareness of PMUY among these households the high upfront cost of procuring an LPG connection and high recurring expenditure on refills deter them from using LPG Evidently there is a need to expand the reach of PMUY to cover households across slums
Integrating the issue of lack of access to clean cooking energy within the discussion on urban poverty
This study reiterates the need to look at poverty in urban areas in the context of energy access Given the heterogeneity of poverty in urban and semi-urban India it is essential to understand energy poverty in the context of access to resources for an enhanced quality of life for the urban poor Similarly slums dwellers in large and small cities alike may experience additional challenges of access Furthermore not all urban poor live in slums we know even less about the access issues of temporary residents or seasonal migrants in urban India Therefore in a rapidly urbanising India studies on the urban poor and air quality need to integrate a focus on energy access to address the vulnerability of women children and communities to HAP and the drudgery of using polluting fuels for cooking and other household energy needs
Access to clean cooking energy schemes must be integrated into the social assistance programmes focused on urban poverty alleviation to enhance its reach
25Way forward
Converging energy access in social protection policies for the urban poor
Accounting for the vulnerabilities of the urban poor is crucial in designing and implementing policies including social protection schemes As a health and economic imperative access to clean cooking energy schemes must be integrated into the social assistance programmes of other ministries (eg health education and nutrition assistance) to offer better support to slum households This would also reduce the burden on households of claiming and accessing multiple benefits across schemes thus freeing them to invest more time in productive activities (CEEW 2020) Government programmes such as the National Urban Livelihoods Mission and social service allocations for housing should use existing targeting approaches to include access to clean cooking energy within the ambit of services for the poor
Bringing a renewed emphasis on clean cooking energy access due to COVID-19 is essential
Most households in urban slums rely on daily wage labour or the gig economy for their household income During the COVID-19 pandemic these occupations have been among the worst impacted by the lockdown and the economic slowdown A survey conducted with over 2000 daily wage workers in urban slums during the lockdown suggests that only 7 per cent of respondents from this group received pay during the lockdown (Basu 2020) causing a massive shock to their livelihoods and wage earnings This kind of impact pushes households into energy poverty leading to the increased use of free-of-cost biomass and consequently increasing the risk of exposure to emissions from fuel burning While the government has committed to supplying up to three free refills to all PMUY households under PM-Garib Kalyan Yojana less than a quarter of households in urban slums have Ujjwala connections The low share of PMUY households effectively makes the majority of slum households ineligible for relief support given under the PM-Garib Kalyan Yojana during the lockdown There is a need to target vulnerable households ndash beyond PMUY beneficiaries ndash with differential subsidy support for using LPG in a sustained manner
Increased poverty would mean increased use of polluting fuels ndash there is a need for a renewed emphasis on clean cooking energy access during the COVID-19 pandemic as increased use of polluting fuels has health implications (lower respiratory infections and COPD) that increase the risk of COVID-19 infections being more severe
There is a need to target vulnerable households ndash beyond PMUY beneficiaries ndash with differential subsidy support for using LPG in a sustained manner
Are Indiarsquos Urban Poor Using Clean Cooking Fuels Insights from Slums in Six States
Balakrishnan Kalpana Sagnik Dey Tarun Gupta R S Dhaliwal Michael Brauer Aaron J Cohen Jeffrey D Stanaway et al 2019 ldquoThe Impact of Air Pollution on Deaths Disease Burden and Life Expectancy Across the States of India The Global Burden of Disease Study 2017rdquo The Lancet Planetary Health 3 (1) e26ndash39 httpsdoiorg101016S2542-5196(18)30261-4
Baqir M S K Bharti R Kothari and R P Singh 2019 ldquoAssessment of an Energy-efficient Metal Chulha for Solid Biomass Fuel and Evaluation of its Performancerdquo International Journal of Environmental Science and Technology 16 (11) 6773ndash6784 httpsdoiorg101007s13762-018-2028-9
Basu Anika Badyal 2020 ldquoLockdown Survey How The Covid-19 Crisis Has Affected Daily Wage WorkersmdashAIFrdquo American India Foundation June 28 httpsaiforglockdown-survey-how-the-covid-19-crisis-has-affected-daily-wage-workers
Butera F M P Caputo R Adhikari and A Facchini 2016 ldquoThe Challenge of Energy in Informal Settlements A Review of the Literature for Latin America and Africardquo Procedia Engineering 1ndash32 httpswwwenelfoundationorgcontentdamenel-foundtopic-downloadThe challenge of Energy in Informal settlementspdf
CEEW 2020 ldquoEnergy Safety Nets India Case Studyrdquo Vienna Sustainable Energy for All httpswwwceewinpublicationsenergy-safety-nets-india-case-study
Central Pollution Control Board 2014 ldquoNational Air Quality Indexrdquo New Delhi Central Pollution Control Board httpsappcpcbccrcomccr_docsFINAL-REPORT_AQI_pdf
Chafe Z S Mehta and K R Smith 2011 ldquoAmbient Fine Particulate (PM25) Air Pollution Attributable to Household Cooking Fuel in Asiardquo AGUFM A54Bndash03 httpsuiadsabsharvardeduabs2011AGUFMA54B03Cabstract
Chandramouli C 2010 ldquoCensus of India 2011 ndash Circular No 8rdquo New Delhi Ministry of Home Affairs httpscensusindiagovin2011-CircularsCircularsCircular-08pdf
Chandrasekhar S and Arup Mitra 2018 ldquoMigration Caste and Livelihood Evidence from Indian City-slumsrdquo Urban Research amp Practice 12 (2) 156ndash172 httpsdoiorg1010801753506920181426781
Cheng Chao Yo and Johannes Urpelainen 2014 ldquoFuel Stacking in India Changes in the Cooking and Lighting Mix 1987ndash2010rdquo Energy 76 (November) 306ndash317 httpsdoiorg101016jenergy201408023
Chowdhary Sourangsu Sagnik Dey Sarath Guttikunda Ajay Pillarisetti Kirk R Smith and Larry Di Girolamo 2019 ldquoIndian annual ambient air quality standard is achievable by completely mitigating emissions from household sourcesrdquo Proceedings of the National Academy of Sciences 116 (22) 10711-10716 httpsdoiorg101073pnas1900888116
Dhingra Chhavi Shikha Gandhi Akanksha Chaurey and P K Agarwal 2008 ldquoAccess to Clean Energy Services for the Urban and Peri-Urban Poor A Case-study of Delhi Indiardquo Energy for Sustainable Development 12 (4) 49ndash55 httpsdoiorg101016S0973-0826(09)60007-7
Farsi Mehdi Massimo Filippini and Shonali Pachauri 2007 ldquoFuel Choices in Urban Indian Householdsrdquo Environment and Development Economics 12 (6) 757ndash774 httpsdoiorg101017S1355770X07003932
References
26
Frontera Antonio Lorenzo Cianfanelli Konstantinos Vlachos Giovanni Landoni and George Cremona 2020 ldquoSevere Air Pollution Links to Higher Mortality in COVID-19 Patients The lsquoDouble-Hitrsquo Hypothesisrdquo Journal of Infection 81 (2) 255ndash259 httpsdoiorg101016jjinf202005031
Ganguly Tanushree Kurinj L Selvaraj Sarath K Guttikunda 2020 ldquoNational Clean Air Programme (NCAP) for Indian cities Review and outlook of clean air action plansrdquo Atmospheric Environment X Vol 8 httpsdoiorg101016jaeaoa2020100096
GNESD 2008 ldquoClean Energy for the Urban Poor An Urgent Issuerdquo Accessed 25 July 2020 httpswwwgooglecomurlsa=tamprct=jampq=ampesrc=sampsource=webampcd=ampved=2ahUKEwi1hf2ru dntAhUCOisKHQH7BtsQFjAAegQIAxACampurl=http3A2F2Fwwwgnesdorg2F-2Fmedia2FSites2FGNESD2FPublication- pdfs2FSPM_CleanEnergyashx3Fla3Dda26hash3DE4971C585B6798F17954F8B42E073 D9507F42A84ampusg=AOvVaw08kCDgOkTkYc6wRDxzsNyq
Guan Wei-Jie Wen-Hua Liang Yi Zhao Heng-Rui Liang Zi-Sheng Chen Yi-Min Li Xiao-Qing Liu et al 2020 ldquoComorbidity and its Impact on 1590 Patients with COVID-19 in China A Nationwide Analysisrdquo European Respiratory Journal 55 (5) 2000547 httpsdoiorg1011831399300300547-2020
Harish Santosh Kirk R Smith Sourangsu Chowdhury Zoe A Chafe Ajay Pillarisetti Jos Lelieveld Sarath Guttikunda Sagnik Dey and Andrew P Grieshop 2019 ldquoThe Contribution of Household Fuels to Ambient Air Pollution in India A Comparison of Recent Estimates Edited by CcapcOrgInrdquo Collaborative Clean Air Policy Centre May 30 httpsccapcorginpolicy-briefs2019530the-contribution-of-household-fuels-to-ambient-air-pollution-in-india-a-comparison-of-recent-estimates
Jain Abhishek Saurabh Tripathi Sunil Mani Sasmita Patnaik Tauseef Shahidi and Karthik Ganesan 2018 ldquoAccess to Clean Cooking Energy and Electricity Survey of States 2018rdquo New Delhi CEEW httpswwwceewinsitesdefaultfilesCEEW-Access-to-Clean-Cooking-Energy-and-Electricity-11Jan19_0pdf
Johnson Priscilla Kalpana Balakrishnan Padmavathi Ramaswamy Santu Ghosh Muthukumar Sadhasivam Omprakash Abirami Bernard W C Sathiasekaran Kirk R Smith Vijayalakshmi Thanasekaraan and Arcot S Subhashini 2011 ldquoPrevalence of Chronic Obstructive Pulmonary Disease in Rural Women of Tamilnadu Implications for Refining Disease Burden Assessments Attributable to Household Biomass Combustionrdquo Global Health Action 4 (1) 7226 httpsdoiorg103402ghav4i07226
Kilic Talip Heather Moylan and Gayatri Koolwal 2020 ldquoGetting the (Gender-disaggregated) Lay of the Land Impact of Survey Respondent Selection on Measuring Land Ownership and Rightsrdquo Washington DC The World Bank httpsdoiorg1015961813-9450-9151
Kojima Masami Robert Bacon and Xin Zhou 2011 ldquoWho Uses Bottled Gas Evidence from Households in Developing Countriesrdquo The World Bank Sustainable Energy Department Oil Gas and Mining Unit httpelibraryworldbankorgdoibook1015961813-9450-5731
Kuo Ying-Min and Mehtabul Azam 2019 ldquoHousehold Cooking Fuel Choice in India 2004ndash2012 A Panel Multinomial Analysisrdquo IZA Discussion Paper No 12682 httpsssrncomabstract=3468630
Lippi Giuseppe and Brandon Michael Henry 2020 ldquoChronic Obstructive Pulmonary Disease Is Associated with Severe Coronavirus Disease 2019 (COVID-19) COPD and COVID-19rdquo Respiratory Medicine 167 105941 httpsdoiorg101016jrmed2020105941
Ministry of Housing and Urban Affairs 2019 ldquoHandbook of Urban Statisticsrdquo New Delhi Government of India httpmohuagovinpdf5c80e2225a124Handbook of Urban Statistics 2019pdf
Rao M Narasimha and B Sudhakara Reddy 2007 ldquoVariations in Energy Use by Indian Households An Analysis of Micro Level Datardquo Energy 32 (2) 143ndash153 httpsdoiorg101016jenergy200603012
27References
Are Indiarsquos Urban Poor Using Clean Cooking Fuels Insights from Slums in Six States28
National Buildings Organisation 2013 ldquoState of Slums in India a Statistical Compendium 2013rdquo New Delhi Government of India httpnbonicinpdfSlums_in_India_Compendium_English_Versionpdf
National Sample Survey Office 2012 ldquoKey Indicators of Urban Slums in India ndash 69th Roundrdquo New Delhi National Data Bank for Socio-religious Categories httpmospinicinsitesdefaultfilesnational_data_bankndb-rpts-69htm
Nolan Laura B 2015 ldquoSlum Definitions in Urban India Implications for the Measurement of Health Inequalitiesrdquo Population and Development Review 41 (1) 59ndash84 httpsideasrepecorgablapopdevv41y2015i1p59-84html
Nolan Laura B David E Bloom and Ramnath Subbaraman 2018 ldquoLegal Status and Deprivation in Urban Slums Over Two Decadesrdquo HHS Public Access 53 (15) 47ndash55
Patel Amit 2020 ldquoPreventing COVID-19 Amid Public Health and Urban Planning Failures in Slums of Indian Citiesrdquo World Medical amp Health Policy 12 (3) httpsdoiorg101002wmh3351
Patnaik Sasmita and Shaily Jha 2020 ldquoCaste Class and Gender in Determining Access to Energy A Critical Review of LPG Adoption in Indiardquo Energy Research amp Social Science 67 (September) 101530 httpsdoiorg101016jerss2020101530
PPAC-CRISIL 2016 ldquoAssessment Report Primary Survey on Household Cooking Fuel Usage and Willingness to Convert to LPGrdquo New Delhi Petroleum Planning amp Analysis Cell Ministry of Petroleum and Natural Gas Government of India httpswwwppacgovinWriteReadDataReports201710310449342512219PrimarySurveyReportPPACpdf
PPAC 2019 ldquoOil Industry Information at a Glancerdquo New Delhi Ministry of Petroleum and Natural Gas Government of India httpswwwppacgovinWriteReadDataReports201912060336500305462ReadyReckonerNov2019WebVersionpdf
Rahaman Mehebub and Dipendra Nath Das 2017 ldquoNature of Slum Growth in Indian Citiesrdquo Urban India 37 (II) 100ndash116 httpswwwresearchgatenetpublication334051882_Nature_of_Slum_Growth_in_Indian_Citiesread
Rains Emily Anirudh Krishna and Erik Wibbels 2018 ldquoUrbanisation and Indiarsquos Slum Continuum Evidence on the Range of Policy Needs and Scope of Mobilityrdquo London International Growth Centre httpswwwtheigcorgwp-contentuploads201802Rains-et-al_Working-paper_coverpdf
Ranjan Rahul and Sudershan Singh 2017 ldquoEnergy Deprivation of Indian Households Evidence from NSSO Datardquo New Delhi Munich Personal RePEc Archive httpsmpraubuni-muenchende835661MPRA_paper_83566pdf
Roy Debraj Bharath Palavalli Niveditha Menon Robin King Karin Pfeffer Michael Lees and Peter M A Sloot 2018 ldquoSurvey-based Socio-economic Data from Slums in Bangalore Indiardquo Nature Publishing Group 5 1ndash9 httpsdoiorg101038sdata2017200
Saksena Sumeet P B Singh Raj Kumar Prasad Rakesh Prasad Preeti Malhotra Veena Joshi and R S Patil 2003 ldquoExposure of Infants to Outdoor and Indoor Air Pollution in Low-income Urban Areas A Case Study of Delhirdquo Journal of Exposure Science amp Environmental Epidemiology 13 219ndash30 httpsdoiorg101038sjjea7500273
Lipu Molla Shahadat Hossain and Arif Waliullah Bhuiyan 2014 ldquoElectricity Access in Urban Slum Households of Bangladesh A Case of Dhakardquo Journal of Renewable and Sustainable Energy 6 (053112) 1ndash15 httpsdoiorg10106314896697
29
Singh Rozita Xiao Wang Emmanuel Ackom and Juan Reyes 2015 ldquoEnergy Access Realities in Urban Poor Communities of Developing Countries Assessments and Recommendationsrdquo Global Network on Energy for Sustainable Development (GNESD) httpswwwgooglecomurlsa=tamprct=jampq=ampesrc=sampsource=webampcd=ampved=2ahUKEwj5nbqI wdntAhXUTX0KHZE6DboQFjAAegQIAhACampurl=https3A2F2Forbitdtudk2Ffiles2F10635 24942FEnergy_access_realities_v_final_updatedpdfampusg=AOvVaw0xNBAAo0bjLueY9FmoigKF
Singh Santosh 2014 ldquoThe Kaleidoscope of Cooking Understanding Cooking Behaviour and Stove Preferences in Rural Indiardquo New Delhi Deutsche Gesellschaft fuumlr Internationale Zusammenarbeit (GIZ) GmbH httpswwwgizdeendownloadsgiz2014-en-kaleidoscope-of-cooking-indiapdf
Smith Kirk R and Ajay Pillarisetti 2017 ldquoHousehold Air Pollution from Solid Cookfuels and its Effects on Healthrdquo Disease Control Priorities 7 (3) 133ndash52 httpsdoiorg101596978-1-4648-0522-6_ch7
UN-Habitat 2003 ldquoThe Challenge of Slums ndash Global Report on Human Settlements 2003rdquo Location of publishing London UN-Habitat httpsunhabitatorgthe-challenge-of-slums-global-report-on-human-settlements-2003
Wang Bolin Ruobao Li Zhong Lu and Yan Huang 2020 ldquoDoes Comorbidity Increase the Risk of Patients with COVID-19 Evidence from Meta-analysisrdquo Aging 12 (7) 6049ndash6057 httpsdoiorg1018632AGING103000
WHO 2014 ldquoWHO Guidelines for Indoor Air Quality Household Fuel Combustionrdquo WHO Accessed 25 July 2020 httpwwwwhointairpollutionguidelineshousehold-fuel-combustionen
World Bank 2020 ldquoThe State of Modern Energy Cooking Servicesrdquo Washington DC World Bank httpdocuments1worldbankorgcurateden937141600195758792pdfThe-State-of-Access-to-Modern-Energy-Cooking-Servicespdf
Yenneti Komali Yehua Dennis Wei and Wen Chen 2017 ldquoThe Urbanization of Poverty in India Spatio-temporal Disparities in Consumption Expendituresrdquo Geographical Review 107 (2) 360ndash383 httpsdoiorg101111j1931-0846201612167x
References
Are Indiarsquos Urban Poor Using Clean Cooking Fuels Insights from Slums in Six States
Annexure 1 Asset ownership index We used Filmer and Pritchettrsquos (2001) proposed approach to construct an asset ownership index using principal component analysis (PCA) We chose the indicators based on data from the Cooking Energy Access survey 2020 The variables we considered for the index were based on classifications by Caroline Moser and Andrew Felton (2007) and K Harttgen (2013) We computed the asset index using housing characteristics and consumer durables as follows
Variables not included in the asset index
Four types of variables were eliminated
1 Variables (such as grid electricity) that had high usage of greater than 95 per cent
2 Those (such as ownership of laptops or computers air conditioners etc) that had a low usage of less than 5 per cent
3 Variables (like house ownership) that have economically fluctuating values
4 Those that indicated a low correlation of less than 20 per cent variation between the top category (ie first) of the asset quintile and the bottom-most category (ie fifth) of the asset quintile
For ease of interpretation we rescaled this index such that the final index values range between 0 and 10 For this purpose we used a feature scaling (or minndashmax scaling) formula
Xnorm (or (IVx)) = (X ndash Xmin)(Xmax ndash Xmin)
where IVx is the normalised index value Xmin is the initial minimum value (-354) and Xmax is the initial maximum value (461) of the asset ownership index
30
Annexures
bull Crowding16 inside the house bull Toilet ownership and usage bull Source of water bull Number of pucca rooms
bull Ownership of two-wheeler bull Ownership of washing machine bull Ownership of television bull Ownership of refrigerator bull Ownership of cooker
16 A household with more than three members occupying a single room is considered crowded (World Health Organization 2018)
Housing characteristics
Consumer durables
Annexure 2 Explaining the use of LPG as the exclusive fuel (simple logistic regression model)
31Annexures
Dependent variable exclusive LPG use
Education of the primary cook (categorical base category is education beyond the school level)
Education of the household head (categorical base category is education beyond the school level)
State (categorical base category includes households from Rajasthan)
P gt z 95 confidence interval
Odds ratio (SE)
1299 (0112)
0659 (0202)
1399 (0394)
0970 (0038)
0994 (0011)
1003 (0013)
2042 (0508)
1011 (0046)
0782 (0441)
1198 (0608)
1377 (0664)
1345 (0566)
3141 (1103)
1213 (0500)
0309 (0211)
1165 (0565)
1703 (0680)
0002
0174
0233
0446
0583
0839
0004
0812
0663
0722
0507
0482
0001
0639
0086
0753
0182
1097
0361
0806
0898
0973
0977
1254
0924
0259
0443
0535
0589
1578
0541
0081
0450
0779
1540
1203
2428
1048
1016
1029
3327
1106
2361
3240
3545
3070
6251
2720
1181
3014
3723
Asset index
Primary cook involved in income-generating activity
Female-headed households
Household size
Age of household head
Age of primary cook
Doorstep delivery of LPG cylinders
PMUY customer
Primary cook is not educated
Primary cook has a school education
Household head is not educated
Household head has a school education
Uttar Pradesh
Bihar
Chhattisgarh
Jharkhand
Madhya Pradesh
Number of households (n) = 417
Log likelihood = -228777
Prob gt chi2 = 0000
Pseudo R2 = 0126
The dependent variable is a dummy variable where households using LPG exclusively are assigned a value of 1 and all other households are assigned the value of 0
The caste of the household has not been factored into the regression as a separate variable because of its underlying influence on economic status
Source Authorsrsquo analysis
Are Indiarsquos Urban Poor Using Clean Cooking Fuels Insights from Slums in Six States
Annexure 3 Air quality (PM25 concentration in μgm3) across 15 districts based on CAAQMS data
32
Dis
tric
tsM
ar-1
9A
pr-1
9M
ay-1
9Ju
n-19
Jul-1
9A
ug-1
9Se
p-19
Oct
-19
Nov
-19
Dec
-19
Jan-
20Fe
b-20
Mar
-20
794
5
988
5
866
7
-
645
329
2
453
7
388
1
769
1
886
4
661
5
950
9
834
4
-
823
4
611
7
569
9
535
7
-
270
4
589
4
571
5
293
1
705
4
839
2
614
9
970
1
826
8
-
844
9
622
1
597
1
564
0
-
235
3
414
3
619
1
414
3
653
9
834
7
568
8
104
90
739
8
-
894
9
630
9
342
2
450
4
-
476
465
2
474
6
429
2
592
3
566
1
-
674
6
531
4
501
5
568
7
450
8
-
320
3
-
846
506
3
349
5
332
4
369
1
387
2
-
430
4
393
6
353
7
446
2
406
8
335
2
339
1
-
102
9
497
2
261
8
269
1
431
4
294
1
-
351
6
277
3
-
336
5
315
5
248
3
392
8
149
7
144
9
462
3
270
5
331
3
273
4
276
0
106
6
391
7
326
2
-
368
6
625
3
875
2
101
64
521
2
183
1
380
4
556
2
544
1
558
2
102
24
104
33
156
44
128
73
146
62
137
71
109
14
183
70
201
80
896
7
190
1
457
7
581
2
583
5
815
4
135
00
126
41
239
94
208
15
158
51
221
86
121
35
192
46
218
43
848
0
205
2
448
5
509
4
582
0
704
5
177
01
613
1
244
01
215
80
136
87
230
54
964
2
201
52
122
30
725
5
120
6
435
4
454
7
481
2
111
37
147
45
537
3
175
53
162
86
111
21
170
08
583
8
132
10
866
2
513
1
112
5
511
3
507
5
511
8
879
4
120
22
502
1
135
53
116
39
994
7
120
45
410
5
792
1
674
8
326
3
177
6
385
0
408
5
335
9
497
2
594
2
429
9
673
2
547
5
540
8
559
4
Gay
a
Muz
affa
rpur
Pat
na
Bho
pal
Satn
a
Alw
ar
Ajm
er
Ud
aip
ur
Ag
ra
Bul
and
shah
r
Hap
ur
Gha
ziab
ad
Gre
ater
Noi
da
Mee
rut
Noi
da
Sour
ce C
onti
nuou
s am
bien
t air
qua
lity
mon
itor
ing
stat
ion
(Mar
ch 2
019
ndash M
arch
202
0)
In a rapidly urbanising India it would be imperative for policymakers and practitioners in energy and urban development sector to integrate access to clean cooking energy within the ambit of services for the urban poor
Image CEEW
Are Indiarsquos Urban Poor Using Clean Cooking Fuels Insights from Slums in Six States
COUNCIL ON ENERGY ENVIRONMENT AND WATER (CEEW)
Sanskrit Bhawan A-10 Aruna Asaf Ali Marg Qutab Institutional AreaNew Delhi - 110 067 IndiaT +91 11 4073 3300
infoceewin | ceewin | CEEWIndia
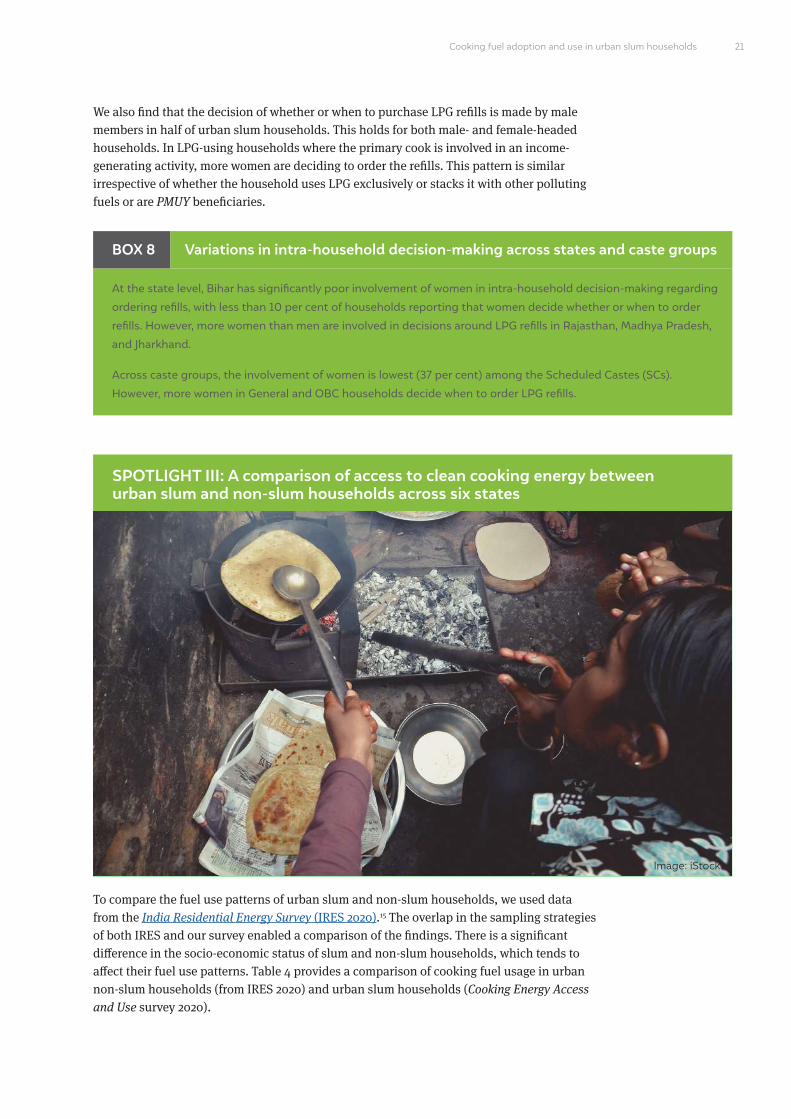
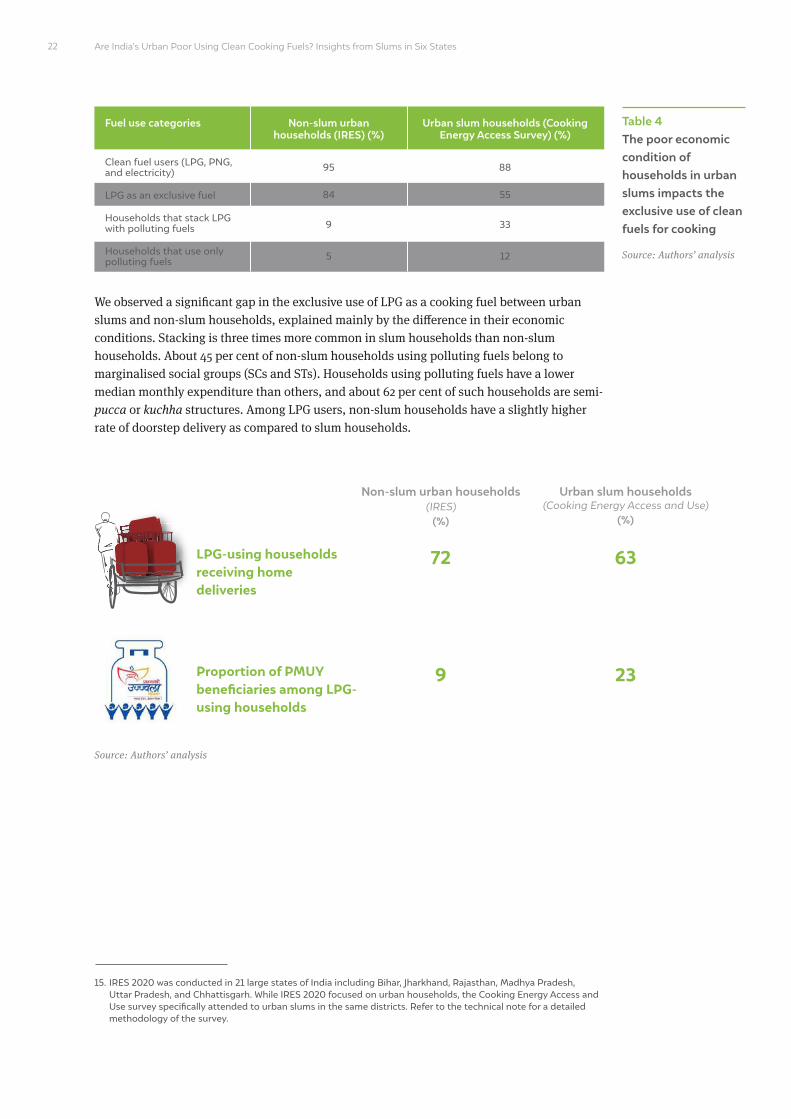
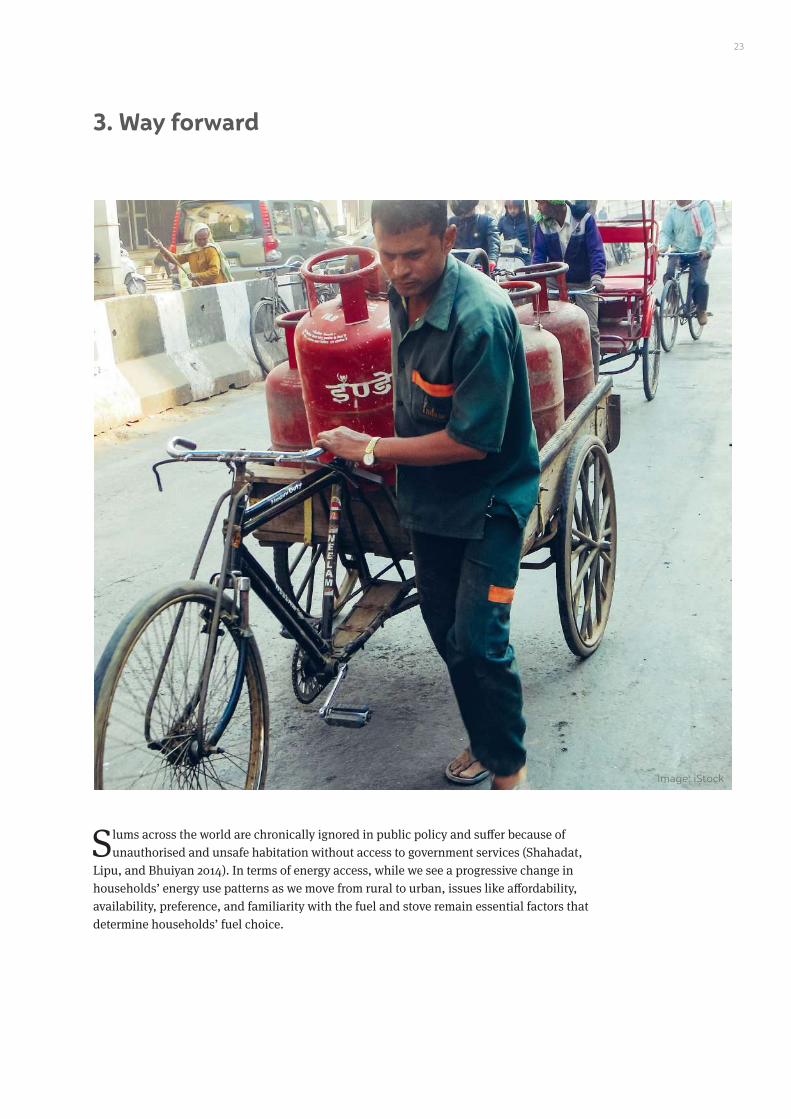
Are Indiarsquos Urban Poor Using Clean Cooking Fuels Insights from Slums in Six States
Balakrishnan Kalpana Sagnik Dey Tarun Gupta R S Dhaliwal Michael Brauer Aaron J Cohen Jeffrey D Stanaway et al 2019 ldquoThe Impact of Air Pollution on Deaths Disease Burden and Life Expectancy Across the States of India The Global Burden of Disease Study 2017rdquo The Lancet Planetary Health 3 (1) e26ndash39 httpsdoiorg101016S2542-5196(18)30261-4
Baqir M S K Bharti R Kothari and R P Singh 2019 ldquoAssessment of an Energy-efficient Metal Chulha for Solid Biomass Fuel and Evaluation of its Performancerdquo International Journal of Environmental Science and Technology 16 (11) 6773ndash6784 httpsdoiorg101007s13762-018-2028-9
Basu Anika Badyal 2020 ldquoLockdown Survey How The Covid-19 Crisis Has Affected Daily Wage WorkersmdashAIFrdquo American India Foundation June 28 httpsaiforglockdown-survey-how-the-covid-19-crisis-has-affected-daily-wage-workers
Butera F M P Caputo R Adhikari and A Facchini 2016 ldquoThe Challenge of Energy in Informal Settlements A Review of the Literature for Latin America and Africardquo Procedia Engineering 1ndash32 httpswwwenelfoundationorgcontentdamenel-foundtopic-downloadThe challenge of Energy in Informal settlementspdf
CEEW 2020 ldquoEnergy Safety Nets India Case Studyrdquo Vienna Sustainable Energy for All httpswwwceewinpublicationsenergy-safety-nets-india-case-study
Central Pollution Control Board 2014 ldquoNational Air Quality Indexrdquo New Delhi Central Pollution Control Board httpsappcpcbccrcomccr_docsFINAL-REPORT_AQI_pdf
Chafe Z S Mehta and K R Smith 2011 ldquoAmbient Fine Particulate (PM25) Air Pollution Attributable to Household Cooking Fuel in Asiardquo AGUFM A54Bndash03 httpsuiadsabsharvardeduabs2011AGUFMA54B03Cabstract
Chandramouli C 2010 ldquoCensus of India 2011 ndash Circular No 8rdquo New Delhi Ministry of Home Affairs httpscensusindiagovin2011-CircularsCircularsCircular-08pdf
Chandrasekhar S and Arup Mitra 2018 ldquoMigration Caste and Livelihood Evidence from Indian City-slumsrdquo Urban Research amp Practice 12 (2) 156ndash172 httpsdoiorg1010801753506920181426781
Cheng Chao Yo and Johannes Urpelainen 2014 ldquoFuel Stacking in India Changes in the Cooking and Lighting Mix 1987ndash2010rdquo Energy 76 (November) 306ndash317 httpsdoiorg101016jenergy201408023
Chowdhary Sourangsu Sagnik Dey Sarath Guttikunda Ajay Pillarisetti Kirk R Smith and Larry Di Girolamo 2019 ldquoIndian annual ambient air quality standard is achievable by completely mitigating emissions from household sourcesrdquo Proceedings of the National Academy of Sciences 116 (22) 10711-10716 httpsdoiorg101073pnas1900888116
Dhingra Chhavi Shikha Gandhi Akanksha Chaurey and P K Agarwal 2008 ldquoAccess to Clean Energy Services for the Urban and Peri-Urban Poor A Case-study of Delhi Indiardquo Energy for Sustainable Development 12 (4) 49ndash55 httpsdoiorg101016S0973-0826(09)60007-7
Farsi Mehdi Massimo Filippini and Shonali Pachauri 2007 ldquoFuel Choices in Urban Indian Householdsrdquo Environment and Development Economics 12 (6) 757ndash774 httpsdoiorg101017S1355770X07003932
References
26
Frontera Antonio Lorenzo Cianfanelli Konstantinos Vlachos Giovanni Landoni and George Cremona 2020 ldquoSevere Air Pollution Links to Higher Mortality in COVID-19 Patients The lsquoDouble-Hitrsquo Hypothesisrdquo Journal of Infection 81 (2) 255ndash259 httpsdoiorg101016jjinf202005031
Ganguly Tanushree Kurinj L Selvaraj Sarath K Guttikunda 2020 ldquoNational Clean Air Programme (NCAP) for Indian cities Review and outlook of clean air action plansrdquo Atmospheric Environment X Vol 8 httpsdoiorg101016jaeaoa2020100096
GNESD 2008 ldquoClean Energy for the Urban Poor An Urgent Issuerdquo Accessed 25 July 2020 httpswwwgooglecomurlsa=tamprct=jampq=ampesrc=sampsource=webampcd=ampved=2ahUKEwi1hf2ru dntAhUCOisKHQH7BtsQFjAAegQIAxACampurl=http3A2F2Fwwwgnesdorg2F-2Fmedia2FSites2FGNESD2FPublication- pdfs2FSPM_CleanEnergyashx3Fla3Dda26hash3DE4971C585B6798F17954F8B42E073 D9507F42A84ampusg=AOvVaw08kCDgOkTkYc6wRDxzsNyq
Guan Wei-Jie Wen-Hua Liang Yi Zhao Heng-Rui Liang Zi-Sheng Chen Yi-Min Li Xiao-Qing Liu et al 2020 ldquoComorbidity and its Impact on 1590 Patients with COVID-19 in China A Nationwide Analysisrdquo European Respiratory Journal 55 (5) 2000547 httpsdoiorg1011831399300300547-2020
Harish Santosh Kirk R Smith Sourangsu Chowdhury Zoe A Chafe Ajay Pillarisetti Jos Lelieveld Sarath Guttikunda Sagnik Dey and Andrew P Grieshop 2019 ldquoThe Contribution of Household Fuels to Ambient Air Pollution in India A Comparison of Recent Estimates Edited by CcapcOrgInrdquo Collaborative Clean Air Policy Centre May 30 httpsccapcorginpolicy-briefs2019530the-contribution-of-household-fuels-to-ambient-air-pollution-in-india-a-comparison-of-recent-estimates
Jain Abhishek Saurabh Tripathi Sunil Mani Sasmita Patnaik Tauseef Shahidi and Karthik Ganesan 2018 ldquoAccess to Clean Cooking Energy and Electricity Survey of States 2018rdquo New Delhi CEEW httpswwwceewinsitesdefaultfilesCEEW-Access-to-Clean-Cooking-Energy-and-Electricity-11Jan19_0pdf
Johnson Priscilla Kalpana Balakrishnan Padmavathi Ramaswamy Santu Ghosh Muthukumar Sadhasivam Omprakash Abirami Bernard W C Sathiasekaran Kirk R Smith Vijayalakshmi Thanasekaraan and Arcot S Subhashini 2011 ldquoPrevalence of Chronic Obstructive Pulmonary Disease in Rural Women of Tamilnadu Implications for Refining Disease Burden Assessments Attributable to Household Biomass Combustionrdquo Global Health Action 4 (1) 7226 httpsdoiorg103402ghav4i07226
Kilic Talip Heather Moylan and Gayatri Koolwal 2020 ldquoGetting the (Gender-disaggregated) Lay of the Land Impact of Survey Respondent Selection on Measuring Land Ownership and Rightsrdquo Washington DC The World Bank httpsdoiorg1015961813-9450-9151
Kojima Masami Robert Bacon and Xin Zhou 2011 ldquoWho Uses Bottled Gas Evidence from Households in Developing Countriesrdquo The World Bank Sustainable Energy Department Oil Gas and Mining Unit httpelibraryworldbankorgdoibook1015961813-9450-5731
Kuo Ying-Min and Mehtabul Azam 2019 ldquoHousehold Cooking Fuel Choice in India 2004ndash2012 A Panel Multinomial Analysisrdquo IZA Discussion Paper No 12682 httpsssrncomabstract=3468630
Lippi Giuseppe and Brandon Michael Henry 2020 ldquoChronic Obstructive Pulmonary Disease Is Associated with Severe Coronavirus Disease 2019 (COVID-19) COPD and COVID-19rdquo Respiratory Medicine 167 105941 httpsdoiorg101016jrmed2020105941
Ministry of Housing and Urban Affairs 2019 ldquoHandbook of Urban Statisticsrdquo New Delhi Government of India httpmohuagovinpdf5c80e2225a124Handbook of Urban Statistics 2019pdf
Rao M Narasimha and B Sudhakara Reddy 2007 ldquoVariations in Energy Use by Indian Households An Analysis of Micro Level Datardquo Energy 32 (2) 143ndash153 httpsdoiorg101016jenergy200603012
27References
Are Indiarsquos Urban Poor Using Clean Cooking Fuels Insights from Slums in Six States28
National Buildings Organisation 2013 ldquoState of Slums in India a Statistical Compendium 2013rdquo New Delhi Government of India httpnbonicinpdfSlums_in_India_Compendium_English_Versionpdf
National Sample Survey Office 2012 ldquoKey Indicators of Urban Slums in India ndash 69th Roundrdquo New Delhi National Data Bank for Socio-religious Categories httpmospinicinsitesdefaultfilesnational_data_bankndb-rpts-69htm
Nolan Laura B 2015 ldquoSlum Definitions in Urban India Implications for the Measurement of Health Inequalitiesrdquo Population and Development Review 41 (1) 59ndash84 httpsideasrepecorgablapopdevv41y2015i1p59-84html
Nolan Laura B David E Bloom and Ramnath Subbaraman 2018 ldquoLegal Status and Deprivation in Urban Slums Over Two Decadesrdquo HHS Public Access 53 (15) 47ndash55
Patel Amit 2020 ldquoPreventing COVID-19 Amid Public Health and Urban Planning Failures in Slums of Indian Citiesrdquo World Medical amp Health Policy 12 (3) httpsdoiorg101002wmh3351
Patnaik Sasmita and Shaily Jha 2020 ldquoCaste Class and Gender in Determining Access to Energy A Critical Review of LPG Adoption in Indiardquo Energy Research amp Social Science 67 (September) 101530 httpsdoiorg101016jerss2020101530
PPAC-CRISIL 2016 ldquoAssessment Report Primary Survey on Household Cooking Fuel Usage and Willingness to Convert to LPGrdquo New Delhi Petroleum Planning amp Analysis Cell Ministry of Petroleum and Natural Gas Government of India httpswwwppacgovinWriteReadDataReports201710310449342512219PrimarySurveyReportPPACpdf
PPAC 2019 ldquoOil Industry Information at a Glancerdquo New Delhi Ministry of Petroleum and Natural Gas Government of India httpswwwppacgovinWriteReadDataReports201912060336500305462ReadyReckonerNov2019WebVersionpdf
Rahaman Mehebub and Dipendra Nath Das 2017 ldquoNature of Slum Growth in Indian Citiesrdquo Urban India 37 (II) 100ndash116 httpswwwresearchgatenetpublication334051882_Nature_of_Slum_Growth_in_Indian_Citiesread
Rains Emily Anirudh Krishna and Erik Wibbels 2018 ldquoUrbanisation and Indiarsquos Slum Continuum Evidence on the Range of Policy Needs and Scope of Mobilityrdquo London International Growth Centre httpswwwtheigcorgwp-contentuploads201802Rains-et-al_Working-paper_coverpdf
Ranjan Rahul and Sudershan Singh 2017 ldquoEnergy Deprivation of Indian Households Evidence from NSSO Datardquo New Delhi Munich Personal RePEc Archive httpsmpraubuni-muenchende835661MPRA_paper_83566pdf
Roy Debraj Bharath Palavalli Niveditha Menon Robin King Karin Pfeffer Michael Lees and Peter M A Sloot 2018 ldquoSurvey-based Socio-economic Data from Slums in Bangalore Indiardquo Nature Publishing Group 5 1ndash9 httpsdoiorg101038sdata2017200
Saksena Sumeet P B Singh Raj Kumar Prasad Rakesh Prasad Preeti Malhotra Veena Joshi and R S Patil 2003 ldquoExposure of Infants to Outdoor and Indoor Air Pollution in Low-income Urban Areas A Case Study of Delhirdquo Journal of Exposure Science amp Environmental Epidemiology 13 219ndash30 httpsdoiorg101038sjjea7500273
Lipu Molla Shahadat Hossain and Arif Waliullah Bhuiyan 2014 ldquoElectricity Access in Urban Slum Households of Bangladesh A Case of Dhakardquo Journal of Renewable and Sustainable Energy 6 (053112) 1ndash15 httpsdoiorg10106314896697
29
Singh Rozita Xiao Wang Emmanuel Ackom and Juan Reyes 2015 ldquoEnergy Access Realities in Urban Poor Communities of Developing Countries Assessments and Recommendationsrdquo Global Network on Energy for Sustainable Development (GNESD) httpswwwgooglecomurlsa=tamprct=jampq=ampesrc=sampsource=webampcd=ampved=2ahUKEwj5nbqI wdntAhXUTX0KHZE6DboQFjAAegQIAhACampurl=https3A2F2Forbitdtudk2Ffiles2F10635 24942FEnergy_access_realities_v_final_updatedpdfampusg=AOvVaw0xNBAAo0bjLueY9FmoigKF
Singh Santosh 2014 ldquoThe Kaleidoscope of Cooking Understanding Cooking Behaviour and Stove Preferences in Rural Indiardquo New Delhi Deutsche Gesellschaft fuumlr Internationale Zusammenarbeit (GIZ) GmbH httpswwwgizdeendownloadsgiz2014-en-kaleidoscope-of-cooking-indiapdf
Smith Kirk R and Ajay Pillarisetti 2017 ldquoHousehold Air Pollution from Solid Cookfuels and its Effects on Healthrdquo Disease Control Priorities 7 (3) 133ndash52 httpsdoiorg101596978-1-4648-0522-6_ch7
UN-Habitat 2003 ldquoThe Challenge of Slums ndash Global Report on Human Settlements 2003rdquo Location of publishing London UN-Habitat httpsunhabitatorgthe-challenge-of-slums-global-report-on-human-settlements-2003
Wang Bolin Ruobao Li Zhong Lu and Yan Huang 2020 ldquoDoes Comorbidity Increase the Risk of Patients with COVID-19 Evidence from Meta-analysisrdquo Aging 12 (7) 6049ndash6057 httpsdoiorg1018632AGING103000
WHO 2014 ldquoWHO Guidelines for Indoor Air Quality Household Fuel Combustionrdquo WHO Accessed 25 July 2020 httpwwwwhointairpollutionguidelineshousehold-fuel-combustionen
World Bank 2020 ldquoThe State of Modern Energy Cooking Servicesrdquo Washington DC World Bank httpdocuments1worldbankorgcurateden937141600195758792pdfThe-State-of-Access-to-Modern-Energy-Cooking-Servicespdf
Yenneti Komali Yehua Dennis Wei and Wen Chen 2017 ldquoThe Urbanization of Poverty in India Spatio-temporal Disparities in Consumption Expendituresrdquo Geographical Review 107 (2) 360ndash383 httpsdoiorg101111j1931-0846201612167x
References
Are Indiarsquos Urban Poor Using Clean Cooking Fuels Insights from Slums in Six States
Annexure 1 Asset ownership index We used Filmer and Pritchettrsquos (2001) proposed approach to construct an asset ownership index using principal component analysis (PCA) We chose the indicators based on data from the Cooking Energy Access survey 2020 The variables we considered for the index were based on classifications by Caroline Moser and Andrew Felton (2007) and K Harttgen (2013) We computed the asset index using housing characteristics and consumer durables as follows
Variables not included in the asset index
Four types of variables were eliminated
1 Variables (such as grid electricity) that had high usage of greater than 95 per cent
2 Those (such as ownership of laptops or computers air conditioners etc) that had a low usage of less than 5 per cent
3 Variables (like house ownership) that have economically fluctuating values
4 Those that indicated a low correlation of less than 20 per cent variation between the top category (ie first) of the asset quintile and the bottom-most category (ie fifth) of the asset quintile
For ease of interpretation we rescaled this index such that the final index values range between 0 and 10 For this purpose we used a feature scaling (or minndashmax scaling) formula
Xnorm (or (IVx)) = (X ndash Xmin)(Xmax ndash Xmin)
where IVx is the normalised index value Xmin is the initial minimum value (-354) and Xmax is the initial maximum value (461) of the asset ownership index
30
Annexures
bull Crowding16 inside the house bull Toilet ownership and usage bull Source of water bull Number of pucca rooms
bull Ownership of two-wheeler bull Ownership of washing machine bull Ownership of television bull Ownership of refrigerator bull Ownership of cooker
16 A household with more than three members occupying a single room is considered crowded (World Health Organization 2018)
Housing characteristics
Consumer durables
Annexure 2 Explaining the use of LPG as the exclusive fuel (simple logistic regression model)
31Annexures
Dependent variable exclusive LPG use
Education of the primary cook (categorical base category is education beyond the school level)
Education of the household head (categorical base category is education beyond the school level)
State (categorical base category includes households from Rajasthan)
P gt z 95 confidence interval
Odds ratio (SE)
1299 (0112)
0659 (0202)
1399 (0394)
0970 (0038)
0994 (0011)
1003 (0013)
2042 (0508)
1011 (0046)
0782 (0441)
1198 (0608)
1377 (0664)
1345 (0566)
3141 (1103)
1213 (0500)
0309 (0211)
1165 (0565)
1703 (0680)
0002
0174
0233
0446
0583
0839
0004
0812
0663
0722
0507
0482
0001
0639
0086
0753
0182
1097
0361
0806
0898
0973
0977
1254
0924
0259
0443
0535
0589
1578
0541
0081
0450
0779
1540
1203
2428
1048
1016
1029
3327
1106
2361
3240
3545
3070
6251
2720
1181
3014
3723
Asset index
Primary cook involved in income-generating activity
Female-headed households
Household size
Age of household head
Age of primary cook
Doorstep delivery of LPG cylinders
PMUY customer
Primary cook is not educated
Primary cook has a school education
Household head is not educated
Household head has a school education
Uttar Pradesh
Bihar
Chhattisgarh
Jharkhand
Madhya Pradesh
Number of households (n) = 417
Log likelihood = -228777
Prob gt chi2 = 0000
Pseudo R2 = 0126
The dependent variable is a dummy variable where households using LPG exclusively are assigned a value of 1 and all other households are assigned the value of 0
The caste of the household has not been factored into the regression as a separate variable because of its underlying influence on economic status
Source Authorsrsquo analysis
Are Indiarsquos Urban Poor Using Clean Cooking Fuels Insights from Slums in Six States
Annexure 3 Air quality (PM25 concentration in μgm3) across 15 districts based on CAAQMS data
32
Dis
tric
tsM
ar-1
9A
pr-1
9M
ay-1
9Ju
n-19
Jul-1
9A
ug-1
9Se
p-19
Oct
-19
Nov
-19
Dec
-19
Jan-
20Fe
b-20
Mar
-20
794
5
988
5
866
7
-
645
329
2
453
7
388
1
769
1
886
4
661
5
950
9
834
4
-
823
4
611
7
569
9
535
7
-
270
4
589
4
571
5
293
1
705
4
839
2
614
9
970
1
826
8
-
844
9
622
1
597
1
564
0
-
235
3
414
3
619
1
414
3
653
9
834
7
568
8
104
90
739
8
-
894
9
630
9
342
2
450
4
-
476
465
2
474
6
429
2
592
3
566
1
-
674
6
531
4
501
5
568
7
450
8
-
320
3
-
846
506
3
349
5
332
4
369
1
387
2
-
430
4
393
6
353
7
446
2
406
8
335
2
339
1
-
102
9
497
2
261
8
269
1
431
4
294
1
-
351
6
277
3
-
336
5
315
5
248
3
392
8
149
7
144
9
462
3
270
5
331
3
273
4
276
0
106
6
391
7
326
2
-
368
6
625
3
875
2
101
64
521
2
183
1
380
4
556
2
544
1
558
2
102
24
104
33
156
44
128
73
146
62
137
71
109
14
183
70
201
80
896
7
190
1
457
7
581
2
583
5
815
4
135
00
126
41
239
94
208
15
158
51
221
86
121
35
192
46
218
43
848
0
205
2
448
5
509
4
582
0
704
5
177
01
613
1
244
01
215
80
136
87
230
54
964
2
201
52
122
30
725
5
120
6
435
4
454
7
481
2
111
37
147
45
537
3
175
53
162
86
111
21
170
08
583
8
132
10
866
2
513
1
112
5
511
3
507
5
511
8
879
4
120
22
502
1
135
53
116
39
994
7
120
45
410
5
792
1
674
8
326
3
177
6
385
0
408
5
335
9
497
2
594
2
429
9
673
2
547
5
540
8
559
4
Gay
a
Muz
affa
rpur
Pat
na
Bho
pal
Satn
a
Alw
ar
Ajm
er
Ud
aip
ur
Ag
ra
Bul
and
shah
r
Hap
ur
Gha
ziab
ad
Gre
ater
Noi
da
Mee
rut
Noi
da
Sour
ce C
onti
nuou
s am
bien
t air
qua
lity
mon
itor
ing
stat
ion
(Mar
ch 2
019
ndash M
arch
202
0)
In a rapidly urbanising India it would be imperative for policymakers and practitioners in energy and urban development sector to integrate access to clean cooking energy within the ambit of services for the urban poor
Image CEEW
Are Indiarsquos Urban Poor Using Clean Cooking Fuels Insights from Slums in Six States
COUNCIL ON ENERGY ENVIRONMENT AND WATER (CEEW)
Sanskrit Bhawan A-10 Aruna Asaf Ali Marg Qutab Institutional AreaNew Delhi - 110 067 IndiaT +91 11 4073 3300
infoceewin | ceewin | CEEWIndia
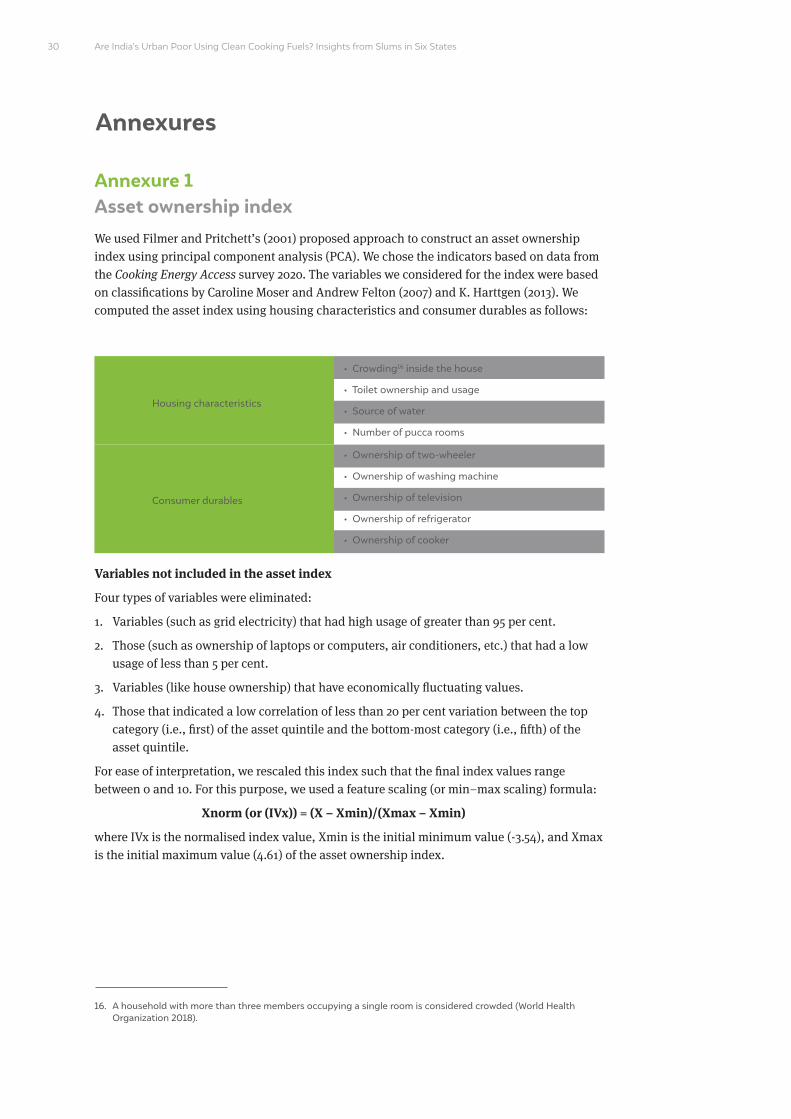
Are Indiarsquos Urban Poor Using Clean Cooking Fuels Insights from Slums in Six States
Annexure 1 Asset ownership index We used Filmer and Pritchettrsquos (2001) proposed approach to construct an asset ownership index using principal component analysis (PCA) We chose the indicators based on data from the Cooking Energy Access survey 2020 The variables we considered for the index were based on classifications by Caroline Moser and Andrew Felton (2007) and K Harttgen (2013) We computed the asset index using housing characteristics and consumer durables as follows
Variables not included in the asset index
Four types of variables were eliminated
1 Variables (such as grid electricity) that had high usage of greater than 95 per cent
2 Those (such as ownership of laptops or computers air conditioners etc) that had a low usage of less than 5 per cent
3 Variables (like house ownership) that have economically fluctuating values
4 Those that indicated a low correlation of less than 20 per cent variation between the top category (ie first) of the asset quintile and the bottom-most category (ie fifth) of the asset quintile
For ease of interpretation we rescaled this index such that the final index values range between 0 and 10 For this purpose we used a feature scaling (or minndashmax scaling) formula
Xnorm (or (IVx)) = (X ndash Xmin)(Xmax ndash Xmin)
where IVx is the normalised index value Xmin is the initial minimum value (-354) and Xmax is the initial maximum value (461) of the asset ownership index
30
Annexures
bull Crowding16 inside the house bull Toilet ownership and usage bull Source of water bull Number of pucca rooms
bull Ownership of two-wheeler bull Ownership of washing machine bull Ownership of television bull Ownership of refrigerator bull Ownership of cooker
16 A household with more than three members occupying a single room is considered crowded (World Health Organization 2018)
Housing characteristics
Consumer durables
Annexure 2 Explaining the use of LPG as the exclusive fuel (simple logistic regression model)
31Annexures
Dependent variable exclusive LPG use
Education of the primary cook (categorical base category is education beyond the school level)
Education of the household head (categorical base category is education beyond the school level)
State (categorical base category includes households from Rajasthan)
P gt z 95 confidence interval
Odds ratio (SE)
1299 (0112)
0659 (0202)
1399 (0394)
0970 (0038)
0994 (0011)
1003 (0013)
2042 (0508)
1011 (0046)
0782 (0441)
1198 (0608)
1377 (0664)
1345 (0566)
3141 (1103)
1213 (0500)
0309 (0211)
1165 (0565)
1703 (0680)
0002
0174
0233
0446
0583
0839
0004
0812
0663
0722
0507
0482
0001
0639
0086
0753
0182
1097
0361
0806
0898
0973
0977
1254
0924
0259
0443
0535
0589
1578
0541
0081
0450
0779
1540
1203
2428
1048
1016
1029
3327
1106
2361
3240
3545
3070
6251
2720
1181
3014
3723
Asset index
Primary cook involved in income-generating activity
Female-headed households
Household size
Age of household head
Age of primary cook
Doorstep delivery of LPG cylinders
PMUY customer
Primary cook is not educated
Primary cook has a school education
Household head is not educated
Household head has a school education
Uttar Pradesh
Bihar
Chhattisgarh
Jharkhand
Madhya Pradesh
Number of households (n) = 417
Log likelihood = -228777
Prob gt chi2 = 0000
Pseudo R2 = 0126
The dependent variable is a dummy variable where households using LPG exclusively are assigned a value of 1 and all other households are assigned the value of 0
The caste of the household has not been factored into the regression as a separate variable because of its underlying influence on economic status
Source Authorsrsquo analysis
Are Indiarsquos Urban Poor Using Clean Cooking Fuels Insights from Slums in Six States
Annexure 3 Air quality (PM25 concentration in μgm3) across 15 districts based on CAAQMS data
32
Dis
tric
tsM
ar-1
9A
pr-1
9M
ay-1
9Ju
n-19
Jul-1
9A
ug-1
9Se
p-19
Oct
-19
Nov
-19
Dec
-19
Jan-
20Fe
b-20
Mar
-20
794
5
988
5
866
7
-
645
329
2
453
7
388
1
769
1
886
4
661
5
950
9
834
4
-
823
4
611
7
569
9
535
7
-
270
4
589
4
571
5
293
1
705
4
839
2
614
9
970
1
826
8
-
844
9
622
1
597
1
564
0
-
235
3
414
3
619
1
414
3
653
9
834
7
568
8
104
90
739
8
-
894
9
630
9
342
2
450
4
-
476
465
2
474
6
429
2
592
3
566
1
-
674
6
531
4
501
5
568
7
450
8
-
320
3
-
846
506
3
349
5
332
4
369
1
387
2
-
430
4
393
6
353
7
446
2
406
8
335
2
339
1
-
102
9
497
2
261
8
269
1
431
4
294
1
-
351
6
277
3
-
336
5
315
5
248
3
392
8
149
7
144
9
462
3
270
5
331
3
273
4
276
0
106
6
391
7
326
2
-
368
6
625
3
875
2
101
64
521
2
183
1
380
4
556
2
544
1
558
2
102
24
104
33
156
44
128
73
146
62
137
71
109
14
183
70
201
80
896
7
190
1
457
7
581
2
583
5
815
4
135
00
126
41
239
94
208
15
158
51
221
86
121
35
192
46
218
43
848
0
205
2
448
5
509
4
582
0
704
5
177
01
613
1
244
01
215
80
136
87
230
54
964
2
201
52
122
30
725
5
120
6
435
4
454
7
481
2
111
37
147
45
537
3
175
53
162
86
111
21
170
08
583
8
132
10
866
2
513
1
112
5
511
3
507
5
511
8
879
4
120
22
502
1
135
53
116
39
994
7
120
45
410
5
792
1
674
8
326
3
177
6
385
0
408
5
335
9
497
2
594
2
429
9
673
2
547
5
540
8
559
4
Gay
a
Muz
affa
rpur
Pat
na
Bho
pal
Satn
a
Alw
ar
Ajm
er
Ud
aip
ur
Ag
ra
Bul
and
shah
r
Hap
ur
Gha
ziab
ad
Gre
ater
Noi
da
Mee
rut
Noi
da
Sour
ce C
onti
nuou
s am
bien
t air
qua
lity
mon
itor
ing
stat
ion
(Mar
ch 2
019
ndash M
arch
202
0)
In a rapidly urbanising India it would be imperative for policymakers and practitioners in energy and urban development sector to integrate access to clean cooking energy within the ambit of services for the urban poor
Image CEEW
Are Indiarsquos Urban Poor Using Clean Cooking Fuels Insights from Slums in Six States
COUNCIL ON ENERGY ENVIRONMENT AND WATER (CEEW)
Sanskrit Bhawan A-10 Aruna Asaf Ali Marg Qutab Institutional AreaNew Delhi - 110 067 IndiaT +91 11 4073 3300
infoceewin | ceewin | CEEWIndia
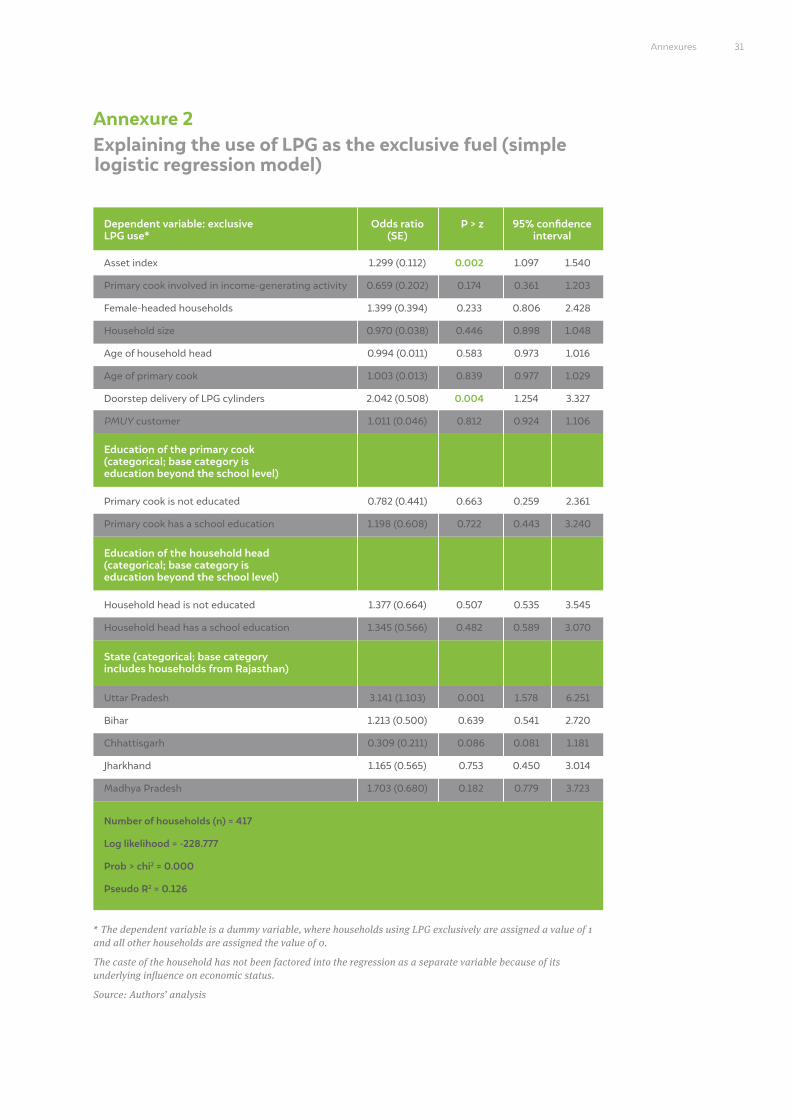
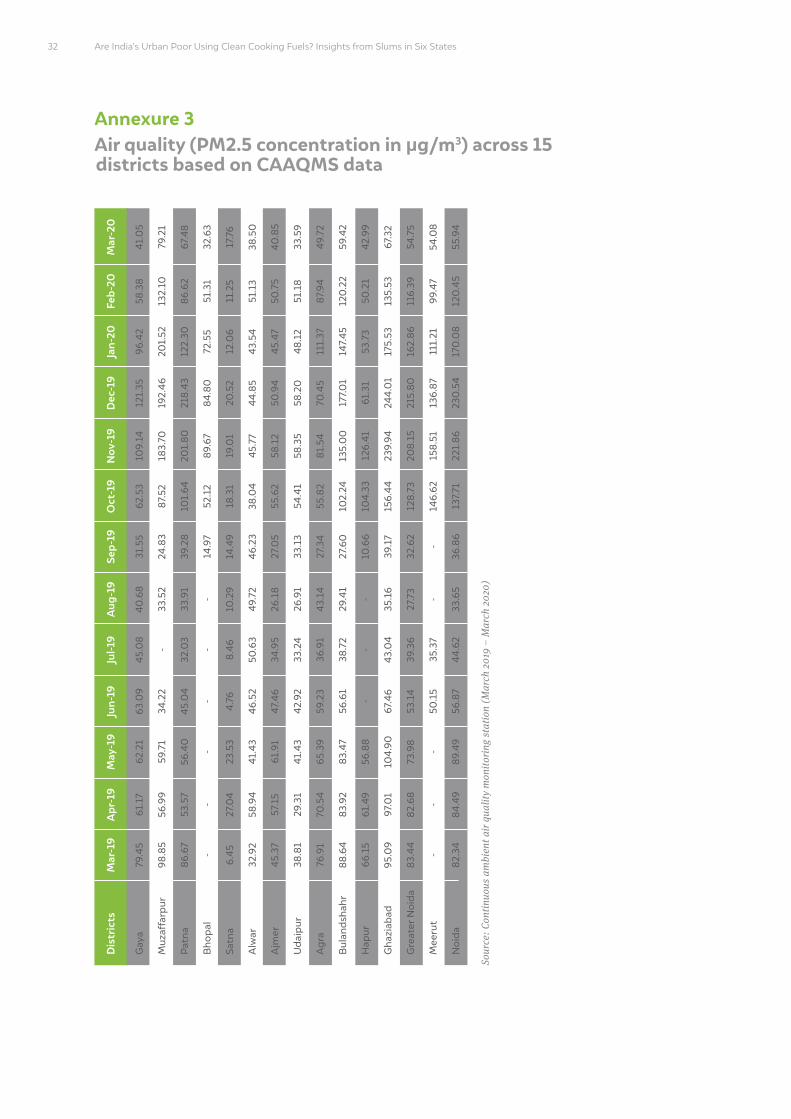
Are Indiarsquos Urban Poor Using Clean Cooking Fuels Insights from Slums in Six States
Annexure 3 Air quality (PM25 concentration in μgm3) across 15 districts based on CAAQMS data
32
Dis
tric
tsM
ar-1
9A
pr-1
9M
ay-1
9Ju
n-19
Jul-1
9A
ug-1
9Se
p-19
Oct
-19
Nov
-19
Dec
-19
Jan-
20Fe
b-20
Mar
-20
794
5
988
5
866
7
-
645
329
2
453
7
388
1
769
1
886
4
661
5
950
9
834
4
-
823
4
611
7
569
9
535
7
-
270
4
589
4
571
5
293
1
705
4
839
2
614
9
970
1
826
8
-
844
9
622
1
597
1
564
0
-
235
3
414
3
619
1
414
3
653
9
834
7
568
8
104
90
739
8
-
894
9
630
9
342
2
450
4
-
476
465
2
474
6
429
2
592
3
566
1
-
674
6
531
4
501
5
568
7
450
8
-
320
3
-
846
506
3
349
5
332
4
369
1
387
2
-
430
4
393
6
353
7
446
2
406
8
335
2
339
1
-
102
9
497
2
261
8
269
1
431
4
294
1
-
351
6
277
3
-
336
5
315
5
248
3
392
8
149
7
144
9
462
3
270
5
331
3
273
4
276
0
106
6
391
7
326
2
-
368
6
625
3
875
2
101
64
521
2
183
1
380
4
556
2
544
1
558
2
102
24
104
33
156
44
128
73
146
62
137
71
109
14
183
70
201
80
896
7
190
1
457
7
581
2
583
5
815
4
135
00
126
41
239
94
208
15
158
51
221
86
121
35
192
46
218
43
848
0
205
2
448
5
509
4
582
0
704
5
177
01
613
1
244
01
215
80
136
87
230
54
964
2
201
52
122
30
725
5
120
6
435
4
454
7
481
2
111
37
147
45
537
3
175
53
162
86
111
21
170
08
583
8
132
10
866
2
513
1
112
5
511
3
507
5
511
8
879
4
120
22
502
1
135
53
116
39
994
7
120
45
410
5
792
1
674
8
326
3
177
6
385
0
408
5
335
9
497
2
594
2
429
9
673
2
547
5
540
8
559
4
Gay
a
Muz
affa
rpur
Pat
na
Bho
pal
Satn
a
Alw
ar
Ajm
er
Ud
aip
ur
Ag
ra
Bul
and
shah
r
Hap
ur
Gha
ziab
ad
Gre
ater
Noi
da
Mee
rut
Noi
da
Sour
ce C
onti
nuou
s am
bien
t air
qua
lity
mon
itor
ing
stat
ion
(Mar
ch 2
019
ndash M
arch
202
0)
In a rapidly urbanising India it would be imperative for policymakers and practitioners in energy and urban development sector to integrate access to clean cooking energy within the ambit of services for the urban poor
Image CEEW
Are Indiarsquos Urban Poor Using Clean Cooking Fuels Insights from Slums in Six States
COUNCIL ON ENERGY ENVIRONMENT AND WATER (CEEW)
Sanskrit Bhawan A-10 Aruna Asaf Ali Marg Qutab Institutional AreaNew Delhi - 110 067 IndiaT +91 11 4073 3300
infoceewin | ceewin | CEEWIndia
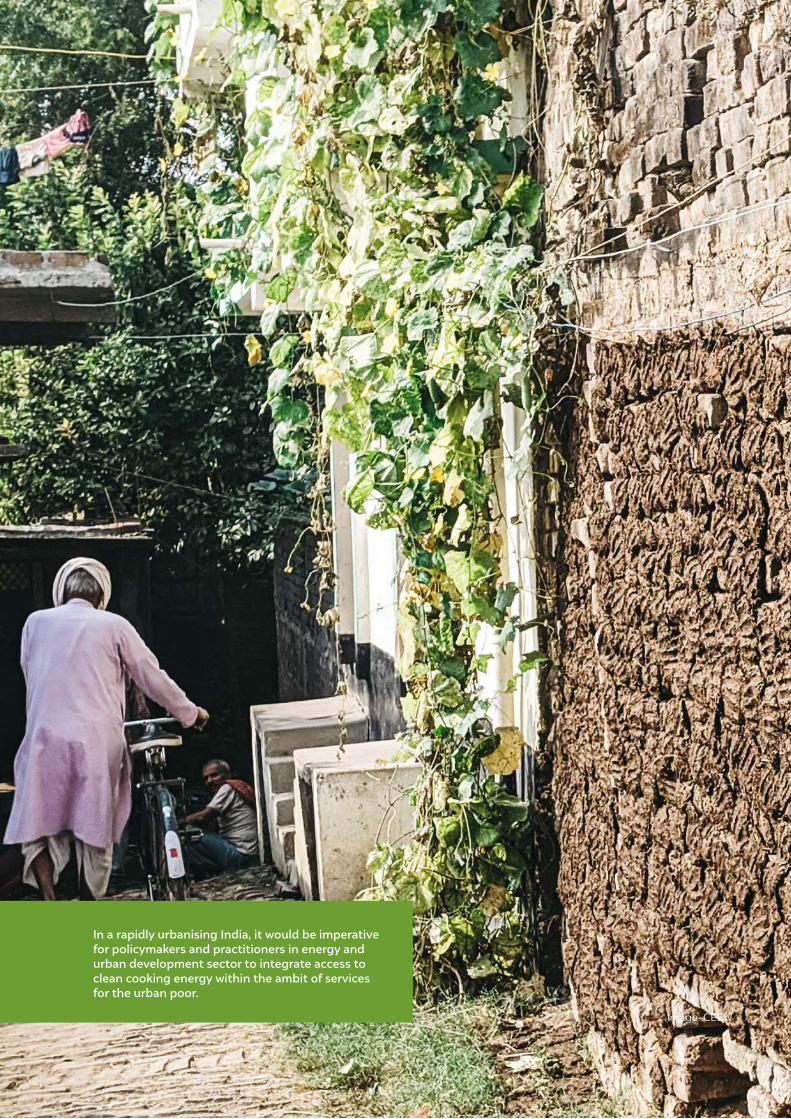
Are Indiarsquos Urban Poor Using Clean Cooking Fuels Insights from Slums in Six States
COUNCIL ON ENERGY ENVIRONMENT AND WATER (CEEW)
Sanskrit Bhawan A-10 Aruna Asaf Ali Marg Qutab Institutional AreaNew Delhi - 110 067 IndiaT +91 11 4073 3300
infoceewin | ceewin | CEEWIndia
Related Documents