Working Paper Series Are fund managers rewarded for taking cyclical risks? Ellen Ryan Disclaimer: This paper should not be reported as representing the views of the European Central Bank (ECB). The views expressed are those of the authors and do not necessarily reflect those of the ECB. No 2652 / March 2022

Welcome message from author
This document is posted to help you gain knowledge. Please leave a comment to let me know what you think about it! Share it to your friends and learn new things together.
Transcript

Working Paper Series
Are fund managers rewarded for
taking cyclical risks?
Ellen Ryan
Disclaimer: This paper should not be reported as representing the views of the European Central Bank
(ECB). The views expressed are those of the authors and do not necessarily reflect those of the ECB.
No 2652 / March 2022
Abstract
The investment fund sector has expanded dramatically since the crisis of 2008-2009. Asthe sector grows, so do the implications of its risk-taking for the wider financial systemand real economy. This paper provides empirical evidence for the existence of wide-spread risk-taking incentives in the investment fund sector, with a particular focuson incentives for synchronised, cyclical risk-taking which could have systemic effects.Incentives arise from the positive response of investors to returns achieved throughcyclical risk-taking and non-linearities in the relationship between fund returns andfund flows, which may keep managers from fully internalising the effects of adverseoutcomes on their portfolios. The fact that market discipline may not be sufficient toensure prudential behaviour among managers, combined with the externalities of thisrisk-taking for the wider system, creates a clear case for macroprudential regulatoryintervention.
JEL classification: G23; G11; G28;Key words: Financial stability; investment funds; incentive; risk-taking; macropru-dential policy
ECB Working Paper Series No 2652 / March 2022 1
Non-technical summary
The euro area investment fund sector has tripled in size since the crisis of 2008-2009. As thesector grows, so do the implications of its risk-taking for the wider financial system and realeconomy. In particular, high risk appetite by funds during periods of market exuberancecan (excessively) push down risk premia in markets. This trend can then reverse sharplywhen a crisis hits and as the fund sector is faced by rising investor redemptions. The fundsector’s procyclicality can be amplified further where pre-crisis risk-taking has left fundswith insufficient liquidity to meet redemptions. These dynamics were recently observedduring the crisis period which followed the outbreak of the coronavirus pandemic in March2020.
A lot of work has been done to understand and monitor these transmission mechanisms.However, it is also important to understand fund manager’s incentives to take these typesof risks in the first place, as this will ultimately drive the propensity of the sector to createsystemic risk. Where fund managers face incentives for excess risk-taking, regulatoryintervention may be necessary to mitigate either the incentives or managers’ capacity torespond to them. This paper uses a large data set of euro area funds’ returns and inflows toassess whether the flow-performance relationship of euro area funds exhibits characteristicswhich could incentivise the type of coordinated, cyclical risk-taking which creates systemicrisk.
Under the standard business model of the asset management industry, a fund managermaximises their income by maximising the size of their fund. This is because managersmake money from investment fees as opposed to investment returns and fees are typically afunction of assets under management. However, investors have been shown to invest morein funds that are performing well and so the relationship between investment performanceand inflows (the flow-performance relationship) can be seen as an implicit incentive contractfor the manager.
When the flow-performance relationship exhibits particular characteristics it can give riseto adverse incentives. The literature has shown that when investors have a stronger re-sponse to good performance than bad performance, fund managers may not fully takeinto account the downside risks to their investments, as the flow response to this outcomeis weaker. In this sense the flow-performance relationship can reward truly “excess” risk-taking, where an investment’s return does not necessarily have to compensate for associatedrisk.
First, we confirm the presence of asymmetries in the flow-performance relationship for eq-uity, government bond, corporate bond and high yield funds in the euro area. This suggeststhat the flow-performance relationship typically rewards risk-taking across all asset classes.Second, we examine how these asymmetries interact with the wider market environment.We show that for equity funds the asymmetry of the flow-performance relationship isstronger in times when market prices are rising and when equity funds are receiving netinflows on aggregate. Thus this type of incentive could give rise to a coordinated increasein equity fund risk appetite during periods of market exuberance.
However, “cyclical risk-taking” can also occur when managers make investments which arethemselves cyclical in nature, purchasing assets which will have very high returns whenmarket prices are rising but very low returns when they fall. Our third contribution
ECB Working Paper Series No 2652 / March 2022 2
is to show that funds across all examined asset classes can in fact attract inflows bymaking these types of investments. The possibility that investors allocate money to fundswhich are performing well due to their market directionality has been largely ignoredby the existing literature and could be interpreted in a number of ways. Investors maybelieve that fund managers can time the market and intentionally invest in funds wheremanagers are benefiting from their market directionality. Alternatively, investors maynot be sophisticated enough to distinguish between good performance achieved throughinvestments which are and are not correlated with the wider market.
Finally, we identify asymmetries in the strength of the flow performance relationship acrossmarket environments. Specifically, we show that performance relative to peers plays agreater role in determining which funds receive inflows during periods of market exuberancethan it does outflows during a crisis. This holds for performance in general but also forperformance derived from correlation with the wider market. This type of behaviour amonginvestors can be intuitively interpreted as follows: During good times investors choose high-performing funds because they believe the manager has “hot hands” or is highly skilled.During a crisis outflows are in large part driven by the wider shock, with performancerelative to peers playing a lesser role. Such an asymmetry may further incentivise cyclicalrisk-taking, which will be rewarded with large inflows as investments perform well in goodtimes but will not result in equivalent “punishment” when the investment underperformsduring a crisis. As such, managers do not need to fully internalise the effect of a crisison their portfolio and in flow terms will always benefit from leaning into (and possiblyamplifying) an asset price boom.
This suggests that market discipline, as imposed by funds’ investors, may not be sufficientto ensure prudential behaviour among fund managers. When we also take into accountthe externalities of this risk-taking for the wider system, our findings create a clear casefor regulatory intervention. de Guindos (2020) suggests a number of approaches, includingmacroprudential leverage limits and ex-ante liquidity management tools.
ECB Working Paper Series No 2652 / March 2022 3
The expansion in the variety of intermediaries and financial transactions has major benefits[...] But along with the opportunities to do good, they have created opportunities to makethings worse. The balance between the two is determined by the incentives of players.
The Greenspan Era: Lessons for the Future, Speech by Raghuram G. Rajan, August 27,2005, Jackson Hole, Wyoming 1
1 Introduction
The expansion of the non-bank sector has been one of the most notable developments inthe global financial system since the crisis of 2008-2009. In the euro area the investmentfund sector has tripled in size since 2008.
On one hand this comes with benefits, such as reducing the vulnerability of economiesto banking sector shocks. However, policymakers have voiced concerns that a growinginvestment fund sector has an increasing capacity to create systemic risk. High risk appetiteacross the fund sector during periods of market exuberance can compress risk premia and(excessively) ease financing conditions in the real economy. During a crisis, funds’ demandfor risky assets can drop suddenly, as they raise cash to meet rising redemption demand,thus pushing up risk premia and tightening financing conditions. This procyclicality maybe amplified where excess risk-taking during “good times” increases the sector’s crisis lossesor has left funds’ liquidity buffers so low they cannot meet redemptions without engagingin firesales. These dynamics were recently observed in March 2020, following the outbreakof the coronavirus crisis in Europe (de Guindos (2020) and ECB (2020)).
These painful consequences for investors and for fund managers beg the question: Whywould funds take excess risk in the first place? This paper examines ways the flow-performance relationship can incentivise excess risk-taking by fund managers, with a par-ticular focus on coordinated, cyclical risk-taking which could have systemic implications.We use a large fund-level data set for the euro area to show that the flow-performancerelationship for euro area funds does in fact exhibit characteristics associated with cycli-cal risk-taking incentives. Identifying these adverse incentives not only provides insightinto the behaviour of the investment fund sector but also provides further impetus to theexpansion of macroprudential policies to this part of the financial system.
In his seminal discussion on the role of incentives in driving risk-taking in modern financialsystems, Rajan (2005) argues that competition for investor inflows may push fund managersto take on excessive risk. Competitive behaviour may be particularly problematic where therelationship between fund returns and investor inflows (henceforth the flow-performancerelationship) rewards risk-taking. When investors respond to good fund performance withinflows to a greater extent than they respond to poor performance with outflows, managersdo not need to fully internalise the downside risks to an investment. Rajan cites Chevalierand Ellison (1997), who show that the flow-performance relationship for US equity fundsdoes exhibit this type of asymmetry and then provide evidence that managers do respondto the incentives this creates.
Our paper adds to the literature on incentives and the flow-performance relationship in a1Available here.
ECB Working Paper Series No 2652 / March 2022 4
number of ways. Non-linearities in the flow-performance relationship of US equity fundshave been extensively examined and a number of papers have carried out analysis for USbond funds. We provide a comprehensive examination for the euro area, covering equity,government bond, corporate bond and high yield funds. By using the same methods acrossall fund types, we also allow for clean comparison of findings across these four core partsof the fund sector. Through this analysis we confirm the presence of asymmetries in theflow-performance relationship for all categories. This suggests that the flow-performancerelationship typically rewards risk-taking across all asset classes in the euro area.
Second, we examine how these asymmetries interact with the wider market environmentfor each fund type, a question largely ignored due to the microeconomic focus of muchof the existing literature. We show that for equity funds the asymmetry of the flow-performance relationship is stronger in times when market prices are rising and whenequity funds are receiving net inflows on aggregate. This suggests that general risk-takingincentives for equity fund managers, arising from larger payoffs to good performance thanbad performance, may behave procyclically.
However, “cyclical risk-taking” can also occur when managers make investments which arethemselves cyclical in nature, purchasing assets which will have very high returns whenmarket prices are rising but very low returns when they fall. Our third contribution is toshow that funds across all examined asset classes can in fact attract inflows by makingthese types of investments. To date, the literature has largely focused on flow response tounsystematic performance, i.e. returns not generated through correlation with the widermarket. We decompose fund returns into their systematic (market beta) and unsystematic(alpha) components and show, to our knowledge for the first time, that managers acrossall asset classes can attract inflows when they generate returns through market-directionalinvestment strategies.
Finally, we identify asymmetries in the strength of the flow performance relationship acrossmarket environments. Specifically, we show that performance relative to peers plays agreater role in determining which funds receive inflows during periods of market exuber-ance than it does outflows during a crisis. This non-linearity is found for performance ingeneral but also for performance derived from correlation with the wider market. Such anasymmetry may further incentivise cyclical risk-taking, which will be rewarded with largeinflows as investments perform well in good times but will not result in equivalent “pun-ishment” when the investment underperforms during a crisis. As such, managers do notneed to fully internalise the effect of a crisis on their portfolio and in flow terms will alwaysbenefit from leaning into (and possibly amplifying) an asset price boom. In this way theactions of fund managers will also amplify the already procyclical tendencies of fund flows.This type of behaviour may be particularly problematic during periods of accommodativemonetary policy, where an extended period of rising asset prices results in a build-up ofrisk among funds.
This type of behaviour among fund investors can be intuitively interpreted as follows: Dur-ing good times investors choose high-performing funds because they believe the managerhas “hot hands” or is highly skilled. During a crisis outflows are instead driven by the widershock, as opposed to whether or not a fund is underperforming its peers. This type of be-haviour among fund investors would be in line with arguments already made about bankinvestors. Rajan (1994) constructs a model where banks can try boost their reputationby gambling for higher returns in good times. When a crisis occurs and banks post large
ECB Working Paper Series No 2652 / March 2022 5

losses, investors attribute the losses to the crisis itself, as opposed to an individual banker’sability. Rajan shows that this creates the incentive for coordinated, cyclical risk-takingamong banks.
The fact that market discipline may not be sufficient to ensure prudential behaviour amongmanagers, combined with the externalities of this risk-taking for the wider system, createsa clear case for regulatory intervention. Moreover, Rajan (1994) shows that where risk-taking arises from competition with peers, policies must be applied to the whole sector.In other words - a macroprudential response is necessary. de Guindos (2020) suggestsa number of approaches including macroprudential leverage limits and ex-ante liquiditymanagement tools.
The rest of this paper is structured as follows: Section 2 lays out theoretical links be-tween the flow-performance relationship and risk-taking incentives, with reference to theliterature. Section 3 provides an overview of the data set used, the approach taken to clas-sifying funds and introduces the baseline econometric specification. Section 4 augmentsthis baseline specification to address our first two questions about the flow-performancerelationship: Do investors respond more to good performance than bad performance anddoes this asymmetry change with market conditions? Section 5 then examines incentivesfor managers to take cyclical bets by asking if they can attract flows through cyclical risk-taking and if the flow performance relationship varies across crisis and non-crisis periods.Section 6 discusses policy implications. Section 7 concludes.
2 The Flow Performance Relationship and Risk-Taking In-
centives
Under the standard business model of the asset management industry, a fund managermaximises their income by maximising the size of their fund. This is because managersmake money from investment fees - as opposed to investment returns - and fees are typicallya function of assets under management (AuM). However, investors have been shown toinvest more in funds that are performing well and so the relationship between flows intoa fund and the fund’s performance (henceforth the flow-performance relationship) can beseen as an implicit incentive contract for the manager.
This has given rise to a literature examining the flow-performance relationship’s capacityto create adverse incentives when it displays specific characteristics, in particular when itis non-linear. Figure 1 sketches a simple version of this argument, whereby a fund managerconsiders making an investment which will result in a loss or gain of equal size, with equallikelihood. The expected payoff for the fund’s investors is zero but the expected payofffor the manager depends on the shape of the flow-performance relationship. If investorsrespond more strongly to good performance than bad performance, the flow performancerelationship becomes convex. In this case the expected flow payoff to the investment ispositive, as the inflow associated with a “win” is larger than the outflow associated with a“loss”. This could induce the manager to make investments with negative expected returns,as they are not fully exposed to the downside of their investment decisions. Thus a convexflow-performance relationship can create an incentive for truly “excessive risk-taking”, asreturns on an investment no longer need to compensate for downside risks. For the rest
ECB Working Paper Series No 2652 / March 2022 6

Figure 1: Payoffs of an investment to managers and investors with a non-linear flow-performance relationship
of this paper, “excess risk” will refer to investments made by fund managers without fullinternalisation of downside risk to their investors.
Chevalier and Ellison (1997), the seminal paper in this literature, show that the flow-performance relationship for US equity funds is in fact convex and provide evidence thatmanagers respond to the incentives this creates. The wider literature on this topic examineshow various fund or investor features affect these incentives. This includes examining therole of fund age (Chevalier and Ellison (1997)), fund families (Jank and Wedow (2013)),geographic variation in investor base and asset composition (Ferreira et al. (2012)), thenumber of fund managers and their exposure to termination risk (Qiu (2003)). 2
However, these papers take a largely microeconomic perspective, ultimately examiningagency conflict and incomplete contracts in the mutual fund industry. From a macroe-conomic and financial stability perspective, a crucial question is whether risk-taking in-centives have a cyclical component. Risk-taking by funds can create systemic risk whenall funds raise their risk appetite at the same time, particularly where the fund sector islarge enough for the collective behaviour of funds to affect wider risk premia. Moreover,excessive risk-taking during during a market upswing may increase funds’ vulnerabilityto a market reversal and increase the sector’s role as an amplifier of market shocks. Weexamine links between the wider market environment and asymmetries in the flow perfor-mance relationship. This will tell us whether general risk-taking incentives, arising fromlarger payoffs to good performance than bad performance, become more pronounced dur-ing periods of wider market exuberance, potentially raising fund managers’ risk appetitein a coordinated, procyclical manner.
2These papers represent only a sample of a rich wider literature. Also of particular note are Brown etal. (1996) who establish the tournaments method for examining manager response to incentives and Sirriand Tufano (1998) another key paper in the identification of non-linear flow performance relationships forUS equity funds.
ECB Working Paper Series No 2652 / March 2022 7
Once we start thinking about cyclical aspects of these incentives, another form of adverseincentive becomes clear. Fund managers know that the future payoff to assets they purchaseis in part state dependent. In particular, assets with cyclical returns will perform well whenthe market as a whole is rising but very badly during times of crisis. So what if investorscare more about a fund’s performance (relative to their peers) in good times than during acrisis? In this case fund managers may be incentivised to buy assets with cyclical payoffs.They will benefit from strong inflows during good times as the investment performs wellbut will not experience equivalent “punishment” during a crisis when it performs badly. Ofcourse such incentives would have clear adverse implications for financial stability, pushingfund managers to always lean into an asset price boom by taking correlated, cyclical bets.
This type of behaviour among fund investors would be in line with arguments alreadymade about bank investors. Rajan (1994) constructs a model whereby bankers care abouttheir long-term portfolio returns but also want to signal their skill to investors throughshort-term returns. When reputation concerns are strong enough banks may engage inshort term gambling, making risky investments to try boost today’s return despite theirnegative long-term expected payoffs. Rajan’s bank investors judge the skill of a bank man-ager by their current returns relative to other banks and this creates cyclical coordinationfailures. In periods when the banking system as a whole is posting high returns, low re-turns are attributed to low ability. This creates an incentive for gambling to maintainthe appearance of high skill. During a crisis all banks post low returns and so investorsattribute poor performance to the wider market shock, as opposed to the skill of an in-dividual manager. Thus banks are incentivised to all increase risk-taking simultaneouslyand to take correlated, cyclical risks which, if they do not pay off, no individual bankmanager can be blamed for. This framework has since been used to motivate and assessthe implications of macroprudential policy in the banking system by Haldane (2010) andAikman et al. (2015).
It would not be surprising if investors buying investment fund shares behaved similarlyto those buying bank shares and fund managers have clear incentives to care about theirreputation due to their need to attract investor inflows. We can also measure the effectof portfolio performance on a fund manager’s reputation by looking at how performanceinfluences investors’ decision to give a manager more money - i.e. via the flow-performancerelationship. Thus, we can empirically examine whether the incentives which drive cyclicalrisk-taking in Rajan’s model also exist in the fund sector by doing two things. First, weneed to show that funds are able to attract inflows with returns which are correlated withthe wider market, i.e. by taking cyclical bets. Next we need to show that performancerelative to peers plays a stronger role in driving fund-level inflows during good times thanduring crises.
Previous work examining the flow-performance relationship largely ignores the potentialfor performance derived from procyclical positioning to attract returns. Indeed, the cycli-cal or market-correlated component of fund returns is often stripped out before the flowperformance relationship is examined. This is due to an implicit or explicit assumptionthat fund investors are sophisticated enough to look past cyclical returns and only respondto unsystematic fund returns (also referred to as alpha). In this regard, our paper providesnovel insights into the capacity of fund managers across a range of asset classes to attractinflows through procyclical positioning. We will discuss this issue in further depth in Sec-tion 5.1. Our analysis of non-linearities in this form of the flow-performance relationshipis also a novel contribution.
ECB Working Paper Series No 2652 / March 2022 8

Our work can be seen as complementary to that of Goldstein et al. (2017) and Chen et al.(2010) who also examine how incentives arising from the flow-performance relationship canhave financial stability implications. While we examine how the flow-performance relation-ship may incentivise managers, Goldstein et al. (2017) and Chen et al. (2010) examine howthe flow-performance relationship creates incentives for fund investors. Specifically, theyexamine how concave flow-performance relationships may create incentives for investors torun on funds, thus creating financial fragility where a fund’s investments are illiquid andmanagers are forced to engage in firesales to meet redemptions. Our findings suggest thatthe flow performance relationship may incentivise managers to take too much risk duringperiods of market exuberance. Where managers take risk by buying increasingly illiquidassets, this will increase their vulnerability to fund runs during crises, thus amplifying themechanism studied by Goldstein et al. (2017) and Chen et al. (2010).
Of course there is also a wide literature examining the flow-performance relationshipthrough a lens not related to manager incentives. Work of particular relevance to oursincludes Feroli et al. (2014), which examines the flow-performance relationship at the ag-gregate asset class level for US equity and fixed income funds. The authors find evidenceof return-chasing behaviour and evidence that aggregate flows into an asset class can af-fect market prices, creating a self-fulfilling cycle which can reverse following changes ininvestor sentiment. At the fund-level, Gruber (2011), Fulkerson et al. (2013) and Chenand Qi (2017) examine the flow-performance relationship of US equity funds, bond fundsand corporate bond funds respectively, including potential non-linearities, with the goal ofassessing whether flows are “smart”.
3 Data Set and Baseline Specification
3.1 Data set and fund categories
We use monthly fund-level data on returns and flows from the commercial provider Lipper,starting in September 2004 and ending in July 2019. To focus on funds whose actions aremost relevant for euro area financial stability (i.e. those buying European assets), thosewith pan-European and global investment mandates are selected. All funds are open ended,actively managed and domiciled within the euro area.
As our paper centres around competition between fund managers for investor inflows, wetake care to establish groups of similar funds which could be considered as competing withone another. Typically investors first decide on the type of asset they would like exposureto and then choose among funds providing exposure to this asset. As such, managers areonly really competing for flows with other managers whose funds have the same investmentuniverse as they do. Identifying funds which are investing in the same assets, will also helpus to identify periods when all funds in a given category are investing in a market withrising or falling prices, thus also simplifying our definitions of procyclical behaviour.
Identifying a fund’s investment universe is more complicated than it may first appear.For example, simply selecting funds identified as “Equity” and “European” by Lipper willprovide a varied group of funds, many of which invest in only specific segments of theequity market such as financial or real estate firms. These funds are unlikely to be in
ECB Working Paper Series No 2652 / March 2022 9
competition with funds buying solely utility equities, for example, and price dynamics forthese sectors will likely be out of sync with each other. Similarly among funds identifiedas European government bond funds by Lipper, many only invest in specific maturitybonds. Lipper identification for corporate bond funds also inconsistently separates thosebuying investment grade and high yield securities. To ensure we are comparing funds withsimilar investment universes, we categorise funds on the basis of the benchmark the fund ismanaged against. By construction this should align with their investment universe.3 Forexample, funds managed against Euro Stoxx can be identified as broad European equityfunds and separated from those which are managed against the sectoral subsets of theindex. Similarly, funds managed against indices of short maturity government bond fundscan also be removed and funds buying high yield securities can be identified by their highyield index. This approach also allows us to easily identify different market environmentsvia price changes to the relevant benchmark.
Alignment between assigned benchmark and investment universe is checked by examiningcorrelation between fund returns and benchmark returns. First, it is found that returns ofmany European funds associated with government bond indices display a low correlationwith the returns of the index. This may be due to the use of government bond indicesas a substitute for a risk-free rate, which is then used as a performance benchmark forfunds with a wider investment universe. Thus funds managed against government bondbenchmarks but not also separately identified by Lipper as government bond funds aredropped.
Second, most euro denominated bond funds identified as “Global” in their investment focusexhibit a low correlation with euro denominated global benchmarks and a much highercorrelation with European benchmarks.4 To allow for mis-identification of benchmarks byLipper, these funds as re-categorised as European. The paper’s overall findings are robustto skipping this cleaning step.
Within each category, flow and return values outside the top and bottom fifth percentilein each period are removed to ensure findings are not driven by outlier or erroneous dataentries (this standard in the literature, see for example Fulkerson et al. (2013), Sujing andJiaping (2014) and Chen and Qi (2017)). Our final sample is made up of almost 8,500unique funds which are categorised by geographic focus (European, Global) and asset class(equity, government bond, corporate bond, high yield bond). The panel is unbalanced andthe total sample size varies across time, in line with trends in the overall investment fundsector. As shown in Figure 2 , the sample grows from approximately 2,000 to 3,000 fundsover the fifteen years examined. As expected, the sample size varies substantially acrosscategories. To ensure that results are not driven by dynamics in the larger categories,regression analysis is carried out at asset-class level throughout the paper.5
This final sample is predominantly made up of UCITS funds (80 per cent), with a smallnumber of AIFMD funds (7 per cent) and a share of the sample identified as neither (13per cent). As a result, dynamics reflect the “vanilla”, retail end of the market as opposed
3Specifically we use the “Technical Benchmark” variable from Lipper as it has superior data qualityto the “Manager Benchmark” and is likely to account for different management companies using similarbenchmarks compiled by different providers.
4A very small minority of European and Global funds are denominated in currencies other than euroor US dollar and these are removed for the sake of simplicity.
5Regressions are pooled across geographic focus as global categories for corporate and high yield bondfunds are quite small once data cleaning is complete.
ECB Working Paper Series No 2652 / March 2022 10
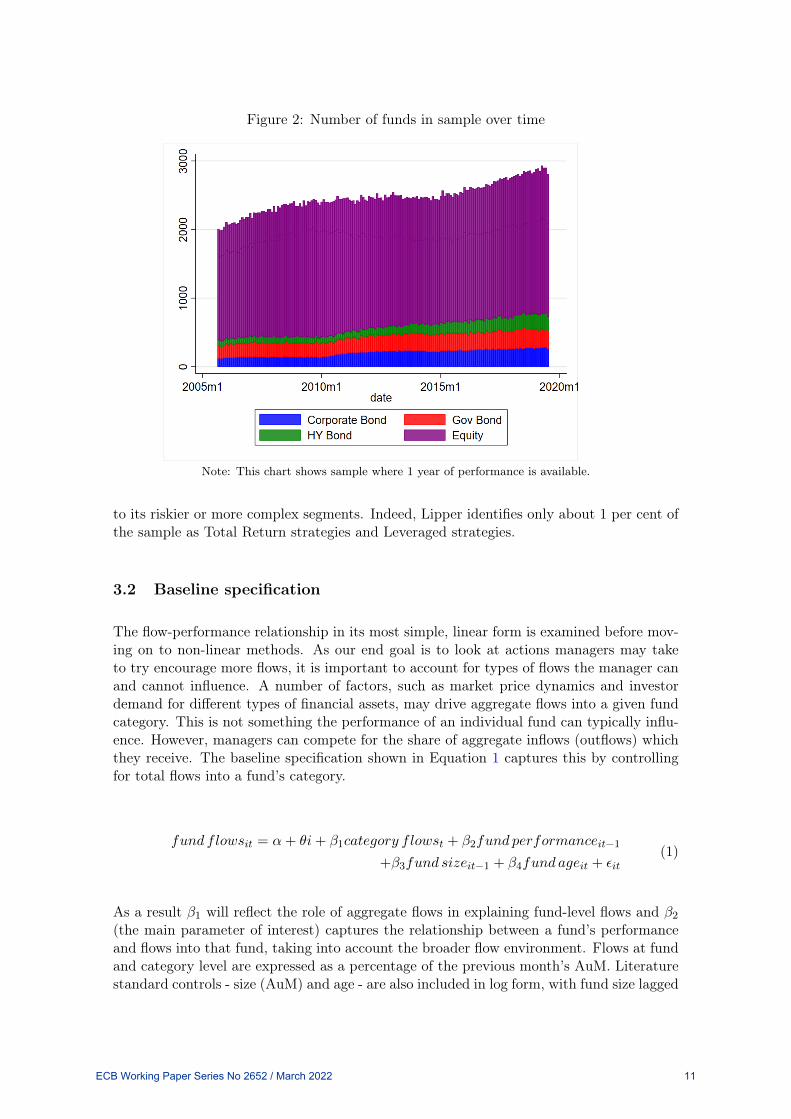
Figure 2: Number of funds in sample over time
Note: This chart shows sample where 1 year of performance is available.
to its riskier or more complex segments. Indeed, Lipper identifies only about 1 per cent ofthe sample as Total Return strategies and Leveraged strategies.
3.2 Baseline specification
The flow-performance relationship in its most simple, linear form is examined before mov-ing on to non-linear methods. As our end goal is to look at actions managers may taketo try encourage more flows, it is important to account for types of flows the manager canand cannot influence. A number of factors, such as market price dynamics and investordemand for different types of financial assets, may drive aggregate flows into a given fundcategory. This is not something the performance of an individual fund can typically influ-ence. However, managers can compete for the share of aggregate inflows (outflows) whichthey receive. The baseline specification shown in Equation 1 captures this by controllingfor total flows into a fund’s category.
fund flowsit = α+ θi+ β1category flowst + β2fund performanceit−1
+β3fund sizeit−1 + β4fund ageit + εit(1)
As a result β1 will reflect the role of aggregate flows in explaining fund-level flows and β2(the main parameter of interest) captures the relationship between a fund’s performanceand flows into that fund, taking into account the broader flow environment. Flows at fundand category level are expressed as a percentage of the previous month’s AuM. Literaturestandard controls - size (AuM) and age - are also included in log form, with fund size lagged
ECB Working Paper Series No 2652 / March 2022 11

by one period to remove contemporaneous effects of flows on size. θi are a series of fund-level fixed effects which will capture time-invariant features of funds not already accountedfor by the categorisation process, such as mandate-imposed risk limits or domicile country.While not strictly time invariant, fund fee structures are also typically stable over time(see Sujing and Jiaping (2014)).
Our baseline specification also addresses the two types of endogeneity that can arise inrelation to the flow-performance relationship (β2). First, large flows into an asset classmay push up prices for those assets and therefore fund performance. This could lead toflows driving performance instead of vice versa (see Feroli et al. (2014)). Controlling foraggregate flows into a category addresses this problem, as flows into an individual fundare unlikely to impact valuations for an entire asset class. Second, flows in and out ofan individual fund may affect its performance. For example, large outflows may requirea fund to quickly sell illiquid assets at a loss, thus reducing returns. To avoid this typeof endogeneity, fund performance is lagged throughout the paper. Lagging performancemeasures also captures the tendency for fund investors to respond to its performance witha lag. Errors are also clustered at the fund-level.
3.3 Performance measures
The existing literature uses a range of performance measures when examining the flow-performance relationship. Many papers use risk-adjusted performance measures and Jensen’salpha is a particularly popular choice (see Berkowitz and Kotowitz (2000), Goldstein etal. (2017) and Sirri and Tufano (1998)). In its simplest form, Jensen’s alpha is the αit
from the CAPM equation below and it is widely used in the mutual fund literature as ameasure of fund manager skill. Specifically, it is the part of a fund’s performance which isnot explained by the fund’s correlation with the wider market and so can be interpreted asthe manager’s capacity to “pick stocks” and generate returns without taking market risk.It can also be referred to as a fund’s “unsystematic” return or simply its alpha.
fund returnit − risk free ratet = αit + βit(market returnt − risk free ratet) (2)
This is clearly a useful measure when analysis is taking a micro-perspective. Howeverfrom a systemic risk perspective, the component of returns generated through procyclicalinvestment strategies (captured by βit(market returnt−risk free ratet)) is important andis not something we want to remove from our performance measure. Thus we begin byusing a fund’s ranking relative to its peers as a baseline performance measure, as this willcapture both systematic and unsystematic returns. We will study these two componentsseparately in Section 5. We construct our relative ranking variable by ranking funds withineach category and period by their rolling 12 month performance and then normalising thevariable to give values between 0 and 100.6 Performance relative to benchmark can also becalculated as the difference between a fund’s 12 month returns and the 12 month returnson the benchmark for their category (e.g. Euro Stoxx 50 for European equities).
6"Category" refers to a funds’ geographic-asset class group, such as European corporate bond. 12 monthrolling performance is preferable as month-on-month performance is noisy and not necessarily observableby investors. 12 month performance is also widely used in the existing literature.
ECB Working Paper Series No 2652 / March 2022 12
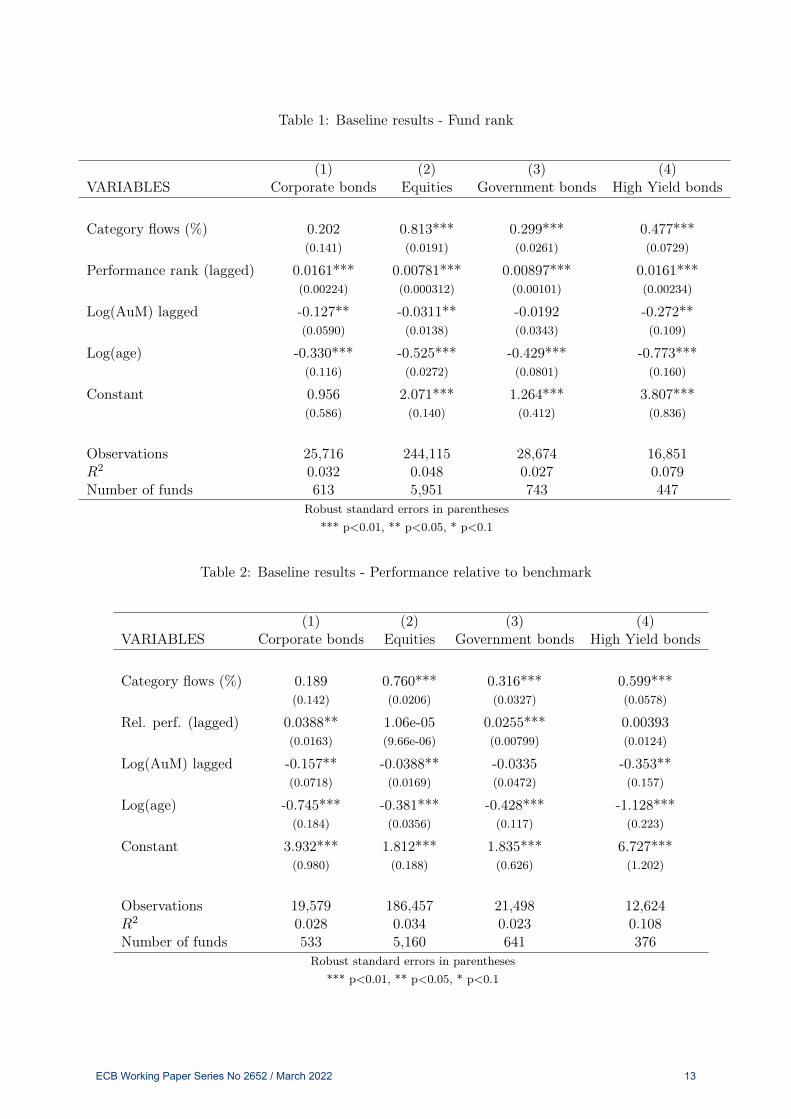
Table 1: Baseline results - Fund rank
(1) (2) (3) (4)VARIABLES Corporate bonds Equities Government bonds High Yield bonds
Category flows (%) 0.202 0.813*** 0.299*** 0.477***(0.141) (0.0191) (0.0261) (0.0729)
Performance rank (lagged) 0.0161*** 0.00781*** 0.00897*** 0.0161***(0.00224) (0.000312) (0.00101) (0.00234)
Log(AuM) lagged -0.127** -0.0311** -0.0192 -0.272**(0.0590) (0.0138) (0.0343) (0.109)
Log(age) -0.330*** -0.525*** -0.429*** -0.773***(0.116) (0.0272) (0.0801) (0.160)
Constant 0.956 2.071*** 1.264*** 3.807***(0.586) (0.140) (0.412) (0.836)
Observations 25,716 244,115 28,674 16,851R2 0.032 0.048 0.027 0.079Number of funds 613 5,951 743 447
Robust standard errors in parentheses*** p<0.01, ** p<0.05, * p<0.1
Table 2: Baseline results - Performance relative to benchmark
(1) (2) (3) (4)VARIABLES Corporate bonds Equities Government bonds High Yield bonds
Category flows (%) 0.189 0.760*** 0.316*** 0.599***(0.142) (0.0206) (0.0327) (0.0578)
Rel. perf. (lagged) 0.0388** 1.06e-05 0.0255*** 0.00393(0.0163) (9.66e-06) (0.00799) (0.0124)
Log(AuM) lagged -0.157** -0.0388** -0.0335 -0.353**(0.0718) (0.0169) (0.0472) (0.157)
Log(age) -0.745*** -0.381*** -0.428*** -1.128***(0.184) (0.0356) (0.117) (0.223)
Constant 3.932*** 1.812*** 1.835*** 6.727***(0.980) (0.188) (0.626) (1.202)
Observations 19,579 186,457 21,498 12,624R2 0.028 0.034 0.023 0.108Number of funds 533 5,160 641 376
Robust standard errors in parentheses*** p<0.01, ** p<0.05, * p<0.1
ECB Working Paper Series No 2652 / March 2022 13

Table 1 shows results for the baseline specification, using fund ranking as a performancemeasure. For all asset classes there is a positive and highly statistically significant relation-ship between a fund’s ranking relative to its peers and flows into that fund. This is in linewith the flow-performance relationship already well-documented in the literature. Table 2shows results using a funds’ performance relative to its market benchmark, an alternativebaseline measure. Coefficients are not statistically significant in all cases, likely due to thegreater noisiness of this measure which reduces its effectiveness. Indeed it should be keptin mind that we are using data from a commercial provider as opposed to supervisory dataand so erroneous data entries may create some unavoidable noise in our data set. As rank-ing relative to peers is also more in line with our theoretical argument of fund competitionwith peers, we keep this as the baseline performance measure.
4 Investor Response to Good and Bad Performance
4.1 The shape of flow-performance relationships in the euro area
To examine non-linearities in the flow-performance relationship, the continuous perfor-mance measure from our baseline specification (Equation 1) is replaced with dummy vari-ables for each performance quintile. The third quintile is used as the base category so thatcoefficients reflect flows to funds in a given performance quintile compared to those in themiddle quintile (in that period and in their category). Figure 3 shows coefficients (dots)and confidence intervals (shaded areas) from this specification at category-level. Resultsare shown in table format in Appendix A.
Asymmetrical, specifically convex, relationships can be seen across all asset classes. Forbond funds, the differences between flows to funds in the 3rd performance quintile andthose in the 4th and 5th quintiles are either insignificant or barely significant. Moreover,the coefficients for the top quintile are approximately double those for the bottom quintile(in absolute terms). This means there is limited flow downside to under-performance buta clear and positive investor response to out-performance. For equity funds, coefficientson lower quintiles are highly statistically significant, in part due to the larger sample size.However, the payoff to being in the top performance quintile is still double the flow impactof being in the bottom quintile.
The particularly large impact of being in the top quintile of performers for equity fundsreflects findings in the literature on US funds. Of course this raises questions about thebehaviour of investors. Chevalier and Ellison (1997) and Sirri and Tufano (1998) suggestthat convexity may be produced by the use of fund returns as marketing tools. In partic-ular, top performing funds may appear on published “top performer” lists or receive mediaattention.
Finding convex flow-performance relationships for corporate bond funds is to some extentat odds with the existing literature. Chen and Qi (2017) find a broadly linear relationship,using piecewise regressions. However, they use multiple factor alphas as performancemeasures. We construct a two factor alpha by regressing fund returns on aggregate equityand bond indices.7 We then repeat the exercises shown in Figure 3 with this alternative
7See Sections 5.1 for a more detailed discussion of constructing these types of performance measures.
ECB Working Paper Series No 2652 / March 2022 14
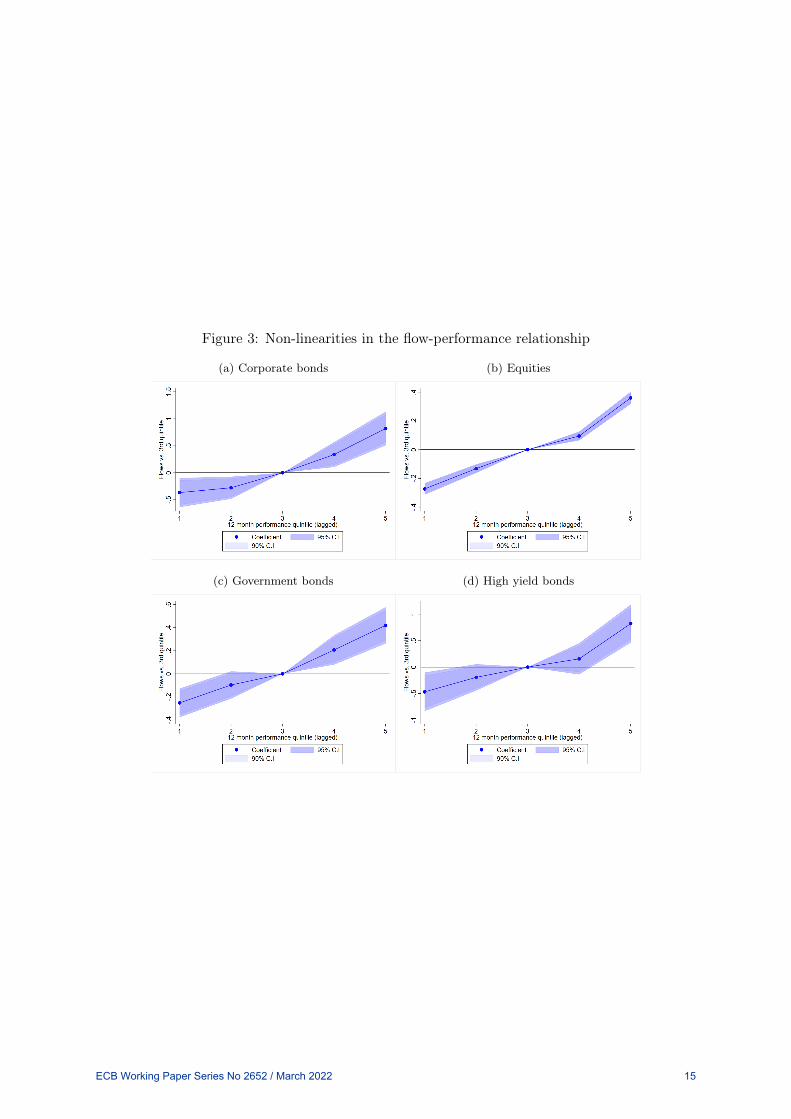
Figure 3: Non-linearities in the flow-performance relationship
(a) Corporate bonds (b) Equities
(c) Government bonds (d) High yield bonds
ECB Working Paper Series No 2652 / March 2022 15
measure and, in line with Chen and Qi (2017), find a much smaller difference in the effectsof being in the bottom performance quintile (-0.35) versus the top quintile (+0.3). However,we maintain that this performance measure is not entirely relevant to our analysis as itstrips out procyclical performance.
Goldstein et al. (2017) primarily use this two factor alpha measure but stress that theirfindings of a concave relationship are robust to the use of a range of performance measures.When we replicate their main empirical approach - which regresses fund flows on a twofactor alpha, a dummy equalling one when this measure is negative and the interactionof both variables - we continue to find weaker flow response to underperformance thanoverperformance among corporate bond funds. We are able to replicate the Goldstein etal. (2017) result among high yield funds but only with an alpha measure and not ourranking measure, which again we maintain is more relevant to our analysis. It is possiblethat differences arise from our use of a purely European sample of funds. Indeed, Ferreiraet al. (2012) find variation in the shape of the flow-performance relationship across differentregions. Goldstein et al. (2017) also find that concavity is less pronounced in funds withan institutional investor base. Thus differences in findings could also be explained by thegreater role of institutional investors among the investor base of our sample.
4.2 The market environment and the shape of the flow-performancerelationship
Next we examine whether the shape of the flow performance relationship is specific to agiven market environment. For example, is the relationship more convex during periodswhere aggregate inflows are positive or market prices are rising? This would suggest thatrisk-taking incentives not only exist across the euro area investment fund sector but alsohave a cyclical element. As a result, changes in the wider macrofinancial environmentcould result in increasing risk-appetite across the investment fund sector.
The role of the market environment in driving the shape of the flow performance relation-ship is examined by interacting flow quintile variables with dummies which equal 1 whenan asset class is receiving positive net inflows (Table 3) and when aggregate prices for anasset class rose the previous month (Table 4). Aggregate market prices are measured usingchanges in the value of the relevant benchmark for a given group of funds and this variableis lagged to reflect the lagged relationship between fund performance and fund flows.
Convexity in the flow performance relationship for equity funds appears to have a substan-tial cyclical component. Specifically, convexity increases in periods with aggregate inflowsand when market prices are rising, as shown by the positive and statistically significant in-teraction terms for higher performance quintiles. This suggests that investors’ asymmetricresponse to good and bad performance may not only incentivise risk-taking among equityfund managers but that these incentives behave procyclically. In “good times”, equity man-agers have more to gain in flow terms from posting high returns compared to the loss theyexperience if bets don’t pay off.
For bond funds results are mixed. For high yield funds convexity weakens in inflow periods,with the flow impact of low returns strengthening. For government bond funds, convexityweakens in periods with aggregate inflows but strengthens in periods when market prices
ECB Working Paper Series No 2652 / March 2022 16
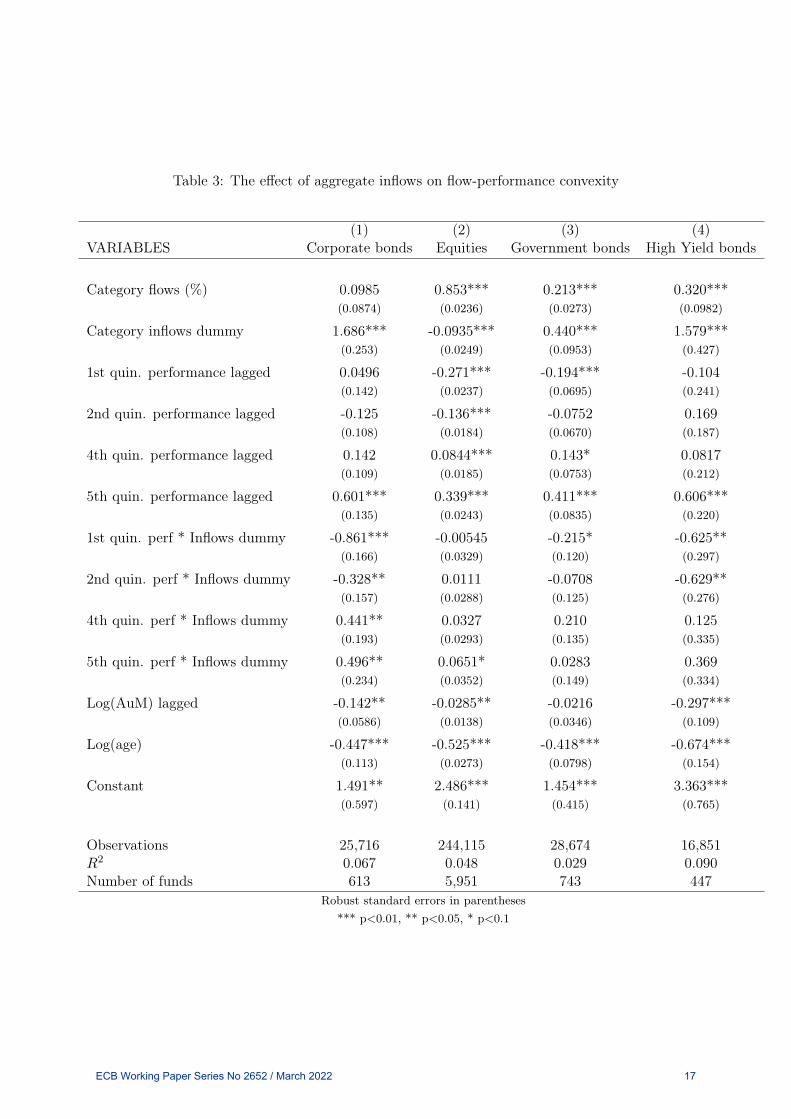
Table 3: The effect of aggregate inflows on flow-performance convexity
(1) (2) (3) (4)VARIABLES Corporate bonds Equities Government bonds High Yield bonds
Category flows (%) 0.0985 0.853*** 0.213*** 0.320***(0.0874) (0.0236) (0.0273) (0.0982)
Category inflows dummy 1.686*** -0.0935*** 0.440*** 1.579***(0.253) (0.0249) (0.0953) (0.427)
1st quin. performance lagged 0.0496 -0.271*** -0.194*** -0.104(0.142) (0.0237) (0.0695) (0.241)
2nd quin. performance lagged -0.125 -0.136*** -0.0752 0.169(0.108) (0.0184) (0.0670) (0.187)
4th quin. performance lagged 0.142 0.0844*** 0.143* 0.0817(0.109) (0.0185) (0.0753) (0.212)
5th quin. performance lagged 0.601*** 0.339*** 0.411*** 0.606***(0.135) (0.0243) (0.0835) (0.220)
1st quin. perf * Inflows dummy -0.861*** -0.00545 -0.215* -0.625**(0.166) (0.0329) (0.120) (0.297)
2nd quin. perf * Inflows dummy -0.328** 0.0111 -0.0708 -0.629**(0.157) (0.0288) (0.125) (0.276)
4th quin. perf * Inflows dummy 0.441** 0.0327 0.210 0.125(0.193) (0.0293) (0.135) (0.335)
5th quin. perf * Inflows dummy 0.496** 0.0651* 0.0283 0.369(0.234) (0.0352) (0.149) (0.334)
Log(AuM) lagged -0.142** -0.0285** -0.0216 -0.297***(0.0586) (0.0138) (0.0346) (0.109)
Log(age) -0.447*** -0.525*** -0.418*** -0.674***(0.113) (0.0273) (0.0798) (0.154)
Constant 1.491** 2.486*** 1.454*** 3.363***(0.597) (0.141) (0.415) (0.765)
Observations 25,716 244,115 28,674 16,851R2 0.067 0.048 0.029 0.090Number of funds 613 5,951 743 447
Robust standard errors in parentheses*** p<0.01, ** p<0.05, * p<0.1
ECB Working Paper Series No 2652 / March 2022 17
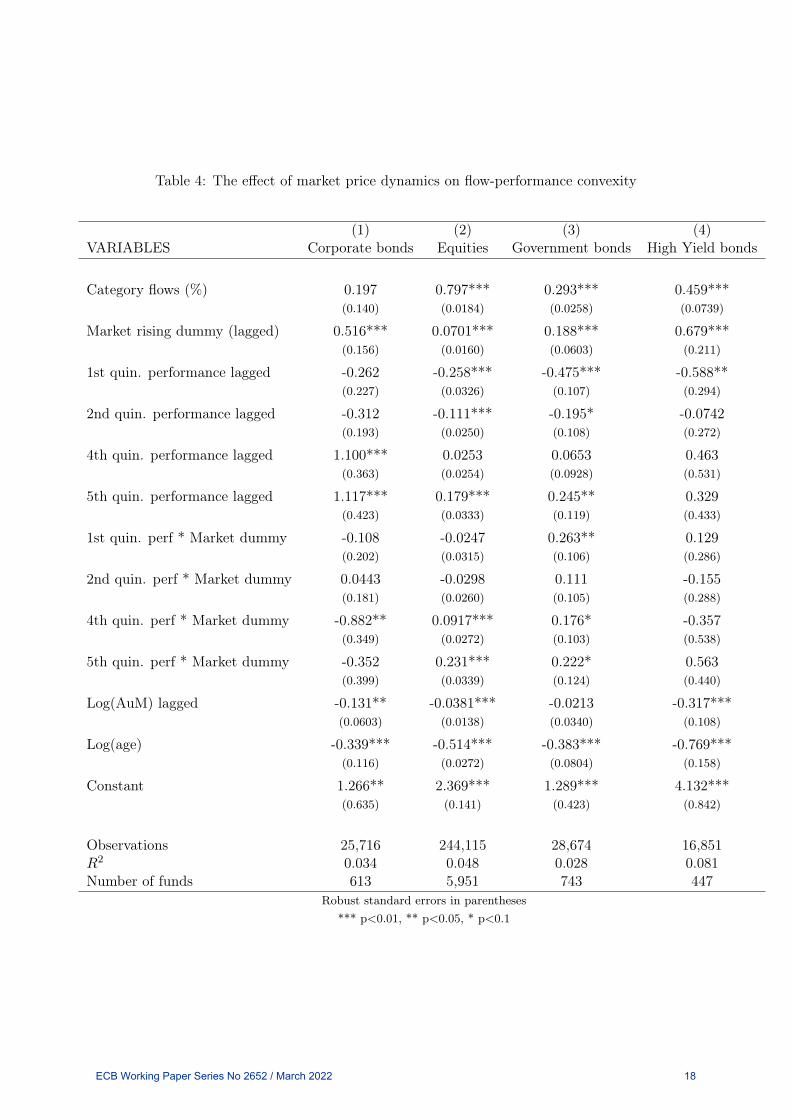
Table 4: The effect of market price dynamics on flow-performance convexity
(1) (2) (3) (4)VARIABLES Corporate bonds Equities Government bonds High Yield bonds
Category flows (%) 0.197 0.797*** 0.293*** 0.459***(0.140) (0.0184) (0.0258) (0.0739)
Market rising dummy (lagged) 0.516*** 0.0701*** 0.188*** 0.679***(0.156) (0.0160) (0.0603) (0.211)
1st quin. performance lagged -0.262 -0.258*** -0.475*** -0.588**(0.227) (0.0326) (0.107) (0.294)
2nd quin. performance lagged -0.312 -0.111*** -0.195* -0.0742(0.193) (0.0250) (0.108) (0.272)
4th quin. performance lagged 1.100*** 0.0253 0.0653 0.463(0.363) (0.0254) (0.0928) (0.531)
5th quin. performance lagged 1.117*** 0.179*** 0.245** 0.329(0.423) (0.0333) (0.119) (0.433)
1st quin. perf * Market dummy -0.108 -0.0247 0.263** 0.129(0.202) (0.0315) (0.106) (0.286)
2nd quin. perf * Market dummy 0.0443 -0.0298 0.111 -0.155(0.181) (0.0260) (0.105) (0.288)
4th quin. perf * Market dummy -0.882** 0.0917*** 0.176* -0.357(0.349) (0.0272) (0.103) (0.538)
5th quin. perf * Market dummy -0.352 0.231*** 0.222* 0.563(0.399) (0.0339) (0.124) (0.440)
Log(AuM) lagged -0.131** -0.0381*** -0.0213 -0.317***(0.0603) (0.0138) (0.0340) (0.108)
Log(age) -0.339*** -0.514*** -0.383*** -0.769***(0.116) (0.0272) (0.0804) (0.158)
Constant 1.266** 2.369*** 1.289*** 4.132***(0.635) (0.141) (0.423) (0.842)
Observations 25,716 244,115 28,674 16,851R2 0.034 0.048 0.028 0.081Number of funds 613 5,951 743 447
Robust standard errors in parentheses*** p<0.01, ** p<0.05, * p<0.1
ECB Working Paper Series No 2652 / March 2022 18

are rising. For corporate bond funds convexity weakens in periods with aggregate inflowsand when the market is rising, indicated by the greater flow impact of low returns in Table3 and lower flow impact of high returns in Table 4. While this doesn’t provide clear a clearmessage about convexity in flow performance relationships being cyclical, it does suggestthat differences in findings with the existing literature could also be explained by the shapeof the flow performance relationship varying across market environments.
5 Investor Response to Cyclical Performance
5.1 Performance measures revisited
Examining how the shape of the flow performance relationship varies across market envi-ronments can tell us whether general risk-taking incentives strengthen as the market rises.However, cyclical risk-taking incentives could also operate by incentivising cyclical invest-ment strategies, i.e. investment in assets that perform well when the market performs wellbut badly during a crisis. A first step towards understanding these types of incentives isto see if managers can attract inflows by taking procyclical bets.
We can decompose a fund’s returns into those which are and are not driven by procyclicalpositioning using the CAPM equation from Section 3.3 (Equation 2). Specifically weestimate αit and βit through 12 month rolling regressions of monthly fund returns in excessof the risk free rate on market returns in excess of the risk free rate. We use the monthlyyield on an index of euro area AAA government 1 year bonds from the ECB SDW as ourrisk free rate, although the ultimate choice of risk-free rate has limited impact on finalresults. For each category of funds, market return is measured as monthly returns on thebenchmark for their category. The distribution of βit for each fund category is shown inFigure 4. Its concentration around 1 for most asset classes reflects the type of funds in oursample, which broadly track specified market indices. However funds can achieve a valuehigher than one by buying more cyclical assets within their investment universe or lowerthan one through cash holdings, hedging or holding less cyclical assets.
The component of a fund’s returns attributable to the market directionality of its portfoliocan then be calculated as shown in Equation 3 and the αit from the CAPM equation willcapture the component of returns not achieved through cyclical positioning (its alpha).
beta performanceit = βit(monthly market returnt − risk free ratet) (3)
We acknowledge that more complex methods are often used to calculate these types ofparameters. Fund returns are often regressed on a range of market factors such as returnson stock markets, government bonds and corporate bond risk premia. Indeed many of thepapers discussed in Section 2 use alphas produced using this multi-factor approach (seeGoldstein et al. (2017), Gruber (2011), Chen and Qi (2017) and Fulkerson et al. (2013) forexample). However, for the sake of our analysis the simpler approach yields more relevantmetrics. For example, regressing fund returns on factors such as corporate bond spreadsand returns on government bonds would let us look at how managers can attract flows bytaking tactical positions which will do well in response to developments in these specific
ECB Working Paper Series No 2652 / March 2022 19
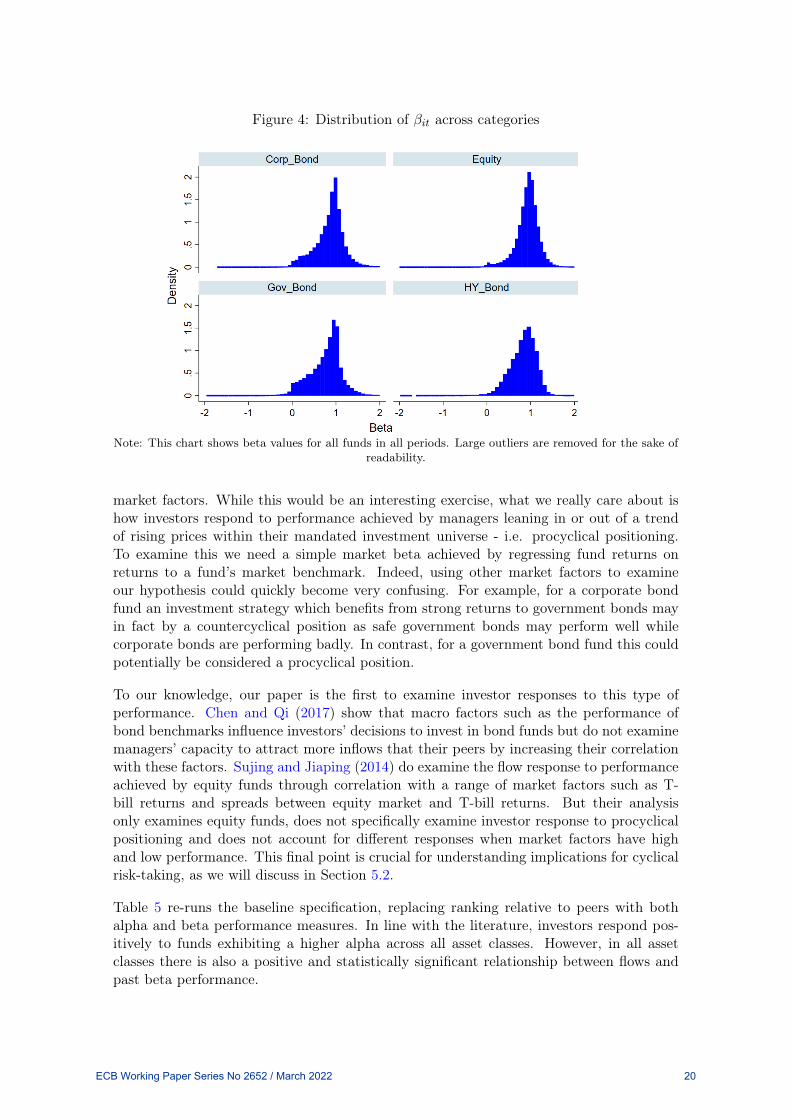
Figure 4: Distribution of βit across categories
Note: This chart shows beta values for all funds in all periods. Large outliers are removed for the sake ofreadability.
market factors. While this would be an interesting exercise, what we really care about ishow investors respond to performance achieved by managers leaning in or out of a trendof rising prices within their mandated investment universe - i.e. procyclical positioning.To examine this we need a simple market beta achieved by regressing fund returns onreturns to a fund’s market benchmark. Indeed, using other market factors to examineour hypothesis could quickly become very confusing. For example, for a corporate bondfund an investment strategy which benefits from strong returns to government bonds mayin fact by a countercyclical position as safe government bonds may perform well whilecorporate bonds are performing badly. In contrast, for a government bond fund this couldpotentially be considered a procyclical position.
To our knowledge, our paper is the first to examine investor responses to this type ofperformance. Chen and Qi (2017) show that macro factors such as the performance ofbond benchmarks influence investors’ decisions to invest in bond funds but do not examinemanagers’ capacity to attract more inflows that their peers by increasing their correlationwith these factors. Sujing and Jiaping (2014) do examine the flow response to performanceachieved by equity funds through correlation with a range of market factors such as T-bill returns and spreads between equity market and T-bill returns. But their analysisonly examines equity funds, does not specifically examine investor response to procyclicalpositioning and does not account for different responses when market factors have highand low performance. This final point is crucial for understanding implications for cyclicalrisk-taking, as we will discuss in Section 5.2.
Table 5 re-runs the baseline specification, replacing ranking relative to peers with bothalpha and beta performance measures. In line with the literature, investors respond pos-itively to funds exhibiting a higher alpha across all asset classes. However, in all assetclasses there is also a positive and statistically significant relationship between flows andpast beta performance.
ECB Working Paper Series No 2652 / March 2022 20
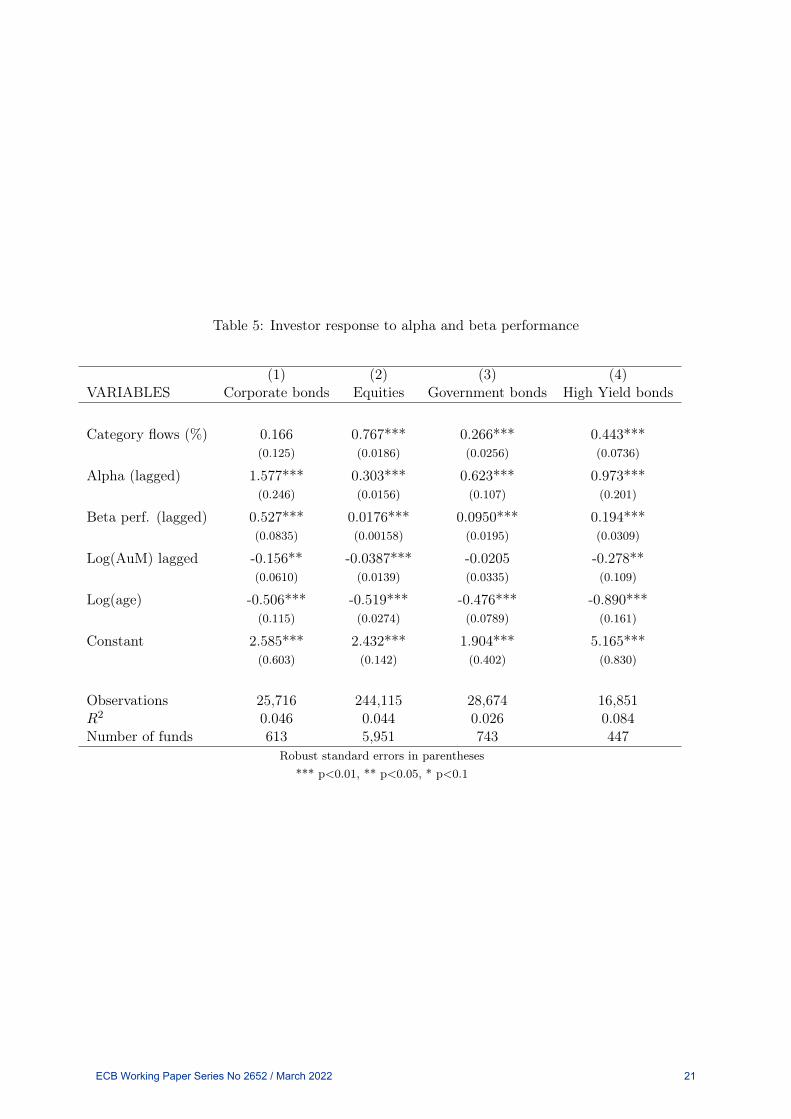
Table 5: Investor response to alpha and beta performance
(1) (2) (3) (4)VARIABLES Corporate bonds Equities Government bonds High Yield bonds
Category flows (%) 0.166 0.767*** 0.266*** 0.443***(0.125) (0.0186) (0.0256) (0.0736)
Alpha (lagged) 1.577*** 0.303*** 0.623*** 0.973***(0.246) (0.0156) (0.107) (0.201)
Beta perf. (lagged) 0.527*** 0.0176*** 0.0950*** 0.194***(0.0835) (0.00158) (0.0195) (0.0309)
Log(AuM) lagged -0.156** -0.0387*** -0.0205 -0.278**(0.0610) (0.0139) (0.0335) (0.109)
Log(age) -0.506*** -0.519*** -0.476*** -0.890***(0.115) (0.0274) (0.0789) (0.161)
Constant 2.585*** 2.432*** 1.904*** 5.165***(0.603) (0.142) (0.402) (0.830)
Observations 25,716 244,115 28,674 16,851R2 0.046 0.044 0.026 0.084Number of funds 613 5,951 743 447
Robust standard errors in parentheses*** p<0.01, ** p<0.05, * p<0.1
ECB Working Paper Series No 2652 / March 2022 21
This is an important finding. The use of alpha performance measures when examining theflow-performance relationship is usually motivated by the (implicit) assumption that in-vestors can identify returns resulting from a fund manager leaning into the a rising market(beta performance) and those resulting from a managers’ capacity to identify good invest-ments without taking this type of risk (alpha). Investors are assumed to only reward thelatter with inflows. However, investors appear to respond to both.8 This aligns with be-haviour in Rajan’s coordination model, whereby high returns boost reputation, regardlessof whether they are from prudent investing or gambling.
Our finding that investors allocate money to funds which are performing well due to theirmarket directionality could be interpreted in a number of ways. Investors may believe thatfund managers can time the market and intentionally invest in funds where managers arebenefiting from their market directionality. Alternatively, investors may not be sophisti-cated enough to distinguish between good performance achieved through alpha or throughbeta performance.
In either case, this type of investor behaviour could push fund managers to take cyclical betsin a bid to attract inflows. Of course, the positive and statistically significant coefficienton beta performance does mean that investors also withdraw money from procyclicallypositioned funds when market performance is negative. However, this may not fully negatethe incentive for managers to use cyclical bets to attract inflows. For example, managersmay expect asset prices to continue rising for a long time (e.g. due to low for long monetarypolicy) and believe that they will be able to reverse their position before the marketturns. Managers may also simply operate with a short time horizon and care more aboutimmediate inflows than the long term well-being of the fund. Short-termism could bereinforced by asset management companies’ approaches to manager compensation.
5.2 The market environment and the strength of the flow-performancerelationship
Particularly adverse incentives may arise when managers can attract inflows through cycli-cal bets and the strength of the flow-performance relationship varies with the marketenvironment. If investors disproportionately invest in the best performing funds duringgood times but do not discriminate across funds in the same way during a crisis, then amanager making large cyclical bets should see much larger inflows than their peers duringgood times - as the investment performs well - but outflows similar to their peers when theinvestment performs badly during a crisis.
We empirically examine this issue by comparing the flow performance relationship in crisisand non-crisis periods. Crisis periods for each fund category are identified using aggregateflow and benchmark performance. Specifically, periods where aggregate flows or benchmarkperformance are below the 10th percentile for the 2004-2019 period are classified as crises.Dummy variables for these periods are then added to the baseline regression and interactedwith fund performance. As before dummies for extreme market drops are added at a
8Testing for the equality of coefficients on alpha and beta performance coefficients rejects equality inall cases. So a one unit increase in alpha performance will have a bigger impact on flows that a one unitincrease in beta performance. However, the finding that investors respond to beta performance at all isstill important.
ECB Working Paper Series No 2652 / March 2022 22
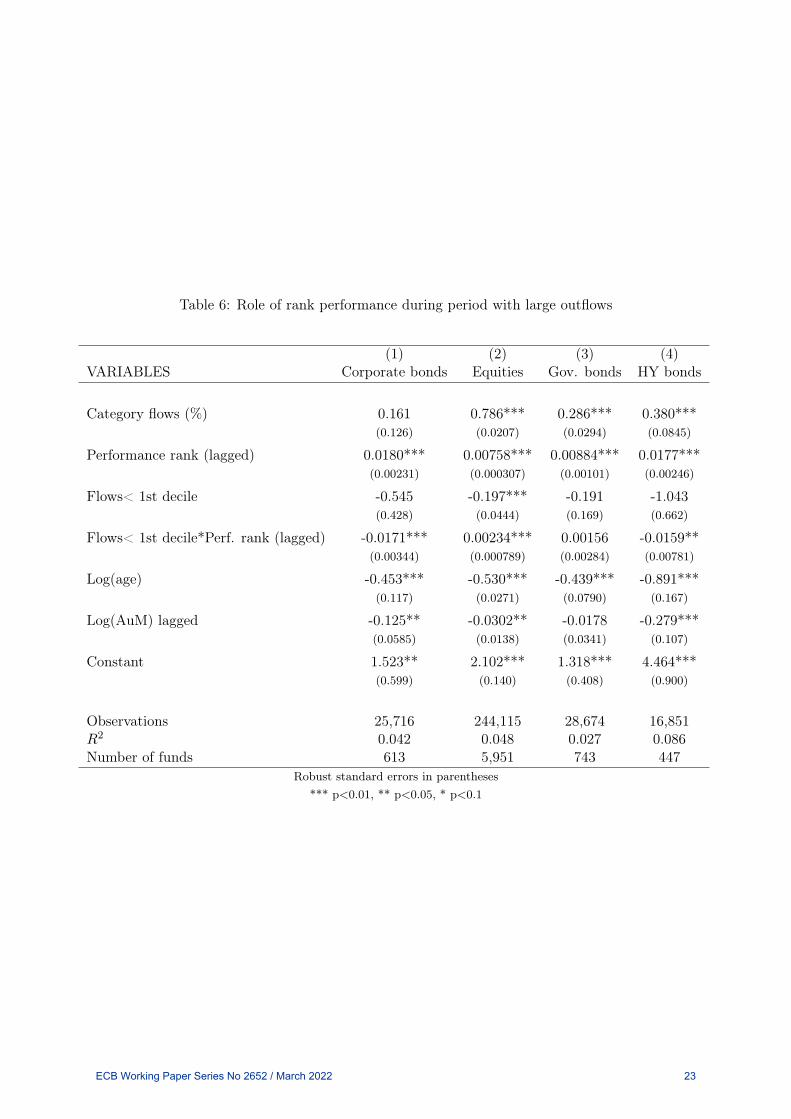
Table 6: Role of rank performance during period with large outflows
(1) (2) (3) (4)VARIABLES Corporate bonds Equities Gov. bonds HY bonds
Category flows (%) 0.161 0.786*** 0.286*** 0.380***(0.126) (0.0207) (0.0294) (0.0845)
Performance rank (lagged) 0.0180*** 0.00758*** 0.00884*** 0.0177***(0.00231) (0.000307) (0.00101) (0.00246)
Flows< 1st decile -0.545 -0.197*** -0.191 -1.043(0.428) (0.0444) (0.169) (0.662)
Flows< 1st decile*Perf. rank (lagged) -0.0171*** 0.00234*** 0.00156 -0.0159**(0.00344) (0.000789) (0.00284) (0.00781)
Log(age) -0.453*** -0.530*** -0.439*** -0.891***(0.117) (0.0271) (0.0790) (0.167)
Log(AuM) lagged -0.125** -0.0302** -0.0178 -0.279***(0.0585) (0.0138) (0.0341) (0.107)
Constant 1.523** 2.102*** 1.318*** 4.464***(0.599) (0.140) (0.408) (0.900)
Observations 25,716 244,115 28,674 16,851R2 0.042 0.048 0.027 0.086Number of funds 613 5,951 743 447
Robust standard errors in parentheses*** p<0.01, ** p<0.05, * p<0.1
ECB Working Paper Series No 2652 / March 2022 23

Table 7: Role of beta performance following large market drops
(1) (2) (3) (4)VARIABLES Corporate bonds Equities Gov. bonds HY bonds
Category flows (%) 0.162 0.800*** 0.289*** 0.438***(0.122) (0.0188) (0.0263) (0.0741)
Beta perf. (lagged) 0.506*** 0.00989*** 0.0835*** 0.198***(0.0879) (0.00178) (0.0207) (0.0451)
Bench < 1st dec. (lag.) -0.649*** 0.00539 -0.334** -0.488**(0.213) (0.0459) (0.141) (0.219)
Bench < 1st dec. (lag.)*Beta perf. (lagged) -0.370*** 0.0110* -0.186** -0.115*(0.127) (0.00667) (0.0938) (0.0623)
Log(age) -0.489*** -0.556*** -0.464*** -0.871***(0.117) (0.0280) (0.0798) (0.167)
Log(AuM) lagged -0.135** -0.0293** -0.0122 -0.277***(0.0608) (0.0140) (0.0337) (0.106)
Constant 2.364*** 2.598*** 1.837*** 4.993***(0.613) (0.144) (0.408) (0.865)
Observations 25,716 244,115 28,674 16,851R2 0.041 0.041 0.023 0.081Number of funds 613 5,951 743 447
Robust standard errors in parentheses*** p<0.01, ** p<0.05, * p<0.1
ECB Working Paper Series No 2652 / March 2022 24
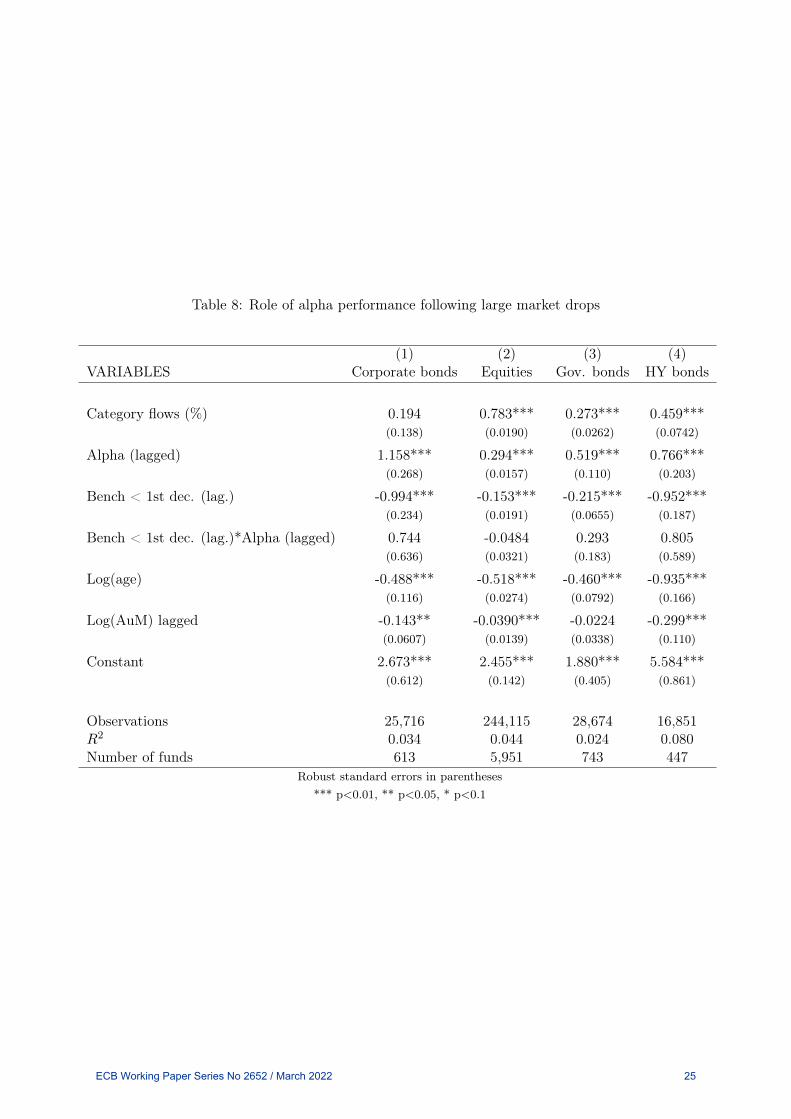
Table 8: Role of alpha performance following large market drops
(1) (2) (3) (4)VARIABLES Corporate bonds Equities Gov. bonds HY bonds
Category flows (%) 0.194 0.783*** 0.273*** 0.459***(0.138) (0.0190) (0.0262) (0.0742)
Alpha (lagged) 1.158*** 0.294*** 0.519*** 0.766***(0.268) (0.0157) (0.110) (0.203)
Bench < 1st dec. (lag.) -0.994*** -0.153*** -0.215*** -0.952***(0.234) (0.0191) (0.0655) (0.187)
Bench < 1st dec. (lag.)*Alpha (lagged) 0.744 -0.0484 0.293 0.805(0.636) (0.0321) (0.183) (0.589)
Log(age) -0.488*** -0.518*** -0.460*** -0.935***(0.116) (0.0274) (0.0792) (0.166)
Log(AuM) lagged -0.143** -0.0390*** -0.0224 -0.299***(0.0607) (0.0139) (0.0338) (0.110)
Constant 2.673*** 2.455*** 1.880*** 5.584***(0.612) (0.142) (0.405) (0.861)
Observations 25,716 244,115 28,674 16,851R2 0.034 0.044 0.024 0.080Number of funds 613 5,951 743 447
Robust standard errors in parentheses*** p<0.01, ** p<0.05, * p<0.1
ECB Working Paper Series No 2652 / March 2022 25
lag, reflecting the lagged response of flows to performance. As we are regressing laggedfund performance on flows this also ensures that the periods used for fund and marketperformance align. There is substantial but not complete overlap between dates identifiedvia extreme flows and those identified via extreme market price drops.
First, Table 6 shows that the coefficient for the interaction between rank performance andthe outflow crisis dummy is negative and statistically significant for corporate and highyield funds. Corporate and high yield funds are arguably the fund categories with thegreatest propensity to create the financial stability risks. Funds hold a larger share ofoutstanding euro area corporate and high yield bonds than they do government bonds orequities, increasing the sector’s capacity to influence market pricing. Corporate and highyield bonds are also much less liquid than government bonds or equities, increasing thesefunds’ likelihood to engage in firesale activity during periods of large outflows.
For periods associated with large drops in asset values, we interact the crisis dummy withperformance due to a fund’s beta (Table 7) and then with a fund’s alpha (Table 8). Thecoefficient for the interaction between beta performance and a crisis period is negative andstatistically significant for all types of bond fund. In contrast, the interaction with alphaperformance in Table 8 is never statistically significant. So investors treat non-systematic(or “non-cyclical”) returns equally across market conditions but are more forgiving of lossesarising from the market drop itself (beta performance).
Taken together this suggests that incentives facing bond fund managers may be capturedby two quotes used in Haldane (2010). If investors reward beta performance during goodtimes but do not equally punish it when the market turns then, to paraphrase Keynes, “Asound [fund manager], alas, is not one who foresees danger and avoids it, but one who,when he is ruined, is ruined in a conventional and orthodox way with his fellows, so thatno one can really blame him”. As a result, in the period preceding crises, procyclicalinvesting may be driven more by competition with peers than by a genuine belief by fundmanagers that asset prices will continue to rise. Or as stated in 2006 by then CitibankCEO Chuck Prince “As long as the music is playing, you’ve got to get up and dance. We’restill dancing”. Notably, the overall effect on market pricing will act out alongside the effectof aggregate flows, which are also typically procyclical (see Feroli et al. (2014)).
Of course, this doesn’t mean that during a crisis period risky funds are not experiencingoutflows or that outflows during a crisis period are not a problem. In particular, ourfindings do not negate concerns around fund firesales during crisis periods raised in paperslike Goldstein et al. (2017). First, our findings do not refer to the sensitivity of flows in andout of an asset class to the performance of that asset class but instead refer to flows at thefund-level relative to peers. Feroli et al. (2014) documents that flows to given asset classesare highly sensitive to their returns. So during periods where an asset class performs badlymost funds will be experiencing outflows but the role of past performance in determininghow flows are distributed across funds will be weaker than in normal periods.
Second, the negative interaction term suggests that at the fund-level the sensitivity offlows to performance weakens during a crisis. Funds with very procyclical positioningwho are posting much larger losses than their more conservative peers will likely also beexperiencing larger outflows in absolute terms. It is the marginal effect that is weaker andit is this marginal effect which can incentivise risk-taking in the upswing.
ECB Working Paper Series No 2652 / March 2022 26

In contrast, the interaction coefficients are positive for equity funds in both Table 6 and 7,although they are smaller in absolute size than for corporate and high yield funds. Thissuggests that while cyclical risk-taking incentives also exist for equity funds, they arisefrom changes in the shape of the flow-performance relationship as studied in Section 4.1as opposed to its intensity as examined here.
To ensure that our findings are robust to variation in the cut-off point used in crisisdefinition, we repeat the exercises from Tables 6 to 8, defining a crisis as periods in thebottom 5th, 15th and 20th percentile of months across our 15 year sample. Full resultscan be found in Appendix B. For crises characterised by large outflows, the interaction ofrank performance and the crisis dummy remains negative and statistically significant forboth high yield and corporate bond funds across all cut-off points.
For periods with large market drops, significance of the beta performance interaction termis lost for bond funds only when a 20th percentile cut-off is used and for governmentbonds with a 5th percentile cut-off. However, coefficients remain negative in all cases.Interestingly, the alpha-crisis interaction is statistically significant and positive for highyield and corporate bond funds when the 20th percentile cut-off is used and for high yieldfunds when the 15th percentile cut-off is used. This suggests that in some cases investorsare not only less sensitive to losses arising from pro-cyclical positioning during crisis butalso more sensitive to non-systematic losses during these periods. Again, this supports our(and Rajan’s) argument that during a crisis investors treat market-directional (pro-cyclical)and non-market-directional returns differently.
6 Policy Implications
Our empirical analysis has shown that the flow performance relationship for euro areafunds exhibits characteristics associated with cyclical risk-taking incentives. Overall thissuggests that the flow performance relationship does reward fund managers for takingcyclical risks.While this is bad news for funds’ investors, it also has serious implicationsfor the wider financial system and the real economy. Excess risk-taking among investmentfunds can have externalities for the wider system and as the fund sector grows so does itscapacity to create systemic risk.
The fact that market discipline, as imposed by funds’ investors, may not be sufficient toensure prudential behaviour among managers, combined with the externalities of this risk-taking for the wider system, creates a clear case for regulatory intervention. This argumenthas already been comprehensively made for banks, resulting in extensive prudential super-vision of the sector, which has grown further since the global financial crisis. Parallelsbetween incentives identified in our analysis and in the banking literature suggests thatthese arguments also apply to funds. For example, Hellmann et al. (2000) and Rochet(1992) illustrate that regulatory intervention in the face of convex payoff structures can bewelfare improving in the banking sector. When Rajan (1994) takes into account the effectsof competition between agents, he shows that regulation applied to only parts of a sectorcan increase risk-taking incentives but that policy applied to all agents can be beneficial.This further highlights the importance of a macroprudential approach in the funds sector,a task which has been a high priority among policy makers for a number of years.
ECB Working Paper Series No 2652 / March 2022 27
Understanding the incentives driving risk-taking can also assists in the design of policiesaiming to mitigate it. Examining policy response to convex payoff structures, Hellmann etal. (2000) suggests two complementary approaches: Increase agent’s exposure to their owninvestments and limit the capacity of agents to engage in risk-taking which has negativelong term consequences for their own profits. Building on Rajan’s model, Haldane (2010)puts forward two similar suggestions: Increase the cost of gambling for the gamblers anduse credible policy to push agents to coordinate at lower risk levels. In particular, Hal-dane (2010) emphasises that credible policy can also work via an expectations channel,whereby agents expect their peers to take less risk and so do not need to take as much riskthemselves.
In theory, fund managers’ exposure to their own investments (and thus the cost of gam-bling) could be increased by applying principles already used in corporate renumerationpackages to fund fees. In many parts of the corporate and financial sector it is now com-monplace for bonuses to be paid partially in company equity, which cannot be sold fora specified period of time after the bonus payment. The goal is to incentivise employ-ees through performance-linked compensation, while also ensuring that employees do notboost short term performance metrics through actions which ultimately undermine thewell-being of the company. Similarly, fund fee payments by investors could be subject toa lock-up and only received by fund managers after a specified period, if the fund has per-formed well over the cycle or has met some set of medium-term performance metrics. Thiscould also be framed simply as a performance fee which includes a fee rebate for investorsin the event of severe underperformance.
This type of policy would increase fund managers and management companies’ exposure tothe downside of their own risk-taking and discourage managers from boosting short termreturns to the detriment of the funds’ longer term performance. In the context of Rajan’smodel, this would make the benefits derived from a good reputation also subject to thecost of gambling. Of course these tools are subject to the Lucas critique, in that changingfee structures could change investor flow behaviour, and are not currently available inregulatory legislation.
Tools which limit risk-taking capacity are more readily available, with de Guindos (2020)suggesting a number of suitable options. First he suggests the use of ex-ante liquiditymanagement tools, such as minimum liquidity buffers and redemption notice periods. Bothwould primarily reduce the externalities of funds’ behaviours during crisis periods, byincreasing their capacity to meet large redemptions without engaging in firesales. However,by requiring that funds hold some share of their portfolio in safe, highly liquid assets,minimum liquidity buffers would also reduce their capacity to take excess risk in the firstplace. Increased regulation of redemption notice periods would also reduce funds’ capacityto attract flows by offering short notice redemptions, which ultimately results in substantialliquidity risk-taking when funds’ assets are illiquid.
de Guindos (2020) also suggests that existing leverage regulation be reconsidered. The useof leverage by funds, through either derivatives or borrowing can increase the cyclicalityof their returns, allowing them to boost returns during good times but also requiring themto rapidly exit large positions during crises. Again, where effectively and credibly appliedacross funds, leverage limits could reduce the capacity for cyclical, systemic risk to build-upin the fund sector.
ECB Working Paper Series No 2652 / March 2022 28
Finally, our findings regarding cyclicality in risk-taking incentives suggest that these toolscould benefit from countercyclical implementation, similarly to countercyclical capitalbuffers in the banking sector. In practice this would involve tightening liquidity and lever-age requirements during periods of market exuberance but then loosening them duringcrises, to allow funds to respond to large redemptions and to avoid funds collectivelydeleveraging and exiting positions.
7 Conclusions
To understand the behaviour of the financial system, we need to understand the incentivesfaced by its participants. Where incentive structures reward agents for making decisionswhich are to the detriment of the system as a whole, this creates fundamental instability.It also justifies regulatory intervention.
This paper has provided empirical evidence for the existence of wide-spread risk-takingincentives in the investment fund sector. Incentives arise from the positive response ofinvestors to returns achieved through cyclical risk-taking and non-linearities in the re-lationship between fund returns and fund flows, which may keep managers from fullyinternalising the effects of adverse outcomes on their portfolios.
Our findings mirror the drivers laid out in the existing literature on bank-driven creditbooms, pointing to broad, destabilising effects. However, understanding these incentivesalso allows for effective policy design to mitigate their effects. As the incentives arise fromcompetition between funds, it is crucial that policies are applied across the sector, i.e.that a macroprudential approach is taken, and that they directly tackle the coordinationproblem. The need for these types of policies may be particularly pronounced duringextended periods of accommodative monetary policy, where long periods of rising assetprices result in a build-up of risk among funds.
These findings raise a number of questions for further research. Most obviously, can wemeasure funds’ response to these incentives? Such analysis would not be straightforwardand would need to account for increased fund demand for risky assets manifesting inincreased fund holdings and, in cases where funds are the dominant buyer of a security,in pricing effects. It would also likely require holdings-level data for a large number offunds over an extended period of time.9 The examination of fund incentives could also beextended to sources other than the flow-performance relationship.
Finally, Goldstein et al. (2017) highlight that the growing role of ETFs may change theway the flow-performance relationship affects the investment fund sector. In relation tothis paper’s analysis, growth in passive products may reduce the share of the fund sectorwhich can choose to take excess risk but could also increase investors’ expectation of strongreturns from actively managed products, amplifying the flow-performance dynamics shownhere.
9See Barbu et al. (2020) who use this type of data to examine institutional funds.
ECB Working Paper Series No 2652 / March 2022 29
References
Aikman, David, Benjamin Nelson, and Misa Tanaka, “Reputation, risk-taking, and macro-prudential policy,” Journal of Banking & Finance, 2015, 50, 428–439.
Barbu, Alexandru, Christoph Fricke, and Emanuel Moench, “Procyclical Asset Manage-ment and Bond Risk Premia,” Deutsche Bundesbank Discussion Paper, 2020, 38.
Berkowitz, Michael K and Yehuda Kotowitz, “Investor risk evaluation in the determinationof management incentives in the mutual fund industry,” Journal of Financial Markets, 2000, 3(4), 365–387.
Brown, Keith C, W Van Harlow, and Laura T Starks, “Of tournaments and temptations:An analysis of managerial incentives in the mutual fund industry,” The Journal of Finance,1996, 51 (1), 85–110.
Chen, Qi, Itay Goldstein, and Wei Jiang, “Payoff complementarities and financial fragility:Evidence from mutual fund outflows,” Journal of Financial Economics, 2010, 97 (2), 239–262.
Chen, Yong and Nan Qi, “The behaviour of investor flows in corporate bond mutual funds,”Management Science, 2017, 63, 1365–1381.
Chevalier, Judith and Glenn Ellison, “Risk taking by mutual funds as a response to incentives,”Journal of Political Economy, 1997, 105 (6), 1167–1200.
de Guindos, Luis, “Building the Financial System of the 21st Century,” 7 2020. Speech at the18th annual symposium on “Building the Financial System of the 21st Century: an Agenda forEurope and the United States” organised by the Program on International Financial Systemsand Harvard Law School [Accessed: 2020 08 17].
ECB, “Financial Stability Review,” 2020, May.
Feroli, Michael, Anil K Kashyap, Kermit L Schoenholtz, and Hyun Song Shin, “Markettantrums and monetary policy,” Chicago Booth Research Paper, 2014, (14-09).
Ferreira, Miguel A, Aneel Keswani, Antonio F Miguel, and Sofia B Ramos, “Theflow-performance relationship around the world,” Journal of Banking & Finance, 2012, 36 (6),1759–1780.
Fulkerson, Jon, Jordan Bradford, and Timonth Riley, “Return Chasing in Bond Funds,”Journal of Fixed Income, 2013, Spring (2), 90–103.
Goldstein, Itay, Hao Jiang, and David T Ng, “Investor flows and fragility in corporate bondfunds,” Journal of Financial Economics, 2017, 126 (3), 592–613.
Gruber, Martin J, “Another puzzle: The growth in actively managed mutual funds,” in “Invest-ments And Portfolio Performance,” World Scientific, 2011, pp. 117–144.
Haldane, Andrew, “Curbing the credit cycle,” 11 2010. Speech at the Columbia UniversityCenter on Capitalism and Society Annual Conference, New York [Accessed: 2020 07 24].
Hellmann, Thomas F, Kevin C Murdock, and Joseph E Stiglitz, “Liberalization, moralhazard in banking, and prudential regulation: Are capital requirements enough?,” Americaneconomic review, 2000, 90 (1), 147–165.
Jank, Stephan and Michael Wedow, “Purchase and redemption decisions of mutual fundinvestors and the role of fund families,” The European Journal of Finance, 2013, 19 (2), 127–144.
Qiu, Jiaping, “Termination risk, multiple managers and mutual fund tournaments,” Review ofFinance, 2003, 7 (2), 161–190.
ECB Working Paper Series No 2652 / March 2022 30

Rajan, Raghuram G, “Why bank credit policies fluctuate: A theory and some evidence.,” TheQuarterly Journal of Economics, 1994, (109(2)).
, “Has financial development made the world riskier?,” NBER Working Paper, 2005, (11728).
Rochet, Jean-Charles, “Capital requirements and the behaviour of commercial banks,” EuropeanEconomic Review, 1992, 36 (5), 1137–1170.
Sirri, Erik R and Peter Tufano, “Costly search and mutual fund flows,” The journal of finance,1998, 53 (5), 1589–1622.
Sujing, Li and Qiu Jiaping, “Product differentiation over the state space in the mutual fundindustry,” Management Science, 2014, 60 (2), 508–502.
ECB Working Paper Series No 2652 / March 2022 31

Appendices
A Results in Table Format
ECB Working Paper Series No 2652 / March 2022 32
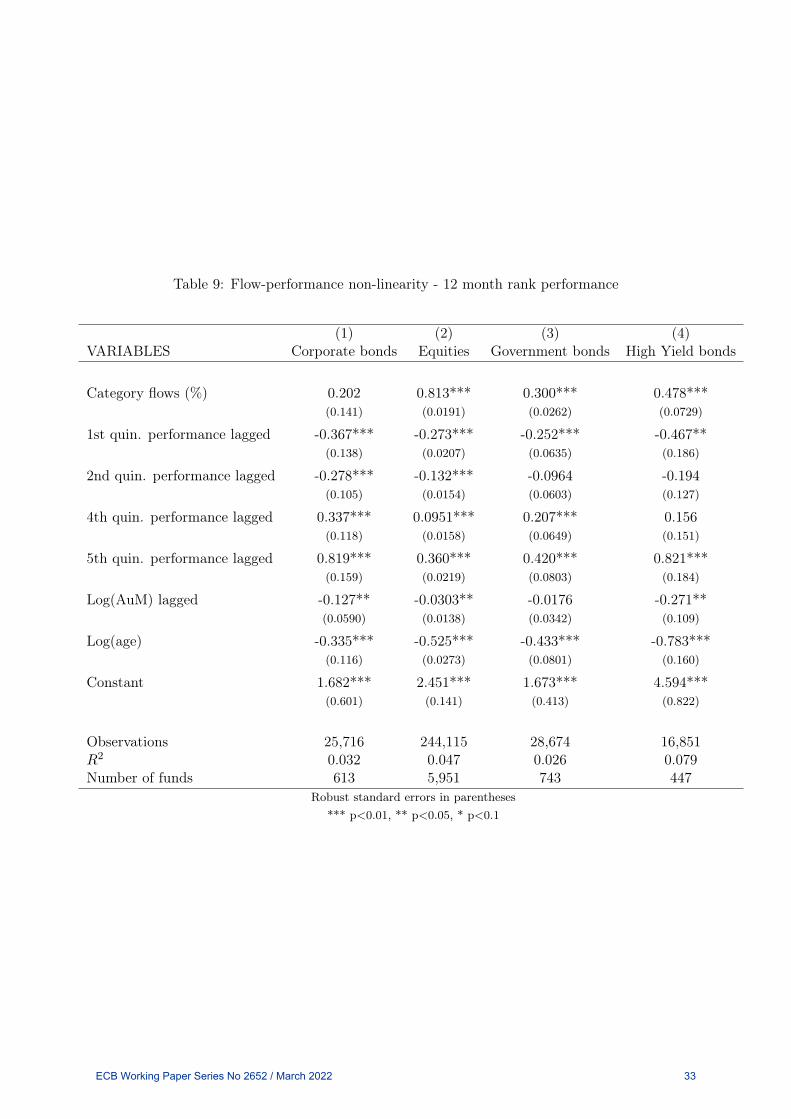
Table 9: Flow-performance non-linearity - 12 month rank performance
(1) (2) (3) (4)VARIABLES Corporate bonds Equities Government bonds High Yield bonds
Category flows (%) 0.202 0.813*** 0.300*** 0.478***(0.141) (0.0191) (0.0262) (0.0729)
1st quin. performance lagged -0.367*** -0.273*** -0.252*** -0.467**(0.138) (0.0207) (0.0635) (0.186)
2nd quin. performance lagged -0.278*** -0.132*** -0.0964 -0.194(0.105) (0.0154) (0.0603) (0.127)
4th quin. performance lagged 0.337*** 0.0951*** 0.207*** 0.156(0.118) (0.0158) (0.0649) (0.151)
5th quin. performance lagged 0.819*** 0.360*** 0.420*** 0.821***(0.159) (0.0219) (0.0803) (0.184)
Log(AuM) lagged -0.127** -0.0303** -0.0176 -0.271**(0.0590) (0.0138) (0.0342) (0.109)
Log(age) -0.335*** -0.525*** -0.433*** -0.783***(0.116) (0.0273) (0.0801) (0.160)
Constant 1.682*** 2.451*** 1.673*** 4.594***(0.601) (0.141) (0.413) (0.822)
Observations 25,716 244,115 28,674 16,851R2 0.032 0.047 0.026 0.079Number of funds 613 5,951 743 447
Robust standard errors in parentheses*** p<0.01, ** p<0.05, * p<0.1
ECB Working Paper Series No 2652 / March 2022 33

B Varying Crisis Definitions
ECB Working Paper Series No 2652 / March 2022 34

Table 10: Outflows below 5th percentile- performance rank
(1) (2) (3) (4)VARIABLES Corporate bonds Equities Gov. bonds HY bonds
Category flows (%) 0.175 0.771*** 0.308*** 0.411***(0.132) (0.0191) (0.0280) (0.0788)
Performance rank (lagged) 0.0167*** 0.00773*** 0.00894*** 0.0174***(0.00225) (0.000308) (0.000996) (0.00238)
Flows< 5th percentile -0.929 -0.286*** 0.113 -0.791(0.582) (0.0676) (0.236) (0.888)
Flows< 5th percentile*Perf. rank (lagged) -0.0149** 0.00182 0.000606 -0.0264**(0.00588) (0.00121) (0.00408) (0.0129)
Log(age) -0.428*** -0.530*** -0.423*** -0.893***(0.118) (0.0272) (0.0793) (0.165)
Log(AuM) lagged -0.124** -0.0306** -0.0197 -0.277**(0.0590) (0.0138) (0.0343) (0.108)
Constant 1.408** 2.091*** 1.241*** 4.394***(0.601) (0.140) (0.410) (0.873)
Observations 25,716 244,115 28,674 16,851R2 0.038 0.048 0.027 0.084Number of funds 613 5,951 743 447
Robust standard errors in parentheses*** p<0.01, ** p<0.05, * p<0.1
ECB Working Paper Series No 2652 / March 2022 35

Table 11: Outflows below 15th percentile- performance rank
(1) (2) (3) (4)VARIABLES Corporate bonds Equities Gov. bonds HY bonds
Category flows (%) 0.151 0.796*** 0.256*** 0.337***(0.121) (0.0215) (0.0297) (0.0869)
Performance rank (lagged) 0.0183*** 0.00761*** 0.00901*** 0.0184***(0.00232) (0.000311) (0.00102) (0.00250)
Flows< 15th percentile -0.704* -0.103*** -0.276** -1.190**(0.362) (0.0367) (0.136) (0.595)
Flows< 15th percentile*Perf. rank (lagged) -0.0131*** 0.00127** -0.000328 -0.0180***(0.00269) (0.000631) (0.00238) (0.00654)
Log(age) -0.428*** -0.528*** -0.453*** -1.017***(0.115) (0.0272) (0.0791) (0.173)
Log(AuM) lagged -0.128** -0.0306** -0.0150 -0.272**(0.0582) (0.0138) (0.0341) (0.108)
Constant 1.472** 2.094*** 1.383*** 5.086***(0.590) (0.140) (0.406) (0.950)
Observations 25,716 244,115 28,674 16,851R2 0.045 0.048 0.027 0.091Number of funds 613 5,951 743 447
Robust standard errors in parentheses*** p<0.01, ** p<0.05, * p<0.1
ECB Working Paper Series No 2652 / March 2022 36
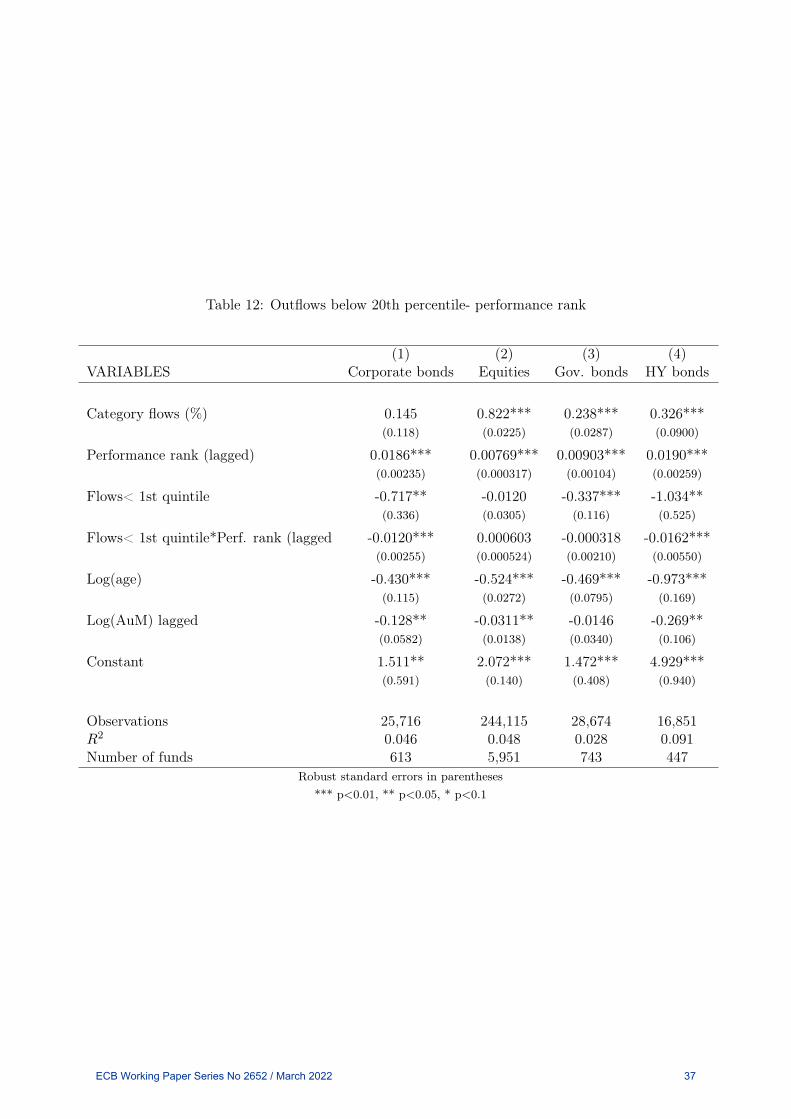
Table 12: Outflows below 20th percentile- performance rank
(1) (2) (3) (4)VARIABLES Corporate bonds Equities Gov. bonds HY bonds
Category flows (%) 0.145 0.822*** 0.238*** 0.326***(0.118) (0.0225) (0.0287) (0.0900)
Performance rank (lagged) 0.0186*** 0.00769*** 0.00903*** 0.0190***(0.00235) (0.000317) (0.00104) (0.00259)
Flows< 1st quintile -0.717** -0.0120 -0.337*** -1.034**(0.336) (0.0305) (0.116) (0.525)
Flows< 1st quintile*Perf. rank (lagged -0.0120*** 0.000603 -0.000318 -0.0162***(0.00255) (0.000524) (0.00210) (0.00550)
Log(age) -0.430*** -0.524*** -0.469*** -0.973***(0.115) (0.0272) (0.0795) (0.169)
Log(AuM) lagged -0.128** -0.0311** -0.0146 -0.269**(0.0582) (0.0138) (0.0340) (0.106)
Constant 1.511** 2.072*** 1.472*** 4.929***(0.591) (0.140) (0.408) (0.940)
Observations 25,716 244,115 28,674 16,851R2 0.046 0.048 0.028 0.091Number of funds 613 5,951 743 447
Robust standard errors in parentheses*** p<0.01, ** p<0.05, * p<0.1
ECB Working Paper Series No 2652 / March 2022 37
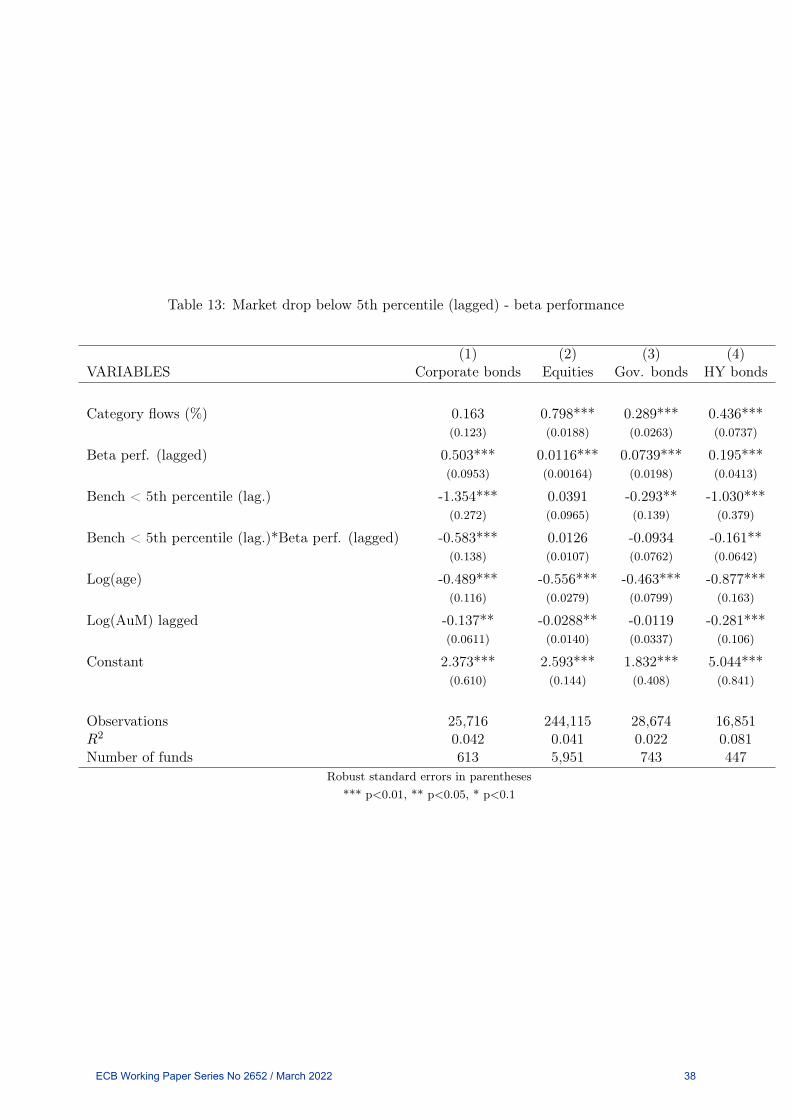
Table 13: Market drop below 5th percentile (lagged) - beta performance
(1) (2) (3) (4)VARIABLES Corporate bonds Equities Gov. bonds HY bonds
Category flows (%) 0.163 0.798*** 0.289*** 0.436***(0.123) (0.0188) (0.0263) (0.0737)
Beta perf. (lagged) 0.503*** 0.0116*** 0.0739*** 0.195***(0.0953) (0.00164) (0.0198) (0.0413)
Bench < 5th percentile (lag.) -1.354*** 0.0391 -0.293** -1.030***(0.272) (0.0965) (0.139) (0.379)
Bench < 5th percentile (lag.)*Beta perf. (lagged) -0.583*** 0.0126 -0.0934 -0.161**(0.138) (0.0107) (0.0762) (0.0642)
Log(age) -0.489*** -0.556*** -0.463*** -0.877***(0.116) (0.0279) (0.0799) (0.163)
Log(AuM) lagged -0.137** -0.0288** -0.0119 -0.281***(0.0611) (0.0140) (0.0337) (0.106)
Constant 2.373*** 2.593*** 1.832*** 5.044***(0.610) (0.144) (0.408) (0.841)
Observations 25,716 244,115 28,674 16,851R2 0.042 0.041 0.022 0.081Number of funds 613 5,951 743 447
Robust standard errors in parentheses*** p<0.01, ** p<0.05, * p<0.1
ECB Working Paper Series No 2652 / March 2022 38
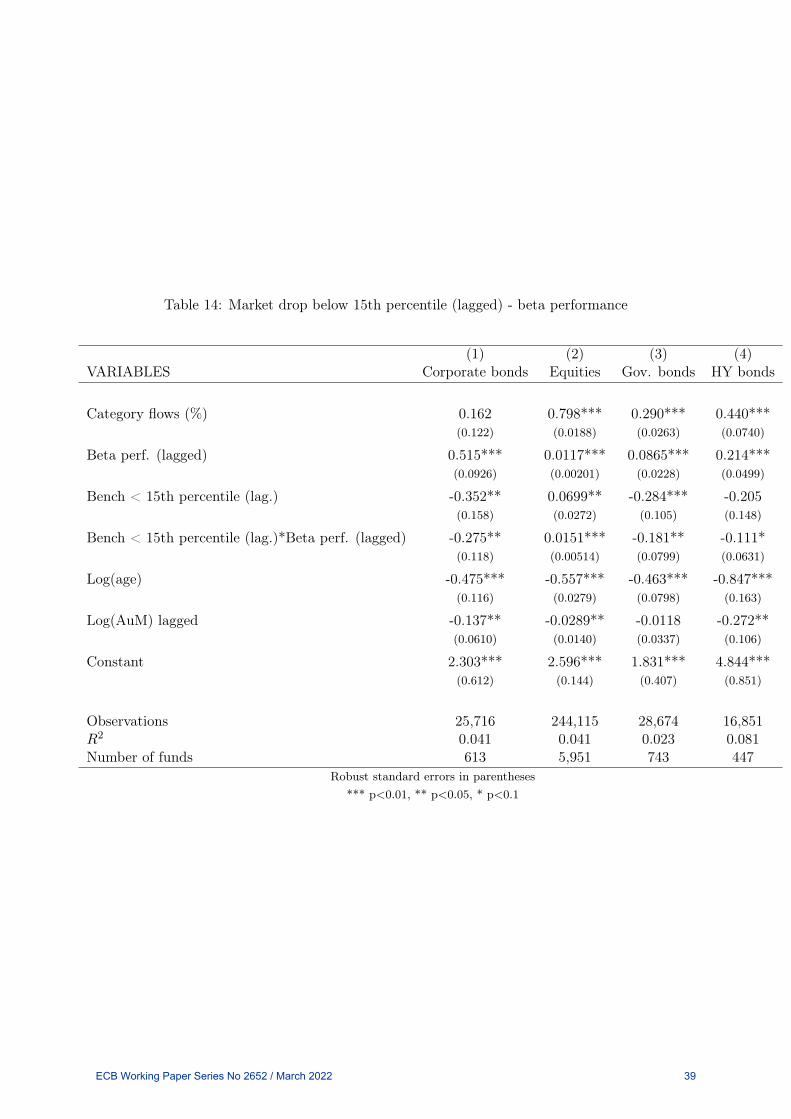
Table 14: Market drop below 15th percentile (lagged) - beta performance
(1) (2) (3) (4)VARIABLES Corporate bonds Equities Gov. bonds HY bonds
Category flows (%) 0.162 0.798*** 0.290*** 0.440***(0.122) (0.0188) (0.0263) (0.0740)
Beta perf. (lagged) 0.515*** 0.0117*** 0.0865*** 0.214***(0.0926) (0.00201) (0.0228) (0.0499)
Bench < 15th percentile (lag.) -0.352** 0.0699** -0.284*** -0.205(0.158) (0.0272) (0.105) (0.148)
Bench < 15th percentile (lag.)*Beta perf. (lagged) -0.275** 0.0151*** -0.181** -0.111*(0.118) (0.00514) (0.0799) (0.0631)
Log(age) -0.475*** -0.557*** -0.463*** -0.847***(0.116) (0.0279) (0.0798) (0.163)
Log(AuM) lagged -0.137** -0.0289** -0.0118 -0.272**(0.0610) (0.0140) (0.0337) (0.106)
Constant 2.303*** 2.596*** 1.831*** 4.844***(0.612) (0.144) (0.407) (0.851)
Observations 25,716 244,115 28,674 16,851R2 0.041 0.041 0.023 0.081Number of funds 613 5,951 743 447
Robust standard errors in parentheses*** p<0.01, ** p<0.05, * p<0.1
ECB Working Paper Series No 2652 / March 2022 39

Table 15: Market drop below 20th percentile (lagged) - beta performance
(1) (2) (3) (4)VARIABLES Corporate bonds Equities Gov. bonds HY bonds
Category flows (%) 0.163 0.801*** 0.290*** 0.437***(0.122) (0.0188) (0.0261) (0.0738)
Beta perf. (lagged) 0.488*** 0.00807*** 0.0690*** 0.167***(0.0967) (0.00237) (0.0242) (0.0535)
Bench < 1st quin. (lag.) -0.247** -0.00537 -0.204*** -0.514***(0.113) (0.0176) (0.0749) (0.127)
Bench < 1st quin. (lag.)*Beta perf. (lagged) -0.164 0.0109** -0.0996 -0.0898(0.106) (0.00449) (0.0696) (0.0653)
Log(age) -0.488*** -0.556*** -0.467*** -0.822***(0.117) (0.0279) (0.0799) (0.163)
Log(AuM) lagged -0.137** -0.0294** -0.0115 -0.285***(0.0609) (0.0140) (0.0337) (0.106)
Constant 2.384*** 2.605*** 1.869*** 4.904***(0.619) (0.145) (0.409) (0.858)
Observations 25,716 244,115 28,674 16,851R2 0.041 0.041 0.023 0.082Number of funds 613 5,951 743 447
Robust standard errors in parentheses*** p<0.01, ** p<0.05, * p<0.1
ECB Working Paper Series No 2652 / March 2022 40
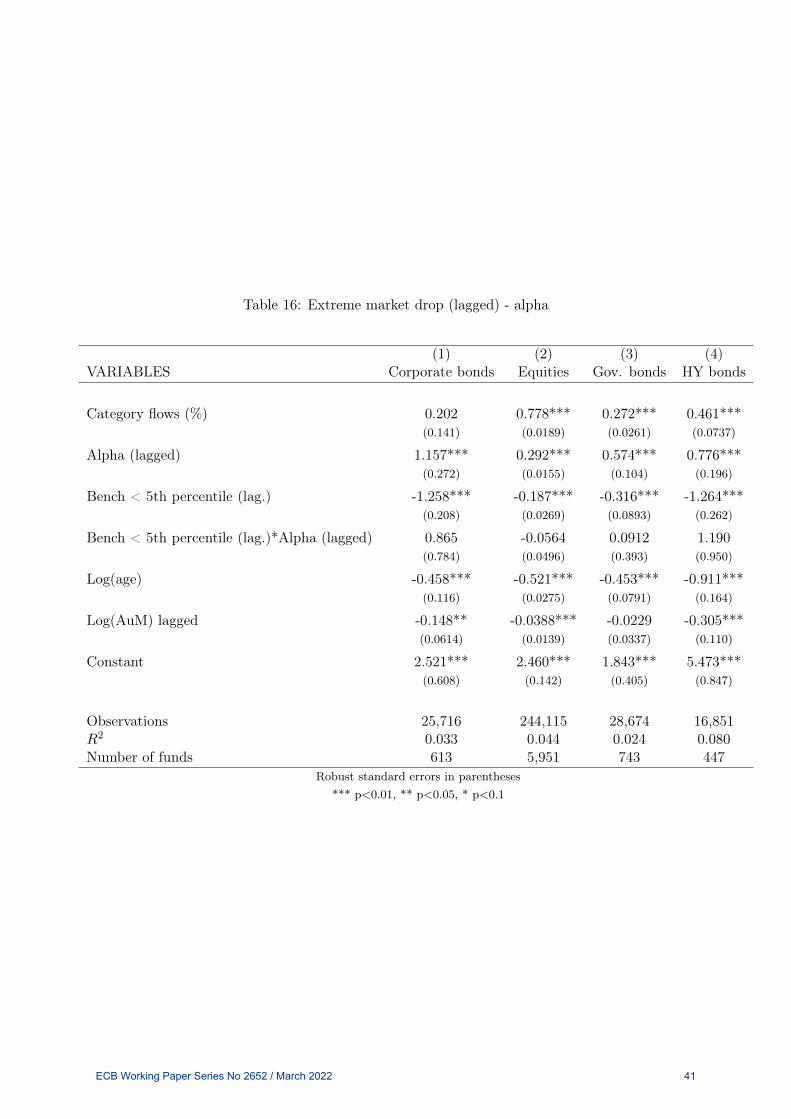
Table 16: Extreme market drop (lagged) - alpha
(1) (2) (3) (4)VARIABLES Corporate bonds Equities Gov. bonds HY bonds
Category flows (%) 0.202 0.778*** 0.272*** 0.461***(0.141) (0.0189) (0.0261) (0.0737)
Alpha (lagged) 1.157*** 0.292*** 0.574*** 0.776***(0.272) (0.0155) (0.104) (0.196)
Bench < 5th percentile (lag.) -1.258*** -0.187*** -0.316*** -1.264***(0.208) (0.0269) (0.0893) (0.262)
Bench < 5th percentile (lag.)*Alpha (lagged) 0.865 -0.0564 0.0912 1.190(0.784) (0.0496) (0.393) (0.950)
Log(age) -0.458*** -0.521*** -0.453*** -0.911***(0.116) (0.0275) (0.0791) (0.164)
Log(AuM) lagged -0.148** -0.0388*** -0.0229 -0.305***(0.0614) (0.0139) (0.0337) (0.110)
Constant 2.521*** 2.460*** 1.843*** 5.473***(0.608) (0.142) (0.405) (0.847)
Observations 25,716 244,115 28,674 16,851R2 0.033 0.044 0.024 0.080Number of funds 613 5,951 743 447
Robust standard errors in parentheses*** p<0.01, ** p<0.05, * p<0.1
ECB Working Paper Series No 2652 / March 2022 41

Table 17: Extreme market drop (lagged) - alpha
(1) (2) (3) (4)VARIABLES Corporate bonds Equities Gov. bonds HY bonds
Category flows (%) 0.193 0.786*** 0.270*** 0.463***(0.137) (0.0191) (0.0262) (0.0741)
Alpha (lagged) 1.127*** 0.296*** 0.524*** 0.728***(0.269) (0.0160) (0.113) (0.204)
Bench < 15th percentile (lag.) -0.847*** -0.109*** -0.207*** -0.635***(0.197) (0.0148) (0.0531) (0.143)
Bench < 15th percentile (lag.)*Alpha (lagged) 0.560 -0.0376 0.246 0.846*(0.408) (0.0263) (0.176) (0.501)
Log(age) -0.463*** -0.516*** -0.463*** -0.855***(0.115) (0.0274) (0.0791) (0.162)
Log(AuM) lagged -0.151** -0.0379*** -0.0212 -0.300***(0.0614) (0.0139) (0.0337) (0.110)
Constant 2.619*** 2.444*** 1.896*** 5.250***(0.609) (0.142) (0.404) (0.839)
Observations 25,716 244,115 28,674 16,851R2 0.034 0.044 0.025 0.080Number of funds 613 5,951 743 447
Robust standard errors in parentheses*** p<0.01, ** p<0.05, * p<0.1
ECB Working Paper Series No 2652 / March 2022 42

Table 18: Extreme market drop (lagged) - alpha
(1) (2) (3) (4)VARIABLES Corporate bonds Equities Gov. bonds HY bonds
Category flows (%) 0.190 0.781*** 0.268*** 0.453***(0.135) (0.0190) (0.0257) (0.0737)
Alpha (lagged) 1.113*** 0.298*** 0.511*** 0.672***(0.251) (0.0164) (0.115) (0.212)
Bench < 1st quin. (lag.) -0.837*** -0.113*** -0.233*** -0.786***(0.169) (0.0117) (0.0438) (0.133)
Bench < 1st quin. (lag.)*Alpha (lagged) 0.754* -0.0223 0.266 0.937**(0.443) (0.0207) (0.172) (0.378)
Log(age) -0.527*** -0.518*** -0.473*** -0.816***(0.116) (0.0274) (0.0790) (0.162)
Log(AuM) lagged -0.146** -0.0386*** -0.0206 -0.302***(0.0607) (0.0139) (0.0337) (0.110)
Constant 2.964*** 2.468*** 1.969*** 5.194***(0.618) (0.142) (0.404) (0.839)
Observations 25,716 244,115 28,674 16,851R2 0.037 0.044 0.025 0.082Number of funds 613 5,951 743 447
Robust standard errors in parentheses*** p<0.01, ** p<0.05, * p<0.1
ECB Working Paper Series No 2652 / March 2022 43

Acknowledgements
The views expressed in this paper are those of the author and are not necessarily those held by the European Central Bank. The author
would like to thank Lorenzo Cappiello, Karl Whelan, Sujit Kapadia and seminar participants at the European Central Bank, Central Bank
of Ireland and University College Dublin for helpful comments.
Ellen Ryan
European Central Bank, Frankfurt am Main, Germany; email: [email protected]
© European Central Bank, 2022
Postal address 60640 Frankfurt am Main, Germany
Telephone +49 69 1344 0
Website www.ecb.europa.eu
All rights reserved. Any reproduction, publication and reprint in the form of a different publication, whether printed or produced
electronically, in whole or in part, is permitted only with the explicit written authorisation of the ECB or the authors.
This paper can be downloaded without charge from www.ecb.europa.eu, from the Social Science Research Network electronic library or
from RePEc: Research Papers in Economics. Information on all of the papers published in the ECB Working Paper Series can be found
on the ECB’s website.
PDF ISBN 978-92-899-4985-9 ISSN 1725-2806 doi:10.2866/220637 QB-AR-22-017-EN-N
Related Documents


![[WEBINAR] Winning With Rewarded Video Monetization](https://static.cupdf.com/doc/110x72/55a81fa31a28abf9178b4608/webinar-winning-with-rewarded-video-monetization.jpg)