Are efforts to improve technical quality of care competing with improving clinical outcomes?: The case of the elevated A1c Parchman ML, Pugh JA, Romero RL University of Texas Health Science Center-San Antonio VERDICT Health Services Research Program, South Texas Veterans Health Care System

Are efforts to improve technical quality of care competing with improving clinical outcomes?: The case of the elevated A1c Parchman ML, Pugh JA, Romero.
Dec 13, 2015
Welcome message from author
This document is posted to help you gain knowledge. Please leave a comment to let me know what you think about it! Share it to your friends and learn new things together.
Transcript
Are efforts to improve technical quality of care competing with improving clinical outcomes?: The case of the elevated A1c
Parchman ML, Pugh JA, Romero RLUniversity of Texas Health Science Center-San Antonio
VERDICT Health Services Research Program, South Texas Veterans Health Care System
Background: Quality of Healthcare Health Plan & Providers Performance
Audit & feedback QI Improvement programs
Quality Indicators focus on delivery or receipt of a service, e.g. Immunization given Screening test performed Foot exam done
Feasibility/Data Availability: ease of administrative data access

Understanding Quality of Care High level
administrative data Health Plan Performance Clinic-level Performance Provider-level
Performance The “black box” of the
clinical encounter

Clinic-Level Performance: Process Measures Done, CVD Risks Good: A1c<7; BP<130/80; LDL-C< 100
0
10
20
30
40
50
60
70
1 2 3 4 5 6 7 8 9 10 11 12 13 14 15 16 17 18 19 20
Clinic
%All 6 done
All 3 good
Objective: Inside the “Black Box” To examine the relationship between
performance of technical/process measures of quality of care inside the primary care encounter and medication intensification for poorly controlled diabetes
Is the likelihood that a change in medication occurred among patients with an elevated A1c associated with process measure performance?
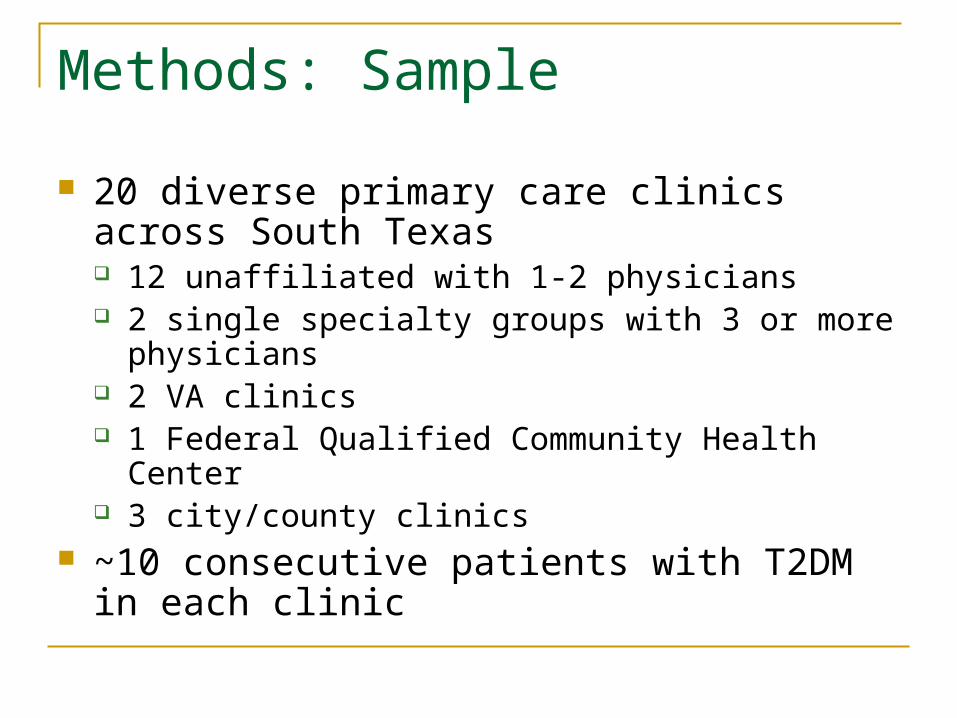
Methods: Sample
20 diverse primary care clinics across South Texas 12 unaffiliated with 1-2 physicians 2 single specialty groups with 3 or more physicians 2 VA clinics 1 Federal Qualified Community Health Center 3 city/county clinics
~10 consecutive patients with T2DM in each clinic

Methods: Data Collection
Trained Observer: Direct observation of encounter
Patient Exit Survey Chart review
Most recent A1c value Number of medications Indicated diabetes service done in past year
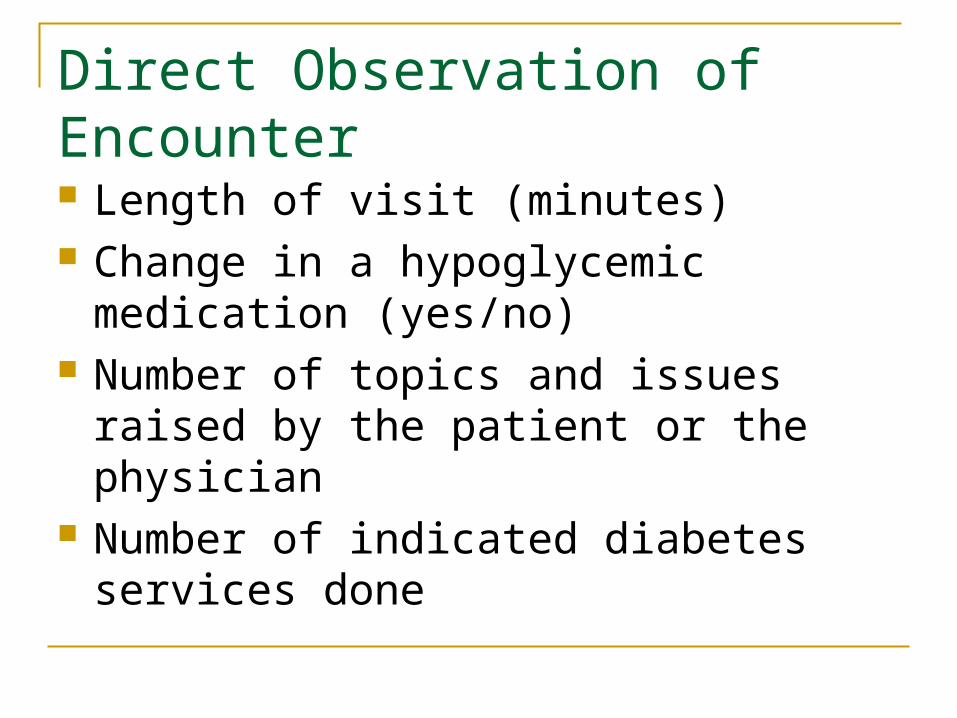
Direct Observation of Encounter Length of visit (minutes) Change in a hypoglycemic medication
(yes/no) Number of topics and issues raised by the
patient or the physician Number of indicated diabetes services done

Indicated Diabetes Services
If not done in past year by chart review Foot exam Referral for eye exam A1c ordered Lipid panel ordered Urine micro-albumin ordered BP measured
For analysis converted to “all indicated done: yes/no”

Analysis
Dependent: change in medication Independent: all indicated services done
(yes/no) Co-variates
Length of visit Number of topics/issues raised by patient or physician, Most recent A1c level Number of chronic medications.
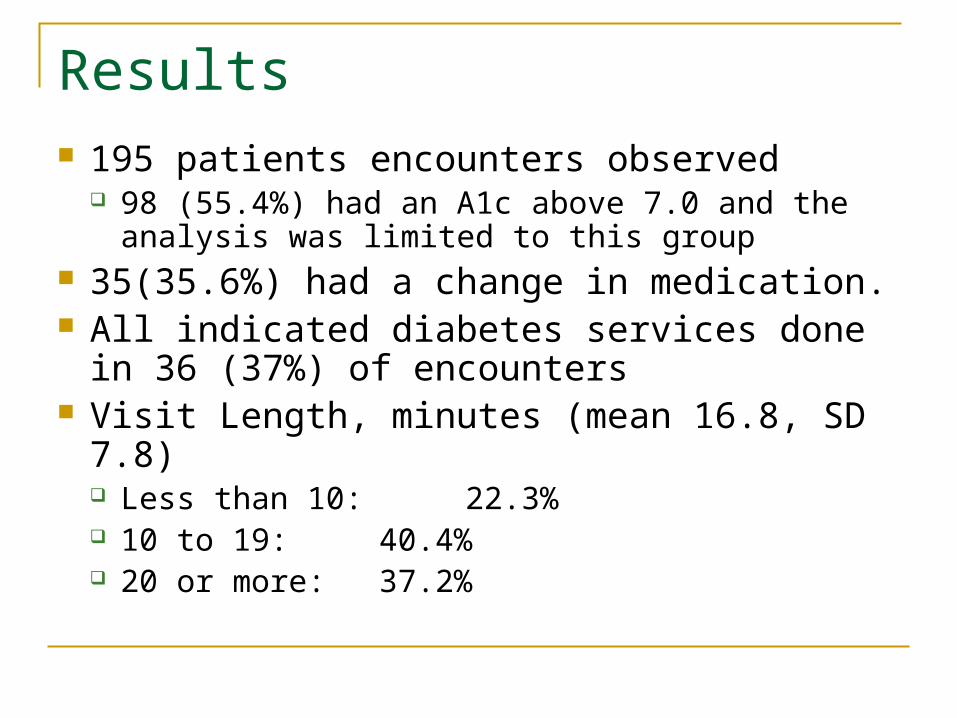
Results 195 patients encounters observed
98 (55.4%) had an A1c above 7.0 and the analysis was limited to this group
35(35.6%) had a change in medication. All indicated diabetes services done in 36 (37%)
of encounters Visit Length, minutes (mean 16.8, SD 7.8)
Less than 10: 22.3% 10 to 19: 40.4% 20 or more: 37.2%

Number Indicated and % Done
100 100
42.9 43.8 43.3
16.7
0
20
40
60
80
100
120
1 2 3 4 5 6
# Indicated services
% of visits all done
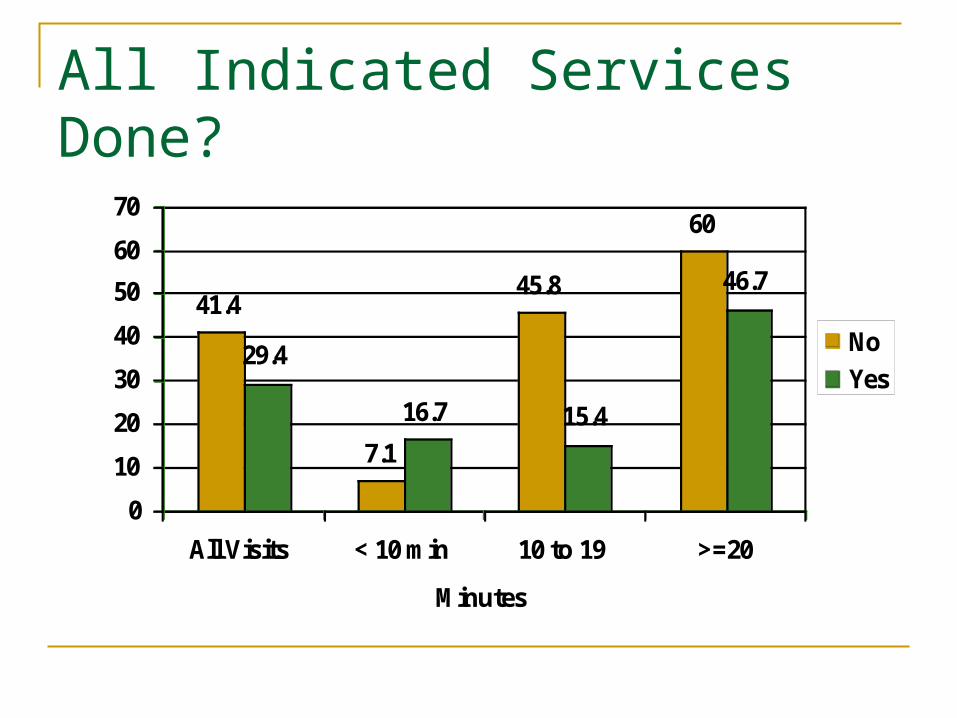
All Indicated Services Done?
41.4
7.1
45.8
60
29.4
16.7 15.4
46.7
0
10
20
30
40
50
60
70
All Visits < 10 min 10 to 19 >=20
Minutes
% change meds
No
Yes

Final Model (n=98)
OR (95% CI)
All Done 0.24 (0.08, 0.78)
Length of visit 1.11 (1.01, 1.21)
# patient questions 0.57 (0.38, 0.84)
MD topics 1.03 (.91, 1.16)
Recent A1c level 1.20 (.89, 1.62)
# Medications 1.26 (1.05, 1.51)
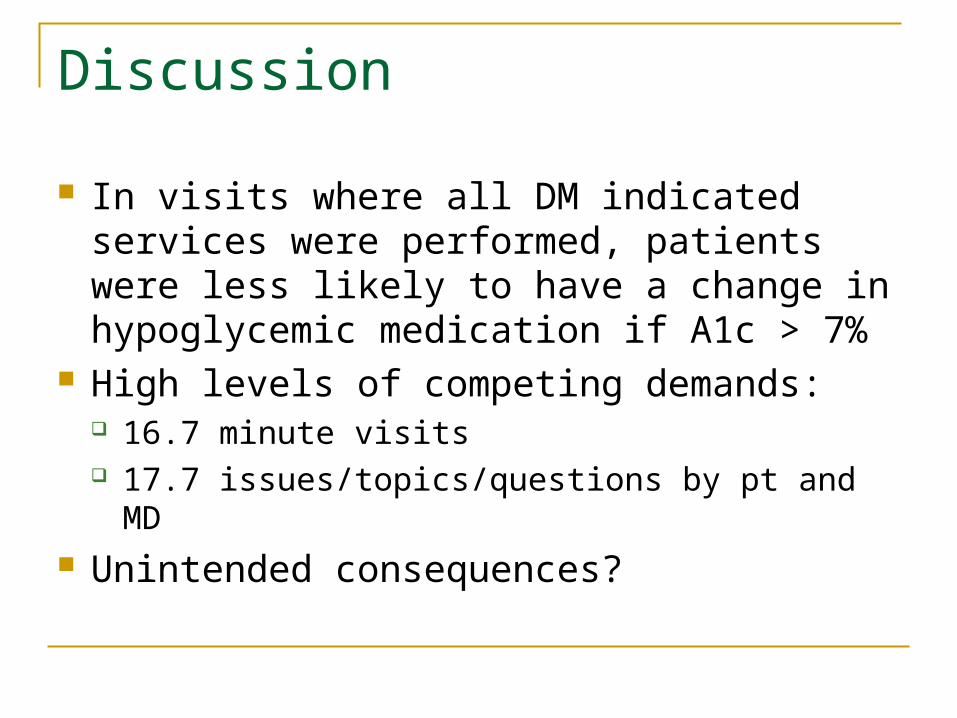
Discussion
In visits where all DM indicated services were performed, patients were less likely to have a change in hypoglycemic medication if A1c > 7%
High levels of competing demands: 16.7 minute visits 17.7 issues/topics/questions by pt and MD
Unintended consequences?
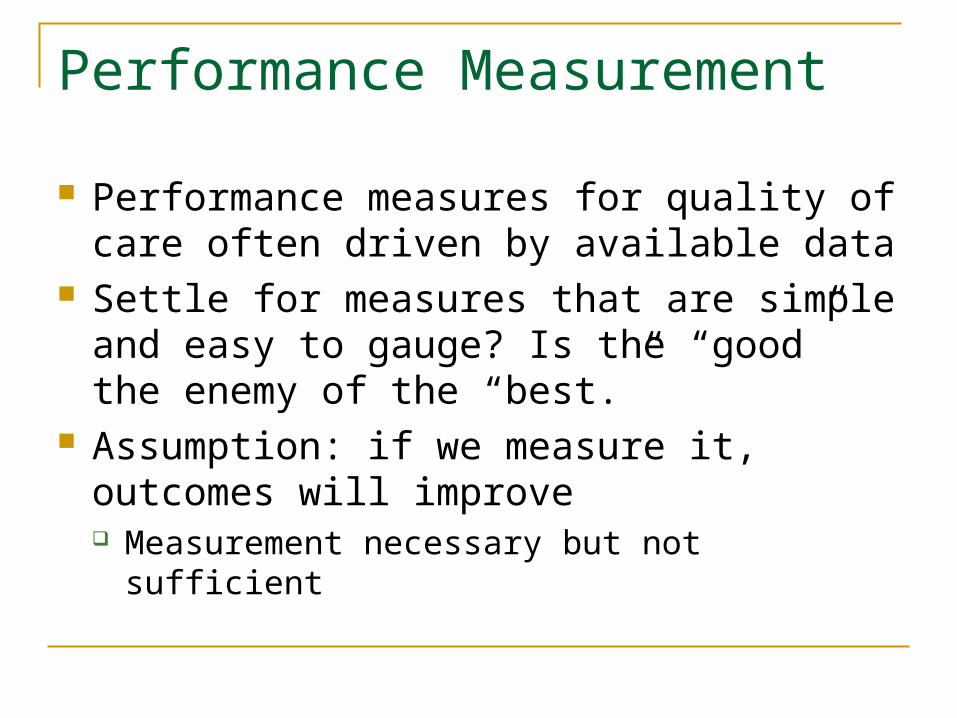
Performance Measurement
Performance measures for quality of care often driven by available data
Settle for measures that are simple and easy to gauge? Is the “good” the enemy of the “best.”
Assumption: if we measure it, outcomes will improve Measurement necessary but not sufficient
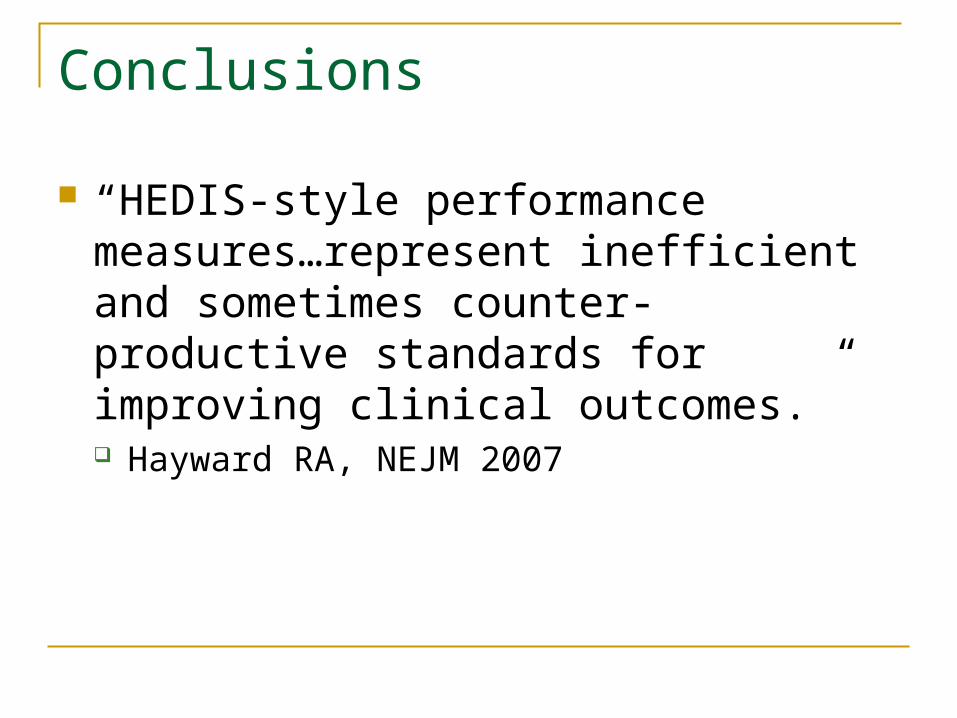
Conclusions
“HEDIS-style performance measures…represent inefficient and sometimes counter-productive standards for improving clinical outcomes.” Hayward RA, NEJM 2007

Discussion
Studies of strategies to “un-burden” the demands on primary care clinicians during patient encounters are needed Panel Size? Pharmacists led-clinics Group clinics Caution on adding additional demands on patients
for additional trips and visits and co-pays Patient-Centered Goal: prevent diabetes
complications by controlling A1c, BP, lipids

Acknowledgements
The research reported here was supported by: Agency for Healthcare Research and Quality (K08
HS013008-02), Kay Anderson, Project Officer Department of Veterans Affairs, Veterans Health
Administration, Health Services Research and Development Service. The views expressed in this article are those of the authors and do not necessarily represent the views of the Department of Veterans Affairs.
Members, South Texas Ambulatory Research Network (STARNet)
Contact: [email protected]
Related Documents