Are Banks Responsive to Exogenous Shocks to Credit Demand in Rural Economies? District – level Evidence from India Sankar De * and Siddharth Vij ** Present version: May 2013 Abstract In the existing literature on rural financial markets in emerging economies, there has been much discussion on local bilateral contracts and mutual insurance arrangements, which are inadequate to deal with the typically correlated risks that individuals and households face in the rural sector, and on the costly and inefficient strategies that they adopt to smooth their income or consumption. The discussions rest on the implicit premise that the financial intermediation system in the rural economy is inefficient in insuring the individual agents against idiosyncratic shocks to their income and consumption. However, the premise itself has remained largely unexamined. Using extensive district-level rainfall and bank credit data from India, we investigate whether the commercial banks respond positively to exogenous shocks to credit demand in the rural economy in the wake of droughts. We find that banks increase agricultural credit in drought-affected years compared to years of normal rainfall, but not personal loans or other types of non-agricultural credit. Further, agricultural credit increases in the intensive margin (average loan size per account), but not in the extensive margin (the number of accounts). We also find that private banks increase credit more than public-sector banks. Overall, our findings offer positive evidence on the role of commercial banks in rural financial markets and, in the process, contribute to several existing literatures. Keywords: bank credit; credit demand; credit supply; natural disasters JEL Classifications: G21, O2, Q14 * Shiv Nadar University, Gautam Budh Nagar, Pincode 203207, UP, INDIA **Stern School of Business, New York University Sankar De (corresponding author) can be reached at [email protected] . The authors thank the Indian Meteorological Department for rainfall data, and Sanjay Bose (Statistics and Information Management, Reserve Bank of India) and CD Srinivasan (RPCD, Reserve Bank of India) for special data help. They also thank the participants in the International Growth Centre conference (December 2011), the Asian Econometric Society conference (December 2012), and seminars at the Institute for Financial Management and Research, Indian School of Business, Shiv Nadar University, and the World Bank for their comments. The authors remain responsible for all errors in the paper.

Welcome message from author
This document is posted to help you gain knowledge. Please leave a comment to let me know what you think about it! Share it to your friends and learn new things together.
Transcript
Are Banks Responsive to Exogenous Shocks to Credit Demand in Rural Economies?
District – level Evidence from India
Sankar De* and Siddharth Vij**
Present version: May 2013
Abstract
In the existing literature on rural financial markets in emerging economies, there has been much discussion on local bilateral contracts and mutual insurance arrangements, which are inadequate to deal with the typically correlated risks that individuals and households face in the rural sector, and on the costly and inefficient strategies that they adopt to smooth their income or consumption. The discussions rest on the implicit premise that the financial intermediation system in the rural economy is inefficient in insuring the individual agents against idiosyncratic shocks to their income and consumption. However, the premise itself has remained largely unexamined. Using extensive district-level rainfall and bank credit data from India, we investigate whether the commercial banks respond positively to exogenous shocks to credit demand in the rural economy in the wake of droughts. We find that banks increase agricultural credit in drought-affected years compared to years of normal rainfall, but not personal loans or other types of non-agricultural credit. Further, agricultural credit increases in the intensive margin (average loan size per account), but not in the extensive margin (the number of accounts). We also find that private banks increase credit more than public-sector banks. Overall, our findings offer positive evidence on the role of commercial banks in rural financial markets and, in the process, contribute to several existing literatures. Keywords: bank credit; credit demand; credit supply; natural disasters
JEL Classifications: G21, O2, Q14
* Shiv Nadar University, Gautam Budh Nagar, Pincode 203207, UP, INDIA **Stern School of Business, New York University Sankar De (corresponding author) can be reached at [email protected]. The authors thank the Indian Meteorological Department for rainfall data, and Sanjay Bose (Statistics and Information Management, Reserve Bank of India) and CD Srinivasan (RPCD, Reserve Bank of India) for special data help. They also thank the participants in the International Growth Centre conference (December 2011), the Asian Econometric Society conference (December 2012), and seminars at the Institute for Financial Management and Research, Indian School of Business, Shiv Nadar University, and the World Bank for their comments. The authors remain responsible for all errors in the paper.

1
I. Introduction and motivation
How effectively does the financial intermediation system respond to idiosyncratic shocks
to income and consumption faced by individuals and households in the rural sector of an
emerging economy? In spite of the enormous importance of the topic, a survey of the existing
literature on rural financial markets finds few studies directly addressing the topic. By contrast,
local bilateral credit and insurance arrangements with landlords, moneylenders, family and
friends, or group-based mutual savings and insurance arrangements such as rotating savings and
credit associations (ROSCAs) have received much attention (see, for example, Coate and
Ravallion, 1993; La Ferrara 2003; Townsend 1995; Genicot and Ray, 2002). However, since the
risks that individuals and households face in a rural economy are typically correlated, as they
arise from common external shocks such as floods and famines, and the pool of savings are
usually limited, local markets often fail to offer adequate diversification opportunities and funds
at a reasonable cost. As a result, households and individuals in rural areas are left facing
considerable residual risk, with no option but to adopt costly and inefficient strategies to smooth
income or consumption. A number of such strategies have been discussed in the existing
literature, including scattering plots of cultivable land (McCloskey 1976; Townsend 1993) and
opting for a more diversified mix of crops and nonfarm production activities at the price of a
lower average return, adjustment of intertemporal labor supply in response to shocks (Kochar
1999), labor bonding (Srinivasan 1989; Genicot 2002), selling investment assets to smooth
consumption (Rosenzweig and Wolpin, 1993) and several other options. Not surprisingly, the
welfare implications of the strategies are typically negative.
While the discussions in the existing literature have been insightful and advanced our
understanding of the strategies, they rest on the implicit premise that risk diversification
opportunities offered by the existing system of financial intermediation are either very limited or
altogether missing in the rural economy. However, the premise itself has remained largely
unexamined (Conning and Udry, 2007, pp. 6-7)1. The present paper is an attempt to redress this
imbalance in the existing literature on rural financial markets. The paper examines the premise
1 “While these studies have advanced our understanding of local bilateral financial contracting and mutual insurance within poor communities, the study of financial intermediation has remained relatively neglected” (Conning and Udry, 2007)

2
with multiple tests conducted with extensive data of bank credit and rainfall at the district level
in India, and finds that the commercial banking system in the rural economy of India responds
positively to exogenous shocks to credit demand following natural disasters. This is the central
contribution of the present paper. In the process, the paper makes contributions to several other
literatures as well. The present paper is also the first systematic study of the relationship between
the two primary determinants of farm output in India and other emerging economies: rainfall and
supply of credit.
To motivate our approach, we present a simple model (see the appendix at the end of this
paper) that links the responsiveness of the commercial banks to exogenous credit demand shocks
to the bankers’ incentive structure. The model incorporates a standard feature of rural credit
cycle and a few typical features of bankers’ incentives that have been documented by other
researchers (Banerjee, Cole and Duflo, 2005; Banerjee and Duflo, 2008). The farmers seek bank
credit for their operating expenses (seeds, fertilizers etc.) during the crop planting season and, in
a year of normal rainfall, pay off their debt from the proceeds of the harvest. In a year of poor
rainfall, their ability to pay off their current debt is diminished, and some of them default. But
they still need a fresh loan for the next planting season. The bankers face a penalty if they
recognize a bad loan, and prefer to bailout the defaulting farmers and give them fresh loans. In
many cases, bailouts substitute the probability of a bigger future default for the certainty of a
smaller current default. But this is not so in the case of drought-driven defaults, because a year of
drought is typically followed by a year of normal rainfall2. The model offers several testable
predictions. We summarize them here, but discuss them more fully in section III of this paper.
First, the volume of outstanding agricultural credit extended by banks increases following a year
of poor rainfall, driven by those farmers who are unable to pay off their current loans but still get
fresh loans. Second, the credit increase occurs in the intensive margin (the average size of the
existing loans) rather than in the extensive margin (the number of loan accounts). The banks
typically have more information about the type of their current borrowers than they have about
new borrowers. Following a difficult year their information set is more refined, and they are
better able to target better farmers within their current pool of borrowers for more credit. Third,
2 In our sample, using one measure of drought, a district experiences a drought in two consecutive years in 15.3% cases, compared to average occurrence of drought in 11.3% district-years. By a second measure of drought, the corresponding numbers are 15.3% and 17.5%.

3
while bank managers with both public sector and private sector banks have an incentive to bail
out a farmer facing default and not recognize a non-performing loan, public sector bank
managers typically lack incentives of the other kind, namely to provide additional loans to
borrowers who are proven to be good and do not default on their current loans (Banerjee, Cole
and Duflo, 2005; Banerjee and Duflo, 2008). As a result, private banks are observed to respond
more positively than public banks to combined credit demand from farmers of all types.
We test the empirical implications of the model and find confirming evidence. We also
test a few other hypotheses suggested in the existing literature. The results indicate that banks
increase agricultural credit following drought-affected years compared to normal years. Further
examination suggests that the observed increase in outstanding credit consists primarily of fresh
loans, and not addition of overdue interests and other charges added to old loans. The increase in
agricultural credit represents an increase in the intensive margin, rather than an increase in
extensive margin. We also find that bank ownership makes a difference. Percentage increase in
agricultural lending appears to be significantly higher in the case of private banks than public
sector banks, though both types increase their lending, while special regional rural banks do not.
Interestingly, there is no significant difference in additional credit origination following a
drought between districts that are drought-prone and districts that are not.
Our setting is particularly suitable for the goals of the paper. Our panel data of droughts
and agricultural credit at the district level spans 640 districts spread over 28 states and 7 Union
Territories over a long period (1993 – 2010). The data offers two types of variation at the district
level which are important for our purpose: considerable cross-sectional variation between credit
observations and time-series variation between occurrences of droughts at the district level (see
section III of this paper for data description). We exploit the variation in the data to conduct
clean difference-in-difference tests to identify the causal impact of unanticipated changes in the
demand for farm credit due to exogenous changes in rainfall on the supply of farm credit. The
panel-setting enables us to include district fixed-effects in our regression models, ruling out
spurious correlations due to time-invariant cross-sectional variations. Similarly, year-fixed
effects control for yearly variation in macroeconomic and other factors that may affect supply of
agricultural credit. We also use state-year fixed effects to control for time-trends in credit supply
so that the regression coefficients reflect the relationships between droughts and agricultural
credit net of trends unrelated to droughts.
4
The present paper contributes to several other existing literatures. In standard economic
theory of financial intermediation the primary role of financial institutions is to channel capital
from depositors and other savers to uses with high marginal returns. Substantial empirical
evidence from emerging capital markets suggests that this role is performed poorly. Banerjee and
Duflo (2005) cite evidence that in many less developed countries borrowing interest rates are
often of the order of 60% or more, even though deposit rates are less than half as much, and
defaults are rare. The evidence suggests that the marginal product of capital in the firms paying
these rates may far exceed the opportunity cost of capital. In a separate paper, using a sample of
loan data from a public sector bank in India, Banerjee and Duflo (2008) use a government-
mandated directed lending program as a natural experiment to establish that many of the firms in
their sample were severely credit constrained, and that the marginal rate of return to capital was
very high for them. To explain their findings, the authors cite aversion to managerial risk-taking
in public sector banks. If a loan performs poorly, the managers face a penalty but, on the other
hand, a good loan decision does not bring them rewards. It should be noted that the above studies
focus on credit for small businesses, not rural credit. Conceivably, agricultural loans to farmers
in drought-affected areas are likely to have high marginal returns, or at least higher marginal
returns than during normal times. A drought typically depletes their savings, causing serious
capital scarcity,3. Our finding that banks in rural India increase agricultural credit following a
drought compared to non-drought years suggests that allocation of bank credit is not always sub-
optimal.
However, we note that our evidence is not inconsistent with inertia and lack of
managerial risk-taking in public sector banks as suggested by Banerjee and Duflo (2008), since
we do find evidence that the private banks respond more strongly than public banks to drought-
driven credit demand. In this respect, our results add new evidence to the literature comparing
the efficacy of Indian banks by ownership type (Gormley 2010)
Though this is not the main focus of this paper, our setting also provides a test of the joint
effect of electoral processes and drought on credit allocation. Public sector banks are known to
be vulnerable to political capture, and loans can be targeted in ways that many other government
expenditures, such as public works projects, cannot. Starting with Wright (1974), this literature 3 Rosenzweig and Wolpin (1993) have documented that farmers in India sell their main investment assets, such as bullocks, to smooth consumption during times of poor weather.

5
connects government-mandated provision of bank credit with electoral goals. In two parallel
papers, Cole (2009a) and Cole, Healy and Werker (2012) document political capture of public
institutions in India, including commercial banking and public distribution systems, resulting in
significant differences in provision of agricultural credit and government relief spending at the
district level between election and non-election years. In the present paper we use a larger panel
dataset, including more districts as well as more years, and investigate the joint effects of
elections and droughts on agricultural credit and test whether firm credit increases in election
years following a drought after controlling for the effect of the drought itself. For all bank groups
together, our difference-in-difference-in-difference tests do not find evidence of increase in
agricultural credit beyond what is typically observed following a drought-affected year.
However, when we examine credit extended by different bank groups, public sector banks
appear to increase agricultural credit in an economically significant manner, while other bank
groups do not. To this extent, our results are consistent with Cole (2009a). Since the motivation
and the enquiries of the present paper are different from the two papers, they may be viewed as
broadly complementary to our work.
A final contribution of this paper is that it presents the first systematic study of the
relationship between the two primary determinants of farm output in India: rainfall and supply of
credit. Empirical evidence regarding the relationship is important for our purpose. Agriculture
remains a major sector of the Indian economy. It accounts for about 19 per cent of the GDP. The
importance of the sector to India is due also partly to its role in job creation and poverty
alleviation in the countryside. About two-thirds of the Indian population depend on the sector for
their livelihood. In the existing academic literature as well as professional reports, there is
sufficient evidence of the importance of rainfall and, to a lesser extent, of rural credit to
agricultural output in India. However, there does not appear to be an existing empirical study that
links rainfall and rural credit. We discuss this point more fully in the next section.
Our paper proceeds in the following manner. Section II outlines the institutional context
for our study. Section III presents our hypotheses regarding agricultural credit supply in response
to droughts. Section IV describes the data used to test the hypotheses. Section V presents the
results of our basic tests concerning credit supply following a drought. Whether government
banks and private banks differ in their response to droughts is the topic of section VI. Section VII
presents results on the interaction of the election cycle with the rural credit cycle. Section VIII

6
presents the results of our investigations into the effectiveness of the central banks interventions
in rural credit markets in the wake of droughts. Section IX presets our conclusions.
II. The framework
A. Rainfall and credit supply
We have remarked above that rainfall and supply of credit are two key determinants of
agricultural output in India. There is substantial evidence in the existing academic literature as
well as professional reports and government policy papers that rainfall is an important
determinant of Indian farm output. Using rainfall and crop yield data for a panel of 272 districts
over 32 years, Cole et al (2009) report a strong positive relationship between rainfall and
agricultural output. On an average, one standard deviation increase in rainfall results in a 3% -
4% increase in the value of output in their sample. There is also wide recognition of the
importance of rainfall to agriculture and national income in different agencies of the government,
policy forums, political parties, and think tanks. The sentiment extends to the popular press. The
Financial Express, a major financial newspaper in India, carried the following item on August
24, 2009:
“Approximately 25% of the country is affected by drought and agricultural output is set
to plummet this year. Lower income for rural workers will in turn be a huge drag on private
consumption, an important driver of India's economic expansion.” The drought in question
affected 25% of the country and was associated with 29% below normal rainfall during the busy
Kharif season (June - September) in 2009.
The importance of agricultural credit, the other key determinant of farm output in India,
is inherently tied to the heavy dependence of agriculture on rainfall. With the intermittent failure
of the monsoons and other vicissitudes, farming in India has traditionally been a high-risk
activity, resulting in high cost of credit and pervasive rural indebtedness (Mohan, 2006). We
have observed before that ours is the first systematic study to link supply of agricultural credit to
poor rainfall. However, from time to time the financial press and other media outlets in India
report isolated instances of the effect of poor rainfall on bank credit availability. The same issue
of the Financial Express cited above carried the following report:

7
“Taking special measures on behalf of the banking industry, Bank of Maharashtra
chairman and managing director Allen CA Pareira said the bank is working on rescheduling
agricultural loans for the affected farmers by converting the short-term loans to long-term ones.
Normally the bank provides crop loans with the repayment period of a year only. However, we
are trying to reschedule those loans so that farmers can repay them over a period of 3-5 years,
he added.” The same newspaper article also reported that the Bank of India, a big public sector
bank, had planned to disburse Rs. 203 billion in farm loans instead of the usual Rs. 165 billion in
the year.
B. Government initiatives
Given the importance of agricultural credit to farming in India, development of cost-
effective rural credit systems has been a top priority of the Indian government for over a century.
Over the years, it has set up multiple committees/working groups/task forces to recommend
solutions4. The solutions have been broadly of three types: supply of agricultural credit through
nationalized public-sector banks, requiring both public and private banks to extend at least a
certain percentage of credit to agriculture and small-scale industry under a national priority
sector lending scheme, and requiring all commercial banks to open four branches in an unbanked
location for every new branch opened in a location with an existing bank. Since 1985,
commercial banks have been required to lend a fraction of their total credit to the “priority
sectors” defined by the government. Currently, the figure is 40% for domestic banks and 32% for
foreign banks5. Of the priority sector lending targets for domestic banks, almost half (18% of
total bank credit) is required to be directed towards agriculture. Foreign banks do not have
specific targets for agriculture, presumably due to their minimal presence in rural areas.
There is documented evidence that the increase in rural credit supply owing to the
redistributive nature of branch expansion has led to a significant decline in poverty among
India’s rural population (see Burgess and Pande, 2005; Burgess, Pande, and Wong, 2005).
However, there have been few systematic studies of the effect of additional credit on farm output
4 The list of recent committees include “The High-level Committee on Agricultural Credit through Commercial Banks” (1998), “Task Force to Study the Functions of Cooperative Credit System and to Suggest Measures for its Strengthening” (1999), “Expert Committee on Rural Credit” (2001), and “The Working Group to Suggest Amendments in the Regional Rural Banks Act, 1976” (2002). 5 Master Circular-Lending to Priority Sector, Reserve Bank of India, July 1, 2011

8
in India, except for Binswagner and Khandker (1992). They find that India's government-led
approach to agricultural credit paid off in non-farm growth, employment, and rural wages, but
the direct impact of expanded credit on agricultural output has been modest. However, in
government reports, policy papers, and media reports a positive association between farm output
and credit is often assumed.
C. Bank ownership in India
India has witnessed two waves of bank nationalization, first in 1969 and subsequently in
1980. On both occasions private banks, 14 in 1969 and 6 in 1980, with an all-India deposit base
above a given threshold were compulsorily nationalized. The rationale for nationalization was
that public banks could better serve rural and underbanked regions; they would promote an
equitable distribution of credit, and would better serve sensitive sectors of the economy primarily
agriculture. Cole (2009b) finds that the nationalization did achieve development lending goals
but had no impact on the real economy.
The arguments against nationalization focus on the soft incentives given to bank loan
officers to extend loans to underbanked sectors and regions as well as their susceptibility to
political capture. Using a sample of bank loans from a large public sector bank, Banerjee and
Duflo (2008) finds evidence of the former. Bank officers are reluctant to lend to the optimal
level, since the benefits for them from extending new loans are outweighed by the costs of
potential corruption charges if the loans go bad. Cole (2009a) finds evidence that Indian public
sector banks are susceptible to political capture. Agricultural credit goes through cycles where
the peak occurs just before state elections.
As of March 31, 2010 (the date on which our sample ends), 27 public sector banks, 22
domestic private banks, and 34 foreign banks were operating in India. Regional rural banks
(RRBs), a special category of banks set up in 1975 with the stated purpose of providing
sufficient credit to agriculture and other sectors important to the rural economy, numbered 82 in
total (RBI 2011). The Central Government owns 50% of each RRB, the relevant State
Government owns 15%, and the remaining 35% is owned by a commercial bank which is known
as the sponsor bank. Since our primary interest in this paper is in agricultural lending, it is
instructive to note the share of agricultural credit originating from different bank groups. The
share of foreign banks in direct agricultural credit is negligible since they do not have a

9
significant rural network, nor do they face a mandatory lending requirement to agriculture
unlike other bank groups. Of all the direct agricultural credit outstanding in India at the end of
the 2009-2010 fiscal year, 73.1% came from public sector banks. RRBs had the next highest
share with 14.4% while domestic private banks contributed 12.4%. The above figures show that
banking in India, particularly rural India, is still heavily dominated by government-owned banks.
D. Bank regulator’s initiatives
In addition to various attempts by the government to improve the rural credit supply
situation in general, the central bank of India which also doubles up as the regulator of the
banking sector has taken steps to exhort commercial banks to provide loan relief measures to the
farmers following natural calamities. The Rural Planning and Credit Department (RPCD) of the
Reserve Bank of India (RBI) issues annual guidelines to the commercial banks on loan relief
measures to be provided in areas affected by natural calamities. The guidelines are issued in the
form of an official circular. From time to time the existing guidelines are revised. Starting in
1984, five such major revisions have taken place (in 84, 91, 93, 98 and 2005).
The guidelines specify droughts, floods, cyclones, tidal waves and other similar
calamities as natural calamities. Though the guidelines call on the banks to grant fresh
agricultural loans as well as revise the terms of the existing loans, they typically leave the actual
decisions, including the quantum of fresh loans and the revised terms for the old loans, to the
discretion of the banks themselves. For the personal or consumption loans, the guidelines usually
suggest a target. For example, the 2005 circular suggests that the banks may extend general
consumption loans up to INR 1,000 to eligible persons in calamity-affected areas. The amount
suggested has increased from circular to circular. But here too the guidelines offer only
exhortations and fall short of imposing any mandatory requirements on the banks.
Our investigations reported in section VIII below indicate that the periodic revisions of
the guidelines by the central bank have had little impact on agricultural credit supply following a
drought in the countryside, though personal loans appear to have gone up. If the circulars
influenced the banks’ decision to extend more agricultural credit, then we would observe an
increase in rural credit in the years following the issue of a new set of guidelines compared to the
previous years. We investigate this issue with the 1998 and 2005 circulars, and find no such
increase.

10
III. Hypotheses
The central question of this paper is the responsiveness of the commercial banks in India
to exogenous credit demand shocks caused by poor rainfall. Our focus on credit from
commercial banks to the exclusion of all other sources of rural credit does not result in loss of
generality, because commercial banks are by far the most dominant source of formal credit to
rural households (Basu and Srivastava, 2005)6.
Given our topic, identification of demand and supply of credit is of paramount
importance. All observed loan amounts are equilibrium values, equating and supply. How do
we ascertain that the observed credit increases, if any, are supply-driven, and not demand-
driven? We proceed on the reasonable and conservative assumption that rural credit demand
exceeds, or at least matches, credit supply in a difficult year when personal savings are likely be
depleted. In other words, we rule out the possibility of excess supply which would imply that the
banks in our sample were inclined to offer more credit than demanded. If they were indeed so
inclined, the test results would understate the true effects of increased demand on supply
availability, and would be biased against our hypothesis.
As we have mentioned above, in a year of poor rainfall, the ability of the average farmer
to pay off their current agricultural debt is diminished, but they still need a fresh loan for the next
planting season. In our model, presented in the appendix, there are two types of farmers in a
district: good and bad. The former achieve higher productivity per unit of land in all states of
nature. In a drought-affected year, the farmers that are observed to pay off their current loans are
all good type. They are given a new loan by their bankers. As a result, the level of their
outstanding credit remains the same as before. The farmers that are unable to pay off their loans
include the remaining good type farmers and all bad type. The bankers face a penalty if they
recognize a bad loan, and therefore prefer to bailout the farmers that default on their current
loans and give them fresh loans too, increasing their outstanding credit. As a result, total
outstanding credit for all farmers together is observed to increase. In many cases, bailouts
substitute a probability of a bigger future default for the certainty of a smaller current default.
But it is not so in the case of drought-driven defaults, because a year of drought is typically
6 Using data from the Rural Finance Access Survey (RFAS) 2003 conducted by The World Bank, they note that commercial banks are the source for more than 80% of the formal credit outstanding in rural areas.

11
followed by a year of normal rainfall. In our sample, given that a district had a drought in year t,
in 15.3% cases it experiences a drought in year t+1 as well. In the whole sample, a drought
occurs in 11% of all district-years. By an alternative measure of drought, if a district has a
drought in year t, in 16.3% cases it again has a drought in year t+1. In the whole sample, drought
occurs in 17.5% of all district-years.
From the discussion above, our model offers the following testable prediction and a
difference-in-difference test:
H1: The amount of agricultural credit outstanding in a district is higher following a
drought-affected year compared to other districts not affected by the drought and also compared
to other years without a drought.
Our data of bank loans are obtained from Basic Statistical Returns (BSR) compiled
annually by the Reserve Bank of India (RBI). The data includes outstanding bank credit for each
occupation in each district in a given year, but not flow of credit in the year. An observed
increase in outstanding credit could arise from one or both of two factors: (a) pro-borrower
action taken by the banks, such as sanction of new loans and (b) acceptance of non-payment of
interest and other dues on old loans in default which are added to the old loans until the loans are
treated as non-performing and written off. The first factor implies that the banks actively help out
rural borrowers in especially difficult times, whereas the second factor indicates that they
passively evergreen existing loans. Does the second factor contribute significantly to observed
increases in credit, if any? Lacking direct data on the two sources of credit, we are able to
investigate this issue indirectly. If outstanding agricultural credit increases primarily because of
late payment or non-payment of debt service charges in drought-affected years, other types of
bank credit, especially personal loans, are also likely to register an increase in the same years.
Actually, in their case the observed increase is likely to be higher. It should be noted that, unlike
agricultural credit, personal loans are not included in priority sector loans and carry a
considerably higher rate of interest than the controlled rates on priority sector loans. If
outstanding personal loans are not observed to increase, then one could reasonably infer that the
second source does not contribute significantly to the level of outstanding agricultural credit.

12
H2: The increase in agricultural credit outstanding following a drought-affected year is
due to new loans rather than to non-payment or delayed payment of debt service charges on
existing loans.
There is also another interesting way to test if late payment or non-payment of debt
service charges causes the rise, if any, in agricultural credit outstanding following a drought. If
this were indeed the case, then in districts which experience frequent droughts we would ex-ante
expect bank managers not to renew loans from farmers which carry the risk of non-payment. In
other words, the observed increase in agricultural credit following a drought would be
proportionately less in a drought-prone district than in other districts. On the other hand, if the
increase in outstanding agricultural credit in drought-prone districts proves to be similar to other
districts, it would suggest that non-payment of debt service charges is not pushing up the volume
of outstanding agricultural credit.
H3: Following a drought, drought-prone districts experience a similar increase in
agricultural credit than districts that are not drought-prone.
Our model predicts that the credit increase will occur in the intensive margin (the average
size of the existing loans) rather than in the extensive margin (the number of loan accounts). The
prediction follows from the observation that the banks typically have more information about the
type of their current borrowers than about new borrowers. Following a difficult year their
information set is more refined, and they are better able to target better farmers within their
current pool of borrowers for more credit. The information gain enables them to make better
credit decisions.
H4: The credit increase occurs in the intensive margin (the average size of the existing
loans) rather than in the extensive margin (the number of loan accounts).
We have noted in the previous section that the rationale offered for bank nationalization
in India included the argument that public banks would better serve rural and underbanked
regions and sensitive sectors of the economy, primarily agriculture. We have also noted that the
government as well as the RBI periodically exhorts the banks to extend credit during droughts.
The ownership pattern of public banks would seem to make them more susceptible to such
interventions. Given the rationale behind bank nationalization, ours is an ideal setting to test

13
whether nationalized banks serve the rural economy adequately, and whether private banks lag
behind public banks in this regard. This leads to the fifth hypothesis of the paper:
H5: The volume of agricultural credit extended by public sector banks in a district
following a drought exceeds the corresponding credit extended by private banks.
A prediction of our model provides the alternative hypothesis to H5. As we have
discussed above, bank managers with both public sector and private sector banks have an
incentive to bail out a farmer facing default and not recognize a non-performing loan. However,
public sector bank managers typically lack proper incentives to provide additional loans to
borrowers who are proven to be good and do not default on their current loans. Based on a
sample of bank loans from a large public sector bank, Banerjee, Cole and Duflo (2005) argue
that public sector banks in India are extremely inertia-prone, and attribute this to lack of proper
incentives for public sector bank loan officers7. They face the threat of vigilance action if loans
approved by them go bad, but are not rewarded commensurately if the loans perform well. We
extend this argument and claim that private sector banks, by contrast, are more inclined to
provide additional credit to good farmers. As a result, private banks are observed to respond
more positively than public banks to combined credit demand from farmers of all types.
As we have remarked in the previous section of this paper, public sector banks are
presumed to be vulnerable to political capture, and their loans can be controlled in ways that
many other government expenditures, such as construction projects, cannot. This literature links
government-controlled provision of bank credit to electoral goals. The Indian political system
provides for exogenous election cycles which are different for different states. This variation can
be exploited to test for joint effects of elections and droughts on agricultural credit supply. If
agricultural credit in India, which should be allocated on commercial merit, is observed to
increase in a district in an election year immediately following a drought in that district,
compared to other drought-affected years, after controlling for the effect of the drought itself, the
evidence would lend support to the hypothesis of political control of credit extended by public
sector banks. The investigation suggests a difference-in-difference-in-difference test of the
following hypothesis:
7 The sample of bank loans in Banerjee, Cole and Duflo (2005) does not include agricultural loans.

14
H6: Agricultural credit supply is higher in a district when a drought precedes a state
election than when it does not.
IV. Data
The geographic unit in our analysis is the administrative district, similar to a county in the
USA. According to the 2011 Census, India has 640 districts spread across 28 states and 7 Union
Territories. The largest state, Uttar Pradesh, has 72 districts while the state of Goa has only 2.
A. Bank Credit
Our data on bank credit comes from the Reserve Bank of India’s annual publication
‘Basic Statistical Returns of Scheduled Commercial Banks (BSR)’. The publication provides data
on the amount of credit outstanding, occupation-wise, at the end of the fiscal year (March 31 in
the case of India) in each district, as well as the number of accounts for which credit is
outstanding. We have this data from 1993-94 to 2009-10. The data for agricultural lending is
divided into two types: direct and indirect. Loans given to individual farmers come under the
purview of direct agricultural finance. Indirect agricultural finance covers loans given to
corporate, food and agro-processing units as well as loans given to non-banking financial
institutions for onward lending to farmers. Since our focus is on the effect drought has on
farmers’ demand for credit, and the response of the banks to this demand, we use the data for
direct agricultural finance in our tests.
Table 1A provides the summary statistics of the bank credit variables in our sample.
Almost 23% of the total credit outstanding for the median district-year observation is direct
agricultural credit. There are almost 30,000 accounts with direct agricultural credit outstanding in
the median district-year. These accounts tend to be small, with the median account having an
outstanding amount of INR 24,500 (approximately USD 490 at the current exchange rates)8.
Table 1A here
B. Rainfall
Our data on rainfall and drought comes from the India Meteorological Department
(IMD). We use the Standardized Precipitation Index (SPI) as our primary measure of drought
conditions. The SPI is a drought index developed in McKee, Doesken and Kleist (1993). It is 8 In Nov 2011, the exchange rate was approximately 1 USD = 50 INR

15
based on the probability of observing a given amount of rainfall in a particular year. The SPI for
a year registering the median rainfall is zero. The deviation from the median is standardized to
arrive at the index value for a particular year. We obtain SPI data for Indian districts from a
study by Pai, Sridhar, Guhathakurta and Hatwar (2010). It computes the SPI for India’s main
monsoon season, namely the Southwest monsoon season, for 458 districts for the period 1901-
2003. The Southwest monsoon season lasts from June to September. As mentioned in Pai et al
(2010), if the SPI measure for a district in a given year is less than -1, the district is said to be
suffering from a moderate drought. We code all such instances as drought observations for our
sample of SPI indices (1993 -2003).
We also construct an alternative measure of drought, using the percentage of normal (PN)
method. In this method, the rainfall in a particular year is compared to the district’s long period
average (LPA) rainfall. If the rainfall is less than a certain percentage of the LPA, the district is
said to be suffering from a drought. Pai et al (2010) suggests 75% of LPA as the cut-off below
which a district is considered to experience a moderate drought. This is the yardstick we use9.
Annual rainfall data at the district level from 1993 onwards in obtained from the National Data
Centre (NDC) at the IMD. We obtain data on the LPA from the IndiaStat database. IndiaStat
collects its data from different sources. For many of the districts, two or three different values of
the LPA are available. We only calculate the PN measure for those districts for which we have a
consensus LPA or those where the difference between the highest and lowest estimate of LPA is
not more than 5% of the lowest estimate10. This exercise reduces the number of districts for
which we are able to calculate PN measures to 334. We have no reason to believe that the
exercise introduces non-randomness into our districts data.
The summary statistics of the weather variables are reported in Table 1B. Since our bank
credit data starts from 1993-94, we report the weather variables from 1993-94. For the SPI
measure, the median value is, as expected, close to 0. For 11% of the observations the value of
SPI is less than -1, indicating drought.
Table 1B here
9 We also run our tests with a threshold of 70% of LPA and 80% of LPA. Results do not change significantly. 10 As a robustness check, we also drop those districts where the difference between the highest and lowest estimate of LPA is more than 2.5%. Results are largely similar.

16
Over the period 1993-2010, the median district-year rainfall is 1014mm with a standard
deviation of 838mm. The median district-year observation deviates from the LPA by only 0.3%.
For 17.5% of the observations, the rainfall is less than 75% of the LPA, implying drought
conditions. Among our two measures, PN reports drought with a significantly higher frequency
than SPI. One potential reason, apart from difference in measurement methods, is the fact that
the data periods are different. If we look only at those years for which we have both SPI and PN
values, we find that drought incidence using PN reduces to 16.3%. However, this is still
significantly higher than the drought incidence using SPI. Figure 1 below plots drought
frequency using both measures.
Figure 1 here
C. Other data
In order to test the third hypothesis discussed above, it is necessary to identify the
drought-prone districts in India. We obtained a list of 99 drought-prone districts from the
Compendium of Environment Statistics, 2002, released by the Central Statistical Organization,
Government of India11. Figure 2 below maps the distribution of the drought-prone districts. Not
surprisingly, the drought-prone districts are concentrated in the arid regions of western and
north-western India as well as the Deccan plateau. However, the 99 drought-prone districts are
spread over as many as 15 states.
Figure 2 here
The last hypothesis discussed above focuses on the role of election cycles in bank credit
disbursement. To test the hypothesis we focus on elections to state legislative assemblies since
national elections would get subsumed by year fixed effects in our regression models. Each
legislative assembly has a term of five years, though elections might be held earlier if the
government loses its majority in the assembly. The states hold elections in different years and
months. Our data on election dates comes from the website of the Election Commission of India,
a constitutional authority responsible for the conduct of all national and state elections.
We also test whether government response to droughts interacts meaningfully with the
response of the banking system. Real per capita non-plan expenditure of state governments on
11 The IndiaStat database also reports the list.

17
relief on account of natural calamities is our measure of government response. This proxy has
been used in other studies that examine government responsiveness to natural calamities in India,
such as Besley and Burgess (2002) and Cole, Healy and Werker (2012). The calamities include
droughts, floods, cyclones, earthquakes etc. The relief amount separately for droughts is not
available. The nominal amounts of expenditure are obtained from the RBI’s Handbook of State
Government Finances12. We calculate state GDP deflator using state GDP data from the Central
Statistical Organization. State-wise population is obtained from the Census of India website.
We also attempted to collect data on state governments’ expenditure on debt relief for
farmers. It is included in what the state governments report in their budget as their expenditure
on social security and welfare13. We sought the data on debt relief for farmers from the
governments of all the 28 states and 7 union territories in India, using petitions under the Right to
Information (RTI) Act, 2005. While an encouraging number of state governments (23 out of 28)
and 2 union territory governments responded to our queries, several of the responses did not
provide the information we sought. However, none of the governments acknowledged having
provided debt relief for farmers within our sample period. The responses were uniform in this
respect.
V. Results: Agricultural Credit and Drought
We present our results in three parts. This section outlines the empirical strategy we use
and present the results of the tests of the first four hypotheses. It may be recalled that the
hypotheses verify in different ways the response of the commercial banking system to drought-
induced shocks to demand for credit of the rural households in Indian districts. In the next two
sections we present our results whether bank ownership and political economy of banking make
a significant difference to the banks’ response.
A. Effect of drought on credit in a district
12 The state governments in India follow a standard budget format. They report their expenditure on relief for calamities under “major” budget head 2245. The RBI compiles the data for all states. 13 The state governments report their expenditure on social security and welfare under the “sub-major” budget head 2235.

18
The most direct way to test our first hypothesis is to compare the amount of direct
agricultural credit outstanding at the end of a year following a drought with other years.
Formally, we test this by estimating the following equation:
AgriCreditdt = α + γd + νt + δDroughtdt-1 + βBankCreditdt + εdt (1)
Depending on the specification, AgriCreditdt in equation (1) is the volume of direct
agricultural credit outstanding, or the ratio of direct agricultural credit to total bank credit
outstanding, in district d at the end of the fiscal year t. The RBI defines the fiscal year t as the
period from April 1 of calendar year t-1 to March 31 of year t. All our bank credit data are
available for fiscal years, since BSR data compiled by the RBI is our main source for this data.
However, all our rainfall data are available for calendar years. Since the main rainfall season is
the southwest monsoon season which lasts from June to September, poor rainfall in calendar year
t-1 is most relevant to agricultural credit at the end of fiscal year t.
The regression model in (1) is the basic regression model of our study. It is used with
appropriate modifications in all other tests of this paper. Note that it is an economical model. The
sole independent variable of interest is Droughtt-1, a dummy taking the value 1 in drought-
affected years and 0 in other years. The amount of rainfall in a particular district in a given year
is an exogenous variable, and orthogonal to other district-wide factors that may affect credit
supply. On running regressions of the drought dummy variables on both district and year fixed
effects, we find that only a small fraction of the variation in the drought variable is explained by
either set of fixed effects14. This suggests that there is significant variation in rainfall deficiency
among districts in a particular year, as well as in a given district over time. These characteristics
of Droughtt-1 variable imply that the co-efficient δ is a reliable difference in difference (DID)
estimate of the effect of drought on agricultural credit. BankCreditdt is the total amount of bank
credit outstanding less direct agricultural credit in district d at the end of fiscal year t. We include
this variable as a proxy for the development of the banking industry in the district. It also
controls for the district’s economic development in a particular year. The regression model
includes district fixed effects, γd, to control for time-invariant cross-sectional variations in credit
supply. Similarly, year fixed effects control for annual nation-wide macroeconomic fluctuations
and other factors that may affect credit supply. In alternate specifications in place of year fixed
14 In the case of annual rainfall, the variation explained by district fixed effects is quite large. However, year fixed effects again explains only a small fraction.

19
effects we include region year fixed effects to control for annual regional fluctuations in credit
supply unrelated to weather. Throughout, we cluster standard errors at the district level, and
winsorize all data at the 1% level to eliminate outliers and data discrepancies.
Table 2 reports the pooled OLS estimates of equation 1. In Panel A, the dependent
variable is the logged value of agricultural credit outstanding at the end of the fiscal year. In
Panel B, the dependent variable is the ratio of the direct agricultural credit outstanding to the
total bank credit outstanding. In this table, and all subsequent tables, we report results with both
measures of drought: SPI based as well as PN based. As we have discussed before, the two
measures are estimated using somewhat different methods. To control for the difference in
measurement techniques, we construct a stricter measure of drought and report results for this
measure. We create a dummy variable that takes value 1 if and only if both SPI and PN measures
of drought are available for the district-year observation and both of them indicate that the
district suffered a drought in that year. The variable is 0 if both measures are available and if at
least one of them suggests that the district did not suffer a drought. The number of district-year
observations applicable to the stricter measure of drought is of course less than when either of
the two measures is used. All specifications include the logged value of total bank credit
outstanding as a control, and district and year or region-year fixed effects. Even numbered
columns include region-year fixed effects.
Table 2 here
The results in panel A of table 2 provide clear evidence supporting our first hypothesis.
Agricultural credit outstanding is higher following a drought. Under both SPI (column 1 and 2)
and PN based (column 3 and 4) measures of drought, we find that δ is positive and strongly
significant. The magnitude of the difference differs somewhat between the two measures of
drought. Under SPI, the credit outstanding in drought-affected years is higher by about 4 – 5
percent (significant at 1% level), while it is 3% - 4% higher and significant at 5% level in the
case of the PN measure15. The results using the stricter measure of drought as our independent
variable of interest are reported in columns 5 and 6 of the table. They not only confirm our
earlier results that the effect of drought on agricultural credit outstanding is positive and
significant, the reported coefficients are also of a much larger magnitude (8 – 11 percent,
15 Since the dependent variable is logged, the co-efficient on Drought can be approximated as the percentage effect

20
significant at 5% level). District-years where both measures of drought agree appear to signal a
more severe drought.
With the ratio of agricultural to bank credit outstanding as the dependent variable (Panel
B), the point estimates are positive and significant in all specifications, and very similar to the
estimates using the logged value of agricultural credit: about 4% for the SPI-based measure
(significant at 1% level), 3% for the PN-based measure (significant at 5% level), and 6% – 8%
when both measures indicate a drought (again significant at 5% level).
A feature of these, and all subsequent results, is the very high value of adjusted R-square
of the regressions (well over 0.9). The high value is driven, not surprisingly, by the inclusion of
fixed effects. District fixed effects alone explain almost 75% of the variation in agricultural
credit. Year fixed effects alone explain another 16%. The number of observations for regressions
with SPI-measure and PN-measure of droughts are virtually the same (3267 and 3308). As we
have remarked above, the SPI measures are available for more districts but for a shorter time
period than PN measures. For the tests with both measures, the number of observations decline
to 1394.
B. Effect in neighboring districts
To further confirm that the results we obtain are due to the effect of drought alone and
not some other factor, we conduct a falsification test. We look at neighboring districts of
drought-hit districts – the districts that share a physical border with the drought-hit districts - but
do not experience a drought themselves. We run the same regression equation as equation (1),
except that the dependent variable in this test is the average agricultural credit outstanding in
neighboring districts of district d in fiscal year t16. We only include neighboring districts that did
not experience a drought in calendar year t-1. The estimate of the co-efficient δ in this case
indicates the percentage increase in agricultural credit outstanding in neighboring districts when
district d is drought-hit compared to when it is not. Farming in India is a local activity, and with
a widespread network of bank branches in the country17, it is reasonable to expect the rural
households to seek bank credit in the districts where they do the farming. We hypothesize that δ
16 We also do the test using the total agricultural credit in neighboring districts. The results are similar. 17 Basu and Srivastava (2005) notes that the average population as well as area served per bank branch in India compares favorably with other developing countries.

21
is insignificant, since the effect of the drought on district-level credit supply should be restricted
to the district itself.
The results in table 3 confirm our hypothesis. Using the SPI measure (columns 1 and 2)
as well as the combined measure (columns 5 and 6), the effect of a drought in a district on the
agricultural credit in neighboring districts not affected by the drought is insignificant.
Interestingly, when the PN measure is used, the effect is negative and significant. The average
agricultural credit in neighboring districts comes down by almost 5% (significant at 1 – 5 percent
level). This may indicate that the banks transfer loanable funds to drought-affected districts.
Importantly, in no case is the effect positive and significant. Districts affected by a drought
witness an increase in agricultural credit, but no such increase in observed in neighboring
districts. This finding provides confirmation that the results reported in table 2 above are due to
poor rainfall itself and not due to some unobserved time-varying regional/ geographic factors.
Table 3 here
C. Dynamics of bank response
After having established that a drought has a statistically significant effect on agricultural
credit supply at the district level, we examine the dynamics of the effect18, and test whether the
effect is temporary or persists over time. In particular, if a drought is a truly exogenous event,
then its effect should not be anticipated in advance. To test the dynamics, we estimate the
following regression equation
AgriCreddt = α + γd + νt + δ1Ddt-1-6+ δ2Ddt-1
-5 + …+δ11Ddt-1
5 + δ12Ddt-1
6 + βBankCreddt + εdt (2)
As in equation (1) before, AgriCreditdt is agricultural credit outstanding in district d at the
end of the fiscal year t. The difference between equation (1) above and the present equation is
that we drop the Droughtt-1 dummy variable and instead introduce a series of dummy variables
where D-i equals 1 for a district in the ith year before a drought and 0 otherwise, while Di equals 1
in the ith year after a drought and 0 otherwise. Since we exclude the dummy for the year of the
drought, we are able to estimate the dynamics relative to that year. As before, we include district
fixed effects, year fixed effects or region-year fixed effects as well as the log of bank credit as a
control, and cluster standard errors at the district level. The dummies at the end points, Ddt-1-6 and
18 The analysis in this sub-section is in the spirit of the relevant section in Beck, Levine and Levkov (2010)

22
Ddt-16, refer to 6 years or further away from the drought year. Excessive variance in rainfalls in
the end zones may make the estimates for those points less precise.
One complication in studying the dynamics is that a particular district might suffer
multiple droughts over our sample period. If the droughts are close enough, the dynamic effects
of one drought may interfere with the dynamics of another. For instance, according to our SPI
measure, the district of Sambalpur in the eastern state of Orissa suffered a drought in 1998 and
another one in 2002. The dynamic effects of both droughts will impinge on agricultural credit in
the district in 2000. Disentangling the effect of one from the other is problematic. To get around
this issue, we conduct the analysis only for those districts which experienced a single drought in
our entire sample period19. This leaves us with 42 districts using the SPI-based measure of
drought, and 61 using PN-based measure.
Figure 3 below plots the results with the 90% confidence intervals. Figure 3(a) portrays
the results using SPI, while Figure 3(b) uses the PN measure of drought. Both graphs suggest the
same conclusions. Both before and after a drought, the amount of agricultural credit outstanding
is lower than that immediately following the drought. This result is much clearer in the case of
Figure 3(b) which includes more districts as well as a longer time period (1993 – 2010). Though
the confidence intervals in both figures are wide, we do see that the point estimates are below
zero for almost the same years in both figures.
Figure 3 here
D. Active or passive response by banks?
In this sub-section, we discuss the results for our second hypothesis. The increase in
agricultural credit outstanding could be caused by active borrower-friendly response of the banks
to the drought (either by extending more credit or restructuring existing loans), or it could be
simply due to passive acceptance of non-payment of debt charges on existing loans by the
borrowers in a difficult year whereby the charges are added to the outstanding credit. Lacking
direct data on fresh loans, we investigate this issue indirectly. To test which of the two reasons is
more pertinent we look at non-agricultural credit, in particular personal loans. As we have
discussed above, if outstanding agricultural credit increases primarily because of late payment or
19 We also exclude those districts for which we have less than 10 drought observations.
23
non-payment of debt service charges in drought-affected years, other types of bank credit,
particularly personal loans, are also likely to register an increase in the same years, especially
because non-agricultural loans, unlike agricultural credit, are not included in priority sector loans
and carry a considerably higher rate of interest than the controlled rates on priority sector loans.
On the other hand, if banks respond positively to the plight of the farmers following a drought,
they would extend more agricultural credit but not more non-agricultural loans. Therefore,
whether personal loans appear to increase or not provides a clue to the source of the increase in
outstanding agricultural credit following a drought.
The above intuition calls for a series of tests. To start with, we estimate a modified
equation (1') where other types of loans replace direct agricultural credit as the dependent
variable but all other variables remain the same as (1) before :
OtherLoansdt = α + γd + νt + δDroughtdt-1 + βBankCreditdt + εdt (1')
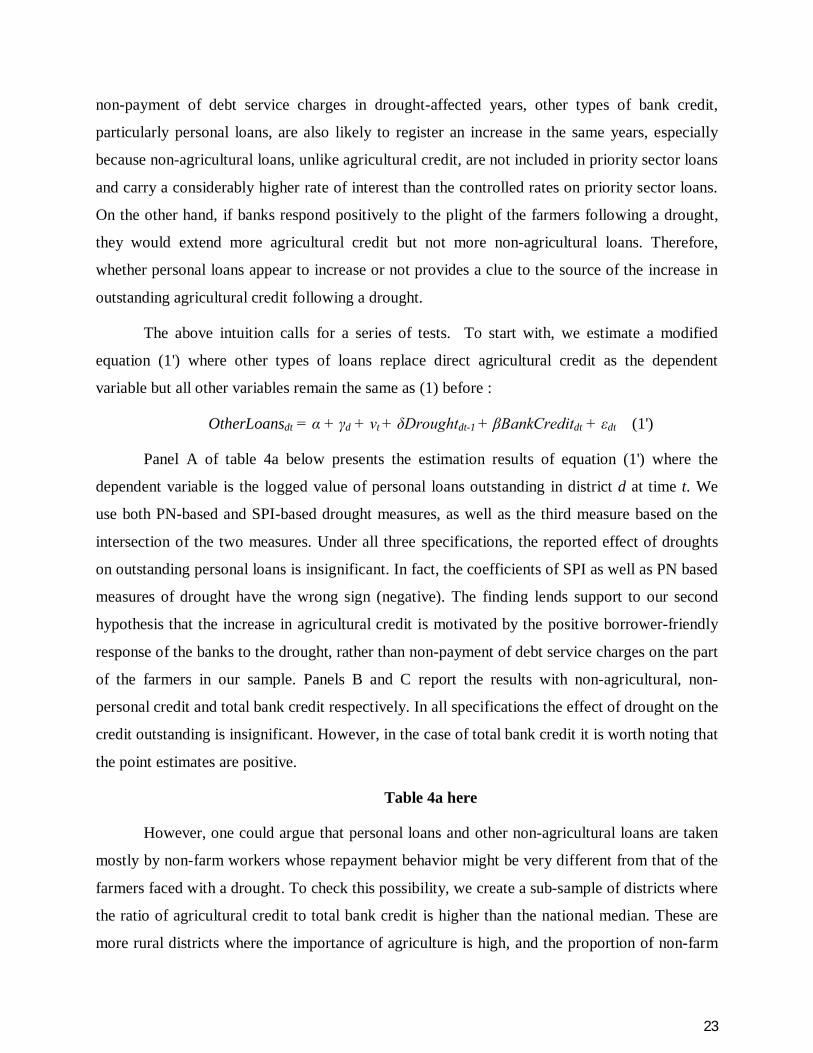
Panel A of table 4a below presents the estimation results of equation (1') where the
dependent variable is the logged value of personal loans outstanding in district d at time t. We
use both PN-based and SPI-based drought measures, as well as the third measure based on the
intersection of the two measures. Under all three specifications, the reported effect of droughts
on outstanding personal loans is insignificant. In fact, the coefficients of SPI as well as PN based
measures of drought have the wrong sign (negative). The finding lends support to our second
hypothesis that the increase in agricultural credit is motivated by the positive borrower-friendly
response of the banks to the drought, rather than non-payment of debt service charges on the part
of the farmers in our sample. Panels B and C report the results with non-agricultural, non-
personal credit and total bank credit respectively. In all specifications the effect of drought on the
credit outstanding is insignificant. However, in the case of total bank credit it is worth noting that
the point estimates are positive.
Table 4a here
However, one could argue that personal loans and other non-agricultural loans are taken
mostly by non-farm workers whose repayment behavior might be very different from that of the
farmers faced with a drought. To check this possibility, we create a sub-sample of districts where
the ratio of agricultural credit to total bank credit is higher than the national median. These are
more rural districts where the importance of agriculture is high, and the proportion of non-farm

24
workers is likely to be small. We estimate equation (1) for this sub-sample using both direct
agricultural credit and personal loans as the dependent variable. The results, reported in Table 4b
below, confirm the earlier results. Agricultural credit outstanding in these districts increases
following a drought, but the amount of personal loans outstanding remains unaffected. Further,
the coefficient estimates of the drought variables remain virtually the same as in the full sample,
though the significance levels are lower because the number of observations are about half as
before.
Table 4b here
A potential peril in comparing the outcomes for agricultural credit and personal loans is
the possibility of strategic default on agricultural loans, but not on personal loans. India has a
history of waivers of agricultural loans by the government following droughts (Kanz, 2011). By
contrast, personal loans are never waived. Given this history, might the farmers in drought-hit
districts strategically default only on agricultural loans expecting to be bailed out by the
government, but not default on personal loans? This selective strategic default could conceivably
explain the increase in agricultural credit outstanding while leaving other credit unchanged. And
the increase in this case would be due to addition of unpaid debt service charges, and not fresh
loans. To address this issue, we investigate whether the amount of government debt relief
extended in the wake of a previous drought in a district has a differential effect on the increase in
agricultural credit outstanding following the current drought. If selective strategic default in
anticipation of a loan waiver causes the observed increase in agricultural credit, we would expect
the increase to be more pronounced in districts where government relief was higher following the
previous drought experienced by the district.
Formally, we estimate the following regression equation:
AgriCreditdt = α +γd +νt +δ1Droughtdt-1+δ2Droughtdt-1*ReliefExpdst-k +ζ+βBankCreditdt + εdt (3)
In equation (3), the coefficient δ2 of the interaction term Droughtdt-1*ReliefExpdst-k is the
coefficient of interest. ReliefExpdst-k is the amount of relief expenditure in state s in year t-k where
k refers to the number of years between successive droughts in district d. We attempt to estimate
equation (3) using two different sets of government relief expenditure data. As we have
mentioned in the data section above, we used petitions under the RTI Act, 2005, to obtain data
on debt relief for farmers included in state annual budgets. None of the governments

25
acknowledged having provided debt relief for farmers within our sample period. Therefore, the
farmers in drought-affected districts in our sample could not have conditioned on past debt relief,
nullifying the hypothesis of strategic default.
We obtained a second set of data, namely state government relief expenditure on account
of natural calamities, from the Handbook of State Government Finances issued by the RBI. As
we have discussed in the Data section above, this data has been used in other studies that
examine government responsiveness to natural calamities in India, such as Besley and Burgess
(2002) and Cole, Healy and Werker (2012). The calamities include droughts, floods, cyclones,
earthquakes etc. The relief amount separately for droughts is not available. Another issue with
this data is that it is available only at the state-year level; data at the district level is not available.
In our tests we use the data deflated by the state GDP deflator.
The results of the pooled OLS estimation of equation (3) are reported in table 4c below.
In all specifications, using either drought measure, the coefficient δ2 is insignificant. The finding
suggests that the increase in agricultural credit in a drought-hit district is unrelated to the amount
of relief expenditure in that state during the previous drought in that district. If farmers were
selectively defaulting on agricultural loans, we would expect the increase in agricultural credit to
be higher when the relief expenditure during the previous drought was higher. The test results
with the second set of data again rule out strategic default by farmers as an explanation for the
observed increase in agricultural credit.
The table indicates that the number of observations used for this test is sharply lower:
1,364 for the SPI-based measure and 1,613 for the PN-based measure. This is because for many
droughts in our sample the previous droughts are outside the sample period.
Table 4c here
E. Is the effect different in drought-prone districts?
Our third hypothesis compares the effect of drought in drought-prone districts and non
drought-prone districts. Our source for the list of drought-prone districts is the Compendium of
Environment Statistics, 2002, released by the Central Statistical Organization, Government of
India. The list includes a total of 99 districts. Not surprisingly, the drought-prone districts are

26
concentrated in the arid regions of western and north-western India, though they are spread over
15 states.
To formally test our third hypothesis, we use the following equation:
AgriCreddt = α + γd + νt + δ1Droughtdt-1+ δ2Droughtdt-1*Drought-Proned + βBankCreddt + εdt (4)
The equation is the same as equation (1) in all respects except that it adds an additional variable
interacting the drought variable with Drought-Proned, a dummy variable that takes the value of 1
for the 99 drought-prone districts, and 0 otherwise. The coefficient of the variable δ2 is of
interest here. While δ1 measures the effect of drought on agricultural credit in non drought-prone
districts, δ2 measures the differential effect in districts that are drought-prone. δ1+ δ2 measures
the combined effect in drought-prone districts.
Panel A of Table 5 below reports the results of the pooled OLS estimation of equation
(4). In both column 1 and 2, the coefficient on the drought variable is positive and significant as
before. However, the coefficient on the interaction term is insignificant in both cases. The tests
do not find evidence that the effect of drought on agricultural credit is different in drought-prone
and non drought-prone districts. Next, we split our sample into two parts, one with drought-
prone districts and the other without. We estimate equation (1) separately for these two sub-
samples. In panel B of the table, we report the results for the drought-prone district sample. The
estimate of the drought coefficient is positive but insignificant. This might be due to the low
number of observations we have for the drought-prone districts sample: 749 for the SPI-based
measure and 681 for the PN-based measure. For the non drought-prone districts, the results for
the drought coefficients are very similar to the results for the full sample in panel A. The effect
of drought on agricultural credit outstanding is positive and significant.
Table 5 here
The results support our third hypothesis. We do not find any evidence that the effect of
drought on agricultural credit outstanding is different between drought-prone districts and other
districts. These results also lend further credence to our second hypothesis. If late payment
caused the rise in agricultural credit outstanding, then in districts which experience frequent
droughts we would ex-ante expect bank managers not to renew loans to farmers who run the risk

27
of non-payment. As a result, outstanding agricultural credit would increase proportionately less
in drought-prone districts than in others. Our findings do not support this implication.
F. Intensive or extensive margin?
The results of the tests discussed above clearly indicate that agricultural credit extended
by commercial banks in a district increases following a drought, and that the increase appears to
be driven by fresh loans rather than non-payment of debt service charges on old loans. Is the
increase in credit due to an increase in the number of accounts, or to an increase in the amount of
credit outstanding in the average account? Since we have data on the total number of accounts in
a district which have credit outstanding at the end of a year, we are able to determine the credit
outstanding in the average account.
Our estimation strategy remains essentially unchanged. We estimate equation (1) by
pooled OLS, and change the dependent variable to number of accounts or average account size
as the case may be. The results of the estimation are presented in Table 6 below.
Table 6 here
Panel A of the table reports the results where the dependent variable is the logged number
of agricultural credit accounts outstanding. We find that though the point estimates are positive
in all cases, they are statistically insignificant in all but one (column 3 - PN based drought
without region-year effects). In Panel B, we regress the logged value of the average amount of
agricultural credit outstanding on the drought variables and the other relevant variables. The
coefficients of all drought variables are positive and significant in all specifications. The increase
in the average size is of the order of 2-3.5 percent when we measure drought using either SPI or
PN. When we use our combined measure, which counts a drought only when both SPI and PN
measures indicate a drought, we find the effect to be significantly larger – of the order of 10 – 11
percent. The results of both panels taken together clearly suggest that the increase in agricultural
credit outstanding following a drought is driven by an increase in the average amount
outstanding rather than an increase in the number of accounts.
VI. Results: Does bank ownership make a difference?

28
We have seen above that the Indian banking sector, as a whole, is responsive to increases
in demand for agricultural credit following a drought. We now examine whether private and
public banks differ in their response and test hypothesis H5.
As we have mentioned in the data section before, we obtained the annual data for
agricultural credit outstanding at the district level by bank ownership group for the period 2001-
2010 from the Department of Statistics and Information Management of the RBI. We organized
the data into three broad bank groups: all public banks, all private banks (including foreign
banks) and regional rural banks (RRBs).
Our empirical strategy is identical to that is Section V.a above. The equation we estimate
is:
AgriCreditdtb = α + γd + νt + δDroughtdt-1 + βBankCreditdtb + εdt (5)
The only difference from regression model (1) is that the credit variables indicate credit for
district d in year t issued by banks belonging to ownership group b. The estimation results for
equation (5) are presented in Table 7 below. The reported results are for PN-based measure of
drought only, since SPI-based measures of drought are available only up to year 2003. Panel A
of the table presents the results for all banks, panel B for public sector banks, panel C for RRBs
and panel D for private banks.
Table 7 here
From the table, after controlling for effects of year and region-year trend, all banks
increase credit by 2% in response to a drought. This result is comparable to the result for the full
sample period 1993 - 2010 (2.9% from column 4 in table 2 before). Public sector banks also
increase agricultural credit by 2% in response to a drought. However, the results are not
statistically significant. The insignificance of the results could be due to fewer observations from
a shorter sample period, about 2,300 observations, compared to about 3,300 observations for the
full sample period. The RRBs do not appear to increase credit at all. However, we see a large and
positive effect of drought on agricultural credit extended by private banks, to the extent of
17.8%. Please note that this result does not suggest that in absolute terms the aggregate increase
in agricultural credit from the banking sector that we have observed above is driven largely by
private sector banks. As we have noted above, 73% of the total outstanding agricultural credit is

29
extended by public sector banks, while 12% is extended by private banks. However, the results
reject the null hypothesis that public sector banks respond more effectively to sudden credit
demand shocks in the rural sector.
VII. Results: Political Economy of Bank Response to Droughts
In this section we investigate whether politics influences the provision of bank credit
following a drought and, if so, how. We test hypothesis H6 which focuses on the role of elections
in provision of bank credit. We also examine if and how the government response to droughts
interacts with the response of the commercial banks.
A. Droughts, elections, and bank credit
Does direct agricultural credit increase more if the drought happens just before an
election? To test the hypothesis, we focus on elections to state legislative assemblies. Each
legislative assembly has a term of five years, though elections might be held earlier if the
government loses its majority. Our data on election dates comes from the website of the Election
Commission of India, a constitutional authority responsible for the conduct of all national and
state elections. Elections in India generally take place between October and May (i.e. after the
southwest monsoon season ends) . Importantly, Indian state elections are not synchronized,
making it possible to exploit the variation in the relationship between the electoral cycles and
credit cycles, while ruling out the possibility of macroeconomic fluctuations as an explanation
for the variation.
To test the hypothesis, we estimate the following equation:
AgriCreddt=α+γd +νt +δ1Droughtdt-1+δ2Droughtdt-1*Electionst +ζElectionst +βBankCreddt +εdt (6)
The variable Electionst takes the value 1 if state s has an election in the period from October of
year t-1 to September of year t (i.e. the one year immediately following the monsoon). We
construct a variable Droughtdt-1*Electionst which has the value 1 if a district suffered a drought in
year t-1and also had a state assembly election right after the drought in year t. The coefficient of
this variable is our coefficient of interest. As a robustness test, we also test for the impact if the
election is scheduled a year later, in year t+1. The regression model includes ζElectionst to
control for the effect the election cycle has on agricultural credit.

30
The results of the pooled OLS estimation of equation (6) are presented in Panel A of
Table 8a. We find similar results with both measures of drought. The coefficients of Drought
(SPI), 0.038, and Drought (PN), 0.022, are very similar to the regression model without the
interaction terms with election (see columns 2 and 4 of table 2 before). The coefficients of the
interaction terms with both measures are positive but statistically insignificant. We do not find
statistically strong evidence to suggest that agricultural credit increases more following a drought
which occurs just before an election compared to other droughts20. The drought variable by itself
continues to explain the observed variation in agricultural credit outstanding. The results if the
election is scheduled a year later, in year t+1, are similar. Those results are not reported.
Interestingly, the coefficient of the election variable is negative and but not significant. This
result is inconsistent with the findings in Cole (2009).
Table 8a here
Next, we divide our sample into two parts – one with election years only and the other
without. We estimate equation (1) separately for these two sub-samples. The results are reported
in Panels B and C respectively. We find that the point estimates of the impact of Drought (PN)
on agricultural credit are larger in election years compared to non-election years. However, the
estimates are statistically insignificant. Similarly, the coefficient of the Drought (SPI) variable is
larger in election years (10.7%, but statistically significant) than in non-election years (4.7%,
significant at 1% level). The insignificance of the results for the election years could be due to
much smaller number of observations: 662 for the SPI-based measure and 733 for the PN-based
measure. Overall, these results do not provide conclusive evidence that the impact of droughts
which occur just before elections is different from other droughts.
B. Droughts, elections, and credit by bank ownership type
Does bank ownership make a difference to our findings in the sub-section above? To test
the hypothesis, we estimate the following equation:
AgriCreddtb=α+γd +νt +δ1Droughtdt-1+δ2Droughtdt-1*Electionst +ζElectionst +βBankCreddtb +εdt (7)
20 We also test for the impact if the election is scheduled a year later, in year t+1. The results, unreported, do not
change.
31
The only difference from regression model (6) above is that the credit variables indicate credit
for district d in year t issued by banks belonging to ownership group b. The estimation results for
equation (7) are presented in Table 8b below.
Table 8b here
The reported results are for PN-based measure of drought only, since SPI-based measures
of drought are available only up to year 2003. Panel A of the table presents the results for all
banks together, panel B for public sector banks, panel C for RRBs and panel D for private banks.
Interestingly, the coefficient of Drought (PN) is positive but insignificant for all banks together
as well as for each bank group. For the full sample period also, reported in table 10a above, the
coefficient for all banks was insignificant. Interestingly, the coefficient of the interaction term
Droughtdt-1*Electionst, 5.7%, is significant at 10% level for public sector banks. The result
indicates that public sector banks are susceptible to the influence of electoral politics, consistent
with Cole (2009a). Also interestingly, the coefficient of the Election Year itself is positive and
significant for all bank groups. In election years, all bank groups appear to increase their lending
to rural households.
C. Interaction between bank response and government action
A natural source of relief following a drought would be the government. Besley and
Burgess (2002) and Cole, Healy and Werker (2012) are among the papers that study how state
governments respond to natural calamities in India. In this paper, we focus on how the
government response interacts with the response of banks. Are the two responses complementary
– do responsive governments prevail upon banks, particularly public sector banks, to increase
lending to drought-hit areas? Or is bank responsiveness a substitute for government
responsiveness – if governments do not respond, because of incompetence, inertia or fiscal
constraints, do banks step in? We attempt to answer these questions by estimating the following
regression equation:
AgriCreditdt = α +γd +νt +δ1Droughtdt-1+δ2Droughtdt-1*ReliefExpdst +ζ+βBankCreditdt + εdt (8)
In equation (8), the coefficient on the interaction term Droughtdt-1*ReliefExpdst is the
coefficient of interest. As discussed earlier, data on relief expenditure on account of natural
calamities is obtained from the Reserve Bank of India’s Handbook of State Government

32
Finances. We have this data only at the state-year level; data at the district level is not available.
We use the data deflated by the state GDP deflator.
The regression estimates are presented in Tables 9a and 9b. Table 9a presents results
using both measures of drought for the full sample period. The coefficient of the interaction term
Droughtdt-1*ReliefExpdst with the SPI-based measure of drought is negative which would imply
substitutability. On the other hand, the coefficient of the interaction term with the PN-based
measure of drought is positive, indicating a complementary relationship. However, both
coefficients are statistically insignificant. Taken together, the results do not provide a clear
picture whether bank response and government response are complements or substitutes. They
appear independent of each other. The coefficients of the two drought variables, as well as that of
the third measure which records a drought only when the other two measures also signal drought,
are positive but insignificant.
Table 9a here
In table 9b we present the results for the four bank groups separately. Panel A of the table
presents the results for all banks together, panel B for public sector banks, panel C for RRBs and
panel D for private banks. The results are available only for the PN-based measure of drought for
the period 2001-2010. The coefficient of the interaction term Droughtdt-1*ReliefExpdst is
insignificant for each group. Again the results suggest that the commercial banking system and
the government respond to droughts independently of each other.
Table 9b here
VIII. Do RBI circulars influence bank behavior?
In Section II above, we noted that the Reserve Bank of India issues annual guidelines to
banks on providing relief for farmers facing natural calamities. In this section, we briefly
investigate whether these guidelines influence bank lending behavior in the rural sector. As
mentioned earlier, these guidelines have undergone five major changes (in 84, 91, 93, 98 and
2005). The first two are not covered by our sample period, while the third is in the first year of
the sample. Hence, we focus on the implications of the changes of 1998 and 2005. Our empirical
strategy is simple – we test whether agricultural credit extended following a drought is different

33
in the years preceding and following a change in guidelines. Formally, we estimate the following
regression equation:
AgriCreditdt = α + γd + νt + δ1Droughtdt-1+ δ2Droughtdt-1*DT + βBankCreditdt + εdt (9)
The coefficient δ2 of the interaction term Droughtdt-1*DT. is our coefficient of interest. The
variable DT takes the value 1 in years after T and 0 otherwise. We are interested in the cases
where T is 1998 and 2005. Panel A of Table 10 reports the results of the estimation of equation
(9) when T is 1998. The coefficients of the interaction term Droughtdt-1*DT is insignificant in all
specifications, including Drought (SPI), Drought (PN) and Drought (combined SPI and PN).
The results suggest that the changes in the RBI guidelines exhorting banks to lend more to
farmers in tough times had no differential impact on agricultural credit, either positive or
negative. In unreported results, we find similar results when T is 2005. In that case, the only
measure of drought we have is the PN measure (since SPI data is available only till 2003).
We have noted in section II above that the RBI guidelines also ask banks to increase
personal and consumption loans. Panel B of Table 10 uses volume of personal loans instead of
agricultural credit as the dependent variable. Here also the coefficients of the drought variables
and the interaction terms are all insignificant. One must recognize, however, that the results in
this section need to be interpreted with more caution than our other results since the observed
insignificant effects could also be driven by some counteracting change in the macro
environment which coincided with the change in the RBI guidelines.
IX. Conclusions
This paper presents evidence that commercial banks in India respond to droughts by
increasing direct agricultural credit to the rural households. The increase is driven by an increase
in average account size rather than an increase in the number of accounts, and is not different for
districts which experience frequent droughts. We do not find any evidence that the increase is
motivated by political considerations – the point at which the drought occurs in the election cycle
has no bearing on the credit extended. The increase also does not appear to be driven by the
RBI’s exhortations to the banks to provide loan relief to the rural borrowers living in areas
affected by droughts. Privately owned banks respond most effectively to a temporary credit
demand shock. Overall, we present positive evidence on the role of commercial banks in optimal
capital allocation, in contrast to some recent studies that have found their role sub-optimal.

34
35
References
Banerjee, A.V., S.A. Cole and E. Duflo (2005). “Bank Financing in India,” in Wanda Tseng and David Cowen, eds., India’s and China’s Recent Experience with Reform and Growth, Palgrave Macmillan.
Banerjee, A.V., and E. Duflo (2008). “Do Firms Want to Borrow More: Testing Credit Constraints Using a Targeted Lending Program,” MIT Working Paper.
Basu, P. and P. Srivastava (2005). “Improving access to finance for India’s rural poor,” in Priya Basu, ed., India’s Financial Sector: Recent Reforms, Future Challenges, Macmillan.
Beck, T.H.L., R. Levine and A. Levkov (2010). “Big Bad Banks? The Winners and Losers from Bank Deregulation in the United States,” Journal of Finance 65(5), 1637-1667.
Besley, T., and R. Burgess (2002). “The Political Economy of Government Responsiveness: Theory and Evidence from India.” Quarterly Journal of Economics 117(4), 1415-1451.
Binswanger, H., and S.R. Khandker (1992). “The Impact of Formal Finance on the Rural Economy of India.” Policy Research Working Paper Series 949, The World Bank.
Bolton, P., and H. Rosenthal (2002). “Political Intervention in Debt Contracts.” Journal of Political Economy 110(5), 1103-1134.
Burgess, R., and R. Pande (2005). “Can Rural Banks Reduce Poverty? Evidence from the Indian Social Banking Experiment.” American Economic Review 95(3), 780–795. Burgess, R., R.Pande and G. Wong (2005). “Banking for the Poor: Evidence from India.” Journal of the European Economic Association 3(2-3), 268-278. Cole, S.A. (2009a). "Fixing Market Failures or Fixing Elections? Elections, Banks and Agricultural Lending in India," American Economic Journal: Applied Economics 1(1), 219-250.
Cole, S.A. (2009b). “Financial Development, Bank Ownership, and Growth. Or, Does Quantity Imply Quality?," Review of Economics and Statistics 91(1), 33-51.
Cole, S.A., A. Healy and E. Werker (2012). “Do Voters Demand Responsive Governments? Evidence from Indian Disaster Relief.” Journal of Development Economics 97(2), 167-181.
Conning, J. and C. Udry (2007). “Rural Financial Markets in Developing Countries,” in Robert Evenson and Prabhu Pingali, eds., Handbook of Agricultural Economics, Elsevier.
Genicot, G. (2002). “Bonded Labor and Serfdom: A Paradox of Voluntary Choice.” Journal of Development Economics 67(1), 101-127.
36
Gormley, T.A. (2010). “The Impact of Foreign Bank Entry in Emerging Markets: Evidence from India.” Journal of Financial Intermediation 19(1), 26-51.
Kanz, M. (2011). “What does Debt Relief do for Development? Evidence from a Large-Scale Policy Experiment,” Working Paper
Kochar, A. (1999). “Smoothing Consumption by Smoothing Income: Hours-of-Work Responses to Idiosyncratic Agricultural Shocks in Rural India.” Review of Economics and Statistics 81(1), 50-61.
McCloskey, D. (1976). “English Open Fields as Behavior towards Risk.” Research in Economic History 1, 124-170.
McKee, T.B., N.J. Doesken and J. Kleist (1993). "The relationship of drought frequency and duration to time scales", 8th Conference on Applied Climatology, pp. 179-184.
Mohan, R. (2006). “Agricultural Credit in India: Status, Issues and Future Agenda.” Economic and Political Weekly 41(11), 1013-1023.
Pai, D.S., L. Sridhar, P. Guhathakurta and H.R. Hatwar (2010). “Districtwise Drought Climatology of the Southwest Monsoon Season over India Based on Standardized Precipitation Index (SPI).” National Climate Centre Research Report No. 2/2010, India Meteorological Department.
Reserve Bank of India (2011). “Statistical Tables relating to banks in India 2010-11”, November 2011.
Rosenzweig, M.R., and K.I. Wolpin (1993). “Credit Market Constraints, Consumption Smoothing, and the Accumulation of Durable Production Assets in Low-income Countries: Investments in Bullocks in India.” Journal of Political Economy 101(2), 223-244.
Srinivasan T.N. (1989). “On Choice among Creditors and Bonded Labour Contracts,” in Pranab Bardhan, ed., The Economic Theory of Agrarian Institutions, Oxford University Press.
Townsend, R.M. (1999). The medieval village economy: A study of the Pareto mapping in general equilibrium models, Frontiers of Economic Research series. Princeton University Press.
Wright, G. (1974). “The Political Economy of New Deal Spending: An Econometric Analysis.” Review of Economics and Statistics 56(1), 30-38.

37
Table 1A: Summary Statistics (Bank Credit Variables) The table reports key summary statistics of our banking variables. We report credit outstanding, number of accounts and average account size for direct agricultural credit as well as total bank credit at the district-year level. The data is from annual volumes of the Reserves Bank of India’s ‘Basic Statistical Returns for Scheduled Commercial Banks’ The data covers the period from 1993-94 to 2009-10.
Variables N Mean SD P25 Median P75
Credit (in Million INR) Direct Agricultural 9152 1673.216 3007.372 222.86 683.2775 1835.815
Total Bank 9152 19402.23 161475.3 1049.257 3160.433 8892.059 Ratio of Direct Agri to Total Bank 9152 0.253 0.187 0.117 0.227 0.365
Number of Accounts
Direct Agricultural 9152 45721.29 60360.47 12646.5 29194 57458 Total Bank 9152 124225.5 305073.5 35168.5 73128.5 135147.5 Ratio of Direct Agri to Total Bank 9152 0.421 0.179 0.305 0.428 0.541
Average Account Size (INR)
Direct Agricultural 9151 44130.75 140757 13320.15 24479.22 44326.88 Total Bank 9152 86878.71 133281.4 25050.05 49404.22 95114.48 Ratio of Direct Agri to Total Bank 9151 0.598 1.121 0.377 0.552 0.739
Table 1B: Summary Statistics (Weather Variables) The table reports key summary statistics of the weather variables we use in our regressions. We obtain the annual Standardized Precipitation Index (SPI) measure for 458 districts from Pai, Sridhar, Guhathakurta and Hatwar (2010). The SPI measure reported is from 1993-2003. We obtain annual rainfall from the National Data Centre of the Indian Meteorological Department. This data is from 1993-2010. Long Period Averages are obtained from IndiaStat. Drought definitions for both SPI and PN-based come from Pai, Sridhar, Guhathakurta and Hatwar (2010).
Variables N Mean SD P25 Median P75
SPI-based SPI measure 4015 0.039 0.917 -0.5 0.03 0.55
Drought (SPI<-1) 4015 0.110 0.313 0 0 0
PN-based
Annual Rainfall (mm) 6182 1236.304 838.3516 703.2 1013.95 1490.2 % deviation from LPA 3989 4.498 39.226 -18.134 0.263 19.628 Drought (deviation<-25%) 3989 0.175 0.380 0.000 0.000 0.000
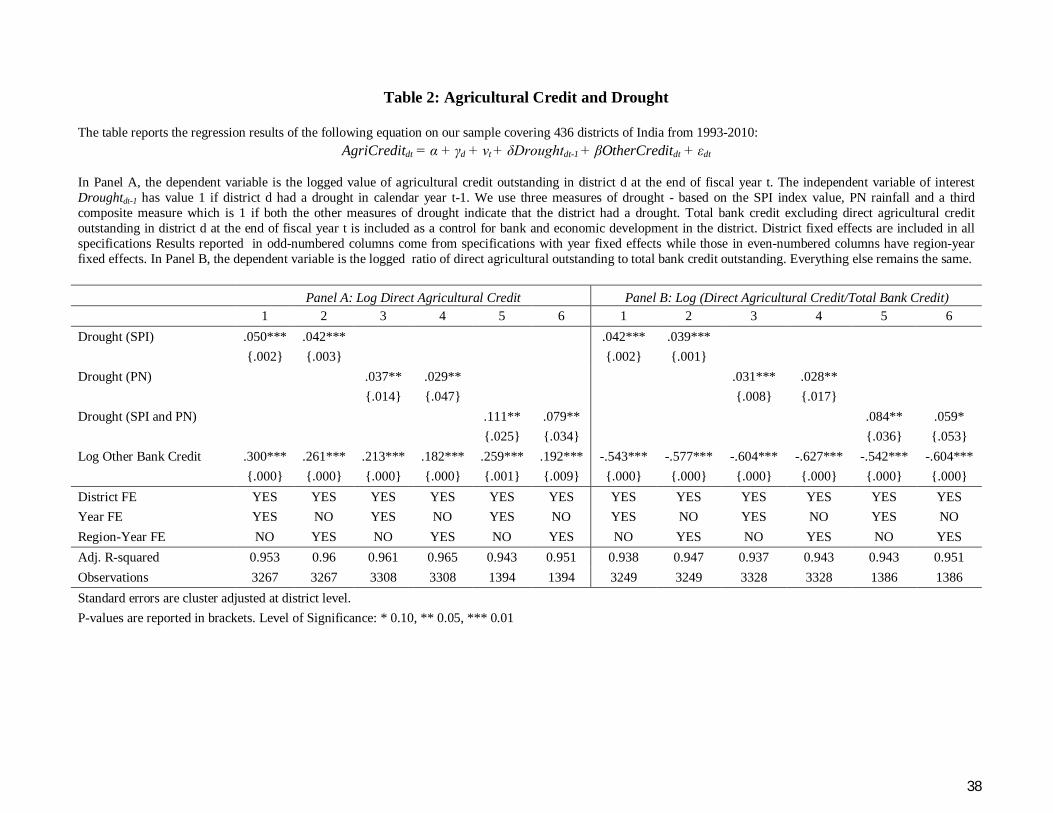
38
Table 2: Agricultural Credit and Drought
The table reports the regression results of the following equation on our sample covering 436 districts of India from 1993-2010: AgriCreditdt = α + γd + νt + δDroughtdt-1 + βOtherCreditdt + εdt
In Panel A, the dependent variable is the logged value of agricultural credit outstanding in district d at the end of fiscal year t. The independent variable of interest Droughtdt-1 has value 1 if district d had a drought in calendar year t-1. We use three measures of drought - based on the SPI index value, PN rainfall and a third composite measure which is 1 if both the other measures of drought indicate that the district had a drought. Total bank credit excluding direct agricultural credit outstanding in district d at the end of fiscal year t is included as a control for bank and economic development in the district. District fixed effects are included in all specifications Results reported in odd-numbered columns come from specifications with year fixed effects while those in even-numbered columns have region-year fixed effects. In Panel B, the dependent variable is the logged ratio of direct agricultural outstanding to total bank credit outstanding. Everything else remains the same. Panel A: Log Direct Agricultural Credit Panel B: Log (Direct Agricultural Credit/Total Bank Credit) 1 2 3 4 5 6 1 2 3 4 5 6 Drought (SPI) .050*** .042*** .042*** .039*** {.002} {.003} {.002} {.001} Drought (PN) .037** .029** .031*** .028** {.014} {.047} {.008} {.017} Drought (SPI and PN) .111** .079** .084** .059*
{.025} {.034} {.036} {.053} Log Other Bank Credit .300*** .261*** .213*** .182*** .259*** .192*** -.543*** -.577*** -.604*** -.627*** -.542*** -.604***
{.000} {.000} {.000} {.000} {.001} {.009} {.000} {.000} {.000} {.000} {.000} {.000} District FE YES YES YES YES YES YES YES YES YES YES YES YES Year FE YES NO YES NO YES NO YES NO YES NO YES NO Region-Year FE NO YES NO YES NO YES NO YES NO YES NO YES Adj. R-squared 0.953 0.96 0.961 0.965 0.943 0.951 0.938 0.947 0.937 0.943 0.943 0.951 Observations 3267 3267 3308 3308 1394 1394 3249 3249 3328 3328 1386 1386 Standard errors are cluster adjusted at district level. P-values are reported in brackets. Level of Significance: * 0.10, ** 0.05, *** 0.01

39
Table 3: Drought and Credit in Neighboring Districts
The table reports the regression results of the following equation: AgriCreditdt = α + γd + νt + δDroughtdt-1 + βOtherCreditdt + εdt
The dependent variable is the logged value of the average direct agricultural credit outstanding in districts neighboring district d at the end of fiscal year t. By neighboring district, we mean districts which share a physical border with district d. We exclude neighboring districts which had a drought. The independent variable of interest Droughtdt-1 has value 1 if district d had a drought in calendar year t-1 and 0 otherwise. We use three measures of drought - based on the SPI index value, PN rainfall and a third composite measure which is 1 if both the other measures of drought indicate that the district had a drought. The average of total bank credit excluding direct agricultural credit outstanding in districts neighboring district d at the end of fiscal year t is included as a control for bank and economic development in the district. District fixed effects are included in all specifications. Results reported in odd-numbered columns come from specifications with year fixed effects while those in even-numbered columns have region-year fixed effects. Log Direct Agricultural Credit in Neighboring Districts
1 2 3 4 5 6 Drought (SPI) -0.01 -0.008 {.595} {.629} Drought (PN) -.046** -.049*** {.011} {.007} Drought (SPI and PN) 0.062 0.05
{.162} {.277} Log Other Credit in Neighboring Districts .294*** .280*** .305*** .305*** .327*** .324***
{.000} {.000} {.000} {.000} {.000} {.000} District FE YES YES YES YES YES YES Year FE YES NO YES NO YES NO Region-Year FE NO YES NO YES NO YES Adj. R-squared 0.953 0.963 0.953 0.958 0.923 0.932 Observations 3227 3227 3380 3380 1398 1398
Standard errors are cluster adjusted at district level. P-values are reported in brackets. Level of Significance: * 0.10, ** 0.05, *** 0.01

40
Table 4a: Other Credit and Drought
The table reports the regression results of the following equation on our sample covering 436 districts of India from 1993-2010: PersonalLoansdt = α + γd + νt + δDroughtdt-1 + βOtherCreditdt + εdt
In Panel A, the dependent variable is the logged value of personal loans outstanding in district d at the end of fiscal year t. The independent variable of interest Droughtdt-1 has value 1 if district d had a drought in calendar year t-1. We use three measures of drought - based on the SPI index value, PN rainfall and a third composite measure which is 1 if both the other measures of drought indicate that the district had a drought. Total bank credit excluding personal loans outstanding in district d at the end of fiscal year t is included as a control for bank and economic development in the district. District and region-year fixed effects are included in all specifications.
In Panel B, the dependent variable is the logged value of non-direct agricultural, non-personal loans outstanding. The control variable is the difference between total bank credit and the value of the dependent variable outstanding. There are no other differences between the specifications in Panel A and Panel B. Panel C has the logged value of total bank credit as the dependent variable. Since total bank credit is now on the left hand side, there is no control variable in Panel C. The fixed effects are the same as in the two other panels.
Panel A: Log Personal Loans Panel B: Log Non-Personal, Non-
Agricultural Loans Panel C: Log Total Bank
Credit
1 2 3 1 2 3 1 2 3 Drought (SPI) -0.005 -0.007 0.005 {.708} {.747} {.799} Drought (PN) -0.002 0.002 0.009 {.895} {.898} {.556} Drought (SPI and PN) 0.017 0.016 .081*
{.505} {.719} {.052} Log Other Credit .324*** .324*** .271*** .646*** .671*** .507*** {.000} {.000} {.000} {.000} {.000} {.000} District FE YES YES YES YES YES YES YES YES YES Region-Year FE YES YES YES YES YES YES YES YES YES Adj. R-squared 0.978 0.977 0.98 0.963 0.948 0.968 0.96 0.961 0.962 Observations 3264 3344 1392 3263 3343 1391 3274 3363 1397 Standard errors are cluster adjusted at district level. P-values are reported in brackets. Level of Significance: * 0.10, ** 0.05, *** 0.01

41
Table 4b: Agricultural Credit and Drought in Rural Districts The table reports the regression results of the following equation:
AgriCreditdt = α + γd + νt + δDroughtdt-1 + βOtherCreditdt + εdt
We run the regression on a sample of those districts where the ratio of direct agricultural credit to total bank credit outstanding is above the national median. In Panel A, the dependent variable is the logged value of direct agricultural credit outstanding in district d at the end of fiscal year t. In Panel B, we use the logged value of personal loans outstanding instead. The independent variable of interest Droughtdt-1 has value 1 if district d had a drought in calendar year t-1. We use three measures of drought - based on the SPI index value, PN rainfall and a third composite measure which is 1 if both the other measures of drought indicate that the district had a drought. Total bank credit excluding direct agricultural credit outstanding in district d at the end of fiscal year t is included as a control for bank and economic development in the district. District and region-year fixed effects are included in all specifications. Panel A: Log Direct Agri Credit Panel B: Log Personal Loans
1 2 3 1 2 3 Drought (SPI) .050** 0.011 {.012} {.548} Drought (PN) .030* 0 {.070} {.999} Drought (SPI and PN) .110*** 0.049
{.001} {.244} Log Other Credit .200*** .247*** .274** .293*** .459*** .341**
{.005} {.000} {.039} {.000} {.000} {.012} District FE YES YES YES YES YES YES Region-Year FE YES YES YES YES YES YES Adj. R-squared 0.951 0.964 0.944 0.97 0.973 0.969 Observations 1655 1721 679 1655 1754 678
Standard errors are cluster adjusted at district level. P-values are reported in brackets. Level of Significance: * 0.10, ** 0.05, *** 0.01

42
Table 4c: Agricultural Credit and Government Relief Expenditure in Previous Drought This table reports the regression results of the following equation:
AgriCreddt = α + γd + νt + δ1Droughtdt-1+ δ2Droughtdt-1*ReliefExpdst-k + ζReliefExpdst-k + βOtherCreddt + εdt
The dependent variable is the logged value of agricultural credit outstanding in district d at the end of fiscal year t. Droughtdt-1 has value 1 if district d had a drought in calendar year t-1. We use two measures of drought - based on the SPI index value and on PN rainfall. ReliefExpdst-k is the logged value of real per capita non-plan expenditure on relief on account of natural calamities in state s in the year which coincides with the most recent occurrence of drought in district d. Data on relief expenditure is from the Reserve Bank of India’s handbook on state government finances. District fixed effects are included in both specifications. Odd numbered columns have results from including year fixed effects while region-year fixed effects are included in even numbered columns. Log Direct Agri Credit 1 2 3 4
Drought (SPI) .085* 0.05
{.071} {.269}
Drought (SPI) * Previous DY Log (Non-plan relief expenditure per capita) -0.021 -0.004
{.246} {.811}
Drought (PN) -0.018 -0.016
{.412} {.422}
Drought (PN) * Previous DY Log (Non-plan relief expenditure per capita) 0.029 0.021
{.275} {.404}
Log Other Credit .359*** .339*** .216*** .210***
{.000} {.000} {.000} {.000}
Previous Drought Year Log (Non-plan relief expenditure per capita) -0.011 -0.016 0.074 0.068
{.750} {.645} {.273} {.268}
District FE YES YES YES YES
Year FE YES NO YES NO Region-Year FE NO YES NO YES
Adj. R-squared 0.963 0.966 0.973 0.973 Observations 1364 1364 1613 1613
Standard errors are cluster adjusted at district level. P-values are reported in brackets. Level of Significance: * 0.10, ** 0.05, *** 0.01

43
Table 5: Drought Prone Districts
Panel A of the table reports the regression results of the following equation: AgriCreditdt = α + γd + νt + δ1Droughtdt-1+ δ2Droughtdt-1*Drought-Proned + βOtherCreditdt + εdt
The dependent variable is the logged value of agricultural credit outstanding in district d at the end of fiscal year t. Droughtdt-1 has value 1 if district d had a drought in calendar year t-1. We use two measures of drought - based on the SPI index value and PN rainfall. Drought-Proned is 1 for those districts which have been identified as susceptible to frequent droughts. We get the list of 99 drought-prone districts from IndiaStat. Total bank credit excluding direct agricultural credit outstanding in district d at the end of fiscal year t is included as a control for bank and economic development in the district. District and region-year fixed effects are included in both specifications. The tests in Panel B and Panel C are identical to those in Table 2. However, they contain results from tests run on sub-samples of the data. Panel B has results from running the tests for a sample containing drought-prone districts only while Panel C has the results when we run the tests for the sample containing non drought-prone districts.
Log Direct Agricultural Credit
Panel A: Full Sample Panel B: Drought- Prone
Districts Panel C: Non Drought
Prone Districts
1 2 1 2 1 2 Drought (SPI) .045*** 0.019 .044*** {.003} {.620} {.004} Drought (SPI)*Drought Prone -0.015
{.683}
Drought (PN) .041** -0.005 .040**
{.015} {.875} {.018} Drought (PN)*Drought Prone -0.053 {.135} Log Bank Credit .261*** .183*** 0.218 0.162 .266*** .188***
{.000} {.000} {.107} {.171} {.000} {.000} District FE YES YES YES YES YES YES Region-Year FE YES YES YES YES YES YES Adj. R-squared 0.96 0.965 0.945 0.957 0.962 0.966 Observations 3267 3308 749 681 2518 2627
Standard errors are cluster adjusted at district level. P-values are reported in brackets. Level of Significance: * 0.10, ** 0.05, *** 0.01

44
Table 6: Source of Increased Agricultural Credit
The table reports the regression results of the following equation on our sample covering 436 districts of India from 1993-2010:
AgriCreditdt = α + γd + νt + δDroughtdt-1 + βOtherCreditdt + εdt
In Panel A, the dependent variable is the logged number of direct agricultural accounts in district d at the end of fiscal year t. The independent variable of interest Droughtdt-1 has value 1 if district d had a drought in calendar year t-1. We use three measures of drought - based on the SPI index value, PN rainfall and a third composite measure which is 1 if both the other measures of drought indicate that the district had a drought. Total number of credit accounts excluding direct agricultural credit accounts in district d at the end of fiscal year t is included as a control for bank and economic development in the district. District fixed effects are included in all specifications. Results reported in odd-numbered columns come from specifications with year fixed effects while those in even-numbered columns have region-year fixed effects. In Panel B, the dependent variable is the log of the average amount outstanding in a direct agricultural credit account in district d at the end of fiscal year t. We calculate the average amount by dividing the amount outstanding by the number of accounts. Our control variable is the log of the average amount outstanding in non-direct agricultural credit accounts in district d at the end of fiscal year t. Our drought variable as well as fixed effects are the same as in Panel A.
Panel A: Log Number of Direct Agri Credit Accounts Panel B: Log Average Size of Direct Agri Credit Accounts 1 2 3 4 5 6 1 2 3 4 5 6 Drought (SPI) 0.012 0 .030** .035*** {.385} {.987} {.021} {.009} Drought (PN) .024* 0.005 .021* .025** {.062} {.656} {.059} {.023} Drought (SPI and PN) 0.008 -0.019 .111*** .104***
{.796} {.518} {.005} {.004} Log Number of Other Accounts .652*** .536*** .486*** .469*** .720*** .638*** {.000} {.000} {.000} {.000} {.000} {.000} Log Average Size of Other Accounts .205*** .183*** .183*** .171*** .200*** .159***
{.000} {.000} {.000} {.000} {.001} {.000} District FE YES YES YES YES YES YES YES YES YES YES YES YES Year FE YES NO YES NO YES NO YES NO YES NO YES NO Region-Year FE NO YES NO YES NO YES NO YES NO YES NO YES Adj. R-squared 0.957 0.969 0.937 0.945 0.948 0.957 0.927 0.935 0.953 0.958 0.94 0.949 Observations 3259 3259 3280 3280 1389 1389 3193 3193 3315 3315 1370 1370 Standard errors are cluster adjusted at district level. P-values are reported in brackets. Level of Significance: * 0.10, ** 0.05, *** 0.01

45
Table 7: Drought and Agricultural Credit by Type of Bank The table reports the regression results of the following equation:
AgriCreditdtb = α + γd + νt + δDroughtdt-1 + βOtherCreditdtb + εdt
The dependent variable is the logged value of direct agricultural credit outstanding in district d at the end of fiscal year t for banks belonging to bank ownership group b. The independent variable of interest Droughtdt-1 has value 1 if district d had a drought in calendar year t-1. We use only the PN measure of drought in this case since our data starts in 2000. Total bank credit excluding direct agricultural credit outstanding in district d at the end of fiscal year t for banks belonging to bank ownership group b is included as a control for bank and economic development in the district. District and region-year fixed effects are included in all specifications. Panel A deals with all banks, Panel B with just public sector banks, Panel C with Regional Rural Banks and Panel D with private sector banks including foreign banks.
Log Direct Agricultural Credit
Panel A: All Banks
Panel B: Public Sector Banks
Panel C: Regional Rural Banks
Panel D: Private Sector Banks
1 2 4 6 Drought (PN) 0.016 0.016 -0.009 .178*
{.237} {.275} {.730} {.086} Log Other Credit .137*** .128*** .820*** .206***
{.000} {.000} {.000} {.003} District FE YES YES YES YES Region-Year FE YES YES YES YES Adj. R-squared 0.974 0.969 0.94 0.85 Observations 2349 2341 2016 1732
Standard errors are cluster adjusted at district level. P-values are reported in brackets. Level of Significance: * 0.10, ** 0.05, *** 0.01

46
Table 8a: Agricultural Credit, Drought and Elections Panel A of the table reports the regression results of the following equation:
AgriCreditdt = α + γd + νt + δ1Droughtdt-1+ δ2Droughtdt-1*Electionst + ζElectionst + βOtherCreddt + εdt
The dependent variable is the logged value of agricultural credit outstanding in district d at the end of fiscal year t. Droughtdt-1 has value 1 if district d had a drought in calendar year t-1. We use two measures of drought - based on the SPI index value and PN rainfall. Electionst is coded 1 when the state saw an assembly election between October of year t-1 and September of year t. Data on election dates is from the Election Commission of India. Total bank credit excluding direct agricultural credit outstanding in district d at the end of fiscal year t is included as a control for bank and economic development in the district. District and region-year fixed effects are included in both specifications.
The tests in Panel B and Panel C are identical to those in Table 2. However, they contain results from tests run on sub-samples of the data. The sub-sample used in Panel B has data from election years only, while the sub-sample used in Panel C only has non-election years.
Log Direct Agricultural Credit
Panel A: Whole Sample Panel B: Election Years Panel C: Non Election
Years
1 2 3 4 5 6 Drought (SPI) .038** 0.107 .047*** {.014} {.255} {.006} Drought (SPI)*Election Year 0.031 {.390} Drought (PN) 0.022 0.053 0.028
{.168} {.305} {.126} Drought (PN)*Election Year 0.029 {.299} Election Year -0.01 -0.012 {.334} {.276} Log Bank Credit .255*** .183*** .374*** .174*** .297*** .227***
{.000} {.000} {.002} {.009} {.000} {.000} District FE YES YES YES YES YES YES Region-Year FE YES YES YES YES YES YES Adj. R-squared 0.958 0.965 0.94 0.956 0.951 0.961 Observations 3250 3308 662 733 2588 2575 Standard errors are cluster adjusted at district level. P-values are reported in brackets. Level of Significance: * 0.10, ** 0.05, *** 0.01
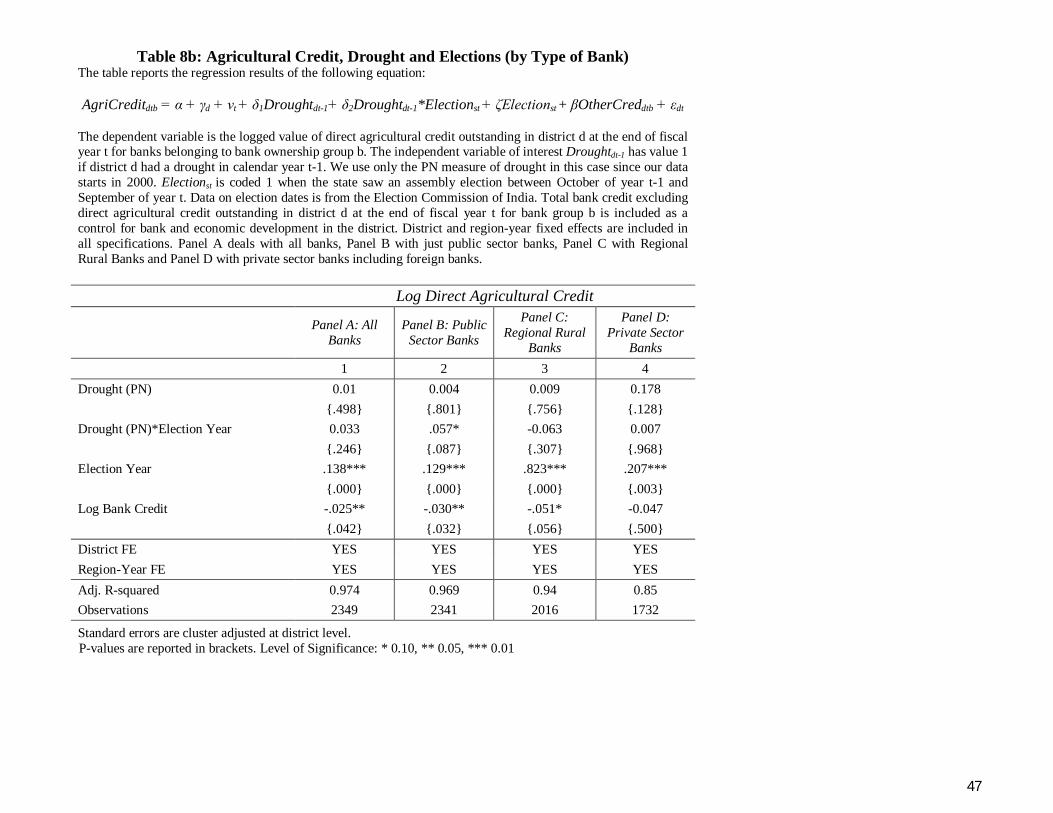
47
Table 8b: Agricultural Credit, Drought and Elections (by Type of Bank) The table reports the regression results of the following equation:
AgriCreditdtb = α + γd + νt + δ1Droughtdt-1+ δ2Droughtdt-1*Electionst + ζElectionst + βOtherCreddtb + εdt
The dependent variable is the logged value of direct agricultural credit outstanding in district d at the end of fiscal year t for banks belonging to bank ownership group b. The independent variable of interest Droughtdt-1 has value 1 if district d had a drought in calendar year t-1. We use only the PN measure of drought in this case since our data starts in 2000. Electionst is coded 1 when the state saw an assembly election between October of year t-1 and September of year t. Data on election dates is from the Election Commission of India. Total bank credit excluding direct agricultural credit outstanding in district d at the end of fiscal year t for bank group b is included as a control for bank and economic development in the district. District and region-year fixed effects are included in all specifications. Panel A deals with all banks, Panel B with just public sector banks, Panel C with Regional Rural Banks and Panel D with private sector banks including foreign banks.
Log Direct Agricultural Credit
Panel A: All Banks
Panel B: Public Sector Banks
Panel C: Regional Rural
Banks
Panel D: Private Sector
Banks
1 2 3 4 Drought (PN) 0.01 0.004 0.009 0.178
{.498} {.801} {.756} {.128} Drought (PN)*Election Year 0.033 .057* -0.063 0.007
{.246} {.087} {.307} {.968} Election Year .138*** .129*** .823*** .207***
{.000} {.000} {.000} {.003} Log Bank Credit -.025** -.030** -.051* -0.047
{.042} {.032} {.056} {.500} District FE YES YES YES YES Region-Year FE YES YES YES YES Adj. R-squared 0.974 0.969 0.94 0.85 Observations 2349 2341 2016 1732
Standard errors are cluster adjusted at district level. P-values are reported in brackets. Level of Significance: * 0.10, ** 0.05, *** 0.01

48
Table 9a: Agricultural Credit and Government Relief Expenditure This table reports the regression results of the following equation:
AgriCreditdt = α + γd + νt + δ1Droughtdt-1+ δ2Droughtdt-1*ReliefExpdst + βOtherCreddt + εdt
The dependent variable is the logged value of agricultural credit outstanding in district d at the end of fiscal year t. Droughtdt-1 has value 1 if district d had a drought in calendar year t-1. We use three measures of drought - based on the SPI index value, PN rainfall and a measure which signals drought only when the other two measures both signal drought. ReliefExpdst is the logged value of real per capita non-plan expenditure on relief on account of natural calamities. Data on relief expenditure is from the Reserve Bank of India’s handbook on state government finances. Total bank credit excluding direct agricultural credit outstanding in district d at the end of fiscal year t is included as a control for bank and economic development in the district. District and year fixed effects are included in both specifications. Region-year fixed effects are included in even numbered columns.
Log Direct Agri Credit 1 2 3 4 5 6
Drought (SPI) 0.074 0.069
{.150} {.162}
Drought (SPI) * Log (Non-plan relief expenditure per capita) -0.01 -0.01
{.630} {.614}
Drought (PN) 0.004 0.019
{.940} {.717}
Drought (PN) * Log (Non-plan relief expenditure per capita) 0.011 0.003
{.469} {.855}
Drought (PN and SPI) 0.024 0.094
{.868} {.569}
Drought (PN and SPI) * Log (Non-plan relief expenditure per capita) 0.033 0.001
{.582} {.988}
Log Other Credit .300*** .259*** .213*** .205*** .258*** .216**
{.000} {.000} {.000} {.000} {.001} {.010}
District FE YES YES YES YES YES YES
Year FE YES NO YES NO YES NO Region-Year FE NO YES NO YES NO YES
Adj. R-squared 0.95 0.957 0.961 0.962 0.943 0.948
Observations 3235 3235 3259 3259 1394 1394
Standard errors are cluster adjusted at district level. P-values are reported in brackets. Level of Significance: * 0.10, ** 0.05, *** 0.01

49
Table 9b: Agricultural Credit and Government Relief Expenditure (by Type of Bank) This table reports the regression results of the following equation:
AgriCreditdtb = α + γd + νt + δ1Droughtdt-1+ δ2Droughtdt-1*ReliefExpdst + βOtherCreddtb + εdt
The dependent variable is the logged value of direct agricultural credit outstanding in district d at the end of fiscal year t for banks belonging to bank ownership group b. The independent variable of interest Droughtdt-1 has value 1 if district d had a drought in calendar year t-1. We use only the PN measure of drought in this case since our data starts in 2000. ReliefExpdst is the logged value of real per capita non-plan expenditure on relief on account of natural calamities. Data on relief expenditure is from the Reserve Bank of India’s handbook on state government finances. Total bank credit excluding direct agricultural credit outstanding in district d at the end of fiscal year t for bank group b is included as a control for bank and economic development in the district. District and region-year fixed effects are included in all specifications. Panel A deals with all banks, Panel B with just public sector banks, Panel C with Regional Rural Banks and Panel D with private sector banks including foreign banks.
Log Direct Agricultural Credit
Panel A: All Banks
Panel B: Public Sector
Banks
Panel C: Regional
Rural Banks
Panel D: Private
Sector Banks
1 2 3 4 Drought (PN) 0.066 0.064 0.043 -0.141
{.190} {.234} {.698} {.757} Drought (PN)* Log (Non-plan relief expenditure per capita) -0.016 -0.015 -0.017 0.105
{.280} {.342} {.623} {.448} Log Other Credit .153*** .149*** .810*** .227***
{.000} {.000} {.000} {.001} District FE YES YES YES YES Region-Year FE YES YES YES YES Adj. R-squared 0.972 0.967 0.94 0.839 Observations 2300 2291 1984 1688
Standard errors are cluster adjusted at district level. P-values are reported in brackets. Level of Significance: * 0.10, ** 0.05, *** 0.01

50
Table 10: Agricultural Credit and Drought: Before and After 1998 The Table below reports the regression results of the following equation:
AgriCreditdt = α + γd + νt + δ1Droughtdt-1+ δ2Droughtdt-1*D1998 + βOtherCreditdt + εdt
In Panel A, the dependent variable is the logged value of agricultural credit outstanding in district d at the end of fiscal year t. In Panel B, we use the logged value of personal loans outstanding in district d at the end of fiscal year t as the dependent variable. Droughtdt-1 has value 1 if district d had a drought in calendar year t-1. We use three measures of drought - based on the SPI index value, PN rainfall and a third composite measure which is 1 if both the other measures of drought indicate that the district had a drought. D1998 is an indicator variable which takes the value 1 for all observations which are after 1998, and 0 otherwise. The control variable is the difference between total bank credit and the value of the dependent variable outstanding. District and region-year fixed effects are included in all specifications. Log Direct Agricultural Credit Log Personal Loans
1 2 3 4 5 6 Drought (SPI) .050*** -0.024 {.010} {.212} Drought (SPI)*Post 98 -0.016 0.039 {.587} {.143} Drought (PN) 0.02 -0.018 {.701} {.665} Drought (PN)*Post 98 0.01 0.019 {.854} {.686} Drought (SPI and PN) .134* -0.044
{.096} {.480} Drought (SPI and PN)*Post 98 -0.076 0.085
{.386} {.189} Log Bank Credit .261*** .182*** .193*** .324*** .324*** .270***
{.000} {.000} {.009} {.000} {.000} {.000} District FE YES YES YES YES YES YES Region-Year FE YES YES YES YES YES YES Adj. R-squared 0.96 0.965 0.951 0.978 0.977 0.98 Observations 3267 3308 1394 3264 3344 1392
Standard errors are cluster adjusted at district level. P-values are reported in brackets. Level of Significance: * 0.10, ** 0.05, *** 0.01

51
Figure 1: Drought Frequency
The figure plots the percentage of districts in India that suffer from drought during every year in our sample period (1993-2009). The series for drought measured by SPI
runs from 1993 to 2003 while for drought measured by PN rainfall it covers the entire period.

52
Figure 2: Drought Prone Districts The figure plots the distribution of drought prone districts in India. Drought prone districts are identified from the Compendium of Environment Statistics, 2002

53
Figure 3: Dynamics of Drought Effect on Agricultural Credit The figure plots the dynamics of agricultural credit outstanding in the years preceding and following a drought. We consider a window from 6 years prior to 6 years after a drought for only those districts which have had just one drought within our sample period.
We report the coefficients estimated from the following regression:
AgriCreditdt = α + γd + νt + δ1Ddt-1-6+ δ2Ddt-1
-5 + …+δ11Ddt-1
5 + δ12Ddt-1
6 + βBankCreditdt + εdt
D-i equals 1 for districts in the ith year before a drought and 0 otherwise, while Di equals 1 for districts in the ith year after a drought and 0 otherwise. Since we exclude the dummy for the year of the drought, we are able to estimate the dynamics relative to the year of the drought. We include district fixed effects, year fixed effects and district-year fixed effects as well as the log of bank credit as a control. Our dependent variable is the log of agricultural credit outstanding.
The circles represent the point estimates of the respective dummy coefficient while the dashed lines represent 90% confidence intervals, adjusted for district-level clustering. In (a), we report results where the drought measure is SPI-based. There are 42 districts with the time period being from 1993-2003. In (b), the drought measure is based on PN rainfall. It covers 61 districts over 1993-2009.
(a) Drought measured using SPI
-1
-.5
0
.5
Perc
enta
ge c
hang
e
-6 -3 0 3 6Years relative to Drought

54
Figure 3: Dynamics of Drought Effect on Agricultural Credit (contd.)
(b) Drought measured using PN rainfall
-.2
-.1
0
.1Pe
rcen
tage
cha
nge
-6 -3 0 3 6Years relative to Drought
Related Documents