ARCHITECTURE-DRIVEN FAULT-BASED TESTING FOR SOFTWARE SAFETY a thesis submitted to the department of computer engineering and the graduate school of engineering and science of bilkent university in partial fulfillment of the requirements for the degree of master of science By Havva G¨ ulay G¨ urb¨ uz August, 2014

Welcome message from author
This document is posted to help you gain knowledge. Please leave a comment to let me know what you think about it! Share it to your friends and learn new things together.
Transcript

ARCHITECTURE-DRIVEN FAULT-BASEDTESTING FOR SOFTWARE SAFETY
a thesis
submitted to the department of computer engineering
and the graduate school of engineering and science
of bilkent university
in partial fulfillment of the requirements
for the degree of
master of science
By
Havva Gulay Gurbuz
August, 2014

I certify that I have read this thesis and that in my opinion it is fully adequate,
in scope and in quality, as a thesis for the degree of Master of Science.
Asst. Prof. Dr. Bedir Tekinerdogan(Advisor)
I certify that I have read this thesis and that in my opinion it is fully adequate,
in scope and in quality, as a thesis for the degree of Master of Science.
Asst. Prof. Dr. Can Alkan
I certify that I have read this thesis and that in my opinion it is fully adequate,
in scope and in quality, as a thesis for the degree of Master of Science.
Assoc. Prof. Dr. Halit Oguztuzun
Approved for the Graduate School of Engineering and Science:
Prof. Dr. Levent OnuralDirector of the Graduate School
ii

ABSTRACT
ARCHITECTURE-DRIVEN FAULT-BASED TESTINGFOR SOFTWARE SAFETY
Havva Gulay Gurbuz
M.S. in Computer Engineering
Supervisor: Asst. Prof. Dr. Bedir Tekinerdogan
August, 2014
A safety-critical system is defined as a system in which the malfunctioning of
software could result in death, injury or damage to environment. To mitigate
these serious risks the architecture of safety-critical systems need to be carefully
designed and analyzed. A common practice for modeling software architecture
is the adoption of architectural perspectives and software architecture viewpoint
approaches. Existing approaches tend to be general purpose and do not explicitly
focus on safety concern in particular. To provide a complementary and dedicated
support for designing safety-critical systems we propose safety perspective and
an architecture framework approach for software safety.
Once the safety-critical systems are designed it is important to analyze these
for fitness before implementation, installation and operation. Hereby, it is im-
portant to ensure that the potential faults can be identified and cost-effective
solutions are provided to avoid or recover from the failures. In this context,
one of the most important issues is to investigate the effectiveness of the ap-
plied safety tactics to safety-critical systems. Since the safety-critical systems
are complex systems, testing of these systems is challenging and very hard to
define proper test suites for these systems. Several fault-based software testing
approaches exist that aim to analyze the quality of the test suites. Unfortunately,
these approaches do not directly consider safety concern and tend to be general
purpose and they doesn’t consider the applied the safety tactics. We propose a
fault-based testing approach for analyzing the test suites using the safety tactic
and fault knowledge.
Keywords: software safety, safety-critical systems, architectural design, architec-
tural viewpoints, architectural perspectives, fault-based testing.
iii

OZET
YAZILIM EMNIYETI ICIN MIMARI-GUDUMLUHATA-TABANLI TEST
Havva Gulay Gurbuz
Bilgisayar Muhendisligi, Yuksek Lisans
Tez Yoneticisi: Yrd. Doc. Dr. Bedir Tekinerdogan
Agustos, 2014
Emniyet-kritik sistemlerdeki bir aksama ya da islev bozuklugu olumlere, insanlar
uzerinde ciddi yaralanmalara ya da cevresel hasarlara neden olabilir. Bu riskleri
ortadan kaldırmak ya da azaltmak icin emniyet-kritik sistemler dikkatli bir sekilde
tasarlanmalı ve analiz edilmelidir. Tasarım asamasında karar alınırken farklı
paydaslar icin mimari gorunumlerin ve perspektiflerin modellenmesi, yazılım mi-
mari tasarımında kullanılan yaygın pratiklerden birisidir. Literaturde var olan
yaklasımlar genel amaclı olarak kullanılmıs ve ozel olarak emniyet ilgisi ele
alınmamıstır. Emniyet ilgisini mimari duzeyde adresleyebilmek ve emniyet-kritik
sistemlerin tasarım surecini desteklemek amacıyla literaturde var olmayan em-
niyet perspektifi ve yazılım emniyeti icin mimari cerceve yaklasımlarını sunuy-
oruz.
Emniyet-kritik sistemler tasarlandıktan sonra gerceklestirim, kurulum ve
isletim sureclerinden once sistemlerin analiz asaması gerceklestirilmelidir. Yapılan
analizle birlikte olası hataların belirlendigi ve belirlenen hataları tolere etmek ya
da ortadan kaldırmak icin uygun maliyetli cozumlerin uygulandıgından emin ol-
unmalıdır. Emniyet-kritik sistemler karmasık sistemler oldugu icin, bu sistemlerin
testinin gerceklestirilmesi ve uygun test durumlarının yazılması oldukca zorludur.
Literaturde yazılım mimarisi kalitesini degerlendirmek acısından bircok senaryo-
tabanlı yazılım mimari analizi yaklasımları sunulmustur. Fakat bu yaklasımlar
genel cozumler sunmakta ve emniyet ilgisini dogrudan goz onunde bulundur-
mamaktadır. Bu kapsamda, emniyet-kritik sistemler icin olusturulan test du-
rumlarının uygulanan emniyet taktikleri ve hata bilgileri kullanılarak etkinligini
degerlendirebilmek icin hata-tabanlı test yaklasımı sunulmaktadır.
Anahtar sozcukler : yazılım emniyeti, emniyet-kritik sistemler, mimari tasarım,
mimari gorunumler, mimari perspektifler, hata-tabanlı test.
iv

Acknowledgement
I would like to express my deepest thanks and gratitude to my supervisor Asst.
Prof. Dr. Bedir Tekinerdogan for his strong support and guidance of my research,
motivation and unsurpassed knowledge. It was a great pleasure for me to have a
chance of working with him.
I am also thankful to Asst. Prof. Dr. Can Alkan and Assoc. Prof. Dr. Halit
Oguztuzun for kindly accepted to read and review this thesis. Probably most
of this work would not have been possible without the support of Nagehan Pala
Er. I am grateful to Nagehan for her valuable ideas and suggestions. I would
also like to acknowledge the financial support of TUBITAK (The Scientific and
Technological Research Council of Turkey) during my research.
I would like to thank Esra Cansızoglu for her guidance and help on academic
decisions in my career. I am also grateful to my friends Elif Tekin and Kubra Isık
for their endless patience, moral and support. I am also thankful all the people of
the room EA507, especially Fatma Balcı and Elif Dal for their valuable friendship
and understanding.
Last but not least, I would like to thank my family, my mother Beyhan, my
father Ahmet and my twin brother Hasan for being in my life, supporting me in
every way. Without their everlasting love, this thesis would never be completed.
v

Contents
1 Introduction 1
1.1 Software Safety . . . . . . . . . . . . . . . . . . . . . . . . . . . . 1
1.2 Problem Statement . . . . . . . . . . . . . . . . . . . . . . . . . . 1
1.3 Contribution . . . . . . . . . . . . . . . . . . . . . . . . . . . . . . 3
1.4 Outline of The Thesis . . . . . . . . . . . . . . . . . . . . . . . . . 5
2 Background 6
2.1 Software Architecture Design . . . . . . . . . . . . . . . . . . . . 6
2.1.1 Software Architecture Views . . . . . . . . . . . . . . . . . 6
2.1.2 Software Architecture Frameworks . . . . . . . . . . . . . 8
2.2 Model-Driven Development . . . . . . . . . . . . . . . . . . . . . 12
2.2.1 Modeling . . . . . . . . . . . . . . . . . . . . . . . . . . . 13
2.2.2 Metamodeling . . . . . . . . . . . . . . . . . . . . . . . . . 14
2.2.3 Model Transformations . . . . . . . . . . . . . . . . . . . . 16
2.3 Fault-Based Testing . . . . . . . . . . . . . . . . . . . . . . . . . . 18
vi

CONTENTS vii
3 Case Study - Avionics Control Computer System 20
4 Systematic Literature Review on Model-Based Testing for
Safety 23
4.1 Background . . . . . . . . . . . . . . . . . . . . . . . . . . . . . . 24
4.1.1 Model-Based Testing . . . . . . . . . . . . . . . . . . . . . 24
4.1.2 Systematic Reviews . . . . . . . . . . . . . . . . . . . . . . 27
4.2 Research Method . . . . . . . . . . . . . . . . . . . . . . . . . . . 27
4.2.1 Review Protocol . . . . . . . . . . . . . . . . . . . . . . . 28
4.2.2 Research Questions . . . . . . . . . . . . . . . . . . . . . . 29
4.2.3 Search Strategy . . . . . . . . . . . . . . . . . . . . . . . . 30
4.2.4 Study Selection Criteria . . . . . . . . . . . . . . . . . . . 33
4.2.5 Study Quality Assessment . . . . . . . . . . . . . . . . . . 34
4.2.6 Data Extraction . . . . . . . . . . . . . . . . . . . . . . . . 35
4.2.7 Data Synthesis . . . . . . . . . . . . . . . . . . . . . . . . 36
4.3 Results . . . . . . . . . . . . . . . . . . . . . . . . . . . . . . . . . 37
4.3.1 Overview of the Reviewed Studies . . . . . . . . . . . . . . 37
4.3.2 Research Methods . . . . . . . . . . . . . . . . . . . . . . 44
4.3.3 Methodological Quality . . . . . . . . . . . . . . . . . . . . 45
4.3.4 Systems Investigated . . . . . . . . . . . . . . . . . . . . . 48
4.3.5 Threads to Validity . . . . . . . . . . . . . . . . . . . . . . 66

CONTENTS viii
4.4 Conclusion . . . . . . . . . . . . . . . . . . . . . . . . . . . . . . . 67
5 Software Safety Perspective 69
5.1 Safety Perspective Definition . . . . . . . . . . . . . . . . . . . . . 70
5.1.1 Applicability to Views . . . . . . . . . . . . . . . . . . . . 71
5.1.2 Concerns . . . . . . . . . . . . . . . . . . . . . . . . . . . . 73
5.1.3 Activities for Appliying Safety Perspective . . . . . . . . . 75
5.1.4 Architectural Tactics . . . . . . . . . . . . . . . . . . . . . 79
5.1.5 Problems and Pitfalls . . . . . . . . . . . . . . . . . . . . . 81
5.1.6 Checklist . . . . . . . . . . . . . . . . . . . . . . . . . . . . 83
5.2 Application of the Safety Perspective on Case Study . . . . . . . . 84
5.2.1 Activities for Safety Perspective . . . . . . . . . . . . . . . 84
5.2.2 Applicability to Views . . . . . . . . . . . . . . . . . . . . 92
5.2.3 Checklist and Architectural Tactics . . . . . . . . . . . . . 97
5.3 Application of the Safety Perspective on Views and Beyond Approach 99
6 Architecture Framework for Software Safety 104
6.1 Metamodel for Software Safety . . . . . . . . . . . . . . . . . . . . 105
6.2 Viewpoint Definition for Software Safety . . . . . . . . . . . . . . 108
6.2.1 Hazard Viewpoint . . . . . . . . . . . . . . . . . . . . . . . 108
6.2.2 Safety Tactic Viewpoint . . . . . . . . . . . . . . . . . . . 108
6.2.3 Safety-Critical Viewpoint . . . . . . . . . . . . . . . . . . . 110

CONTENTS ix
6.3 Application of the Architecture Framework on Case Study . . . . 112
6.3.1 Hazard View . . . . . . . . . . . . . . . . . . . . . . . . . 112
6.3.2 Safety Tactic View . . . . . . . . . . . . . . . . . . . . . . 117
6.3.3 Safety-Critical View . . . . . . . . . . . . . . . . . . . . . 120
6.4 Tool . . . . . . . . . . . . . . . . . . . . . . . . . . . . . . . . . . 127
7 Fault-Based Testing for Software Safety 128
7.1 DSL for Software Safety . . . . . . . . . . . . . . . . . . . . . . . 129
7.1.1 Metamodel . . . . . . . . . . . . . . . . . . . . . . . . . . 129
7.1.2 DSL . . . . . . . . . . . . . . . . . . . . . . . . . . . . . . 130
7.2 Fault-Based Testing Approach . . . . . . . . . . . . . . . . . . . . 132
7.3 Tool . . . . . . . . . . . . . . . . . . . . . . . . . . . . . . . . . . 136
7.4 Application of Fault-Based Testing Approach on Case Study . . . 137
7.4.1 Case Study . . . . . . . . . . . . . . . . . . . . . . . . . . 138
7.4.2 Application of Fault-Based Testing Approach . . . . . . . 141
8 Related Work 154
9 Conclusion 157
A Search String 167
B List of Primary Studies 171

CONTENTS x
C Study Quality Assessment 174
D Data Extraction Form 175

List of Figures
2.1 IEEE conceptual model for architecture description . . . . . . . . 7
2.2 Kruchten’s 4+1 Framework . . . . . . . . . . . . . . . . . . . . . 8
2.3 Views & Beyond Architecture Framework . . . . . . . . . . . . . . 11
2.4 An example four layer OMG architecture . . . . . . . . . . . . . . 15
2.5 A conceptual model for metamodel concepts . . . . . . . . . . . . 16
2.6 Model transformation process . . . . . . . . . . . . . . . . . . . . 17
3.1 Component and connector view of the case study . . . . . . . . . 22
4.1 Process of model-based testing . . . . . . . . . . . . . . . . . . . . 26
4.2 Review Protocol . . . . . . . . . . . . . . . . . . . . . . . . . . . . 28
4.3 Year-wise distribution of primary studies . . . . . . . . . . . . . . 42
4.4 Quality of reporting of the primary studies . . . . . . . . . . . . . 45
4.5 Rigor quality of the primary studies . . . . . . . . . . . . . . . . . 46
4.6 Relevance quality of the primary studies . . . . . . . . . . . . . . 46
4.7 Credibility of evidence of the primary studies . . . . . . . . . . . . 47
xi

LIST OF FIGURES xii
4.8 Overall quality of the primary studies . . . . . . . . . . . . . . . . 47
4.9 Domain distribution of primary studies . . . . . . . . . . . . . . . 48
4.10 Main motivation for adopting model-based testing for software safety 53
4.11 Model-based testing steps . . . . . . . . . . . . . . . . . . . . . . 54
4.12 Requirement Specification Language . . . . . . . . . . . . . . . . 55
4.13 Test Case Specification Language . . . . . . . . . . . . . . . . . . 57
4.14 Generated type of test elements . . . . . . . . . . . . . . . . . . . 57
4.15 Contribution type . . . . . . . . . . . . . . . . . . . . . . . . . . . 60
5.1 Appliying the safety perspective . . . . . . . . . . . . . . . . . . . 75
5.2 Deployment view for the first version . . . . . . . . . . . . . . . . 88
5.3 Deployment view for the second version . . . . . . . . . . . . . . . 89
5.4 Functional view for the first version . . . . . . . . . . . . . . . . . 92
5.5 Functional view for the second version . . . . . . . . . . . . . . . 93
5.6 Information view for altitude data . . . . . . . . . . . . . . . . . 94
5.7 Information view for fuel amount data . . . . . . . . . . . . . . . 95
5.8 Context view for our case study . . . . . . . . . . . . . . . . . . . 96
5.9 Decomposition style for our case study . . . . . . . . . . . . . . . 101
5.10 Uses style for our case study . . . . . . . . . . . . . . . . . . . . . 102
5.11 Layered style for our case study . . . . . . . . . . . . . . . . . . . 103
6.1 Metamodel for safety . . . . . . . . . . . . . . . . . . . . . . . . . 107

LIST OF FIGURES xiii
6.2 Hazard view for HZ1 . . . . . . . . . . . . . . . . . . . . . . . . . 114
6.3 Hazard view for HZ2 . . . . . . . . . . . . . . . . . . . . . . . . . 115
6.4 Hazard view for HZ5 . . . . . . . . . . . . . . . . . . . . . . . . . 117
6.5 Safety tactic view for our case study . . . . . . . . . . . . . . . . 118
6.6 Safety-critical view for our case study . . . . . . . . . . . . . . . . 121
6.7 Hazard view for second design alternative - HZ1 . . . . . . . . . 123
6.8 Hazard view for second design alternative - HZ2 . . . . . . . . . . 123
6.9 Safety tactic view for second design alternative . . . . . . . . . . . 125
6.10 Safety-critical view for second design alternative . . . . . . . . . . 126
6.11 Snapshot of the tool for modeling three viewpoints . . . . . . . . 127
7.1 Metamodel for safety DSL . . . . . . . . . . . . . . . . . . . . . . 129
7.2 Process for proposed fault-based testing approach . . . . . . . . . 132
7.3 Tool for safety DSL . . . . . . . . . . . . . . . . . . . . . . . . . . 136
7.4 Tool for fault-based testing . . . . . . . . . . . . . . . . . . . . . . 137
7.5 UML Class diagram for our case study . . . . . . . . . . . . . . . 140
7.6 Hazard view for our case study - Part 1 . . . . . . . . . . . . . . . 142
7.7 Hazard view for our case study - Part 2 . . . . . . . . . . . . . . . 143
7.8 Safety tactic view for our case study . . . . . . . . . . . . . . . . 144
7.9 Safety-critical view for our case study - Part 1 . . . . . . . . . . . 145
7.10 Safety-critical view for our case study - Part 2 . . . . . . . . . . . 146

LIST OF FIGURES xiv
7.11 Implementation details for our case study . . . . . . . . . . . . . . 146
7.12 Sample generated code for mutant generation . . . . . . . . . . . 150
7.13 Sample generated code for executing test cases . . . . . . . . . . . 150

List of Tables
4.1 Overview of search results and study selection . . . . . . . . . . . 33
4.2 Quality Checklist . . . . . . . . . . . . . . . . . . . . . . . . . . . 35
4.3 Data Extraction . . . . . . . . . . . . . . . . . . . . . . . . . . . . 36
4.4 Distribution of the studies over Publication Channel . . . . . . . . 43
4.5 Distribution of studies over Research Method . . . . . . . . . . . 44
4.6 Identified domains of model-based testing for software safety . . . 49
4.7 Model Specification Language . . . . . . . . . . . . . . . . . . . . 56
4.8 Solution Approaches for Generated Types of Test Elements . . . . 58
4.9 Definitions for grading the strength of evidence . . . . . . . . . . 64
4.10 Average Quality Scores of Experimental Studies . . . . . . . . . . 65
5.1 Brief description of the safety perspective . . . . . . . . . . . . . . 71
5.2 Applicability of safety perspective to Rozanski and Woods’ views 72
5.3 Hazard Severity Levels . . . . . . . . . . . . . . . . . . . . . . . . 76
5.4 Hazard Probability Level . . . . . . . . . . . . . . . . . . . . . . . 77
xv

LIST OF TABLES xvi
5.5 Hazard Risk Index . . . . . . . . . . . . . . . . . . . . . . . . . . 78
5.6 Hazard Risk Categorization . . . . . . . . . . . . . . . . . . . . . 78
5.7 Checklist . . . . . . . . . . . . . . . . . . . . . . . . . . . . . . . . 83
5.8 Hazard identification and risk definition for our case study . . . . 85
5.9 Safety requirements for the case study . . . . . . . . . . . . . . . 87
5.10 Safety perspective application to views for the case study . . . . . 92
5.11 Checklist for the case study . . . . . . . . . . . . . . . . . . . . . 98
5.12 Architectural tactics for the case study . . . . . . . . . . . . . . . 99
5.13 Applicability of the safety perspective on Views & Beyond approach100
5.14 Application of the selected styles on the case study . . . . . . . . 101
6.1 Hazard Viewpoint . . . . . . . . . . . . . . . . . . . . . . . . . . . 109
6.2 Safety tactic viewpoint . . . . . . . . . . . . . . . . . . . . . . . . 110
6.3 Safety-critical viewpoint . . . . . . . . . . . . . . . . . . . . . . . 111
6.4 Fault table for the case study . . . . . . . . . . . . . . . . . . . . 113
7.1 Results for test cases . . . . . . . . . . . . . . . . . . . . . . . . . 135
7.2 Mutant generation for safety tactics . . . . . . . . . . . . . . . . . 151
7.3 Results for AltitudeDifferenceCheck-GraphicsMgr . . . . . . . . . 153
7.4 Results for AltitudeDifferenceCheck-Fuel . . . . . . . . . . . . . . 153

Chapter 1
Introduction
1.1 Software Safety
Currently, an increasing number of systems are controlled by software and rely
on the correct operation of software. In this context, a safety-critical system is
defined as a system in which the malfunctioning of software could result in death,
injury or damage to environment. Software can be considered safe if it does
not produce an output which causes a catastrophic event for the system. Sev-
eral methods, processes and models are developed in order to make the software
safe. System safety engineering is the application of engineering and manage-
ment principles, criteria, and techniques to optimize all aspects of safety within
the constraints of operational effectiveness, time, and cost throughout all phases
of the system life cycle [1] [2].
1.2 Problem Statement
An important concern for designing safety-critical systems is safety since a failure
or malfunction may result in death or serious injury to people, or loss or severe
damage to equipment or environmental harm. It is generally agreed that quality
1

concerns need to be evaluated early on in the life cycle before the implementation
to mitigate risks. For safety-critical systems this seems to be an even more serious
requirement due to the dramatic consequences of potential failures. For coping
with safety several standard and implementation approaches have been defined
but this has not been directly considered at the architecture modeling level.
A common practice for modeling software architecture is the adoption of ar-
chitectural perspectives and software architecture viewpoint approaches. Archi-
tectural perspectives include a collection of activities, tactics and guidelines that
require consideration across a number of the architectural viewpoint approach
which aims to model the architecture for particular stakeholders and concerns.
However, existing approaches tend to be general purpose and do not explicitly fo-
cus on safety concern in particular. For example, component and connector view
[3] could help to determine the system’s components and relationships between
them. However, it doesn’t include the information about whether a component
is safety-critical is not explicit. Safety-critical components implement safety-
critical requirements but the general purpose views do not answer the question
which safety requirements are implemented in which components. Another miss-
ing knowledge is about the tactics and patterns that are applied to handle safety
requirements.
The goal of providing safety concerns in views is two-fold: (1) communicating
the design decisions related with safety concerns through views (2) accomplish-
ing safety analysis of the architecture from views. The first goal, communicating
the design decisions related with safety concerns, is important for safety engi-
neers, system engineers and software engineers. Safety and system engineers
perform hazard identification and provide safety requirements, a subset of which
is allocated to software. Then, the software engineers design and implement
the software according to the safety requirements. Thus, these views would
help bridge the gap between them by communicating safety information from
the safety and system engineers to software engineers. The second goal, accom-
plishing safety analysis of the architecture, supports the safety assessment of the
design. If safety related information can be obtained from the views, the architec-
ture can be properly analyzed. Typically, safety analysis is performed from the
2

early stages of the design and the architecture can be updated after safety anal-
ysis, if deemed necessary. For example, an important guideline is not to include
non-safety-critical software inside safety-critical software. If the safety-critical
and non-safety-critical components can be differentiated, such an analysis can
be performed. After the analysis is accomplished and if there is a safety-critical
component which includes non-safety-critical components, then the architecture
is reshaped.
Once the safety critical systems are designed it is important to analyze these
for fitness before implementation, installation and operation. Hereby, it is im-
portant to ensure that the potential faults can be identified and cost-effective
solutions are provided to avoid or recover from the failures. Since the safety-
critical systems are complex systems, testing of these systems is challenging and
very hard to define proper test suites for these systems. Several fault-based soft-
ware testing approaches exist that aim to analyze the quality of the test suites.
Unfortunately, these approaches do not directly consider safety concern and tend
to be general purpose and they doesn’t consider the applied the safety tactics.
1.3 Contribution
In this work, our main focus is supporting the testing of safety-critical systems.
In this context, we conduct a systematic literature review(SLR) on model-based
testing for software safety to identify, evaluate and interpret the relevant studies
concerning a particular topic area. The SLR provides a roadmap to describe the
current state of model-based testing for software safety. This study helps us to
identify the limitations of proposed solutions for model-based testing for software
safety.
In order to address the design problems mentioned in section 1.2, firstly, we
propose an architectural perspective for safety. The safety perspective includes
a collection of activities, tactics and guidelines to handle safety concerns. The
safety perspective can assist the system and software architects in designing,
3

analyzing and communicating the decisions regarding safety concerns.
Although the safety perspective forces the architects to think about designers
to think about the design decisions regarding the safety at an architectural level,
it doesn’t provide complete architectural modeling of software safety concerns.
In order to solve this problem, we propose an architectural framework for soft-
ware safety. The architecture framework is based on a metamodel that has been
developed after a thorough domain analysis for software safety. The framework
includes three coherent set of viewpoints each of which addresses an important
concern. The framework is not mentioned as a replacement of existing general
purpose frameworks but rather needs to be considered complementary to these.
In order to address analyzing the effectiveness of the applied safety tactics, we
propose a fault-based testing approach for software safety. Fault-based testing
is one of the testing approaches which aims to analyze, evaluate and design test
suites by using fault knowledge. An important aspect in fault-based testing is
mutation analysis which involves modifying a program under test to create vari-
ants of the program. The proposed approach results in the impact analysis of a
test suite on the applied tactics and likewise provides an important insight in the
effectiveness of the safety tactics.
The contributions of this thesis can be summarized as follows:
• Systematic literature review on model-based testing for software safety to
summarize the existing studies and identify the limitations of the existing
studies
• Safety perspective definition to provide tactics and guidelines to handle
safety in architectural level
• Architectural framework definition for software safety to analyze the ar-
chitecture in the early phases of the development life cycle, analyze the
design alternatives, increase the communication between safety engineers
and software developers and communicate the design decisions related with
safety
4

• Fault-based testing approach to analyze the quality of test suites considering
the applied safety tactics knowledge
1.4 Outline of The Thesis
This thesis is organized as follows: Chapter 2 provides a background information
for software architecture design and model-driven software development. Chapter
3 explains the case study to illustrate the proposed approaches in this thesis. The
chapter 4 presents the conducted systematic review to systematically identify,
analyze and describe the state of the art advances in model-based testing for
software safety. In chapter 5, firstly, the safety perspective approach is explained.
Then, application of the proposed safety perspective on the industrial case study
is given. Chapter 6 describes the architecture framework for software safety and
its application on the industrial case study. In chapter 7, the fault-based testing
approach and its application on the case study are presented. Chapter 8 describes
the related work. Finally, chapter 9 presents the conclusion.
5

Chapter 2
Background
2.1 Software Architecture Design
The software architecture of a program or computing system is the structure or
structures of the system, which comprise software elements, the externally visible
properties of those elements, and the relationships among them [3]. When de-
veloping a system, architectural design decisions are quite important. However,
creating architectural descriptions for the systems has some challenges. One of
these challenges is represent the complex structure of the system in an under-
standable way for all stakeholders. In order to solve this problem, architectural
view concept is introduced. In this section, we provide the background for ar-
chitectural views. Then, we present some software architecture frameworks for
modeling the architecture.
2.1.1 Software Architecture Views
A common practice in software architecture design is to model and document dif-
ferent architectural views for describing the architecture according to the stake-
holders concerns. An architectural view is a representation of a set of system
elements and relations associated with them to support a particular concern.
6

Figure 2.1: IEEE conceptual model for architecture description
Having multiple views helps to separate the concerns and as such support the
modeling, understanding, communication and analysis of the software architec-
ture for different stakeholders. There are different studies which define various
views for architecture design. In order to make the idea generic, viewpoint con-
cept is proposed as IEEE standard [4]. Architectural views conform to viewpoints
that represent the conventions for constructing and using a view. The conceptual
model from IEEE 1471 standard describing architectural view and viewpoint con-
cepts are given in Figure 2.1 [4]. As shown in the figure, each architectural view
addresses some stakeholders concerns and each of the stakeholders’ concerns im-
pacts the viewpoint definitions. An architectural framework organizes and struc-
tures the proposed architectural viewpoints. Different architectural frameworks
7

have been proposed in the literature including the Kruchtens 4+1 view model
[5], Siemens Four Views model [6], Rozanski and Wood’s approach [7], and Views
and Beyond approach [3].
2.1.2 Software Architecture Frameworks
Krutchen’s 4+1 Framework
The 4 + 1 View Model [5] proposed by Philippe Krutchen for describing software
architecture. As shown in Figure 2.2, this framework consists of five different
views, each of which addresses a specific set of concerns. The logical view describes
the design’s object model. It is concerned with the functional requirements of the
system. The process view deals with the design’s concurrency and synchronization
aspects of the system. This view addresses oncurrency, distribution, integrators,
performance, and scalability, etc. The physical view depicts the mapping of the
software onto the hardware and shows the system’s distributed aspects. The
development view defines the software’s static organization in the development
environment.
Figure 2.2: Kruchten’s 4+1 Framework
Siemens Four View Framework
Siemens four view framework [6] is developed at Siemens Corporate Research.
It includes four views separate different concerns. The conceptual view defines
8

the major elements in the system and the mapping between functionalities of the
product and these elements by concerning functional requirements of the system.
The module view organizes modules into two orthogonal structures: decompo-
sition and layer. The decomposition structure shows how the system logically
decomposed into subsystems and modules. The layer structure defines the con-
straints and dependencies between this modules. The execution view defines how
modules are mapped to run time elements. The code architecture view focuses on
the organization of the software artefacts. In this approach, several mappings of
the structures are explicitly defined. Conceptual structures are implemented by
module structures, and assigned to execution structures. Module structures can
be located in or implemented by code structures. Code structures can configure
execution structures.
Rozanski and Woods Framework
Rozanski and Woods [7] propose an architecture framework consisting of seven
different viewpoints, namely, Functional, Information, Concurrency, Develop-
ment, Deployment and Operational, and Context viewpoints for supporting the
architecture design . The Functional viewpoint defines the functional elements
of the system, their responsibilities, interfaces and interactions. The Information
viewpoint represents the way that the architecture stores, manipulates, manages
and distributes information. The Concurrency viewpoint illustrates the concur-
rency structure of the system and identifies the parts of the systems which should
execute concurrently, and shows these are coordinated and controlled. The De-
velopment viewpoint describes the architecture that supports the system devel-
opment. The Deployment viewpoint defines the environment into which system
will be deployed. The Operational viewpoint describes how the system will be
operated, managed, and supported. The Context viewpoint describes the rela-
tionships, dependencies, and interactions between the system and its environment
such as external systems, people, and groups.
Rozanski and Woods state that quality concerns are crosscutting on these
viewpoints and as such creating a viewpoint for a given quality concern seems
less appropriate. Instead they propose the concept of architectural perspective,
9

which include a collection of activities, tactics and guidelines that that require
consideration across a number of the architectural views. In order to capture
the system-wide quality concerns, each relevant perspective is applied to some
or all views. In this way, the architectural views provide the description of the
architecture, while the architectural perspectives can help to analyze and modify
the architecture to ensure that system exhibits the desired quality properties.
In [7], Rozanski and Woods define Security, Performance and Scalability,
Availability and Resilience, Evolution, Accessibility, Development Resource, In-
ternationalization, Location, Regulation and Usability perspectives. The Security
perspective describes the ability of the system reliably control, monitor and au-
dit who can perform which activity on which resources, detect and recover from
failures. The Performance and Scalability perspective defines the ability of the
system to be executed in desired performance profile and to handle increased
processing volumes. The Availability and Resilience perspective describes the
ability of the system to be fully or partly operational as and when required and
to effectively handle failures that could affect system availability. The Evolution
perspective defines the ability of the system to be flexible in the face of the in-
evitable change. The Accessibility perspective describes the ability of the system
to be used by disabled people. The Development Resource perspective describes
the ability of the system to be designed, built, deployed, and operated with in
some constraints. The Internationalization perspective defines the ability of the
system to be independent from any particular language or country. The Loca-
tion perspective describes the ability of the system to overcome problems which
are brought by location of its elements. The Regulation perspective describes the
ability of the system to conform to laws, quasi-legal regulations, company policies
and other rules and standards. The Usability perspective defines the interaction
between system and people.
Views and Beyond Framework
Clements et al. propose Views & Beyond framework [3] includes three different
views which of each result in a style. In this approach, they don’t use the term
viewpoint explicitly, they refer it as style. Style is a specialization of element and
10

relation types, together with some constraints [3]. In this framework approach,
they define module style, component & connector style and allocation style. Figure
2.3 shows the styles in Views & Beyond approach.
Figure 2.3: Views & Beyond Architecture Framework
Module style documents a systems principal units of implementation. In this
style, modules are primary elements which are an implementation unit provides
a coherent set of responsibilities. This view has six important styles which are
decomposition, uses, generalization, layered, aspects and data model styles. The
decomposition style is used for decomposing a system into implementation units
which are modules and sub-modules. Additionally, it shows how system respon-
sibilities are divided between modules and submodules. The uses style shows the
dependency between the modules. The generalization style shows the inheritance
between modules to support extension and evolution of the architecture. In ad-
dition, it is used for capturing the commonalities and variations. The layered
style composes groups which are called layers which include modules that offer a
cohesive set of services and it defines the allowed-to-use relation with each other.
For two layers having allowed-to-use relation, any module in the first layer is al-
lowed to use any module in second layer. The aspects style shows aspect modules
that implement crosscutting concerns and how they are bound to other modules
in the system. The data model style defines the structure of data entities and
relationship between them.
Component & connector style documents the systems units of execution. It
expresses runtime behavior of the system by using components and connectors.
Component is one of the principal processing units of the executing system, while
11

connector is the interaction mechanism between the components. This view ad-
dresses four important styles which are call-return, data flow, event-based and
repository styles. The call-return style presents a computational model in which
components provide a set of services may be invoked by other components syn-
chronously. Client-server style, peer-to-peer style, and service-oriented architec-
ture style are the examples styles for the call-return style. The data flow style
shows the flow of data through the system. Pipe-and-filter style is the form of the
data flow style. The event-based style shows which components interact through
asynchronous events or messages. Publish-subscribe style is the example of this
style. The repository style presents the components interact through large collec-
tions of persistent, shared data. Shared data style is the form of the this style. In
addition to these styles, multi-tier style is defined. In this style, the components
are grouped into tier and presented in this concept.
Allocation style documents the relations between a systems software and non-
software resources of the development and execution environments. An environ-
ment can be the hardware, the file systems supporting development or deploy-
ment, or the development organization. This view identifies three different styles
that are deployment, install, and work assignment styles. The deployment style
defines the mapping between the software’s components and connectors and the
hardware platform on which software executes. The install style describes the
mapping between the components in the software architecture and structures
in the file system of the production environment. The work assignment style
describes the mapping between software components and the people, teams or
organizational work units which are responsible of development of those mod-
ules.
2.2 Model-Driven Development
Models have been widely used in software engineering to analyze, design and im-
plement the software projects. Models are the abstraction of the systems. UML
models, software process models and design patterns are the example models
12

used in development life cycle of software systems. Initially, models are used for
documentation. Model-Based Software Development(MBSD) approach aims to
develop software by using models. However, this approach separates the models
from the code. With the introducing the Model-Drivien Software Development
(MDSD) paradigm, models are treated as a key abstraction of software develop-
ment process. According to MDSD approach, models are executable and they
can be considered as code.
In this section, we present the background on Model-Driven Software de-
velopment (MDSD). Firsly, we provide a background about modeling. After, we
present the basic information about metamodeling. Finally, we explain the model
transformations.
2.2.1 Modeling
Different definitions have been defined for the concept of model in software engi-
neering. We present some selected definitions from [8] in below:
• A model is an abstraction of a (real or language based) system allowing
predictions or inferences to be made [9].
• Models provide abstractions of a physical system that allow engineers to
reason about that system by ignoring extraneous details while focusing on
the relevant ones [10].
• A model of a system is a description or specification of that system and its
environment for some certain purpose [11].
Mellor et al.[12] provides a classification of models depending on their level of
precision. A model can be considered as a Sketch, as a Blueprint, or as an
Executable. The classification is presented below:
• Model as Sketch: Model as sketch is simple drawing model to communicate
the ideas. It is an informal diagram and doesn’t give much detail of a
13

system.
• Model as Blueprint : Model as blueprint can be considered as document or
design model to describe properties needed to build real thing. It describes
the system in sufficient detail.
• Model as Executable: Model as executable is a software model that can be
compiled and executed. Additionally, it can be automatically translated
into other model or code. It is more precise than sketch and blueprint.
In model-based development approach, models are used as blueprints as defined
by the above categorization of Mellor et al. [12]. In contrast to model-based devel-
opment approach, in model-driven development approach models are considered
as executables.
2.2.2 Metamodeling
Model-driven development is a paradigm which considers the models as key ab-
stractions. In this context, metamodeling has an important role in model-driven
development paradigm. Metamodel is a model which defines the language for
expressing a model. It describes the constructs of a modeling language and their
relationships, as well as constraints and modeling rules. A model is an instance
of metamodel or a model conforms to metamodel. A metamodel conforms to
metametamodel which is the language for defining metamodels. Model driven
development organizes the models in four layer architecture [11] illustrated in
Figure 2.4 . The lowermost layer is M0 describes the real-world objects. The layer
M1, model layer, describes the normal user models. In the M2 layer metamodels
are created. In the topmost layer M3 metametamodels are defined. According
the Figure 2.4, real concrete systems lies on M0. The M1 layer defines the model
of a real system such as models are created in UML. In metamodeling layer M2,
the concepts to define a UML diagram are presented. In metametamodeling layer
M3, the language to define metamodel is presented. According to example given
in the Figure 2.4, Meta-Object Facility(MOF) lies on M3 layer.
14

Figure 2.4: An example four layer OMG architecture
Metamodels are important in both model driven development and software
language engineering approach [13] which is the application of a systematic, disci-
plined, quantifiable approach to the development, use, and maintenance of these
languages. A metamodel should include the following elements [13] [14]:
• Abstract Syntax : It describes the vocabulary of concepts provided by the
language and how may be combined to create models. It consists of a
definition of concepts and the relationships between these concepts.
• Concreate Syntax : It is a realization of the abstract syntax. It can be
represented as visually or textually. A textual syntax enables models to be
described in a structured textual form where as a concrete syntax presents
the models in a diagrammatical form.
• Static Semantics : It defines the well-formedness rules that state how the
concepts may be legally combined.
• Semantics : It describes the meaning of concepts defined in abstract syntax.
Figure 2.5 shows the elements and relationships of the metamodel.
15

Figure 2.5: A conceptual model for metamodel concepts
2.2.3 Model Transformations
In model driven development the notion of the model transformations have an
important role. Model transformation takes as input a model conforming to a
given metamodel and produces as output another model conforming to a given
metamodel. Model transformation provides the following points:
• Generating lower-level models from higher-level models
• Mapping and synchronizing among models at the same level or different
levels of abstraction
• Creating query-based views of a system
• Model evolution tasks such as model refactoring
• Reverse engineering of higher-level models from lower-level models or code
The Figure 2.6 shows the simple scenario of a transformation with one input
(source) model and one output(target) model. Both models conform to their
respective metamodels. The transformation is defined with respect to the meta-
models. The transformation definition is executed by a transformation engine. It
reads the source model and outputs the target model.
16

Figure 2.6: Model transformation process
In general, model transformations categorized in two types as model-to-model
transformations and model-to-text transformations.
Model-to-model transformations
Model-to-model transformation is a key aspect of model-driven development. In
this transformation a source model is transformed into another target model
which is instance of either the source metamodel or another metamodel. Both
source and target are models conform to their respective metamodel. Transforma-
tions are executed by transformation engines.The Eclipse MMT (Model-to-Model
Transformation) [15] project provides a framework for model-to-model transfor-
mation languages. There are three transformation engines that are developed in
the scope of MMT project: ATL [16], QVTo [17], QVTd [18].
Model-to-text transformations
Model-to-text transformation is a special case of model-to-model transformation.
In this transformation target is a text and there is no target metamodel. Model-
to-text transformation is useful for generating both code and noncode artifacts
such as documentations. The Eclipse M2T [19](Model-to-Text transformation)
project provides a framework for generating textual artifacts from models. JET
[20], Accelo [21] and Xpand [22] are the developed projects in the scopse of M2T
project.
17

2.3 Fault-Based Testing
Software testing is one of the most important process in software development
life cycle as testing identifies faults and removal of these faults increases software
quality and reliability. Software testing involves two types of testing which are
black box and white box testing. Black box testing is concerned with input-
output behaviour or functionality of the component, whereas white box testing
deals with the internal program structure by accessing the program code. In both
the cases testing shows that a program satisfies its test data but cannot assure
the quality of test data.
Fault-based testing is one of the testing approaches which aims to analyze,
evaluate and design test suites by using fault knowledge. Mutation testing is the
one of the common forms of fault-based testing. It involves modifying a program
under test to create variants of the program. Variants are created by making
small changes in the program following a pattern. Mutation operators are the
patterns to change program’s code, and each variant of the program is called a
mutant. Basically, there are three kind of mutations: value mutations, decision
mutations, and statement mutations. Value mutation involves the changing the
values of constants or parameters. Decision mutation involves the modifying
conditions to reflect potential errors in the coding of conditions in programs.
Statement mutation involves deleting certain lines to reflect omissions in coding
or swapping the order of lines of code.
Mutation analysis consists of following three steps [23]:
1. Mutant operator selection relevant to faults
2. Mutant generation
3. Distinguishing mutants by executing original program and each generated
mutants with the test cases
After test cases are executed on mutated programs, mutation score is cal-
culated by using number of live mutants and number of killed mutants. If
18

behavior/output of a mutant is differs from the original program, mutant is
killed. Otherwise, mutant is live. Mutation score is calculated by using the
equation(killedmutants ∗ 100)/(livemutants+ killedmutants). Based on the re-
sults the quality of test cases is assessed.
There are some tools for mutation generation. µJava [24] is one of the open
source tools which generates mutants for Java programs. It automatically gen-
erates mutants for both method-level mutation testing and class-level mutation
testing. The method-level mutant operators are explained in [25] and the class-
level mutation operators are explained in [26]. After creating mutants, µJava
allows to execute tests and evaluates the mutation coverage of the tests.
19

Chapter 3
Case Study - Avionics Control
Computer System
In this chapter, we explain the case study Avionics Control Computer System
(ACCS) to illustrate the safety perspective approach in section 5, the architecture
framework approach in section 6, and fault-based testing approach in section 7.
Avionics is one of the domains where safety is a crucial quality attribute. Sev-
eral accidents show that the faults in avionics systems could lead to catastrophic
consequences that cause loss of life. Various cases related with both military
and commercial aviation are summarized in [27]. There are several standards
such as DO-178C (Software Considerations in Airborne Systems and Equipment
Certification) [28] to regulate software development and certification activities
for avionics domain. Especially commercial avionics systems are subject to these
regulations. The Avionics Control Computer System contains several thousands
of requirements. We select a subset of the requirements for our case study. The
capabilities provided by our avionics control computer are summarized below:
• Display aircraft altitude data
Altitude is defined as the height of the aircraft above sea level. Altitude
information is shown to pilots, as well as, also used by other avionics systems
such as ground collision detection system. Pilots depend on the displayed
20

altitude information especially when landing.
• Display aircraft position data
Position is the latitude and longitude coordinates of the aircraft received
from GPS (Global Positioning System). Route management also uses air-
craft position. Aircraft position is generally showed along with the other
points in the route. Pilots can see the deviation from the route and take
actions according to the deviation.
• Display aircraft attitude data
Attitude is defined with the angles of rotation of the aircraft in three di-
mensions, known as roll, pitch and yaw angles. For instance, the symbol,
called as ADI (Attitude Direction Indicator), is used to show roll and pitch
angles of the aircraft.
• Display fuel amount
Fuel amount is the sum of fuel in all fuel tanks. Fuel amount is generally
represented with a bar chart in order to show how much fuel remains in the
aircraft.
• Display radio frequency channel
The radio frequency channel is used to communicate with ground stations.
Figure 3.1 shows the component and connector view [3] of the architecture
design of the case study, using a UML component diagram. Altimeter1Manager
and Altimeter2Manager are the managers of altimeter device 1 and 2, respec-
tively. Each altimeter manager receives the aircrafts altitude data from the
specified altimeter device and provides it to NavigationManager. Gyro1Manager
and Gyro2Manager are the managers of gyroscope device 1 and 2, respectively.
Each gyroscope manager receives the aircrafts attitude data from the speci-
fied gyroscope device and provides it to NavigationManager. Gps1Manager and
Gps2Manager are the managers of GPS device 1 and 2, respectively. Each GPS
manager receives the aircrafts position data from the specified GPS device and
provides it to NavigationManager. Fuel1Manager and Fuel2Manager are the
managers of fuel sensor 1 and 2, respectively. Each fuel manager receives the air-
crafts fuel data from the specified fuel sensor and provides it to PlatformManager.
21

Figure 3.1: Component and connector view of the case study
RadioManager is the manager of radio device. RadioManager receives radio fre-
quency data from the radio device and provides it to CommunicationManager.
NavigationManager reads the aircrafts altitude, attitude and position data from
the specified managers and provides them to graphics managers. PlatformMan-
ager reads fuel data from the fuel managers and provides it to graphics man-
agers. CommunicationManager reads radio frequency data from RadioManager
and provides it to graphics managers. Graphics1Manager and Graphics2Manager
read the aircrafts altitude, attitude, position, fuel and radio frequency data and
show these on the graphics displays.
22

Chapter 4
Systematic Literature Review on
Model-Based Testing for Safety
Testing the software of safety-critical systems is crucial since a failure or mal-
function may result in death or serious injury to people, or loss or severe damage
to equipment or environmental harm. Software testing of safety-critical systems
can be stated as the process of validating and verifying that a system meets the
safety requirements that guided its design and development and likewise satisfies
the needs of stakeholders. Testing usually includes the process of executing a
program or application with the intent of finding software bugs. Software bugs
may result in an error which could in the end cause a failure that could be safety-
critical. An important challenge in testing is the derivation of test cases that can
identify the potential faults. In large scale and complex software systems, testing
can be laborious and time consuming when it is done manually.
Model-based testing (MBT) adopts models of a system under test and/or
its environment for designing and optionally also executing artifacts to perform
software testing or system testing. Using explicit models helps to structure the
process of deriving tests and support the reuse, reproduction and documentation
of test cases. In addition MBT enables the automated production and execution
of test cases, which on its turn reduces the cost and time of testing and increase
23

the quality of test cases [29].
MBT has been applied for testing both functional and nonfunctional prop-
erties. In this chapter we focus on the application of MBT for testing safety
properties. Several approaches have been provided for this in the literature. The
overall objective of this paper is to provide a systematic review to systematically
identify, analyze and describe the state of the art advances in model-based testing
for software safety.
The systematic review is conducted by a multiphase study selection process
using the published literature in major software engineering journals and con-
ference proceedings. We reviewed 462 papers that are discovered using a well-
planned review protocol, and 20 of them were assessed as primary studies related
to our research questions. Based on the analysis of data extraction process, we
discuss the primary trends and approaches and present the identified obstacles.
For researchers, this SLR gives an overview of the reported model-based testing
for software safety with the strength of empirical evidences of the identified ap-
proaches. For the practitioners, this SLR can be considered as a map for finding
and analyzing the studies relevant to their situation.
In this chapter, firstly we provide the preliminaries including background of
model-based testing, software safety and systematic literature review (SLR). Af-
ter, we present the details of SLR method adopted in this study. Finally, we
present the result of the SLR study and the discussion.
4.1 Background
4.1.1 Model-Based Testing
The IEEE Software Engineering Body of Knowledge (SWEBOK 2004) defines
testing as an activity performed for evaluating product quality, and for improv-
ing it, by identifying defects and problems [30]. In contrast to static analysis
24

techniques testing requires the execution of the program with specific input val-
ues to find failures in its behavior. In general, exhaustive testing is not possible or
practical for most real programs due to the large number of possible inputs and
sequences of operations. Because of the large set of possible tests only a selected
set of tests can be executed within feasible time limits. As such, the key challenge
of testing is how to select the tests that are most likely to expose failures in the
system. Moreover, after the execution of each test, it must be decided whether
the observed behaviour of the system was a failure or not. This is called the
oracle problem.
In the traditional test process the design of test cases and the oracles as well
as the execution of the tests are performed manually. This manual process is
time consuming and less tractable for the human tester. MBT relies on models
of a system requirements and behaviour to automate the generation of the test
cases and their execution. A model is usually an abstract, partial presentation of
the desired behaviour of a system under test (SUT). Test cases derived from such
a model are collectively known as an abstract test suite. Based on the abstract
test suite a concrete test suite needs to be derived that is suitable for execution.
Hereby, the elements in the abstract test suite are mapped to specific statements
or method calls in the software to create the concrete test suite. The generated
executable test cases often include an oracle component which assigns a pass/fail
decision to each test. Because test suites are derived from models and not from
source code, model-based testing is usually seen as one form of black-box testing.
The general process for MBT is shown in Figure 4.1 [31]. Based on the Test
Requirements and the Test Plan a Test Model is constructed. The test model is
used to generate test cases that together form the Abstract Test Suite. Because
there are usually an infinite number of possible tests, usually test selection criteria
are adopted to select the proper test cases. For example, different model coverage
criteria, such as all-transitions, can be used to derive the corresponding test cases.
The resulting test cases lack the detail needed by the SUT and as such are not
directly executable. In the third step the abstract test suite is transformed to a
concrete or executable test suite. This is typically done using a transformation
tool, which translates each abstract test case to an executable test case. An
25

Figure 4.1: Process of model-based testing
advantage of the separation between abstract test suite and concrete test suite
is the platform and language independence of the abstract test cases. The same
abstract test case can be reused in different test execution environments. In the
fourth step the concrete test cases are executed on the SUT. A distinction is made
between on-line MBT and off-line MBT. In on-line MBT the concrete test cases
are executed as they are produced. In off-line MBT the test cases are produced
before the execution. The test execution will result in a report that contains the
outcome of the execution of the test cases. In the final, fifth step, these results
are analyzed and if needed corrective actions are taken. Hereby, for each test
that reports a failure, the cause of the failure is determined and the program (or
model) is corrected.
26

4.1.2 Systematic Reviews
A systematic literature review (also referred to as a systematic review) is a means
of identifying, evaluating and interpreting all relevant studies concerning a par-
ticular research question, topic area or phenomenon of interest. The systematic
literature review (SLR) is usually performed to summarize the existing evidence
for a particular topic, identify any gaps in current research to suggest areas for
further investigation and providing framework/background to new research ac-
tivities [32]. The goal of an SLR is a rigorous, trustworthy and auditable method
in order to give a clear, reasonable and unbiased evaluation of a research topic.
The inception of SLR is based on the evidence-based research which was de-
veloped initially in the field of medicine. The success of evidence-based medicine
has triggered many other disciplines to adopt a similar SLR approach, includ-
ing for example psychiatry, nursing, social policy, and education. In a similar
way, evidence-based software engineering is introduced with the guideline for
performing systematic literature reviews in software engineering [33]. The goal of
evidence-based software engineering is to improve the quality of software-intensive
systems, and provide insight to stakeholder groups whether practitioners are using
best practice or not. The aim of an SLR is not just investigate all existing evi-
dence; it is also aim to support the development of evidence-based guidelines for
practitioners. In our study we aimed at identifying and evaluating the evidence
regarding the model-based testing for software safety. Therefore, a systematic
literature review was a suitable research method for our research.
4.2 Research Method
A systematic literature review (SLR) is identification, evaluation and interpreta-
tion of all available research relevant to a particular research questions or topic
area [32]. We conduct the SLR for identifying and evaluating the existing evi-
dence regarding the model-based testing for software safety. For our SLR study,
we follow the guidelines for performing SLRs as proposed by Kitchenham and
27

Charters [32]. The remainder of this section describes our review protocol and
several steps as outlined in the guideline.
4.2.1 Review Protocol
Before the conducting the systematic review firstly we develop a review protocol.
A review protocol defines the methods that will be used to perform a specific
systematic review. The pre-defined protocol reduces the researcher bias. The
adopted review protocol is shown in Figure 4.2.
Figure 4.2: Review Protocol
Firstly, we specified our research questions (discussed in section 3.2) based on
28

the objectives of this systematic review. After this step we defined the search
scope and the search strategy (3.3). The search scope defines the time span and
the venues that we looked at. In the search strategy we devised the search strings
that were formed after performing deductive pilot searches. A good search string
brings the appropriate search results that will come to a successful conclusion in
terms of sensitivity and precision rates. Once the search strategy was defined,
we specified the study selection criteria (section 3.4) that are used to determine
which studies are included in, or excluded from, the systematic review. The se-
lection criteria were piloted on a number of primary studies. We screened the
primary studies at all phases on the basis of inclusion and exclusion criteria. Also,
peer reviews were performed by the authors throughout the study selection pro-
cess. The process followed with quality assessment in which the primary studies
that resulted from the search process were screened based on quality assessment
checklists and procedures (section 3.5). Once the final set of preliminary studies
was defined the data extraction strategy was developed which defines how the
information required from each study is obtained (section 3.6). For this we devel-
oped a data extraction form that was defined after a pilot study. In the final step
the data synthesis process takes place in which we present the extracted data and
associated results.
4.2.2 Research Questions
The most important part of any systematic review is to clearly and explicitly
specify the research questions. Research questions drive the subsequent parts
of the systematic review. Hence, asking the right question is crucial to derive
the relevant findings properly. The more precise the research questions are, the
more accurate the findings will be. In this context, research questions need to be
meaningful and important to both practitioners and researchers. In this paper
we are interested in investigating empirical studies which are done about model-
based testing for software safety. In order to examine the evidence of model-based
testing for software safety, we define the following research questions:
29

• R.Q.1 : In which domains is model-based testing applied?
• R.Q.2 : What are the existing research directions within model-based test-
ing for software safety?
– R.Q.2.1 : What is the motivation for adopting model-based testing
for software safety?
– R.Q.2.2 : What are the proposed solutions in model-based testing for
software safety?
– R.Q.2.3 : What are the research challenges in model-based testing for
software safety?
• R.Q.3 : What is the strength of evidence of the study?
4.2.3 Search Strategy
The aim of the SLR is to find as many primary studies relating to the research
questions as possible using a well-planned search strategy. In this subsection we
describe our search strategy by explaining search scope, adopted search method
and search string.
4.2.3.1 Scope
Our search scope consists of two dimensions which are publication period and
publication venues. In terms of publication period (time), our search scope in-
cludes the papers that were published over the period of 1992 and July 2014. We
search the papers in selected venues which are well-known venues. We use the fol-
lowing search databases: IEEE Xplore, ACM Digital Library, Wiley Inter Science
Journal Finder, ScienceDirect, Springer Link and ISI Web of Knowledge. Our
targeted search items are journal papers, conference papers, workshop papers.
30

4.2.3.2 Search Method
To search the selected databases we used both manual and automatic search. Au-
tomatic search is realized through entering search strings on the search engines of
the electronic data source. Manual search is realized through manually browsing
the conferences, journals or other important sources. The outcome of a search
process can easily lead to a very high number of papers. In this respect, for the
search process it has been pointed out that the relevant studies are selected (high
recall) while the irrelevant ones are ruled out (high precision). Usually depending
on the objectives of an SLR, one of the criteria (recall or precision) can be favored
and used by the investigators. Hereby, a search strategy that focuses on high re-
call only can require too much manual effort of dealing with irrelevant articles
whereas a precise search strategy can unavoidably miss many relevant articles.
To identify the relevant studies as much as possible while reducing the number
of irrelevant ones, Zhang et al. [34] proposed the so-called quasi-gold standard.
Hereby, before defining the search query first a manual survey of publications
is carried out in which the employed search strings are analyzed and elicited.
The resulting search strings are then fed into the search query aiming to find the
optimal set with respect to the recall and precision rates.
We also adopted this approach to reveal better keywords in designating search
strings, and likewise to achieve high recall rate and high precision rate. The
primary studies, which we manually selected in reliance upon our knowledge
of topic, were analyzed in order to elicit better keywords that would optimize
the retrieval of relevant material. The analysis of the articles in the QGS was
carried out by using word frequency and statistical analysis tools. First, the term
frequency, inverse document frequency (TF*IDF) algorithm was operated on the
titles and abstracts of the QGS papers. As stated by Zhang et al. [34], full text
analysis would mislead us into thinking inaccurate keywords as true indicators
because of the titles in the reference section. Also, the keywords of authors were
manually examined to enhance the representative set of words observed. Finally,
a definite set of search strings was obtained.
31

4.2.3.3 Search String
For the automated search we construct a search string after performing a number
of pilot searches to get relevant studies as much as possible. Since each electronic
data sources provide different features, for each data source, we define different
search strings which are semantically equivalent. In order to create more complex
queries we use the OR and AND operators. The following represents the search
string which is defined for IEEE Xplore database:
((”Document Title”:”model based testing” OR ”Document Title”:”model based
software testing” OR
”Document Title”:”model-based testing” OR ”Document Title”:”model-based
software testing” OR
”Document Title”:”model driven testing” OR ”Document Title”:”model driven
software testing” OR
”Document Title”:”model-driven testing” OR ”Document Title”:”model-driven
software testing” OR
”Document Title”:”model based test” OR ”Document Title”:”model based soft-
ware test” OR
”Document Title”:”model-based test” OR ”Document Title”:”model-based soft-
ware test” OR
”Document Title”:”model driven test” OR ”Document Title”:”model driven soft-
ware test” OR
”Document Title”:”model-driven test” OR ”Document Title”:”model-driven soft-
ware test”
) AND (”Document Title”:”safety”))
OR
((”Abstract”:”model based testing” OR ”Abstract”:”model based software test-
ing” OR
”Abstract”:”model-based testing” OR ”Abstract”:”model-based software testing”
OR
”Abstract”:”model driven testing” OR ”Abstract”:”model driven software test-
ing” OR
”Abstract”:”model-driven testing” OR ”Abstract”:”model-driven software test-
ing” OR
32

”Abstract”:”model based test” OR ”Abstract”:”model based software test” OR
”Abstract”:”model-based test” OR ”Abstract”:”model-based software test” OR
”Abstract”:”model driven test” OR ”Abstract”:”model driven software test” OR
”Abstract”:”model-driven test” OR ”Abstract”:”model-driven software test”
) AND (”Abstract”:”safety”))
The search strings for other electronic databases are given in Appendix A . The
result of the overall search process after applying the search queries is given in
the second column of Table 4.1. As shown in the table, we identified in total 462
papers at this stage of the search process. The third column of the table presents
the number of papers where the full texts of papers are available. Since some
studies can be shown in different electronic databases multiple times, we applied
a manual search to find duplicate publications. After applying the last stage of
the search process 20 papers were left.
Source
# of IncludedStudies AfterApplyingSearch Query
# of IncludedStudies AfterEC1-EC3Applied
# of IncludedStudies AfterEC4-EC8Applied
IEEE Xplore 24 20 9ACM Digital Library 9 3 0Wiley Interscience 31 13 0Science Direct 7 7 5Springer 361 252 6ISI Web of Knowledge 30 5 0Total 462 300 20
Table 4.1: Overview of search results and study selection
4.2.4 Study Selection Criteria
Since the search query strings have a broad scope to ensure that any important
documents are not omitted, the automated search can easily leads to a large
number of documents. In accordance with the SLR guidelines we further applied
two exclusion criteria on the large-sized sample of papers in the first stage. The
33

overall exclusion criteria that we used were as follows:
• EC 1: Papers where the full text is not available
• EC 2: Duplicate publications found in different search sources
• EC 3: Papers are written in different language than English
• EC 4: Papers don’t relate to software safety
• EC5: Papers don’t relate to model-based/model-driven testing
• EC6: Papers don’t explicitly discuss safety
• EC7: Papers which are experience and survey papers
• EC8: Papers don’t validate the proposed study
The exclusion criteria are applied manually. After applying these criteria, 20
papers of the 462 papers are selected.
4.2.5 Study Quality Assessment
In addition to general inclusion/exclusion criteria, we also consider to assess the
quality of primary studies. The main goals of this step are providing more de-
tailed inclusion/exclusion criteria, determining the importance of individual stud-
ies once results are being synthesized, guiding the interpretation of findings and
leading recommendations for further research. In this stage, analysis process
includes qualitative and quantitative studies. We develop a quality assessment
based on quality instruments which are checklist of factors that need to be assess
for each study [32]. The quality checklist is derived by considering the factors
that could bias study results. While developing our quality assessment, we adopt
the summary quality checklist for quantitative studies and qualitative studies
which is proposed on [32]. Table 4.2 presents the quality checklist. Since the
aim is ranking studies according to an overall quality score, we deploy the items
in the quality checklist on a numeric scale. We use the three point scale and
34

assign scores (yes=1, somewhat=0.5, no=0) to the each criterion. The results of
assessment are given in Appendix B. These results are used in order to support
data extraction and data synthesis stages.
No QuestionQ1 Are the aims of the study is clearly stated?Q2 Are the scope and context of the study clearly defined?Q3 Is the proposed solution clearly explained and validated by an empirical
study?Q4 Are the variables used in the study likely to be valid and reliable?Q5 Is the research process documented adequately?Q6 Are the all study questions answered?Q7 Are the negative findings presented?Q8 Are the main findings stated clearly in terms of creditability, validity and
reliability?Q9 Do the conclusions relate to the aim of the purpose of study?Q10 Does the report have implications in practice and results in research area
for model-based testing for software safety?
Table 4.2: Quality Checklist
4.2.6 Data Extraction
In order to extract data needed to answer research questions, we read the full-
texts of 20 selected primary studies. We designed a data extraction form to collect
all the information needed to address the review questions and the study quality
criteria. The data extraction form includes standard information such as study
ID, date of extraction, year, authors, repository, publication type and space for
additional notes. In order to collect information directly related to answering
research questions, we added some fields such as targeted domain, motivation for
study, solution approach, constraints/limitations of approach, findings etc. All
related fields to research questions are shown in Table 4.3. We kept a record of
the extracted information in a spreadsheet to support the process of synthesizing
the extracted data.
35

Research Questions Data ExtractedRQ1 Targeted domain
RQ2RQ2.1 Motivation for study, main theme of studyRQ2.2 Requirement specification language, safety model specifica-
tion language, method for generating models from require-ments, type of generated test elements(test case, test oracle,test data etc.), solution approach for test element, test se-lection criteria, test case specification language, method fortest execution
RQ2.3 Constraints/limitation of proposed solution, findingsRQ3 Assessment approach, evidence type (AE, AC, IE, IC)
Table 4.3: Data Extraction
4.2.7 Data Synthesis
Data synthesis is the process of collating and summarizing the extracted data in
a manner suitable for answering the questions that an SLR seeks to answer. At
this stage, we performed a qualitative and quantitative analysis separately on the
data extracted from the reviewed papers. We investigated whether the qualita-
tive results can lead us to explain quantitative results. For example, a primary
study involving an assessment of an automated user assistance technology could
help interpret other solutions quantitatively. However, we also realized that re-
porting protocols differed too much in what we actually collected quantitative
information. The reason behind this is that the papers which are principally
quantitative in nature are also heterogeneous, and the reported data is rather
limited. Hence, a statistical meta-analysis was infeasible and could not be per-
formed in our case. On the other hand, descriptive or qualitative analysis could
be performed smoothly on the reviewed papers.
We made use of tabular representation of the data when feasible, and it en-
abled us to make comparisons across studies. Also, using the quantitative sum-
maries of the results, we inferred the implications for future search, and conse-
quently the existing research directions within model-based software safety.
36

4.3 Results
4.3.1 Overview of the Reviewed Studies
This section presents the overview of the selected 20 studies. Below short sum-
mary of each study is given.
• Study A: In this work, the authors present the requirements in temporal
logic formulas. They generate an automaton model in NuSVM from the c-
source code automatically. They generate the test cases from the automaton
model and requirement specification by using the model checkers SAL and
NuSVM by producing counterexamples. The approach is illustrated using
a case study from automotive domain.
• Study B: In this study, the authors provide an automaton model for safety
properties. The safety model is generated from automaton model. Test
case and test script generation are performed based on the safety model.
They provide a framework for testing process. The proposed approach is
validated by using an industrial case from railway domain.
• Study C: The authors propose a method for model-based testing of AU-
TOSAR multicore RTOS. Firstly, they construct an abstract model to
describe requirements. From this model they generate concrete model in
Promela language with system configuration. Then, from this formal model,
they generate the test cases by model checking. They provide a classifica-
tion tree for test selection. Additionally, they provide a method for bug
analysis. The proposed approach is illustrated using an experiment from
automotive domain.
• Study D: In this study, the authors propose a framework for generating test
cases from a safety model. Firstly, they model the system using FSM (finite
state machine). The FSM models are translated into Promela models. Each
test requirement is formulated as temporal logic expression. In addition to
these models, Markov chain model is used to describe the states of the
37

system. Test case generation is performed by SPIN tool with model check-
ing techniques using the constructed models. They illustrate the proposed
framework on an industrial case from railway domain.
• Study E: In this study, the authors propose a new algorithm for test case
generation to support the testing of onboard systems. Firstly, they produce
the network timed automata model from interaction model of system using
the UPPAAL tool. Then, they generate the test cases from network timed
automata model using the CoVeR model-based testing tool. The proposed
approach is illustrated using a case study from railway domain.
• Study F: In this work, the authors propose a risk based testing method
using the information from FTA. They generate test cases based on the
risk given in FTA. They use the event set notion and transform the event
set into state machine as test model. They mainly focus on generating the
test model from FTA events. The proposed approach is illustrated by using
a automation system.
• Study G: The authors focus on generating test model for the instances in the
system. Firstly, they identify the components and composition operators
in the system. Then, they describe the behavior of components using the
Mealy machines (type of finite state machine) and behavior of composition
operators using -calculus. They define a domain specific language which
uses the components and composition operators to build a system model
from domain description. The proposed approach is illustrated by using a
case study from railway domain.
• Study H: In this paper, the authors focus on the state space explosion prob-
lem in model checking. They propose a multi-object checking approach for
generating scenarios in order to solve state space problem. Firslty, they
define the UML models of the system by using UML-based Railway Inter-
lockings. Then, they propose an approach for generating counterexamples
with multi-object checking. From the UML-based RI models they generate
the counterexamples using the multi-object checking. Based on the coun-
terexamples they generate test cases with multi-object checking method.
38

The approach is illustrated on a case study from railway domain.
• Study I: In this study, the authors propose a model-based test case genera-
tion approach particularly aim feature interaction analysis. Firstly, they de-
fine the functional architecture and behavioral specification to describe sys-
tem specification model. Functional architecture defines the components,
sensors, actuator hardware devices and values such as signals, shared vari-
ables etc. in the system. Behavioral specification describes the behavior of
the system by using the STATEFLOW automata. In order to generate test
cases, the STATEFLOW diagrams are transformed into flow graphs. They
generate the test cases from the flow graphs. The approach is illustrated
by using a case study from automotive domain.
• Study J: In this paper, the authors propose a systematic method for test
case generation based on a preliminary safety analysis report (PSAR). The
report is written in natural language specifies the user’s needs. They con-
vert the PSAR into an explicit system model for scenario-based test case
generation. Then, they design ontology which represents the set of concepts
and their relations with in a domain. They construct the SRP (Standard
Review Plan)-based ontology in XML which will be used to tag PSAR.
Sequence diagram is generated for combining and generating different sce-
nario test cases form the tagged PSAR. The test cases are generated from
the sequence diagrams and their variations. They illustrate the proposed
method using a case study from nuclear domain.
• Study K: In this paper, the authors present an approach for automatic sce-
nario generation from environment behavior models of the system. The
authors define an environmental behavior model rather than system behav-
ior model. The environmental behavior model focuses on the productive
aspects of the behavior. They model the environmental behavior of system
as event trace. Then, they use the AEG tool for generating AEG (attributed
event grammar) model from environment model. The test generator takes
the AEG and derives a random event trace from it and generates a test
drive in C. They illustrate the proposed approach using an experiment from
medical domain.
39

• Study L: In this work, the authors provide an approach for test suite gen-
eration for testing of SPLs. They define their test model as state machines.
For each product in the SPL, they build a test model called as 100% test
model. By combining these models they build a super model called as 150%
test model for SPL. Additionally, they define the test goals for test case se-
lection. Then, they propose an algorithm to generate test cases from the
150% test models using the test goals. They use the Azmun framework as
a test case generator. The proposed method is illustrated on a case study
from automotive domain.
• Study M: In this study, the authors focus on fault detection. They classify
the faults and select most studied classes of faults in the literature. They
use the abstract state machine (ASM) as test model. ASM is the model of
system under test. Based on the ASM and fault class, they generate the test
predicates which describe the test conditions. From the ASM specification
SPIN model checker generates the counterexamples with model checking.
Based on the counterexamples and test predicates the test suite is generated.
They illustrate their approach by using two case studies from automotive
and nuclear domains.
• Study N: In this study, the authors, firstly, define the context model and
scenarios in the system. Context model is a metamodel of the system and
it explains the elements and their relations. The scenarios are presented
in UML sequence diagram of the system. Based on the context model and
UML sequence diagrams, they generate test data. The proposed approach
is illustrated on a case study from robotics domain.
• Study O: In this work, the authors construct the test model as transition
system which includes all possible inputs and corresponding expected out-
puts. And they define a DSL for expressing transition systems. They use
JUMBL tool for test case generation. The proposed approach is illustrated
by using an experiment from robotics domain.
• Study P: In this paper, the authors define the UML class diagrams and
state diagrams to express the requirements. In order to express the rules
40

which define the system behavior, they use the OCL. They generate the
OOAS models from UML diagrams using VIATRA tool. OOAS consists
of a finite set of variables representing the state of system and a finite
set of actions that act upon the variables. They generate the mutants of
the OOAS models. For every OOAS model and its mutants they gener-
ate IOLTS (input/output labeled transition system) as abstract test cases.
IOLTS describe the states and transition relations between these states.
The abstract test cases are converted to EPS (Elektra Periphery Simula-
tor) scripts which present concrete test cases. They illustrate the proposed
method on a case study from railway domain.
• Study Q: In this study, the authors present an approach for generate OOAS
model as test model from UML class and state diagrams. They define a set
of rules for transformation UML diagrams into OOAS model. They imple-
ment a tool for transformation. Additionally they use the Argos tool con-
verts OOAS model to an action system that is the input for their test-case
generator Ulysses. The proposed approach is illustrated by an industrial
case from automotive domain.
• Study R: In this paper, the authors derive the functional model from the
requirement specification in a language called ESTEREL. They also build
verification model in PSL (property specification language). They anno-
tated these models according to defined code coverage metrics and they
produce structural and conformance models. From these models, tests are
generated by esVerify tool by generating counterexamples. The generated
tests are not executable. They are transformed into executable SystemC
tests using the TestSpec generator. The proposed method is illustrated by
using a power state machine.
• Study S: In this paper, the authors propose an approach to transform FBD
(Functional Block Diagram) into timed automata model. Programmable
Logic Controllers widely used in avionics and railway domains. FBD is a
programming language for PCLs. They use a UPPAAL model-checker to
generate test cases from timed automata model. The proposed method is
illustrated using an industrial case from railway domain.
41

• Study T: In this work, the authors, firstly, build the CPN (colored Petri Net)
model based on the system requirement specification. Based on the CPN
model XML file and reachable graph of the CPN model is obtained. They
propose an algorithm APCO (all paths covered optimal) to generate test
cases as XML. From the XML test cases they apply the APCO algorithm
to obtain set of test subsequences. The set of XML test sequences are
generated by using the SPS algorithm (sequence priority selected). The
proposed method is illustrated using an industrial case from railway domain.
Figure 4.3 shows the year-wise distribution of the primary studies.
Figure 4.3: Year-wise distribution of primary studies
We present the overview of the selected primary studies according to publica-
tion channel in Table 4.4. The table includes the publication sources, publication
channels, types of studies and number of studies.
42

Publication ChannelPublication
SourceType
# of
Studies
Electronic Notes in Theoretical Computer
Science
ScienceDirect Conference 3
Information and Software Technology ScienceDirect Article 2
Software Testing, Verification and Validation
Workshops (ICSTW)
IEEE Conference 2
Agent and Multi-Agent Systems Technolo-
gies and Applications
Springer Chapter 1
Autonomous Decentralized Systems
(ISADS)
IEEE Conference 1
Computational Intelligence and Software En-
gineering (CiSE)
IEEE Conference 1
Intelligent Transportation Systems IEEE Conference 1
e & i Elektrotechnik und Informationstech-
nik
Springer Article 1
Formal Methods for Components and Ob-
jects
Springer Chapter 1
High Level Design Validation and Test Work-
shop
IEEE Conference 1
Information Technology and Applications IEEE Conference 1
Intelligent Solutions in Embedded Systems IEEE Conference 1
KI 2010: Advances in Artificial Intelligence Springer Chapter 1
Model Driven Engineering Languages and
Systems
Springer Chapter 1
Software Testing, Verification and Validation
(ICST)
IEEE Conference 1
Tests and Proofs Springer Chapter 1
Table 4.4: Distribution of the studies over Publication Channel
43

According to the table, we can observe that the selected primary studies are
published in highly ranked publication sources such as IEEE, ScienceDirect and
Springer. The journal ”Electronic Notes in Theoretical Computer Science” is one
of the remarkable publication channels that provide rapid publication of confer-
ence proceedings, lecture notes, thematic monographs and similar publications of
interest to the theoretical computer science and mathematics communities. The
other remarkable publication channels are ”Information and Software Technol-
ogy” and ”Software Testing, Verification and Validation Workshops (ICSTW)”.
”Information and Software Technology” focuses on research and experience that
contributes to the improvement of software development practices. ”Software
Testing, Verification and Validation Workshops” focuses on research in all areas
related to software quality.
4.3.2 Research Methods
It is very important to conduct empirical studies with well-defined research
methodologies to ensure the reliability and validity of the findings. Primary stud-
ies are expected to explicitly define and report the used research methodology. In
Table 5 we provide the information about the type of research methods used in
the 20 selected primary studies. There are three types of research methods that
we extracted in the review process. It can be observed that ’case study’ research
method is the dominant method used to evaluate the model-based testing for soft-
ware safety approaches. Also Table 4.5 shows that, in reviewed primary studies,
experiments and short examples are used to analyze and assess their approaches.
Research Method Studies Number Percent
Case Study A, E, F, H, L, N, P, Q, R 9 %45
Experiment C, K, M, O, S, T 6 %30
Short Example B, D, G, I, J 5 %25
Table 4.5: Distribution of studies over Research Method
44

4.3.3 Methodological Quality
In this section, we present the quality of selected primary studies. For this pur-
pose, we try to address methodological quality in terms of relevance, quality of
reporting, rigor and assessment of credibility by using the quality checklist which
is defined in Table 4.2. Therefore, we grouped the first three questions of the
checklist for the quality of reporting, the ninth and tenth questions for the rele-
vance, the fourth, fifth, and sixth questions for rigor, and the seventh and eighth
questions for assessment of credibility of evidence. In Appendix C, we present
the result of quality checklist.
In Figure 4.4, we present the quality of reporting based on the result of first
three questions. The figure shows that 30% of the primary studies are good
according to the quality of reporting.
Figure 4.4: Quality of reporting of the primary studies
In order to the assessment of the primary studies’ quality according to the
trustiness of findings, we assess the rigor of studies. In Figure 4.5 we present
the quality score of rigor of studies based on the result of fourth, fifth, and sixth
questions. According to Figure 4.5 only three primary studies (15%) have poor
quality score. 11 (55%) primary studies are good according to rigor quality score.
Further, 6 papers (30%) of the primary studies are assessed as top quality in
terms of rigor.
45

Figure 4.5: Rigor quality of the primary studies
As another methodological quality measure, we assess the relevance of the
selected primary studies. Figure 4.6 shows the relevance quality scores based on
the evaluation of the ninth and tenth questions. According to the Figure 4.6, 45%
of the primary studies are directly relevant to the model-based software safety
testing and 55% of the primary studies are to some extent relevant to the field.
Figure 4.6: Relevance quality of the primary studies
In order to assess the primary studies in terms of credibility, validity and
reliability of positive and negative findings and major conclusions of the primary
studies, in Figure 4.7, we present the quality score based on results of seventh and
eighth questions. According to our evaluation, there is no primary study that has
full credibility of evidence. Considering the score 1.5 as first-rate, 4 (20%) of the
primary studies are good according to Figure 4.7. The studies having score 1 were
treated as fair and 9 (45%) of the primary studies fall into this category. Seven
46

studies (35%) have poor quality score according to their credibility of evidence.
Figure 4.7: Credibility of evidence of the primary studies
Finally, we summarize by giving the overall methodological quality scores. In
Figure 4.8, total quality of scores is presented in terms of our four criteria: quality
of reporting, relevance, rigor and credibility of evidence. Considering the score 9
and 9.5 as high scores, 4 (20%) of the primary studies have high quality. 9 (45%)
primary studies having scores (7.5, 8.5) have good quality. 7(35%) of the studies
having scores (6, 7) have poor quality.
Figure 4.8: Overall quality of the primary studies
47

4.3.4 Systems Investigated
In this section, we present the results which are extracted from 20 selected primary
studies in order to answer the research questions.
RQ.1: In which domains is model-based testing applied?
In order to answer this research question, we analyzed the targeted domains of the
20 selected primary studies separately. In Table 4.6, we present the categories of
targeted domain that we extracted. There are seven main domains namely, auto-
motive, railway, nuclear, robotics, automation, medical and power consumption.
Figure 4.9 shows the domain distribution of the selected primary studies.
Figure 4.9: Domain distribution of primary studies
As shown in Table 4.6, the category Automotive includes five subcategories
that are car alarm system, cruise control, car door controlling, car application sys-
tem and control system. Study L and Q apply the model-based testing on alarm
systems for cars. Study L performs model-based testing on software product
family of automotive domain. Study M discusses the cruise control system that
automatically controls the speed of a car. In study I, a model-based approach for
48

test case generation approach is described for embedded control systems for cars.
Study A applies the model-based testing on the embedded system application for
cars. Study C discusses the control system in vehicles.
Domain Identified Subcategory Studies
Automotive
Car Alarm System L, Q
Cruise Control M
Car Door Controlling I
Car Application System A
Control System C
Railway
Interlocking System H, P
Control System B, D, G
Onboard System E
Radio Block System T
Battery Control System S
Nuclear Safety Injection System J, M
RoboticsAutonomous Mobile Robots O
Vacuum Cleaner N
Automation Modular Production System F
Medical Infusion Pump K
Power Consumption Power State Machine R
Table 4.6: Identified domains of model-based testing for software safety
In the domain Railway, model-based testing is applied on four different sub-
categories which are railway interlocking system, railway control system, railway
onboard system and train battery control system. Study H and P discuss the
railway interlocking system that prevents trains from colliding and drilling, while
at the same time allowing trains movements. Study B, D and G discuss the
train control system which is an important part of the railway operations man-
agement system. Study E applies the model-based testing on railway onboard
system which is responsible for implementation of over speed protection and safe
distance between trains. Study T applied the model-based testing on battery
49

control systems for trains. Study S discusses the battery control system of train
that manages the power source of the train system.
The domain Robotics includes two subcategories that are autonomous mobile
robots and vacuum cleaner. Study O applies model-based testing on autonomous
mobile robot which behaves like a human and make decisions on their own or
interact with humans. In study N, vacuum cleaner robot is used to verify proposed
model-based testing approach. The robot is able to create a map of its placed
environment, clean the room and avoid collision with living beings.
In the domain Nuclear, study J and M applies model-based testing on safety
injection systems that injects water into the reactor pressure vessel automatically.
In the domain Automation, study F applies the model-based testing on modular
production system. In the domain Medical, study K demonstrates the proposed
solution approach for model-based testing on software which is developed for
infusion pumps. In the final category Power Consumption, study R illustrates
the proposed methodology by using power state machine component which is
used for power management in embedded systems.
As seen in the Table 4.6, the study M appears in two different domains. Since
it includes two different domains, we categorized the study M in both Automotive
and Nuclear domains.
Based on the Table 4.6, approaches for model-based testing for software safety
are applied to different types of domains. Also it can be observed that the Auto-
motive and Railway domains are dominant in the selected primary studies.
RQ.2: What are the existing research directions within model-based
testing for software safety?
With this research question, we aim to identify research directions within model-
based testing for software safety. As defined in section 4.2.2, we divide this
research question into three sub-questions. The first sub-question aims to explain
motivation for adopting model-based testing for software safety, the second sub-
question aims to present existing solution approaches, and the third sub-question
50

aims to report identified research challenges.
RQ.2.1: What is the motivation for adopting model-based testing for
software safety?
Regarding to this research question, we aimed to identify the main reasons for
applying model-based software testing for software safety in the reviewed pri-
mary studies. Based on the result of the data extraction process, we identify the
following reasons:
• reducing cost and development time
Software testing has to be carried out carefully to ensure a test coverage
that can detect the relevant faults. Unfortunately, as we have stated be-
fore, manual testing is often a time consuming process that becomes soon
infeasible with the increasing size and complexity of the software. Also in
case of changes to the software regression testing needs to be carried out
to ensure that no faults have been introduced. Studies C, K, L, P, Q, and
T explicitly describe the reduction of cost and development time as the
reasons for adopting MBT.
• improving the testing coverage
Another main reason is testing coverage which is measurement of software
testing that measures how many lines/blocks/functions of code is tested.
It describes how much of the code which is exercised by running the tests.
As the safety critical systems are growing, it is difficult to achieve high
test coverage and complete testing by using conventional testing methods
such as manual testing and random testing. In study B, C, F, J, M, and R
achieving high testing coverage is discussed.
• improving the testing efficiency and quality
The third main reason is increasing testing efficiency. In study E, L, O,
P, and S increasing testing efficiency is discussed. In the test case gener-
ation process, beside the generation of relevant test cases, redundant and
irrelevant test cases can be generated. Study E indicates that in manual
test case generation, most of the generated test cases can’t be reused and
51

it leads to repeated works when the configuration is changed. Study P
discusses difficulty of quality evaluation of manually generated test cases
regarding efficiency and redundancy. Study O points that when test cases
are generated in unsystematically and in ad-hoc manner, they are described
on a very low technical level of abstraction. Study L discusses the testing
of a software product line. They indicate that testing every single prod-
uct configuration of a software product line individually by using common
testing methods is not acceptable for large software product lines. Addi-
tionally, they points that in order to achieve efficient testing, they should
be able to generate small test suite which covers all test cases in software
product line suitably. Study S focuses on testing of functional block dia-
grams which represent component model of the safety-critical systems. In
this study, program testing of functional block diagrams mostly relies on
manual testing or simulation methods which are inefficient way of testing.
• increasing fault detection
The last main reason is increasing fault detection. In study A, I, M, and R
enhancing fault detection is discussed. Study A indicates that because of
the increasing occurrence of failures in embedded systems in automotive do-
main, number of recalling of cars increases. Therefore, testing is important
to detect faults. Study I points that failures can be discovered by apply-
ing model-based testing. Study M indicates that written test cases can be
used to check the implementation software for faults. The fault detection
capability can be improved by creating suitable test cases. Therefore, by
applying testing process, fault detection can be improved. Study R indi-
cates that designing system-on-a-chip has many challenges. In order to find
faults in design with high potential, test case generation is necessary.
In Figure 4.10, we present the number of studies which include mentioned
four main reasons. As shown in the figure 4.10, one primary study can discuss
more than one main reason. Apart from these main reasons, there are also mi-
nor reasons which are mentioned in reviewed studies. One minor reason is need
for particular set of models for testing. Study G considers the systems which
are build up components connected a network-like structure. It indicates that
52

in these systems, each instance needs its own set of models for testing. Another
minor reason is solving the state space explosion problem in automated verifi-
cation techniques. Study H points that in model checking approach which is an
automated verification technique, when too many objects are taken into account,
state space explosion problem arises.
Figure 4.10: Main motivation for adopting model-based testing for software safety
RQ.2.2: What are the proposed solutions in model-based testing for
software safety?
With respect to this research question, we aimed to present the proposed different
solution approaches in which model-based testing are applied. As described in
Section-2.1, model-based testing consists of five steps that are test model con-
struction, definition of test selection criteria, test case specification, test case
generation, and test execution. Therefore, we give the extracted results in five
subsections in order to explain the proposed solution approaches properly.
While some of the reviewed primary studies have addressed the complete
model-based testing life cycle (described in section 4.1.1), some of them focuses
only on subset of activities. Figure 4.11 presents the number of studies that ad-
dresses particular type of model-based testing steps. All reviewed papers perform
model construction step. Only 3 (15%) of the selected studies define their test
selection criteria. 7 (35%) of the primary studies perform test case specification
53

step. 18 (90%) of the selected studies generate test cases. 13 (65%) of the selected
primary studies execute the generated test scripts.
Figure 4.11: Model-based testing steps
In test model construction step, the models of the system are extracted from
requirements or specification documents. In order to analyze this step, we extract
the information which are existence of safety model, requirement specification
language, model specification language, and used method for model generation
from requirements.
In order to test safety properties of the software, it is quite important to
create safety models from requirements. Only study B, D, and F (15% of the
primary studies) create the specific safety model which describes the safety prop-
erties/functions of the system under test. 85% of the primary studies don’t use
safety model in their studies.
For the requirement specification language, we define two categories: formal
and informal. Five (25%) of the primary studies define the requirements formally.
10 (50%) of the primary studies define the requirements informally. 5 (25%) of the
primary studies don’t specify the requirements. Figure 12 shows the distribution
of number of studies.
54

Figure 4.12: Requirement Specification Language
Model generation from requirements can be performed manually or automat-
ically. In 20 selected studies, we identified that 5 (25%) of the primary studies
generate models from requirements automatically. 15 (75%) of the reviewed pri-
mary studies generate models manually.
For the model specification language, reviewed primary studies used various
different specification languages. In Table 4.7 we present the all extracted meth-
ods from 20 selected primary studies.
In 8 (40%) of primary studies (study B, D, E, F, I, L, M and S) automata
is used as model specification language. Automata are a useful model for vari-
ous different kinds of hardware and software [35]. In study D and F, finite state
machine is used as model specification language. In study E and S, models are
defined as timed automata. In study I, models are described by using StateFlow
which has been adopted from StateChart, allows hierarchical modeling of dis-
crete behaviors consisting of parallel and exclusive decompositions, which makes
it challenging to capture and translate into formal models [36]. In study L, de-
terministic state machine is used to model products in a software product line.
In study M, models are defined as abstract state machine.
In study A, C, G, K, O, R (30% of the primary studies), models are defined
by using domain specific languages which are designed to express statements
55

in particular application domain. In study A, NuSMV language [37] which is
designed for model checking is used to declare models. The verification language
Promela is used in study C as model specification language. Event grammar is
used in study K. Esterel language which is used for the development of complex
systems is used as model specification language in study S. In study G and R, test
models are constructed as a transition system which contains all possible inputs
to the system and usually the corresponding expected outputs.
In 4 (20%) of the primary studies, UML is used to construct models. In study J
and O, UML sequence diagram is used to define test models. UML state diagram
is used as a model specification language in study Q. In study H, UML-based
RI (Railway Interlocking) models are used to define test models. UML-based RI
includes the infrastructure objects and UML to model the system behavior.
In study P and Q, OOAS (Object-Oriented Action System) is used as model
specification language. OOAS is used for formalism of parallel and distributed
systems. Study N defines the models by using Petri Net [38] graphs.
Model Specification Language Number of Studies
Automata 8
DSL (Domain Specific Language) 6
UML Diagrams 3
OOAS (Object-Oriented Action System) 2
Graph 1
Table 4.7: Model Specification Language
For the definition of test selection criteria, most (85%) of the primary studies
are not define the criteria for test selection. Only 3 of the primary studies, study
C, D and L, defines the criteria. In order to define the criteria study C used
Classification Tree, study D used Temporal Logic, and study L defines the test
goals as test selection criteria.
For the test case specification step, most (65%) of the primary studies don’t
56

specify their test case specification language. 6 (30 %) of the reviewed studies
that are study A, J, L, O, R , and S define test cases formally. 1 (5%) of the
primary studies, study D, use an informal language to describe test cases.
Figure 4.13: Test Case Specification Language
For test case generation step, only 2 of the primary studies, study G and Q,
don’t generate test cases. They perform only model construction step. Therefore,
there is no extracted data for test case generation step regarding these studies.
Additionally, study P generates test data and test oracle.
Figure 4.14: Generated type of test elements
57

As understand from the previous paragraph, in some reviewed studies test
data (inputs and outputs), test sequences, test scenarios, test oracles and test
scripts are generated beside of the test cases. In Figure 4.14, we present number
of the studies and the generated type of test elements. The reviewed studies,
except the studies G, Q and P, generate test cases. The studies B, D, F, K, L, M
and O generates test scripts which is a set of instructions in order to test system
functions correctness. The studies A, O, and R generate test data that is the
data which is used for testing of system. The studies C, D, and M generate test
sequence which is the set order of steps and actions comprising a test or test
run. Test oracle is a mechanism that decides whether system has passed or failed
a test. The study O generate test oracle. The studies B and T generate test
scenario that represents the set of actions in order to test the functionality of the
system.
In order to generate types of test elements (test case, test script etc.) reviewed
studies proposes various different type of solution approaches. In Table 4.8 we
present the proposed solution approaches for generating test elements.
Solution Approach Number of Studies
Tool 8
Model checking 3
Not specified 2
Graph Algorithm 3
Algorithm 1
Multi-object checking 1
Model transformation 1
DSL 1
Table 4.8: Solution Approaches for Generated Types of Test Elements
As seen from the Table 4.8, 8 (40%) of the primary studies use existing model-
based testing tools. Study E uses CoVeR tool [39] to generate test cases auto-
matically based on timed automata theory. CoVeR is a model-based testing tool
58

which allows its users to automatically generate test suites from timed automata
specifications of real-time systems. Study K generates test cases and test scripts
by using AEG-based (Attributed Event Grammar based) generator. It is used
for automation of random event trace generation in order to generate desired test
cases and test scripts. Study L uses a model-based testing tool Azmun as test
case generator which is based on the model checker NuSMV [37] to generate test
cases of products in software product line. Study M uses a tool [40]. Study O
uses JUMBL (J Usage Model Builder Library) tool [41] which is a model-based
testing tool for statistical testing in order to generate test cases and test scripts.
Study Q uses VIATRA tool to generate OOAS models from UML diagrams using.
Study R uses TestSpec Generator in order to generate executable test suites from
abstract test suites. Study S uses the UPAAAL tool based on model checking to
generate test cases from models.
The second most used solution approach is model checking. 3 (15%) of the
reviewed primary studies used model checking to generate test elements. Model
checking is a technique used for formal verification of the system automatically.
The main purpose of the model checking is to verify a formal property given as a
logical formula on a system model. Model checkers are formal verification tools
which capable of providing counter examples to violated properties [42]. Study
A used SAL and NuSMV model checkers to generate test case and test data.
SAL (Symbolic Analysis Laboratory) [43] is a framework which is used for model
checking of transition systems. NuSVM [37] is a model checker based on binary
decision diagrams. It is designed to be an open architecture for model checking.
In study C, they aim to find both test cases and execution sequence by using
model checking techniques. Study D uses the SPIN [44] model checker tool in
order to generate test cases and test scripts. SPIN is a general tool for verifying
the correctness of distributed software models automatically.
In three of the reviewed studies, graph theory is used to generate test cases.
In study I, they use path finding algorithm on a graph to generate test case.
Study N uses search based algorithms to generate test data. The study T uses
the all paths covered optimally graph algorithm to generate test cases.
59

Study J defines a new algorithm which generates test cases by extracting
the data from the tagged PSAR (Preliminary Safety Analysis Report). The
extracted data generate the sequence diagram to product test information. Study
H uses a multi-object checking in order to generate test cases. In model checking
techniques, if too many objects are taken into account, state space explosion
problem arises. Therefore they use multi-object checking which outwits the state
space explosion problem by checking one object at a time. Study O generates
test data and test oracles by using model transformations by conforming model
instances to the metamodel. Study G uses a domain specific language (DSL) to
define test models.
Test execution can be done by manually or automatically. For this step, 13
(65%) of the primary studies, study B, C, D, F, K, L, M, N, O, P, R, S, and T
executes tests automatically. Seven of the primary studies doesn’t state explicitly
whether they run their tests or don’t.
With this research question we also extracted information about contribution
provided by the reviewed primary studies. 15 (75%) of the primary studies pro-
pose a method in order to model-based testing for software safety. 4 (20%) of
the primary studies implement a framework, only one of the reviewed primary
studies a tool to test software safety by using model-based techniques.
Figure 4.15: Contribution type
60

RQ.2.3: What are the research challenges in model-based testing for
software safety?
This research question is aimed to reveal the research challenges which are ex-
tracted from primary studies for further advancements. With respect to this
question we identified some research challenges that include problems in reviewed
studies and future research directions.
• Model-based testing for domain specific applications
All reviewed papers discuss model-based testing for particular application
domains such as automotive, railway etc. There seems to be a clear impact
of the specific domain on the model-based testing process. The question
here is whether we could provide a general purpose MBT approach without
considering a particular domain. For this purpose, how the application
domains impact the MBT process should be investigated.
• What is the impact of the context on MBT? How to model context in/for
MBT?
Some of the reviewed papers indicate that existing standard test descrip-
tions don’t support to express changes in the context. For some domains
such as autonomous systems, safety testing has some challenges due to some
reasons: Firstly, the system behavior is highly context-aware. Additionally,
context is complex and its specification could be large. Thirdly, changes
in system behavior and context should be handled to capture the require-
ments. In order to solve these problems, study P defines a context model
and scenario-based behavior specification languages. The context model
captures domain knowledge about context of the system systematically. In
regard to the system behavior, scenario-based behavior specification cap-
tures the behavior of system in case of a test context.
• What are the required metrics for validating/evaluating the MBT elements
including model, test case specification, test case etc.?
As explained before, model-based testing consists of several steps. In each
step, at least one element is produced to complete MBT process. However,
61

after each generation of MBT elements, the quality of the generated ele-
ment should be evaluated. In some reviewed studies, they propose a new
metric or use existing metrics to assess the testing quality. In study O,
they define context related coverage metric and scenario related coverage
metric in order to measure testing coverage. In reviewed studies, there isn’t
stated/proposed metric to evaluate for other types of MBT elements.
• How to compose models for generating test cases in MBT?
Some of the systems are composed of components that connected a network-
like structure. In study G, these systems are discussed. Each instance of
these systems requires its own set of model to generate test cases. How-
ever, creating a test model for each instance could be costly. Therefore,
they propose a component-based solution to generate test models by using
general information. They create test model components from requirement
specification and they translate these models by using the domain-specific
information.
• How to define MBT for software product families?
Software product line (SPL) is an engineering approach for the systematic
software reuse in order to reduce the cost and development time, improve
the software quality. Since every product needs its own configuration in
large SPLs, SPL testing approaches are not able to test efficiently large
SPLs. Additionally, testing each product in SPLs individually is time con-
suming process. For these reasons, in study L propose a new approach for
testing of SLPs. They implement an algorithm which generates a set of test
cases from complete test model that consist of all test models of an SPL as
special cases. They generate test cases which satisfy the required coverage
criteria. After the test case generation, they applied selection criteria on
generated test cases in order to represent all subsets of product features in
the SPL.
• How to apply MBT for testing systemic behavior?
In some reviewed studies, they use behavioral models for test case genera-
tion. Study G focuses only creating proper test models for the embedded
control systems. In order to handle the complexity of these systems, they
62

propose a component-based approach. They identify the candidate com-
ponents which represent the behavior of system. They use Mealy machine
(finite-state automata) in order to describe the behavior of the components.
They define a DSL which describes components and operators to build a
system model as a test model. Study I describes the behavioral models of
system by using Stateflow (finite-state automata) models. In study H, they
used UML sequence diagrams to define their behavioral models.
• How to integrate MBT with other V& V approaches?
The main purpose of the model checking is to verify a formal property
given as a logical formula on a system model. Model checkers are formal
verification tools which have capability of providing counterexamples to
violated properties. In some reviewed studies (study C, D), model checking
is used to interpret both counterexamples to find test cases and the test
cases to find execution sequence. However, study H indicates that model
checking techniques suffer from state space explosion problem when the
system has too many objects. Hence, they propose multi-object checking
approach to handle the state space explosion problem.
• How to define a generic test model to express safety properties/functionalities
of the system?
In reviewed studies, only four of the primary studies have specific safety
model to use it test case generation process. Three of these papers define
their safety properties using automata. One of them defines a DSL in order
to specify safety model. Based on these results, none of the reviewed papers
provide a generic approach to generate test model. However, in [42], the
authors propose a UML profile on architectural level aim to provide a tool
for formal verification and validation techniques such as model checking and
runtime verification.
• How to generalize the safety requirement specification in order to generate
test models?
Based on the data extraction results only four of the primary studies ex-
press the requirements by using formal language. Two of these studies use
temporal logic formulas to indicate the requirements. The other studies
63

use fault tree and UML State Diagrams. As a result, there is no proposed
generic approach to express safety requirements.
RQ.3: What is the strength of evidence of the study?
As we mentioned before, it is important that users of SLR to know how much
confidence they can have in results and findings arising from that SLR. Hence,
third research question is defined to address strength of evidence based on the
selected primary studies. In the literature, there are several systems for grad-
ing the strength of the evidence. In this work, we used the definitions from the
GRADE (Grading of Recommendations Assessment, Development and Evalua-
tion) [29] working group which is developed for grading the quality of evidence and
strength of recommendations. GRADE approach specifies four grades of strength
of evidence which is given in Table 4.9 (adopted from [29]). The strength of evi-
dence is determined by four key elements which are study design, study quality,
consistency and directness.
Grade Definition
High Further research is very unlikely to change our confidence in the
estimate of effect
Moderate Further research is likely to have an important impact on our con-
fidence in the estimate of effect and may change the estimate
Low Further research is very likely to have an important impact on our
confidence in the estimate of effect and is likely to change the esti-
mate
Very Low Any estimate of effect is very uncertain
Table 4.9: Definitions for grading the strength of evidence
Regarding the study design, the GRADE approach gives higher grade to ex-
periments than to observational studies. In this work, 6 (30%) of the selected
primary studies are experimental type. Table 4.10 shows the average quality
scores related to experimental studies. Thus according to GRADE approach, our
64

first categorization of the strength of evidence in this review from the perspective
of study design is low.
Experimental Studies C, K, M, P, T
Number of Studies 6
Mean quality score 8,4
Table 4.10: Average Quality Scores of Experimental Studies
With respect to quality of studies, in general, issues of bias, validity and
reliability are not addressed explicitly. Additionally, none of the selected primary
studies got full score from our study quality assessment criterion. 9(45%) of
the selected primary studies stated their findings clearly in terms of credibility,
validity and reliability. Besides, none of the selected primary studies discuss the
negative findings clearly. Based on these findings, we can conclude that there
are some limitations to the quality of the selected primary studies due to the low
quality scores.
Regarding the consistency which addresses the similarity of estimates of effects
across studies, we realized that there are little differences among articles. Because
of the results of the primary studies are presented both objectively and empir-
ically, we didn’t conduct a sensitivity analysis by excluding studies which have
poor quality. Since the outcomes of reviewed primary studies are not presented in
comparable way and reporting protocols vary from study to study, evaluating the
synthesis of quantitative results will be not feasible. This causes us to perform
the data synthesis in a more qualitative or descriptive way which is not desired.
Based on these findings, we can conclude that in general results have consistency.
Directness refers to the extent to which the people, interventions, and out-
come measures are similar to those of interest. In this context, people refer to
the subject of the study; intervention refers to the applied model-based testing
approaches. With respect to the people, none of the selected primary studies
used human subjects. Regarding the intervention, in the selected primary stud-
ies, various types of model-based testing approaches are used. With respect to
65

the outcome measures, seven (35%) of the primary studies performed in indus-
trial settings. Based on these findings, the total evidence based on directness of
the primary studies is low.
Combining the four key elements of study design, study quality, consistency,
and directness for grading the strength of evidence, we found that the strength of
evidence in a low grade. This means that the estimate of effect that is based on
the body of evidence from current research can be considered uncertain. Further
research is required to gain a reliable estimate of effects of model-based testing
for software safety.
4.3.5 Threads to Validity
One of the main threats to validity of this systematic literature review is the pub-
lication bias. The publication bias indicates the tendency of researchers to more
likely publish positive results. In order to deal with this bias, as recommended in
[31], we developed a research protocol and constructed research questions. After
this we define our search scope and search method clearly. Since we decided to
search papers automatically, we construct our search string according to target
of this systematic literature review. Another important issue is here incomplete-
ness which results in search bias. The risk of this threat highly depends on used
keywords in search string. In order to reduce this risk we used an iterative ap-
proach in keyword list construction process. In order to achieve largest set of
targeted search items, we performed some pilot searches on search engines of se-
lected electronic databases by constructing a keyword list. When the keyword
list was not able to find the targeted studies, new keywords were added to list
or some keywords are deleted from the list. However, it is still possible to miss
some relevant literature papers. One such instance is the existence of gray lit-
erature such as technical reports, MSc and PhD theses, and company journals.
In our case, this literature can be important if the authors report the complete
study and validated it by using a case study. In this review, we did not include
such information. Another risk of the incompleteness is that the searches on elec-
tronic databases are inconsistent in search engines. Those databases have limited
66

capabilities in terms of performing complex search strings. This could lead to
irrelevant studies being selected. Therefore, we defined a selection criteria and
applied inclusion/exclusion procedures on primary studies manually. Thereby,
we tried to reduce the publication bias and search bias as much as possible by
adopting the guidelines and defining criteria.
After the primary studies selected and evaluated, we performed the data ex-
traction in order to derive the review result. In this process, if data extraction
isn’t modeled in a well-defined way, this can be causes data extraction bias. In
order to define the data extraction model, we read a set of randomly selected
papers. Each of them was used to construct initial data extraction form based on
previously defined research questions and we performed pilot data extraction on
randomly selected primary studies. After the pilot data extraction process, we
added some fields to the form in order to capture relevant results. Furthermore,
to eliminate the unnecessary or irrelevant results we removed some fields from the
data extraction form. To reduce the data extraction bias, we applied this several
times and after a number of iterations and discussions we constructed the final
data extraction model.
4.4 Conclusion
In this work, we have presented the methodological details and results of a sys-
tematic literature review on model-based testing for software safety. To the best
of our knowledge, there is no previous systematic literature study has been per-
formed before on this domain. We tried to systematically identify, analyze, and
synthesize the findings of the published literature since 2005. We identified 462
papers from the searching literature, and 20 of them were found as relevant pri-
mary studies to our research questions. Based on this review, we analyze the
current model-based testing approaches for software safety and present the re-
sults to help the researchers and identify the future research directions.
With respect to our research questions, we present the domains in which
67

model-based testing applied. We have reported the reasons to apply model-based
software testing for software safety in reviewed primary studies. Additionally,
we present the existing solution approaches for model-based testing for software
safety area. Finally we identify the research challenges to provide future research
directions.
The existing model-based testing approaches have clear impact on software
safety testing. However, these solution approaches have some limitations. Firstly,
these solutions are based on specific domains. Another limitation is that most
of the studies consider the small part of the system. Therefore, they don’t have
complete model of the system and they couldn’t evaluate their solution properly.
Additionally, most of the proposed solutions have low performance in terms of test
case generation methods. As a result, the main argument is that can we provide
a model-based testing approach which removes or decreases these problems for
software safety.
As a summary, this work can be considered as a roadmap to describe the
current state of model-based testing for software safety. We believe that the
results of our systematic literature review will help to improve the model-based
testing for software safety area and we hope that the extracted results will become
useful in developing new approaches.
68

Chapter 5
Software Safety Perspective
An important concern for designing safety-critical systems is safety since a failure
or malfunction may result in death or serious injury to people, or loss or severe
damage to equipment or environmental harm. It is generally agreed that quality
concerns need to be evaluated early on in the life cycle before the implementation
to mitigate risks. For safety-critical systems this seems to be an even more
serious requirement due to the dramatic consequences of potential failures. For
coping with safety several standard and implementation approaches have been
defined but this has not been directly considered at the architecture modeling
level. Hence, we propose the safety perspective that is dedicated to ensure that
the safety concern is properly addressed in the architecture views.
In this chapter, firstly we explain the proposed safety perspective approach.
Then, we show the application of the proposed approach on the case study de-
scribed in section 3. Finally, we present the application of the safety perspective
on Views & Beyond architecture framework.
69

5.1 Safety Perspective Definition
In order to provide tactics and guidelines to handle safety in architectural level,
the safety perspective is defined based on the following guidelines as defined by
Rozanski and Woods [7] :
• The perspective description in brief in desired quality
• The perspective’s applicability to views to show which views are to be af-
fected by applying the perspective
• The concerns which are addressed by the perspective
• An explanation of activities for applying the perspective to the architectural
design.
• The architectural tactics as possible solutions when the architecture doesn’t
exhibit the desired quality properties the perspective addresses
• Some problems and pitfalls to be aware of and risk-reduction techniques
• Checklist of things to consider when applying and reviewing the perspective
to help make sure correctness, completeness, and accuracy
Based on the above-mentioned guideline, Table 5.1 presents the brief description
of the proposed safety perspective definition. In following subsections we discuss
the each point.
70

Desired
QualityThe ability of the system to provide an information about
safety-related decisions and ability to control and monitor the
hazardous operations in the system
Applicability Any systems which include hazardous or safety-critical oper-
ations
Concerns Failures, Hazards, Risks, Fault Tolerance, Availability, Relia-
bility, Accuracy, Performance
Activities Identify hazards, Define risks, Identify safety requirements,
Design safety model, Assess against safety requirements
Architectural
TacticsAvoid from failures and hazards, Define failure detection
mechanisms, Mitigate the failure consequences
Problems and
PitfallsDescribing the fault tolerance, No clear requirements or safety
model, Underestimated safety problems
Table 5.1: Brief description of the safety perspective
5.1.1 Applicability to Views
Table 5.2 shows how the safety perspective affects each of the Rozanski and
Woods’ architectural views as described in section 2.1.2. For all the seven views
the safety perspective seems to be useful and can reshape the corresponding view.
71

View Applicability
Functional
View
The functional view allows determining which of the system’s
functional elements considered as safety critical.The functional
view allows determining which of the system’s functional ele-
ments considered as safety critical.
Information
View
The information view helps to see the safety-critical data in the
system
Concurrency
View
The concurrency view defines which system’s elements executed
concurrently. Safety design may imply isolate or integrate some
elements in runtime. Therefore this will affect the system’s con-
currency structure.
Development
View
Applying this view can help to provide a guideline or constraints
to developers in order to raise awareness for the system’s safety
critical elements.
Deployment
View
The deployment view provides information about the environ-
ment into which the system will be deployed. Therefore, apply-
ing this view can help to determine the required hardware, third-
party software requirements and some constraints for safety.
Operational
View
The operational view helps to understand how the system will
be operated, managed, and supported in runtime environment.
Since safety implementation includes critical and complex opera-
tions, operational view needs to consider safety critical elements
to describe system’s operation properly.
Context
View
The context view provides information about the external en-
tities and shows the interaction between them and the system.
Therefore, applying this view can help to understand which types
of users will use the system and which external systems are nec-
essary in order to make sure the system operates correctly.
Table 5.2: Applicability of safety perspective to Rozanski and Woods’ views
72

5.1.2 Concerns
The basic concerns of safety can be derived from the broad literature on software
safety. We describe these shortly.
Failures
Failure is an event where a system or subsystem doesn’t exhibit the expected
behaviors which are documented in system’s requirement specification. Failures
can be oriented software or hardware [2]. Logical errors which are mostly results
of the developer’s errors in coding phase can cause failures. In addition, a mistake
in the design step of the system development lifecycle brings failure.
Hazards
Hazard is a presence of a potential risk situation that can result or contribute
to mishap [2]. Hence, hazard is a potentially dangerous situation. In order
to make sure the safety of the system, possible hazards in the system should be
identified, controlled and prevented. To give an example, misrouted trains, signal
faults, engine stop and breaking system faults are can be considered as hazards
of safety-critical systems in railway domain [45]. For each identified hazard,
there should be at least one hazard control method for preventing the hazard,
reduce the possibility of hazard occurrence or decrease the impact of the hazard.
To create a proper hazard control method, hazard causes should be identified
rigorously. Hazard control methods use hardware, software or combination of
them to prevent the hazards.
Risks
Risk is combination of the probability of occurrence of loss and the severity of
that loss [1]. The terms hazard and risk can be used interchangeably. However,
there is a difference between them. Hazard is a potential source that can result of
harm, while risk presents the likelihood of the harm if hazard exposes. In order
to conduct risk assessment process, severity and probability of hazard occurrence
should be identified. These values allow hazards to be prioritized and risks to
73

be managed [2]. This provides the basic information required to decide on the
acceptability of design proposals and the steps that are necessary to reduce risks
to acceptable levels.
Fault Tolerance
Fault tolerance is the ability of the system to continue properly in the unwanted
event or failure and maintain a safe operational condition. Depending on the
failure and the failure tolerance mechanism, the system may operate normally or
with reduced functionality. While a failed system is not good, it may still be safe.
Failure tolerance becomes a safety issue when the failures occur in hazard controls.
Since, failures affect all system behavior; creating fault tolerance requires system-
wide approach [2].
Availability
Availability is the degree to which a system is in a specified operable and commit-
table state at the start of a mission. Since the safety-critical systems are generally
real-time systems, the system should be available as much as it can. Failures in
the system reduce the availability of the system. As such, for designing a system
for availability, the hazards and failures should be identified and their causes are
clearly determined. Additionally, the result of the hazard identification and risk
definition should be analyzed and under which failures and hazards the system
going to fall down for availability. Fault tolerance analysis should be conducted
for availability.
Reliability
Reliability is the ability of a system to perform a required function under given
conditions for a given time interval. Reliability does not consider the consequences
of the failures, but only the existence of failures [46]. For establishing the system
reliability, the number of failure/hazard occurrence should be calculated in a
specified amount of time. Designing a system for reliability usually involves fault
tolerance analysis of the system.
74

Accuracy
Accuracy defines the functional correctness of the system that presents a behavior
according to the specifications of the functions it should provide [47]. Since safety-
critical systems include critical operations that must operated correctly from the
safety aspect, accuracy of the system should be handled carefully. Additionally,
fault tolerance is quite related to accuracy of the system.
Performance
Performance is mostly about the response time of a system. For the performance
the questions how quickly the system reacts to user need, how much the system
can capable to accomplish within a specified amount of time should be answered.
The response time of the system should be acceptable level. In architectural level,
performance testing should be planned properly.
5.1.3 Activities for Appliying Safety Perspective
The activity diagram in Figure 5.1 summarizes the process for applying the safety
perspective.
Figure 5.1: Appliying the safety perspective
75

The first step includes the identification of the hazards followed by the defini-
tion of risks. This is followed by identifying and detailing the safety requirements.
After the safety requirements safety models are designed and the safety require-
ments are assessed. In the following sub-sections we describe this process in more
detail.
5.1.3.1 Identify Hazards
In order to identify safety requirements, the potential cause of hazards should
be defined. To identify and classify the hazards preliminary hazard analysis
can be conducted. This process should include the list of all hazards and their
probable causes such as software-based, hardware-based and environment-based.
In addition to the theoretical analysis and brainstorming in development team,
hazard analysis of similar existing systems can be examined to identify hazards.
Moreover, a prototype or model can be used to analyze normal and abnormal
scenarios that may cause hazards. Additionally, a conversation can be carried
out with a domain expert in order to obtain hazard information [48]. For hazard
identification, hazard severity should be defined for each hazard in the system.
Different studies such as [2], [28], [49] propose severity classification for hazards.
Hazard severity levels are defined as shown in Table 5.3 which is adopted from
[49].
Severity Class DefinitionCatastrophic Death, system loss or severe environmental damageCritical Severe injury, severe occupational illness, major system or
environmental damageMarginal Minor injury, minor occupational illness or minor system or
environmental damageNegligible Less than minor injury, occupational illness or less than minor
system or environmental damage
Table 5.3: Hazard Severity Levels
76

5.1.3.2 Define Risks
After the hazard identification step, estimation of probability of hazard occur-
rence for each hazard should be carried out in order to define risks. Various
studies such as [2], [49] propose probability levels for hazards. Table 5.4 shows
the occurrence definition for hazard which is adopted from [49]. After deter-
mining severity and likelihood of occurrence of hazards, these findings should be
documented in a proper way. The documentation should include hazard descrip-
tion, hazard cause(s), hazard consequence(s), hazard severity and probability of
hazard occurrence.
OccurrenceClass
Definition
Frequent Likely to occur frequently (More than 10−3)Probable The event will occur several times in the life of an item. (10−3
to 10−5)Occasional Likely to occur sometime in the life of an item. (10−5 to 10−7)Remote Unlikely but possible to occur in the life of an item. (10−7 to
10−9)Improbable So unlikely, it can be assumed occurrence may not be experi-
enced (Less than 10−9)
Table 5.4: Hazard Probability Level
Based on the hazard severity and hazard occurrence class identification, risks
should be assessed. As proposed in studies [2], [28] and [49] Hazard Risk Index
creation should be carried out to prioritize the hazards and make risks manage-
able. Table 5.5 and 5.6 show an example of hazard risk index and example risk
categorization which are adapted from [49]. After the risk definition, risk as-
sessment should be conducted by methods such as fault tree analysis, event tree
analysis, simulation etc.
77

Severity ClassPossibility of Occurrence Catastrophic Critical Marginal NegligibleFrequent 1 3 7 13Probable 2 5 9 16Occasional 4 6 11 18Remote 8 10 14 19Improbable 12 15 17 20
Table 5.5: Hazard Risk Index
Risk Assessment Value Risk Category1-5 High6-9 Serious10-17 Medium18-20 Low
Table 5.6: Hazard Risk Categorization
5.1.3.3 Identify Safety Requirements
After the hazard identification and risk assessment, software safety requirements
should be determined to construct a safety model. Safety requirements can be
identified by using different methods. One of the methods for identifying safety
requirements is preliminary hazard analysis [2]. This method looks into the sys-
tem from the point of view of hazards. The causes of hazards are mapped to
the software, and hazard control features are identified as safety requirements.
Another method is top-down analysis of system requirements and specifications
[2]. In this method system requirements identify system hazards and specify
safety-critical functions in the system. Fault Tree Analysis (FTA) can be carried
out to identify safety-critical functions. These functions can be mapped to safety
requirements. The study [50], proposes a method includes functional hazard anal-
ysis and preliminary system safety analysis to identify the safety requirements.
Functional hazard analysis identifies the hazards and failures. Preliminary system
safety analysis maps failure conditions to safety requirements. Additionally, some
methods combine the several existing techniques to derive safety requirements.
78

5.1.3.4 Design Safety Model
While designing the safety-critical systems, having only generic system’s models
is usually not adequate. There should be also specific safety model in order to
present safety-critical elements or components in the system. The safety model
helps to understand and improve the overall system properly. Safety model can be
derived from safety requirements. Various studies such as [51], [52], [53] propose
an approach to design safety model. One way to create a safety model of the
system is defining an extension mechanism to UML models. UML extension can
be achieved by adding stereotype to UML diagrams. Another approach to design
a safety model is defining a domain-specific language. Another way to express
safety model is using automata.
5.1.3.5 Assess Against Safety Requirements
After designing the system’s safety model, it should be assessed to check whether
it is consistent with identified safety requirements. The assessment can be done
by tracing the checklist which is provided in section 3.6. Additionally, a third
authority can carry out the assessment process. Moreover, some safety cases can
be created and model is assessed through these safety cases. If there is a conflict
between identified safety requirements and safety model, the safety design model
should be reworked and fixed. This process should be continued until no conflict
is found.
5.1.4 Architectural Tactics
Architectural tactics can be considered as possible solutions when the architecture
does not exhibit the required quality properties addressed by the perspective.
Different studies such as [54], [55], [56] have proposed architectural tactics or
patterns for supporting safety design. In [56], Wu and Kelly propose safety tactics
by adopted SEI’s tactic work. In the following we describe important selected
tactics.
79

5.1.4.1 Avoid from Failures and Hazards
An important tactic includes approaches for avoiding from failures and hazards.
One way for doing this is making the system as simple as possible. If the system
has simple and small number of components, the possibility of occurrence of
the failure will be decrease and the system will becomes safer. However, safety-
critical systems are in general complex systems and the application of this tactic
could be challenging. An alternative tactic for avoiding from failures is to apply
redundancy. The simplest form in this category is replication which is copying of
components in order to detect hardware failures. Another technique to avoid from
failures and hazards is N-version programming proposed by Chen and Avizienis
[57]. N-version programming helps to improve software safety. In N-version
programming technique, independent development teams use same specification
to develop multiple versions of the system. In this context, different designs can
be created for each version of the system in order to determine design faults from
safety perspective.
5.1.4.2 Define Failure Detection Mechanisms
If hazards and failures occur, system should be able to handle them. In order to
detect the failures, failure detection mechanisms can be derived from safety re-
quirements. A fault detection mechanism can be a software or hardware function
that can be able to detect a defined set of faults. In the literature, there are some
studies such as [58] which derive failure detection methods from software safety
with model-driven approaches. In these approaches, generally safety requirements
are identified and refined. The possible fault detection mechanisms are created as
a library and using model-driven techniques, a proper fault detection mechanism
is determined which fulfills at least one safety requirement.
80

5.1.4.3 Mitigate the Failure Consequences
At the architecture design level, based on the hazard identification and risk def-
inition, consequences of failures can be predicted and reduced/prevented. There
are several ways for realizing this. Redundancy is one way to reduce impacts of
failure consequences as described in section 5.1.4.1. Replication also can be used
for mitigation the failure consequences. In the design process, these redundant
components should be identified. Another form of redundancy is implementing
independent components to detect the hardware and software failures. In ad-
dition to these tactics, there are some well-known methods which provide the
combination of these tactics. One of these techniques is heartbeat which offers a
mechanism for periodically monitoring the aliveness and arrival rate of indepen-
dent runnables. It is based on receiving a signal or message from a component,
device, subsystem, or system. The signal/message shows the health status of
that system. If the signal/message is received in a pre-defined time interval, this
means that system is working properly. However, if the signal/message is not re-
ceived in an interval, this means there can be a fault in the system. This fault can
lead to catastrophic hazards in safety-critical system. Therefore, some predefined
operations should be carried out in this case. By using the heartbeat method,
failures/hazard can be detected and the impact of the failure consequences can
be reduced.
5.1.5 Problems and Pitfalls
In this section, we provide the potential safety problems and pitfalls as well as
the risk-reduction techniques.
5.1.5.1 Describing the Fault Tolerance
As we have stated before fault tolerance is one of the important approaches for
increasing safety in safety-critical systems. However, even if the system fails it
may still be safe. To cope with safety it is important to explicitly identify the
81

failures that lead to unsafe situations. For this, the following needs to be carried
out:
• Analyze the architectural model especially the functional and deployment
views to define the possible failures in the system
• Review the architecture in several failure scenarios and check what impact
the failures have on system’s safety.
• Ensure that safety design has some configurations when the unexpected
situations occur, the system fails safely
5.1.5.2 No Clear Requirement Description or Safety Model
As in normal systems, the requirements for safety-critical systems are also defined
in the software requirements specifications. Several problems can be based due to
the improper preparation of the SRS. The SRS might be imprecise, incomplete or
ambiguous regarding safety requirements. Because the developed safety models
are based on the defined requirements, these can also be inappropriate regarding
safety. The following steps can be carried out to mitigate these risks:
• Try to transform requirements into clear and consistent representation with
domain experts
• When identifying the requirements use plenty of different examples with
stakeholders
5.1.5.3 Underestimated Safety Problems
While designing the system, some important possible faults could be missed be-
cause of the lack of domain knowledge of the system designers. Since these faults
can lead to failures, safety of the system can decrease. Risk reductions in this
context are the following:
82

• Design the safety model with external domain experts
• Try to analyze the similar systems in order to gain insight about the safety
problems in the similar safety-critical systems
5.1.6 Checklist
In this section, we provide checklist for requirements capture and architecture
definition to consider when applying and reviewing the perspective to help make
sure correctness, completeness, and accuracy. Table 5.7 presents the checklist.
#Item Item Definition[CH1] Have you identified safety-critical operations in the system?[CH2] Have you identified possible failures and hazards in the system in-
cluding causes and consequences of them?[CH3] Have you worked through the hazard severity and occurrence infor-
mation to define the risks in the system?[CH4] Have you identified availability needs for safety of the system?[CH5] Have you worked through example scenarios with your stakeholders
so that they understand the planned safety risks the system runs?[CH6] Have you reviewed your safety requirements with external domain
experts?[CH7] Have you addressed each hazard and risk in the designed safety
model?[CH8] Is the design of safety model as simple as possible and highly mod-
ular?[CH9] Have you identified safe states and fully checked and verified them
for completeness and correctness?[CH10] Have you produced an integrated overall safety design of the sys-
tem?[CH11] Have you defined the fault tolerance of the system?[CH12] Have you applied the results of the safety perspective to all effected
views?[CH13] Have domain experts reviewed the safety design?
Table 5.7: Checklist
83

5.2 Application of the Safety Perspective on
Case Study
This section explains the application of the proposed safety perspective approach
on the case study Avionics Control Computer System described in section 3.
5.2.1 Activities for Safety Perspective
In this sub-section, we explain how the activities defined in section 5.1.3 are
applied to our case study.
5.2.1.1 Identify Hazards
This activity is performed with domain experts (avionics engineers and pilots),
system engineers and safety engineers. Some of the identified hazards for our
case study are given in Table 5.8 along with possible causes, consequences, and
severity classification. Severity class of the hazards, numbered from HZ1 to HZ4,
is identified as catastrophic since possible consequence of these hazards is aircraft
crash. For instance, if a high altitude is displayed instead of its correct value,
the pilots could assume that the aircraft is high enough not to crash to the
ground especially when landing. This assumption could lead to aircraft crash
that causes deaths, system loss, and in some cases severe environmental damage.
These results make these hazards catastrophic. When the consequence of HZ5 is
considered, its severity class is identified as negligible because this hazard results
in only a communication error with ground station.
5.2.1.2 Define Risks
The probability of occurrence and risk category for each hazard are also given in
Table 5.8. Our design criterion is to design the system such that the probability
84

Haza
rdP
oss
ible
Cause
sC
onse
quence
sSeveri
tyP
rob
abil
ity
Ris
k
[HZ
1]D
ispla
yin
gw
rong
alti
tude
dat
a
Los
sof
/Err
orin
alti
met
erdev
ice
Los
sof
/Err
orin
com
munic
atio
nch
annel
wit
hal
tim
eter
dev
ice
Err
orin
dis
pla
ydev
ice
Air
craf
tcr
ash
Cat
astr
ophic
Impro
bab
leM
ediu
m
[HZ
2]D
ispla
yin
gw
rong
fuel
amou
nt
Los
sof
/Err
orin
engi
ne
par
amet
ers
dev
ice
Los
sof
/Err
orin
com
munic
atio
nch
annel
wit
hen
gine
par
amet
ers
dev
ice
Err
orin
dis
pla
ydev
ice
Air
craf
tcr
ash
Cat
astr
ophic
Impro
bab
leM
ediu
m
[HZ
3]D
ispla
yin
gw
rong
atti
tude
dat
a
Los
sof
/Err
orin
atti
tude
dev
ice
Los
sof
/Err
orin
com
munic
atio
nch
annel
wit
hat
titu
de
dev
ice
Err
orin
dis
pla
ydev
ice
Air
craf
tcr
ash
Cat
astr
ophic
Impro
bab
leM
ediu
m
[HZ
4]D
ispla
yin
gw
rong
pos
itio
ndat
a
Los
sof
/Err
orin
pos
itio
ndev
ice
Los
sof
/Err
orin
com
munic
atio
nch
annel
wit
hp
osit
ion
dev
ice
Err
orin
dis
pla
ydev
ice
Air
craf
tcr
ash
Cat
astr
ophic
Impro
bab
leM
ediu
m
[HZ
5]D
ispla
yin
gw
rong
radio
freq
uen
cych
annel
Los
sof
/Err
orin
radio
dev
ice
Los
sof
/Err
orin
com
munic
atio
nch
annel
wit
hra
dio
dev
ice
Err
orin
dis
pla
ydev
ice
Com
munic
atio
ner
ror
wit
hgr
ound
stat
ion
Neg
ligi
ble
Occ
asio
nal
Low
Tab
le5.
8:H
azar
did
enti
fica
tion
and
risk
defi
nit
ion
for
our
case
study
85

of occurrence of all catastrophic failures should be improbable. The probability
of the hazards, numbered from HZ1 to HZ4, is defined as improbable because
they are catastrophic hazards. In the following section, safety requirements are
identified in order to make these hazards improbable.
5.2.1.3 Identify Safety Requirements
Safety requirements are identified in this step. To illustrate the remaining activ-
ities we use the hazards HZ1, HZ2, HZ5. Similar activities are performed for the
other hazards. Table 5.9 lists the safety requirements related to HZ1, HZ2, and
HZ5. Similarly various safety requirements can be defined for the other identified
hazards.
5.2.1.4 Design Safety Model
The next activity is to design a safety model which satisfies the identified safety
requirements. This is an iterative process. The models are created first and
then they are checked against safety requirements. The models can be changed
according to these checks. We prefer to show two versions of the architecture
for our case study. The first version is designed without considering the safety
requirements. It is modified after safety requirements are identified, that is, after
safety perspective is applied, which results in the second version. The reasons of
the modifications will be explained in the next section (assessment section).
Figure 5.2 shows the deployment diagram of the first version, which includes
one avionics control computer (AvionicsComputer), one altimeter device (Altime-
ter), one radio device (Radio), one fuel amount device (FuelAmount), and one
display device (GraphicsDisplay). Avionics control computer consists of follow-
ing modules: Communication Manager, Radio Manager, Navigation Manager,
Altitude Manager, Graphics Manager , Platform Manager, and Fuel Manager.
86

Hazard ID Definition
HZ1
SR1 Altitude data shall be received from two independent altime-ter devices.
SR2 If one of the altitude data cannot be received, the altitudedata received from only one of the altimeter device shall bedisplayed and a warning shall be generated.
SR3 If both of the altitude data cannot be received, the altitudedata shall not be displayed and a warning shall be generated.
SR4 If the difference between two altitude values received from twoaltimeter devices is more than a given threshold, the altitudedata shall not be displayed and a warning shall be generated.
SR5 Altitude data shall be displayed on two independent displaydevices.
HZ2
SR6 Fuel amount data should be recieved from two independentengine parameters device.
SR7 If one of the fuel amount data cannot be recieved, the fuelamount data recieved only one of the engine parameters deviceshall be displayed and a warning shall be generated.
SR8 If both of the fuel amount data cannot be recieved, the fuelamount data shall not be displayed and a warning shall begenerated.
SR9 If the difference between two fuel amount vales received fromtwo altimeter devices is more than a given threshold, the fuelamout data shall not be displayed and a warning shall begenerated.
SR10 Fuel amount data shall be displayed on two independent dis-play devices.
HZ3S11 Radio frequency data shall be received from a radio device.SR12 Radio frequency data shall be displayed on two display de-
vices.
Table 5.9: Safety requirements for the case study
87

Figure 5.2: Deployment view for the first version
The deployment diagram of the second version, after applying the safety per-
spective, is shown in Figure 5.3. The second version includes two avionics con-
trol computers (AvionicsComputer1 and AvionicsComputer2 ), two altimeter de-
vices (Altimeter1 and Altimeter2 ), two radio devices (Radio1 and Radio2 ), two
fuel amount devices (FuelAmount1 and FuelAmount2 ), and two display devices
(Graphics1Display and Graphics2Display). Avionics control computer contains
following modules: Communication Manager, Radio Manager, Navigation Man-
ager, Altitude1 Manager, Altitude2 Manager, Platform Manager, Fuel1 Manager,
Fuel2 Manager, Graphics1 Manager, Graphics2 Manager, and Health Monitor.
Altitude1 Manager receives data from the altitude device connected to MIL-
STD-1553 communication channels. Similarly, Altitude2 Manager receives data
from the altitude device on the ARINC-429 communication channels. MIL-STD-
1553 and ARINC-429 are two wildly known communication standards used in
avionics systems. These two managers just receive the data and send it to the
required modules. They do not make any calculations on the data. Navigation
Manager receives the altimeter data from Altitude1 Manager and Altitude2 Man-
ager and makes the necessary checks on the altimeter data. These checks include
the range check and difference check. If the difference between two altimeter val-
ues received from two altimeter devices is more than a given threshold, a warning
data is produced. The HZ1 is related to these elements. The altimeter data
88

Figure 5.3: Deployment view for the second version
89

and warning data are sent to Graphics Managers. Graphics Managers drive two
graphical displays according to the received data. A well-known standard called
DVI is used to drive graphical displays.
Fuel1 Manager receives data from the fuel amount device connected to MIL-
STD-1553 communication channels. Similarly, Fuel2 Manager receives the data
from the fuel amount device connected to ARINC-429 communication channels.
Platform Manager receives the fuel amount data from Fuel1 Manager and Fuel2
Manager and makes the necessary checks on the fuel amount data. These checks
include the range check and difference check. If the difference between two altime-
ter values received from two altimeter devices is more than a given threshold, a
warning data is produced. The HZ2 is related to these elements. The fuel amount
data and warning data are sent to Graphics Managers. Graphics Managers show
the fuel amount data on the two graphical display devices.
Communication Manager and the Radio device are shown on the models in
order to include a non-safety critical feature. The hazard HZ5 is related to these
elements. The severity class of this hazard is identified as negligible, which makes
it a non-safety critical feature. Radio Manager receives the radio frequency data
from the radio device connected to MIL-STD-1553 communcation channel and
sends it to the Communication Manager which also sends the data to the Graphics
Managers. Graphics Managers show the data on the graphical display devices.
SC (Safety Critical) stereotype is defined to tag the safety-critical modules.
The safety-critical modules are tagged with SC in Figure 5.3. SC stereotype
differentiates the safety-critical modules from the rest of the modules.
5.2.1.5 Assess Against Safety Requirements
The last activity is the assessment against requirements. There is only one al-
timeter device, one fuel amout device, and one display device in the first version
of the architecture so the safety requirements SR1, SR5, SR6, SR10, and SR12 are
not satisfied. We adapted the first version and included one additional altimeter
device, one additional fuel amout device, and one additional display device in the
90

second version of the architecture. Therefore the safety requirements SR1, SR5,
SR6, SR10, and SR12 are satisfied.
Redundancy is also accomplished for the avionics control computer in the
second version of the architecture. There are two avionics computers which can
communicate to each other for heartbeat messages (through UDP protocol). They
run according to master/slave paradigm. Only one of the avionics computers can
be master at a given time. If slave avionics computer cannot receive heartbeat
messages, it can become master. Both of them can receive altimeter data and
can display it on graphical display devices but only the master computer does it.
The safety requirements SR2, SR3, SR4, SR7, SR8, and SR9 are also satisfied
in the second version of the architecture. Navigation Manager checks the altitude
data and produces either the altitude data or a warning for altitude. If altitude
data is produced, it is displayed on both graphical devices by Graphics Managers.
If a warning is generated, a warning symbol is displayed on the graphical devices
instead of altitude. For the fuel amount data, Platform Manager checks the
data and produces either the altitude data or a warning for fuel amout data.
If fuel amount data is produced, it is displayed on both graphical devices by
Graphics Managers. If a warning is generated, a warning symbol is displayed on
the graphical devices instead of fuel amount.
Health monitoring is another tactic which is applied in order to increase the
safety of the system. Health monitor checks the status of the modules. If there
is a problem related with a module, it can restart the module. Health monitors
are also used to determine master/slave condition. Heartbeat messages are sent
and received by health monitors.
91

5.2.2 Applicability to Views
This section describes the application of safety perspective to the views for our
case study, which allows us to ensure that the architecture is suitable as far as
safety perspective is concerned. Table 5.10 lists a summary of the application of
safety perspective to the views for our case study.
View Applicability to the case studyFunctional Safety-critical modules are determined. (in Figure 5.5)Information Safety-critical data is determined. (see Figure 5.6 and 5.7)Concurrency Not applicableDevelopment Requirement Standard, Coding Standard, Design Decisions,
Reviews and Checklists Common processing required is de-fined.
Deployment There are two avionics control computers, two altimeter de-vices, two fuel amount devices and two display devices. (inFigure 5.3)
Operational Check the correctness of the loaded binaries, SCM and SPCRprocessing for safety-critical defects, Maintenance and usertraining
Context External devices related with safety-critical features are de-termined. (see Figure 5.8)
Table 5.10: Safety perspective application to views for the case study
Figure 5.4: Functional view for the first version
As we stated before, designing is an iterative process and we preferred to
show two versions of functional view. The functional view allows determining
92

which of the system’s functional elements considered as safety-critical. Figure
5.4 shows the functional view for the first version of the architecture and Figure
5.5 shows the functional view for the second version of the architecture. These
two diagrams illustrate the modules and the interfaces between these modules.
When we consider the first version and check against safety requirements, we see
that the first version does not satisfy the safety requirements. Therefore, the first
version is modified and the second version is produced. The modifications are
summarized in the following paragraph.
Figure 5.5: Functional view for the second version
The modules that are responsible for the display of the altitude data and fuel
amount data are considered as safety-critical modules. These are Altitude1 Man-
ager, Altitude2 Manager, Fuel1 Manager, Fuel2 Manager, Navigation Manager,
Platfrom Manager, Graphics1 Manager, and Graphics2 Manager. These modules
are tagged with SC stereotype. Health monitoring is applied for safety-critical
93

modules. Health monitor collects data about the status of the safety-critical
modules. Figure 5.5 shows that the identified safety-critical modules communi-
cate with health monitor through specified connections. Communication Manager
is responsible for radio frequency data, so it is not considered as safety-critical
module and it does not communicate with Health Monitor.
The information view helps to see the safety-critical data in the system. Al-
titude data and fuel amount data are safety-critical for our case study. The data
path of the altitude data is shown in Figure 5.6. Similarly the data path of
the fuel amount data is shown in Figure 5.7. Safety-critical data is also tagged
with SC stereotype. All the modules on the data path of altitude data should
be safety-critical modules. The data path diagrams are used to show that all
safety-critical data is processed by only safety-critical modules.
Figure 5.6: Information view for altitude data
94

Figure 5.7: Information view for fuel amount data
The concurrency view defines which system’s elements executed concurrently.
All modules run in a pre-defined and time-shared fashion for our case. There
is no concurrent processing, so concurrency view is not applicable for our case
study.
The development view helps to provide a guideline or constraints to developers
in order to raise awareness for the system’s safety-critical elements. Requirement
standard, coding standard and design decisions are documented and shared with
developers for our case. Developers of the safety-critical software should apply
the defined rules in these documents. Reviews (requirement review, code review,
etc.) and checklists are used for assessment. Common processing required across
modules are also defined. For instance, how health monitoring for a safety-critical
module should be used is documented.
The deployment view provides information about the environment into which
the system will be deployed. Figure 5.3 shows the deployment diagram for the
second version. The diagram can be used to identify safety-critical modules. SC
stereotype is used to tag safety-critical modules.
The operational view helps to understand how the system will be operated,
managed, and supported in runtime environment. A mechanism is developed to
95

Figure 5.8: Context view for our case study
check the correctness of the loaded binaries for our case. The binary loaded to
avionics computers is controlled with a checksum for safe loading. One of the
important aspects of operational view is Software Configuration Management
(SCM) and Software Problem and Change Request (SPCR) processing. We de-
fine both SCM infrastructure and SPCR processing in Software Configuration
Management Plan document. This document explains how defects will be re-
solved and how new releases will be produced. Reported defects are categorized
according to their safety impact. If a defect has severe safety consequences, all
the flights should be stopped and the new version of the software should be loaded
before flight. Another important aspect of operational view is maintenance of the
system and user training. User handbooks and training will be given at the end
of the project.
The context view provides information about the external entities related with
safety-critical features and shows the interactions between them and the system.
The diagram in Figure 5.8 is an example context view especially designed for
altitude display. External devices are tagged with ExternalDevice stereotype
96

and the communication protocols between the external devices and the avionics
control system are given on the connection lines. Both of the avionics computers
receive altitude data and fuel amount data from two different related devices and
send it to the graphical display devices to be shown to the Pilot who is represented
as an Actor.
5.2.3 Checklist and Architectural Tactics
The checklist defined in 5.1.6 for safety perspective is filled in Table 5.11 for our
case study. Some example notes related with the altitude hazard are written in
the last column of the table.
97

CH
Item
Yes
/No
/NA
Notes
[CH1] Yes Displaying altitude data and fuel amount data are identified as
safety-critical operation.
[CH2] Yes Displaying wrong altitude data, fuel amount data and radio fre-
quency data are identified as a hazard (HZ1, HZ2, and HZ5).
[CH3] Yes Severity class of the hazard HZ1 and HZ2 is catastrophic and its
occurrence probability should be improbable.
[CH4] Yes The system is designed with two avionics computer to satisfy high
availability requirement.
[CH5] Yes When an altitude or fuel amount warning is generated, the actions
that should be taken by the operator (pilot) are documented.
[CH6] Yes The safety requirements are identified with avionics engineers and
pilots.
[CH7] Yes The related modules with the hazard HZ1, HZ2 and HZ5 are iden-
tified.
[CH8] Yes The system consists of several modules. The modules are identified
according to high-cohesion low-coupling principle.
[CH9] NA There is no safe state for our case.
[CH10] Yes Safety-critical modules are identified. Redundancy techniques are
applied.
[CH11] Yes The system is designed as redundant in several levels. (two al-
timeter devices, two fuel amount devices, two display devices, two
avionics computers) Health monitoring for safety-critical modules
is applied.
[CH12] Yes Refer to section 5.2.2
[CH13] Yes The safety design is reviewed with avionics engineers and pilots.
Table 5.11: Checklist for the case study
98

Several architectural tactics are utilized for our case study. The first ar-
chitectural technique is redundancy. Several parts of the system are designed
as redundant in order to satisfy both safety requirements and high availability
needs. This technique is applied to avoid from failures and mitigate the failure
consequences. Health monitoring technique is applied for failure detection of the
safety-critical modules. Table 5.12 summarizes the applied tactics. Similar tactics
can be applied for other identified catastrophic hazards. (A. is the Avoidance,
D. is the Detection and M. is the Mitigation)
Tactic A. D. M.
If one of the altimeter devices produces wrong altimeter output this
fault is detected by Navigation Manager and a warning is generated
in order to warn the pilots about altitude data.
X X X
If one of the fuel amount devices produces wrong fuel amount out-
put this fault is detected by Platform Manager and a warning is
generated in order to warn the pilots about fuel amount data.
X X X
If one of the display devices crashes and cannot display desired
data, the other one continue to display it.
X X
If master avionics computer is not available, the slave avionics com-
puter becomes master and starts to operate.
X X
If a safety-critical module fails, this failure is detected by health
monitor. The module is re-started.
X X
Table 5.12: Architectural tactics for the case study
5.3 Application of the Safety Perspective on
Views and Beyond Approach
In this section, we show the application of the proposed safety perspective on
Views & Beyonds approach explained in section 2.1.2. Table 5.13 shows the
safety perspective affects each of the styles in Views & Beyonds approach.
99

Styles ApplicabilityDecomposition This style allows determining which modules and submodules
of the system should be considered as safety-critical.Uses This style allows determining dependencies between safety crit-
ical modules and other modules.Generalization This style can express the inheritance in safety critical modules.Layered This style groups modules into layers. Therefore it allows de-
termining which layers include safety critical modules. Addi-tionally, it shows which layers can be able to use these modulesand vice versa.
Aspects This allows determining the aspect modules which are relatedwith safety-critical modules.
Data Model The safety perspective has less impact on this style.Call-Return This style allows determining the safety-critical components in
the system and interaction between these components and othercomponents.
Data Flow This style allows determining the flow of data on safety-criticaloperations.
Event-based This style allows determining the interaction of safety-criticalcomponents and other components through asynchronousevents or messages
Repository The safety perspective has less impact on this style.Deployment This style allows determining the required hardware elements,
third-party software requirements and environmental elementsfor safety-critical components.
Install This style allows determining the required software elements tosupport production environments or specific permissions andconfiguration elements for safety-critical elements.
WorkAssignment
This style allows determining the people, team or organizationalwork units which are responsible for development of safety-critical components.
Table 5.13: Applicability of the safety perspective on Views & Beyond approach
100

In order to illustrate the proposed safety perspective, we select decomposition,
uses, and layered styles from module style, data flow style from component &
connector style, and deployment style from allocation style. Table 5.14 presents
the application of the selected styles from Views & Beyond approach on the case
study used in the previous section.
Style Explanation
Decomposition Safety-critical and non-safety-critical modules are deter-
mined. (see Figure 5.9)
Uses The modules which are used by safety-critical modules are
presented. (see Figure 5.10)
Layered In each layer, safety-critical and non-safety critical modules
are shown. (see Figure 5.11)
Data Flow Safety-critical data and its flow is presented. (see Figure
5.6 and Figure 5.7)
Deployment Two avionics control computers, two altimeter devices, two
fuel amount devices, two graphics devices. (see Figure 5.3)
Table 5.14: Application of the selected styles on the case study
Figure 5.9: Decomposition style for our case study
101

We present the decomposition style of the case study in Figure 5.9. It shows
the non safety-critical modules and safety-critical modules tagged with SC stereo-
type. The decomposition sytle consists of three main modules, namely, Data,
Application and Presentation. Data module includes Fuel1 Manager, Fuel2 Man-
ager, Altitude1 Manager, Altitude2 Manager safety-critical modules and Radio
Manager non-safety-critical module. Application module includes Navigation
Manager, Platform Manager safety-critical modules and Communication Man-
ager non-safety-critical module. Presentation module includes Graphics1 Man-
ager and Graphics2 Manager safety-critical modules.
Figure 5.10: Uses style for our case study
Figure 5.10 shows the uses style for the case study. It presents the relation
between safety-critical and related modules. As seen from Figure 5.10, any of
the module in Presentation module uses the modules in Application module.
Navigation Manager uses Altitude1 Manager and Altitude2 Manager. Platform
Manager uses Fuel1 Manager and Fuel2 Manager. Communication Manager uses
Radio Manager.
Figure 5.11 presents the layered style of the case study. Our case study is
presented in the three layered architecture. The first layer includes the Data
modules. The second layer includes theApplication modules. Similarly, the third
102

layer includes the modules from Presentation module. According to our archi-
tecture design, the third layer is allowed to use second layer and the second layer
is allowed to use first layer.
Figure 5.11: Layered style for our case study
The data flow style shows the flow of safety-critical data. In previous section,
we present the data flow for altitude and fuel manager data in Figure 5.6 and
Figure 5.7 respectively.
The deployment style helps to determine required harware elements, third-
party software elements for safety-critical operations. In previous section, we
present deployment style in Figure 5.3.
103

Chapter 6
Architecture Framework for
Software Safety
Designing appropriate software architecture of a safety-critical system is impor-
tant to meet the requirements for the communication, coordination and control
of the safety-critical concerns. A common practice in the software architecture
design community is to model and document different architectural views for de-
scribing the architecture according to the stakeholders concerns.Having multiple
views helps to separate the concerns and as such support the modeling, under-
standing, communication and analysis of the software architecture for different
stakeholders.
For modeling the software architecture of safety-critical systems we can con-
sider the approaches of both the safety engineering domain and the software
architecture modeling domain. From the safety engineering perspective we can
observe that many useful models such as fault trees and failure modes and ef-
fect analysis have been identified. In addition several guidelines and patterns
have been proposed to support the architecture design of safety critical systems.
Unfortunately, the safety engineering domain does not provide explicit modeling
abstractions for modeling the architecture of safety-critical systems. On the other
hand existing software architecture frameworks tend to be general purpose and do
104

not directly focus on safety concerns in particular. However, if safety is an impor-
tant concern then it is important to provide explicit abstraction mechanisms at
the architecture design level to reason about to communicate and analyze the ar-
chitectural design decisions from an explicit safety perspective. In particular this
is crucial for safety-critical systems which have indeed demanding requirements.
In this chapter we propose an architecture framework for modeling the ar-
chitecture for software safety in order to address the safety concern explicitly
and assist the architects. Firstly, we present the metamodel for software safety.
The metamodel is developed after a through domain analysis. Next, we explain
the architecture framework based on this metamodel. The framework includes
three coherent set of viewpoints each of which addresses an important concern.
The framework is not mentioned as a replacement of existing general purpose
frameworks but rather needs to be considered complementary to these. Then, we
illustrate the application of the viewpoints for an industrial case on safety-critical
avionics control computer system explained in section 3.
6.1 Metamodel for Software Safety
In this section we provide a metamodel for software safety to represent the safety-
related concepts. The metamodel as shown in Figure 6.1 has been derived after
a thorough domain analysis to safety design concepts and considering existing
previous studies such as [59] [60] [61]. The metamodel consists of three parts. The
bottom part of the metamodel includes the concepts which are related to hazards
in the system. A Hazard describes the presence of a potential risk situation
that can result or contribute to mishap. A Hazard causes some Consequences.
Safety Requirements are derived from identified Hazards. We define FTA Node,
Operator and Fault to conduct Fault Tree Analysis which is a well-known method.
Fault Tree Analysis [62] aims to analyze a design for possible faults which lead
to hazard in the system using Boolean logic. FTA Nodes, Faults and Operators
are the elements of a Fault Tree. Faults are the leaf nodes of the Fault Tree.
Operator is used to conduct Boolean logic. Operator can be AND or OR. A
105

Hazard is caused by one or more FTA Nodes.
The middle part of the metamodel includes the concepts which are related
to applied safety tactics in the design. As explained in section 5.1.4, we have
identified the well-known safety tactics as fault avoidance, fault detection and
fault tolerance. Fault avoidance tactic aims to prevent faults from occurring in
the system. When a fault is occurred, fault is detected by applying fault detection
tactics. Fault tolerance is the ability of the system to continue properly when the
fault is occurred and maintain a safe operational condition. Therefore, applied
Safety Tactic can be Fault Avoidance Tactic, Fault Detection Tactic or Fault
Tolerance Tactic in order to deal with faults.
The top part of the metamodel includes the concepts which present elements in
the architecture design. These elements are Monitoring Element, Safety-Critical
Element and Non-Safety Critical Element where Architectural Element is super-
class of them. An Architectural Element can reads data from another Archi-
tectural Element, writes data to another Architectural Element, and commands
to another Architectural Element. Monitoring Element monitors one or more
Safety-Critical Elements by checking the status of them. If there is a problem in
a Safety-Critical Element it can react by stopping/starting/restarting/initializing
the related Safety-Critical Element. Safety-Critical Element presents the element
which includes safety-critical operations. One Safety-Critical Element can be el-
ement of another Safety-Critical Element. Safety-Critical Elements can report
occurred faults to other Safety-Critical Elements. A Safety-Critical Element has
States to describe its condition. Safe State is one type of the State. If a Fault is
detected which can lead to a Hazard and there is a Safe State which can prevent
from this Hazard, the Safety-Critical Element can switch its state to that Safe
State. Safety-Critical Elements shouldn’t include the elements which doesn’t have
safety-critical operations. Therefore, Non-Safety-Critical Element is defined to
represent the elements which don’t include safety-critical operations. One Non-
Safety-Critical Element can be element of another Non-Safety-Critical Element.
A Monitoring Element or Safety-Critical Element implements the Safety Tactics
in order to ensure the safety of the system. A Safety-Critical Element can imple-
ment one or more Safety Requirements in order to provide desired functionality.
106

Figure 6.1: Metamodel for safety
107

6.2 Viewpoint Definition for Software Safety
Based on the metamodel as discussed in the previous section we derive and explain
the viewpoints defined for software safety. We have identified three coherent
set of viewpoints that together form the safety architecture framework: Hazard
Viewpoint, Safety Tactics Viewpoint and Safety-Critical Viewpoint.
6.2.1 Hazard Viewpoint
Table 6.1 shows the Hazard Viewpoint. It aims to support the hazard identifica-
tion process and shows each hazard along with the fault trees which can cause
the hazard, the derived safety requirements and the possible consequences of the
hazard.
6.2.2 Safety Tactic Viewpoint
Table 6.2 presents the safety tactics viewpoint that models the tactics and their
rela-tions to cope with the identified hazards. In general we can distinguish
among fault avoidance, fault detection and fault tolerance tactics. In the meta-
model definition, we define avoids, detects and tolerates relationship from Safety
Tactic element to Fault. However, one Fault can be handled by different Safety
Tactics, we define an attribute handledFaults in Safety Tactic element instead
of presenting each handled faults as an element and constructing relationships
between Safety Tactics and Faults. This approach improves the readability of
the view and shows traceability between Faults and Safety Tactics.
108

Section Description
Overview This viewpoint describes the identified hazards, their possible
causes and consequences, derived safety requirements from these
hazards and possible faults in the system.
Concerns
•Which safety requirements are derived from which hazards?
•Which faults can cause which hazards?
•What are the possible consequences of the identified hazards?
Stakeholders Software Architect, Safety Engineer
Constraints
•One or more safety requirements can be derived from a hazard.
•A hazard can cause one or more consequences.
•A hazard can be caused by one or more FTA Nodes.
Elements
Relationships
Table 6.1: Hazard Viewpoint
109

Section Description
Overview This viewpoint describes the safety tactics implemented in the
system. Also it shows the faults handled by the safety tactics.
Concerns•What are the appliedsafety tactics?
•Which faults are handled by which safety tactics?
Stakeholders Software Architect, Safety Engineer, Software Developer
Constraints A safety tactic can extend different safety tactics.
Elements
Relationships
Table 6.2: Safety tactic viewpoint
6.2.3 Safety-Critical Viewpoint
In Table 6.3 we explain the safety-critical viewpoint. In metamodel definition, we
define implements relationship from Monitoring Element and Safety-Critical El-
ement to Safety Tactic. One Safety Tactic can be implemented by different Mon-
itoring Elements or Safety-Critical Elements. Therefore, we define an attribute
implementedTactics in both Monitoring Element and Safety-Critical Element in-
stead of showing Safety Tactics as an element in this viewpoint. This modifica-
tion is also done for implements relationship between Safety-Critical Element and
Safety Requirement. This relation is shown as an attribute implementedSReqs in
Safety-Critical Element.
110

Section DescriptionOverview This viewpoint shows the safety-critical elements, monitoring el-
ements, non-safety-critical elements and relations between them.It presents also the implemented safety tactics by related safety-critical elements and monitoring elements.,Additionally it showsthe implemented safety requirements by related safety-critical ele-ments.
Concerns
•What are the safety-critical elements and relations between them?•What are the monitoring elements and relations between monitor-ing and safety-critical elements?•What are the implemented safety tactics and safety requirementsby safety-critical elements and monitoring elements?•What are the non-safety-critical elements and relations betweenthem?
Stakeholders Software Architect, Safety Engineer, Software Developer
Constraints
•A safety-critical element can read data from one or more safety-critical elements.•A safety-critical element can write data to one or more safety-critical elements.•A safety-critical element can command one or more safety-criticalelements.•A safety-critical element can report fault to one or more safety-critical elements.•A monitoring element can monitor one or more safety-criticalelements.•A monitoring element can react (stop/start/init/restart) one ormore safety-critical elements.
Elements
Relationships
Table 6.3: Safety-critical viewpoint
111

6.3 Application of the Architecture Framework
on Case Study
In this section, we present the application of the framework approach to the case
study Avionics Control Computer System described in section 3. The following
subsections illustrate the application of defined viewpoints on the case study.
6.3.1 Hazard View
In section 5.2.1.1, we have conducted hazard identification (see Table 5.8) for our
case study. In order to illustrate the framework approach, we use HZ1 (Displaying
wrong altitude data), HZ2 (Displaying wrong fuel amount data) and HZ5 (Dis-
playing wrong radio frequency data). Table 6.4 shows the faults related to HZ1,
HZ2, and HZ5. The faults are numbered from F1 to F32. The Figure 6.2, Figure
6.3, and Figure 6.4 show the hazard views for HZ1, HZ2, and H5 respectively.
The hazard view answers the following questions for our case study.
• Which safety requirements are derived from which hazards?
• What are the possible consequences of the identified hazards?
• Which faults can cause which hazards?
112

Fault Description[F1] Loss of altimeter device 1[F2] Loss of communication with altimeter device 1[F3] Loss of altimeter device 2[F4] Loss of communication with altimeter device 2[F5] Error in altimeter device 1[F6] Error in communication with altimeter device 1[F7] Error in altimeter device 2[F8] Error in communication with altimeter device 2[F9] Altimeter1 Manager fails[F10] Altimeter2 Manager fails[F11] Navigation Manager fails[F12] Loss of fuel device 1[F13] Loss of communication with fuel device 1[F14] Loss of fuel device 2[F15] Loss of communication with fuel device 2[F16] Error in fuel device 1[F17] Error in communication with fuel device 1[F18] Error in fuel device 2[F19] Error in communication with fuel device 2[F20] Fuel1 Manager fails[F21] Fuel2 Manager fails[F22] Platform Manager fails[F23] Loss of radio device[F24] Loss of communication with radio device[F25] Error in radio device[F26] Error in communication with radio device[F27] Radio Manager fails[F28] Communication Manager fails[F29] Error in display device 1[F30] Error in display device 2[F31] Graphics1 Manager fails[F32] Graphics2 Manager fails
Table 6.4: Fault table for the case study
113

Figure 6.2: Hazard view for HZ1
For HZ1 we present the answers of these questions below:
• Which safety requirements are derived from which hazards?
The safety requirements S1-S5 are derived from HZ1 are displayed in Figure
6.2. These requirements are defined in Table 5.8.
• What are the possible consequences of the identified hazards?
As shown in Figure 6.2, aircraft crash is the possible consequence of the
HZ1.
• Which faults can cause which hazards?
The faults which can cause HZ1 are shown as the leaf nodes of a fault tree
generated by using Fault Tree Analysis which is a well-known method [62].
The faults F1-F11 and F29-F32 are related to HZ1. Their definitions are
given in Table 6.4. The names of the FTA Nodes are numerated from N1 to
N9. N1 and N2 indicate ”Loss of Altimeter1 ” and ”Loss of Altimeter2 ”. N3
and N4 represent ”Error in Altimeter1 ” and ”Error in Altimeter2 ”. Wrong
114

altimeter data can be displayed when one of the followings occur: when al-
timeter1 is lost and there is an error in altimeter2 (N5), when altimeter2
is lost and there is an error in altimeter1 (N6), when there is an error in
both altimeters (N7) and the difference between them is not greater than
the threshold, when there is an error in display device 1 and the Graph-
ics2 Manager fails (N8), when there is an error in display device 2 and the
Graphics1 Manager fails (N9), when the Navigation Manager fails.
Figure 6.3: Hazard view for HZ2
115
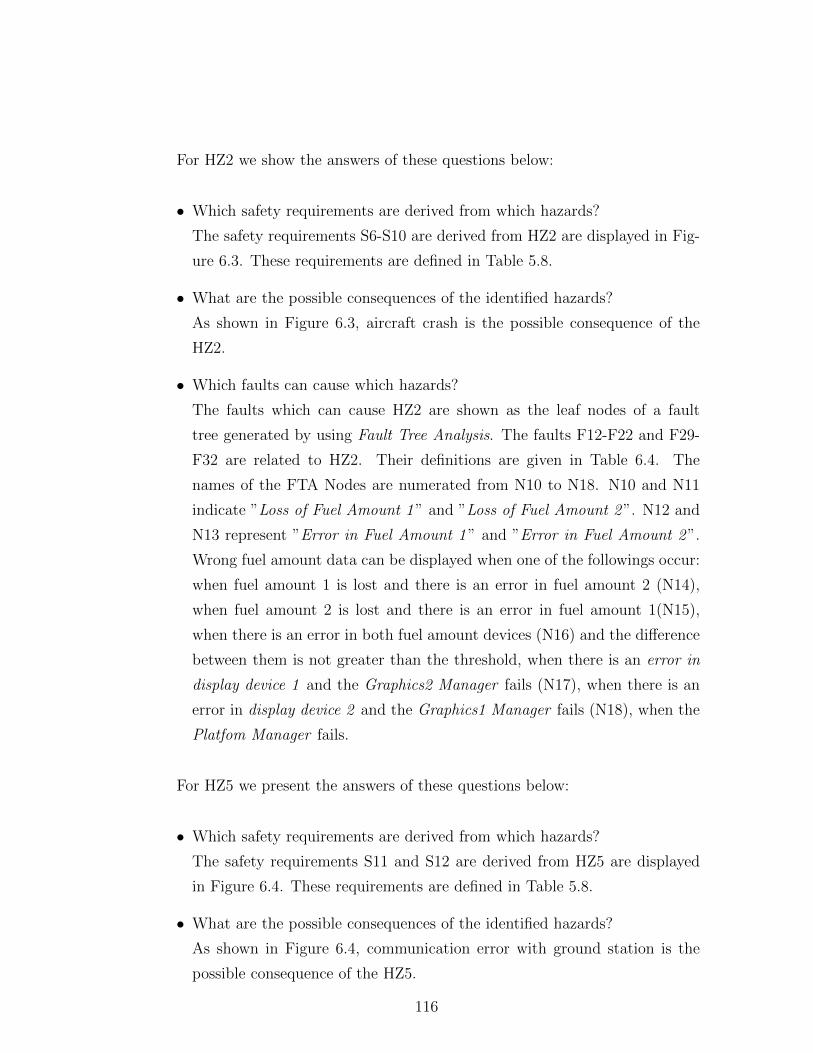
For HZ2 we show the answers of these questions below:
• Which safety requirements are derived from which hazards?
The safety requirements S6-S10 are derived from HZ2 are displayed in Fig-
ure 6.3. These requirements are defined in Table 5.8.
• What are the possible consequences of the identified hazards?
As shown in Figure 6.3, aircraft crash is the possible consequence of the
HZ2.
• Which faults can cause which hazards?
The faults which can cause HZ2 are shown as the leaf nodes of a fault
tree generated by using Fault Tree Analysis. The faults F12-F22 and F29-
F32 are related to HZ2. Their definitions are given in Table 6.4. The
names of the FTA Nodes are numerated from N10 to N18. N10 and N11
indicate ”Loss of Fuel Amount 1 ” and ”Loss of Fuel Amount 2 ”. N12 and
N13 represent ”Error in Fuel Amount 1 ” and ”Error in Fuel Amount 2 ”.
Wrong fuel amount data can be displayed when one of the followings occur:
when fuel amount 1 is lost and there is an error in fuel amount 2 (N14),
when fuel amount 2 is lost and there is an error in fuel amount 1(N15),
when there is an error in both fuel amount devices (N16) and the difference
between them is not greater than the threshold, when there is an error in
display device 1 and the Graphics2 Manager fails (N17), when there is an
error in display device 2 and the Graphics1 Manager fails (N18), when the
Platfom Manager fails.
For HZ5 we present the answers of these questions below:
• Which safety requirements are derived from which hazards?
The safety requirements S11 and S12 are derived from HZ5 are displayed
in Figure 6.4. These requirements are defined in Table 5.8.
• What are the possible consequences of the identified hazards?
As shown in Figure 6.4, communication error with ground station is the
possible consequence of the HZ5.
116

Figure 6.4: Hazard view for HZ5
• Which faults can cause which hazards?
The faults which can cause HZ5 are shown as the leaf nodes of a fault tree
generated by using Fault Tree Analysis. The faults F23-F32 are related to
HZ5. Their definitions are given in Table 6.4. Wrong radio frequency data
can be displayed when one of the followings occur: when radio frequency
is lost or there is an error in radio frequency device or there is an error
in display device 1 and the Graphics2 Manager fails or there is an error
in display device 2 or the Graphics1 Manager fails or the Communication
Manager fails.
6.3.2 Safety Tactic View
Safety tactics view shows the tactics implemented in the architecture along with
the handled faults. This view answers the question ”Which tactics are applied to
handle which faults?”. The Figure 6.5 shows the applied tactics to handle the
faults related to hazards HZ1, HZ2, and HZ5.
117

Figure 6.5: Safety tactic view for our case study
The tactics named as T1, T2, T3, T7, T8, T9, T13, and T14 are generated
from fault tolerance tactic. T1 is a redundancy tactic for altitude data. Altitude
data is received from two different altimeter devices. By applying the tactic T1,
the faults from F1 to F8 are handled. Similarly T7 is a redundancy tactic handles
the faults F12-F19 for fuel amount data. Fuel amount is received from two dif-
ferent fuel devices. T2 is a warning tactic for altitude data. An altitude warning
118

is generated when there is a difference between two altitude values received from
two different altimeters, or when altitude data is received from only one of the
altimeters, or when altitude data cannot be received from both altimeters (dif-
ferent warnings are generated to distinguish these cases). By applying the tactic
T2, the faults from F1 to F8 are handled. Similarly T8 is a warning tactic for
fuel amount data. A fuel amount warning is generated when there is a difference
between two fuel amount values received from two different fuel devices, or when
fuel amount data is received from only one of the fuel devices, or when fuel amount
data cannot be received from both fuel devices (different warnings are generated
to distinguish these cases). By applying the tactic T8, the faults F12-F19 are
handled. T3 is a recovery tactic for Navigation Manager. When navigation man-
ager fails, it is recovered. The tactic T3 is applied to handle faults F9, F10 and
F11. Similarly, the tactic T9 is a recovery tactic for Platform Manager. It is
appled to handle faults F20,F21,F22 by recovering the Platform Manager. T13
is a redundancy tactic for displaying the data. Altitude data and fuel amount
data are displayed on two different displays. The tactic T13 is applied to handle
faults F29 and F30. T14 is a recovery tactic for graphics managers. When one
of the graphics managers fails, it is recovered. The tactic T14 handles the faults
F31 and F32.
The tactics named as T4, T5, T6, T10, T11, T12, T15 are fault detection
tactics. T4 is a comparison tactic and it compares the altitude values received
from two different altimeter devices and detects if there is a difference. The
tactic T4 is applied to handle faults from F5 to F8. Similarly the tactic T10
is a comparison tactic which compares the fuel amount data received from two
different fuel devices and detects if there is a difference. This tactic is applied to
handle faults F16-F19. T5 is a comparison tactic and it compares the received
altitude value with its minimum and maximum values in order to detect out of
range altitude value. By applying the tactic T5, the faults from F5 to F8 are
handled. Similarly, the tactic T11 is a comparison tactic which compares the
received fuel amount value with its minimum and maximum values to detect out
of range fuel amount value. This tactic is applied to handle faults F16-F19.
T6 is a monitoring tactic which monitors the navigation managers failure.
119

The tactic T6 is applied to handle faults F9, F10 and F11. T12 is a monitoring
tactic monitors the platform manager’s failure. This tactic is applied to handle
the faults F20, F21, F22. T15 is a monitoring tactic which monitors the graphics
managers failures. The tactic T15 handles the faults F31 and F32.
6.3.3 Safety-Critical View
The safety-critical view for our case study is shown in Figure 6.6. The Figure 6.6
shows the related modules to HZ1, HZ2, and HZ5.
The Altitude1 Manager and Altitude2 Manager are the managers of the al-
timeter devices and the Graphics1 Manager and Graphics2 Manager are the man-
agers of the graphics devices. Navigation Manager reads the altitude data from
Altitude1 Manager and Altitude2 Manager. Graphics1 Manager and Graphics2
Manager read the altitude data from Navigation Manager. If a warning should
be generated Navigation Manager notifies the Graphics1 Manager and Graph-
ics2 Manager through commands relation. If a fault is occurred in Altimeter1
Manager and Altimeter2 Manager, they report the occurred fault to Navigation
Manager through reportsFault relation.
The Fuel1 Manager and Fuel2 Manager are the managers of the fuel de-
vices and. Platform Manager reads the fuel amount data from Fuel1 Manager
and Fuel2 Manager. Graphics1 Manager and Graphics2 Manager read the fuel
amount data from Platform Manager. If a warning should be generated Platform
Manager notifies the Graphics1 Manager and Graphics2 Manager through com-
mands relation. If a fault is occurred in Fuel1 Manager and Fuel2 Manager, they
report the occurred fault to Platform Manager through reportsFault relation.
Manager Monitor monitors Altimeter1 Manager, Altimeter2 Manager, Nav-
igation Manager, Fuel1 Manager, Fuel2 Manager, and Platform Manager. It
detects the failure when one of these managers fails and recovers from failures
by stopping/starting/initializing the failed modules. Similarly, Graphics Mon-
itor monitors the Graphics1 Manager and Graphics2 Manager. It detects the
120

failure when one of these managers fails and recovers from failures by stop-
ping/starting/initializing the failed modules.
Figure 6.6: Safety-critical view for our case study
As it can be observed from Figure 6.6, Navigation Manager and Platform
Manager cause single-point of failure which can also be inferred from the fault
tree shown in the hazard views in Figure 6.2 and Figure 6.3. So, another de-
sign alternative is developed to solve this problem. Since, changing this view
affects hazard and safety tactic views, we update these views for second design
alternative.
121

In the second design alternative;
• redundancy technique is also applied to Navigation Manager and Platform
Manager by defining two Navigation Managers and two Platform Managers
• Manager Monitor is removed and two new monitor called Navigation Mon-
itor and Platform Monitor are defined, Navigation Monitor controls only
Navigation Managers and Platform Monitor controls only Platform Man-
agers
• two new monitor called Altitude Monitor and Fuel Monitor is added to
control Altitude Managers and Fuel Managers
In order to update hazard views, firstly we update fault table given in Table
6.4. The fault F11 is changed as ”Navigation1 Manager fails”, the fault F22 is
changed as ”Platform1 Manager fails”. In addition to this, we define two new
faults F33 as ”Navigation2 Manager fails” and F34 ”Platform2 Manager fails”.
The updated fault table is given in Table. The updated hazard views are given
in Figure 6.7 for HZ1, Figure 6.8 for HZ2. Since the HZ5 is not affected by the
new design alternative, hazard view for HZ5 is not changed.
As shown in Figure 6.7 , we add FTA Node N19 to represent ”Navigation
Managers fail”. If both of the Navigation1 Manager and Navigation2 Manager
fails, wrong altitude data can be represented.
As shown in Figure 6.8, we add FTA Node N20 to represent ”Platform Man-
agers fail”. If both of the Platform1 Manager and Platform2 Manager fails,
wrong fuel amount data can be represented.
122

Figure 6.7: Hazard view for second design alternative - HZ1
Figure 6.8: Hazard view for second design alternative - HZ2
123

The Figure 6.9 shows the safety tactic view for second design alternative.
There are two new tactics implemented by Altitude Monitor, which are called as
HealthCheckForAltitude (T16) and RecoverAltitude (T17). Similarly, there are
two new tactics implemented by Fuel Monitor, which are called HealthCheckFor-
Fuel (T18) and Recover Fuel (T19).
The Figure 6.10 presents the safety-critical view for second design alternative.
By applying redundancy tactic for Navigation Manager and Platform Manager,
the single-point of failure problem is solved. This design increases the safety of
the system. However, addition of the new monitor and manager also increases
the relations (function calls) between the related modules and this impacts the
performance of the system.
124

Figure 6.9: Safety tactic view for second design alternative
125

Fig
ure
6.10
:Saf
ety-c
riti
cal
vie
wfo
rse
cond
des
ign
alte
rnat
ive
126

6.4 Tool
In this section we discuss the tool that we have developed in the Eclipse environ-
ment to model the defined viewpoints as views. We use EuGENia [63] and GMF
[64] tools which are packaged in Epsilon project [65]. GMF (Graphical Modeling
Framework) tools are used to define visual concrete syntax based on Ecore meta-
model. They also provide generative components to generate diagram editors in
Eclipse environment. Firstly, we define our metamodel as an Ecore metamodel.
We use specific annotations in order to define graphical notations of each element
in our metamodel by using GMF. We use this annotated Ecore metamodel as
the abstract syntax definition while defining the visual concrete syntax of the
corresponding viewpoints. EuGENia tool generates the needed models from this
annotated Ecore metamodel for GMF diagram editor generation. Lastly, the edi-
tor defined for three different viewpoints is exported as plug-in to Eclipse. Figure
6.11 shows a sample screenshot from the tool. The tool provides a user interface
with four different panes to construct views.
Figure 6.11: Snapshot of the tool for modeling three viewpoints
127

Chapter 7
Fault-Based Testing for Software
Safety
Software safety can be addressed at different levels in the software development
life cycle. Addressing safety concerns early on at the software architecture design
level is important to guide the subsequent life cycle activities to ensure that the
eventual software is reliable. Once the safety critical systems are designed it is
important to analyze these systems for fitness before implementation, installation
and operation. Hereby, it is important to ensure that the potential faults can be
identified and cost-effective solutions are provided to avoid or recover from the
failures. Since the safety-critical systems are complex systems, testing of these
systems is challenging and very hard to define proper test suites for these systems.
As explained in section 5.1.4 the software safety tactics are quite important
for ensuring the safety of the system. While constructing the test suites, the
safety tactic knowledge can be used to build strong test cases. Several fault-
based software testing approaches exist that aim to analyze the quality of the
test suites. Unfortunately, these approaches tend to be general purpose and they
doesn’t consider the applied the safety tactics.
In this section we adopt a fault-based testing approach for analyzing the
strength of defined test suites by using the safety tactic and fault knowledge.
128

To apply fault-based testing for analyzing the test suites, firstly, we first present
a metamodel and a domain specific language that models different safety views
and the relation to the code. Then, we explain the fault-based testing process.
Finally, the proposed approach is illustrated using an industrial case study.
7.1 DSL for Software Safety
In this section we present the metamodel and domain specific language developed
to express safety concerns in safety-critical systems.
7.1.1 Metamodel
In section 6.1, we have derived the metamodel after a thorough domain analysis to
express safety design concepts. To support fault-based testing we have enhanced
the earlier metamodel and added the Implementation Detail concept. The general
metamodel is shown in Figure 7.1.
Figure 7.1: Metamodel for safety DSL
Implementation Detail is defined to use in fault-based testing process for mu-
tant generation and test case run steps. As presented in Figure 7.1, Implemen-
tation Detail consists of Implementation Relations which can be Module-Class
129

Relation or Class-Test Case Relation. Module-Class Relation describes which
Architectural Elements defined in Safety-Critical View consists of which classes
in the program code. Class-Test Case Relation defines which classes in the pro-
gram code should be tested with which test cases. For the Safety View part of
the metamodel detailed information can be found in section 6.1.
7.1.2 DSL
Based on the safety metamodel, we provide a domain specific language (DSL) to
represent the concepts in safety domain. The grammar of defined DSL in EBNF
form is presented below.
SafetyDSL = {SafetyView} ImplementationDetail;
SafetyView = HazardView | SafetyTacticView | SafetyCriticalView;
HazardView = ’Hazard View’ STRING ’{ Elements {’ {HazardElement} ’}’’Relations {’ {HazardRelation} ’}’ ’}’ ;
HazardElement = Hazard | SafetyRequirement | Consequence | Fault | FaultTree;
Hazard = ’hazard’ HazardID ’;’ ;
SafetyRequirement = ’safetyRequirement’ SReqID ’;’ [’{’{SafetyRequirement}’}’];Consequence = ’consequence’ ConsequenceID ’;’ ;
Fault = ’fault’ FaultID ’;’ ;
FaultTree = ’faultTree’ FaultTreeID FaultTreeNode ’;’ ;
FaultTreeNode = FaultID | ANDNode | ORNode ;
ANDNode = FaultTreeNode ’AND’ FaultTreeNode ;
ORNode = FaultTreeNode ’OR’ FaultTreeNode
HazardRelation = DerivedFrom | Causes | CausedBy ;
DerivedFrom = SReqID {’,’ SReqID} ’derivedFrom’ HazardID ’;’ ;
Causes = HazardID ’causes’ ConsequenceID {’,’ ConsequenceID} ’;’ ;
CausedBy = HazardID ’causedBy’ FaultTreeID ’;’ ;
SafetyTacticView = ’SafetyTacticView’ STRING ’{’ {SafetyTactic} ’}’ ;
SafetyTactic = (’faultAvoidance’ | ’faultDetection’ | ’faultTolerance’) STacticID
’{’ ’type=’ STRING ’avoidedFaults=’ (FaultID) {’,’ FaultID} ’}’ ’;’ ;
SafetyCriticalView = ’Safety-CriticalView’ name=ID ’{’
130

’Elements {’{ArchitecturalElement} ’}’’Relations {’{SafetyCriticalRelation} ’}’ ’}’ ;
ArchitecturalElement = SafetyCritical | NonSafetyCritical | Monitor ;
SafetyCritical = ’safety-critical’ SCModuleID ’{’’criticalityLevel=’ (’A’ | ’B’ | ’C’ | ’D’) ’;’
’implementedSafetyRequirements=’ SReqID {’,’ SReqID} ’;’
[ ’implementedTactics=’ STacticID {’,’ STacticID} ’;’ ]
[ ’sub-elements=’{SCModuleID} {’,’ SCModuleID} ’;’ ]
[ ’hasState’ StateID {’,’ StateID} ] ’}’ ’;’ ;
NonSafetyCritical = ’non-safety-critical’ NSCModuleID (’{’{NSCModuleID}’}’|’;’);Monitor = ’monitor’ MonitorID
[ ’{’ ’implementedTactics=’ SCTacticID {’,’ SCTacticID} ’}’ ] ’;’ ;
State = (’state’ | ’safeState’) StateID ’;’ ;
SafetyCriticalRelation = ArchElementToArchElement
| MonitorToArchitecturalElement | ReportsFault ;
ArchitecuralElementID = (SCModuleID | NSCModuleID | MonitorID);
ArchElementToArchElement = ArchitecturalElementID
(’reads’ | ’writes’ | ’commands’)
ArchitecturalElementID {’,’ ArchitecturalElementID} ’;’ ;
MonitorToArchitecturalElement = MonitorID
(’stops’ | ’starts’ | ’inits’ | ’restarts’ | ’monitors’)
SCModuleID {’;’ SCModuleID} ’;’ ;
ReportsFault = SCModuleID ’reportsFault’ SCModuleID {’,’ SCModuleID} ’;’ ;
ImplementationDetail = ’ImplementationRelations {’’Module-Class Relation {’ {ModuleClassRelation} ’};’’Class-TestCase Relation{’ {ClassTestCaseRelation} ’};’ ’}’ ;
ModuleClassRelation = ArchitecturalElementID ’composesOf=’ ’{’ClassDef{’,’ClassDef}’}”;’;
ClassTestCaseRelation = ClassDef ’testWith=’
’{’ QualifiedName {’,’ QualifiedName} ’}’ ’;’ ;
ClassDef = QualifiedName ;
Qualified Name = STRING { ’.’ STRING } ; HazardID = STRING;
SReqID = STRING; ConsequenceID = STRING;
FaultID = STRING; FaultTreeID = STRING;
131

SCModuleID = STRING; NSCModuleID = STRING;
MonitorID = STRING; StateID = STRING;
7.2 Fault-Based Testing Approach
Figure 7.2 shows the process for our fault-based testing approach. In the follow-
ing, we explain each step in detail.
Figure 7.2: Process for proposed fault-based testing approach
Build Safety Model
The first step is constructing safety model using the safety grammar defined in
132

the previous section. The safety model can be defined using the tool which is ex-
plained in the next section. In order to build the safety model, hazard view, safety
tactic view, and safety-critical view should be defined using the safety DSL. Haz-
ard view describes the identified hazards, their possible causes and consequences,
derived safety requirements from these hazards and possible faults in the system.
Safety tactic view describes the implemented safety tactics and the faults handled
by these safety tactics. Safety-critical view describes the safety-critical elements,
monitoring elements, non-safety-critical elements, and relations between them.
It also presents the safety tactics implemented by related safety-critical elements
and monitoring elements. Additionally, it shows the implemented safety require-
ments by related safety-critical elements. In addition to these views, implemen-
tation details should be defined for the mutant generation and test case execution
steps.
Select Mutation Operators
After creating the safety model, mutation operators should be selected to generate
mutations. Mutant generation step is performed by using µJava [24] which is an
open source project for generating mutants for both method-level and class-level
mutations. In [25] and [26], the authors provide a set of mutation operators
and their explanations for class-level and method-level mutations. The proper
mutation operators can be selected by using the mentioned guidelines.
Generate Code for Mutant Generation
The next step is code generation from the defined safety model with using the
selected mutation operators. Code generation is performed using the code gener-
ator which is provided in the tool. For the code generation,
• fault information from hazard view model definition,
• tactic and handled faults information from safety-tactic view model defini-
tion,
• safety-critical module and implemented tactics from safety-critical view
133

model definition
• module, class, and test class information are extracted to determine the
module, its implementation classes and test classes
information are extracted from the defined safety model. For each tactic in the
system, a code is generated using the mentioned information in Java. It is a
skeleton code that includes the necessary code to generate mutants and run test
cases by calling related methods from µJava. Additionally, it involves a code part
to present results by generating report after test case run.
Generate Mutants
After the code generation step, mutants are generated using µJava. In order to
generate mutants corresponding selected mutant operators, the generated skele-
ton code is run with original program code. For each selected mutant operator,
related code is changed in the original program code by µJava and mutants are
generated.
Run Test Cases
After the mutant generation step, existing test cases are run on mutated program
codes to assess the quality of test cases. Test cases are run by executing the code
generated in skeleton code.
Generate Reports
The last step is report generation. Test case execution results are presented in
an excel file that includes the related faults, tactics, modules, class name, test
case name, mutation operator, and information which indicates the test case
fails/passes. Additionally, mutation score is calculated by using the information
of live mutants and killed mutants.
Results When we run the test suites on the original code and mutated code,
there could be 4 different cases for the results. The table 7.1 shows the cases.
134

Original Code Mutated Code Result
Pass Fail Expected
Pass Pass Shouldn’t happen
Fail Fail Possible
Fail Pass Rare
Table 7.1: Results for test cases
pass-fail case: If the original code is clean and it is implemented to exhibit
the expected safety tactic behavior, the test suite passes when it is executed on
the original code. Since the mutated code is generated by making some changes in
the original code, it includes some faults related to selected mutation operators.
Therefore, we expect that when we run the test suite on the mutated code, the
test suite should fail.
pass-pass case: As we explained in the pass-fail case, if the original code is
clean, when we execute the test suite it should pass on the original code and it
should fail on the mutated code. pass-pass case shouldn’t happen.
fail-fail case: If the original code doesn’t implemented to exhibit the ex-
pected safety tactic behavior, the test suite should fail, when we run it on the
original code. Since the mutated code includes some fault because of the muta-
tion, it is possible to fail on the mutated code.
fail-pass case: If the original code doesn’t implemented to exhibit the ex-
pected safety tactic behavior, the test suite should fail, when we run on the
original code. However, when we apply the mutation and generate the mutated
code from the original program, some faulty part of the original program could
be corrected on the mutated code and the test suite can deal with the faults.
Therefore, when we execute the test suite on the mutated code it can pass in rare
cases.
135

7.3 Tool
In this section, we discuss the tool that we have developed in the Eclipse envi-
ronment to define safety DSL and the tool to apply fault-based testing process.
We have define the grammar of safety DSL using Xtext [66] a language develop-
ment framework provided as an Eclipse plug-in, and the corresponding generator
creates the parser and runnable language artifacts. From these artifacts, the full-
featured Eclipse text editor is generated. Figure 7.3 shows the snapshot from
Eclipse text editor for our case study.
Figure 7.3: Tool for safety DSL
As mentioned before, for the mutant generation and test case execution steps
an existing open source project µJava implemented in Java is used. µJava pro-
vides the class-level and method-level operators for mutant generation. Addi-
tionally, it enables to execute predefined test cases on mutated program code. In
order to generate mutants, execute test cases and generate report from results of
execution of test cases a tool is implemented by taking advantage of Java library.
An example screenshot from implemented tool is shown in Figure 7.4.
136

Figure 7.4: Tool for fault-based testing
7.4 Application of Fault-Based Testing Ap-
proach on Case Study
In this section, we explain the application of fault-based testing approach and
present the results by using an industrial case study described in section 3. Firstly,
we give the information for implementation of the case study Avionics Control
Computer System. Then, we explain the application of each step of fault-based
testing approach presented in Figure 7.2.
137

7.4.1 Case Study
We apply the fault-based testing approach on the case study Avionics Control
Computer System explained in section 3. We implement the case study in Java
environment. The Figure 7.5 shows the UML class diagram of our case study. In
the following we provide the brief description of implemented classes for our case
study.
• common package includes:
– Altitude class which holds altitude data
– Fuel class which holds fuel amount data
– Radio class which holds radio frequency data
– Partition is a abstract class which is extended by Altitude1Mgr, Al-
titude2Mgr, NavigationManager, Fuel1Mgr, Fuel2Mgr, PlatformMgr,
RadioMgr, CommunicationMgr, and GraphicsMgr classes. This class
includes the methods to initialize, stop and run the mentioned manager
classes.
• protocol package includes:
– M1553Protocol is a abstract class which is extended by M1553ProtocolAltitude
and M1553ProtocolFuel classes.
– A429Protocol is a abstract class which is extended by A429ProtocolAltitude
and A429ProtocolFuel classes.
– M1553ProtocolAltitude class is defined for the altitude device which is
connected to MIL-STD-1553 channel used widely in avionics system
to receive data.
– M1553ProtocolFuel class is defined for the fuel device which is con-
nected to MIL-STD-1553 channel used widely in avionics system to
receive data.
– M1553ProtocolRadio class is defined for the radio device which is con-
nected to MIL-STD-1553 channel used widely in avionics system to
receive data.
138

– A429ProtocolAltitude class is defined for the altitude device which is
connected to ARINC-429 channel used widely in avionics system to
receive data.
– A429ProtocolFuel class is defined for the fuel device which is connected
to ARINC-429 channel used widely in avionics system to receive data.
• altitude device package includes:
– Altitude1Mgr is the device manager of altitude 1 device. This class uses
M1553ProtocolAltitude class to communicate with altitude 1 device.
– Altitude2Mgr is the device manager of altitude 2 device. This class uses
A429ProtocolAltitude class to communicate with altitude 2 device.
• navigation package includes:
NavigationMgr reads the altitude data from Altitude1Mgr and Alti-
tude2Mgr. It compares the altitudes, (1) if the difference between two
altitude values is within the defined boundaries, it produces an altitude
value, (2) if the difference between two altitude values is outside the de-
fined boundaries, it produces an altitude warning.
• fuel device package includes:
– Fuel1Mgr is the device manager of fuel 1 device. This class uses
M1553ProtocolFuel class to communicate with fuel 1 device.
– Fuel2Mgr is the device manager of fuel 2 device. This class uses
A429ProtocolFuel class to communicate with fuel 2 device.
• platform package includes:
PlatformMgr reads the fuel data from Fuel1Mgr and Fuel2Mgr. It com-
pares the two fuel data, (1) if the difference between two fuel values is
within the defined boundaries, it produces a fuel value, (2) if the difference
between two fuel values is outside the defined boundaries, it produces a fuel
warning.
139

Fig
ure
7.5:
UM
LC
lass
dia
gram
for
our
case
study
140

• radio device package includes:
RadioMgr is the device manager of radio frequency device. This class uses
M1553ProtocolRadio class to communicate with radio device.
• communication package includes:
CommunicationManager reads the radio frequency from RadioMgr and it
provides the radio frequency to GraphicsMgr.
• graphics package includes:
GraphicsMgr reads altitude data from two NavigationMgr objects. It first
checks whether there is an altitude warning. If there is no altitude warning,
then it displays the altitude data. Similarly, it reads fuel amount from two
PlatformMgr objects. It controls whether a fuel warning is produced. If
there is no fuel warning, then it displays the fuel amout data. It also reads
the radio frequency data from CommunicatonMgr object and it displays
the received data.
• monitor package includes:
– GraphicsMonitor monitors and recovers the GrahpicsMgr if it fails.
– Manager monitor monitors the Altitude1Mgr, Altitude2Mgr, Navi-
gationMgr, Fuel1Mgr, Fuel2Mgr, and PlatformMgr. If any of these
managers fails, the Manager monitor recovers it.
7.4.2 Application of Fault-Based Testing Approach
Build Safety Model
Firstly, we construct a safety model by using safety DSL explained in section
7.1.2. We define hazard view, safety tactic view, and safety-critical view for
the case study described in section 3. Additionally, we define the implementation
relations for the mutant generation and test case run steps. Figure 7.6 and Figure
7.7 present the concrete syntax of the hazard view for the case study. Figure 7.8
presents the concrete syntax of the safety tactic view for the case study. Figure
7.9 and Figure 7.10 show the concrete syntax of safety-critical view of the case
141

study. Figure 7.11 shows the implementation details given by using the safety
DSL.
Figure 7.6: Hazard view for our case study - Part 1
142

Figure 7.7: Hazard view for our case study - Part 2
143

Figure 7.8: Safety tactic view for our case study
144

Figure 7.9: Safety-critical view for our case study - Part 1
145

Figure 7.10: Safety-critical view for our case study - Part 2
Figure 7.11: Implementation details for our case study
146

Select Mutation Operators
We select the proper mutation operators according to the applied safety tac-
tic implementations. When deciding which operators to be selected, we use the
guidelines [25] and [26] provided by µJava. In these guidelines, the authors pro-
vide a set of mutation operators with their descriptions.
In the following, we present the selected mutation operators for each applied
safety tactic.
• AltitudeDataWarning tactic: This tactic generates an altitude warning
when there is a difference between two altitude values received from two
different altitude devices, when altitude data is received from only one of
the altimeters, or when altitude data cannot be received from both altime-
ters. Therefore, the implementation of this tactic includes comparison (&&
- And Operator and ||- OR Operator) and subtraction operations. In order
to generate mutants of these operators, we select COI, ROR, AORB, COR,
and LOI operators from [25] and [26]. COI (Conditional Operator Insertion)
inserts the unary conditional operators to the original code. Since the only
one unary operator is ”!” in Java, this mutation inserts the ”!” operator.
ROR (Relational Operator Replacement) replaces the relational operators
(<, >, <=, >=, ==, and !=) with other relational operators and the en-
tire predicate with true/false. AORB (Arithmetic Operator Replacement)
replaces the basic binary arithmetic operators (+, -, * , /, %) with other
binary arithmetic operators. COR (Conditional Operator Replacement) re-
places the binary conditional operators (&& , ||, & , |, ˆ) with other binary
conditional operators. LOI (Logical Operator Insertion) inserts the unary
logical operators (& , |, ˆ) to the original code.
• AltitudeDifferenceCheck tactic: This tactic compares the altitude values re-
ceived from two different altitude devices and detects if there is a difference.
Implementation of this tactic is similar to AltitudeDataWarning tactic. It
includes comparison (&& - And Operator and ||- OR Operator) and sub-
traction operations. Therefore, we select COI, ROR, AORB, COR, and
LOI operators.
147

• AltitudeRangeCheck tactic: This tactic compares the received altitude value
with its minimum and maximum values in order to detect the out of range
altitude value. Since it includes some comparison operations, we select COI,
LOI, and ROR.
• HealthCheckForGraphics tactic: This tactic is a monitoring tactic that mon-
itors the graphics managers’ failures. Implementation of this tactic includes
some comparison operations. We select COI and ROR operators for muta-
tion. When implementing this tactic, one of the important issue is setting
the Graphics Managers correctly. In order to analyze this issue, we select
PRV, JTI, and JTD operators. PRV(Reference assignment with other com-
patible type) changes operands of a reference assignment to be assigned to
the objects of subclasses. JTI (Java This keyword Insertion) inserts the key-
word this. JTD (Java This keyword Deletion) deletes the uses of keyword
this.
• HealthCheckForPlatform tactic: This tactic is a monitoring tactic which
monitors the platform managers’ failures. Implementation of this tactic
similar to HealthCheckForGraphics tactic. Therefore, we select COI, ROR,
PRV, JTI, and JTD operators as mutation operators.
• HealthCheckForNavigation tactic: This tactic is a monitoring tactic which
monitors the navigation managers’ failures. Implementation of this tac-
tic similar to HealthCheckForGraphics tactic and HealthCheckForPlatform
tactic. Therefore, we select COI, ROR, PRV, JTI, and JTD operators as
mutation operators.
• RecoverGraphics tactic: This tactic is a recovery tactic for graph-
ics manager. When the graphics manager fails, it recovers by stop-
ping/initializing/restarting the manager. Since the managers are extended
from Partition, calling of correct managers’ recovering operations is impor-
tant. In order to analyze this, we select PCI mutation operation. PCI (Type
cast operator insertion) changes the original type of an object reference to
the parent or child of the original declared type.
148

• RecoverNavigation tactic: This tactic is recovery tactic for navigation man-
ager. When the navigation manager fails, it recovers the manager. Since
the implementation of this tactic is similar to RecoverGraphics tactic, we
select PCI operator for mutation.
• RecoverPlatform tactic: This tactic is a recovery tactic for platform man-
ager. When the platform manager fails, it recovers the manager. Since
the implementation of this tactic is similar to RecoverGraphics tactic and
RecoverNavigation tactic, we select PCI operator for mutation.
• Redundant Altitude, Redundant Fuel, Redundant Display tactics : These
tactics are the redundancy tactics. In the implementation, there should
be two altitude managers, two fuel managers, and two graphics managers.
As shown in implementation details, we define two altitude managers, two
fuel managers, and two graphics managers. Hence, there is no mutation
generation for these tactics.
Generate Code for Mutant Generation
The next step is code generation to generate mutants and run test cases. The code
is generated by the tool developed within Xtext framework. The skeleton code is
generated using the constructed safety model and the selected mutant operators
information. The code includes the necessary Java code for mutant generation
and execution of test cases. Since we aim to analyze the applied safety tactics,
the code is generated for each safety tactic.
The sample code part is shown in Figure 7.12. This code includes the mu-
tant generation code for the AltitudeRangeCheck safety tactic for the module
Altitude1Manager.
149

Figure 7.12: Sample generated code for mutant generation
As shown in Figure 7.12, the mutation operators are provided with two string
list which are class ops and traditional ops. class ops is the list for class-level
mutation operators, while traditional ops is the list for method-level mutation
operators. The implementation classes are provided as a string list with file list.
These lists are given as parameters to generateMutants method in order to gen-
erate mutants.
Figure 7.13: Sample generated code for executing test cases
The Figure 7.13 shows the example code part to execute test cases and gener-
ate report. The example shows the generated code for for the AltitudeRangeCheck
safety tactic for the module Altitude1Manager. As shown in the Figure 7.13, the
150

class name and its test case class(es) are given as parameter to runTestCases
method. runTestCases method runs the test cases and returns the test results.
Test results are given as a parameter to generateExcelReport for generating the
report.
Generate Mutants
The generated code is used to generate mutants. An example code is presented
in Figure 7.12. We generate the mutants for our case study by executing the
generated code. In Table 7.2, we present the number of generated mutants for
each safety tactic and related module pair.
Safety Tactic Module # of mutants
AltitudeDataWarning Graphics1Manager 10
AltitudeDataWarning Graphics2Manager 10
AltitudeDataWarning NavigationManager 60
AltitudeDifferenceCheck NavigationManager 60
AltitudeRangeCheck Altitude1Manager 28
AltitudeRangeCheck Altitude2Manager 28
FuelDataWarning Graphics1Manager 10
FuelDataWarning Graphics2Manager 10
FuelDataWarning PlatformManager 24
FuelDifferenceCheck PlatformManager 24
FuelRangeCheck Fuel1Manager 28
FuelRangeCheck Fuel2Manager 28
HealthCheckForGraphics GraphicsMonitor 10
HealthCheckForNavigation ManagerMonitor 2
HealthCheckForPlatform ManagerMonitor 2
RecoverGraphics GraphicsMonitor 21
RecoverNavigation ManagerMonitor 21
RecoverPlatform ManagerMonitor 21
Table 7.2: Mutant generation for safety tactics
151

Run the Test Cases
The next step is executing the test cases on generated mutant codes. Test cases
are implemented by considering the behavior of the applied safety tactics. Test
case execution is performed by running the generated code. An example code to
run test cases is shown in Figure 7.13.
Generate Reports
The last step is report generation. After the test cases are generated, the test
results are provided to related code part explained above. The report includes the
name of the classes under test, name of the test case classes, mutation operators,
name of the test cases, and test results (fail/pass).
Results
As explained before, there are four different cases for the results: pass-fail, pass-
pass, fail-pass, and fail-fail. For the sake of simplicity, we present the results for
the tactics AltitudeDataWarning and FuelRangeCheck.
The table 7.3 shows the example results for the AltitudeDataWarning tactic
for the mutation operator ROR (Relational Operator Replacement). We have
implemented this warning according to its specification. Therefore, the test cases
pass on the original code.
The table 7.4 shows the example results for the FuelRangeCheck tactic for
the mutation operator COI (Conditional Operator Insertion). This tactic isn’t
implemented. Hence, the system doesn’t exhibit the expected behaviour of Fu-
elRangeCheck tactic. As shown in the table, some of the test cases fail on the
original code, since the system doesn’t include the implementation of the Fuel-
RangeCheck tactic.
152

Test CaseOriginalCode
Mutation OperatorMutatedCode
errorInDevice1Test pass ROR passerrorInDevice2Test pass ROR passerrorInDevice1And2Test pass ROR passlossOfDevice1Test pass ROR passlossOfDevice2Test pass ROR passlossOfDevice1And2Test pass ROR passdisplayAltitudeTest1 pass ROR faildisplayAltitudeTest2 pass ROR faildisplayAltitudeTest3 pass ROR passdisplayAltitudeTest4 pass ROR faildisplayAltitudeTest5 pass ROR faildisplayAltitudeTest6 pass ROR passdisplayAltitudeTest7 pass ROR fail
Table 7.3: Results for AltitudeDifferenceCheck-GraphicsMgr
Test CaseOriginalCode
Mutation OperatorMutatedCode
errorInDeviceTest1 fail COI failerrorInDeviceTest2 fail COI passlossOfDeviceTest fail COI passfuelTest1 pass COI failfuelTest2 pass COI failfuelTest3 pass COI failzeroizeTest pass COI fail
Table 7.4: Results for AltitudeDifferenceCheck-Fuel
153

Chapter 8
Related Work
Safety concern has not been explicitly addressed using a dedicated architecture
perspective before. However, there is plenty of work related to safety engineering.
In [67] and [54] several architectural patterns are proposed to support soft-
ware safety design. Gawand et al. [54] propose a framework for specification of
architectural patterns to support safety and fault tolerance. They provide four
types of patterns. One of the patterns is Control-Monitor pattern. They aim
to improve fault detection by using redundancy by using this pattern. Another
pattern is Triple Modular Redundancy pattern which is used to enhance safety
of the system where there is no fail-safe state. The other pattern is Reflective
State pattern which separates the application into two parts as base-level and
meta-level to separate control and safety aspect from the application logic. The
last pattern is Fault Tolerance Redundancy pattern which improves the fault tol-
erance of the system while implementing the redundancy for safety. Armoush et
al. [67] propose Recovery Block with Backup Voting pattern which improves the
fault tolerance of the system.
There are some techniques for analyzing the design from safety aspect. One
of the techniques is Fault Tree Analysis (FTA) which is proposed by Leveson
and Harvey [62]. FTA aims to analyze a design for possible faults which lead to
failures in the system. FTA is conducted by using logic gates. Another technique
154

is Failure Modes and Effects Analysis (FMEA) [68]. FMEA aims to identify po-
tential design weakness in system. It involves reviewing as many components,
assemblies, and subsystems as possible to identify failure modes and causes and
effects of such failures. The other technique is Failure Modes, Effects, and Criti-
cality Analysis (FMCEA) [68] which is an extension of FMEA. FMCEA includes
failure criticality assessment, while FMEA doesn’t. Criticality is assessed by both
considering the probability of failure modes and severity of their consequences.
There are several standards on software safety that provide a guideline for
software safety plan and design. RTCA DO-178C [28], MIL-STD-882D [49], IEC
61508 [69], NASA-STD-8719.13C [70] are some examples of the safety standards.
These standards basically define the required levels of safety but no do directly
consider the explicit design of safety-critical systems.
In order to represent the architecture of a software system formally, Architec-
ture Description Languages (ADL) are proposed. There are some ADLs which
supports the safety design and analysis. One of the ADLs is EAST-ADL2 [71]
which supports for safety analysis of safety-critical systems in automotive soft-
ware development. Another ADL is SCS-SADL [72] which helps to design of
hardware-in-loop simulation of safety-critical systems.
Architecture Evaluation process aims to analyze the software architecture de-
sign with respect to the stakeholder concerns. To compare the architectural
evaluation approaches a number of frameworks have been proposed. The Soft-
ware Architecture Review and Assessment (SARA) report, for example, provides
a conceptual framework for conducting architectural reviews [3]. The evalua-
tion frameworks usually compare the methods based on the criteria of context
and goals of the method, required content for applying the method, the pro-
cess adopted in the method, and the validation of the method. Although these
approaches are useful they tend to be general purpose. The safety perspective
that we have provided is dedicated for analyzing and design for safety concern in
particular.
In [73] and [74] the authors consider the explicit modeling of viewpoint for
155

quality concerns. Hereby, each quality concern such as adaptability and recov-
erability require a different decomposition of the architecture. To define the
required decompositions for the quality concerns architectural elements and re-
lations are defined accordingly. The study [73] on local recoverability has shown
that this approach is also largely applicable. We consider this work complemen-
tary to the architectural perspectives approach. It seems that both alternative
approaches seem to have merits.
Various studies [59] [60] [61] propose a metamodel for safety. Douglas [59]
provides a UML profiling for safety analysis including profiling for FTA (Fault
Tree Analysis) diagrams. Taguchi [60] provides a metamodel which includes safety
concepts expressed in ISO/FDIS 26262 standard [75] from scratch. In [61], they
define a metamodel includes safety concepts extracted from the airworthiness
standard, RTCA DO-178B [76], by extending UML.
In the literature, some studies propose fault-based testing approach to test
safety-critical systems. In [77], they define a test case generation approach based
on the model mutation for the safety requirements in the system. Firstly, they
define the fault model by describing mutation operators and UML models of the
system. They describe an approach for transforming UML model using the fault
model to OOAS(Object-Oriented Action Systems). After then, they generate
mutations of OOAS models and use these models for test case generation process.
The another study [78] applies mutation testing on nuclear reactor. In this work,
they propose a test case generation approach to test nuclear reactor. Then, they
apply the mutation testing by mutating the original source code. With this
approach, they aim to calculate the degree of test adequacy of the generated test
cases.
156

Chapter 9
Conclusion
An increasing number of systems tend to be safety-critical. Designing these sys-
tems by explicitly considering safety is important to mitigate the risks that could
to dramatic failures. We have observed that designing a safety-critical system
requires to show design decisions related to safety concerns explicitly at the archi-
tectural level. Existing viewpoints approaches and perspective approaches tend
to be general purpose and deliberately do not directly focus on the architectural
modeling of software safety concerns. However, in particular for safety-critical
systems it is crucial to represent these concerns early on at the architecture de-
sign level. For this purpose, we have provided a safety perspective that can be
used for supporting the architectural design of safety-critical systems. The need
for this was derived from a real industrial project in which we had to design a
safety critical system. The safety perspective appeared to be really practical, es-
pecially since it forced the designers to think about the design decisions regarding
the safety. The safety perspective was not only useful as a guidance tool for assist-
ing the safety engineer and the architect, but it also helped in the early analysis
of the architecture. In our future work we aim to apply the safety perspective
for several other domains. Another issue that we would like to consider is the
trade-off analysis using the safety perspective with the perspectives as defined for
other quality concerns.
157

Although safety perspective provides tactics and guidelines for handling the
safety concern at the architectural level, it doesn’t provide complete architec-
tural modeling of software safety concerns. In order to solve this problem, we
have introduced the architecture framework for software safety to address the
safety concerns explicitly. The framework includes three coherent set of view-
points each of which addresses an important concern. The application of the
viewpoints is illustrated for an industrial case on safety-critical avionics control
computer system. Using the viewpoints we could (1) analyze the architecture in
the early phases of the development life cycle, (2) analyze the design alternatives,
(3) increase the communication between safety engineers and software developers
and (4) communicate the design decisions related with safety. We have shown
how the architecture framework can be used for a real the design of a safety
critical system in the avionics domain. As a future work, we will define metrics
and develop tools to analyze several design alternatives for safety-critical systems
based on the proposed viewpoints.
Once the safety critical systems are designed it is important to analyze these
for fitness before implementation, installation and operation. For this purpose, we
have provided an approach for fault-based testing for analyzing the effectiveness
of safety tactics. The metamodel and the realized DSL formed an important
input to model the faults, the tactics and to support fault-based testing. We
have applied the approach and the tool for an industrial case study. Since this
approach focuses on the safety tactics and fault knowledge while designing the
test suites, it enables to testers to define more strong test suites for testing of the
safety-critical systems. Additionally, it provides the analysis of quality of test
cases by using the safety tactics. As a future work, we aim to model the safety
tactics in detailed way. In our approach, we determine the mutation operators
manually. By using the constructed safety DSL and safety tactic model, the
selection of mutation operators can be automatized. Also the test oracle (test
suites, test data, test scripts etc.) can be generated automatically by using these
models.
158

Bibliography
[1] N. G. Leveson, Safeware: System Safety and Computers. New York, NY,
USA: ACM, 1995.
[2] [NASATechnicalStandard], NASA Software Safety Guidebook, March 2004.
(NASA-GB-8719.13).
[3] P. Clements, D. Garlan, L. Bass, J. Stafford, R. Nord, J. Ivers, and R. Little,
Documenting Software Architectures: Views and Beyond. Pearson Educa-
tion, 2002.
[4] [ISO/IEC42010:2007], Recommended practice for architectural description
of software-intensive systems (ISO/IEC 42010)., July 2005. (identical to
ANSI/IEEE Std14712000).
[5] P. Kruchten, “The 4+1 view model of architecture,” IEEE Softw., vol. 12,
pp. 42–50, Nov. 1995.
[6] C. Hofmeister, R. Nord, and D. Soni, Applied Software Architecture. Boston,
MA, USA: Addison-Wesley Longman Publishing Co., Inc., 2000.
[7] N. Rozanski and E. Woods, Software Systems Architecture: Working With
Stakeholders Using Viewpoints and Perspectives. Addison-Wesley Profes-
sional, 2005.
[8] P.-A. Muller, F. Fondement, and B. Baudry, “Modeling modeling,” in Model
Driven Engineering Languages and Systems (A. Schrr and B. Selic, eds.),
vol. 5795 of Lecture Notes in Computer Science, pp. 2–16, Springer Berlin
Heidelberg, 2009.
159

[9] T. Kuehne, “Matters of (meta-) modeling,” Software and System Modeling,
vol. 5, no. 4, pp. 369–385, 2006.
[10] A. Brown, “Model driven architecture: principles and practice,” SoSyM,
vol. 3, no. 3, pp. 314–327, 2004.
[11] “ OMG (Object Management Group) Model Driven Architecture.” http:
//www.omg.org/mda/.
[12] S. J. Mellor, S. Kendall, A. Uhl, and D. Weise, MDA Distilled. Redwood
City, CA, USA: Addison Wesley Longman Publishing Co., Inc., 2004.
[13] A. Kleppe, Software Language Engineering: Creating Domain-Specific Lan-
guages Using Metamodels. Addison-Wesley Professional, 1 ed., 2008.
[14] T. Stahl, M. Voelter, and K. Czarnecki, Model-Driven Software Development:
Technology, Engineering, Management. John Wiley & Sons, 2006.
[15] “Eclipse - Model-to-Model Transformation (MMT).” http://www.eclipse.
org/mmt/.
[16] “ATL - Transformation Language.” http://www.eclipse.org/atl/.
[17] “Eclipse - OperationalQVT.” http://www.eclipse.org/mmt/?project=
qvto.
[18] “Eclipse - Declarative QVT.” http://www.eclipse.org/mmt/?project=
qvtd.
[19] “Eclipse - Model-to-Text Transformation.” http://www.eclipse.org/
modeling/m2t/.
[20] “Eclipse - JET.” http://www.eclipse.org/modeling/m2t/.
[21] “Eclipse - Accelo.” http://wiki.eclipse.org/accelo.
[22] “Eclipse - Xpand.” http://wiki.eclipse.org/Xpand.
[23] M. Young and M. Pezze, Software Testing and Analysis: Process, Principles
and Techniques. John Wiley & Sons, 2005.
160

[24] “µJava - Mutation System for Java Programs.” http://cs.gmu.edu/
~offutt/mujava/.
[25] Y. S. Ma, Y. R. Kwon, and J. Offutt, “Inter-class mutation operators for
java,” in Proceedings of the 13th International Symposium on Software Reli-
ability Engineering, ISSRE ’02, (Washington, DC, USA), pp. 352–363, IEEE
Computer Society, 2002.
[26] J. Offutt, Y. S. Ma, and Y. R. Kwon, “The class-level mutants of mujava,” in
Proceedings of the 2006 International Workshop on Automation of Software
Test, AST ’06, (New York, NY, USA), pp. 78–84, ACM, 2006.
[27] P. G. Neumann, “Illustrative risks to the public in the use of computer sys-
tems and related technology,” SIGSOFT Softw. Eng. Notes, vol. 17, pp. 23–
32, Jan. 1992.
[28] [RTCADO-178CStandard], Software Considerations in Airbone Systems and
Equipment Certification, May 2012.
[29] D. Atkins, D. Best, P. A. Briss, M. Eccles, Y. Falck-Ytter, S. Flottorp,
G. H. Guyatt, R. T. Harbour, M. C. Haugh, D. Henry, S. Hill, R. Jaeschke,
G. Leng, A. Liberati, N. Magrini, J. Mason, P. Middleton, J. Mrukowicz,
D. O’Connell, A. D. Oxman, B. Phillips, H. J. Schunemann, T. T.-T. Edejer,
H. Varonen, G. E. Vist, J. W. Williams, and S. Zaza, “Grading quality of
evidence and strength of recommendations.,” BMJ (Clinical research ed.),
vol. 328, p. 1490, 2004.
[30] P. Bourque and R. Dupuis, “Guide to the software engineering body of
knowledge 2004 version,” Guide to the Software Engineering Body of Knowl-
edge, 2004. SWEBOK, pp. –, 2004.
[31] M. Utting, A. Pretschner, and B. Legeard, “A taxonomy of model-based
testing approaches,” Software Testing Verification and Reliability, vol. 22,
pp. 297–312, 2012.
[32] B. Kitchenham and S. Charters, “Guidelines for performing Systematic Lit-
erature Reviews in Software Engineering,” Engineering, vol. 2, p. 1051, 2007.
161

[33] B. Kitchenham, O. Pearlbrereton, D. Budgen, M. Turner, J. Bailey, and
S. Linkman, “Systematic literature reviews in software engineering A sys-
tematic literature review,” Information and Software Technology, vol. 51,
pp. 7–15, 2009.
[34] H. Zhang, M. A. Babar, and P. Tell, “Identifying relevant studies in software
engineering,” Information and Software Technology, vol. 53, pp. 625–637,
2011.
[35] J. E. Hopcroft, R. Motwani, and J. D. Ullman, “Introduction to automata
theory, languages, and computation, 2nd edition,” 2001.
[36] M. Li and R. Kumar, “Stateflow to extended finite automata translation,” in
Proceedings - International Computer Software and Applications Conference,
pp. 1–6, 2011.
[37] “NuSVM Language.” http://nusmv.fbk.eu/.
[38] C. Petri, Kommunikation mit Automaten. PhD thesis, Institut fur instru-
mentelle Mathematik, Bonn, 1962.
[39] A. Hessel and P. Pettersson, “COVERA Real-time Test Case Generation
Tool,” in 19th IFIP International Conference on Testing of Communicating
Systems and 7th International Workshop on Formal Approaches to Testing
of Software, 2007.
[40] “ATGT - Tool.” http://cs.unibg.it/gargatini/projects/atgt/.
[41] S. Prowell, “JUMBL: a tool for model-based statistical testing,” 36th Annual
Hawaii International Conference on System Sciences, 2003. Proceedings of
the, 2003.
[42] F. Thomas, J. Delatour, F. Terrier, and S. Gerard, “Toward a framework
for explicit platform-based transformations,” in Proceedings - 11th IEEE
Symposium on Object/Component/Service-Oriented Real-Time Distributed
Computing, ISORC 2008, pp. 211–218, 2008.
[43] “SAL Framework.” http://sal.csl.sri.com/.
162

[44] “Spin - Formal Verification.” http://spinroot.com/spin/whatispin.htm.
[45] B. Ning and C. A. Brebbia, Computers in Railways XII: Computer System
Design and Operation in Railways and Other Transit Systems. WIT Press,
1st ed., 2010.
[46] J. D. Lawrence, “Software safety hazard analysis,” 1995.
[47] [ISO/IEC25010:2011], Systems and software Quality Requirements and Eval-
uation (SQuaRE), Systems and software engineering, 2011.
[48] L. Gowen, J. Collofello, and F. Calliss, “Preliminary hazard analysis for
safety-critical software systems,” in Computers and Communications, 1992.
Conference Proceedings., Eleventh Annual International Phoenix Conference
on, pp. 501–508, April 1992.
[49] [MIL-STD-882D], Standard Practice for System Safety, Department of De-
fense, 2000.
[50] A. Joshi, M. P. Heimdahl, S. P. Miller, and M. W. Whalen, “Model-based
safety analysis,” 2006.
[51] A. Pataricza, I. Majzik, G. Huszerl, and G. Varnai, UML-based design and
formal analysis of a safety-critical railway control software module, May
2003.
[52] G. Yu and Z. wei Xu, “Model-based safety test automation of safety-critical
software,” in Computational Intelligence and Software Engineering (CiSE),
2010 International Conference on, pp. 1–3, Dec 2010.
[53] M. Wasilewski, W. Hasselbring, and D. Nowotka, “Defining requirements
on domain-specific languages in model-driven software engineering of safety-
critical systems,” in Software Engineering 2013 Workshopband (S. Wagner
and H. Lichter, eds.), Lecture Notes in Informatics, (Bonn), pp. 467–482,
Kollen Druck+Verlag GmbH, 2013.
[54] H. Gawand, R. Mundada, and S. P, Design Patterns to Implement Safety
and Fault Tolerance, March 2011.
163

[55] S. P. Kumar, P. S. Ramaiah, and V. Khanaa, “Architectural patterns to
design software safety based safety-critical systems,” in Proceedings of the
2011 International Conference on Communication, Computing & Secu-
rity, ICCCS ’11, (New York, NY, USA), pp. 620–623, ACM, 2011.
[56] W. Wu and T. Kelly, “Safety tactics for software architecture design,” in
Computer Software and Applications Conference, 2004. COMPSAC 2004.
Proceedings of the 28th Annual International, pp. 368–375 vol.1, Sept 2004.
[57] L. Chen and A. Avizienis, “N-version programminc: A fault-tolerance ap-
proach to rellablllty of software operatlon,” in Fault-Tolerant Computing,
1995, Highlights from Twenty-Five Years., Twenty-Fifth International Sym-
posium on, pp. 113–, Jun 1995.
[58] D. Sojer, C. Buckl, and A. Knoll, “Deriving fault-detection mechanisms from
safety requirements,” Computer Science - Research and Development, pp. 1–
14, 2011.
[59] B. P. Douglass, Analyze System Safety using UML within the IBM Rational
Rhapsody Environment, 2009.
[60] K. Taguchi, Metamodeling Approach to Safety Standard for Consumer De-
vices, 2011.
[61] G. Zoughbi, L. Briand, and Y. Labiche, “Modeling safety and airworthiness
(rtca do-178b) information: Conceptual model and uml profile,” Softw. Syst.
Model., vol. 10, pp. 337–367, July 2011.
[62] N. G. Leveson and P. R. Harvey, “Analyzing software safety,” IEEE Trans.
Softw. Eng., vol. 9, pp. 569–579, Sept. 1983.
[63] “EuGeNia.” http://www.eclipse.org/epsilon/doc/eugenia/.
[64] “Eclipse Graphical Modeling Framework (GMF).” http://www.eclipse.
org/modeling/gmp/.
[65] “ Eclipse Epsilon Project.” http://www.eclipse.org/epsilon.
164

[66] “Eclipse - Xtext Language Development Framework.” http://www.
eclipse.org/Xtext/.
[67] A. Armoush, F. Salewski, and S. Kowalewski, “Recovery block with backup
voting: A new pattern with extended representation for safety critical em-
bedded systems,” in Information Technology, 2008. ICIT ’08. International
Conference on, pp. 232–237, Dec 2008.
[68] M. Rausand and A. Høyland, System Reliability Theory: Models, Statistical
Methods and Applications, Second Edition. Wiley-Interscience, 2003.
[69] [IS/IEC61508], Functional Safety of Electrical /Electronic/ Programmable
Electronic Safety-Related Systems. International Electrotechnical Commis-
sion, 1998.
[70] [NASA-STD-8719.13C], NASA Software Safety Standard, July 2013.
[71] P. Cuenot, P. Frey, R. Johansson, H. Lonn, Y. Papadopoulos, M.-O. Reiser,
A. Sandberg, D. Servat, R. T. Kolagari, M. Torngren, and M. Weber, “The
east-adl architecture description language for automotive embedded soft-
ware,” in Proceedings of the 2007 International Dagstuhl Conference on
Model-based Engineering of Embedded Real-time Systems, MBEERTS’07,
(Berlin, Heidelberg), pp. 297–307, Springer-Verlag, 2010.
[72] Y. Zhu, Z. Xu, and M. Mei, “A simulation architecture description language
for hardware-in-loop simulation of safety critical systems,” Journal of The-
oretical and Applied Information Technology, vol. 46, December 2012.
[73] H. Sozer, B. Tekinerdoan, and M. Aksit, “Optimizing decomposition of soft-
ware architecture for local recovery,” Software Quality Journal, vol. 21, no. 2,
pp. 203–240, 2013.
[74] B. Tekinerdogan and H. Sozer, “Defining architectural viewpoints for quality
concerns,” in Software Architecture (I. Crnkovic, V. Gruhn, and M. Book,
eds.), vol. 6903 of Lecture Notes in Computer Science, pp. 26–34, Springer
Berlin Heidelberg, 2011.
[75] [ISO26262-1:2011], Functional Safety of Road Vehicles, 2011.
165

[76] [RTCADO-178BStandard], Software Considerations in Airborne Systems
and Equipment Certification, 1992.
[77] W. Herzner, R. Schlick, H. Brandl, and J. Wiessalla, “Towards fault-based
generation of test cases for dependable embedded software.”
[78] P. A. Babu, C. S. Kumar, N. Murali, and T. Jayakumar, “An intuitive
approach to determine test adequacy in safety-critical software,” SIGSOFT
Softw. Eng. Notes, vol. 37, pp. 1–10, Sept. 2012.
166

Appendix A
Search String
•IEEE Explore Search String
((”Document Title”:”model based testing” OR ”Document Title”:”model based
software testing” OR
”Document Title”:”model-based testing” OR ”Document Title”:”model-based
software testing” OR
”Document Title”:”model driven testing” OR ”Document Title”:”model driven
software testing” OR
”Document Title”:”model-driven testing” OR ”Document Title”:”model-driven
software testing” OR
”Document Title”:”model based test” OR ”Document Title”:”model based soft-
ware test” OR
”Document Title”:”model-based test” OR ”Document Title”:”model-based soft-
ware test” OR
”Document Title”:”model driven test” OR ”Document Title”:”model driven soft-
ware test” OR
”Document Title”:”model-driven test” OR ”Document Title”:”model-driven soft-
ware test”
) AND (”Document Title”:”safety”))
OR
((”Abstract”:”model based testing” OR ”Abstract”:”model based software test-
ing” OR
167

”Abstract”:”model-based testing” OR ”Abstract”:”model-based software testing”
OR
”Abstract”:”model driven testing” OR ”Abstract”:”model driven software test-
ing” OR
”Abstract”:”model-driven testing” OR ”Abstract”:”model-driven software test-
ing” OR
”Abstract”:”model based test” OR ”Abstract”:”model based software test” OR
”Abstract”:”model-based test” OR ”Abstract”:”model-based software test” OR
”Abstract”:”model driven test” OR ”Abstract”:”model driven software test” OR
”Abstract”:”model-driven test” OR ”Abstract”:”model-driven software test”
) AND (”Abstract”:”safety”))
•ACM Digital Library
((Title:”model based testing” OR Title:”model based software testing” OR
Title:”model-based testing” OR Title:”model-based software testing” OR
Title:”model driven testing” OR Title:”model driven software testing” OR
Title:”model-driven testing” OR Title:”model-driven software testing” OR
Title:”model based test” OR Title:”model based software test” OR
Title:”model-based test” OR Title:”model-based software test” OR
Title:”model driven test” OR Title:”model driven software test” OR
Title:”model-driven test” OR Title:”model-driven software test”) AND Ti-
tle:”safety”)
OR
((Abstract:”model based testing” OR Abstract:”model based software test-
ing” OR
Abstract:”model-based testing” OR Abstract:”model-based software test-
ing” OR
Abstract:”model driven testing” OR Abstract:”model driven software test-
ing” OR
Abstract:”model-driven testing” OR Abstract:”model-driven software test-
ing” OR
Abstract:”model based test” OR Abstract:”model based software test” OR
168

Abstract:”model-based test” OR Abstract:”model-based software test” OR
Abstract:”model driven test” OR Abstract:”model driven software test” OR
Abstract:”model-driven test” OR Abstract:”model-driven software test”)
AND Abstract:”safety”)
•Wiley Interscience
(”model based testing” OR ”model based software testing” OR ”model-based
testing” OR ”model-based software testing” OR ”model driven testing” OR
”model driven software testing” OR ”model-driven testing” OR ”model-
driven software testing” OR ”model based test” OR ”model based software
test” OR ”model-based test” OR ”model-based software test” OR ”model
driven test” OR ”model driven software test” OR ”model-driven test” OR
”model-driven software test” )AND ”software” AND ”safety”
•Science Direct
TITLE-ABSTR-KEY ((”model based testing” OR ”model based software
testing” OR ”model-based testing” OR ”model-based software testing” OR
”model driven testing” OR ”model driven software testing” OR ”model-
driven testing” OR ”model-driven software testing” OR ”model based test”
OR ”model based software test” OR ”model-based test” OR ”model-based
software test” OR ”model driven test” OR ”model driven software test” OR
”model-driven test” OR ”model-driven software test” ) AND ”safety”)
•Springer
(”model based testing” OR ”model based software testing” OR ”model-based
testing” OR ”model-based software testing” OR ”model driven testing” OR
”model driven software testing” OR ”model-driven testing” OR ”model-
driven software testing” OR ”model based test” OR ”model based software
test” OR ”model-based test” OR ”model-based software test” OR ”model
169

driven test” OR ”model driven software test” OR ”model-driven test” OR
”model-driven software test” ) AND ”safety”
•ISI Web of Knowledge
((TI=”model based testing” OR TI=”model based software testing” OR
TI=”model-based testing” OR TI=”model-based software testing” OR
TI=”model driven testing” OR TI=”model driven software testing” OR
TI=”model-driven testing” OR TI=”model-driven software testing” OR
TI=”model based test” OR TI=”model based software test” OR
TI=”model-based test” OR TI=”model-based software test” OR
TI=”model driven test” OR TI=”model driven software test” OR
TI=”model-driven test” OR TI=”model-driven software test”) AND
TI=”safety”) OR
((TS=”model based testing” OR TS=”model based software testing” OR
TS=”model-based testing” OR TS=”model-based software testing” OR
TS=”model driven testing” OR TS=”model driven software testing” OR
TS=”model-driven testing” OR TS=”model-driven software testing” OR
TS=”model based test” OR TS=”model based software test” OR
TS=”model-based test” OR TS=”model-based software test” OR
TS=”model driven test” OR TS=”model driven software test” OR
TS=”model-driven test” OR TS=”model-driven software test”) AND
TS=”safety”)
170

Appendix B
List of Primary Studies
A. Kandl, S., Kirner R., Puschner P. Development of a framework for au-
tomated systematic testing of safety-critical embedded systems. Interna-
tional Workshop on Intelligent Solutions in Embedded Systems 2006. 1-13.
DOI=10.1109/WISES.2006.329116
B. Yu G., Xu Z. W. Model-Based Safety Test Automation of Safety-Critical
Software. International Conference on Computational Intelligence and Software
Engineering (CiSE) 2010. 1-3. DOI = 10.1109/CISE.2010.5676883
C. Fang L., Kitamura T., Do T., Ohsaki H. Formal Model-Based Test for
AUTOSAR Multicore RTOS. IEEE Fifth International Conference on Soft-
ware Testing, Verification and Validation (ICST) 2012. 251-259. DOI =
10.1109/ICST.2012.105
D. Yu G., Xu Z. W., Du J. W. An Approach for automated safety testing of
safety-critical software system based on safety requirements. International Fo-
rum on Information Technology and Applications (IFITA ’09) 2009.3. 166-169.
DOI= 10.1109/IFITA.2009.18
E. Lv J., Li K., Wei G., Tang T., Li C., Zhao W. Model-based test cases generation
for Onboard system. IEEE Eleventh International Symposium on Autonomous
Decentralized Systems (ISADS) 2013. 1-6. DOI= 10.1109/ISADS.2013.6513433
F. Kloos J., Hussain T., Eschbach R. Risk-based testing of safety-critical embed-
ded systems driven by fault tree analysis. IEEE Fourth International Conference
171

on Software Testing, Verification and Validation Workshops (ICSTW) 2011. 26-
33. DOI = 10.1109/ICSTW.2011.90
G. Kloos J., Eschbach R. A systematic approach to construct compositional be-
haviour models for network-structured safety-critical systems. Electronic Notes in
Theoretical Computer Science, 263. 145-160. DOI = 10.1016/j.entcs.2010.05.00
H. Kollmann M., Hon, Y. Generating Scenarios by Multi-Object Checking.
Electronic Notes in Theoretical Computer Science, 190 (2), 61-72. DOI =
10.1016/j.entcs.2007.08.006
I. Lochau M., Goltz U. Feature Interaction Aware Test Case Generation for Em-
bedded Control Systems. Electronic Notes in Theoretical Computer Science, 264
(3), 37-52. DOI = 10.1016/j.entcs.2010.12.013
J. Tseng W., Fan C. Systematic Scenario Test Case Generation for Nuclear
Safety Systems. Information and Software Technology. 55 (2), 344-356. DOI
= 10.1016/j.infsof.2012.08.016
K. Auguston M., Michael J., Shing M. Environment Behavior Models for Au-
tomation of Testing and Assessment of System Safety. Information and Software
Technology. 48 (10). 971-980. DOI = 10.1016/j.infsof.2006.03.005
L. Cichos H., Oster S., Lochau M., Schrr A. Model-Based Coverage-Driven Test
Suite Generation for Software Product Lines. Proceedings of the 14th inter-
national conference on Model driven engineering languages and systems, 6981.
425-439. DOI = 10.1007/978-3-642-24485-8 31
M. Gargantini A. Using Model Checking to Generate Fault Detecting Tests. Tests
and Proofs, 4454. 189-206. DOI = 10.1007/978-3-540-73770-4 11.
N. Micskei Z., Szatmri Z., Olh J., Majzik, I. A Concept for Testing Robustness
and Safety of the Context-Aware Behaviour of Autonomous System. Agent and
Multi-Agent Systems. Technologies and Applications, 7327. 504-513. DOI =
10.1007/978-3-642-30947-2 55
O. Proetzsch M., Zimmermann F., Eschbach R., Kloos J., Karsten, B. A System-
atic Testing Approach for Autonomous Mobile Robots Using Domain-Specific
Languages. KI 2010: Advances in Artificial Intelligence, 6359. 317-324. DOI =
10.1007/978-3-642-16111-7 36
P. Herzner W., Schlick R., Schtz W., Brandl H., Krenn W. Towards generation
172

of efficient test cases from UML/OCL models for complex safety-critical sys-
tems. e & i Elektrotechnik und Informationstechnik, 127 (6). 181-186. DOI =
10.1007/s00502-010-0741-2
Q. Krenn W., Schlick R., Aichernig B. Mapping UML to Labeled Transition Sys-
tems for Test-Case Generation. Formal Methods for Components and Objects.
6286. 186-207. DOI = 10.1007/978-3-642-17071-3 10
R. Mathaikutty D. A., Ahuja S., Dingankar A., Shukla S. Model-driven
test generation for system level validation.IEEE International on High Level
Design Validation and Test Workshop (HLVDT 2007). 83-90. DOI =
10.1109/HLDVT.2007.4392792
S. Enoiu E. P., Sundmark D., Pettersson P. Model-based test suite generation for
function block diagrams using the UPPAAL model checker. IEEE Sixth Inter-
national Conference on Software Testing, Verification and Validation Workshops
(ICSTW) 2013. 158-167. DOI = 10.1109/ICSTW.2013.27
T. Zheng W., Liang C., Wang R., Kong W., Automated Test Approach
Based on All Paths Covered Optimal Algorithm and Sequence Priority Selected
Algorithm. IEEE Transactions on Intelligent Transportation Systems, DOI:
10.1109/TITS.2014.2320552
173

Appendix C
Study Quality Assessment
Quality ofReporting
Rigor Credit Relevance
PrimaryStudy
Q1 Q2 Q3 Q4 Q5 Q6 Q7 Q8 Q9 Q10 Total
A 1 1 0,5 1 1 1 0,5 0,5 1 1 8,5B 1 1 0,5 0,5 0,5 0,5 0 0,5 1 0,5 6C 1 1 1 1 1 1 0,5 1 1 1 9,5D 1 1 0,5 0,5 0,5 0,5 0,5 0,5 1 0,5 6,5E 1 1 0,5 1 0,5 1 0 0,5 1 0,5 7F 1 1 0,5 1 1 1 0 0,5 1 0,5 7,5G 1 1 0,5 0,5 1 1 0,5 0,5 1 0,5 7,5H 1 1 0,5 1 0,5 1 0 1 1 0,5 7,5I 1 1 0,5 0,5 1 1 0 0,5 1 0,5 7J 1 1 0,5 1 1 1 0,5 1 1 1 9K 1 1 1 1 0,5 1 0,5 1 1 1 9L 1 1 0,5 0,5 1 1 0,5 1 1 0,5 8M 1 1 0,5 1 1 1 0,5 1 1 0,5 8,5N 1 1 1 1 0,5 1 0,5 0,5 1 1 8,5O 1 1 0,5 1 1 0,5 0 0,5 1 0,5 7P 1 1 1 0,5 1 1 0,5 1 1 1 9Q 1 1 0,5 1 0,5 1 0 0,5 1 1 7,5R 1 1 0,5 1 1 1 0 1 1 0,5 8S 1 1 1 1 1 1 0 1 1 1 9T 1 1 1 1 1 1 0 1 1 1 9
174

Appendix D
Data Extraction Form
175

Publications Related to This Thesis
1. H. G. Gurbuz, B. Tekinerdogan, N. Pala Er. Safety Perspective for Sup-
porting Architectural Design of Safety-Critical Systems, in Proc. of the 8th
European Conference on Software Architecture (ECSA 2014), LNCS 8627,
pp. 365-373, 2014
2. H. G. Gurbuz, N. Pala Er, B. Tekinerdogan. Architecture Framework for
Software Safety, to be published in Proc. of the 8th System Analysis and
Modelling Conference (SAM 2014), Valencia, Spain, September 29-30, 2014
3. H. G. Gurbuz, N. Pala Er, B. Tekinerdogan. Application of Safety Per-
spective to the Views and Beyond Approach, to be published in Proc. of
the 8th Turkish Software Engineering Conference (UYMS 2014), Guzelyurt,
KKTC, 8-10 September, 2014.
4. H. G. Gurbuz, B. Tekinerdogan. Systematic Literature Review on Model-
Based Testing for Software Safety, to be submitted
176
Related Documents