ARCHITECTURE AND REMOTE INTERACTION TECHNIQUES FOR DIGITAL MEDIA EXCHANGE ACROSS 3G MOBILE DEVICES

Welcome message from author
This document is posted to help you gain knowledge. Please leave a comment to let me know what you think about it! Share it to your friends and learn new things together.
Transcript

ARCHITECTURE AND REMOTE
INTERACTION TECHNIQUES FOR
DIGITAL MEDIA EXCHANGE
ACROSS 3G MOBILE DEVICES

2
3
Abstract
For users away from the office or home, there is an increasing demand for mobile
solutions that offer effective collaborative facilities on the move. The mobile
cellular device, or “smart phone”, can offer a ubiquitous platform to deliver such
services, provided that its many physical and technological constraints can be
overcome.
In an effort to better support mobile collaboration, this thesis presents a
contributing Mobile Exchange Architecture (MEA) designed to improve upon
the capabilities provided by mobile devices to enable synchronous exchange of
digital media during a phone conversation using wireless networks and cellular
devices. This research includes the design and development of one such MEA in
the form of a fully functional Photo-conferencing service, supporting shared
remote interaction techniques, simultaneous voice communication and seamless
digital media exchange between remote and collocated mobile users.
Furthermore, through systematic design, experimental evaluations and field
studies we evaluate the effects of different shared remote interaction techniques –
„pointing‟, „scaling‟, „mixed‟ and „hybrid‟ – assessing the task effort required by
users when interacting around shared images across resource constrained mobile
devices.
This thesis presents a direction for the future development of technologies and
methods to enable a new era of scalable always-to-hand mobile collaborative
environments.
4
Author‟s Declaration
At the time of submission, several sections of work from this thesis have
previously appeared (or are scheduled to appear) in peer-reviewed publications.
In the following list the full references for these publications are given.
- Yousef, K. and O'Neill, E. [2008]: Preliminary Evaluation of a Remote
Mobile Collaborative Environment. In: Proceedings of ACM CHI 2008
Conference on Human Factors in Computing Systems April 5-10, 2008,
Florence, Italy. pp. 3267-3272.
- Yousef, K. and O'Neill, E. [2008]: Supporting Social Album Creation with
Mobile Photo-Conferencing. In: Proceedings of Collocated Social
Practices Surrounding Photos Workshop at CHI 2008 April 5-10, 2008,
Florence, Italy.
- Harper, R. Rodden, T. Rogers, Y., Sellen, A. [2008]. Being Human: HCI in
2020, Microsoft Research, Cambridge, UK. pp. 64-68
- Yousef, K. and O'Neill, E. [2007]. Photo-Conferencing: A Novel Approach
to Interactive Photo Sharing across 3G Mobile Networks. In: Proceedings
of Social Interaction and Mundane Technologies Workshop Simtech
2007, November 26-27, 2007, Melbourne, Australia..
- Yousef, K. and O'Neill, E. [2007]. Sunrise: Towards Location Based
Clustering For Assisted Photo Management. In: Proceedings of Ninth
International Conference on Multimodal Interfaces, Tagging, Mining and
Retrieval of Human-Related Activity Information Workshop at ICMI
2007 November 12-15, 2007, Nagoya, Japan. pp. 47-54.
5
- Harper, R. Regan, T. Rouncefield, M. Rubens, S. and Yousef, K. [2007].
Trafficking: Design for the Viral Exchange of Digital Content on Mobile
Phones at Mobile HCI 2007 September 9-12, 2007, Singapore, Malaysia.
- Collomosse, J.P. Yousef, K. and E. O'Neill, E. [2006]. Viewpoint Invariant
Image Retrieval For Context In Urban Environments. In: Proceedings of
3rd European Conference on Visual Media Production, CVMP 2006, 29–
30 November, London, UK. pp. 177 - 177.
Research related to this PhD has also appeared on the discovery channel (Yousef,
K interview with Anna Choi), BBC Radio 4 and demonstrated in CSCW‟08:
- Yousef, K. and O'Neill, E. [2008]: Supporting Mobile Cooperative Services
across 3G Cellular Networks. Reception Demo CSCW 2008 Conference
on Computer Supported Cooperative Work November 8-12, 2008, San
Diego, California, USA.
This research has also received industry coverage e.g. NTT DATA Institute of
Management Consulting and the Vodafone Research 1st prize (2007) for
outstanding applied research in the field of Mobile Social Networking and
Communication.

6
Acknowledgements
It is said that we learn the most when we undertake projects at the edge of
impossibility; we set out on a voyage of discovery, navigating new terrains,
searching for that glimmer of hope that will guide us to the answers we seek.
It is with those thoughts in mind my gratitude goes to my supervisor Dr. Eamonn
O‟Neill for his support throughout my Ph.D. He has throughout taught me what
it means to be a researcher and to strive for excellence. But just as importantly, he
has constantly allowed my inquisitiveness the freedom to explore new terrains,
undertake greater challenges and the invaluable advice and support to make this
thesis possible.
Special thanks go to my family for their never ending support and guidance
throughout my life; this dissertation is simply impossible without them. I would
also like to thank my friends for providing a constant source of encouragement
during my graduate study and to all of my participants for contributing their
time, effort and valuable feedback.
Finally, this work would not have been feasible without funding from the
University of Bath, the EPSRC, Microsoft and Vodafone Group R&D that
enabled much of my research and allowed me to travel to conferences around the
world to present my results.

7
Table of Contents
Abstract 3
Author‟s Declaration 4
Acknowledgements 6
Table of Contents 7
List of Figure 13
List of Tables 18
List of Abbreviations 19
Chapter 1 – Introduction .............................................................................................. 22
1.1 Introduction ............................................................................................. 22
1.2 Problem Statement and Research Goals .................................................. 24
1.3 Contribution and significance ................................................................. 25
1.4 Organization of Dissertation ................................................................... 26
Chapter 2 – Background and Related Work ................................................................ 30
2.1 Introduction ............................................................................................... 30
2.2 Collaboration ............................................................................................. 31
2.3 Video-Mediated Communication .............................................................. 32
2.3.1 Personal Space: Video-as-Presence ................................................ 33
2.3.2 Task Space: Video-as-Data ............................................................. 37
2.4 Towards Mobile Collaboration ................................................................. 39
2.5 Mobile Media Exchange .......................................................................... 40
2.6 Mobile Capture Culture ............................................................................. 41
2.7 Mobile Sharing Limitations ...................................................................... 44
2.8 Chapter Summary...................................................................................... 45
Chapter 3 – GSM Cellular Architecture ...................................................................... 48
3.1 Introduction ............................................................................................... 48

8
3.2 Mobile Communication Systems .............................................................. 49
3.3 The GSM Architecture .............................................................................. 50
3.3.1 Early Mobile 2G Data Networks (GPRS) ....................................... 51
3.3.2 Existing Mobile 3G Data Networks (UMTS) ................................. 52
3.3.3 Next Generation Mobile IP-Data Networks (IMS) ......................... 53
3.4 Chapter Summary...................................................................................... 55
Chapter 4 –Mobile Exchange Architecture .................................................................. 60
4.1 Introduction ............................................................................................... 60
4.2 Mobile Exchange Architecture ................................................................. 61
4.3 Architecture Overview .............................................................................. 62
4.4 Extensibility .............................................................................................. 63
4.5 Layered Architecture ................................................................................. 65
4.5.1 Communication „Push-Sync‟ Layer ................................................ 67
4.5.1.1 Session Management Engine ................................................ 69
4.5.1.1.1 Seamless Session Creation ............................................... 69
4.5.1.1.2 Session Initiation Protocols .............................................. 71
4.5.1.1.3 Session initiation „dialling‟ process ................................. 71
4.5.1.1.4 Session initiation „ringing‟ process .................................. 72
4.5.1.1.5 Session expansion process ............................................... 74
4.5.1.1.6 Session terminating process ............................................. 74
4.5.1.2 Distributed Coordination Engine ......................................... 75
4.5.1.2.1 Exchanging „state‟ information ........................................ 76
4.5.1.2.2 State Coordination Protocols ........................................... 77
4.5.1.2.3 State exchange „publish‟ process ..................................... 77
4.5.1.2.4 State exchange „subscribe‟ process .................................. 78
4.5.1.2.5 Coping with „jitter‟ effects ............................................... 79
4.5.1.3 Distributed Exchange Engine ................................................ 80
4.5.1.3.1 Store and forward process ................................................ 81
4.5.1.3.2 Security and Encryption ................................................... 81
4.5.1.3.3 Data Exchange Protocols ................................................. 82
4.5.1.3.4 Resource „transfer‟ process .............................................. 82
4.5.1.3.5 Resource „verifier‟ process .............................................. 83
4.5.1.4 Adaptive Throttling Mechanism ........................................... 84
4.5.2 Collaboration APIs .......................................................................... 84
4.5.2.1 Session Management............................................................. 85
4.5.2.2 Resource Publisher ................................................................ 85
4.5.2.3 Resource Subscriber .............................................................. 86
4.6 Chapter Summary ..................................................................................... 86
Chapter 5 –Mobile Photo-Conferencing Service ......................................................... 88
5.1 Introduction ............................................................................................... 88
5.2 Implementation - Application Layer ......................................................... 89
5.2.1 Graphical User Interface ................................................................. 90

9
5.2.1.1 Main Task Screen.................................................................. 91
5.2.1.2 Archive Viewer ..................................................................... 93
5.2.1.3 Session Initiation Process...................................................... 97
5.2.1.4 Media Space Screen .............................................................. 98
5.2.1.5 Application Settings ............................................................ 101
5.2.1.6 User Input Controls ............................................................. 102
5.2.2 Rendering and Compositing Engine ............................................. 104
5.2.2.1 Scaling & Animation Engine .............................................. 105
5.2.2.2 Compositing Engine ............................................................ 106
5.2.2.3 Content Adaption Techniques ............................................. 108
5.2.2.3.1 Content Transformation ................................................ 109
5.2.2.3.2 Content Framing ........................................................... 111
5.2.2.3.3 Content Peripheral Framing .......................................... 112
5.2.2.3.4 Content Peripheral t-Framing ........................................ 114
5.2.2.4 Content Adaption User Survey ........................................... 115
5.2.3 Adaptive Throttling Mechanisms.................................................. 119
5.2.3.1 Consistency Maintenance Algorithms ................................ 120
5.2.3.2 Rapid input & Animation Tweening ................................... 122
5.2.3.3 Unicast & Group Messaging ............................................... 124
5.2.3.4 Sequencing & Time Synchronisation ................................. 125
5.3 Chapter Summary.................................................................................... 126
Chapter 6 – Remote Interaction Techniques .............................................................. 128
6.1 Introduction ............................................................................................. 128
6.2 Grounding Communication ..................................................................... 129
6.3 Pilot Study - Interaction Techniques ....................................................... 130
6.3.1 Pointing ........................................................................................ 130
6.3.2 Scaling .......................................................................................... 131
6.4 Study 1 - Pointing and Scaling ............................................................... 132
6.4.1 Study Methodology ...................................................................... 133
6.4.1.1 Design ................................................................................. 133
6.4.1.2 Interaction Techniques ........................................................ 133
6.4.1.3 Experimental Task .............................................................. 135
6.4.1.4 Procedure ............................................................................ 138
6.4.1.5 Participants .......................................................................... 139
6.4.1.6 Apparatus ............................................................................ 140
6.4.1.7 Materials ............................................................................. 142
6.4.1.8 Problems encountered ......................................................... 142
6.4.2 Statistical Analysis ....................................................................... 143
6.4.2.1 Task completion time .......................................................... 143
6.4.2.2 Error Rates .......................................................................... 144
6.4.2.3 Conversation Analysis ........................................................ 145
6.4.2.4 Event Analysis .................................................................... 146
6.4.2.5 Workload Analysis .............................................................. 147
6.4.3 Subjective Feedback ..................................................................... 151

10
6.4.4 Discussion .................................................................................... 152
6.5 Study 2 - Hybrid Technique .................................................................... 154
6.5.1 Study Methodology ..................................................................... 154
6.5.1.1 Design ................................................................................. 154
6.5.1.2 Hybrid Interaction Technique ............................................. 155
6.5.1.3 Interaction Technique ......................................................... 157
6.5.1.4 Experimental Task .............................................................. 157
6.5.1.5 Procedure ............................................................................ 158
6.5.1.6 Participants .......................................................................... 159
6.5.1.7 Apparatus ............................................................................ 159
6.5.1.8 Materials ............................................................................. 159
6.5.1.9 Problems encountered ......................................................... 160
6.5.2 Statistical Analysis ....................................................................... 160
6.5.2.1 Task completion time .......................................................... 161
6.5.2.2 Error Rates .......................................................................... 161
6.5.2.3 Conversation Analysis ........................................................ 162
6.5.2.4 Event Analysis .................................................................... 163
6.5.2.5 Workload Analysis .............................................................. 164
6.5.3 Subjective Feedback ..................................................................... 167
6.5.4 Discussion .................................................................................... 167
6.6 Study 3 - Field-Based Observations ........................................................ 168
6.6.1 Study Methodology ...................................................................... 168
6.6.1.1 Design ................................................................................. 168
6.6.1.2 Interaction Techniques ........................................................ 169
6.6.1.3 Procedure ............................................................................ 172
6.6.1.4 Participants .......................................................................... 173
6.6.1.5 Apparatus ............................................................................ 173
6.6.1.5 Problems Encountered ........................................................ 174
6.6.2 Analysis ........................................................................................ 174
6.6.2.1 Timing Analysis .................................................................. 174
6.6.2.2 Conversation Analysis ........................................................ 176
6.6.2.3 Event Analysis .................................................................... 177
6.6.2.4 Subjective Feedback ........................................................... 178
6.7 Chapter Summary.................................................................................... 180
Chapter 7 – Summary & Future Work ....................................................................... 182
7.1 Summary ................................................................................................. 182
7.2 Further Work ........................................................................................... 184
7.3 Conclusion .............................................................................................. 186
7.4 Closing Remarks ..................................................................................... 187
Bibliography .............................................................................................................. 188
11
A Companion to Chapter 2 ........................................................................................ 199
A.1 HTC-S710 Device Specifications .......................................................... 199
B Companion to Chapter 3 ........................................................................................ 201
B.1 GSM Architecture .................................................................................. 201
B.2 Second Generation GSM Architecture ................................................... 202
B.3 Third Generation GSM Architecture ...................................................... 204
B.4 IMS (IP Multimedia Subsystem) Architecture ....................................... 205
B Companion to Chapter 5 ........................................................................................ 207
C.1 Participant Survey .................................................................................. 207
D Companion to Chapter 6 ........................................................................................ 209
D.1 Participant Consent Form ....................................................................... 209
D.2 Participant Information Sheet ................................................................. 210
D.3 Participant Worker Diagram .................................................................. 211
D.4 Participant Helper Diagram .................................................................... 212
D.5 Participant post-questionnaire .............................................................. 213
D.6 Participant post-questionnaire NASA TLX subscales sheet .................. 214
D.7 Participant post-questionnaire NASA TLX paired-comparisons sheet .. 215
D.8 Participant Evaluation Questionnaire ..................................................... 216
D.9 Participant Evaluation Questionnaire ..................................................... 217
D.10 Mobile collaboration: Workload Analysis ........................................... 218
D.11 Weighted subscale by communication condition ................................. 218
D.12 Study 1 – Pointing Results (Timing, Words, Events) .......................... 219
D.13 Study 1 – Pointing Results Workload Analysis: Mental Demand ....... 219
D.14 Study 1 – Pointing Results Workload Analysis: Physical Demand ..... 220
D.15 Study 1 – Pointing Results Workload Analysis: Temporal Demand ... 220
D.16 Study 1 – Pointing Results Workload Analysis: Performance ............. 221
D.17 Study 1 – Pointing Results Workload Analysis: Effort ........................ 221
D.18 Study 1 – Pointing Results Workload Analysis: Frustration ................ 222
D.19 Study 1 – Scaling Results (Timing, Words, Events) ............................ 223
D.20 Study 1 – Scaling Results Workload Analysis: Mental Demand ......... 223
D.21 Study 1 – Scaling Results Workload Analysis: Physical Demand ....... 224
D.22 Study 1 – Scaling Results Workload Analysis: Temporal Demand ..... 224
D.23 Study 1 – Scaling Results Workload Analysis: Performance .............. 225
D.24 Study 1 – Scaling Results Workload Analysis: Mental Demand ......... 225
D.25 Study 1 – Scaling Results Workload Analysis: Frustration ................. 226
D.26 Study 1 – Mixed Results (Timing, Words, Events) ............................. 227
D.27 Study 1 – Mixed Results Workload Analysis: Mental Demand........... 227
D.28 Study 1 – Mixed Results Workload Analysis: Physical Demand ........ 228
D.29 Study 1 – Mixed Results Workload Analysis: Temporal Demand ...... 228
D.30 Study 1 – Mixed Results Workload Analysis: Performance ................ 229
12
D.31 Study 1 – Mixed Results Workload Analysis: Mental Demand........... 229
D.32 Study 1 – Mixed Results Workload Analysis: Frustration ................... 230
D.33 Study 2 – Hybrid Results (Timing, Words, Events) ............................. 231
D.34 Study 2 – Hybrid Results Workload Analysis: Mental Demand .......... 231
D.35 Study 2 – Hybrid Results Workload Analysis: Physical Demand ....... 232
D.36 Study 2 – Hybrid Results Workload Analysis: Temporal Demand ..... 232
D.37 Study 2 – Hybrid Results Workload Analysis: Performance ............... 233
D.38 Study 2 – Hybrid Results Workload Analysis: Effort .......................... 233
D.39 Study 2 – Hybrid Results Workload Analysis: Frustration .................. 234

13
List of Figures
1.1 Mobiles are helping some nations leapfrog older technologies ........................... 23
1.2 Organization of the Dissertation .......................................................................... 28
2.1 Person space versus task space: (left) a personal space is provided by a video link
directly between two users; (right) a task space is a new domain in which the users can
collaborate .................................................................................................................... 32
2.2 AT&T's Picturephone, unveiled at the 1964 World's Fair ................................... 34
2.3 Apple‟s iChat software ......................................................................................... 34
2.4 The Hydra four-way teleconferencing system ..................................................... 36
2.5 The collaborative puzzle task. The Worker‟s view (left) and the Helper‟s view
(right) from Gergle (2006) The Worker‟s screen consists of a staging area on the right
hand side in which the puzzle pieces are shown, and a work area on the left hand side
in which she constructs the puzzle.. ............................................................................. 39
3.1 GSM Architecture ................................................................................................ 50
3.2 Second Generation GSM Architecture ................................................................. 51
3.3 Third Generation GSM Architecture .................................................................... 52
3.4 IMS (IP Multimedia Subsystem) Architecture ..................................................... 53
3.5 IMS (IP Multimedia Subsystem) Layers. ............................................................. 54
3.6 Network Agnostic Architecture ........................................................................... 55
3.7 The TCP/IP and associated protocol OSI layers .................................................. 56
4.1 Mobile exchange architectural overview ............................................................. 62
4.2 OSI seven layer model and MEA model .............................................................. 64
4.3 MEA extensible architecture. ............................................................................... 65
4.4 MEA detailed architectural overview .................................................................. 65
4.5 Mobile Exchange Server architectural detail ....................................................... 67
4.6 MEA detailed architectural overview, with highlighted push-sync layer ............ 67
4.7 Push-Sync Mediator modules ............................................................................... 68
4.8 Session creation process overview diagram, see protocols 4.5.1.1.2-6 for
additional information .................................................................................................. 69
4.9 Stages of a call lifecycle ....................................................................................... 70
4.10 Session initiation „dialling‟ process ..................................................................... 71
14
4.11 Session initiation „ringing‟ process ...................................................................... 72
4.12 Session invitation token ....................................................................................... 73
4.13 Session expansion process ................................................................................... 74
4.14 Session contraction process ................................................................................. 74
4.15 Distributed coordination process overview diagram, see protocols 4.5.1.2.2-4 for
additional information .................................................................................................. 75
4.16 Data types comparison bit-rate/delay ................................................................... 76
4.17 State update process ............................................................................................. 77
4.18 State request process ............................................................................................ 78
4.19 Distributed Coordination Mechanism .................................................................. 79
4.20 Distributed Exchange Engine overview diagram, see protocols 4.5.1.3-5 for
additional information .................................................................................................. 80
4.21 Media Exchange Engine ...................................................................................... 82
4.22 Media Exchange Engine ...................................................................................... 83
4.23 Mobile collaboration API layer............................................................................ 84
4.24 MEA application programming interface ............................................................ 85
4.25 User load time (left) and Bandwidth usage (right), for fifty concurrent user
sessions ........................................................................................................................ 87
5.1 MEA application layer components ..................................................................... 89
5.2 Experiential Aesthetics: A Framework for Beautiful Experience [Uday 2008] .. 90
5.3 Main interface task selection ................................................................................ 91
5.4 Main task selection menu: Start session (top left), Archive viewer (top right),
Account settings (bottom left), Exit client (bottom right). ........................................... 92
5.5 Archive viewer interface (left) and real time rendering process (right) ............... 93
5.6 Archive viewer real-time overlay process ............................................................ 94
5.7 Main interface with four options and exit buttons, Standard list view (left), Ripple
interface (right) ............................................................................................................ 95
5.8 Main interface with four options and exit buttons ............................................... 96
5.9 Session initiation process in action ...................................................................... 97
5.10 Main Conferencing Interface ............................................................................... 99
5.11 Image Contribution and Selection indicator bar: Image selection process ........ 100
5.12 Image Contribution and Selection indicator bar: Image Contribution indicator 100
5.13 Media space advanced options, controls and user customisable configuration
settings ....................................................................................................................... 100
5.14 Application Settings Screen ............................................................................... 101
5.15 User interface input controls .............................................................................. 103
5.16 Media Exchange relative to screen size ............................................................. 104
5.17 Animated zooming during a shared session ....................................................... 105
15
5.18 Sharing and gesturing as it occurs during face-to-face collaboration (Crabtree,
Rodden et al. 2004) (top), and during a remote mobile photo-conferencing session
(bottom) ..................................................................................................................... 106
5.19 RGB (left), RGBA (middle) and RGBA with alpha compositing (right) .......... 107
5.20 Cropped: RGB (left), RGBA (middle) and RGBA with alpha compositing
(right). ....................................................................................................................... 107
5.21 Illustrative example of variations in screen resolution and orientation across a
number of available Windows Mobile devices .......................................................... 108
5.22 The effects of content transformation, as it would appear on a mobile device‟s
display (yellow area). The top illustration consists of the source image and the lower
illustrates the target output ......................................................................................... 109
5.23 Content transformation, across four devices: S730 (source device), Motorola Q9,
HP iPAQ 200 and Apples iPhone. Across four common screen resolutions from left
to right 240x320, 320x340, 480x640 and 480x320 ................................................... 110
5.24 Content framing, across four devices: S730 (source device), Motorola Q9, HP
iPAQ 200 and Apples iPhone. Across four common screen resolutions from left to
right 240x320, 320x340, 480x640 and 480x320 ....................................................... 111
5.25 Content peripheral framing, across four devices: S730 (source device), Motorola
Q9, HP iPAQ 200 and Apples iPhone. Across four common screen resolutions from
left to right 240x320, 320x340, 480x640 and 480x320 ............................................. 112
5.26 An example of content transformation (left) in comparison to content framing
(middle) and content peripheral framing (right). Across three screen resolutions from
top to bottom: 240x320, 320x340 and 480x640 ........................................................ 113
5.27 Content peripheral t-framing, across four devices: S730 (source device),
Motorola Q9, HP iPAQ 200 and Apples iPhone. Across four common screen
resolutions from left to right 240x320, 320x340, 480x640 and 480x320. ................. 114
5.28 An example of image-content transformation (top-row) in comparison to content
framing (second-row), peripheral framing (third-row) and peripheral t-framing
(bottom-row), across four common screen resolutions 240x320, 320x340, 480x640
and 480x320 ............................................................................................................... 116
5.29 Schematic- content transformation (top-row) in comparison to content framing
(second-row), peripheral framing (third-row) and peripheral t-framing (bottom-row),
across four common screen resolutions 240x320, 320x340, 480x640 and 480x320 117
5.30 Content transformation applied to schematic data containing textual content.
240x320 (right) and transformed aspect ratio 320x340 (left), the textual content in the
transformed output becomes harder to read ............................................................... 118
5.31 Adaptive Throttling Mechanism. ....................................................................... 119
5.32 Catch-up Coordination Mechanism ................................................................... 121
5.33 Adaptive Throttling Coordination Mechanism .................................................. 121
5.34 Animation Tweening process............................................................................. 122
5.35 Animation Tweening transition ......................................................................... 123
5.36 Catch-up Coordination Mechanism ................................................................... 124

16
5.37 Synchronisation Mechanism .............................................................................. 125
6.1 Pointing interaction ............................................................................................ 130
6.2 Scaling interaction .............................................................................................. 131
6.3 „Pointing‟ (left) and „scaling‟ (right) .................................................................. 132
6.4 Extract from a complex visual image with multiple points of focus:
Michelangelo‟s Last Judgement (a); (ab) after 1 degree of scaling; (b) with cursor
indicator ..................................................................................................................... 135
6.5 Michelangelo‟s Last Judgement, example image with multiple
referential points and connections showing one possible relation diagram ............... 136
6.6 Diagram layouts used across conditions and counterbalanced across participating
pairs. Rule defines that each node in the diagram must connect to at least on other
node for successful completion. Design allows for a large number of possible
permutations to deter random selection ..................................................................... 137
6.7 Connection examples, each node must connect to at least one other node. A-B:
fulfil the connection rule, C: does not. ....................................................................... 137
6.8 Collaborative study Helper/Worker set-up......................................................... 139
6.9 Experiment setup with divider to prevent visual communication (a). Participants
(bottom row): Helper on the left (b) and Worker on the right (c) .............................. 141
6.10 Mean task completion time, in seconds across conditions ................................. 144
6.11 Mean number of error rates across conditions ................................................... 144
6.12 Mean number of words spoken across conditions ............................................. 145
6.13 Mean number of key presses across conditions ................................................. 146
6.14 Workload: Mean weighted (NASA TLX both sections) mental workload sub-
scales across conditions ............................................................................................. 148
6.15 Workload: Mean unweighted (NASA TLX first section only) mental workload
sub-scales ................................................................................................................... 149
6.16 Scaling (left), Pointing (right) Helper/Worker un-weighted mental workload sub-
scales comparison ...................................................................................................... 149
6.17 Workload: Mean „Pointing‟ unweighted Helper/Worker workload sub-scales
comparison ................................................................................................................. 150
6.18 Workload: Mean „Scaling‟ unweighted Helper/Worker workload sub-scales
comparison ................................................................................................................. 151
6.19 Workload: Mean „Mixed‟ unweighted Helper/Worker workload sub-scales
comparison ................................................................................................................. 151
6.20 Picture which does not use the rule of third (left),
Picture that use the rule of third (right) ...................................................................... 155
6.21 Scene framing and alignment grid, a common
feature on most digital cameras ................................................................................. 155
6.22 Pointing, Scaling, Mixed and Hybrid interaction conditions.
Blue arrows indicate panning actions and green arrows indicate scaling action ...... 156

17
6.23 Hybrid interface (ca); Hybrid interface after 1 degree of scaling (cb) ............... 157
6.24 Experiment setup/participants, Helpers on the left and Workers on the right. .. 158
6.25 Mean task completion time, in seconds across conditions ................................. 160
6.26 Mean number of error rates across conditions ................................................... 162
6.27 Mean number of words spoken across conditions ............................................. 163
6.28 Mean number of key presses across conditions ................................................. 164
6.29 Workload: Mean weighted (NASA TLX both sections) mental workload sub-
scales across communication conditions: Pointing, Scaling, Mixed and Hybrid ....... 165
6.30 Workload: Mean unweighted (NASA TLX first section only) mental workload
sub-scales across communication conditions: Pointing, Scaling, Mixed and Hybrid 166
6.31 Workload: Mean „hybrid‟ unweighted Helper/Worker workload sub-scales
comparison ................................................................................................................. 166
6.32 User interface input controls .............................................................................. 170
6.33 Image selection (top), capture (middle) and collaborative distribution (bottom)171
6.34 Photo-conferencing functionality categorised by participant use during a
collaborative session, displayed as percentage .......................................................... 175
6.35 Screen size and referential awareness ................................................................ 176
6.36 Mean number of key presses across conditions ................................................. 177
7.1 Support for multiple concurrent mobile cooperative sessions across cellular
networks ..................................................................................................................... 183
7.2 Access to mobile sensory data, location information and environmental readings
will define future MEAs ............................................................................................ 185

18
List of Tables
2.1 Space and time taxonomy for computer-supported cooperative work, with
example applications [Ellis, et al. 1991]. Participants may be in the same place or
different places, and may interact synchronously or asynchronously with each other. 31
2.2 A taxonomy of image capture, showing numbers and proportions of images by
category [Kindberg et al. 2005] ................................................................................... 42
6.1 Mean (and SDs in parentheses) performance of collaborating pairs across
conditions (Time: in seconds, Errors: average per experiment)................................. 143
6.2 Mean (and SDs in parentheses) performance of collaborating pairs across
conditions (Words: number of words). ...................................................................... 145
6.3 Mean (and SDs in parentheses) performance of collaborating pairs across
conditions (Events: number of key presses, Workload: NASA TLX). ...................... 147
6.4 Workload: Mean weighted (NASA TLX both sections) mental workload sub-
scales across conditions: Pointing, Scaling and Mixed. SDs in parentheses. ........... 148
6.5 Mean (and SDs in parentheses) performance of collaborating pairs across
conditions (Time: in seconds, Errors: average per experiment)................................. 161
6.6 Mean (and SDs in parentheses) performance of collaborating pairs across
conditions (Words: number of words). ...................................................................... 162
6.7 Mean (and SDs in parentheses) performance of collaborating pairs across conditions
(Events: number of key presses). ............................................................................... 163
6.8 Workload: Mean weighted (NASA TLX both sections) mental workload sub-scales
across conditions: Pointing, Scaling and Mixed. SDs in parentheses ....................... 165
6.9 Mean (and SDs in parentheses) performance of collaborating pairs across conditions
(Events: number of key presses) ................................................................................ 178
6.10 The mean responses to the Likert-scale questions completed by each of the
participants from 1 = strongly disagree to 5 = strongly agree .................................... 179

19
List of Abbreviations
3G Refers to the third generation of mobile phones.
3GPP 3rd Generation Partnership Project
ANOVA ANalysis Of VAriance
Ajax Application Programming Interface
CSCW Computer Supported Cooperative Work
DOM Document Object Model
GSM Groupe Spéciale Mobile, original in French, translates into English
as the General Mobile System. Because the standard has become
global it is also known as Global System Mobile.
GPRS General Packet Radio Service, a subset of the GSM standard,
which enables transfer of packet data
GPU Graphical Processing Unit
GUI Graphical User Interface
HCI Human-Computer Interaction
HTML HyperText Markup Language
HTTP HyperText Transport Protocol
HTTPS Secure HyperText Transfer Protocol
IMS IP Multimedia Subsystem
IMSI International Mobile Subscriber Identity
J2ME Java 2 Platform, Micro Edition
20
JSON Java Script Object Notation
MEA Mobile Exchange Architecture
MVC Model-View-Controller
MMS Multi Media Services
OSI Open Systems Interconnection
PC Personal Computer
PDA Personal Digital Assistant
SD Standard Deviation
UI User Interface
URL Uniform Resource Locator
W3C World Wide Web Consortium
WAP Wireless Application Protocol
WLAN Wireless LAN, local area network
UBICOMP Ubiquitous Computing
UMTS Universal Mobile Telecommunications Services, a term used for
the third generation standards of mobile telephones. Can be
regarded as a synonym to 3G (within the contexts of this book)
WWW World Wide Web, A service developed at CERN Research Centre
by Tim Berners Lee in 1989, which makes possible the global
distribution of hypertext and multimedia data

21

22
Chapter 1
Introduction
“Any sufficiently advanced technology is indistinguishable from magic” Arthur C. Clarke
1.1 Introduction
Today, there are 1.5 billion television sets in use around the world. 1 billion people are
on the Internet. But nearly 3 billion people have a mobile phone, making it one of the
world's most successful consumer products. April 3, 2008 marked the 35th anniversary
of the first public telephone call placed on a portable cellular phone. Martin Cooper (now
chairman, CEO, and co-founder of Array Comm Inc) placed that call on April 3, 1973,
while general manager of Motorola's Communications Systems Division.
It was the incarnation of his vision for personal wireless communications, distinct from
cellular car phones. That first call, placed to Cooper‟s rival at AT&T‟s Bell Labs from
the streets of New York City, caused a fundamental technology and communications
market shift toward the person and away from the place.
"People want to talk to other people - not a house, or an office, or a car.
Given a choice, people will demand the freedom to communicate wherever
they are, unfettered by the infamous copper wire." Martin Cooper.
There has since been a worldwide boom in the penetration of mobile telephony devices
that have had a profound effect on the global technologies landscape. Far-reaching
cellular voice networks provide the potential for people to make themselves available for
phone calls with any person, at any time. Mobile data networks have become more
practical in coverage and bandwidth, fostering improvements in offerings that seek to
bring the successful communication modalities of the fixed Internet (e-mail, instant
messaging and social networks) to the mobile domain.
23
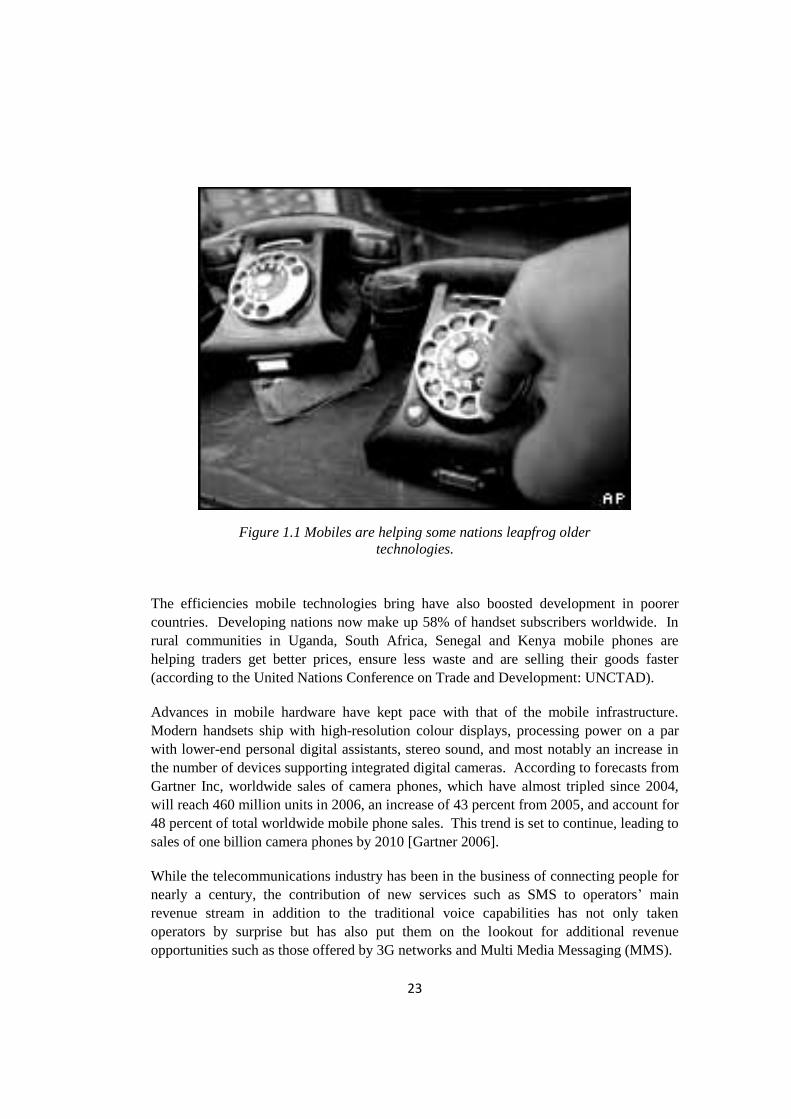
The efficiencies mobile technologies bring have also boosted development in poorer
countries. Developing nations now make up 58% of handset subscribers worldwide. In
rural communities in Uganda, South Africa, Senegal and Kenya mobile phones are
helping traders get better prices, ensure less waste and are selling their goods faster
(according to the United Nations Conference on Trade and Development: UNCTAD).
Advances in mobile hardware have kept pace with that of the mobile infrastructure.
Modern handsets ship with high-resolution colour displays, processing power on a par
with lower-end personal digital assistants, stereo sound, and most notably an increase in
the number of devices supporting integrated digital cameras. According to forecasts from
Gartner Inc, worldwide sales of camera phones, which have almost tripled since 2004,
will reach 460 million units in 2006, an increase of 43 percent from 2005, and account for
48 percent of total worldwide mobile phone sales. This trend is set to continue, leading to
sales of one billion camera phones by 2010 [Gartner 2006].
While the telecommunications industry has been in the business of connecting people for
nearly a century, the contribution of new services such as SMS to operators‟ main
revenue stream in addition to the traditional voice capabilities has not only taken
operators by surprise but has also put them on the lookout for additional revenue
opportunities such as those offered by 3G networks and Multi Media Messaging (MMS).
Figure 1.1 Mobiles are helping some nations leapfrog older
technologies.

24
Evidence however shows that despite heavy investments in 3G networks to drive new
services such as MMS, the MMS service has been described as “a flop” [Economist
2006] and SMS still remains the dominant collaborative service globally for 2006,
accounting for 56% of end user spending on mobile data services [IDC 2006].
Through “social shaping” [MacKenzie and Wajcman 1985] it is possible to argue that
MMS‟s picture sending capabilities as opposed to SMS‟s texting capabilities, fails to
meet user needs. An emerging body of research on cameraphone use [Kindberg, et al.
2005, Van House and Davis 2005] indicates that people want to share images, however
image sharing is itself a complex research space, and mobile users are often frustrated
when trying to share images remotely and interactively [Aoki et al. 2005].
1.2 Problem Statement and Research Goals
Private and business communication and collaboration is increasingly being freed from
temporal and spatial constraints. Many traditional ways of interacting which required
temporal or spatial coordination have given way to much more flexible and adaptive
distributed and mobile interaction styles among businesses and people. More and more
users are searching the Internet from their phones, and the phone itself is evolving into a
computer platform. In the future, there may be no desktop or laptop computers; instead,
the only computer you use could be the mobile phone.
The need for continuous collaboration irrespective of physical location and organizational
boundaries is becoming a typical setting which produces new complex scenarios that
have to be supported by technologies combining paradigms from a multiplicity of
research areas, such as distributed systems, CSCW, mobile data management, databases,
knowledge management and software engineering.
Independently of the business domain, private collaboration has become a hot issue.
Virtual communities and so-called “social networks” have enjoyed a tremendous
popularity recently and are starting to require functionalities for collaboration in the
broadest sense similar to those in business environments. The widespread availability of
mobile devices makes support for mobility a rising topic across these domains.
Although mobile devices free users from a socket and cable, mobility brings about a new
level of challenge, including time-varying wireless channels and dynamic topology and
connectivity.

25
Weiser introduced the notion of ubiquitous computing in 1991 [Wieser 1991]:
“The most profound technologies are those that disappear. They weave
themselves into the fabric of everyday life until they are indistinguishable
from it.” Mark Weiser.
The heterogeneity of networks, hardware, software, services and information makes it a
challenging task to provide a transparent computing system from the user point of view.
Mobility means that some of the assumptions of how to create distributed systems are
challenged. Wireless network connections are intermittent with varying bandwidth and
quality. Mobile devices are resource-weak to allow them to slip into one‟s pocket and to
operate on battery power.
This dissertation is motivated by the difficulties mobile users have in sharing media
remotely and interactively with others. The research question this thesis addresses is
“How can we better design systems to support interactive media exchange across
resource constrained mobile cellular devices?”.
1.3 Contribution and significance
Mobile cooperative services are an emerging field of research in providing always-at-
hand communication capabilities to users on the go. In an effort to contribute to our
understanding of and improve upon the capabilities provided by mobile devices to
exchange rich media content between remote participants, this work provides a novel
combination of robust mobile systems engineering with an investigation of related user
interaction techniques, contributing to the design, implementation and evaluation of
digital media sharing solutions in the mobile domain.
A review of the literature on media sharing on mobile phone based devices suggests a
need for rich interactivity that simply doesn’t exist with current mobile services.
Adopting an architecture led investigation into mobile media sharing we developed a
complete mobile exchange architecture and functioning end to end system that works
across all 3G mobile cellular networks to support the unique properties of cellular mobile
environments.
We have also demonstrated the instantiation of this system as a mobile photo-sharing
application. Although this is an important example of the kind of applications that can be
supported, we intend the underlying architecture and its interaction techniques to be more
generically applicable across a range of mobile activities and services.
26
A robust distributed co-ordination engine is responsible for the management of all active
cooperative sessions and supports scenarios from simple media- and location-sharing
services to distributed gaming utilising an extensible plug-in systems architecture. The
dissertation goes on to provide a comparative evaluation of remote interaction techniques,
“Pointing”, “Scaling”, “Mixed” and “Hybrid”, assessing their impact on users‟ actual
performance and perceptions, helping to advance and inform the design of systems to
support digital media exchange across mobile devices.
Unlike much of the previous work in this area, which has largely focused upon desktop
based cooperative environments, our solution was designed and built from the ground up
and evaluated across resource limited mobile cellular devices. Inspired by rich real-time
interactions, we designed and iteratively prototyped a fully functional mobile architecture
which supports real time digital media exchange and interactions across collocated and
remote mobile cellular devices with the simultaneous use of an active phone call. This
dissertation presents the ideation, conceptual architecture, high-fidelity prototyping,
evaluation and iterative prototyping of the mobile architecture, engendering new
directions for future work in this area.
1.4 Organization of Dissertation
The goal of this dissertation is to investigate how best to support mobile digital media
exchange and to design and build an architecture to enable the creation of such mobile
services. There are therefore two distinct strands of research that are intertwined in this
dissertation. Figure 1.2 summarises how the different chapters of the dissertation relate to
each other.
Chapter 2 discusses related literature. We start with a structured review of
computer mediated communication, CSCW, groupware and relevant projects
exploring software design and interaction techniques for collaborative
environments. We then conclude by covering themes in mobile media exchange
practices, their key challenges and design principles. This chapter informs our
ensuing discussions and investigations into mobile media exchange and the
development of such cooperative solutions.
Chapter 3 investigates the cellular landscape. As this thesis is primarily about
supporting digital media exchange across mobile cellular devices supported by an
active voice channel, this chapter is devoted to providing a brief overview of the
GSM data networks, their constraints and the challenges each entails in order to
facilitate mobile media exchange over cellular networks and devices.
27
Chapter 4 builds upon chapter 3, reporting on the design of a layered mobile
exchange architecture that provides a bespoke Session Management Engine,
Distributed Coordination Engine, Distributed Exchange Engine, Adaptive
Throttling Mechanism and development APIs. The outcome of this chapter is a
robust mobile architecture on which we can build fully functional mobile
solutions that work over existing 3G cellular networks as outlined in the next
chapter.
Chapter 5 builds upon chapters 3 and 4. Here we present a fully functional
instantiation of the mobile exchange architecture presented in chapter 4 in the
form of a Photo-Conferencing service. We outline the procedure by which the
system was built on commodity mobile hardware, describe design decisions and
introduce remote gestural interactions that we evaluate at length in the following
chapter.
Chapter 6 builds upon chapter 5. This chapter describes four specific interaction
additions to the mobile exchange architecture. The first study provides an
evaluation of the remote interaction techniques offered by a photo-conferencing
instantiation of our mobile exchange architecture, evaluating differences between
remote pointing, scaling and mixed interaction techniques. The second study
evaluates a new hybrid interaction technique developed by combining the most
successful characteristics of the interaction techniques found in our first study. A
third, field-based, study evaluates user engagement with the photo-conferencing
service and reports implications for the design of such mobile collaborative
services.
Finally, Chapter 7 concludes this dissertation with remarks related to the original
research question and how it has been addressed. This chapter also addresses the
limitations of this work, discussing potential extensions and future avenues for
related work.

28
Figure 1.2 Organization of the Dissertation.

29

30
Chapter 2
Background
& Related Work
“The ecosystem is the computer and collaboration is its operating system” Marten
Mickos
2.1 Introduction
Groupware applications typically enable a group of people involved in a common task to
manipulate shared objects, and modify them in a coherent manner [Sun et al. 1998].
These systems often incorporate a range of visual and auditory modalities to help groups
communicate, cooperate, coordinate, solve problems, compete, negotiate and achieve
their goals.
There are many collaborative activities that may be amenable to technological support;
examples include telephony, electronic conferencing, knowledge management,
distributed communication, media sharing in social settings and collaborations between
field- and office-based colleagues.
The objective of this literature review is to provide a background to the various threads of
research which are important for framing the research questions and the experiments that
constitute the core of this thesis. This chapter covers the role of video mediate
communications, mobile media exchange and the issues that brought researchers to
design numerous technologies to support remote communication. The goal of this
chapter is to help inform our ensuing discussions and investigations concerned with
media sharing on mobile devices and the development of mobile cooperative solutions.

31
Table 2.1. Space and time taxonomy for computer-supported cooperative
work, with example applications [Ellis, et al. 1991]. Participants may be in
the same place or different places, and may interact synchronously or
asynchronously with each other.
Space
Same Different
Time
Same
Face-to-Face
(Presentation Support)
Synchronous Distributed
(Videophone)
Different
Asynchronous
(Physical Notice Board)
Asynchronous Distributed
(E-mail)
2.2 Collaboration
In the broadest definition collaboration refers to any activities that a pair of individuals or
a group of people perform together. However, it can be helpful to define collaboration
more precisely. Roschelle and Teasley [1994] define collaboration as a
coordinated, synchronous activity that is the result of a continued attempt to
construct and maintain a shared conception of a problem.
Roschelle and Teasley [1994] also provide a definition of the difference between
cooperation and collaboration:
Cooperative work is accomplished by the division of labour among
participants, as an activity where each person is responsible for a portion of
the problem solving. We focus on collaboration as the mutual engagement of
participants in a coordinated effort to solve the problem together.
Furthermore within Computer-Supported Co-operative Work (CSCW), collaboration
stresses the idea of co-construction of knowledge and mutual engagement of participants.
In this sense, collaboration can be considered as a special form of interaction, with
CSCW collaborative applications falling into one of four groups (see Table 2.1),
depending on whether the participants are in the same place or different places, and
32
whether they interact in real-time or through a series of disconnected events [Ellis et al.
1991].
Although it is tempting to think that the goal of a system for synchronous remote
collaboration should be purely to imitate a face-to-face conversation, this may not always
be the case as outlined in the next section and there may be more effective ways to
support many types of collaborative tasks, which may also exploit more effectively the
strengths of the electronic medium [Hollan and Stornetta 1992].
2.3 Video-Mediated Communication
Video-mediated communication (VMC) refers to the tools and technologies that provide
collaborators with visual and auditory access to remote spaces. Early video-mediated
communication has been around since the late 1920s and it has undergone many
sequential technological shifts influenced by the latest hardware advancements and the
rapid growth in Internet connectivity that have enabled new forms of remote
collaboration, conferencing and distance learning [Finn et al. 1997].
Two streams of VMC research have emerged in parallel, both supporting synchronous
communication between participants. The earliest work focused on the replication of
face-to-face communication through the use of the communication links to transmit facial
images (a.k.a. talking heads), providing what Buxton [1992] calls personal space. The
second shifted the focus away from facial images and utilised the communication links to
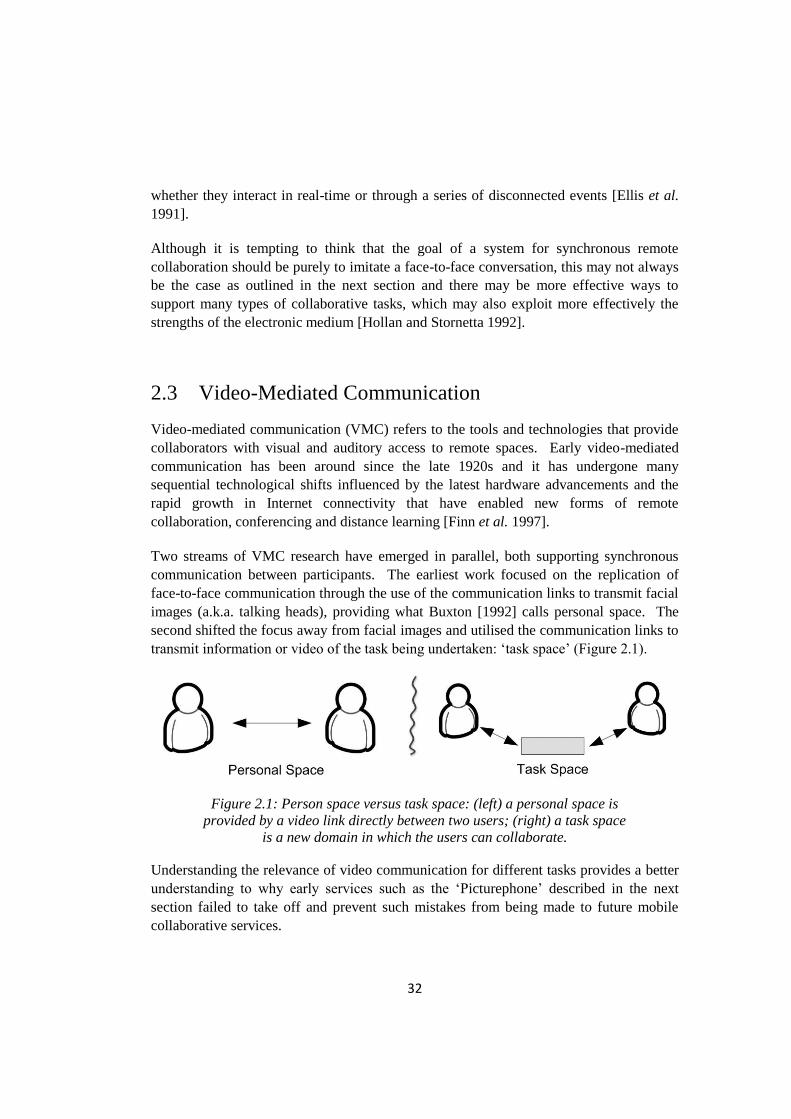
transmit information or video of the task being undertaken: „task space‟ (Figure 2.1).
Figure 2.1: Person space versus task space: (left) a personal space is
provided by a video link directly between two users; (right) a task space
is a new domain in which the users can collaborate.
Understanding the relevance of video communication for different tasks provides a better
understanding to why early services such as the „Picturephone‟ described in the next
section failed to take off and prevent such mistakes from being made to future mobile
collaborative services.

33
In the next section we provide a brief overview of past VMC research aimed at sustaining
collaborative work at a distance through video-mediated-communication. This section
provides a comparison between the use of VMC across personal and task space that is
relevant to our research on mobile collaboration. A more through overview of this area is
provided by Finn et al. [1997] and by Kirk [2006].
2.3.1 Personal Space: Video-as-Presence
As early as 1926, scientists at Bell demonstrated a telephone that transmitted a video
image along with the audio. Termed the Picturephone, this contraption was considered
the logical next step for communication technologies; seeing as well as hearing the person
you were talking to would bring the experience closer to being face-to-face and was
“premised on the hypothesis that the more closely they mimic face-to-face
communication, the more effective the communication that will take place” [O'Conaill et
al. 1993; p. 391].
The Picturephone was introduced publicly at the 1964 World Fair (see Figure 2.2). Its
intuitive appeal fuelled positive forecasts of wide-scale adoption [Egido 1988] that lead to
predictions that it would replace the existing voice-only telephone by the early 1970s.
AT&T‟s Picturephone was a prime example of the use of video to create a sense of
presence (commonly referred to as Video-as-Presence) by transmitting images of a
person‟s face and shoulders. Video-as-Presence is still in use today and can be seen in
such internet applications as Apple‟s iChat (see Figure 2.3) and Microsoft Live
Messenger.
Products incorporating video-as-presence, such as AT&T‟s Picturephone have, however,
been unsuccessful in attracting consumers and have displayed only a gradual growth
among business customers [Whittaker 1995]. While often the goal of implementing
video-as-presence is to improve communication and to reduce or eliminate employee
travel, the results are often disappointing.
A number of recent studies attempting to understand the reasons for its relative lack of
success [e.g. Dourish et al. 1996, Finn, et al. 1997, Gaver et al. 1993, Heath and Luff
1991, Sellen 1995, Tang 1992, Whittaker 2003] have shown that there is generally a
preference among users for richer communication that includes video [Anderson et al.
2000, Fish et al. 1992, Tang and Isaacs 1992], but current devices are often hampered by
important limitations that can introduce negative artefacts that can compromise the
interaction.

34
Figure 2.2: AT&T's Picturephone, unveiled at the 1964 World's Fair.
Figure 2.3: Apple‟s iChat software.

35
There are, however, modest indications that video-as-presence enhances social and
emotional aspects of communication, creating stronger feelings of connectedness between
participants [Short et al.]. Further benefits provided by video-as-presence include the
availability of nonverbal feedback and attitude cues, and access to a gestural modality for
emphasis and elaboration [Anderson et al. 1997, Isaacs and Tang 1994, Isaacs and Tang
1997].
Further, when there are lapses in the audio channel, the visual channel shows what is
happening on the other side, providing important context for interpreting the pause
[Isaacs and Tang 1994]. This ability to continually validate attitude and attention may be
the reason why video-as-presence has been shown to particularly benefit social tasks,
involving negotiation, bargaining and conflict resolution [Anderson, et al. 2000,
Whittaker 1995, Williams 1977].
Isaacs and Tang [1992] have also found that incorporating video in remote interactions
may support non-verbal communication and the mechanics of conversation, such as turn
taking, monitoring understanding and adjusting to reactions. People are also more willing
to hold delicate discussions over video than over the phone, and for many, being able to
establish the identity of the remote partner is important [Isaacs and Tang 1997].
Groups that use video-as-presence tend to like each other better than those using audio
only [Whittaker and O'Conaill 1997], though systems often fail to properly provide cues
to the social context of the interaction, such as whether a conversation is public or private
(you cannot see who is in the room outside the view of the camera), preventing users
from framing their interactive behaviours [Lee et al. 1997].
Additionally many important limitations of VMC prevent it from achieving the full
benefits of face-to-face. Turn-taking and floor management is difficult in groups because
it relies on being able to judge exact gaze direction, something that most video-as-
presence systems don‟t support [Isaacs and Tang 1994, Whittaker and O'Conaill 1997].
Judging a collaborator‟s exact focus of attention when observing or helping with a task is
difficult for the same reason [Neale et al. 1998]. Side conversations cannot take place
and any informal communications have been shown to be extremely difficult to support
[Nardi and Whittaker 2002]. Pointing and manipulation of actual shared objects is
troublesome [Isaacs and Tang 1994, Neale, et al. 1998].
Further, a number of variations on the classic video conferencing system have been
developed, each attempting to address some of the limitations mentioned above. For
instance, to provide correct gaze cues, Sellen et al. [1992] developed a Hydra prototype
(see Figure 2.4) in which a camera, display, microphone, and speaker are integrated. The
displays are small and the cameras positioned to maintain eye contact.

36
Figure 2.4: The Hydra four-way teleconferencing system.
There are also social and practical barriers to the use of video telephony. Social barriers
relate to people‟s concerns about privacy and a reduced ability to control presentation of
the self with video (though long term experiments with media suggest some of these
concerns may disappear as video mediated relationships develop with time and in
appropriate cultural contexts, [e.g. Dourish, et al. 1996]. Practical barriers to use in
organisational contexts include the need to plan calls too far in advance, technical
difficulties of setup and the need to use special equipment in dedicated rooms [Hirsh et
al. 2005]. If the required effort is too high, people resort to the simpler and more widely
available audio telephony [e.g. Martin and Rouncefield 2003, Tang 1992].
For tasks that primarily involve information exchange or simple problem solving the
benefits of adding video have been investigated and it has been found that comparisons of
video-as-presence and audio-only have generally not shown any benefits of video over
audio-only communication [Anderson, et al. 2000, Tang and Isaacs 1992]. There is
however demonstrable value of video to visually share objects in support of conversation
between remote participants, rather than simply to share „talking heads‟ [e.g. Kraut et al.
2002, Whittaker 2003]. Studies of the effects on communication in mediated
environments have shown that sharing the same visual space (task-space) is an important
aspect of communication [Sellen 1995, Stefik et al. 1987].
37
2.3.2 Task Space: Video-as-Data
The field of video mediated communication has long examined the effects of providing
visual information to aid people in collaboration over distances; recent research shows
however that not all forms of visual information is sufficient to aid in the communication
process. Examples such as the introduction of video telephony in the 1960s followed
confident predictions that it would eventually replace voice only telephony but, as history
and the benefit of hindsight has revealed, those predictions didn‟t bear out but eventually
lead to several market failures [Harper and Taylor 2005].
A number of parallel studies of video mediated communication through “personal spaces”
have investigated the additional utility of the technology to create “task spaces”, where
images of the work objects themselves are transmitted between participants [Anderson, et
al. 2000, Fussell et al. 2000, Gaver, et al. 1993, Nardi et al. 1993]. These studies were in
response to a growing body of evidence that questions the importance of personal space
in providing video as the form of presence (e.g. talking heads). Whittaker [1995] argued
that the research into the use of video has focused too much on supporting non-verbal
communication and has neglected functions such as using visual information to initiate
communication or depicting shared work objects.
Early research on task spaces was conducted by Krauss and Fussel [1990, 1991]
concerning the development of mutual knowledge and the construction of shared
communicative environments for increasing communicative effectiveness. They utilised
an experimental design aimed at exploring the process of achieving grounded
conversations through the design of different communication technologies.
Rochelle and Teasley for instance, demonstrated that collaboration requires the
construction and maintenance of a shared representation of the problem and stressed the
role of shared understanding, and wrote that collaboration is “a coordinated, synchronous
activity that is the result of a continued attempt to construct and maintain a shared
conception of a problem” [1994; p. 70].
The research has demonstrated that collaboration requires the construction and
maintenance of a shared representation of the problem [1994], that including a shared
task space is important [Buxton 1992] and for tasks other than negotiation a task space is
more useful than a personal space [Anderson, et al. 2000]. Shared task spaces were also
found to be fundamental for coordinating awareness, through the “understanding of the
activities of others” [Dourish and Bellotti 1992], which in turn provides a “context for
your own activity” [Dourish and Bellotti 1992: 107].
Further, in collaboration, grounding is part of a refinement process through which actors
refine what they mean, becoming more and more exact over time [Baker 1995]. They

38
increase their common ground when they add new related information. This is done
through the tools, the goal, the setting, or the individuals themselves [Baker et al. 1999]
and that the constraints on achieving common ground, and the costs of doing so, change
in the collaborative situation depending on the tools being used. Task space was found to
facilitate the negotiation of „common ground‟ and a level of shared understanding of
what is being discussed in a conversation between two or more parties [Clark 1992,
Fussell, et al. 2000]. In an effort to explain this finding, later work [Gergle et al. 2004]
demonstrated through sequential analysis how visual actions within a shared space can be
used to replace elements of dialogue that would be necessary in the absence of visual
feedback.
Kraut, Gergle, and Fussell in their experimental setup (see Figure 2.5) demonstrated that
the presence of a shared visual space significantly improved performance on the
collaborative puzzle task [Kraut, et al. 2002]. The authors controlled whether the helper
could see the space of the worker and could refer to the objects by the mean of „deictic
expressions‟. The puzzle based approach was taken to allow systematic manipulations to
be made to the shared visual environments such that various parameters of their
construction could be empirically compared.
Through their experimental analyses Krauss and Fussell [1990] began to understand how
task-focussed language evolved during the collaborative tasks. The evolution of referring
expressions and the developing awareness of common referents was shown to be
significantly affected by the resources used to establish communication. If a shared
visual environment was enabled it was often observed to be of significant support to the
smooth establishment of such critical communicative processes. In their early work on
the subject [Gergle et al. 2004, Kraut, et al. 2002], they demonstrated that the presence of
the shared visual space significantly improved performance on the collaborative puzzle
task and that interactional references further enhanced remote collaboration [Kraut et al.
1996].
Gergle, Millen, Kraut and Fussell [2004] extended this finding by demonstrating that
when the talk in collaborative tasks is mediated by text-based chat (such as Instant
Messaging), persistence of the text messages improves task performance but less so than
access to a shared visual space. Through a series of sequential analysis techniques
[Bakeman and Gottman 1997, Bakeman and Quera 1995, Fienberg and NetLibrary 1980,
Fussell et al. 2004] they also demonstrated how action can replace explicit verbal
instruction in a shared visual workspace. They revealed that pairs with a shared
workspace were less likely to explicitly verify their actions with speech. Rather, they
relied on visual information to provide the necessary communicative and coordinative
cues.

39
Figure 2.5: The collaborative puzzle task. The Worker‟s view (left) and the
Helper‟s view (right) from Gergle (2006) The Worker‟s screen consists
of a staging area on the right hand side in which the puzzle pieces
are shown, and a work area on the left hand side in which
she constructs the puzzle.
Recent research has shown that sharing a 2D visual space improves instruction in
computer-based tasks [Karsenty 1999, Kraut, et al. 2002]. Other research has suggested
the value of workspace oriented video systems for 3D tasks [e.g. MacWhinney 2000,
Nardi, et al. 1993]. These studies suggest the importance of shared views of the
workspace for remote collaboration on physical tasks and suggest that video systems
which provide views of the work area are likely to be more useful in supporting
awareness and grounding during collaborative physical tasks.
2.4 Towards Mobile Collaboration
An important emerging aspect is that people are mobile and do much of their work away
from their office. In response, Bellotti & Bly [1996] suggest that systems for
collaborative work should be designed to support mobile collaborators. In this section we
examine the current drivers of mobile collaboration and the limitations imposed by the
technology and usability that has to date limited its widespread adoption.
The mobile phone initially started out as a hardware centric device and what you did with
it was very limited, but making it small, cheap and sleek were key factors in its ever
rising success. Mobiles are now converging to become software driven devices. That is
not to say that the hardware is no longer important but the balance of what makes it useful
and attractive is shifting to the software. Companies such as Apple, Google, Nokia, RIM
and Microsoft are depending more on the added value afforded by software to create
more compelling consumer solutions. Mobiles now account for a third of the top three

40
items people carry with them whenever they leave home in addition to keys and wallet
[Ichikawa et al. 2005].
Although mobile services that have collaborative elements have long been provided by
mobile phone companies in the form of voice calls, text messages and more recently 3G
multimedia messaging (MMS). Their collaborative capabilities have been limited to the
use of one channel at a time, with voice communication still the only real-time
collaborative service available on cellular devices today.
In an effort to contribute to mobile phone based collaborative architectures, we sought to
improve upon the capabilities provided by mobile devices to exchange rich media content
between remote participants. The following literature review on media sharing across
mobile cellular devices suggests a need for collaborative interactivity that simply doesn‟t
exist with current mobile services.
2.5 Mobile Media Exchange
There has been a worldwide boom in the penetration of mobile telephony devices that
have had a profound effect on the global technology landscape. Far-reaching cellular
voice networks provide the potential for people to make themselves available for phone
calls with any person, at any time. Consumer mobile data networks have become more
practical in coverage and bandwidth, fostering improvements in offerings that seek to
bring the successful communication modalities of the fixed Internet (e-mail, instant
messaging and social networks) to the mobile domain.
Advances in mobile hardware have kept pace with those of the mobile infrastructure.
Modern handsets ship with high-resolution colour displays, processing power on a par
with lower-end personal digital assistants, stereo sound, and most notably an increase in
the number of devices supporting integrated digital cameras. According to forecasts from
Gartner Inc, worldwide sales of camera phones, which have almost tripled since 2004,
will reach 460 million units in 2006, an increase of 43 percent from 2005 and account for
48 percent of total worldwide mobile phone sales. This trend is set to continue, leading to
sales of one billion camera phones by 2010 [Gartner 2006].
While the telecommunications industry has been in the business of connecting people for
nearly a century, the proliferation of new services such as SMS and their impact on
operators‟ main revenue stream in addition to the traditional voice capabilities has not
only taken operators by surprise but has also put them on the lookout for additional
revenue opportunities such as 3G networks and Multi Media Messaging (MMS).

41
With more and more people capturing photos on the move, camera phones account for a
large number of the photos we carry around with us. Research suggests that technologies
are becoming increasingly suitable for supporting collaboration around photos, and may
potentially offer new forms of expression [Lindley and Monk 2008]. Evidence however
shows that despite heavy investments into 3G networks to drive new services such as
MMS, there has been relatively little use. The MMS service has been described as “a
flop” [Economist 2006] and SMS remained the dominant collaborative application
globally for 2006, accounting for 56% of end user spending on mobile data services [IDC
2006].
Through “social shaping” [MacKenzie and Wajcman 1985] it‟s possible to argue MMS‟s
picture sending capabilities, as opposed to SMS‟s texting capabilities, fails to meet user
needs. An emerging body of research on cameraphone use [Kindberg, et al. 2005, Van
House and Davis 2005] indicates that people want to share images, however image
sharing is itself a complex research space, and mobile users are typically frustrated when
trying to share images remotely and interactively [Aoki, et al. 2005].
2.6 Mobile Capture Culture
Studies of cameraphone use paint a picture of successful adoption and creative
appropriation, e.g. teasing [Kurvinen 2003], collaborative storytelling [Koskinen et al.
2002] or the mundane “elevated to a photographic object” [Okabe and Ito 2003]. It
appears that as relationships get more intimate, shared messages tend to get even more
mundane. While friends and acquaintances tend to capture and share moments, events
and observations that are at least minimally interesting for the recipient, couples tended to
share pictures and sounds about almost anything they happen to see or hear just to
maintain a state of closeness through “visual co-presence” [Ito 2005].
Most intriguing, perhaps, are the breadth of ways that users have appropriated
photographs in computer-mediated communication technologies. Mäkelä et al. noted that
photos were used for joking, expressing emotion, and sharing art [Mäkelä et al. 2000].
Ling and Julsrud [2004] identified six genres of use including documentation of work-
related objects, visualization of details and project status, snap shots, postcards, greetings
and chain messages.
Investigating emergent practice of camera phone use in Japan, Okabe employed
ethnographic diary studies of camera phone usage patterns and identified three social
usages of cameraphones: archiving, intimate sharing, and peer-to-peer news and reporting
[Okabe 2005]. Kindberg et al. [2005] conducted a study into how and why people used
cameraphones in both the UK and US in which they proposed a taxonomy of image

42
capture (see Table 2.2) that categorised images based on their social or individual uses
and whether they were of an affective or functional nature.
Van House also focused on identifying classes of pictures taken and shared by
cameraphone users [Van House and Davis 2005]. Reporting on a 60-person study
conducted over 10 months of an experimental Mobile Media Metadata (MMM2) system,
Van House and Davis pinpointed four pre-existing practices from traditional photography
that their participants adapted for cameraphone use: creating and maintaining social
relationships, constructing personal and group memory, self-presentation and self-
expression. In addition they identify two emerging categories: social commentary, e.g.
journalistic shots, and functional uses, e.g. scanning written information.
Voida and Mynatt [Voida and Mynatt 2005] noted that nearly two-thirds of the photos
captured by their participants were that of the classic Kodak Culture [Chalfen 1987] and
by at large, mobile multimedia seems to continue this tradition of ordinary snapshot
photography, but makes it even more ad hoc in terms of what people choose to shoot
[Koskinen, et al. 2002]. Cooley follows a similar theme in which she proposes that
imaging with cameraphones is informed by an autobiographical impulse and, thereby,
belongs to a long tradition of first-person forms of documentation [Cooley 2005].
Taylor and Harper adopt an anthropological and social view of cameraphone sharing in
terms of the age old practices of „gift-giving‟ which they note as simply “great
recurrences of ordinary society” and that “successful technologies are ones that afford the
accomplishment of particular enduring cultural practices” [Taylor and Harper 2002].
Table 2.2. A taxonomy of image capture, showing numbers and
proportions of images by category [Kindberg et al. 2005].

43
Maia Garau identified seven classes in which shared pictures could be categorised, based
on observations of users‟ emerging cameraphone social practices with „Radar‟ [Maia
Garau 2006], a system designed to enable visual conversations between close friends.
Based on this classification a shared museum picture could be categorised as a contextual
photo.
Context: Location | Activity | Food | Time/Temperature
Portrait: Self | Friends | Animals
Visual interest: Scenery | Architecture | Poetic | Art shot
Media: Logo | Advertisement | Book | TV/film | Website
Humour: Amusing shot | In-joke | Running joke
Event: Mundane | Special
Travel: Information (e.g. boarding card) | Tourist shot
Rivière argues that the act of sharing may be just about communication “Being
multimedia tools, they increasingly use intimate play context, which have no rational
purpose but rather aim at sensations, and in which the search for immediately shared
pleasure is more and more visible” [Rivière 2005].
Koskinen describes cameraphone pictures as merely focusing on immediate life and it is
this complexity of immediate life that has lead to many interpretations of use [Koskinen
2007]. He continues to state what people see as important may result from years of
symbolic and imaginary work, e.g. while “Paris” may be a sign on the map for one
person, for another it may be an elaborate, exciting experience created over years of being
there [Battarbee and Koskinen 2005]. In addition messages may be designed using
complex constructs. For example, people often take advantage of genres they find from
media and culture, including documents, snapshots, postcards, greetings, and chain
messages that are sometimes downloaded from the Web [Ling et al. 2005].
The breadth of this research on the uses of mobile image capture and sharing highlights
the complexities involved, in which any intentions can be defined though several
categories at once, for example Barthes talks about a portrait-photograph of himself as
related to four versions of himself: the person he thinks he is, who he wants others to
think he is, who the photographer thinks he is, and the person the photographer makes use
of to exhibit his or her art [Barthes 1981]. In the next section we define a sharper focus
for our research here on the digital media exchange capabilities afforded by the mobile
capture and share technologies.

44
2.7 Mobile Sharing Limitations
The recent literature around digital photography often remarks upon two trends. First,
there is the desire to move beyond the individual‟s taking, organising and storing photos
to more social practices of sharing images and jointly constructing albums or archival
collections [Frohlich et al. 2002]. Secondly, there is the increasing use of mobile phone
cameras [Ito 2005] to provide opportunistic, spur-of-the-moment capture [Okabe and Ito
2003, Van House and Davis 2005] and to enable the creation of “life documents”
[Plummer 2001].
Whether increasingly capable camera phones will precipitate the demise of the consumer
digital camera market or fuel it by introducing more people to the joys of digital
photography is currently an open question. What is clear, however, is that the sheer
number of camera phones in use and their closeness to hand for their typical user makes
the camera phone an increasingly common source of the images that people wish to share.
However, the very ubiquity of the camera phone and the spontaneous capture of images
in a wide variety of settings mean that in many of these settings the user has no access to
other devices with which to display and share the captured photos. Hence, moving from
capture to sharing can involve the sharers huddling around the camera phone‟s screen
[Kindberg, et al. 2005] or the photo taker posting it to an online archiving service. The
former approach has the advantage of maintaining the spontaneity of the photo capture
and sharing in the moment. The latter approach has the advantage of providing the
sharers with copies, their own displays, tools etc at the expense of spontaneity.
This has led to much research [Aoki, et al. 2005, Ito 2005, Kindberg et al. 2004, Maia
Garau 2006, e.g. Okabe 2005, Van House 2007] into the limitations of camera phones
and services for sharing images, such as MMS which currently remains relatively unused
and under developed [Economist 2006]. Subsequent research has been dedicated to
overcoming these difficulties [Van House and Davis 2005]. Solutions such as MMM2
[Davis et al. 2005] sought to improve on several limitations of MMS, overcoming the
size constraints imposed on MMS and streamlining the sharing process. However, the
MMM2 system didn‟t lead to an increase in mobile-to-mobile sharing. Van House
describes this as partly due to poor usability of the MMM2 phone interface and partly due
to technical difficulties [Van House 2006]. Radar by Maia Garau et al [Maia Garau
2006] was also designed to overcome the limitations of MMS mobile sharing. Similarly
to MMM2, Radar provides a mechanism to upload images directly to a web-based
archiving solution for sharing images, differing only in its chronological representation
and commenting capabilities.
Okabe [2005] reports the “one channel at a time” interaction paradigm of MMS as
causing many mobile users to be “frustrated when trying to share images remotely and
interactively”.
45
Recent research points to participants needing richer capabilities to connect in the
moment, undergoing the effort of using multiple devices to achieve ongoing
conversations while sharing images [Kindberg, et al. 2005]. Similarly, mobile users have
been observed transferring mobile images to instant messaging clients to enable
conversation [Van House 2006]. This need for interactivity when sharing photographs
has also been traced back to earlier ethnographic studies of collocated domestic
photography by Chalfen, who argued that “[domestic photographs] are meant to be
shared, and they are meant to prompt interaction” [Chalfen 1998].
Frohlich et al. [2002] proposed “Photo-Conferencing” as a service that could overcome
these restrictions and provide a means by which users could engage in interactive
computer-mediated photo-sharing practices, supported by a simultaneous telephone
conversation, minimising collaborative effort [Clark and Brennan 1991]. However,
current mobile devices and cellular networks present serious challenges to enabling this
and previously no mobile cellular photo-conferencing service has been created.
In this dissertation we report on the first such mobile photo-conferencing service. The
service we present here allows collocated and distributed 3G cellular users
simultaneously to share, interact and converse in a real-time cooperative photo-
conferencing session through a single application.
2.8 Chapter Summary
In this chapter we started with an overview of the various strands of research relating to
collaboration and the relevance of video communication for different tasks, and covered
how face-to-face interaction provides people with many contextual cues such as facial
expressions, body postures and gestures that guide them as they interpret others‟
communication and interact with them [Goffman 1959]. We also saw that in distributed
collaboration; depending on which medium is used, some or all of these cues disappear.
Still, research has demonstrated that collaborators often find it more important to have a
shared view of the work than to see each other [Anderson, et al. 2000, Buxton 1992,
Gaver, et al. 1993, Kraut, et al. 2002, 1994]. However, if the team members are not
sharing the same native language, video is especially important: the visual link supports
them in showing their understanding through facial expressions and gestures [Veinott et
al. 1999].
In the latter half of this chapter we presented the notion that the proliferation of small
portable mobile devices may one day allow for new anywhere, any time collaborative
capabilities that don‟t exist today. Although there has been a growing body of work
relating to the impact of video mediated communication on users and desktop

46
environments [e.g. Anderson, et al. 1997, Sellen 1995, Whittaker and O'Conaill 1997],
very little research to date has investigated those effects across resource restricted mobile
cellular devices that are rapidly becoming the most common form of user facing
computing device.
Mobile users are “frustrated when trying to share images remotely and interactively”
[Okabe 2005] and the need for interactivity and interaction among participants is not fully
met by current mobile and MMS practices.
Our research is motivated by the difficulties mobile phone users have in sharing and
engaging with media synchronously and interactively with others. The goal is to explore
how we can better design mobile systems to support such sharing and engagement in both
collocated and remote settings using resource constrained mobile cellular devices.
These devices also present unique research challenges for enabling those services across
limited mobile hardware specifications, restrictive screen sizes and varying cellular
networks that are susceptible to signal loss and network outages.
The service we seek to demonstrate will allow both collocated and remote 3G cellular
users simultaneously to share, interact and converse in a real-time cooperative session,
providing mechanisms through which users can indicate focus [Turner and Kraut 1992]
during a digital media session and construct what Crabtree et al. [Crabtree et al. 2004]
describe as “a host of fine grained grammatical distinctions”.
In the following chapters we report on the first such mobile phone based solution. This
project entailed a multifaceted challenge that required [1] an understanding of existing
mobile technologies; [2] the creation of a mobile exchange architecture that supports the
sharing of different forms of digital media (data types) between mobile devices; [3] the
development of a mobile media-sharing solution; and [4] the evaluation of interaction
techniques to support effective communication through this solution.

47

48
Chapter 3.
GSM Cellular
Architecture
“The Mobile Web Initiative is important - information must be made seamlessly available
on any device” Tim Berners-Lee
3.1 Introduction
The increased need for people and organizations to stay connected whilst changing
physical location and crossing organizational boundaries has resulted in a wave of new
portable devices, and generated interest in tackling some of the difficult research issues
arising in developing technologies for such context.
Mobile cellular devices and the networks on which they operate present new challenges
in the forms of bandwidth constraints, intermittent connectivity issues and signal loss that
sets them apart from traditional fixed networks. These mobile cellular networks also
present many opportunities to utilise the existing infrastructures to provide new services
that harness the potential available in today‟s networks.
This chapter provides the background to the mobile cellular landscape, looking at the
existing infrastructure and deployed technologies, outlining limitations to existing
technologies and important issues that need to be addressed in an effort to enable rich
media exchange across mobile devices and networks. The work reported in the rest of the
thesis sets out to overcome many of these limitations and challenges.

49
3.2 Mobile Communication Systems
The origins of mobile telephony date back to the 1920s, initially used with maritime
vessels and not particularly suited to on-land communication. The equipment was
extremely bulky, the radio technology did not deal very well with buildings and other
obstacles found in cities. Further progress was made in the 1930s with the development
of frequency modulation (FM), which helped in battlefield communications during the
Second World War. These developments were carried over to peacetime, and limited
mobile telephony service became available in the 1940s. Such systems were of limited
capacity, however, and it took many years for mobile telephony to become a viable
commercial product.
Mobile communications as we know it today started in the late 1970s with the
introduction of the first generation wireless systems, characterized by voice only
(analogue) communication, with limited support for user mobility. The analogue services
provided methods of modulating radio signals so that they can carry information such as
voice or data. Analogue cellular phones worked like a FM radio, the receiver and
transmitter are tuned to the same frequency, and the voice transmitted is varied within a
small band to create a pattern that the receiver can reconstruct. This limited the number
of channels that can be used.
Digital communications technology was introduced with second generation (2G) mobile
systems in the 1990s. In digital, the analogue voice signal is converted into binary code
and transmitted as a series of on and off transmissions. The second generation systems
are characterized by the provision of better quality voice services available to the mass
market and the introduction of the cellular concept in which scarce radio resources can be
used simultaneously by several mobile users.
Many of the early mobile communication systems utilised various standards, leading to
incompatibilities across different countries and regions of the world. It wasn‟t until the
introduction of GSM that a true global mobile standard emerged. This has driven a much
tighter international cooperation around cellular technologies than for the earlier
generations, resulting in economies of scale.
GSM is the most used mobile communication system today and has been a major
breakthrough in the domain of mobile communications. GSM is currently the only digital
technology that provides data services such as email, fax, internet browsing, and
intranet/LAN wireless access, and it‟s also the only service that permits users to place a
call from either North America or Europe.
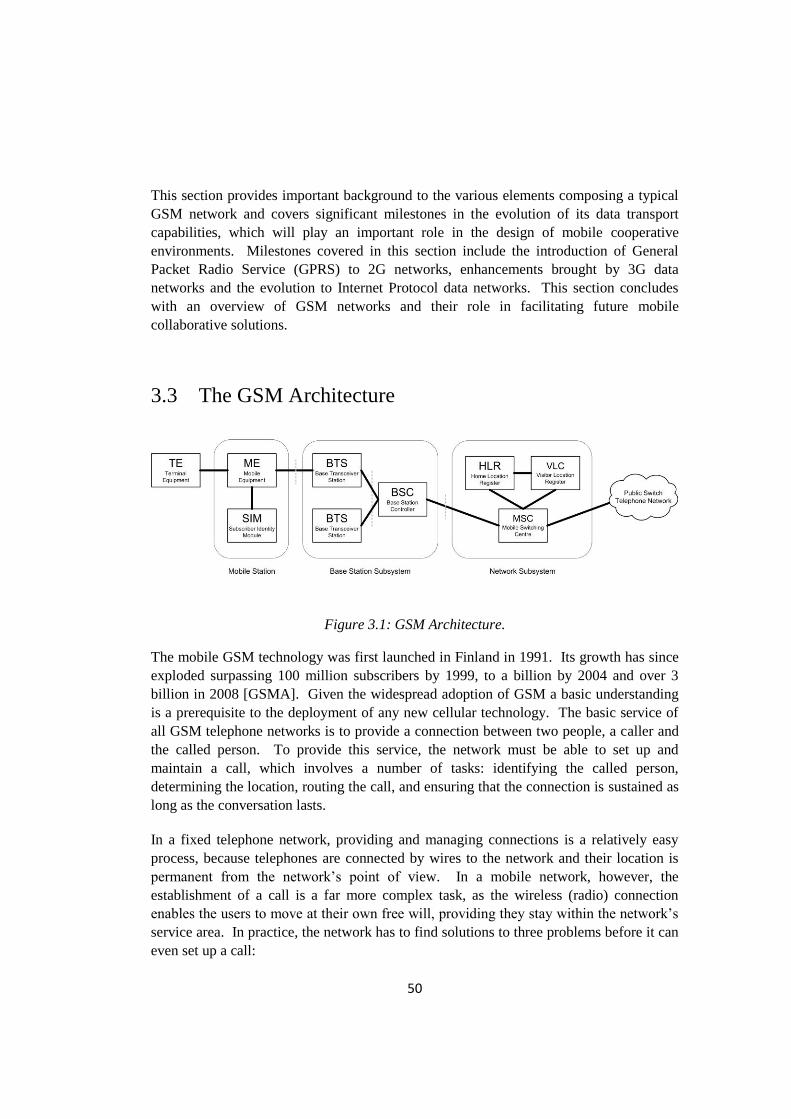
50
This section provides important background to the various elements composing a typical
GSM network and covers significant milestones in the evolution of its data transport
capabilities, which will play an important role in the design of mobile cooperative
environments. Milestones covered in this section include the introduction of General
Packet Radio Service (GPRS) to 2G networks, enhancements brought by 3G data
networks and the evolution to Internet Protocol data networks. This section concludes
with an overview of GSM networks and their role in facilitating future mobile
collaborative solutions.
3.3 The GSM Architecture
Figure 3.1: GSM Architecture.
The mobile GSM technology was first launched in Finland in 1991. Its growth has since
exploded surpassing 100 million subscribers by 1999, to a billion by 2004 and over 3
billion in 2008 [GSMA]. Given the widespread adoption of GSM a basic understanding
is a prerequisite to the deployment of any new cellular technology. The basic service of
all GSM telephone networks is to provide a connection between two people, a caller and
the called person. To provide this service, the network must be able to set up and
maintain a call, which involves a number of tasks: identifying the called person,
determining the location, routing the call, and ensuring that the connection is sustained as
long as the conversation lasts.
In a fixed telephone network, providing and managing connections is a relatively easy
process, because telephones are connected by wires to the network and their location is
permanent from the network‟s point of view. In a mobile network, however, the
establishment of a call is a far more complex task, as the wireless (radio) connection
enables the users to move at their own free will, providing they stay within the network‟s
service area. In practice, the network has to find solutions to three problems before it can
even set up a call:
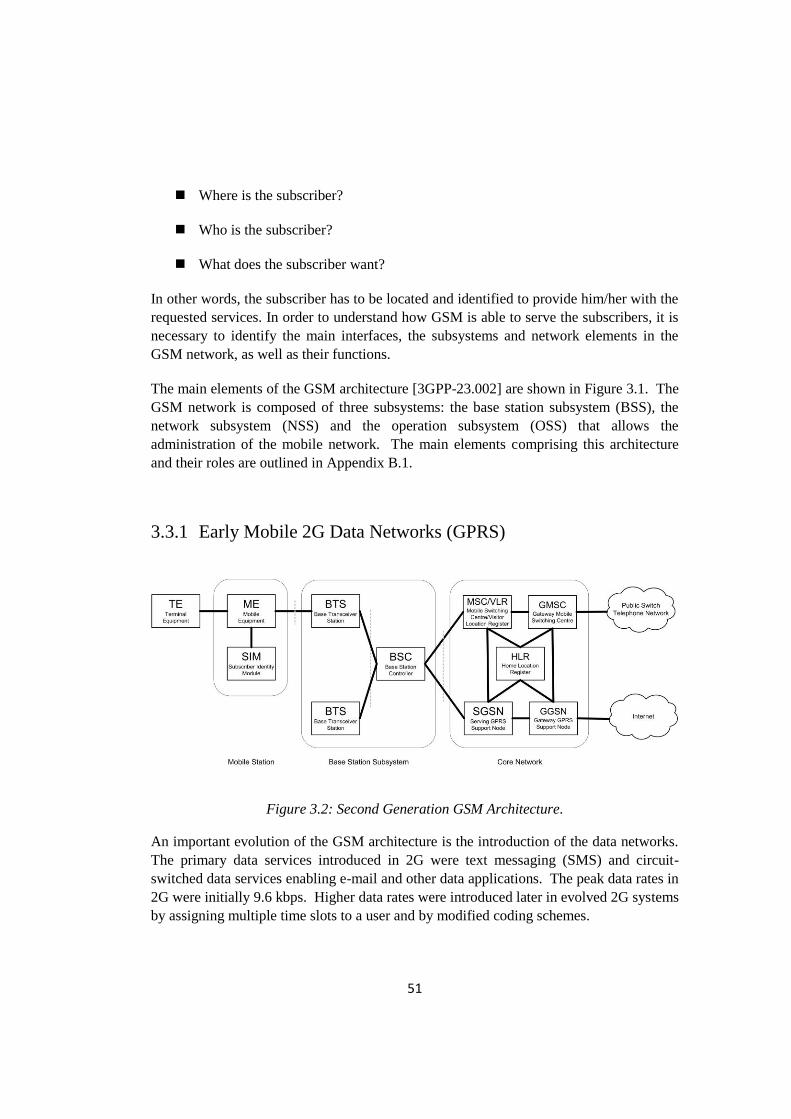
51
Where is the subscriber?
Who is the subscriber?
What does the subscriber want?
In other words, the subscriber has to be located and identified to provide him/her with the
requested services. In order to understand how GSM is able to serve the subscribers, it is
necessary to identify the main interfaces, the subsystems and network elements in the
GSM network, as well as their functions.
The main elements of the GSM architecture [3GPP-23.002] are shown in Figure 3.1. The
GSM network is composed of three subsystems: the base station subsystem (BSS), the
network subsystem (NSS) and the operation subsystem (OSS) that allows the
administration of the mobile network. The main elements comprising this architecture
and their roles are outlined in Appendix B.1.
3.3.1 Early Mobile 2G Data Networks (GPRS)
Figure 3.2: Second Generation GSM Architecture.
An important evolution of the GSM architecture is the introduction of the data networks.
The primary data services introduced in 2G were text messaging (SMS) and circuit-
switched data services enabling e-mail and other data applications. The peak data rates in
2G were initially 9.6 kbps. Higher data rates were introduced later in evolved 2G systems
by assigning multiple time slots to a user and by modified coding schemes.

52
Packet data over cellular systems became a reality during the second half of the 1990s,
with General Packet Radio Services (GPRS) introduced in GSM and packet data also
added to other cellular technologies such as the Japanese PDC standard. These
technologies are often referred to as 2.5G. The success of the wireless data service iMode
in Japan gave a very clear indication of the potential for applications over packet data in
mobile systems, in spite of the fairly low data rates supported at the time.
The infrastructure of 2G networks (see Figure 3.2) is in many ways very similar to that of
the initial GSM architecture (see Figure 3.1), with two main additions in the form of the
SGSN and GGSN added to the core network to provide internet connectivity.
The introduction of simple data access to cellular devices in 2G networks marked an
important transition in the evolution of mobile cellular networks supporting voice only
communication among connected clients, into a platform capable of supporting rich data
exchange, e-mail downloads and web-surfing whilst on the go. The main elements
comprising this architecture and their roles are outlined in Appendix B.2.
3.3.2 Existing Mobile 3G Data Networks (UMTS)
Figure 3.3: Third Generation GSM Architecture.
Universal Mobile Telecommunications System (UMTS) marked the third evolutionary
milestone in the history of the mobile cellular landscape. 3G networks brought improved
speech quality and advanced data and information services. The primary data services
introduced in 3G were multimedia messaging (MMS), access to e-mail and the internet
and the ability to send and receive full-motion video.

53
The peak data rates in 3G were extended up to 2Mbit/s. UMTS was designed as a true
global system, comprising both terrestrial and satellite components and can be operated
alongside GSM/GPRS networks.
3G systems use different frequency bands, so mobiles won‟t interfere with each other.
The General Packet Radio System (GPRS) outlined previously was designed to facilitate
the transition from phase 2 GSM networks to 3G UMTS networks. GPRS supplemented
GSM networks by enabling packet switching and allowing direct access to external
packet data networks.
The 2G architecture optimized the „core network‟ for the transition to higher data rates.
Therefore, the 2G architecture was an important prerequisite for the introduction of 3G
UMTS networks. For 3G networks to achieve higher data rates, the base station
subsystems of earlier 2G networks are enhanced in the form of Radio Network
Controllers (RNC) that makes up a UTRAN network, between the user equipment and the
UMTS core network (see Figure 3.3). The main elements comprising this architecture
and their roles are outlined in Appendix B.3.
3.3.3 Next Generation Mobile IP-Data Networks (IMS)
Figure 3.4: IMS (IP Multimedia Subsystem) Architecture.
The Internet Protocol Multimedia Subsystem (IMS) [Camarillo and García-Martín 2004]
is an architectural framework for delivering the next-generation internet protocol (IP)
voice and multimedia communications across mobile networks. It was originally
designed by the wireless standards body 3rd Generation Partnership Project (3GPP), and
is part of the vision for evolving mobile networks beyond GSM.

54
Figure 3.5: IMS (IP Multimedia Subsystem) Layers.
Unlike earlier 2G/3G networks that marked incremental updates to the data capabilities
and bandwidth provided to cellular devices, IMS is designed to fill the gap between the
existing traditional telecommunications technology and internet technology, enabling the
convergence of data, speech and mobile network technology over an IP-based
infrastructure that increased bandwidth alone will not provide.
IMS was specifically architected to enable and enhance real time, multimedia mobile
services such as rich voice services, video telephony, messaging, conferencing, and push
services. IMS enables these user-to-user communication services via a number of key
mechanisms including session negotiation and management, Quality of Service (QoS)
and mobility management over rich IP based protocols.
IMS is specified as an incremental add-on to existing mobile 2G (see Figure 3.2), 3G (see
Figure 3.3), wireless and fixed networks rather than a radical replacement. In that sense
IMS shares many of the existing technologies throughout its Subsystems and Core
Network layers (see Figure 3.4). IMS integrates at the GGSN gateway node enabling
direct terminal connections using Internet Protocol (IP) over IPv6/IPv4 and Session
Initiation Protocol (SIP) [Handley et al. 1999]. The main elements comprising this
architecture and their roles are outlined in Appendix B.4.
IMS differs from previous network architectures in that it provides an open framework
designed on the success of the Internet and the IP-based services to deliver point to point
connections. IMS uses the SIP protocol (Session Initiation Protocol) for multimedia
session negotiation and session management. IMS is essentially a mobile SIP network
designed to support this functionality, where IMS provides routing, network location, and
addressing facilities.
IMS systems are based on the four layer architecture (see Figure 3.5). The bottom-most
IMS access layer works with legacy circuit-switched networks along with the latest cable,
packet and wireless networks, allowing IMS to function across access technologies. IMS
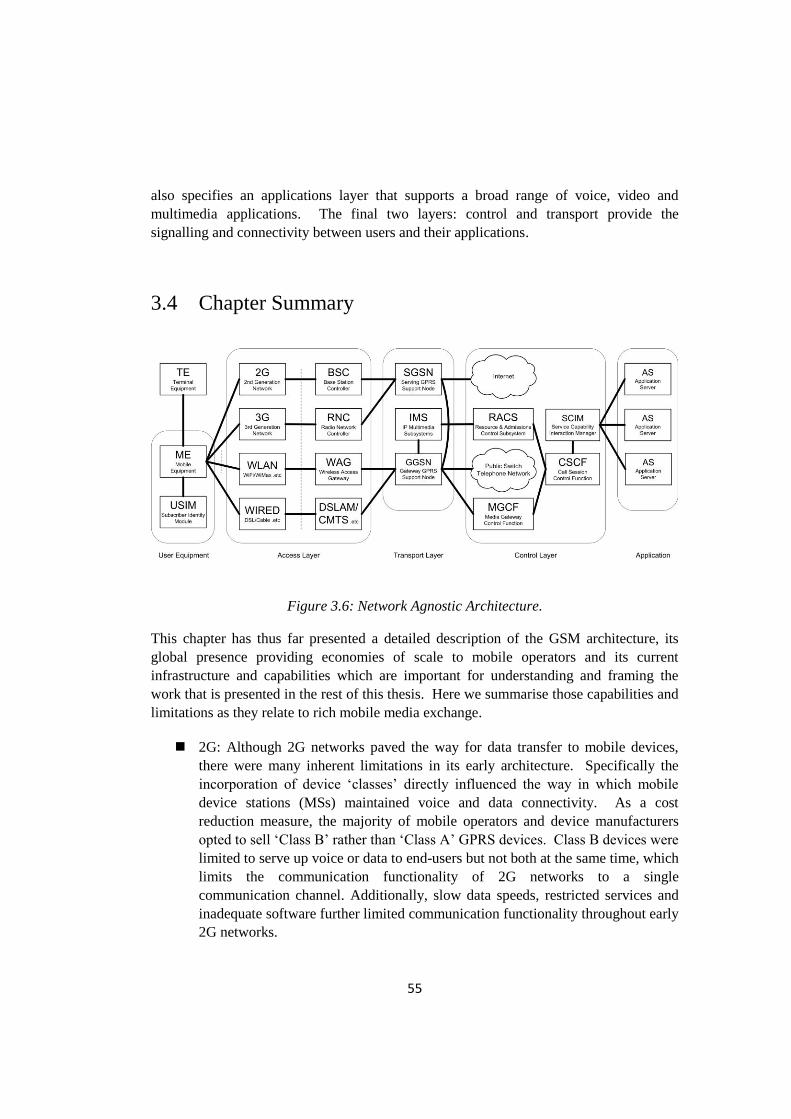
55
also specifies an applications layer that supports a broad range of voice, video and
multimedia applications. The final two layers: control and transport provide the
signalling and connectivity between users and their applications.
3.4 Chapter Summary
Figure 3.6: Network Agnostic Architecture.
This chapter has thus far presented a detailed description of the GSM architecture, its
global presence providing economies of scale to mobile operators and its current
infrastructure and capabilities which are important for understanding and framing the
work that is presented in the rest of this thesis. Here we summarise those capabilities and
limitations as they relate to rich mobile media exchange.
2G: Although 2G networks paved the way for data transfer to mobile devices,
there were many inherent limitations in its early architecture. Specifically the
incorporation of device „classes‟ directly influenced the way in which mobile
device stations (MSs) maintained voice and data connectivity. As a cost
reduction measure, the majority of mobile operators and device manufacturers
opted to sell „Class B‟ rather than „Class A‟ GPRS devices. Class B devices were
limited to serve up voice or data to end-users but not both at the same time, which
limits the communication functionality of 2G networks to a single
communication channel. Additionally, slow data speeds, restricted services and
inadequate software further limited communication functionality throughout early
2G networks.

56
Figure 3.7: The TCP/IP and associated protocol OSI layers.
Early 2G data services provided a giant leap forward in the ideas and visions that
would shape future mobile services, but were limited both in capabilities and
infrastructure. Despite these limitations, simple mobile collaborative
environments would have still been possible across 2G networks, albeit restricted
to a single communications channel and limited in their real time interaction
capabilities to the semi-real time exchange of small data packets.
3G: In contrast to earlier 2G and 2.5G networks, 3G networks presented the first
evolutionary step towards the integration of mobile data and voice
communication infrastructures, enabling new avenues of communication. The
main advantage of 3G networks lies in its simultaneous data and voice
capabilities, unlike earlier 2G systems (see section 3.3.1). 3G enables users to
talk on the phone (voice traffic) while simultaneously surfing the web, checking
email or using applications such as Maps (data traffic).
However, to enable mobile-to-mobile sessions, 3G networks would require the
means to connect multiple participants. Session Initiation Protocol (SIP)
[Handley, et al. 1999] is one such IETF signalling mechanism used in the
establishment, modification and termination of networked sessions between fixed
network devices. Though SIP works over fixed networks, it currently provides
no support for ensuring delivery of data packets between mobile participants that

57
roam between different sub-networks, or any support for determining the location
of a mobile host at session set-up time. And because 3G networks borrow
heavily from earlier 2G GSM architectural designs (see section 3.3.2), it too lacks
the IP addressability needed to allow SIP‟s session management protocols to
operate, establish the required connections and make use of UDP/TCP protocols
to route data back and forth between connected devices.
IMS: The IMS application layers are a huge departure from traditional GSM
architectures that consist of various proprietary protocols and silo applications,
e.g. MMS that varied across different operators and networks. This unified
application layer introduces transparency to previously ungoverned operator
network filtering and firewall restrictions, ensuring applications can receive and
re-direct data packets along dynamic paths to their final destinations.
The IMS upper layer applications approach is borrowed from the traditional
networking model, and would be familiar to anyone who has come across the
seven layer OSI model (see Figure 3.7). This separation of software, hardware
and underlying transport mechanisms reduces the reliance on a specific set of
hardware or networking standards, allowing for the creation of network agnostic
application services out of the box.
Of the GSM networks presented, IMS offers the most potential to facilitate mobile
exchange architectures (MEAs). However, despite the many advantages IMS may one
day deliver, it currently stands in sharp contrast to the commercially available 2G/3G
cellular networks and still remains a far-away prototype that‟s yet to achieve commercial
availability, currently limiting IMS‟s capabilities and applicability to reduced lab based
scenarios. Though this might change in the future, IMS‟s fluctuating roadmap has
already resulted in many sceptics of the technology [Waclawsky 2005] and only time will
tell whether IMS will truly live up to its goals and evolve from a mere prototype to a next
generation mobile network.
Therefore it would be more beneficial to facilitate mobile media exchange over existing
2G/3G networks. 2G networks are however limited to a single communications channel
and restricted bandwidth that would also limit their capabilities to support such features.
By a process of elimination this leaves 3G networks as the only remaining cellular
candidate to facilitate rich mobile media exchange. However, unlike traditional fixed
networks that support TCP/IP communication, in 3G networks there‟s no support for
shared sessions or even direct mobile to mobile communication outside of voice only
connectivity.
Taking into account the lack of SIP capabilities in 2G/3G mobile networks and that it‟s
common practice for mobile operators to heavily utilise firewall systems and ingress

58
filtering mechanisms to further prevent inbound data connections to mobile devices, the
challenge then becomes how to enable SIP functionality over current IP-less 3G cellular
networks. In the next chapter we will look at how such an SIP layer can be incorporated
into the creation of a mobile exchange architecture that can work across existing 3G
networks.

59

60
Chapter 4.
Mobile Exchange
Architecture
“It is the framework which changes with each new technology and not just the picture
within the frame” Marshall McLuhan
4.1 Introduction
Our previous chapters have examined the need for mobile media exchange solutions to
assist with our ever increasing nomadic lifestyles and have sought insight from the
existing literature and state of the art to understand the current limitations and
requirements to providing such services across the mobile domain. In this chapter, as part
of our efforts to further understand how we can better design and build systems to support
digital media exchange across 3G mobile devices, we report the development of an end-
to-end mobile exchange architecture to create the foundation for future work that will
allow users to communicate and exchange digital media across remote and co-located
mobile cellular devices.
This chapter describes the design of the mobile exchange architecture [Yousef and
O'Neill 2007, Yousef and O'Neill 2008] to support the sharing of different forms of
digital media data types between mobile devices. The chapter builds upon the GSM
networks outlined in the previous chapter and provides technical insight into the
implementation of a mobile exchange architecture that is vital to enabling rich mobile
media exchange capabilities.

61
4.2 Mobile Exchange Architecture
The mobile exchange architecture (MEA) is a set of contributing technologies targeted
specifically at resource restricted mobile phone based cellular devices. The architecture
allows users to engage in digital media sharing during a mobile phone call, allowing the
utilisation of the voice channel. It uses a 3G internet connection to exchange data
between participants and plain old telephone service (POTS) to exchange voice data.
The architecture is designed to achieve these goals and overcome the limitations of
existing mobile cellular networks. The mobile exchange architecture presented here is
device, network and operator independent. This means that the MEA will work across
most mobile phones and allow users to freely switch between operators that provide
cheaper services or better coverage.
The mobile exchange architecture is designed to cater to real-time applications (e.g.
games) that require small amounts of data to be updated relatively frequently with low
delay, and push-based applications that need to exchange large amounts of data (e.g.
media packages) with minimum delay, and applications supporting both. As such the
mobile exchange architecture supports the mechanic of collaborations [Gutwin and
Greenberg 2000], through the following requirements:
[f1] Communication: To establish local and remote sessions, the underlying
infrastructure provides the ability to find other users in the network and then
to establish a session with that user.
[f2] Coordination: To enable real time interactions and the creation of
shared interaction spaces among all connected participants.
[f3] Transfer: Supporting data exchange between participants,
encompassing the transfer and distribution of all media between
participants. Such media may include audio, video and messages.
To realize these goals, we developed a complete bespoke person-to-person mobile
exchange architecture, designed from the ground up to work over existing GSM 3G and
future networks. The following section outlines the components of this MEA, its
functionality and the operation of the underlying protocols.

62
4.3 Architecture Overview
The mobile exchange architecture consists of a number of components that integrate with
existing GSM communication systems. Figure 4.1 provides an overview of these
components, with a more detailed overview provided in Figure 4.4.
Mobile Node PSYNC MediatorCellular Network / WiFi Wired Node
internet internet
Figure 4.1: Mobile exchange architectural overview.
Mobile/Wired Node: Consist of devices running a highly optimized multi-
threaded layer of Push-Sync (PSYNC) protocols wrapped in a custom application
software interface. The application software is separated from the PSYNC
protocols by a set of APIs enabling different applications to be developed for
different consumer and business scenarios that benefit from the underling packet
transmission, compression and encryption methods encompassed in the PSYNC
layers.
The client based software automatically establishes a connection to the PSYNC
Mediator upon initiation to report status, receive data and join or establish session
requests. Based on the type of application used and security level, the client
software will connect to the PSYNC Mediator using either HTTP or secure
HTTPS protocols for added privacy.
PSYNC Mediator: The Push-Sync (PSYNC) Mediator lies at the heart of the
service and is responsible for registration, authentication, routing of data between
connected clients and the maintenance of all active sessions among connected
clients.
The PSYNC Mediator consists of four modular components: the session
manager, consumption manager, upload manager and state manager. This
division of labour ensures failure resilience, scaling and load balancing to support
an arbitrary number of connected clients across multiple sessions.

63
The PSYNC Mediator constantly monitors all active clients and any associated
sessions. It delivers required data and notifications to connected peers, ensuring
real time communication, stability and data integrity. The PSYNC Mediator can
support multiple clients (mobile and wired) connected to the same session,
multiple sessions or distributed across separate sessions, maintaining state
information across all connected clients.
Network Interface: PSYNC services are network agnostic, supporting Code
Division Access (CDMA), General Packet Radio Service (GPRS), 1x Evolution-
Data Optimized (1xEV-DO), Universal Mobile Telecommunications System
(UMTS), Wi-Fi (IEEE 802.11) and WiMax (IEEE 802.16), in addition to existing
cellular and wireless networks as well as future networks supporting web access
and voice communication.
4.4 Extensibility
The mobile exchange architecture is built on an extensible infrastructure similar to IMS
and the seven layer OSI model (see Figure 3.5, 3.7), to enable a rich set of applications to
be deployed upon a single extensible robust mobile exchange architecture.
The MEA protocol stack is shown in Figure 4.2 opposite the Open Systems Interconnect
(OSI) standard reference model. The OSI model provides the basis for connecting open
systems for distributed applications and is the basis of all IP communications. To meet
the requirements [f1-3], it is desirable to ensure maximum independence among the
various software and hardware elements of the system to facilitate intercommunication
among disparate elements; and to eliminate the “ripple effect” when there is a
modification to one software element that may affect other elements.
In the OSI model the lowest layers include the physical connection and the data link
layer. Examples are a local area network, a dial-up link, or a wireless network. This link
layer can be quite complicated (including different message formats and control
mechanisms), but it is simply used to transfer content or payload from one link endpoint
to another. Built on top of this layer are additional protocols, such as TCP and IP, used to
route payload from one network node to another in a network that can be extremely large
(e.g. the Internet).

64
Figure 4.2: OSI seven layer model and MEA model.
As a web-based mobile protocol, the MEA is designed to allow mobile nodes to
communicate with one another. It is transmitted using protocols (5, 6 and 7) higher in the
protocol stack.
However, this OSI mapping is a highly simplified view of what actually takes place in
networking environments today. In reality, nominally lower-layer protocols are often
layered on top of nominally higher-layer protocols. To take an example, suppose we are
looking at web traffic. The typical protocol stack would be, from the bottom up: Ethernet
/ IP / TCP / HTTP. This is the OSI model that textbooks describe for IP networks, in
simplified form. The physical layer is at the very bottom, but goes without mention, and
there is no session layer or presentation layer between TCP and HTTP.
Although many systems rely on such simple four layer architectures that follow the OSI
model, in reality many architectures are far more complex. In 3G operators‟ networks for
instance, web traffic looks like this: Ethernet / IP / UDP / GTP / IP / TCP / HTTP. The
application is the same, but the transport network is different because the operator tunnels
traffic over the GPRS Tunneling Protocol (GTP). Notice that IP appears twice in this
stack: once directly on top of Ethernet, where the OSI model says it belongs, but once
higher up than UDP.
In this case the OSI model takes on the form of a directed graph, where each node in the
graph represents a protocol and each directed link between nodes would allow a second
protocol to be layered on top of the first. Graph layering introduces added complexity

65
compared to linear stacks, though a combination of both helps the mobile exchange
architecture to decompose the problem into more manageable parts and provide a
standard architecture to enable collaboration tasks.
4.5 Layered Architecture
Figure 4.3: MEA extensible architecture.
The MEA‟s main modules are composed of linear layers using the lowest protocols (5, 6
and 7) of the OSI protocol stack (see Figure 4.3), with the interconnections between
layers on the mobile node taking on a graph representation (see Figure 4.4). Details of
the layered architectures are described below:
Figure 4.4: MEA detailed architectural overview.
Application Layer: The application layer consists of solutions designed to make
use of the mobile exchange architecture and makes up the lowest layer of the
exchange architecture (OSI layer 1). An important role of the application layer,
especially in the MEA model, is to allow for clear separation between solutions
and application logic built on top of the MEA and the underlying routines,
procedures and protocols required to establish mobile sessions and maintain
active data connections between mobile nodes.
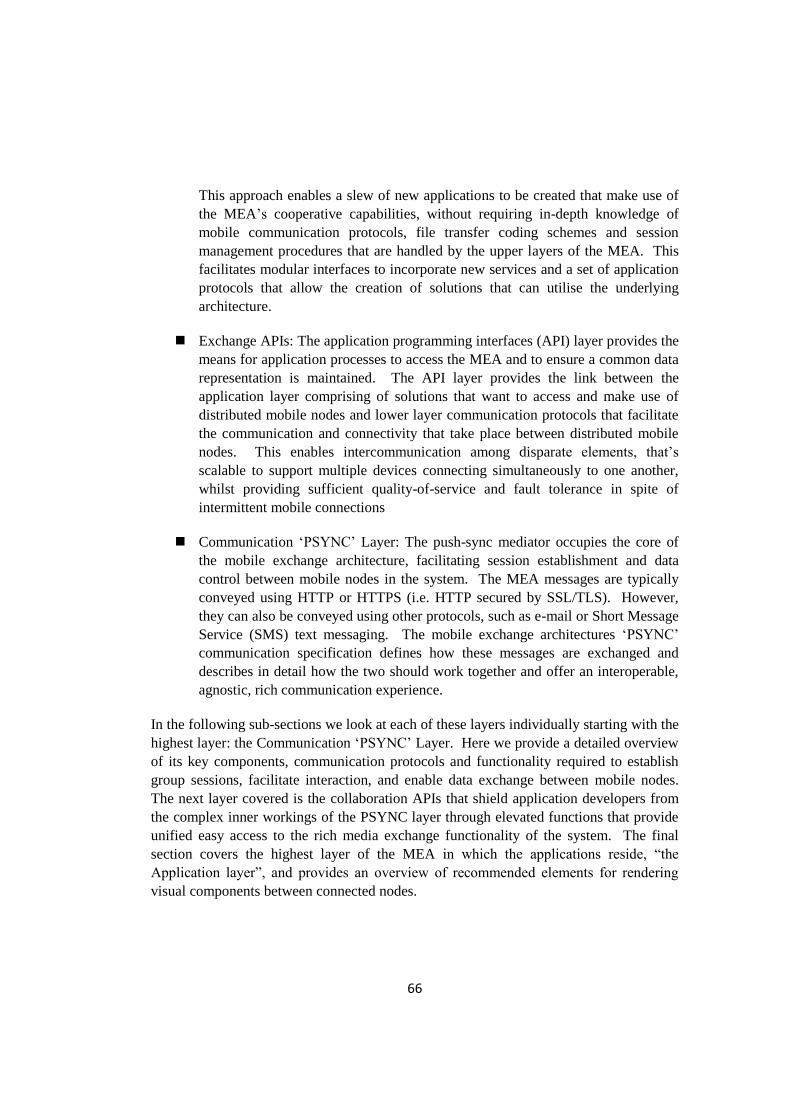
66
This approach enables a slew of new applications to be created that make use of
the MEA‟s cooperative capabilities, without requiring in-depth knowledge of
mobile communication protocols, file transfer coding schemes and session
management procedures that are handled by the upper layers of the MEA. This
facilitates modular interfaces to incorporate new services and a set of application
protocols that allow the creation of solutions that can utilise the underlying
architecture.
Exchange APIs: The application programming interfaces (API) layer provides the
means for application processes to access the MEA and to ensure a common data
representation is maintained. The API layer provides the link between the
application layer comprising of solutions that want to access and make use of
distributed mobile nodes and lower layer communication protocols that facilitate
the communication and connectivity that take place between distributed mobile
nodes. This enables intercommunication among disparate elements, that‟s
scalable to support multiple devices connecting simultaneously to one another,
whilst providing sufficient quality-of-service and fault tolerance in spite of
intermittent mobile connections
Communication „PSYNC‟ Layer: The push-sync mediator occupies the core of
the mobile exchange architecture, facilitating session establishment and data
control between mobile nodes in the system. The MEA messages are typically
conveyed using HTTP or HTTPS (i.e. HTTP secured by SSL/TLS). However,
they can also be conveyed using other protocols, such as e-mail or Short Message
Service (SMS) text messaging. The mobile exchange architectures „PSYNC‟
communication specification defines how these messages are exchanged and
describes in detail how the two should work together and offer an interoperable,
agnostic, rich communication experience.
In the following sub-sections we look at each of these layers individually starting with the
highest layer: the Communication „PSYNC‟ Layer. Here we provide a detailed overview
of its key components, communication protocols and functionality required to establish
group sessions, facilitate interaction, and enable data exchange between mobile nodes.
The next layer covered is the collaboration APIs that shield application developers from
the complex inner workings of the PSYNC layer through elevated functions that provide
unified easy access to the rich media exchange functionality of the system. The final
section covers the highest layer of the MEA in which the applications reside, “the
Application layer”, and provides an overview of recommended elements for rendering
visual components between connected nodes.

67
4.5.1 Communication „Push-Sync‟ Layer
The Push-Sync mediator makes up the heart of the mobile exchange architecture,
consisting of four modular components: a session management engine, a distributed
coordination engine, a distributed exchange engine and a session management engine. In
addition to these core modules an underlying adaptive throttling mechanism is employed
throughout all layers of the push-sync mediator to ensure optimum response times (see
Figure 4.7).
Figure 4.5: Mobile Exchange Server architectural detail.
The communication „PSYNC‟ layer makes up the highest of the OSI layers (Layer 5, see
Figure 4.5, 4.2). It provides the establishment and control of the message packets
between mobile nodes and is the only layer that‟s shared across the mobile node and
push-sync mediator (see Figure 4.6).
Figure 4.6: MEA detailed architectural overview,
with highlighted push-sync layer.
In order to perform its role, the push-sync layer is made of four core components as
outlined below. More in-depth details are provided on each of these components in the
next section; see Figure 4.7:
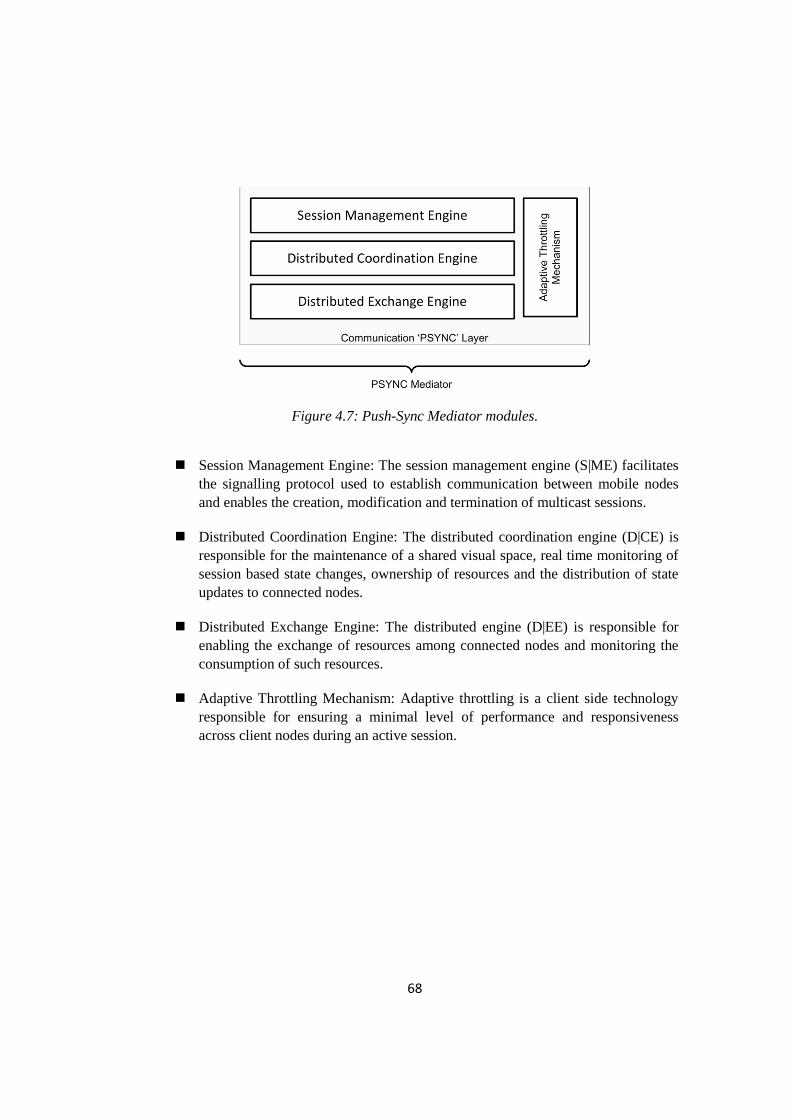
68
Figure 4.7: Push-Sync Mediator modules.
Session Management Engine: The session management engine (S|ME) facilitates
the signalling protocol used to establish communication between mobile nodes
and enables the creation, modification and termination of multicast sessions.
Distributed Coordination Engine: The distributed coordination engine (D|CE) is
responsible for the maintenance of a shared visual space, real time monitoring of
session based state changes, ownership of resources and the distribution of state
updates to connected nodes.
Distributed Exchange Engine: The distributed engine (D|EE) is responsible for
enabling the exchange of resources among connected nodes and monitoring the
consumption of such resources.
Adaptive Throttling Mechanism: Adaptive throttling is a client side technology
responsible for ensuring a minimal level of performance and responsiveness
across client nodes during an active session.

69
4.5.1.1 Session Management Engine
The session management engine (S|ME) is responsible for coordinating presence,
initiating a connection between two cooperative nodes in the network, the addition of
supplementary nodes to a shared session and the management and termination of all
session based connections. The session initiation process is outlined in Figure 4.8 and
discussed further in 4.5.1.1.2.
PSYNC Mediator
Create Session/Re-spawn
ACK
Subscription Status
STATUS
Session
InitiationCall & Session
Manager
Invite/Conference-in
ACK
Session
Expansion
Collaborating Node
Figure 4.8: Session creation process overview diagram,
see protocols 4.5.1.1.2-6 for additional information.
The process of establishing a shared session is initiated client side on the user‟s device.
The process has been specifically designed to resemble the familiar process of creating a
voice call in which the user selects a contact, dials the number and initiates a
conversation.
4.5.1.1.1 Seamless Session Creation
A shared session differs significantly to mobile video conferencing [O'Hara et al. 2006]
in a number of key usability areas. The current process of mobile video-conferencing
requires the user to pre-emptively engage in a video-conferencing call or a voice call
prior to dialling the intended recipient.

70
Idle
Incoming Call Outgoing Call HangUp
InCall
InCall
operation
InCall 2-X
Request Results
Wait
Figure 4.9: Stages of a call lifecycle.
This has two major drawbacks; first, it reduces the opportunity for spontaneous
interactions: A user initiating the voice call cannot seamlessly switch to video
conferencing without hanging up and redialling. Secondly, a user initiated video-
conference call can‟t switch over to a voice only call when video is no longer required.
There has been ample research into the advantages and disadvantages of video as
presence compared to video as data [Kraut, et al. 2002, Whittaker and O'Conaill 1997],
however a more important focus of the session initiation process was to allow for
spontaneous sharing [Cooley 2005] as exists in real life. For that to occur, seamless
switching between conferencing (Voice + Interaction + Data) and non-conferencing
(Voice only) needs to be supported.
Our process of establishing a session has therefore been designed to occur before the call
(idle), during the call (in-call) and to persist after the call (hang-up) encompassing all
major stages of the call‟s life cycle; see figure 4.9.

71
4.5.1.1.2 Session Initiation Protocols
Communications between the Connected Node (CN) and the Push-Sync Mediator (PM)
are covered in the dialogue based representation below, providing insight into the
information exchanged between both parties and their roles in the session initiation
process. Only the dialogue between a single connected client and the Push-Sync
mediator is highlighted, however the process applies to all connected clients. In
circumstances where the presence of additional connected session nodes affect the logic
of the operation being discussed (CN~) is used to represent these changes.
4.5.1.1.3 Session initiation „dialling‟ process
PSYNC Mediator S|ME
Create Session
ACK
Session
Initiation
diallingCall Manager
Collaborating Node
Token
Figure 4.10: Session initiation „dialling‟ process.
CN: The initiating user starts by selecting the intended recipient the user wishes to engage
with in a shared session from the phone‟s built in address book or contact list. This is
similar to the process of creating a voice call. The user then initiates the connection
which commences the „dialling‟ process. The dialling process identifies both parties and
creates a session request by transmitting a token to the PM‟s call manager, see Figure
4.10.
PM: The token is received by the call manager, checked to insure correct formatting,
header checksums and recipient validity before returning an acknowledgement of
delivery to the initiating node. The received token contains a number of user attributes
that serves to identify both parties (the source and target) of the shared session. The
attributes pertain to two unique key values the first relevant to the user: which defaults to
the users preferred phone number and the latter is specific to the connected device: which
in the cellular device scenario defaults to the cellular devices unique identifier IMEI
(International Mobile Equipment Identity) number. In a PC scenario the unique identifier
can be configured to use the MAC (Media Access Control) address or similar unique
identifying attribute.

72
These attributes ensure subscribers maintain a universal accessible identifier at the
PSYNC Mediator that is globally addressable at a user and device level. This allows
addressability over IP-less 3G cellular networks and across firewall restricted
connections.
The dual addressability also serves an important role in ensuring the system is scalable to
support a multitude of devices (mobiles, laptops, PCs .etc) that a user may wish to engage
through in the future and that the system can target the recipient at both a device level and
a broader user level independent of the user‟s device.
4.5.1.1.4 Session initiation „ringing‟ process
PSYNC Mediator S|ME
Subscription Status?
AcceptedSession
Initiation
ringing
Session Manager
Collaborating Node
Engaged
Un-available
Token
Figure 4.11: Session initiation „ringing‟ process.
CN: Upon receiving the PM‟s acknowledgment of message delivery the connected node
enters „ringing‟ stage, in which it enters a blocking mode and waits for the newly created
session to be accepted by the remote user, see figure 4.11.
PM: As soon as the CN enters ringing mode, the call manager automatically hands over
operations to the session manager, freeing up the call manager to focus on validating new
incoming session creation requests. Sessions are managed using a subscription system in
which one or more nodes can join a session by subscribing to its synchronisation queue.
The role of the session manager is to act as a broker allowing users to subscribe to
new/existing sessions, keep track of session subscription and manage associated users. In
the ringing process, the role of the call manager is to broker a new session subscription
contract between connecting parties. This is achieved by forwarding the session requests
to all intended participants and returning one of three responses to the initiating node:

73
Accepted: This notifies both parties that the session has been accepted, that both
parties are now subscribed to the session and are ready to communicate.
Engaged: This status identifies the target node as being aware of the incoming
session request but is currently engaged in another shared session or pre-occupied
with another task and does not wish to participate in the new session.
Unavailable: Differs from engaged in that unavailable denotes that the target user
is currently inaccessible or out of range. This status is more specific to mobile
clients, which are more susceptible to signal loss and network outages.
CN: The session subscription status request is returned to the connected node. When
„engaged‟ or „unavailable‟ is received the connected node discontinues the session
request and notifies the initiating user. The „accepted‟ status session request response
differs from the previous two status requests in that the accepted request contains both a
status response „accepted‟ and a verified session invitation token, see Figure 4.12.
PSYNC Mediator S|ME
Session InvitationSession
InitiationSession Manager
Collaborating Node
Token
Figure 4.12: Session invitation token.
PM: The verified session initiation token is returned to the connected node with an
„accepted‟ session request status. The session invitation token contains the session
information and verification codes required to establish a data-channel between both
nodes to converse and exchange data.
CN: Upon receiving a session invitation token, the session initiation process ends and
both nodes enter into a shared session

74
4.5.1.1.5 Session expansion process
PSYNC Mediator S|ME
Session Invitation
ACK
Session
ExpansionCall Manager
Collaborating Node
Token
Figure 4.13: Session expansion process.
CN~: During an active session new users can be invited to participate in the already
active session by issuing a session invitation token to another participant from the user‟s
address book or contact list, see Figure 4.13. This process differs from that of a newly
created session between two participants in that a non blocking „ringing‟ process is
utilised to allow the active session to continue without acknowledgement from the
inviting party. The use of a non blocking „ringing‟ process allows the current ongoing
shared session to commence as usual without any interruptions (i.e. participants don‟t
need to wait for the new party to join before resuming the session). The invited recipient
upon accepting the session invitation will be sent the latest state update of the active
session, allowing the participant to catch-up with the latest session information.
PM: The session invitation process is similar to that of session creation, in which the call
manager hands over verified requests to the session manager for acceptance status
confirmation and distribution of invitation codes to authorised nodes. In addition the
session expansion invitation packets contain additional information to inform new nodes
on the number of active clients and latest session information.
4.5.1.1.6 Session terminating process
PSYNC Mediator S|ME
End Session
ACK
Session
ContractionSession Manager
Collaborating Node
Token
Figure 4.14: Session contraction process.

75
CN~: During an active session any user can join or leave a session at will, this differs
from unplanned disconnects caused by mobile networks in which the participating nodes
are subject to a grace period in which the client based software will attempt to reconnect
and catch-up with the latest session information.
The process of terminating a session can occur in two situations. The first is linked to the
client that initiated the connection. Initiating clients can transmit an „end session‟ token
to notify all active users connected to the session that the session is terminating, see
Figure 4.14.
The other scenario in which an „end session‟ is transmitted occurs automatically by the
PSYNC manager when the number of clients in the system drops below an acceptable
threshold (currently set to 2 active users), due to nodes leaving the session (clean
disconnect) or when clients drop from the session (unplanned disconnects) caused by
signal loss and a suitable time-out being reached.
PM: Upon receiving the end session token, the PSYNC manager ceases updates to the
session state and informs all active clients that the session in which they were connected
has been terminated. The termination of any session involves the session manager un-
subscribing the connected nodes from the session update stream and returning them to
their previous state.
4.5.1.2 Distributed Coordination Engine
The distributed coordination engine (D|CE) is responsible for the maintenance of a shared
visual space, real time monitoring of session based state changes, ownership of resources
and the distribution of state updates to connected nodes. The state management process is
outlined in Figure 4.15 and discussed further in 4.5.1.2.2.
Publish
ACK Timestamp
Subscribe
State Snapshot
State
ExchangeDistributed
Coordination Engine
PSYNC MediatorCollaborating Node
Figure 4.15: Distributed coordination process overview diagram,
see protocols 4.5.1.2.2-4 for addition information.

76
In the previous section we discussed the session management engine and its role in the
session creation process. The distributed coordination engine is initiated immediately
after the session initiation process has completed, and is responsible for the ongoing
maintenance of all active sessions until their termination.
4.5.1.2.1 Exchanging „state‟ information
In order to enable mobile media exchange, two primary forms of information need to be
exchanged between mobile clients: smaller control packets that manage the distributed
nodes and larger media packets, e.g. files, videos and images that are exchanged between
connected nodes (see Figure 4.16). In a typical networking scenario it would suffice to
propagate each control packet across the network, e.g. pan left, pan right, zoom in, etc.
However, mobile clients are more susceptible to disruptions in connectivity, which can
lead to packet loss and render some or all remote clients out of sync.
To overcome this problem, the distributed coordination engine was adapted to exchange
“state” information rather than “event” data. State information consists of significant
attributes pertaining to active components, e.g. the displayed components‟ dimensions
and x,y co-ordinates, etc. This allows the system to be far more resilient to packet loss
and out-of-order events.
Figure 4.16: Data types comparison bit-rate/delay.
The drawback to this approach is that in comparison to single event transmission, state
transmission packets are larger, incurring additional data overhead. However, by

77
adopting state transmission, the need for delivery acknowledgment packets can be
eliminated, as lost packets can be discarded in favour of new incoming data carrying the
latest state information. Avoiding the associated overhead of checking whether every
packet actually arrives in an interactive conferencing system is made even more
important when slower mechanisms such as HTTP requests are required to traverse
firewalls.
4.5.1.2.2 State Coordination Protocols
Adopting the same notations, communications between the Connected Node (CN) and the
Push-Sync Mediator (PM) are covered in the dialogue based representation below,
providing insight into the information exchanged between both parties and their roles in
the session initiation process. Only the dialogue between a single connected client and
the Push-Sync mediator is highlighted, however the process applies to all connected
clients. Adopting the same symbols used in the previous section (CN~) denotes
circumstances where the presence of additional connected session nodes affects the logic
of the operation being discussed.
4.5.1.2.3 State exchange „publish‟ process
PSYNC Mediator D|CE
Transmit State
ACK Timestamp
State
Exchange
publishState Manager
Collaborating Node
Token
Figure 4.17: State update process.
CN~: Nodes in a shared session maintain both an „active‟ and „passive‟ status. In passive
state nodes update their visual space to reflect changes made by other nodes during the
shared session. In the active state nodes participate and contribute (publish) changes
made to the shared session, see Figure 4.17.
CN: A node primarily becomes active in response to user input e.g. the pressing of a key
or the use of a menu function which affects the shared space. The results of these actions
are packaged into a state publisher token with the session identifier and transmitted to the
state manager.
78
PM: The token is received by the state manager, checked to insure correct formatting,
header checksums and recipient validity prior to distributing the update to all relevant
connected nodes in the shared session.
4.5.1.2.4 State exchange „subscribe‟ process
PSYNC Mediator D|CE
State Status?
State Snapshot
State
Exchange
subscribeState Manager
Collaborating Node
Token
Figure 4.18: State request process.
CN~: All nodes are automatically subscribed to the session state manager during the
session initiation process (see previous section).
PM: To maintain a shared space the state manager can issue state update requests to
connected nodes. Each node in the shared session is tuned to a state synchronisation
clock (see Figure 4.18). On each beat of the clock client states are synchronised to the
shared session state.
In a cellular network over 180 state update requests can be issued by the state manager
every minute, approximately one update every 300 milliseconds based on network
coverage and signal strength. This enables our system to maintain a highly dynamic
shared space between connected devices, for multiple devices to simultaneously tune to a
single state synchronisation clock and for new clients to join an existing session by
subscribing to the session‟s existing state synchronisation clock.
Before a state update request is issued to the connected node the state manager compares
the global session state queue to the node‟s state queue. If the state of the connected node
differs from the global session state, an update „state snapshot‟ is transmitted to the
connected node, see Figure 4.18.
CN: The connected node receives the state update and refreshes the local shared space to
mimic that of the global shared space. Because constant user interface and state updates
can drastically affect node performance if not governed correctly, user interface updates
in addition to incoming state updates are governed by a throttling process (see Adaptive
Throttling Mechanism 4.5.1.4) to manage this process.

79
4.5.1.2.5 Coping with „jitter‟ effects
Jitter is a common side effect to any state based synchronisation approach, in which
roundtrip network delays can extenuate subtle differences between local state information
and that of the global state. This can be observed in the following scenario:
SYNC
Client n
Client n+1
State information
300ms CLOCK
State Information
Pan Right
Pan Down
300ms CLOCK
JITTER
State BSource State AState A
Synchronised Cycle State
Shared Space
SYNC SYNC
I II III
Figure 4.19: Distributed Coordination Mechanism.
SYNC-I
PM: Previous SYNC cycle has already occurred, state updates were distributed.
CN: Client is in its initial „Source‟ state, as seen in the fourth row of Figure 4.19.
SYNC-II
CN: Client submits a status update „pan right‟ at approx 20ms into the sync-ii cycle.
Client‟s local state = „State A‟, as seen in the fourth row of Figure 4.19.
PM: Due to network delays the state update is received late approx 150ms into the sync-ii
cycle, validated by the state manager and queued for distribution in sync-ii. Global state =
„State A‟.
CN: Client submits an additional state update „pan down‟ at approx 180ms into the sync-
ii cycle. Clients local state = „State B‟, as seen in the fourth row of Figure 4.19.
PM: Due to network delays this packet is not received during the current sync cycle.
Global state = „State A‟.
In this situation the local client state differs from that of the global state, causing the local
state „State B‟ to be forcefully updated to an outdated global state „State A‟ during sync-ii.

80
SYNC-III
PM: The state update from the client finally arrives=, approx 30ms into sync-iii cycle,
validated by the state manager and queued for distribution in sync-iii. Global state =
„State B‟ state.
PM: During sync-iii client is reverted back to its correct local state „State B‟ causing a
jitter effect to occur.
Given the nature of mobile cellular connectivity, network delays naturally occur, resulting
in an observed jitter effect. To overcome this issue, the state synchronisation approach is
augmented with a time stamp UTC (Universal Coordinate Time) that gets attached to
each state packet.
The UTC time stamp can then be used by client side logic Kalman filters [Chui and Chen
1987, Harvey 1990] to compare incoming state data against previously submitted state
data, allowing older state packets to be removed and to eliminate jitter effects.
Performing this action client side rather than on the server reduces bandwidth as local
state data doesn‟t need to be updated as frequently, introduces self managed nodes and
results in the infrastructure being more resilient to network outages.
4.5.1.3 Distributed Exchange Engine
The distributed exchange engine (D|EE) is responsible for enabling the exchange of
resources among connected nodes and monitoring the consumption of such resources.
The exchange process (i.e. the upload and download) of resources comprise the core of
the distributed exchange engine and provides a unified transfer mechanism to all
connected nodes. The distributed exchange engine is outlined in Figure 4.20 and
discussed further in 4.5.1.3.3.
Resource Exchange
SYNC
Resource Verifier
SYNC
Data
TransferDistributed
Exchange Engine
PSYNC MediatorCollaborating Node
Figure 4.20: Distributed Exchange Engine overview diagram,
see protocols 4.5.1.3.3-5 for additional information.

81
The distributed exchange engine is also responsible for the monitoring of resource
consumption across connected nodes. The management of resource consumption assists
in the maintenance of resources among nodes during a shared session by providing proof
of resource delivery and return to sender information ensuring quality-of-service and fault
tolerance in spite of intermittent connections across cellular networks.
4.5.1.3.1 Store and forward process
Mobile data networks can suffer from intermittent connectivity issues, signal loss and
times when their users may not wish to be disturbed. As such there needs to be a set of
procedures to handle communication between participants if one is actively unavailable
or out of signal range.
The Mobile Exchange Architecture therefore offers a store-and-forward (S&F) function,
in which if the message cannot be delivered to the receiver straight away, the original
message will be stored at the PSYNC Mediator unaltered, which will then be forwarded
the intended recipients when they become available.
This is similar to that of a traditional postal service, in which a mail carrier will attempt to
re-deliver a registered message if the intended recipient was not at the premises or
otherwise engaged during the first attempted delivery.
This comprises basic functionality, but future expansions to the PSYNC Mediator S&F
functionality could be enhanced to include the use of live presence information to better
inform the scheduling of forwarded messages.
4.5.1.3.2 Security and Encryption
The MEA supports Certificate Authority (CA) root certificates issued by various
companies. A CA root certificate provides a trusted third party to verify the ownership of
SSL certificates issued to companies and websites. When communicating over SSL, the
root certificate on the PSYNC Mediator must match a trusted root certificate on the
mobile node in order for the synchronisation to take place.
For secure shared sessions it is not recommended to enable data exchange without having
a matching set of root certificates on the PSYNC Mediator and mobile node. If the root
certificate on the PSYNC Mediator does not exist in the list of trusted root certificates on
the mobile node, the communication will not commence unless the certificate is installed
or updated by the user.

82
4.5.1.3.3 Data Exchange Protocols
Similarly communications between the Connected Node (CN) and the Push-Sync
Mediator (PM) are covered in the dialogue based representation below, providing insight
into the information exchanged between both parties and their roles in the data exchange
process. Only the dialogue between a single connected client and the Push-Sync
mediator is highlighted, however the process applies to all connected clients. (CN~)
denotes the circumstances where the presence of additional connected session nodes
effect the data exchange process being discussed.
4.5.1.3.4 Resource „transfer‟ process
PSYNC Mediator D|EE
ACK
Retransmit
Content Manager
Collaborating Node
Upload Resource
Stream
Resource
Exchange
transfer
Figure 4.21: Media Exchange Engine.
CN~: Media data is exchanged less frequently than state information during an active
session, but amounts to substantially more data being transmitted. Media transmission is
lossless with no compression or scaling conducted at the D|EE level e.g. A JPEG image
will be transmitted in the original resolution at which the image was captured prior to
transmission. This ensures the quality of the media is maintained among connected nodes
in the shared session and, if required, application specific compression and scaling can
occur at a higher API level prior to hand over, see Figure 4.21.
CN: The resource transfer process consists of a HTTP transfer stream between the
connected node and the content manager.
PM: The data stream is received by the content manager, checked to insure correct
formatting, header checksums and recipient validity before returning one of two
responses to the initiating node:
ACK: This status acknowledges the transfer of resources and data delivery to the
initiating node.

83
Retransmit: This status occurs during a transmission error, caused by user
interruption, checksum errors or loss of connectivity.
CN: If „ack‟ (acknowledgement) status is received the transfer process concludes and the
node is free to transmit another resource to the active session.
4.5.1.3.5 Resource „verifier‟ process
PSYNC Mediator D|EE
Consumed
In-Transit
Failed
Consumption Manager
Collaborating Node
Consumption?
Token
Resource
Exchange
verifier
Figure 4.22: Media Exchange Engine.
CN: The connected node submits a consumption verifier token to the consumption
manager to confirm the delivery or consumption of a resource, see Figure 4.22.
PM: The token data is received by the consumption manager, checked to insure correct
formatting, header checksums and recipient validity before returning one of three
responses to the initiating node:
Consumed: The status denoted that the resource was consumed correctly by the
targeted node.
In-Transit: A retuned „in-transit‟ status means that the resource has not yet been
consumed, but is currently in the process of being transferred to the targeted
nodes.
Failed: The target node, did not receive the transferred resource.
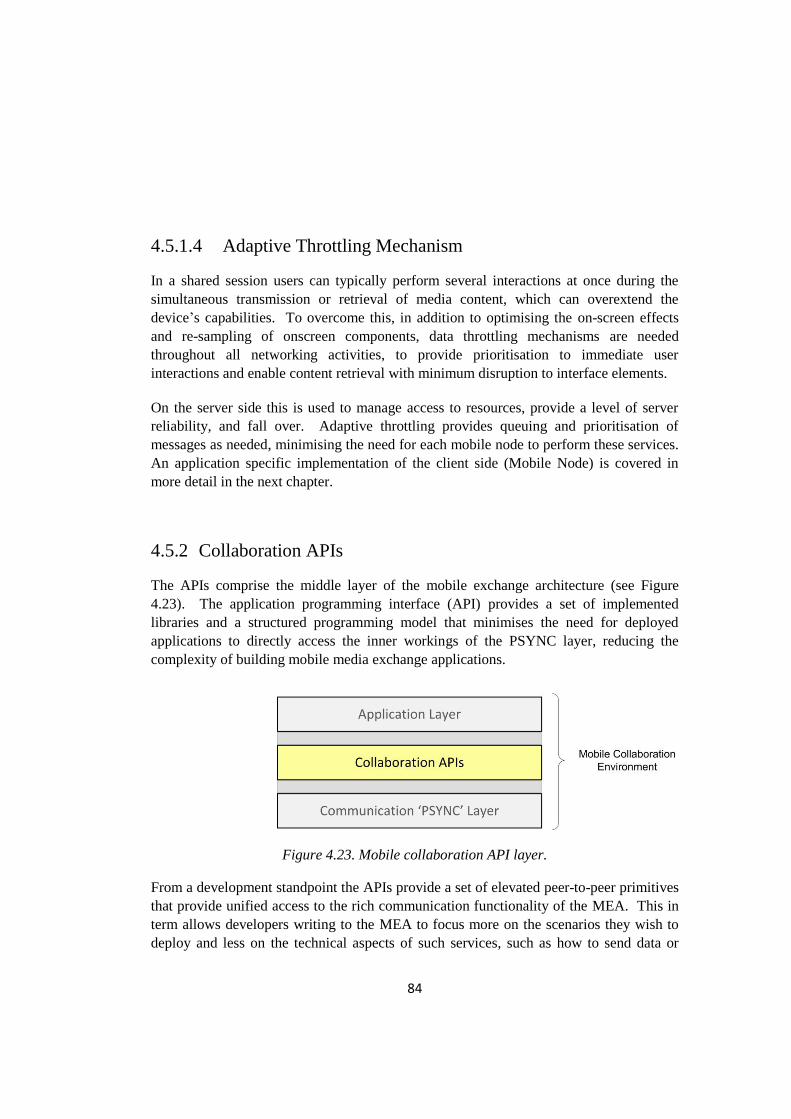
84
4.5.1.4 Adaptive Throttling Mechanism
In a shared session users can typically perform several interactions at once during the
simultaneous transmission or retrieval of media content, which can overextend the
device‟s capabilities. To overcome this, in addition to optimising the on-screen effects
and re-sampling of onscreen components, data throttling mechanisms are needed
throughout all networking activities, to provide prioritisation to immediate user
interactions and enable content retrieval with minimum disruption to interface elements.
On the server side this is used to manage access to resources, provide a level of server
reliability, and fall over. Adaptive throttling provides queuing and prioritisation of
messages as needed, minimising the need for each mobile node to perform these services.
An application specific implementation of the client side (Mobile Node) is covered in
more detail in the next chapter.
4.5.2 Collaboration APIs
The APIs comprise the middle layer of the mobile exchange architecture (see Figure
4.23). The application programming interface (API) provides a set of implemented
libraries and a structured programming model that minimises the need for deployed
applications to directly access the inner workings of the PSYNC layer, reducing the
complexity of building mobile media exchange applications.
Figure 4.23. Mobile collaboration API layer.
From a development standpoint the APIs provide a set of elevated peer-to-peer primitives
that provide unified access to the rich communication functionality of the MEA. This in
term allows developers writing to the MEA to focus more on the scenarios they wish to
deploy and less on the technical aspects of such services, such as how to send data or
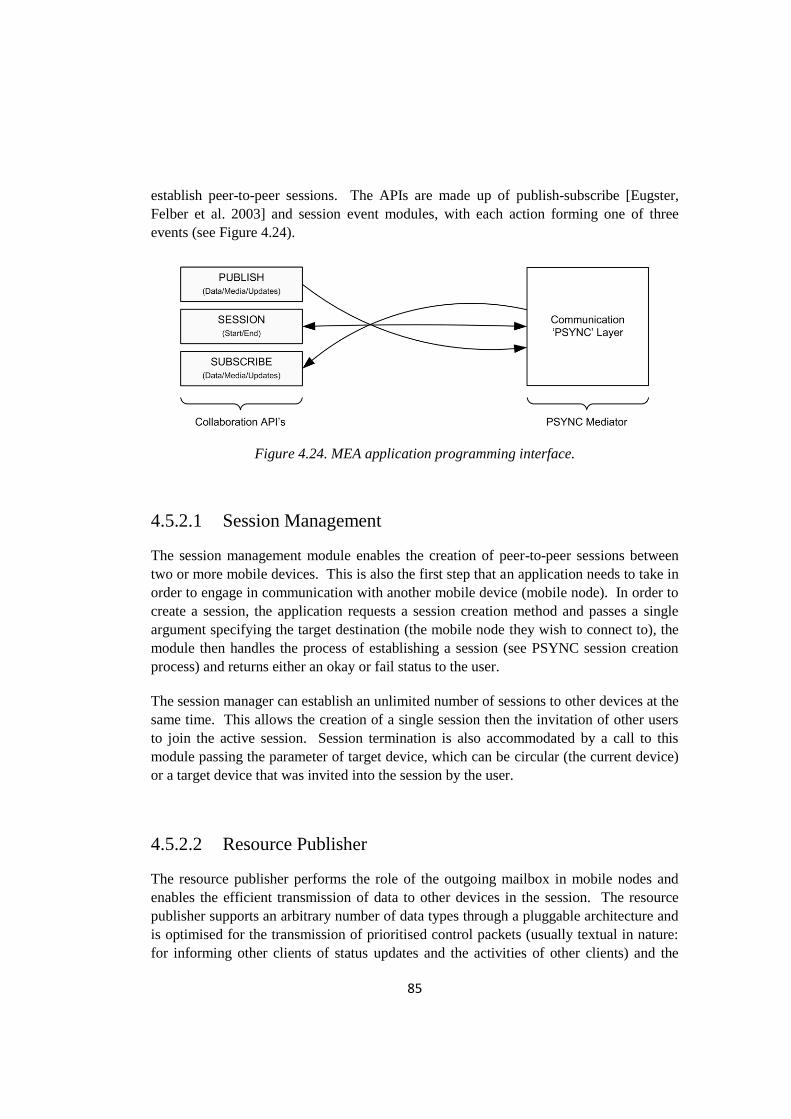
85
establish peer-to-peer sessions. The APIs are made up of publish-subscribe [Eugster,
Felber et al. 2003] and session event modules, with each action forming one of three
events (see Figure 4.24).
Figure 4.24. MEA application programming interface.
4.5.2.1 Session Management
The session management module enables the creation of peer-to-peer sessions between
two or more mobile devices. This is also the first step that an application needs to take in
order to engage in communication with another mobile device (mobile node). In order to
create a session, the application requests a session creation method and passes a single
argument specifying the target destination (the mobile node they wish to connect to), the
module then handles the process of establishing a session (see PSYNC session creation
process) and returns either an okay or fail status to the user.
The session manager can establish an unlimited number of sessions to other devices at the
same time. This allows the creation of a single session then the invitation of other users
to join the active session. Session termination is also accommodated by a call to this
module passing the parameter of target device, which can be circular (the current device)
or a target device that was invited into the session by the user.
4.5.2.2 Resource Publisher
The resource publisher performs the role of the outgoing mailbox in mobile nodes and
enables the efficient transmission of data to other devices in the session. The resource
publisher supports an arbitrary number of data types through a pluggable architecture and
is optimised for the transmission of prioritised control packets (usually textual in nature:
for informing other clients of status updates and the activities of other clients) and the

86
much larger binary packets (that comprises the rich data files, music, pictures or movies
that clients may wish to exchange with one another).
There is currently no restriction on the file types or sizes that can be transferred to other
participants during a shared session using the publishing module. The file transfer
capabilities have been tested with 700Mb multimedia files transfers over WiFi and
200Mb over 3G cellular connections. The transfer function supports error correction,
with the maximum transfer limits being arbitrary based on the bandwidth available on the
given network.
4.5.2.3 Resource Subscriber
In addition to sending files, applications can also subscribe to files sent to them by other
mobile nodes. Rather than setting up a subscription to a specific node, this module adopts
a self subscription model in which mobile nodes subscribe to files for which they are the
target. This simplifies the process and allows client side filtering of received files.
4.6 Chapter Summary
Communication in a static network differs significantly from that of synchronous
communication in a mobile network. In static networks, one implicitly assumes that all
user devices have stable connectivity while this isn‟t the case in a mobile environment.
Because mobile networks suffer from weak and intermittent connectivity, a user might
become temporarily unavailable even though he or she is still engaged in the shared
session.
In this chapter we have presented a new mobile-to-mobile architecture that we believe
overcomes the problems inherent in today‟s mobile networks. Our architecture offers
rich interactional mobile-to-mobile capabilities that can operate throughout existing 3G
networks and demonstrates the capabilities available within existing mobile networks to
communicate, control and exchange data between remote mobile devices.
The architecture consists of a suite of bespoke client and server based components and
protocols to enable rich cooperative services amongst mobile clients. This combination
has a number of advantages in the mobile environment. It (1) enhances performance by
vastly reducing unnecessary data exchange, (2) maximises bandwidth through built in
compression and throttling mechanisms, and (3) enables support for disconnected
operations and loss of connectivity.

87
The mobile exchange server‟s mid-range hardware (2 x 1.8 GHZ Intel Core 2 Duo, 512
MB RAM, 80 GB SATA Hard Disk, Apache/2.2.11 (Unix), mod_ssl/2.2.11,
OpenSSL/0.9.8i, DAV/2, mod_auth_passthrough/2.1, mod_bwlimited/1.4: running on a
shared hosting server in Colorado, USA) was tested with a load of fifty concurrent
connections, originating from the UK. The server load presented as user load time (see
Figure 4.25, left) and bandwidth usage (see Figure 4.25, right). For the peer-to-peer load
testing a total of 2,969 random session requests was performed over a 30 minute period.
The server load delay in seconds was 4.45 for 10 concurrent clients, 3.98 for 20 clients,
3.78 for 30 clients, 3.83 for 40 clients and 3.69 for 50 concurrent clients. The bandwidth
usage in kbits was 482 for 10 concurrent clients, 901 for 20 clients, 1338 for 30 clients,
1849 for 40 clients and 2312 for 50 concurrent clients. The overall server load (i.e.
cpu/memory/bandwidth) for this period was under 10% providing resources for additional
concurrent connections. Furthermore the use of open web standards and Apache (for data
exchange) allows the photo-conferencing service to scale using existing industry standard
load balancing and server replication techniques.
Figure 4.25. User load time (left) and Bandwidth usage (right),
for fifty concurrent user sessions.
The creation of a robust distributed co-ordination engine facilitates the management of all
active cooperative sessions and supports scenarios from simple media- and location-
sharing services to distributed gaming utilising an extensible systems architecture. The
system demonstrates rich interactional P2P capabilities that can operate throughout
existing 3G mobile networks.
Some of the possible usage scenarios of this architecture extend to multimedia data
sharing, DIY assistance, e.g. “which button should I press – look, they all seem to be red”
and to professional field engineers, e.g. “just sent you the latest schematics, let‟s look at
them and let me talk you through the new alterations before you start repairs” and
cooperative map sharing to assist with selecting meeting points. In the next chapter we
demonstrate one such application that‟s built directly on top of the mobile exchange
architecture.
88
Chapter 5.
Mobile Photo-
Conferencing Service
“The technologies which have had the most profound effects on human life are usually
simple” Freeman Dyson
5.1 Introduction
Research has demonstrated that the “one channel at a time” interaction paradigm of MMS
causes many mobile users to be “frustrated when trying to share images remotely and
interactively” and that participants need richer capabilities to connect in the moment,
undergoing the effort of using multiple devices to achieve ongoing conversations while
sharing images [Kindberg, et al. 2005]. Frohlich et al. [2002] suggested “Photo-
Conferencing” as a service that could overcome these restrictions and provide a means by
which users could engage in interactive computer-mediated photo-sharing practices,
supported by a simultaneous telephone conversation, minimising collaborative effort
[Clark and Brennan 1991].
In this chapter we present a Photo-conferencing service [Yousef and O'Neill 2007] we
have named „Ripple‟ that builds upon the exchange architecture reported in Chapter 5 to
deliver the first rich media sharing service to realise the photo-conferencing vision across
mobile devices. Although other instantiations were also possible with the technology we
chose to pursue Ripple as it covered many of the fundamental concepts of mobile to
mobile interactions. Here we provide an overview of the user interface design of our
photo-conferencing application (Ripple) and describe its many features and functionality
that enable rich interactive photo-conferencing.

89
5.2 Implementation - Application Layer
Figure 5.1: MEA application layer components.
Through our work reported in Chapter 5, we developed a complete mobile media
exchange system comprising remote mobile to mobile session initiation protocols,
client/server based software and application programming interfaces (see previous
chapter). In this chapter we report one instantiation of the mobile exchange architecture
in the form of a Photo-Conferencing service that resides in the application layer of the
MEA (see Figure 5.1).
The requirements for photo-conferencing necessitate the creation of application modules
that are beneficial to the process of sharing and manipulating photos among distributed
mobile nodes. Taking into account the resource restrictions of mobile devices requires
that the core image manipulation modules are highly optimised and any inefficient,
replicated or bloated functionality reduced to the bare minimum. To this end the Photo-
Conferencing application layer consists of four core elements:
Graphical User Interface (GUI): Comprises the high level visual elements that the
users of the system will see and interact through when using the mobile photo-
conferencing service.
Rendering and Compositing Engine: Comprises the low level optimised
encoding, animation, thumbnail creation, image caching, compositing and alpha
blending functionality that support higher level GUI elements.
Interaction Logic: Comprises the primitive subroutines, branching and decision
making rules for handling incoming/outgoing data and interactions during the
photo-conferencing session.

90
Adaptive Throttling Mechanisms: Comprises techniques for enhancing
bandwidth, processor utilisation and the maintenance of an acceptable quality of
service (QOS) among connected nodes during shared sessions.
5.2.1 Graphical User Interface
Good user interface design can transform an unruly cluster of confusing features into a
structured, understandable experience [Donald 2008]. Uday presented „Experiential
Aesthetics‟ a Framework for Beautiful Experience (see Figure 5.2), that places emphases
on creating simplicity in interface design, as users shouldn‟t need to know about
complicated back-end and architectures to get their work done [Uday 2008]. Simple,
effective and aesthetically pleasing interface design is particularly important on mobile
phones, where users are obliged to interact through very limited physical interfaces.
Figure 5.2: Experiential Aesthetics: A Framework for
Beautiful Experience [Uday 2008].
As such experiential aesthetics were core to the development of the photo-conferencing
service. Each interaction task and subsequent interface screen was created from the
ground up with attention to detail extending to even the smallest pixel level. Every
screen, selection indicator, load sequence, activity indicator, icons, colour scheme, page
titles, input methods etc were carefully scrutinised and iterated many times during the
development process to ensure a simple, unique and coherent aesthetic experience
throughout.
Research suggests that many everyday tasks aren‟t planned but are opportunistic, with
people simply deciding to use something when they think about it [Norman and Collyer
2002]. The user interface was therefore built to support both Sovereign and Transient
states [Cooper and Reimann 2004]. Sovereign states are typically designed to
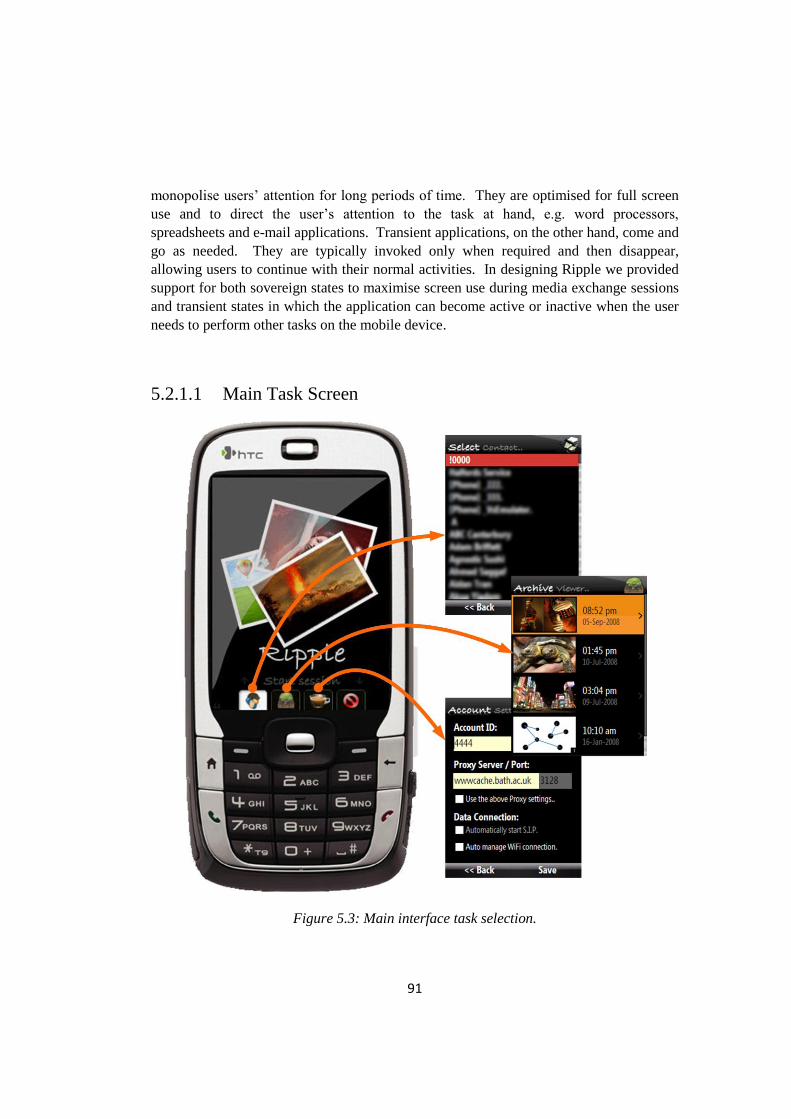
91
monopolise users‟ attention for long periods of time. They are optimised for full screen
use and to direct the user‟s attention to the task at hand, e.g. word processors,
spreadsheets and e-mail applications. Transient applications, on the other hand, come and
go as needed. They are typically invoked only when required and then disappear,
allowing users to continue with their normal activities. In designing Ripple we provided
support for both sovereign states to maximise screen use during media exchange sessions
and transient states in which the application can become active or inactive when the user
needs to perform other tasks on the mobile device.
5.2.1.1 Main Task Screen
Figure 5.3: Main interface task selection.

92
Figure 5.4: Main task selection menu: Start session (top left), Archive viewer
(top right), Account settings (bottom left), Exit client (bottom right).
Ripple was designed to enable mobile photo-conferencing between collocated and remote
participants. The main application screen provides a clean user interface to simplify this
process using task based interactions [Seedhouse 1999, Skehan 2003]. The main
application screen (as with the rest of the mobile client) utilises a bespoke user interface
designed specifically to support mobile photo-conferencing. The main interface supports
four main tasks (see Figure 5.3, 5.4):
Start session: This item is used to create a new „empty‟ session. When it is
selected users are presented with a list of contacts from the phone‟s built in
address book. Once a target contact is selected the new session is initiated
between the two devices, see section 5.2.1.3.
Archive viewer: The archive viewer is a chronological data store of all previous
sessions created or joined by the current user. All sessions are automatically
stored in the archive viewer and presented in chronological order, see 5.2.1.2.

93
Account Settings: The settings screen allows the modification of key networking
and account management configurations for the user, see section 5.2.1.5.
Exit Client: Simple option that terminates the application and removes all traces
from the mobile‟s memory prior to exiting Ripple. This option is also available
throughout all sub-screens, through the context menu for quick access.
5.2.1.2 Archive Viewer
Figure 5.5: Archive viewer interface (left) and real
time rendering process (right).
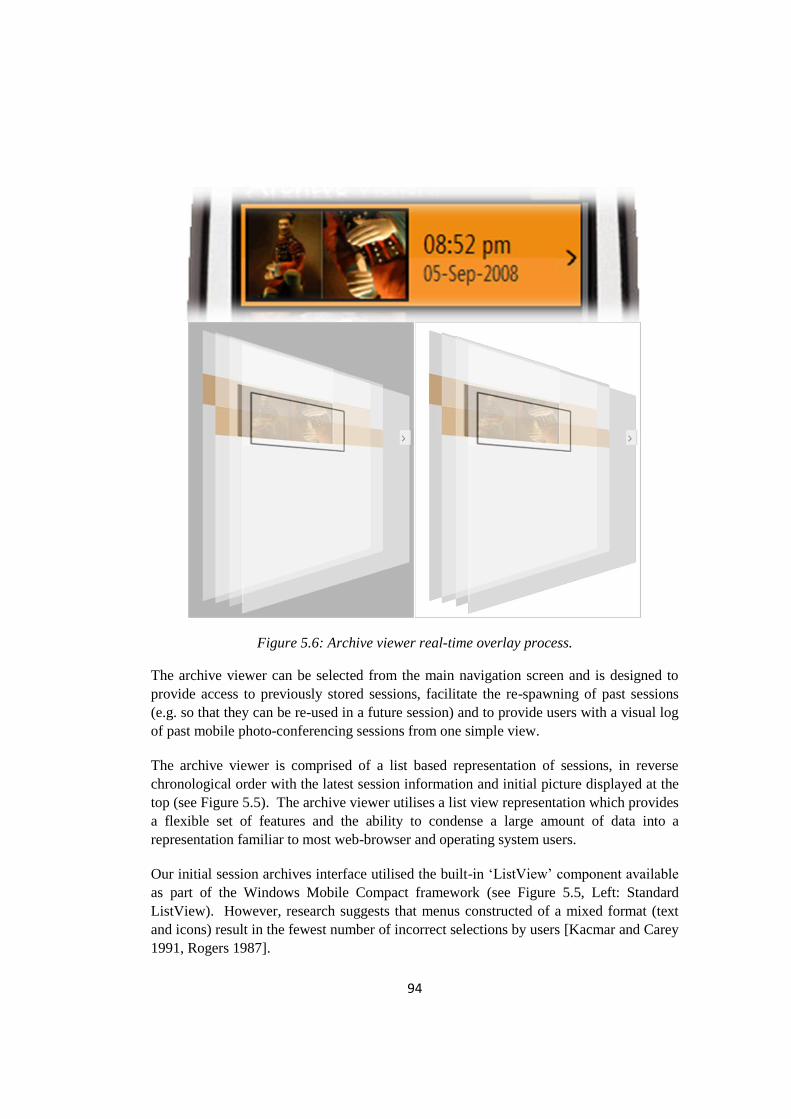
94
Figure 5.6: Archive viewer real-time overlay process.
The archive viewer can be selected from the main navigation screen and is designed to
provide access to previously stored sessions, facilitate the re-spawning of past sessions
(e.g. so that they can be re-used in a future session) and to provide users with a visual log
of past mobile photo-conferencing sessions from one simple view.
The archive viewer is comprised of a list based representation of sessions, in reverse
chronological order with the latest session information and initial picture displayed at the
top (see Figure 5.5). The archive viewer utilises a list view representation which provides
a flexible set of features and the ability to condense a large amount of data into a
representation familiar to most web-browser and operating system users.
Our initial session archives interface utilised the built-in „ListView‟ component available
as part of the Windows Mobile Compact framework (see Figure 5.5, Left: Standard
ListView). However, research suggests that menus constructed of a mixed format (text
and icons) result in the fewest number of incorrect selections by users [Kacmar and Carey
1991, Rogers 1987].

95
Figure 5.7: Main interface with four options and exit buttons,
Standard list view (left), Ripple interface (right).
As part of the iterative interaction design process we sought to improve upon the built in
ListView control to provide an enhanced visual representation of past sessions which can
more clearly convey past session information and their associated time-stamps (see
Figure 5.5 right, 5.6). In addition to the standard controls, recent mobile development
tools such as the dot net compact framework provide additional levels of customisation
over the creation of user interface control elements. These typically consist of three
control levels:
User controls: Are the simplest type of control. They are most often available
through a drag-and-drop visual editor (e.g. Visual Studio), and inherit from the
System.Windows.Forms.UserControl class.
Inherited controls: Are generally more flexible than user controls. With an
inherited control, an existing control that closely matches the intended use is
selected to derive a custom class that typically overrides or adds properties and
methods to the base control.
Owner-drawn controls: Are the most flexible control class. They generally use
GDI+ drawing routines to generate their interfaces from scratch. Because of this,
they tend to inherit from a base class like System.Windows.Forms.Control.
Owner-drawn controls require the most work and provide the most customizable
user interface.
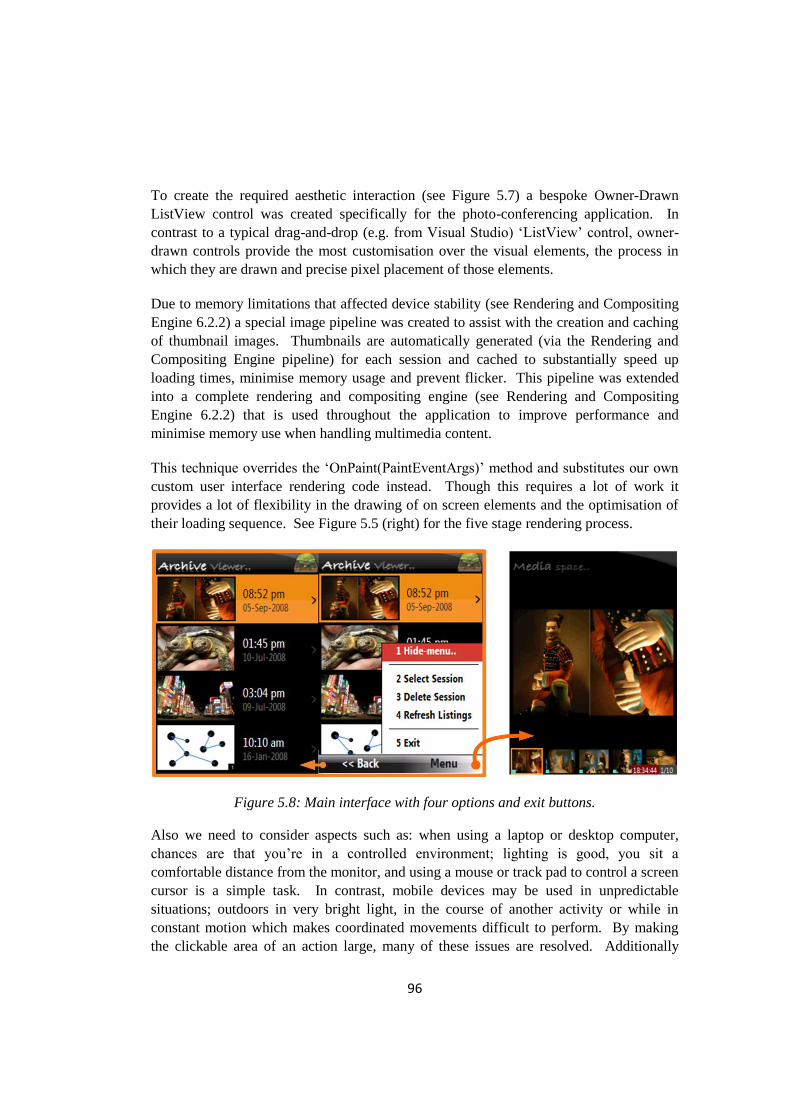
96
To create the required aesthetic interaction (see Figure 5.7) a bespoke Owner-Drawn
ListView control was created specifically for the photo-conferencing application. In
contrast to a typical drag-and-drop (e.g. from Visual Studio) „ListView‟ control, owner-
drawn controls provide the most customisation over the visual elements, the process in
which they are drawn and precise pixel placement of those elements.
Due to memory limitations that affected device stability (see Rendering and Compositing
Engine 6.2.2) a special image pipeline was created to assist with the creation and caching
of thumbnail images. Thumbnails are automatically generated (via the Rendering and
Compositing Engine pipeline) for each session and cached to substantially speed up
loading times, minimise memory usage and prevent flicker. This pipeline was extended
into a complete rendering and compositing engine (see Rendering and Compositing
Engine 6.2.2) that is used throughout the application to improve performance and
minimise memory use when handling multimedia content.
This technique overrides the „OnPaint(PaintEventArgs)‟ method and substitutes our own
custom user interface rendering code instead. Though this requires a lot of work it
provides a lot of flexibility in the drawing of on screen elements and the optimisation of
their loading sequence. See Figure 5.5 (right) for the five stage rendering process.
Figure 5.8: Main interface with four options and exit buttons.
Also we need to consider aspects such as: when using a laptop or desktop computer,
chances are that you‟re in a controlled environment; lighting is good, you sit a
comfortable distance from the monitor, and using a mouse or track pad to control a screen
cursor is a simple task. In contrast, mobile devices may be used in unpredictable
situations; outdoors in very bright light, in the course of another activity or while in
constant motion which makes coordinated movements difficult to perform. By making
the clickable area of an action large, many of these issues are resolved. Additionally

97
when highlighted by a contrasting background colour, important actions are more easily
seen and targeted even when overall screen contrast is poor. Most important of all, a
large click area requires less precision and effort to activate [MacKenzie 1992].
Ripple utilises a number of these techniques e.g. by varying font size, weight, colour and
style, its able to discretely communicate additional information without excessive
labelling. Menus are hidden by default (see Figure 4.8) to emphasise the media, therefore
most interactions have been designed without menus in mind, e.g. selecting a specific
session requires only a right gesture on the arrow key, while returning to the previous
screen requires a simple left gesture.
5.2.1.3 Session Initiation Process
Figure 5.9: Session initiation process in action.

98
The session initiation process occurs after the “Start session” button is selected via the
main interface screen (see Figure 5.3), the user is then presented with a list of contacts
that are extracted from the mobile phone‟s built in address book (see Figure 5.9).
Upon selection of a targeted user for the shared session an “Initiating Connection” screen
(see Figure 5.9, right) is presented. This screen animates a waiting state to the user as the
underling networking engine determines the existing settings, optimal configuration and
whether a new networking connection can be established to the remote target based on
the user‟s current location, network setup and signal strength.
After the connection has been made, a new session is created and the user is presented
with a blank shared interaction “Media Space”, to which new content can be added by
either party engaged in the shared session. Additionally from the Media Space screen, at
any point in the session users are able to conference-in additional participants, extending
the number of users that are currently taking part in the shared session.
5.2.1.4 Media-Space Screen
The Media-Space is the main interaction space for sharing and interacting with images
among all users in the shared session. Thus, the media space is comprised of many
modular components that can be drawn and manipulated on the screen as needed. This
enables users to maintain sessions, share images, interact, e.g. Pan/Zoom, and propagate
state changes from a single flexible interface (see Figure 5.10).
At the bottom of the media space lies the image contribution and selection indicator bar
(see Figure 5.11, 5.12). This bar provides quick access to all the images shared in the
open session so that users can move between multiple shared images (see Figure 5.11).
The image contribution indicator presents a unique colour to each participant (computed
by multiplying each-user id against RGB colour values), allowing users to determine
which image or groups of images were sent from a specific person (see Figure 5.12).
Again due to the large number of on screen images (visible in the centre of the screen and
below in the contribution bar), caching and thumbnail generation techniques were used to
minimise the application‟s memory and processing footprints (using the central
Rendering and Compositing Engine). Similar to the rest of the user interface minimalist
design, advanced options, controls and user customisable configuration settings (see
Figure 5.13) are hidden from the user to maximise screen utilisation but can be called
upon with a single click on the phones soft keys for quick access.

99
Figure 5.10: Main Conferencing Interface.

100
Figure 5.11: Image Contribution and Selection indicator bar:
Image selection process.
Figure 5.12: Image Contribution and Selection indicator bar:
Image Contribution indicator.
Figure 5.13: Media space advanced options, controls and
user customisable configuration settings.

101
5.2.1.5 Application Settings
Figure 5.14: Application Settings Screen.
The last Ripple screen comprises of the settings screen which allows the modification of
key networking and account management configurations by the user (see Figure 5.14).
The account id can be any unique number or character string unique to a user in the MEA
network (e.g. this is typically set to the phone number of the mobile device) for easy
address book access to mobile nodes. Proxy settings are optional and are only needed
when corporate access (e.g. WiFi) restrictions are in place at the organization or network

102
the user wishes to connect to. This built in support for direct proxy configuration ensures
network agnostic connections can be maintained even in strict corporate environments.
Finally the data connection options provide additional management of the SIP (Session
Initiation Process). When auto-start is enabled, the user is always available to partake in
a shared session (though users can ignore an incoming request). This can be disabled
when users don‟t wish to have this functionality, for example when roaming or travelling
abroad. The auto-manage WiFi option puts preference on free WiFi based connectivity
(when available) over 3G connections to reduce costs or improve data connectivity.
5.2.1.6 User Input Controls
Smartphones were selected over the more powerful PDAs (portable digital assistants) due
to their popular compact form factor and because they account for the vast majority of
mobile devices currently sold worldwide. Keypads on a smartphones usually have twelve
keys, digits 0-9 plus the star and the hash key. In addition, there are typically a number of
keys that are referred to as the soft keys. The soft keys are used to navigate and interact
within the user interface of the phone and often include a joystick or a set of directional
keys.
The Ripple user interface has been primarily designed for single handed use (see Figure
5.15) and facilitates the selection of on screen elements or moving around images during
a shared session. Devices that accommodate single-handed interaction can offer a
significant benefit to users by freeing a hand for the host of physical and mental demands
common to mobile activities [Karlson et al. 2006]. For example in a moving subway
while clutching a hand strap, the ergonomics involved in non single handed mobile
interactions can be very frustrating e.g. trying to control a stylus from moving around a
slippery surface.
The input options were designed to take into account three groups of possible users:
beginners, intermediates, and advanced. Each has different needs [Cooper and Reimann
2004]. By designing the interface to meet these needs, all these groups will be more
satisfied than if it was designed primarily for one group or the other. Also to cater for
perpetual intermediates [Cooper and Reimann 2004], the user interface simplifies the
interaction to primary use cases, allowing users to perform the main tasks required to
establish and interact in a shared session. In addition hidden menus can be quickly
revealed to cater for advanced users. This allows users to quickly get the hang of basic
functionality then transition to the advanced functionality when needed or after a period
of familiarisation.

103
Figure 5.15: User interface input controls.
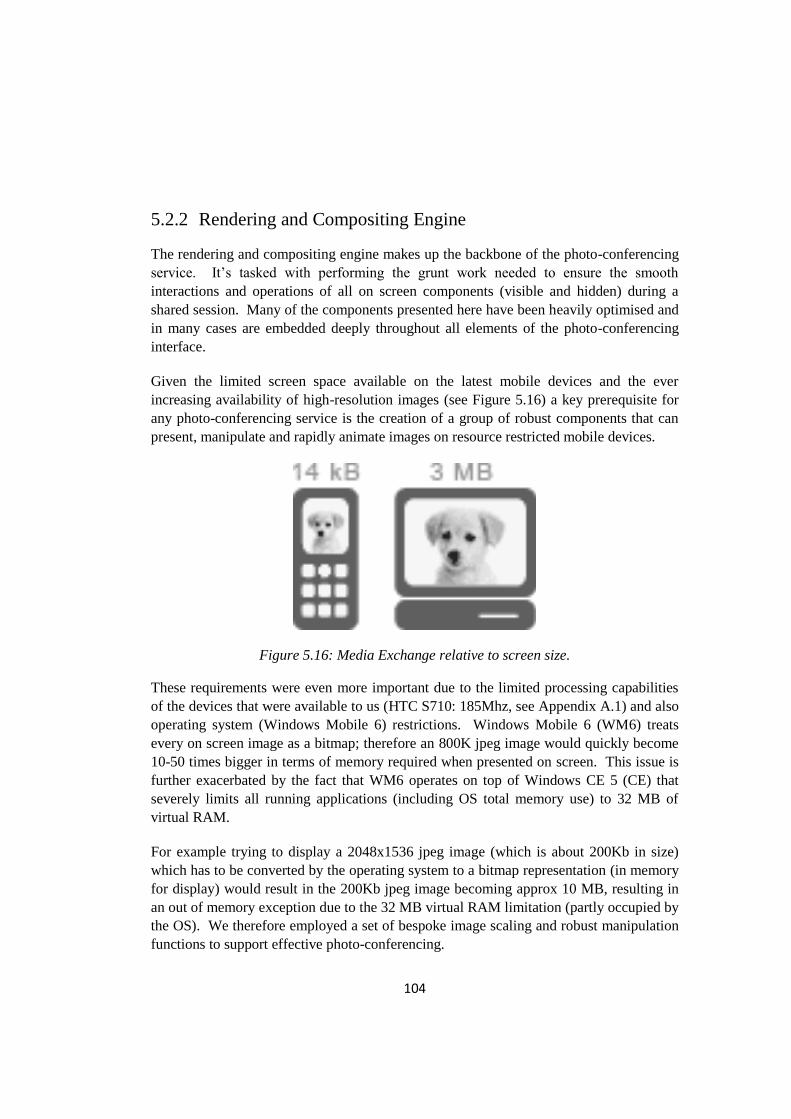
104
5.2.2 Rendering and Compositing Engine
The rendering and compositing engine makes up the backbone of the photo-conferencing
service. It‟s tasked with performing the grunt work needed to ensure the smooth
interactions and operations of all on screen components (visible and hidden) during a
shared session. Many of the components presented here have been heavily optimised and
in many cases are embedded deeply throughout all elements of the photo-conferencing
interface.
Given the limited screen space available on the latest mobile devices and the ever
increasing availability of high-resolution images (see Figure 5.16) a key prerequisite for
any photo-conferencing service is the creation of a group of robust components that can
present, manipulate and rapidly animate images on resource restricted mobile devices.
Figure 5.16: Media Exchange relative to screen size.
These requirements were even more important due to the limited processing capabilities
of the devices that were available to us (HTC S710: 185Mhz, see Appendix A.1) and also
operating system (Windows Mobile 6) restrictions. Windows Mobile 6 (WM6) treats
every on screen image as a bitmap; therefore an 800K jpeg image would quickly become
10-50 times bigger in terms of memory required when presented on screen. This issue is
further exacerbated by the fact that WM6 operates on top of Windows CE 5 (CE) that
severely limits all running applications (including OS total memory use) to 32 MB of
virtual RAM.
For example trying to display a 2048x1536 jpeg image (which is about 200Kb in size)
which has to be converted by the operating system to a bitmap representation (in memory
for display) would result in the 200Kb jpeg image becoming approx 10 MB, resulting in
an out of memory exception due to the 32 MB virtual RAM limitation (partly occupied by
the OS). We therefore employed a set of bespoke image scaling and robust manipulation
functions to support effective photo-conferencing.

105
5.2.2.1 Scaling & Animation Engine
Figure 5.17: Animated zooming during a shared session.
In desktop systems a typical design problem occurs when interacting with detailed
datasets such as map based and network diagram representations in which the available
display space is often smaller than the area populated with data. In these scenarios
zooming functionality is commonly added to the interface to allow users to navigate
around the data space at differing levels of granularity (see Figure 5.17).
Similarly in a mobile photo-conferencing application, the images displayed on the screens
usually contain much more additional (pixel) data then can be represented in a single
view. Two separate engines were created to assist with these scenarios. The first is a
bespoke scaling engine that employs bicubic interpolation and progressive rendering to
minimise the memory footprint of on screen items. This allows a zoomed out image (see
Figure 5.17 Left) to be optimised to incur a similar small memory footprint to a zoomed
in image (see Figure 5.17 Right) by only rendering the required pixels.
In addition a complete animation engine works alongside the scaling engine to assist in
performing transitions of on screen components such as performing smooth Panning and
Zooming gestural effects. Both engines have been heavily optimised and throttled (using
rapid Input and animation tweening to limit the number of successive input events that
generate key states over a pre-defined period, see section 5.2.3.2) to minimise the mobile
device‟s CPU utilisation as much as possible and to free up resources for handling the
outgoing and incoming networking packets that are essential to maintaining a shared
communication session between mobile nodes.
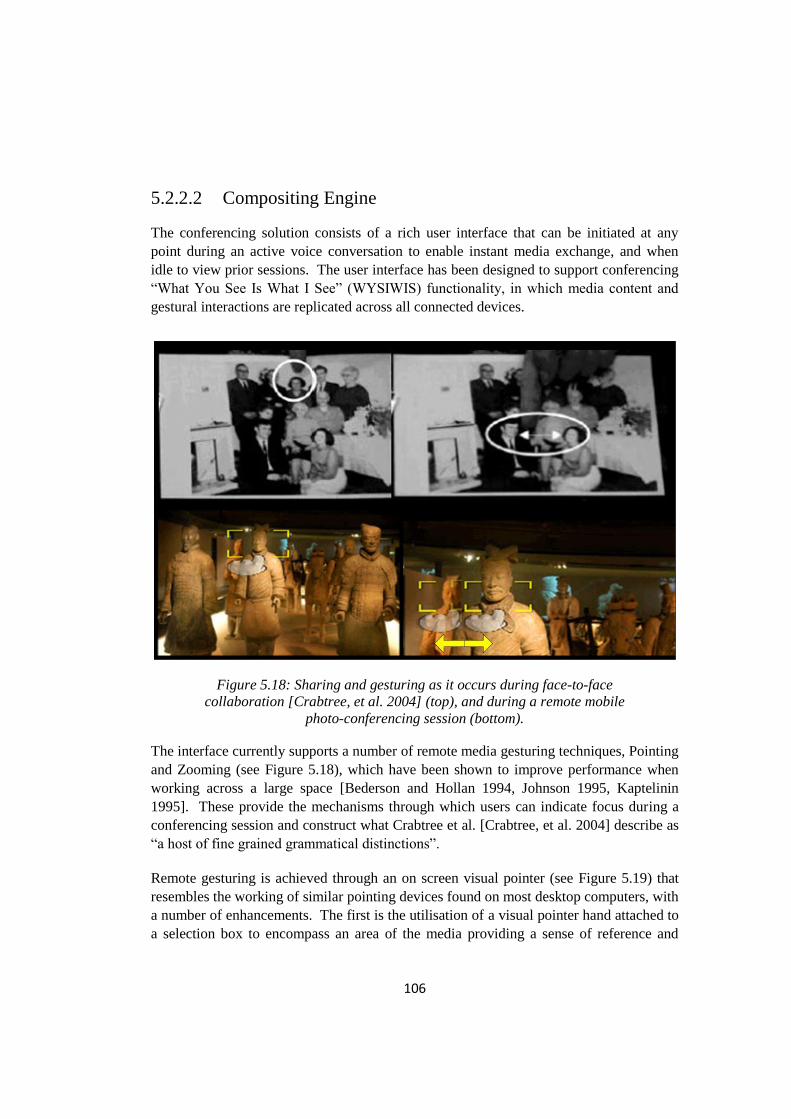
106
5.2.2.2 Compositing Engine
The conferencing solution consists of a rich user interface that can be initiated at any
point during an active voice conversation to enable instant media exchange, and when
idle to view prior sessions. The user interface has been designed to support conferencing
“What You See Is What I See” (WYSIWIS) functionality, in which media content and
gestural interactions are replicated across all connected devices.
Figure 5.18: Sharing and gesturing as it occurs during face-to-face
collaboration [Crabtree, et al. 2004] (top), and during a remote mobile
photo-conferencing session (bottom).
The interface currently supports a number of remote media gesturing techniques, Pointing
and Zooming (see Figure 5.18), which have been shown to improve performance when
working across a large space [Bederson and Hollan 1994, Johnson 1995, Kaptelinin
1995]. These provide the mechanisms through which users can indicate focus during a
conferencing session and construct what Crabtree et al. [Crabtree, et al. 2004] describe as
“a host of fine grained grammatical distinctions”.
Remote gesturing is achieved through an on screen visual pointer (see Figure 5.19) that
resembles the working of similar pointing devices found on most desktop computers, with
a number of enhancements. The first is the utilisation of a visual pointer hand attached to
a selection box to encompass an area of the media providing a sense of reference and

107
focus, and the ability to enlarge and compress the selection area, using similar photo
panning and zooming techniques to provide fine grain control over the focus zone.
Figure 5.19: RGB (left), RGBA (middle) and
RGBA with alpha compositing (right).
Figure 5.20: Cropped: RGB (left), RGBA (middle) and RGBA
with alpha compositing (right).
Because the .net compact framework (the programming layer for the Windows Mobile 6
operating system) on which the system is based lacked support for alpha transparency, we
had to create an alpha compositing engine that could take an RGB image and construct an
RGBA alpha composited blend that simulates transparency on the pointer.
Alpha compositing is the process of combining an image with a background to create the
appearance of partial transparency. Image elements are rendered in separate passes and
then combined. The pointer consists of an alpha composited hand (see Figure 5.19, 5.20),
that enables direct selection and media focus without obscuring the underlying image.
Performance was a major hurdle when creating the alpha composited effect, especially
due to the fact that the alpha transparent layer (the pointer) doesn‟t remain stationary but
animates under normal usage conditions, as it moves and resizes over the main image.

108
This work therefore required many development iterations to achieve satisfactory
performance results.
5.2.2.3 Content Adaptation Techniques
Enabling mobile to mobile connections, creating shared interaction spaces and careful
optimization of the client software has allowed us to extend the photo-conferencing
capabilities across a large number of mobile devices currently available on the market,
from low-end Smartphones to more powerful Pocket PC devices.
In today‟s mobile market consumers are presented with a greater choice of devices, form
factors and screen resolutions to meet their individual needs (see Figure 5.21). These
variations present new challenges to the maintenance of deictic referencing that mobile
photo-conferencing services need to overcome in order to succeed.
HP iPAQ 200
320x240
480x640
Motorola Q9HTC S710
240x320
Figure 5.21: Illustrative example of variations in screen resolution and
orientation across a number of available Windows Mobile devices.
Existing mobile photo-sharing solutions such as MMS services have suffered from
interoperability issues in which messages created by some devices were not compatible
with the capabilities of recipient devices [Bodic 2003, Coulombe and Grassel 2004,
Daniel Ralph 2003]. Although MMS interoperability issues still exist today, mobile
operators were quick to learn from their mistakes and introduced dynamic content
adaptation techniques such as MMSC [Daniel Ralph 2003] to rectify initial user
experiences and encourage the adoption of MMS services. Key to the photo-
conferencing solution developed in this research is the maintenance of a shared visual
space and deictic referencing, through which the mechanics of collaboration [Gutwin and
Greenberg 2000] can be supported.
For such a solution to succeed, it needs to overcome such interoperability issues. Support
for content adaptation is therefore provided by the photo-conferencing interface. In the

109
following section we present four preliminary techniques: “content transformation”,
“content framing”, “content peripheral framing” and “content peripheral t-framing” that
enable cross-device content adaptation during photo-conferencing sessions.
5.2.2.3.1 Content Transformation
Content transformation is a technique in which the source (shared) image is modified to
accompany variations in the target device‟s screen orientation and resolution whilst
maintaining deictic referencing (see Figure 5.22). The transformation consists of varying
the image‟s dimensions and aspect ratio in order to apply stretching across the available
display space on each device.
Figure 5.22: The effects of content transformation, as it would appear on a
mobile device‟s display (yellow area). The top illustration consists of the
source image and the lower illustrates the target output.
The top half of Figure 5.22 illustrates the shared visual space as it would appear on the
screen of a 240x320 (Portrait QVGA) display, with the bottom half illustrating how it

110
would appear on a 320x240 (Landscape QVGA) display. These are two common screen
resolutions, found on many of the latest mobile devices such as the HTC S730 and the
Motorola Q9 (see Figure 5.21) respectively. The transformation is applied by
manipulating the image‟s horizontal and vertical aspect ratios according to the target
display on which it is being presented.
Suppose Ʀ, Ω are the aspect ratios of the current and targeted displays‟ resolutions
respectively, Cw the current displayed image width and Ch the height. We calculate the
target image width Tw and height Th by: Tw = (Cw . Ω), Th = (Ch . Ʀ).
Figure 5.23: Content transformation, across four devices: S730 (source
device), Motorola Q9, HP iPAQ 200 and Apples iPhone. Across four
common screen resolutions from left to right 240x320, 320x340, 480x640
and 480x320.
The advantage of content transformation is that it utilizes all of the mobile device‟s
screen real-estate, whilst maintaining an acceptable level of support for deictic
referencing, in which a question such as “What colour is the flag in the bottom right?”
would return the same answer with both display resolutions (see Figure 5.22, top/bottom).
Additionally, when performing transformations to displays which are variant
multiplications of the source display, for example displaying the content from a 240x320
(QVGA) device to a 480x640 (VGA) display found on many Pocket PCs such as the

111
iPAQ 200 (see Figure 5.21), no image skewing occurs during transformation, providing
identical experiences as both screens share the same aspect ratio (see Figure 5.23).
5.2.2.3.2 Content Framing
Content framing uses subtraction method A ∩ B+n (see Figure 5.24, 5.26 second column),
in which both screens permit shared content to be viewed, shading out areas not viewable
on both devices. This technique provides an alternative to content transformations and is
more suitable for sharing textual and schematic contents across mobile devices as no
transformation or skewing is applied to the original image, with horizontal and vertical
aspect ratios being maintained.
Figure 5.24: Content framing, across four devices: S730 (source device),
Motorola Q9, HP iPAQ 200 and Apples iPhone. Across four common
screen resolutions from left to right 240x320, 320x340,
480x640 and 480x320.
Content framing in effect creates blank space at the screens‟ edges, similar to that
observed when viewing widescreen movies on non-widescreen televisions. This allows
both participants to interact around an identical shared visual space, without incurring any
distortions. In comparison to content transformation, content framing doesn‟t make the
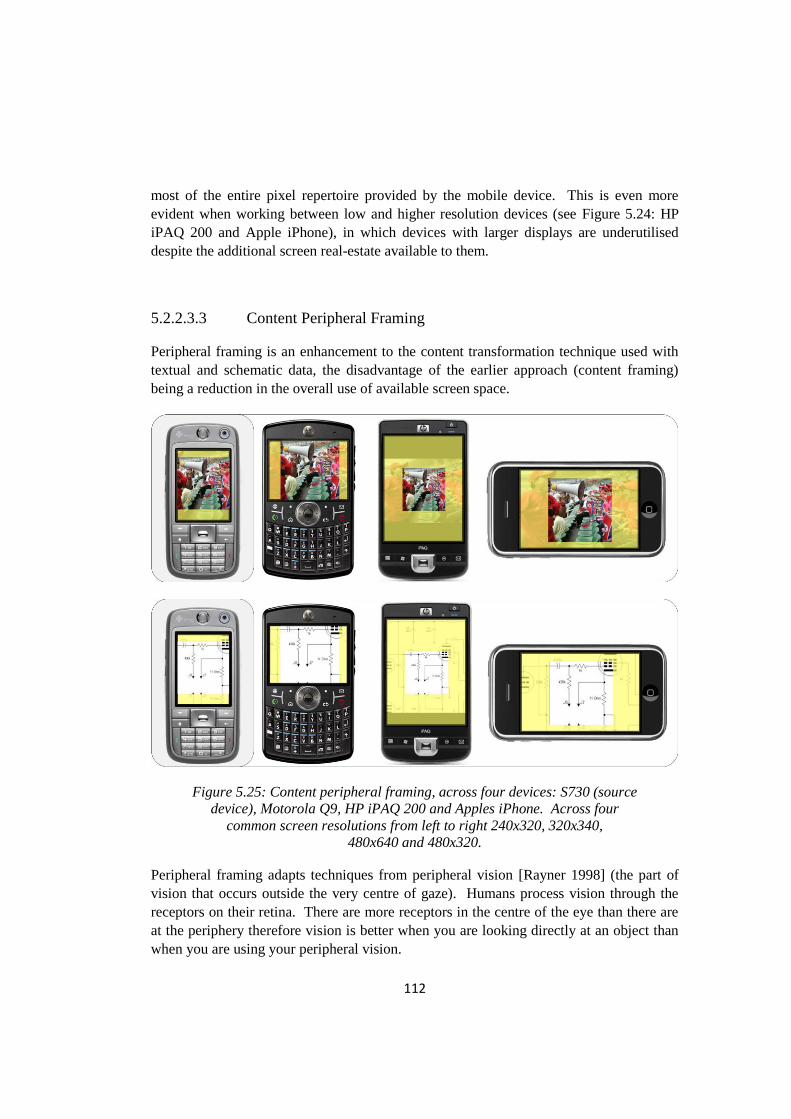
112
most of the entire pixel repertoire provided by the mobile device. This is even more
evident when working between low and higher resolution devices (see Figure 5.24: HP
iPAQ 200 and Apple iPhone), in which devices with larger displays are underutilised
despite the additional screen real-estate available to them.
5.2.2.3.3 Content Peripheral Framing
Peripheral framing is an enhancement to the content transformation technique used with
textual and schematic data, the disadvantage of the earlier approach (content framing)
being a reduction in the overall use of available screen space.
Figure 5.25: Content peripheral framing, across four devices: S730 (source
device), Motorola Q9, HP iPAQ 200 and Apples iPhone. Across four
common screen resolutions from left to right 240x320, 320x340,
480x640 and 480x320.
Peripheral framing adapts techniques from peripheral vision [Rayner 1998] (the part of
vision that occurs outside the very centre of gaze). Humans process vision through the
receptors on their retina. There are more receptors in the centre of the eye than there are
at the periphery therefore vision is better when you are looking directly at an object than
when you are using your peripheral vision.

113
Figure 5.26: An example of content transformation (left) in comparison to
content framing (middle) and content peripheral framing (right).
Across three screen resolutions from top to bottom:
240x320, 320x340 and 480x640.
In a photo-conferencing scenario, the shared interaction space between all participants
constitutes the main point of gaze, whereas the non-shared interaction space can in a
similar way to peripheral vision create a paracentral vision adjacent to the centre of gaze,
without distracting from the main focus. Content peripheral framing uses the subtraction

114
method A ∩ B principle, shading out areas not viewable on both devices in a similar way
to content framing. This allows both participants to interact around shared content, but
unlike content framing the applied shading consists of a matt transparency layer that
enables peripheral vision to make use of the entire pixel space provided by the mobile
device (see Figure 5.25, 5.26 third column).
5.2.2.3.4 Content Peripheral t-Framing
The strength of any photo-conferencing content adaptation method lies in its ability to
maintain a shared visual space whilst maintaining acceptable deictic referencing. We
have thus far presented three approaches (content transformation, content framing and
content peripheral framing) to enable content adaptation during a photo-conferencing
session.
Figure 5.27: Content peripheral t-framing, across four devices: S730
(source device), Motorola Q9, HP iPAQ 200 and Apples iPhone. Across
four common screen resolutions from left to right 240x320, 320x340,
480x640 and 480x320.

115
There is however one more approach that should be considered, in which the unique
attributes of previous methods can be combined to maximise display usage. Peripheral t-
framing is a combination of the best characteristics of content transformation and
peripheral framing to further enhance overall screen utilisation.
In this approach content transformation is applied to stretch the shared visual content,
filling the available display space without altering the contents‟ original aspect ratios (see
Figure 5.27). Subsequently peripheral framing can be applied to define focus and identify
content inside the periphery of the shared space. Using this approach with our previous
example (see Figure 5.28, last row), mixed adaptation can be applied to further reduce the
need for outsized transparency frames when using peripheral framing, enlarging the
shared visual space and further enhancing utilisation of the devices‟ available screen
space.
5.2.2.4 Content Adaptation User Survey
We conducted an environment independent subjective usability survey [Wynekoop et al.
1992] in which we asked participants to rate the above content-adaptation techniques to
determine the most suitable adaptation methods. The survey presented users with two
prototype display screens. The first presented a standard image (see Figure 5.28), the
second presented a textual-schematic data (see Figure 5.29), each presented across four
common device resolutions by condition: Stretching, Framing, Peripheral Framing, and
Peripheral t-Framing (similar to Figure 5.28, 5.29).
We ran 23 participants. Participants were selected at random from students at the
University of Bath. The average participant age was 26 and 43% of participants were
female. The users were asked to rate the adaptation method they most preferred based on
their subjective preferences, see Appendix C.1. To minimise influence participants were
not informed as to the nature of the results we wished to collect, e.g. quality of output,
readability or distortion between the adaptation methods.

116
Figure 5.28: An example of image-content transformation (top-row) in
comparison to content framing (second-row), peripheral framing (third-row)
and peripheral t-framing (bottom-row), across four common screen
resolutions 240x320, 320x340, 480x640 and 480x320.

117
Figure 5.29: Schematic- content transformation (top-row) in comparison to
content framing (second-row), peripheral framing (third-row) and
peripheral t-framing (bottom-row), across four common screen resolutions
240x320, 320x340, 480x640 and 480x320.
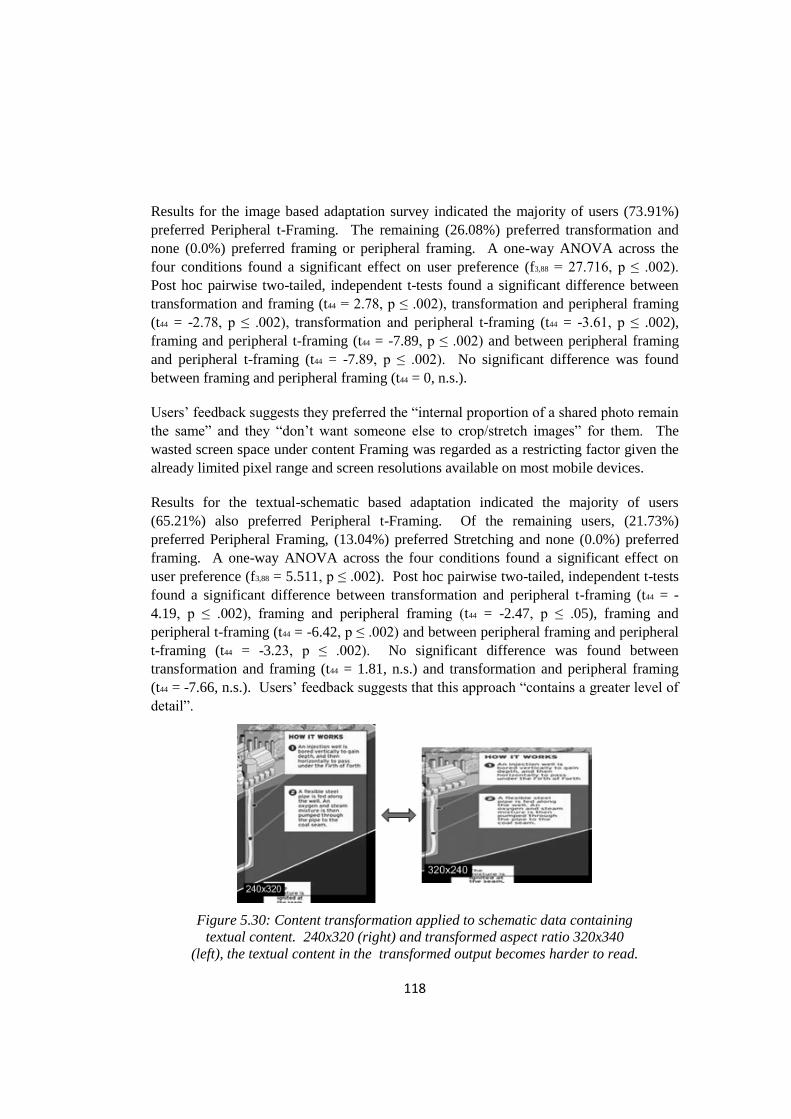
118
Results for the image based adaptation survey indicated the majority of users (73.91%)
preferred Peripheral t-Framing. The remaining (26.08%) preferred transformation and
none (0.0%) preferred framing or peripheral framing. A one-way ANOVA across the
four conditions found a significant effect on user preference (f3,88 = 27.716, p ≤ .002).
Post hoc pairwise two-tailed, independent t-tests found a significant difference between
transformation and framing (t44 = 2.78, p ≤ .002), transformation and peripheral framing
(t44 = -2.78, p ≤ .002), transformation and peripheral t-framing (t44 = -3.61, p ≤ .002),
framing and peripheral t-framing (t44 = -7.89, p ≤ .002) and between peripheral framing
and peripheral t-framing (t44 = -7.89, p ≤ .002). No significant difference was found
between framing and peripheral framing (t44 = 0, n.s.).
Users‟ feedback suggests they preferred the “internal proportion of a shared photo remain
the same” and they “don‟t want someone else to crop/stretch images” for them. The
wasted screen space under content Framing was regarded as a restricting factor given the
already limited pixel range and screen resolutions available on most mobile devices.
Results for the textual-schematic based adaptation indicated the majority of users
(65.21%) also preferred Peripheral t-Framing. Of the remaining users, (21.73%)
preferred Peripheral Framing, (13.04%) preferred Stretching and none (0.0%) preferred
framing. A one-way ANOVA across the four conditions found a significant effect on
user preference (f3,88 = 5.511, p ≤ .002). Post hoc pairwise two-tailed, independent t-tests
found a significant difference between transformation and peripheral t-framing (t44 = -
4.19, p ≤ .002), framing and peripheral framing (t44 = -2.47, p ≤ .05), framing and
peripheral t-framing (t44 = -6.42, p ≤ .002) and between peripheral framing and peripheral
t-framing (t44 = -3.23, p ≤ .002). No significant difference was found between
transformation and framing (t44 = 1.81, n.s.) and transformation and peripheral framing
(t44 = -7.66, n.s.). Users‟ feedback suggests that this approach “contains a greater level of
detail”.
Figure 5.30: Content transformation applied to schematic data containing
textual content. 240x320 (right) and transformed aspect ratio 320x340
(left), the textual content in the transformed output becomes harder to read.

119
From the results Peripheral t-Framing consistently provided a suitable representation of
data across device resolutions. In contrast not all images were suitable to undergo content
transformations in which skewing occurred. Schematic and textual content can become
much harder to read after content transformation has been applied (see Figure 5.30).
Individual preferences and perceptions can also be affected by content transformation that
results in skewing, in which, for example, the display of loved ones in a stretched aspect
ratio can be disconcerting.
5.2.3 Adaptive Throttling Mechanisms
Figure 5.31: Adaptive Throttling Mechanism.
Multimedia streaming over wireless networks is becoming increasingly popular [Harper,
et al. 2007]. Adaptive solutions are proposed to compensate for high fluctuations in the
available bandwidth to increase communication quality. Throttling is proposed as a
client/server technology responsible for ensuring a consistent level of performance,
responsiveness and usability during a shared session.
In a shared session users can typically perform several interactions at once during the
simultaneous transmission or retrieval of media content (see Figure 5.31). If not managed
correctly, these rapid transactions can often overextend the bandwidth available on
mobile networks and the processing capabilities of the mobile nodes to analyse such
packets.
To overcome this, in addition to optimising user interface components (e.g. display
creation, animation effects and re-sampling of onscreen components) to minimize
processor and memory loads, data throttling mechanisms are needed throughout all
networking activities, to provide prioritisation to immediate user interactions and enable
content retrieval with minimum disruption to interface elements.

120
The adaptive throttling mechanisms outlined in this section perform the automatic
queuing and prioritisation of incoming messages as needed, saving each of the connected
nodes (which have limited resources) from having to perform these services.
5.2.3.1 Consistency Maintenance Algorithms
Latency is the time required to transmit a message between mobile nodes. Here it is
defined as the time between a „PSYNC‟ message leaving one mobile node and arriving at
its destination mobile node. Network latency is largely unpredictable, particularly across
mobile, heterogeneous and wide area networks such as the internet. There are many
possible sources of latency in such networks, including the traffic generated by the
connected nodes themselves [Dutta-Roy 2000].
As a result of this, latency is rarely constant throughout execution and rich mobile
communication is difficult to achieve, regardless of the communication protocols used
(e.g. 802.11 protocol family, or wide area wireless communication protocols such
as GSM, CDMA, and UMTS). Wireless data connections provide modest bandwidth
that fluctuates based on operator coverage and active cell-tower bandwidth. The „best
effort‟ approach adopted by mobile operators places no guarantees on available
bandwidth or packet delivery. These limitations can result in limited connectivity
dependent on bandwidth availability and network congestion that can severely affect the
exchange of packets between connected participants.
Direct migration from traditional (desktop based) synchronous communication
environments is therefore difficult and doesn‟t result in the same degree of interactivity to
connected users. Adaptive throttling is a novel technique to help alleviate these
variations in connectivity, speed and signal loss across mobile nodes.
The Consistency Maintenance Algorithms are used to monitor and sense the delay in
transmitted packets to dynamically throttle local lag [Mauve et al. 2004]. For example by
varying the rate (up: faster or down: slower) at which individual shared interaction spaces
are updated, we can minimise inconsistencies across distributed mobile nodes. This can
be observed in the following scenario, in which a „pan right‟ event is handled differently
by a sending and receiving client:
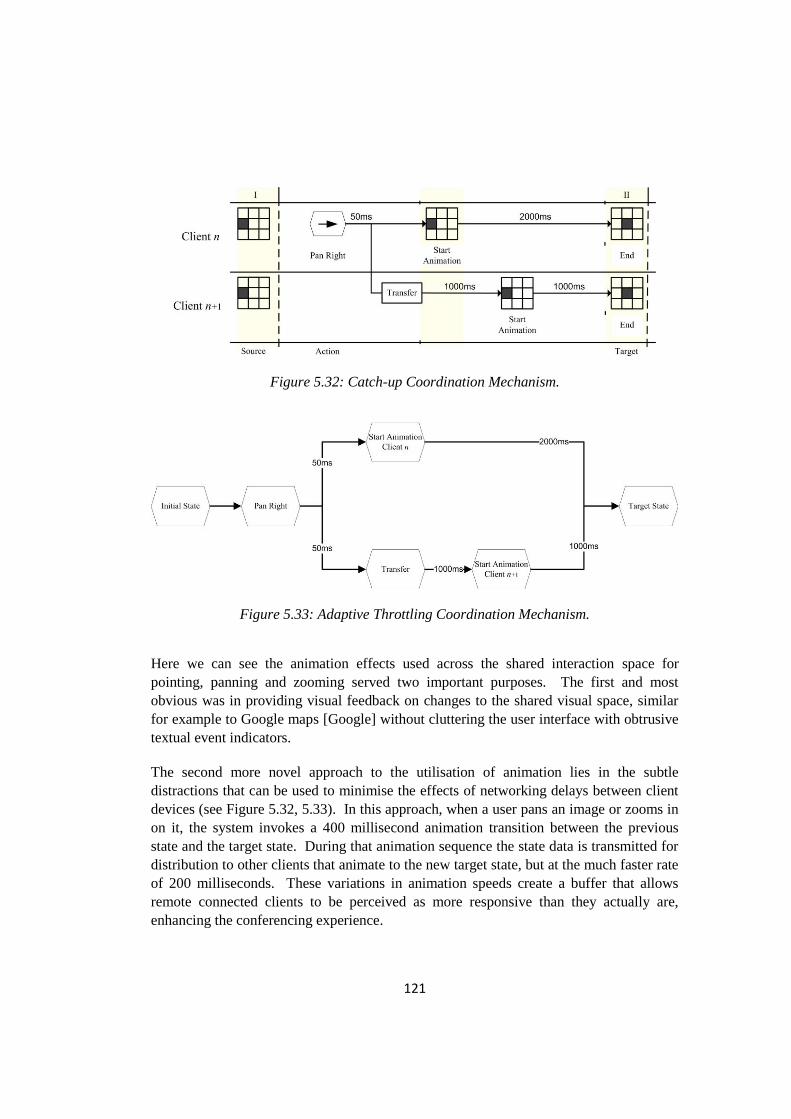
121
Figure 5.32: Catch-up Coordination Mechanism.
Figure 5.33: Adaptive Throttling Coordination Mechanism.
Here we can see the animation effects used across the shared interaction space for
pointing, panning and zooming served two important purposes. The first and most
obvious was in providing visual feedback on changes to the shared visual space, similar
for example to Google maps [Google] without cluttering the user interface with obtrusive
textual event indicators.
The second more novel approach to the utilisation of animation lies in the subtle
distractions that can be used to minimise the effects of networking delays between client
devices (see Figure 5.32, 5.33). In this approach, when a user pans an image or zooms in
on it, the system invokes a 400 millisecond animation transition between the previous
state and the target state. During that animation sequence the state data is transmitted for
distribution to other clients that animate to the new target state, but at the much faster rate
of 200 milliseconds. These variations in animation speeds create a buffer that allows
remote connected clients to be perceived as more responsive than they actually are,
enhancing the conferencing experience.

122
5.2.3.2 Rapid Input & Animation Tweening
Figure 5.34: Animation Tweening process.
In synchronous communication users can often perform multiple consecutive actions to
adjust the shared view or indicate focus to other participants in the shared session.
Sending or even receiving rapid inputs puts stress on both the mobile devices and the
networks on which they operate.
Rapid input algorithms help reduce network load by only propagating required „key‟ state
changes throughout the network to other mobile nodes. Key states are defined here as the
target state of the interaction in which no subsequent commands proceed within an input
threshold. For example if the user changes the state of the shared space by moving
around a shared item (e.g. an image) through rapid successive events <300 milliseconds
(selected based on informal testing of interaction performance e.g. pan left, pan down,
zoom in, pan right on the HTC S710 hardware utilised throughout our testing). The
rapid input algorithm will only transfer a portion of the event queue, such as initial
interaction and the final destination, see Figure 5.34 right. This cuts down network load
and processing requirements on receiving nodes.
However, this introduces jagged flickering state transitions that cause an on screen item
(e.g. an image) to bounce around the screen before reaching its final state. This is where
the Animation Tweening algorithm comes into play. It complements the rapid input
algorithm by smoothing incoming transitions on remote nodes, removing flickering and
allowing the seamless movement from the different image states that are received by the
mobile nodes (see Figure 5.34).
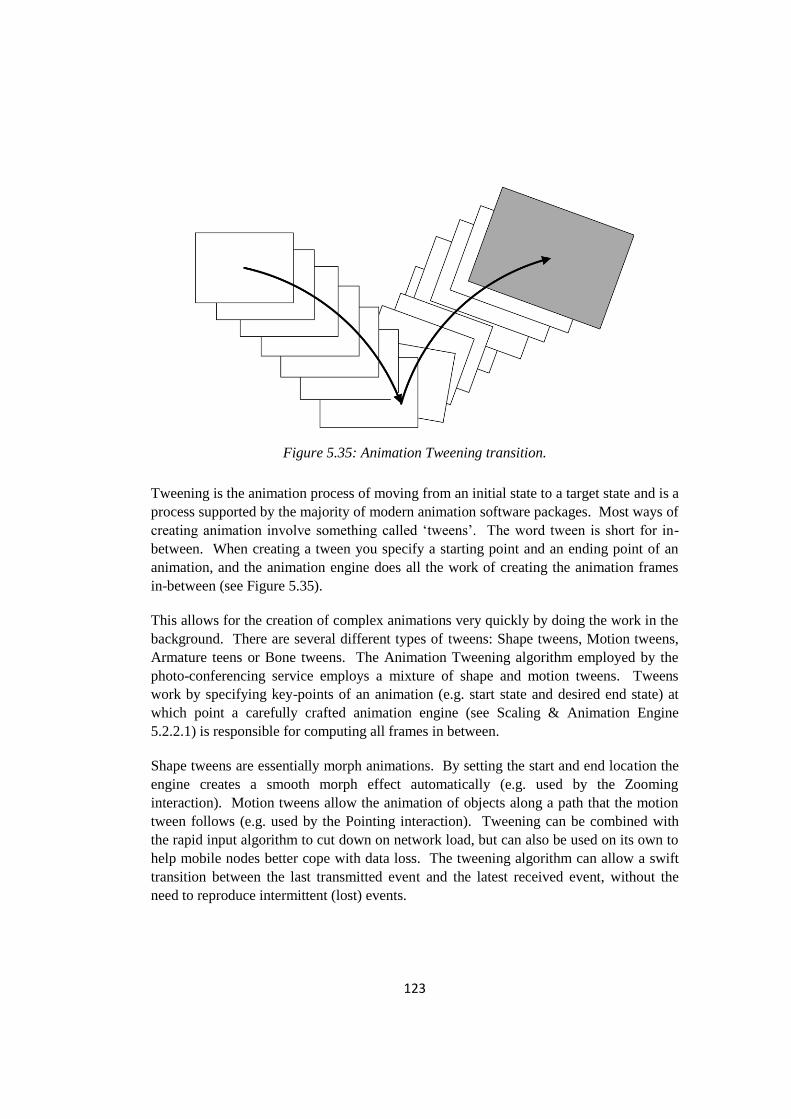
123
Figure 5.35: Animation Tweening transition.
Tweening is the animation process of moving from an initial state to a target state and is a
process supported by the majority of modern animation software packages. Most ways of
creating animation involve something called „tweens‟. The word tween is short for in-
between. When creating a tween you specify a starting point and an ending point of an
animation, and the animation engine does all the work of creating the animation frames
in-between (see Figure 5.35).
This allows for the creation of complex animations very quickly by doing the work in the
background. There are several different types of tweens: Shape tweens, Motion tweens,
Armature teens or Bone tweens. The Animation Tweening algorithm employed by the
photo-conferencing service employs a mixture of shape and motion tweens. Tweens
work by specifying key-points of an animation (e.g. start state and desired end state) at
which point a carefully crafted animation engine (see Scaling & Animation Engine
5.2.2.1) is responsible for computing all frames in between.
Shape tweens are essentially morph animations. By setting the start and end location the
engine creates a smooth morph effect automatically (e.g. used by the Zooming
interaction). Motion tweens allow the animation of objects along a path that the motion
tween follows (e.g. used by the Pointing interaction). Tweening can be combined with
the rapid input algorithm to cut down on network load, but can also be used on its own to
help mobile nodes better cope with data loss. The tweening algorithm can allow a swift
transition between the last transmitted event and the latest received event, without the
need to reproduce intermittent (lost) events.

124
5.2.3.3 Unicast & Group Messaging
Figure 5.36: Catch-up Coordination Mechanism.
Unicast transmission is employed to ensure that information packets are only sent to the
required mobile nodes and not broadcast to all nodes (see Figure 5.36), further reducing
network load. An example scenario where this functionality is used is in the elimination
of „echo‟ in the network. Echo can commonly occur when a status update is broadcast by
a mobile node to other nodes in the network. The initiating client as part of the broadcast
will also receive the message it transmits to others.
Unicast and select messaging prevents this scenario from occurring by allowing clients to
target specific nodes or groups of node in the mobile network (excluding themselves in
the process). Target packets bring many advantages such as optimised bandwidth, in
which clients only receive the packets destined for them, and reduced processing
requirements as no additional filtering is needed client side to ignore echo messages.
Additionally the built in support for unicast messaging improves the security and integrity
of the MEA network by ensuring the transmitted packets are only delivered to authorised
mobile nodes during an active session.

125
5.2.3.4 Sequencing & Time Synchronisation
Figure 5.37: Synchronisation Mechanism.
The sequences in which messages are received play an important role in synchronous
communication. When using non-fault tolerant networks, packets can be lost in the
network or arrive at targeted nodes out of sequence. Both situations are harmful when
attempting to maintain a shared view. Lost packets result in jumps in state updates
(which the Tweening engine helps alleviate) and delayed packets can result in a déja vu
scenario in which unintended past events affect a future system state.
By employing a global, millisecond precision (needed for rapid input) shared time across
all connected mobile nodes, clients can analyse the time-stamp associated with incoming
packets against the time-stamps of previously received and transmitted packets to assess
correct ordering. For example if a packet delay occurs, upon receiving the delayed packet
the client will be able to identify the time-stamp as being older than a more recent
received packet or packet recently submitted by the client, in which case the packet can
be discarded in favour of a more up-to-date event thereby avoiding such situations (See
Figure 5.37).
To achieve millisecond precision, server side time synchronisation is used over client side
time synchronisation. This reduces the need for clients to continuously synchronise their
internal clocks or share time zones.

126
5.3 Chapter Summary
The photo-conferencing service represents our initial instantiation of a mobile media
exchange service built on the Mobile Exchange Architecture presented in Chapter 4.
Although simple in nature, it tackles three fundamental obstacles of mobile cooperative
services: (1) establishing mobile-to-mobile sessions, (2) exchanging large amounts of
data, and (3) maintaining a shared visual space among remote cellular devices.
The system supports two working modes, synchronous and asynchronous: one in which
real time interactions are shared with all participants and the other in which users can
join, leave and catch up later at any time. Scalability was a core part of the architectural
design. The photo-conferencing service demonstrates rich interactional P2P capabilities
that can operate throughout existing 3G mobile networks and addresses the important
issue of mobile content adaptation. Content transformation, content framing, content
peripheral framing and content peripheral t-framing techniques are all demonstrated to
enable rich media sharing across mobile devices, adapting to variations in screen
resolution.
The photo-conferencing interactions enable remote or collocated mobile users to interact
with visual media using two shared interaction techniques: „pointing‟ which consists of a
pointer cursor that simultaneously moves on both devices, and „scaling‟ which
simultaneously enlarges or shrinks the viewable area on both devices.
Pointing and scaling on each device can be controlled independently or simultaneously
(i.e. synchronously across the devices) using dedicated hardware buttons. These facilities
provide a shared visual space that can lead to more efficient communication [Gergle
2005, Kraut, et al. 2002], providing the mechanisms through which users can indicate
focus during a collaborative session [Bederson and Hollan 1994, Johnson 1995,
Kaptelinin 1995, Turner and Kraut 1992] and construct what Crabtree et al. [2004]
describe as “a host of fine grained grammatical distinctions”.
In scenarios when users are distributed, the photo-conferencing system supports
simultaneous voice calls amongst the users. This is not, of course, to claim that there will
be no differences between collocated (face-to-face) and distributed interactions but,
uniquely, our mobile system offers users the ability to use the same mobile device and
services with full voice communication across both collocated and distributed settings.

127
This chapter has provided an initial prototype of a new form of mobile-to-mobile media
sharing service that is spontaneous, dynamic and can occur during an active phone
conversation. In the next chapter we focus on the interaction techniques used with this
service and through a series of user studies assess the impact of these interaction
techniques throughout a shared communication session.
.
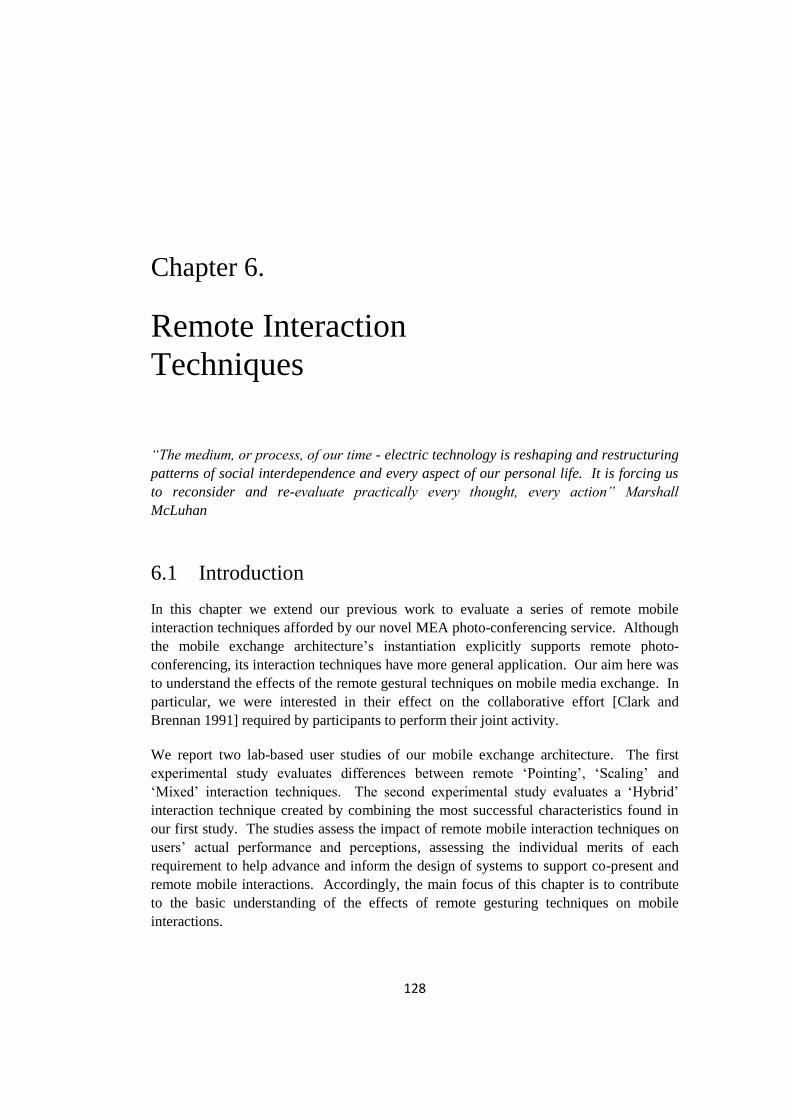
128
Chapter 6.
Remote Interaction
Techniques
“The medium, or process, of our time - electric technology is reshaping and restructuring
patterns of social interdependence and every aspect of our personal life. It is forcing us
to reconsider and re-evaluate practically every thought, every action” Marshall
McLuhan
6.1 Introduction
In this chapter we extend our previous work to evaluate a series of remote mobile
interaction techniques afforded by our novel MEA photo-conferencing service. Although
the mobile exchange architecture‟s instantiation explicitly supports remote photo-
conferencing, its interaction techniques have more general application. Our aim here was
to understand the effects of the remote gestural techniques on mobile media exchange. In
particular, we were interested in their effect on the collaborative effort [Clark and
Brennan 1991] required by participants to perform their joint activity.
We report two lab-based user studies of our mobile exchange architecture. The first
experimental study evaluates differences between remote „Pointing‟, „Scaling‟ and
„Mixed‟ interaction techniques. The second experimental study evaluates a „Hybrid‟
interaction technique created by combining the most successful characteristics found in
our first study. The studies assess the impact of remote mobile interaction techniques on
users‟ actual performance and perceptions, assessing the individual merits of each
requirement to help advance and inform the design of systems to support co-present and
remote mobile interactions. Accordingly, the main focus of this chapter is to contribute
to the basic understanding of the effects of remote gesturing techniques on mobile
interactions.

129
In addition we report a third, field-based, study which evaluated user engagement with
the MEA and suggested implications for the design of such mobile services.
6.2 Grounding Communications
Establishing mutual understanding, or „common ground‟, is required for effective
communication. This is referred to as the „process of grounding‟ [Clark and Schaefer
1989, Clark and Wilkes-Gibbs 1986]. Grounding is a collaborative, interactive process,
which ensures that participants have understood a previous utterance, to a level sufficient
for their current purposes.
The process of grounding can be affected by several factors. Clark and Schaefer [1989]
suggest that different conversational purposes impact on grounding, so task related
conversations might require stronger evidence of understanding than social dialogues. It
has also been proposed that the process of grounding changes with communicative
context [Clark and Brennan 1991]. This is because contexts vary in the number of
channels of communication they support, and hence the range of „grounding constraints‟
(ways of constraining the many possible interpretations of utterances or messages)
afforded by the communicative context. Some methods of grounding appear to require
very little effort in communicatively rich contexts, but using the same grounding
constraints in another context may take considerably more effort. For example, while it is
easy to use non-verbal behaviour to show agreement and understanding in face-to-face
communication, this is not so easily achieved during a videoconference, where the visual
channel is often impoverished.
The effort required to maintain the process of grounding will therefore vary dramatically
with communicative context [Clark and Brennan 1991]. For example, in video-mediated
communication (VMC), attenuation of visual signals can make it difficult to time the
effective use of non-verbal signals to show understanding.
Similarly users of MEA systems should use the grounding constraints that require the
least collaborative effort. The question being addressed in this section is the extent to
which the gestural interactions provided by our MEA to support this. Although there
have been a number of studies of the impact of VMC on users [e.g. Anderson, et al. 1997,
Sellen 1995, Whittaker and O'Conaill 1997], very little research has investigated those
effects across resource restricted (form factors, networks and services .etc) mobile
cellular devices.
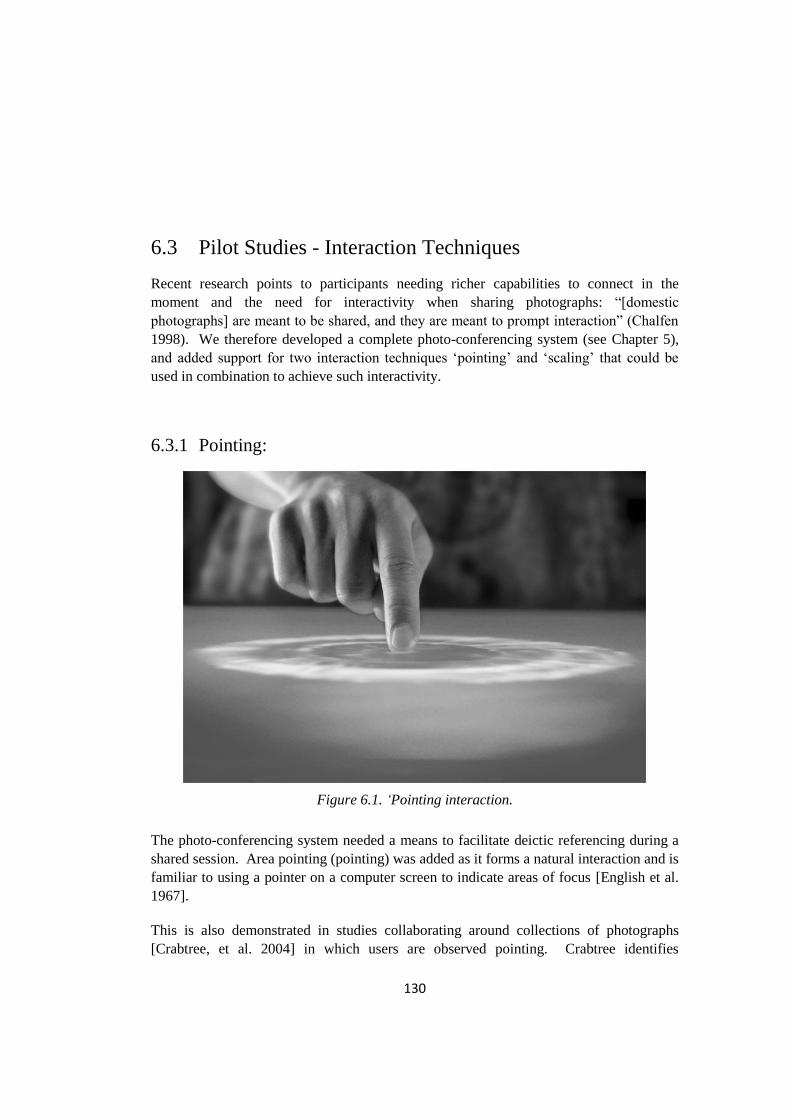
130
6.3 Pilot Studies - Interaction Techniques
Recent research points to participants needing richer capabilities to connect in the
moment and the need for interactivity when sharing photographs: “[domestic
photographs] are meant to be shared, and they are meant to prompt interaction” (Chalfen
1998). We therefore developed a complete photo-conferencing system (see Chapter 5),
and added support for two interaction techniques „pointing‟ and „scaling‟ that could be
used in combination to achieve such interactivity.
6.3.1 Pointing:
Figure 6.1. „Pointing interaction.
The photo-conferencing system needed a means to facilitate deictic referencing during a
shared session. Area pointing (pointing) was added as it forms a natural interaction and is
familiar to using a pointer on a computer screen to indicate areas of focus [English et al.
1967].
This is also demonstrated in studies collaborating around collections of photographs
[Crabtree, et al. 2004] in which users are observed pointing. Crabtree identifies

131
„pointing‟ as “a gloss on a host of embodied interactional gestures that enable persons
using photographs to establish mutual orientations, to furnish topics and to make a host of
what might, following the later Wittgenstein [Wittgenstein and Anscombe 1953], be
called fine-grained „grammatical‟ distinctions that provide for the meaningful use
photographs and the practical achievement of „sharing”.
6.3.2 Scaling
Figure 6.2. Scaling interaction.
In addition to pointing based interaction, a scaling interaction was added to aid the
display of the details of a given shared photograph due to the inherent limitations of
mobile devices‟ screens (i.e. minimal size and resolution). Most if not all images
captured by the cameras built into current mobile devices offer a minimum of two
megapixels resolution images (1600x1200) that greatly exceed the QVGA (320x240)
resolutions provided by the majority of mobile device screens.
The act of scaling in and out of an image to indicate detail or focus on a specific subject
has been shown to improve performance when working across a large space [Bederson
and Hollan 1994, Johnson 1995, Kaptelinin 1995] and can complement the pointing
interaction during the collaborative image sharing session, providing the mechanisms
through which users can indicate focus during a conferencing session and construct what
Crabtree et al. [2004] describe as “a host of fine grained grammatical distinctions”.
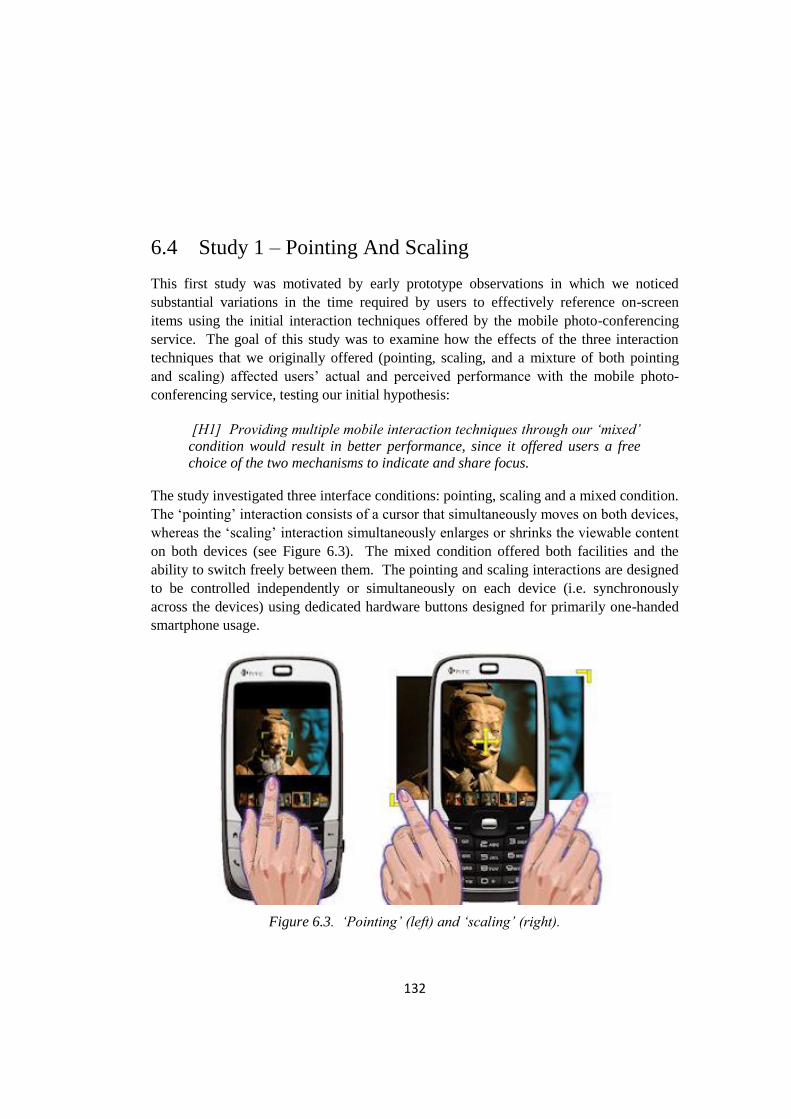
132
6.4 Study 1 – Pointing And Scaling
This first study was motivated by early prototype observations in which we noticed
substantial variations in the time required by users to effectively reference on-screen
items using the initial interaction techniques offered by the mobile photo-conferencing
service. The goal of this study was to examine how the effects of the three interaction
techniques that we originally offered (pointing, scaling, and a mixture of both pointing
and scaling) affected users‟ actual and perceived performance with the mobile photo-
conferencing service, testing our initial hypothesis:
[H1] Providing multiple mobile interaction techniques through our „mixed‟
condition would result in better performance, since it offered users a free
choice of the two mechanisms to indicate and share focus.
The study investigated three interface conditions: pointing, scaling and a mixed condition.
The „pointing‟ interaction consists of a cursor that simultaneously moves on both devices,
whereas the „scaling‟ interaction simultaneously enlarges or shrinks the viewable content
on both devices (see Figure 6.3). The mixed condition offered both facilities and the
ability to switch freely between them. The pointing and scaling interactions are designed
to be controlled independently or simultaneously on each device (i.e. synchronously
across the devices) using dedicated hardware buttons designed for primarily one-handed
smartphone usage.
Figure 6.3. „Pointing‟ (left) and „scaling‟ (right).

133
6.4.1 Study Methodology
6.4.1.1 Design
The experiment was conducted using a between participants design, which manipulated
one independent variable, communication method, consisting of three levels („pointing‟,
„scaling‟ and „mixed‟) accompanied by an audio channel to support voice
communication.
The dependent variables included: task completion time, number of words spoken,
number of input events that took place, error rates and a subjective rating of mental
workload by the participants. The experimental hypothesis was that the mixed condition
would result in better performance measurements, since it offered users a free choice of
two mechanisms to indicate and share focus [Turner and Kraut 1992].
6.4.1.2 Interaction Techniques
Study 1 investigated three interface conditions: pointing, scaling and a mixed condition.
The pointing and scaling interactions were designed to be controlled independently or
simultaneously on each device (i.e. synchronously by any participant across all devices)
using dedicated hardware buttons on the mobile keypad.
In the „pointing‟ condition, the participants were provided with only the pointing
facility of the mobile media exchange service (see Figure 6.4.c). The „pointing‟
interaction consists of a cursor with an attached selection area that simultaneously
moves on both devices (see Figure 6.3 and 6.4b). In this condition the pointer
can be positioned anywhere on the screen using a combination of six buttons:
directional-pad (up, down, left, right) for pointer positioning, enter-button to
shrink the pointer‟s selection area and back-button to enlarge the selection area
(up to three levels in either direction). Moving the pointer on one device‟s screen
made it move synchronously on the other device‟s screen.
The animation speed at which the pointer moves on user input was set to 500
milliseconds to provide smooth transitioning (due to processor limitations) and
covers a movement area equivalent to the size of the pointer‟s selection box (e.g.
115x65 pixels at level 2 on a 320x240 display).

134
In the „scaling‟ condition, participants were provided with only the scaling
facility (see Figure 6.4.ba and 6.4.bb). The „scaling‟ interaction uses a
progressive zooming technique (employing bicubic interpolation) to
simultaneously enlarge or shrink the viewable content on both devices (see
Figure 6.3 and 6.4a-ab). In this condition images can be positioned anywhere on
the screen and scaled using a combination of six buttons: directional-pad (up,
down, left, right) for image positioning, enter-button to scale into the viewable
area and back-button to scale out of the viewable area. Scaling on one device‟s
screen made the same scaling occur synchronously on the other device‟s screen.
The scaling interaction is dynamic based on the original image‟s resolution
(pixel/aspect ratio) which limits zoom to 1:1 of the original image size e.g. a
960x 720 image would support three degrees of zooming from its original
zoomed out view (on a 320x240 display).
Similar to „pointing‟, the scaling interaction used in the experiment was restricted
to three degrees of scaling (each doubling the image size). The animation speed
at which the scaling occurs from start to finish on user input was also set to 500
milliseconds due to processor limitations (see Appendix A.1).
The „mixed‟ condition offered both the pointing and scaling interaction
techniques (see Figure 6.3), and participants were encouraged to use whichever
they preferred at any time. The pointing and scaling interactions are designed to
be controlled independently or simultaneously on each device (i.e. synchronously
by any participant across the devices) using dedicated hardware buttons on the
mobile T9 keypad.
In this condition a toggle-key (hash-button) was added to allow users to switch
between the pointing and scaling input mechanisms. An event (pointing or
scaling) on one device‟s screen made the same event occur synchronously on the
other device‟s screen.

135
Figure 6.4. Extract from a complex visual image with multiple points of
focus (a): Michelangelo‟s Last Judgement; (ab) after 1 degree of scaling;
(b) with cursor indicator.
6.4.1.3 Experimental Task
Study 1 tested the following hypothesis:
[H1] Providing multiple mobile interaction techniques through our „mixed‟
condition would result in better performance, since it offered users a free
choice of two mechanisms to indicate and share focus.
We wanted an experimental task which tested users‟ ability to navigate around shared
images on the (small) mobile display and to identify focus points and the connections
between them [Crabtree, et al. 2004]. Previous research on referential communication
has often utilized experimental situations that create communication challenges for
participants in a more condensed way than they typically occur spontaneously [Clark
1996, Clark and Schober 1989, Clark and Wilkes-Gibbs 1990, Kraut et al. 2002, Kraut et
al. 2002].
Therefore, in testing the hypothesis we abstracted away from the details of any particular
shared image while controlling the complexity of the task. Following Dillon [Dillon et
al. 1990] and Kabbash [Kabbash et al. 1994], the experimental task utilised a puzzle
136
paradigm which required a Helper to guide the actions of a Worker in the completion of a
“connect the dots” diagram.
This was chosen as it represents a generic object-focused task and is comparable to tasks
used in previous work [e.g. Clark and Brennan 1991, Zanella and Greenberg 2001],
allowing for precise control over the number of referential points used by participants and
the level of task difficulty. The dots used in the experimental task represent focus points
and the connections represent relations between those focus points (see Figure 6.5).
Figure 6.5. Michelangelo‟s Last Judgement, example image with multiple
referential points and connections showing one possible relation diagram.
To complete the task a participant was required to connect a series of dots constructing a unique
shape known only to the other participant. Connecting the dots provided a large number of
unique permutations (see figure 6.6) to be created, and the Worker relied completely on
instruction from the Helper. The task consists of connecting a series of nodes (dots)
together; there was only one restriction outlined: “as a minimum each node must at least
connect to one other node”. However, there was no limit on the number of connections to

137
or from a single node, i.e. a node can connect to multiple other nodes or just one (see
figure 6.7).
We measured speed and accuracy of target selection from a standard starting position. In
order to extend generalisability beyond simple images, the dots (targets) used in the task
differed in position and size and were distributed in an irregular pattern across the screen
in order to limit the participant‟s ability to verbally identify objects directly using
physical characteristics alone. This approach was selected to stress users beyond that of
simple image sharing and simulate scenarios in which mobile users may interact not only
with visually rich images (e.g. Figure 6.5) but also other complex representations such as
schematics (e.g. engineering diagrams) or map based representations (e.g. GPS based
navigation aids) that may contain many referential points.
Additionally, three different puzzle layouts (see Figure 6.6, Appendix D.4) were utilised
across all conditions to counter potential confounding variables or learning bias due to a
specific puzzle composition.
Figure 6.6. Diagram layouts used across conditions and counterbalanced across
participating pairs. Rule defines that each node in the diagram mus connect
to at least on other node for successful completion. Design allows for a
large number of possible permutations to deter random selection.
Figure 6.7: Connection examples. Each node must connect to at least one
other node. A and B fulfil the connection rule. C does not.

138
6.4.1.4 Procedure
Participants were divided into random pairs, 12 pairs per condition. Each pair was guided
separately into the usability lab (see figure 6.9). Prior to the study, the participants were
each provided with a copy of the consent form to sign and filled out a background
questionnaire. Any queries relating to the form were answered at this stage. If it was
established that participants had never met before, participants were introduced to one
another.
The participants were then provided with a copy of the task instructions and asked to read
through the instructions as a pair to ensure they were well understood (see Appendices
D.1, D.2). The experimenter then proceeded to read aloud the instructions. The study
design was between participants (to prevent task familiarisation) with 3 conditions. In the
„pointing‟ condition, the participants were provided with only the pointing interaction
technique (see Figure 6.3 and 6.4b). In the „scaling‟ condition, participants were
provided with only the scaling interaction technique (see Figure 6.3 and 6.4a-ab). In the
„mixed‟ condition, participants were provided with both interaction techniques and
encouraged to use whichever they preferred at any time.
The participants were sat down initially at a shared desk, presented with the mobile
equipment and given training in the use of the mobile media exchange service (both as
helper and worker), allowing ample time for familiarisation. During the experiment
participants occupied the same usability lab with a divider set up to prevent visual
communication by means other than the mobile device provided (see figure 6.8).
Participants were randomly assigned roles (Helper or Worker), and asked to
collaboratively complete the puzzle. The Helper was provided with diagrammatic
instruction in both printed form and visually on the Helper‟s mobile display containing
the final puzzle state, so that the helper could guide the actions of the Worker in
completing the „connect the dots‟ puzzle. The Worker activities (with no initial
knowledge of the final puzzle state) were to receive instructions from the Helper,
collaborate through the mobile device and sketch the correct final diagram using the pen
and paper materials provided.
In addition, Workers were instructed that they were not allowed to see the Helper‟s
instructions. Both participants were instructed that they could talk at all times, were
provided a maximum of 10 minutes to complete the task and asked to complete the task
as quickly as possible (most pairs completed in less than 5 minutes). Post task
completion, the participants provided subjective feedback on the condition just used and
completed a NASA TLX workload assessment (see Appendices D.5-D.7).
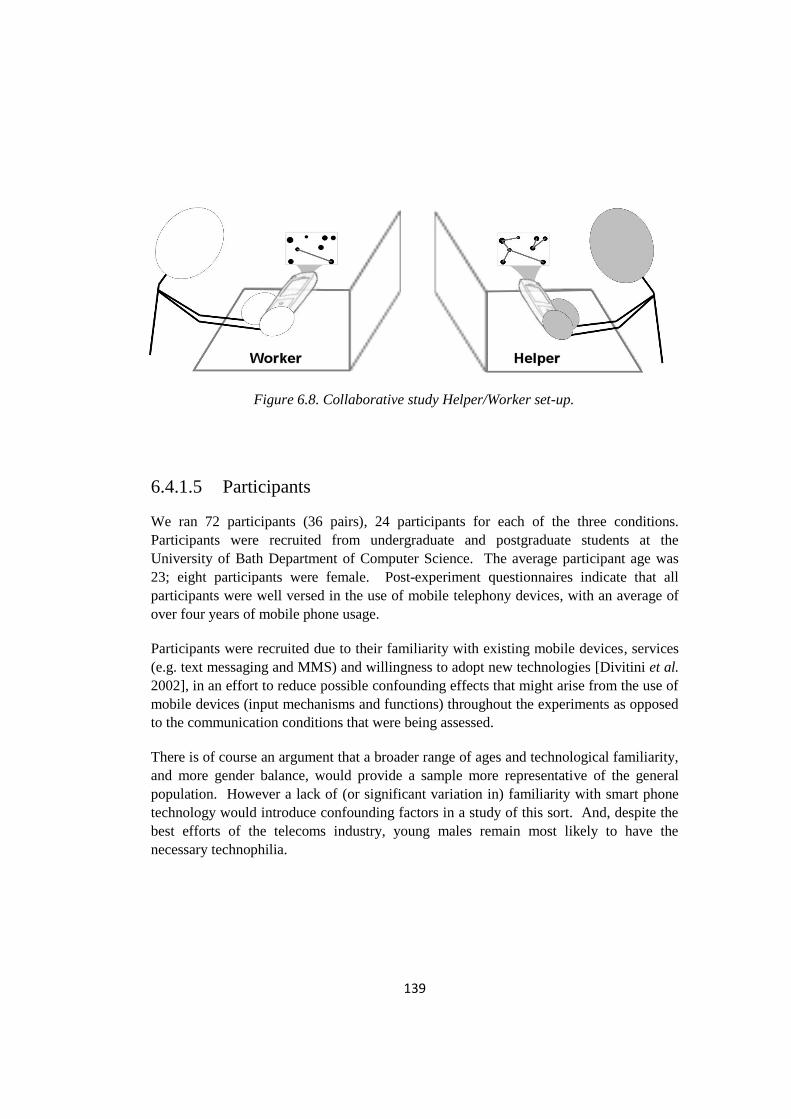
139
6.4.1.5 Participants
We ran 72 participants (36 pairs), 24 participants for each of the three conditions.
Participants were recruited from undergraduate and postgraduate students at the
University of Bath Department of Computer Science. The average participant age was
23; eight participants were female. Post-experiment questionnaires indicate that all
participants were well versed in the use of mobile telephony devices, with an average of
over four years of mobile phone usage.
Participants were recruited due to their familiarity with existing mobile devices, services
(e.g. text messaging and MMS) and willingness to adopt new technologies [Divitini et al.
2002], in an effort to reduce possible confounding effects that might arise from the use of
mobile devices (input mechanisms and functions) throughout the experiments as opposed
to the communication conditions that were being assessed.
There is of course an argument that a broader range of ages and technological familiarity,
and more gender balance, would provide a sample more representative of the general
population. However a lack of (or significant variation in) familiarity with smart phone
technology would introduce confounding factors in a study of this sort. And, despite the
best efforts of the telecoms industry, young males remain most likely to have the
necessary technophilia.
Figure 6.8. Collaborative study Helper/Worker set-up.

140
6.4.1.6 Apparatus
The physical set up of the study was similar to that in Figure 6.8. Each participant was
provided with a Smartphone mobile device, a HTC S730s supporting the following
specifications: the Windows Mobile 6.1 Standard operating system, a 2.4 inch TFT
display with 240x320 pixels and an internal 802.11g wireless module which was used
throughout the experiments to establish communication between the devices.
Smartphone (non-touch screen) mobile devices were used throughout the experiments
enabling one or two handed input using the directional keypad and the built-in T9 input
keys. Each mobile device was pre-loaded with a custom built stand-alone Windows
Mobile Photo-Conferencing client (see Chapter 5), that established communication
between the two mobile devices, creating a shared visual space in which a number of
communication conditions could be utilised.
The application was always run in full screen mode to ensure the only interface displayed
and accessible to the user would be the puzzle task. The devices used in the experiment
were identical in make and model and both fully charged to eliminate any processor
throttling effect on transmission speeds.
The desk chairs provided were height adjustable, each participant‟s desk was shielded by
a tall divider to prevent direct visual communication between participants, and verbal
communication was allowed. The experimenter observation desk occupied a separate
room adjacent to the participants‟ room, in which the experiment was monitored and
recorded.
The experimenter had access to an Apple Macbook laptop computer [MBPRO
12/2.33/3G/160/SD/MDM/AP/BT GBR] displaying real-time session information and log
data for the active experiment to assist with monitoring and observational note taking.
The experiment‟s progress was monitored by two cameras in the participant‟s room that
fed through a monitor providing a real-time image to the experimenter. Also in the
participants‟ room a MiniDV video camera (Sony Handycam DCR-HC22E) mounted on
a height and angle adjustable tripod was used to record the experiments for future
analysis.

141
Figure 6.9. Experiment setup with divider to prevent visual
communication (a). Participants (bottom row): Helper on
the left (b) and Worker on the right (c).

142
6.4.1.7 Materials
Both participants were each provided with a copy of the instruction sheet that was read
out prior to commencing the experiment (see Appendix D.1) and provided on a single
side of A4 paper on the participants‟ desks for further reference. An additional copy was
also used by the experimenter. The Helper was also provided with a copy of the final
puzzle diagram and a mobile key-pad reference diagram (see Appendix D.4 and Figure
6.1.5) to provide a quick reference and reminder to the input keys used for the particular
experiment, pointing, scaling or mixed. The worker was provided with a copy of the
unfinished puzzle diagram (see Appendix D.3) and a pen to draw in the relevant diagram.
In addition to task based material, participants were also provided with A4 paper consent
forms to sign, questionnaire materials including NASA TLX for subjective assessment of
mental workloads (including both the subscales and the paired-comparisons forms) and a
bespoke evaluation questionnaire (see Appendices D.5-D.9).
6.4.1.8 Problems encountered
No major task completion problems were encountered. Some entry errors were observed,
e.g. a mis-pressed button during a selection or a transmission procedure. As such entry
errors are part of standard mobile use, these input errors were allowed.
Mobile phone based recording software was initially used in pilot studies, but the
performance impact was found to be inconsistent and was removed because the inability
to precisely control and measure its overall impact on the task performance outweighed
its usefulness. Instead, server side (pass through) logging software was used, in which
each transmitted command was logged.
During one of the experiments, WiFi connectivity (supplied by the university) was lost
due to a minor outage. Although this didn‟t directly impact the system which resumed
after the outage, task completion time (a measurable result) was affected and these results
were removed.
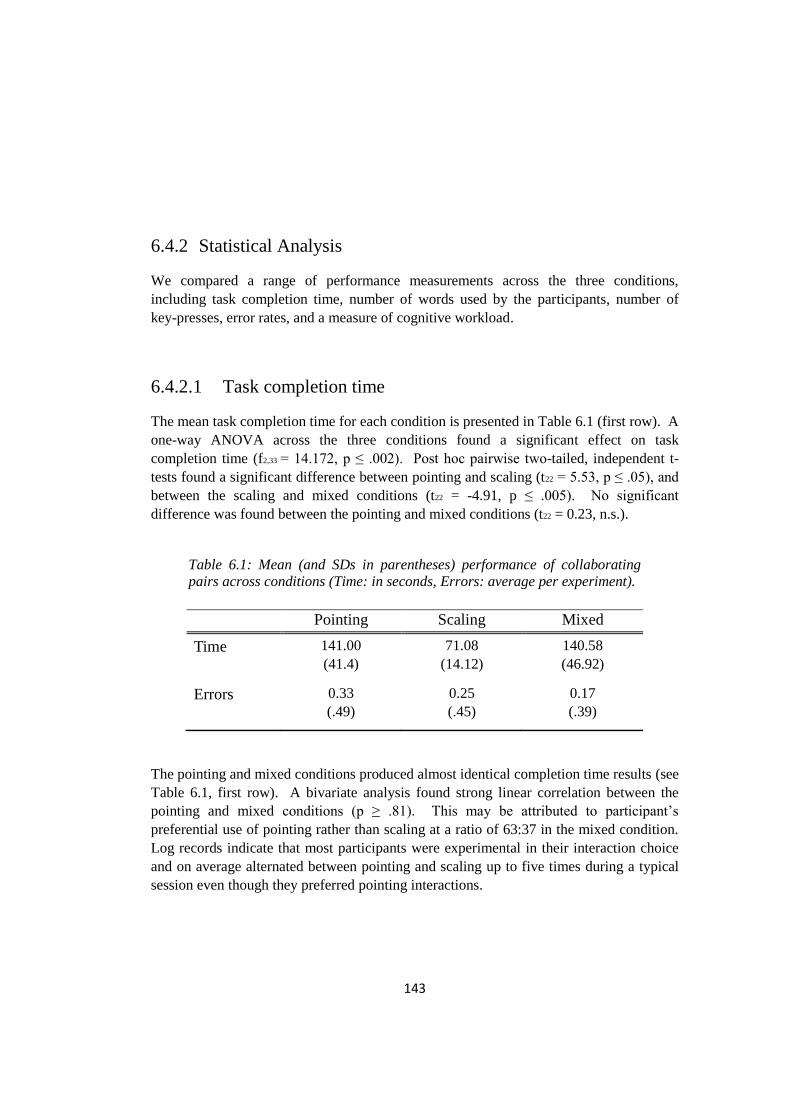
143
6.4.2 Statistical Analysis
We compared a range of performance measurements across the three conditions,
including task completion time, number of words used by the participants, number of
key-presses, error rates, and a measure of cognitive workload.
6.4.2.1 Task completion time
The mean task completion time for each condition is presented in Table 6.1 (first row). A
one-way ANOVA across the three conditions found a significant effect on task
completion time (f2,33 = 14.172, p ≤ .002). Post hoc pairwise two-tailed, independent t-
tests found a significant difference between pointing and scaling (t22 = 5.53, p ≤ .05), and
between the scaling and mixed conditions (t22 = -4.91, p ≤ .005). No significant
difference was found between the pointing and mixed conditions (t22 = 0.23, n.s.).
Table 6.1: Mean (and SDs in parentheses) performance of collaborating
pairs across conditions (Time: in seconds, Errors: average per experiment).
Pointing Scaling Mixed
Time 141.00
(41.4)
71.08
(14.12)
140.58
(46.92)
Errors 0.33
(.49)
0.25
(.45)
0.17
(.39)
The pointing and mixed conditions produced almost identical completion time results (see
Table 6.1, first row). A bivariate analysis found strong linear correlation between the
pointing and mixed conditions (p ≥ .81). This may be attributed to participant‟s
preferential use of pointing rather than scaling at a ratio of 63:37 in the mixed condition.
Log records indicate that most participants were experimental in their interaction choice
and on average alternated between pointing and scaling up to five times during a typical
session even though they preferred pointing interactions.

144
Figure 6.10: Mean task completion time, in seconds across conditions.
Results for task completion time indicate that the scaling only condition (see Figure 6.10)
enabled participants to complete the task in approximately half the time of the pointing
and mixed conditions.
6.4.2.2 Error Rates
We performed post-trial analyses of error rates (Table 6.1, bottom row). Error rates are a
representation of the number of incorrectly connected nodes from each “connect the dots”
puzzle task. A one-way ANOVA across the three conditions found no significant effect
on the number of errors made across conditions (f2,33 = .41, n.s.).
Figure 6.11: Mean number of error rates across conditions.

145
Although the error rates suggest that a mixed condition could lead to 50% reduction (see
Figure 6.11) in error rates compared to the pointing only condition, no significant
difference was found, perhaps due to the overall low error count.
6.4.2.3 Conversation Analysis
The number of words used by the participants was taken as a measure of task workload.
Transcripts were created from video recordings of the experimental trials and the total
number of words used by each Helper/Worker pair was calculated for each session (see
Figure 6.12). The mean number of words used by the pairs in each condition is presented
in Table 6.2.
Figure 6.12: Mean number of words spoken across conditions.
Table 6.2: Mean (and SDs in parentheses) performance of collaborating
pairs across conditions (Words: number of words).
Pointing Scaling Mixed
Words 208.08
(61.87)
154.58
(38.27)
200.58
(39.16)
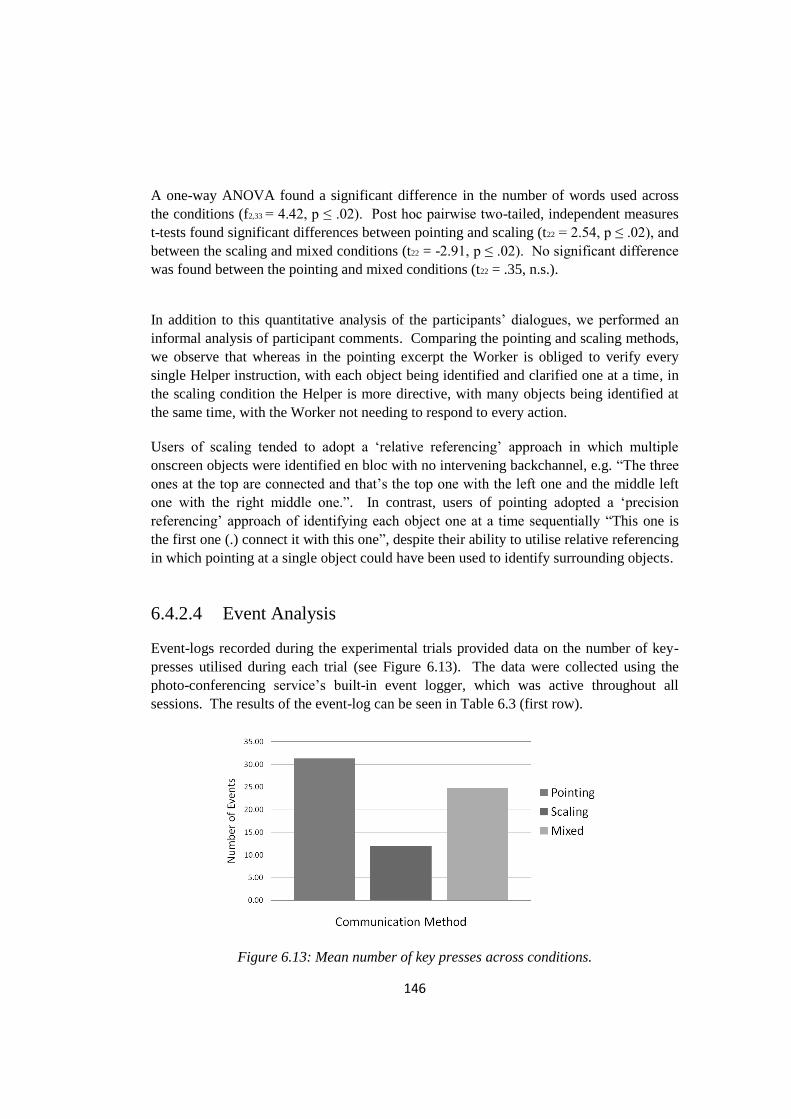
146
A one-way ANOVA found a significant difference in the number of words used across
the conditions (f2,33 = 4.42, p ≤ .02). Post hoc pairwise two-tailed, independent measures
t-tests found significant differences between pointing and scaling (t22 = 2.54, p ≤ .02), and
between the scaling and mixed conditions (t22 = -2.91, p ≤ .02). No significant difference
was found between the pointing and mixed conditions (t22 = .35, n.s.).
In addition to this quantitative analysis of the participants‟ dialogues, we performed an
informal analysis of participant comments. Comparing the pointing and scaling methods,
we observe that whereas in the pointing excerpt the Worker is obliged to verify every
single Helper instruction, with each object being identified and clarified one at a time, in
the scaling condition the Helper is more directive, with many objects being identified at
the same time, with the Worker not needing to respond to every action.
Users of scaling tended to adopt a „relative referencing‟ approach in which multiple
onscreen objects were identified en bloc with no intervening backchannel, e.g. “The three
ones at the top are connected and that‟s the top one with the left one and the middle left
one with the right middle one.”. In contrast, users of pointing adopted a „precision
referencing‟ approach of identifying each object one at a time sequentially “This one is
the first one (.) connect it with this one”, despite their ability to utilise relative referencing
in which pointing at a single object could have been used to identify surrounding objects.
6.4.2.4 Event Analysis
Event-logs recorded during the experimental trials provided data on the number of key-
presses utilised during each trial (see Figure 6.13). The data were collected using the
photo-conferencing service‟s built-in event logger, which was active throughout all
sessions. The results of the event-log can be seen in Table 6.3 (first row).
Figure 6.13: Mean number of key presses across conditions.

147
A one-way ANOVA across the three conditions found a significant effect on the number
of key-presses required to complete the task (f2,33 = 14.44, p ≤ .002). Post hoc pairwise
two-tailed, independent measures t-tests found a significant difference between pointing
and scaling (t22 = 5.73, p ≤ .002), and between the scaling and mixed conditions (t22 = -
3.85, p ≤ .001). No significant difference was found between the pointing and mixed
conditions (t22 = 1.55, n.s.).
Table 6.3: Mean (and SDs in parentheses) performance of collaborating
pairs across conditions (Events: number of key presses, Workload: NASA
TLX).
Pointing Scaling Mixed
Events 31.33
(10.47)
12.00
(5.15)
24.75
(10.23)
6.4.2.5 Workload Analysis
Post-trial analyses of mental workload were performed by administering the NASA TLX
using both sections of the assessment, the sub-group scales and the paired comparisons
section. This weighted measure gave a score out of 20 (see Table 6.4, Figure 6.14), with
20 representing the highest possible level of mental workload. For completeness [Byers
et al. 1989] unweighted measures are also presented; see Figure 6.15.
A one-way ANOVA across the three conditions for each sub-scale found a significant
effect on temporal demand (f2,33 = 7.45, p ≤ .002), with no significant effect on mental
demand (f2,33 = 2.51, n.s.), physical demand (f2,33 = .85, n.s.), performance (f2,33 = 1.32,
n.s.), effort (f2,33 = .29, n.s.) or frustration (f2,33 = 2.41, n.s.). Post hoc pairwise two-
tailed, independent measures t-tests found a significant difference in temporal demand
between pointing and scaling (t22 = -34.9, p ≤ .005), and between scaling and mixed (t22 =
3.94, p ≤ .005). No significant difference was found between the pointing and mixed
conditions (t22 = -.68, n.s.).
These results indicate a higher perceived temporal demand for scaling in comparison to
pointing, contradicting to some extent our findings on task completion times (see Table
6.1, first row).

148
Figure 6.14. Workload: Mean weighted (NASA TLX both sections)
mental workload sub-scales across conditions.
Table 6.4: Workload: Mean weighted (NASA TLX both sections) mental
workload sub-scales across conditions: Pointing, Scaling and Mixed. SDs in
parentheses.
Pointing Scaling Mixed
Mental demand 4.19
(1.55)
3.68
(2.76)
2.36
(2.09)
Physical demand 0.48
(.57)
0.06
(.03)
0.00
(.)
Temporal demand 2.08
(1.32)
4.63
(1.09)
3.38
(1.85)
Performance
2.07
(1.72)
2.22
(.93)
1.51
(.3)
Effort
2.91
(1.94)
2.37
(1.56)
2.05
(1.75)
Frustration
2.19
(1.91)
1.80
(1.18)
2.46
(1.65)

149
Figure 6.15. Workload: Mean unweighted (NASA TLX first
section only) mental workload sub-scales.
Figure 6.16. Scaling (left), Pointing (right) Helper/Worker un-weighted
mental workload sub-scales comparison.
Further analysis of participant workload compared helper/worker pairs in the scaling and
pointing condition (see Figure 6.16, 6.17). Differences indicate that the higher temporal
demand was perceived primarily by the helper. A post hoc pairwise two-tailed, repeated
measures t-test found significant difference in temporal demand (t24 = 9.17, p ≤ .002) and
performance (t24 = -2.6, p ≤ .05), in the scaling only condition.

150
The results also indicate the contradiction between helper/worker pairs in the scaling only
condition, by which helpers in the scaling only condition perceived a negative impact:
higher temporal demand and reduced performance (see Figure 6.18). However, the
accompanying workers perceived a positive impact: significantly lower temporal demand
(see Figure 6.18 Temporal demand) and improved performance (see Figure 6.18
Performance) in the same task. This is in contrast to the pointing only condition in which
helper/worker pairs shared similar perceptions of task performance (see Figure 6.17
Performance).
From the results in the pointing only and mixed conditions we can observe on average,
both helper and workers pairs perceived similar workloads (see Figure 6.17, 6.19).
However, in the scaling only condition helper and workers pairs have more varying
perceptions (see Figure 6.18).
Finally, a finding consistent across all conditions is that the helper always perceived a
higher temporal demand than the worker, which may be attributed to the nature of the
task in which the helper is responsible for guiding the actions of the worker to ensure the
task is completed as quickly as possible.
Figure 6.17. Workload: Mean „Pointing‟ unweighted Helper/
Worker workload sub-scales comparison.

151
Figure 6.18. Workload: Mean „Scaling‟ unweighted Helper/
Worker workload sub-scales comparison.
Figure 6.19. Workload: Mean „Mixed‟ unweighted Helper/
Worker workload sub-scales comparison.
6.4.3 Subjective Feedback
Participants‟ qualitative feedback was collected through a 6-point Likert scale gauging
mobile phone experience (based on number of phone calls they make, use of the camera
phone facilities, text messaging and multimedia messaging services during a typical day)
and a questionnaire on the condition they had just used, see Appendix D.8-D.9.
An interesting finding with respect to the logged data was found in the scaling only
feedback. When asked “what feature if added would enhance the collaborative
152
performance?”, many participants indicated their desire for a cursor as a precision
pointing mechanism in addition to the scaling mechanism provided.
6.4.4 Discussion
The scaling only condition enabled participants to complete the task in almost half the
time of the pointing only and the mixed conditions. This finding suggests that the use of
scaling can accelerate the process of achieving conversational grounding [Clark and
Wilkes-Gibbs 1986] in this kind of mobile collaborative setting. According to the
principle of least collaborative effort [Clark and Wilkes-Gibbs 1986], people should try to
ground with as little combined effort as possible and change their communicative
strategies based on certain costs of the communication medium [Clark and Brennan
1991].
With scaling only we observed a reduction in combined frustration taking place (Table
6.5, sixth row). These results are corroborated by findings in the event analysis that show
far fewer interaction events are required when using scaling in comparison to the pointing
and mixed conditions (Table 6.4).
However, a side effect of scaling only can be seen in the subscale comparison of mental
workload, in which a much higher temporal demand (Table 6.5, third row) indicated that
participants perceived that faster results could have been possible, despite completing the
task in almost half the time of the pointing only and mixed conditions (Table 6.1, first
row). This contradiction between user‟s perception and measured results highlights the
importance in studies of this nature of collecting both quantitative and qualitative
feedback to completely understand the user‟s experience.
Additionally in their post-trial feedback, users in the scaling only condition – where no
pointer was present – explicitly requested a pointing “cursor” as a means to simplify
performance of the task. The high proportion of pointing used in comparison to scaling
(63:37) in the mixed condition supports the suggestion that, given a choice of pointing or
scaling, users prefer pointing.
Our informal analysis indicates that the relative referencing afforded by the scaling
method can better support remote mobile media exchange, accelerating grounding and
supporting the principle of least collaborative effort. Although participants preferred the
precision referencing afforded by a pointer, the combination of relative referencing with
precision referencing in the „mixed‟ condition did little to enhance performance, faring
only slightly better than the pointing only condition and much worse than the scaling only
condition (see Table 6.1).

153
Though the users‟ expressed desire for precision pointing may be attributable simply to
first time use of the system after long experience with pointer-based interfaces, or its
similarity to the real world physical interaction of pointing with one‟s finger that is also
observed in studies of remote virtual interactions [Robertson 2000], it does highlight the
need to take into account familiar input mechanisms when designing for usability of
remote mobile interactions.
Finally, the initial hypothesis [H1] was not supported, as the mixed condition did not
offer the best of both worlds as we had predicted, but saw most users going with their
preference for pointing, contributing to the strong correlation between the mixed and
pointing results.
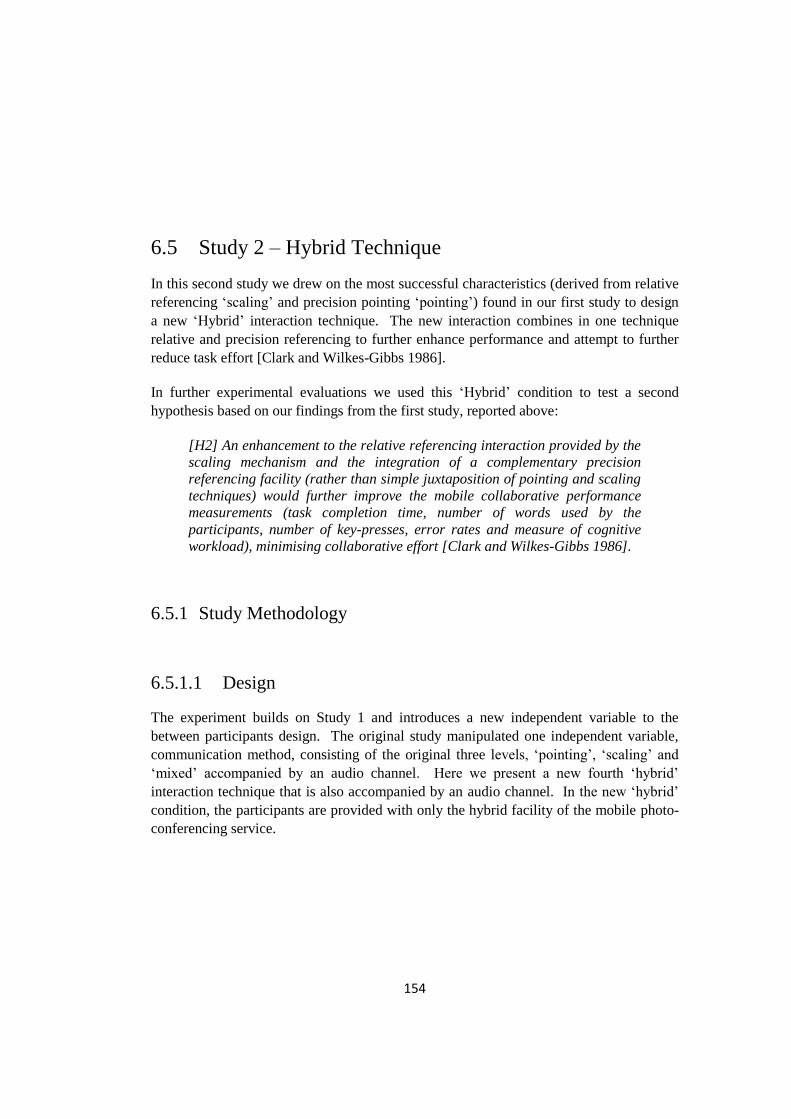
154
6.5 Study 2 – Hybrid Technique
In this second study we drew on the most successful characteristics (derived from relative
referencing „scaling‟ and precision pointing „pointing‟) found in our first study to design
a new „Hybrid‟ interaction technique. The new interaction combines in one technique
relative and precision referencing to further enhance performance and attempt to further
reduce task effort [Clark and Wilkes-Gibbs 1986].
In further experimental evaluations we used this „Hybrid‟ condition to test a second
hypothesis based on our findings from the first study, reported above:
[H2] An enhancement to the relative referencing interaction provided by the
scaling mechanism and the integration of a complementary precision
referencing facility (rather than simple juxtaposition of pointing and scaling
techniques) would further improve the mobile collaborative performance
measurements (task completion time, number of words used by the
participants, number of key-presses, error rates and measure of cognitive
workload), minimising collaborative effort [Clark and Wilkes-Gibbs 1986].
6.5.1 Study Methodology
6.5.1.1 Design
The experiment builds on Study 1 and introduces a new independent variable to the
between participants design. The original study manipulated one independent variable,
communication method, consisting of the original three levels, „pointing‟, „scaling‟ and
„mixed‟ accompanied by an audio channel. Here we present a new fourth „hybrid‟
interaction technique that is also accompanied by an audio channel. In the new „hybrid‟
condition, the participants are provided with only the hybrid facility of the mobile photo-
conferencing service.

155
6.5.1.2 Hybrid Interaction Technique
A new interface was constructed for the hybrid condition (see Figures 6.22 and 6.23ca-
cb) that was motivated by our earlier findings and informal participant comments. The
new interface combines the characteristics of relative and precision referencing to form a
new coherent design that attempts to further reduce task workload.
The „hybrid‟ design incorporates H2 through a grid layout that divides up the screen
space with semi-transparent visible segmentation (grid lines), providing a co-ordinate
reference scheme (regions 1-9) and the ability to scale through selection to further
enhance relative referencing and instantly reduce the available search space, similar to the
scaling condition‟s facility to drill down to a specific view. Precision referencing was
also integrated through the use of a pointing mechanism, consisting of a semi-transparent
red-highlight selection area (see Figures 6.22 and 6.23ca-cb). This pointer is locked to
the relative referencing grid, indicating areas of immediate focus and also enabling
relative referencing of surrounding areas.
Figure 6.20. Picture which does not use the rule of third (left),
Picture that use the rule of thirds (right).
Figure 6.21. Scene framing and alignment grid, a common
feature on most digital cameras.
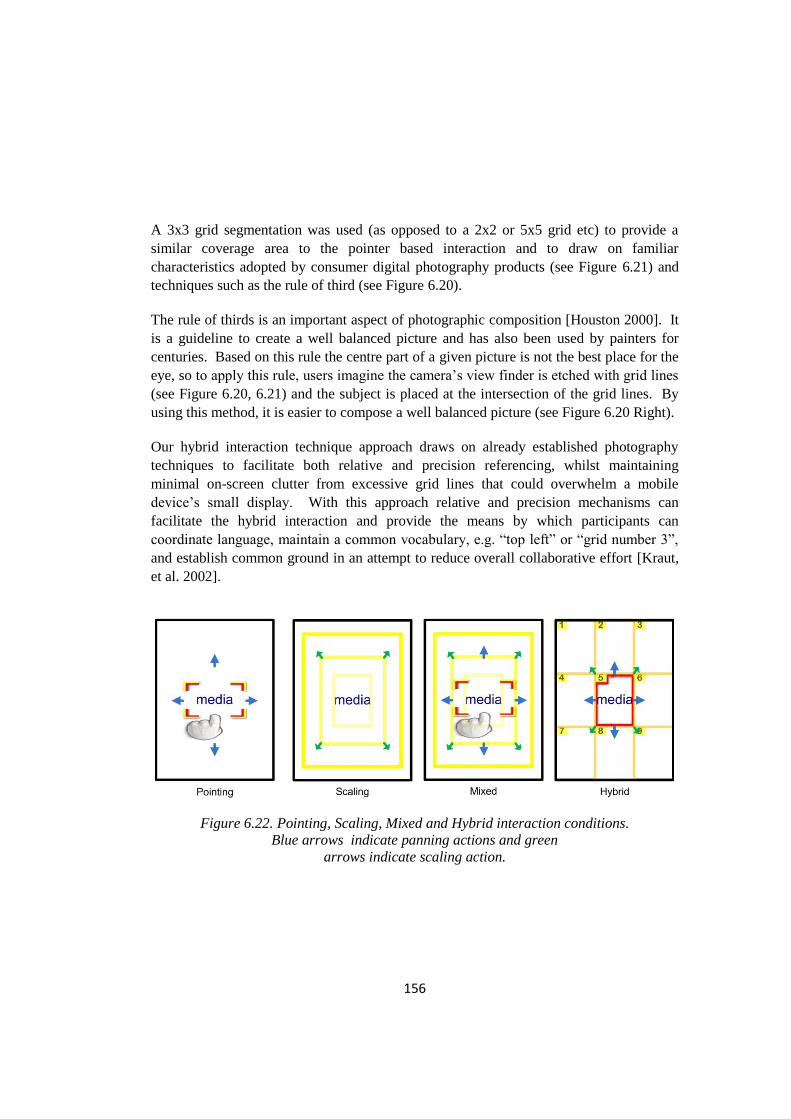
156
A 3x3 grid segmentation was used (as opposed to a 2x2 or 5x5 grid etc) to provide a
similar coverage area to the pointer based interaction and to draw on familiar
characteristics adopted by consumer digital photography products (see Figure 6.21) and
techniques such as the rule of third (see Figure 6.20).
The rule of thirds is an important aspect of photographic composition [Houston 2000]. It
is a guideline to create a well balanced picture and has also been used by painters for
centuries. Based on this rule the centre part of a given picture is not the best place for the
eye, so to apply this rule, users imagine the camera‟s view finder is etched with grid lines
(see Figure 6.20, 6.21) and the subject is placed at the intersection of the grid lines. By
using this method, it is easier to compose a well balanced picture (see Figure 6.20 Right).
Our hybrid interaction technique approach draws on already established photography
techniques to facilitate both relative and precision referencing, whilst maintaining
minimal on-screen clutter from excessive grid lines that could overwhelm a mobile
device‟s small display. With this approach relative and precision mechanisms can
facilitate the hybrid interaction and provide the means by which participants can
coordinate language, maintain a common vocabulary, e.g. “top left” or “grid number 3”,
and establish common ground in an attempt to reduce overall collaborative effort [Kraut,
et al. 2002].
Figure 6.22. Pointing, Scaling, Mixed and Hybrid interaction conditions.
Blue arrows indicate panning actions and green
arrows indicate scaling action.
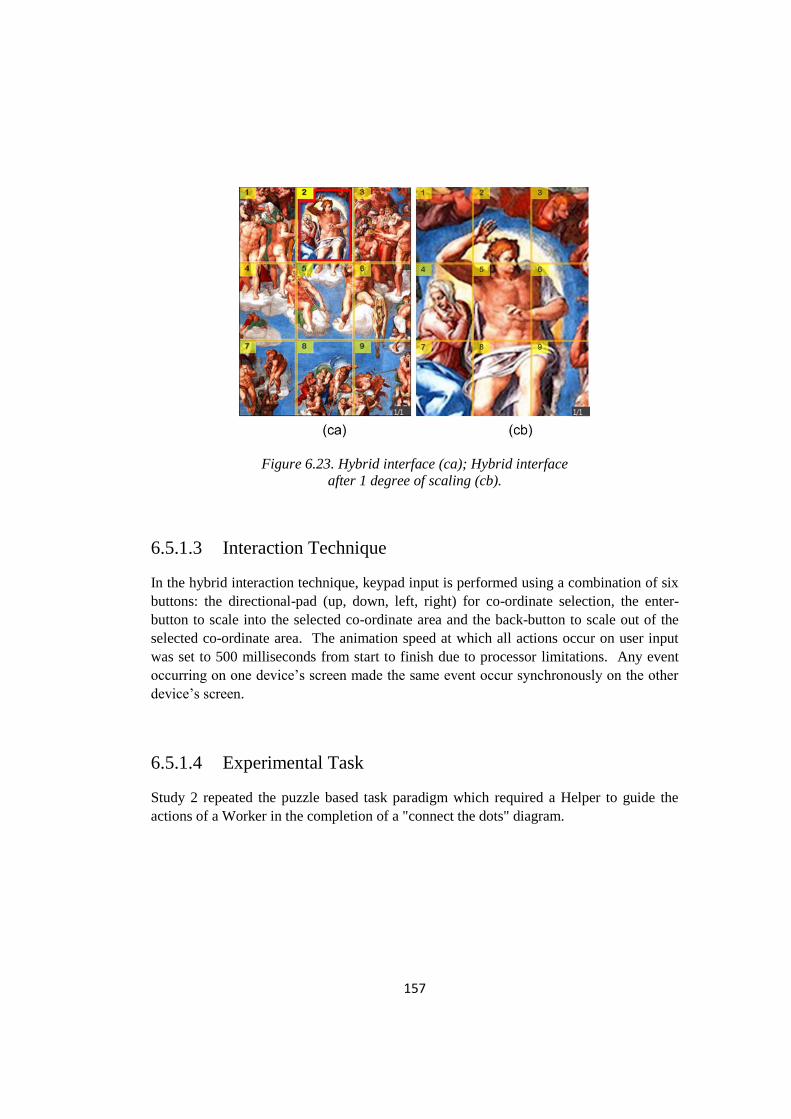
157
Figure 6.23. Hybrid interface (ca); Hybrid interface
after 1 degree of scaling (cb).
6.5.1.3 Interaction Technique
In the hybrid interaction technique, keypad input is performed using a combination of six
buttons: the directional-pad (up, down, left, right) for co-ordinate selection, the enter-
button to scale into the selected co-ordinate area and the back-button to scale out of the
selected co-ordinate area. The animation speed at which all actions occur on user input
was set to 500 milliseconds from start to finish due to processor limitations. Any event
occurring on one device‟s screen made the same event occur synchronously on the other
device‟s screen.
6.5.1.4 Experimental Task
Study 2 repeated the puzzle based task paradigm which required a Helper to guide the
actions of a Worker in the completion of a "connect the dots" diagram.

158
Figure 6.24. Experiment setup/participants, Helpers on
the left and Workers on the right.
6.5.1.5 Procedure
Participants were divided into random pairs, 8 pairs in total. Each pair was guided
separately into the usability lab (see figure 6.24). Prior to the study, the participants were
each provided with a copy of the consent form to sign and filled out a background
questionnaire. Any queries relating to the form were answered at this stage. If it was
established that participants had never met before, participants were introduced to one
another.
Participants were then provided with a copy of the task instructions and asked to read
through the instructions as a pair to ensure they were well understood (see Appendix
D.1). The experimenter then proceeded to read aloud the instructions.
The study repeated the puzzle based task paradigm which required a Helper to guide the
actions of a Worker in the completion of a "connect the dots" diagram. The procedure

159
was identical to that of the previous study but participants were provided with only the
hybrid interaction technique (see Figures 6.23 and 6.22ca-cb).
6.5.1.6 Participants
We ran a group of 16 participants (8 pairs, not used in Study 1), again recruited from
undergraduate and postgraduate students at the University of Bath. The average age of
participants was 25, four participants were female, and all participants were well versed
in the use of mobile devices with an average of over four years‟ mobile phone use.
6.5.1.7 Apparatus
The apparatus was identical to the first study and the same mobile devices and study
setup were used to enable direct comparison. In this hybrid interaction technique
condition, keypad input is performed using a combination of six buttons: the directional-
pad (up, down, left, right) for co-ordinate selection, the enter-button to scale into the
viewable co-ordinate area and the back-button to scale out of the viewable co-ordinate
area. Any event occurring on one device‟s screen made the same event occur
synchronously on the other device‟s screen.
We recorded a range of performance measurements, including task completion time,
number of words used by the participants, number of key-presses, error rates, and a
measure of cognitive workload.
6.5.1.8 Materials
Both participants were each provided with a copy of the instruction sheet that was read
out prior to commencing the experiment on a single side of A4 (see Appendix D.1) and
provided on participants desks for further reference. An additional copy was also used by
the experimenter. The Helper was also provided with a copy of the final puzzle diagram
to create expert status and a mobile key-pad reference diagram (see Appendix D.4 and
Figure 6.1.5) to provide a quick reference and reminder to the input keys used for the
hybrid experiment. The worker was provided with a copy of the unfinished puzzle
diagram (see Appendix D.3) and a pen to draw the relevant diagram.
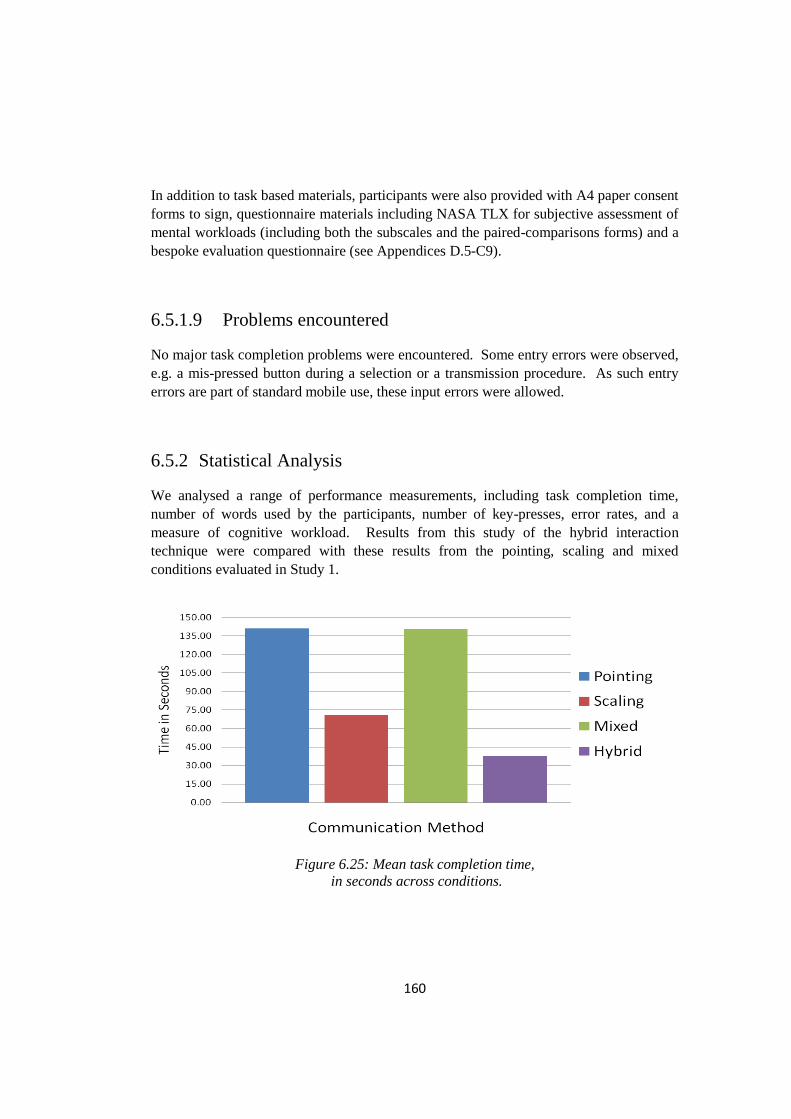
160
In addition to task based materials, participants were also provided with A4 paper consent
forms to sign, questionnaire materials including NASA TLX for subjective assessment of
mental workloads (including both the subscales and the paired-comparisons forms) and a
bespoke evaluation questionnaire (see Appendices D.5-C9).
6.5.1.9 Problems encountered
No major task completion problems were encountered. Some entry errors were observed,
e.g. a mis-pressed button during a selection or a transmission procedure. As such entry
errors are part of standard mobile use, these input errors were allowed.
6.5.2 Statistical Analysis
We analysed a range of performance measurements, including task completion time,
number of words used by the participants, number of key-presses, error rates, and a
measure of cognitive workload. Results from this study of the hybrid interaction
technique were compared with these results from the pointing, scaling and mixed
conditions evaluated in Study 1.
Figure 6.25: Mean task completion time,
in seconds across conditions.

161
6.5.2.1 Task completion time
We performed the same analysis as in our first study, accounting for the lower number of
participants (harmonic mean statistical methods provides by the SPSS v16 statistical
package) in the new, fourth condition provided by the hybrid interaction technique. Table
6.6 (first row, fourth column) shows the timing results. A one-way ANOVA across the
hybrid and the previous three conditions (pointing, scaling, mixed) found a significant
effect on task completion time (f3,40 = 18.31, p ≤ .002). Mean comparison (see Table 6.5:
top row) suggested that the hybrid was almost twice as fast as the scaling only condition,
with post hoc pairwise two-tailed, independent t-tests indicating a significant difference
between hybrid and scaling (t18 = 2.46, p ≤ .05).
These results indicate that in terms of completion time, an integrated combination of
relative referencing and precision referencing can lead to improved measurements
compared to pointing only (see Figure 6.25), the simple offering of both pointing and
scaling in the mixed condition, and to the previously best performing scaling only
condition.
Table 6.5: Mean (and SDs in parentheses) performance of collaborating
pairs across conditions (Time: in seconds, Errors: average per experiment).
Pointing Scaling Mixed Hybrid
Time 141.00
(41.4)
71.08
(14.12)
140.58
(46.92)
37.58
(11.26)
Errors 0.33
(.49)
0.25
(.45)
0.17
(.39)
0
(0)
6.5.2.2 Error Rates
Error rates were calculated based on the same kind of analysis as in study 1. There were
no errors in the hybrid condition (see Table 6.5, second row, forth column). A one-way
ANOVA across the hybrid and three previous conditions found no significant effect on
the number of errors made (f3,40 = 1.16, n.s.), probably due to the overall low error rates
(see Figure 6.26).
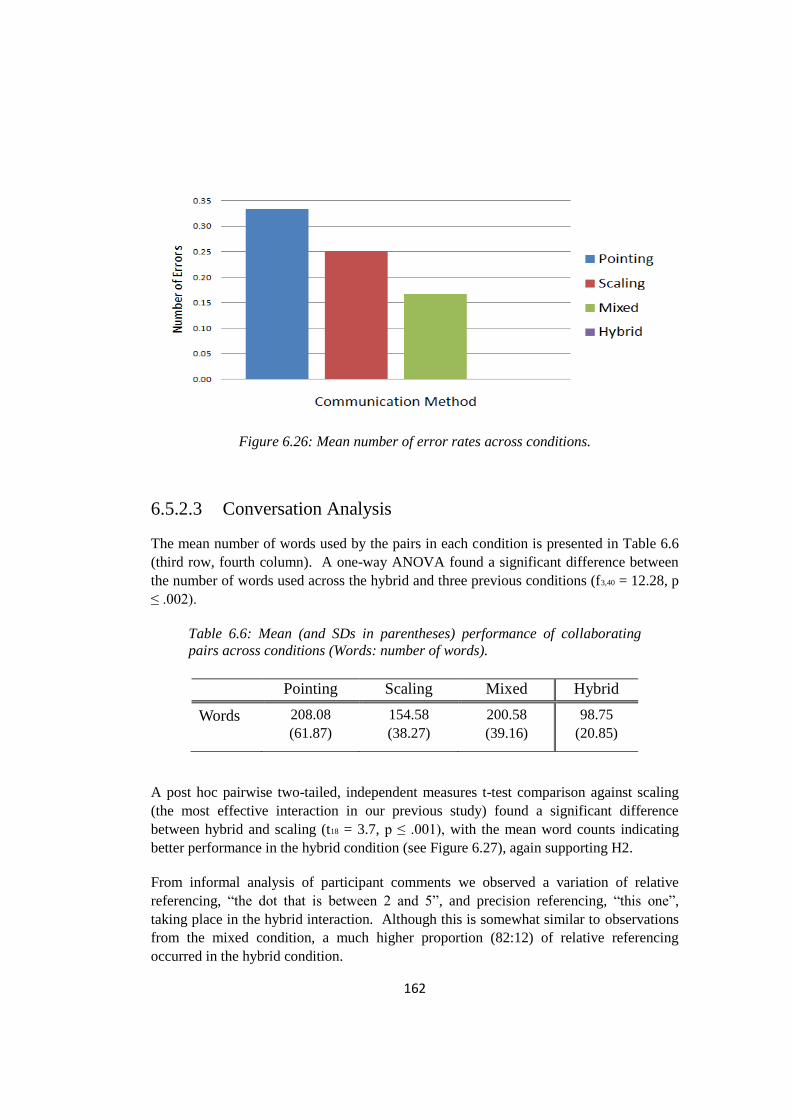
162
Figure 6.26: Mean number of error rates across conditions.
6.5.2.3 Conversation Analysis
The mean number of words used by the pairs in each condition is presented in Table 6.6
(third row, fourth column). A one-way ANOVA found a significant difference between
the number of words used across the hybrid and three previous conditions (f3,40 = 12.28, p
≤ .002).
Table 6.6: Mean (and SDs in parentheses) performance of collaborating
pairs across conditions (Words: number of words).
Pointing Scaling Mixed Hybrid
Words 208.08
(61.87)
154.58
(38.27)
200.58
(39.16)
98.75
(20.85)
A post hoc pairwise two-tailed, independent measures t-test comparison against scaling
(the most effective interaction in our previous study) found a significant difference
between hybrid and scaling (t18 = 3.7, p ≤ .001), with the mean word counts indicating
better performance in the hybrid condition (see Figure 6.27), again supporting H2.
From informal analysis of participant comments we observed a variation of relative
referencing, “the dot that is between 2 and 5”, and precision referencing, “this one”,
taking place in the hybrid interaction. Although this is somewhat similar to observations
from the mixed condition, a much higher proportion (82:12) of relative referencing
occurred in the hybrid condition.

163
Figure 6.27: Mean number of words spoken across conditions.
6.5.2.4 Event Analysis
Event logs were recorded in the same manner as study 1 and can be seen in Table 6.7. A
one-way ANOVA across the four conditions found a significant effect on the number of
key-presses required to complete the task (f3,40 = 20.22, p ≤ .002). Post hoc pairwise two-
tailed independent measures t-tests found a significant difference in the number of key-
press events in the hybrid condition compared to the scaling only condition (t18 = 3.1, p ≤
.006), with the mean scores indicating better performance in the hybrid condition, again
supporting H2.
The results also suggested a significant reduction in key-presses in the hybrid condition
compared to the mixed condition (see Figure 6.28) in which pointing was chosen over
scaling by a ratio of 63:37.
Table 6.7: Mean (and SDs in parentheses) performance of collaborating
pairs across conditions (Events: number of key presses).
Pointing Scaling Mixed Hybrid
Events 31.33
(10.47)
12.00
(5.15)
24.75
(10.23)
6.00
(3.42)
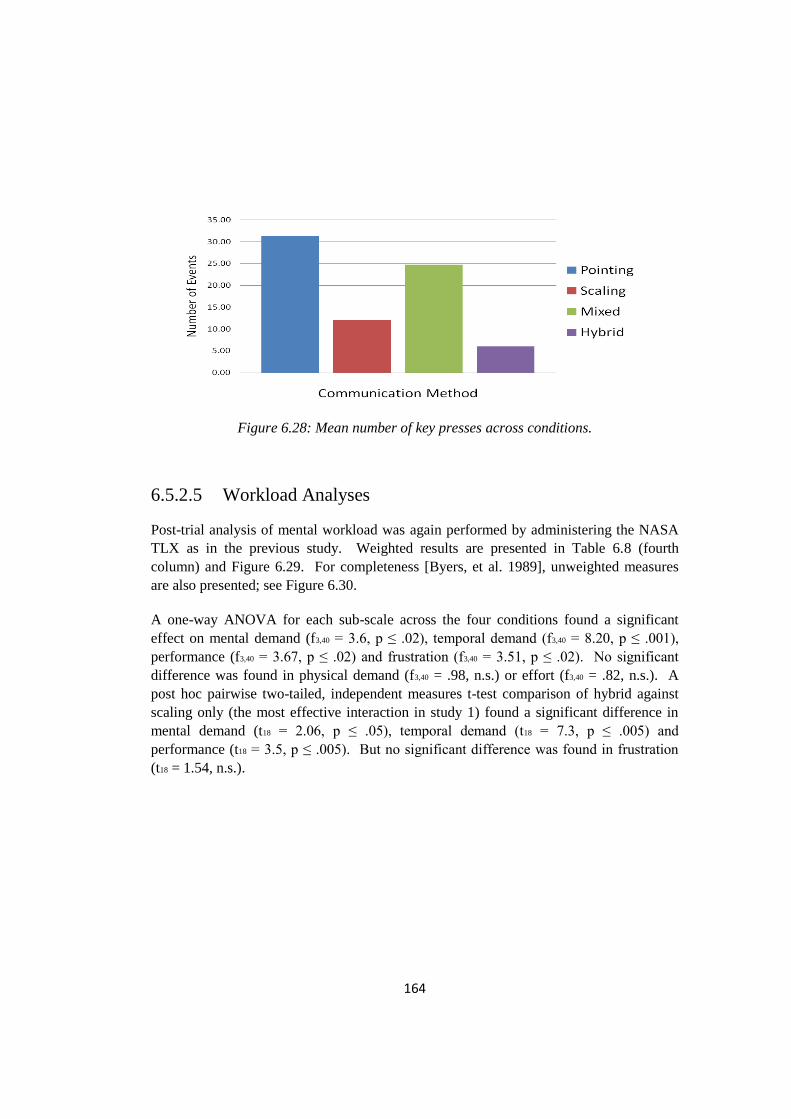
164
Figure 6.28: Mean number of key presses across conditions.
6.5.2.5 Workload Analyses
Post-trial analysis of mental workload was again performed by administering the NASA
TLX as in the previous study. Weighted results are presented in Table 6.8 (fourth
column) and Figure 6.29. For completeness [Byers, et al. 1989], unweighted measures
are also presented; see Figure 6.30.
A one-way ANOVA for each sub-scale across the four conditions found a significant
effect on mental demand (f3,40 = 3.6, p ≤ .02), temporal demand (f3,40 = 8.20, p ≤ .001),
performance (f3,40 = 3.67, p ≤ .02) and frustration (f3,40 = 3.51, p ≤ .02). No significant
difference was found in physical demand (f3,40 = .98, n.s.) or effort (f3,40 = .82, n.s.). A
post hoc pairwise two-tailed, independent measures t-test comparison of hybrid against
scaling only (the most effective interaction in study 1) found a significant difference in
mental demand (t18 = 2.06, p ≤ .05), temporal demand (t18 = 7.3, p ≤ .005) and
performance (t18 = 3.5, p ≤ .005). But no significant difference was found in frustration
(t18 = 1.54, n.s.).

165
Figure 6.29. Workload: Mean weighted (NASA TLX both sections)
mental workload sub-scales across communication conditions:
Pointing, Scaling, Mixed and Hybrid.
Table 6.8: Workload: Mean weighted (NASA TLX both sections) mental
workload sub-scales across conditions: Pointing, Scaling and Mixed. SDs in
parentheses.
Pointing Scaling Mixed Hybrid
Mental demand 4.19
(1.55)
3.68
(2.76)
2.36
(2.09)
1.25
(1.62)
Physical demand 0.48
(.57)
0.06
(.03)
0.00
(.)
0.25
(.39)
Temporal demand 2.08
(1.32)
4.63
(1.09)
3.38
(1.85)
1.37
(1.36)
Performance
2.07
(1.72)
2.22
(.93)
1.51
(.3)
0.51
(.54)
Effort
2.91
(1.94)
2.37
(1.56)
2.05
(1.75)
0.99
(.91)
Frustration
2.19
(1.91)
1.80
(1.18)
2.46
(1.65)
0.58
(.5)

166
Figure 6.30. Workload: Mean unweighted (NASA TLX first section
only) mental workload sub-scales across communication
conditions: Pointing, Scaling, Mixed and Hybrid.
Figure 6.31. Workload: Mean „hybrid‟ unweighted Helper/
Worker workload sub-scales comparison.
167
In comparison to the findings from Study 1, in which the actual and perceived
performances of the scaling only condition differed (fastest in Study 1, see Figure 6.18),
we can observe that the hybrid condition on average, both helper and workers pairs
perceived similar workloads (see Figure 6.31). Additionally, a finding consistent across
all conditions in the previous study and also in the hybrid condition is that the helper
always perceives a higher temporal demand than the worker. This may be attributed to
the nature of the task in which the helper is responsible for guiding the actions of the
worker to ensure the task is completed as quickly as possible.
6.5.3 Subjective Feedback
Qualitative feedback was collected in an identical method to Study 1, see Appendix D.8-
D.9. When asked “what feature if added would enhance the collaborative performance?”
no common response was provided, with most participants indicating positive satisfaction
with the hybrid interaction condition.
6.5.4 Discussion
Although our initial hypothesis (H1) reflected an assumption that more is better, i.e.
providing both scaling and pointing interaction techniques would enhance usability, the
actual effects have proved more subtle. Offering the two together in the first study
certainly wasn‟t more useful than providing one or the other alone. However, the new
hybrid interaction technique that we developed to offer an integration of the best features
of each technique led to significant gains, as predicted in H2.
The „Hybrid‟ results showed a significant reduction, compared to the scaling only,
pointing only and mixed conditions, in users‟ overall collaborative effort [Clark and
Brennan 1991] as measured by task completion times, conversation, event and workload
required to complete the shared task.
The hybrid condition saw an increase in the ratio of relative referencing (of surrounding
items) to precision referencing (pointing with an area box) compared to our findings for
the mixed condition, corroborating earlier findings from the scaling only condition in
which an increased use of relative referencing saw a significant reduction in the amount
of backchannel that took place and accelerated the process of conversational grounding,
with the nonverbal communication interactions helping to provide the context for the
spoken communication [Tan 1992]. An observation relating to the low error rates across
conditions (cf. Table 6.6) suggests that when the probability of referential ambiguity is
168
high, additional costs such as time, number of words spoken or alternative techniques are
used to reduce the ambiguity.
The hybrid condition also enhanced users‟ perception of workload, providing participants
with a more realistic perception of task completion time (low temporal demand), and
performance perceptions (see Figure 6.31 Performance) that were more in line with actual
measured performance results. This is in contrast to our findings from the scaling only
condition in which perceived (subjective) and actual performance results contradicted
each other.
6.6 Study 3 – Field-Based Observations
Experiments by their very nature are tightly constrained in order to evaluate specific
attributes of an environment or interaction technique and have varying ecological
validity. Field-based or observational studies are a useful complement to the more
straitened studies of the kind reported in the preceding sections of this chapter.
To better understand the issues associated with the mobile media exchange we performed
field-based observations and interviews. The aim of these field-based observations was
to capture rich contextual information regarding the use of mobile media exchange
environments to further gauge end user feedback, reactions and criticisms of such MEA
services in a more natural (non-lab based) setting. The field-based observation presented
the MEA photo-conferencing instantiation to a broader audience, removing previous lab
based constraints and allowing users to explore all aspects of the system. The MEA
photo-conferencing service was deployed in an active conference environment in which
real world constraints such as network load, packet loss, user preferences etc directly
affected user‟s experience with and perceptions of the mobile services.
6.6.1 Study Methodology
6.6.1.1 Design
The field-based study involved groups of 2 to 3 participants who were recruited during
the special demo reception at the ACM 2008 Conference on Computer Supported
Cooperative Work. Each group was in the same vicinity (verbally collocated) and
provided with devices to interact and share images using the MEA photo-conferencing
service. Data collection was performed through direct observation and activity (server

169
based pass through) logs. These were conducted at a group and individual participant
level.
6.6.1.2 Interaction Techniques
Participants were provided with the four previously reported interaction techniques,
pointing, scaling, mixed and hybrid conditions, and with a further two interactions: the
ability to capture and share new or existing images on the device and the ability to switch
between shared images (see Figure 5.15, 5.10 and 5.11). All interactions were designed
to be controlled independently on each device (i.e. synchronously by any participant
across all devices) using dedicated hardware buttons on the mobile keypad. The keypad
layout was modified (see Figure 6.32) to accommodate the additional interactions, using a
combination of ten buttons comprising: the hash key, directional pad (up, down, left,
right, enter, back) and the number keys 1, 2 and 3.
The hash key was used to toggle between the different interaction modes.
Pointing: Indicated by the presence of a pointer on the screen.
Hybrid: Indicated by the presence of a grid layout on the screen.
Scaling: Indicated by no on-screen elements.
Mixed: The use of the toggle key enables the mixed condition by
allowing users to toggle freely between the Pointing and Scaling
interaction techniques.
The directional-pad (up, down, left, right, enter, back) was contextual, based on the type
of input mode selected:
Pointing: The direction pad moves the pointer so that it can be positioned
anywhere on the screen. The enter-key shrinks the pointer‟s selection area
and the back-key enlarges the selection area.
Scaling: The direction pad moves the active image so that it can be
positioned anywhere on the screen. The enter-key scales into the viewable
area and the back-key scales out of the viewable area.
Hybrid: The direction pad allows for co-ordinate selection. The enter-key
scales into the active co-ordinate area and the back-key scales out of the
selected co-ordinate area.

170
Figure 6.32: User interface input controls.

171
Figure 6.33. Image selection (top), capture (middle)
and collaborative distribution (bottom).
Participants were also able to switch between images in the shared session using the keys
1 and 3. The first navigates the user to the previous image in the thumbnail list and the
latter navigates to the next image in the thumbnail list (see Figure 6.33 Bottom and 5.11).
Also, multiple images could be added to the shared session (depicted by a thumbnail list)
through the use of the number 2-key. After which users are presented with a list of all
images (see Figure 6.32 top) and an option to select either an existing image from the

172
user‟s device or to use the built-in camera to capture a new image for sharing (see Figure
6.32 Middle and Bottom).
Similarly to the lab based studies, the animation speed at which all actions occur on user
input was set to 500 milliseconds from start to finish due to processor limitations, and any
event occurring on one device‟s screen made the same event occur synchronously on the
other device‟s screen.
6.6.1.3 Procedure
The study consisted of observations of participants interacting using the MEA photo-
conferencing service, followed by a questionnaire. Throughout the study, there were
three main categories for data collection: (1) An evaluation of the initial user experience;
(2) Engagement with the MEA Photo-conferencing service; (3) Participants‟ reactions to
the MEA service, particularly feedback and future directions.
The system was presented to users as an early showcase of the use of everyday mobile
devices as viable alternatives to fixed desktop based cooperative solutions when users are
on the go. This allowed us to frame a much broader picture for the technology and gain
additional feedback. For the field observations the following structure was used:
Two to three participants were provided with the MEA mobile handset.
An interactive media exchange session was automatically initiated.
Participants were provided with a brief demonstration of the technology
and an overview of the input keys used during the interactions.
Participants were allowed to engage freely with one another using the
MEA photo-conferencing and its remote gestural interaction mechanisms.
During the interaction each group was shadowed and observed, after which each
participant was individually interviewed, normally following their shared engagement. In
the interviews we discussed participants‟ use of the MEA photo-conferencing service and
some of the more interesting observations from the shadowing. Finally, each participant
was asked to complete a quick survey to gauge their mobile phone use, experience and
feedback regarding the photo-conferencing service.

173
6.6.1.4 Participants
We ran 21 participants who took part in groups of 2 to 3 users at a time. The field-based
observations involved inviting groups of participants to take part in a photo-conferencing
session. Participants were randomly recruited from those attending the Computer
Supported Cooperative Work conference and, despite an attempt in random selection, the
majority of groups comprised users that previously knew each other. This offered the
advantage of allowing the participants to be at ease during their interactions, with many
offering each other assistance during the photo-conferencing session.
All the participants volunteered to be observed during their interactions and take part in a
small questionnaire to gauge their previous phone use and feedback. Four participants
were female and post-study questionnaires indicate that all participants were well versed
in the use of mobile telephony devices, with the majority rating over five years of mobile
phone usage.
6.6.1.5 Apparatus
Similar to the previous lab based studies, smartphone (non-touch screen) mobile devices
were used throughout the experiments enabling one or two handed input using the
directional keypad and the built-in T9 input keys. Also each mobile device was pre-
loaded with a custom built stand-alone Windows Mobile Photo-Conferencing client (see
Chapter 5), that established communication between the two mobile devices, creating a
shared visual space in which a number of communication conditions could be utilised.
Differing from the lab based studies, the Photo-Conferencing client allowed users to
explore the full range of communication capabilities, including all four remote interaction
techniques “Pointing”, “Scaling”, “Mixed” and “Hybrid” and the facility to capture new
photos and instantly share them with group members in addition to sharing any existing
photos on the device itself and the ability to switch between shared images.
The six devices used in the experiment were all windows mobile based with similar
specifications, the application was always run in full screen mode and the devices were
fully charged where possible to reduce any processor throttling effect on transmission
speeds.
In addition to providing each user with a hands-on demonstration of the technology, a
laptop was set-up to provide a brief pre-recorded video presentation that could be

174
displayed repeatedly to passersby. The video was itself concise (less than two minutes in
length) and covered an introduction to the MEA photo-conferencing service and a
demonstration of the system and devices.
6.6.1.6 Problems Encountered
No major problems were encountered with the hardware or software, although very high
network latency and bandwidth fluctuations were frequently observed. This was
primarily due to the conference environment and the limited bandwidth available at the
venue in which the conference took place. However, despite the network latency the
MEA was still able to facilitate communication between the participants and was able to
distribute the image successfully albeit at a slower rate.
6.6.2 Analysis
Several types of quantitative and qualitative data were gathered. Server side pass-through
logging was instrumented to log time-stamped records of all interactions, including
events related to the type of interaction method used and the number of photos shared.
All groups were observed by the experimenter and notes were taken throughout. Finally,
after using the system all participants completed a questionnaire containing both Likert-
scale [Williges 1996] and free-form questions. The questionnaire incorporated a 5-point
Likert scale, and the participants selected a response to each statement that ranged from
„strongly agree‟ to „strongly disagree‟.
6.6.2.1 Timing Analysis
Analysis of the server logs provided insight into the interaction techniques used most by
the participants (see Figure 6.34). We categorised interactions according to six distinct
groups, based on the facilities provided by the MEA Photo-conferencing system:
Sx01: In combination with participant observations this defines the percentage
time users spent looking or talking about an image or photo being shared during a
shared session. This can more specifically be defined as the amount of time
when no interface interaction took place, i.e. no other interaction such as
pointing, scaling or switching etc were being performed.

175
Figure 6.34. Photo-conferencing functionality categorised
by participant use during a collaborative session,
displayed as percentage.
Cx01: Defines the amount of time users were engaged in the process of adding
new images to the shared session. This includes images captured through the
camera or from the phone‟s built in memory card.
Sx02: Defines the amount of time users were engaged in the process of switching
between the different images captured during the shared session. This includes
the time spent navigating back and forth between the different images added to
the shared session.
Px01: Defines the amount of time users were engaged in the pointing interaction
condition. This includes time related to positioning the pointer on the screen, in
addition to shrinking and enlarging the pointer selection area.
Sx03: Defines the amount of time users were engaged in the scaling interaction
condition. This includes time related to positioning the image on the screen, in
addition to scaling into and out of the viewable image area.
Hx01: Defines the amount of time users were engaged in the hybrid interaction
condition. This includes time related to co-ordinate selection, in addition to
scaling into and out of an active co-ordinate area.
Findings in relation to observations indicate that the main portion of time spent during a
shared session (39%) was dedicated to viewing and conversing over the images being
shared. This was followed by the act of navigating between the different images being
shared (28%), the act of sharing new images (19%), performing hybrid interactions (5%),
performing pointing interactions (5%) and finally performing scaling interactions (4%).

176
These results demonstrate the differences between lab-based studies and that of a typical
mobile cooperative session. In our previous lab based studies we observed that the
gestural interactions accounted for the dominant portion of time throughout the shared
session (see Table 6.1). This was due to the nature of the task involved, i.e. the puzzle
based task in which participants were provided with an elevated situation that wouldn‟t
typically occur except under the most demanding mobile cooperative scenarios and were
asked to perform the task in as little time as possible.
The field study results are reassuring and highlight the nature of media exchange, in
which, as observed, the content of the shared interaction space plays a key role in the
shared communication session and, although very useful, the remote gestural interaction
techniques are secondary.
6.6.2.2 Conversation Analysis
Field-based observations and note taking were used to gather information on the verbal
queues employed by participants. These observations identified a number of general
strategies users adopted to support their shared interactions, verbal framing being the
most common. When users exchanged photos they often took advantage of the limited
screen size to frame the image and refer to the elements using the screen itself as a co-
ordinate system, e.g. “look at the top right of your screen”.
Figure 6.35. Screen size and referential awareness.
These results are similar to earlier findings in which positioning elements in the shared
workspace allowed users to better convey deictic referencing (see 6.4.2.3). They also
suggest that the limited screen size afforded by most common cellular devices may
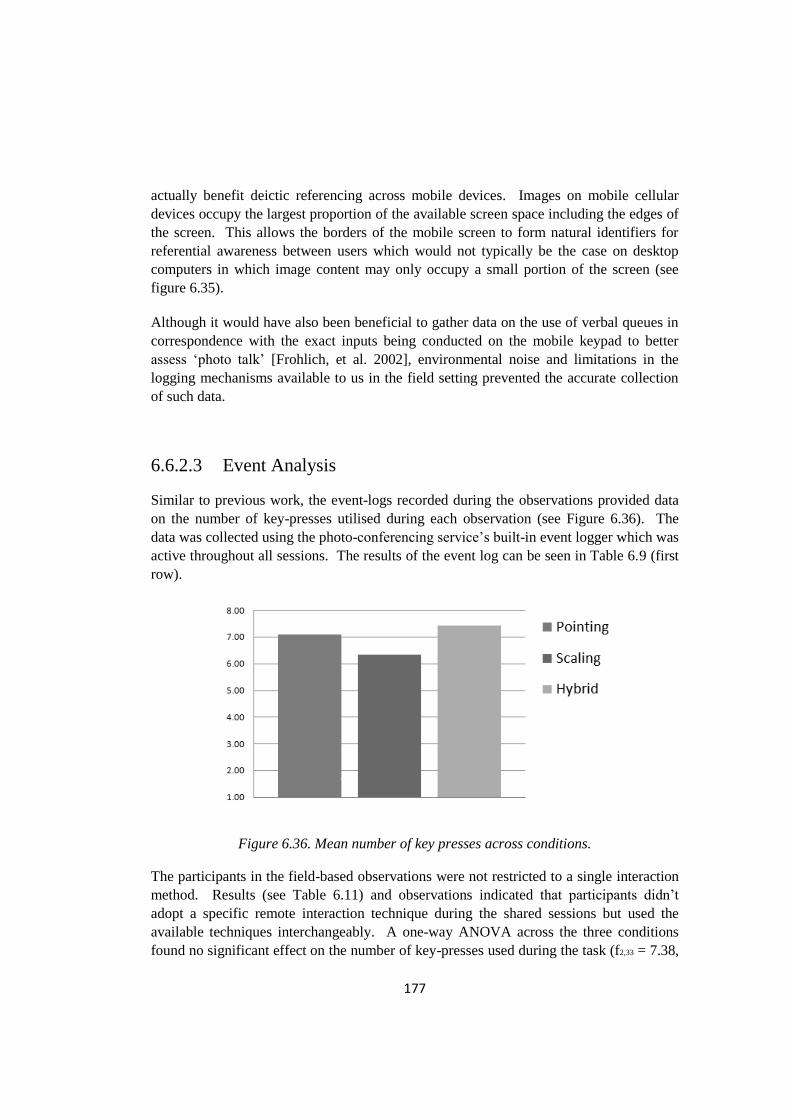
177
actually benefit deictic referencing across mobile devices. Images on mobile cellular
devices occupy the largest proportion of the available screen space including the edges of
the screen. This allows the borders of the mobile screen to form natural identifiers for
referential awareness between users which would not typically be the case on desktop
computers in which image content may only occupy a small portion of the screen (see
figure 6.35).
Although it would have also been beneficial to gather data on the use of verbal queues in
correspondence with the exact inputs being conducted on the mobile keypad to better
assess „photo talk‟ [Frohlich, et al. 2002], environmental noise and limitations in the
logging mechanisms available to us in the field setting prevented the accurate collection
of such data.
6.6.2.3 Event Analysis
Similar to previous work, the event-logs recorded during the observations provided data
on the number of key-presses utilised during each observation (see Figure 6.36). The
data was collected using the photo-conferencing service‟s built-in event logger which was
active throughout all sessions. The results of the event log can be seen in Table 6.9 (first
row).
Figure 6.36. Mean number of key presses across conditions.
The participants in the field-based observations were not restricted to a single interaction
method. Results (see Table 6.11) and observations indicated that participants didn‟t
adopt a specific remote interaction technique during the shared sessions but used the
available techniques interchangeably. A one-way ANOVA across the three conditions
found no significant effect on the number of key-presses used during the task (f2,33 = 7.38,

178
n.s.). The results also suggested no significant preference for a particular interaction
method, with pointing accounting for 34% participant usage, scaling 30.4% participant
usage and Hybrid 35.6% participant usage.
Observations also highlighted two distinct classes of users. Those that adopted an
exploratory approach in which each interaction was used in turn, before settling on a
preferred method and those that only used the first interaction method they came across
and adapted their interactions accordingly. Although the majority of the participants were
well versed in the use of mobile devices, these results highlight the need to design
systems to cater to varying usage scenarios [Cooper and Reimann 2004].
Table 6.9: Mean (and SDs in parentheses) performance of collaborating
pairs across conditions (Events: number of key presses).
Pointing Scaling Hybrid
Events 7.08
(3.09)
6.33
(2.50)
7.42
(2.15)
6.6.2.4 Subjective Feedback
User satisfaction is often used as an aggregate of the subjective measure [Olaniran 1995].
A five-point Likert scale was used to measure satisfaction; the characteristics of this scale
include a statement with a five-point rating scale, a horizontal and continuous scale with
five labelled anchors, and equivalent intervals between anchors. The anchors were
“strongly agree” (weight equal to five), “agree” (weight equal to four), “neither agree nor
disagree” (weight equal to three), “disagree” (weight equal to two), and “strongly
disagree” (weight equal to one).
After using the photo-conferencing service we asked participants a number of questions
to gauge feedback and satisfaction levels. The results for the post-study questionnaire
based on the five-point Likert scale can be seen in Table 6.10. The overall results were
very positive. Participants found collaboration using the Photo-conferencing system easy
(mean = 4.09; SD = 0.76); that the interaction methods didn‟t hinder collaboration (mean
= 3.80; SD = 0.81); and they found the interaction methods useful (mean = 4.14; SD =
0.57).

179
Table 6.10: The mean responses to the Likert-scale questions completed by
each of the participants from 1 = strongly disagree to 5 = strongly agree.
Mean
I found it easy to collaborate this way 4.09
I was not constrained by the interaction method 3.80
I enjoyed using collaborative service 4.61
I found the interaction methods useful 4.14
I felt satisfied with the facilities available for
sharing images 4.38
In terms of the overall use of the Photo-conferencing service, participants were positive
about the facilities provided by the system, e.g. image sharing, capturing, switching and
gestural interactions (mean = 4.38; SD = 0.66) and, just as importantly, they highly
enjoyed using the collaborative service (mean = 4.61; SD = 0.49).
The participants were able to quickly learn and then successfully perform each of the
remote interaction techniques. In general, participants seemed able to quickly learn to use
the Photo-conferencing service and switch between its interactions without any noticeable
trouble.
Overall reactions to the MEA Photo-conferencing service were very positive with many
keen to try out the technology. Furthermore, after the questionnaire many of the
participants stayed behind to discuss several possible additions to the system and also
suggested several new directions for future research. These have been summarised at the
end of the chapter.

180
6.7 Chapter Summary
In the scaling condition, which showed the second best performance overall, participants
tended to use relative referencing (of surrounding items). In contrast, users of pointing
(with an area box) tended to use precision referencing. Relative referencing dominated in
the hybrid condition, which showed the best performance. Thus, the type of interaction
techniques offered to mobile users can have a strong impact on their communication
strategy and in the case of the hybrid interaction technique can essentially direct users
into employing an optimal communication scheme.
The interaction techniques‟ support for relative and precision referencing, rather than the
specific interaction mechanisms per se, may underlie the differences in the results. Users
of pointing tended to use precision referencing. In contrast, in the scaling only condition,
which showed the second best performance overall, participants tended to use relative
referencing. Relative referencing again dominated in the hybrid condition, which showed
the best performance overall. Thus, users‟ preferential use of pointing when given a
straight choice between pointing and scaling (in the mixed condition) may have led them
to use a less effective form of referencing.
The Hybrid results show a reduction in task completion time compared to previous
relative referencing (scaling only condition), precision referencing (pointing only
condition) and the simple offering of both relative and precision referencing (mixed
condition) findings. Results further indicate that the hybrid approach led to a significant
reduction in task completion time, number of words required and the number of events
needed to complete the shared task, minimising collaborative effort [Clark and Brennan
1991]. Durkheim [1938] wrote that “whenever certain elements combine and thereby
produce, by the fact of their combination, new phenomena, it is plain that these new
phenomena reside not in the original elements but in the totality formed by their union”.
In our “hybrid” interaction technique, the synthesis of the best relative and precision
referencing characteristics produced a new interaction that enhanced our overall results
and supported H2:
[H2] An enhancement to the relative referencing interaction provided by the
scaling mechanism and the integration of a complementary precision
referencing facility (rather than simple juxtaposition of pointing and scaling
techniques) would further improve the mobile collaborative performance
measurements (task completion time, number of words used by the
participants, number of key-presses, error rates and measure of cognitive
workload), minimising collaborative effort [Clark and Wilkes-Gibbs 1986].
181
Findings from our field-based observations identified several enhancements that could be
made to the MEA photo-conferencing system:
Expanded annotation and drawing support to further enhance the playfulness of
the interaction, e.g. for drawing moustaches, glasses, horns etc.
A text based conversation channel: this was suggested as being useful for
scenarios in which verbal communication could not take place, e.g. in quiet zones
such as libraries or during conference talks.
Photo Ringtones: in which for example a photo “captured during a night out”
could be pushed to a recipient device to be displayed during the ringing process,
making for an interesting conversation starter.
In addition the field-based observations identified several directions for future mobile
collaborative research, including:
Collaborative editing: Allowing multiple fixed and mobile users to edit and work
with shared resources including documents, files and media. Variations on this
theme include version control and track editing features.
Network Play: Given the existing demand for basic gaming with mobile devices,
it is not difficult to see why the advent of interactive mobile collaborative gaming
sessions between players from around the world was a popular talking point and
suggestion.
Social Communication: The popularity of social networks raises the question of
possible integration strategies with existing social networking services such as
Facebook, Flickr and MySpace to provide real time status and activity
notifications.
Throughout the studies reported in this chapter, we observed an enthusiasm and high
level of demand for the technology. Many of the ideas for future research came directly
from user suggestions and are highlighted in the next chapter as targets for further
exploration.
182
Chapter 7.
Summary
& Future Work
“. . . the moment man first picked up a stone or a branch to use as a tool, he altered
irrevocably the balance between him and his environment. From this point on, the way in
which the world around him changed was different. It was no longer regular or
predictable. New objects appeared that were not recognizable as a mutation of
something that had existed before, and as each one emerged it altered the environment
not for a season but forever. While the number of these tools remained small, their effect
took a long time to spread and to cause change. But as they increased, so did their
effects: the more the tools, the faster the rate of change” James Burke, Connections
7.1 Summary
In this research we have extended the state of the art in mobile cellular interactions and
vastly expanded the richness afforded to remote mobile users beyond those capabilities
presented to date in the commercial and research fields. We have progressively
transitioned from a review of the literature, to the creation of a comprehensive
functioning mobile digital media exchange system, through the design and development
of an exemplar application and its evaluation and subsequent enhancements to develop
improved remote mobile interaction techniques.
Our research presents a fully functional MEA supporting shared remote interaction
techniques and simultaneous voice communication across cellular devices. The MEA
supports services such as a mobile photo-conferencing service in which real time
interactive media sharing can occur between mobile users during an active phone call.
This instantiation enables mobile cellular users to talk, exchange and manipulate photos
synchronously in a single application. It works effectively across a diverse range of
mobile devices with highly constrained displays, keypads and processing power.

183
The system based on an architecture led investigation into mobile media sharing supports
two working modes, synchronous and asynchronous: one in which real time interactions
are shared with all participants and the other in which users can join, leave and catch up
later at any time. Scalability was a core part of the architectural design. The system
currently supports multiple users and separate sessions (see Figure 7.1), enabling simple
one-to-one shared sessions through to large-sessions comprising many connected users,
all sharing and participating in shared spaces across their mobile cellular devices. A
robust distributed co-ordination engine is responsible for the management of all active
cooperative sessions and supports scenarios from simple media- and location-sharing
services to distributed gaming utilising an extensible plug-in systems architecture.
Figure 7.1: Support for multiple concurrent mobile cooperative
sessions across cellular networks.
We have reported experimental evaluations and a field study investigating different
interaction techniques designed to support communication across highly resource
constrained mobile devices. Specifically, we investigated the effects of these interaction
techniques on the collaborative effort required by users, their actual and perceived
performance. We have demonstrated that rich mobile communication can be achieved
through the use of effective remote interaction techniques [Yousef and O'Neill 2008].
Our refinements of these techniques have provided improvements to both user perceived
and actual performance metrics.

184
7.2 Further Work
We consciously ran our studies on standard mobile phones with built-in keypads,
relatively small displays and less powerful processors due to their popularity and massive
worldwide sale volumes. This research could have taken the simpler route of using
laptop computers, which are also commonly referred to as “mobile” devices. However,
laptops are often bulky and battery-hungry, making them suitable only for “pause
workers” who can grab 10 minutes at a table somewhere.
Further research could extend our mobile phone findings and investigate the use of
alternative mobile interface techniques that are beginning to become popular, such as
touchscreens. Issues include designing and evaluating potentially different interaction
mechanisms for alternative physical interfaces, investigating the relationships between
relative and precision referencing and the specific features of different mobile interaction
techniques, and investigating how multiple devices with an even greater diversity of form
factors and interaction techniques can support users interacting in the same session.
Architecture load tests of fifty simultaneous users were performed on the photo-
conferencing instantiation and although the results indicated that a greater number of
simultaneous sessions could have been supported on the mid-range server hardware used.
Further research into the scalability of such mobile infrastructures and the use of more
finely tuned load balancing techniques could better facilitate such mobile services in
supporting a greater number of simultaneous users across separate and shared sessions.
From our user studies, on average the lowest recorded task completion time was 45
seconds (for the scaling condition), compared to the highest recorded 4 minutes (for the
mixed condition). Added to the initial training time, the average hands-on use of the
photo-conferencing system by the first time participants was less than 15 minutes. It
would, of course, be very interesting to run further studies based on extended use,
particularly in more natural settings and with a range of photos and other visual content
that users chose to share.
Future designs could incorporate mechanisms for conflict resolution between connected
peers, e.g. using accelerometers to detect users shaking their screens to enforce floor
control. Although haptic feedback was implemented through the phones‟ built in
vibration mechanisms, we could not effectively evaluate its use due to the technical
limitations of the devices used in our studies. The phones, in common with similar
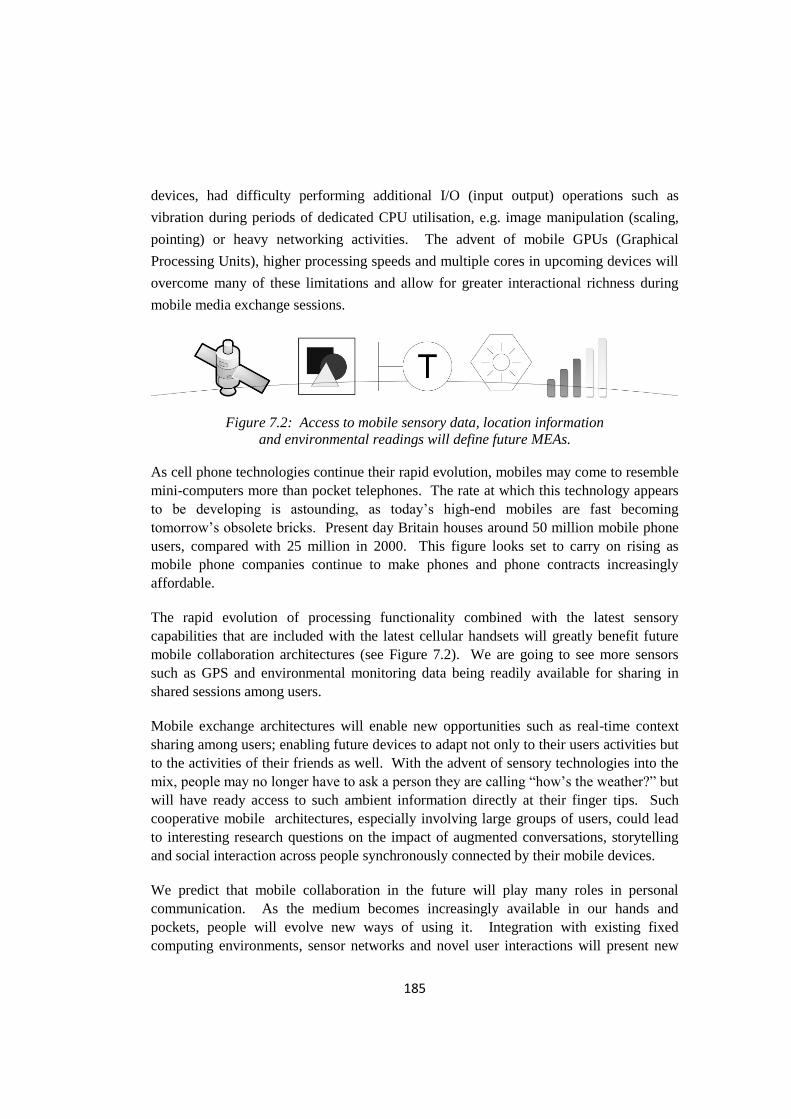
185
devices, had difficulty performing additional I/O (input output) operations such as
vibration during periods of dedicated CPU utilisation, e.g. image manipulation (scaling,
pointing) or heavy networking activities. The advent of mobile GPUs (Graphical
Processing Units), higher processing speeds and multiple cores in upcoming devices will
overcome many of these limitations and allow for greater interactional richness during
mobile media exchange sessions.
Figure 7.2: Access to mobile sensory data, location information
and environmental readings will define future MEAs.
As cell phone technologies continue their rapid evolution, mobiles may come to resemble
mini-computers more than pocket telephones. The rate at which this technology appears
to be developing is astounding, as today‟s high-end mobiles are fast becoming
tomorrow‟s obsolete bricks. Present day Britain houses around 50 million mobile phone
users, compared with 25 million in 2000. This figure looks set to carry on rising as
mobile phone companies continue to make phones and phone contracts increasingly
affordable.
The rapid evolution of processing functionality combined with the latest sensory
capabilities that are included with the latest cellular handsets will greatly benefit future
mobile collaboration architectures (see Figure 7.2). We are going to see more sensors
such as GPS and environmental monitoring data being readily available for sharing in
shared sessions among users.
Mobile exchange architectures will enable new opportunities such as real-time context
sharing among users; enabling future devices to adapt not only to their users activities but
to the activities of their friends as well. With the advent of sensory technologies into the
mix, people may no longer have to ask a person they are calling “how‟s the weather?” but
will have ready access to such ambient information directly at their finger tips. Such
cooperative mobile architectures, especially involving large groups of users, could lead
to interesting research questions on the impact of augmented conversations, storytelling
and social interaction across people synchronously connected by their mobile devices.
We predict that mobile collaboration in the future will play many roles in personal
communication. As the medium becomes increasingly available in our hands and
pockets, people will evolve new ways of using it. Integration with existing fixed
computing environments, sensor networks and novel user interactions will present new

186
opportunities to enable a range of innovative scenarios and communication modalities.
We believe the research reported in this thesis to be part of the first phase of a new era in
scalable always-to-hand mobile collaborative solutions. We must continue the work,
exemplified in this thesis, both on building the technical capabilities and on
understanding how people can better interact and communicate to realize the full
potential of this new medium.
7.3 Conclusion
This thesis has set out to advance the field of mobile-to-mobile communication, by asking
a simple question: “How can we better design systems to support interactive media
exchange across resource constrained mobile cellular devices?”
This resulted in the design, construction and creation of a complete Mobile Exchange
Architecture based on requirements derived from the literature, an in depth knowledge of
mobile networks, distributed cellular interactions and mobile user-interface development.
Additionally a series of lab-based and field-based studies was conducted, in which the
utility of mobile media exchange was investigated, both qualitatively examining its
cooperative function and quantitatively exploring its impact on facets of task
performance. The system evaluation was designed as a feedback loop in which new
knowledge and requirements could be used to enhance mobile media exchange and
further its capabilities to exchange rich media across mobile devices. To draw this thesis
to a close, the key contributions of the research will be summarised.
1. Advances the field of mobile communication and presents an architecture lead
investigation in to the design and development of mobile exchange architectures (MEAs)
in which local and remote mobile users can share, synchronously interact and converse
during an active phone conversation.
2. Presents a new complete mobile exchange architecture, client software and adaptation
techniques that enable users to establish mobile-to-mobile sessions, exchanging large
amounts of data and maintaining a shared visual space amongst collocated and remote
cellular devices.
3. Presents an iterative experimental evaluation of mobile gestural interaction techniques,
Scaling, Pointing, Mixed and Hybrid for mobile-to-mobile media exchange, assessing
their impact on collaborative effort [Clark and Brennan 1991].

187
7.4 Closing Remarks
If we look back at the rapid evolution of mobile cellular networks and devices, the
number of services that have defined the way in which we communicate today can be
counted on a single hand: Voice, Text Messaging, Multi Media Messaging and more
recently the Internet. Amongst these, voice still remains to date the only synchronous
service between mobile devices. In this thesis we have demonstrated that not only are
richer solutions possible over existing 3G networks, but that they can both augment
existing services such as voice and enable the next generation of mobile communication
capabilities and connectedness.
While further work remains in order to comprehensively explore the field of Mobile
Exchange Architectures (MEAs) and the interaction techniques they will present, this
thesis provides a step forward as well as a direction for the future development of
complementary technologies to better enable mobile collaboration. As these mobile
technologies and capabilities evolve, so too will user needs and what they will come to
expect from their mobile devices. To date the field of Mobile Collaboration remains in
its infancy. As research progresses the future will present greater opportunities that will
delight, inspire and challenge our notions of what is achievable on the once very limited
devices that we carry in our hands, pockets and bags as we journey onwards to new
destinations.
188
Bibliography
Anderson, A. H., Bard, E., Sotillo, C., Doherty-Sneddon, G. and Newlands, A. The
effects of face-to-face communication on the intelligibility of speech. Perception and
Psychophysics 59 (1997), 580–592.
Anderson, A. H., Smallwood, L., Macdonald, R., Mullin, J., Fleming, A. and O'malley, C.
Video data and video links in mediated communication: what do users value?
International Journal of Human-Computer Studies 52, 1 (2000), 165-187.
Aoki, P., Szymanski, M. and Woodruff, A. Turning from Image Sharing to Experience
Sharing. First Workshop on Pervasive Image Capture and Sharing, Ubicomp'05 (2005).
Bakeman, R. and Gottman, J. M. Observing Interaction: An Introduction to Sequential
Analysis. Cambridge University Press (1997).
Bakeman, R. and Quera, V. Analyzing Interaction: Sequential Analysis with SDIS &
GSEQ. Cambridge University Press (1995).
Baker, M. Negotiation in Collaborative Problem-Solving Dialogues. Dialogue And
Instruction: Modelling Interaction In Intelligent Tutoring Systems (1995).
Baker, M., Hansen, T., Joiner, R. and Traum, D. The role of grounding in collaborative
learning tasks. Collaborative learning: Cognitive and computational approaches (1999),
31-63.
Barthes, R. Camera Lucida: Reflections on Photography, Hill and Wang (1981).
Battarbee, K. and Koskinen, I. Co-experience: user experience as interaction. CoDesign
1, 1 (2005), 5-18.
Bederson, B. B. and Hollan, J. D. Pad++: a zooming graphical interface for exploring
alternate interface physics. Proceedings of the 7th annual ACM symposium on User
interface software and technology (1994), 17-26.
Bellotti, V. and Bly, S. Walking away from the desktop computer: distributed
collaboration and mobility in a product design team. ACM Press New York, NY, USA
(1996), 209-218.
Bodic, G. L. Multimedia Messaging Service: An Engineering Approach to MMS, John
Wiley and Sons, USA (2003).

189
Buxton, W. Telepresence: integrating shared task and person spaces. Morgan Kaufmann
Publishers Inc. San Francisco, CA, USA (1992), 123-129.
Buxton, W. A. S. Telepresence: integrating shared task and person spaces. Morgan
Kaufmann Publishers Inc. San Francisco, CA, USA (1992), 123-129.
Byers, J. C., Bittner, A. C. and Hill, S. G. Traditional and raw task load index (TLX)
correlations: Are paired comparisons necessary. Advances in industrial ergonomics and
safety 1 (1989), 481–488.
Camarillo, G. and García-Martín, M. A. The 3G IP Multimedia Subsystem (IMS):
Merging the Internet and the Cellular Worlds, John Wiley and Sons (2004).
Chalfen, R. Snapshot Versions of Life. Bowling Green, Ohio: Bowling Green State
University. Popular Press (1987).
Chalfen, R. Family photograph appreciation: Dynamics of medium, interpretation and
memory. Communication & cognition. Monographies 31, 2-3 (1998), 161-178.
Chui, C. K. and Chen, G. Kalman filtering with real-time applications. Springer Series In
Information Sciences; Vol. 17 (1987).
Clark, H. H. Arenas of Language Use, Center for the Study of Language and Information
(1992).
Clark, H. H. Plenary Session: Working Together at a Distance, CSCW. ACM Press,
Cambridge, MA (1996).
Clark, H. H. and Brennan, S. E. Grounding in communication. Perspectives on socially
shared cognition (1991), 127-149.
Clark, H. H. and Schaefer, E. F. Contributing to discourse. Cognitive Science 13, 2
(1989), 259-294.
Clark, H. H. and Schober, M. F. Understanding by addressees and overhearers. Cognitive
Psychology 21 (1989), 211-232.
Clark, H. H. and Wilkes-Gibbs, D. Referring as a collaborative process. Cognition 22, 1
(1986), 1-39.
Clark, H. H. and Wilkes-Gibbs, D. Referring as a collaborative process. Intentions in
Communication (1990), 463-493.
Collomosse, J., Yousef, K. and O'neill, E. Viewpoint Invariant Image Retrieval For
Context In Urban Enviroments. In: Proceedings of 3rd European Conference on Visual
Media Production, CVMP 2006, November 29–30, London, UK. (2006), 177-177.

190
Cooley, H. R. The Autobiographical Impulse and Mobile Imaging: Toward a Theory of
Autobiometry. School of Cinema-Television/Division of Critical Studies, University of
Southern California, Los Angeles, Calif., US (2005).
Cooper, A. and Reimann, R. About Face 2.0: The essentials of interaction design.
Information Visualization 3 (2004), 223-225.
Coulombe, S. and Grassel, G. Multimedia adaptation for the multimedia messaging
service. IEEE Communications Magazine 42, 7 (Jul 2004), 120-126.
Crabtree, A., Rodden, T. and Mariani, J. Collaborating around collections: informing the
continued development of photoware. Proceedings of the 2004 ACM conference on
Computer supported cooperative work (2004), 396-405.
Daniel Ralph, P. G. MMS: Technologies, Usage and Business Models, John Wiley and
Sons USA (October 2003).
Davis, M., Rothenberg, M., Van House, N., Towle, J., King, S., Ahern, S., Burgener, C.,
Perkel, D., Finn, M. and Viswanathan, V. MMM2: mobile media metadata for media
sharing. Conference on Human Factors in Computing Systems (2005), 1335-1338.
Dillon, R. F., Edey, J. D. and Tombaugh, J. W. Measuring the true cost of command
selection: techniques and results. ACM New York, NY, USA (1990), 19-26.
Divitini, M., Haugalokken, O. K. and Norevik, P. A. Improving communication through
mobile technologies: which possibilities? Proceedings IEEE International Workshop on
Wireless and Mobile Technologies in Education (2002), 86-90.
Donald, A. N. The way i see it: Simplicity is not the answer. interactions 15, 5 (2008),
45-46.
Dourish, P., Adler, A., Bellotti, V. and Henderson, A. Your place or mine? Learning from
long-term use of Audio-Video communication. Computer Supported Cooperative Work
(CSCW) 5, 1 (1996), 33-62.
Dourish, P. and Bellotti, V. Awareness and coordination in shared workspaces, ACM,
Toronto, Ontario, Canada,(1992).
Durkheim, E. The Rules of Sociological Method, 8th edn, G. Catlin (Ed.) Trans. S.
Solovay & JH Mueller, Glencoe, IL: Free Press1938).
Dutta-Roy, A. The cost of quality in Internet-style networks. Spectrum, IEEE 37, 9
(2000), 57-62.
Economist, T. Picture messaging: Lack of textual appeal. The Economist, 380, 8489
(Aug. 2006) 56. (2006).

191
Egido, C. Video conferencing as a technology to support group work: a review of its
failures. ACM New York, NY, USA (1988), 13-24.
Ellis, C. A., Gibbs, S. J. and Rein, G. L. Groupware: some issues and experiences.
Communications of the ACM 34, 1 (1991), 39-58.
English, W. K., Engelbart, D. C. and Berman, M. L. Display-Selection Techniques for
Text Manipulation. Human Factors in Electronics, IEEE Transactions on (1967), 5-15.
Eugster, P. T., P. A. Felber, et al. (2003). "The many faces of publish/subscribe." ACM
computing Surveys 35(2): 114-131.
Fienberg, S. E. and Netlibrary, I. The analysis of cross-classified categorical data, MIT
Press Cambridge, MA (1980).
Finn, K. E., Sellen, A. J. and Wilbur, S. B. Video-Mediated Communication, Lawrence
Erlbaum Associates, Inc. Mahwah, NJ, USA (1997).
Fish, R. S., Kraut, R. E., Root, R. W. and Rice, R. E. Evaluating video as a technology
for informal communication. ACM Press New York, NY, USA (1992), 37-48.
Frohlich, D., Kuchinsky, A., Pering, C., Don, A. and Ariss, S. Requirements for
photoware. Proceedings of the 2002 ACM conference on Computer supported
cooperative work (2002), 166-175.
Fussell, S. R., Kraut, R. E. and Siegel, J. Coordination of communication: effects of
shared visual context on collaborative work. ACM Press New York, NY, USA (2000),
21-30.
Fussell, S. R., Setlock, L. D., Yang, J., Ou, J., Mauer, E. and Kramer, A. D. I. Gestures
Over Video Streams to Support Remote Collaboration on Physical Tasks. Human-
Computer Interaction 19, 3 (2004), 273-309.
Gartner Gartner Dataquest November 2 (2006).
Gaver, W. W., Sellen, A., Heath, C. and Luff, P. One is not enough: multiple views in a
media space. ACM New York, NY, USA (1993), 335-341.
Gergle, D. The value of shared visual space for collaborative physical tasks, ACM,
Portland, OR, USA,(2005).
Gergle, D., Kraut, R. E. and Fussell, S. R. Action as language in a shared visual space,
ACM, Chicago, Illinois, USA,(2004).
Gergle, D., Kraut, R. E. and Fussell, S. R. Language Efficiency and Visual Technology:
Minimizing Collaborative Effort with Visual Information. Journal of Language and
Social Psychology 23, 4 (2004), 491.
192
Goffman, E. The presentation of self in everyday life. Garden City, NY (1959).
Google Maps: http://maps.google.com/
Gsma, GSM Worldwide Association. http://www.gsmworld.com.
Gutwin, C. and Greenberg, S. The Mechanics of Collaboration: Developing Low Cost
Usability Evaluation Methods for Shared Workspaces. Proceedings of the 9th IEEE
International Workshops on Enabling Technologies: Infrastructure for Collaborative
Enterprises (2000), 98-103.
Handley, M., Schulzrinne, H., Schooler, E. and Rosenberg, J. SIP: Session Initiation
Protocol. Request for Comments 2543 (1999).
Harper, R. and Taylor, A. S. The Inside Text: Social, Cultural and Design Perspectives
on SMS, Springer (2005).
Harper, R., Yousef, K., Regan, T., Izadi, S., Rouncefield, M. and Rubens, S. Trafficking:
design for the viral exchange of TV content on mobile phones. ACM New York, NY,
USA (2007), 249-256.
Harvey, A. C. Forecasting, Structural Time Series Models and the Kalman Filter,
Cambridge University Press (1990).
Heath, C. and Luff, P. Disembodied Conduct: Communication through video in a multi-
media environment. (1991), 99-103.
Hirsh, S., Sellen, A. and Brokopp, N. Why HP People Do and Don‟t Use
Videoconferencing Systems. HPL-2004-140(R.1). 17 (2005).
Hollan, J. and Stornetta, S. Beyond being there. Proceedings of the SIGCHI conference
on Human factors in computing systems, Monterey, California, United States (1992),
119-125.
Houston, A. Basic Photography: The Rule of Thirds. Retrieved January 23 (2000), 2005.
Ichikawa, F., Chipchase, J. and Grignani, R. Where'S The Phone? A Study of Mobile
Phone Location in Public Spaces. (2005), 1-8.
Idc Survey indicates that less than 10% of users are utilizing services other than SMS.
Press Release. http://www.idc.com/getdoc.jsp?containerId=pr2006_03_03_130022.
(2006).
Isaacs, E. and Tang, J. What video can and cannot do for collaboration: a case study.
Multimedia Systems 2, 2 (1994), 63-73.

193
Isaacs, E. and Tang, J. Studying video-based collaboration in context: From small
workgroups to large organizations. Video-Mediated Communication (1997), 173-197.
Ito, M. Intimate Visual Co-Presence. First Workshop on Pervasive Image Capture and
Sharing, Ubicomp'05 (2005).
Johnson, J. A. A comparison of user interfaces for panning on a touch-controlled display.
Proceedings of the SIGCHI conference on Human factors in computing systems (1995),
218-225.
Kabbash, P., Buxton, W. and Sellen, A. Two-handed input in a compound task. ACM
New York, NY, USA (1994), 417-423.
Kacmar, C. and Carey, J. Assessing the usability of icons in user interfaces. Behaviour &
Information Technology 10, 6 (1991), 443-457.
Kaptelinin, V. A comparison of four navigation techniques in a 2D browsing task.
Conference on Human Factors in Computing Systems (1995), 282-283.
Karlson, A., Bederson, B. and Contreras-Vidal, J. Understanding Single-Handed Mobile
Device Interaction. Human-Computer Interaction Lab, University of Maryland, College
Park, HCIL Tech Report 2 (2006).
Karsenty, L. Cooperative Work and Shared Visual Context: An Empirical Study of
Comprehension Problems in Side-by-Side and Remote Help Dialogues. Human-
Computer Interaction 14, 3 (1999), 283-315.
Kindberg, T., Spasojevic, M., Fleck, R. and Sellen, A. How and Why People Use Camera
Phones. Consumer Applications and Systems Laboratory. H&P Laboratories Bristol,
HPL-2004-216, Nov 26 (2004).
Kindberg, T., Spasojevic, M., Fleck, R. and Sellen, A. The ubiquitous camera: an in-
depth study of camera phone use. Pervasive Computing, IEEE 4, 2 (2005), 42-50.
Kirk, D. S. Turn it this way: Remote gesturing in video-mediated communication.
Unpublished doctoral dissertation, Univesrity of Nottingham, Nottingham, UK. Available
from http://www.cs.nott.ac.uk/~dsk/DSK-PhDThesisComplete.pdf (2006).
Koskinen, I. Mobile Multimedia in Society: Uses and Social Consequences. Handbook of
Mobile Studies (2007).
Koskinen, I., Kurvinen, E., Lehtonen, T. K., Kaski, J., Keinänen, N. and Absetz, K.
Mobile image, IT Press (2002).
Krauss, R. M. and Fussell, S. R. Mutual knowledge and communicative effectiveness,
Intellectual teamwork: social and technological foundations of cooperative work.
Lawrence Erlbaum Associates, Inc., Mahwah, NJ (1990).

194
Krauss, R. M. and Fussell, S. R. Constructing shared communicative environments.
Perspectives on socially shared cognition (1991), 172-200.
Kraut, R. E., Fussell, S. R., Brennan, S. E. and Siegel, J. Understanding effects of
proximity on collaboration: Implications for technologies to support remote collaborative
work. Distributed work (2002), 137-162.
Kraut, R. E., Gergle, D. and Fussell, S. R. The use of visual information in shared visual
spaces: informing the development of virtual co-presence. Proceedings of the 2002 ACM
conference on Computer supported cooperative work (2002), 31-40.
Kraut, R. E., Miller, M. D. and Siegel, J. Collaboration in performance of physical tasks:
effects on outcomes and communication. Proceedings of the 1996 ACM conference on
Computer supported cooperative work (1996), 57-66.
Kurvinen, E. Only when miss universe snatches me: teasing in MMS messaging. ACM
New York, NY, USA (2003), 98-102.
Lee, A., Schlueter, K. and Girgensohn, A. Sensing activity in video images. ACM New
York, NY, USA (1997), 319-320.
Lindley, S. E. and Monk, A. F. Social enjoyment with electronic photograph displays:
Awareness and control. International Journal of Human-Computer Studies 66, 8 (2008),
587-604.
Ling, R. and Julsrud, T. The development of grounded genres in multimedia messaging
systems (MMS) among mobile professionals. (2004).
Ling, R., Julsrud, T. and Yttri, B. Nascent communication genres within SMS and MMS.
The Inside Text: Social, Cultural and Design Perspectives on SMS Springer, Dordrecht,
Norwell, MA (2005).
Mackenzie, D. A. and Wajcman, J. The social shaping of technology: how the
refrigerator got its hum, Open University Press (1985).
Mackenzie, I. S. Fitts'Law as a Research and Design Tool in Human-Computer
Interaction. Human-Computer Interaction 7, 1 (1992), 91-139.
Macwhinney, B. The CHILDES Project: Tools for Analyzing Talk, Lawrence Erlbaum
Associates Inc, US (2000).
Maia Garau, J. P., Scott Lederer, Chris Beckmann Speaking in Pictures: Visual
Conversation Using Radar. Second Workshop on Pervasive Image Capture and Sharing,
Ubicomp'06 (2006).

195
Mäkelä, A., Giller, V., Tscheligi, M. and Sefelin, R. Joking, storytelling, artsharing,
expressing affection: a field trial of how children and their social network communicate
with digital images in leisure time. ACM Press New York, NY, USA (2000), 548-555.
Martin, D. and Rouncefield, M. Making the Organization Come Alive: Talking Through
and About the Technology in Remote Banking. Human-Computer Interaction 18, 1 & 2
(2003), 111-148.
Mauve, M., Vogel, J., Hilt, V. and Effelsberg, W. Local-lag and timewarp: providing
consistency for replicated continuous applications. Multimedia, IEEE Transactions on 6,
1 (2004), 47-57.
Nardi, B. and Whittaker, S. The place of face-to-face communication in distributed work.
Distributed work (2002), 83-110.
Nardi, B. A., Schwarz, H., Kuchinsky, A., Leichner, R., Whittaker, S. and Sclabassi, R.
Turning away from talking heads: the use of video-as-data in neurosurgery. ACM New
York, NY, USA (1993), 327-334.
Neale, D., Mcgee, M., Amento, B. and Brooks, P. Making Media Spaces Useful: Video
Support And Telepresence. Blacksburg, Virginia Polytechnic Institute and State
University 28 (1998).
Norman, D. A. and Collyer, B. The design of everyday things, Basic Books New York
(2002).
O'conaill, B., Whittaker, S. and Wilbur, S. Conversations Over Video Conferences: An
Evaluation of the Spoken Aspects of Video-Mediated Communication. Human-Computer
Interaction 8, 4 (1993), 389-428.
O'hara, K., Black, A. and Lipson, M. Everyday practices with mobile video telephony.
ACM New York, NY, USA (2006), 871-880.
Okabe, D. Social practice of Camera Phone in Japan. First Workshop on Pervasive Image
Capture and Sharing, Ubicomp'05 (2005).
Okabe, D. and Ito, M. Camera phones changing the definition of picture-worthy. Japan
Media Review 29 (2003).
Olaniran, B. Perceived communication outcomes in computer-mediated communication:
an analysis of three systems among new users. Information Processing and Management
31, 4 (1995), 525-541.
Plummer, K. Documents of Life 2: An Invitation to a Critical Humanism, Sage
Publications, USA (2001).
196
Rayner, K. Eye movements in reading and information processing: 20 years of research.
Psychological Bulletin 124, 3 (1998), 372-422.
Rivière, C. Seeing and Writing on a Mobile Phone: New Forms of Sociability in
Interpersional Communications. Proceedings of Communications in the 21st Century:
The Mobile Information Society (2005).
Robertson, T. Building bridges: negotiating the gap between work practice and
technology design. International Journal of Human-Computers Studies 53, 1 (2000), 121-
146.
Rogers, Y. Icon design for the user interface. International Reviews of Ergonomics:
Current Trends in Human Factors Research and Practice (1987).
Roschelle, J. and Teasley, S. D. The construction of shared knowledge in collaborative
problem solving. Nato Asi Series F Computer And Systems Sciences 128 (1994), 69-69.
Seedhouse, P. Task-based interaction. ELT Journal 53, 3 (1999), 149-156.
Sellen, A. J. Speech patterns in video-mediated conversations. ACM New York, NY,
USA (1992), 49-59.
Sellen, A. J. Remote Conversations: The Effects of Mediating Talk with Technology.
Human-Computer Interaction 10, 4 (1995), 401-444.
Short, J., Williams, E. and Christie, B. The Social Psychology of Telecommunications.
1976, Wiley, London.
Skehan, P. Task-based instruction. Language Teaching 36, 01 (2003), 1-14.
Stefik, M., Bobrow, D. G., Foster, G., Lanning, S. and Tatar, D. WYSIWIS revised: early
experiences with multiuser interfaces. ACM Transactions on Information Systems (TOIS)
5, 2 (1987), 147-167.
Sun, C., Jia, X., Zhang, Y., Yang, Y. and Chen, D. Achieving convergence, causality
preservation, and intention preservation in real-time cooperative editing systems. ACM
Trans. Comput.-Hum. Interact. 5, 1 (1998), 63-108.
Tang, J. C. Why Do Users Like Video? Studies of Multimedia-Supported Collaboration.
(1992).
Tang, J. C. and Isaacs, E. Why do users like video? Computer Supported Cooperative
Work (CSCW) 1, 3 (1992), 163-196.
Taylor, A. S. and Harper, R. Age-old practices in the'new world': a study of gift-giving
between teenage mobile phone users. ACM New York, NY, USA (2002), 439-446.

197
Turner, J. and Kraut, R. Sharing Perspectives: Proceedings of the Conference on
Computer-Supported Cooperative Work. CSCW (1992).
Uday, G. Experiential aesthetics: a framework for beautiful experience. interactions 15, 5
(2008), 6-10.
Van House, N. A. Distant closeness: Cameraphones and public image sharing. Second
Workshop on Pervasive Image Capture and Sharing, Ubicomp'06 (2006).
Van House, N. A. Flickr and public image-sharing: distant closeness and photo
exhibition. CHI '07 extended abstracts on Human factors in computing systems (2007).
Van House, N. A. and Davis, M. The Social Life of Cameraphone Images. First
Workshop on Pervasive Image Capture and Sharing, Ubicomp'05 (2005).
Veinott, E., Olson, J., Olson, G. and Fu, X. Video helps remote work: Speakers who need
to negotiate common ground benefit from seeing each other. ACM New York, NY, USA
(1999), 302-309.
Voida, A. and Mynatt, E. D. Six themes of the communicative appropriation of
photographic images. ACM New York, NY, USA (2005), 171-180.
Waclawsky, J. G. IMS: A critique of the grand plan. Business Communications Review
35, 10 (2005), 54.
Whittaker, S. Rethinking video as a technology for interpersonal communications: theory
and design implications. International Journal of Human-Computer Studies 42, 5 (1995),
501-529.
Whittaker, S. Things to Talk About When Talking About Things. Human-Computer
Interaction 18, 1 & 2 (2003), 149-170.
Whittaker, S. and O'conaill, B. The role of vision in face-to-face and mediated
communication. Video-Mediated Communication (1997), 23-49.
Wieser, M. The Computer for the 21st Century. Scientific American 9 (1991), 933–940.
Williams, E. Experimental comparisons of face-to-face and mediated communication: A
review. Psychological Bulletin 84, 5 (1977), 963-976.
Williges, R. Notes from class lecture. Department of Industrial and Systems Engineering,
Virginia Polytechnic Institute and State University, Blacksburg, VA, Spring (1996).
Wittgenstein, L. and Anscombe, G. E. M. Philosophische Untersuchungen Philosophical
Investigations, Blackwell (1953).

198
Wynekoop, J. L., Conger, S. A., School of, B., Public, A. and Bernard, M. B. C. A Review
of Computer Aided Software Engineering Research Methods, Dept. of Statistics and
Computer Information Systems, School of Business and Public Administration, Bernard
M. Baruch College of the City University of New York (1992).
Yousef, K. and O'Neill, E. Photo-Conferencing: A Novel Approach to Interactive Photo
Sharing across 3G Mobile Networks. In: Proceedings of Social Interaction and Mundane
Technologies Workshop Simtech 2007, November 26-27, 2007, Melbourne, Australia.
(2007).
Yousef, K. and O'Neill, E. Sunrise: Towards Location Based Clustering For Assisted
Photo Management. In: Proceedings of Ninth International Conference on Multimodal
Interfaces, Tagging, Mining and Retrieval of Human-Related Activity Information
Workshop at ICMI 2007 November 12-15, 2007, Nagoya, Japan. (2007), 47-54.
Yousef, K. and O'Neill, E. Preliminary Evaluation of a Remote Mobile Collaborative
Environment. In: Proceedings of ACM CHI 2008 Conference on Human Factors in
Computing Systems April 5-10, 2008, Florence, Italy. (2008), 3267-3272.
Yousef, K. and O'Neill, E. Supporting Mobile Cooperative Services across 3G Cellular
Networks. ACM Conference on Computer Supported Cooperative Work Integrated
Demo, November 8-12, 2008, San Diego, California, USA. (2008).
Yousef, K. and O'Neill, E. Supporting Social Album Creation with Mobile Photo-
Conferencing. In: Proceedings of Collocated Social Practices Surrounding Photos
Workshop at CHI 2008 April 5-10, 2008, Florence, Italy. (2008).
Zanella, A. and Greenberg, S. Reducing interference in single display groupware through
transparency. Proceedings of the seventh conference on European Conference on
Computer Supported Cooperative Work (2001), 339-358.

199
Appendix A.
Companion to Chapter 2
Appendix A.1: HTC-S710 Device Specifications
Release Date: April, 2007
Software Environment Operating System: Windows Mobile 6 Standard
Microprocessor
CPU: 32bit Texas Instruments OMAP 850
CPU Clock: 201 MHz
Memory, Storage capacity
ROM capacity: 128 MB (accessible: 63.4MB)
RAM capacity: 64 MB (accessible: 49.6MB)
Display
Display Type: color transflective TFT , 65536 scales
Display Resolution: 240 x 320
Display Diagonal: 2.4 "
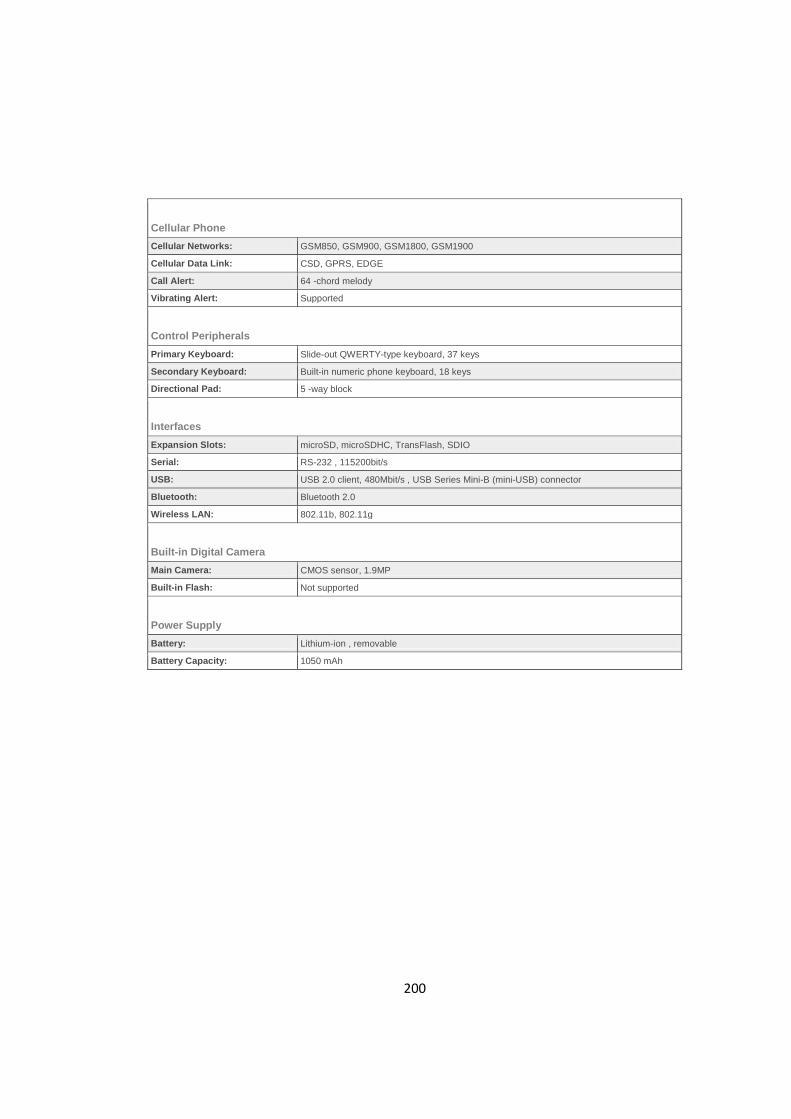
200
Cellular Phone
Cellular Networks: GSM850, GSM900, GSM1800, GSM1900
Cellular Data Link: CSD, GPRS, EDGE
Call Alert: 64 -chord melody
Vibrating Alert: Supported
Control Peripherals
Primary Keyboard: Slide-out QWERTY-type keyboard, 37 keys
Secondary Keyboard: Built-in numeric phone keyboard, 18 keys
Directional Pad: 5 -way block
Interfaces
Expansion Slots: microSD, microSDHC, TransFlash, SDIO
Serial: RS-232 , 115200bit/s
USB: USB 2.0 client, 480Mbit/s , USB Series Mini-B (mini-USB) connector
Bluetooth: Bluetooth 2.0
Wireless LAN: 802.11b, 802.11g
Built-in Digital Camera
Main Camera: CMOS sensor, 1.9MP
Built-in Flash: Not supported
Power Supply
Battery: Lithium-ion , removable
Battery Capacity: 1050 mAh

201
Appendix B.
Companion to Chapter 3
Appendix B.1: GSM Architecture
Mobile Station (MS): The MS is a combination of terminal equipment and
subscriber data. The terminal equipment is called ME (Mobile Equipment) and
the subscriber‟s data is stored in a separate module called SIM (Subscriber
Identity Module). A mobile station can be a basic mobile handset or a more
complex Personal Digital Assistant (PDA). When the user is moving (i.e. while
driving), network control of MS connections is switched over from cell site to
cell site to support MS mobility through a process called handover.
Base Transceiver Station (BTS): The BTS implements the air communications
interface with all active MSs located under its coverage area (cell site). This
includes signal modulation/demodulation, signal equalizing and error coding.
Several BTSs are connected to a single Base Station Controller (BSC). In the
United Kingdom, the number of GSM BTSs is estimated at around several
thousand. Cell radii range from 10 to 200 m for the smallest cells to several
kilometres for the largest cells. A BTS is typically capable of handling 20–40
simultaneous communications.

202
Base Station Controller (BSC): The BSC supplies a set of functions for managing
connections of BTSs under its control. Functions enable operations such as
handover, cell site configuration, management of radio resources and tuning of
BTS radio frequency power levels. In addition, the BSC realises a first
concentration of circuits towards the MSC. In a typical GSM network, the BSC
controls over 70 BTSs.
Mobile Switching Centre (MSC): The MSC performs the communications
switching functions of the system and is responsible for call set-up, release and
routing. It also provides functions for service billing and for interfacing other
networks.
The Visitor Location Register (VLR): The VLR contains dynamic information
about users who are attached to the mobile network including the user‟s
geographical location. The VLR is usually integrated to the MSC. Through the
MSC, the mobile network communicates with other networks such as the Public
Switched Telephone Network (PSTN), Integrated Services Digital Network
(ISDN), Circuit Switched Public Data Network (CSPDN) and Packet Switched
Public Data Network (PSPDN).
Home Location Register (HLR): The HLR is a network element containing
subscription details for each subscriber. A HLR is typically capable of managing
information for hundreds of thousands of subscribers.
Appendix B.2: Second Generation GSM Architecture
Mobile Station (MS): The MS is a combination of terminal equipment and
subscriber data and is similar to that of the earlier GSM systems. However,
203
updates to the MS to support data connectivity have resulted in three different
operating modes [3GPP-22.060] to the BTS:
Class A: The mobile station supports simultaneous use of GSM and GPRS
services (e.g. attachment, activation, monitoring, and transmission) and may
establish or receive calls on the two services simultaneously. There are very few
mobiles supporting this class on the market as these devices requires lots of CPU
bandwidth which would make them more expensive.
Class B: The mobile station is attached to both GSM and GPRS services.
However, the mobile station can only operate in one of the two services at a time.
Once the voice call has terminated, the data service can be resumed. Most
phones on the market are currently of this class.
Class C: The mobile station is attached to either the GSM service or the GPRS
service but is not attached to both services at the same time. Prior to establishing
or receiving a call on one of the two services, the mobile station has to be
explicitly attached to the desired service. This class is generally used by GPRS
modems which are not used for voice calls.
Serving GPRS Support Node (SGSN): The SGSN is connected to one or more
base station subsystems. It operates as a router for data packets for all mobile
stations present in a given geographical area. It also keeps track of the location
of mobile stations and performs security functions and access control.
Gateway GPRS Support Node (GGSN): The GGSN ensures interactions between
the GPRS core network and external packet-switched networks such as the
Internet. For this purpose, it encapsulates data packets received from external
networks and routes them toward the SGSN.

204
Appendix B.3: Third Generation GSM Architecture
User Equipment (UE): The UE is the same as the Mobile Station (MS), usually
provided to the subscriber in the form of a handset composed of Mobile
Equipment (ME) and a UMTS Subscriber Identity Module (USIM). The ME
contains the radio transceiver, the display and digital signal processors. The
USIM is a 3G application on an UMTS IC card (UICC) which holds the
subscriber identity, authentication algorithms and other subscriber-related
information.
UTRAN Network: The UTRAN is composed of nodes B and Radio Network
Controllers (RNCs). The node B is responsible for the transmission of
information in one or more cells, to and from UEs. It also participates partly in
the system resource management. The node B interconnects with the RNC via
the Iub interface. The RNC controls resources in the system and interfaces the
core network.
UMTS Core Network: The first phase UMTS core network is based on an
evolved GSM network sub-system (circuit-switched domain) and a GPRS core
network (packet-switched domain). Consequently, the UMTS core network is
composed of the HLR, the MSC/VLR and the GMSC (to manage circuit-
switched connections) and the SGSN and GGSN (to manage packet-based
connections).
Second Phase UMTS: The initial UMTS architecture presented in this chapter is
based on evolved GSM and GPRS core networks (providing support for circuit-
switched and packet-switched domains, respectively). The objective of this
initial architecture is to allow mobile network operators to rapidly roll out UMTS
networks on the basis of existing GSM and GPRS networks.

205
Appendix B.4: IMS (IP Multimedia Subsystem) Architecture.
Proxy Call Session Control Function (P-CSCF): The P-CSCF is a SIP proxy that
is the first point of contact for the IMS terminal. It can be located either in the
visited network (in full IMS networks) or in the home network (when the visited
network isn't IMS compliant yet). The terminal discovers its P-CSCF with either
DHCP, or it is assigned in the PDP Context in General Packet Radio Service
(GPRS).
The P-CSCF authenticates the user, establishes an internet protocol security
association with the IMS terminal, preventing spoofing attacks and replay
attacks, and protects the privacy of the user. Other nodes trust the P-CSCF, and
do not have to authenticate the user again.
Interrogating Call Session Control (I-CSCF): The I-CSCF is another SIP function
located at the edge of an administrative domain. Its IP address is published in the
Domain Name System (DNS) of the domain (using NAPTR and SRV type of
DNS records), so that remote servers can find it, and use it as a forwarding point
(e.g. registering) for SIP packets to this domain. The I-CSCF queries the HSS
using the Diameter Cx interface to retrieve the user location (Dx interface is used
from I-CSCF to SLF to locate the needed HSS only), and then routes the SIP
request to its assigned S-CSCF.
Serving Call Session Control (S-CSCF): The S-CSCF is the central node of the
signalling plane. It is a SIP server, but performs session control too. It is always
located in the home network. It uses Diameter Cx and Dx interfaces to the HSS
to download and upload user profiles and has no local storage of the user. All
necessary information is loaded from the HSS.

206
Application Server (AS): AS host and execute services, and interface with the S-
CSCF using Session Initiation Protocol (SIP). An example of an application
server that is being developed in 3GPP is the Voice call continuity Function
(VCC Server). Depending on the actual service, the AS can operate in SIP proxy
mode, SIP UA (user agent) mode or SIP B2BUA (back-to-back user agent)
mode. An AS can be located in the home network or in an external third-party
network.
Subscription Locator Function (SLF): The purpose of the SLF function is to
locate the HSS and S-CSCF assigned to a particular subscriber. This is an
indexing function, mapping the user identity to the S-CSCF/HSS according to
registration. When the P-CSCF needs to route a request for a subscriber session
to the appropriate S-CSCF, the P-CSCF would access this function to determine
which S-CSCF has been assigned to the subscriber. Other devices may need to
access this function as well, such as an application server supporting services to
the subscriber.
Home Subscriber Server (HSS): The HSS is similar in function to the GSM
Home Location Register (HLR) and Authentication Centre (AUC). The HSS is a
master user database that supports the IMS network entities that actually handle
calls. It contains the subscription-related information (user profiles), performs
authentication and authorization of the user, and can provide information about
the user's physical location.
Breakout Gateway Control Function (BGCF): The BGCF is a SIP server that
includes routing functionality based on telephone numbers. It is only used when
calling from the IMS to a phone in a circuit switched network, such as the Public
Switched Telephone Network (PSTN) or the Public land mobile network
(PLMN).
Media Gateway Control Function (MGCF): The MGCF handles call control
protocol conversion between SIP and ISUP and interfaces with the SGW over
SCTP. It also controls the resources in a Media Gateway (MGW) across an H.248
interface.
Media Resource Function Controller (MRFC): The MRFC is a signalling plane
node that acts as a SIP User Agent to the S-CSCF, and which controls the MRFP
across an H.248 interface.
Media resource function processor (MRFP): The MRFP is a media plane node
that implements all media-related functions. The MRFP delivers IP Audio and
Video Media processing features as a shared re-usable resource for the numerous
multimedia services hosted by the application servers in the IMS.
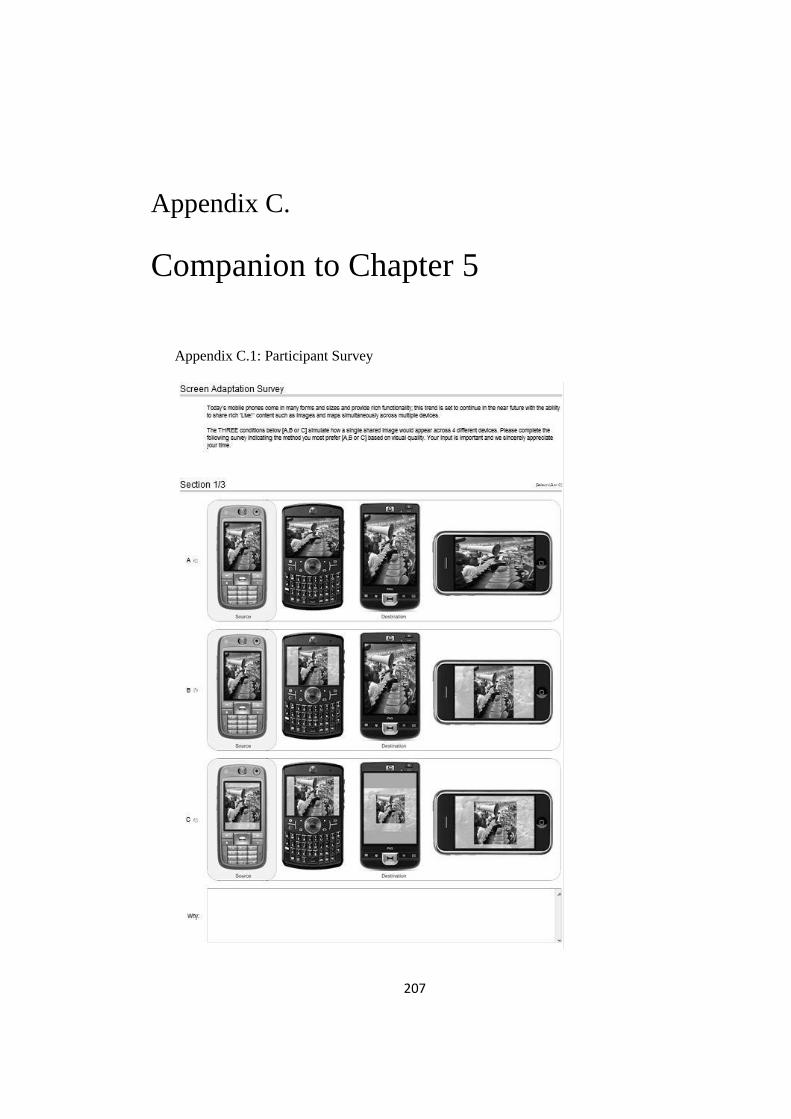
207
Appendix C.
Companion to Chapter 5
Appendix C.1: Participant Survey

208

209
Appendix D.
Companion to Chapter 6
Appendix D.1: Participant Consent Form
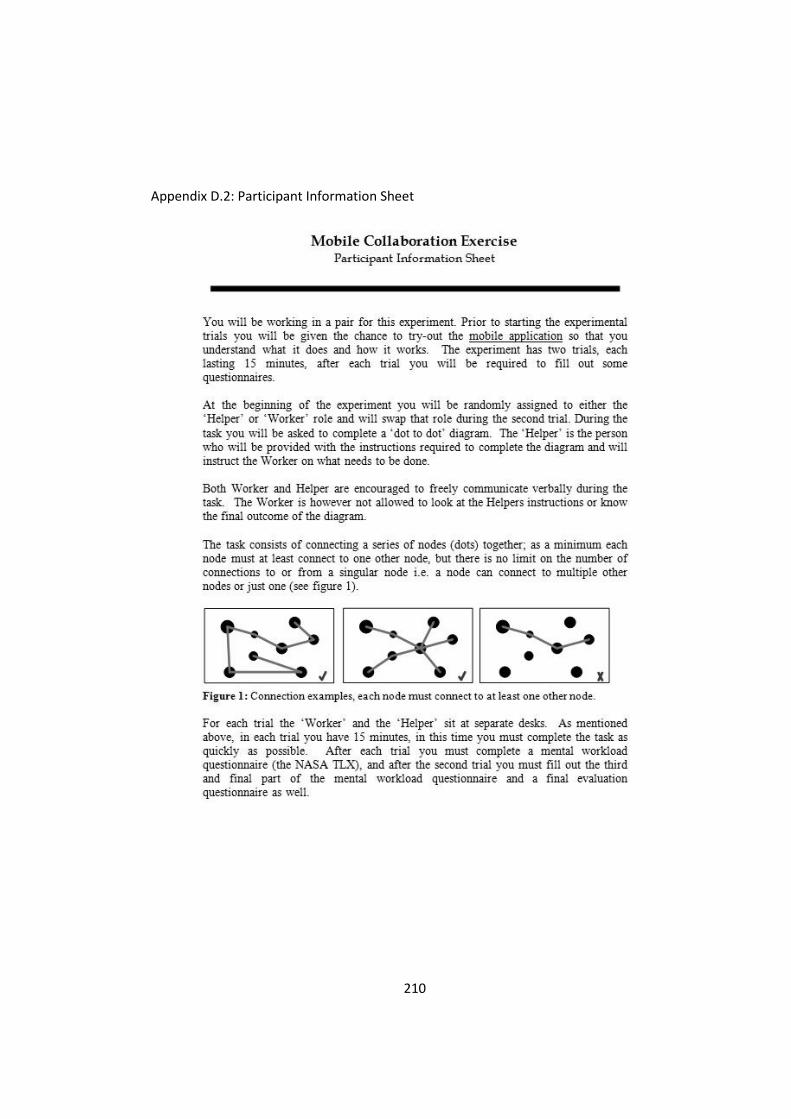
210
Appendix D.2: Participant Information Sheet
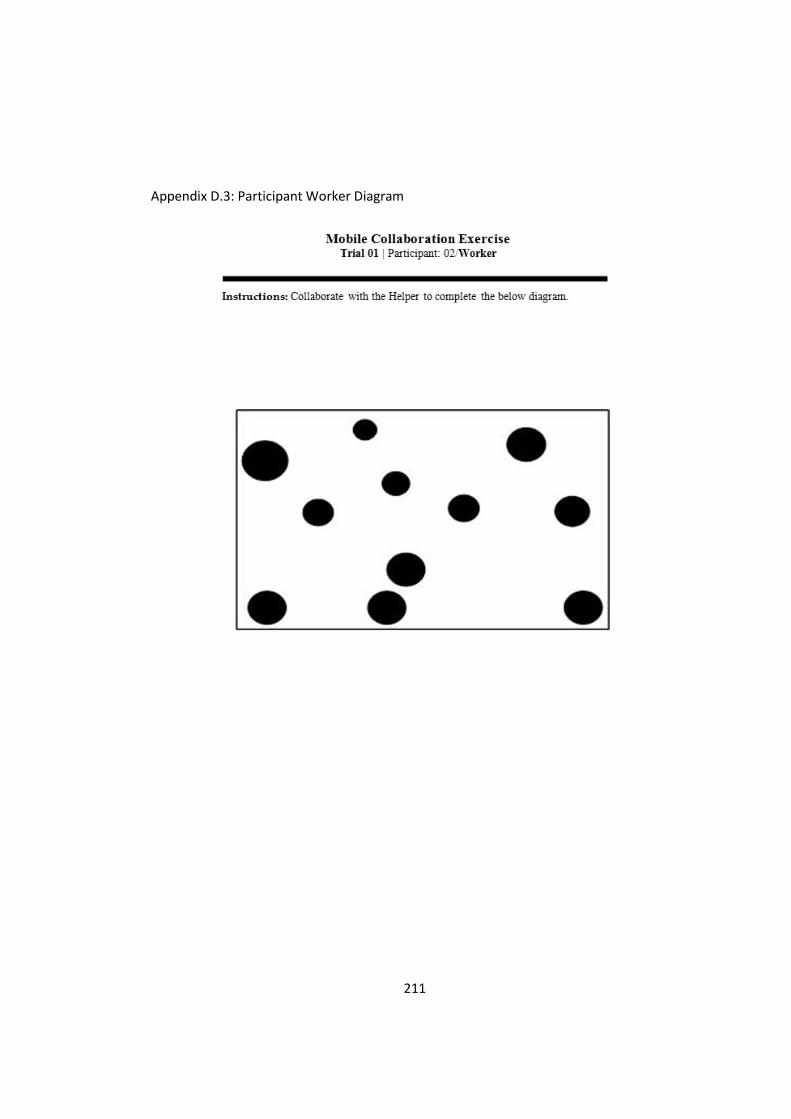
211
Appendix D.3: Participant Worker Diagram
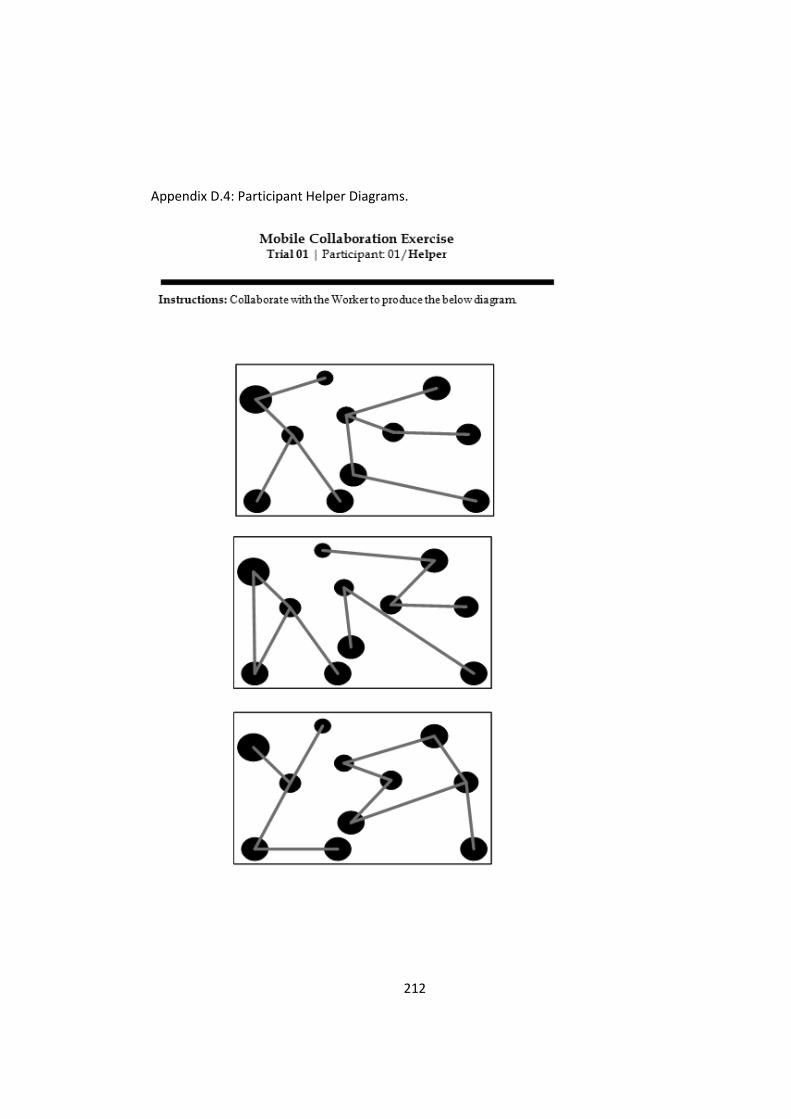
212
Appendix D.4: Participant Helper Diagrams.

213
Appendix D.5: Participant post-questionnaire

214
Appendix D.6: Participant post-questionnaire NASA TLX subscales sheet
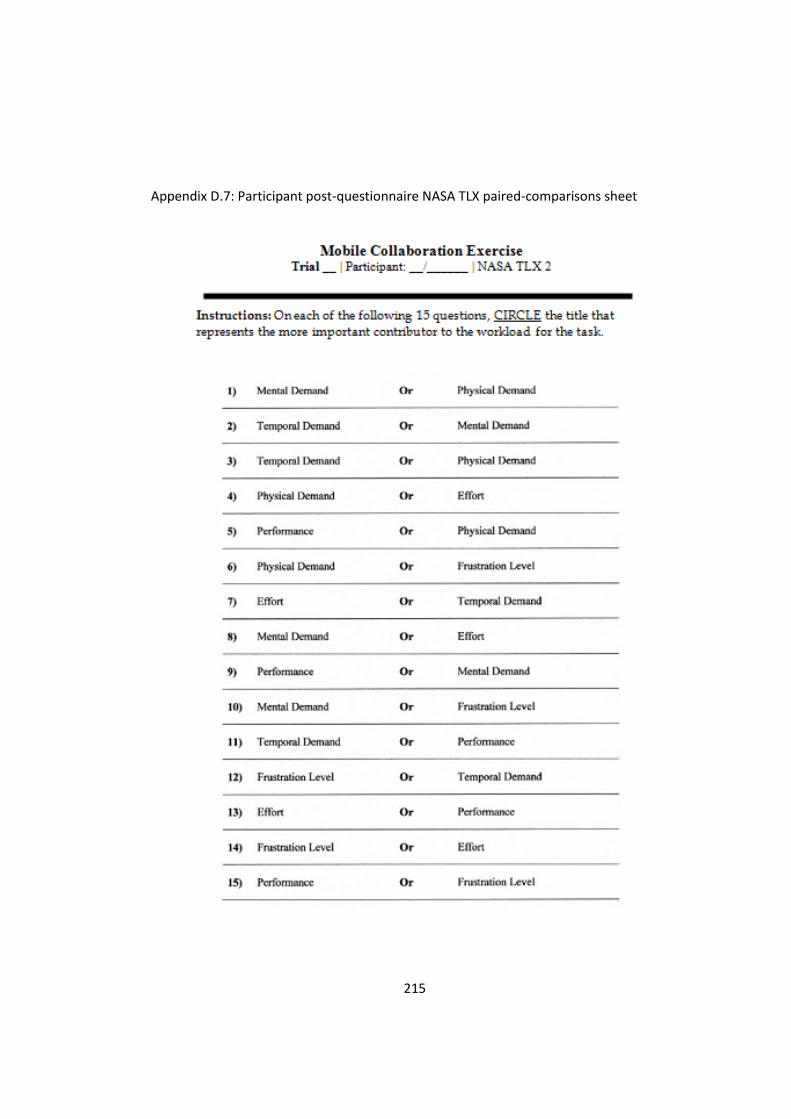
215
Appendix D.7: Participant post-questionnaire NASA TLX paired-comparisons sheet

216
Appendix D.8: Participant Evaluation Questionnaire

217
Appendix D.9: Participant Evaluation Questionnaire

218
Appendix D.10: Mobile collaboration: Workload Analysis
Table D.10: Mean (and SDs in parentheses) un-weighted mental workload
sub-scales by interaction condition: Pointing, Scaling and Mixed.
Pointing Scaling Mixed
Mental demand 16.67
(4.56)
14.25
(7.84)
10.92
(6.08)
Physical demand 6.58
(3.12)
5.08
(2.31)
4.83
(4.78)
Temporal demand 14.25
(8.14)
23.00
(2.98)
16.17
(5.2)
Performance
8.83
(6.67)
11.25
(8.05)
7.08
(3.15)
Effort
14.33
(6.04)
13.67
(8.06)
12.33
(5.02)
Frustration
15.92
(8.03)
10.33
(5.37)
11.67
(5.79)
Appendix D.11: Weighted subscale by communication condition.

219
Appendix D.12 Study 1 – Pointing Results (Timing, Words, Events)
# Timing Words Events
1 146 227 40
2 131 233 11
3 128 148 50
4 245 319 45
5 109 176 28
6 113 147 25
7 105 95 35
8 121 292 33
9 111 213 29
10 136 202 32
11 149 231 23
12 198 214 25
Sum: 1692 2497 376
Mean: 141.00 208.08 31.33
StdDev: (41.4) (61.87) (10.47)
Appendix D.13 Study 1 – Pointing Results Workload Analysis: Mental Demand
Mental Demand
Helper Worker Combined
# Weight Rating W/R Weight Rating W/R Rating W/R
1 4.00 19.00 5.07 2.00 4.00 0.53 23.00 5.60
2 4.00 20.00 5.33 2.00 5.00 0.67 25.00 6.00
3 3.00 12.00 2.40 4.00 1.00 0.27 13.00 2.67
4 3.00 12.00 2.40 4.00 1.00 0.27 13.00 2.67
5 5.00 15.00 5.00 2.00 5.00 0.67 20.00 5.67
6 5.00 13.00 4.33 2.00 4.00 0.53 17.00 4.87
7 4.00 5.00 1.33 2.00 10.00 1.33 15.00 2.67
8 4.00 4.00 1.07 2.00 7.00 0.93 11.00 2.00
9 5.00 15.00 5.00 4.00 5.00 1.33 20.00 6.33
10 5.00 13.00 4.33 2.00 4.00 0.53 17.00 4.87
11 4.00 5.00 1.33 4.00 10.00 2.67 15.00 4.00
12 4.00 4.00 1.07 4.00 7.00 1.87 11.00 2.93

220
Sum: 50.00 137.00 38.67 34.00 63.00 11.60 200.00 50.27
Mean: 4.17 11.42 3.22 2.83 5.25 0.97 16.67 4.19
StdDev: (.72) (5.68) (1.77) (1.03) (2.9) (.72) (4.56) (1.55)
Appendix D.14 Study 1 – Pointing Results Workload Analysis: Physical Demand
Physical Demand
Helper Worker Combined
# Weight Rating W/R Weight Rating W/R Rating W/R
1 0.00 2.00 0.00 2.00 4.00 0.53 6.00 0.53
2 0.00 2.00 0.00 2.00 1.00 0.13 3.00 0.13
3 0.00 3.00 0.00 0.00 1.00 0.00 4.00 0.00
4 0.00 3.00 0.00 0.00 1.00 0.00 4.00 0.00
5 2.00 7.00 0.93 0.00 2.00 0.00 9.00 0.93
6 2.00 11.00 1.47 0.00 1.00 0.00 12.00 1.47
7 1.00 1.00 0.07 0.00 4.00 0.00 5.00 0.07
8 1.00 1.00 0.07 0.00 4.00 0.00 5.00 0.07
9 2.00 7.00 0.93 0.00 2.00 0.00 9.00 0.93
10 2.00 11.00 1.47 0.00 1.00 0.00 12.00 1.47
11 1.00 1.00 0.07 0.00 4.00 0.00 5.00 0.07
12 2.00 1.00 0.13 0.00 4.00 0.00 5.00 0.13
Sum: 13.00 50.00 5.13 4.00 29.00 0.67 79.00 5.80
Mean: 1.08 4.17 0.43 0.33 2.42 0.06 6.58 0.48
StdDev: (.9) (3.83) (.59) (.78) (1.44) (.16) (3.12) (.57)
Appendix D.15 Study 1 – Pointing Results Workload Analysis: Temporal Demand
Temporal demand
Helper Worker Combined
# Weight Rating W/R Weight Rating W/R Rating W/R
1 1.00 9.00 0.60 2.00 15.00 2.00 24.00 2.60
2 1.00 1.00 0.07 2.00 1.00 0.13 2.00 0.20
3 3.00 8.00 1.60 4.00 1.00 0.27 9.00 1.87
4 3.00 7.00 1.40 4.00 1.00 0.27 8.00 1.67
5 2.00 8.00 1.07 1.00 13.00 0.87 21.00 1.93
6 2.00 11.00 1.47 1.00 4.00 0.27 15.00 1.73
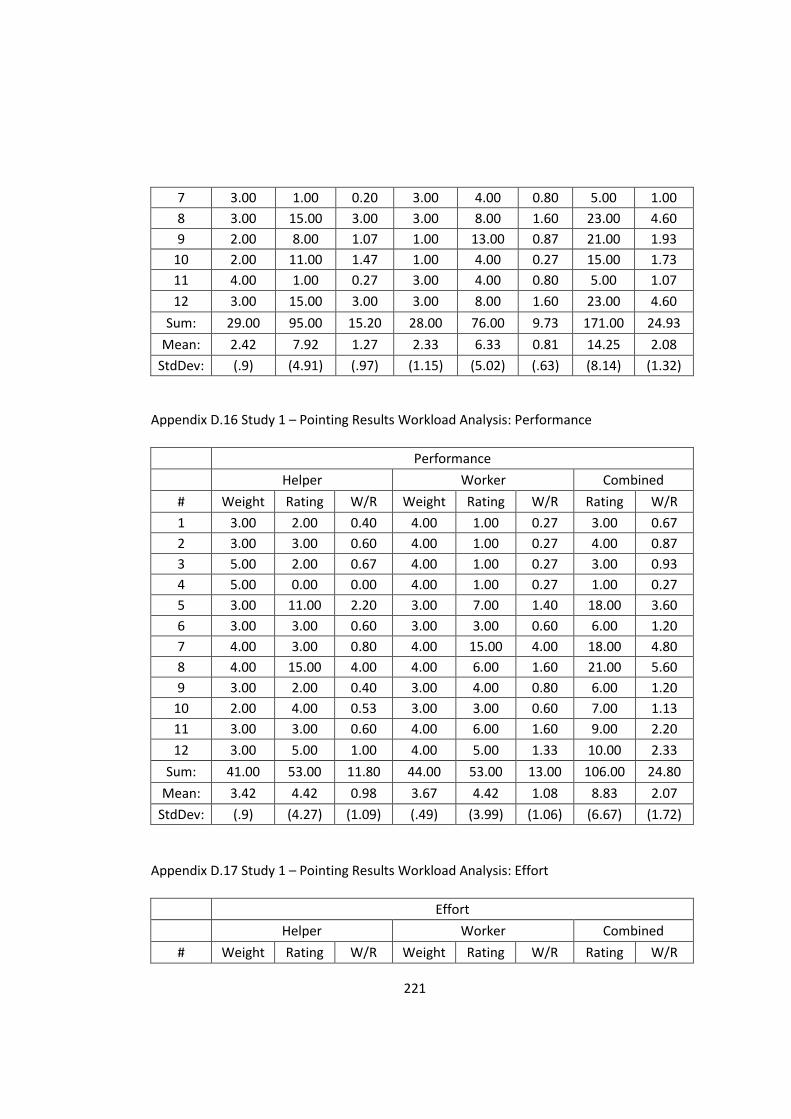
221
7 3.00 1.00 0.20 3.00 4.00 0.80 5.00 1.00
8 3.00 15.00 3.00 3.00 8.00 1.60 23.00 4.60
9 2.00 8.00 1.07 1.00 13.00 0.87 21.00 1.93
10 2.00 11.00 1.47 1.00 4.00 0.27 15.00 1.73
11 4.00 1.00 0.27 3.00 4.00 0.80 5.00 1.07
12 3.00 15.00 3.00 3.00 8.00 1.60 23.00 4.60
Sum: 29.00 95.00 15.20 28.00 76.00 9.73 171.00 24.93
Mean: 2.42 7.92 1.27 2.33 6.33 0.81 14.25 2.08
StdDev: (.9) (4.91) (.97) (1.15) (5.02) (.63) (8.14) (1.32)
Appendix D.16 Study 1 – Pointing Results Workload Analysis: Performance
Performance
Helper Worker Combined
# Weight Rating W/R Weight Rating W/R Rating W/R
1 3.00 2.00 0.40 4.00 1.00 0.27 3.00 0.67
2 3.00 3.00 0.60 4.00 1.00 0.27 4.00 0.87
3 5.00 2.00 0.67 4.00 1.00 0.27 3.00 0.93
4 5.00 0.00 0.00 4.00 1.00 0.27 1.00 0.27
5 3.00 11.00 2.20 3.00 7.00 1.40 18.00 3.60
6 3.00 3.00 0.60 3.00 3.00 0.60 6.00 1.20
7 4.00 3.00 0.80 4.00 15.00 4.00 18.00 4.80
8 4.00 15.00 4.00 4.00 6.00 1.60 21.00 5.60
9 3.00 2.00 0.40 3.00 4.00 0.80 6.00 1.20
10 2.00 4.00 0.53 3.00 3.00 0.60 7.00 1.13
11 3.00 3.00 0.60 4.00 6.00 1.60 9.00 2.20
12 3.00 5.00 1.00 4.00 5.00 1.33 10.00 2.33
Sum: 41.00 53.00 11.80 44.00 53.00 13.00 106.00 24.80
Mean: 3.42 4.42 0.98 3.67 4.42 1.08 8.83 2.07
StdDev: (.9) (4.27) (1.09) (.49) (3.99) (1.06) (6.67) (1.72)
Appendix D.17 Study 1 – Pointing Results Workload Analysis: Effort
Effort
Helper Worker Combined
# Weight Rating W/R Weight Rating W/R Rating W/R

222
1 2.00 9.00 1.20 5.00 15.00 5.00 24.00 6.20
2 2.00 10.00 1.33 5.00 1.00 0.33 11.00 1.67
3 1.00 4.00 0.27 2.00 3.00 0.40 7.00 0.67
4 1.00 5.00 0.33 2.00 2.00 0.27 7.00 0.60
5 3.00 10.00 2.00 4.00 16.00 4.27 26.00 6.27
6 3.00 8.00 1.60 4.00 2.00 0.53 10.00 2.13
7 2.00 5.00 0.67 5.00 10.00 3.33 15.00 4.00
8 2.00 5.00 0.67 5.00 12.00 4.00 17.00 4.67
9 1.00 10.00 0.67 2.00 8.00 1.07 18.00 1.73
10 3.00 8.00 1.60 4.00 4.00 1.07 12.00 2.67
11 2.00 5.00 0.67 3.00 8.00 1.60 13.00 2.27
12 2.00 5.00 0.67 3.00 7.00 1.40 12.00 2.07
Sum: 24.00 84.00 11.67 44.00 88.00 23.27 172.00 34.93
Mean: 2.00 7.00 0.97 3.67 7.33 1.94 14.33 2.91
StdDev: (.74) (2.37) (.56) (1.23) (5.14) (1.72) (6.04) (1.94)
Appendix D.18 Study 1 – Pointing Results Workload Analysis: Frustration
Frustration
Helper Worker Combined
# Weight Rating W/R Weight Rating W/R Rating W/R
1 5.00 5.00 1.67 0.00 5.00 0.00 10.00 1.67
2 5.00 3.00 1.00 0.00 5.00 0.00 8.00 1.00
3 3.00 9.00 1.80 1.00 2.00 0.13 11.00 1.93
4 3.00 4.00 0.80 1.00 2.00 0.13 6.00 0.93
5 0.00 8.00 0.00 5.00 17.00 5.67 25.00 5.67
6 0.00 5.00 0.00 5.00 3.00 1.00 8.00 1.00
7 1.00 15.00 1.00 1.00 5.00 0.33 20.00 1.33
8 1.00 14.00 0.93 1.00 11.00 0.73 25.00 1.67
9 2.00 8.00 1.07 5.00 17.00 5.67 25.00 6.73
10 1.00 5.00 0.33 5.00 3.00 1.00 8.00 1.33
11 1.00 15.00 1.00 1.00 5.00 0.33 20.00 1.33
12 1.00 14.00 0.93 1.00 11.00 0.73 25.00 1.67
Sum: 23.00 105.00 10.53 26.00 86.00 15.73 191.00 26.27
Mean: 1.92 8.75 0.88 2.17 7.17 1.31 15.92 2.19
StdDev: (1.73) (4.59) (.56) (2.12) (5.47) (2.07) (8.03) (1.91)
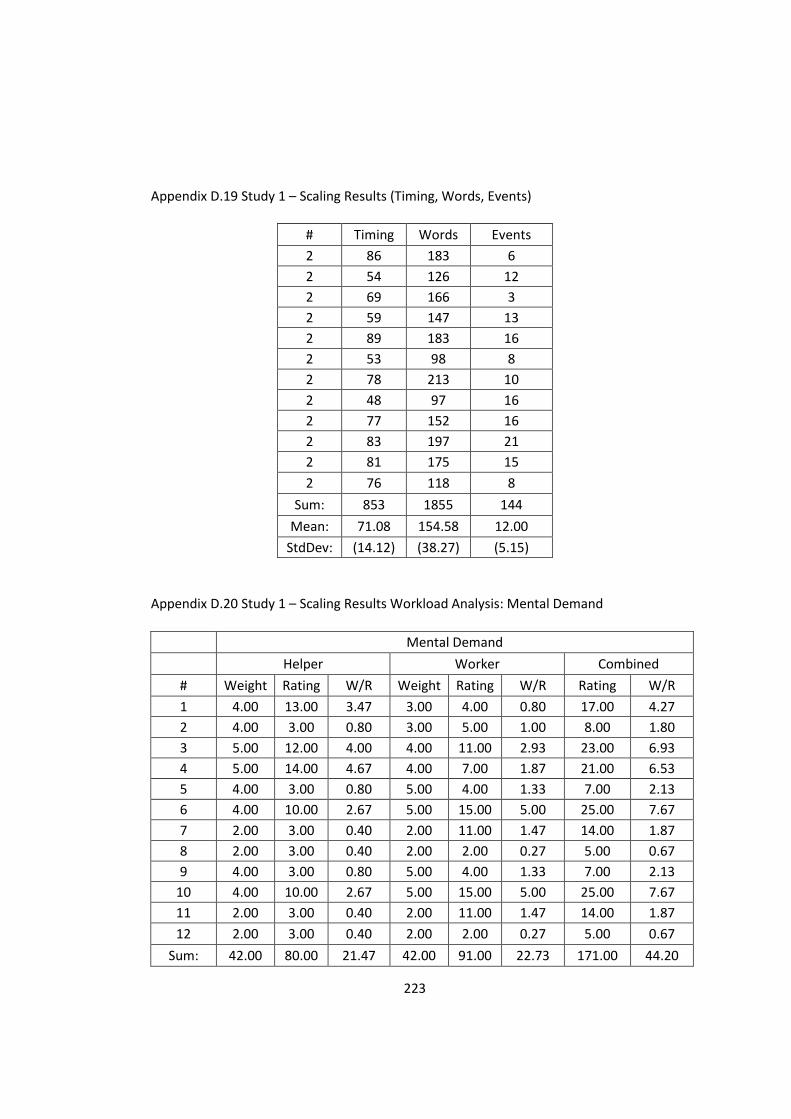
223
Appendix D.19 Study 1 – Scaling Results (Timing, Words, Events)
# Timing Words Events
2 86 183 6
2 54 126 12
2 69 166 3
2 59 147 13
2 89 183 16
2 53 98 8
2 78 213 10
2 48 97 16
2 77 152 16
2 83 197 21
2 81 175 15
2 76 118 8
Sum: 853 1855 144
Mean: 71.08 154.58 12.00
StdDev: (14.12) (38.27) (5.15)
Appendix D.20 Study 1 – Scaling Results Workload Analysis: Mental Demand
Mental Demand
Helper Worker Combined
# Weight Rating W/R Weight Rating W/R Rating W/R
1 4.00 13.00 3.47 3.00 4.00 0.80 17.00 4.27
2 4.00 3.00 0.80 3.00 5.00 1.00 8.00 1.80
3 5.00 12.00 4.00 4.00 11.00 2.93 23.00 6.93
4 5.00 14.00 4.67 4.00 7.00 1.87 21.00 6.53
5 4.00 3.00 0.80 5.00 4.00 1.33 7.00 2.13
6 4.00 10.00 2.67 5.00 15.00 5.00 25.00 7.67
7 2.00 3.00 0.40 2.00 11.00 1.47 14.00 1.87
8 2.00 3.00 0.40 2.00 2.00 0.27 5.00 0.67
9 4.00 3.00 0.80 5.00 4.00 1.33 7.00 2.13
10 4.00 10.00 2.67 5.00 15.00 5.00 25.00 7.67
11 2.00 3.00 0.40 2.00 11.00 1.47 14.00 1.87
12 2.00 3.00 0.40 2.00 2.00 0.27 5.00 0.67
Sum: 42.00 80.00 21.47 42.00 91.00 22.73 171.00 44.20
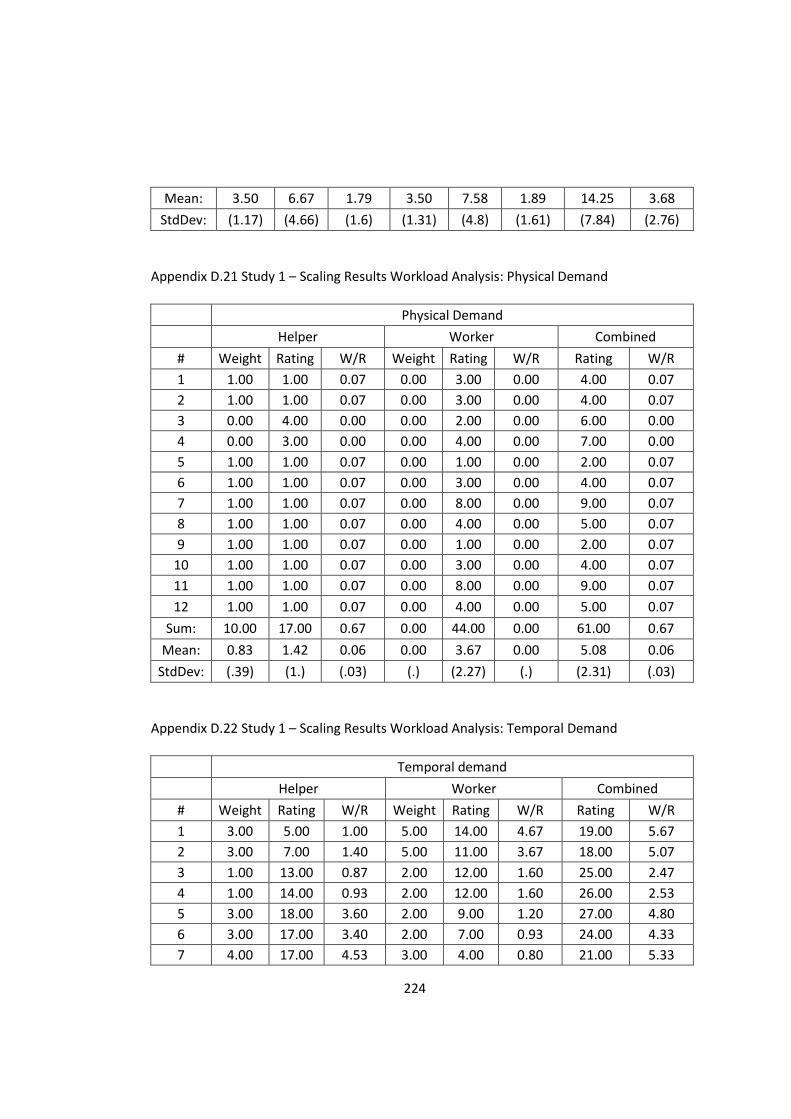
224
Mean: 3.50 6.67 1.79 3.50 7.58 1.89 14.25 3.68
StdDev: (1.17) (4.66) (1.6) (1.31) (4.8) (1.61) (7.84) (2.76)
Appendix D.21 Study 1 – Scaling Results Workload Analysis: Physical Demand
Physical Demand
Helper Worker Combined
# Weight Rating W/R Weight Rating W/R Rating W/R
1 1.00 1.00 0.07 0.00 3.00 0.00 4.00 0.07
2 1.00 1.00 0.07 0.00 3.00 0.00 4.00 0.07
3 0.00 4.00 0.00 0.00 2.00 0.00 6.00 0.00
4 0.00 3.00 0.00 0.00 4.00 0.00 7.00 0.00
5 1.00 1.00 0.07 0.00 1.00 0.00 2.00 0.07
6 1.00 1.00 0.07 0.00 3.00 0.00 4.00 0.07
7 1.00 1.00 0.07 0.00 8.00 0.00 9.00 0.07
8 1.00 1.00 0.07 0.00 4.00 0.00 5.00 0.07
9 1.00 1.00 0.07 0.00 1.00 0.00 2.00 0.07
10 1.00 1.00 0.07 0.00 3.00 0.00 4.00 0.07
11 1.00 1.00 0.07 0.00 8.00 0.00 9.00 0.07
12 1.00 1.00 0.07 0.00 4.00 0.00 5.00 0.07
Sum: 10.00 17.00 0.67 0.00 44.00 0.00 61.00 0.67
Mean: 0.83 1.42 0.06 0.00 3.67 0.00 5.08 0.06
StdDev: (.39) (1.) (.03) (.) (2.27) (.) (2.31) (.03)
Appendix D.22 Study 1 – Scaling Results Workload Analysis: Temporal Demand
Temporal demand
Helper Worker Combined
# Weight Rating W/R Weight Rating W/R Rating W/R
1 3.00 5.00 1.00 5.00 14.00 4.67 19.00 5.67
2 3.00 7.00 1.40 5.00 11.00 3.67 18.00 5.07
3 1.00 13.00 0.87 2.00 12.00 1.60 25.00 2.47
4 1.00 14.00 0.93 2.00 12.00 1.60 26.00 2.53
5 3.00 18.00 3.60 2.00 9.00 1.20 27.00 4.80
6 3.00 17.00 3.40 2.00 7.00 0.93 24.00 4.33
7 4.00 17.00 4.53 3.00 4.00 0.80 21.00 5.33

225
8 4.00 16.00 4.27 3.00 6.00 1.20 22.00 5.47
9 3.00 18.00 3.60 2.00 9.00 1.20 27.00 4.80
10 3.00 17.00 3.40 2.00 7.00 0.93 24.00 4.33
11 4.00 17.00 4.53 3.00 4.00 0.80 21.00 5.33
12 4.00 16.00 4.27 3.00 6.00 1.20 22.00 5.47
Sum: 36.00 175.00 35.80 34.00 101.00 19.80 276.00 55.60
Mean: 3.00 14.58 2.98 2.83 8.42 1.65 23.00 4.63
StdDev: (1.04) (4.29) (1.49) (1.11) (3.29) (1.22) (2.98) (1.09)
Appendix D.23 Study 1 – Scaling Results Workload Analysis: Performance
Performance
Helper Worker Combined
# Weight Rating W/R Weight Rating W/R Rating W/R
1 2.00 3.00 0.40 4.00 10.00 2.67 13.00 3.07
2 2.00 2.00 0.27 4.00 7.00 1.87 9.00 2.13
3 2.00 1.00 0.13 5.00 7.00 2.33 8.00 2.47
4 2.00 3.00 0.40 5.00 6.00 2.00 9.00 2.40
5 2.00 1.00 0.13 2.00 6.00 0.80 7.00 0.93
6 2.00 13.00 1.73 2.00 15.00 2.00 28.00 3.73
7 5.00 1.00 0.33 4.00 6.00 1.60 7.00 1.93
8 5.00 1.00 0.33 4.00 5.00 1.33 6.00 1.67
9 2.00 1.00 0.13 2.00 6.00 0.80 7.00 0.93
10 2.00 13.00 1.73 2.00 15.00 2.00 28.00 3.73
11 5.00 1.00 0.33 4.00 6.00 1.60 7.00 1.93
12 5.00 1.00 0.33 4.00 5.00 1.33 6.00 1.67
Sum: 36.00 41.00 6.27 42.00 94.00 20.33 135.00 26.60
Mean: 3.00 3.42 0.52 3.50 7.83 1.69 11.25 2.22
StdDev: (1.48) (4.54) (.57) (1.17) (3.59) (.57) (8.05) (.93)
Appendix D.24 Study 1 – Scaling Results Workload Analysis: Mental Demand
Effort
Helper Worker Combined
# Weight Rating W/R Weight Rating W/R Rating W/R
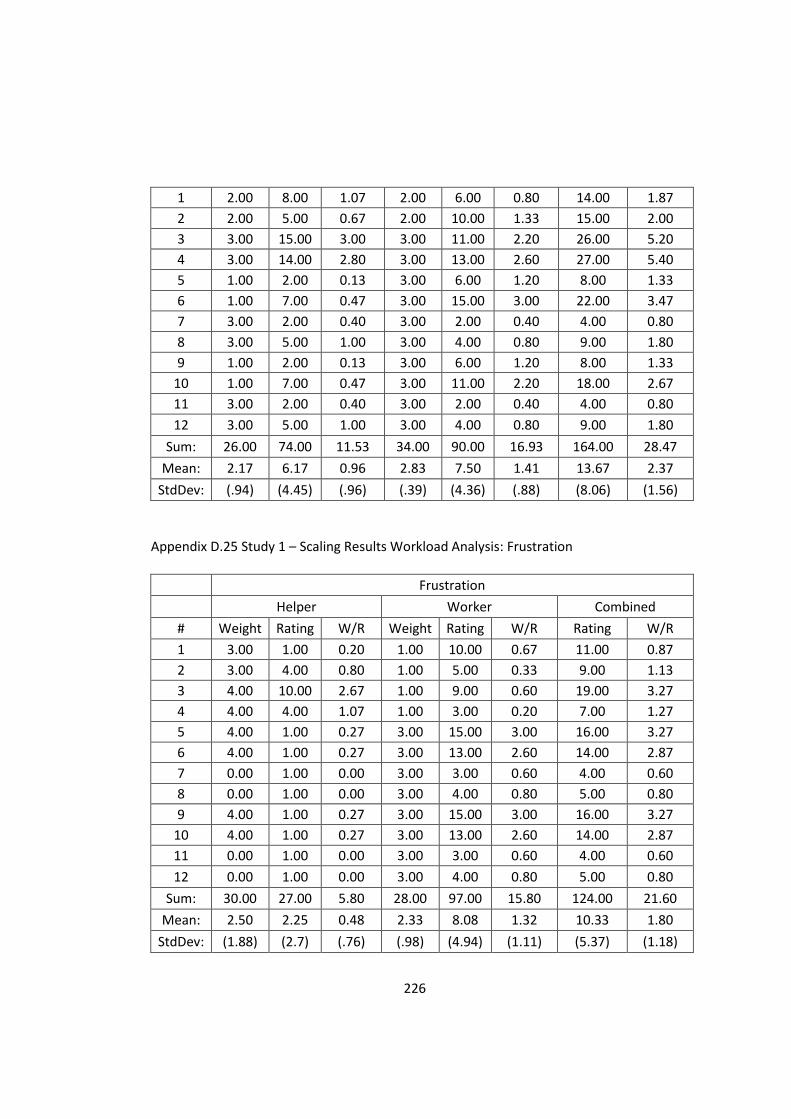
226
1 2.00 8.00 1.07 2.00 6.00 0.80 14.00 1.87
2 2.00 5.00 0.67 2.00 10.00 1.33 15.00 2.00
3 3.00 15.00 3.00 3.00 11.00 2.20 26.00 5.20
4 3.00 14.00 2.80 3.00 13.00 2.60 27.00 5.40
5 1.00 2.00 0.13 3.00 6.00 1.20 8.00 1.33
6 1.00 7.00 0.47 3.00 15.00 3.00 22.00 3.47
7 3.00 2.00 0.40 3.00 2.00 0.40 4.00 0.80
8 3.00 5.00 1.00 3.00 4.00 0.80 9.00 1.80
9 1.00 2.00 0.13 3.00 6.00 1.20 8.00 1.33
10 1.00 7.00 0.47 3.00 11.00 2.20 18.00 2.67
11 3.00 2.00 0.40 3.00 2.00 0.40 4.00 0.80
12 3.00 5.00 1.00 3.00 4.00 0.80 9.00 1.80
Sum: 26.00 74.00 11.53 34.00 90.00 16.93 164.00 28.47
Mean: 2.17 6.17 0.96 2.83 7.50 1.41 13.67 2.37
StdDev: (.94) (4.45) (.96) (.39) (4.36) (.88) (8.06) (1.56)
Appendix D.25 Study 1 – Scaling Results Workload Analysis: Frustration
Frustration
Helper Worker Combined
# Weight Rating W/R Weight Rating W/R Rating W/R
1 3.00 1.00 0.20 1.00 10.00 0.67 11.00 0.87
2 3.00 4.00 0.80 1.00 5.00 0.33 9.00 1.13
3 4.00 10.00 2.67 1.00 9.00 0.60 19.00 3.27
4 4.00 4.00 1.07 1.00 3.00 0.20 7.00 1.27
5 4.00 1.00 0.27 3.00 15.00 3.00 16.00 3.27
6 4.00 1.00 0.27 3.00 13.00 2.60 14.00 2.87
7 0.00 1.00 0.00 3.00 3.00 0.60 4.00 0.60
8 0.00 1.00 0.00 3.00 4.00 0.80 5.00 0.80
9 4.00 1.00 0.27 3.00 15.00 3.00 16.00 3.27
10 4.00 1.00 0.27 3.00 13.00 2.60 14.00 2.87
11 0.00 1.00 0.00 3.00 3.00 0.60 4.00 0.60
12 0.00 1.00 0.00 3.00 4.00 0.80 5.00 0.80
Sum: 30.00 27.00 5.80 28.00 97.00 15.80 124.00 21.60
Mean: 2.50 2.25 0.48 2.33 8.08 1.32 10.33 1.80
StdDev: (1.88) (2.7) (.76) (.98) (4.94) (1.11) (5.37) (1.18)

227
Appendix D.26 Study 1 – Mixed Results (Timing, Words, Events)
# Timing Words Events
3 86 111 11
3 131 156 33
3 128 230 30
3 245 228 42
3 162 241 18
3 113 194 36
3 105 230 33
3 121 184 26
3 106 245 12
3 110 187 20
3 180 189 23
3 200 212 13
Sum: 1687 2407 297
Mean: 140.58 200.58 24.75
StdDev: (46.92) (39.16) (10.23)
Appendix D.27 Study 1 – Mixed Results Workload Analysis: Mental Demand
Mental Demand
Helper Worker Combined
# Weight Rating W/R Weight Rating W/R Rating W/R
1 5.00 9.00 3.00 4.00 14.00 3.73 23.00 6.73
2 5.00 11.00 3.67 4.00 11.00 2.93 22.00 6.60
3 2.00 10.00 1.33 1.00 4.00 0.27 14.00 1.60
4 2.00 9.00 1.20 1.00 3.00 0.20 12.00 1.40
5 3.00 4.00 0.80 5.00 5.00 1.67 9.00 2.47
6 3.00 3.00 0.60 5.00 6.00 2.00 9.00 2.60
7 2.00 4.00 0.53 3.00 4.00 0.80 8.00 1.33
8 2.00 2.00 0.27 3.00 2.00 0.40 4.00 0.67
9 3.00 4.00 0.80 2.00 5.00 0.67 9.00 1.47
10 3.00 3.00 0.60 2.00 6.00 0.80 9.00 1.40
11 2.00 4.00 0.53 3.00 4.00 0.80 8.00 1.33
12 2.00 2.00 0.27 3.00 2.00 0.40 4.00 0.67

228
Sum: 34.00 65.00 13.60 36.00 66.00 14.67 131.00 28.27
Mean: 2.83 5.42 1.13 3.00 5.50 1.22 10.92 2.36
StdDev: (1.11) (3.32) (1.09) (1.35) (3.58) (1.14) (6.08) (2.09)
Appendix D.28 Study 1 – Mixed Results Workload Analysis: Physical Demand
Physical Demand
Helper Worker Combined
# Weight Rating W/R Weight Rating W/R Rating W/R
1 0.00 1.00 0.00 0.00 2.00 0.00 3.00 0.00
2 0.00 1.00 0.00 0.00 3.00 0.00 4.00 0.00
3 0.00 11.00 0.00 0.00 4.00 0.00 15.00 0.00
4 0.00 11.00 0.00 0.00 3.00 0.00 14.00 0.00
5 0.00 1.00 0.00 0.00 3.00 0.00 4.00 0.00
6 0.00 3.00 0.00 0.00 2.00 0.00 5.00 0.00
7 0.00 1.00 0.00 1.00 0.00 0.00 1.00 0.00
8 0.00 1.00 0.00 1.00 0.00 0.00 1.00 0.00
9 0.00 1.00 0.00 0.00 3.00 0.00 4.00 0.00
10 0.00 3.00 0.00 0.00 2.00 0.00 5.00 0.00
11 0.00 1.00 0.00 1.00 0.00 0.00 1.00 0.00
12 0.00 1.00 0.00 1.00 0.00 0.00 1.00 0.00
Sum: 0.00 36.00 0.00 4.00 22.00 0.00 58.00 0.00
Mean: 0.00 3.00 0.00 0.33 1.83 0.00 4.83 0.00
StdDev: (.) (3.81) (.) (.49) (1.47) (.) (4.78) (.)
Appendix D.29 Study 1 – Mixed Results Workload Analysis: Temporal Demand
Temporal demand
Helper Worker Combined
# Weight Rating W/R Weight Rating W/R Rating W/R
1 1.00 4.00 0.27 1.00 3.00 0.20 7.00 0.47
2 1.00 7.00 0.47 1.00 3.00 0.20 10.00 0.67
3 5.00 12.00 4.00 2.00 13.00 1.73 25.00 5.73
4 5.00 10.00 3.33 2.00 14.00 1.87 24.00 5.20
5 4.00 16.00 4.27 4.00 3.00 0.80 19.00 5.07
6 4.00 15.00 4.00 4.00 2.00 0.53 17.00 4.53
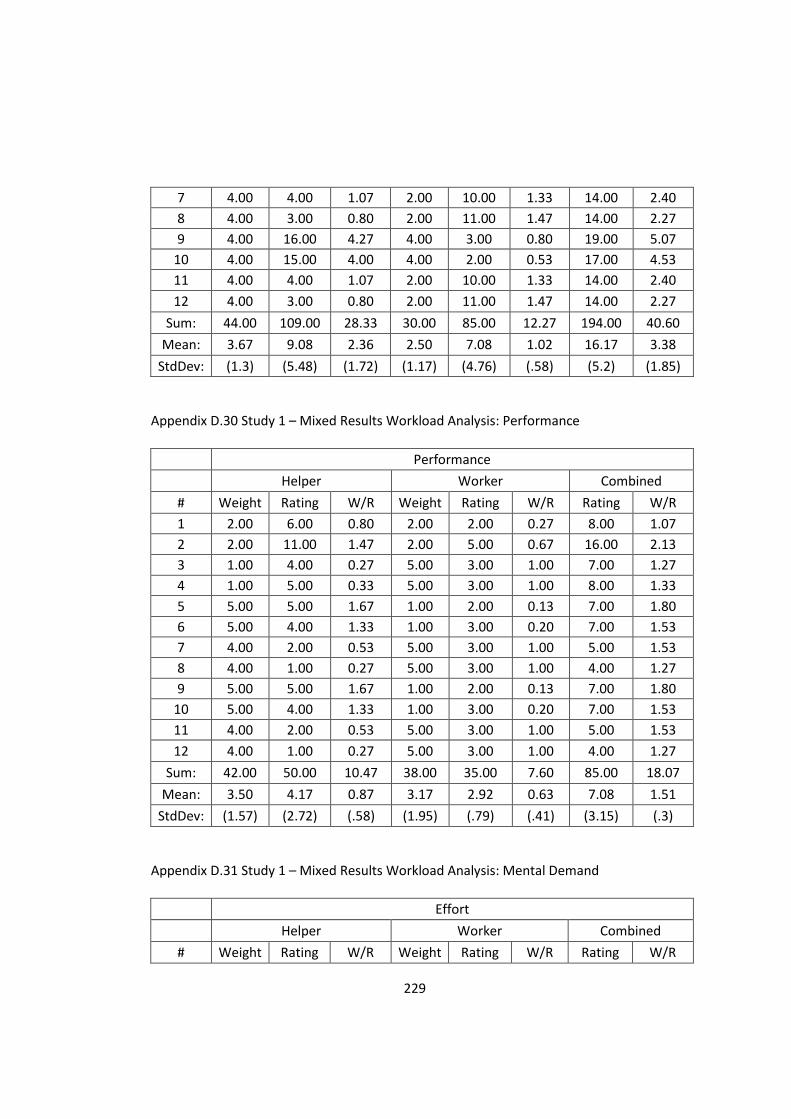
229
7 4.00 4.00 1.07 2.00 10.00 1.33 14.00 2.40
8 4.00 3.00 0.80 2.00 11.00 1.47 14.00 2.27
9 4.00 16.00 4.27 4.00 3.00 0.80 19.00 5.07
10 4.00 15.00 4.00 4.00 2.00 0.53 17.00 4.53
11 4.00 4.00 1.07 2.00 10.00 1.33 14.00 2.40
12 4.00 3.00 0.80 2.00 11.00 1.47 14.00 2.27
Sum: 44.00 109.00 28.33 30.00 85.00 12.27 194.00 40.60
Mean: 3.67 9.08 2.36 2.50 7.08 1.02 16.17 3.38
StdDev: (1.3) (5.48) (1.72) (1.17) (4.76) (.58) (5.2) (1.85)
Appendix D.30 Study 1 – Mixed Results Workload Analysis: Performance
Performance
Helper Worker Combined
# Weight Rating W/R Weight Rating W/R Rating W/R
1 2.00 6.00 0.80 2.00 2.00 0.27 8.00 1.07
2 2.00 11.00 1.47 2.00 5.00 0.67 16.00 2.13
3 1.00 4.00 0.27 5.00 3.00 1.00 7.00 1.27
4 1.00 5.00 0.33 5.00 3.00 1.00 8.00 1.33
5 5.00 5.00 1.67 1.00 2.00 0.13 7.00 1.80
6 5.00 4.00 1.33 1.00 3.00 0.20 7.00 1.53
7 4.00 2.00 0.53 5.00 3.00 1.00 5.00 1.53
8 4.00 1.00 0.27 5.00 3.00 1.00 4.00 1.27
9 5.00 5.00 1.67 1.00 2.00 0.13 7.00 1.80
10 5.00 4.00 1.33 1.00 3.00 0.20 7.00 1.53
11 4.00 2.00 0.53 5.00 3.00 1.00 5.00 1.53
12 4.00 1.00 0.27 5.00 3.00 1.00 4.00 1.27
Sum: 42.00 50.00 10.47 38.00 35.00 7.60 85.00 18.07
Mean: 3.50 4.17 0.87 3.17 2.92 0.63 7.08 1.51
StdDev: (1.57) (2.72) (.58) (1.95) (.79) (.41) (3.15) (.3)
Appendix D.31 Study 1 – Mixed Results Workload Analysis: Mental Demand
Effort
Helper Worker Combined
# Weight Rating W/R Weight Rating W/R Rating W/R

230
1 4.00 6.00 1.60 3.00 8.00 1.60 14.00 3.20
2 4.00 11.00 2.93 3.00 14.00 2.80 25.00 5.73
3 5.00 11.00 3.67 4.00 4.00 1.07 15.00 4.73
4 3.00 10.00 2.00 4.00 4.00 1.07 14.00 3.07
5 2.00 6.00 0.80 2.00 3.00 0.40 9.00 1.20
6 2.00 3.00 0.40 2.00 3.00 0.40 6.00 0.80
7 4.00 2.00 0.53 0.00 10.00 0.00 12.00 0.53
8 4.00 3.00 0.80 0.00 10.00 0.00 13.00 0.80
9 2.00 6.00 0.80 5.00 3.00 1.00 9.00 1.80
10 2.00 3.00 0.40 5.00 3.00 1.00 6.00 1.40
11 4.00 2.00 0.53 0.00 10.00 0.00 12.00 0.53
12 4.00 3.00 0.80 0.00 10.00 0.00 13.00 0.80
Sum: 40.00 66.00 15.27 28.00 82.00 9.33 148.00 24.60
Mean: 3.33 5.50 1.27 2.33 6.83 0.78 12.33 2.05
StdDev: (1.07) (3.45) (1.07) (1.97) (3.9) (.84) (5.02) (1.75)
Appendix D.32 Study 1 – Mixed Results Workload Analysis: Frustration
Frustration
Helper Worker Combined
# Weight Rating W/R Weight Rating W/R Rating W/R
1 3.00 1.00 0.20 5.00 12.00 4.00 13.00 4.20
2 3.00 8.00 1.60 5.00 13.00 4.33 21.00 5.93
3 2.00 14.00 1.87 3.00 1.00 0.20 15.00 2.07
4 4.00 11.00 2.93 3.00 2.00 0.40 13.00 3.33
5 1.00 3.00 0.20 3.00 5.00 1.00 8.00 1.20
6 1.00 3.00 0.20 3.00 4.00 0.80 7.00 1.00
7 1.00 7.00 0.47 4.00 12.00 3.20 19.00 3.67
8 1.00 1.00 0.07 4.00 4.00 1.07 5.00 1.13
9 1.00 3.00 0.20 3.00 5.00 1.00 8.00 1.20
10 1.00 3.00 0.20 3.00 4.00 0.80 7.00 1.00
11 1.00 7.00 0.47 4.00 12.00 3.20 19.00 3.67
12 1.00 1.00 0.07 4.00 4.00 1.07 5.00 1.13
Sum: 20.00 62.00 8.47 44.00 78.00 21.07 140.00 29.53
Mean: 1.67 5.17 0.71 3.67 6.50 1.76 11.67 2.46
StdDev: (1.07) (4.24) (.92) (.78) (4.4) (1.48) (5.79) (1.65)
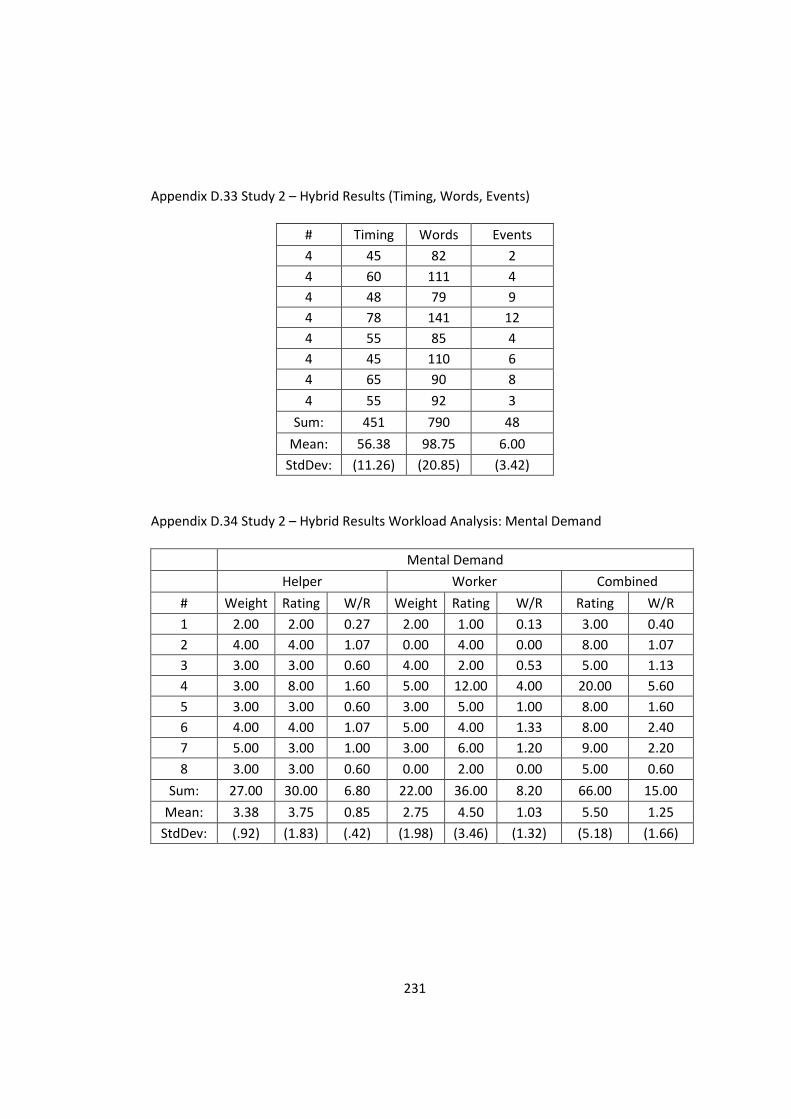
231
Appendix D.33 Study 2 – Hybrid Results (Timing, Words, Events)
# Timing Words Events
4 45 82 2
4 60 111 4
4 48 79 9
4 78 141 12
4 55 85 4
4 45 110 6
4 65 90 8
4 55 92 3
Sum: 451 790 48
Mean: 56.38 98.75 6.00
StdDev: (11.26) (20.85) (3.42)
Appendix D.34 Study 2 – Hybrid Results Workload Analysis: Mental Demand
Mental Demand
Helper Worker Combined
# Weight Rating W/R Weight Rating W/R Rating W/R
1 2.00 2.00 0.27 2.00 1.00 0.13 3.00 0.40
2 4.00 4.00 1.07 0.00 4.00 0.00 8.00 1.07
3 3.00 3.00 0.60 4.00 2.00 0.53 5.00 1.13
4 3.00 8.00 1.60 5.00 12.00 4.00 20.00 5.60
5 3.00 3.00 0.60 3.00 5.00 1.00 8.00 1.60
6 4.00 4.00 1.07 5.00 4.00 1.33 8.00 2.40
7 5.00 3.00 1.00 3.00 6.00 1.20 9.00 2.20
8 3.00 3.00 0.60 0.00 2.00 0.00 5.00 0.60
Sum: 27.00 30.00 6.80 22.00 36.00 8.20 66.00 15.00
Mean: 3.38 3.75 0.85 2.75 4.50 1.03 5.50 1.25
StdDev: (.92) (1.83) (.42) (1.98) (3.46) (1.32) (5.18) (1.66)

232
Appendix D.35 Study 2 – Hybrid Results Workload Analysis: Physical Demand
Physical Demand
Helper Worker Combined
# Weight Rating W/R Weight Rating W/R Rating W/R
1 0.00 2.00 0.00 0.00 1.00 0.00 3.00 0.00
2 0.00 2.00 0.00 5.00 4.00 1.33 6.00 1.33
3 0.00 1.00 0.00 2.00 1.00 0.13 2.00 0.13
4 1.00 4.00 0.27 0.00 1.00 0.00 5.00 0.27
5 0.00 3.00 0.00 1.00 1.00 0.07 4.00 0.07
6 1.00 4.00 0.27 2.00 2.00 0.27 6.00 0.53
7 1.00 2.00 0.13 3.00 2.00 0.40 4.00 0.53
8 1.00 2.00 0.13 0.00 2.00 0.00 4.00 0.13
Sum: 4.00 20.00 0.80 13.00 14.00 2.20 34.00 3.00
Mean: 0.50 2.50 0.10 1.63 1.75 0.28 2.83 0.25
StdDev: (.53) (1.07) (.12) (1.77) (1.04) (.45) (1.39) (.44)
Appendix D.36 Study 2 – Hybrid Results Workload Analysis: Temporal Demand
Temporal demand
Helper Worker Combined
# Weight Rating W/R Weight Rating W/R Rating W/R
1 3.00 4.00 0.80 2.00 2.00 0.27 6.00 1.07
2 3.00 6.00 1.20 1.00 8.00 0.53 14.00 1.73
3 3.00 9.00 1.80 0.00 3.00 0.00 12.00 1.80
4 4.00 14.00 3.73 3.00 5.00 1.00 19.00 4.73
5 3.00 8.00 1.60 2.00 4.00 0.53 12.00 2.13
6 4.00 5.00 1.33 2.00 5.00 0.67 10.00 2.00
7 2.00 6.00 0.80 2.00 6.00 0.80 12.00 1.60
8 3.00 5.00 1.00 2.00 3.00 0.40 8.00 1.40
Sum: 25.00 57.00 12.27 14.00 36.00 4.20 93.00 16.47
Mean: 3.13 7.13 1.53 1.75 4.50 0.53 7.75 1.37
StdDev: (.64) (3.23) (.96) (.89) (1.93) (.31) (3.93) (1.13)

233
Appendix D.37 Study 2 – Hybrid Results Workload Analysis: Performance
Performance
Helper Worker Combined
# Weight Rating W/R Weight Rating W/R Rating W/R
1 5.00 1.00 0.33 5.00 1.00 0.33 2.00 0.67
2 5.00 5.00 1.67 2.00 1.00 0.13 6.00 1.80
3 5.00 1.00 0.33 5.00 1.00 0.33 2.00 0.67
4 5.00 1.00 0.33 4.00 1.00 0.27 2.00 0.60
5 5.00 1.00 0.33 4.00 1.00 0.27 2.00 0.60
6 3.00 1.00 0.20 2.00 1.00 0.13 2.00 0.33
7 2.00 1.00 0.13 3.00 1.00 0.20 2.00 0.33
8 4.00 3.00 0.80 5.00 1.00 0.33 4.00 1.13
Sum: 34.00 14.00 4.13 30.00 8.00 2.00 22.00 6.13
Mean: 4.25 1.75 0.52 3.75 1.00 0.25 1.83 0.51
StdDev: (1.16) (1.49) (.5) (1.28) (.) (.09) (1.49) (.49)
Appendix D.38 Study 2 – Hybrid Results Workload Analysis: Effort
Effort
Helper Worker Combined
# Weight Rating W/R Weight Rating W/R Rating W/R
1 1.00 2.00 0.13 4.00 2.00 0.53 4.00 0.67
2 2.00 4.00 0.53 4.00 3.00 0.80 7.00 1.33
3 3.00 6.00 1.20 1.00 2.00 0.13 8.00 1.33
4 2.00 12.00 1.60 1.00 12.00 0.80 24.00 2.40
5 3.00 6.00 1.20 2.00 5.00 0.67 11.00 1.87
6 2.00 5.00 0.67 2.00 4.00 0.53 9.00 1.20
7 3.00 7.00 1.40 3.00 5.00 1.00 12.00 2.40
8 1.00 3.00 0.20 4.00 2.00 0.53 5.00 0.73
Sum: 17.00 45.00 6.93 21.00 35.00 5.00 80.00 11.93
Mean: 2.13 5.63 0.87 2.63 4.38 0.63 6.67 0.99
StdDev: (.83) (3.07) (.56) (1.3) (3.34) (.26) (6.28) (.67)

234
Appendix D.39 Study 2 – Hybrid Results Workload Analysis: Frustration
Frustration
Helper Worker Combined
Weight Rating W/R Weight Rating W/R Rating W/R
4.00 2.00 0.53 2.00 1.00 0.13 3.00 0.67
1.00 5.00 0.33 3.00 5.00 1.00 10.00 1.33
1.00 3.00 0.20 3.00 2.00 0.40 5.00 0.60
0.00 8.00 0.00 2.00 5.00 0.67 13.00 0.67
1.00 4.00 0.27 3.00 3.00 0.60 7.00 0.87
1.00 5.00 0.33 2.00 4.00 0.53 9.00 0.87
2.00 3.00 0.40 1.00 3.00 0.20 6.00 0.60
3.00 3.00 0.60 4.00 3.00 0.80 6.00 1.40
13.00 33.00 2.67 20.00 26.00 4.33 59.00 7.00
1.63 4.13 0.33 2.50 3.25 0.54 4.92 0.58
(1.3) (1.89) (.19) (.93) (1.39) (.29) (3.16) (.32)
Related Documents