Archaeological Geophysical Survey in Peatland Environments: Case Study Survey at Flag Fen, (Area 2), Peterborough, Cambridgeshire May 2008 Appendices A, B & C

Welcome message from author
This document is posted to help you gain knowledge. Please leave a comment to let me know what you think about it! Share it to your friends and learn new things together.
Transcript
Archaeological Geophysical Survey in Peatland Environments:
Case Study Survey at Flag Fen, (Area 2), Peterborough, Cambridgeshire
May 2008
Appendices A, B & C
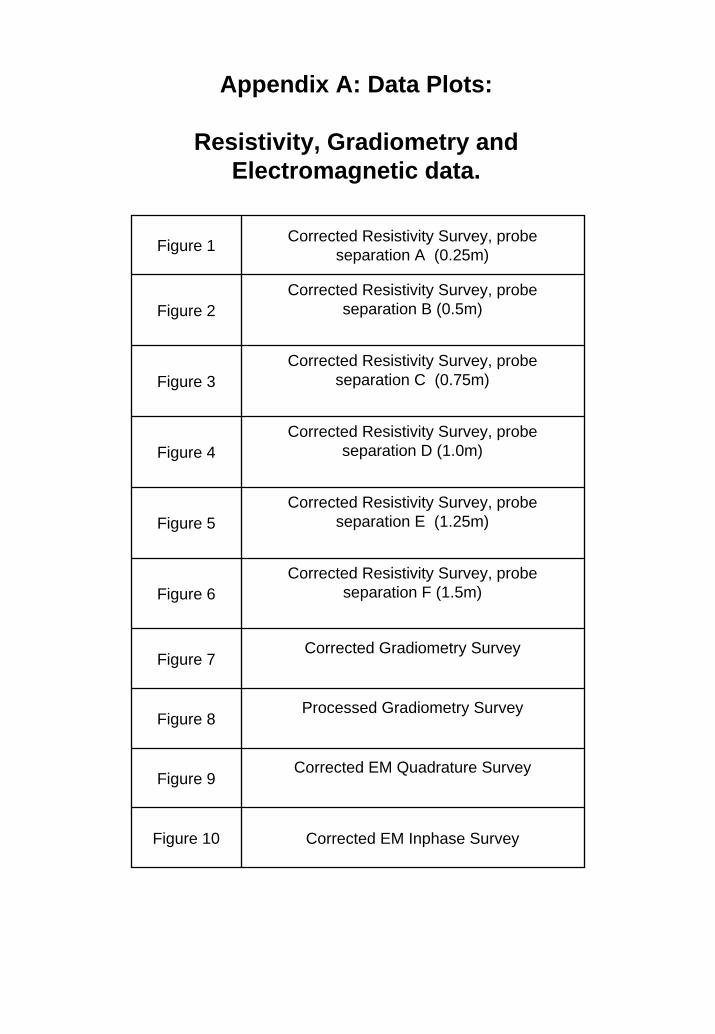
Appendix A: Data Plots:
Resistivity, Gradiometry and Electromagnetic data.
Figure 1 Corrected Resistivity Survey, probe separation A (0.25m)
Figure 2Corrected Resistivity Survey, probe
separation B (0.5m)
Figure 3Corrected Resistivity Survey, probe
separation C (0.75m)
Figure 4Corrected Resistivity Survey, probe
separation D (1.0m)
Figure 5Corrected Resistivity Survey, probe
separation E (1.25m)
Figure 6Corrected Resistivity Survey, probe
separation F (1.5m)
Figure 7Corrected Gradiometry Survey
Figure 8Processed Gradiometry Survey
Figure 9Corrected EM Quadrature Survey
Figure 10 Corrected EM Inphase Survey
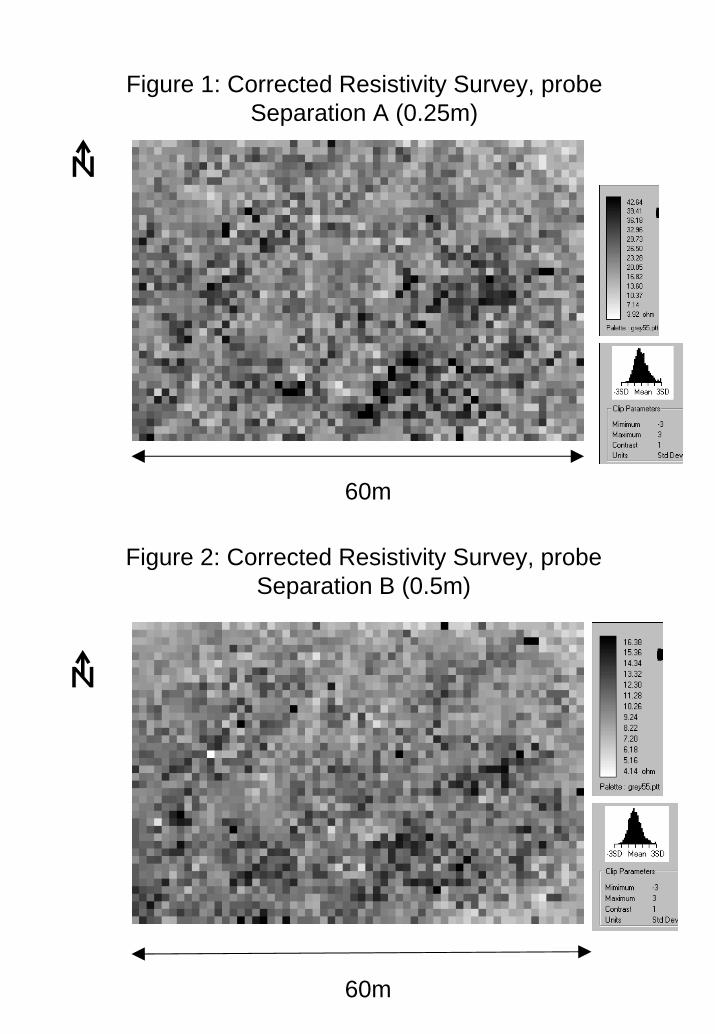
Figure 1: Corrected Resistivity Survey, probeSeparation A (0.25m)
a
60m
Figure 2: Corrected Resistivity Survey, probeSeparation B (0.5m)
a
60m
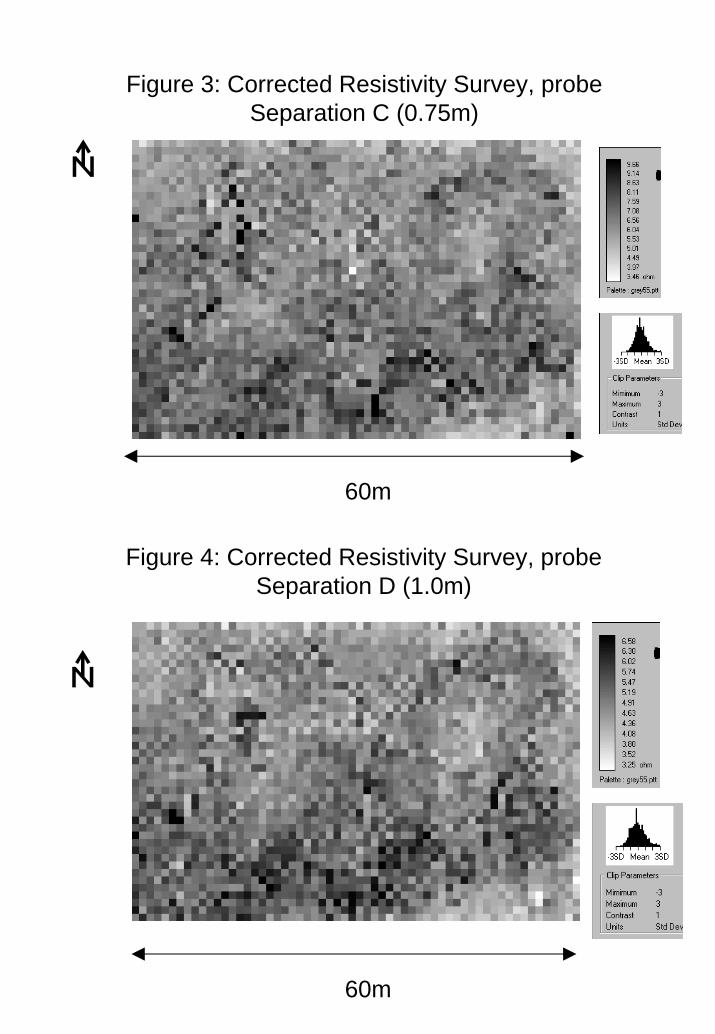
Figure 3: Corrected Resistivity Survey, probeSeparation C (0.75m)
a
60m
Figure 4: Corrected Resistivity Survey, probeSeparation D (1.0m)
a
60m
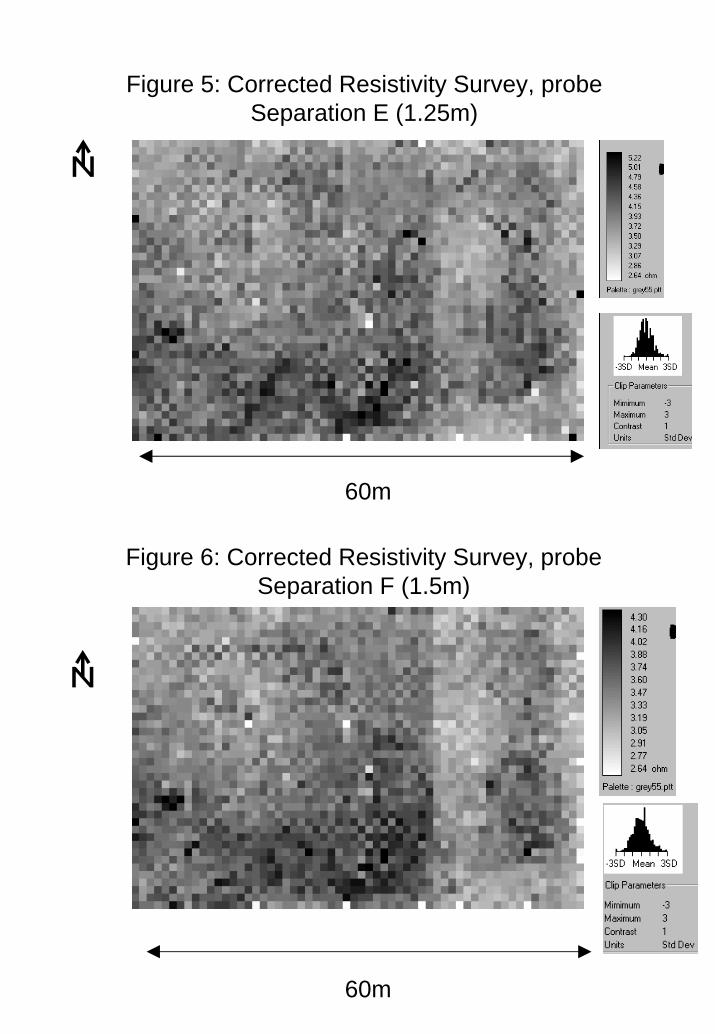
Figure 5: Corrected Resistivity Survey, probeSeparation E (1.25m)
a
60m
Figure 6: Corrected Resistivity Survey, probeSeparation F (1.5m)
a
60m
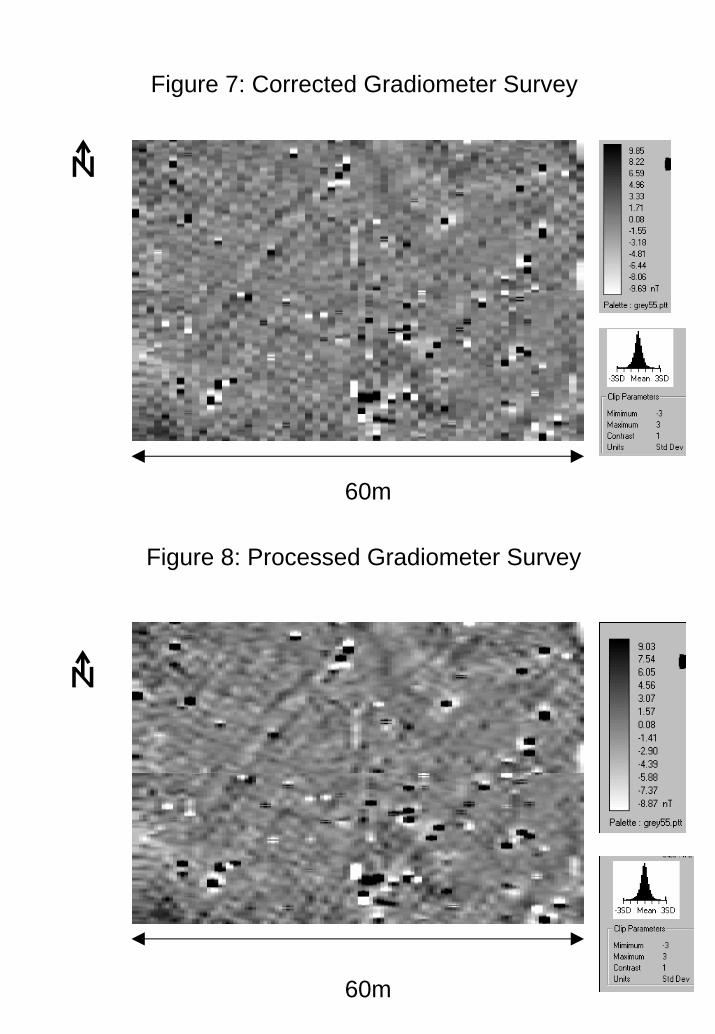
Figure 7: Corrected Gradiometer Survey
a
60m
Figure 8: Processed Gradiometer Survey
a
60m
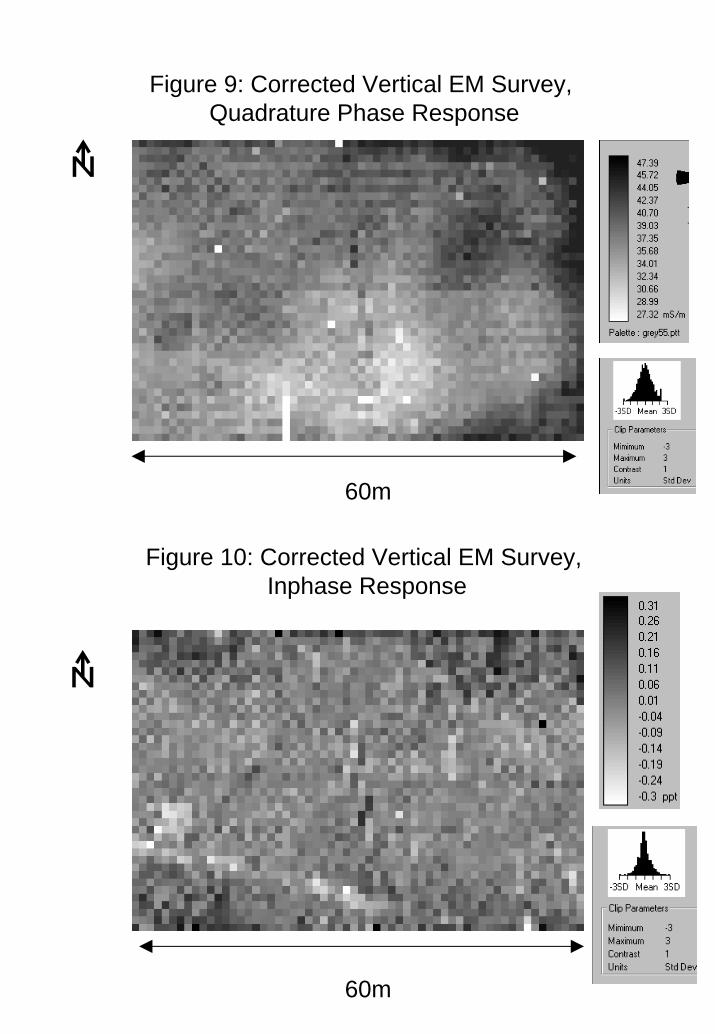
Figure 9: Corrected Vertical EM Survey, Quadrature Phase Response
a
60m
Figure 10: Corrected Vertical EM Survey,Inphase Response
a
60m
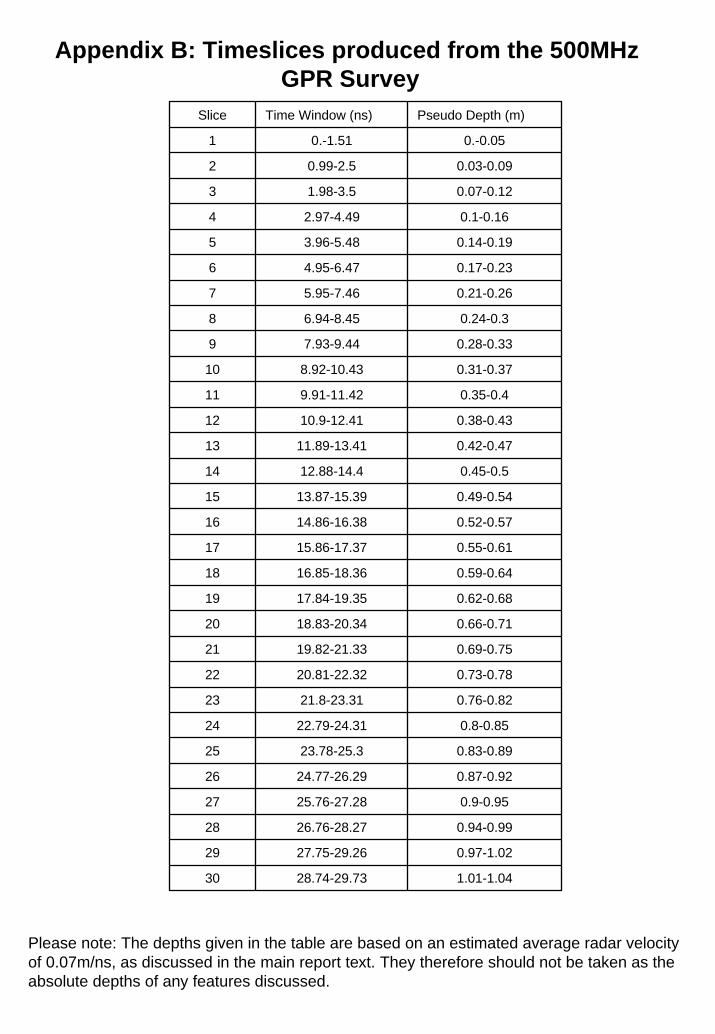
Appendix B: Timeslices produced from the 500MHz GPR Survey
Slice Time Window (ns) Pseudo Depth (m)
1 0.-1.51 0.-0.05
2 0.99-2.5 0.03-0.09
3 1.98-3.5 0.07-0.12
4 2.97-4.49 0.1-0.16
5 3.96-5.48 0.14-0.19
6 4.95-6.47 0.17-0.23
7 5.95-7.46 0.21-0.26
8 6.94-8.45 0.24-0.3
9 7.93-9.44 0.28-0.33
10 8.92-10.43 0.31-0.37
11 9.91-11.42 0.35-0.4
12 10.9-12.41 0.38-0.43
13 11.89-13.41 0.42-0.47
14 12.88-14.4 0.45-0.5
15 13.87-15.39 0.49-0.54
16 14.86-16.38 0.52-0.57
17 15.86-17.37 0.55-0.61
18 16.85-18.36 0.59-0.64
19 17.84-19.35 0.62-0.68
20 18.83-20.34 0.66-0.71
21 19.82-21.33 0.69-0.75
22 20.81-22.32 0.73-0.78
23 21.8-23.31 0.76-0.82
24 22.79-24.31 0.8-0.85
25 23.78-25.3 0.83-0.89
26 24.77-26.29 0.87-0.92
27 25.76-27.28 0.9-0.95
28 26.76-28.27 0.94-0.99
29 27.75-29.26 0.97-1.02
30 28.74-29.73 1.01-1.04
Please note: The depths given in the table are based on an estimated average radar velocity of 0.07m/ns, as discussed in the main report text. They therefore should not be taken as the absolute depths of any features discussed.
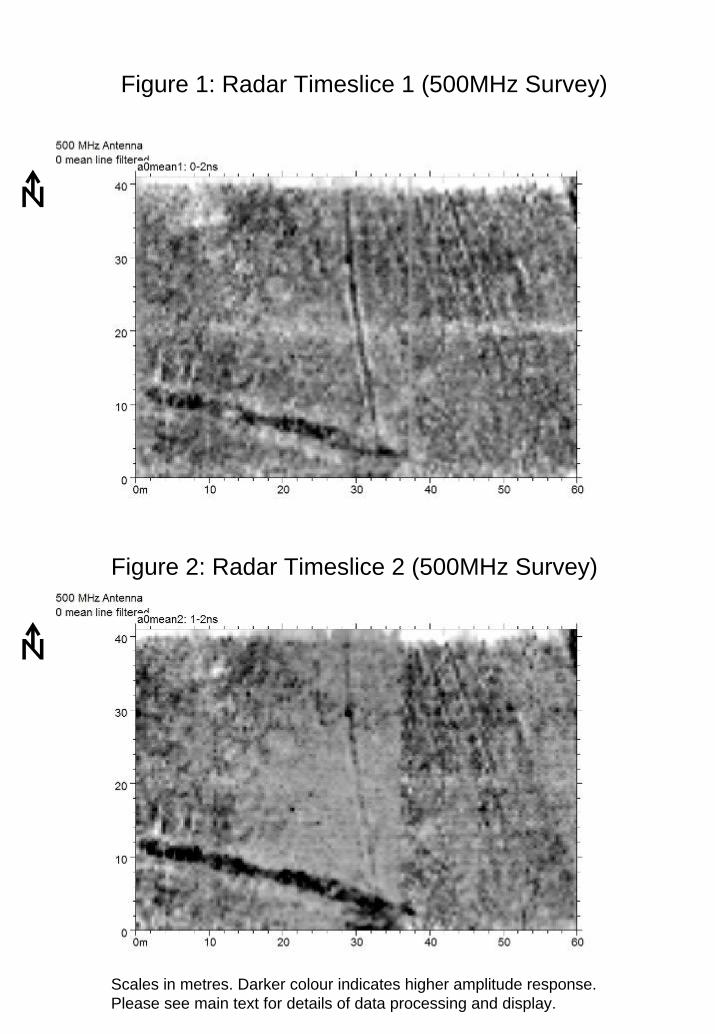
Figure 1: Radar Timeslice 1 (500MHz Survey)
a
Figure 2: Radar Timeslice 2 (500MHz Survey)
a
Scales in metres. Darker colour indicates higher amplitude response. Please see main text for details of data processing and display.
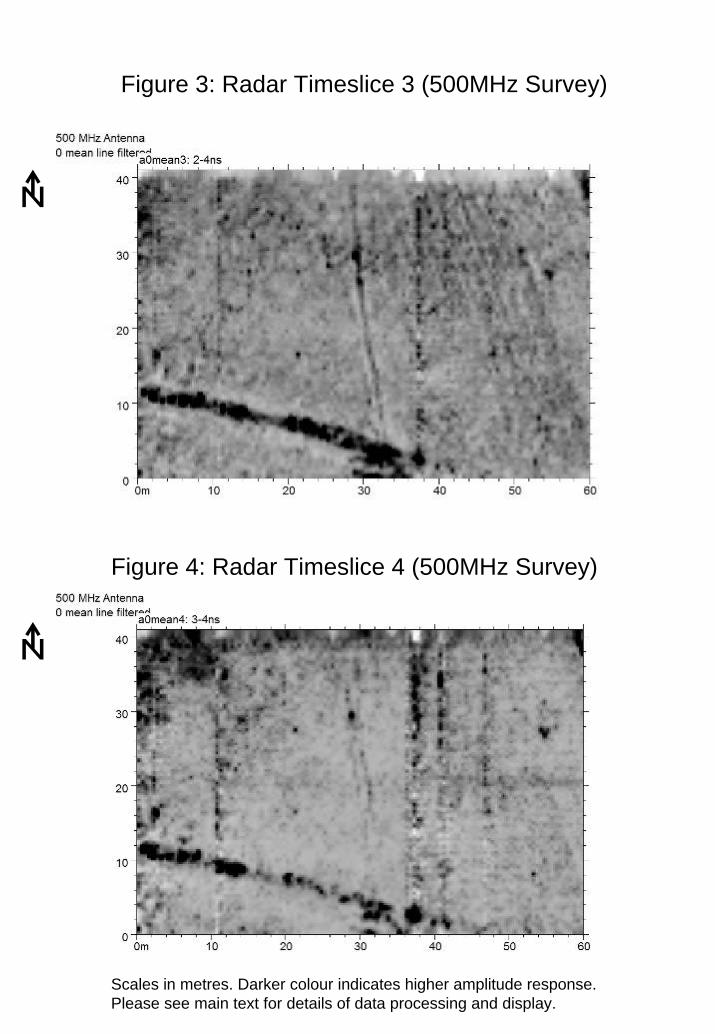
Figure 3: Radar Timeslice 3 (500MHz Survey)
a
a
Figure 4: Radar Timeslice 4 (500MHz Survey)
Scales in metres. Darker colour indicates higher amplitude response. Please see main text for details of data processing and display.
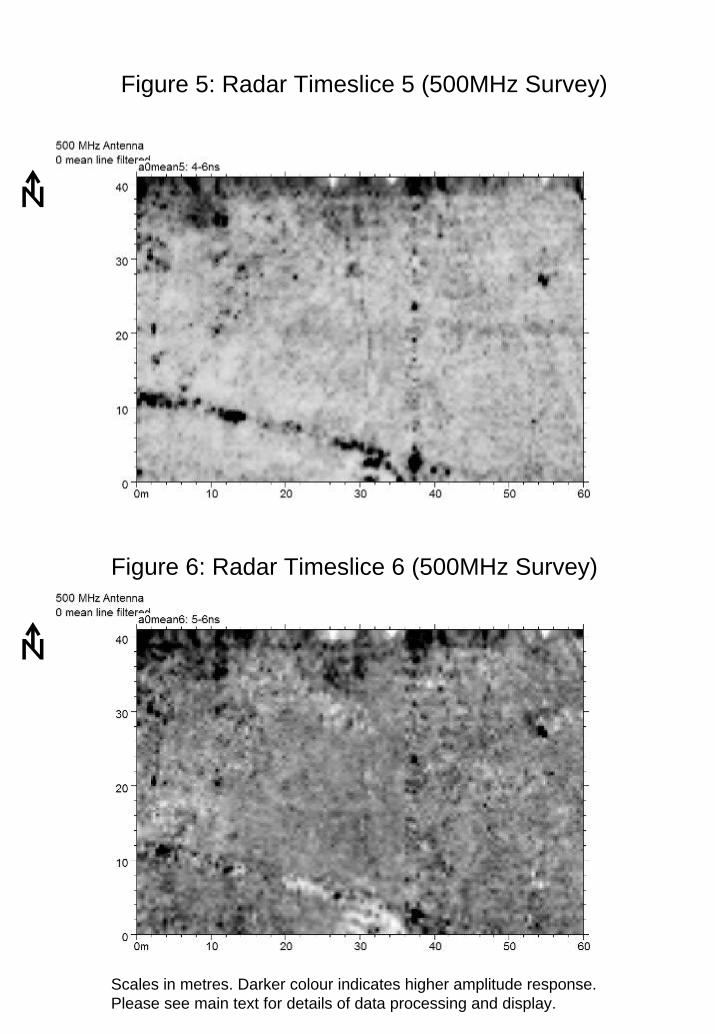
Figure 5: Radar Timeslice 5 (500MHz Survey)
a
a
Figure 6: Radar Timeslice 6 (500MHz Survey)
Scales in metres. Darker colour indicates higher amplitude response. Please see main text for details of data processing and display.
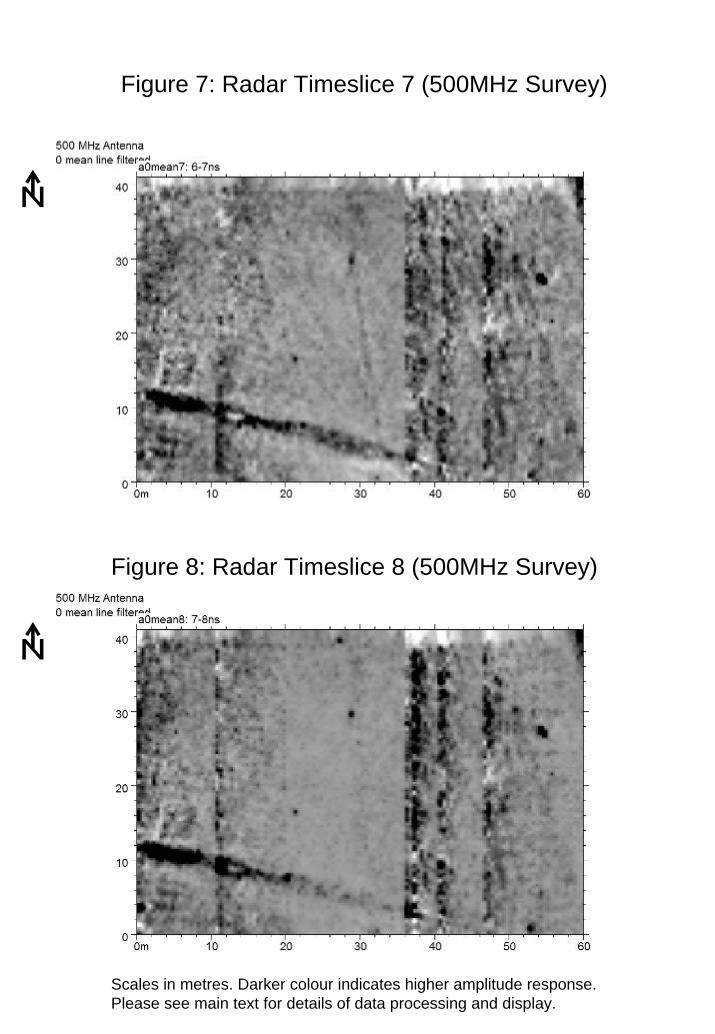
Figure 7: Radar Timeslice 7 (500MHz Survey)
a
a
Figure 8: Radar Timeslice 8 (500MHz Survey)
Scales in metres. Darker colour indicates higher amplitude response. Please see main text for details of data processing and display.
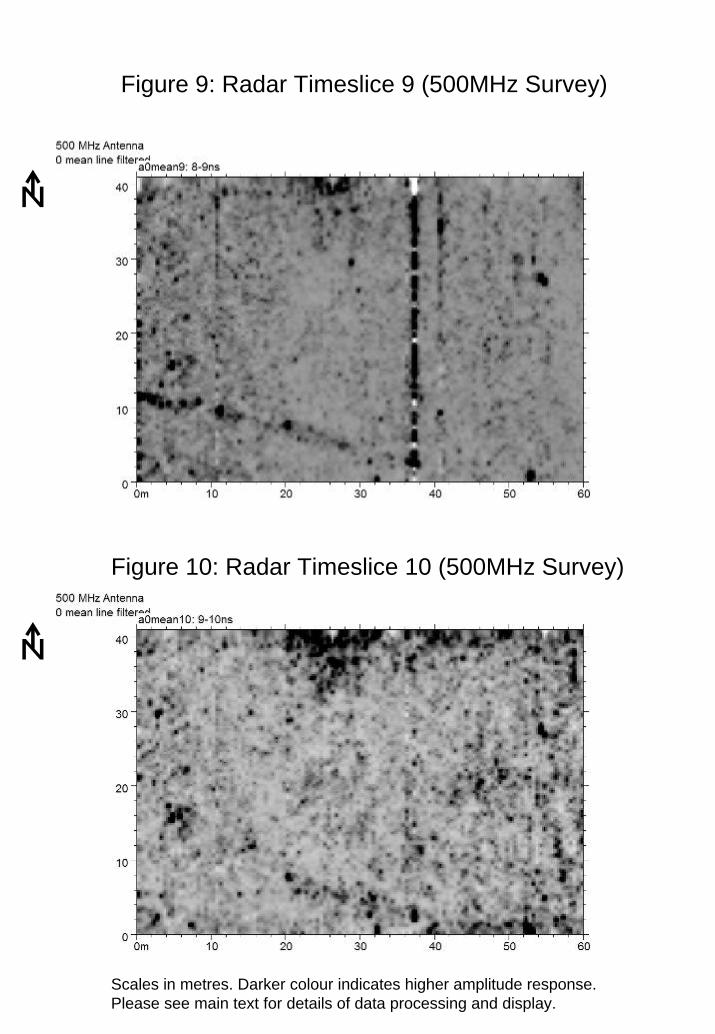
Figure 9: Radar Timeslice 9 (500MHz Survey)
a
a
Figure 10: Radar Timeslice 10 (500MHz Survey)
Scales in metres. Darker colour indicates higher amplitude response. Please see main text for details of data processing and display.
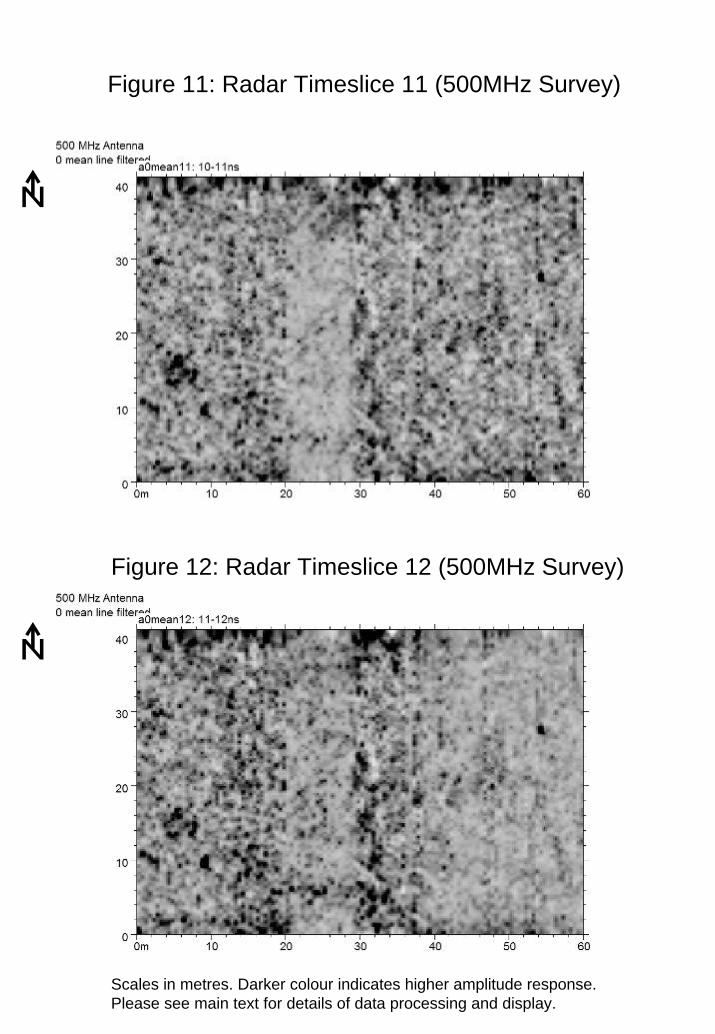
Figure 11: Radar Timeslice 11 (500MHz Survey)
a
a
Figure 12: Radar Timeslice 12 (500MHz Survey)
Scales in metres. Darker colour indicates higher amplitude response. Please see main text for details of data processing and display.
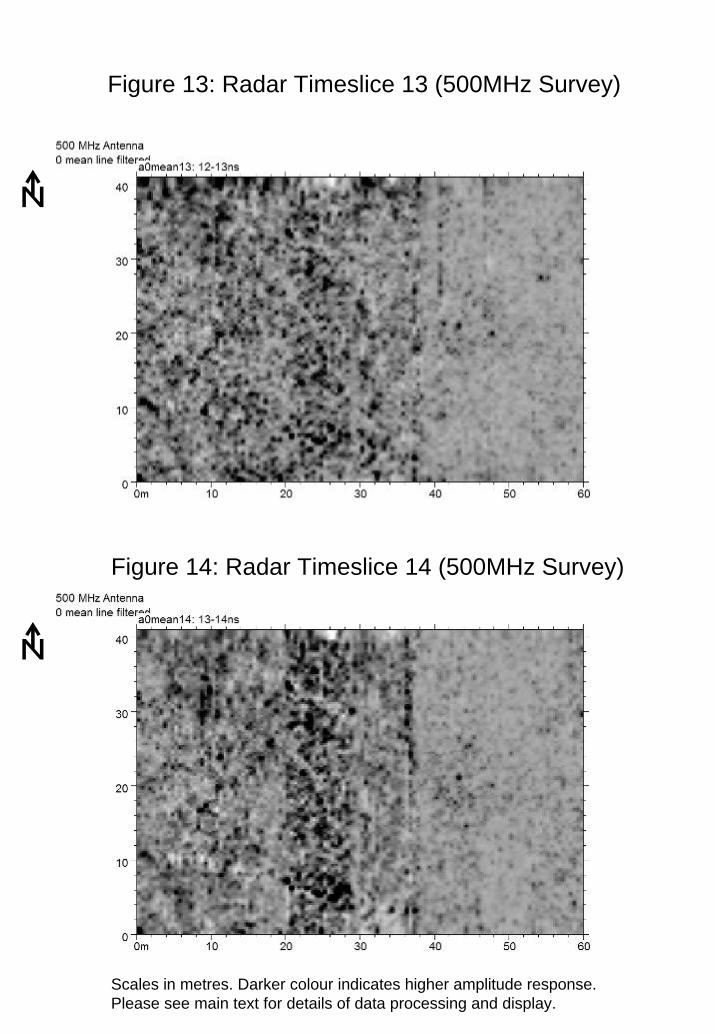
Figure 13: Radar Timeslice 13 (500MHz Survey)
a
a
Figure 14: Radar Timeslice 14 (500MHz Survey)
Scales in metres. Darker colour indicates higher amplitude response. Please see main text for details of data processing and display.
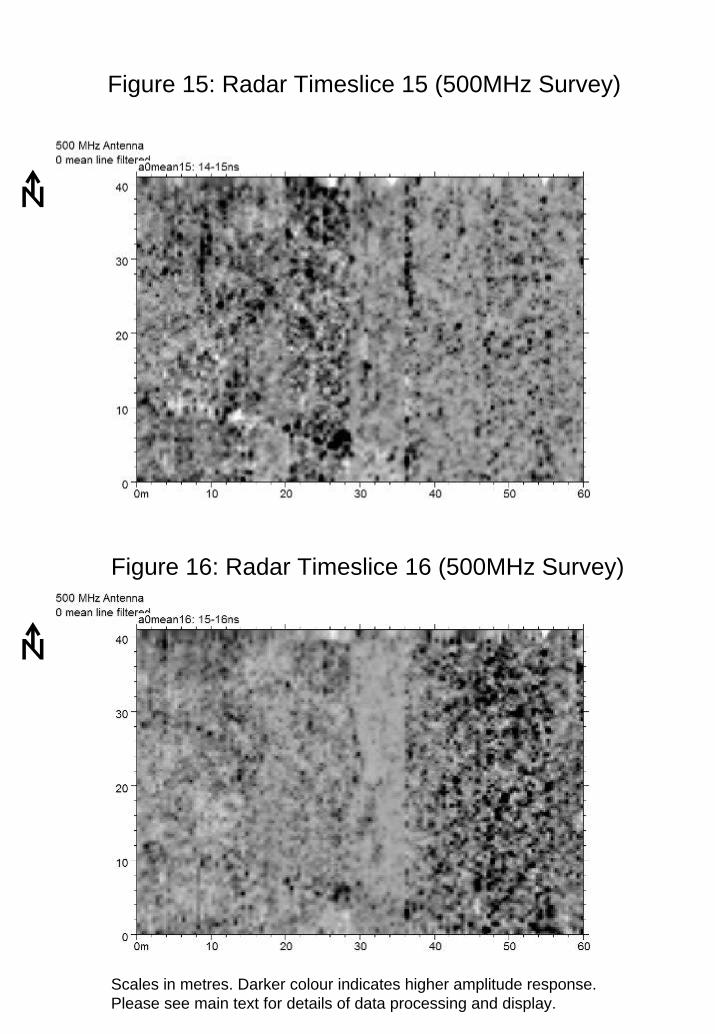
Figure 15: Radar Timeslice 15 (500MHz Survey)
a
a
Figure 16: Radar Timeslice 16 (500MHz Survey)
Scales in metres. Darker colour indicates higher amplitude response. Please see main text for details of data processing and display.
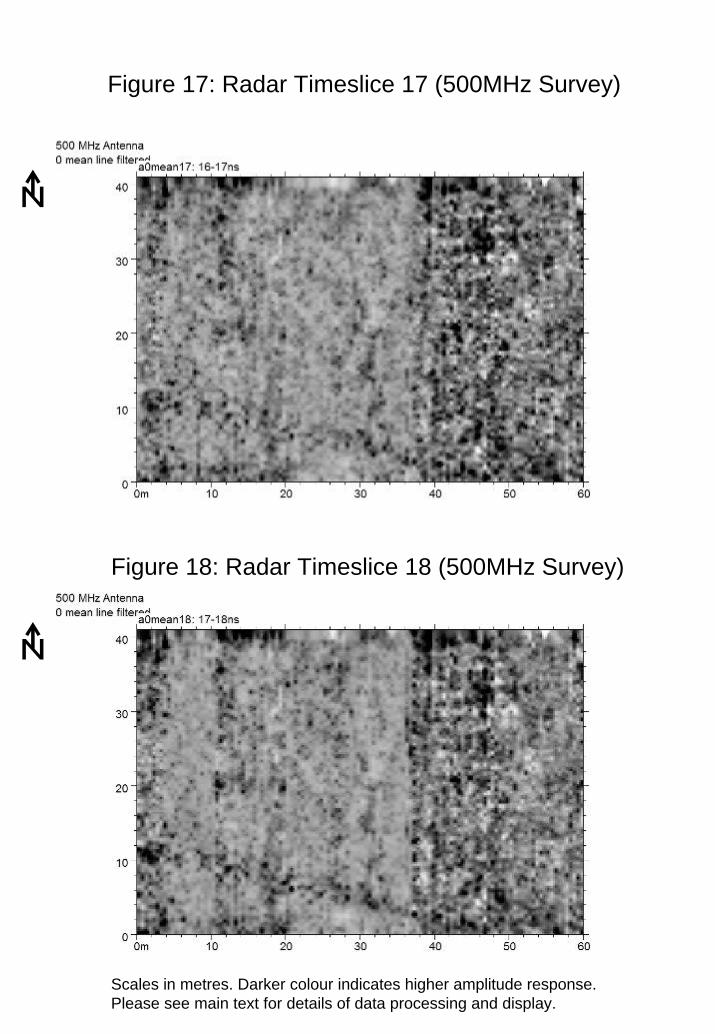
Figure 17: Radar Timeslice 17 (500MHz Survey)
a
a
Figure 18: Radar Timeslice 18 (500MHz Survey)
Scales in metres. Darker colour indicates higher amplitude response. Please see main text for details of data processing and display.
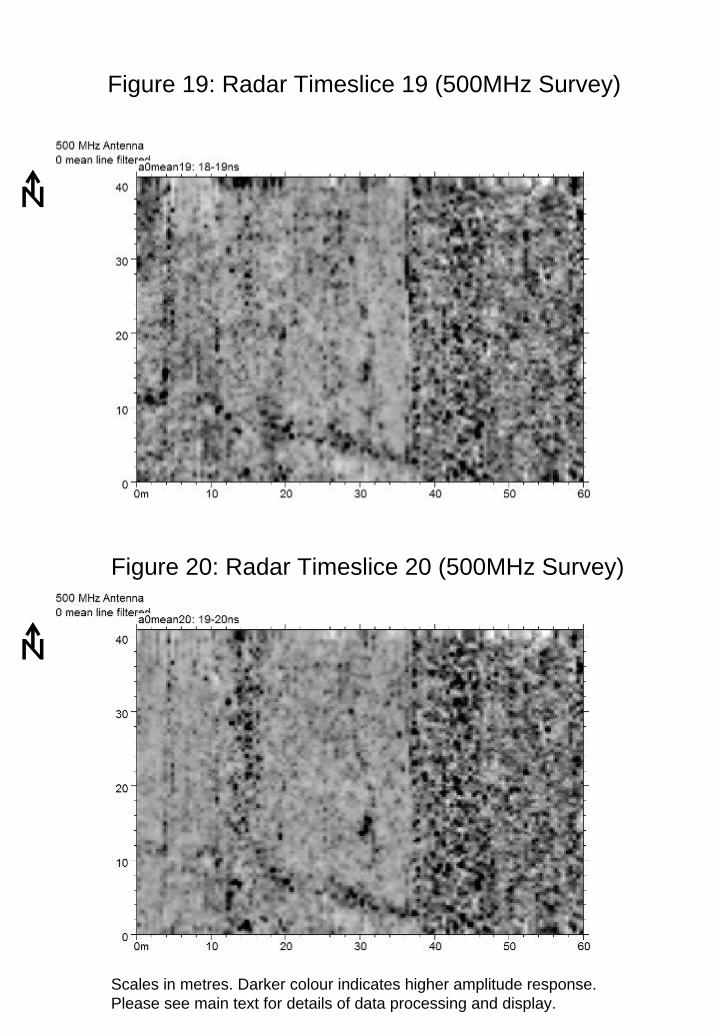
Figure 19: Radar Timeslice 19 (500MHz Survey)
a
a
Figure 20: Radar Timeslice 20 (500MHz Survey)
Scales in metres. Darker colour indicates higher amplitude response. Please see main text for details of data processing and display.
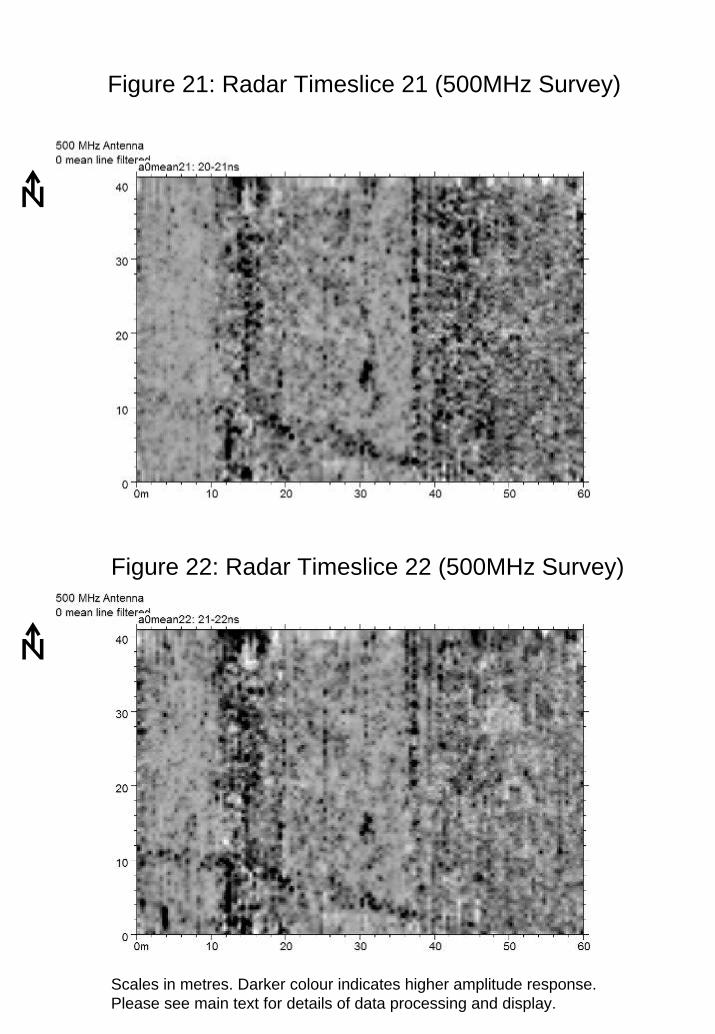
Figure 21: Radar Timeslice 21 (500MHz Survey)
a
a
Figure 22: Radar Timeslice 22 (500MHz Survey)
Scales in metres. Darker colour indicates higher amplitude response. Please see main text for details of data processing and display.
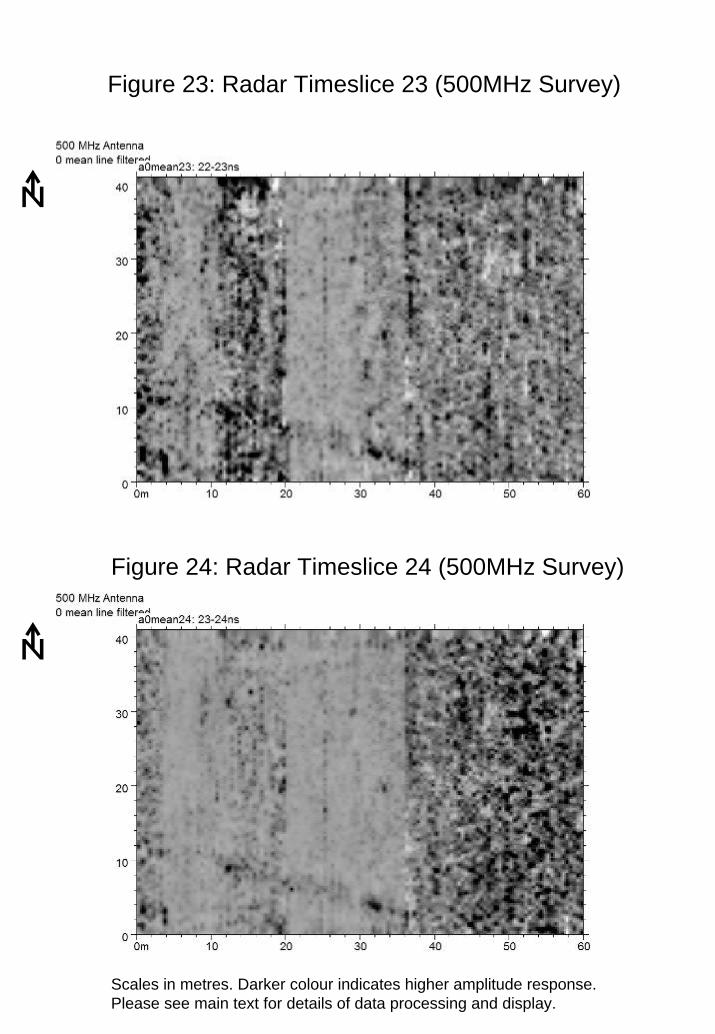
Figure 23: Radar Timeslice 23 (500MHz Survey)
a
a
Figure 24: Radar Timeslice 24 (500MHz Survey)
Scales in metres. Darker colour indicates higher amplitude response. Please see main text for details of data processing and display.
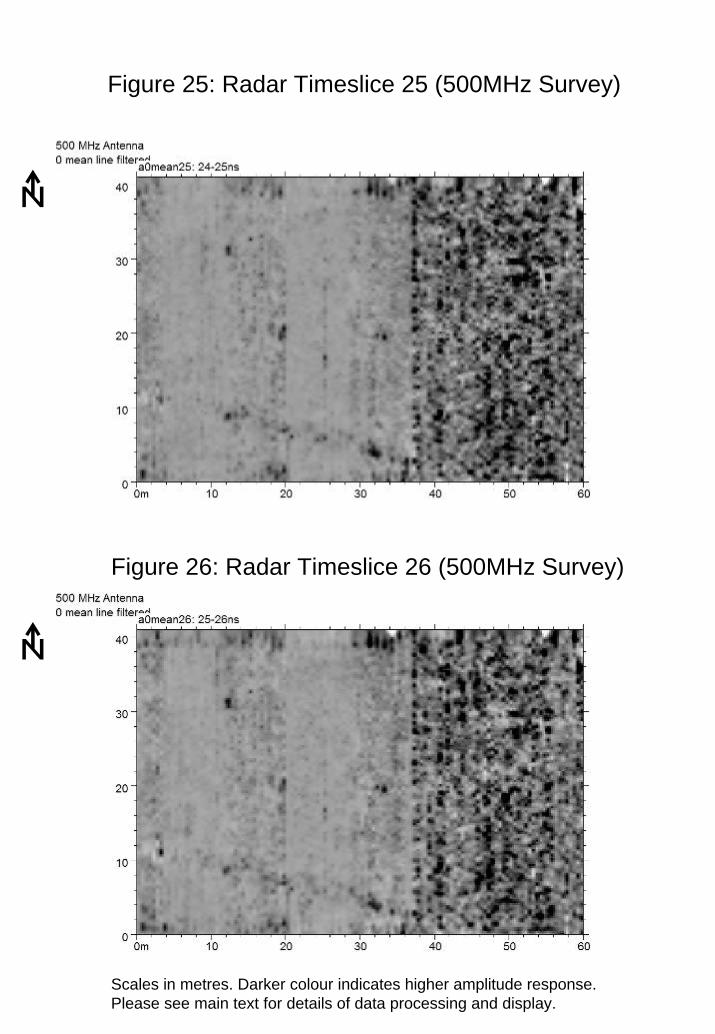
Figure 25: Radar Timeslice 25 (500MHz Survey)
a
a
Figure 26: Radar Timeslice 26 (500MHz Survey)
Scales in metres. Darker colour indicates higher amplitude response. Please see main text for details of data processing and display.
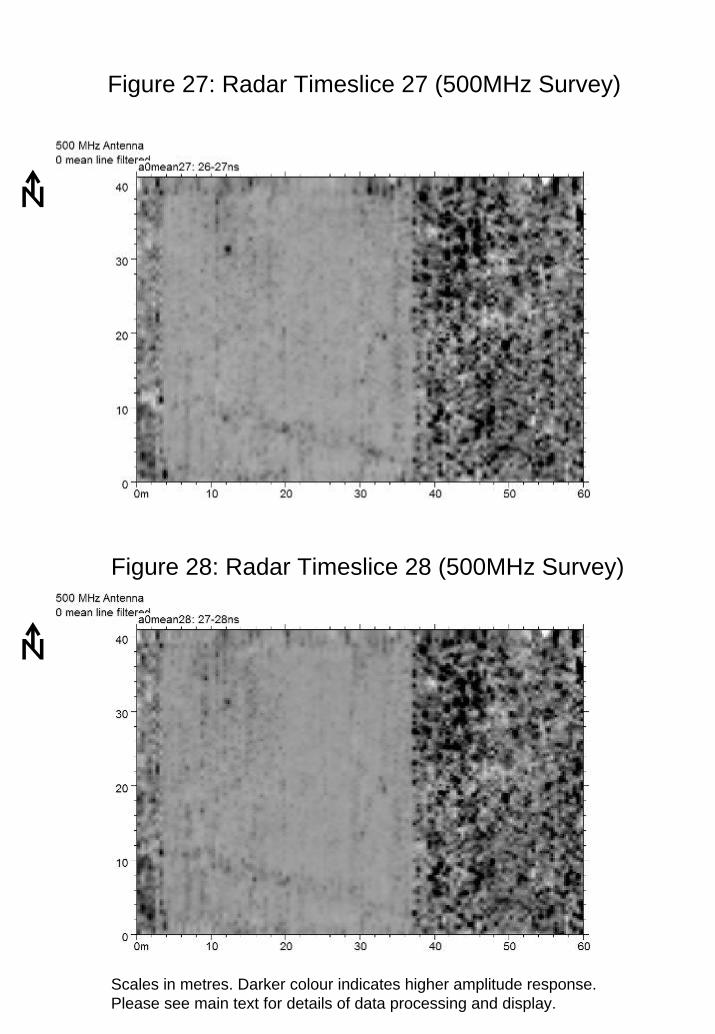
Figure 27: Radar Timeslice 27 (500MHz Survey)
a
a
Figure 28: Radar Timeslice 28 (500MHz Survey)
Scales in metres. Darker colour indicates higher amplitude response. Please see main text for details of data processing and display.
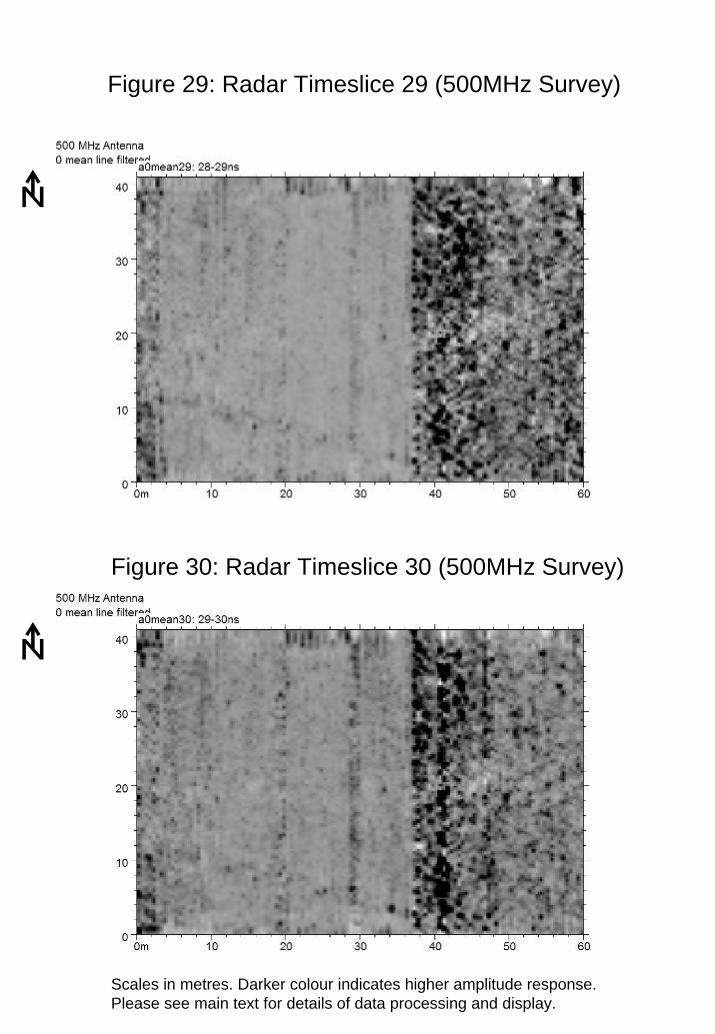
Figure 29: Radar Timeslice 29 (500MHz Survey)
a
a
Figure 30: Radar Timeslice 30 (500MHz Survey)
Scales in metres. Darker colour indicates higher amplitude response. Please see main text for details of data processing and display.
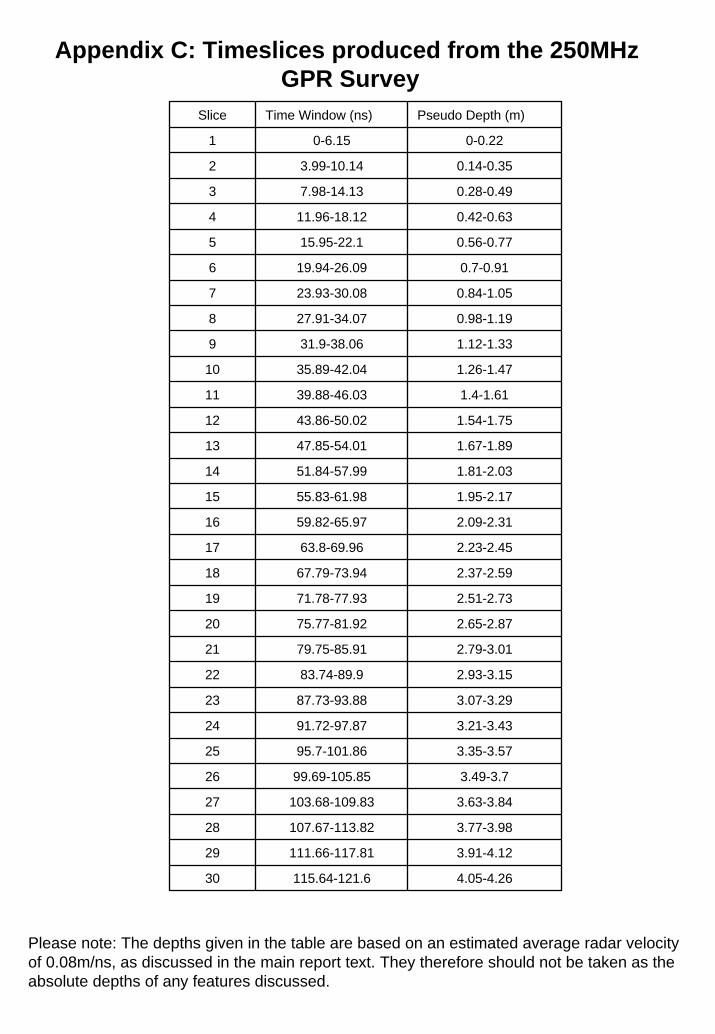
Appendix C: Timeslices produced from the 250MHz GPR Survey
Slice Time Window (ns) Pseudo Depth (m)
1 0-6.15 0-0.22
2 3.99-10.14 0.14-0.35
3 7.98-14.13 0.28-0.49
4 11.96-18.12 0.42-0.63
5 15.95-22.1 0.56-0.77
6 19.94-26.09 0.7-0.91
7 23.93-30.08 0.84-1.05
8 27.91-34.07 0.98-1.19
9 31.9-38.06 1.12-1.33
10 35.89-42.04 1.26-1.47
11 39.88-46.03 1.4-1.61
12 43.86-50.02 1.54-1.75
13 47.85-54.01 1.67-1.89
14 51.84-57.99 1.81-2.03
15 55.83-61.98 1.95-2.17
16 59.82-65.97 2.09-2.31
17 63.8-69.96 2.23-2.45
18 67.79-73.94 2.37-2.59
19 71.78-77.93 2.51-2.73
20 75.77-81.92 2.65-2.87
21 79.75-85.91 2.79-3.01
22 83.74-89.9 2.93-3.15
23 87.73-93.88 3.07-3.29
24 91.72-97.87 3.21-3.43
25 95.7-101.86 3.35-3.57
26 99.69-105.85 3.49-3.7
27 103.68-109.83 3.63-3.84
28 107.67-113.82 3.77-3.98
29 111.66-117.81 3.91-4.12
30 115.64-121.6 4.05-4.26
Please note: The depths given in the table are based on an estimated average radar velocity of 0.08m/ns, as discussed in the main report text. They therefore should not be taken as the absolute depths of any features discussed.
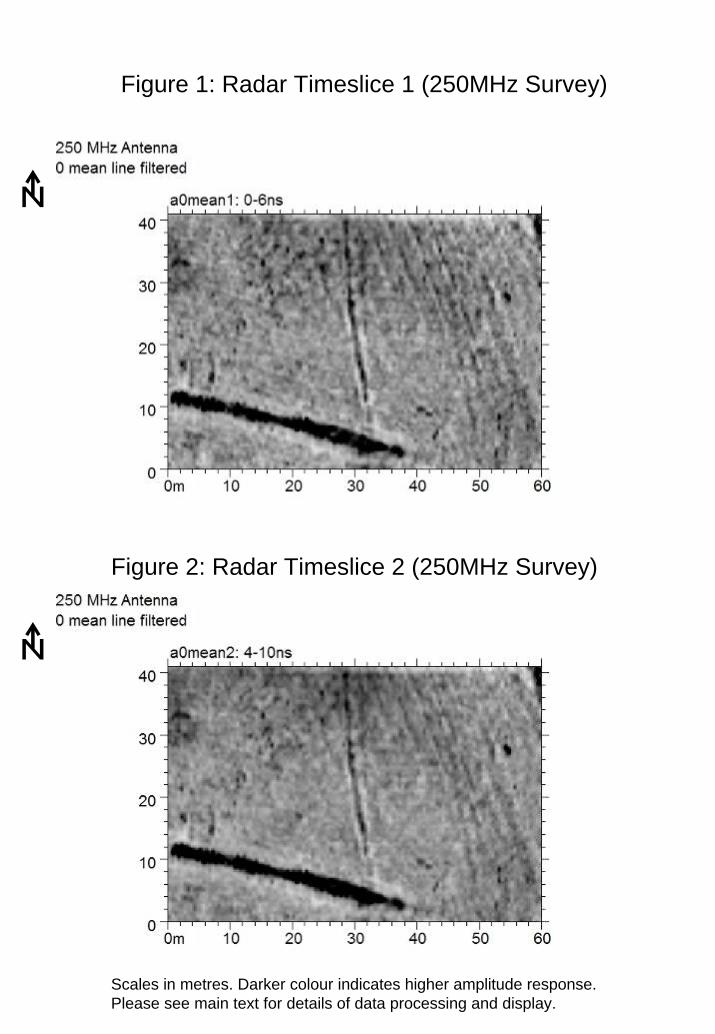
Figure 1: Radar Timeslice 1 (250MHz Survey)
a
a
Figure 2: Radar Timeslice 2 (250MHz Survey)
Scales in metres. Darker colour indicates higher amplitude response. Please see main text for details of data processing and display.
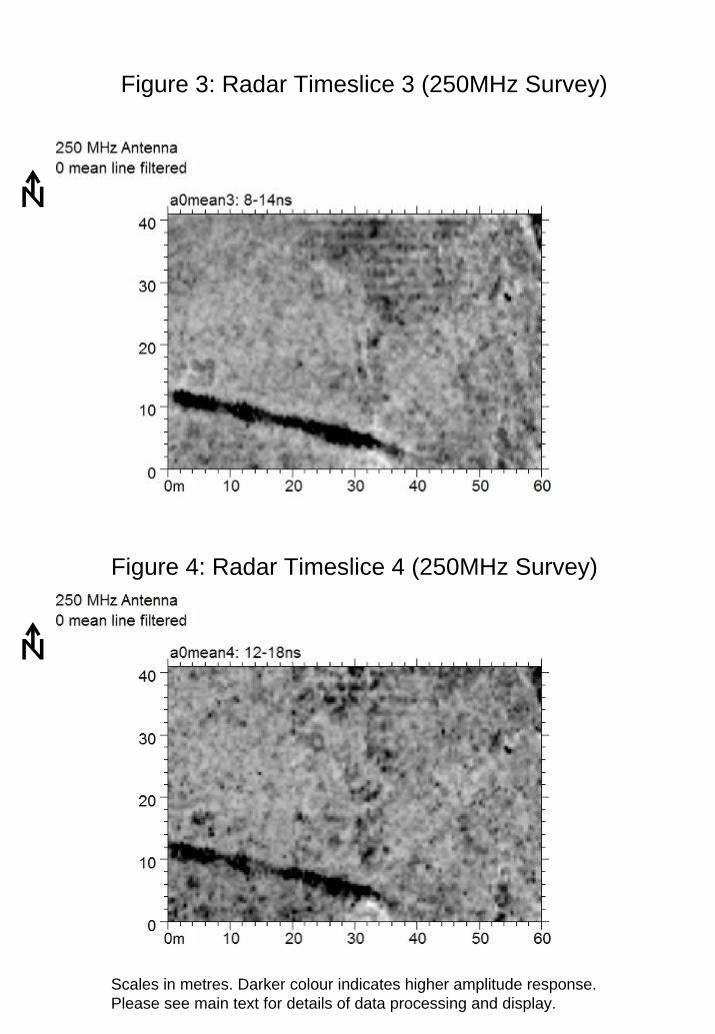
Figure 3: Radar Timeslice 3 (250MHz Survey)
a
a
Figure 4: Radar Timeslice 4 (250MHz Survey)
Scales in metres. Darker colour indicates higher amplitude response. Please see main text for details of data processing and display.
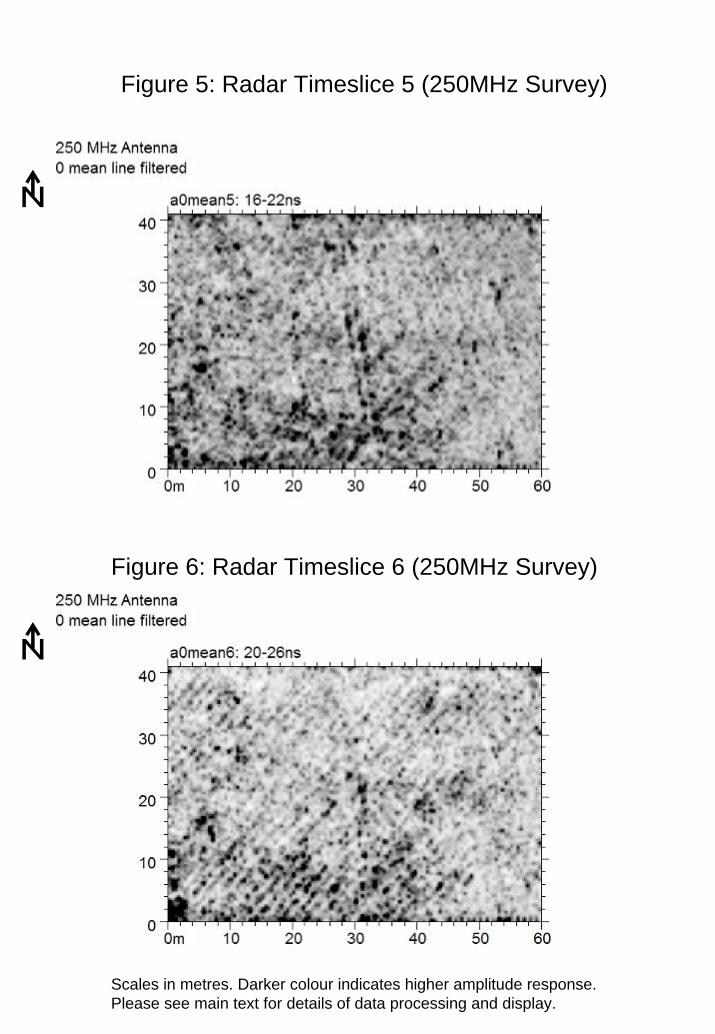
Figure 5: Radar Timeslice 5 (250MHz Survey)
a
a
Figure 6: Radar Timeslice 6 (250MHz Survey)
Scales in metres. Darker colour indicates higher amplitude response. Please see main text for details of data processing and display.
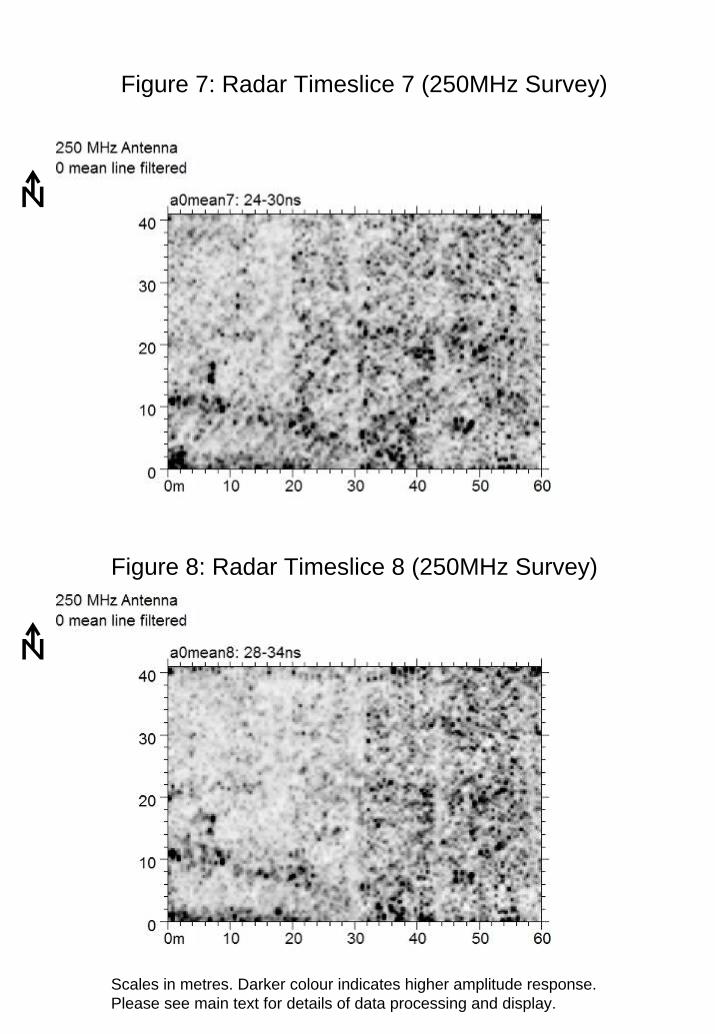
Figure 7: Radar Timeslice 7 (250MHz Survey)
a
a
Figure 8: Radar Timeslice 8 (250MHz Survey)
Scales in metres. Darker colour indicates higher amplitude response. Please see main text for details of data processing and display.
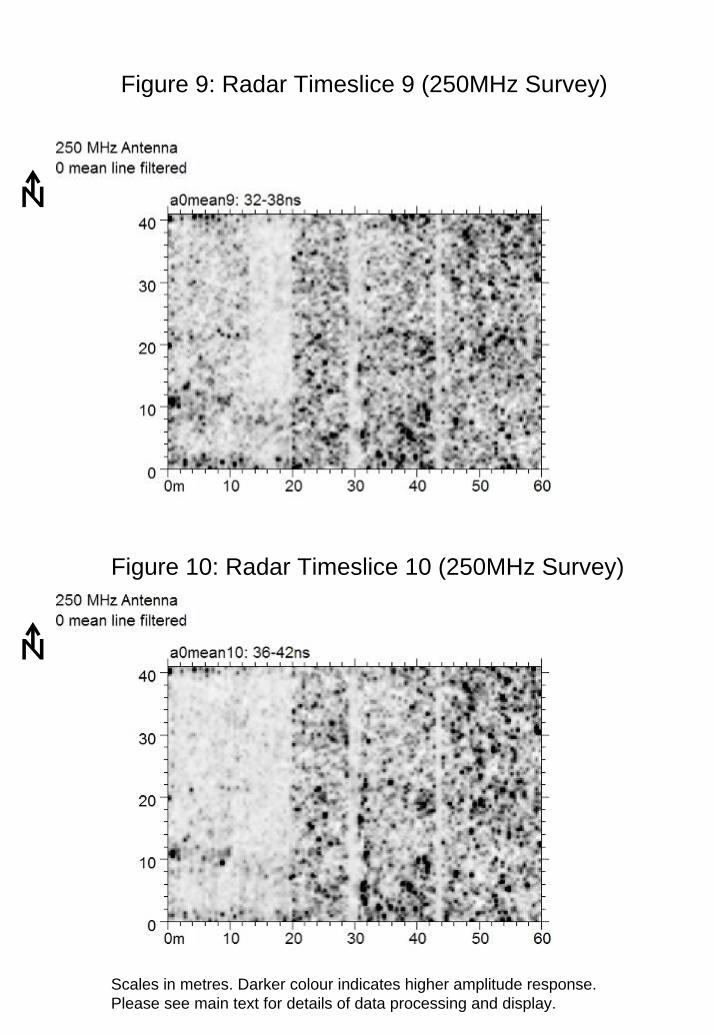
Figure 9: Radar Timeslice 9 (250MHz Survey)
a
a
Figure 10: Radar Timeslice 10 (250MHz Survey)
Scales in metres. Darker colour indicates higher amplitude response. Please see main text for details of data processing and display.
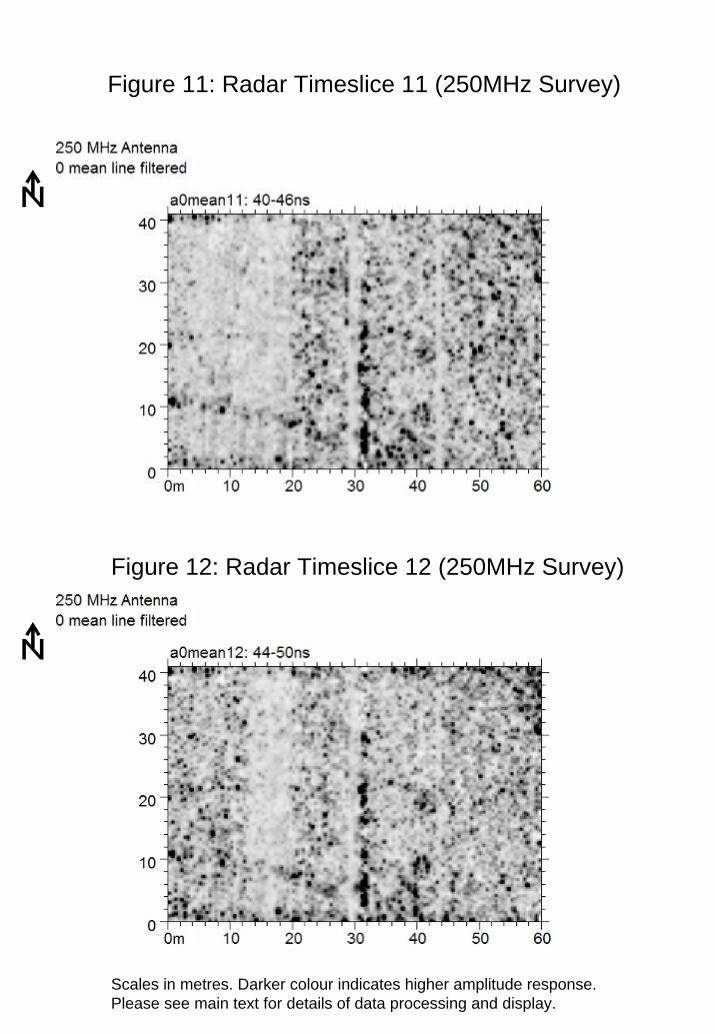
Figure 11: Radar Timeslice 11 (250MHz Survey)
a
a
Figure 12: Radar Timeslice 12 (250MHz Survey)
Scales in metres. Darker colour indicates higher amplitude response. Please see main text for details of data processing and display.
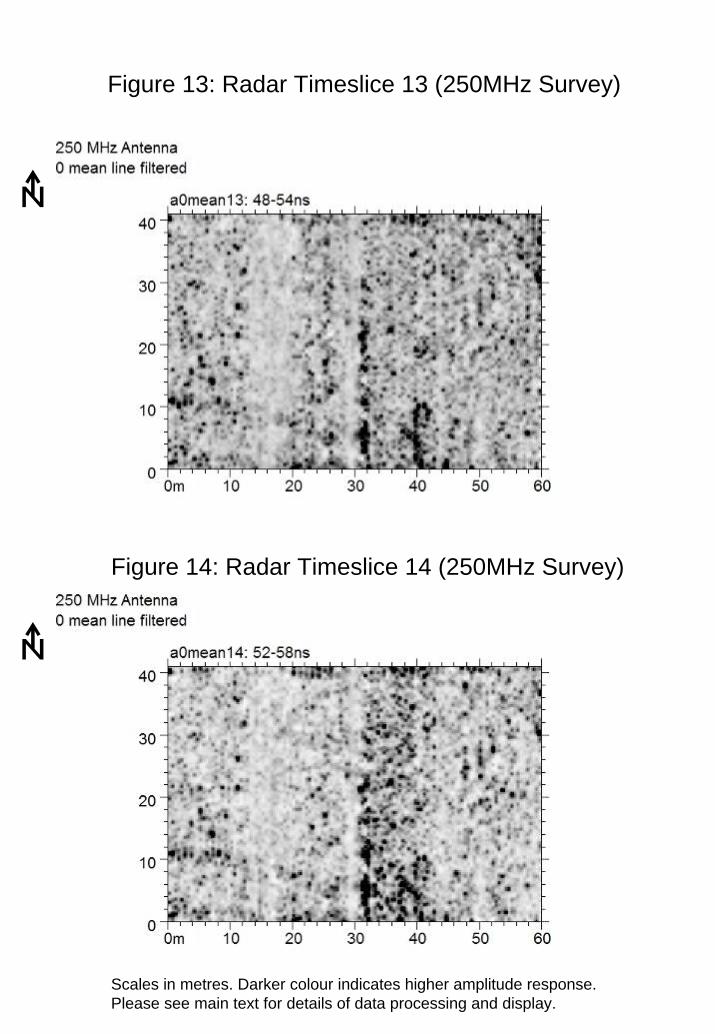
Figure 13: Radar Timeslice 13 (250MHz Survey)
a
a
Figure 14: Radar Timeslice 14 (250MHz Survey)
Scales in metres. Darker colour indicates higher amplitude response. Please see main text for details of data processing and display.
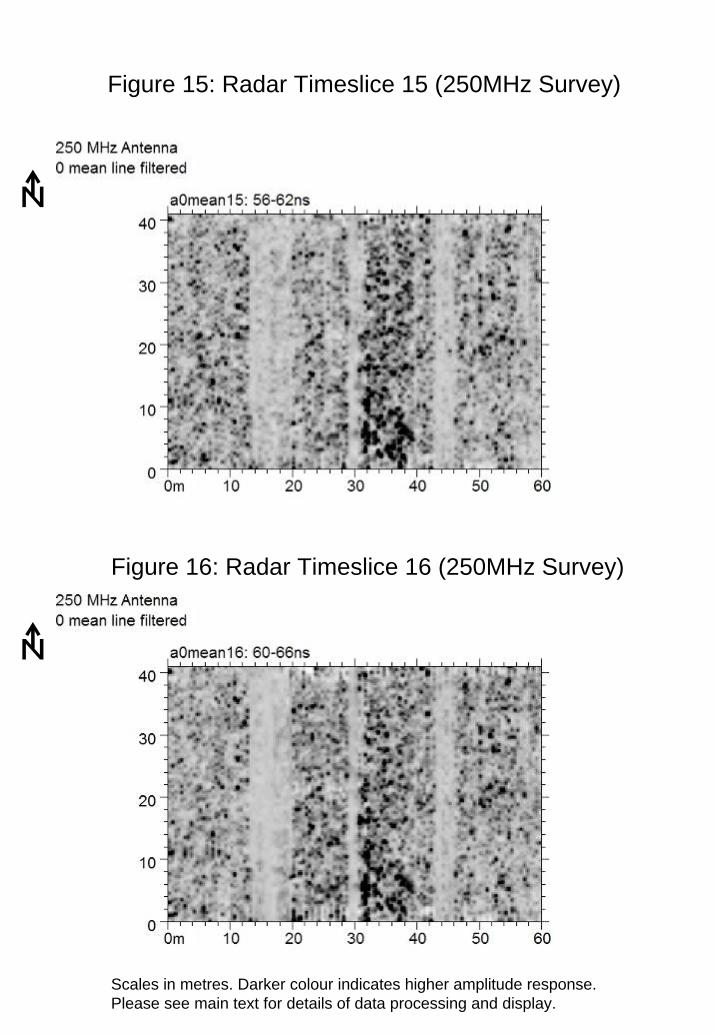
Figure 15: Radar Timeslice 15 (250MHz Survey)
a
a
Figure 16: Radar Timeslice 16 (250MHz Survey)
Scales in metres. Darker colour indicates higher amplitude response. Please see main text for details of data processing and display.
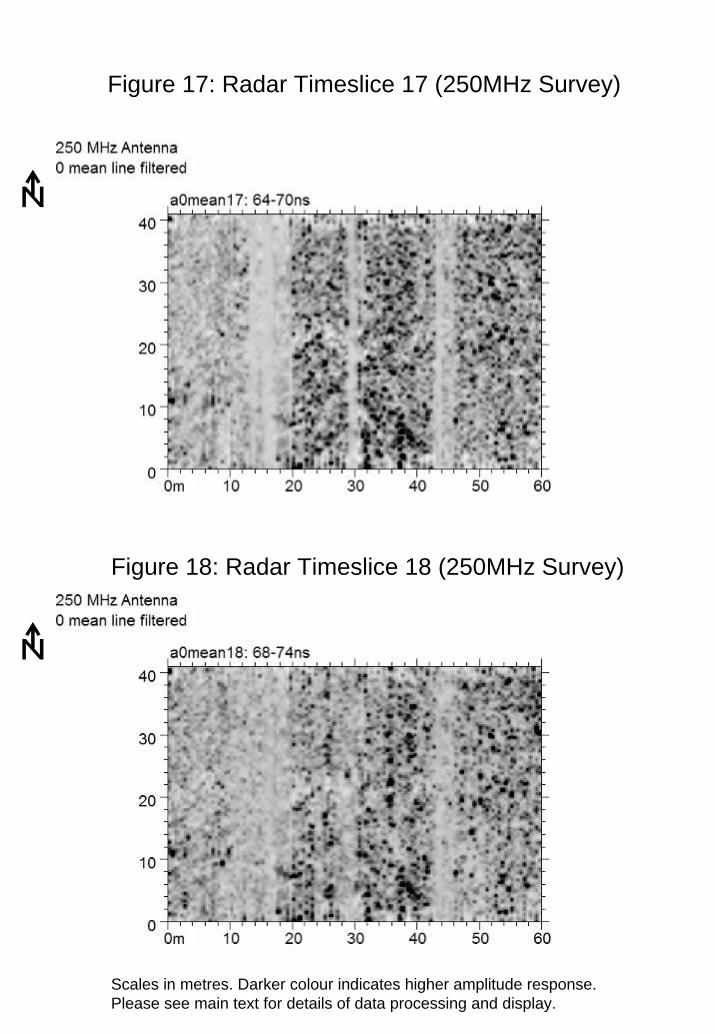
Figure 17: Radar Timeslice 17 (250MHz Survey)
a
a
Figure 18: Radar Timeslice 18 (250MHz Survey)
Scales in metres. Darker colour indicates higher amplitude response. Please see main text for details of data processing and display.
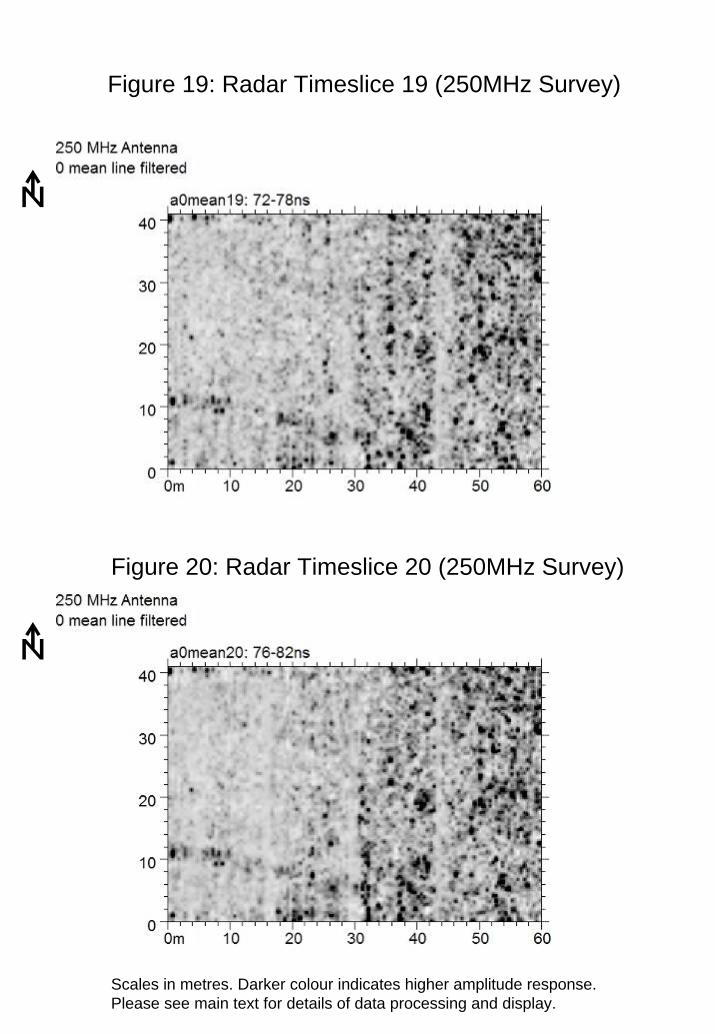
Figure 19: Radar Timeslice 19 (250MHz Survey)
a
a
Figure 20: Radar Timeslice 20 (250MHz Survey)
Scales in metres. Darker colour indicates higher amplitude response. Please see main text for details of data processing and display.
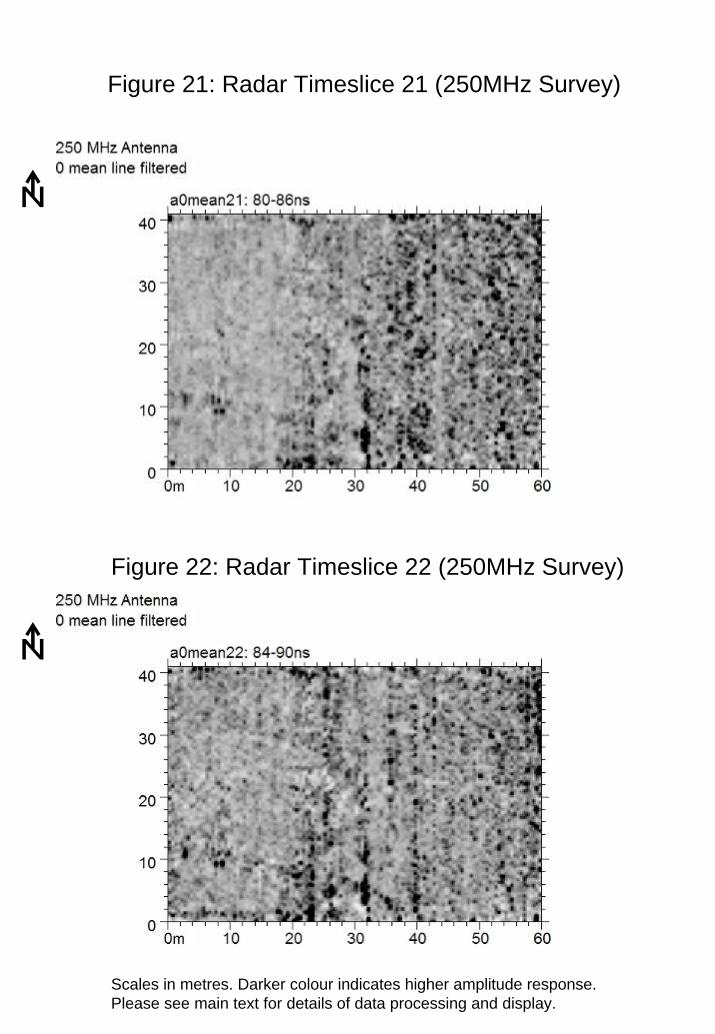
Figure 21: Radar Timeslice 21 (250MHz Survey)
a
a
Figure 22: Radar Timeslice 22 (250MHz Survey)
Scales in metres. Darker colour indicates higher amplitude response. Please see main text for details of data processing and display.
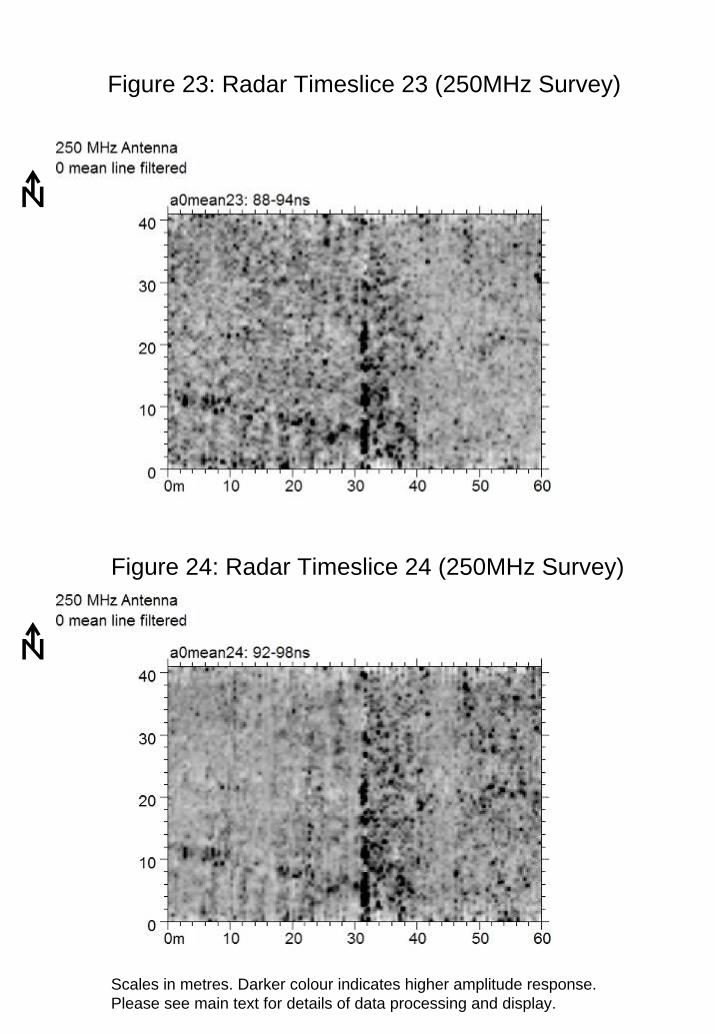
Figure 23: Radar Timeslice 23 (250MHz Survey)
a
a
Figure 24: Radar Timeslice 24 (250MHz Survey)
Scales in metres. Darker colour indicates higher amplitude response. Please see main text for details of data processing and display.
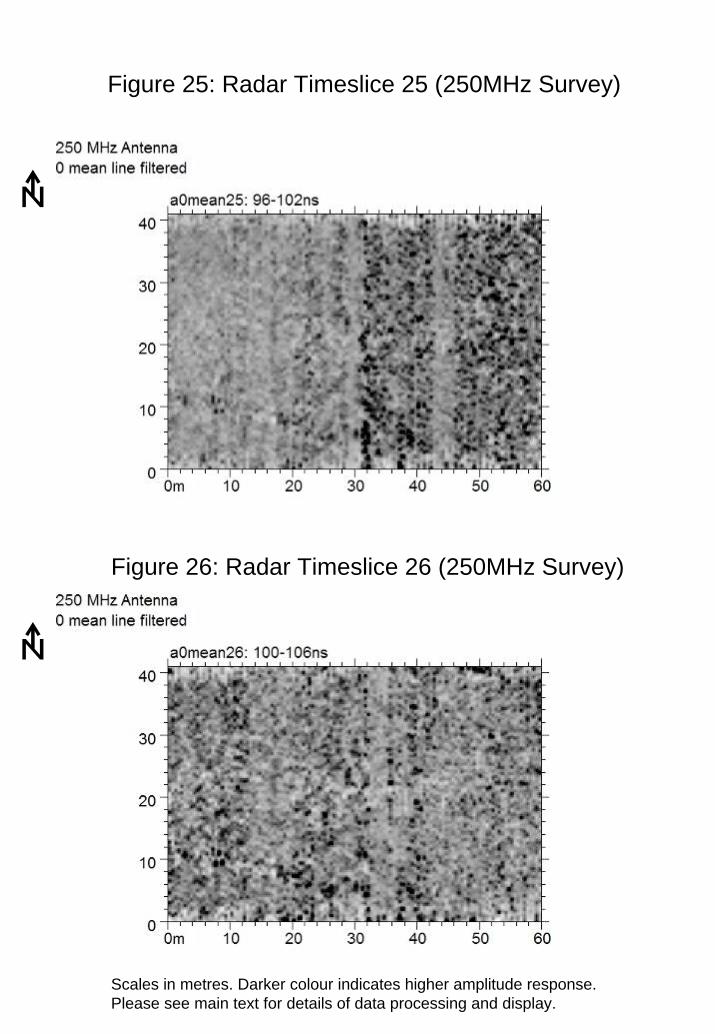
Figure 25: Radar Timeslice 25 (250MHz Survey)
a
a
Figure 26: Radar Timeslice 26 (250MHz Survey)
Scales in metres. Darker colour indicates higher amplitude response. Please see main text for details of data processing and display.
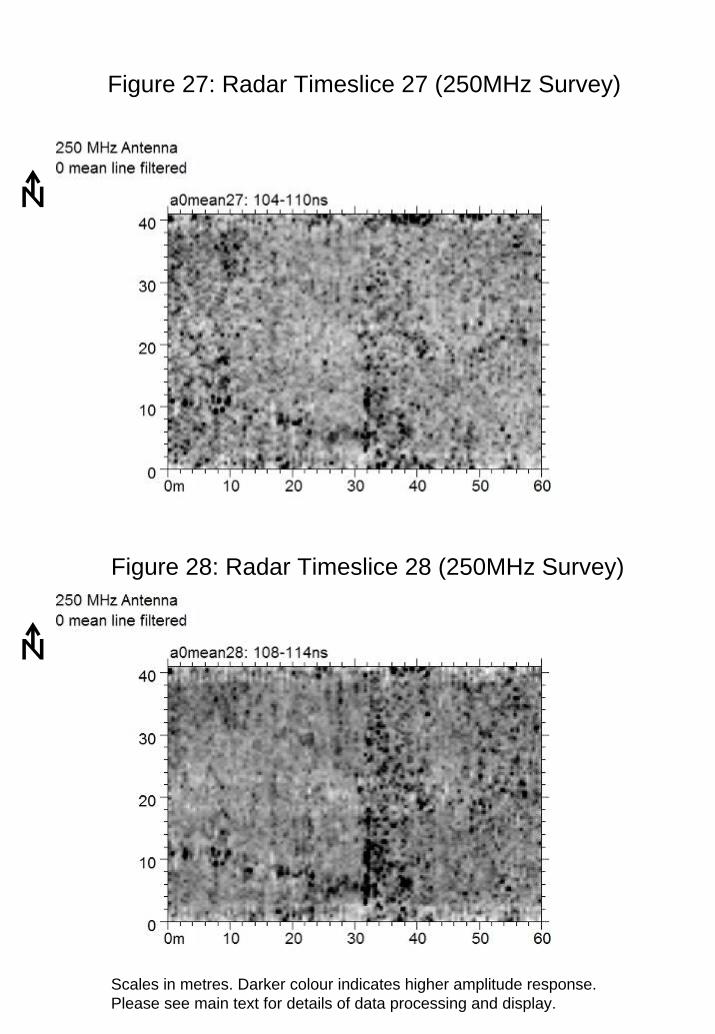
Figure 27: Radar Timeslice 27 (250MHz Survey)
a
a
Figure 28: Radar Timeslice 28 (250MHz Survey)
Scales in metres. Darker colour indicates higher amplitude response. Please see main text for details of data processing and display.
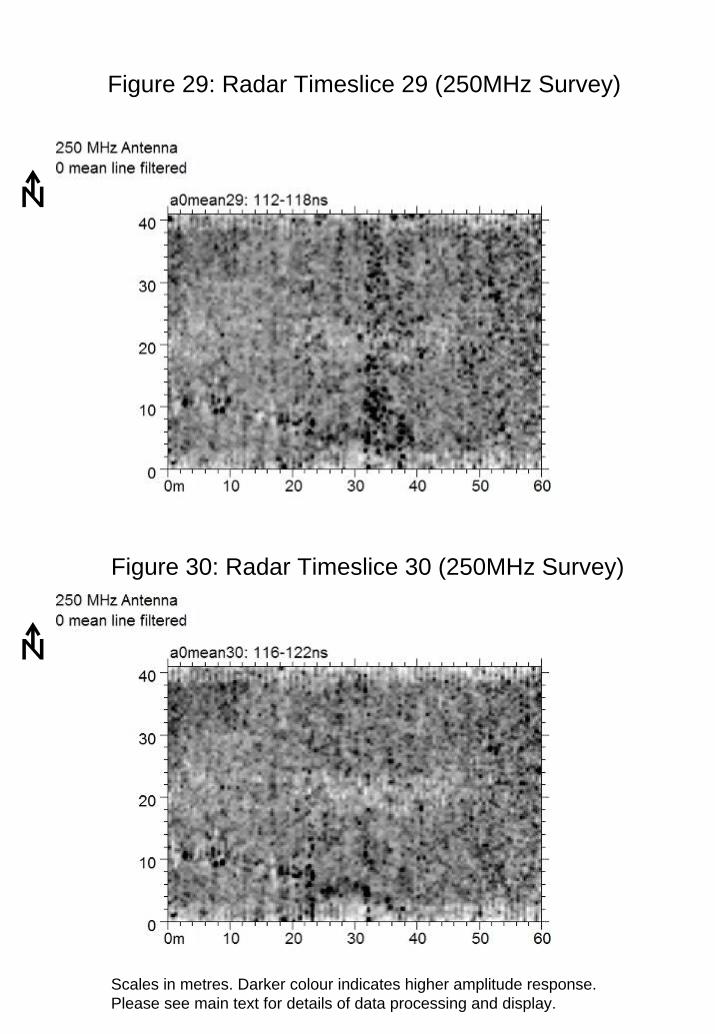
Figure 29: Radar Timeslice 29 (250MHz Survey)
a
a
Figure 30: Radar Timeslice 30 (250MHz Survey)
Scales in metres. Darker colour indicates higher amplitude response. Please see main text for details of data processing and display.
Related Documents