APPLIED AND ENVIRONMENTAL MICROBIOLOGY, Feb. 2010, p. 757–768 Vol. 76, No. 3 0099-2240/10/$12.00 doi:10.1128/AEM.02409-09 Copyright © 2010, American Society for Microbiology. All Rights Reserved. Archaeal and Bacterial Communities Respond Differently to Environmental Gradients in Anoxic Sediments of a California Hypersaline Lake, the Salton Sea Brandon K. Swan, 1 † Christopher J. Ehrhardt, 2 ‡ Kristen M. Reifel, 3 Lilliana I. Moreno, 4 and David L. Valentine 5 * Marine Science Program and Department of Earth Science, University of California, Santa Barbara, California 93106 1 ; Department of Earth Science, University of California, Santa Barbara, California 93106-9630 2 ; Graduate Program in Marine Environmental Biology, Department of Biology, University of Southern California, Los Angeles, California 90089 3 ; International Forensic Research Institute, Department of Chemistry and Biochemistry, Florida International University, Miami, Florida 33199 4 ; and Department of Earth Science and Marine Science Institute, University of California, Santa Barbara, California 93106 5 Received 5 October 2009/Accepted 23 November 2009 Sulfidic, anoxic sediments of the moderately hypersaline Salton Sea contain gradients in salinity and carbon that potentially structure the sedimentary microbial community. We investigated the abundance, community structure, and diversity of Bacteria and Archaea along these gradients to further distinguish the ecologies of these domains outside their established physiological range. Quantitative PCR was used to enumerate 16S rRNA gene abundances of Bacteria, Archaea, and Crenarchaeota. Community structure and diversity were evaluated by terminal restriction fragment length polymorphism (T-RFLP), quantitative analysis of gene (16S rRNA) frequencies of dominant microorganisms, and cloning and sequencing of 16S rRNA. Archaea were numerically dominant at all depths and exhibited a lesser response to environmental gradients than that of Bacteria. The relative abundance of Crenarchaeota was low (0.4 to 22%) at all depths but increased with decreased carbon content and increased salinity. Salinity structured the bacterial community but exerted no significant control on archaeal community structure, which was weakly correlated with total carbon. Partial sequencing of archaeal 16S rRNA genes retrieved from three sediment depths revealed diverse communities of Euryarchaeota and Crenarchaeota, many of which were affiliated with groups previously described from marine sediments. The abundance of these groups across all depths suggests that many putative marine archaeal groups can tolerate elevated salinity (5.0 to 11.8% [wt/vol]) and persist under the anaerobic conditions present in Salton Sea sediments. The differential response of archaeal and bacterial communities to salinity and carbon patterns is consistent with the hypothesis that adaptations to energy stress and availability distinguish the ecologies of these domains. The vast majority of cultured Archaea isolates are charac- terized as extremophiles, which thrive under environmental extremes of temperature, pH, salinity, and oxygen availability. Unlike Bacteria, these organisms are well defined by select physiologies or catabolic activities. Cultivated halophilic ar- chaea are obligate aerobes, and with a few exceptions (58), most 16S rRNA gene sequences affiliated with this physiolog- ical group have been recovered primarily from environments with oxygen present. Thermophilic archaea, many of which utilize hydrogen-based metabolisms, have temperature re- quirements that preclude their survival and growth in more moderate environments. Other archaeal physiological groups include acidophiles, which thrive in acidic and mostly high- temperature environments, the obligate anaerobic methano- gens, which are capable of competing with Bacteria when more energetically favorable electron acceptors are not available (i.e., sulfate), and methane-oxidizing archaea, which require methane for energy production. Recent work on several Cre- narchaeota isolates points to nitrification as their primary en- ergy metabolism, but these organisms have been detected in cold, predominantly aerobic environments, such as open ocean waters and soil (47), and in hyperthermophilic environments (24). Several archaeal groups identified using only 16S rRNA genes, for which no current isolates exist, have been detected in anaerobic sediments of the marine subsurface (6), estuaries (42), freshwater (46), and salt lakes (29). While their physiol- ogy and catabolism remain a source of speculation, the envi- ronmental distribution patterns of these mesophilic, presum- ably anaerobic, groups seemingly exclude the physiological and catabolic types outlined above. That is, the persistence of di- verse archaeal populations in anoxic sediments at moderate temperature and salinity and at circumneutral pH with only trace levels of methane strongly suggests that alternative met- abolic or physiological activities must characterize these pop- ulations. Saline lakes are ubiquitous and can be found on all conti- nents. Although many saline lakes are labeled “extreme” en- vironments, microbial diversity within their sediments is often * Corresponding author. Mailing address: Department of Earth Sci- ence and Marine Science Institute, University of California, 1006 Webb Hall, Santa Barbara, CA 93106-9630. Phone: (805) 893-2973. Fax: (805) 893-2314. E-mail: [email protected]. † Present address: Bigelow Laboratory for Ocean Sciences, 180 McKown Point Road, P.O. Box 475, West Boothbay Harbor, ME 04575. ‡ Present address: FBI Academy, Building 12, Quantico, VA 22135. Published ahead of print on 30 November 2009. 757

Welcome message from author
This document is posted to help you gain knowledge. Please leave a comment to let me know what you think about it! Share it to your friends and learn new things together.
Transcript

APPLIED AND ENVIRONMENTAL MICROBIOLOGY, Feb. 2010, p. 757–768 Vol. 76, No. 30099-2240/10/$12.00 doi:10.1128/AEM.02409-09Copyright © 2010, American Society for Microbiology. All Rights Reserved.
Archaeal and Bacterial Communities Respond Differently toEnvironmental Gradients in Anoxic Sediments of a
California Hypersaline Lake, the Salton Sea�
Brandon K. Swan,1† Christopher J. Ehrhardt,2‡ Kristen M. Reifel,3Lilliana I. Moreno,4 and David L. Valentine5*
Marine Science Program and Department of Earth Science, University of California, Santa Barbara, California 931061; Department ofEarth Science, University of California, Santa Barbara, California 93106-96302; Graduate Program in Marine Environmental Biology,
Department of Biology, University of Southern California, Los Angeles, California 900893; International Forensic Research Institute,Department of Chemistry and Biochemistry, Florida International University, Miami, Florida 331994; and Department of
Earth Science and Marine Science Institute, University of California, Santa Barbara, California 931065
Received 5 October 2009/Accepted 23 November 2009
Sulfidic, anoxic sediments of the moderately hypersaline Salton Sea contain gradients in salinity and carbonthat potentially structure the sedimentary microbial community. We investigated the abundance, communitystructure, and diversity of Bacteria and Archaea along these gradients to further distinguish the ecologies ofthese domains outside their established physiological range. Quantitative PCR was used to enumerate 16SrRNA gene abundances of Bacteria, Archaea, and Crenarchaeota. Community structure and diversity wereevaluated by terminal restriction fragment length polymorphism (T-RFLP), quantitative analysis of gene (16SrRNA) frequencies of dominant microorganisms, and cloning and sequencing of 16S rRNA. Archaea werenumerically dominant at all depths and exhibited a lesser response to environmental gradients than that ofBacteria. The relative abundance of Crenarchaeota was low (0.4 to 22%) at all depths but increased withdecreased carbon content and increased salinity. Salinity structured the bacterial community but exerted nosignificant control on archaeal community structure, which was weakly correlated with total carbon. Partialsequencing of archaeal 16S rRNA genes retrieved from three sediment depths revealed diverse communities ofEuryarchaeota and Crenarchaeota, many of which were affiliated with groups previously described from marinesediments. The abundance of these groups across all depths suggests that many putative marine archaealgroups can tolerate elevated salinity (5.0 to 11.8% [wt/vol]) and persist under the anaerobic conditions presentin Salton Sea sediments. The differential response of archaeal and bacterial communities to salinity andcarbon patterns is consistent with the hypothesis that adaptations to energy stress and availability distinguishthe ecologies of these domains.
The vast majority of cultured Archaea isolates are charac-terized as extremophiles, which thrive under environmentalextremes of temperature, pH, salinity, and oxygen availability.Unlike Bacteria, these organisms are well defined by selectphysiologies or catabolic activities. Cultivated halophilic ar-chaea are obligate aerobes, and with a few exceptions (58),most 16S rRNA gene sequences affiliated with this physiolog-ical group have been recovered primarily from environmentswith oxygen present. Thermophilic archaea, many of whichutilize hydrogen-based metabolisms, have temperature re-quirements that preclude their survival and growth in moremoderate environments. Other archaeal physiological groupsinclude acidophiles, which thrive in acidic and mostly high-temperature environments, the obligate anaerobic methano-gens, which are capable of competing with Bacteria when more
energetically favorable electron acceptors are not available(i.e., sulfate), and methane-oxidizing archaea, which requiremethane for energy production. Recent work on several Cre-narchaeota isolates points to nitrification as their primary en-ergy metabolism, but these organisms have been detected incold, predominantly aerobic environments, such as open oceanwaters and soil (47), and in hyperthermophilic environments(24).
Several archaeal groups identified using only 16S rRNAgenes, for which no current isolates exist, have been detectedin anaerobic sediments of the marine subsurface (6), estuaries(42), freshwater (46), and salt lakes (29). While their physiol-ogy and catabolism remain a source of speculation, the envi-ronmental distribution patterns of these mesophilic, presum-ably anaerobic, groups seemingly exclude the physiological andcatabolic types outlined above. That is, the persistence of di-verse archaeal populations in anoxic sediments at moderatetemperature and salinity and at circumneutral pH with onlytrace levels of methane strongly suggests that alternative met-abolic or physiological activities must characterize these pop-ulations.
Saline lakes are ubiquitous and can be found on all conti-nents. Although many saline lakes are labeled “extreme” en-vironments, microbial diversity within their sediments is often
* Corresponding author. Mailing address: Department of Earth Sci-ence and Marine Science Institute, University of California, 1006Webb Hall, Santa Barbara, CA 93106-9630. Phone: (805) 893-2973.Fax: (805) 893-2314. E-mail: [email protected].
† Present address: Bigelow Laboratory for Ocean Sciences, 180McKown Point Road, P.O. Box 475, West Boothbay Harbor, ME04575.
‡ Present address: FBI Academy, Building 12, Quantico, VA 22135.� Published ahead of print on 30 November 2009.
757

equivalent to that reported for studies of freshwater and ma-rine systems (28). Most studies of the microbial ecology withinsaline lakes have focused on gradients within the water col-umn, with very few studies on patterns within the sediments.Specifically, these studies have examined how changes in watercolumn salinity lead to shifts in microbial productivity anddiversity (8). However, particle-associated microbial commu-nities are known to differ fundamentally from water column orfree-living populations (1, 18). These observed differencescould be explained by the type and strength of environmentalgradients that microbial communities in sediments experience,as opposed to those encountered by pelagic communities.
Sediments contain strong environmental gradients, such astime (e.g., sediment age at depth), nutrient and carbon avail-ability, and the dominant terminal electron-accepting process(TEAP) resulting from the sequential use of available oxidantsby the microbial community (41). These gradients can lead tochanges in the dominant microbial groups (i.e., a shift fromsulfate reducers to methanogens with depth and age). Manysaline lakes are highly productive and shallow and experiencelarge fluctuations in water level due to climatic changes or tochanges in inflows due to urban and agricultural activities.Changes in lake level can lead to dramatic shifts in mixingregimens, nutrient cycling, and water chemistry. Historic fluc-tuations in water column salinity are often recorded within thesediments in the form of evaporite deposits, which may act asadditional sources of ionic loading of the water column (62).These sedimentary salinity gradients may modulate the meta-bolic activity of some microbial groups. For example, Oren(44) proposed bioenergetic constraints as a possible explana-tion for the reduced activity or absence of some microbialgroups within high-salinity environments. Thus, saline lakesediments are excellent natural laboratories in which to studychanges and adaptations of microbial communities due tolarge-scale changes in environmental gradients.
The Salton Sea is a large (980 km2), eutrophic, moderatelyhypersaline (48 to 50 g liter�1), terminal lake located 69 mbelow sea level in the Salton Basin, CA. Several large lakeshave formed in the Salton Basin over geologic history, the mostrecent of which was Lake Cahuilla ca. 300 years ago (7). Thecurrent lake was unintentionally created in 1905–1907, whenthe Colorado River flooded the Salton Basin for a period of 16months. Profundal sediments are highly sulfidic, and sulfatereduction is suspected to be the dominant TEAP within thesesediments (54). Based on elemental analysis (51) and 137Csactivity (37) of sediment layers, a depth of �22 cm marks thepoint when flooding of the Salton Basin occurred. Sedimentabove this depth represents the ca. 102 years of historicalchange within the Salton Sea, including a shift from a watercolumn salinity of 35 g liter�1 to the hypersaline conditionsthat currently exist. Sediments below this depth consist of low-carbon, gypsum-rich evaporite deposits that were present onthe older dry lake bed prior to the formation of the currentlake. A previous study reported several strong geochemicalgradients within pore water across this relatively small depthrange (62).
In this work, a suite of cultivation-independent techniquesand geochemical analyses was utilized to correlate shifts inabundance, community structure, and diversity of Archaea andBacteria in Salton Sea sediments with changes in environmen-
tal gradients. Large differences in abundance and communitystructure patterns of Archaea and Bacteria were found alongthe gradients. In addition, the majority of archaeal sequencesretrieved were affiliated with previously described but as yetuncultivated groups identified from various marine sedimen-tary environments. This indicates that these groups are able totolerate the higher salinity and anaerobic conditions charac-teristic of Salton Sea sediments. Fundamental differences be-tween the metabolic capacities and ecologies of Archaea andBacteria are discussed to explain these patterns.
MATERIALS AND METHODS
Sediment collection and processing. Intact sediment cores were collected at asite (S-1; 33°25�00�N, 115°55�00�W; 14 m in depth) located in the center of thenorthern basin of the Salton Sea. This site was one of several reference samplingstations chosen for a reconnaissance study of the biological limnology of theSalton Sea during the period 1997–1999 (63) and is a location where sedimentcores representing the complete history of the extant lake can be collected. Bulksediment was collected using a modified Ekman box corer (15 � 15 � 50 cm) andsubsampled using polycarbonate cylinders (7.5 � 50 cm). This method yieldedsediment cores with an average length of 35 cm. Sediment from one core wasextruded at 1-cm intervals, and the sediment from each interval was then split.Following the method of Wardlaw and Valentine (62), pore water was extractedfrom one-half of the sediment by centrifugation (12,000 � g, 15 min) and filteredthrough a 0.2-�m filter. The remaining sediment was stored at �80°C for sub-sequent molecular analyses. Sediment from a second core was extruded at 1-cmintervals, placed in acid-washed (20% HCl), precombusted (450°C, 4 h) glassvials, and stored at �20°C prior to analysis of bulk sediment chemical properties.
Geochemical analysis. The concentration of total dissolved salts in pore waterwas determined by the refractive index, measured using a handheld refractom-eter. Samples that had a salinity value of �80 g liter�1 were quantitatively dilutedwith distilled water prior to measurement. Since the ionic composition of SaltonSea pore water differs from that of seawater, exact values determined using thistechnique should be interpreted with caution. Pore water sulfate concentrationswere determined using a nephelometric method based on the precipitation ofbarium sulfate (BaSO4) through the addition of excess barium chloride (BaCl2)solution to a known volume of pore water (23). The reported accuracy of thismethod (�1 mM) (23) makes it particularly useful for samples with high sulfateconcentrations (62). Total carbon (TC), organic carbon (OC; after treatment ofsample with 25% HCl), and total nitrogen (TN) contents of bulk sediment weredetermined from dried (105°C, 48 h), ground sediment samples, using a CHNelemental analyzer (model CEC 440HA; Exeter Analytical). Inorganic carbon(IC) content was determined by subtraction of the OC value from the TC value.
Mineral identification and analysis. Sediment subsamples (0.2 to 0.5 g) werecollected at 2-cm intervals along the 0- to 28-cm sediment depth range and driedonto 5-mm glass slides. Mineral-phase identification and analysis were conductedwith powder X-ray diffractometry (XRD), using a Phillips X’Pert diffractometer.The X-ray source was Cu K� radiation (1.5405 Å) at 40 kV and 50 mA. Dif-fraction peaks between 2 values of 2° and 70° were recorded, and peaks wereidentified using the peak search function of Phillips X’Pert Highscore software(PANalytical). Minerals were identified by comparing the observed mixed-phasediffraction pattern to the ICDD-PDF mineral database. Relative abundances ofeach mineral phase were determined using the “semiquantitative analysis” func-tion in the X’Pert Highscore software package. This calculation is based onreference intensity ratio values for the mineral assemblage (12). For sedimentsamples, relative abundances of the following minerals were determined usingthe “fit profile” command: calcite (ICDD-PDF reference code 00-005-0586),gypsum (ICDD-PDF reference code 99-000-0004), halite (ICDD-PDF referencecode 00-005-0628), and silica (ICDD-PDF reference code 00-033-1161).
DNA extraction and T-RFLP analysis. DNAs were extracted from subsamples(0.3 to 0.5 g) of previously frozen sediment by use of a FastDNA spin kit for soil(Qbiogene, Carlsbad, CA). DNAs from two separate subsamples were extracted,combined, further purified with a Wizard SV gel and PCR cleanup system(Promega, Madison, WI) according to the manufacturer’s instructions, and quan-tified by PicoGreen fluorometry (Molecular Probes, Eugene, OR). Archaeal andbacterial community structure was determined at 2-cm depth intervals, usingterminal restriction fragment length polymorphism (T-RFLP) analysis (5). Du-plicate PCR (50-�l) reaction mixtures were prepared and contained 50 ng tem-plate DNA, 0.2 �M forward primer, 0.2 �M reverse primer, 1� Qiagen PCRbuffer, 1.5 mM MgCl2, a 200 �M concentration of each deoxynucleoside triphos-
758 SWAN ET AL. APPL. ENVIRON. MICROBIOL.

phate, 0.2 mM bovine serum albumin (BSA; New England Biolabs [NEB],Ipswich, MA), and 2.5 U Taq DNA polymerase. Partial bacterial and archaeal16S rRNA genes were amplified using labeled (6-carboxyfluorescein [FAM];Eurofins MWG Operon) forward and unlabeled reverse primers (Table 1). Thespecificity of the archaeal reverse primer was confirmed using in silico amplifi-cation against databases, using the RDP v10 Probe Match tool (15). ArchaealPCR amplification conditions were as follows: 3-min hot start at 95°C, followedby 30 cycles (45 s of denaturing at 94°C, 1 min of annealing, and 2 min ofextension at 72°C) and a final extension step of 5 min at 72°C. Bacterial PCRamplification conditions were as follows: 2-min hot start at 95°C, followed by 30cycles (45 s of denaturing at 95°C, 45 s of annealing, and 90 s of extension at72°C) and a final extension step of 7 min at 72°C. Amplicon size was checked byrunning PCR products on a 0.8% agarose gel for 30 min at 80 V and visualizingthem by staining with SYBR gold (Molecular Probes).
Duplicate PCR products containing amplicons of the correct size were com-bined, purified, and concentrated using a Wizard SV gel and PCR cleanupsystem (Promega). Duplicate 40-�l reaction mixtures containing 50 ng PCRproduct, 5.0 �l 1� enzyme buffer (20�; NEB), 0.5 �l BSA (10 mg ml�1), and 0.5U of restriction enzyme (NEB) were digested for 8 h. The following restrictionenzymes were used: HhaI, DdeI, and DpnI for archaeal PCR products and HhaI,HaeIII, and RsaI for bacterial PCR products. Digestion products were purifiedand concentrated using a Montage PCR centrifugal device (Millipore, Billerica,MA) and quantified using PicoGreen. Samples were diluted to have equivalentfinal DNA concentrations and were run in duplicate on an ABI Prism 3100genetic analyzer (PE Applied Biosystems, Foster City, CA) at the GenomicsTechnology Support Facility of Michigan State University. Resulting electro-pherograms were analyzed using GeneScan 3.1 software (Perkin-Elmer).
Community structure analysis. Terminal restriction fragment (TRF) peaks of�50 fluorescence units (above background) and constituting �0.5% of the totalsample peak area were manually aligned by comparison to an internal sizestandard. Duplicate T-RFLP profiles were compared, and nonreplicated TRFpeaks were removed from further analyses. Replicated TRF peak areas wereaveraged and divided by the total sample area (based on replicated TRF peaksonly) to obtain the individual relative peak area for each TRF.
Microbial community structure patterns were evaluated using hierarchal clus-ter analysis and nonmetric multidimensional (MDS) analysis (13). Hierarchalcluster analysis was performed on TRF relative abundance and presence-absencedata, using the Bray-Curtis (BC) similarity index and flexible-beta linkage ( ��0.25). MDS is an ordination technique that plots samples as points in low-dimensional space while attempting to maintain the relative distances betweenpoints as close as possible to the actual rank order of similarities betweensamples. Thus, sampling stations with similar community structures are plottedcloser together in ordination space. A stress factor is calculated for each MDSordination and indicates how well plotted configurations of sample distancesagree with original rank orders calculated from the similarity matrices. MDSanalysis of T-RFLP profiles was performed using previously calculated BC indi-ces for TRF relative abundances.
Relationships between microbial community structure and environmentalvariables were examined using the BEST procedure (14), which calculates mod-ified Spearman rank correlation coefficients (�s) between MDS configurations
and Euclidean similarity matrices of all possible environmental variable combi-nations. Hydrogen sulfide concentrations were log transformed before calculat-ing Euclidean similarities, whereas dissolved oxygen and temperature valueswere not transformed. Cluster analysis was done using XLStat (AddinSoftSARL), and all MDS calculations were performed using Primer v6.0 (Primer-ELtd.).
Phylogenetic assignment of TRFs. The putative phylogenetic identities andrelative abundances of bacterial community members determined from T-RFLPprofiles were estimated at selected sediment depths by use of several Web-basedprograms. First, several 16S rRNA gene sequence databases (Ribosomal Data-base Project [RDP] v10 [15] and Greengenes [21]) and the In silico PCR andDNA Restriction (ISPaR) tool, a component of the Microbial Community Anal-ysis (MiCA) online resource (53), were used to generate predicted TRF lengthsof bacterial 16S rRNA gene sequences. Primers and restriction enzymes used inISPaR were identical to those used in the sediment T-RFLP analysis. Second,predicted TRF lengths of 16S rRNA gene sequences were imported into PAT(31) and matched to TRF lengths generated from sediment T-RFLP analysis.Third, normalized abundance equations for each TRF peak and its relative peakarea in each T-RFLP profile were calculated using the APLAUS tool in MiCA.Abundance equations were then simplified by performing algebraic calculationsby hand, further reducing the number of possible phylotypes present in eachsample. This procedure resulted in several mathematically valid plausible com-munity compositions for each sample; however, only one plausible communitycomposition was determined in our analysis, and phylogenetic assignments wererestricted mostly to the phylum or class level.
In agreement with previous studies, few matches between archaeal T-RFLPpatterns and archaeal 16S rRNA gene sequences present in databases werefound. Therefore, expected TRFs of archaeal clones obtained in this study werematched to T-RFLP sediment profiles by use of TRiFLe (30). First, partialarchaeal 16S rRNA gene sequences of clones from three sediment depth inter-vals were digested in silico, using PCR primers and the HhaI restriction enzymethat were used for sediment T-RFLP analysis. Second, sediment T-RFLP profilesfrom each depth interval were matched to expected TRFs from clone sequencesby use of TRiFLe. Finally, relative abundances of matched TRFs were used toestimate the relative abundances of Euryarchaeota and Crenarchaeota overdepth.
qPCR. Quantitative real-time PCR (qPCR) was performed using an ABI 7900HT real-time PCR system (Applied Biosystems) and the primers and annealingconditions listed in Table 1. PCR mixtures (25 �l) contained 12.5 �l of 1� PowerSYBR green master mix (Applied Biosystems), 0.9 �M primer (each; finalconcentration), 1 �l of DNA template (1 ng), and ultrapure water for thebalance. Each reaction condition had an initial denaturing step of 10 min at 95°Cto activate the AmpliTaq Gold DNA polymerase, followed by 40 cycles of 30 s ofdenaturing at 95°C, 30 s of primer annealing (Table 1), and 30 s of primerextension at 72°C. Melting curve analysis (0.2°C s�1) and gel electrophoresis (2%agarose) of qPCR products revealed single amplicons of the predicted sizes forall primer pairs. Annealing temperatures used were optimized for each primerpair. Plasmid quantification standards were constructed for each primer pair bycloning PCR products resulting from amplification of environmental DNA. Ex-act matches between 16S rRNA sequences of PCR product inserts and qPCR
TABLE 1. PCR primers and conditions used in this study
Primer Sequence (5�33�) Annealingtemp (°C) Targeted group Reference
Primers for T-RFLP27f AGAGTTTGATCMTGGCTCAG 55 Bacteria 351392r ACGGGCGGTGTGTRC 55 Universal 35
Primers for T-RFLP/cloning519f CAGCMGCCGCGGTAATWC 57 Universal 361397r GTGTGCAAGGRGCAGGGA 57 Archaea Unpublished
Primers for qPCRBac331f TCCTACGGGAGGCAGCAGT 64.5 Bacteria 40Bac797r GGACTACCAGGGTCTAATCCTGTT 64.5 Bacteria 40Arch349f GYGCASCAGKCGMGAAW 50 Archaea 56Arch806r GGACTACVSGGGTATCTAAT 50 Archaea 56771f ACGGTGAGGGATGAAAGCT 54 Crenarchaeota 43957r CGGCGTTGACTCCAATTG 54 Crenarchaeota 43
VOL. 76, 2010 MICROBIAL PATTERNS ALONG ENVIRONMENTAL GRADIENTS 759

primer pairs were confirmed by sequencing. DNA copy numbers of PCR productinserts contained in clones were calculated, and standard curves were generatedby serial dilution (3.0 � 103 to 3.0 � 109 DNA copies �l�1). Amplification ofenvironmental samples and standards, including controls containing no DNAtemplate (ultrapure water only), was done in triplicate. Average amplificationefficiencies for Bacteria, Archaea, and Crenarchaeota were 89%, 85%, and 97%,respectively, and all amplifications were linear (r2 � 0.999, 0.990, and 0.997,respectively).
Archaeal clone libraries. Archaeal 16S rRNA gene clone libraries were con-structed from the sediment depth intervals 0 to 1 cm, 22 to 23 cm, and 32 to33 cm. PCR conditions and primers were the same as those used for archaealT-RFLP analysis (Table 1). Clone libraries were constructed from PCR productsby use of a PCR CloningPlus kit (Qiagen, Valencia, CA). Blue-white screeningof cloned plasmids was done using LB agar plates containing 100 �g ml�1
ampicillin, 80 �g ml�1 X-Gal (5-bromo-4-chloro-3-indolyl--D-galactopyrano-side), and 50 �M IPTG (isopropyl--D-thiogalactopyranoside; Teknova, Hollis-ter, CA). Picked transformants were grown overnight in 1.6 ml LB broth con-taining 0.075 mg ml�1 ampicillin, and plasmid DNA was extracted using aQuickClean 5 M miniprep kit (GenScript, Piscataway, NJ) according to themanufacturer’s instructions. Approximately 500 ng of DNA from each plasmidcontaining a PCR product insert was sequenced at the University of California,Berkeley, DNA sequencing facility, using the T7-M13 sequencing primer pair.The average sequence length was 890 nucleotides.
Phylogenetic analysis and clone library comparisons. Sequence ends weretrimmed and edited using Sequencher v4.7 (Gene Codes, Ann Arbor, MI) andwere checked for chimeras using Mallard (4) and Bellerophon (26). Suspectsequences were removed prior to further analysis. Unique phylotypes (�97%sequence similarity) were determined using DOTUR (48). A single representa-tive phylotype sequence was included in the alignments. Edited sequences werecompared to previously deposited sequences, using the RDP v10 Seqmatch (15)and NCBI BLASTN (3) online tools. Multiple sequence alignments of the mostclosely matched isolate and environmental sequences and the clone sequencesfrom this study were performed using CLUSTAL_X v1.81 (57).
Neighbor-joining (NJ) trees of sequences, with the Jukes-Cantor nucleotidesubstitution correction and 1,000 distance bootstrap replicates, were constructedusing PAUP* v.4.0 beta 10 (55). Phylogenetic trees were exported and editedusing TreeView v1.6.0 (45). Phylogenetic trees were also constructed using max-imum parsimony and maximum likelihood methods, and resulting tree topolo-gies were similar to those generated using NJ methods (data not shown). Clonelibrary diversity was calculated using EstimateS v7.5 (17), richness estimates werecalculated using DOTUR (48), and library coverage was calculated usingGood’s index. Estimated shared richness, community overlap (66), and com-munity structure similarity (65) between clone libraries were calculated usingSONS (49).
Nucleotide sequence accession numbers. Sequence data have been submittedto the GenBank database under accession numbers EU329738 to EU329844.
RESULTS
Bulk sediment and pore water chemistry. TC, OC, and TNcontents (% [wt/wt]) all decreased with increasing depth,whereas IC remained relatively constant (Fig. 1A). The sedi-ment OC content ranged between 12.3 and 2.3%, and IC was 5% over most depths; however, the amount of TC comprisedof IC increased from an average of 30% to 40% at depthsbelow 20 cm. Ratios of OC to TN by mass (9.2 to 13.5) weresimilar to those reported for marine coastal sediments. Porewater salinity (% [wt/vol]) more than doubled over the sam-pling depth, increasing from 5.0 to 11.8% (50 to 118‰), andsulfate concentrations increased from 112 to 701 mM(Fig. 1B).
Powder X-ray diffractometry analysis indicated that calcite,gypsum, halite, and silica were the most abundant mineralspresent. With the exception of the near-surface (0 to 2 cm) anddeeper (23 to 28 cm) sediments, calcite was the most abundantmineral and had an average relative abundance of 73% (wt/wt). Gypsum was detected only in the depth intervals in whichcalcite abundances were lowest (0 to 2 cm, 67 to 72%; and 23to 28 cm, 29 to 69%). Average relative abundances of haliteand silica were 23% and 6%, respectively, and showed littlevariation with depth. The high relative abundances of haliteare most likely an artifact resulting from the drying processduring sample preparation.
Quantification of 16S rRNA genes. The abundances of ma-jor microbial groups, as determined by qPCR, were reported asDNA copy numbers of 16S rRNA genes per g of dry sediment.The abundances of total microbes (Archaea and Bacteria) andof Archaea were 105 to 107 DNA copies g�1, whereas Bacteriaand Crenarchaeota abundances were 104 to 106 DNA copiesg�1 (Fig. 1C). Archaeal 16S rRNA genes were dominant (64 to99%) at all sediment depths, and Crenarchaeota abundance, asa percentage of total Archaea, varied from 0.4 to 22%. Changesin the abundances of Crenarchaeota and Bacteria over depthwere similar (Fig. 1C).
Microbial community structure patterns. Three differentrestriction enzymes were used to generate TRFs for Archaea
FIG. 1. Depth profiles of bulk sediment (A), pore water chemistry (B), and abundance of major microbial groups determined by qPCR (C).Arrows indicate depth intervals selected for archaeal 16S rRNA gene sequencing.
760 SWAN ET AL. APPL. ENVIRON. MICROBIOL.

and Bacteria. Although the number of TRFs generated witheach restriction enzyme was variable, community structure pat-terns determined by multivariate techniques were similar.Therefore, only results for the HhaI enzyme are presented.Relative TRF peak areas were used in the analysis of commu-
nity structure, but similar patterns were found using presence-absence data. Cluster analysis revealed five distinct subgroups(I to V) with �65% similarity for both microbial groups (Fig.2A and B). Two major bacterial subgroups with 10% simi-larity were observed (Fig. 2B). Additionally, an overall trend
FIG. 2. Hierarchical cluster analyses (A and B) and nonmetric MDS plots (C to F) of arcsine square root-transformed relative T-RFLP peakareas. Distance matrices used for both analyses were calculated using the Bray-Curtis similarity index. Sediment depth intervals (cm) are listed onthe y axes, and dotted lines (A and B), ellipses (C and D), and Roman numerals (A to D) designate subgroups with �65% similarity. Correspondingconcentrations of environmental variables most correlated with community structure are plotted as open circles (E and F). Arrows indicate depthintervals selected for archaeal 16S rRNA gene sequencing (C and E). 2-D, two-dimensional; �s, Spearman rank correlation coefficient. Only resultsof clustering and MDS analyses obtained using data from HhaI restriction are presented. MDS topology and resulting stress values obtained usingother restriction enzymes were similar.
VOL. 76, 2010 MICROBIAL PATTERNS ALONG ENVIRONMENTAL GRADIENTS 761
with sediment depth was found for the bacterial community,where adjacent sediment depths were most similar to eachother. No such trend with depth was apparent for the archaealcommunity.
MDS was used to perform ordination of T-RFLP profiles(Fig. 2C and D). An examination of the stress values, whichrepresent unexplained information, determined that two di-mensions were sufficient for explaining community patterns.Bacterial community patterns from MDS analysis closelymatched those obtained by hierarchal clustering (Fig. 2B andD), further validating the overall trend, and were correlatedwith pore water salinity (�s � 0.76) (Fig. 2F). Archaeal com-munity structure patterns revealed by MDS analysis alsomatched those from hierarchal clustering (Fig. 2A and C).Archaeal community structure patterns were weakly corre-lated with TC (�s � 0.33) and pore water salinity (�s � 0.11)(Fig. 2E).
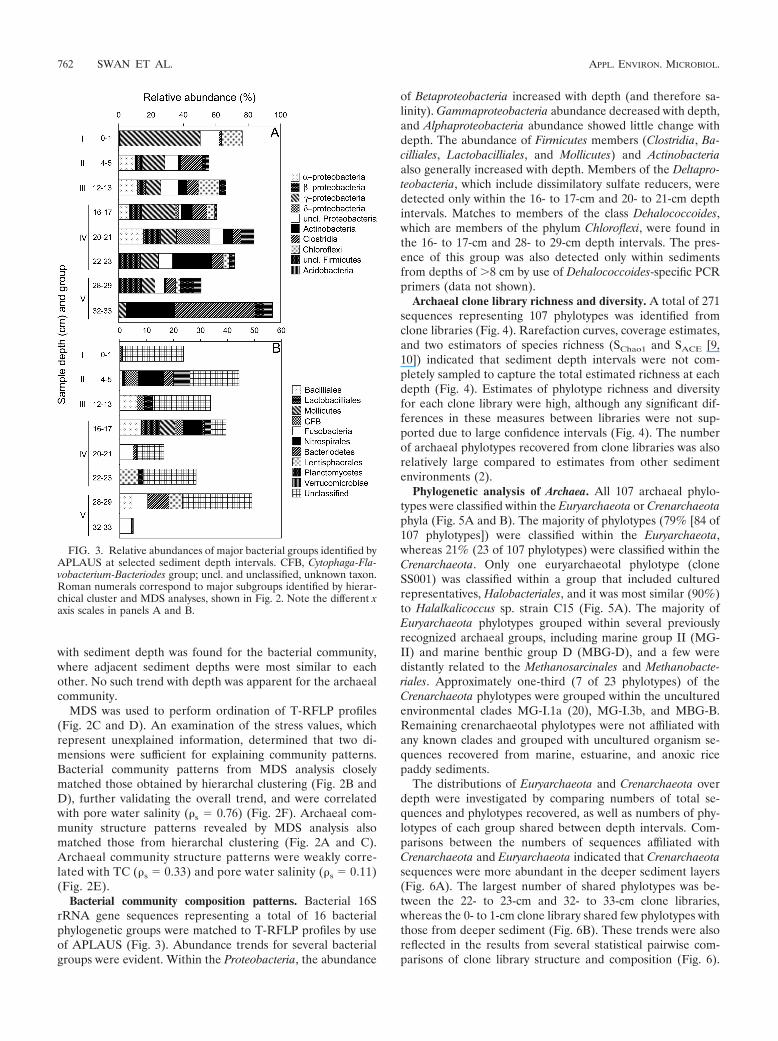
Bacterial community composition patterns. Bacterial 16SrRNA gene sequences representing a total of 16 bacterialphylogenetic groups were matched to T-RFLP profiles by useof APLAUS (Fig. 3). Abundance trends for several bacterialgroups were evident. Within the Proteobacteria, the abundance
of Betaproteobacteria increased with depth (and therefore sa-linity). Gammaproteobacteria abundance decreased with depth,and Alphaproteobacteria abundance showed little change withdepth. The abundance of Firmicutes members (Clostridia, Ba-cilliales, Lactobacilliales, and Mollicutes) and Actinobacteriaalso generally increased with depth. Members of the Deltapro-teobacteria, which include dissimilatory sulfate reducers, weredetected only within the 16- to 17-cm and 20- to 21-cm depthintervals. Matches to members of the class Dehalococcoides,which are members of the phylum Chloroflexi, were found inthe 16- to 17-cm and 28- to 29-cm depth intervals. The pres-ence of this group was also detected only within sedimentsfrom depths of �8 cm by use of Dehalococcoides-specific PCRprimers (data not shown).
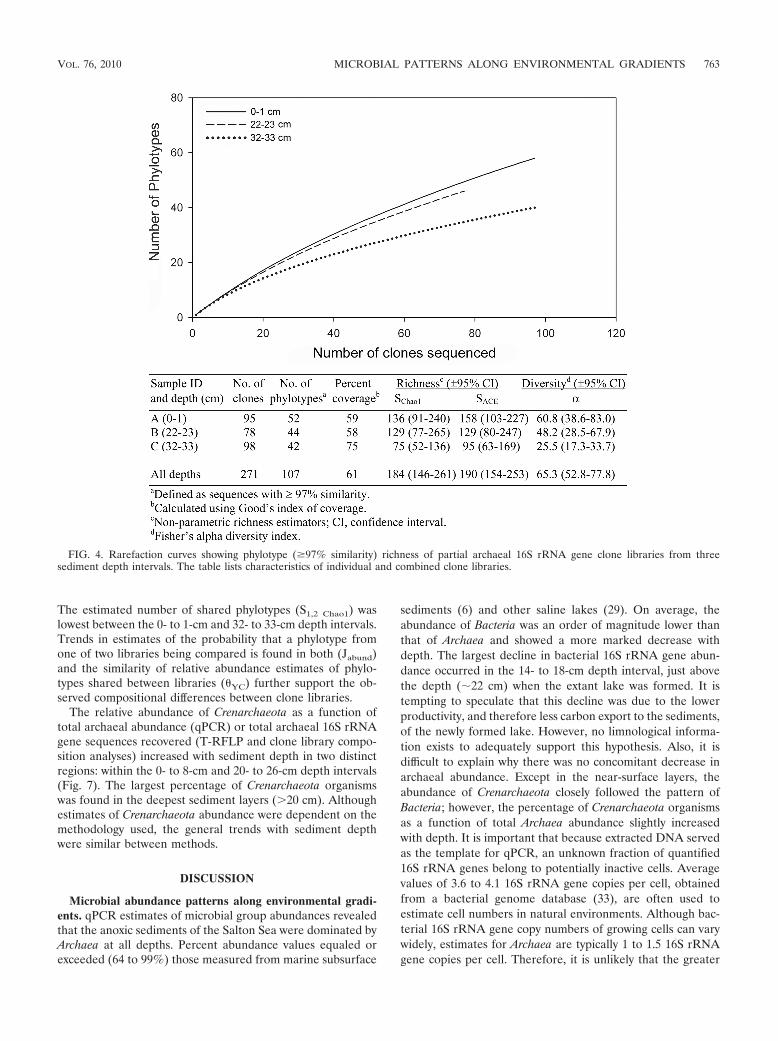
Archaeal clone library richness and diversity. A total of 271sequences representing 107 phylotypes was identified fromclone libraries (Fig. 4). Rarefaction curves, coverage estimates,and two estimators of species richness (SChao1 and SACE [9,10]) indicated that sediment depth intervals were not com-pletely sampled to capture the total estimated richness at eachdepth (Fig. 4). Estimates of phylotype richness and diversityfor each clone library were high, although any significant dif-ferences in these measures between libraries were not sup-ported due to large confidence intervals (Fig. 4). The numberof archaeal phylotypes recovered from clone libraries was alsorelatively large compared to estimates from other sedimentenvironments (2).
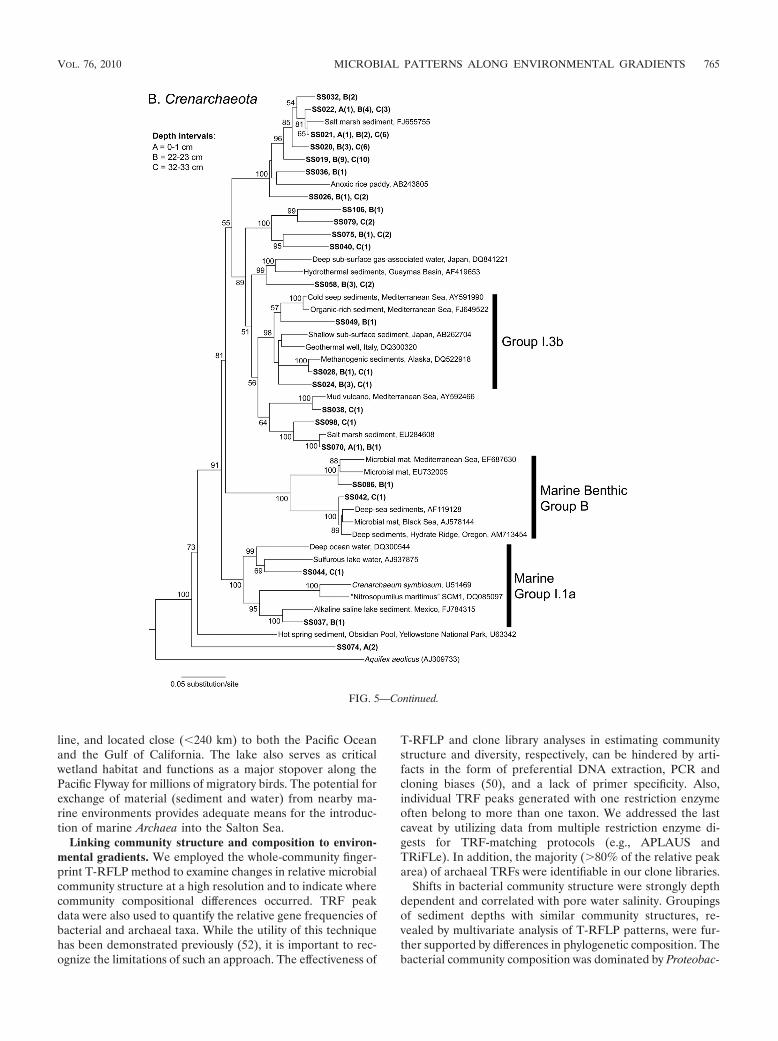
Phylogenetic analysis of Archaea. All 107 archaeal phylo-types were classified within the Euryarchaeota or Crenarchaeotaphyla (Fig. 5A and B). The majority of phylotypes (79% [84 of107 phylotypes]) were classified within the Euryarchaeota,whereas 21% (23 of 107 phylotypes) were classified within theCrenarchaeota. Only one euryarchaeotal phylotype (cloneSS001) was classified within a group that included culturedrepresentatives, Halobacteriales, and it was most similar (90%)to Halalkalicoccus sp. strain C15 (Fig. 5A). The majority ofEuryarchaeota phylotypes grouped within several previouslyrecognized archaeal groups, including marine group II (MG-II) and marine benthic group D (MBG-D), and a few weredistantly related to the Methanosarcinales and Methanobacte-riales. Approximately one-third (7 of 23 phylotypes) of theCrenarchaeota phylotypes were grouped within the unculturedenvironmental clades MG-I.1a (20), MG-I.3b, and MBG-B.Remaining crenarchaeotal phylotypes were not affiliated withany known clades and grouped with uncultured organism se-quences recovered from marine, estuarine, and anoxic ricepaddy sediments.
The distributions of Euryarchaeota and Crenarchaeota overdepth were investigated by comparing numbers of total se-quences and phylotypes recovered, as well as numbers of phy-lotypes of each group shared between depth intervals. Com-parisons between the numbers of sequences affiliated withCrenarchaeota and Euryarchaeota indicated that Crenarchaeotasequences were more abundant in the deeper sediment layers(Fig. 6A). The largest number of shared phylotypes was be-tween the 22- to 23-cm and 32- to 33-cm clone libraries,whereas the 0- to 1-cm clone library shared few phylotypes withthose from deeper sediment (Fig. 6B). These trends were alsoreflected in the results from several statistical pairwise com-parisons of clone library structure and composition (Fig. 6).
FIG. 3. Relative abundances of major bacterial groups identified byAPLAUS at selected sediment depth intervals. CFB, Cytophaga-Fla-vobacterium-Bacteriodes group; uncl. and unclassified, unknown taxon.Roman numerals correspond to major subgroups identified by hierar-chical cluster and MDS analyses, shown in Fig. 2. Note the different xaxis scales in panels A and B.
762 SWAN ET AL. APPL. ENVIRON. MICROBIOL.
The estimated number of shared phylotypes (S1,2 Chao1) waslowest between the 0- to 1-cm and 32- to 33-cm depth intervals.Trends in estimates of the probability that a phylotype fromone of two libraries being compared is found in both (Jabund)and the similarity of relative abundance estimates of phylo-types shared between libraries (YC) further support the ob-served compositional differences between clone libraries.
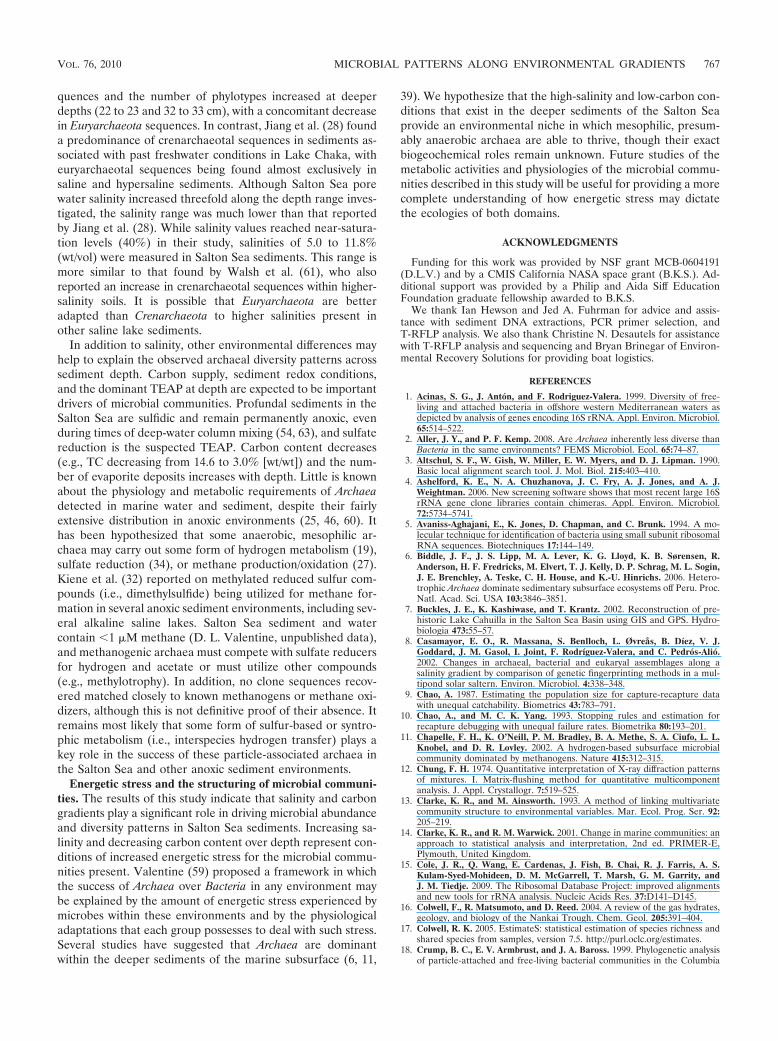
The relative abundance of Crenarchaeota as a function oftotal archaeal abundance (qPCR) or total archaeal 16S rRNAgene sequences recovered (T-RFLP and clone library compo-sition analyses) increased with sediment depth in two distinctregions: within the 0- to 8-cm and 20- to 26-cm depth intervals(Fig. 7). The largest percentage of Crenarchaeota organismswas found in the deepest sediment layers (�20 cm). Althoughestimates of Crenarchaeota abundance were dependent on themethodology used, the general trends with sediment depthwere similar between methods.
DISCUSSION
Microbial abundance patterns along environmental gradi-ents. qPCR estimates of microbial group abundances revealedthat the anoxic sediments of the Salton Sea were dominated byArchaea at all depths. Percent abundance values equaled orexceeded (64 to 99%) those measured from marine subsurface
sediments (6) and other saline lakes (29). On average, theabundance of Bacteria was an order of magnitude lower thanthat of Archaea and showed a more marked decrease withdepth. The largest decline in bacterial 16S rRNA gene abun-dance occurred in the 14- to 18-cm depth interval, just abovethe depth (�22 cm) when the extant lake was formed. It istempting to speculate that this decline was due to the lowerproductivity, and therefore less carbon export to the sediments,of the newly formed lake. However, no limnological informa-tion exists to adequately support this hypothesis. Also, it isdifficult to explain why there was no concomitant decrease inarchaeal abundance. Except in the near-surface layers, theabundance of Crenarchaeota closely followed the pattern ofBacteria; however, the percentage of Crenarchaeota organismsas a function of total Archaea abundance slightly increasedwith depth. It is important that because extracted DNA servedas the template for qPCR, an unknown fraction of quantified16S rRNA genes belong to potentially inactive cells. Averagevalues of 3.6 to 4.1 16S rRNA gene copies per cell, obtainedfrom a bacterial genome database (33), are often used toestimate cell numbers in natural environments. Although bac-terial 16S rRNA gene copy numbers of growing cells can varywidely, estimates for Archaea are typically 1 to 1.5 16S rRNAgene copies per cell. Therefore, it is unlikely that the greater
FIG. 4. Rarefaction curves showing phylotype (�97% similarity) richness of partial archaeal 16S rRNA gene clone libraries from threesediment depth intervals. The table lists characteristics of individual and combined clone libraries.
VOL. 76, 2010 MICROBIAL PATTERNS ALONG ENVIRONMENTAL GRADIENTS 763

abundance of archaeal 16S rRNA gene copies in Salton Seasediments was due to a larger number of gene copies per cellthan that for Bacteria.
Presence of marine archaeal groups in the Salton Sea. Themajority of archaeal phylotypes recovered from Salton Seasediments belong to phylogenetic groups previously describedfrom marine sediments (i.e., MG-II and MBG-B and -D). A
few previous studies have also reported the presence of ar-chaeal marine groups in saline lakes (28, 29). Jiang et al. (29)suggested that similarities in pH (e.g., alkaline) and salinitycomposition (e.g., NaCl dominant) in marine and Tibetan sa-line lake sediments could explain the presence and apparentdominance of these groups in these two seemingly disparateenvironments. The Salton Sea is NaCl-salinity dominant, alka-
FIG. 5. Phylogenetic relationships of Euryarchaeota (A) and Crenarchaeota (B) Salton Sea clone sequences (in bold) from three sediment depthintervals, as well as previously reported environmental sequences and associated GenBank accession numbers. Trees were constructed using theNJ algorithm with Jukes-Cantor-corrected DNA distances. Bootstrap (1,000 replicates) values of �50 are indicated at the nodes. The number ofsequences within each clone group is shown in parentheses, and the depth interval in which each clone was found is indicated by a letter. The scalebars represent a 5% sequence difference, and Aquifex aeolicus was used as an outgroup.
764 SWAN ET AL. APPL. ENVIRON. MICROBIOL.
line, and located close ( 240 km) to both the Pacific Oceanand the Gulf of California. The lake also serves as criticalwetland habitat and functions as a major stopover along thePacific Flyway for millions of migratory birds. The potential forexchange of material (sediment and water) from nearby ma-rine environments provides adequate means for the introduc-tion of marine Archaea into the Salton Sea.
Linking community structure and composition to environ-mental gradients. We employed the whole-community finger-print T-RFLP method to examine changes in relative microbialcommunity structure at a high resolution and to indicate wherecommunity compositional differences occurred. TRF peakdata were also used to quantify the relative gene frequencies ofbacterial and archaeal taxa. While the utility of this techniquehas been demonstrated previously (52), it is important to rec-ognize the limitations of such an approach. The effectiveness of
T-RFLP and clone library analyses in estimating communitystructure and diversity, respectively, can be hindered by arti-facts in the form of preferential DNA extraction, PCR andcloning biases (50), and a lack of primer specificity. Also,individual TRF peaks generated with one restriction enzymeoften belong to more than one taxon. We addressed the lastcaveat by utilizing data from multiple restriction enzyme di-gests for TRF-matching protocols (e.g., APLAUS andTRiFLe). In addition, the majority (�80% of the relative peakarea) of archaeal TRFs were identifiable in our clone libraries.
Shifts in bacterial community structure were strongly depthdependent and correlated with pore water salinity. Groupingsof sediment depths with similar community structures, re-vealed by multivariate analysis of T-RFLP patterns, were fur-ther supported by differences in phylogenetic composition. Thebacterial community composition was dominated by Proteobac-
FIG. 5—Continued.
VOL. 76, 2010 MICROBIAL PATTERNS ALONG ENVIRONMENTAL GRADIENTS 765
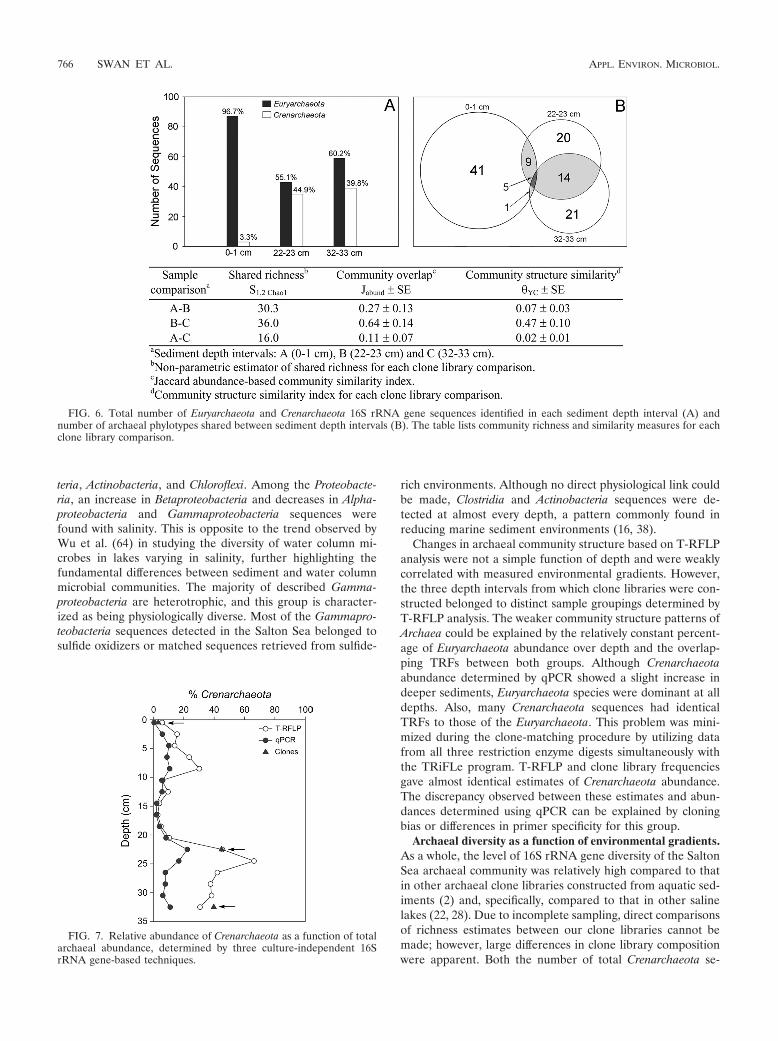
teria, Actinobacteria, and Chloroflexi. Among the Proteobacte-ria, an increase in Betaproteobacteria and decreases in Alpha-proteobacteria and Gammaproteobacteria sequences werefound with salinity. This is opposite to the trend observed byWu et al. (64) in studying the diversity of water column mi-crobes in lakes varying in salinity, further highlighting thefundamental differences between sediment and water columnmicrobial communities. The majority of described Gamma-proteobacteria are heterotrophic, and this group is character-ized as being physiologically diverse. Most of the Gammapro-teobacteria sequences detected in the Salton Sea belonged tosulfide oxidizers or matched sequences retrieved from sulfide-
rich environments. Although no direct physiological link couldbe made, Clostridia and Actinobacteria sequences were de-tected at almost every depth, a pattern commonly found inreducing marine sediment environments (16, 38).
Changes in archaeal community structure based on T-RFLPanalysis were not a simple function of depth and were weaklycorrelated with measured environmental gradients. However,the three depth intervals from which clone libraries were con-structed belonged to distinct sample groupings determined byT-RFLP analysis. The weaker community structure patterns ofArchaea could be explained by the relatively constant percent-age of Euryarchaeota abundance over depth and the overlap-ping TRFs between both groups. Although Crenarchaeotaabundance determined by qPCR showed a slight increase indeeper sediments, Euryarchaeota species were dominant at alldepths. Also, many Crenarchaeota sequences had identicalTRFs to those of the Euryarchaeota. This problem was mini-mized during the clone-matching procedure by utilizing datafrom all three restriction enzyme digests simultaneously withthe TRiFLe program. T-RFLP and clone library frequenciesgave almost identical estimates of Crenarchaeota abundance.The discrepancy observed between these estimates and abun-dances determined using qPCR can be explained by cloningbias or differences in primer specificity for this group.
Archaeal diversity as a function of environmental gradients.As a whole, the level of 16S rRNA gene diversity of the SaltonSea archaeal community was relatively high compared to thatin other archaeal clone libraries constructed from aquatic sed-iments (2) and, specifically, compared to that in other salinelakes (22, 28). Due to incomplete sampling, direct comparisonsof richness estimates between our clone libraries cannot bemade; however, large differences in clone library compositionwere apparent. Both the number of total Crenarchaeota se-
FIG. 6. Total number of Euryarchaeota and Crenarchaeota 16S rRNA gene sequences identified in each sediment depth interval (A) andnumber of archaeal phylotypes shared between sediment depth intervals (B). The table lists community richness and similarity measures for eachclone library comparison.
FIG. 7. Relative abundance of Crenarchaeota as a function of totalarchaeal abundance, determined by three culture-independent 16SrRNA gene-based techniques.
766 SWAN ET AL. APPL. ENVIRON. MICROBIOL.
quences and the number of phylotypes increased at deeperdepths (22 to 23 and 32 to 33 cm), with a concomitant decreasein Euryarchaeota sequences. In contrast, Jiang et al. (28) founda predominance of crenarchaeotal sequences in sediments as-sociated with past freshwater conditions in Lake Chaka, witheuryarchaeotal sequences being found almost exclusively insaline and hypersaline sediments. Although Salton Sea porewater salinity increased threefold along the depth range inves-tigated, the salinity range was much lower than that reportedby Jiang et al. (28). While salinity values reached near-satura-tion levels (40%) in their study, salinities of 5.0 to 11.8%(wt/vol) were measured in Salton Sea sediments. This range ismore similar to that found by Walsh et al. (61), who alsoreported an increase in crenarchaeotal sequences within higher-salinity soils. It is possible that Euryarchaeota are betteradapted than Crenarchaeota to higher salinities present inother saline lake sediments.
In addition to salinity, other environmental differences mayhelp to explain the observed archaeal diversity patterns acrosssediment depth. Carbon supply, sediment redox conditions,and the dominant TEAP at depth are expected to be importantdrivers of microbial communities. Profundal sediments in theSalton Sea are sulfidic and remain permanently anoxic, evenduring times of deep-water column mixing (54, 63), and sulfatereduction is the suspected TEAP. Carbon content decreases(e.g., TC decreasing from 14.6 to 3.0% [wt/wt]) and the num-ber of evaporite deposits increases with depth. Little is knownabout the physiology and metabolic requirements of Archaeadetected in marine water and sediment, despite their fairlyextensive distribution in anoxic environments (25, 46, 60). Ithas been hypothesized that some anaerobic, mesophilic ar-chaea may carry out some form of hydrogen metabolism (19),sulfate reduction (34), or methane production/oxidation (27).Kiene et al. (32) reported on methylated reduced sulfur com-pounds (i.e., dimethylsulfide) being utilized for methane for-mation in several anoxic sediment environments, including sev-eral alkaline saline lakes. Salton Sea sediment and watercontain 1 �M methane (D. L. Valentine, unpublished data),and methanogenic archaea must compete with sulfate reducersfor hydrogen and acetate or must utilize other compounds(e.g., methylotrophy). In addition, no clone sequences recov-ered matched closely to known methanogens or methane oxi-dizers, although this is not definitive proof of their absence. Itremains most likely that some form of sulfur-based or syntro-phic metabolism (i.e., interspecies hydrogen transfer) plays akey role in the success of these particle-associated archaea inthe Salton Sea and other anoxic sediment environments.
Energetic stress and the structuring of microbial communi-ties. The results of this study indicate that salinity and carbongradients play a significant role in driving microbial abundanceand diversity patterns in Salton Sea sediments. Increasing sa-linity and decreasing carbon content over depth represent con-ditions of increased energetic stress for the microbial commu-nities present. Valentine (59) proposed a framework in whichthe success of Archaea over Bacteria in any environment maybe explained by the amount of energetic stress experienced bymicrobes within these environments and by the physiologicaladaptations that each group possesses to deal with such stress.Several studies have suggested that Archaea are dominantwithin the deeper sediments of the marine subsurface (6, 11,
39). We hypothesize that the high-salinity and low-carbon con-ditions that exist in the deeper sediments of the Salton Seaprovide an environmental niche in which mesophilic, presum-ably anaerobic archaea are able to thrive, though their exactbiogeochemical roles remain unknown. Future studies of themetabolic activities and physiologies of the microbial commu-nities described in this study will be useful for providing a morecomplete understanding of how energetic stress may dictatethe ecologies of both domains.
ACKNOWLEDGMENTS
Funding for this work was provided by NSF grant MCB-0604191(D.L.V.) and by a CMIS California NASA space grant (B.K.S.). Ad-ditional support was provided by a Philip and Aida Siff EducationFoundation graduate fellowship awarded to B.K.S.
We thank Ian Hewson and Jed A. Fuhrman for advice and assis-tance with sediment DNA extractions, PCR primer selection, andT-RFLP analysis. We also thank Christine N. Desautels for assistancewith T-RFLP analysis and sequencing and Bryan Brinegar of Environ-mental Recovery Solutions for providing boat logistics.
REFERENCES
1. Acinas, S. G., J. Anton, and F. Rodriguez-Valera. 1999. Diversity of free-living and attached bacteria in offshore western Mediterranean waters asdepicted by analysis of genes encoding 16S rRNA. Appl. Environ. Microbiol.65:514–522.
2. Aller, J. Y., and P. F. Kemp. 2008. Are Archaea inherently less diverse thanBacteria in the same environments? FEMS Microbiol. Ecol. 65:74–87.
3. Altschul, S. F., W. Gish, W. Miller, E. W. Myers, and D. J. Lipman. 1990.Basic local alignment search tool. J. Mol. Biol. 215:403–410.
4. Ashelford, K. E., N. A. Chuzhanova, J. C. Fry, A. J. Jones, and A. J.Weightman. 2006. New screening software shows that most recent large 16SrRNA gene clone libraries contain chimeras. Appl. Environ. Microbiol.72:5734–5741.
5. Avaniss-Aghajani, E., K. Jones, D. Chapman, and C. Brunk. 1994. A mo-lecular technique for identification of bacteria using small subunit ribosomalRNA sequences. Biotechniques 17:144–149.
6. Biddle, J. F., J. S. Lipp, M. A. Lever, K. G. Lloyd, K. B. Sørensen, R.Anderson, H. F. Fredricks, M. Elvert, T. J. Kelly, D. P. Schrag, M. L. Sogin,J. E. Brenchley, A. Teske, C. H. House, and K.-U. Hinrichs. 2006. Hetero-trophic Archaea dominate sedimentary subsurface ecosystems off Peru. Proc.Natl. Acad. Sci. USA 103:3846–3851.
7. Buckles, J. E., K. Kashiwase, and T. Krantz. 2002. Reconstruction of pre-historic Lake Cahuilla in the Salton Sea Basin using GIS and GPS. Hydro-biologia 473:55–57.
8. Casamayor, E. O., R. Massana, S. Benlloch, L. Øvreås, B. Díez, V. J.Goddard, J. M. Gasol, I. Joint, F. Rodríguez-Valera, and C. Pedros-Alio.2002. Changes in archaeal, bacterial and eukaryal assemblages along asalinity gradient by comparison of genetic fingerprinting methods in a mul-tipond solar saltern. Environ. Microbiol. 4:338–348.
9. Chao, A. 1987. Estimating the population size for capture-recapture datawith unequal catchability. Biometrics 43:783–791.
10. Chao, A., and M. C. K. Yang. 1993. Stopping rules and estimation forrecapture debugging with unequal failure rates. Biometrika 80:193–201.
11. Chapelle, F. H., K. O’Neill, P. M. Bradley, B. A. Methe, S. A. Ciufo, L. L.Knobel, and D. R. Lovley. 2002. A hydrogen-based subsurface microbialcommunity dominated by methanogens. Nature 415:312–315.
12. Chung, F. H. 1974. Quantitative interpretation of X-ray diffraction patternsof mixtures. I. Matrix-flushing method for quantitative multicomponentanalysis. J. Appl. Crystallogr. 7:519–525.
13. Clarke, K. R., and M. Ainsworth. 1993. A method of linking multivariatecommunity structure to environmental variables. Mar. Ecol. Prog. Ser. 92:205–219.
14. Clarke, K. R., and R. M. Warwick. 2001. Change in marine communities: anapproach to statistical analysis and interpretation, 2nd ed. PRIMER-E,Plymouth, United Kingdom.
15. Cole, J. R., Q. Wang, E. Cardenas, J. Fish, B. Chai, R. J. Farris, A. S.Kulam-Syed-Mohideen, D. M. McGarrell, T. Marsh, G. M. Garrity, andJ. M. Tiedje. 2009. The Ribosomal Database Project: improved alignmentsand new tools for rRNA analysis. Nucleic Acids Res. 37:D141–D145.
16. Colwell, F., R. Matsumoto, and D. Reed. 2004. A review of the gas hydrates,geology, and biology of the Nankai Trough. Chem. Geol. 205:391–404.
17. Colwell, R. K. 2005. EstimateS: statistical estimation of species richness andshared species from samples, version 7.5. http://purl.oclc.org/estimates.
18. Crump, B. C., E. V. Armbrust, and J. A. Baross. 1999. Phylogenetic analysisof particle-attached and free-living bacterial communities in the Columbia
VOL. 76, 2010 MICROBIAL PATTERNS ALONG ENVIRONMENTAL GRADIENTS 767
River, its estuary, and the adjacent coastal ocean. Appl. Environ. Microbiol.65:3192–3204.
19. Dawson, S. C., E. F. Delong, and N. R. Pace. 2006. Phylogenetic and eco-logical perspectives on uncultured Crenarchaeota and Korarchaeota, p. 281–289. In M. Dworkin, S. Falkow, E. Rosenberg, K.-H. Schleifer, and E.Stackebrandt (ed.), The prokaryotes, volume 3. Archaea. Bacteria: Firmi-cutes, Actinomycetes. Springer-Verlag, New York, NY.
20. DeLong, E. F. 1992. Archaea in coastal marine environments. Proc. Natl.Acad. Sci. USA 89:5685–5689.
21. DeSantis, T. Z., P. Hugenholtz, N. Larsen, M. Rojas, E. L. Brodie, K. Keller,T. Huber, D. Dalevi, P. Hu, and G. L. Andersen. 2006. Greengenes, achimera-checked 16S rRNA gene database and workbench compatible withARB. Appl. Environ. Microbiol. 72:5069–5072.
22. Dong, H., G. Zhang, H. Jiang, B. Yu, L. Chapman, C. Lucas, and M. Fields.2006. Microbial diversity in sediments of saline Qinghai Lake, China: linkinggeochemical controls to microbial ecology. Microb. Ecol. 51:65–82.
23. Gieskes, J. M., T. Gamo, and H. Brumsack. 1991. Chemical methods forinterstitial water analysis aboard Joides Resolution. Ocean drilling program,technical note 15. Texas A&M University, College Station, TX.
24. Hatzenpichler, R., E. V. Lebedeva, E. Spieck, K. Stoecker, A. Richter, H.Daims, and M. Wagner. 2008. A moderately thermophilic ammonia-oxidiz-ing crenarchaeote from a hot spring. Proc. Natl. Acad. Sci. USA 105:2134–2139.
25. Hershberger, K. L., S. M. Barns, A.-L. Reysenbach, S. C. Dawson, and N. R.Pace. 1996. Wide diversity of Crenarchaeota. Nature 384:420.
26. Huber, T., G. Faulkner, and P. Hugenholtz. 2004. Bellerophon: a program todetect chimeric sequences in multiple sequence alignments. Bioinformatics20:2317–2319.
27. Inagaki, F., T. Nunoura, S. Nakagawa, A. Teske, M. Lever, A. Lauer, M.Suzuki, K. Takai, M. Delwiche, F. S. Colwell, K. H. Nealson, K. Horikoshi,S. D’Hondt, and B. B. Jørgensen. 2006. Biogeographical distribution anddiversity of microbes in methane hydrate-bearing deep marine sediments onthe Pacific Ocean Margin. Proc. Natl. Acad. Sci. USA 103:2815–2820.
28. Jiang, H., H. Dong, B. Yu, X. Liu, Y. Li, S. Ji, and C. L. Zhang. 2007.Microbial response to salinity change in Lake Chaka, a hypersaline lake onTibetan plateau. Environ. Microbiol. 9:2603–2621.
29. Jiang, H., H. Dong, B. Yu, Q. Ye, J. Shen, H. Rowe, and C. Zhang. 2008.Dominance of putative marine benthic Archaea in Qinghai Lake, north-western China. Environ. Microbiol. 10:2355–2367.
30. Junier, P., T. Junier, and K.-P. Witzel. 2008. TRiFLe, a program for in silicoterminal restriction fragment length polymorphism analysis with user-defined sequence sets. Appl. Environ. Microbiol. 74:6452–6456.
31. Kent, A. D., D. J. Smith, B. J. Benson, and E. W. Triplett. 2003. Web-basedphylogenetic assignment tool for analysis of terminal restriction fragmentlength polymorphism profiles of microbial communities. Appl. Environ. Mi-crobiol. 69:6768–6776.
32. Kiene, R. P., R. S. Oremland, A. Catena, L. G. Miller, and D. G. Capone.1986. Metabolism of reduced methylated sulfur compounds in anaerobicsediments and by a pure culture of an estuarine methanogen. Appl. Environ.Microbiol. 52:1037–1045.
33. Klappenbach, J. A., P. R. Saxman, J. R. Cole, and T. M. Schmidt. 2001.rrndb: the ribosomal RNA operon copy number database. Nucleic AcidsRes. 29:181–184.
34. Knittel, K., T. Losekann, A. Boetius, R. Kort, and R. Amann. 2005. Diversityand distribution of methanotrophic Archaea at cold seeps. Appl. Environ.Microbiol. 71:467–479.
35. Lane, D. J. 1991. 16S/23S rRNA sequencing, p. 115–175. In E. Stackebrandtand M. Goodfellow (ed.), Nucleic acid techniques in bacterial systematics.John Wiley & Sons, Chichester, United Kingdom.
36. Lane, D. J., B. Pace, G. J. Olsen, D. A. Stahl, M. L. Sogin, and N. R. Pace.1985. Rapid determination of 16S ribosomal RNA sequences for phyloge-netic analyses. Proc. Natl. Acad. Sci. USA 82:6955–6959.
37. Li, H. C., T. L. Ku, X. M. Xu, R. Peters, and H. P. Buchheim. 2003.Hydrologic and climatic variations in the Salton Basin, California, between1,400 and 16,500 14C yr BP as read from geochemical signals in lake depos-its, p. 162–163. Abstr. 3rd Int. Limnogeol. Cong., Tucson, AZ.
38. Li, Y., F. Li, X. Zhang, S. Qin, Z. Zeng, H. Dang, and Y. Qin. 2008. Verticaldistribution of bacterial and archaeal communities along discrete layers of adeep-sea cold sediment sample at the East Pacific Rise (�13°N). Extremo-philes 12:573–585.
39. Lipp, J. S., Y. Morono, F. Inagaki, and K.-U. Hinrichs. 2008. Significantcontribution of Archaea to extant biomass in marine subsurface sediments.Nature 454:991–994.
40. Nadkarni, M. A., F. E. Martin, N. A. Jacques, and N. Hunter. 2002. Deter-mination of bacterial load by real-time PCR using a broad-range (universal)probe and primers set. Microbiology 148:257–266.
41. Nealson, K., and W. Berelson. 2003. Layered microbial communities and thesearch for life in the universe. Geomicrobiol. J. 20:451–462.
42. Nelson, K. A., N. S. Moin, and A. E. Bernhard. 2009. Archaeal diversity andthe prevalence of Crenarchaeota in salt marsh sediments. Appl. Environ.Microbiol. 75:4211–4215.
43. Ochsenreiter, T., D. Selezi, A. Quaiser, L. Bonch-Osmolovskaya, and C.Schleper. 2003. Diversity and abundance of Crenarchaeota in terrestrialhabitats studied by 16S RNA surveys and real time PCR. Environ. Microbiol.5:787–797.
44. Oren, A. 2001. The bioenergetic basis for the decrease in metabolic diversityat increasing salt concentrations: implications for the functioning of salt lakeecosystems. Hydrobiologia 466(Dev. Hydrobiol. 162):61–72.
45. Page, R. D. M. 1996. Tree View: an application to display phylogenetic treeson personal computers. Bioinformatics 12:357–358.
46. Schleper, C., W. Holben, and H.-P. Klenk. 1997. Recovery of crenarchaeotalribosomal DNA sequences from freshwater-lake sediments. Appl. Environ.Microbiol. 63:321–323.
47. Schleper, C., G. Jurgens, and M. Jonuscheit. 2005. Genomic studies ofuncultivated archaea. Nat. Rev. Microbiol. 3:479–488.
48. Schloss, P. D., and J. Handelsman. 2005. Introducing DOTUR, a computerprogram for defining operational taxonomic units and estimating speciesrichness. Appl. Environ. Microbiol. 71:1501–1506.
49. Schloss, P. D., and J. Handelsman. 2006. Introducing SONS, a tool foroperational taxonomic unit-based comparisons of microbial communitymemberships and structures. Appl. Environ. Microbiol. 72:6773–6779.
50. Schmalenberger, A., F. Schwieger, and C. C. Tebbe. 2001. Effect of primershybridizing to different evolutionarily conserved regions of the small-subunitrRNA gene in PCR-based microbial community analyses and genetic pro-filing. Appl. Environ. Microbiol. 67:3557–3563.
51. Schroeder, R. A., W. H. Orem, and Y. K. Kharaka. 2002. Chemical evolutionof the Salton Sea, California: nutrient and selenium dynamics. Hydrobiolo-gia 473(Dev. Hydrobiol. 161):23–45.
52. Schutte, U., Z. Abdo, S. Bent, C. Shyu, C. Williams, J. Pierson, and L.Forney. 2008. Advances in the use of terminal restriction fragment lengthpolymorphism (T-RFLP) analysis of 16S rRNA genes to characterize micro-bial communities. Appl. Microbiol. Biotechnol. 80:365–380.
53. Shyu, C., T. Soule, S. Bent, J. Foster, and L. Forney. 2007. MiCA: a web-based tool for the analysis of microbial communities based on terminal-restriction fragment length polymorphisms of 16S and 18S rRNA genes.Microb. Ecol. 53:562–570.
54. Swan, B. K., J. M. Watts, K. M. Reifel, and S. H. Hurlbert. 2007. Role of thepolychaete Neanthes succinea in phosphorus regeneration from sediments inthe Salton Sea, California. Hydrobiologia 576:111–125.
55. Swofford, D. L. 2003. PAUP*. Phylogenetic analysis using parsimony (*andother methods), version 4.0. Sinauer Associates, Sunderland, MA.
56. Takai, K., and K. Horikoshi. 2000. Rapid detection and quantification ofmembers of the archaeal community by quantitative PCR using fluorogenicprobes. Appl. Environ. Microbiol. 66:5066–5072.
57. Thompson, J. D., T. J. Gibson, F. Plewniak, F. Jeanmougin, and D. G.Higgins. 1997. The CLUSTAL_X windows interface: flexible strategies formultiple sequence alignment aided by quality analysis tools. Nucleic AcidsRes. 25:4876–4882.
58. Tindall, B. J., and H. G. Truper. 1986. Ecophysiology of the aerobic halo-philic archaebacteria. Syst. Appl. Microbiol. 7:202–212.
59. Valentine, D. L. 2007. Adaptations to energy stress dictate the ecology andevolution of the Archaea. Nat. Rev. Microbiol. 5:316–323.
60. Vetriani, C., A.-L. Reysenbach, and J. Dore. 1998. Recovery and phyloge-netic analysis of archaeal rRNA sequences from continental shelf sediments.FEMS Microbiol. Ecol. 161:83–88.
61. Walsh, D. A., R. T. Papke, and W. F. Doolittle. 2005. Archaeal diversity alonga soil salinity gradient prone to disturbance. Environ. Microbiol. 7:1655–1666.
62. Wardlaw, G. D., and D. L. Valentine. 2005. Evidence for salt diffusion fromsediments contributing to increasing salinity in the Salton Sea, California.Hydrobiologia 533:77–85.
63. Watts, J. M., B. K. Swan, M. A. Tiffany, and S. H. Hurlbert. 2001. Thermal,mixing, and oxygen regimes of the Salton Sea, California, 1997–1999. Hy-drobiologia 466:159–176.
64. Wu, Q. L., G. Zwart, M. Schauer, M. P. Kamst-van Agterveld, and M. W.Hahn. 2006. Bacterioplankton community composition along a salinity gra-dient of sixteen high-mountain lakes located on the Tibetan Plateau, China.Appl. Environ. Microbiol. 72:5478–5485.
65. Yue, J. C., and M. K. Clayton. 2005. A similarity measure based on speciesproportions. Commun. Stat. Theor. Methods 34:2123–2131.
66. Yue, J. C., M. K. Clayton, and F.-C. Lin. 2001. A nonparametric estimator ofspecies overlap. Biometrics 57:743–749.
768 SWAN ET AL. APPL. ENVIRON. MICROBIOL.
Related Documents