Arbitrage Trading: the Long and the Short of It Yong Chen Texas A&M University Zhi Da University of Notre Dame Dayong Huang University of North Carolina at Greensboro First draft: December 1, 2014 This version: May 3, 2018 Abstract We examine net arbitrage trading (NAT) measured by the difference between quarterly abnormal hedge fund holdings and abnormal short interest. NAT strongly predicts stock returns in the cross section. Across 10 well-known stock anomalies, abnormal returns are realized only among stocks experiencing large NAT. Exploiting Regulation SHO that facilitated short-selling for a random group of stocks, we present causal evidence that NAT has stronger return predictability among stocks facing greater limits- to-arbitrage. We also find large returns for anomalies that arbitrageurs chose to exploit despite capital constraints during the 2007-2009 financial crisis. Finally, we confirm our main findings using daily data. (JEL Classification: G11, G23) Keywords: Arbitrage trading, hedge funds, short selling, stock anomalies, limits to arbitrage a We are grateful to Andrew Karolyi (the Executive Editor) and an anonymous referee for valuable advice. We thank Charles Cao, Roger Edelen, Samuel Hanson, Johan Hombert (Paris conference discussant), Byoung-Hyoun Hwang (AFA discussant), Hagen Kim, Weikai Li (CICF discussant), Bing Liang, Jeffrey Pontiff, Marco Rossi, Kalle Rinne (Luxembourg conference discussant), Thomas Ruf (EFA discussant), Clemens Sialm, Sorin Sorescu, Zheng Sun, Robert Stambaugh, Wei Wu, Jianfeng Yu, and seminar and conference participants at Miami University, Texas A&M University, University of Hawaii, University of Notre Dame, the 2015 European Finance Association Meeting in Vienna, the 4th Luxembourg Asset Management Summit, 2015 Macquarie Global Quantitative Research Conference in Hong Kong, the 2016 American Finance Association Annual Meeting in San Francisco, the 8th Annual Hedge Fund Research Conference in Paris, the 2016 China International Conference in Finance, and the 2016 Financial Management Association Meeting in Las Vegas for helpful discussions and comments. Chen acknowledges financial support from the RepublicBank Research Fellowship at Texas A&M University. Da acknowledges financial support from the Zych Family Fellowship at the Notre Dame Institute for Global Investing. We are responsible for all remaining errors. Send correspondence to Yong Chen, Department of Finance, Mays Business School, Texas A&M University, College Station, TX 77843-4218; telephone: (979) 845-3870. E- mail: [email protected].

Welcome message from author
This document is posted to help you gain knowledge. Please leave a comment to let me know what you think about it! Share it to your friends and learn new things together.
Transcript

Arbitrage Trading: the Long and the Short of It
Yong Chen
Texas A&M University
Zhi Da
University of Notre Dame
Dayong Huang
University of North Carolina at Greensboro
First draft: December 1, 2014
This version: May 3, 2018
Abstract
We examine net arbitrage trading (NAT) measured by the difference between quarterly abnormal hedge
fund holdings and abnormal short interest. NAT strongly predicts stock returns in the cross section.
Across 10 well-known stock anomalies, abnormal returns are realized only among stocks experiencing
large NAT. Exploiting Regulation SHO that facilitated short-selling for a random group of stocks, we
present causal evidence that NAT has stronger return predictability among stocks facing greater limits-
to-arbitrage. We also find large returns for anomalies that arbitrageurs chose to exploit despite capital
constraints during the 2007-2009 financial crisis. Finally, we confirm our main findings using daily
data. (JEL Classification: G11, G23)
Keywords: Arbitrage trading, hedge funds, short selling, stock anomalies, limits to arbitrage
a
We are grateful to Andrew Karolyi (the Executive Editor) and an anonymous referee for valuable advice.
We thank Charles Cao, Roger Edelen, Samuel Hanson, Johan Hombert (Paris conference discussant),
Byoung-Hyoun Hwang (AFA discussant), Hagen Kim, Weikai Li (CICF discussant), Bing Liang, Jeffrey
Pontiff, Marco Rossi, Kalle Rinne (Luxembourg conference discussant), Thomas Ruf (EFA discussant),
Clemens Sialm, Sorin Sorescu, Zheng Sun, Robert Stambaugh, Wei Wu, Jianfeng Yu, and seminar and
conference participants at Miami University, Texas A&M University, University of Hawaii, University of
Notre Dame, the 2015 European Finance Association Meeting in Vienna, the 4th Luxembourg Asset
Management Summit, 2015 Macquarie Global Quantitative Research Conference in Hong Kong, the 2016
American Finance Association Annual Meeting in San Francisco, the 8th Annual Hedge Fund Research
Conference in Paris, the 2016 China International Conference in Finance, and the 2016 Financial
Management Association Meeting in Las Vegas for helpful discussions and comments. Chen acknowledges
financial support from the RepublicBank Research Fellowship at Texas A&M University. Da acknowledges
financial support from the Zych Family Fellowship at the Notre Dame Institute for Global Investing. We
are responsible for all remaining errors. Send correspondence to Yong Chen, Department of Finance, Mays
Business School, Texas A&M University, College Station, TX 77843-4218; telephone: (979) 845-3870. E-
mail: [email protected].

1
Arbitrageurs play a crucial role in modern finance. Textbooks describe arbitrageurs as entities that,
by simultaneously taking long and short positions in different assets, help eliminate mispricing
and restore market efficiency. As a result, their trading pins down the expected return on these
assets, according to the arbitrage pricing theory (APT) of Ross (1976). On the other hand,
investors’ behavioral biases and agency frictions may lead to persistent mispricing when
arbitrageurs face limits-to-arbitrage (e.g., De Long, Shleifer, Summers, and Waldman, 1990;
Shleifer and Vishny, 1997).1 Relative to theoretical development, however, our understanding
about arbitrage activity from empirical research is still rather limited.
One major challenge in studying arbitrage activity empirically has been the lack of data on
arbitrageurs.2 However, as hedge funds emerged as institutionalized arbitrageurs and the data of
their stock holdings became available in recent years, a series of papers has inferred the long side
of arbitrage trading by investigating hedge fund stock holdings (e.g., Brunnermeier and Nagel,
2004; Griffin and Xu, 2009; Cao, Chen, Goetzmann, and Liang, 2017). Meanwhile, since short
positions are involved in arbitrage trades, several studies track the short side of arbitrage trading
by examining short-selling activity on stocks (e.g., Boehmer, Jones, and Zhang, 2008; Hanson and
Sunderam, 2014; Hwang, Liu, and Xu, 2017).
In this paper, we propose a measure of net arbitrage trading against a stock by combining
hedge fund holdings as the proxy for the long side with short interest as the proxy for the short
side. Intuitively, combining the two sides provides a complete view about arbitrage trading that
usually involves both long and short positions. The advantage of our measure, however, goes
beyond adding up the effects from the two sides. Arbitrageurs may disagree on the value of a stock,
so that the same stock is bought by some arbitrageurs and sold short by others. Moreover, a
correctly priced stock may be purchased by some arbitrageurs while sold short by others for
1 See Gromb and Vayanos (2012) for a survey of theoretical development in the literature on limits to arbitrage. 2 The type of arbitrageurs we are interested in is those, as described in the APT, who take long and short positions in
well-diversified portfolios with similar risk exposures but different expected returns. It is different from pure arbitrage
in which assets in long and short positions have identical cash flows.

2
hedging purposes.3 Thus, as long as the correlation between the two sides is not –1 (which is
confirmed in our empirical analysis), our measure based on the net position, i.e., the difference
between the two sides, differs from the summation of the effects from the two sides and represents
a more accurate proxy for arbitrage trading. 4 Based on this measure, we attempt to better
understand the information content of arbitrage activity, in particular, the interaction between
arbitrage trading, stock anomalies, and the role of limits-to-arbitrage. We discuss this interaction
in detail in the form of hypothesis development in Section 1, and those hypotheses guide our
empirical analysis.
For the empirical analysis, we first combine hedge fund holdings and short interest at the
stock level over the period 1990–2015. To capture quarterly variations in arbitrage activity relative
to the trend, we define abnormal hedge fund holdings (AHF) and abnormal short interest (ASR)
as their values in a quarter minus their moving averages in the past four quarters. Then, we measure
net arbitrage trading, denoted NAT, as the difference between AHF and ASR to capture the trade
imbalance of arbitrageurs. For example, an NAT of 1% on a stock means that arbitrageurs, as a
group, have purchased an additional 1% of the stock (as the percentage of total number of shares
outstanding) during the quarter relative to their past average.
Our analysis provides six sets of results. First, we show that NAT significantly predicts
future stock returns. Stocks in the highest NAT quintile outperform those in the lowest quintile by
0.73% per month (t-value = 8.56) in the next quarter. The return spread declines over time to 0.40%
per month (t-value = 4.43) in the second quarter, further down to 0.17% per month (t-value = 1.90)
in the third quarter, and then becomes insignificant in the subsequent quarters within two years.
3 For example, a correctly priced value stock with poor recent returns may be bought by a value trader and
simultaneously shorted by a momentum trader to hedge their respective long-short strategies. Similarly, a stock may
be sold short to hedge against a convertible bond purchase. In such cases, simultaneous increases in both long and
short sides do not necessarily indicate disagreement (i.e., differences of opinion) among arbitrageurs about the value
of the stock as described in Miller (1977). Our measure, however, captures net arbitrage trading on the stock. 4 Our analysis also helps explain the puzzling relation documented in Boehmer, Huszar, and Jordan (2010) that heavily
traded stocks with low short interest subsequently experience significantly positive abnormal returns. Their finding is
not surprising if we focus on net arbitrage trading because stocks with low short interest, on average, experience net
purchases from arbitrageurs. Hence, combining the two sides of arbitrage activity provides insights that cannot be
obtained from either side alone.

3
The return predictability of NAT remains significant in the first two quarters even on a risk-
adjusted basis, suggesting that NAT is informative about mispricing. This return predictability
holds in a battery of robustness checks, including Fama-MacBeth cross-sectional regressions
controlling for other return predictors and double sorting on AHF and ASR. Importantly, this
return predictability does not reverse in the long run, suggesting that it is not due to temporary
price pressure caused by arbitrage trading.
Second, we examine the relation between NAT and stock anomalies. Our tests cover 10
well-known anomalies, including book-to-market ratio, gross profitability, operating profit, return
momentum, market capitalization, asset growth, investment growth, net stock issues, accrual, and
net operating assets. We find striking evidence that abnormal returns are driven by anomaly stocks
traded by arbitrageurs. Specifically, we define an anomaly stock to be traded by arbitrageurs if it
is in the long portfolio and recently bought by arbitrageurs (i.e., its NAT belongs to the top 30%),
or if it is in the short portfolio and recently sold short by arbitrageurs (i.e., its NAT belongs to the
bottom 30%). On average, this subset of anomaly stocks exhibits significant return spreads
(between the long and the short leg) of 0.88% (t-value = 7.95), 0.60% (t-value = 5.46), 0.41% (t-
value = 4.04), and 0.32% (t-value = 3.25) per month during the first, second, third, and fourth
quarters, respectively. In sharp contrast, the rest of anomaly stocks earn return spreads less than
0.15% per month over the same quarters. We confirm this pattern using a single comprehensive
mispricing measure (MISP) constructed by Stambaugh, Yu, and Yuan (2015). Among “mispriced”
stocks, those traded by arbitrageurs earn much higher returns than the rest in the next four quarters.
The strong return predictability of NAT in both the entire cross-section and anomaly stocks
suggests that the market is not always efficient and the arbitrageurs are indeed effective in
detecting mispricing. The fact that NAT predicts return beyond a quarter suggests that arbitrage
trading does not eliminate mispricing completely and instantaneously, consistent with the
existence of limits-to-arbitrage (Shleifer and Vishny, 1997).
Our third set of results describes two channels through which mispricing is eliminated and
arbitrage profit is realized. One is the release of fundamental information, and the other is related
4
to “copycat trading.” Specifically, we find that a disproportionately large portion of arbitrage profit
takes place around earnings announcements in the next two quarters when fundamental cash flow
information is released to the public. In addition, other types of institutional investors (e.g., mutual
funds, banks, insurance companies) subsequently trade in the same direction as arbitrageurs,
further facilitating price convergence. Interestingly, other institutional investors trade in the
opposite direction to arbitrageurs in the contemporaneous quarter and only start to follow
arbitrageurs with a lag of at least one quarter, consistent with a pattern of copycat trading.
Fourth, NAT allows us to directly test an important implication of limits-to-arbitrage: when
arbitrage is more difficult, arbitrage trading should reveal more severe mispricing, all else being
equal. We adopt Regulation SHO as an instrument for limits-to-arbitrage in the cross section,
following Chu, Hirshleifer, and Ma (2017). During the period from May 2005 to August 2007,
Regulation SHO relaxed short-sale constraints for a randomly selected group of “pilot” stocks.5
As such, pilot stocks face reduced limits-to-arbitrage relative to non-pilot stocks. By measuring
arbitrage trading directly, we examine the causal effect of limits-to-arbitrage on arbitrage activity
which in turn affects anomaly returns and market efficiency. Based on NAT, we confirm that pilot
stocks are sold short more than non-pilot stocks in the pilot period, even though these stocks are
otherwise indistinguishable in terms of stock characteristics. More importantly, we show that NAT
identifies more mispriced stocks among the non-pilot stock sample than among the pilot stock
sample, and the difference is concentrated on the short-leg and during the pilot period.
Fifth, we link aggregate limits-to-arbitrage to NAT and stock anomalies. Examining the
NAT of anomaly stocks, we find significant withdrawal of arbitrage capital during the financial
crisis of 2007–2009, consistent with Ben-David, Franzoni, and Moussawi (2012) and Nagel
(2012). As a novel result, we show that during the crisis when arbitrage capital was constrained in
5 From the Russell 3000 index, Regulation SHO removed short-sale price tests (i.e., uptick rule for NYSE/AMEX and
bid price test for Nasdaq) for a random set of about 1000 pilot stocks that were included as every third stock ranked
by trading volume. This exemption of the short-sale price tests for pilot stocks lasted from May 2, 2005 to August 6,
2007. See Diether, Lee, and Werner (2009) for a detailed description of Regulation SHO and the pilot program.

5
general, those anomalies to which arbitrageurs chose to allocate their scarce capital realized high
future abnormal returns.
Finally, we confirm our main results using daily data during the period from June 2006 to
March 2011. We estimate NAT at a daily frequency by combining daily security lending data with
daily trading records of a subset of hedge funds. The daily frequency of data provides statistical
power even though the tests are performed over a relatively short sample period. We show that
daily NAT significantly predicts stock returns both in the full sample and among anomaly stocks
up to a month. In addition, daily NAT predicts more overpricing among non-pilot stocks during
the pilot period.
Our paper contributes to a growing literature that examines arbitrage activity by hedge fund
holdings and short-selling activity.6 Using data on hedge fund holdings, Brunnermeier and Nagel
(2004) and Griffin, Harris, Shu, and Topaloglu (2011) show that, during the tech bubble period,
hedge funds rode with the bubble and destabilized the market. Further, Griffin and Xu (2009) find
weak predictive power of changes in hedge fund ownership for future stock returns, while
Agarwal, Jiang, Tang, and Yang (2013) document strong return predictability of hedge fund
“confidential holdings.” Cao, Chen, Goetzmann, and Liang (2017) find that, compared with other
types of institutional investors, hedge funds tend to hold and purchase undervalued stocks, and
undervalued stocks with larger hedge fund ownership realize higher returns subsequently. Sias,
Turtle, and Zykaj (2016) show that shocks to hedge fund demand can predict stock returns.
Focusing on the short side, several papers document that stocks with higher short-selling
activity realize lower returns (e.g., Asquith and Meulbroek, 1995; Desai, Ramesh, Thiagarajan,
and Balachandran, 2002; Boehmer, Jones, and Zhang, 2008).7 Using institutional ownership to
6 There exist other proxies for arbitrage trading in the literature. For example, Lou and Polk (2015) infer arbitrage
activity from the comovement of stock returns. 7 There are theoretical arguments about why short sales or short-sale constraints should be related to stock returns.
Miller (1977) argues that, in the presence of heterogeneous beliefs, binding short-sale constraints prevent stock prices
from fully reflecting negative opinions of pessimistic traders, leading to overpricing and low subsequent returns.
Diamond and Verrecchia (1987) show that given their high costs (e.g., no access to proceeds), short sales are more
likely to be informative.

6
proxy for stock loan supply, Asquith, Pathak, and Ritter (2005) find that, for small stocks with
high short interest, low institutional ownership is associated with negative returns, revealing the
effect of short-sale constraints on stock prices. Nagel (2005) finds that short-sale constraints help
explain cross-sectional stock return anomalies. Drechsler and Drechsler (2016) find that short-
rebate fee is informative about overpricing and arbitrage trades.
To the best of our knowledge, our paper is the first to combine information on both long
and short sides to study the relation between arbitrage trading, mispricing, and limits-to-arbitrage.
Our measure of net arbitrage trading provides substantial value over examining either hedge fund
holdings or short interest alone and presents a more complete view about the effect of arbitrage
activity on the returns on stocks and especially anomaly stocks.8 Indeed, NAT not only predicts
stock returns, but facilitates our investigation of the source of arbitrage profit. Most importantly,
when using this measure to study stock anomalies, we find strong evidence supporting the notion
that arbitrage trading is informative about mispricing. Therefore, our analysis sheds new light on
how arbitrageurs operate in stock markets and how their trading affects stock prices.
Recently, exploiting regulatory changes to short selling, Chu, Hirshleifer, and Ma (2017)
show that limits-to-arbitrage affect the correction of mispricing. To the extent that arbitrageurs are
crucial in correcting mispricing, our paper fills in the important element by examining arbitrage
trading directly. For example, one novel hypothesis and finding of our paper is that, in the presence
of limits-to-arbitrage, a larger NAT reveals more severe mispricing. In addition, Hwang, Liu, and
Xu (2017) find that relaxation of short-sale constraints in Hong Kong is associated with increased
hedge fund purchases of underpriced stocks, which highlights the important role of short positions
in hedging arbitrage risks. In our paper, the NAT measure is designed to capture the trade
imbalance between the long side and the short side of arbitrage activity.
8 Jiao, Massa, and Zhang (2016) find that opposite changes in hedge fund holdings and short interest predict stock
returns. Different from their paper, we focus on the interaction between arbitrage trading, stock anomalies, and limits-
to-arbitrage.

7
1. Hypothesis Development
In this section, we develop our main hypotheses for empirical analysis. Through testing
these hypotheses based on the measure of net arbitrage trading, we attempt to better understand
the interaction between arbitrage trading, stock anomalies, and the role of limits-to-arbitrage in the
stock market.
First, it is well known that if the stock market is efficient and information is fully and
instantaneously incorporated into stock prices, arbitrageurs’ trades should not be systematically
related to future stock returns (Fama, 1970). Similarly, even if the market is not efficient but
arbitrageurs are uninformed about stock mispricing, arbitrage trading still does not predict future
stock returns. Thus, in the scenario of efficient market or uninformed arbitrageurs, the NAT
measure should not be related to future stock returns in the cross section.
However, if the market has inefficiencies and arbitrageurs possess skills to correctly
identify mispricing, then arbitrage trading will be informative about future stock returns. More
specifically, stocks heavily bought by arbitrageurs are expected to outperform those heavily
shorted by arbitrageurs on a risk-adjusted basis in the future. Since such return difference is not
caused by temporary price pressure, this return predictability arising from superior information
will not reverse and arbitrage trading should have a permanent price impact. As such, we form our
first hypothesis about the return predictability with informed arbitrageurs.
Hypothesis 1 (Informed arbitrageurs): NAT should positively predict future stock returns
above and beyond temporary price pressure, if the stock market has inefficiencies and arbitrageurs
are informed about mispricing.
Next, we argue that an investigation of anomaly stocks can shed light on what stock-level
information arbitrageurs may use to detect mispricing. If arbitrageurs simply rely on the same set
of anomaly stock characteristics (e.g., book-to-market ratio, operating profit, etc.), then arbitrage
trading should have no additional return predictability among stocks with similar anomaly

8
characteristics.9 Otherwise, return predictability of arbitrage trading among stocks with similar
anomaly characteristics suggests that not all anomaly stocks are “created equal” and that
arbitrageurs use information other than common stock characteristics to detect mispricing. This
rationale leads to our second hypothesis.
Hypothesis 2 (Arbitrage in anomalies): Within the set of stocks that have similar anomaly
characteristics, NAT should positively predict future stock returns above and beyond temporary
price pressure if arbitrageurs use information other than common stock characteristics.
Since collecting and processing information in financial markets involves costs for
arbitrageurs (Grossman and Stiglitz, 1980), the return predictability of arbitrage trading should
also reflect arbitrage costs. If arbitrage costs are negligible, informed arbitrageurs will trade
quickly against mispricing until mispricing is eliminated almost instantaneously. In reality,
however, arbitrageurs often face substantial costs in the forms of transaction costs, short-sale
constraints, limited arbitrage capital, noise trader risk, and synchronization risk (e.g., De Long et
al., 1990; Pontiff, 1996; Shleifer and Vishny, 1997; Abreu and Brunnermeier, 2002). These
frictions, which impose limits-to-arbitrage, impede arbitrageurs from quickly correcting
mispricing. As a result, the correction to mispricing will occur with a delay as fundamental
information is released to the market gradually or during specific information events (such as
earnings announcements), or when other investors start to trade in the same direction as
arbitrageurs perhaps after learning about arbitrage trading. Considering the existence of limits-to-
arbitrage and the consequent delay in the correction to mispricing, we develop our third hypothesis
as follows.
Hypothesis 3 (Presence of limits-to-arbitrage): The predictive power of NAT for future
stock returns should be “long-lasting” in the presence of limits-to-arbitrage.
Finally, limits-to-arbitrage vary across stocks and over time and such variation is expected
to reveal the extent of mispricing. Mispriced stocks with small limits-to-arbitrage are relatively
9 Section 2.3 and the Appendix contain detailed discussions of these stock anomalies that the previous literature has
documented to predict future returns in the cross section.

9
easy for arbitrageurs to trade and will thus yield less abnormal profit, since even small price
deviation from fundamental values will be exploited by arbitrageurs. In doing so, arbitrage trading
corrects mispricing. On the other hand, large frictions impose substantial costs to arbitrageurs and
deter arbitrage trading. Hence, we hypothesize that, when a stock faces great limits-to-arbitrage
yet arbitrageurs, as a group, still choose to trade it heavily, the stock is likely to be severely
mispriced and the potential arbitrage profit outweighs the arbitrage costs. This intuition leads to
the following novel hypothesis.
Hypothesis 4 (Limits-to-arbitrage in the cross section and over time): All else being equal,
the predictive power of NAT for future stock returns should be stronger among mispriced stocks
that face greater limits-to-arbitrage, and during times when arbitrage capital is more constrained.
Testing Hypothesis 4 in the cross section requires a stock-level measure of limits-to-
arbitrage that deter arbitrage trading but do not affect ex-ante mispricing. It is empirically difficult,
however, to separate limits-to-arbitrage and ex-ante mispricing, since both of them are often
proxied in previous research by the same stock characteristics such as size and volatility. In our
paper, we use Regulation SHO as an instrument of limits-to-arbitrage at the stock level, following
Chu, Hirshleifer, and Ma (2017). During the period from May 2005 to August 2007, Regulation
SHO reduced short-sale constraints for a randomly selected group of pilot stocks. As a result, for
two equally overpriced stocks, the non-pilot stock faces greater limits-to-arbitrage than the pilot
stock, while they could otherwise be identical due to the random nature of the pilot stock
assignment. Hypothesis 4 predicts that overpriced non-pilot stocks sold short by arbitrageurs will
experience larger underperformance than similar overpriced pilot stocks during the pilot period.
For underpriced stocks, however, no significant difference should be observed between pilot and
non-pilot stocks during the pilot period. Similarly, no significant difference should be observed
between the two groups of stocks outside the pilot period.
Limits-to-arbitrage also vary over time. For example, Ben-David, Franzoni, and Moussawi
(2012) and Nagel (2012) provide evidence that arbitrage capital was severely constrained during
the 2007–2009 financial crisis. Our NAT measure allows us to directly examine how such

10
important limits-to-arbitrage affect various anomalies differently. Specifically, Hypothesis 4
predicts that anomalies exploited by arbitrageurs during the crisis, despite their capital constraints,
should perform particularly well in the near future.
2. Data and Sample Construction
2.1 Hedge Fund Holdings
For the long side, we employ the data on hedge fund stock holdings following Cao, Chen,
Goetzmann, and Liang (2017). The data are constructed by manually matching the Thomson
Reuters 13F institutional holdings data with a comprehensive list of hedge fund company names.
The list of hedge fund company names is compiled from six hedge fund databases, namely TASS,
HFR, CISDM, Bloomberg, Barclay Hedge and Morningstar. Under the Securities Exchange Act
of 1934, all institutional investors, including hedge fund management companies, with investment
discretion over $100 million are required to report their stock holdings to the Securities and
Exchange Commission (SEC) through quarterly Form 13F filings in which stock positions greater
than 10,000 shares or $200,000 in market value are subject to disclosure.
Since the 13F holdings data do not indicate which institutions are hedge fund companies,
we identify hedge fund companies through the following three steps. First, 13F institutions are
matched with the list of hedge fund company names. Second, among the matched institutions, we
assess whether hedge fund management is indeed their primary business. We check whether they
are registered with the SEC. Before the Dodd-Frank Act, registering with the SEC was not required
for hedge fund companies unless they simultaneously conducted non-hedge fund businesses such
as mutual fund management. Following Brunnermeier and Nagel (2004), we include those
unregistered with the SEC as pure-play hedge funds in our sample. If the adviser was registered
with the SEC and filed Form ADV, we follow Brunnermeier and Nagel (2004) and Griffin and Xu
(2009) to include it in our sample only if the following two criteria are both satisfied: over 50% of
its investment is listed as “other pooled investment vehicle” (including private investment

11
companies, private equity, and hedge funds) or over 50% of its clients are high-net-worth
individuals, and the adviser charges performance-based fees. Finally, to address the concern that
some hedge fund companies may not report to a database because of the voluntary nature, we
manually check the company website and other online sources for each of the unmatched 13F
institutions to decide whether it is a hedge fund company. Over the sample period 1990–2015, our
sample covers 1,494 hedge fund management companies.
For each stock in our sample, we compute its quarterly hedge fund holdings (HF) as the
number of shares held by all hedge fund companies at the end of the quarter divided by the total
number of shares outstanding. If the stock is not held by any hedge fund company, its HF is set to
zero. We define abnormal hedge fund holdings (AHF) as the current quarter HF minus the average
HF in the past four quarters. Though AHF is correlated with change in hedge fund ownership from
the one quarter to the next, it better captures quarterly variations in arbitrage activity relative to
the trend.
2.2 Short Interest
For the short side, short interest data, as a commonly used proxy for short-selling activity,
are obtained from the Compustat Short Interest file, which reports monthly short interest for stocks
listed on the NYSE, AMEX, and NASDAQ. Because the Compustat Short Interest file only started
coverage on NASDAQ stocks from 2003, we follow the literature to supplement our sample with
short interest data on NASDAQ prior to 2003 obtained from the exchange. The data have been
used in several previous studies to examine the impacts of short interest on stock prices (e.g.,
Asquith, Pathak, and Ritter, 2005; Hanson and Sunderam, 2014).
For each stock in our sample, we compute its quarterly short interest (SR) as the number
of shares sold short at the end of the quarter divided by the total number of shares outstanding. If
the stock is not covered by our short interest files, its SR is set to zero. Similar to AHF, we define
abnormal short interest (ASR) as SR in the current quarter minus the average SR in the past four
quarters.

12
2.3 Stock Anomalies
When examining the relation between arbitrage trading and stock anomalies, we consider
10 well-known return anomalies largely following Fama and French (2008) and Stambaugh, Yu,
and Yuan (2012).
The first anomaly is book-to-market ratio. Rosenberg, Reid, and Lanstein (1985) and Fama
and French (1993) document that stocks with high book-to-market ratio on average have high
future returns, even after adjusting for market risk based on the CAPM (Sharpe, 1964). The second
anomaly is operating profit. Fama and French (2015) show that firms’ operating profits are
positively related to their future stock returns. The third anomaly is gross profitability. Novy-Marx
(2013) shows that firms with higher gross profit have higher future returns. The fourth anomaly is
return momentum of Jegadeesh and Titman (1993). In our setting, at the end of each quarter, we
compute stock returns in the past 12 months by skipping the immediate month prior to the end of
the quarter, divide the stocks into winners and losers, and then hold them in the next quarter. The
fifth anomaly is market capitalization. Banz (1981) and Fama and French (1993) show a negative
relation between firm size and expected stock return even after adjusting for market risk. The sixth
anomaly is asset growth. Cooper, Gulen, and Schill (2008), Fama and French (2015), and Hou,
Xue, and Zhang (2015) show that firms with higher growth rates of asset have lower future returns.
The seventh anomaly is investment growth. Xing (2008) finds a negative relation between firm
investment and expected stock return. The eighth anomaly is net stock issues. Ritter (1991),
Loughran and Ritter (1995), and Fama and French (2008) find that larger net stock issues are
associated with lower future returns. The ninth anomaly is accrual. Sloan (1996) and Fama and
French (2008) find a negative association of accrual with future stock returns. Finally, the tenth
anomaly is net operating assets. Hirshleifer, Hou, Teoh, and Zhang (2004) show that firms with
larger operating assets tend to have lower expected returns.
For each of the anomalies, we construct quintile portfolios at the end of each quarter. We
then compute monthly long-minus-short portfolio return spreads for the next quarter. Details of
the anomaly constructions are provided in the Appendix.
13
2.4 Sample Description and the Net Arbitrage Trading Measure
We start our sample in 1990 as hedge fund holdings and short interest were sparse before
then. 10 For our base sample, we exclude stocks with share price less than $5 and market
capitalization below the 20th percentile size breakpoint of NYSE firms for two reasons. First,
hedge fund companies only need to report stock positions greater than 10,000 shares or $200,000
in market value, and thus their holdings of small and penny stocks may be underestimated. Second,
excluding these stocks alleviates concerns about market microstructure noises. (As shown later,
our inference is robust to alternative sample filters.)
Figure 1 depicts the cross-sectional coverage of hedge fund holdings and short interest over
time. As shown in Figure 1(a), the number of stocks in the sample starts around 1,600 in 1990,
reaches a peak of 2,200 during the tech bubble, and then levels off to 1,400 at the end of the sample
period. The coverage of hedge fund holdings was relatively small at the beginning. In the year of
1990, only 1,000 out of the 1,600 stocks in our sample have positive hedge fund ownership.
However, the hedge fund holdings coverage has increased rapidly, and since 2000, most of the
stocks have both hedge fund ownership and short interest. Figure 1(b) plots the market
capitalization coverage of hedge fund holdings and short interest. Stocks with positive hedge fund
ownership account for more than 90% of the Center for Research in Security Prices (CRSP)
universe we cover in terms of market capitalization.
Panel A of Table 1 summarizes the cross-sectional distributions of our main variables. We
find HF to have a slightly higher mean than SR (4.66% vs. 3.80%). AHF and ASR have similar
distributions. Compared with HF and SR, AHF and ASR are less persistent. We measure net
arbitrage trading (NAT) as the difference between AHF and ASR.11 Across the stocks, NAT has a
mean value close to zero and a first-order autocorrelation of 0.53 at a quarterly frequency.
10 Prior to 1990, the aggregate hedge fund holdings and short interest, as fractions of the total market capitalization of
the CRSP universe, were both less than 1% on average. 11 As with other proxies for arbitrage activity, our measure of net arbitrage trading may contain measurement
errors. First, long positions of hedge funds that do not meet the 13F filing requirement are omitted in the sample,
which understates the long side. Nonetheless, because such funds tend to be small, the underestimation should not be
14
Panel B of Table 1 reports cross-sectional correlations among the variables. The correlation
between HF and SR across stocks is 22.39%, far from –1. As expected, NAT is positively
correlated with AHF while negatively correlated with ASR. These correlations indicate that net
arbitrage trading is quite different from arbitrage activity on either the long or the short side alone,
as well as the simple summation of both sides. Thus, it is important to examine net arbitrage trading
based on both long and short sides.
Figure 2 plots value-weighted averages of hedge fund holdings minus short interest (HFSR,
in solid line) and the net arbitrage trading (NAT, in dotted line) over time. NAT captures trade
imbalance of arbitrageurs. An aggregate NAT of 1% (–1%) means that arbitrageurs, as a group,
have purchased (sold) an additional 1% of the market during the recent quarter relative to the
average of the previous four quarters. Aggregate NAT fluctuates between –1% and 1% for most
of the time. One particularly low value of NAT occurred in late 2008 when arbitrageurs fled the
market due to capital constraints.
2.5 Return Predictability of Net Arbitrage Trading
In this subsection, we test Hypothesis 1 about whether arbitrage trading is informative
about future stock returns by examining the return predictive power of NAT in the cross section.
We first use a portfolio sorting approach. Given our quarterly data, we form portfolios of stocks at
the end of each quarter and track their returns in subsequent quarters. Specifically, at the end of
each quarter, we sort stocks by their values of NAT and assign them into quintile portfolios. Then,
for each portfolio, we track its excess return (relative to the risk-free rate) computed by equally
averaging excess returns of all stocks in the portfolio. We also adjust for factor exposures with
three asset pricing models, namely the Fama and French (1993) three-factor model including the
severe. Second, the short interest data cover not only short sales by hedge funds but those by other short sellers like
individual investors and institutional investors. However, hedge funds constitute the main body of short sellers, while
other investors represent only a small fraction of short interest. In addition, hedge funds may hold non-U.S. stocks
(e.g., emerging market stocks) that can be hard to short sell. As a result, hedge funds on average show a long bias,
rather than perfectly balancing out long and short positions. Nonetheless, since our study focuses on the cross section
of U.S. stocks, our inference will not be systematically biased by the above-mentioned imperfections in measuring
arbitrage activity.

15
market factor, a size factor and a value factor; the three-factor model augmented with the Carhart
(1997) momentum factor; and the Fama and French (2015) five-factor model that expands the
three factors with a profitability factor and an asset growth factor.
Panel A of Table 2 reports the return predictability of NAT. On average, stocks recently
bought by arbitrageurs as a group (NAT-quintile 5) have a monthly excess return of 1.23% (t-value
= 3.67), whereas stocks recently sold by arbitrageurs (NAT-quintile 1) have a monthly excess
return of 0.49% (t-value = 1.41). The high-minus-low NAT portfolio (NAT-HML) has a monthly
return of 0.73% (t-value = 8.56). After risk adjustment, the portfolio of high NAT stocks has
monthly alphas of 0.40%, 0.47%, and 0.39% from the three asset pricing models, respectively,
whereas the portfolio of low NAT stocks has monthly alphas of –0.35%, –0.21%, and –0.28%,
respectively. Accordingly, the monthly alphas of the high-minus-low NAT portfolio are 0.75% (t-
value = 8.80), 0.68% (t-value = 8.11), and 0.67% (t-value = 7.74), respectively.
In Panel B of Table 2, we further track the quintile portfolios in the subsequent four
quarters.12 The result in the bottom row shows that excess returns associated with NAT decrease
over time. Excess return of the high-minus-low NAT portfolio is the largest at 0.73% per month
(t-value = 8.56) in the quarter immediately after portfolio formation, then drops to 0.40% (t-value
= 4.43) in the second quarter, further drops to 0.17% (t-value = 1.90) in the third quarter, and
finally drops to almost zero in the fourth quarter. The decay in alpha corroborates the pattern
documented by Di Mascio, Lines, and Naik (2017) using transaction-level data of institutional
investors. As shown in Figure 3, when we extend the horizon up to two years, there is no significant
return spread beyond the third quarter. Importantly, the absence of return reversal in the long run
suggests that the abnormal return is not driven by temporary price pressure caused by arbitrage
12 From a practical perspective, it is useful to examine the subsequent quarters since hedge fund holdings are often
reported with a temporal delay averaged about 45 days. In some rare cases, the delay can be as long as a year or more.
Such confidential holdings are usually omitted in the Thomson Reuters 13F holdings data. Agarwal, Jiang, Tang, and
Yang (2013) show that confidential holdings contain substantial information that predicts stock returns. Hence, our
results about the return predictability of arbitrage trading inferred from the 13F data (along with short interest) can be
somewhat conservative.

16
trading.13 For comparison, we also report the high-minus-low quintile portfolio excess returns on
portfolios sorted on either AHF or ASR. Sorting on either AHF or ASR generates much smaller
return spreads than sorting on NAT. Hence, combing the two sides of arbitrage trading provides
insights that otherwise cannot be obtained from either side alone.
In Panel C of Table 2, we address the question of whether NAT simply combines the return
predictive power of AHF and ASR. To gauge the combined return predictive power, we perform
a two-way independent sort on AHF and ASR. At the end of each quarter, we form tercile
portfolios based on AHF and independently form tercile portfolios based on ASR. Then, nine
AHF-ASR portfolios are taken from the intersections of these two sets of tercile portfolios. We
first notice that the average next quarter excess return of stocks with both high AHF and high ASR
are similar to that of stocks with both low AHF and low ASR (0.90% vs. 0.86%), confirming that
the difference between AHF and ASR is what really matters. Second, the monthly excess returns
are 1.22% for stocks with high AHF and low ASR, and 0.44% for stocks with high ASR and low
AHF. The corresponding spread of 0.78% measures the combined return predictive power of AHF
and ASR, and the spread remains significant at 0.65% after the five-factor risk adjustment.
The comparable measure of NAT’s return predictability is the high-minus-low portfolio
average excess return from sorting the same stocks into 9 portfolios using NAT. The corresponding
monthly return is 0.85% and remains 0.81% after the five-factor risk adjustment, which is higher
than its counterpart from the double sort above. (For brevity, the detailed results of the 9-portfolio
sorting are not tabulated in the paper but reported in the Internet Appendix.) Comparing the single
sort results to those from the double sort, we conclude that NAT is a better measure of arbitrage
trading while both AHF and ASR are incomplete proxies.
Finally, we perform Fama-MacBeth (1973) cross-sectional regressions to further examine
the predictability of NAT, while controlling for other return predictors identified in the literature.
13 In fact, for both high- and low-NAT portfolios, their NAT mean-reverts to zero after two quarters. If the return
spread in the first two quarters reflects price pressure from abnormal trading, we would expect a return reversal beyond
the second quarter when abnormal trading disappears.
17
For each quarter, we run a cross-sectional regression of average monthly excess returns over the
next quarter on the end-of-quarter NAT along with control variables. The control variables include
book-to-market ratio, gross profitability, operating profit, return momentum, market capitalization,
asset growth, investment growth, net stock issues, accrual, and net operating assets. All the
explanatory variables are winsorized at the 1% and 99% levels, and standardized at the end of each
quarter. Then, we average the coefficient estimates over the quarters and compute their t-values
based on Newey and West (1987) standard errors with four lags.
Panel D of Table 2 reports results of the Fama-MacBeth regressions. We find the regression
coefficients on AHF, ASR, and NAT to be all significant with expected signs, even after
controlling for other return predictors. The coefficient on AHF is 0.11% (t-value = 4.24), while
the coefficient on ASR is -0.13% (t-value = –4.45). The coefficient on NAT is 0.18% (t-value =
6.65). Combining information in AHF and ASR leads to substantially enhanced forecasting power
for stock returns. The results also suggest that the information possessed by arbitrageurs, revealed
by their trades, goes beyond a simple linear combination of well-known stock anomalies.
To summarize, both the portfolio sorts and Fama-MacBeth regressions provide evidence
that NAT has predictive power for stock returns. Such predictive power does not reverse and goes
beyond a simple combination of predictive power from both the long and the short side. These
results lend strong support to Hypothesis 1 that arbitrageurs are informed about mispricing. The
Internet Appendix collects additional robustness results. For example, we show the robustness by
including smaller stocks, excluding stocks with zero HF or SR, using different scaling factor in
HF and SR, and examining subsample periods. Interestingly, replacing hedge fund holdings with
institutional ownership takes away the return predictability. This suggests that hedge funds,
presumably the group of most sophisticated investors, are different from other types of institutional
investors, consistent with the finding of Cao, Chen, Goetzmann, and Liang (2017).

18
3. Net Arbitrage Trading, Stock Anomalies, and Limits-to-Arbitrage
In this section, we investigate how arbitrage trading interacts with stock anomalies
identified in the existing literature. First, we examine the relation between arbitrage trading and
anomaly returns. Then, we investigate potential channels underlying the correction of mispricing.
Finally, we examine the causal effect of limits-to-arbitrage on the relation between arbitrage
trading and anomaly returns.
3.1 NAT and Anomaly Returns
We use the measure of net arbitrage trading to shed light on how arbitrage activity affects
anomaly returns. As described in Section 2.3, we examine a set of 10 anomalies, including book-
to-market ratio, gross profitability, operating profit, momentum, market capitalization, asset
growth, investment-to-capital ratio, net stock issues, accrual, and net operating assets. In addition
to examining anomalies individually, we adopt a comprehensive mispricing measure (MISP)
constructed by Stambaugh, Yu, and Yuan (2015).14 Specifically, for each of the anomalies they
examine, stocks are ranked based on that anomaly with the higher rank associated with lower
average abnormal return. Then, a stock’s MISP, ranging between 0 and 100, is the average of its
percentile rankings across all the anomalies. Consequently, stocks with high (low) values of MISP
tend to be overpriced (underpriced).
Panel A of Table 3 verifies that the long-minus-short spreads in future returns averaged
across the anomalies are both economically and statistically significant. The average return spreads
are 0.29% (t-value = 4.44), 0.26% (t-value = 4.17), 0.22% (t-value = 3.58), and 0.20% (t-value =
3.47) per month during the first, second, third, and fourth quarters, respectively. The magnitude
appears somewhat smaller compared with previous studies, since we use quintile sorts instead of
the more common decile sorts and we exclude small stocks that are often associated with
anomalous returns. The sample period (1990–2015) is likely to play a role as well, with several
anomalies having small returns during the recent period. Not surprisingly, when we adjust for
14 We thank Jianfeng Yu for sharing the data of the mispricing measure.
19
loadings on the Fama-French five factors that are constructed on some of the anomalies, the
resulting alpha spreads are smaller than the return spreads, but still statistically significant.
Next, among stocks in the long- and short-anomaly portfolios, we identify those traded by
arbitrageurs. We classify an anomaly stock to be traded by arbitrageurs if it is in the long portfolio
and recently bought by arbitrageurs (its NAT belongs to the top 30%), or it is in the short portfolio
and recently sold short (its NAT belongs to the bottom 30%).15 Strikingly, anomaly returns appear
to be completely driven by stocks traded by arbitrageurs. As shown in Panel B of Table 3, this
subset of anomaly stocks features return spreads (between the long and the short leg) of 0.88% (t-
value = 7.95), 0.60% (t-value = 5.46), 0.41% (t-value = 4.04), and 0.32% (t-value = 3.25) per
month during the first, second, third, and fourth quarters, respectively. The corresponding five-
factor alphas are 0.71% (t-value = 7.31), 0.45% (t-value = 4.45), 0.33% (t-value = 3.21), and 0.26%
(t-value = 2.50), respectively. Alpha declines over time during the first year.16 When examining
alphas on the long and the short leg separately, we find that alphas come mostly from the short
leg, consistent with Stambaugh, Yu, and Yuan (2012).
In sharp contrast, the middle 40% of anomaly stocks that are not traded by arbitrageurs
earn much smaller return spreads in the next four quarters. As shown in Panel C of Table 3, none
of the return spreads is statistically significant after the five-factor risk adjustment. This is the case
for both the long and the short leg. The fact that abnormal returns appear only among anomaly
stocks experiencing strong arbitrage trading and decline quickly during the first year supports the
view that arbitrageurs are informative about stock mispricing. In addition, our results are not driven
by one or two particular anomalies; instead, the pattern is consistent across all the anomalies. In
addition, anomaly stocks traded by arbitrageurs have similar anomaly characteristics to those not
15 These stocks account for about 30% of both the long- and the short-portfolios. Alternatively, we consider a less
restrictive classification. Specifically, we classify an anomaly stock to be traded by arbitrageurs if it is in the long
portfolio with a positive NAT, or it is in the short portfolio with a negative NAT. Our inference remains unchanged
using such a classification. 16 This result is also consistent with Akbas, Armstrong, Sorescu, and Subrahmanyam (2015) who find that aggregate
money flows to the hedge fund industry attenuate stock return anomalies.

20
traded by arbitrageurs (see the Internet Appendix for details), suggesting that arbitrageurs trade
with information beyond anomaly characteristics.
The last three columns of Table 3 present results from examining the MISP measure of
Stambaugh, Yu, and Yuan (2015). While mispriced stocks do earn abnormal returns in the next
year, especially from the short side (Panel A), the abnormal returns come mostly from the subset
of mispriced stocks that are traded by arbitrageurs according to our NAT measure (Panel B). In
contrast, mispriced stocks that are not traded by arbitrageurs earn much smaller abnormal returns
in the future (Panel C).
Taken together, the evidence in this subsection provides strong support for Hypothesis 2
that not all anomaly stocks are the same and that arbitrageurs use information other than common
stock characteristics to detect mispricing. This finding applies consistently to all individual
anomaly measures as well as a comprehensive anomaly measure. Our approach based on double
sorts of the anomaly measure and NAT accounts for potential nonlinear relation between anomaly
measures and future returns.
Meanwhile, it is important to note that anomaly stocks traded by arbitrageurs continue to
earn abnormal returns in each of the four quarters after portfolio formation. We confirm in the
Internet Appendix that these abnormal returns cease to be significant after five quarters and do not
reverse in the long run. Thus, such long-lasting abnormal returns support Hypothesis 3 that
arbitrage trading does not correct mispricing immediately and completely in the presence of limits-
to-arbitrage. We examine the channels contributing to the mispricing correction and the role of
limits-to-arbitrage in the next two subsections, respectively.
3.2 Channels of Mispricing Correction
In the presence of limits-to-arbitrage, the process of mispricing correction is not
instantaneous but takes time. In this subsection, we document two channels of mispricing
correction: one is the release of fundamental information, and the other is related to copycat
trading.

21
First, mispricing can be corrected during important information events when fundamental
information about the firm is released to the market. One such information event is the quarterly
earnings announcement. In Panel A of Table 4, we examine the average stock return around
earnings announcements (over a three-day window) across anomaly stocks traded by arbitrageurs
and those not traded. The anomaly stocks purchased by arbitrageurs outperform those sold by
arbitrageurs by 0.16% per day (t-value = 5.12) during the earnings announcement window in the
next quarter t+1, translating to about 3.36% per month (0.16% × 21 days). This return spread is
more than three times larger than the average traded anomaly stock return spread of 0.88% per
month over the same quarter (as reported in Panel B of Table 3), suggesting that the return spread
disproportionately accrues during the earnings announcement window. The return spread remains
at 0.10% per day (t-value = 3.22) over the three-day window in quarter t+2. Therefore, the evidence
supports the information channel. Recently, Engelberg, McLean, and Pontiff (2017) also find
much higher anomaly returns realized on earnings announcement days compared with other times.
By examining arbitrage trading directly, we show that these abnormal returns are mainly
associated with anomaly stocks traded by arbitrageurs.
Second, copycat trading by other investors could also contribute to the correction of
mispricing. Panel B of Table 4 reports, for portfolios of anomaly stocks traded or not traded by
arbitrageurs, the average change in institutional ownership (excluding hedge fund ownership) in
subsequent quarters. We find that non-hedge-fund institutional investors increase their holdings
during quarters t+1 through t+4 of anomaly stocks purchased by arbitrageurs in quarter t. They
also decrease their holdings of anomaly stocks sold by arbitrageurs. The differences between the
holding changes are highly significant in the next four quarters. Hedge fund holdings are often
reported with a temporal delay averaged about 45 days. In some rare cases, the delay can be as
long as a year or more. It is therefore not surprising that other investors copy hedge fund trades
with a delay. To obtain a complete picture, we also look at the average change in non-hedge fund
institutional holdings in the current quarter t. Interestingly, non-hedge funds appear to trade in the
opposite direction to arbitrage activity, in that anomaly stocks bought (sold) by arbitrageurs

22
actually experience selling (buying) from non-hedge funds as a whole. This result highlights the
importance to separate hedge funds from other types of institutional investors. Moreover, given
the absence of return reversal associated with NAT, the opposite trading pattern of hedge funds
and non-hedge funds in the current quarter cannot be attributed to potential “fire sales” in which
hedge funds trade with non-hedge funds rushing to liquidate assets.
When examining the trading behavior of other types of institutional investors on anomaly
stocks not traded by arbitrageurs, we observe quite a different pattern. In quarter t, while
arbitrageurs do not trade these stocks, other institutional investors do. As a group, they increase
their holdings of anomaly stocks on the long side and decrease their holdings of anomaly stocks
on the short side, even though these trades do no add value as evident in Panel C of Table 3. In the
next four quarters, they increase their holdings on anomaly stocks on both sides, more so for those
on the short side.
3.3 Causal Evidence from Regulation SHO
Our Hypothesis 4 predicts that, faced with limits-to-arbitrage, arbitrageurs will choose to
trade against mispricing only if the potential profit from exploiting the mispricing overweighs the
arbitrage costs. Thus, all else being equal, the predictive power of NAT for future stock returns
should be stronger among stocks that impose greater limits-to-arbitrage.
To test this hypothesis, we need to distinguish between limits-to-arbitrage and ex-ante
mispricing. We exploit Regulation SHO as an instrument for limits-to-arbitrage. As noted above,
Regulation SHO relaxed short-sale restrictions for a random set of pilot stocks, which reduced
limits-to-arbitrage while having little effect on ex ante mispricing. This feature helps isolate the
impact of limits-to-arbitrage on arbitrage activity. After we apply the procedures of Diether, Lee,
and Werner (2009) and Chu, Hirshleifer, and Ma (2017) and merge with the stock anomalies data,
our sample contains 650 pilot stocks and 1,425 non-pilot stocks. We define the pilot period as June
2005–July 2007, and thus the rest of our sample period includes a pre-pilot period (January 1990–
May 2005) and a post-pilot period (August 2007–December 2015). Motivated by Boehmer, Jones,
and Zhang (2013), we skip the third and fourth quarters of 2008 in the post-pilot period to mitigate
23
the impact of the financial crisis and the short-selling ban (and we will take a particular look at the
crisis period in the next subsection).
We first verify the validity of Regulation SHO as an instrument of limits-to-arbitrage.
Previous studies (e.g., Diether, Lee, and Werner, 2009; Grullon, Michenaud, and Weston, 2016)
show that pilot stocks experienced higher short-selling activity than non-pilot stocks caused by
Regulation SHO. Consistent with their results, we find that at the beginning of the pilot period, the
average short interest is 4.80% for pilot stocks and 4.57% for non-pilot stocks, and the difference
is 0.23% (t-value = 2.00). Moreover, there are no pre-trends of pilot stocks and non-pilot stocks
prior to Regulation SHO (see the Internet Appendix for details). As shown in Panel A of Table 5,
pilot stocks and non-pilot stocks also do not exhibit significant difference in any of the 10 anomaly
characteristics, suggesting that these stocks are otherwise indistinguishable. Taken together, these
results support Regulation SHO as a valid instrument of limits-to-arbitrage.
Panel B of Table 5 reports the main results using portfolio sorts. We first examine the
difference between pilot stocks (with smaller limits-to-arbitrage) and non-pilot stocks (with greater
limits-to-arbitrage) during the pilot period. Consistent with Hypothesis 4, the results suggest that
the anomaly stocks traded by arbitrageurs indeed realize higher abnormal returns in the presence
of greater limits-to-arbitrage. Among non-pilot stocks, the anomaly stocks purchased by
arbitrageurs outperform those sold by arbitrageurs by 0.96% per month (t-value = 3.20) on a risk-
adjusted basis during the pilot period. This alpha spread is larger than the counterpart, 0.53% per
month (t-value = 0.92), associated with pilot stocks. More importantly, this return difference comes
entirely from the short side of stock anomalies where the difference in limits-to-arbitrage exists.17
Therefore, overpriced non-pilot stocks sold short by arbitrageurs exhibit larger underperformance
(i.e., reduction of stock price) than similar overpriced pilot stocks during the pilot period. In
17 Hwang, Liu, and Xu (2017) find that when stocks are added to the short-sale list (i.e., become shortable) in Hong
Kong, their industry-peer, underpriced stocks experience increased hedge fund purchases, which suggests that
shortability of some stocks could offer a hedging benefit and thus affect arbitrageurs’ long position in underpriced
stocks in the same industry. In our setting, anomaly stocks are not restricted to industry peers.

24
contrast, since the arbitrage costs are low (e.g., relaxed short-sale constraints) for the pilot stocks,
mispricing of even a small magnitude (small price deviation from fundamental values) will be
exploited and corrected by arbitrageurs, and thus the average abnormal return associated with
arbitrage trading is relatively small for the pilot stocks.
As placebo tests, we compare pilot-stocks with non-pilot stocks during both the pre-pilot
period and the post-pilot period when there is no regulatory difference in short-sale constraints. As
expected, there is no significant return gap between pilot stocks and non-pilot stocks outside the
pilot period.
Finally, we perform a panel regression analysis for the entire sample period, to formally
test the difference between pilot and non-pilot stocks during the pilot period. Similar to Chu,
Hirshleifer, and Ma (2017), we regress future stock returns on the dummy variables of the non-
pilot stocks and the pilot period. The Non-pilot dummy equals one if a stock is a non-pilot stock
and zero otherwise. The Pilot-period dummy equals one if the time falls within the pilot period
and zero otherwise. We regress the returns of the traded group (or, the not-traded group) on the
Non-pilot dummy and the interaction term between the Non-pilot dummy and the Pilot-period
dummy, with control of the time fixed effect. The panel regression is specified as follows.
𝑟𝑖,𝑡+1 = 𝑎𝑡 + 𝑎1 × 𝑁𝑜𝑛-𝑝𝑖𝑙𝑜𝑡𝑖 × 𝑃𝑖𝑙𝑜𝑡-𝑝𝑒𝑟𝑖𝑜𝑑𝑡 + 𝑎2 × 𝑁𝑜𝑛-𝑝𝑖𝑙𝑜𝑡𝑖 + 𝜀𝑖,𝑡, (1)
where 𝑟𝑖,𝑡+1 is the portfolio-level average monthly excess return in the next month for the long leg,
the short leg, or the long-minus-short of the traded and not-traded groups, and 𝑎𝑡 is the time fixed
effect. Hypothesis 4 predicts that high level of arbitrage trading on anomaly stocks subject to
greater limits-to-arbitrage should lead to more investment profit. Given greater difficulty of short
selling for non-pilot stocks than for pilot stocks during the pilot period, non-pilot stocks in the

25
short leg should exhibit more negative returns. Thus, we expect a negative regression coefficient,
𝑎1, on the interaction term for the short leg among traded stocks.
As shown in Panel C of Table 5, for the short leg among traded stocks, the estimated
coefficient on the interaction term is -0.32% (t-value = -1.92). This suggests that, compared with
pilot stocks in the short leg, non-pilot stocks that are also in the short leg and experience high
arbitrage trading during the pilot period tend to have more negative returns. Such a relation does
not exist among stocks that are not traded by arbitrageurs. These findings echo the results of the
portfolio sorting tests.
In summary, exploiting the exogenous Regulation SHO that altered limits-to-arbitrage on
a random group of stocks, we provide causal evidence that limits-to-arbitrage affect arbitrage
activity which in turn affects anomaly returns. Consistent with Hypothesis 4, we present novel
evidence that, when arbitrageurs faced with greater limits-to-arbitrage still choose to trade some
anomaly stocks, those stocks tend to realize larger abnormal returns.
3.4 Arbitrage Trading during the Financial Crisis of 2007–2009
In this subsection, we examine the trading behavior of arbitrageurs on anomaly stocks
during the financial crisis of 2007–2009, which has had far-reaching impacts on financial markets
and beyond. Ben-David, Franzoni, and Moussawi (2012) document that hedge funds significantly
divested their stock positions in the crisis. Nagel (2012) presents evidence of reduced liquidity
provision during the 2007–2009 period. We attempt to further understand how arbitrageurs
allocate their capital and how arbitrage activity affects the anomaly returns during the crisis. In
particular, Hypothesis 4 predicts that anomalies arbitrageurs choose to trade despite capital
constraints should do better in the near future.

26
To infer arbitrage capital allocated to the anomalies over time, we adopt the method of
Hanson and Sunderam (2014) to run the following cross-sectional regression for each stock
anomaly in each quarter.
𝑁𝐴𝑇𝑖,𝑡 = 𝑐0,𝑡 + 𝒄𝒕′ × 𝑰(𝐶ℎ𝑎𝑟𝑎𝑐𝑡𝑒𝑟𝑖𝑠𝑡𝑖𝑐 𝑄𝑢𝑖𝑛𝑡𝑖𝑙𝑒)𝑖,𝑡 + 𝑒𝑖,𝑡, (2)
where 𝑁𝐴𝑇𝑖,𝑡 is the net arbitrage trading on stock i in quarter t. 𝑰(𝐶ℎ𝑎𝑟𝑎𝑐𝑡𝑒𝑟𝑖𝑠𝑡𝑖𝑐 𝑄𝑢𝑖𝑛𝑡𝑖𝑙𝑒)𝑖,𝑡 is
the vector of quintile dummies for a specific anomaly characteristic (e.g., book-to-market), and the
omitted dummy is Quintile 1 corresponding to the short leg. Thus, each coefficient in the vector
𝒄𝒕 captures the difference in NAT between stocks in that particular quintile and those in Quintile
1 (i.e., the short leg). We focus on the coefficient on Quintile 5, 𝑐5,𝑡, since it measures the NAT
difference between the long and the short leg. We obtain a time-series of 𝑐5,𝑡 by running the cross-
sectional regression for each anomaly in each quarter. Because all the independent variables in the
regression are dummy variables, we can compare the regression coefficients across anomalies and
over time.
Next, for each anomaly, we run a time-series regression of 𝑐5,𝑡 on a constant and the Crisis
dummy that equals one for the crisis period 2007:Q3–2009:Q2 and zero otherwise.
𝑐5,𝑡 = 𝑏0 + 𝑏1 × 𝐶𝑟𝑖𝑠𝑖𝑠 𝑡 + 𝜀𝑡. (3)
Here, 𝑏0 captures the average difference in net arbitrage trading between the long and the short
leg, and a positive value means that arbitrage capital on average is allocated to the “right” leg. A
larger value of 𝑏0 implies greater arbitrage trading on that particular anomaly. 𝑏1 is the change of
27
arbitrage capital during the crisis relative to other time. Accordingly, 𝑏0 + 𝑏1 is the arbitrage
capital allocated to each anomaly during the crisis. In contrast to prior studies that focus on either
the long-leg (hedge fund holdings) or the short-leg (short interest), NAT allows us to more
precisely infer arbitrage trading intensity across different anomalies.
Panel A of Table 6 presents the allocation of arbitrage capital over time. 𝑏0 is positive for
all the 10 anomalies and statistically significant for eight of them, suggesting that overall arbitrage
capital has been allocated to the right leg. In particular, arbitrageurs seem to trade momentum,
value, and asset growth anomaly more heavily.
Moreover, 𝑏1 appears negative for seven anomalies and 𝑏0 + 𝑏1 is statistically
insignificant for seven of the 10 anomalies, suggesting significant withdrawal of arbitrage capital
in the financial crisis. This finding is consistent with the results of Ben-David, Franzoni, and
Moussawi (2012) and Nagel (2012). Interestingly, arbitrageurs did not cease trading all anomalies;
asset growth, investment, and net share issuance are the three anomalies that arbitrageurs continued
to trade during the crisis.
Finally, in Panel B of Table 6, we explore the relation between arbitrage trading and
anomaly returns during the crisis. Based on 𝑐5,𝑡 across the anomalies at the end of each quarter t,
we split the 10 anomalies into three groups: the three anomalies with the highest 𝑐5,𝑡, the three
anomalies with the lowest 𝑐5,𝑡 and the remaining four anomalies. We then form three portfolios
(“Long”, “Short”, and “Middle”, respectively) by following excess returns of each of the three
groups over the next three months. Over the entire sample period 1990–2015, the Long portfolio
(i.e., anomalies receiving relatively large arbitrage capital) significantly outperforms the Short
portfolios (i.e., anomalies receiving relatively small arbitrage capital). More importantly, such
outperformance is much larger in magnitude over the crisis period than in other times. During

28
2007:Q3–2009:Q2, the Long portfolio outperformed the Short portfolio by 1.43% per month (t-
value = 2.12) on a risk-adjusted basis. This provides further support to our Hypothesis 4, in the
sense that during the crisis when arbitrageurs were facing severe capital constraints, those positions
to which arbitrageurs chose to allocate their scarce capital indeed realized high future abnormal
returns.
4. Evidence from Daily Data
In this section, we repeat our main analysis using daily data. We estimate NAT at a daily
frequency by combining daily security lending data with daily trading record of a subset of hedge
funds. The use of daily data can potentially deliver powerful tests even for a relatively short sample
period.
Using daily-level of security lending to proxy for short interest at a daily frequency, we
compute daily abnormal short interest (ASR) in a way similar to the construction of ASR using
the quarterly data. In the meantime, while we do not observe the daily holdings of hedge funds,
we show how to compute daily abnormal hedge fund holdings (AHF) based on daily hedge fund
trading data. We next describe the data sources and how we compute daily AHF, ASR, and NAT
in detail.
4.1 Estimating Daily NAT
Our daily equity lending data come from Data Explorers. Since the main reason for
borrowing equity is short selling, the level of equity on loan is a good proxy of short selling activity.
Equity lending data have been used to study short selling in several existing studies, such as Geczy,
Musto, and Reed (2002) and Saffi and Sigurdsson (2011).
Our data on daily institutional trading activity come from ANcerno, Ltd. (also called Abel
Noser Solutions), a widely recognized transaction cost consulting firm to institutional investors.
We obtain the data of all trades made by their clients. To focus on hedge funds among all the
29
clients, we compile a list of 125 hedge fund companies by manually matching the names of
ANcerno’s clients with our list of hedge fund companies (described in Section 2.1).18 The equity
lending data overlap with the intuitional trading data spanning June 2006 to March 2011, which
constitutes the sample period for our analysis with the daily data.
For the short side, the daily abnormal short interest (ASR) is computed as the deviation of
short interest from its average in the past 30 days (scaled by the total number of shares
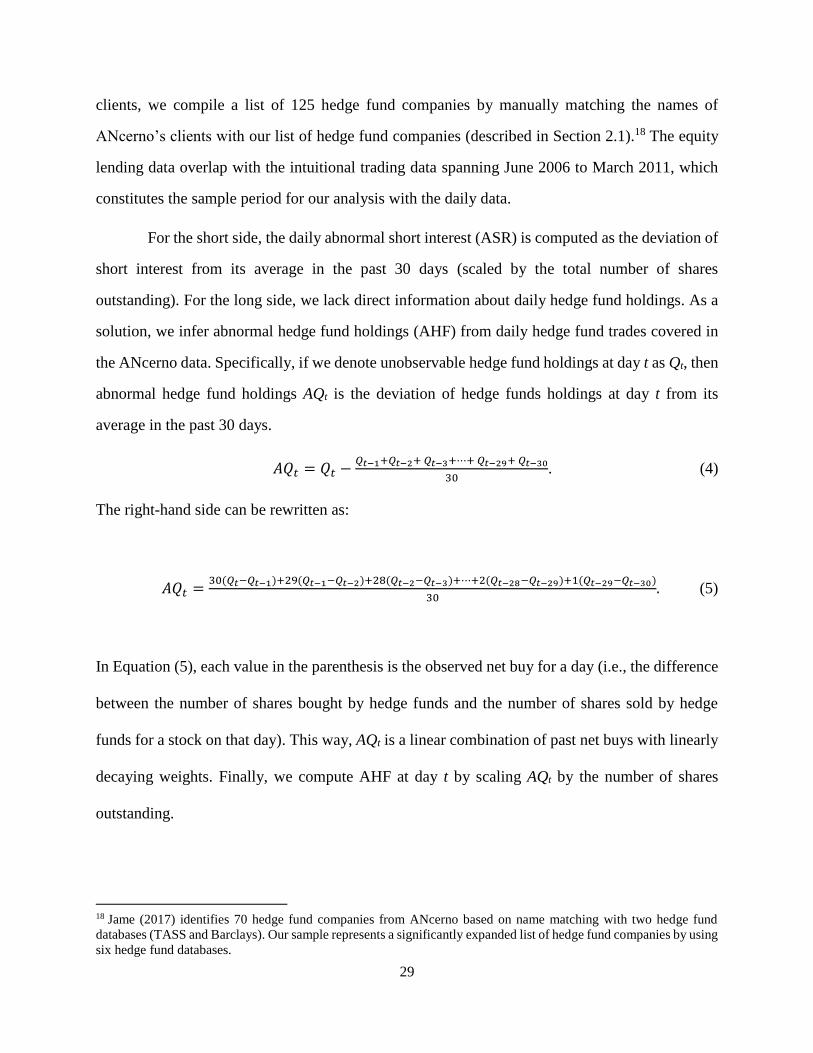
outstanding). For the long side, we lack direct information about daily hedge fund holdings. As a
solution, we infer abnormal hedge fund holdings (AHF) from daily hedge fund trades covered in
the ANcerno data. Specifically, if we denote unobservable hedge fund holdings at day t as Qt, then
abnormal hedge fund holdings AQt is the deviation of hedge funds holdings at day t from its
average in the past 30 days.
𝐴𝑄𝑡 = 𝑄𝑡 −𝑄𝑡−1+𝑄𝑡−2+ 𝑄𝑡−3+⋯+ 𝑄𝑡−29+ 𝑄𝑡−30
30. (4)
The right-hand side can be rewritten as:
𝐴𝑄𝑡 =30(𝑄𝑡−𝑄𝑡−1)+29(𝑄𝑡−1−𝑄𝑡−2)+28(𝑄𝑡−2−𝑄𝑡−3)+⋯+2(𝑄𝑡−28−𝑄𝑡−29)+1(𝑄𝑡−29−𝑄𝑡−30)
30. (5)
In Equation (5), each value in the parenthesis is the observed net buy for a day (i.e., the difference
between the number of shares bought by hedge funds and the number of shares sold by hedge
funds for a stock on that day). This way, AQt is a linear combination of past net buys with linearly
decaying weights. Finally, we compute AHF at day t by scaling AQt by the number of shares
outstanding.
18 Jame (2017) identifies 70 hedge fund companies from ANcerno based on name matching with two hedge fund
databases (TASS and Barclays). Our sample represents a significantly expanded list of hedge fund companies by using
six hedge fund databases.
30
Since the ANcerno daily data only covers a small subset of hedge funds, the levels of AHF
and ASR are not directly comparable and thus we cannot compute NAT as the simple difference
between the two values. Instead, we compute the cross-sectional percentile rankings of AHF and
ASR at each day and take the difference between the AHF ranking and the ASR ranking as our
daily measure of NAT.
4.2 Return Predictability of Daily NAT
We now examine the return predictability of daily net arbitrage trading. At day t, we form
quintile portfolios based on NAT and follow the equal-weighted portfolio excess returns in the
next s days. Quintile 5 has the highest value of NAT. We examine s equal to 5, 10, and 20 trading
days. This trading strategy is similar to the momentum strategy of Jegadeesh and Titman (1993),
since there are s effective trading signals at a particular day. For instance, if the holding period is
10 days, then the daily return for any particular day is the average of the daily returns on 10
different portfolios formed in each of the past 10 days. The alphas are computed with the Fama-
French five factors (the inference is unchanged when the other asset pricing models are used for
risk adjustment). Stocks with price less than $5 at the time of portfolio formation are excluded.
Our daily sample covers an average of 2,418 stocks per day.
Table 7 presents the results. When the holding period is 10 trading days (about 2 weeks),
the long leg, i.e., the quintile having the highest value of NAT, has an average daily excess return
of 0.052% (5.2 bps). The corresponding five-factor alpha is 0.015% per day (t-value = 3.46). In
contrast, quintile 1 has an average daily excess return of 0.022% and an alpha of -0.017% (t-value
= -3.61). The difference between quintiles 5 and 1 yields a daily return of 0.029% (t-value = 3.61)
and a daily alpha of 0.032% (t-value = 3.99). The pattern is similar when we change the holding
period to 5 and 20 trading days. Thus, the return predictability of NAT at a daily frequency
31
provides further support for Hypothesis 1 that arbitrageurs are informed about future stock returns.
As shown in Figure 4, the cumulative return associated with the high-minus-low NAT-quintile
portfolio is gradually increasing up to 30 days. The gradual correction of mispricing is consistent
with Hypothesis 3 about the presence of limits-to-arbitrage. We also confirm that the cumulative
return does not reverse when we extend the horizon.
4.3 Daily NAT and Stock Mispricing
Using daily data, we revisit the performance of anomaly stocks by separating them into
those that arbitrageurs trade and those that arbitrageurs do not trade. To define traded and not-
traded groups, we first form two portfolios from MISP using the median MISP as the breakpoint,
then in each MISP portfolio, we use the 20th percentile and the 80th percentile NAT breakpoints
to identify low, medium, and high NAT groups.19 The traded group include stocks that have either
low MISP/high NAT (traded long leg, denoted T/L) or high MISP/low NAT (traded short leg,
denoted T/S). The not-traded group has either low MISP/medium NAT (not traded long leg,
denoted NT/L) or high MISP/medium NAT (not traded short leg, denoted NT/S). We follow
average excess returns of these portfolios in the next 5, 10, and 20 trading days.
Table 8 presents the results about anomaly stock returns. When the holding period is 10
days, the traded long leg (T/L) has a daily excess return of 0.051% and a daily alpha of 0.017% (t-
value = 2.51), and the traded short leg has a return of 0.019% and an alpha of -0.021% (t-value =
-2.69). In this traded group, the long-minus-short portfolio has a return of 0.032% (t-value = 1.94)
and an alpha of 0.038% per day (t-value = 2.72). In contrast, among not-traded stocks, the long-
minus-short portfolio has a return of 0.010% (t-value = 0.92) and an alpha of 0.013% per day (t-
19 We use the median value of MISP as the breakpoint in the daily sample to allow for a larger number of stocks in
each portfolio, which reduces noise associated with portfolio returns at a daily frequency.

32
value = 1.37). The abnormal return spread among the traded stocks remains at 0.035% per day (t-
value = 2.59) when the holding period is 20 trading days.
Therefore, these results provide further evidence supporting Hypothesis 2 that arbitrageurs
can detect mispricing even among stocks of similar anomaly characteristics and Hypothesis 3 that
limits-to-arbitrage prevent mispricing from being corrected quickly and completely.
4.4 Evidence from Regulation SHO
We test Hypothesis 4 using daily data in this subsection. As in Section 3, we exploit the
exogenous shock from Regulation SHO that alleviated limits-to-arbitrage for a random set of pilot
stocks. Similar to the analysis described in Section 3.3, we employ the daily data to study the
relation between arbitrage trading, stock mispricing, and limits-to-arbitrage in a panel regression
framework.
Specifically, we regress future stock returns on the dummy variables of the non-pilot stocks
and the pilot period for the daily sample. The Non-pilot dummy equals one for non-pilot stocks
and zero otherwise. The Pilot-period dummy equals one if the time falls within the pilot period
June 2006–July 2007 and zero otherwise.20 The post-pilot period spans August 2007 to March
2011 (the end of the daily sample), and we skip the last two quarters of 2008. We regress the
returns of the traded group (or, the not-traded group) on the Non-pilot dummy and the interaction
term between the Non-pilot dummy and the Pilot-period dummy. The panel regression is specified
as follows.
𝑟𝑖,𝑡+𝑠 = 𝑑𝑡 + 𝑑1 × 𝑁𝑜𝑛-𝑝𝑖𝑙𝑜𝑡𝑖 × 𝑃𝑖𝑙𝑜𝑡-𝑝𝑒𝑟𝑖𝑜𝑑𝑡 + 𝑑2 × 𝑁𝑜𝑛-𝑝𝑖𝑙𝑜𝑡𝑖 + 𝜀𝑖,𝑡, (6)
20 The pilot period for the daily data starts in June 2006, the beginning month of our daily sample.

33
where 𝑟𝑖,𝑡+𝑠 is the portfolio-level average daily excess return in the next s days for the long leg,
the short leg, or the long-minus-short of the traded and not-traded groups, and 𝑏𝑡 is the time fixed
effect. According to our Hypothesis 4, we expect a significantly negative regression coefficient on
the interaction term for the short leg among traded stocks.
Table 9 reports results from the regressions. While we examine both traded stocks and not-
traded stocks, our focus is on traded stocks for which abnormal returns are expected to arise by
Hypothesis 4. For the short leg among traded stocks, the estimated coefficient on the interaction
term between the Non-pilot dummy and the Pilot-period dummy is -0.056% (t-value = -2.35) for
a holding horizon of 10 trading days. Thus, relative to pilot stocks in the short leg, non-pilot stocks
in the short leg and experiencing high arbitrage trading during the pilot period realize more
negative returns. The results are robust to different holding days.
In contrast, there is no difference in stock returns for the long leg between pilot stocks and
non-pilot stocks during the pilot period. The coefficient on the interaction term is -0.001 (t-value
= -0.04) for the long leg. In addition, in the not-traded group, there is also no difference for both
the long leg and the short leg. This is intuitive, since the pilot program should mainly affect the
short leg during the pilot period and have a relatively small impact for the long leg or outside the
pilot period.
In summary, using Regulation SHO as an instrument of limits-to-arbitrage and the daily
measure of net arbitrage trading, we document relatively large negative returns associated with
stocks that are in the short leg (likely overpriced stocks), excluded from the pilot stock list (having
greater limits-to-arbitrage), and yet experience heavy arbitrage trading. This finding is consistent
with Hypothesis 4 that arbitrage trading has stronger predictive power for stock returns when the
mispriced stocks face greater limits-to-arbitrage.

34
5. Conclusion
While modern finance predicts that arbitrageurs play a crucial role in financial markets,
measuring arbitrage activity is challenging. Prior research has relied on aggregate hedge fund
holdings to measure the long side of arbitrage and short interest to measure the short side. In this
paper, we track net arbitrage trading (NAT) with the difference between the long and short sides.
Empirically, NAT provides new insights relative to examining either side of arbitrage alone and
enhances our understanding about the interaction between arbitrage trading, stock mispricing, and
the role of limits-to-arbitrage.
Based on the NAT measure over the period 1990–2015, we find that arbitrageurs are
informed about mispricing. In the cross section, NAT strongly predicts future stock returns for at
least two quarters. Such predictability is not due to temporary price pressure, but consistent with
informational advantage of arbitrageurs and the subsequent copycat trading of other types of
institutional investors such as mutual funds, banks, and insurance companies.
When examining a broad set of stock anomalies, we find that abnormal returns come
exclusively from anomaly stocks traded by arbitrageurs. The persistent anomaly returns suggest
the existence of limits-to-arbitrage. Exploiting Regulation SHO that facilitated short selling for a
random group of stocks, we show causal evidence that limits-to-arbitrage affect arbitrageurs’
ability to correct mispricing. In addition, zooming into the 2007–2009 financial crisis, we find that
stock anomalies exploited by arbitrageurs despite capital constraints were particularly profitable.
Our NAT measure can potentially be applied in other contexts. For example, it would be
interesting to use the return spread associated with arbitrage activity as a pricing factor in the spirit
of the APT. Another potential area is to examine NAT and its impacts in international markets.
We leave these topics for future research.
35
Appendix: Details of the Constructions of Stock Return Anomalies.
This appendix provides details of constructing the 10 stock return anomalies examined in
the paper. Following the convention in the literature (e.g., Fama and French, 2008; Novy-Marx,
2013; Hou, Xue, and Zhang, 2015), the financial and accounting ratios for each stock from July of
year t to June of year t+1 (i.e., third quarter of year t to second quarter of year t+1) are computed
based on information from the previous fiscal year ending in year t-1. At the end of each quarter,
we sort stocks into quintile portfolios based on their financial ratios. Monthly excess returns in the
next three months are calculated as equal-weighted averages of excess returns of individual firms
in each portfolio. The portfolios are rebalanced each quarter at the end of March, June, September,
and December.
1. Book-to-market ratio (BM). Book equity is stockholders’ book equity, plus balance sheet
deferred taxes (Compustat item ITCB) and investment tax credit (TXDB) if available,
minus the book value of preferred stock. We employ tiered definitions largely consistent
with those used in Davis, Fama, and French (2000), Novy-Marx (2013), and Hou, Xue,
and Zhang (2015) to construct stockholders’ equity and book value of preferred stock.
Stockholders equity is as given in Compustat (SEQ) if available, or else common equity
(CEQ) plus the book value of preferred stock, or else total assets minus total liabilities
(AT–LT). Book value of preferred stock is redemption value (PSTKRV) if available, or
else liquidating value (PSTKL) if available, or else par value (PSTK). Book-to-market ratio
in year t-1 is computed as book equity for the fiscal year ending in calendar year t-1 divided
by the market capitalization at the end of December of year t-1. Stocks with missing book
values or negative book-values are deleted.
2. Gross Profit to Asset (GP). Following Novy-Marx (2013), we measure gross profits-to-
assets in year t-1 as gross profit in year t-1 (Compustat item GP) divided by total assets in
year t-1 (AT).
3. Operating Profit (OP). Following Fama and French (2015), we measure operating profit in
year t-1 as year t-1 gross profit (Compustat item GP), minus selling, general, and

36
administrative expenses (XSGA) if available, minus interest expense (XINT) if available,
all divided by year t-1 book equity. Stocks with missing book value or negative book-value
are deleted.
4. Momentum (MOM). Similar to Jegadeesh and Titman (1993), at the end of March, June,
September, and December (month t), we compute each stock’s cumulative return from
month t-13 to t-2, and form quintile portfolios for the next three months. We compute
equal-weighted monthly returns in each portfolio for month t+1 to t+3, and the portfolio
is rebalanced at the end of month t+3.
5. Market Capitalization (MC). Following Fama and French (2008), MC is defined as the
market capitalization (in million dollars) at the end of June in each year. It is the product
of the number of shares outstanding and share price from the CRSP. This MC is used for
the following four quarters.
6. Asset Growth (AG). Following Cooper, Gulen, and Schill (2008), we compute asset growth
in year t-1 as total assets (AT) for the fiscal year ending in calendar year t-1 divided by
total assets for the fiscal year ending in calendar year t-2, minus one.
7. Investment growth (IK). Following Xing (2008), we measure investment growth for year
t-1 as the growth rate in capital expenditure (CAPX) from the fiscal year ending in calendar
year t-2 to the fiscal year ending in t-1.
8. Net stock issues (NS). Following Fama and French (2008), we compute net stock issues in
year t-1, as the split-adjusted shares outstanding for fiscal year ending in calendar year t-1
divided by the split-adjusted shares outstanding for fiscal year ending in calendar year t-2,
minus one. The split-adjusted shares outstanding are calculated as shares outstanding
(CSHO) times the adjustment factor (AJEX).
9. Accrual (AC). Accruals in year t-1 are defined following Fama and French (2008), as the
change in operating working capital per split-adjusted share from t-2 to t-1 divided by book
equity per split-adjusted share at t-1. Operating working capital is computed as current
assets (ACT) minus cash and short-term investments (CHE), minus the difference of
current liability (LCT) and debt in current liabilities (DLC) if available.
37
10. Net Operating Assets (NOA). Following Hirshleifer et al. (2004), we define net operating
assets (NOA) in year t-1, as operating assets minus operating liabilities in year t-1 scaled
by total assets in year t-2 (Compustat item AT). Operating assets are total assets (AT) minus
cash and short-term investment (CHE). Operating liabilities are total assets minus debt
included in current liabilities (item DLC, zero if missing), minus long-term debt (item
DLTT, zero if missing), minus minority interests (item MIB, zero if missing), minus book
value of preferred stocks as described in the definition of book equity (zero if missing),
and minus common equity (CEQ).

38
References
Abreu, Dilip, and Markus Brunnermeier, 2002, Synchronization risk and delayed arbitrage,
Journal of Financial Economics 66, 341–360.
Agarwal, Vikas, Wei Jiang, Yuehua Tang, and Baozhong Yang, 2013, Uncovering hedge fund
skill from the portfolio holdings they hide, Journal of Finance 59, 1271–1289.
Akbas, Ferhat, William Armstrong, Sorin Sorescu, and Avanidhar Subrahmanyam, 2015, Smart
money, dumb money, and equity return anomalies, Journal of Financial Economics 118, 355–382.
Asquith, Paul, and Lisa Meulbroek, 1995, An empirical investigation of short interest, Working
paper, M.I.T.
Asquith, Paul, Parag Pathak, and Jay Ritter, 2005, Short Interest, Institutional Ownership, and
Stock Returns, Journal of Financial Economics 78, 243–276.
Banz, Rolf, 1981, The relationship between return and market value of common stocks, Journal
of Financial Economics 9, 3–18.
Ben-David, Itzhak, Francesco Franzoni, and Rabih Moussawi, 2012, Hedge fund stock trading in
the financial crisis of 2007–2009, Review of Financial Studies 25, 1–54.
Boehmer, Ekkehart, Zsuzsa Huszar, and Bradford Jordan, 2010, The good news in short interest,
Journal of Financial Economics 96, 80–97.
Boehmer, Ekkehart, Charles Jones, and Xiaoyan Zhang, 2008, Which shorts are informed? Journal
of Finance 63, 491–527.
Boehmer, Ekkehart, Charles Jones, and Xiaoyan Zhang, 2013, Shackling short sellers: The 2008
shorting ban, Review of Financial Studies 26, 1364–1400.
Brunnermeier, Markus, and Stefan Nagel, 2004, Hedge funds and the technology bubble, Journal
of Finance 59, 2013–2040.
Cao, Charles, Yong Chen, William Goetzmann, and Bing Liang, 2017, The role of hedge fund in
the security price formation process, Working paper, Penn State University, Texas A&M, Yale
SOM, and University of Massachusetts Amherst.
Carhart, Mark, 1997, On persistence in mutual fund performance, Journal of Finance 52, 57–82.
Chu, Yongqiang, David Hirshleifer, and Liang Ma, 2017, The causal effect of limits to arbitrage
on asset pricing anomalies, Working paper, University of South Carolina and UC Irvine.
Cooper, Michael, Huseyin Gulen, and Michael Schill, 2008, Asset growth and the cross-section of
stock returns, Journal of Finance 63, 1609–52.

39
Davis, James, Eugene Fama, and Kenneth French, 2000, Characteristics, covariances, and average
returns: 1929 to 1997, Journal of Finance 55, 389–406.
De Long, Bradford, Andrei Shleifer, Lawrence Summers, and Robert Waldmann, 1990, Noise
trader risk in financial market, Journal of Political Economy 98, 703–738.
Desai, H., K. Ramesh, S. R. Thiagarajan, and B. V. Balachandran, 2002, An investigation of the
informational role of short interest in the Nasdaq market, Journal of Finance 57, 2263–2287.
Diamond, Douglas, and Robert Verrecchia, 1987, Constraints on short-selling and asset price
adjustment to private information, Journal of Financial Economics 18, 277–311.
Diether, Karl, Kuan-Hui Lee, and Ingrid Werner, 2009, It’s SHO time! Short-sale price tests and
market quality, Journal of Finance 64, 37–73.
Di Mascio, Rick, Anton Lines, and Narayan Naik, 2015, Alpha decay, Working paper, London
Business School.
Drechsler, Itamar, and Qingyi Drechsler, 2016, The shorting premium and asset pricing anomalies,
Working paper, New York University.
Edelen, Roger, Ozgur Ince, and Gregory Kadlec, 2016, Institutional investors and stock return
anomalies, Journal of Financial Economics 119, 472–488.
Engelberg, Joseph, David McLean, and Jeffrey Pontiff, 2017, Anomalies and news, Journal of
Finance, forthcoming.
Fama, Eugene, 1970, Efficient capital markets: A review of theory and empirical work, Journal of
Finance 25, 383-417.
Fama, Eugene, and Kenneth French, 1993, Common risk factors in the returns on stocks and bonds,
Journal of Financial Economics 33, 3–56.
Fama, Eugene, and Kenneth French, 2008, Dissecting anomalies, Journal of Finance 63, 1653–
1678.
Fama, Eugene, and Kenneth French, 2015, A five-factor asset pricing model, Journal of Financial
Economics 116, 1–22.
Fama, Eugene, and James MacBeth, 1973, Risk, return, and equilibrium–empirical tests, Journal
of Political Economy 81, 607–636.
Geczy, Christopher, David Musto, and Adam Reed, 2002, Stocks are special too: An analysis of
the equity lending market, Journal of Financial Economics 66, 241–269.

40
Griffin, John, Jeffrey Harris, Tao Shu, and Selim Topaloglu, 2011, Who drove and burst the tech
bubble?, Journal of Finance 66, 1251–1290.
Griffin, John, and Jin Xu, 2009, How smart are the smart guys? A unique view from hedge fund
stock holdings, Review of Financial Studies 22, 2531–2570.
Gromb, Denis, and Dimitri Vayanos, 2010, Limits of arbitrage, Annual Review of Financial
Economics 2, 251–275.
Grossman, Sanford J., and Joseph E. Stiglitz, 1980, On the Impossibility of Informationally
Efficient Markets, American Economic Review 70, 393-408.
Grullon, Gustavo, Sébastien Michenaud, and James Weston, 2015, The real effects of short-selling
constraints, Review of Financial Studies 28, 1737–1767.
Hanson, Samuel, and Adi Sunderam, 2014, The growth and limits of arbitrage: Evidence from
short interest, Review of Financial Studies 27, 1238–1286.
Hirshleifer, David, Kewei Hou, Siew Hong Teoh, and Yinglei Zhang, 2004, Do investors
overvalue firms with bloated balance sheets, Journal of Accounting and Economics 38, 297–331.
Hou, Kewei, Chen Xue, and Lu Zhang, 2015, Digesting anomalies: An investment approach,
Review of Financial Studies, 28, 650–705.
Hwang, Byoung-Hyoun, Baixiao Liu, and Wei Xu, 2017, Arbitrage involvement and security
prices, Management Science, forthcoming.
Jame, Russell, 2017, Liquidity provision and the cross-section of hedge fund returns, Management
Science, forthcoming.
Jegadeesh, Narasimhan, and Sheridan Titman, 1993, Returns to buying winners and selling losers:
Implications for stock market efficiency, Journal of Finance 48, 65–91.
Jiao, Yawen, Massimo Massa, and Hong Zhang, 2016, Short selling meets hedge fund 13F: An
anatomy of informed demand, Journal of Financial Economics 122, 544–567.
Lou, Dong, and Christopher Polk, 2015, Comomentum: Inferring Arbitrage Activity from Return
Correlations, Working paper, London School of Economics.
Loughran, Tim, and Jay Ritter, 1995, The New Issues Puzzle, Journal of Finance 50, 23–51.
Miller, Edward, 1977, Risk, uncertainty, and divergence of opinion, Journal of Finance 32, 1151–
1168.
Nagel, Stefan, 2005, Short sales, institutional ownership, and the cross-section of stock returns,
Journal of Financial Economics 78, 277–309.

41
Nagel, Stefan, 2012, Evaporating liquidity, Review of Financial Studies 25, 2005–2039.
Newey, Whitney, and Kenneth West, 1987, A simple, positive definite, heteroskedasticity and
autocorrelation consistent covariance matrix, Econometrica 55, 703–708.
Novy-Marx, Robert, 2013, The other side of value: The gross profitability premium. Journal of
Financial Economics 108, 1–28.
Pontiff, Jeffrey, 1996, Costly arbitrage: Evidence from closed-end funds, Quarterly Journal of
Economics 111, 1135–1151.
Ritter, Jay, 1991, The long-run performance of initial public offerings, Journal of Finance 46, 3–
27.
Rosenberg, Barr, Kenneth Reid, and Ronald Lanstein, 1985, Persuasive evidence of market
inefficiency, Journal of Portfolio Management 11, 9–17.
Ross, Stephen, 1976, The arbitrage theory of capital asset pricing, Journal of Economic Theory 13,
341–360.
Saffi, Pedro, and Kari Sigurdsson, 2011, Price efficiency and short selling, Review of Financial
Studies 24, 821–852.
Sharpe, William, 1964, Capital asset prices: A theory of market equilibrium under conditions of
risk, Journal of Finance 19, 425–442.
Shleifer, Andrei, and Robert Vishny, 1997, The limits of arbitrage, Journal of Finance 52, 35–55.
Sias, Richard, H. J. Turtle, and Blerina Zykaj, 2016, Hedge fund crowds and mispricing,
Management Science 62, 764–784.
Sloan, Richard, 1996, Do stock prices fully reflect information in accruals and cash flows about
future earnings? The Accounting Review 71, 289–315.
Stambaugh, Robert, Jianfeng Yu, and Yu Yuan, 2012, The short of it: Investor sentiment and
anomalies, Journal of Financial Economics 104, 288–302.
Stambaugh, Robert, Jianfeng Yu, and Yu Yuan, 2015, Arbitrage asymmetry and the idiosyncratic
volatility puzzle, Journal of Finance 70, 1903–1948.
Xing, Yuhang, 2008, Interpreting the value effect through the Q-theory: An empirical investigation,
Review of Financial Studies 21, 1767–1795.

42
Table 1 Summary Statistics
This table presents summary statistics for the following variables: hedge fund holdings (HF), defined as the
ratio between the number of shares owned by hedge funds and the number of shares outstanding; short
interest (SR), defined as the ratio between the number of shares shorted and the number of shares
outstanding; the difference between HF and SR (HFSR); abnormal hedge fund holdings (AHF), defined as
the percentage change of current HF from the average HF in the previous four quarters; abnormal short
interest (ASR), defined as the percentage change of current SR from the average SR in the previous four
quarters; and net arbitrage trading (NAT), defined as the difference between AHF and ASR. Panel A reports
the distribution including mean, median, the 5th, 25th, 75th, and 95th percentiles, standard deviation (STD),
and first-order autocorrelation (AR1). At the end of each quarter, we first compute the variables across
stocks, and then take average across quarters. The % of CRSP represents the total market capitalization of
the sample stocks as a percentage of the market capitalization of the CRSP universe. In each quarter, we
exclude firms with market capitalization below the 20th percentile size breakpoint of NYSE firms. Panel B
presents average correlations between HF, SR, HFSR, AHF, ASR, NAT and stock characteristics over
quarters. We consider the following stock characteristics: book-to-market ratio (BM), gross profitability
(GP), operating profit (OP), momentum (MOM), market capitalization (MC), asset growth (AG),
investment-to-capital ratio (IK), net stock issues (NS), accrual (AC), net operating assets (NOA), and the
mispricing measure (MISP) of Stambaugh, Yu, and Yuan (2015). All the values are stated in percentage.
The sample period is from 1990:Q1 to 2015:Q4.
Panel A: Distribution
Mean P5 P25 P50 P75 P95 STD AR1
HF 4.66 0.48 1.46 3.06 6.15 14.81 4.79 0.75
SR 3.80 0.40 1.20 2.50 4.90 12.30 4.00 0.69
HFSR 0.90 -7.70 -1.50 0.50 2.70 10.60 5.40 0.73
AHF 0.20 -3.00 -0.60 0.00 0.80 4.00 2.10 0.52
ASR 0.20 -2.50 -0.60 0.00 0.70 3.70 1.90 0.47
NAT 0.00 -4.90 -1.10 0.00 1.10 4.80 2.90 0.53
% of CRSP 79.68 67.37 70.14 82.00 88.30 94.25 9.64 n.a.

43
Table 1, continued
Panel B: Correlation
SR HFSR AHF ASR NAT BM GP OP MOM MC AG IK NS AC NOA MISP
HF 22.39 67.79 37.92 6.75 21.78 -2.79 3.87 1.86 7.26 -19.67 6.62 5.51 7.66 -0.72 4.41 9.58
SR -54.00 4.27 44.24 -29.43 -9.47 6.72 2.06 -3.55 -19.85 17.34 10.67 10.01 2.26 6.56 18.77
HFSR 28.12 -27.63 41.02 4.90 -1.64 0.49 8.50 -3.49 -7.40 -3.30 -0.79 -2.38 -1.33 -5.44
AHF 8.26 65.16 1.21 0.49 0.10 2.39 -3.12 -1.39 -0.45 -1.60 -0.42 -0.41 -0.17
ASR -66.73 -3.56 0.39 -0.42 -1.61 -4.57 5.40 3.76 2.17 1.02 1.86 6.06
NAT 3.45 0.21 0.46 2.33 0.85 -4.85 -3.04 -2.71 -0.91 -1.58 -4.18
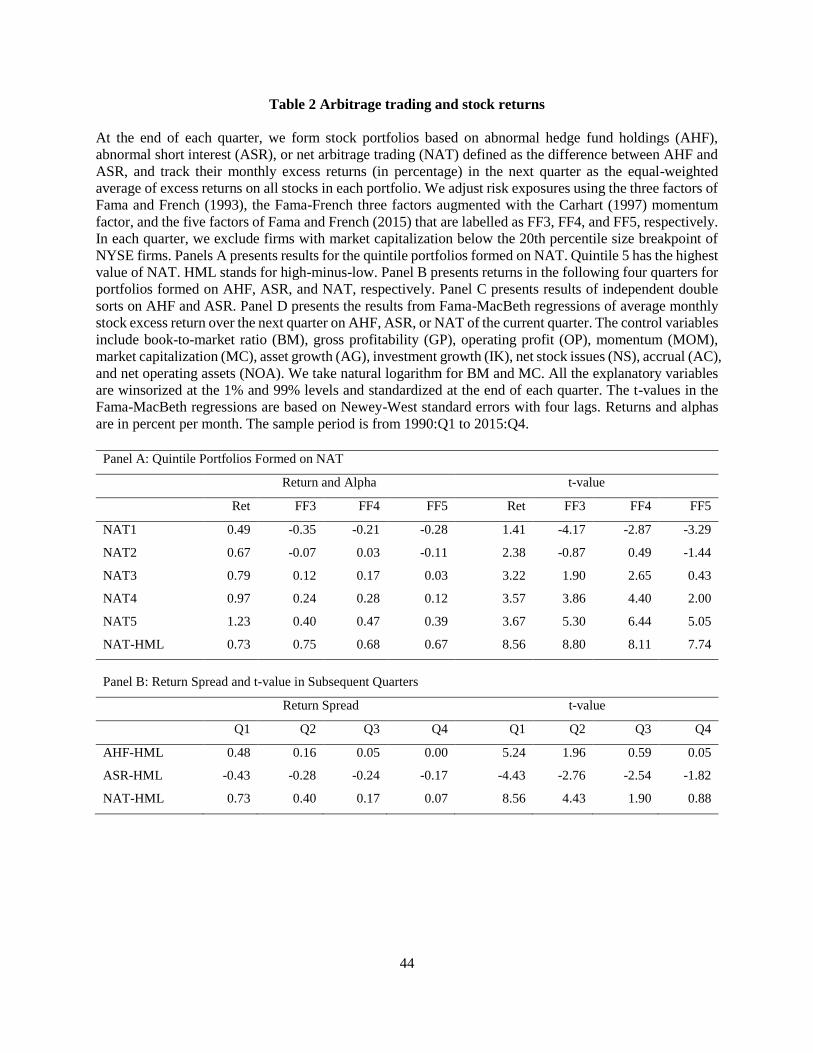
44
Table 2 Arbitrage trading and stock returns
At the end of each quarter, we form stock portfolios based on abnormal hedge fund holdings (AHF),
abnormal short interest (ASR), or net arbitrage trading (NAT) defined as the difference between AHF and
ASR, and track their monthly excess returns (in percentage) in the next quarter as the equal-weighted
average of excess returns on all stocks in each portfolio. We adjust risk exposures using the three factors of
Fama and French (1993), the Fama-French three factors augmented with the Carhart (1997) momentum
factor, and the five factors of Fama and French (2015) that are labelled as FF3, FF4, and FF5, respectively.
In each quarter, we exclude firms with market capitalization below the 20th percentile size breakpoint of
NYSE firms. Panels A presents results for the quintile portfolios formed on NAT. Quintile 5 has the highest
value of NAT. HML stands for high-minus-low. Panel B presents returns in the following four quarters for
portfolios formed on AHF, ASR, and NAT, respectively. Panel C presents results of independent double
sorts on AHF and ASR. Panel D presents the results from Fama-MacBeth regressions of average monthly
stock excess return over the next quarter on AHF, ASR, or NAT of the current quarter. The control variables
include book-to-market ratio (BM), gross profitability (GP), operating profit (OP), momentum (MOM),
market capitalization (MC), asset growth (AG), investment growth (IK), net stock issues (NS), accrual (AC),
and net operating assets (NOA). We take natural logarithm for BM and MC. All the explanatory variables
are winsorized at the 1% and 99% levels and standardized at the end of each quarter. The t-values in the
Fama-MacBeth regressions are based on Newey-West standard errors with four lags. Returns and alphas
are in percent per month. The sample period is from 1990:Q1 to 2015:Q4.
Panel A: Quintile Portfolios Formed on NAT
Return and Alpha t-value
Ret FF3 FF4 FF5 Ret FF3 FF4 FF5
NAT1 0.49 -0.35 -0.21 -0.28 1.41 -4.17 -2.87 -3.29
NAT2 0.67 -0.07 0.03 -0.11 2.38 -0.87 0.49 -1.44
NAT3 0.79 0.12 0.17 0.03 3.22 1.90 2.65 0.43
NAT4 0.97 0.24 0.28 0.12 3.57 3.86 4.40 2.00
NAT5 1.23 0.40 0.47 0.39 3.67 5.30 6.44 5.05
NAT-HML 0.73 0.75 0.68 0.67 8.56 8.80 8.11 7.74
Panel B: Return Spread and t-value in Subsequent Quarters
Return Spread t-value
Q1 Q2 Q3 Q4 Q1 Q2 Q3 Q4
AHF-HML 0.48 0.16 0.05 0.00 5.24 1.96 0.59 0.05
ASR-HML -0.43 -0.28 -0.24 -0.17 -4.43 -2.76 -2.54 -1.82
NAT-HML 0.73 0.40 0.17 0.07 8.56 4.43 1.90 0.88

45
Table 2, continued.
Panel C: Double Sorting on AHF and ASR
Return and Alpha t-value
AHF1 AHF2 AHF3 AHF-HML AHF1 AHF2 AHF3 AHF-HML
Excess Return
ASR1 0.86 0.83 1.22 0.36 2.68 3.08 3.76 3.65
ASR2 0.73 0.79 1.14 0.41 2.65 3.43 4.00 4.76
ASR3 0.44 0.58 0.90 0.46 1.27 1.98 2.55 4.75
ASR-HML -0.42 -0.25 -0.32 -4.62 -2.38 -3.11
FF5 Alpha
ASR1 0.09 -0.02 0.31 0.22 1.06 -0.26 3.81 2.29
ASR2 -0.04 0.02 0.28 0.33 -0.57 0.29 3.59 3.87
ASR3 -0.34 -0.20 0.15 0.50 -3.60 -2.10 1.79 5.02
ASR-HML -0.44 -0.18 -0.16 -4.76 -1.72 -1.80
Panel D: Fama-MacBeth Regressions
Dependent Variable = Excess Return in the Next Quarter
AHF 0.114
t-value 4.24
ASR -0.134
t-value -4.45
NAT 0.183
t-value 6.65
Stock characteristics
as control variables Yes Yes Yes
Adj. R2 (%) 6.56 6.60 6.59
Obs. 358,396 358,396 358,396
46
Table 3 Net Arbitrage Trading and Stock Anomaly Returns
For each stock return anomaly, at the end of each quarter, we construct quintile portfolios and compute monthly portfolio returns in the next four
quarters (Q1, Q2, Q3, and Q4). In Panel A, we report the return spread between the long- and the short-leg of anomaly stocks. The column “Avg.”
reports results for a portfolio equally-investing in the 10 anomalies. Based on the Fama-French five-factor model, we report alphas for the long-
minus-short strategy of the composite portfolios, denoted Alpha(LMS); the long portfolio Alpha(L); and the short portfolio Alpha(S). Similar
analysis based on quintile portfolios is performed to the mispricing measure MISP, where the alphas are denoted Alpha(LMS)MISP, Alpha(L)MISP,
and Alpha(S)MISP. Next, at the end of each quarter, for the long leg, we identify stocks traded by arbitrageurs as those belonging to the NAT group
3 (top 30%), and those not traded by arbitrageurs as those stocks that have middle 40% values of NAT. Similarly, for the short leg, we identify
stocks traded by arbitrageurs as those belonging to the NAT group 1 (bottom 30%), and those not traded by arbitrageurs as those stocks that have
middle 40% values of NAT. We track monthly equal-weighted average returns of these four portfolios. In Panel B, we report the return spread
between the long- and the short-leg of anomaly stocks traded by arbitrageurs. In Panel C, we report the return spread between the long- and short-
leg of anomaly stocks not traded by arbitrageurs. We consider the following stock anomalies: book-to-market ratio (BM), gross profitability (GP),
operating profit (OP), momentum (MOM), market capitalization (MC), asset growth (AG), investment growth (IK), net stock issues (NS), accrual
(AC), net operating assets (NOA), and the mispricing measure (MISP). Returns and alphas are in percent per month. The sample period is from
1990:Q1 to 2015:Q4.
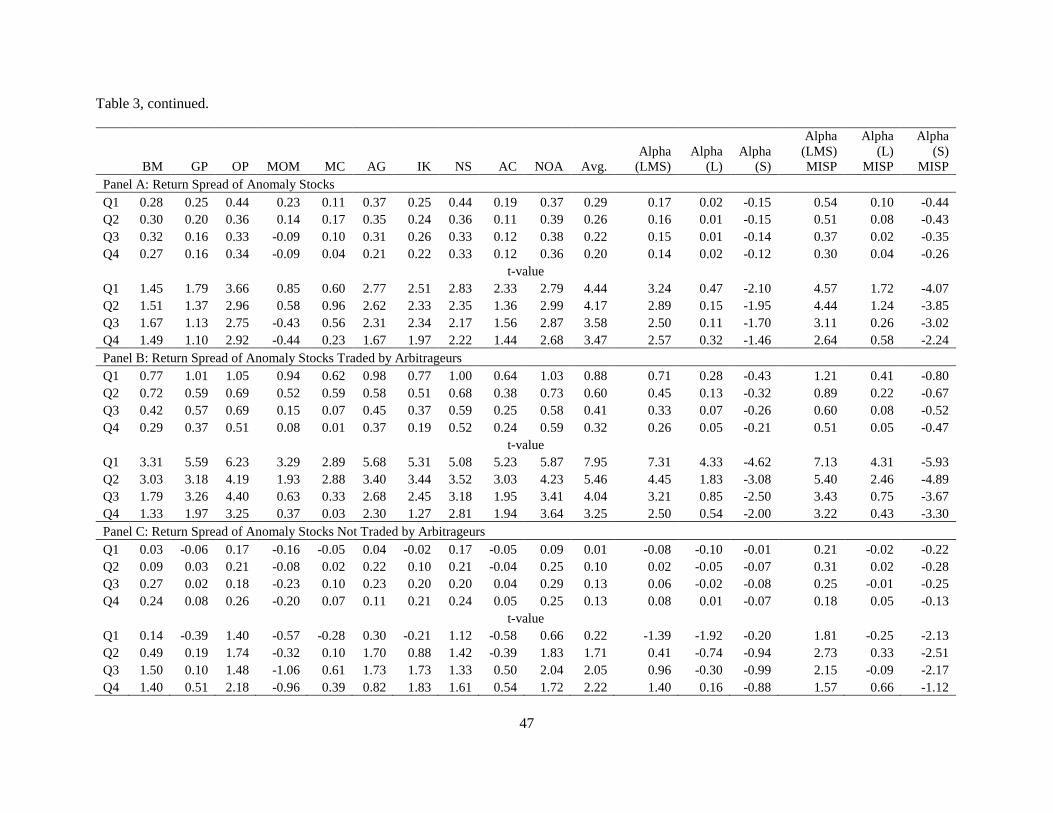
47
Table 3, continued.
BM GP OP MOM MC AG IK NS AC NOA Avg.
Alpha
(LMS)
Alpha
(L)
Alpha
(S)
Alpha
(LMS)
MISP
Alpha
(L)
MISP
Alpha
(S)
MISP
Panel A: Return Spread of Anomaly Stocks
Q1 0.28 0.25 0.44 0.23 0.11 0.37 0.25 0.44 0.19 0.37 0.29 0.17 0.02 -0.15 0.54 0.10 -0.44
Q2 0.30 0.20 0.36 0.14 0.17 0.35 0.24 0.36 0.11 0.39 0.26 0.16 0.01 -0.15 0.51 0.08 -0.43
Q3 0.32 0.16 0.33 -0.09 0.10 0.31 0.26 0.33 0.12 0.38 0.22 0.15 0.01 -0.14 0.37 0.02 -0.35
Q4 0.27 0.16 0.34 -0.09 0.04 0.21 0.22 0.33 0.12 0.36 0.20 0.14 0.02 -0.12 0.30 0.04 -0.26
t-value
Q1 1.45 1.79 3.66 0.85 0.60 2.77 2.51 2.83 2.33 2.79 4.44 3.24 0.47 -2.10 4.57 1.72 -4.07
Q2 1.51 1.37 2.96 0.58 0.96 2.62 2.33 2.35 1.36 2.99 4.17 2.89 0.15 -1.95 4.44 1.24 -3.85
Q3 1.67 1.13 2.75 -0.43 0.56 2.31 2.34 2.17 1.56 2.87 3.58 2.50 0.11 -1.70 3.11 0.26 -3.02
Q4 1.49 1.10 2.92 -0.44 0.23 1.67 1.97 2.22 1.44 2.68 3.47 2.57 0.32 -1.46 2.64 0.58 -2.24
Panel B: Return Spread of Anomaly Stocks Traded by Arbitrageurs
Q1 0.77 1.01 1.05 0.94 0.62 0.98 0.77 1.00 0.64 1.03 0.88 0.71 0.28 -0.43 1.21 0.41 -0.80
Q2 0.72 0.59 0.69 0.52 0.59 0.58 0.51 0.68 0.38 0.73 0.60 0.45 0.13 -0.32 0.89 0.22 -0.67
Q3 0.42 0.57 0.69 0.15 0.07 0.45 0.37 0.59 0.25 0.58 0.41 0.33 0.07 -0.26 0.60 0.08 -0.52
Q4 0.29 0.37 0.51 0.08 0.01 0.37 0.19 0.52 0.24 0.59 0.32 0.26 0.05 -0.21 0.51 0.05 -0.47
t-value
Q1 3.31 5.59 6.23 3.29 2.89 5.68 5.31 5.08 5.23 5.87 7.95 7.31 4.33 -4.62 7.13 4.31 -5.93
Q2 3.03 3.18 4.19 1.93 2.88 3.40 3.44 3.52 3.03 4.23 5.46 4.45 1.83 -3.08 5.40 2.46 -4.89
Q3 1.79 3.26 4.40 0.63 0.33 2.68 2.45 3.18 1.95 3.41 4.04 3.21 0.85 -2.50 3.43 0.75 -3.67
Q4 1.33 1.97 3.25 0.37 0.03 2.30 1.27 2.81 1.94 3.64 3.25 2.50 0.54 -2.00 3.22 0.43 -3.30
Panel C: Return Spread of Anomaly Stocks Not Traded by Arbitrageurs
Q1 0.03 -0.06 0.17 -0.16 -0.05 0.04 -0.02 0.17 -0.05 0.09 0.01 -0.08 -0.10 -0.01 0.21 -0.02 -0.22
Q2 0.09 0.03 0.21 -0.08 0.02 0.22 0.10 0.21 -0.04 0.25 0.10 0.02 -0.05 -0.07 0.31 0.02 -0.28
Q3 0.27 0.02 0.18 -0.23 0.10 0.23 0.20 0.20 0.04 0.29 0.13 0.06 -0.02 -0.08 0.25 -0.01 -0.25
Q4 0.24 0.08 0.26 -0.20 0.07 0.11 0.21 0.24 0.05 0.25 0.13 0.08 0.01 -0.07 0.18 0.05 -0.13
t-value
Q1 0.14 -0.39 1.40 -0.57 -0.28 0.30 -0.21 1.12 -0.58 0.66 0.22 -1.39 -1.92 -0.20 1.81 -0.25 -2.13
Q2 0.49 0.19 1.74 -0.32 0.10 1.70 0.88 1.42 -0.39 1.83 1.71 0.41 -0.74 -0.94 2.73 0.33 -2.51
Q3 1.50 0.10 1.48 -1.06 0.61 1.73 1.73 1.33 0.50 2.04 2.05 0.96 -0.30 -0.99 2.15 -0.09 -2.17
Q4 1.40 0.51 2.18 -0.96 0.39 0.82 1.83 1.61 0.54 1.72 2.22 1.40 0.16 -0.88 1.57 0.66 -1.12

48
Table 4 Returns around Earnings Announcements and Changes in Non-Hedge Fund Holdings
for Anomaly Stocks Traded vs. Not Traded by Arbitrageurs
In Panel A, for anomaly stocks, we compute their average daily returns over a three-day window around
earnings announcements in the next four quarters. Ret_EA# is average return (in percent per day) around
earnings announcement in the #th quarter after portfolio formation. For each stock anomaly, we examine
stocks traded vs. not traded by arbitrageurs separately, and for the long-leg (L) and short-leg (S) separately.
For the long leg, we identify stocks traded by arbitrageurs as those belonging to the net arbitrage trading
(NAT) group 3 (top 30%), and those not traded by arbitrageurs as those have middle 40% values of NAT.
For the short leg, we identify stocks traded by arbitrageurs as those belonging to the NAT group 1 (bottom
30%), and those not traded by arbitrageurs as those have middle 40% values of NAT. In Panel B, we
compute changes in non-hedge fund holdings (in percent) in the current and next four quarters. CNHF# is
the change in non-hedge fund holdings in the #th quarter after portfolio formation. Portfolio-level earnings-
announcement-window returns and changes in non-hedge fund holdings are averaged across stocks. The
statistics are based on a composite portfolio equally investing in the 10 anomalies. We also report the return
difference between the long- and short-leg for the traded and not-traded groups (Traded L–S and Not Trade
L–S). The t-values, reported in parentheses, use Newey-West standard errors with four lags for the CNHFs.
The sample period is from 1990:Q1 to 2015:Q4.
Panel A: Returns around Earnings Announcements Panel B: Changes in Non-Hedge Fund Holdings
Portfolio Ret_EA1 Ret_EA2 Ret_EA3 Ret_EA4 CNHF0 CNHF1 CNHF2 CNHF3 CNHF4
L 0.22 0.17 0.18 0.16 -0.37 0.41 0.91 1.32 1.62
Traded S 0.06 0.07 0.08 0.11 1.36 -0.01 -0.16 -0.26 -0.33
L–S 0.16 0.10 0.10 0.05 -1.73 0.42 1.06 1.59 1.94
(5.12) (3.25) (3.83) (1.78) (-4.00) (4.49) (7.67) (9.86) (10.82)
L 0.12 0.14 0.14 0.16 0.98 0.22 0.30 0.36 0.42
Not Traded S 0.12 0.11 0.10 0.11 -0.17 0.22 0.46 0.69 0.88
L–S 0.01 0.04 0.04 0.06 1.16 0.00 -0.16 -0.33 -0.46
(0.39) (2.34) (2.28) (3.29) (7.58) (0.09) (-2.54) (-3.69) (-4.26)

49
Table 5 Causal Evidence from Regulation SHO
Pilot stocks are the stocks in the Russell 3000 index with short-sale constraints relaxed due to Regulation
SHO during the pilot period. Our sample contains 650 pilot stocks and 1,425 non-pilot stocks. Panel A
presents the difference in the average of anomaly characteristics between pilot stocks and non-pilot stocks
at the beginning of the pilot period. We consider the following anomaly characteristics: book-to-market
ratio (BM), gross profitability (GP), operating profit (OP), momentum (MOM), market capitalization (MC),
asset growth (AG), investment growth (IK), net stock issues (NS), accrual (AC), and net operating assets
(NOA). The anomaly characteristics are reported in their original units (see the Appendix for descriptions
of the characteristics). In Panel B, we first form quintile portfolios based on the mispricing measure MISP
for pilot stocks and non-pilot stocks separately, for the pilot period (June 2005–July 2007), the pre-pilot
period (January 1990–May 2005), and the post-pilot period (August 2007–December 2015). We skip the
third and fourth quarters of 2008 to mitigate the impact of the financial crisis and the short-selling ban. The
traded stocks are those with high net arbitrage trading (NAT) among low MISP stocks, or low NAT among
high MISP stocks measured at the end of the previous quarter. The not-traded stocks are those with medium
NAT among low MISP stocks, or medium NAT among high MISP stocks. We use the 20th percentile and
the 80th percentile MISP breakpoints to identify low MISP and high MISP, and the 30th percentile and the
70th percentile NAT breakpoints to identify low, medium, and high NAT. This definition applies to both
the pilot stock group and the non-pilot stock group. Portfolio L (S) stands for Long (Short). Alphas (FF5)
are computed with the Fama-French five factors. Panel C reports the results from the following panel
regression of future stock returns.
𝑟𝑖,𝑡+1 = 𝑎𝑡 + 𝑎1 × 𝑁𝑜𝑛-𝑝𝑖𝑙𝑜𝑡𝑖 × 𝑃𝑖𝑙𝑜𝑡-𝑝𝑒𝑟𝑖𝑜𝑑𝑡 + 𝑎2 × 𝑁𝑜𝑛-𝑝𝑖𝑙𝑜𝑡𝑖 + 𝜀𝑖,𝑡,
where 𝑟𝑖,𝑡+1 is the portfolio-level average monthly excess return in the next month for the long leg, the short
leg, or the long-minus-short of the traded and not traded groups. The Non-pilot dummy equals one if a stock
is a non-pilot stock and zero otherwise. The Pilot-period dummy equals one if the time falls within the pilot
period and zero otherwise. 𝑎𝑡 is the time fixed effect. L (S) stands for the long (short) leg. The coefficient
of interest, a1, on the interaction term is reported along with its t-value. Returns and alphas are in percent
per month. The sample period for the panel regression is from 1990:Q1 to 2015:Q4.
Panel A: Difference in Characteristics between Pilot Stocks and Non-Pilot Stocks
BM GP OP MOM MC AG IK NS AC NOA
Non-Pilot 0.501 0.294 0.648 0.095 3211 0.143 0.208 0.053 -0.009 0.529
Pilot 0.486 0.293 0.633 0.083 3620 0.157 0.226 0.041 -0.002 0.517
Difference 0.016 0.002 0.015 0.012 -409 -0.014 -0.018 0.012 -0.007 0.011
t-value 0.96 0.16 0.41 0.79 -1.47 -0.98 -0.37 1.83 -0.75 0.83
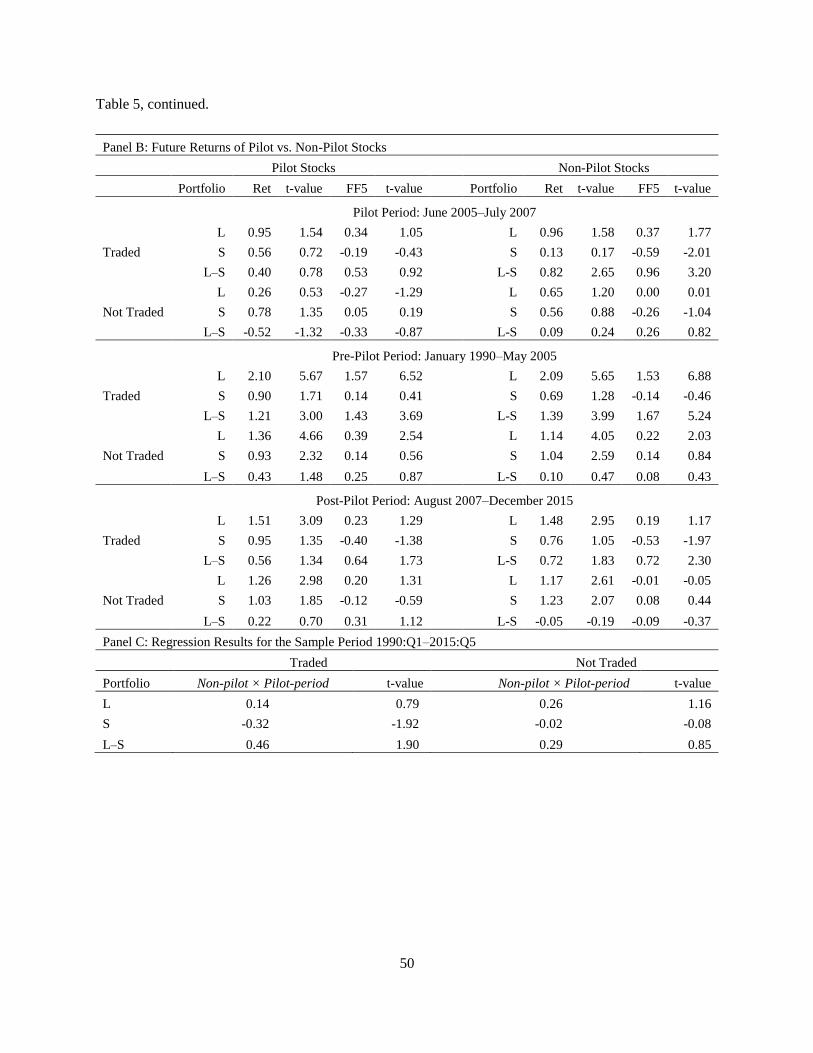
50
Table 5, continued.
Panel B: Future Returns of Pilot vs. Non-Pilot Stocks
Pilot Stocks Non-Pilot Stocks
Portfolio Ret t-value FF5 t-value Portfolio Ret t-value FF5 t-value
Pilot Period: June 2005–July 2007
L 0.95 1.54 0.34 1.05 L 0.96 1.58 0.37 1.77
Traded S 0.56 0.72 -0.19 -0.43 S 0.13 0.17 -0.59 -2.01
L–S 0.40 0.78 0.53 0.92 L-S 0.82 2.65 0.96 3.20
L 0.26 0.53 -0.27 -1.29 L 0.65 1.20 0.00 0.01
Not Traded S 0.78 1.35 0.05 0.19 S 0.56 0.88 -0.26 -1.04
L–S -0.52 -1.32 -0.33 -0.87 L-S 0.09 0.24 0.26 0.82
Pre-Pilot Period: January 1990–May 2005
L 2.10 5.67 1.57 6.52 L 2.09 5.65 1.53 6.88
Traded S 0.90 1.71 0.14 0.41 S 0.69 1.28 -0.14 -0.46
L–S 1.21 3.00 1.43 3.69 L-S 1.39 3.99 1.67 5.24
L 1.36 4.66 0.39 2.54 L 1.14 4.05 0.22 2.03
Not Traded S 0.93 2.32 0.14 0.56 S 1.04 2.59 0.14 0.84
L–S 0.43 1.48 0.25 0.87 L-S 0.10 0.47 0.08 0.43
Post-Pilot Period: August 2007–December 2015
L 1.51 3.09 0.23 1.29 L 1.48 2.95 0.19 1.17
Traded S 0.95 1.35 -0.40 -1.38 S 0.76 1.05 -0.53 -1.97
L–S 0.56 1.34 0.64 1.73 L-S 0.72 1.83 0.72 2.30
L 1.26 2.98 0.20 1.31 L 1.17 2.61 -0.01 -0.05
Not Traded S 1.03 1.85 -0.12 -0.59 S 1.23 2.07 0.08 0.44
L–S 0.22 0.70 0.31 1.12 L-S -0.05 -0.19 -0.09 -0.37
Panel C: Regression Results for the Sample Period 1990:Q1–2015:Q5
Traded Not Traded
Portfolio Non-pilot × Pilot-period t-value Non-pilot × Pilot-period t-value
L 0.14 0.79 0.26 1.16
S -0.32 -1.92 -0.02 -0.08
L–S 0.46 1.90 0.29 0.85

51
Table 6 Arbitrage Trading during the Financial Crisis
This table presents results on arbitrage capital allocated to anomalies as well as the effect of arbitrage
trading on anomaly returns during the 2007–2009 financial crisis. We consider the following anomaly
characteristics: book-to-market ratio (BM), gross profitability (GP), operating profit (OP), momentum
(MOM), market capitalization (MC), asset growth (AG), investment growth (IK), net stock issues (NS),
accrual (AC), and net operating assets (NOA).We run the following cross-sectional regression for each
anomaly in each quarter.
𝑁𝐴𝑇𝑖,𝑡 = 𝑐0,𝑡 + 𝒄𝒕′ × 𝑰(𝐶ℎ𝑎𝑟𝑎𝑐𝑡𝑒𝑟𝑖𝑠𝑡𝑖𝑐 𝑄𝑢𝑖𝑛𝑡𝑖𝑙𝑒)𝑖,𝑡 + 𝑒𝑖,𝑡,
where 𝑁𝐴𝑇𝑖,𝑡 is the net arbitrage trading (in percent) on stock i in quarter t. 𝑰(𝐶ℎ𝑎𝑟𝑎𝑐𝑡𝑒𝑟𝑖𝑠𝑡𝑖𝑐 𝑄𝑢𝑖𝑛𝑡𝑖𝑙𝑒)𝑖,𝑡
is the vector of quintile dummies (of dimension four-by-one) for a specific anomaly characteristic, and the
omitted dummy is Quintile 1 corresponding to the short leg. Each coefficient in the vector 𝒄𝒕 captures the
difference in NAT between stocks in that particular quintile and those in Quintile 1 (the short leg). We focus
on the coefficient on Quintile 5, 𝑐5,𝑡, since it measures the NAT difference between the long and the short
leg. We obtain a time-series of 𝑐5,𝑡 by running the cross-sectional regression for each quarter. In Panel A,
for each anomaly, we report the results from the following time-series regression of 𝑐5,𝑡 on a constant and
the Crisis dummy that equals one for the crisis period 2007:Q3–2009:Q2 and zero otherwise.
𝑐5,𝑡 = 𝑏0 + 𝑏1 × 𝐶𝑟𝑖𝑠𝑖𝑠 𝑡 + 𝜀𝑡.
𝑏0 captures the average difference in NAT between the long and the short leg, with a larger value indicating
greater arbitrage capital allocated to that anomaly. 𝑏1 is the change of arbitrage capital during the crisis
relative to other times. 𝑏0 + 𝑏1 is the arbitrage capital allocated to each anomaly during the crisis. In panel
B, we examine the relation between arbitrage trading and anomaly returns during the crisis period 2007:Q3–
2009:Q2, as well as the entire sample period. Based on 𝑐5,𝑡 across the anomalies at the end of each quarter
t, we split the 10 anomalies into three groups: the three anomalies with the highest 𝑐5,𝑡, the three anomalies
with the lowest 𝑐5,𝑡 and the remaining four anomalies. We then form three portfolios (denoted “L”, “S”,
and “Middle”, respectively) by following excess returns of each of the three groups over the next three
months. We report the average excess returns and the Fama-French five factor alphas for these portfolios.
Returns and alphas are in percent per month. The sample period is from 1990:Q1 to 2015:Q4.
Panel A: Arbitrage Trading on Anomalies over Time
BM GP OPE MOM MC
Estimate t-value Estimate t-value Estimate t-value Estimate t-value Estimate t-value
b0 0.34 8.62 0.07 1.80 0.10 3.33 0.36 7.83 0.02 0.41
b1 -0.17 -1.21 -0.39 -2.72 -0.54 -4.81 -0.09 -0.54 -0.64 -2.98
b0 + b1 0.17 0.78 -0.32 -1.10 -0.43 -0.83 0.27 1.33 -0.61 -1.11
AG IK NS ACB NOA
Estimate t-value Estimate t-value Estimate t-value Estimate t-value Estimate t-value
b0 0.32 9.67 0.25 7.10 0.12 3.64 0.18 4.75 0.05 1.44
b1 0.20 1.69 0.16 1.28 0.46 3.79 -0.46 -3.41 -0.02 -0.15
b0 + b1 0.53 5.02 0.41 2.17 0.59 8.41 -0.29 -1.45 0.03 0.22

52
Table 6, continued.
Panel B: Long and Short Anomalies
1990:Q1–2015:Q4 2007:Q3–2009:Q2
Portfolio Ret t-value FF5 t-value Ret t-value FF5 t-value
L 0.46 3.62 0.55 4.57 0.54 1.22 0.44 1.02
Middle 0.37 3.59 0.44 4.29 -0.10 -0.26 -0.18 -0.50
S 0.17 1.49 0.25 2.19 -0.79 -1.31 -0.99 -1.82
L–S 0.28 1.70 0.31 1.82 1.33 1.97 1.43 2.12

53
Table 7 One-Way Sorting Based on NAT: Evidence from Daily Data
This table reports results of portfolio sorting based on net arbitrage trading (NAT) from a daily sample.
ASR is computed as the deviation of short interest from its average in the past 30 days. For each stock, net
buy from hedge funds is computed based on daily buy and sell. AHF at day t is computed as a linear
combination of net buys in the past 30 day, where the weight for day t is 1, and the weight for day t-1 is
29/30, and so on so that the weight for day t-29 is 1/30. AHF and ASR are ranked from 1 to 100 across
stocks each day. NAT for each stock is computed as the difference between the AHF ranking and the ASR
ranking. At day t, we form quintile portfolios from NAT and follow their excess returns in the next s days.
Quintile 5 has the highest value of NAT. We set s equal to 5, 10, and 20 trading days to approximately
match the holding periods of 1 week, 2 weeks, and a month. Alphas are computed with the Fama-French
five factors. HML stands for high-minus-low. Stocks whose prices are less than $5 at the time of portfolio
formation are excluded. Returns and alphas are in percent per day. The sample period for the daily data is
from June 2006 to March 2011.
Ret t-val. FF5 t-val. Ret t-val. FF5 t-val. Ret t-val. FF5 t-val.
NAT s = 5 days s = 10 days s = 20 days
1 0.023 0.43 -0.017 -3.35 0.022 0.42 -0.017 -3.61 0.024 0.45 -0.015 -3.50
2 0.033 0.66 -0.003 -0.69 0.033 0.66 -0.003 -0.66 0.033 0.65 -0.003 -0.77
3 0.038 0.76 0.001 0.48 0.038 0.76 0.002 0.65 0.038 0.77 0.002 0.98
4 0.038 0.77 0.002 0.50 0.039 0.78 0.003 0.70 0.039 0.79 0.004 0.93
5 0.053 1.02 0.016 3.52 0.052 1.00 0.015 3.46 0.049 0.94 0.012 3.10
HML 0.030 3.54 0.032 3.88 0.029 3.61 0.032 3.99 0.025 3.35 0.028 3.73
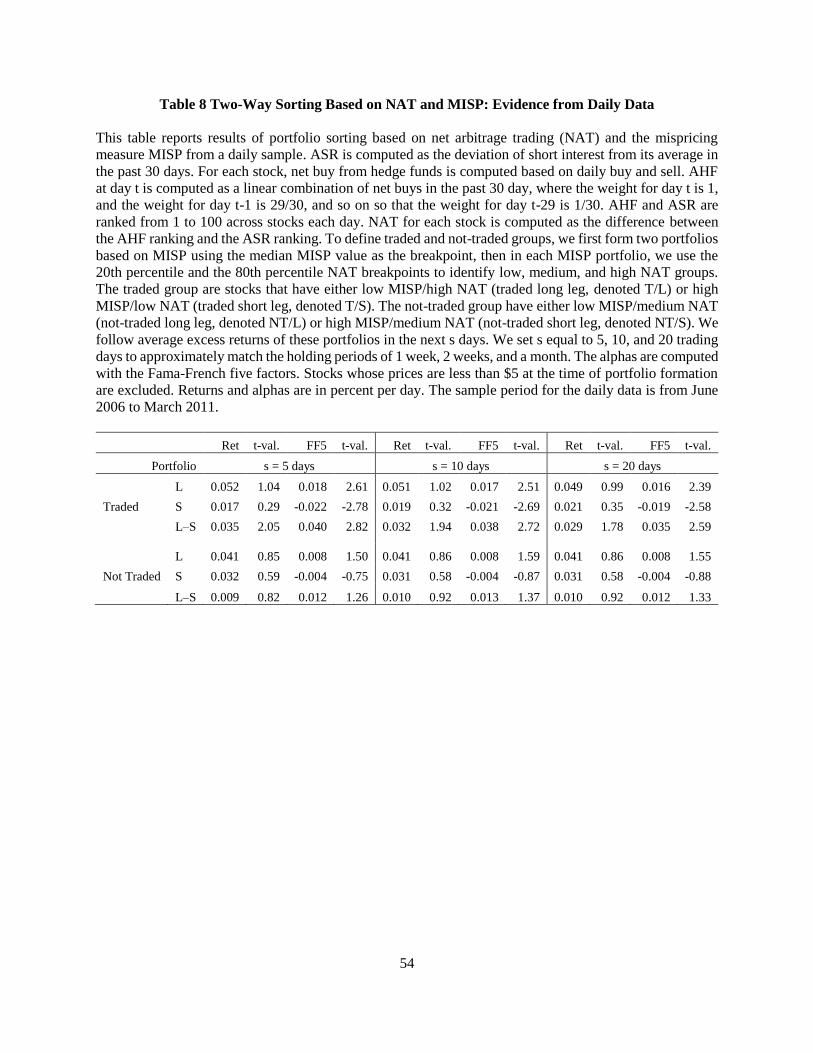
54
Table 8 Two-Way Sorting Based on NAT and MISP: Evidence from Daily Data
This table reports results of portfolio sorting based on net arbitrage trading (NAT) and the mispricing
measure MISP from a daily sample. ASR is computed as the deviation of short interest from its average in
the past 30 days. For each stock, net buy from hedge funds is computed based on daily buy and sell. AHF
at day t is computed as a linear combination of net buys in the past 30 day, where the weight for day t is 1,
and the weight for day t-1 is 29/30, and so on so that the weight for day t-29 is 1/30. AHF and ASR are
ranked from 1 to 100 across stocks each day. NAT for each stock is computed as the difference between
the AHF ranking and the ASR ranking. To define traded and not-traded groups, we first form two portfolios
based on MISP using the median MISP value as the breakpoint, then in each MISP portfolio, we use the
20th percentile and the 80th percentile NAT breakpoints to identify low, medium, and high NAT groups.
The traded group are stocks that have either low MISP/high NAT (traded long leg, denoted T/L) or high
MISP/low NAT (traded short leg, denoted T/S). The not-traded group have either low MISP/medium NAT
(not-traded long leg, denoted NT/L) or high MISP/medium NAT (not-traded short leg, denoted NT/S). We
follow average excess returns of these portfolios in the next s days. We set s equal to 5, 10, and 20 trading
days to approximately match the holding periods of 1 week, 2 weeks, and a month. The alphas are computed
with the Fama-French five factors. Stocks whose prices are less than $5 at the time of portfolio formation
are excluded. Returns and alphas are in percent per day. The sample period for the daily data is from June
2006 to March 2011.
Ret t-val. FF5 t-val. Ret t-val. FF5 t-val. Ret t-val. FF5 t-val.
Portfolio s = 5 days s = 10 days s = 20 days
L 0.052 1.04 0.018 2.61 0.051 1.02 0.017 2.51 0.049 0.99 0.016 2.39
Traded S 0.017 0.29 -0.022 -2.78 0.019 0.32 -0.021 -2.69 0.021 0.35 -0.019 -2.58
L–S 0.035 2.05 0.040 2.82 0.032 1.94 0.038 2.72 0.029 1.78 0.035 2.59
L 0.041 0.85 0.008 1.50 0.041 0.86 0.008 1.59 0.041 0.86 0.008 1.55
Not Traded S 0.032 0.59 -0.004 -0.75 0.031 0.58 -0.004 -0.87 0.031 0.58 -0.004 -0.88
L–S 0.009 0.82 0.012 1.26 0.010 0.92 0.013 1.37 0.010 0.92 0.012 1.33
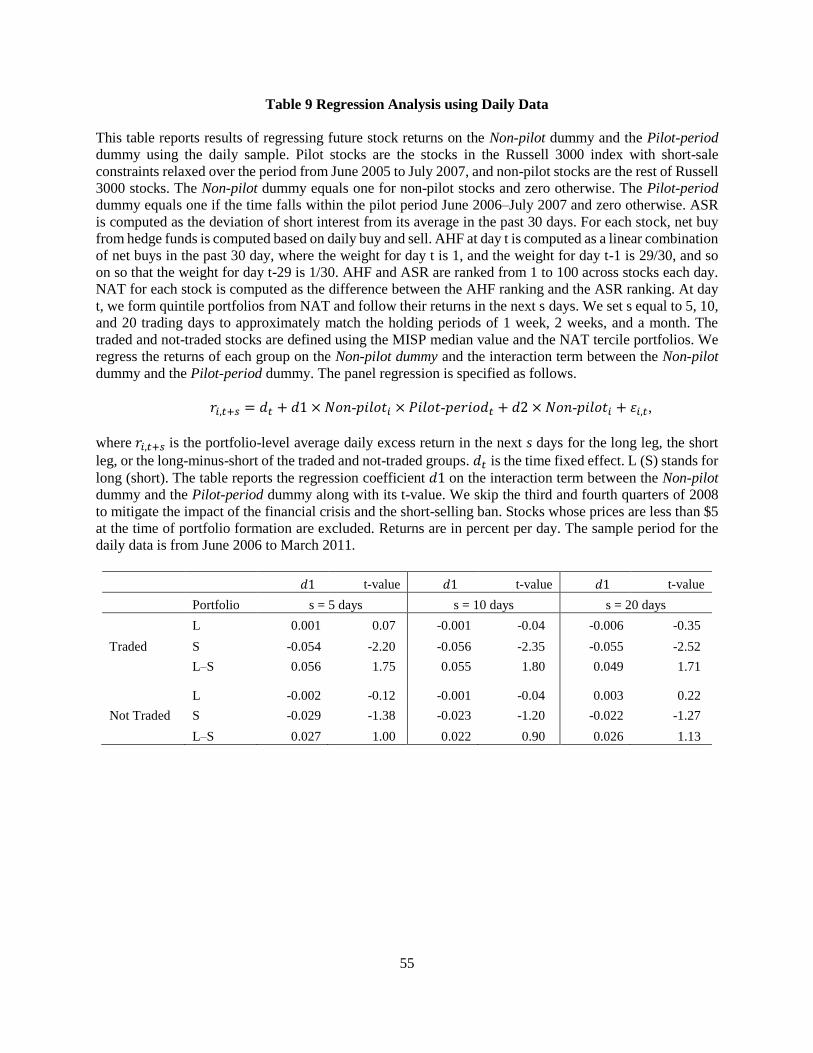
55
Table 9 Regression Analysis using Daily Data
This table reports results of regressing future stock returns on the Non-pilot dummy and the Pilot-period
dummy using the daily sample. Pilot stocks are the stocks in the Russell 3000 index with short-sale
constraints relaxed over the period from June 2005 to July 2007, and non-pilot stocks are the rest of Russell
3000 stocks. The Non-pilot dummy equals one for non-pilot stocks and zero otherwise. The Pilot-period
dummy equals one if the time falls within the pilot period June 2006–July 2007 and zero otherwise. ASR
is computed as the deviation of short interest from its average in the past 30 days. For each stock, net buy
from hedge funds is computed based on daily buy and sell. AHF at day t is computed as a linear combination
of net buys in the past 30 day, where the weight for day t is 1, and the weight for day t-1 is 29/30, and so
on so that the weight for day t-29 is 1/30. AHF and ASR are ranked from 1 to 100 across stocks each day.
NAT for each stock is computed as the difference between the AHF ranking and the ASR ranking. At day
t, we form quintile portfolios from NAT and follow their returns in the next s days. We set s equal to 5, 10,
and 20 trading days to approximately match the holding periods of 1 week, 2 weeks, and a month. The
traded and not-traded stocks are defined using the MISP median value and the NAT tercile portfolios. We
regress the returns of each group on the Non-pilot dummy and the interaction term between the Non-pilot
dummy and the Pilot-period dummy. The panel regression is specified as follows.
𝑟𝑖,𝑡+𝑠 = 𝑑𝑡 + 𝑑1 × 𝑁𝑜𝑛-𝑝𝑖𝑙𝑜𝑡𝑖 × 𝑃𝑖𝑙𝑜𝑡-𝑝𝑒𝑟𝑖𝑜𝑑𝑡 + 𝑑2 × 𝑁𝑜𝑛-𝑝𝑖𝑙𝑜𝑡𝑖 + 𝜀𝑖,𝑡,
where 𝑟𝑖,𝑡+𝑠 is the portfolio-level average daily excess return in the next s days for the long leg, the short
leg, or the long-minus-short of the traded and not-traded groups. 𝑑𝑡 is the time fixed effect. L (S) stands for
long (short). The table reports the regression coefficient 𝑑1 on the interaction term between the Non-pilot
dummy and the Pilot-period dummy along with its t-value. We skip the third and fourth quarters of 2008
to mitigate the impact of the financial crisis and the short-selling ban. Stocks whose prices are less than $5
at the time of portfolio formation are excluded. Returns are in percent per day. The sample period for the
daily data is from June 2006 to March 2011.
𝑑1 t-value 𝑑1 t-value 𝑑1 t-value
Portfolio s = 5 days s = 10 days s = 20 days
L 0.001 0.07 -0.001 -0.04 -0.006 -0.35
Traded S -0.054 -2.20 -0.056 -2.35 -0.055 -2.52
L–S 0.056 1.75 0.055 1.80 0.049 1.71
L -0.002 -0.12 -0.001 -0.04 0.003 0.22
Not Traded S -0.029 -1.38 -0.023 -1.20 -0.022 -1.27
L–S 0.027 1.00 0.022 0.90 0.026 1.13

56
Figure 1 Sample Coverage in the Number of Stocks and Market Capitalization
Figure (a) plots the number of stocks that have positive values of hedge fund holdings (HF), that have positive values of short interest (SR), that
have positive values of both HF and SR, and the total number of stocks in our sample at the end of each quarter, respectively. Hedge fund holdings
(HF) is defined as the ratio between the number of shares held by hedge funds and the number of shares outstanding. Short interest (SR) is defined
as the ratio between the number of shares shorted and the number of shares outstanding. Figure (b) plots market capitalization of these firms as a
fraction of total market capitalization of the CRSP universe over time. Our sample excludes stocks with share price less than $5 and market
capitalization below the 20th percentile size breakpoint of NYSE firms. The sample period is from 1990:Q1 to 2015:Q4.
800
1000
1200
1400
1600
1800
2000
2200
2400
(a) Number of Stocks
HF>0 SR>0 HF>0 and SR>0 Base Sample
80%
82%
84%
86%
88%
90%
92%
94%
96%
98%
100%
(b) Market Cap as Percentage of the CRSP Universe
HF>0 SR>0 HF>0 and SR>0
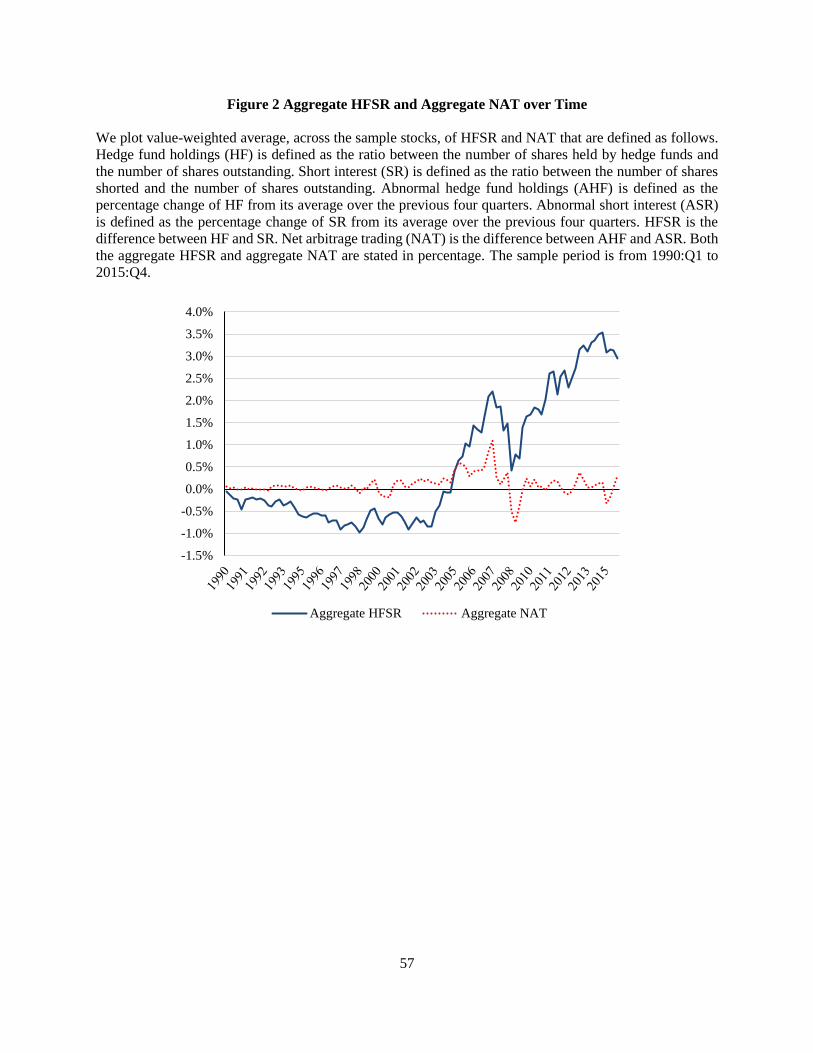
57
Figure 2 Aggregate HFSR and Aggregate NAT over Time
We plot value-weighted average, across the sample stocks, of HFSR and NAT that are defined as follows.
Hedge fund holdings (HF) is defined as the ratio between the number of shares held by hedge funds and
the number of shares outstanding. Short interest (SR) is defined as the ratio between the number of shares
shorted and the number of shares outstanding. Abnormal hedge fund holdings (AHF) is defined as the
percentage change of HF from its average over the previous four quarters. Abnormal short interest (ASR)
is defined as the percentage change of SR from its average over the previous four quarters. HFSR is the
difference between HF and SR. Net arbitrage trading (NAT) is the difference between AHF and ASR. Both
the aggregate HFSR and aggregate NAT are stated in percentage. The sample period is from 1990:Q1 to
2015:Q4.
-1.5%
-1.0%
-0.5%
0.0%
0.5%
1.0%
1.5%
2.0%
2.5%
3.0%
3.5%
4.0%
Aggregate HFSR Aggregate NAT
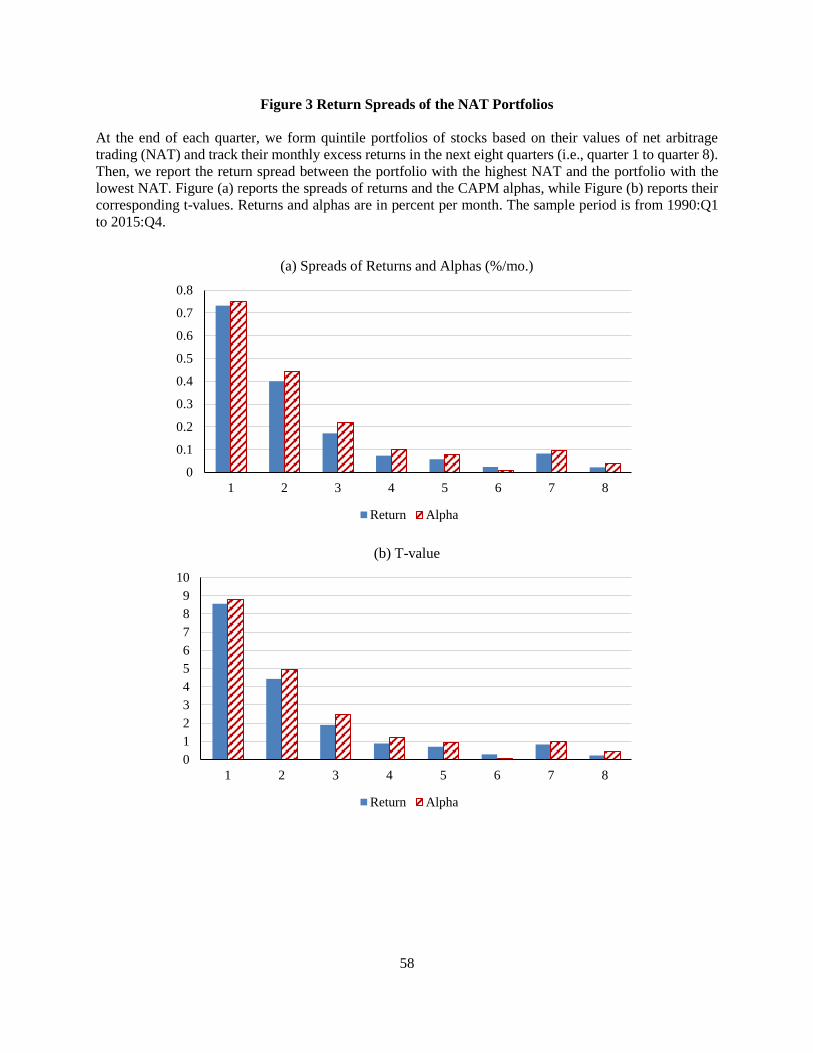
58
Figure 3 Return Spreads of the NAT Portfolios
At the end of each quarter, we form quintile portfolios of stocks based on their values of net arbitrage
trading (NAT) and track their monthly excess returns in the next eight quarters (i.e., quarter 1 to quarter 8).
Then, we report the return spread between the portfolio with the highest NAT and the portfolio with the
lowest NAT. Figure (a) reports the spreads of returns and the CAPM alphas, while Figure (b) reports their
corresponding t-values. Returns and alphas are in percent per month. The sample period is from 1990:Q1
to 2015:Q4.
0
0.1
0.2
0.3
0.4
0.5
0.6
0.7
0.8
1 2 3 4 5 6 7 8
(a) Spreads of Returns and Alphas (%/mo.)
Return Alpha
0
1
2
3
4
5
6
7
8
9
10
1 2 3 4 5 6 7 8
(b) T-value
Return Alpha

59
Figure 4 Cumulative Return based on NAT in the Daily Sample
This figure plots the cumulative return (in percent) of the high-minus-low (HML) NAT-quintile portfolio
return spread in the daily sample. ASR is computed as the deviation of short interest from its average in the
past 30 days. For each stock, net buy from hedge funds is computed based on daily buy and sell. AHF at
day t is computed as a linear combination of net buys in the past 30 days, where the weight for day t is 1,
and the weight for day t-1 is 29/30, and so on so that the weight for day t-29 is 1/30. AHF and ASR are
ranked from 1 to 100 across stocks each day. NAT for each stock is computed as the difference between
the AHF ranking and the ASR ranking. At day t, we form quintile portfolios from NAT and follow their
daily excess returns in the next 30 days. Stocks whose prices at the time of portfolio formation are less than
$5 are excluded. The sample is from June 2006 to March 2011.
0
0.1
0.2
0.3
0.4
0.5
0.6
0.7
0 5 10 15 20 25 30
Day
Cumulative Return (%) of HML NAT Portfolio
Related Documents