ARBA MINCH UNIVERSITY SCHOOL OF POST GRADUATE STUDIES DEPARTMENT OF HYDROLOGY AND WATER RESOURCE MANAGEMENT INVESTIGATION AND HYDROLOGICAL CHARACTERIZATION OF SURFACE WATER STORAGE OPTIONS IN THE UPPER BLUE NILE Case Study of Koga and Gomit Dam By Fuad Abdo Yassin 08/24/2009

Welcome message from author
This document is posted to help you gain knowledge. Please leave a comment to let me know what you think about it! Share it to your friends and learn new things together.
Transcript

ARBA MINCH UNIVERSITY
SCHOOL OF POST GRADUATE STUDIES
DEPARTMENT OF HYDROLOGY AND WATER RESOURCE MANAGEMENT
INVESTIGATION AND HYDROLOGICAL CHARACTERIZATION OF
SURFACE WATER STORAGE OPTIONS IN THE UPPER BLUE NILE
Case Study of Koga and Gomit Dam
By Fuad Abdo Yassin
08/24/2009

[IDENTIFICATION AND HYDROLOGICAL CHARACTERIZATION OF SURFACE WATER STORAGE IN UBN] 2009
Arba Minch University | II
INVESTIGATION AND HYDROLOGICAL
CHARACTERIZATION OF SURFACE WATER STORAGE
OPTIONS IN THE UPPER BLUE NILE
By Fuad Abdo Yassin
A Dissertation Submitted in Partial Fulfillment of the Requirements
for the Degree of Master of Science (Engineering) of the Arba Minch
University
Arba Minch University
August 2009

[IDENTIFICATION AND HYDROLOGICAL CHARACTERIZATION OF SURFACE WATER STORAGE IN UBN] 2009
Arba Minch University | III
CERTIFICATION
The undersigned certifies that he has read the dissertation entitled
Investigation and hydrological characterization of water storage options
in the Upper Blue Nile and hereby recommend for acceptance by the Arba
Minch University in partial fulfillment of the requirements for the degree of
Master of Science (Engineering).
______________________________
Dr. Matthew McCartney
(SUPERVISOR)
Date ________________________________
______________________________
Ato Fisseha Behulu
(Co-SUPERVISOR)
Date ________________________________

[IDENTIFICATION AND HYDROLOGICAL CHARACTERIZATION OF SURFACE WATER STORAGE IN UBN] 2009
Arba Minch University | IV
DECLARATION
I, Fuad Abdo Yassin, declare that this dissertation is my own original work and that it has
not been presented and will not be presented by me to any other University for similar or
any other degree award.
Signature: ________________________________
This dissertation is copyright material protected under the Berne convention, the copyright
Act 1999 and other international and national enactments, in that behalf, on intellectual
property. It may not be reproduced by any means, in full or in part, except for short
extracts in fair dealing, for research or private study, critical scholarly review or discourse
with an acknowledgement, without written permission of the Directorate of Postgraduate
Studies, on behalf of both the author and Arba Minch University.
[IDENTIFICATION AND HYDROLOGICAL CHARACTERIZATION OF SURFACE WATER STORAGE IN UBN] 2009
Arba Minch University | V
ABSTRACT
The aim of this study was to summarize potential surface water storage on natural lakes and on existing
and planned Irrigations, hydropower and multipurpose projects in the upper Blue Nile (UBN). Daily
rainfall runoff modeling and reservoir simulation was conducted using HEC-HMS. The Koga and Gomit
storage dams were assessed in terms of Reliability, Resilience and Vulnerability (RRV) performance
criteria under both existing and hypothetical future climate conditions.
Existing storage in the UBN comprises natural lakes (28 BCM), as well as artificial storage formed by a
weir (9.1 BCM), small (6.1 MCM) and large dams (873.1 MCM). Future storage for ongoing and planned
irrigation, hydropower and multipurpose projects totals 79.6 BCM.
A Digital Elevation Model (DEM) of the study area was used to extract the physical characteristics of
watersheds using Arc-Hydro and the Geospatial Hydrologic Model Extension HEC-GeoHMS. Then in HEC-
HMS, six and four years of hydrological and climatic time series data were used for Koga calibration and
validation respectively and two years of reservoir level data was used for Gomit calibration.
Simulation was conducted with two sets of models: first the Deficit–Constant loss model, Snyder UH
model and monthly constant base flow model: second the Deficit –Constant loss model, SCS UH model,
and monthly constant base flow model.
According to Nash and Sutcliffe Model Efficiency (NSE), Pearson’s Coefficient of Determination (R^2) and
percent difference for a quantity (D) criteria the first model set was found to be the best model
combination. The NSE, R^2 and D result for the Koga calibration period were 60.6%, 0.61 and 0.03 and
for the validation periods were 61.3%, 0.62 and 0.19 respectively. NSE and R2 for Gomit were 61.3% and
0.67 respectively. Using the calibrated parameters, the Koga and Gomit reservoirs were simulated on a
daily time-step for 20 and 10 years of historical data respectively. This was done, to determine the
availability of water to meet the irrigation demand requirements, hydropower requirement (only Koga)
and to maintain environmental flow requirements. The simulation of storage gives RRV value of 0.982,
0.024 and 53 for Koga and RRV value of 0.95, 0.0324, and 71 for Gomit.
The effect of hypothetical rainfall changes -20% to +20% on the RRV value of on the Koga and Gomit
storage dam were determined.RRV of Gomit varied from 0.874, 0.0164, and 88 to 0.979, 0.055, and 44.
Similarly, Koga varied from 0.968, 0.02, and 64 to 0.979, 0.031, and 39.

[IDENTIFICATION AND HYDROLOGICAL CHARACTERIZATION OF SURFACE WATER STORAGE IN UBN] 2009
Arba Minch University | VI
Acknowledgement
Primarily, I would like to extend my heartfelt acknowledgement for Arba Minch Water Technology
Institute who provides me the chance to carry out my graduate study in Arba Minch University.
Furthermore, Special thanks to the International Water Management Institute (IWMI) for giving me the
opportunity of doing my dissertation paper under project “Rethinking water storage for climate change
adaptation in sub-Saharan Africa “and funding me to do so.
I also forwarded my sincere thanks to my Advisor, Dr. Matthew McCartney, for his dedicated assistance
and professional guidance on the entire process of this thesis work. Without him, this research work
would not have this final form. In addition, I would like to thank my co-advisor Ato Fisseha Behulu for his
wonderful follow up and continuous support.
Finally, my gratitude go to the Ministry of Water Resources, particularly for staff members under the
Department of Hydrology and Data Base, GIS and Library, for their considerable support in providing me
hydrological data and other relevant reference materials. In addition, my gratitude goes to National
Metrological Agency (NMA) who provides me metrological data.

[IDENTIFICATION AND HYDROLOGICAL CHARACTERIZATION OF SURFACE WATER STORAGE IN UBN] 2009
Arba Minch University | VII
TABLE OF CONTENTS
CERTIFICATION _______________________________________________ III
DECLARATION ________________________________________________ IV
ABSTRACT ___________________________________________________ V
Acknowledgement _____________________________________________ VI
LIST OF ACRONYMS ___________________________________________ X
LIST OF FIGURES______________________________________________ XI
LIST OF TABLES _____________________________________________ XIII
CHAPTER ONE ________________________________________________ 1
1. INTRODUCTION ................................................................................................................................ 1
1.1 Back Ground ....................................................................................................................................... 1
1.2 Potential Surface Water Storage Opportunities .................................................................................. 1
1.3 Problem Statement .............................................................................................................................. 4
1.4 Objectives of the study ........................................................................................................................ 4
1.4.1 General Objective ........................................................................................................................ 4
1.4.2 Specific Objectives ...................................................................................................................... 4
CHAPTER TWO________________________________________________ 6
2. DESCRIPTION OF THE STUDY AREA ............................................................................................ 6
2.1 Description of Upper Blue Nile .......................................................................................................... 6
2.2 Physical Features of Gomit ................................................................................................................. 7
2.3 The Physical Features of Koga Dam ................................................................................................. 10
CHAPTER THREE _____________________________________________ 13
3. LITRATURE REVIEW ...................................................................................................................... 13
3.1 POTENTIAL SURFACE WATER STORAGE OPPORTUNITIES ON UBN ............................... 13
3.1.1 Surface Water Storage Option on Existing Dams ...................................................................... 13
3.1.2. Water Storage Option on Natural Lakes ................................................................................... 15
3.1.3. Water Storage in the Future Water Resource Development on Upper Blue Nile Basin ........... 17
3.2 General Description of all Software used for this study ................................................................... 22
3.2.1 GIS ............................................................................................................................................. 22
3.2.2 Arc-Hydro .................................................................................................................................. 22
3.2.3 HEC-GeoHMS ........................................................................................................................... 22
3.2.4 HEC-DSS Microsoft Excel Data Exchange Add-In .................................................................. 23
3.2.5 HEC-HMS Modeling ................................................................................................................. 23

[IDENTIFICATION AND HYDROLOGICAL CHARACTERIZATION OF SURFACE WATER STORAGE IN UBN] 2009
Arba Minch University | VIII
3.2.6 Model Performance .................................................................................................................... 32
3.2.7 Reservoir Performance ............................................................................................................... 33
CHAPTER FOUR ______________________________________________ 36
4. METHODOLOGIES AND PROCEDURES ...................................................................................... 36
4.1 Terrain Preprocessing ....................................................................................................................... 36
4.2 Generation of SCS Curve Number Grid ........................................................................................... 40
4.3 Basin Model Development Using HEC-Geo-HMS .......................................................................... 41
4.3.1 Hydrographic Features ............................................................................................................... 41
4.3.2 GeoHMS Data Processing ......................................................................................................... 41
4.4 HEC-HMS model Development ....................................................................................................... 43
4.4.1 Basin Model ............................................................................................................................... 44
4.4.2 Meteorological Model ................................................................................................................ 45
4.4.3 Control Specification Model ...................................................................................................... 45
4.4.4 Model Parameter Calibrations and Validations ......................................................................... 45
4.4.5 Model Performance .................................................................................................................... 46
4.4.6 Calibration and Validation Performance .................................................................................... 46
4.4.7 Reservoir Simulation.................................................................................................................. 46
4.4.8 Climate Scenarios ...................................................................................................................... 47
CHAPTER FIVE _______________________________________________ 49
5. DATA AND ANALYSIS ................................................................................................................... 49
5.1 Hydrological Data ............................................................................................................................. 49
5.2 Meteorological Data .......................................................................................................................... 50
5.3 Missing Data Filling ......................................................................................................................... 52
5.4 Checking Consistency and Homogeneity ......................................................................................... 52
5.5 Irrigation and Downstream Release Data ......................................................................................... 53
5.5 DEM (Digital Elevation Model) ....................................................................................................... 55
5.6 Land Use, Land Cover, Soils ............................................................................................................ 55
5.6.1 Koga Soil and Land use ............................................................................................................. 55
5.6.2 Gomit Soil and Land Use ........................................................................................................... 57
CHAPTER SIX ________________________________________________ 59
6 RESULT AND DISSCUSION ............................................................................................................ 59
6.1 HEC-HMS Results ............................................................................................................................ 59
6.1.1 Calibration and Verification Result ........................................................................................... 59
6.1.2. Reservoir Simulation................................................................................................................. 64

[IDENTIFICATION AND HYDROLOGICAL CHARACTERIZATION OF SURFACE WATER STORAGE IN UBN] 2009
Arba Minch University | IX
CHAPTER SEVEN _____________________________________________ 68
CONCLUSION AND RECOMMENDATION ...................................................................................... 68
7.1 Conclusion ........................................................................................................................................ 68
7.2 Recommendation .............................................................................................................................. 70
REFERENCES ________________________________________________ 71
APPENDICES ________________________________________________ 73
APPENDIX A: Location of Meteorological station ............................................................................... 73
APPENDIX B.1: List of Projects ............................................................................................................ 74
Appendix B.1: Proposed Irrigation projects on the UBNB .................................................................... 75
Appendix B.2: Proposed multipurpose projects on the UBNB ............................................................... 76
Appendix B.3: Major planned hydropower schemes on UBNB ............................................................. 77
Appendix C.1: HEC-HMS model components and categorization ........................................................ 78
Appendix C.2: Calibration parameter constraints ................................................................................... 79
Appendix D.1: Gomit Elevation, Area and Capacity Curves ................................................................. 80
Appendix D.2: Koga Elevation, Area and Capacity Curves ................................................................... 81
Appendix D.3: Koga CN LOOKUP table ............................................................................................... 82
Appendix D.4: Gomit CN LOOKUP table ............................................................................................. 82
Appendix E.1: Koga Optimized Parameter Results ............................................................................... 83
Appendix E.2: Koga Optimized Parameter Results ............................................................................... 84
Appendix E.3: Gomit Optimized Parameter Results ............................................................................. 84
Appendix F.1: Runoff curve numbers for other agricultural lands ......................................................... 85
Appendix F.2: Runoff curve numbers for cultivated agricultural lands ................................................. 86
Appendix G.1: Double mass curve plots of the stations ........................................................................ 87

[IDENTIFICATION AND HYDROLOGICAL CHARACTERIZATION OF SURFACE WATER STORAGE IN UBN] 2009
Arba Minch University | X
LIST OF ACRONYMS
UBN Upper Blue Nile River Basin
WAPCOS Water and Power Consultancy Services
BCEOM French Consultants Company
BCM Billion Cubic Meter
ITCZ Inter-Tropical Convergence Zone
HEC GEOHMS Hydrologic Engineering Center Geospatial Hydrologic modeling Extension
HEC-HMS Hydrologic Engineering Center-Hydrologic Modeling System
DEM Digital Elevation Model
HEC-DSS Hydrologic Engineering Center Data Storage System
SCS Soil Conservation Service
SSR Sum of squared residual
PEV Percent error in volume
USACE United States Army Corps of Engineers
NSE Nash and Sutcliff Efficiency
Co-SAERAR Commission for Sustainable Agricultural and Environmental Rehabilitation in
Amhara Region
GIS Geographic Information System
CN Curve Number
MoWR Ministry of Water Resources
NMA National Meteorological Agency
DcSMc Deficit constant, Snyder and Monthly constant base flow
DcSCSMc Deficit constant, SCS and Monthly constant base flow
EEPCo Ethiopian Power Corporations
ETO Potential Evapotranspiration
FAO Food and Agriculture Organization
USBR United State Bureau of Reclamation
WMO World Meteorological Organization

[IDENTIFICATION AND HYDROLOGICAL CHARACTERIZATION OF SURFACE WATER STORAGE IN UBN] 2009
Arba Minch University | XI
LIST OF FIGURES
Figure 1.1 Water Storage Classification Approaches ................................................................................... 3
Figure 1.2 Layout of data base and HEC-HMS .............................................................................................. 5
Figure 2.1: Study Area .................................................................................................................................. 6
Figure 2.2: Gomit Dam .................................................................................................................................. 7
Figure 2.3: Gomit reservoir characteristics ................................................................................................... 9
Figure 2.4: Contour developed from the Bathymetric data .......................................................................... 9
Figure 2.5: Koga Dam ................................................................................................................................. 10
Figure 2.6: Koga reservoir characteristics ................................................................................................... 11
Figure3.1: Chara-Chara weir ...................................................................................................................... 14
Figure 3.2: satellite image of the Lake. ....................................................................................................... 15
Figure 3.3: Distribution of water storage potential in the Abbay basin ..................................................... 18
Figure 3.4: Spatial distributions with storage size scale of irrigation projects .......................................... 19
Figure 3.5: Spatial distributions with storage size scale of multipurpose projects ..................................... 20
Figure 3.6: Spatial distributions with storage size scale of multipurpose projects ..................................... 21
Figure 3.7 Typical HEC-HMS representation of watershed runoff (USACE, 2000) ...................................... 24
Figure 4.1 Terrain Preprocessing for Koga catchment…………………………………………………………………………….38
Figure4.2: Terrain Preprocessing for Gomit catchment .............................................................................. 39
Figure 4.3: Koga CN grid ............................................................................................................................. 40
Figure 4.4: Gomit CN grids .......................................................................................................................... 41
Figure 4.5: HMS representation of Koga catchment ................................................................................... 42
Figure 4.6: HMS representation of Gomit catchment ................................................................................ 43
Figure 5.1: Monthly flow year-to-year variation ......................................................................................... 49
Figure 5.2: Average annual rainfalls ........................................................................................................... 51
Figure 5.2: Merawi Double mass curves ..................................................................................................... 53
Figure 5.3: Mekane Yesus Double Mass curve ............................................................................................ 53
Figure 5.4: Koga soil grids ........................................................................................................................... 55
Figure 5.5: Koga land use grid..................................................................................................................... 56
Figure 5.6: Gomit watershed Soil and land use grid ................................................................................... 57
Figure 6.1 Calibration of observed and simulated daily and monthly hydrograph of Koga watershed ..... 61

[IDENTIFICATION AND HYDROLOGICAL CHARACTERIZATION OF SURFACE WATER STORAGE IN UBN] 2009
Arba Minch University | XII
Figure 6.2 Validation of observed and simulated daily and monthly hydrograph of Koga watershed ...... 61
Figure 6.3 Scatter plot of observed and simulated discharge for Koga watershed .................................... 62
Figure 6.4 Scatter plot of observed and simulated discharge for Koga watershed .................................... 62
Figure 6.5 Gomit reservoir level daily and monthly calibrations ................................................................ 63
Figure 6.6: Koga HEC-HMS reservior simulation ......................................................................................... 65
Figure 6.7: HEC-HMS output graph of Gomit reservior simulation ............................................................. 66
[IDENTIFICATION AND HYDROLOGICAL CHARACTERIZATION OF SURFACE WATER STORAGE IN UBN] 2009
Arba Minch University | XIII
LIST OF TABLES
Table 1.1 Storage Classifications .................................................................................................................. 2
Table 2.1: Salient Features of the Gomit dam .............................................................................................. 8
Table 2.2: Salient Features of the Koga damMott Macdonald (MM) interim Report ................................ 12
Table 3.1: Water storage options on existing hydropower structure in the Blue Nile catchment .............. 14
Table 3.2: Water storage options on existing small-scale irrigation schemes in the Blue Nile .................. 15
Table 3.3 SCS soil groups and infiltration (loss) rates (SCS, 1986; Skaggs and Khaleel, 1982) ................... 26
Table 4.1 Gomit basin characteristics ......................................................................................................... 43
Table 4.2 a) and b) Koga basin characteristics ........................................................................................... 43
Table 4.3: HMS element .............................................................................................................................. 44
Table 5.1: Evaporation and rainfall ............................................................................................................. 51
Table 5.2: open water evaporation ............................................................................................................. 52
Table 5.3: Gomit Crop water requirements ................................................................................................ 54
Table 5.4: Koga crop water requirements ................................................................................................... 54
Table 5.5: Koga Soil data ............................................................................................................................ 56
Table 5.6: land Use grids ............................................................................................................................. 57
Table 5.7: Gomit Soil ................................................................................................................................... 58
Table 5.8: Gomit Land use ........................................................................................................................... 58
Table 6.1 Koga objective function result ..................................................................................................... 59
Table 6.2 Gomit calibration summery table................................................................................................ 60
Table 6.3: Reservior simulation result for Irrigation over the period 1987 to 2006 .................................... 64
Table 6.4: Reservior simulation result for Hydropower .............................................................................. 65
Table 6.5: Gomit reservior simulation result for Irrigation ......................................................................... 66

CHAPTER ONE
1. INTRODUCTION
1.1 Back Ground
The Blue Nile drains a large area of the Ethiopian Highlands and is the largest tributary of the Nile River,
providing a vital source of fresh water to the downstream riparian users, Sudan and Egypt. To date,
however, there have been very few published studies on the Upper Blue Nile.
As the world fresh water is becoming scarce and countries are moving from normal to water stressed
conditions, it is important to quantify the local, global and regional availability of surface water storage.
The availability of water in many countries with shared watercourse is not well quantified. Without
adequate knowledge of the surface water storage, sustainable water utilization of shared watercourses
will always be constrained by lack of adequate data and information. However, in most instances,
quantification of available water from catchments and watersheds of large river basins is costly and time
consuming. Therefore, estimation techniques become paramount importance. In view of this study
attempted to: i) contribute towards identification and classification of the surface water storage and ii)
asses the performance of surface water storage of the Upper Blue Nile (UBN).
Surface water storage is used to store water during periods of excess for use during periods of limited
availability In order to mitigate current or future impacts on stream flows, provide new water supply,
and potentially improve habitat.
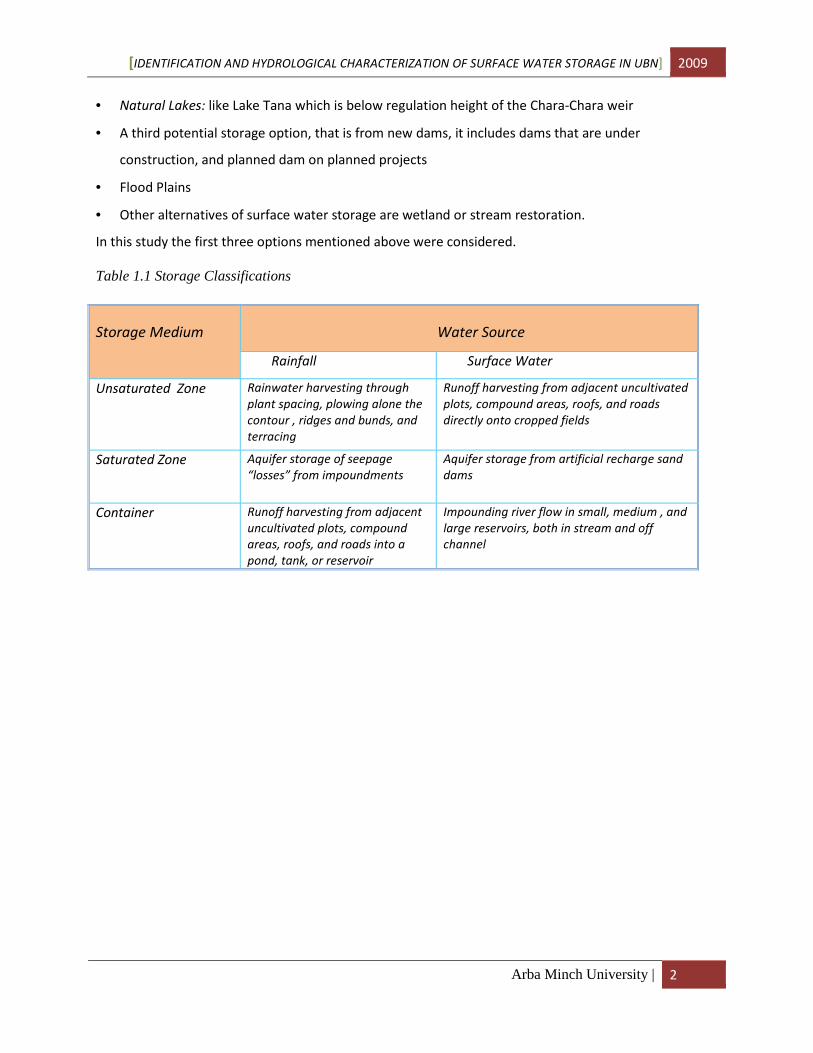
1.2 Potential Surface Water Storage Opportunities
Potential surface water storage includes on-channel and off-channel reservoirs, small impoundments,
underground reservoirs and wetlands. Table 1.1and figure 1.1a and b, shows the approach for general
classification of storage.
On-channel reservoirs are located on the mainstream of a river or stream and filled by the flow from an
upstream watershed. Off-channel reservoirs are located completely off stream and are filled by overland
flow or water pumped from a nearby source. Small impoundments in natural depressions, oxbows, or
small surface ponds need to be implemented on a basin-wide basis in order to provide the greatest
benefit. (Spokane County, January 2009)
• Existing Dams: like Chara-Chara weir on Lake Tana, Finchaa dam, and small dams for small-scale
irrigation schemes.
[IDENTIFICATION AND HYDROLOGICAL CHARACTERIZATION OF SURFACE WATER STORAGE IN UBN] 2009
Arba Minch University | 2
• Natural Lakes: like Lake Tana which is below regulation height of the Chara-Chara weir
• A third potential storage option, that is from new dams, it includes dams that are under
construction, and planned dam on planned projects
• Flood Plains
• Other alternatives of surface water storage are wetland or stream restoration.
In this study the first three options mentioned above were considered.
Table 1.1 Storage Classifications
Storage Medium Water Source
Rainfall Surface Water
Unsaturated Zone Rainwater harvesting through
plant spacing, plowing alone the
contour , ridges and bunds, and
terracing
Runoff harvesting from adjacent uncultivated
plots, compound areas, roofs, and roads
directly onto cropped fields
Saturated Zone Aquifer storage of seepage
“losses” from impoundments
Aquifer storage from artificial recharge sand
dams
Container Runoff harvesting from adjacent
uncultivated plots, compound
areas, roofs, and roads into a
pond, tank, or reservoir
Impounding river flow in small, medium , and
large reservoirs, both in stream and off
channel

[IDENTIFICATION AND HYDROLOGICAL CHARACTERIZATION OF SURFACE WATER STORAGE IN UBN] 2009
Arba Minch University | 3
Figure 1.1 a and b approaches for storage classification
a)
b)

[IDENTIFICATION AND HYDROLOGICAL CHARACTERIZATION OF SURFACE WATER STORAGE IN UBN] 2009
Arba Minch University | 4
1.3 Problem Statement
The availability of surface water storage in different countries with shared watercourse is often not well
quantified. Earlier studies in the Blue Nile river basin shows different surface water storage amounts as
documented in USBR, WAPCOS, BECOMS, and SMEC etc. Though they have followed different
approaches, there are quite considerable differences on the quantity of accessible water resources
identified. In addition, the unevenness between supply and demand of water has overstressed the
environment. Pressure on water resources in the Blue Nile Basin is likely to increase dramatically in the
near future as a result of high population growth in all the riparian states (i.e. Ethiopia and Sudan), and
increasing development related water needs. However, in spite of the national and international
importance of the region, relatively few studies have been conducted and there is only a limited
understanding of the basin’s detailed climatic, hydrological, topographic and hydraulic characteristics
(Johnson and Curtis 1994; Conway 1997).
An increase in rainfall variability translates directly into variation in water availability with potentially
adverse impacts on the livelihoods of beneficiaries. Therefore, appropriate determination and
documentation of schemes of surface water storage in Blue Nile River Basin with their characterization
and performance are indispensable for proper scheduling and consumption of available resources in the
context of adaptation to climate change.
1.4 Objectives of the study
1.4.1 General Objective
The foremost objective of the study is to assess the potentials of the different surface water storage
types and hydrological characterization of surface water storage in the UBN.
1.4.2 Specific Objectives
� Identify and classify the existing surface water storage schemes in the region
� Characterize and asses the performance of selected water storage types using appropriate
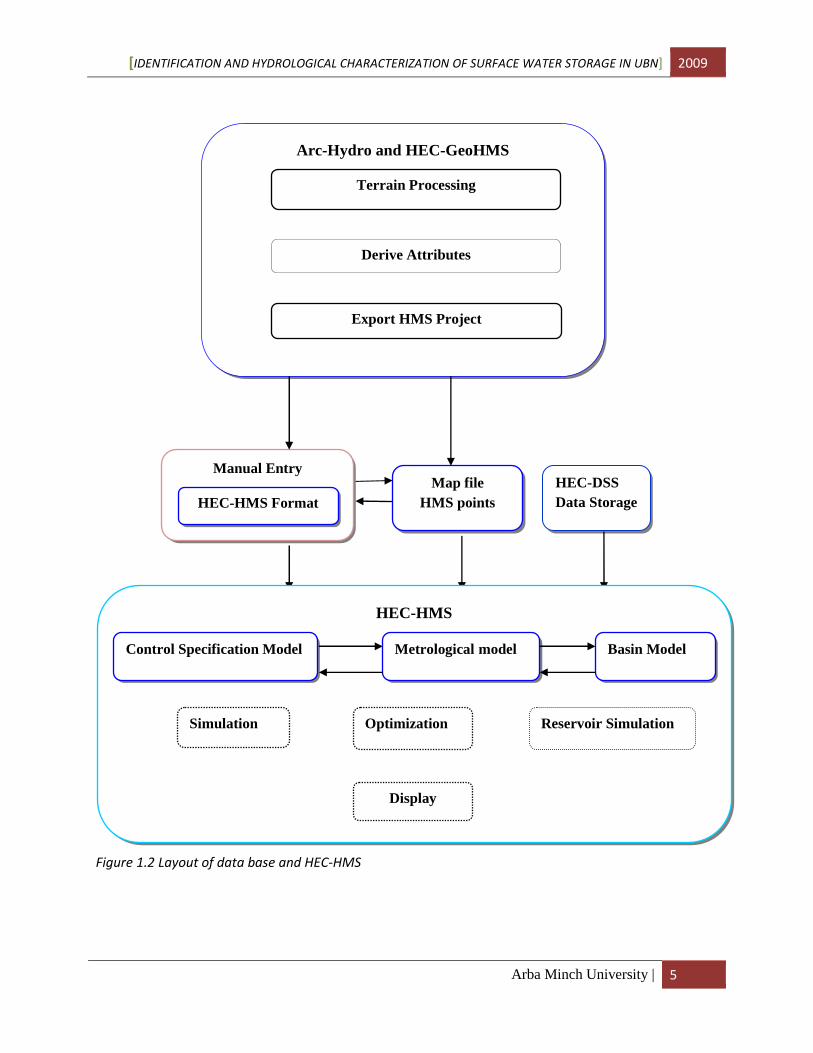
hydrological model (s). The layout model used shown in figure 1.2 and its detail description
is presented in methodology part (chapter four).
� Develop quantifiable indicators that allow comparison of various storage options and
analyze their future trends in terms of performance indices (technical, socio-economical,
environmental)
[IDENTIFICATION AND HYDROLOGICAL CHARACTERIZATION OF SURFACE WATER STORAGE IN UBN] 2009
Arba Minch University | 5
Figure 1.2 Layout of data base and HEC-HMS
HEC-DSS Data Storage
Arc-Hydro and HEC-GeoHMS
Export HMS Project
Terrain Processing
Derive Attributes
HEC-HMS
Manual Entry
HEC-HMS Format Map file
HMS points
Control Specification Model Metrological model Basin Model
Optimization Simulation
Display
Reservoir Simulation
[IDENTIFICATION AND HYDROLOGICAL CHARACTERIZATION OF SURFACE WATER STORAGE IN UBN] 2009
Arba Minch University | 6
CHAPTER TWO
2. DESCRIPTION OF THE STUDY AREA
2.1 Description of Upper Blue Nile
The Upper Blue Nile lies in west Ethiopia between latitudes of 7o 45`N and 12
o 46`N; and longitudes of
34o 05’E and 39
o 45’ E. The basin has a catchment area of about 199,812 km
2 at the border with Sudan,
covering parts of Amhara, Oromiya and Benishangul- Gumuz Regional states. It covers about 17.5 per
cent of Ethiopia’s land area, about 50% of its total average annual runoff and 25 % of its population.
The Abbay basin accounts for a major share of the country’s irrigation and hydropower potential. It has
an irrigation potential of 815,581 ha and a hydro potential of 78,820 GWH/yr. The basin has an average
annual run-off estimated to 54.8 BCM (Awlachew et.al. 2007).
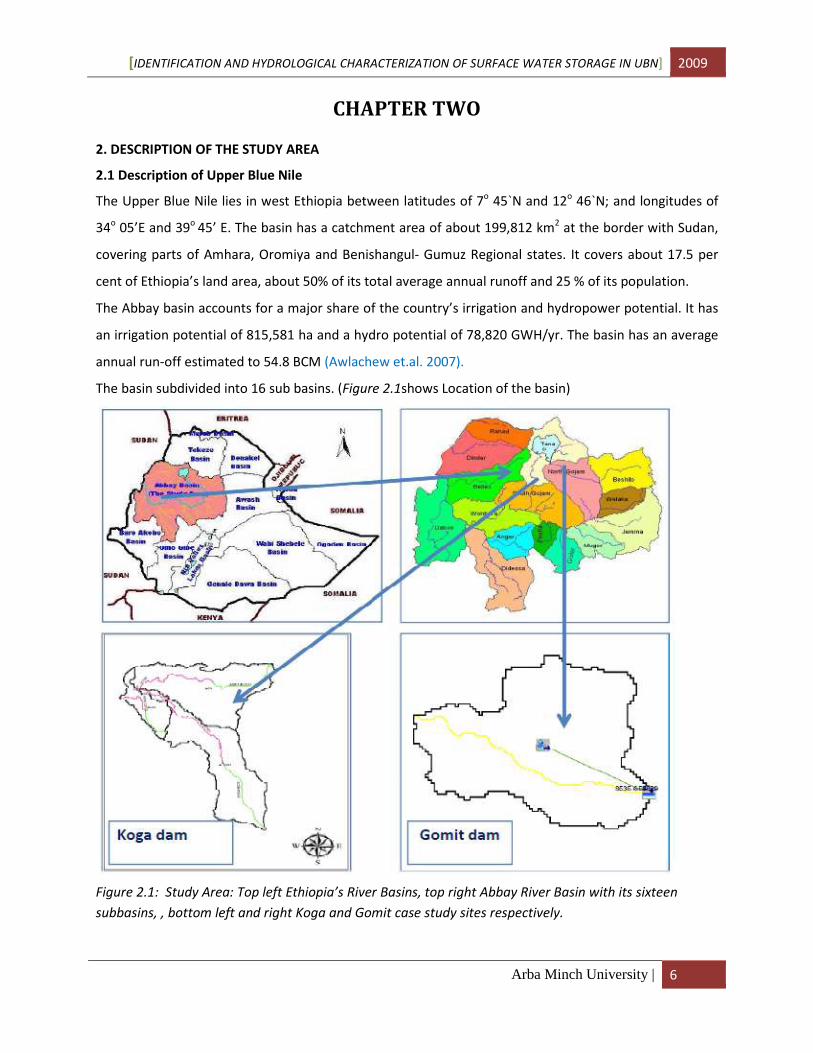
The basin subdivided into 16 sub basins. (Figure 2.1shows Location of the basin)
Figure 2.1: Study Area: Top left Ethiopia’s River Basins, top right Abbay River Basin with its sixteen
subbasins, , bottom left and right Koga and Gomit case study sites respectively.
[IDENTIFICATION AND HYDROLOGICAL CHARACTERIZATION OF SURFACE WATER STORAGE IN UBN] 2009
Arba Minch University | 7
An altitude ranging from 590 meters to more than 4000 meters dominates the climate of Abbay basin.
The influence of this factor determines the variation in local climates ranging from hot to desert-like
climate along the Sudan boarder, to temperate on the high plateau, and cold on the mountain peaks.
The annual rainfall varies between about 800mm to 2,220 mm with a mean of about 1420mm. (Master
Plan of UBNRB – Main Report, 1999)
The highest temperatures are observed in the northwestern part of the basin, in parts of Rihad, Dinder,
Beles and Dabus sub basins. The maximum temperature being 28oC - 38
oC and minimum temperature
15 oC – 20
o C. Lower temperatures are observed in the highlands of Ethiopia in the central and eastern
part of the basin. The maximum and minimum temperature ranges from 12 oC – 20
oC and -1
oC to 8
oC
respectively. (A. Denekew, Awlachew, January 2009)
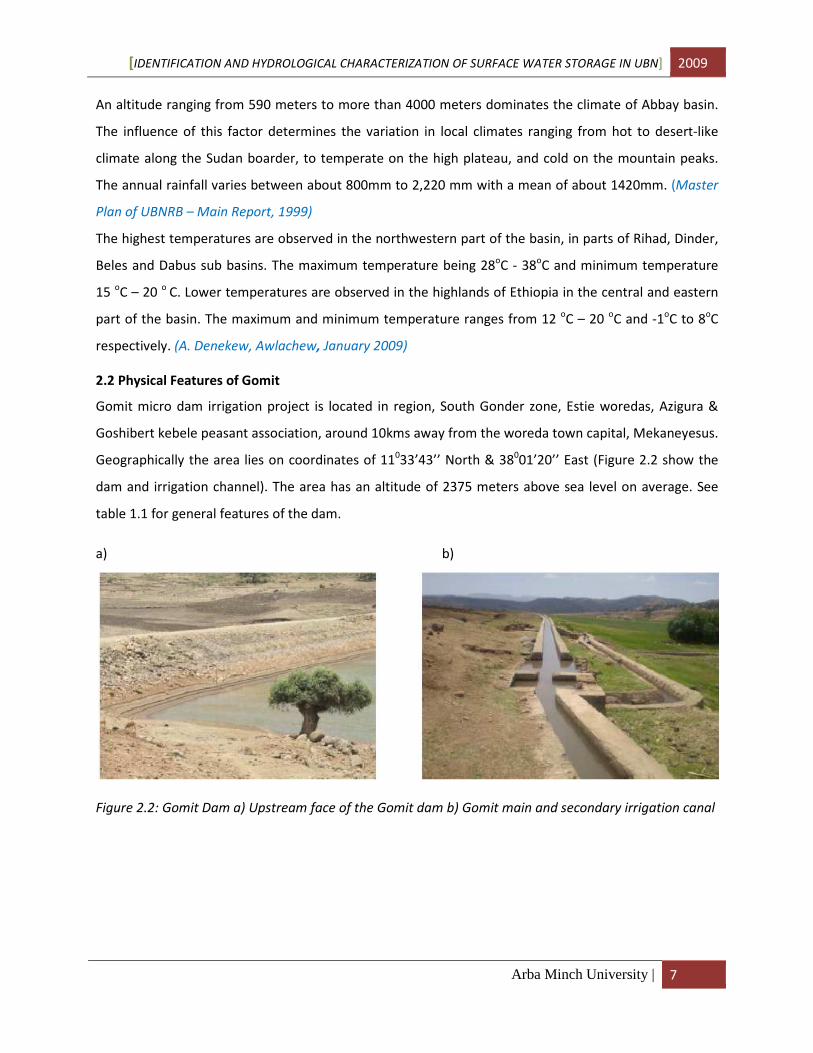
2.2 Physical Features of Gomit
Gomit micro dam irrigation project is located in region, South Gonder zone, Estie woredas, Azigura &
Goshibert kebele peasant association, around 10kms away from the woreda town capital, Mekaneyesus.
Geographically the area lies on coordinates of 11033’43’’ North & 38
001’20’’ East (Figure 2.2 show the
dam and irrigation channel). The area has an altitude of 2375 meters above sea level on average. See
table 1.1 for general features of the dam.
a) b)
Figure 2.2: Gomit Dam a) Upstream face of the Gomit dam b) Gomit main and secondary irrigation canal

[IDENTIFICATION AND HYDROLOGICAL CHARACTERIZATION OF SURFACE WATER STORAGE IN UBN] 2009
Arba Minch University | 8
Table 2.1: Salient Features of the Gomit dam
Features
Dam type Zoned earth embankment dam of 20m height and 324m crest
length with side slopes of 2:1 and 2.5:1 in u/s and d/s
directions respectively
Catchment area 23.43 km2
Command Area 90ha
Storage features Normal pool level = 2367 masl
Total reservoir volume = 73.964x10⁴ m
3
Inundated reservoir area = 22.91 ha
Expected Yield 10.61 Mm3
Beneficiaries 360 HH
Spilway features Max design flood = 87.84m3/s
Crest length = 25m
Climate Mean annual rainfall = 1642.91mm
Mean annual air temperature =16.4oc
Sediment load for 23 years 28.11 ha.m = 281100 m3
Source: Salient Features of Projects Regional Water Resource Bureau, Bahir Dar
The rainfall pattern in the area is characterized by one single rainy season with high amount between
June and September. Mean annual rainfall is 1414mm. Daily temperature varies between 14.2 0C in July
and 17.8 0C on April month. (Co-SARAR Gomit micro dam irrigation agronomy feasibility report, 2000)
The project area is characterized by mountains, ragged and plain lands amounting 45.3%, 17.0% and
37.6% respectively. Mountainous areas but used for grazing purpose and some used for crop
production. With regard to the nature of the command area it is almost gently sloping and regular in its
nature having a slope of about 0-4 % approximately.
The soil resource of command area is endowed with deep up to very deep (90-150cm) stone free and a
good moisture regime or holding capacity as compared to other area of the project surrounding. Major
and dominant soil types identified in the watershed are Calcic Xerosols Eutric Regosols
On the banks of the Gomit river in the reservoir area near to the dam axis water leaks in between the
clay soil and rock formation and Gomit River itself has base flow and this flow increase downstream side
unit it joins the Wanka River. From the above observation, test pit data and characteristics of the
surrounding rock, which is highly vesiculated and weathered basalt rock, and this rock may serve as an
aquifer for surrounding area. (Co-SARAR Gomit micro dam geological feasibility report, 2000)
Gomit Dam has a full supply level of 2367 m, and a maximum storage of 73.964x10⁴ m
3. Appendix C.1
and figure 2.3 shows detail of the reservoir characteristics. Moreover, contour developed from
bathymetric data shown in figure 2.4.

[IDENTIFICATION AND HYDROLOGICAL CHARACTERIZATION OF SURFACE WATER STORAGE IN UBN] 2009
Arba Minch University | 9
Figure 2.3: Gomit reservoir characteristics
Source: Salient Features of Projects Regional Water Resource Bureau, Bahir Dar
Figure 2.4: Contour developed from the Bathymetric data
Source: Salient Features of Projects Regional Water Resource Bureau, Bahir Dar
00.0
6
0.1
6
0.2
7
0.5
4
0.9
2
1.4
4
1.8
9
3.3
3
4.7
6.0
9
7.5
3
9.1
3
11
.07
13
.1
14
.91
16
.04
17
.16
18
.29
18
.74
19
.41
20
.39
21
.52
21
.86
24
.5
25
.5
27
.29
29
.61
2340
2345
2350
2355
2360
2365
2370
2375
0
0.0
6
0.1
6
0.2
7
0.5
4
0.9
2
1.4
4
1.8
9
3.3
3
4.7
6.0
9
7.5
3
9.1
3
11
.07
13
.1
14
.91
16
.04
17
.16
18
.29
18
.74
19
.41
20
.39
21
.52
21
.86
24
.5
25
.5
27
.29
29
.61
Reservoir Area (ha)
Ele
vati
on
(m
)
Reservoir Volume (*1000 m3)
392700 392800 392900 393000 393100 393200 393300 393400
1278100
1278200
1278300
1278400
1278500
0 100 200 300 400
[IDENTIFICATION AND HYDROLOGICAL CHARACTERIZATION OF SURFACE WATER STORAGE IN UBN] 2009
Arba Minch University | 10
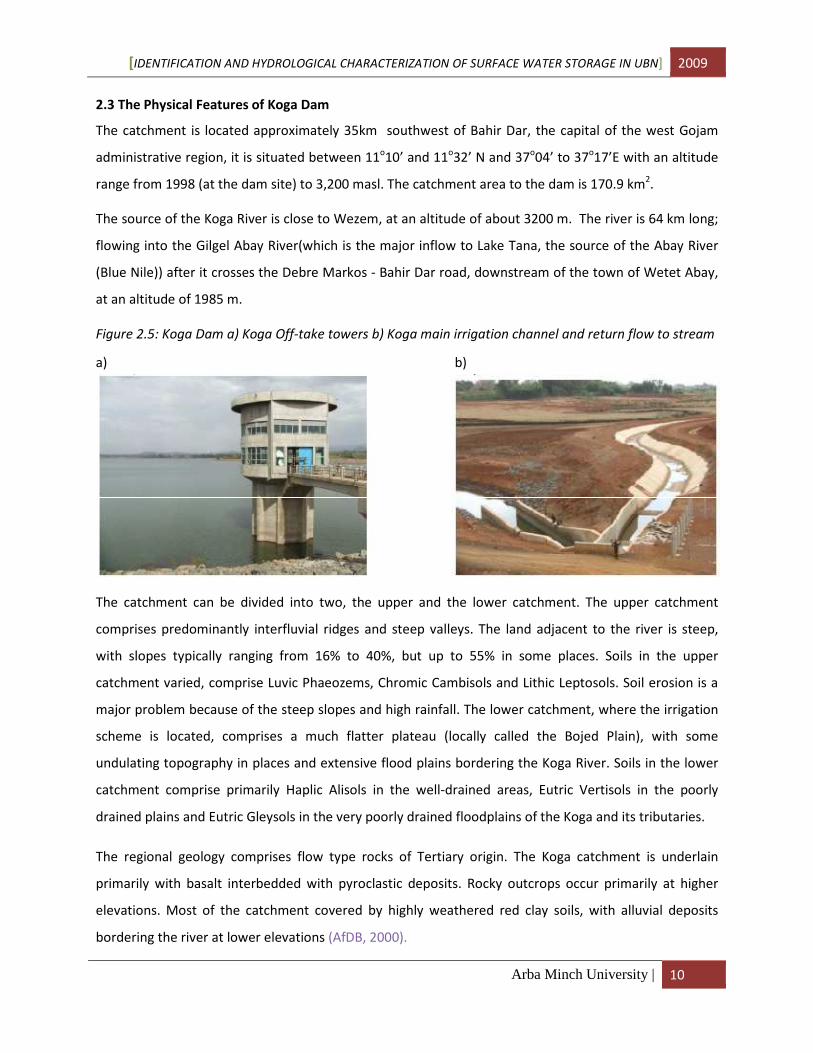
2.3 The Physical Features of Koga Dam
The catchment is located approximately 35km southwest of Bahir Dar, the capital of the west Gojam
administrative region, it is situated between 11o10’ and 11
o32’ N and 37
o04’ to 37
o17’E with an altitude
range from 1998 (at the dam site) to 3,200 masl. The catchment area to the dam is 170.9 km2.
The source of the Koga River is close to Wezem, at an altitude of about 3200 m. The river is 64 km long;
flowing into the Gilgel Abay River(which is the major inflow to Lake Tana, the source of the Abay River
(Blue Nile)) after it crosses the Debre Markos - Bahir Dar road, downstream of the town of Wetet Abay,
at an altitude of 1985 m.
Figure 2.5: Koga Dam a) Koga Off-take towers b) Koga main irrigation channel and return flow to stream
a) b)
The catchment can be divided into two, the upper and the lower catchment. The upper catchment
comprises predominantly interfluvial ridges and steep valleys. The land adjacent to the river is steep,
with slopes typically ranging from 16% to 40%, but up to 55% in some places. Soils in the upper
catchment varied, comprise Luvic Phaeozems, Chromic Cambisols and Lithic Leptosols. Soil erosion is a
major problem because of the steep slopes and high rainfall. The lower catchment, where the irrigation
scheme is located, comprises a much flatter plateau (locally called the Bojed Plain), with some
undulating topography in places and extensive flood plains bordering the Koga River. Soils in the lower
catchment comprise primarily Haplic Alisols in the well-drained areas, Eutric Vertisols in the poorly
drained plains and Eutric Gleysols in the very poorly drained floodplains of the Koga and its tributaries.
The regional geology comprises flow type rocks of Tertiary origin. The Koga catchment is underlain
primarily with basalt interbedded with pyroclastic deposits. Rocky outcrops occur primarily at higher
elevations. Most of the catchment covered by highly weathered red clay soils, with alluvial deposits
bordering the river at lower elevations (AfDB, 2000).

[IDENTIFICATION AND HYDROLOGICAL CHARACTERIZATION OF SURFACE WATER STORAGE IN UBN] 2009
Arba Minch University | 11
The climate of the catchment is largely controlled by the movement of air masses associated with the
Inter-Tropical Convergence Zone (ITCZ). The dry season occurs between November and April and the
wet season between May and October. Typically, about 95% of the annual rainfall occurs in the wet
season. In some years, depending on the exact movement of the ITCZ, small rains occur between April
and May. Rainfall varies depending on altitude. Mean annual rainfall is approximately 1590 mm, but
varies considerably from year to year, with pronounced wetter and drier cycles.
The Koga project comprises the construction of two dams. Currently the project is almost complete and
it starts working partially. The main dam is a 21.5 m high earth dam with a length of 1860 m. In addition,
an 18.50 m high and 1,106 m long saddle dam about 6km to the northeast of the main dam.(figure 2.5
show Koga dam and main channel) The storage capacity of the reservoir at full supply level (2015.25
masl) is 83.1 Mm3 (i.e. 71% of the mean annual runoff). The area submerged at FSL is 18.59 km
2. (Details
of the reservoir characteristics are given in Appendix C.2 and Figure 2.6)
The reservoir will provide water for approximately 7000 ha of dry season irrigation and 5,600 ha of wet
season irrigation
Figure 2.6: Koga reservoir characteristics

[IDENTIFICATION AND HYDROLOGICAL CHARACTERIZATION OF SURFACE WATER STORAGE IN UBN] 2009
Arba Minch University | 12
Table 2.2: Salient Features of the Koga damMott Macdonald (MM) interim Report
Item Unit Koga Main Dam Koga Saddle Dam
Dam Type
Zoned Earth fill Modified
homogeneous earth fill
Crest elevation m 2019.5 2019.5
Length of earth dam m 1730 1162
River bed elevation m 1998 2011
Max height m 21 9
Spilway type overflow ogee type none
Spilway crest elevation m 2015.25 (Crest Length 21.5 m)
na
spillway gates m uncontrolled crest na
Full supply level (FSL) m 2015.1 2015.1
Dead storage Level (DSL) m 2007.5 na
Maximum Water level m 2016.94 na
Maximum storage mcm 83.1 na
Live storage mcm 73.4 na
Maximum Submergence ha 2041 na
Mean Depth of reservoir m 4.41 na
Storage volume/Dam volume 145.5 440.6
Irrigation outlet works 1.5-m dia.steel lined conc.
Conduit, right abutment
Diversion work & low level outlet 3-m gated conduit on left bank of river
Design discharge of outlet works m3/s 9.1 none
Drainage area about dam site km2 164.8 na
Catchment yield mcm 86.72 na
Design flood (inflow to reservoir) m3/s 1:10000 yr (517) na
Compensation flow facilities 450 mm dia. Steel pipe
& control valve off irr out let

[IDENTIFICATION AND HYDROLOGICAL CHARACTERIZATION OF SURFACE WATER STORAGE IN UBN] 2009
Arba Minch University | 13
CHAPTER THREE
3. LITRATURE REVIEW
3.1 POTENTIAL SURFACE WATER STORAGE OPPORTUNITIES ON UBN
3.1.1 Surface Water Storage Option on Existing Dams
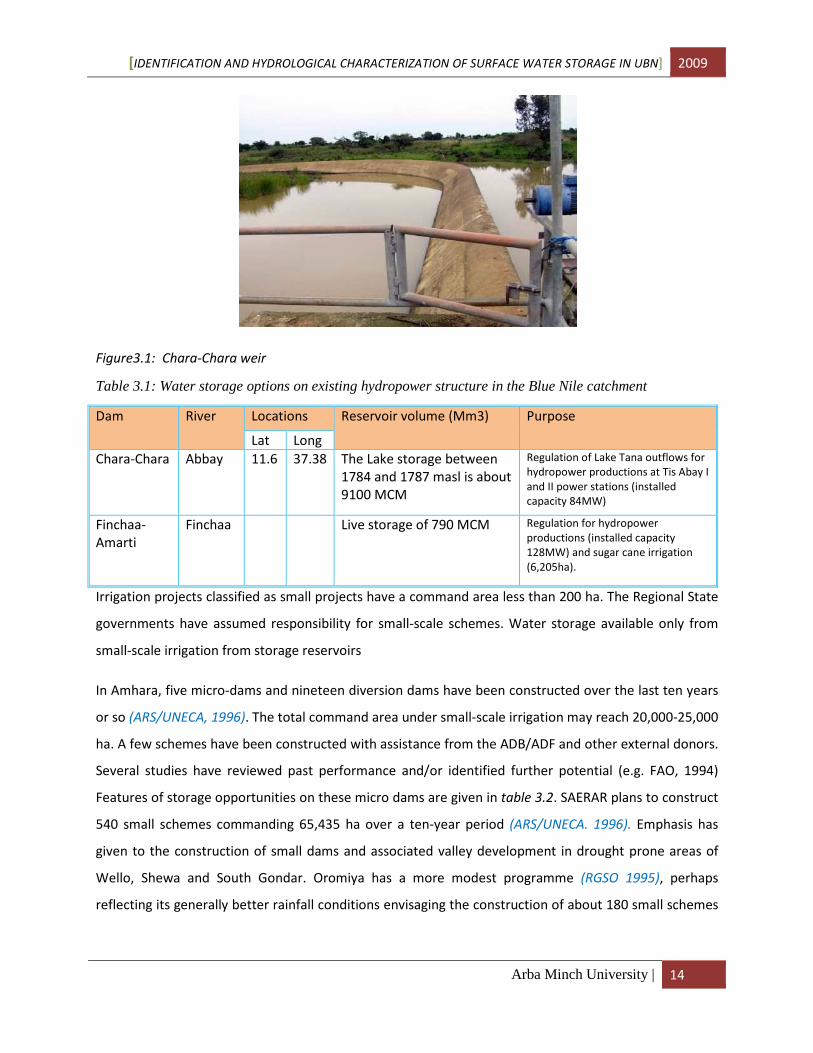
Currently only two medium sized hydraulic structures and several micro-earths dam for hydropower
irrigation and for small-scale irrigation schemes have been constructed in the Ethiopian Blue Nile
catchment. The two dams (i.e. Chara-Chara weir and Finchaa) have better storage opportunities than
the micro-earth dam. Features of the storage are shown in table 3.1. Chara-Chara weir and Finchaa dam
were built primarily to provide hydropower. The combined capacity of the power stations they serve
(212MW) represents approximately 30% of the total currently installed power capacity of the country
(i.e. 731 MW) (World Bank, 2006).
Chara-Chara weir (figure 3.1) is used to regulate the water level and outflow of Lake Tana. This
regulation originally aimed at a more constant outflow from the lake to increase the hydropower
production of the Tis Abbay hydropower plants. The regulation of outflow resulted in a larger seasonal
fluctuations in lake level. The weir consists of seven radial sector gates with sill levels at 1782.5 masl and
widths of 4.8 m. The concrete spillway has a length of 635 m and the crest level is at 1787 masl.
Construction of the weir started in 1994 and the weir, first controlled by two radial gates only, became
operational in December 1995. The increased regulation of the Lake Tana’s outflow by the Chara-Chara
weir enabled the construction of a second power plant (Tis Abbay II), after five additional gates added.
The construction of Tis Abbay II started in 1996 and completed in 2001. The minimum operation level is
1784 masl and the maximum operation level is 1987 masl. However, an optional minimum operation
level of 1784.75 mentioned, to allow for a minimum draught, needed for navigation in Lake Tana. (SMEC
Main Report, 2007)
The Lake storage between 1784 and 1787 masl is about 9100 MCM and this storage will reduce by about
25% if the minimum operation level increased to 1784.75. If all gates are opened, the total calibrated
discharge at the minimum operation level (1784 masl) is 75 m3/s and at the maximum operation level
(spillway level) 490 m3/s (Salini and Pietrangeli, 2006).
[IDENTIFICATION AND HYDROLOGICAL CHARACTERIZATION OF SURFACE WATER STORAGE IN UBN] 2009
Arba Minch University | 14
Figure3.1: Chara-Chara weir
Table 3.1: Water storage options on existing hydropower structure in the Blue Nile catchment
Dam River Locations Reservoir volume (Mm3) Purpose
Lat Long
Chara-Chara Abbay 11.6
37.38
The Lake storage between
1784 and 1787 masl is about
9100 MCM
Regulation of Lake Tana outflows for
hydropower productions at Tis Abay I
and II power stations (installed
capacity 84MW)
Finchaa-
Amarti
Finchaa Live storage of 790 MCM Regulation for hydropower
productions (installed capacity
128MW) and sugar cane irrigation
(6,205ha).
Irrigation projects classified as small projects have a command area less than 200 ha. The Regional State
governments have assumed responsibility for small-scale schemes. Water storage available only from
small-scale irrigation from storage reservoirs
In Amhara, five micro-dams and nineteen diversion dams have been constructed over the last ten years
or so (ARS/UNECA, 1996). The total command area under small-scale irrigation may reach 20,000-25,000
ha. A few schemes have been constructed with assistance from the ADB/ADF and other external donors.
Several studies have reviewed past performance and/or identified further potential (e.g. FAO, 1994)
Features of storage opportunities on these micro dams are given in table 3.2. SAERAR plans to construct
540 small schemes commanding 65,435 ha over a ten-year period (ARS/UNECA. 1996). Emphasis has
given to the construction of small dams and associated valley development in drought prone areas of
Wello, Shewa and South Gondar. Oromiya has a more modest programme (RGSO 1995), perhaps
reflecting its generally better rainfall conditions envisaging the construction of about 180 small schemes
[IDENTIFICATION AND HYDROLOGICAL CHARACTERIZATION OF SURFACE WATER STORAGE IN UBN] 2009
Arba Minch University | 15
covering 19,200 ha over a five year period. Both the Amhara and Oromiya targets are region-wide and
the total within the Abbay basin is presumably significantly smaller.
Table 3.2: Water storage options on existing small-scale irrigation schemes in the Blue Nile
Zone Woreda Scheme Command
Area (ha)
Reservoir volume
(*1000m3) Water Source
North
Gonder
Basonaweran
a Burale 70 Micro-earth Dam
South
Gonder
Estie Gomit 90 739.64 Zoned earth
embankment dam
Fogera Guanta 60 Micro-earth Dam
Dera Shina 60 Micro-earth Dam
Farta Selamko 63 Micro-earth Dam
South Wollo Mekdela Tebi 200 1000 Micro-earth Dam
West Gojjam Enargi-
Enawga Abrajit 70 1225.2 Micro-earth Dam
Source: Regional Water Resource Bureau, Bahir Dar
3.1.2. Water Storage Option on Natural Lakes
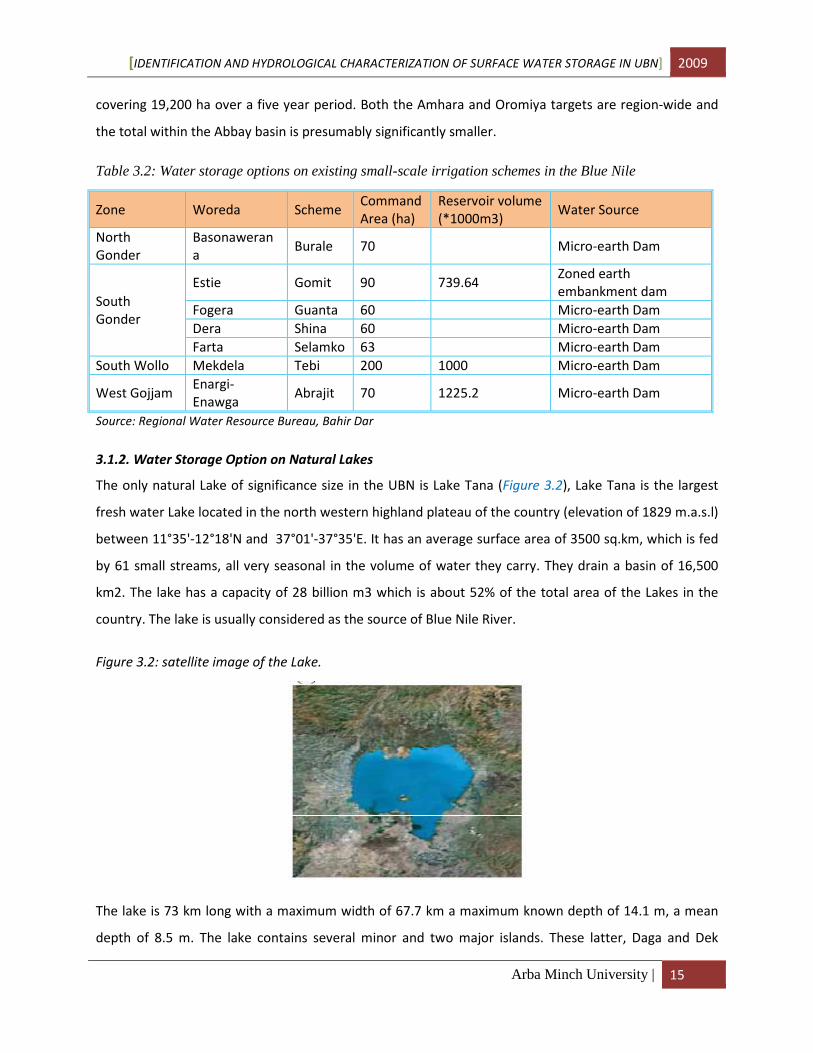
The only natural Lake of significance size in the UBN is Lake Tana (Figure 3.2), Lake Tana is the largest
fresh water Lake located in the north western highland plateau of the country (elevation of 1829 m.a.s.l)
between 11°35'-12°18'N and 37°01'-37°35'E. It has an average surface area of 3500 sq.km, which is fed
by 61 small streams, all very seasonal in the volume of water they carry. They drain a basin of 16,500
km2. The lake has a capacity of 28 billion m3 which is about 52% of the total area of the Lakes in the
country. The lake is usually considered as the source of Blue Nile River.
Figure 3.2: satellite image of the Lake.
The lake is 73 km long with a maximum width of 67.7 km a maximum known depth of 14.1 m, a mean
depth of 8.5 m. The lake contains several minor and two major islands. These latter, Daga and Dek

[IDENTIFICATION AND HYDROLOGICAL CHARACTERIZATION OF SURFACE WATER STORAGE IN UBN] 2009
Arba Minch University | 16
Islands in the southern part of the lake are volcanic cones. Small swampy and seasonally flooded alluvial
plains border the lake to the north, east and west and in these regions, the lakeshore is flat; elsewhere it
is steep and rocky. The lake area enjoys some 2660 hours of sunshine each year, with a mean maximum
of 288 hours in January and a mean minimum of 114 hours in July. Mean annual surface water
temperatures are between 21.5 and 22.0°C depending upon locality. Winds are generally light.
The Blue Nile carries the overspill of the lake from its southern extremity. Maximum outflow 400 m3/s in
September and the average annual overspill estimated at 3.9 billion m3. Precipitation averages 1320
mm/yr, over the lake, with a monthly maximum of 475 mm in July, but by contrast, the December-April
period is virtually rainless. Rainfall over the upper catchments may reach 2000 mm/yr while evaporation
from the lake margins has been determined as 1836 mm/yr.
Currently, the water level of Lake Tana regulated by the Chara-Chara weir, at the outlet of the Lake close
to Bahir Dar town and the natural lake level fluctuation and outflow from the Lake modified.
The weir constructed to enhance energy situation in the country by constructing the second
hydropower plant on upper Blue Nile. While like other Lakes in Ethiopia, Lake Tana not protected by law
until recently (Abunie, 2003); the level of exploitation of the water resources particularly for
consumptive use like irrigation remains limited to date. Recently there is extensive study and
mobilization activity in the country to develop energy and irrigation sector by utilizing the lake and its
tributaries as storage facility for irrigation and hydropower purpose. A notable development is the Tana-
Beles growth corridor concept, which is attempting to stimulate Integrated Water Resources
Development Program around Lake Tana. The plan include among others a basin transfer scheme from
Lake Tana to Beles River Basin for hydropower production, as well as the development of storage dams
(for irrigation) on the tributaries of the Lake.

[IDENTIFICATION AND HYDROLOGICAL CHARACTERIZATION OF SURFACE WATER STORAGE IN UBN] 2009
Arba Minch University | 17
3.1.3. Water Storage in the Future Water Resource Development on Upper Blue Nile Basin
The Nile riparian countries have agreed to collaborate in the development of the Nile water resources to
achieve sustainable socio-economical development. There is significant potential for additional
exploitation in the basin and our country plans to develop the water resources of the river.
In Ethiopia possible hydropower, irrigation and multipurpose projects have been investigated over a
number of years (e.g. Lahmeyer, 1962; USBR, 1964; JICA, 1977; EVDSA, 1980; HALCROW, 1982;
WAPCOS, 1990; BCEOM, 1998).
The projects have been classified as pure irrigation projects, pure power projects or multipurpose
projects:
• Irrigation projects defined as projects where the dam is justified by irrigation requirements. If
economically attractive, small hydropower equipment could be installed to turbine the released
irrigation flow;
• Power projects defined as projects where the reservoir used for regulating the river flows in
order to maximize the firm energy. No priority is then given to irrigation;
• Multipurpose projects defined as projects where part of the reservoir storage is allocated to
satisfy the irrigation requirements and the remaining part to produce power.
Several possible irrigation and power projects in the Abbay basin have been studied at feasibility level
other identified projects have been reviewed at a reconnaissance level to obtain a preliminary estimate
of their output and cost.
In the Abbay basin, the Master Plan identified around 32 potential irrigation, hydropower and
multipurpose projects from these projects there is a possibility of water storage formation of a
maximum of 135269.82 Mm3.
The maximum water storage formed around main stream projects comprises around 72% (95600 Mm3)
of the total storage in the basin. Didessa sub basin comprised 12.9% (17420 Mm3) and the rest of the
basin takes below 5% each (figure 3.3). The detailed results (for all irrigation, power and multi-purpose
projects) presented in Annex A. It provides curves giving the reservoir characteristics (flooded area and
capacity) versus reservoir elevation.

[IDENTIFICATION AND HYDROLOGICAL CHARACTERIZATION OF SURFACE WATER STORAGE IN UBN] 2009
Arba Minch University | 18
Figure 3.3: Distribution of water storage potential in the Abbay basin
3.1.3.1. Water Storage on planned Irrigation projects
The Master Plan proposed to develop a certain percentage of the identified potential over the 50 years
of the Master Plan period. Two alternatives scenarios were proposed for the development of large- and
medium-scale irrigation: a "conservative" one aiming at developing 235,000 ha in 50 years (45% of the
potential), and an "accelerated" one with 350,000 ha (65% of the potential) (BCEOM phase 3 main
report, 1998). An analysis of water resources required to support the Ethiopian irrigation development,
proposed in the Abbay River Master Plan (BCEOM, 1998, main report, page 1-76), indicates that
approximately 5,750 Mm3 needed to irrigate between 370,000 and 440,000 ha. This represents
approximately 11%-12% of the mean annual flow in-to Sudan.
More recently it has been estimated that the water required for the 220,416 ha of highest priority
irrigation would be between 2,200 Mm3 and 3, 830 Mm3 (Endale, 2006). Figure 3.4 shows all planed
irrigation projects with spatial distribution and storage formation scale. (Storage on Angar project
3590Mm3 is the maximum). According to the phase 2 report of abbay basin studies the projects that are
identified and also to be studied at phase three are Gumara (A and B), Megech, Ribb, Gilgel Abbay (A
and B), Jema, Negeso, Angar, Galegu, Rahad. Each of these projects have large reservoir with a total
maximum storage around 5768.1 Mm3. Additional features like dam location, reservoir elevation with
live storage, and irrigable area of irrigation projects are presented in Annex A.1.
02000400060008000
100001200014000160001800020000
Sto
rag
e A
mo
un
t in
(M
m3
)
Sub-Basin Name
Storage amount for the planned project
storage Amount

[IDENTIFICATION AND HYDROLOGICAL CHARACTERIZATION OF SURFACE WATER STORAGE IN UBN] 2009
Arba Minch University | 19
Figure 3.4: Spatial distributions with storage size scale of irrigation projects
3.1.3.2. Water Storage on planned multipurpose projects
The evaluation of multipurpose projects made in a first stage by considering the projects as irrigation
dams i.e. by computing the unit cost per stored m3. In a second stage, power equipment introduced
with values of installed capacity larger than the irrigation requirements but close to the river natural
discharge. BCEOM, 1998, phase 2, section II VOLUME VI
According to the phase 2 report of Abbay basin studies the multi-purpose projects that are identified
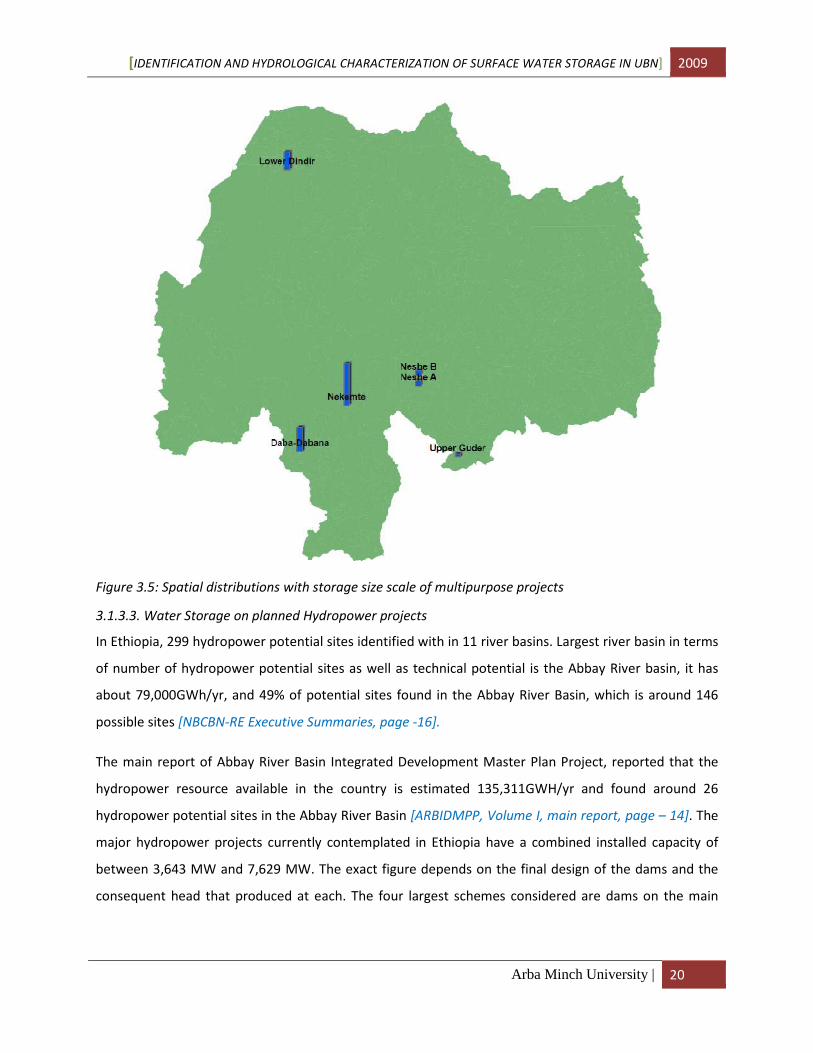
and also to be studied at phase 3 are: Neshe, Upper Guder, Dabana, Lower Dindir, and Nekemte. The
total maximum storage which formed by the fore mentioned projects is around 7,869 Mm3, Nekemte
project contribute the largest 3,380 Mm3. Figure 3.5 shows all planed multipurpose projects with spatial
distribution and storage scale, In addition, details about the project available on appendix A.2
[IDENTIFICATION AND HYDROLOGICAL CHARACTERIZATION OF SURFACE WATER STORAGE IN UBN] 2009
Arba Minch University | 20
Figure 3.5: Spatial distributions with storage size scale of multipurpose projects
3.1.3.3. Water Storage on planned Hydropower projects
In Ethiopia, 299 hydropower potential sites identified with in 11 river basins. Largest river basin in terms
of number of hydropower potential sites as well as technical potential is the Abbay River basin, it has
about 79,000GWh/yr, and 49% of potential sites found in the Abbay River Basin, which is around 146
possible sites [NBCBN-RE Executive Summaries, page -16].
The main report of Abbay River Basin Integrated Development Master Plan Project, reported that the
hydropower resource available in the country is estimated 135,311GWH/yr and found around 26
hydropower potential sites in the Abbay River Basin [ARBIDMPP, Volume I, main report, page – 14]. The
major hydropower projects currently contemplated in Ethiopia have a combined installed capacity of
between 3,643 MW and 7,629 MW. The exact figure depends on the final design of the dams and the
consequent head that produced at each. The four largest schemes considered are dams on the main
[IDENTIFICATION AND HYDROLOGICAL CHARACTERIZATION OF SURFACE WATER STORAGE IN UBN] 2009
Arba Minch University | 21
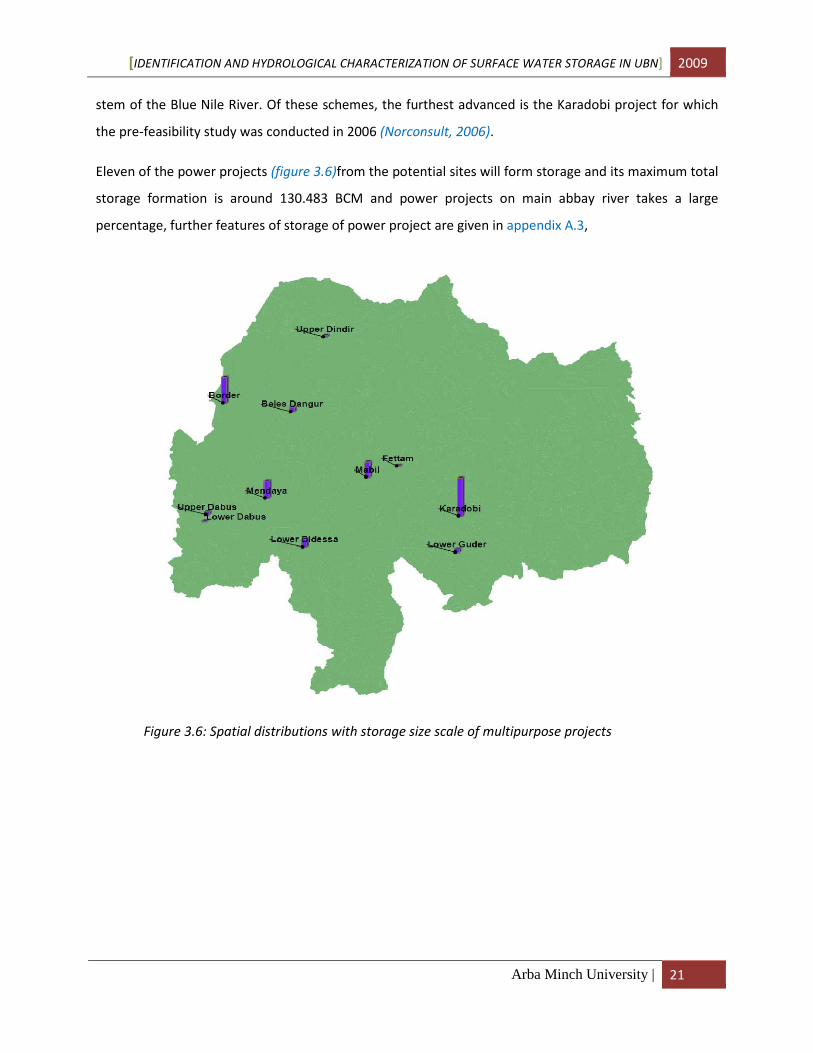
stem of the Blue Nile River. Of these schemes, the furthest advanced is the Karadobi project for which
the pre-feasibility study was conducted in 2006 (Norconsult, 2006).
Eleven of the power projects (figure 3.6)from the potential sites will form storage and its maximum total
storage formation is around 130.483 BCM and power projects on main abbay river takes a large
percentage, further features of storage of power project are given in appendix A.3,
Figure 3.6: Spatial distributions with storage size scale of multipurpose projects

[IDENTIFICATION AND HYDROLOGICAL CHARACTERIZATION OF SURFACE WATER STORAGE IN UBN] 2009
Arba Minch University | 22
3.2 General Description of all Software used for this study
3.2.1 GIS
With the development of computer science, hydrological models combined with Geographic
Information System (GIS) technology. The Arc GIS is one of several Geographic Information Systems
(GIS), which is a powerful integrated suite of GIS applications capable of performing advanced mapping,
data management and geo processing of spatial data (Weizhe An, 2007).
Making a connection between GIS and HEC GEOHMS and arc hydro, and standard software packages like
HEC-HMS, allows the modeler to get the most out of GIS (i.e., to capture the spatial variability of the
system) while continuing to work using familiar tools ( Weizhe An,2007).
3.2.2 Arc-Hydro
Arc Hydro is an Arc-GIS-based system geared to support water resources applications. It consists of two
key components:
• Arc Hydro Data Model
• Arc Hydro Tools
The Arc Hydro tools are a set of utilities developed on top of the Arc Hydro data model. They operate in
the Arc-GIS environment. Some of the functions require the Spatial Analyst extension.
The tools have two key purposes. The first purpose is to manipulate (assign) key attributes in the Arc
Hydro data model. These attributes form the basis for further analyses. They include the key identifiers
(such as HydroID, DrainID, NextDownID, etc.) and the measure attributes (such as Length Down). The
second purpose for the tools is to provide some core functionality often used in water resources
applications. This includes DEM-based watershed delineation, network generation, and attribute-based
tracing (Arc Hydro Tools Overview, 2002).
3.2.3 HEC-GeoHMS
HEC-GeoHMS developed as a tool kit of the geospatial hydrology for engineers and hydrologists with
limited GIS experience. The program allow users to visualize spatial information, document watershed
characteristics, perform spatial analysis, delineate sub-basins and streams, construct inputs to
hydrologic models, and assist with report preparation. Working with HEC-GeoHMS through its
interfaces, menus, tools buttons, and context sensitive online help, in a windows environment, allows
the user to expediently create Hydrologic Modeling System, HEC-HMS (USACE, 2003).
HEC-GeoHMS version creates background map file, lumped basin model, a grid-cell parameter file, and a
distributed basin model, which used by HMS to develop a hydrologic model. The background map file
contains the stream alignments, and sub-basins boundaries. The lumped basin model contains

[IDENTIFICATION AND HYDROLOGICAL CHARACTERIZATION OF SURFACE WATER STORAGE IN UBN] 2009
Arba Minch University | 23
hydrologic elements and their connectivity to represent the movement of water through the drainage
system. The lumped basin file includes watershed areas and reserves empty fields for hydrologic
parameters. To assist with estimating hydrologic parameters, GeoHMS can generate tables containing
physical characteristics of steams and watersheds. If the hydrologic model employs the distributive
techniques for hydrograph transformation, i.e. ModClark, and grid-based precipitation, then a grid-cell
parameter file and a distributed basin model can be generated (USACE, 2003).
3.2.4 HEC-DSS Microsoft Excel Data Exchange Add-In
Used to convert temporal data into HEC-HMS binary format, previously, data from one format would
need to enter into another format by hand by each user. Each program would then use separate
functions to analyze and graph the data. Therefore time-series and tabular data are not stored in the
HEC-HMS dataset; rather, the data are stored in a separate HEC-DSS data file, which accessed by the
HEC-HMS model. The database consists of six parts: the A Part (River basin or project name), B Part
(Location of gage identifier), C Part (Data type (e.g. flow, rainfall, etc.)), D Part (Starting date), E Part (Time
interval of data), and F Part (User defined descriptor of data). The data are stored under a unique pathname,
which includes all of the parts: /A Part/B Part/C Part/D Part/ E Part/F Part. Using these parts, it is easy for
the user and the model to query and manage the data, especially between models. Long-term data
series (years and greater) can be stored in HEC-DSS and multiple model runs can be made in different
times within the data series. The data can be accessed by other HEC models.
3.2.5 HEC-HMS Modeling
HEC-HMS (the Hydrologic Engineering Center’s Hydrological Modeling System) is the United States Army
Corps of Engineers’ hydrologic system computer program developed by the Hydrological Engineering
Center (HEC). The program simulates precipitation-runoff and routing processes, both natural and
controlled. HEC-HMS is the successor to and replacement for HEC’s HEC-1 program and for various
specialized versions of HEC-1. HEC-HMS improves up on the capabilities of HEC-1 and provides
additional capabilities for distributed modeling and continuous simulation (USACE, 2000).
HMS contains four main components. 1) An analytical model to calculate overland flow runoff as well as
channel routing, 2) an advanced graphical user interface illustrating hydrologic system components with
interactive features, 3) a system for storing and managing data, specifically large, time variable data
sets, and 4) a means for displaying and reporting model outputs. (Semu, 2003)
[IDENTIFICATION AND HYDROLOGICAL CHARACTERIZATION OF SURFACE WATER STORAGE IN UBN] 2009
Arba Minch University | 24
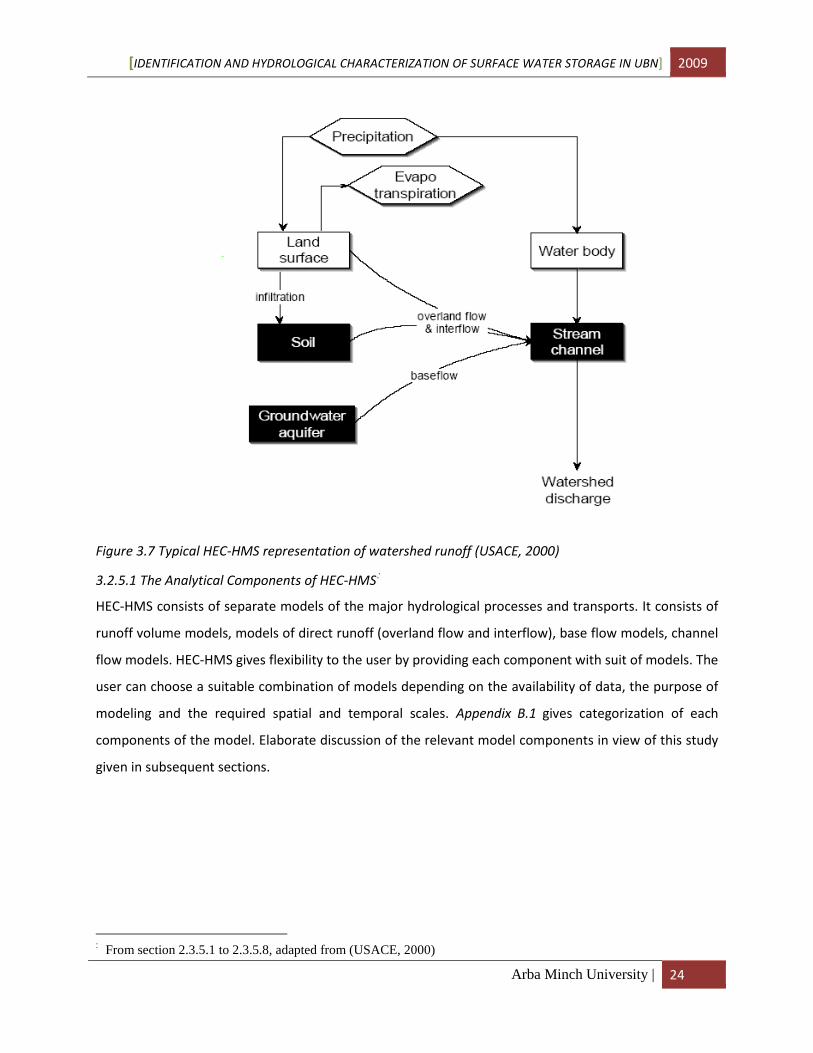
Figure 3.7 Typical HEC-HMS representation of watershed runoff (USACE, 2000)
3.2.5.1 The Analytical Components of HEC-HMS♣
HEC-HMS consists of separate models of the major hydrological processes and transports. It consists of
runoff volume models, models of direct runoff (overland flow and interflow), base flow models, channel
flow models. HEC-HMS gives flexibility to the user by providing each component with suit of models. The
user can choose a suitable combination of models depending on the availability of data, the purpose of
modeling and the required spatial and temporal scales. Appendix B.1 gives categorization of each
components of the model. Elaborate discussion of the relevant model components in view of this study
given in subsequent sections.
♣ From section 2.3.5.1 to 2.3.5.8, adapted from (USACE, 2000)

[IDENTIFICATION AND HYDROLOGICAL CHARACTERIZATION OF SURFACE WATER STORAGE IN UBN] 2009
Arba Minch University | 25
3.2.5.2 Runoff-Volume Models
As illustrated by figure 2.1 above, HEC-HMS computes runoff volume by computing the volume of water
that intercepted, infiltrated, stored, evaporated, or transpired and subtracting it from the precipitation.
Interception and surface storage intended to represent the surface storage of water by trees or grass,
local depressions in the ground surface, cracks and crevices in parking lots or roofs, or a surface area
where water is not free to move as overland flow. Infiltration represents the movement of water to
areas beneath the land surface. Interception, infiltration, storage, evaporation, and transpiration
collectively referred to in the HEC-HMS program and documentation as losses.
HEC-HMS considers that all land and water in a watershed categorized as either directly connected
impervious surface, or pervious surface. Directly connected impervious surface in a watershed is that
portion of the watershed for which all contributing precipitation runs off, with no infiltration,
evaporation, or other volume losses. Precipitation on the pervious surfaces is subject to losses. HEC-
HMS includes seven runoff volume methods specified in Appendix B.1. However, only some of the
appropriate methods in the perspective of this study described below.
Initial and Constant rate, Deficit and Constant rate Loss models
The underlying concept of the initial and constant-rate loss model is that the maximum potential rate of
precipitation loss, fc, is constant throughout an event. Thus, if Pi is the MAP depth during a time interval
t to t+∆t, the excess, Pei, during the interval given by:
��� � ��� � �� �� �� ��0 � ������� � (3.1)
An initial loss, Ia, is added to the model to represent interception and depression storage. Interception
storage is a consequence of absorption of precipitation by surface cover, including plants in the
watershed. Depression storage is a consequence of depressions in the watershed topography; water is
stored in these and eventually infiltrates or evaporates. This loss occurs prior to the onset of runoff.
Until the accumulated precipitation on the pervious area exceeds the initial loss volume, no runoff
occurs. Thus, the excess given by
��� � � 0 �� ∑ �� � �� �� � �� �� ∑ �� �� ��� �� ��0 �� ∑ �� �� ��� �� � �� � (3.2)

[IDENTIFICATION AND HYDROLOGICAL CHARACTERIZATION OF SURFACE WATER STORAGE IN UBN] 2009
Arba Minch University | 26
Initial Loss and Constant-Rate
The initial and constant-rate model, in fact, includes one parameter (the constant rate) and one initial
condition (the initial loss). Respectively, these represent physical properties of the watershed soils and
land use and the antecedent condition.
The constant loss rate can viewed as the ultimate infiltration capacity of the soils. The SCS (1986)
classified soils on basis of this infiltration capacity, and Skaggs and Khaleel (1982) have published
estimates of infiltration rates for those soils, as shown in Table 2.3. These may used in the absence of
better information. Because the model parameter is not a measured parameter, it and the initial
condition best determined by calibration.
Table 3.3 SCS soil groups and infiltration (loss) rates (SCS, 1986; Skaggs and Khaleel, 1982)
Soil group Description Range of loss rates (in/hr)
A Deep sand, deep loess, aggregated silts 0.30-0.45
B Shallow loess, sandy loam 0.15-0.30
C Clay loams, shallow sandy loam, soils low inorganic
content, and soils usually high in clay
0.05-0.15
D Soils that swell significantly when wet, heavy plastic clays,
and certain saline soils
0.00-0.05
The Deficit and Constant-Rate Loss Model
HEC-HMS also includes a quasi-continuous model of precipitation losses, this known as the deficit and
constant-rate loss model. This model is similar to the initial and constant-rate loss model, but the initial
loss can “recover” after a prolonged period of no rainfall.
To use this model in HEC-HMS, the initial loss and constant rate plus the recovery rate must specify.
Then HEC-HMS continuously tracks the moisture deficit, computing it as the initial abstraction volume
less precipitation volume plus recovery volume during precipitation-free periods. The recovery rate
could estimate as the sum of the evaporation rate and percolation rate, or some fraction thereof.
SCS Curve Number Loss Model
The Soil Conservation Service (SCS) Curve Number (CN) model estimates precipitation excess as a
function of cumulative precipitation, soil cover, land use, and antecedent moisture, using the following
equation:

[IDENTIFICATION AND HYDROLOGICAL CHARACTERIZATION OF SURFACE WATER STORAGE IN UBN] 2009
Arba Minch University | 27
�� � (� !")#� !"$% (3.3)
Where: Pe = accumulated precipitation excess at time t; P = accumulated rainfall depth at time t; Ia = the
initial abstraction (initial loss); and S = potential maximum retention, a measure of the ability of a
watershed to abstract and retain storm precipitation. Until the accumulated rainfall exceeds the initial
abstraction, the precipitation excess, and the runoff, will be zero.
From analysis of results from many small experimental watersheds, the SCS developed an empirical
relationship of Ia and S:
�� � 0.2 & (3.4) Therefore, the cumulative excess at time t is:
�� � (( ).* %)#�$).+ % (3.5)
Incremental excess for a time interval computed as the difference between the accumulated excess at
the end of and beginning of the period.
The maximum retention, S, and watershed characteristics related through an intermediate parameter,
the curve number (commonly abbreviated CN) as:
& � �-))) -) ././ (��� _��1�� �2� �3)*45)) *45 ././ (&�) � (3.6)
CN values range from 100 (for water bodies) to approximately 30 for permeable soils with high
infiltration rates.
The SCS uses a combination of soil conditions and land-use (ground cover) to assign a runoff factor to an
area. These runoff factors, called runoff curve numbers (CN), indicate the runoff potential of an area.
The higher the CN, the higher is the runoff potential (USDA SCS (1985a)).
The major factors that determine CN are the hydrologic soil group, cover type, treatment, hydrologic
condition, and antecedent runoff condition. Another factor considered is whether impervious areas
outlet directly to the drainage system (connected) or whether the flow spreads over pervious areas
before entering the drainage system (unconnected). CN values for cultivated agricultural and other
agricultural lands presented in appendix F, under average antecedent runoff condition with the
assumption impervious areas are directly connected.
[IDENTIFICATION AND HYDROLOGICAL CHARACTERIZATION OF SURFACE WATER STORAGE IN UBN] 2009
Arba Minch University | 28
3.2.5.3 Direct-Runoff Models
Modeling direct runoff is transformation of the excess precipitation into point runoff at a given point
outlet. HEC-HMS includes two options, systems type and conceptual type of transformation. The
systems type transformation included in HMS consists of Snyder’s unit hydrographs model, SCS UH
model, Clark’s model, Modified Clark’s model. The conceptual model includes only a kinematics wave
model of overland flow.
Snyder’s UH model
Snyder discovered that the UH lag and peak per unit of excess precipitation per unit area of the
watershed related by:
6(7 � 8 .(9( (3.7)
Where Up=peak of the standard UH; A= watershed drainage area; Cp= UH peaking coefficient; and
C=conversion constant (2.75 for SI or 640 for foot-pound system).
Snyder related parameterized the UH of measured watersheds and related it with measurable
watershed characteristics and proposed the following two equations to estimate the UH lag (tp): : � 88 (;;�)).< (3.8)
Where, Ct=basin coefficient; L=length of the main stream from the outlet to the divide; Lc=length along
the main stream from the outlet to a point nearest the watershed centroid; and C=a conversion
constant (0.75 for SI and 1.0 for foot-pound system).
The parameter Ct and Cp best found via calibration, as they are not physically based parameters. Bedient
and Huber (1992) reported that Ct typically ranges from 1.8 to 2.2, although it has found to vary from 0.4
in mountainous areas to 8.0 along the Gulf of Mexico.
Alternative forms of the parameter predictive equations proposed.
: � 88 =>>?√% A/ (3.9)
Where S= overall slope of longest watercourse from point of concentration to the boundary of drainage
basin; and N=an exponent, commonly taken as 0.33.
SCS UH model
This is a parametric UH proposed by the Soil Conservation Service (SCS) in 1986. At the heart of the SCS
UH model is a dimensionless UH, expresses the UH discharge, Ut, as a ratio to the peak discharge, Up,
for any time t, a fraction of Tp, the time to UH peak.
SCS suggests that the UH peak and time of UH peak related by

[IDENTIFICATION AND HYDROLOGICAL CHARACTERIZATION OF SURFACE WATER STORAGE IN UBN] 2009
Arba Minch University | 29
B: � 8 7C( (3.10)
Where A= watershed area; and C= conversion constant (2.08 in SI and 484 in FPS). The time of peak (also
known as the time of rise) related to the duration of the unit of excess precipitation as:
D: � ∆9* F G�H (3.11)
Where t= the excess rainfall duration and tlag= the basin lag, defined as the time difference between the
center of mass of rainfall excess and the peak of the UH.
The lag time tag given as:
G�H � 3�I J>KL.MN OLLLPQRSTL.U<-.VW %L.X , 3.5 ∆ Z (3.12)
Where t∆ is the computational time interval, CN is average curve number for the watershed, S is the
slope of the longest flow path (%) and L is the length of the longest flow path (ft).
3.4.5.4 Base flow Models
HEC-HMS includes three models for modeling the base flow.
Constant Monthly
This is the simplest base flow model in HMS. It represents base flow as a constant flow; this may vary
monthly. This user-specified flow added to the direct runoff computed from rainfall for each time step
of the simulation.
Exponential Recession Method
This explains the drainage from natural storage in a watershed. It defines the relationship of Qt, the base
flow at any time t, to an initial value as: [ � [� \9 (3.13)
Where Qt is the base flow at time t; Qo is initial base flow (at time zero); and K is an exponential decay
constant. The contribution decays exponentially from the starting flow. As implemented in HMS, K
defined as the ratio of base flow at time t to the base flow one day earlier. The parameters of this model
include the initial flow, the recession ratio, and the threshold flow. The starting base flow is an initial
condition of the model.
3.4.5.5 Channel Flow
The channel routing models available in HMS includes Lag; Modified Pulls, Muskingum, Kinematic wave,
and Muskingum Cunge. Only lag methods used for this study and discussed below.
[IDENTIFICATION AND HYDROLOGICAL CHARACTERIZATION OF SURFACE WATER STORAGE IN UBN] 2009
Arba Minch University | 30
Lag Model
This is the simplest of HEC-HMS routing models. With it, the outflow hydrograph is simply the inflow
hydrograph, but with the ordinates translated (lagged in time) by a specified duration. The flows not
attenuate, so the shape is not changed. Mathematically, the downstream ordinates computed as:
] � ^�( ) _ G�H�( � G�H) ` G�H� (3.14)
Where Ot, is outflow hydrograph ordinate at time t; it is inflow hydrograph ordinate at time t; and lag is
time by which the inflow ordinates are to be lagged.
3.2.5.6 Reservoir in HMS
A reservoir is an element with one or more inflow and one computed outflow. Inflow comes from other
elements in the basin model. If there is more than one inflow, all inflow added together before
computing the outflow. It assumed that the water surface in the reservoir pool is level. Several
methods are available for defining the storage properties of the reservoir. The element used to model
reservoirs, lakes, and ponds
Three different routing methods are available. The first one Outflow Curve routing method designed to
represent the reservoir with a known storage-outflow relationship. The second method Outflow
Structure route method designed to represent individual components of the outlet works. The final
method uses a specified release and computes the storage that would result.
In order to specify the storage characteristics for the reservoir, it will depend on the routing method
selected. The Outflow Curve routing method can accept three different forms of storage characteristics:
storage-discharge, elevation-storage-discharge, or elevation-area-discharge. The Outflow Structures
route method can accept two different forms of storage characteristics: elevation-storage, or elevation-
area. The Specified Release route method can accept two different forms of storage characteristics:
elevation-storage, or elevation-area.
In addition, the selection of routing method also changes choice available in storage method, selection
list. For outflow curve routing method only initial condition (elevation, storage or discharge) appear in
selection list, for Outflow Structures routing initial condition, spillways, auxiliary, outlets, evaporation,
dam seepage, tailwater rating curve, release, dam tops, and pumps selection option will be available and
most of them are optional. Finally, the specified released method maximum release and maximum
reservoir capacity are available.

[IDENTIFICATION AND HYDROLOGICAL CHARACTERIZATION OF SURFACE WATER STORAGE IN UBN] 2009
Arba Minch University | 31
3.2.5.7 Model Calibration and Verification
Calibration
Model calibration is a systematic process of adjusting model parameter values until model results match
acceptably the observed data. The objective function described by the quantitative measure of the
match. In the precipitation-runoff models, this function measures the degree of variation between the
observed and the computed hydrographs. The calibration process finds the optimal parameter values
that minimize the objective function. Further, the calibration estimates some model parameters that
cannot estimate by observation or measurement, or have no direct physical meaning. Calibration can be
either manual or automated (optimization). Manual calibration relies on user’s knowledge of basin
physical properties and expertise in hydrologic modeling. In the automated calibration model
parameters iteratively adjusted until the value of the selected objective function is minimized (CFCAS,
2004).
The latest version of HEC-HMS model includes optimization manager that allows automated model
calibration. There are five objective functions available in the optimization manager (CFCAS, 2004):
• Peak-weighted root mean square error (PWRMSE): Using a weighting factor, the PWRMSE
measure gives greater overall weight to error near the peak discharge.
• Sum of squared residual (SSR): The SSR measure gives greater weight to large errors and lesser
weight to small errors (USACE, 2001):
&&a � ∑ ([� � [3 )*/9b- (3.17)
• Sum of absolute residuals (SAR): The SAR function gives equal weight to both small and large
errors.
• Percent error in peak flow (PEPF): The PEPF measure only considers the magnitude of computed
peak flow and does not account for total volume or timing of the peak:
• Percent error in volume (PEV): The PEV function only considers the computed volume and does
not account for the magnitude or timing of the peak flow.
Two search methods are available in HEC-HMS model for minimizing the objective functions defined
above (USACE, 2001):
• The univariate gradient method (UG): The UG method evaluates and adjusts one parameter at a
time while holding other parameters constant.
• The Nelder and Mead method (NM): The NM method uses a downhill simplex to evaluate all
parameters simultaneously and determine which parameter to adjust.
[IDENTIFICATION AND HYDROLOGICAL CHARACTERIZATION OF SURFACE WATER STORAGE IN UBN] 2009
Arba Minch University | 32
Initial values of parameters that are subject to automated calibration are required to start an
optimization process. The HEC-HMS model has default hard constraints that limit the range of optimized
within reasonable physical intervals. Values within hard constraints do not cause numeric instabilities or
errors in computations. Soft constraints can be defined by the user and allow limiting the range of
values within the wider range of hard constraints.
Verification
Model verification is the process of testing model ability to simulate observed data other than used for
the calibration, with acceptable accuracy. During this process, calibrated model parameters are not
subject to change, their values kept constant. The quantitative measure of the match is again the degree
of variation between computed and observed hydrographs.
3.2.6 Model Performance
In addition to evaluation of performance model in HEC-HMS, other efficiency criteria such as coefficient
of determination, R2 [Nash and Sutcliff (NSE), 1970] and percent difference D. were used.
The r2 coefficient and NSE simulation efficiency measure how well trends in the measured data are
reproduced by the simulated results over a specified period and for a specified time step. The range of
values for r2 is 1.0 (best) to 0.0
The r2 coefficient for n time steps calculated as:
�* � c∑ (def degggghijO )(dkf dkgggg)l#∑ (def degggg)#hijO ∑ (dkf dkgggg)#hijO (3.22)
Where: Qsi is the simulated value, Qoi is the measured values, [�gggg is the average simulated value, [�gggg is
the average measured value
The NSE simulation efficiency for n time steps calculated as:
NSE� p1 � ∑ (def dkf)#hijO∑ (dkf dkgggg)#hijO r (3.23)
Where: Qsi is the simulated value, Qoi is the measured values, [�gggg is the average simulated value
The statistical index of modeling efficiency (NSE) values range from 1.0(best) to negative infinity.
The percent difference for a quantity (D) over a specified period with total days calculated from
measured and simulated values of the quantity in each model time step as:

[IDENTIFICATION AND HYDROLOGICAL CHARACTERIZATION OF SURFACE WATER STORAGE IN UBN] 2009
Arba Minch University | 33
s � 100 p∑ dkfhijO ∑ defhijO∑ dkfhijO r (3.24)
Where: Qsi is the simulated value, Qoi is the measured values
A value close to 0% is best for D. A negative value indicates model over estimation and a positive value
indicate model under estimation.
3.2.7 Reservoir Performance
A quantitative measure of performance of water resource systems is useful in assessing the operational
strategies of the potential future dam projects. Hashimoto et al. (1982) suggested the use of indices of
reliability, resiliency, and vulnerability, for classifying and assessing the performance of water resource
systems. The simulation for both Koga and Gomit reservoir was undertaken by considering long term
series with their irrigation water release and environmental flow release. Then the simulation was used
for characterization of both storage based on the above performance indices that are reliability,
resilience and vulnerability.
Reliability is a measure of frequency or probability that a system is in a satisfactory state meeting a given
criterion. Resiliency generally indicates a measure of how quickly a system recovers from failure once
failure has occurred. Vulnerability is defined as (1) the maximum duration of system failure; and (2) the
cumulative maximum magnitude of water shortage during a system failure. The computational scheme
for these indices in this study was done by defining a (dead storage) storage criterion (C) as the
minimum required storage, the simulated daily storage (Xt) at time t can be classified as a satisfactory
state (S) or a failure state (F), i.e. If Xt ` C then Xt ε S and Zt � 1 (3.25) Else Xt ε F and Zt � 0 Where: Zt is a generic indicator variable, the dead storage of the total storage used as a criterion and,
thus, system failure occurs when storage is below the criterion on any given day. Another indicator, Wt,
which represents a transition from F to S, is defined as:
� � ^1, � � � ��� � F 1 � &0, ] ������� � (3.26)
If the periods of Xt in F are defined as U1, U2,…, UN where N is the number of F periods, then reliability,
resilience, and vulnerability indices during the total time period (T) can be defined as:
a�G���G� 2 � ∑ ��Cfb-D (3.27)

[IDENTIFICATION AND HYDROLOGICAL CHARACTERIZATION OF SURFACE WATER STORAGE IN UBN] 2009
Arba Minch University | 34
a���G����2 � ∑ �9�ijOC ∑ �9�ijO (3.28)
�1G������G� 2 D�3� � 3�I�B1, B2, … . , B�� (3.29) These indices were previously used to evaluate reservoir operations (Hashimoto et al. 1982; Moy et al.
1986) and water distribution systems (Zongxue et al. 1998); manage water quality of a river (Maier et al.
2001) as well as assessing climate change impacts on water resource systems (Fowler et al.2003).

[IDENTIFICATION AND HYDROLOGICAL CHARACTERIZATION OF SURFACE WATER STORAGE IN UBN] 2009
Arba Minch University | 35

[IDENTIFICATION AND HYDROLOGICAL CHARACTERIZATION OF SURFACE WATER STORAGE IN UBN] 2009
Arba Minch University | 36
CHAPTER FOUR
4. METHODOLOGIES AND PROCEDURES
This chapter explains the procedure used to meet the objectives of the study.
� Terrain preprocessing using DEM, ARC-GIS and Arc-Hydro tool for preparation of spatial
hydrographic features, used as an input to HEC-GeoHMS.
� Curve Number (CN) Grid generation using land use and soil data of the study areas.
� HEC-GeoHMS data processing for watershed delineation and for the generation of a basin
model file and importing it in-to HEC-HMS
� Calibration and validation of rainfall runoff modeling, generating volume of discharge and
the runoff hydrographs of the study area using HEC-HMS using historical data.
� Reservoir simulation in HEC-HMS and checking reliability, resilience and vulnerability of
reservoirs for irrigation, hydropower and downstream release
4.1 Terrain Preprocessing
The purpose of terrain preprocessing was to perform an initial analysis of the terrain and to prepare the
dataset for further processing. A Digital Elevation Model (DEM) of the study area is required as input for
terrain preprocessing: a DEM is a grid in which each cell assigned the average elevation on the area
represented by the cell. The DEM must be in ESRI GRID format. There are several tools available for
terrain pre-processing. In this research, Arc Hydro tools (version that works with Arc-GIS 9.2) was used
to process a 90-meter DEM to delineate watershed, sub-watersheds, stream network and some other
watershed characteristics that collectively describe the drainage patterns of a basin. The results were
used to create input files for HMS hydrologic models.
The steps for the preprocessing of arc hydro are
� DEM reconditioning: The DEM Reconditioning function modifies Digital Elevation Models (DEMs) by
imposing linear features onto them (burning/fencing).
� Fill sinks: The Fill Sinks function fills sinks in a grid. If a cell surrounded by higher elevation cells, the
water is trapped in that cell and cannot flow. The Fill Sinks function modifies the elevation value to
eliminate these problems.
� Flow direction: takes a grid ("Hydro DEM" tag) as input, and computes the corresponding flow
direction grid ("Flow Direction Grid" tag). The values in the cells of the flow direction grid indicate
the direction of the steepest descent from that cell.

[IDENTIFICATION AND HYDROLOGICAL CHARACTERIZATION OF SURFACE WATER STORAGE IN UBN] 2009
Arba Minch University | 37
� Flow Accumulation: takes as input a flow direction grid. It computes the associated flow
accumulation grid ("Flow Accumulation Grid" tag) that contains the accumulated number of cells
upstream of a cell, for each cell in the input grid.
� Stream definition: takes a flow accumulation grid as input and creates a Stream Grid ("Stream Grid"
tag) for a user-defined threshold. This threshold is defined either as a number of cells (default 1%)
or as a drainage area in square kilometers.
� Stream segmentation: creates a grid of stream segments that have a unique identification. A
segment may be either a head segment, or a segment between two segment junctions.
� Catchment grid delineation: creates a grid in which each cell carries a value (grid code) indicating to
which catchment the cell belongs. The value corresponds to the value carried by the stream
segment that drains that area, defined in the input Link grid.
� Catchment polygon processing: takes as input a catchment grid and converts it into a catchment
polygon feature class ("Catchment" tag)
� Drainage line processing: converts the input Stream Link grid into a Drainage Line feature class.
Each line in the feature class carries the identifier of the catchment in which it resides.
� Drainage point processing: allows generating the drainage points associated to the catchments.
� Longest flow path for catchments: generates the longest flow path for each catchment in the input
Catchment feature class.
� Slope: allows generating the slope grid in percent for a given DEM.
� Slope greater than 30: allows generating a grid where the cells having a slope greater than or equal
to 30% have a value of 1, and all the others 0. It requires as input a slope grid containing the slope in
percent.
� Slope greater than 30 and facing north: allows generating a grid where the cells having a slope
greater than or equal to 30% and facing north have the value 1. All other cells take the value 0.
� Weighted flow accumulation: used to compute the runoff or the load for each cell. This function
takes as input a flow direction grid and a weight grid. It computes the associated weighted flow
accumulation grid ("Weighted Flow Accumulation Grid" tag) that contains the accumulated values
(weight) of cells upstream of a cell, for each cell in the input flow direction grid.
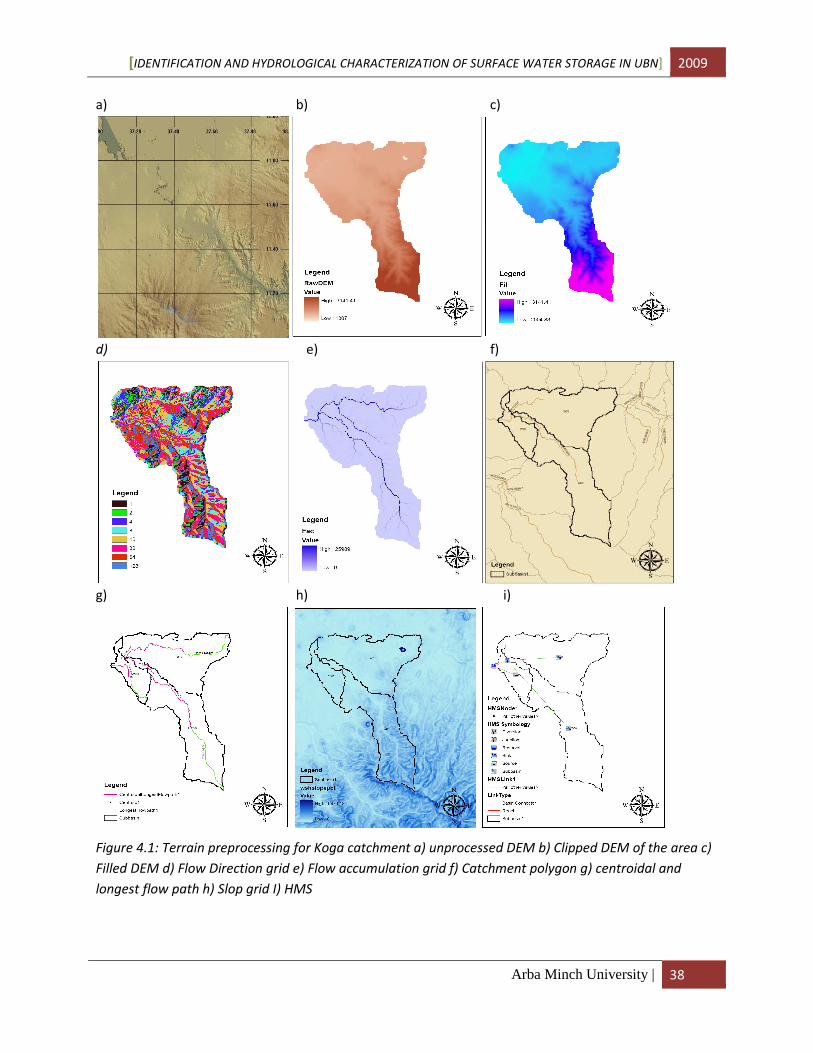
[IDENTIFICATION AND HYDROLOGICAL CHARACTERIZATION OF SURFACE WATER STORAGE IN UBN] 2009
Arba Minch University | 38
a) b) c)
d) e) f)
g) h) i)
Figure 4.1: Terrain preprocessing for Koga catchment a) unprocessed DEM b) Clipped DEM of the area c)
Filled DEM d) Flow Direction grid e) Flow accumulation grid f) Catchment polygon g) centroidal and
longest flow path h) Slop grid I) HMS

[IDENTIFICATION AND HYDROLOGICAL CHARACTERIZATION OF SURFACE WATER STORAGE IN UBN] 2009
Arba Minch University | 39
a) b)
c) d)
e) f)
g) h)
Figure4.2: Terrain Preprocessing for Gomit catchment a) unprocessed DEM b) Clipped DEM of the area c)
Flow Direction grid d) Flow accumulation grid e) centroidal and longest flow path f) Slop grid g)
Catchment polygon h) HMS

[IDENTIFICATION AND HYDROLOGICAL CHARACTERIZATION OF SURFACE WATER STORAGE IN UBN] 2009
Arba Minch University | 40
4.2 Generation of SCS Curve Number Grid
SCS curve number grid (CN grid) is used by many hydrologic models to extract the curve number for
watersheds, Soil and land use data are used to create a curve number grid using HEC-GeoHMS 4.2
(ArcGIS 9.2 version).
Clipped Soil and land use from ETHIO-GIS (Figure 5.1 and 5.2, in chapter five) were joined to create
Unioned Land Use feature by using the analyst tools in Arc-GIS. Then after preparation of a look-up table
that will have curve numbers for different combinations of land uses and soil groups (SCS Curve number
from TR55 Manual used). Finally, HEC-GeoHMS 4.2 uses the spatial features in conjunction with the
look-up table to create curve number grid (Figure 4.3 and 4.4). (Attribute table and CN look up table
available in the appendix C.3 and C.4)
Figure 4.3: Koga CN grid

[IDENTIFICATION AND HYDROLOGICAL CHARACTERIZATION OF SURFACE WATER STORAGE IN UBN] 2009
Arba Minch University | 41
Figure 4.4: Gomit CN grids
4.3 Basin Model Development Using HEC-Geo-HMS
4.3.1 Hydrographic Features
One of the main input parameters for GeoHMS processing is spatial hydrographic features. The GeoHMS
tool is designed to have the output files from the Arc Hydro terrain preprocessing tools as inputs. These
Hydrographic features, which are already executed using Arc Hydro are flow direction grid (Fdr), flow
accumulation grid (Fac), stream grid (Str), stream link grid (Lnk),catchment grid (Cat),curve number grid,
slope grid.
4.3.2 GeoHMS Data Processing
The point of the extensive data preprocessing using Arc-Hydro was to create input files for the GeoHMS
tools. GeoHMS uses the output files from Arc Hydro and automatically create subbasins, longest and
centroidal flow paths, basin centroid and other watershed properties. Additionally, parameters such as
slope, length and average curve number are assigned to flow lines and basins. In general, GeoHMS uses
spatial analyst tools to convert geographic information into parameters for each of the basins and flow
lines. These parameters are used to create a HEC-HMS model that can be used within the HEC-HMS
program. Table 4.1a) to c) basin model prepared in HEC-GeoHMS (Basin model representations of the
catchment in HEC-GeoHMS shown on figure 4.5 and figure 4.6)

[IDENTIFICATION AND HYDROLOGICAL CHARACTERIZATION OF SURFACE WATER STORAGE IN UBN] 2009
Arba Minch University | 42
Figure 4.5: HMS representation of Koga catchment

[IDENTIFICATION AND HYDROLOGICAL CHARACTERIZATION OF SURFACE WATER STORAGE IN UBN] 2009
Arba Minch University | 43
Figure 4.6: HMS representation of Gomit catchment
Table 4.1 Gomit basin characteristics
Table 4.2 a) and b) Koga basin characteristics
Sub Basin
NAME
Shape
Length Shape Area Basin Slope
Area
HMS Longest FL Centroidal FL
Centroidal Elevation
W70 65880 92105100 5.00225 92.105 22861.968 12647.195 2087.264
W80 82440 89456400 15.59100 89.456 31984.497 19537.815 2156.585
W90 37980 22145400 2.33371 22.145 11009.331 5043.557 2037.069
4.4 HEC-HMS model Development
After converting data from a geographic to a hydrologic data structure in the HEC GeoHMS the next step
was configuration of the HMS model. HEC-HMS is a graphical user interface model that requires the
construction of three-model components and data manager that are required for a run: Basin Model,
Meteorological Model, and Control Specification Model.
Basin Name Area HMS Centroidal FL(m) Longest FL(m) Elev U/s(masl) Elev D/s(masl) Slope
Gomit 24.9564 3867.35 8535.65 2649.35 2357.3 0.03
River Name ElevUP HMS ElevDS HMS RivLen HMS Slope
R40 2022.201 2008.804 7668.412 0.001747
R50 2008.804 2003.990 3297.792 0.001460
R60 2129.991 2008.804 19556.455 0.006197

[IDENTIFICATION AND HYDROLOGICAL CHARACTERIZATION OF SURFACE WATER STORAGE IN UBN] 2009
Arba Minch University | 44
4.4.1 Basin Model
The basin model represents the spatial configuration of the watershed. The basin model, for instance,
contains information relevant to the physical attributes of the model, such as basin areas, river reach
connectivity, or reservoir data. The basin model of Koga and Gomit catchment imported that developed
in the previous section. Once imported in HEC HMS, the watershed elements can be modified, added or
removed. In the basin model, individual hydrologic elements can be connected in a network imitating
basin hydrologic structure. HEC-HMS allows seven different watershed elements for construction of the
basin model: sub-basins, reach, junction, source, sink, reservoir and diversion.
The Koga and Gomit basin contains different hydrologic elements but both of them have Subbasin,
reservoir and outlet junction, in addition Koga has reach element. Individual hydrologic element labels
used are shown below with their description
Table 4.3: HMS element
Hydrologic Element Description
Subbasin
Used to represent the physical watershed
Reach
Used to convey (route) stream flow downstream in the basin model
Reservoir
Used to model the detention and attenuation of hydrograph caused by a
reservoir or detention pond
Junction
Used to combine flows from upstream reaches and sub-basins
Diversion
Used for modeling streamflow leaving the main channel.
On the basis of the available data and evaluation of model components, simulation was undertaken with
two model sets:
i) Combinations of Deficit Constant loss, Snyder unit hydrograph and monthly constant
baseflow models
ii) Combinations of Deficit –Constant loss model, SCS UH model, and monthly constant base
flow model.

[IDENTIFICATION AND HYDROLOGICAL CHARACTERIZATION OF SURFACE WATER STORAGE IN UBN] 2009
Arba Minch University | 45
To model the runoff processes in each sub-basin it was necessary to establish initial values for 9
parameters: 4 for the deficit and constant-rate loss model, 2 for Snyder’s model, 2 for SCS model and 1
for the routing Lag model. Some parameters were imported from the basin model (e.g. basin lag) and
others were entered based on type of soil class and acceptable ranges. (Acceptable ranges of
parameters of each model category available in appendix B.2.)
4.4.2 Meteorological Model
The meteorological model in HEC-HMS is the major component that is responsible for the definition of
the meteorological boundary conditions for the subbasins. It includes precipitation, evapotranspiration
and snowmelt methods to be used in simulations. In the present version HEC HMS 3.3 there are four
methods in the HMS model to distribute observed rainfall over the basin: user hyetograph, user gage
weighting, inverse-distance gage weighting, and gridded precipitation. The user specified precipitation
method was used in the model simulations. For precipitation gage input data the most representative
rain gages among nearby station for Koga and Gomit catchments were selected using the Thessien
polygon method. Koga used stations at Merawi and Adet and for the Gomit basin one station at Mekane
Yesus was used. All data transfer was achieved using HEC-DSS.
4.4.3 Control Specification Model
The Control Specification Model specifies the start and end of the computation period and the
computation time interval. Since the available data was daily the computation time interval of this study
was one day. The computation period was divided into a calibration and a validation period. Finally the
model was used for reservoir simulation.
4.4.4 Model Parameter Calibrations and Validations
Each method in HEC-HMS has parameters and the initial values of these parameters need to entered as
input to the model to obtain the simulated runoff hydrographs. Some of the parameters were estimated
by observation and measurements of stream and basin characteristics, but some of them cannot be
estimated. When the required parameters cannot be estimated accurately, the model parameters are
calibrated, i.e. in the presence of rainfall and runoff data the optimum parameters are found because of
a systematic search process that yield the best fit between the observed runoff and the computed
runoff. This systematic search process is called optimization. Optimization begins from initial parameter
estimates and adjusts them so that the simulated results match the observed streamflow as closely as
possible.

[IDENTIFICATION AND HYDROLOGICAL CHARACTERIZATION OF SURFACE WATER STORAGE IN UBN] 2009
Arba Minch University | 46
In this study, Nelder and Mead search algorithm was selected to move from the initial estimates to the
final best estimates by considering the sum squared residuals objective function.
Koga watershed uses six years of data from 2001 to 2006 for calibration and four years of data from
1996 to 1999 for validation. Manual and automatic parameter adjustment was used for optimization of
observed and simulated flow data. In contrast because of lack of data only calibration could be
conducted for the Gomit watershed. This was undertaken using two years of reservoir level data from
August 2006 to July 2008. Manual parameter adjustment was used for optimization of observed and
simulated reservoir level. Most of the initial parameters used based on the watershed characteristics.
4.4.5 Model Performance
The performance of a model must be evaluated on the extent of its accuracy, consistency and
adaptability (Goswami et al., 2005). A forecast efficiency criterion is therefore necessary to judge the
performance of the model. Assessing performance of a hydrologic model (Krause et al., 2005) requires
subjective and/or objective estimates of the closeness of the simulated behavior of the model to
observations.
4.4.6 Calibration and Validation Performance
In this study, the objective function used for measuring the goodness of fit between the computed and
the observed hydrographs is Sum of Squared Residuals with Nelder Mead search algorithm. HEC-HMS
computes the percent errors in peaks and volumes and gives these values in the optimization result
tables automatically. These two values used as goodness-of-fit criteria between observed flow and the
simulated flows. Additionally, three statistical criteria were used to evaluate the calibrated model
performance:
i) Pearson’s Coefficient of Determination (R2)
ii) Nash and Sutcliffe Model Efficiency (NSE) [Nash and Sutcliffe, 1970] and
iii) Percent difference D.
These were computed externally.
4.4.7 Reservoir Simulation
In HEC HMS the reservoir element used to assign for both Koga and Gomit reservoirs instead of outlets
and all flow coming from upstream subbasin, consider as inflow to reservoir. Reservoir element for Koga
were considered only during the reservoir performance simulation period, not the calibration and
validation period (outlet element considered for this period) because the dam is not constructed during
validation and calibration period. However, for Gomit, the reservoir element considered for both case.

[IDENTIFICATION AND HYDROLOGICAL CHARACTERIZATION OF SURFACE WATER STORAGE IN UBN] 2009
Arba Minch University | 47
For both Gomit and Koga reservoirs the routing method selected was Outflow Structures. In addition,
data for elevation-storage-area, spillway, release (for irrigation and environmental), monthly reservoir
evaporation were entered.
Finally, reservoir simulation was undertaken using the optimized parameters, long-term historical
rainfall data and by assuming the reservoir was full initially. The simulation period for Koga was from
1983 to 2004 and for Gomit from 1996 to 2006.
The performance of the reservoirs was evaluated based on reliability, resiliency and vulnerability (RRV)
performance indices. Base line condition selected to decide whether the reservoir is in safe or failure
state is dead storage level for irrigation and environmental release. Dead storage level for Koga and
Gomit are 2007.5 and 2361.589 masl respectively.
Koga hydropower potential of 32 Kilo Watt (KW) was investigated during feasibility study, it is generate
by using compensation flows discharge from the reservoir with head range of 15.5 m to 8.5 m (reservior
fluctuates from EL 2015 to EL 2008.5) assuming turbines are connected to low level outlet. The RRV of
reservoir also evaluated for hydropower generation using minimum required reservior elevation of
2008.5 masl.
4.4.8 Climate Scenarios
The climate in most of the Upper Blue Nile River Basin is likely to become wetter and warmer in the
2050s (2040-2069).The potential changes in mean annual precipitation from six GCMs range from -11%
by CSIRO to 44% by CCSR/NIES with a change of 11% from the weighted average scenario. (Kim, U;
Kaluarachchi, J. J.; Smakhtin, V. U. 2008)
The average changes of climate variables and runoff from the six sub-basins are shown in Figure 4.7.
Compared to the southwest of the UBN, the northeast shows a more pronounced increasing trend in
precipitation and a less pronounced increasing trend in temperature. These trends result in a noticeable
increase in runoff in the northeast compared to the southeast. It is, therefore, possible to suggest that
water availability will most likely improve in this area. (Kim, U; Kaluarachchi, J. J.; Smakhtin, V. U. 2008)
In this study, climate scenario considered to look at the change in values of performance indices by
increasing and decreasing each daily rainfall hypothetically. Since, Koga and Gomit catchment located in
subbasin 6 as per figure 4.7, by 2050 the precipitation increased by 15 to 20%.
Therefore, hypothetical 20% increase of daily rainfall was assumed as the upper limit. As mentioned
above the mean annual precipitation potentially decrease by -11% but the lower limit of -20 % used in
order to see performance indices sensitivity.

[IDENTIFICATION AND HYDROLOGICAL CHARACTERIZATION OF SURFACE WATER STORAGE IN UBN] 2009
Arba Minch University | 48
Figure 4.7: Spatial distribution of the average annual changes in climate variables and runoff under the
weighted scenario for the 2050s: (a) precipitation, (b) temperature, (c) potential evapotranspiration, and
(d) runoff.

[IDENTIFICATION AND HYDROLOGICAL CHARACTERIZATION OF SURFACE WATER STORAGE IN UBN] 2009
Arba Minch University | 49
CHAPTER FIVE
5. DATA AND ANALYSIS
The purpose of this chapter is to bring all the available data and select relevant information for the
analysis. The data sets DEM, Hydrological, Meteorological data, Land use, Land cover and Soil maps
collected.
5.1 Hydrological Data
Twenty years of daily flow data for nine stations for Koga, Gomit and nearby catchments were collected
from the Hydrology Department in the Ministry of Water Resources (MoWR). The name and location of
hydrological station is available in Appendix A.1
Flow in the Koga River is measured at Merawi (37o
02’ E and 11o 22’ N). Data for this station are available
from January 1973. A gauge was installed at the proposed dam site in 2003, but at present, no data are
available for it at the Ministry of Water Resources (MoWR). However, in the past, data from the gauging
station at the site was used to develop a relationship between there and the gauge at Merawi (Mott
MacDonald, 2004).
As shown figure 5.1, the Flow at Merawi shows different behavior year to year
Figure 5.1: Monthly flow year-to-year variation
As the Koga dam site is situated about 20kms upstream of the gauging station, discharge data obtained
at the gauging station were adjusted to dam site. In this respect, an adjustment factor for the difference
0.0
200.0
400.0
600.0
800.0
1000.0
1200.0
1400.0
1600.0
1800.0
2000.00
20
40
60
80
100
120
140
160
1970 1975 1980 1985 1990 1995 2000 2005
Me
raw
i R
ain
fall
(m
m)
Flo
w i
n m
3/s
Jul Aug Sep Oct
Jul Rainfall Aug Rainfall Sep Rainfall Oct Rainfall
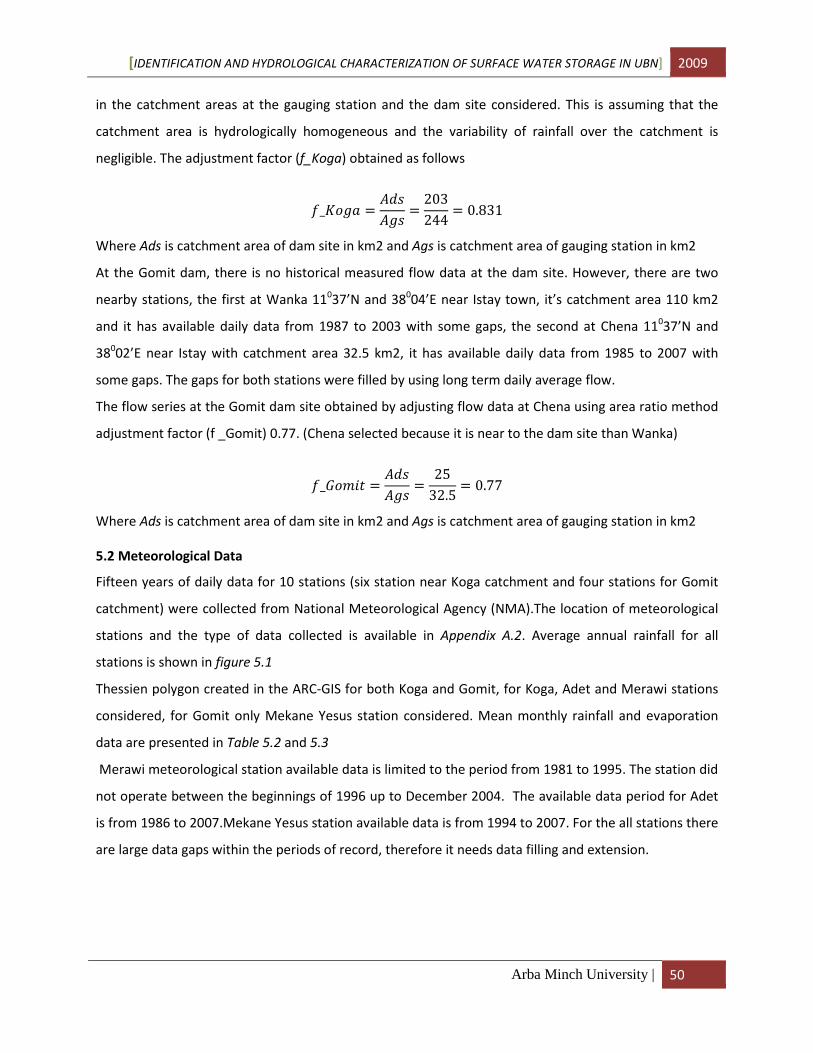
[IDENTIFICATION AND HYDROLOGICAL CHARACTERIZATION OF SURFACE WATER STORAGE IN UBN] 2009
Arba Minch University | 50
in the catchment areas at the gauging station and the dam site considered. This is assuming that the
catchment area is hydrologically homogeneous and the variability of rainfall over the catchment is
negligible. The adjustment factor (f_Koga) obtained as follows
�_\�H� � ����H� � 203244 � 0.831
Where Ads is catchment area of dam site in km2 and Ags is catchment area of gauging station in km2
At the Gomit dam, there is no historical measured flow data at the dam site. However, there are two
nearby stations, the first at Wanka 11037’N and 38
004’E near Istay town, it’s catchment area 110 km2
and it has available daily data from 1987 to 2003 with some gaps, the second at Chena 11037’N and
38002’E near Istay with catchment area 32.5 km2, it has available daily data from 1985 to 2007 with
some gaps. The gaps for both stations were filled by using long term daily average flow.
The flow series at the Gomit dam site obtained by adjusting flow data at Chena using area ratio method
adjustment factor (f _Gomit) 0.77. (Chena selected because it is near to the dam site than Wanka)
�_��3� � ����H� � 2532.5 � 0.77
Where Ads is catchment area of dam site in km2 and Ags is catchment area of gauging station in km2
5.2 Meteorological Data
Fifteen years of daily data for 10 stations (six station near Koga catchment and four stations for Gomit
catchment) were collected from National Meteorological Agency (NMA).The location of meteorological
stations and the type of data collected is available in Appendix A.2. Average annual rainfall for all
stations is shown in figure 5.1
Thessien polygon created in the ARC-GIS for both Koga and Gomit, for Koga, Adet and Merawi stations
considered, for Gomit only Mekane Yesus station considered. Mean monthly rainfall and evaporation
data are presented in Table 5.2 and 5.3
Merawi meteorological station available data is limited to the period from 1981 to 1995. The station did
not operate between the beginnings of 1996 up to December 2004. The available data period for Adet
is from 1986 to 2007.Mekane Yesus station available data is from 1994 to 2007. For the all stations there
are large data gaps within the periods of record, therefore it needs data filling and extension.
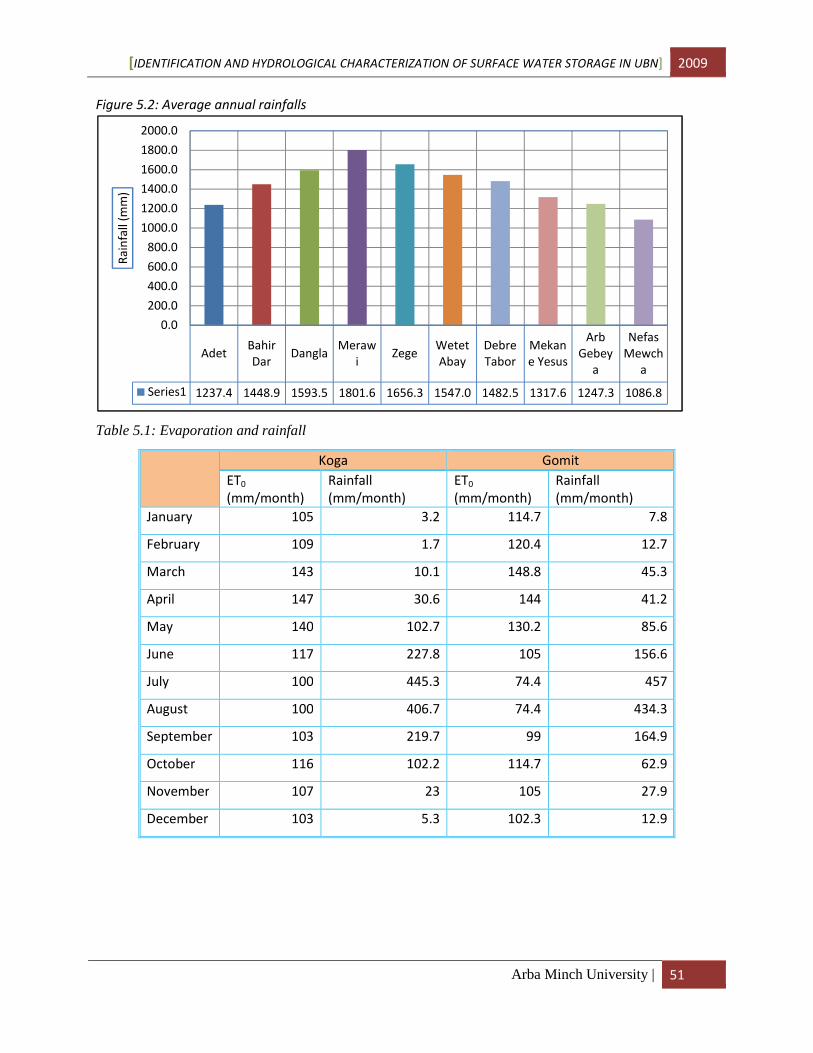
[IDENTIFICATION AND HYDROLOGICAL CHARACTERIZATION OF SURFACE WATER STORAGE IN UBN] 2009
Arba Minch University | 51
Figure 5.2: Average annual rainfalls
Table 5.1: Evaporation and rainfall
Koga Gomit
ET0
(mm/month)
Rainfall
(mm/month)
ET0
(mm/month)
Rainfall
(mm/month)
January 105 3.2 114.7 7.8
February 109 1.7 120.4 12.7
March 143 10.1 148.8 45.3
April 147 30.6 144 41.2
May 140 102.7 130.2 85.6
June 117 227.8 105 156.6
July 100 445.3 74.4 457
August 100 406.7 74.4 434.3
September 103 219.7 99 164.9
October 116 102.2 114.7 62.9
November 107 23 105 27.9
December 103 5.3 102.3 12.9
AdetBahir
DarDangla
Meraw
iZege
Wetet
Abay
Debre
Tabor
Mekan
e Yesus
Arb
Gebey
a
Nefas
Mewch
a
Series1 1237.4 1448.9 1593.5 1801.6 1656.3 1547.0 1482.5 1317.6 1247.3 1086.8
0.0
200.0
400.0
600.0
800.0
1000.0
1200.0
1400.0
1600.0
1800.0
2000.0R
ain
fall
(m
m)

[IDENTIFICATION AND HYDROLOGICAL CHARACTERIZATION OF SURFACE WATER STORAGE IN UBN] 2009
Arba Minch University | 52
Table 5.2: open water evaporation
Open Water Evaporation(mm/month)
Jan Feb Mar Apr May Jun Jul Aug Sep Oct Nov Dec Total
Koga MM 121 124 157 163 151 127 109 103 112 135 124 116 1542
Koga FS 114 118 155 159 154 128 107 109 117 131 117 109 1516
Gomit 126 132 164 158 143 115 82 82 109 126 115 113 1465
5.3 Missing Data Filling
Simple normal ratio method was used to fill stations with missing data.
Normal ratio method are expressed by the following relationship
:I � -� ((�(- � :1 F (�(* � :2 F , , , , , , , , , F (�(� � :�)
Where
PX
missing value of precipitations
PX average value of rainfall for the station in equation for recorded Period.
P1-----Pn any value of neighboring stations.
p1 -----Pn rainfall of neighboring station during missing period
n ----- Number of stations used in the computations
5.4 Checking Consistency and Homogeneity
A time series observational data is relatively consistent and homogenous if the periodic data
proportionally behaves comparable similar pattern. This proportionality tested by double - mass
analysis. The principle of double mass analysis is to plot accumulated values of the station under
investigation against accumulated value of another station, or accumulated values of the average of
other stations, over the same period. Through the double mass curve, inhomogeneities in the time
series (in particular jumps) can be investigated. For example, those originating from a change in
observer, in rain-gauge type, etc. These indicate in double mass plot, showing an inflection point in the
straight line. The data series, which is inconsistent, adjusted to consistent values by proportionality.
Double mass curve plot made for all ten stations near to Koga and Gomit catchments figure 5.2 to 5.3
shows only for Merawi and Mekane Yesus. For the rest station available in Appendix E.1. From the
double mass curve figure the stations are consistent each other.

[IDENTIFICATION AND HYDROLOGICAL CHARACTERIZATION OF SURFACE WATER STORAGE IN UBN] 2009
Arba Minch University | 53
Figure 5.2: Merawi Double mass curves
Figure 5.3: Mekane Yesus Double Mass curve
5.5 Irrigation and Downstream Release Data
The gross crop water requirements used for Gomit and Koga reservoir simulations are shown in table
5.3 and 5.4, their command area are 90ha and 7000ha respectively.
Total gross annual irrigation requirement Koga 1358 mm for irrigation efficiency of 50% and Gomit
irrigation 470 mm for irrigation efficiency of 40.5%
The environmental flow from feasibility study (FS) is used for this study and it is presented in table 5.4
with long-term average downstream flow. There is no environmental release by FS in the month of June
to September, presumably because the period through the rainy season should have sufficient water
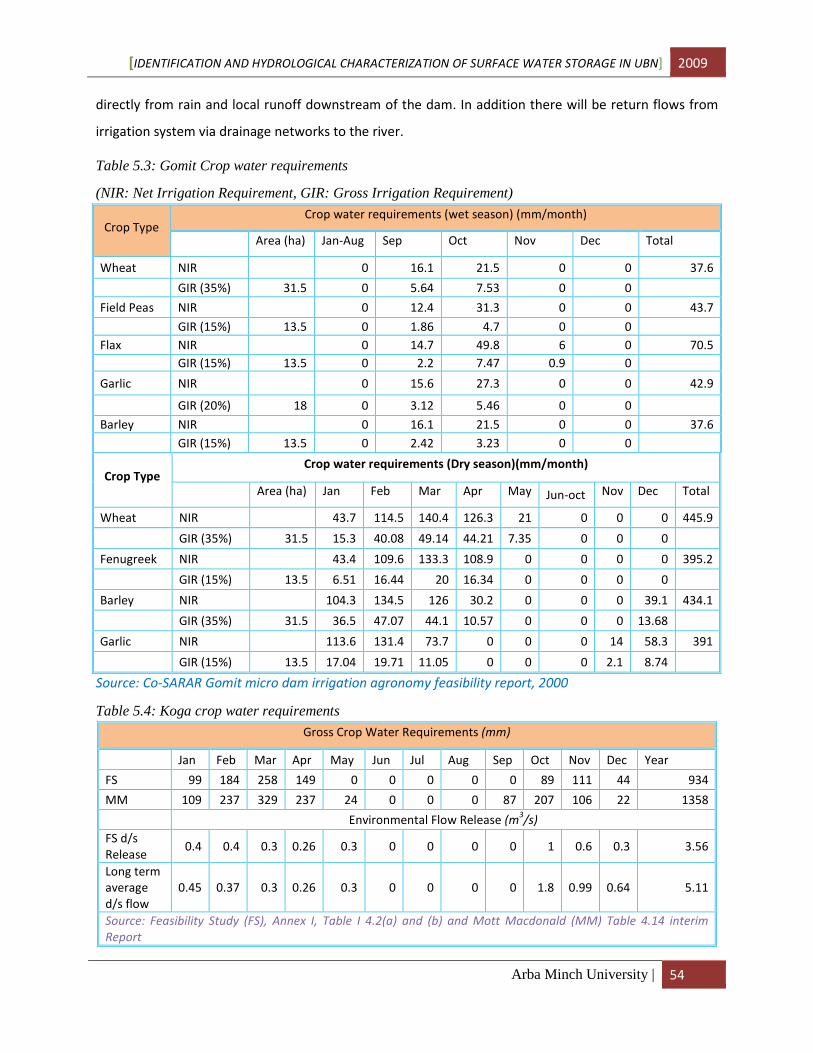
[IDENTIFICATION AND HYDROLOGICAL CHARACTERIZATION OF SURFACE WATER STORAGE IN UBN] 2009
Arba Minch University | 54
directly from rain and local runoff downstream of the dam. In addition there will be return flows from
irrigation system via drainage networks to the river.
Table 5.3: Gomit Crop water requirements
(NIR: Net Irrigation Requirement, GIR: Gross Irrigation Requirement)
Crop Type Crop water requirements (wet season) (mm/month)
Area (ha) Jan-Aug Sep Oct Nov Dec Total
Wheat NIR 0 16.1 21.5 0 0 37.6
GIR (35%) 31.5 0 5.64 7.53 0 0
Field Peas NIR 0 12.4 31.3 0 0 43.7
GIR (15%) 13.5 0 1.86 4.7 0 0
Flax NIR 0 14.7 49.8 6 0 70.5
GIR (15%) 13.5 0 2.2 7.47 0.9 0
Garlic NIR 0 15.6 27.3 0 0 42.9
GIR (20%) 18 0 3.12 5.46 0 0
Barley NIR 0 16.1 21.5 0 0 37.6
GIR (15%) 13.5 0 2.42 3.23 0 0
Crop Type Crop water requirements (Dry season)(mm/month)
Area (ha) Jan Feb Mar Apr May Jun-oct Nov Dec Total
Wheat NIR 43.7 114.5 140.4 126.3 21 0 0 0 445.9
GIR (35%) 31.5 15.3 40.08 49.14 44.21 7.35 0 0 0
Fenugreek NIR 43.4 109.6 133.3 108.9 0 0 0 0 395.2
GIR (15%) 13.5 6.51 16.44 20 16.34 0 0 0 0
Barley NIR 104.3 134.5 126 30.2 0 0 0 39.1 434.1
GIR (35%) 31.5 36.5 47.07 44.1 10.57 0 0 0 13.68
Garlic NIR 113.6 131.4 73.7 0 0 0 14 58.3 391
GIR (15%) 13.5 17.04 19.71 11.05 0 0 0 2.1 8.74
Source: Co-SARAR Gomit micro dam irrigation agronomy feasibility report, 2000
Table 5.4: Koga crop water requirements
Gross Crop Water Requirements (mm)
Jan Feb Mar Apr May Jun Jul Aug Sep Oct Nov Dec Year
FS 99 184 258 149 0 0 0 0 0 89 111 44 934
MM 109 237 329 237 24 0 0 0 87 207 106 22 1358
Environmental Flow Release (m3/s)
FS d/s
Release 0.4 0.4 0.3 0.26 0.3 0 0 0 0 1 0.6 0.3 3.56
Long term
average
d/s flow
0.45 0.37 0.3 0.26 0.3 0 0 0 0 1.8 0.99 0.64 5.11
Source: Feasibility Study (FS), Annex I, Table I 4.2(a) and (b) and Mott Macdonald (MM) Table 4.14 interim
Report

[IDENTIFICATION AND HYDROLOGICAL CHARACTERIZATION OF SURFACE WATER STORAGE IN UBN] 2009
Arba Minch University | 55
5.5 DEM (Digital Elevation Model)
The DEM 90*90 of Ethiopia obtained from Ministry of Water Resource was used to delineate the study
area. The DEM was processed according to the location of the study area. The full process of the DEM is
described in the methodology.
5.6 Land Use, Land Cover, Soils
The soil and land use data of Ethiopia obtained from Ministry of Water Resource was used to clip soil
and land use grid of the study area.
5.6.1 Koga Soil and Land use
Major and dominant soil types identified in the watersheds are chromic vertisols, Dystric gleysols, Pellic
vertisols, Eutric nitisols, chromic cambisols, chromic luvisols, and Leptosols.(fig 5.4 and Table 5.3) The
most dominant soil types are chromic vertisols, Dystric gleysols, and Pellic vertisols.
Figure 5.4: Koga soil grids

[IDENTIFICATION AND HYDROLOGICAL CHARACTERIZATION OF SURFACE WATER STORAGE IN UBN] 2009
Arba Minch University | 56
Table 5.5: Koga Soil data
No SOIL_TYPE Area(km2) Total Watershed %
1 Chromic vertisols 54.15 26.58
2 Dystric gleysols 56.86 27.91
3 Pellic vertisols 51.41 25.24
4 No data 2.19 1.07
5 Eutric nitisols 13.57 6.66
6 Chromic cambisols 14.01 6.88
7 Chromic luvisols 11.39 5.59
8 Leptosols 0.13 0.06
Total 203.71 100.00
The land cover for the Koga basin is mainly characterized by dominantly cultivated, and grassland,
Shrubland, Wetland and plantation according to the Ministry of Water Resources (Ethiopia) land cover
classification figure 5.5.
Figure 5.5: Koga land use grid

[IDENTIFICATION AND HYDROLOGICAL CHARACTERIZATION OF SURFACE WATER STORAGE IN UBN] 2009
Arba Minch University | 57
Table 5.6: land Use grids
No LC_TYPE
Area
(km2) Total Watershed %
1 Cultivation
Cultivated Land; Rainfed; Cereal Land Cover
System; lightly stocked 9.37 4.60
Cultivated Land; Rainfed; Cereal Land Cover
System; moderately stocked 29.68 14.57
Cultivated Land; Rainfed; Cereal Land Cover
System; unstocked (woody pl) 29.15 14.31
2 Grassland
Grassland; moderately stocked 0.92 0.45
Grassland; unstocked (woody plant) 41.93 20.59
Grassland; unstocked (woody plant),Wetland;
Seasonal Swamp / Marsh 44.01 21.61
3 Shrubland
Shrubland; Dense (>50% woody cover),Woodland;
Open (20-50% tree cover) 1.53 0.75
Shrubland; Open (20-50% woody cover) 0.84 0.41
Shrubland; Dense (>50% woody cover) 33.63 16.51
4 Wetland Wetland; Perennial Swamp / Marsh 9.76 4.79
5 Plantation Forest; Plantation forest; Open (20-50% crown
cover) 2.87 1.41
Total 203.70 100.00
5.6.2 Gomit Soil and Land Use
Major and dominant soil types identified in the watershed are Calcic Xerosols Eutric Regosols (fig 5.6 (a)
and table 5.7).
Figure 5.6: Gomit watershed Soil and land use grid
a) Soil grid B) Land use grid
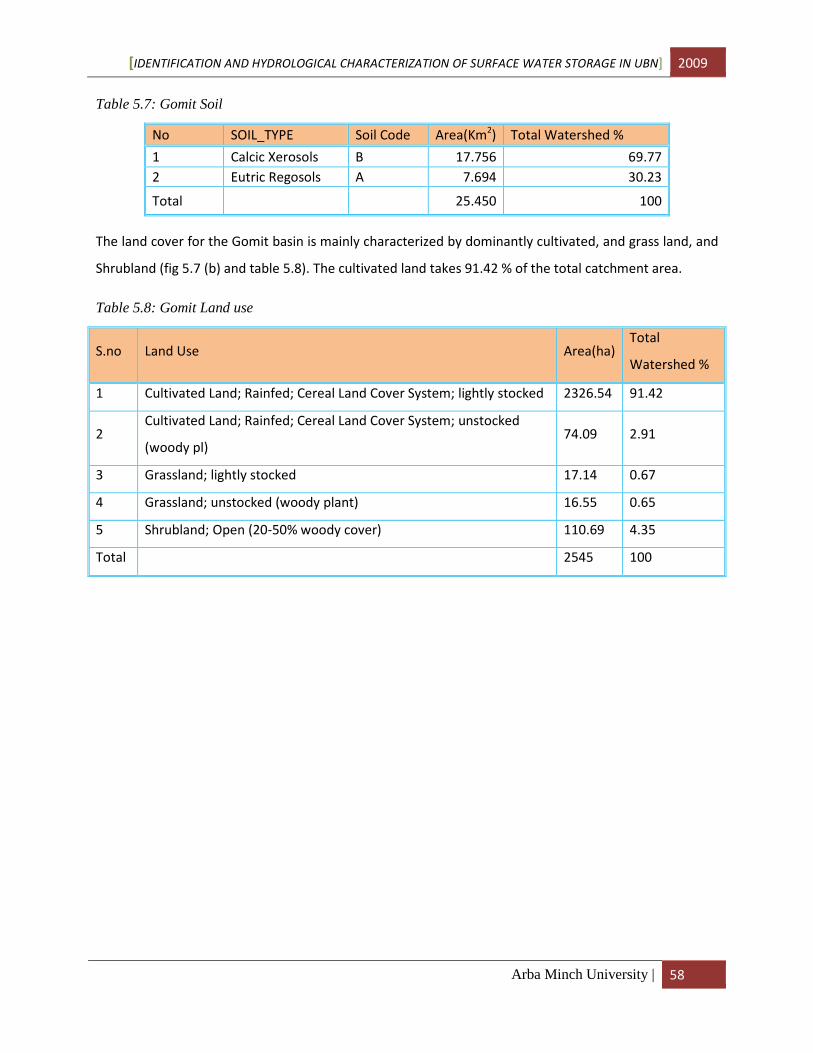
[IDENTIFICATION AND HYDROLOGICAL CHARACTERIZATION OF SURFACE WATER STORAGE IN UBN] 2009
Arba Minch University | 58
Table 5.7: Gomit Soil
No SOIL_TYPE Soil Code Area(Km2) Total Watershed %
1 Calcic Xerosols B 17.756 69.77
2 Eutric Regosols A 7.694 30.23
Total 25.450 100
The land cover for the Gomit basin is mainly characterized by dominantly cultivated, and grass land, and
Shrubland (fig 5.7 (b) and table 5.8). The cultivated land takes 91.42 % of the total catchment area.
Table 5.8: Gomit Land use
S.no Land Use Area(ha) Total
Watershed %
1 Cultivated Land; Rainfed; Cereal Land Cover System; lightly stocked 2326.54 91.42
2 Cultivated Land; Rainfed; Cereal Land Cover System; unstocked
(woody pl) 74.09 2.91
3 Grassland; lightly stocked 17.14 0.67
4 Grassland; unstocked (woody plant) 16.55 0.65
5 Shrubland; Open (20-50% woody cover) 110.69 4.35
Total 2545 100

[IDENTIFICATION AND HYDROLOGICAL CHARACTERIZATION OF SURFACE WATER STORAGE IN UBN] 2009
Arba Minch University | 59
CHAPTER SIX
6 RESULT AND DISSCUSION
6.1 HEC-HMS Results
The rainfall runoff modeling for both Koga and Gomit watershed was conducted using two
transformation methods. The first combination was Deficit constant loss, Snyder unit hydrograph
transformation and monthly constant base flow (DcSMc) and the second combination was Deficit
constant loss, SCS unit hydrograph transformation and monthly constant base flow (DcSCSMc). The SCS
loss (curve number) method was tried in the above two combination but the result was very weak so it
was not considered, this could be due to the low resolution of soil and land use grid, this loss method is
not effective for long-term simulation in addition this loss method not be effective for Ethiopia it is
developed for USA.
6.1.1 Calibration and Verification Result
Daily and monthly discharge data at the Koga dam site from 1996 to 2006 was used for model
calibration (2001 to 2006) and validation (1996 to 1999) of Koga dam watershed. The latest data were
used for calibration because most of the data for this period is not in filled.
Summary results in HEC HMS for a combination DcSMc shown on table 6.1, in addition three Calibration
performance result, are shown in figure 6.1 and 6.3. The first performance evaluation Nash and Sutcliffe
Model Efficiency (NSE) [Nash and Sutcliffe, 1970] for daily stream flow calibration is 0.606 and 0.881 for
monthly Calibration. The second performance evaluation result that is Pearson’s Coefficient of
Determination (R2) gives 0.61 and 0.883 for daily and monthly calibration. The third performance
evaluation result, volumetric fit (D), gives 0.01 % for daily and 2.8 % for monthly.
Table 6.1 Koga objective function result
Measure Simulated Observed Difference Percent Difference
Volume (mm) 7854.716 8025.447 -170.73 -2.13
Peak Flow (M3/S) 33.416 86.419 -53.003 -61.3
Time of Peak 27-Aug-06 00:00 26-Aug-06 00:00
Time of Center of Mass 1-Sep-01 02:16 11-Aug-01 13:06
Model validation for this study was used to determine the effectiveness of the parameterization and
calibration methodologies. The selected validation period was before the respective calibration period.
Daily and Monthly validation result for three-efficiency evaluation (figure 6.2 and 6.4) are 0.622 and

[IDENTIFICATION AND HYDROLOGICAL CHARACTERIZATION OF SURFACE WATER STORAGE IN UBN] 2009
Arba Minch University | 60
0.882 for NSE, 0.63 and 0.919 for R2, and 0.17 % and 1 % for D. These values are higher than the ones
obtained through the model calibration process, this improvement occurred possibly due to Merawi
rainfall data, during calibration the data is both filled and observed but during validation the filled data
used. However, the improvement shows the model is capable of making accurate predictions for periods
outside a calibration period and no need of doing recalibration process.
The result for the second combination DcSCSMc shows better calibration and validation result in R2. It
varies from 0.60 to 0.601 respectively.
Generally, the model under estimates peak flow for all daily simulation period however, for monthly it
underestimates considerably only for year 2006. The volumetric fit shows very good fit of observed and
simulated flow for both monthly and daily, even though the under estimation is greater for monthly
simulation.
The transferred flow data from the Chena station did not give better result in any of performance
evaluation criteria therefore two years of Daily Gomit reservoir level data from May 2006 to July 2008
were used for model calibration.
Calibration summary result for a combination DcSMc are shown in table 6.2 and the other results of
model performance (figure 6.5 and 6.6) gave NSE of 0.64 and R2 of 0.67 for daily comparisons and NSE of
0.785 and R2 of 0.795 for monthly comparisons. The daily and monthly reservior simulation graph (figure
6.5) shows some timing gap in the rise of the reservior water surface specially the daily simulation. This
may be due to non-availability of measured rainfall near the reservior within the catchment.
Table 6.2 Gomit calibration summery table
Gomit Summery Table
Peak inflow 9.830 (m3/S)
Peak outflow 10.106 (m3/S)
Total inflow 822.312 (mm)
Total outflow 815.122 (mm)
Date/Time of Peak Inflow 28-Jun-06
Date/Time of Peak Outflow 28-Jun-06
Peak Storage 1094.986 (1000 m3)
Peak Elevation 2367.386 (m)

[IDENTIFICATION AND HYDROLOGICAL CHARACTERIZATION OF SURFACE WATER STORAGE IN UBN] 2009
Arba Minch University | 61
Figure 6.1 Calibration of observed and simulated daily and monthly flow hydrograph of Koga watershed at dam site, Period (2001-2006)
Figure 6.2 Validation of observed and simulated daily and monthly flow hydrograph of Koga watershed at dam site, Period (1996-1999)

[IDENTIFICATION AND HYDROLOGICAL CHARACTERIZATION OF SURFACE WATER STORAGE IN UBN] 2009
Arba Minch University | 62
Figure 6.3 Scatter plot of observed and simulated discharge for Koga watershed at dam site, Period (2001-2006)
Figure 6.4 Scatter plot of observed and simulated discharge for Koga watershed at dam site, Period (1996-1999)

[IDENTIFICATION AND HYDROLOGICAL CHARACTERIZATION OF SURFACE WATER STORAGE IN UBN] 2009
Arba Minch University | 63
Figure 6.5 Gomit reservoir level daily and monthly calibrations
0
5
10
15
20
25
30
35
40
45
502365
2365.5
2366
2366.5
2367
2367.5
2368
2368.5
2369
Ra
infa
ll (
mm
)
Re
serv
ior
Ele
vati
on
(m
)
Monthly Calibration
Rainfall Elevation Sim(M) Obs Elevation (M)

[IDENTIFICATION AND HYDROLOGICAL CHARACTERIZATION OF SURFACE WATER STORAGE IN UBN] 2009
Arba Minch University | 64
6.1.2. Reservoir Simulation
6.1.2.1. Koga reservoir simulation
Koga reservoir simulation in HEC-HMS (figure 6.6) for rainfall (RF) data from 1987 to 2006, irrigation
demand and downstream release for the same period, Gives reliability, resiliency and vulnerability (RRV)
results which is presented in Table 6.3 using a baseline criterion of dead storage level of 2007.5masl. The
result shows the maximum day in which the irrigation demand may not fulfilled within the simulation
period is 37 day.
In addition, the simulation was also used to check the RRV of storage for minimum power generation
using base line of minimum elevation of 2008.5 masl for power generation. The results presented in
Table 6.4; it shows the reservior fail to generate power for a maximum of 66 day. Since baseline
elevation for hydropower is above irrigation baseline, the reliability is less than that of irrigation.
The hypothetical RF change scenarios from -20% to +20% used to check effect on RRV for irrigation and
hydropower requirement, Table 6.3 and 6.4 show change of RRV values. Vulnerability of irrigation is
more sensitive than resilience and reliability to RF change (e.g. 10% increment of rainfall reduces
vulnerability of irrigation more than by half) but RF change effect is lesser on RRV of reservoir for
hydropower . The simulation period for -20% RF changes shortened to April 1991 because the reservior
is empty at this point.
The percentage increase of RF by 20% makes the minimum reservior storage level above dead storage
level (2007.5 masl) and RRV values of reservior for irrigation reaches the optimum but RRV values of
reservior for hydropower will not reach the optimum, even it will fail to meet minimum power demand
for a maximum of 58 day.
Table 6.3: Reservior simulation result for Irrigation over the period 1987 to 2006
Rainfall Resilience Reliability Vulnerability day (month)
Observed Rainfall
(from 1987-2006) 0.037 0.992 37
-20%
(Jan,1987-Apr,1991) 0.142 0.991 9
-10%
(Jan,1987-Dec,2006) 0.036 0.985 49
+10%
(Jan,1987-Dec,2006) 0.1 0.998 10
+20%
(Jan,1987-Dec,2006) 1 1 0

[IDENTIFICATION AND HYDROLOGICAL CHARACTERIZATION OF SURFACE WATER STORAGE IN UBN] 2009
Arba Minch University | 65
Table 6.4: Reservior simulation result for Hydropower
Rainfall Resilience Reliability Vulnerability (month)
Observed Rainfall
(Jan,1987-Dec,2006) 0.023 0.948 66
-20%
(Jan,1987-Apr,1991) 0.019 0.867 76
-10%
(Jan,1987-Dec,2006) 0.020 0.927 69
+10%
(Jan,1987-Dec,2006) 0.026 0.959 64
+20%
(Jan,1987-Dec,2006) 0.033 0.975 60
Figure 6.6: Koga HEC-HMS reservior simulation
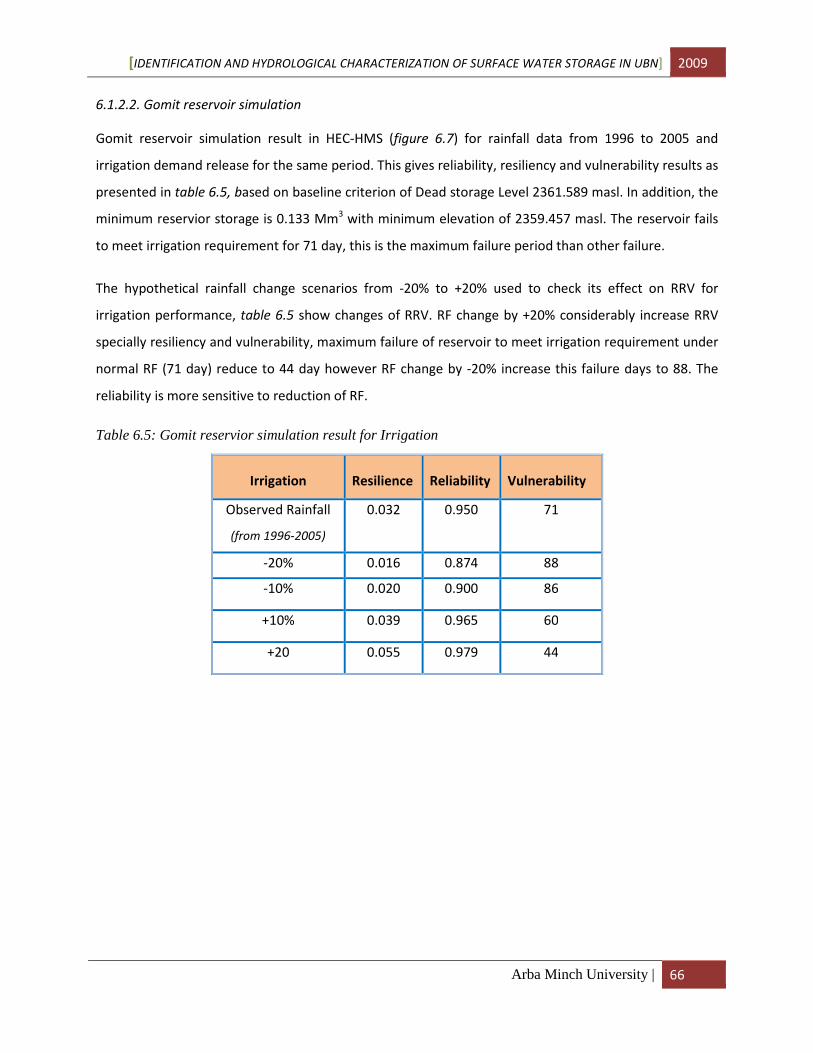
[IDENTIFICATION AND HYDROLOGICAL CHARACTERIZATION OF SURFACE WATER STORAGE IN UBN] 2009
Arba Minch University | 66
6.1.2.2. Gomit reservoir simulation
Gomit reservoir simulation result in HEC-HMS (figure 6.7) for rainfall data from 1996 to 2005 and
irrigation demand release for the same period. This gives reliability, resiliency and vulnerability results as
presented in table 6.5, based on baseline criterion of Dead storage Level 2361.589 masl. In addition, the
minimum reservior storage is 0.133 Mm3 with minimum elevation of 2359.457 masl. The reservoir fails
to meet irrigation requirement for 71 day, this is the maximum failure period than other failure.
The hypothetical rainfall change scenarios from -20% to +20% used to check its effect on RRV for
irrigation performance, table 6.5 show changes of RRV. RF change by +20% considerably increase RRV
specially resiliency and vulnerability, maximum failure of reservoir to meet irrigation requirement under
normal RF (71 day) reduce to 44 day however RF change by -20% increase this failure days to 88. The
reliability is more sensitive to reduction of RF.
Table 6.5: Gomit reservior simulation result for Irrigation
Irrigation Resilience Reliability Vulnerability
Observed Rainfall
(from 1996-2005)
0.032 0.950 71
-20% 0.016 0.874 88
-10% 0.020 0.900 86
+10% 0.039 0.965 60
+20 0.055 0.979 44

[IDENTIFICATION AND HYDROLOGICAL CHARACTERIZATION OF SURFACE WATER STORAGE IN UBN] 2009
Arba Minch University | 67
Figure 6.7: HEC-HMS output graph of Gomit reservior simulation over the period 1996 to 2005

[IDENTIFICATION AND HYDROLOGICAL CHARACTERIZATION OF SURFACE WATER STORAGE IN UBN] 2009
Arba Minch University | 68
CHAPTER SEVEN
CONCLUSION AND RECOMMENDATION
7.1 Conclusion
Based on consideration of all storage opportunities on existing, planned, and ongoing (irrigation,
hydropower and multipurpose projects), the storage option on the Upper Blue Nile Basin is well
distributed except the eastern part. The ongoing projects concentrate around Lake Tana sub basin.
Storages on small-scale projects are not well summarized due to less organized information.
The HEC-HMS program was selected for the current study due to its versatility, capability for reservior
simulation, automatic parameter optimization and its connection with GIS through HEC-GeoHMS. This
model was used to simulate the hydrological characteristics of Gomit and Koga dam located in the Lake
Tana subbasin and north Gojjam subbasin. The selection of the simulation period for hydrologic
modelling was conditioned by the extension and quality of available rainfall data. The direct runoff
model was selected to estimate the total water volume available for runoff. The surface runoff analysis
was carried out using Snyder’s and SCS model. The simulation of baseflow was conducted using a
monthly constant model. The flow routing was modelled by means of the Lag model. The initial values of
parameters were obtained using different formulas, which are indirectly related to watershed
characteristics. The Thessien polygon method was used to identify the meteorological stations that best
represent each subbasin.
The Gomit watershed parameters not verified due to the shortness of reservior level data. The Koga
watershed parameters were calibrated and validated using observed flow at Merawi. The analysis of
goodness of fit was carried out qualitatively, by means of comparisons between simulated and observed
hydrographs, and quantitatively, based on the calculation of the Nash–Sutcliffe efficiency coefficient
(NSE), person coefficient of determination (R2) and percent difference (D) at two different time scales:
daily and monthly. The best adjustments were obtained at a monthly scale, but D had better result on
daily scale. The NSE, R^2 and D result for the Koga calibration period were 0.60 (0.88), 0.61(0.88) and
0.01(2.8) and for the validation were 0.62(0.88), 0.63(0.91) and 0.17(1) respectively. The calibration
result for Gomit were NSE 0.64(0.785) and R2 0.67(0.795). The values in bracket are for monthly time
scale.

[IDENTIFICATION AND HYDROLOGICAL CHARACTERIZATION OF SURFACE WATER STORAGE IN UBN] 2009
Arba Minch University | 69
The evaluation of RRV on daily time step gives best represent the reliability and vulnerability but not the
resiliency (its values is very low) because the reservior will not able to recover rapidly from failure to
safe state on daily time step, instead reservoir translate to safe state after continuous failure state.
The reliability (under observed RF) of Koga reservoir to irrigate 7000 ha and to generate 0.3 MW are
0.992 and 0.948 and reliability of Gomit reservoir to irrigate 90 ha is 0.95, these values shows both
reservoirs are efficient for the intended purpose. The resiliency of both reservoirs is below 0.04, it is
small compared to its optimal value that is 1, and this is due to the simulation period as explained
above. Lastly, vulnerability of Koga reservoir for a simulation period (20 year) is 37 day for irrigation and
66 day for hydropower; these failures are the maximum for 20 years.
RRV of reservior for hypothetical RF (change of RF by -20% to +20%); RRV of Koga for irrigation reaches
optimal value for RF increment by 20%, but reservoir fail for 60 days to meet hydropower release. The
reduction of RF by 20% makes the reservior to reach its minimum level HEC-HMS continue simulation
until it reach the bottom of the reservior and it will stop then after.
Gomit reservior failure period vary from 44 to 88 day (reliability from 0.979 to 0.874) for RF change of RF
from -20% to +20% and for simulation period of ten year. The reservoir resists the RF variation the in
better manner.

[IDENTIFICATION AND HYDROLOGICAL CHARACTERIZATION OF SURFACE WATER STORAGE IN UBN] 2009
Arba Minch University | 70
7.2 Recommendation
Variability of flow data at Merawi shows different statistics year to year. Therefore, for better result in
calibration and validation it needs good observed meteorological data within the watershed. This
happened in the result of Koga and Gomit, both uses station that is out of the watershed. Therefore,
Well-distributed meteorological station needed within the catchment.
In addition, during site visits, reservior regulation for Gomit dam is not efficient it affects the
believability of reservior level data that means during reservior level calibration specified irrigation
release considered but in actual case this not what happened. Therefore measuring of flow at the
reservior outlet is indispensable.
Reservior out flow rule curve is not available, only irrigation and environmental flow requirement data
available, the out flow rule curve good for better reservior simulation otherwise, HEC-HMS reservior
simulation stops when the reservior is empty.
Detail base flow and reservior sedimentation study needed for better estimation of sensitivity of
reservior on RRV. For instance, the base flow considered is constant, it has no relation to rainfall
variation and also it covers some percentage of the irrigation demand. Therefore The Gomit reservior
resist the RF variation effect.
Koga and Gomit reservoirs show variation on RRV for irrigation and hydropower production for
hypothetical RF. In this study, the hypothetical RF used is percentage decrease and increase of RF; it only
brings variation of RF amount not timing effect. Climate change study on these reservior is very
important for their sustainable management.
[IDENTIFICATION AND HYDROLOGICAL CHARACTERIZATION OF SURFACE WATER STORAGE IN UBN] 2009
Arba Minch University | 71
REFERENCES
ACRES International and Shawel consultant (1995) Feasibility Study of the Birr and Koga Irrigation
Project, Birr catchment and irrigation studies p. 75 Addis Ababa, Ethiopia
African Development Bank, (AFDB) 2000, Koga Irrigation and Watershed Management Project,
Summary Environmental Impact Assessment
Arc Hydro Tools Overview, (2002) Version 1.0 Beta 2 E-MAIL [email protected] • WEB www.esri.com
Aster D, and Awlachew S, (January 2009), Characterization and Atlas of the Blue Nile Basin and its Sub
basins, International Water Management Institute (IWMI)
BCEOM (1998) ARBIDMP project Data Collection and Site Investigation Survey and Analysis section III
Annexes volume II Dams project profile and section I volume 6 Dams and Reservoirs, Addis
Ababa, Ethiopia.
BCEOM (1998) ARBIDMP project Water resource studies part 1 Main report, phase 3 Addis Ababa,
Ethiopia
BCECOM, (1999) French Engineering Consultants in association with Island BRGM, '' Abbay River
Integrated Development Master Plan Project '' phase 2 Volume I main Report Volume II Part 1
climatology, part 2 Hydrology and volume III phase 2 Water Balance Modeling.
CFCAS Project, (2004) Assessment of Water Resources Risk and Vulnerability to Changing Climatic
Conditions, Project Report IV, Calibration, Verification, and Sensitivity Analysis of the HEC-HMS
hydrologic model. Page 23
Conway, D. (1997). A water balance model of the Upper Blue Nile in Ethiopia, Hydrological Sciences
Journal-Journal des Sciences Hydrologiques 42(2): 265-286.
Demissie Endale (2006). Assessment of Water Demand for Irrigation Development in Abbay Basin (A
Case of Tributaries Development Scenario) in partial fulfillment of the requirements for the
degree Master of Science (Engineering)
Fowler, H. J.; Kilsby, C. G.; O’Connell, P. E. (2003) modeling the impacts of climatic change and
variability on the reliability, resilience, and vulnerability of a water resource system. Water
Resources Research 39(8): 1222.
Co-SAERAR (1992) Gomit micro earth dam irrigation project, Engineering Geological feasibility report
Co-SAERAR (1992) Gomit micro earth dam irrigation project, Irrigation Agronomy feasibility report
Goswami, M., K.M. O’Connor, K.P. Bhattarai and A.Y. Shamseldin (2005), Assessing the performance of
eight real-time updating models and procedures for the Brosna River, Hydrology and the Earth
System Sciences. 9 (4): 394-411
Hashimoto, T.; Stedinger, J. R.; Loucks, D. P. (1982), Reliability, resiliency, and vulnerability criteria for
performance evaluation of water resource system, Water Resources Research 18: 14-20.
Kim, U. Kaluarachchi, J. J.Smakhtin, V. U. 2008. Climate change impacts on hydrology and water
resources of the Upper Blue Nile River Basin, Ethiopia. Colombo, Sri Lanka: International Water
Management Institute. 27p (IWMI Research Report 126)
Krause P. and F. Base (2006), Sensitivity and uncertainty analysis of the Hydrological model J2000,
Geophysical Research Abstracts, Vol. 8 02510.
Weizhe A. (2007) the study of GIS-Based Hydrological model in highway environmental assessment,
Doctor of Philosophy paper, University of Pittsburgh.

[IDENTIFICATION AND HYDROLOGICAL CHARACTERIZATION OF SURFACE WATER STORAGE IN UBN] 2009
Arba Minch University | 72
Skaggs, R.W., and Khaleel, R. (1982), Infiltration, Hydrologic modeling of small watersheds, American
Society of Agricultural Engineers, St Joseph, MI
Maier, H. R.; Lence, B. J.; Tolson, B. A.; Foschi, R. O. (2001), First-order reliability method for estimating
reliability, vulnerability, and resilience, Water Resources Research 37: 779-790.
Mott MacDonald, (2004), Koga Irrigation and Watershed Management Project, Hydrology Factual
Report, 23 pp. + Appendix
Mott MacDonald, (2005), Koga Irrigation Project, Irrigation and Drainage Design Report (Draft)
Moy, W. S.; Cohon, J. L.; ReVelle, C. S. (1986), Programming model for analysis of the reliability,
resilience, and vulnerability of a water supply reservoir, Water Resources Research 22(4): 489–
498.
NBVBN-RE (Nile Basin Capacity Building Network) (group II) (2005), GIS – based watershed modeling in
the Nile basin countries. GIS & Modeling Application in River Research Cluster NBI, 2007
Norconsult, (2006), Karadobi Multipurpose project, pre-feasibility study, Report to Ministry of water
Resources, The Federal Democratic Republic of Ethiopia.
Salini Costruttori and Studio Pietrangeli (2006) Beles mpp, Level 1 Design January 2006
SMEC, 2008 Hydrological Study of Tana-Beles Sub-Basins, surface water investigation (draft)
USACE (2000), Hydrologic Modeling System HEC-HMS, Technical Reference Manual, US Army Corps of
Engineers, Hydrologic Engineering Center
USACE, (2001), Hydrologic Modeling System HEC-HMS, Users Manual, US Army Corps of Engineers,
Hydrologic Engineering Center
USACE, (2003), Geospatial Hydrologic Modeling Extension HECGeoHMS, User’s Manual US Army Corps
of Engineers, Hydrologic Engineering Center
Ven Te Chow, (1964) Hand Book of Applied Hydrology, A Compendium of Water Resources Technology,
Mc Grew – Hill Book Company, NY, USA.
Water and Power Consultancy Services (India) Ltd. (2005), Environmental Monitoring and Resettlement
Plan for Koga Irrigation and Watershed Management Project, Volume 1: Environmental
Management and Monitoring Plan Report.
World Bank, (2006) Ethiopia: managing water resources to maximize sustainable growth. World Bank
Agriculture and Rural Development Department, Washington D. C
WRIA 55 & 57 (2009) Surface water storage and groundwater recharge investigation, middle Spokane
river Wria 57 wetland restoration & recharge opportunities.
Zongxue, X.; Jinno, K.; Kawamura, A.; Takesaki, S.; Ito, K. (1998), Performance risk analysis for Fukuoka
water supply system, Water Resources Management 12(1): 13–30.

[IDENTIFICATION AND HYDROLOGICAL CHARACTERIZATION OF SURFACE WATER STORAGE IN UBN] 2009
Arba Minch University | 73
APPENDICES
APPENDIX A: Location of Meteorological station
Station Name LAT LONG EASTING NORTHING ALTITUDE_masl
Dera Hamusit 11.7667 37.3833 323836 1301142 1900.0
Mekane Eyesus 11.6500 38.0667 398263 1287903 400.0
Nefas Mewcha 11.7333 38.4500 440067 1297008 3000.0
Arb_Gebeya(Dera) 11.5167 38.8833 487277 1272996 2300.0
Debretabor 11.8833 38.0333 394718 1313718 2690.0
Bahir Dar 11.59968 37.41666 327365 1282652 1770.0
Merawi 11.41666 37.15000 298152 1262582 2110.0
Wetet.Abay 11.36666 37.05000 287200 1257122 1830.0
Addet 11.26969 37.46999 332988 1246123 2080.0
Dangla 11.11666 36.41666 217803 1229995 2000.0
Zege 11.72968 37.29999 314727 1297105 1820.0
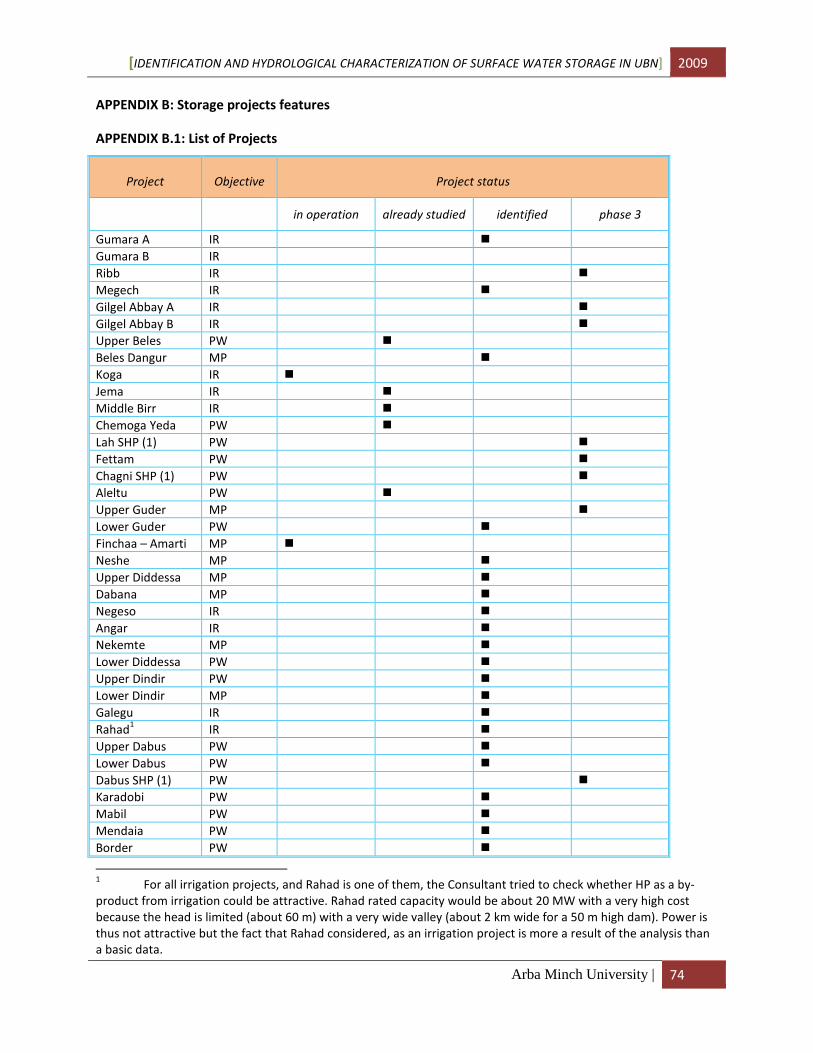
[IDENTIFICATION AND HYDROLOGICAL CHARACTERIZATION OF SURFACE WATER STORAGE IN UBN] 2009
Arba Minch University | 74
APPENDIX B: Storage projects features
APPENDIX B.1: List of Projects
Project Objective Project status
in operation already studied identified phase 3
Gumara A IR �
Gumara B IR
Ribb IR �
Megech IR �
Gilgel Abbay A IR �
Gilgel Abbay B IR �
Upper Beles PW �
Beles Dangur MP �
Koga IR �
Jema IR �
Middle Birr IR �
Chemoga Yeda PW �
Lah SHP (1) PW �
Fettam PW �
Chagni SHP (1) PW �
Aleltu PW �
Upper Guder MP �
Lower Guder PW �
Finchaa – Amarti MP �
Neshe MP �
Upper Diddessa MP �
Dabana MP �
Negeso IR �
Angar IR �
Nekemte MP �
Lower Diddessa PW �
Upper Dindir PW �
Lower Dindir MP �
Galegu IR �
Rahad1 IR �
Upper Dabus PW �
Lower Dabus PW �
Dabus SHP (1) PW �
Karadobi PW �
Mabil PW �
Mendaia PW �
Border PW �
1 For all irrigation projects, and Rahad is one of them, the Consultant tried to check whether HP as a by-
product from irrigation could be attractive. Rahad rated capacity would be about 20 MW with a very high cost
because the head is limited (about 60 m) with a very wide valley (about 2 km wide for a 50 m high dam). Power is
thus not attractive but the fact that Rahad considered, as an irrigation project is more a result of the analysis than
a basic data.

[IDENTIFICATION AND HYDROLOGICAL CHARACTERIZATION OF SURFACE WATER STORAGE IN UBN] 2009
Arba Minch University | 75
Appendix B.1: Proposed Irrigation projects on the UBNB
S.no PROJECTS
Dam site Location Res.elev.
masl
Mean
flow
Mm3
Capacity
Mm3
Flooded
Area
(ha)
Max.
Irrig.
ha LAT LONG
1 GUMARA A 11.755 37.805
1940
1950
1960
235
134
223
333
779
991
1200
13976
2 GUMARA B 11.738 37.790
1960
1970
1980
248
136
218
317
740
901
1090
13976
3 RIBB 12.038 37.990
1905
1915
1925
454
49.5
99.5
173
412
611
895
19625
4 MEGECH 12.522 37.467
1920
1935
1950
203
51
124
260
334
672
1160
7311
5 GILGEL ABBAY A* 11.356 37.026
1920
1922
1924
1766
331
470
641
625
772
937
12069
6 GILGEL ABBAY B
11.456 37.005
1880
1890
1900
2 200
80
216
419
1090
1670
2452
11508
7 KOGA
(almost finished) 11.351 37.134 2015.25 8672 83.1 2041 6000
8 JEMA 11.191
37.175
2110
2120
2130
175
54
99
163
366
545
737
7786
9 GALEGU 12.171 35.991
770
785
800
196
69
187
374
576
1010
1480
9860
10 NEGESO 8.858 36.540
1970
1975
1980
188
56
107
177
831
1210
1600
22815
11 ANGAR
9.688 36.740
1385
1410
1420
541
555
1653
3583
2930
5960
9580
14,450
12 UPPER DIDDESSA
8.203 36.803
1400
1410
1420
1712
1140
2160
3490
8460
11800
14700
14280
Source: (BCEOM, phase 2, section III VOLUME II)
*(Gilgel Abbay-A is much less attractive than Gilgel Abbay B and would be filled by sediment before 50 years),

[IDENTIFICATION AND HYDROLOGICAL CHARACTERIZATION OF SURFACE WATER STORAGE IN UBN] 2009
Arba Minch University | 76
Appendix B.2: Proposed multipurpose projects on the UBNB
S.no
.
PROJECTS
Dam site location Mean
flow
Mm3
Res.elev.
masl
Capacity
Mm3
Flooded
Area (ha)
Max.
Irrig.
ha
P
(MW)
Lat Long
1 UPPER
GUDER 8.858 37.667 183
2425
2430
2435
27
100
244
858
2193
3638
4896 10.4
2 NESHE A 9.751 37.253 103
2215
2220
2225
2230
114
205
323
464
1530
2090
2610
3020
7217 19.2
3 NESHE B 9.757 37.254 103
2210
2215
2220
2225
76
151
258
398
1720
1810
2490
3090
7217 19,2
4 DABANA 8.918 36.008 1609
1340
1350
1360
1370
921
1193
1523
1923
2810
4700
6630
8430
16388 41.6
5 NEKEMTE 9.425 36.500 1937
1300
1310
1320
1330
276
771
1710
3340
3390
6800
12300
20900
11220 16
6 LOWER
DINDIR 12.016
35.873
2009
750
755
760
765
537
755
1040
1430
3800
4960
6320
8040
49555 50
(source: BCEOM, 1998, phase 2, section III VOLUME II)

[IDENTIFICATION AND HYDROLOGICAL CHARACTERIZATION OF SURFACE WATER STORAGE IN UBN] 2009
Arba Minch University | 77
Appendix B.3: Major planned hydropower schemes on UBNB
S.no
Name
Location Res.
elev.
Capacity
Mm3
Flooded
Area(ha)
Anticipated
capacity (MW) Lat Long
1 Karadobi 9.853 37.688
1075
1100
1150
1175
6000
11600
28100
38900
18600
25900
40100
46700
660-1,580
2 Mabil 10.317 36.668
860
880
900
920
1600-4000
4700-7050
8700-11100
13800-16200
13000
17700
22900
28000
510-1,400
3 Mendaia 10.066 35.558
720
730
740
750
4800-7100
7300-9700
10300-12700
13800-16200
23400
27500
33000
38600
980-1,700
4 Border 11.208 35.090
570
580
590
600
1810-5110
6800-10100
13200-16500
21000-24300
42400
56800
71600
85000
750-1,780
5 Beles
Dangur 11.105 35.838
830
835
845
850
2530
2960
3930
4470
8150
8900
10500
11400
104-143
6 Fettam 10.451 37.005
1955
1960
1965
1970
125
312
595
972
2810
4700
6630
8430
94-139
7 Lower
Didessa 9.483 35.971
970
980
1 000
1 010
3220
4290
6910
8490
9380
11400
14900
16800
190-400
8 Lower
Guder 9.420 37.653
1360
1380
1400
1410
709
1606
3006
3926
3420
5670
8430
10000
30-82
9 Lower
Dabus 9.833 34.870
1335
1340
1345
1350
385
608
888
1223
3880
5040
6160
7100
164-212
10 Upper
Dabus 9.871 34.901
1365
1370
1375
1380
423
983
1963
3483
7970
14900
24700
36300
152-193
11 Upper
Dindir 12.002 36.200
950
960
970
980
465
803
1270
1890
2790
4000
5410
7000
15-37.5
Source: (BCEOM, 1998, table 6.1- 6.2)

[IDENTIFICATION AND HYDROLOGICAL CHARACTERIZATION OF SURFACE WATER STORAGE IN UBN] 2009
Arba Minch University | 78
APPENDIX C: HEC-HMS Features
Appendix C.1: HEC-HMS model components and categorization
MODEL CATEGORIZATION
RUNOFF-VOLUME MODELS
Initial and constant-rate Event, lumped, empirical, fitted parameter
SCS curve number (CN) Event, lumped, empirical, fitted parameter
Girded SCS CN Event, distributed, empirical, fitted parameter
Green and Ampt Event, distributed, empirical, fitted parameter
Deficit and constant rate Continuous, lumped, empirical, fitted parameter
Soil moisture accounting Continuous, lumped, empirical, fitted parameter
Girded SMA Continuous, distributed, empirical, fitted parameter
DIRECT-RUNOFF MODELS
User-specified Unit hydrograph Event, lumped, empirical, fitted parameter
Clark’s UH Event, lumped, empirical, fitted parameter
Snyder’s UH Event, lumped, empirical, fitted parameter
SCS UH Event, lumped, empirical, fitted parameter
ModClark Event, distributed, empirical, fitted parameter
Kinematic wave Event, lumped, conceptual, measured parameter
BASE FLOW MODELS
Constant monthly Event, lumped, empirical, fitted parameter
Exponential recession Event, lumped, empirical, fitted parameter
Linear reservoir Event, lumped, empirical, fitted parameter
ROUTING MODELS
Kinematic wave Event, lumped, conceptual, measured parameter
Lag Event, lumped, empirical, fitted parameter
Modified Puls Event, lumped, empirical, fitted parameter
Muskingum Event, lumped, empirical, fitted parameter
Muskingum-Cunge standard
section Event, lumped, quasi-conceptual, measured parameter
Muskingum-Cunge 8-point section Event, lumped, quasi-conceptual, measured parameter
Confluence Continuous, conceptual, measured parameter
Bifurcation Continuous, conceptual, measured parameter

[IDENTIFICATION AND HYDROLOGICAL CHARACTERIZATION OF SURFACE WATER STORAGE IN UBN] 2009
Arba Minch University | 79
Appendix C.2: Calibration parameter constraints
Modeling Model Parameter Unit Minimum Maximum
Runoff Volume
Initial and constant-rate
loss
Initial Loss mm 0 500
Constant loss
rate mm/hr 0 300
Deficit and Constant rate
loss
Initial deficit mm 0 500
Maximum deficit mm 0 500
Deficit recovery
factor - 0.1 5
SCS loss
Initial
abstraction mm 0 500
Curve number - 1 100
Direct Runoff
Transformation
Snyder's UH Lag hour 0.1 hr 500
Cp 0.1 1
SCS UH Lag minute 0.1 30000
Clark’s UH
Time of
concentration hour 0.1 500
Storage
coefficient hour 0.1 1
Base Flow Exponential Recession
Initial base flow m3/s 0 100000
Recession factor 0.000011 -
Flow-to-peak
ratio 0 1
Lag routing Lag Lag min 0 30000

[IDENTIFICATION AND HYDROLOGICAL CHARACTERIZATION OF SURFACE WATER STORAGE IN UBN] 2009
Arba Minch University | 80
APPENDIX D
Appendix D.1: Gomit Elevation, Area and Capacity Curves
Elevation(m) Reservoir
Area(ha) Storage(Ha.m)
Cumulative
Storage
(Ha.m)
Remark
2350.36 0 0 0 Bed Level
2351.0 0.06 0.02 0.02
2352.0 0.16 0.11 0.13
2353.0 0.27 0.22 0.35
2354.0 0.54 0.41 0.76
2355.0 0.92 0.74 1.5
2356.0 1.44 1.18 2.68
2357.0 1.89 1.67 4.35
2358.0 3.33 2.61 6.96
2359.0 4.7 4.02 10.98
2360.0 6.09 5.4 16.38
2361.0 7.53 6.82 23.20
2362.0 9.13 8.33 31.53
2363.0 11.07 10.11 41.64
2364.0 13.10 12.10 53.74
2365.0 14.91 14.01 67.75
2365.5 16.04 7.74 75.49
2366.0 17.16 8.3 83.79
2366.5 18.29 8.86 92.65
2366.7 18.74 3.71 102.08
2367.0 19.41 5.72 102.08
2367.4 20.39 7.96 110.04
2367.86 21.52 9.64 119.68 F.R.L
2368.0 21.86 3.04 122.72
2369.0 24.5 23.18 145.9
2369.36 25.5 9.00 154.9 M.R.L
2370.0 27.29 16.89 171.79
2371.0 29.61 28.45 200.24
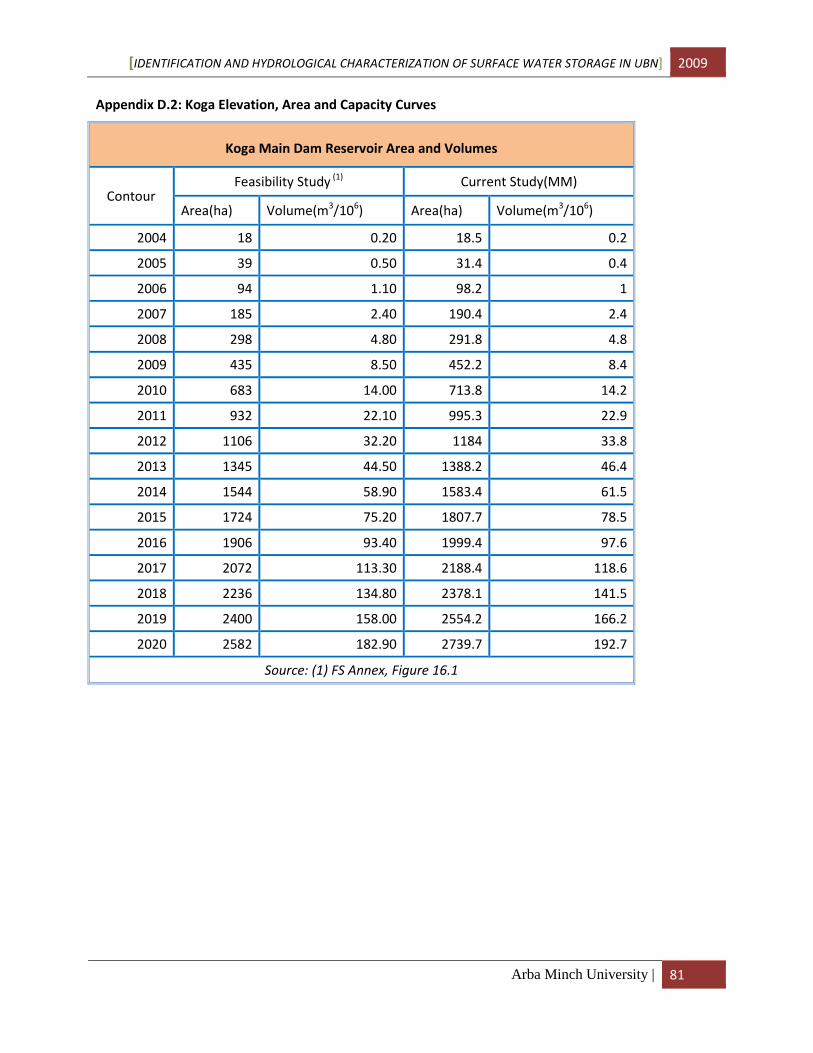
[IDENTIFICATION AND HYDROLOGICAL CHARACTERIZATION OF SURFACE WATER STORAGE IN UBN] 2009
Arba Minch University | 81
Appendix D.2: Koga Elevation, Area and Capacity Curves
Koga Main Dam Reservoir Area and Volumes
Contour Feasibility Study
(1) Current Study(MM)
Area(ha) Volume(m3/10
6) Area(ha) Volume(m
3/10
6)
2004 18 0.20 18.5 0.2
2005 39 0.50 31.4 0.4
2006 94 1.10 98.2 1
2007 185 2.40 190.4 2.4
2008 298 4.80 291.8 4.8
2009 435 8.50 452.2 8.4
2010 683 14.00 713.8 14.2
2011 932 22.10 995.3 22.9
2012 1106 32.20 1184 33.8
2013 1345 44.50 1388.2 46.4
2014 1544 58.90 1583.4 61.5
2015 1724 75.20 1807.7 78.5
2016 1906 93.40 1999.4 97.6
2017 2072 113.30 2188.4 118.6
2018 2236 134.80 2378.1 141.5
2019 2400 158.00 2554.2 166.2
2020 2582 182.90 2739.7 192.7
Source: (1) FS Annex, Figure 16.1
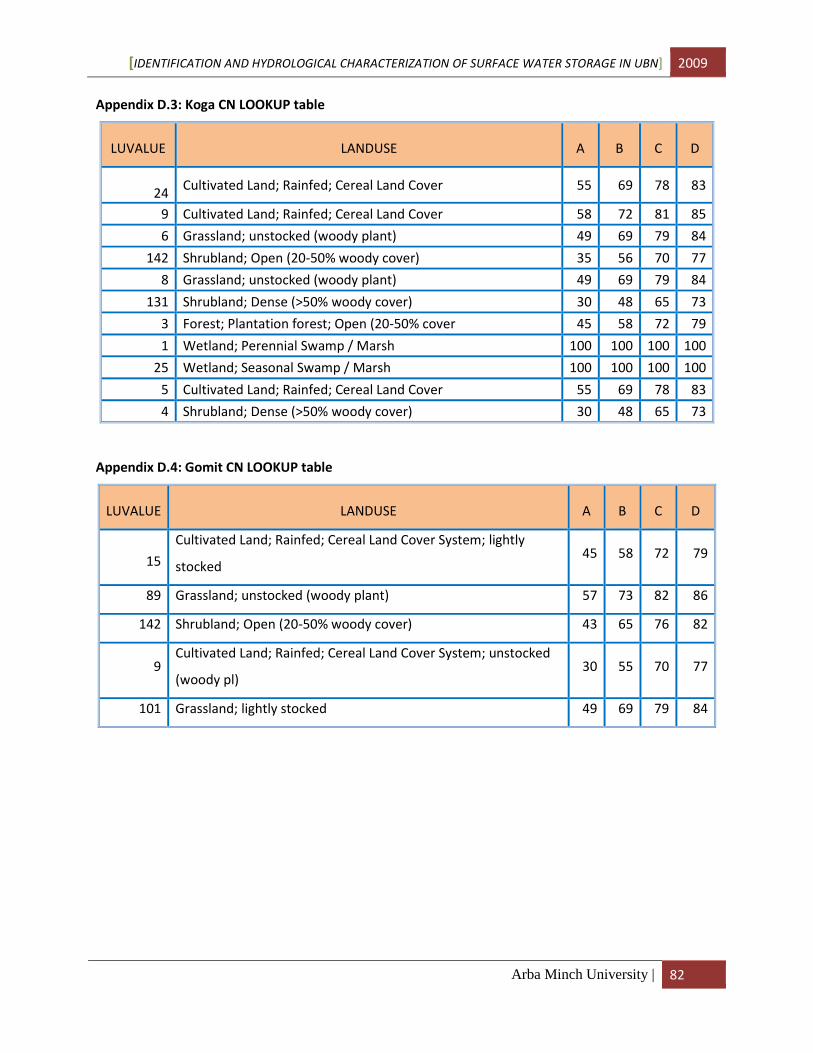
[IDENTIFICATION AND HYDROLOGICAL CHARACTERIZATION OF SURFACE WATER STORAGE IN UBN] 2009
Arba Minch University | 82
Appendix D.3: Koga CN LOOKUP table
LUVALUE LANDUSE A B C D
24 Cultivated Land; Rainfed; Cereal Land Cover 55 69 78 83
9 Cultivated Land; Rainfed; Cereal Land Cover 58 72 81 85
6 Grassland; unstocked (woody plant) 49 69 79 84
142 Shrubland; Open (20-50% woody cover) 35 56 70 77
8 Grassland; unstocked (woody plant) 49 69 79 84
131 Shrubland; Dense (>50% woody cover) 30 48 65 73
3 Forest; Plantation forest; Open (20-50% cover 45 58 72 79
1 Wetland; Perennial Swamp / Marsh 100 100 100 100
25 Wetland; Seasonal Swamp / Marsh 100 100 100 100
5 Cultivated Land; Rainfed; Cereal Land Cover 55 69 78 83
4 Shrubland; Dense (>50% woody cover) 30 48 65 73
Appendix D.4: Gomit CN LOOKUP table
LUVALUE LANDUSE A B C D
15
Cultivated Land; Rainfed; Cereal Land Cover System; lightly
stocked 45 58 72 79
89 Grassland; unstocked (woody plant) 57 73 82 86
142 Shrubland; Open (20-50% woody cover) 43 65 76 82
9 Cultivated Land; Rainfed; Cereal Land Cover System; unstocked
(woody pl) 30 55 70 77
101 Grassland; lightly stocked 49 69 79 84

[IDENTIFICATION AND HYDROLOGICAL CHARACTERIZATION OF SURFACE WATER STORAGE IN UBN] 2009
Arba Minch University | 83
Appendix E: Optimized Parameter Results
Appendix E.1: Koga Optimized Parameter Results
Deficit & Constant Loss, Snyder UH model
Element Parameter Units Initial
Value
Optimized
Value
Objective Function
Sensitivity
W70 Constant Rate MM/HR 1.6 1.6982 -0.02
W70 Initial Deficit MM 0.366 0.3969 0
W70 Maximum Deficit MM 80.03 79.902 0
W70 Snyder Peaking Coefficient 0.99 0.998 0
W70 Snyder Time to Peak HR 12.129 12.245 0
W80 Constant Rate MM/HR 0.12611 0.12744 -0.02
W80 Initial Deficit MM 1.6736 1.8263 0
W80 Maximum Deficit MM 140.05 140.57 -0.03
W80 Snyder Peaking Coefficient 0.152 0.1 0
W80 Snyder Time to Peak HR 14.982 15.345 0
W90 Constant Rate MM/HR 0.61508 0.52474 0
W90 Initial Deficit MM 1.5007 1.7452 0
W90 Maximum Deficit MM 79.901 79.868 0
W90 Snyder Peaking Coefficient 0.99 0.998 0
W90 Snyder Time to Peak HR 7.739 7.9153 0
R50 Lag MIN 24.931 25.41 0

[IDENTIFICATION AND HYDROLOGICAL CHARACTERIZATION OF SURFACE WATER STORAGE IN UBN] 2009
Arba Minch University | 84
Appendix E.2: Koga Optimized Parameter Results
Deficit & Constant Loss, SCS UH model
Element Parameter Units Initial Value Optimized Value Objective Function
Sensitivity
R50 Lag MIN 210 209.88 0
W70 SCS Lag MIN 3490 3490.4 -0.02
W80 SCS Lag MIN 1760 1759.9 -0.02
W90 SCS Lag MIN 937 937.25 -0.11
W70 Constant Rate MM/HR 0.1 2.3482 0.03
W70 Initial Deficit MM 1 1.0614 0
W70 Maximum Deficit MM 60 59.5 0
W80 Constant Rate MM/HR 0.1 2.1245 -0.08
W80 Initial Deficit MM 1 2.0395 0
W80 Maximum Deficit MM 60 62.453 0
W90 Constant Rate MM/HR 0.1 0.0067936 0
W90 Initial Deficit MM 1 0.61176 0
W90 Maximum Deficit MM 60 58.163 0.01
Appendix E.3: Gomit Optimized Parameter Results
Deficit & Constant Loss, Snyder UH model
Parameter Initial Value Optimized Value Sensitivity
Initial Deficit (MM) 10 10 0
Maximum Storage
(MM) 40 30 0
Constant Rate (MM/HR) 0.5 0.45 0.08
Lag Time (HR) 3.2 3.2 0
Peaking Coefficient 0.8 0.85 0

[IDENTIFICATION AND HYDROLOGICAL CHARACTERIZATION OF SURFACE WATER STORAGE IN UBN] 2009
Arba Minch University | 85
Appendix F Curve Number
Appendix F.1: Runoff curve numbers for other agricultural lands 1/
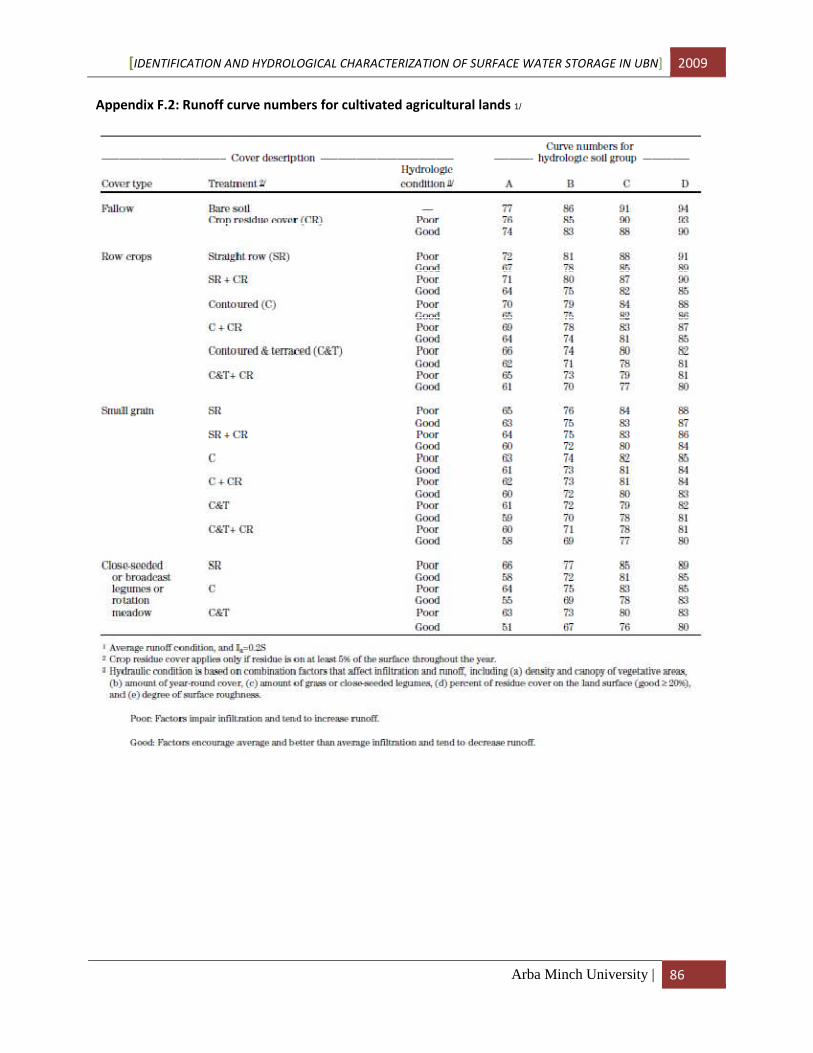
[IDENTIFICATION AND HYDROLOGICAL CHARACTERIZATION OF SURFACE WATER STORAGE IN UBN] 2009
Arba Minch University | 86
Appendix F.2: Runoff curve numbers for cultivated agricultural lands 1/

[IDENTIFICATION AND HYDROLOGICAL CHARACTERIZATION OF SURFACE WATER STORAGE IN UBN] 2009
Arba Minch University | 87
APPENDIX G
Appendix G.1: Double mass curve plots of the stations

[IDENTIFICATION AND HYDROLOGICAL CHARACTERIZATION OF SURFACE WATER STORAGE IN UBN] 2009
Arba Minch University | 88
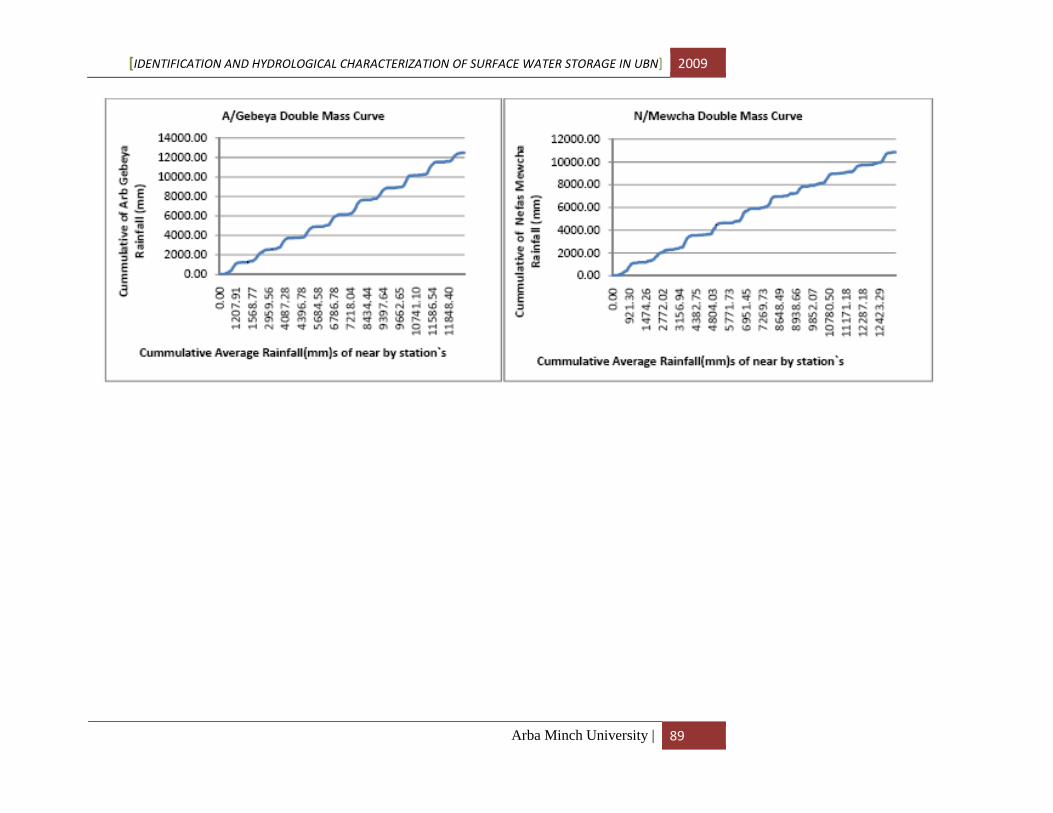
[IDENTIFICATION AND HYDROLOGICAL CHARACTERIZATION OF SURFACE WATER STORAGE IN UBN] 2009
Arba Minch University | 89
Related Documents


