CHAPTER 9 Exceptions and Interrupts (New version1- by Robert Britton – [email protected] ) How much do pirates pay for ear rings? A Buccaneer. 9.1 Introduction This update is a work in progress, so users of my book “MIPS Assembly Language Programming” http://www.pearsonhighered.com/educator/product/MIPS should check back occasionally to determine if they have the latest version. QtSpim is a new user interface for spim built on the. Qt is cross-platform, so the same user interface and same code will run on Windows, Linux, and Mac OS X. For more information go to: http://pages.cs.wisc.edu/~larus/spim.html . This new version is highly recommended. You have observed that under normal circumstances anytime the mouse button is pushed or the mouse is moved, or a key on the keyboard is depressed, your personal computer responds. The natural question to ask is, “What feature of a computer is needed to provide this kind of interactive response?” The answer is that the CPU must have the capability to respond to exceptions. Interrupts from external devices are classified as exceptions. Internal CPU situations such as an arithmetic overflow or address error are classified as exceptions. An exception is an event that initiates a change in the normal flow of program execution. Exception capability eliminates the need to constantly poll the keyboard and mouse. This is obviously an essential capability because if the computer were constantly polling external devices it would not be doing any other work. The key to building a computer system that provides superior processing throughput and provide an interactive response is to include within the hardware design some method for interrupting the program currently running when an exception occurs. The method implemented by the MIPS designers to interrupt the currently running program is to include some additional hardware referred to as coprocessor 0. This coprocessor contains a number of specialized registers that can be accessed at the assembly language level for exception handling. The top window of the QtSpim simulator displays these registers: EPC Coprocessor 0 register 14 (Exception Program Counter) Cause Coprocessor 0 register 13 BadVaddress Coprocessor 0 register 8 Status Coprocessor 0 register 12 Examples of the only two instructions available to access the coprocessor registers are shown below. The second instruction, Move to Coprocessor 0 (mtc0), is confusing because the destination register is specified in the right hand field, which is different from all other MIPS instructions. Notice we reference coprocessor registers only by their number. They are not referenced by a name, so inline comments are essential.

Welcome message from author
This document is posted to help you gain knowledge. Please leave a comment to let me know what you think about it! Share it to your friends and learn new things together.
Transcript

CHAPTER 9
Exceptions and Interrupts (New version1- by Robert Britton – [email protected])
How much do pirates pay for ear rings?
A Buccaneer.
9.1 Introduction
This update is a work in progress, so users of my book “MIPS Assembly Language
Programming” http://www.pearsonhighered.com/educator/product/MIPS should check back occasionally
to determine if they have the latest version.
QtSpim is a new user interface for spim built on the. Qt is cross-platform, so the same user
interface and same code will run on Windows, Linux, and Mac OS X. For more information go
to: http://pages.cs.wisc.edu/~larus/spim.html . This new version is highly recommended.
You have observed that under normal circumstances anytime the mouse button is pushed or the
mouse is moved, or a key on the keyboard is depressed, your personal computer responds. The
natural question to ask is, “What feature of a computer is needed to provide this kind of
interactive response?” The answer is that the CPU must have the capability to respond to
exceptions. Interrupts from external devices are classified as exceptions. Internal CPU situations
such as an arithmetic overflow or address error are classified as exceptions. An exception is an
event that initiates a change in the normal flow of program execution. Exception capability
eliminates the need to constantly poll the keyboard and mouse. This is obviously an essential
capability because if the computer were constantly polling external devices it would not be doing
any other work. The key to building a computer system that provides superior processing
throughput and provide an interactive response is to include within the hardware design some
method for interrupting the program currently running when an exception occurs.
The method implemented by the MIPS designers to interrupt the currently running program is to
include some additional hardware referred to as coprocessor 0. This coprocessor contains a
number of specialized registers that can be accessed at the assembly language level for exception
handling. The top window of the QtSpim simulator displays these registers:
EPC Coprocessor 0 register 14 (Exception Program Counter)
Cause Coprocessor 0 register 13
BadVaddress Coprocessor 0 register 8
Status Coprocessor 0 register 12
Examples of the only two instructions available to access the coprocessor registers are shown
below. The second instruction, Move to Coprocessor 0 (mtc0), is confusing because the
destination register is specified in the right hand field, which is different from all other MIPS
instructions. Notice we reference coprocessor registers only by their number. They are not
referenced by a name, so inline comments are essential.

mfc0 $k0, $13 # CPU register $k0 is loaded with contents of the Cause register
mtc0 $0, $12 # CPU register $0 is stored in the Status register (Cleared to zero)
Coprocessor 0 is designed to send a signal to the CPU control unit when an exception occurs.
Wires from external devices provide input interrupt signals to coprocessor 0. Bits within the
Status register can be manipulated at the assembly language level to selectively enable or disable
certain interrupts.
9.2 Exception Capabilities of QtSpim
QtSpim also responds to interrupts generated by the memory-mapped keyboard or display
terminal. QtSpim also responds to internal exceptions such as overflow and address errors. If
you “single step” through a program, it will not respond to interrupts generated from the
keyboard. The best way to debug these programs is to set breakpoints. Given this feature,
students now have an opportunity to experience writing code to respond to interrupts. Once
again, this points out the advantage of using a simulator when learning to write assembly
language code. Students learning to write native assembly language code for their desktop
computers, such as an Intel x86, typically never have an opportunity to write and run interrupt
handlers that enable and disable the interrupt system. Typically these students never experience
the real-world challenges that arise in writing the code that resides at the very heart of the
operating system.
Most computers provide a programmable timer that will generate an interrupt after a specified
period of time has elapsed. QtSpim includes this feature. For example, we can use the timer to
interrupt the processor every tenth of a second, at which time we can poll the keyboard for any
activity. During all of the remaining time the processor will be doing other useful work. This is
an alternative approach for providing interactive response without having the keyboard directly
generating interrupts.
9.3 CPU Exception Response
Whenever an exception occurs and the MIPS processor has reached the state where the next
instruction would be fetched, the CPU controller goes to a special state. In this special state, the
Cause register is loaded with a number to identify the source of the interrupt. Mode information
in the status register is changed and all interrupts are disabled. Also, the address of the
instruction that was executing when the exception occurred is saved in a register called the
Exception Program Counter (EPC) and the program counter is loaded with the address in
memory where the first instruction of the exception response routine is located. This is memory
location 0x80000180 in the case of QtSpim. If the instruction that was executing involved a
memory access that caused the error, then the memory address is stored in the BadVaddress
register. In the case of QtSpim, a value greater than 15 will be in the exception code field of the
Cause register when any I/O interrupt occurs. The exception response routine then needs to poll
all the I/O devices to determine which one generated the interrupt.

9.4 Exception Response Code
The exception response code is simply a MIPS assembly language program, usually written by a
systems programmer. In the case of the QtSpim simulator, this exception processing entry point
is memory location 0x80000180. This segment of memory is referred to as kernel segment 0
(kseg0). Students are encouraged to analyze QtSpim’s exception response code, which is always
displayed in the Text Segment. A slightly modified version of the exception response code can
be downloaded from the same site where you downloaded this document. To gain a more in
depth understanding of exception response codes, students can experiment by creating other
modified versions of the exception response code. In QtSpim under simulator settings, you can
specify the location of your new exception response code that you want to be loaded by QtSpim.
The first task of the exception response code is to execute some code to save the state of the
machine, as it existed right before the time when the interrupt occurred. Analyzing QtSpim’s
interrupt handler you will find the only registers it saves are $v0 and $a0. This interrupt handler
is not reentrant because it saves these two registers in specific memory locations labeled S1 and
S2. If we wanted to make this code reentrant these register values would have to be saved on a
stack allocated to the operating system. Registers $k0 and $k1 are reserved for the operating
system and this interrupt handler is a fundamental part of the operating system. This interrupt
handler was written using only these registers. After the interrupt has been completely processed,
the machine is placed back in its original state. The exception return (eret) instruction is used to
restore the status register to its original state and return to the program that was interrupted.
Real time systems and embedded processors provide priority interrupt hardware. This hardware
allows higher priority interruption of lower priority code. The MIPS architecture provides
interrupt mask bits within the Status register (bits 8 through 15), which makes it possible to write
a priority interrupt handler. For our purposes at this time it is sufficient to enable all interrupts by
setting all these bits true using the following instructions:
li $s1, 0xffff # Mask to enable all interrupts
mtc0 $s1, $12 # Store enable bits in Status register
Details about the Status and Cause registers are shown below:
Status Register – Coprocessor 0 register $12 31 15 8 4 0
um el ie
Interrupt Mask
um – User mode
el – Exception level
ie – Interrupt enable
Cause Register – Coprocessor 0 register $13 31 15 8 6 2
Branch delayed Pending Interrupts Exception Code

9.5 Enabling I/O Interrupts
The Receiver Control (0xffff000) register associated with the keyboard and the Transmitter
Control (0xffff0008) register associated with the display each have an interrupt enable bit at
position one, just to the left of the Ready bit. This bit must be set to one to enable these I/O
devices to generate an interrupt when the Ready bit comes true. For example, the following code
will enable the keyboard to generate an interrupt when a key is pressed.
li $s1, 2 # In binary 00000000000000000000000000000010
li $a3, 0xffff0000 # Base address of I/O
sw $s1, 0($a3) # Enable Keyboard Interrupt
9.6 Example Code to Enable Interrupts
To experience the effects of an external interrupt we need a program running that will be
interrupted. In this example we use the keyboard as a source of asynchronous interrupt signals.
Using the QtSpim Settings you must make sure that the modified exception response code
replaces the standard exception response code. The modified exception code (exceptions echo.s)
can be downloaded from the same site that you downloaded this document. You will notice that
only five additional instructions were added to the standard exception response code to
implement this new exception response code that responds to interrupts from the keyboard.
The first three instructions in the main program below enable the keyboard to generate an
exception when the Ready bit comes true (See Figure 8.1). The next two instructions are used to
enable all exceptions, including I/O interrupts.
#####################################################################
# Functional Description: Reports elapsed time every 5 seconds over
# a period of one minute. Interrupts from the keyboard are enabled.
# Must Run with Memory-Mapped I/O and the New Exception response code.
#####################################################################
.data # Data declaration section
msg1: .asciiz "\n Elapsed Time = "
.text
main: # Start of code section
li $a3, 0xffff0000 # Base address of I/O
li $s1, 2 # In binary 00000000000000000000000000000010
sw $s1, 0($a3) # Enable Keyboard Interrupt
li $s1, 0x0000ffff # Mask to enable all exceptions
mtc0 $s1, $12 # Store enable bits in status register
li $s1, 0 # Time counter
countdown:
li $s0, 1000000 # Time Factor
waitloop:
addi $s0, $s0, -1

bnez $s0, waitloop
addi $s1, $s1, 5
li $v0, 4 # Print message
la $a0, msg1
syscall
move $a0, $s1
li $v0, 1
syscall # Print amount
addi $t0, $s1, -60
bnez $t0, countdown
li $v0, 10
syscall
When this program starts running, you should start typing some sentences. There are no
instructions in the above program to read a string of characters from the keyboard or to print the
corresponding string, but you will notice that the interrupt handler is reading each character you
type and is echoing each character back to the terminal. When an interrupt occurs the current
instruction completes execution and the address of this instruction is saved in the EPC register of
coprocessor 0. Analyzing the current exception response code you will discover that four (4) is
added to the value saved in the EPC and the exception return “eret” instruction uses this address
to return to the user code.
The new instructions that have been placed in the modified exception response code are shown
below. This code does not check the receiver Ready bit since we know it is true because we
received an interrupt. The Transmitter Ready bit is not checked because we know the display can
accept characters faster than we can type characters. It would be necessary to check the
Transmitter Ready bit if our objective is to immediately echo more than one character back to the
display. With QtSpim the exception code field of the Cause register is loaded with a value
greater than 15 when an I/O interrupt occurs. In order to respond to I/O interrupts, the following
code was added to the standard exception handler. (See new file <exceptions echo.s>)
############################### New ##################################
sgt $v0, $k0, 15
bgtz $v0, _echo # Respond to I/O Interrupts
nop
######################################################################
################################### New Code ########################
_echo:
li $a0, 0xffff0000 # Load Base address of I/O Devices into $a0
lw $v0, 4($a0) # Get character form Keyboard
sw $v0, 12($a0) # Send character to Display
b ret
nop
######################################################################

9.7 A Random Number Generator
It’s always useful to have a random number generator, especially if you own a casino. Some of
the homework exercises will involve modifications to the following program.
#####################################################################
# Description: Generates a random number each time key is pressed.
# Numbers range from 0 to 99. Press Enter key to quit.
# Must Run with a New Exception response code that displays key that was pressed
#####################################################################
.data # Data declaration section
nl: .asciiz "\n"
msg: .asciiz "\nHow Lucky Can You Get?"
bye: .asciiz "\n** Come Back Again **"
.text
main:
li $a3, 0xffff0000 # Base address of I/O
li $s1, 2
sw $s1, 0($a3) # Enable Keyboard Interrupt
li $s1, 0x0000ffff # Mask to enable all interrupts
mtc0 $s1, $12 # Store enable bits in Status register
li $v0, 4 # Print message
la $a0, msg
syscall
li $t0, 211 # Seed values
li $t1, 3021377
clear:
li $v1, 0 # Clear the flag
ranloop:
mult $t0, $t1
mflo $t0
addiu $t0, $t0, 5923
beqz $v1, ranloop # Keystroke will change $v1
# to ASCII value for the key
addiu $v1, $v1, -10
beqz $v1, quit # Quit if Enter Key
li $v0, 4 # Print newline
la $a0, nl
syscall
li $v1, 100 # Controls Range (0 – 99)
divu $t0, $v1
mfhi $a0 # Get Remainder
li $v0, 1
syscall
b clear
quit:
li $v0, 4 # Print newline
la $a0, bye
syscall
li $v0, 10
syscall
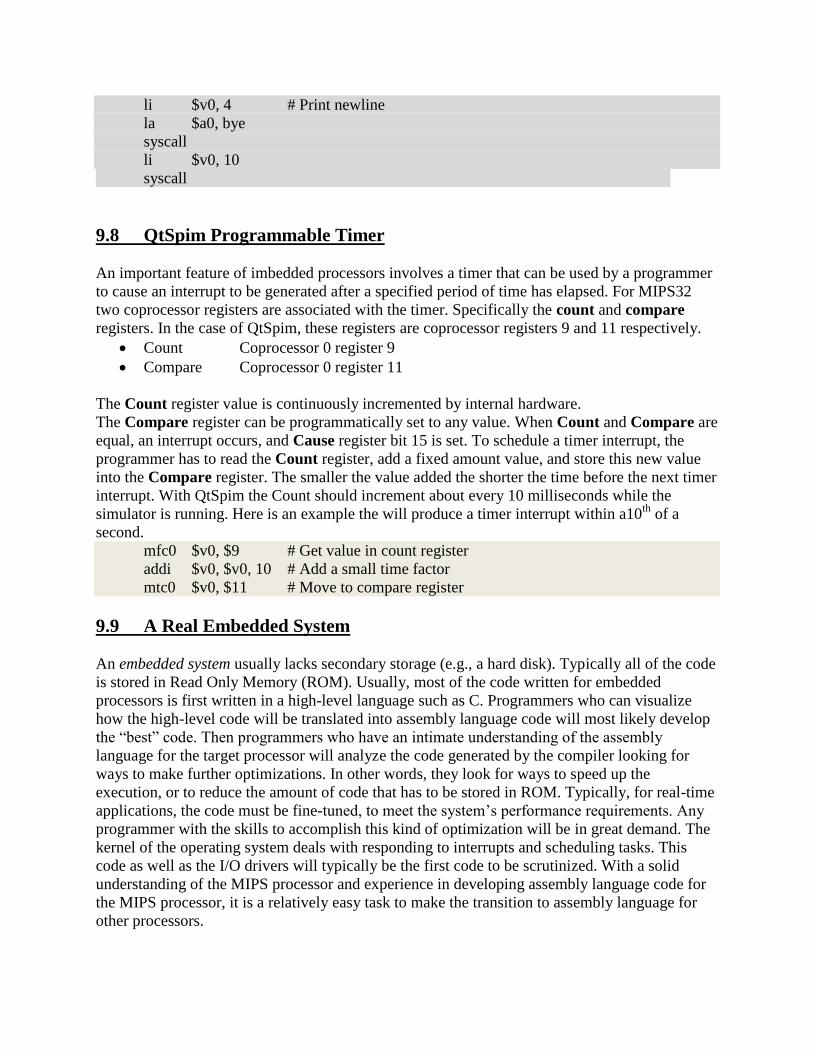
9.8 QtSpim Programmable Timer
An important feature of imbedded processors involves a timer that can be used by a programmer
to cause an interrupt to be generated after a specified period of time has elapsed. For MIPS32
two coprocessor registers are associated with the timer. Specifically the count and compare
registers. In the case of QtSpim, these registers are coprocessor registers 9 and 11 respectively.
Count Coprocessor 0 register 9
Compare Coprocessor 0 register 11
The Count register value is continuously incremented by internal hardware.
The Compare register can be programmatically set to any value. When Count and Compare are
equal, an interrupt occurs, and Cause register bit 15 is set. To schedule a timer interrupt, the
programmer has to read the Count register, add a fixed amount value, and store this new value
into the Compare register. The smaller the value added the shorter the time before the next timer
interrupt. With QtSpim the Count should increment about every 10 milliseconds while the
simulator is running. Here is an example the will produce a timer interrupt within a10th
of a
second.
mfc0 $v0, $9 # Get value in count register
addi $v0, $v0, 10 # Add a small time factor
mtc0 $v0, $11 # Move to compare register
9.9 A Real Embedded System
An embedded system usually lacks secondary storage (e.g., a hard disk). Typically all of the code
is stored in Read Only Memory (ROM). Usually, most of the code written for embedded
processors is first written in a high-level language such as C. Programmers who can visualize
how the high-level code will be translated into assembly language code will most likely develop
the “best” code. Then programmers who have an intimate understanding of the assembly
language for the target processor will analyze the code generated by the compiler looking for
ways to make further optimizations. In other words, they look for ways to speed up the
execution, or to reduce the amount of code that has to be stored in ROM. Typically, for real-time
applications, the code must be fine-tuned, to meet the system’s performance requirements. Any
programmer with the skills to accomplish this kind of optimization will be in great demand. The
kernel of the operating system deals with responding to interrupts and scheduling tasks. This
code as well as the I/O drivers will typically be the first code to be scrutinized. With a solid
understanding of the MIPS processor and experience in developing assembly language code for
the MIPS processor, it is a relatively easy task to make the transition to assembly language for
other processors.

9.10 The PIC32 Microcontroller
We have just about reached the limit of what we can learn by using the QtSpim simulator. We
now have an opportunity to learn more about a real embedded microcontroller. The PIC32 is a
single chip microcontroller that uses a MIPS core as its computing engine.
http://www.microchip.com/wwwproducts/Devices.aspx?dDocName=en534177
As you can see, they have integrated the MIPS32 architecture with a host of I/O interface
components. In addition to the MIPS computing engine the PIC32 includes an expanded
interrupt controller, five additional timers, flash RAM, and SRAM. All these components
provide a highly integrated inexpensive microcontroller that is targeted for high-performance
embedded systems applications. The Microchip Corporation also has an Integrated Development
Environment (IDE) designed to facilitate programming of the PIC32 in the C programming
language.
Family PIC32MX4xx
Max Speed MHz 80
Program Memory Size (KB) 512
RAM (KB) 32
DMA Channels 4
SPITM
2
I2C
TM Compatible 2
A/D channels 16
Max A/D Sample Rate 1000
Input Capture 5
Output Compare/Std. PWM 5
16-bit Digital Timers 5

Parallel Port PMP16
Comparators 2
Internal Oscillator 8 MHz, 32 kHz
RTCC Yes
I/O Pins 85
We control all these devices via memory mapped special function registers (SFR’s), the details
of which are spelled out in the PIC32 reference manual. The master index to almost any
document related to the PIC32 can be found here:
http://www.microchip.com/wwwproducts/Devices.aspx?dDocName=en534177
The 250 page Family Data Sheet provides the final word on how to use all the capabilities of the
PIC32: http://ww1.microchip.com/downloads/en/DeviceDoc/61156F.pdf
9.11 Transition to The MPLAB Intregrated Development Environment
MPLAB Integrated Development Environment (IDE) is a free, integrated toolset for the
development of embedded applications employing Microchip's PIC® and dsPIC
®
microcontrollers. The MPLAB IDE runs as a 32-bit application on MS Windows®, is easy to use
and includes a host of free software components for fast application development and super-
charged debugging. MPLAB IDE also serves as a single, unified graphical user interface for
additional Microchip and third party software and hardware development tools. Moving between
tools is a snap, and upgrading from the free software simulator to hardware debug and
programming tools is easy because MPLAB IDE has the same user interface for all tools. http://www.microchip.com/stellent/idcplg?IdcService=SS_GET_PAGE&nodeId=1406&dDocName=en536656
Download MPLAB IDE and use the tutorial in the MPLAB IDE User’s Guide at the bottom of
this page to explore how easy it is to create an application. Write assembly code, build and
assemble your project with MPLAB's wizards, then test your code with the built-in simulator and
debugger. When you are ready to test your own application, select one of the low-cost
debugger/programmers to program a device and analyze your hardware. For example the
Cerebot32MX4 is a powerful microcontroller development board that can be purchased for less
than $100. http://www.digilentinc.com/Products/Detail.cfm?NavPath=2,396,754&Prod=CEREBOT32MX4

The MPLAB C Compiler for Academic Use (LITE) is distributed with a complete ANSI C
standard library. The libraries include functions for string manipulation, dynamic memory
allocation, data conversion, timekeeping, and math functions (trigonometric, exponential and
hyperbolic). The compilers support both alternate data models, especially useful to take advantage
of the memory in embedded systems. The MPLAB C Compiler for Academic Use (LITE)
includes a powerful command line driver program. Using the driver program, application
programs can be compiled, assembled, and linked in a single step. These are easy to learn and
ready for use with the full complement of libraries, ancillary programs and full documentation on
compiler, assembler and linker.
Features Key features of the MPLAB C Compiler for Academic Use (LITE) include:
ANSI-compliant
Free, fully functional, with all libraries and source code as commercial versions
Integrated with MPLAB IDE for easy-to-use project management and source-level debugging
Generates relocatable object modules for enhanced code reuse
Fully compatible with object modules generated with MPASM Assembler, allowing complete
freedom to mix assembly and C in a single project

9.12 Running a Program on the MPLAB simulator
The following is an example program that will run on the MPLAB IDE. You should be able to
download this example program from the same site that you downloaded this revised version of
Chapter 9. At this time, it is recommended you create a folder with the name MPLAB Projects
and within that folder create a new folder with the name Blink. All the files for our first project
will go into the Blink folder. MPLAB will put at least nine (9) files in each new project folder.
One of these files will be your MIPS assembly language program. It is recommended that you
give each new project folder the same name as you give to the MIPS assembly language program
file. For example the following program file has the name “Blink”. There are new directives that
we now need to learn about when using MPLAB. You will notice that comments are specified
using the same syntax as the C programming language.
/*####################################################################
# NAME: Blink DATE: March 25, 2011 - 1:30 PM
# Functional Description: Blink PortB Led's off and on
# Must set breakpoints and watch LATB to observe function with MPLAB
# Assembler automatically inserts nop's to take care of delayed branches
#######################################################################*/
#include <p32xxxx.h> // Provides symbolic names for SFR such as TRISB
.globl main
.ent main // directive that marks symbol 'main' as entry point
main: // Start of code section
sw $zero, TRISB // TRISB = 0; make PortB output
li $v0, 0x033F // Bit Pattern: 0000001100111111
sw $v0, PORTB // PORTB - Turn on all 8 LED's
back:
li $s0, 100000 // Adjustable Time Factor
nop // ** Set breakpoint here
loop1:
addi $s0, $s0, -1
bnez $s0, loop1
sw $zero, PORTB // PORTB - Turn off all LED's
li $s0, 100000 // Adjustable Time Factor
nop // ** Set breakpoint here
loop2:
addi $s0, $s0, -1
bnez $s0, loop2
sw $v0, PORTB // Turn on all 8 LED's
b back
.end main // directive that marks end of 'main'
Interrupt code can be written in C or assembly
Flexible memory models take advantage of small memory applications and the storage of
data in SFR space Strong support for inline assembly when total control is absolutely
necessary Super-efficient code generator engine with multi-level optimization
Extensive library support, including standard C, math, DSP and peripheral libraries
Additional software libraries and application development tools are available from
Microchip’s web site

The symbolic names for all the PIC32 special function registers (SFR) are defined within the
header file p32xxxx.h. In the above program the symbolic name TRISB and PORTB correspond
to the memory mapped special function registers (SFRs) for port B. You can examine the names
and addresses of all the SFRs in MPLAB by opening: View > SFR / Peripherals. Everything
you ever wanted to know, but were afraid to ask about the general purpose I/O ports of the
PIC32 is available at: http://ww1.microchip.com/downloads/en/DeviceDoc/61120D.pdf
The PIC32 has seven general purpose I/O ports, and each port has four associated SFR registers .
When you look at the list of addresses associated with the SFRs you will observe that the
designers of the PIC32 left address space available for the possibility of expanding the number of
SFR registers associated with each of the peripherals. So for example the addresses associated
with the port B registers are:
Address Symbol Function
0xBF886040 TRISB Control: If bit is 0 the corresponding bit of port is an output else it’s an input
0xBF886050 PORTB Data in or out
0xBF886060 LATB Latch that drives the output pins labeled PORTB
0xBF886070 ODCB Open-Drain control register
Another observation is that the header for port B on the Cerebot development board is only 8-bits
wide but internally the latch associated with the data port is 16 bits wide. Also we observe that it
is not the lower 8-bits of Port B that are connected to the Pmod LED header. To light up all 8
LED’s on the header the following bit pattern must be stored in the Port B latch: 0x033f .
Starting on page 25 of the following PDF document, Microchip provides a step by step
explanation on how to set up and run the following program on MPLAB. Just go to:
http://ww1.microchip.com/downloads/en/DeviceDoc/51833A.pdf
The following Quick Reference provides a slightly modified sequence of steps to create a
project.
Quick Reference 1. Select: Project > Project Wizard to create a new project, when window opens click next. 2. At “Step One: Select a device”, use the pull-down menu to select the device. Then click next. 3. At “Step Two: Select a language toolsuite”, choose “Microchip PIC32 C-Compiler Toolsuite” as the “Active Toolsuite”. Then click next to continue 4. At “Step Three: Click Create a new project file” Now Browse to select the predefined folder where the new project files will be saved. (This assumes that you previously created a MPLAB projects folder and a new project folder, e.g. “Blink”.) Click Next to continue. 5. At “Step Four: Add any existing files to your project” We have none so Select next to continue. 6. At the Summary screen, click Finish to create the new project and workspace. 7. The Project window should open showing our new project. (If not, select View>Project)
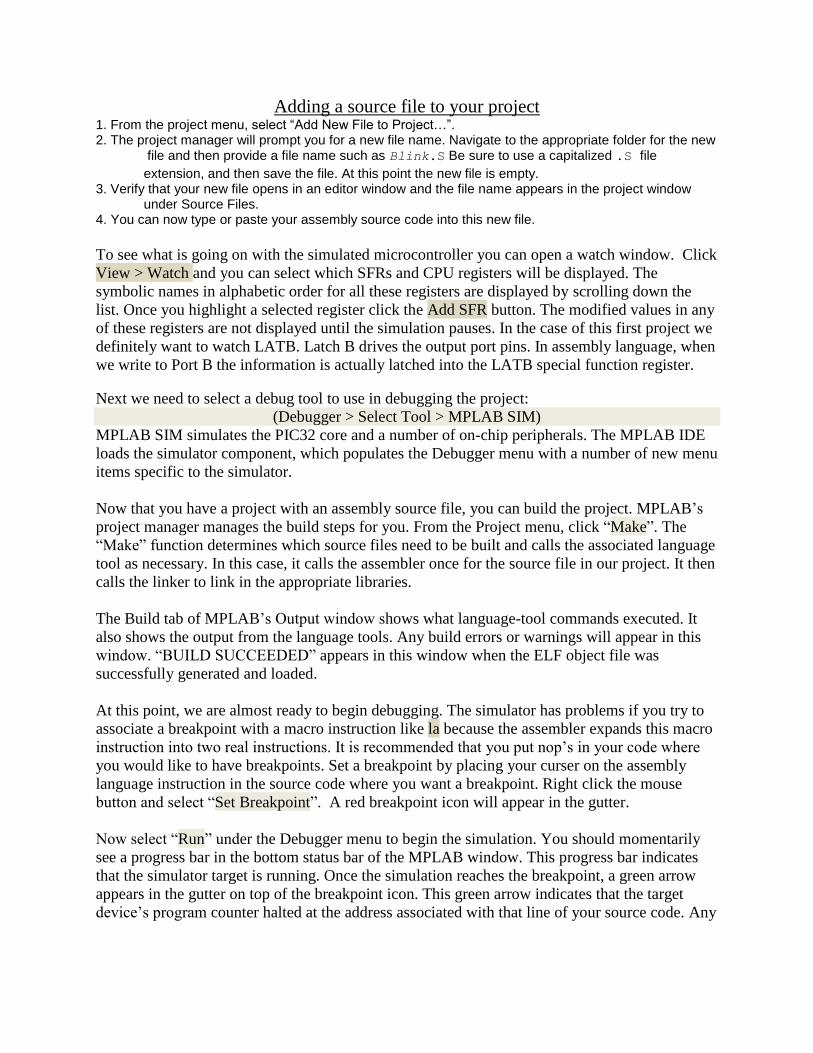
Adding a source file to your project 1. From the project menu, select “Add New File to Project…”. 2. The project manager will prompt you for a new file name. Navigate to the appropriate folder for the new file and then provide a file name such as Blink.S Be sure to use a capitalized .S file
extension, and then save the file. At this point the new file is empty. 3. Verify that your new file opens in an editor window and the file name appears in the project window under Source Files. 4. You can now type or paste your assembly source code into this new file.
To see what is going on with the simulated microcontroller you can open a watch window. Click
View > Watch and you can select which SFRs and CPU registers will be displayed. The
symbolic names in alphabetic order for all these registers are displayed by scrolling down the
list. Once you highlight a selected register click the Add SFR button. The modified values in any
of these registers are not displayed until the simulation pauses. In the case of this first project we
definitely want to watch LATB. Latch B drives the output port pins. In assembly language, when
we write to Port B the information is actually latched into the LATB special function register.
Next we need to select a debug tool to use in debugging the project:
(Debugger > Select Tool > MPLAB SIM)
MPLAB SIM simulates the PIC32 core and a number of on-chip peripherals. The MPLAB IDE
loads the simulator component, which populates the Debugger menu with a number of new menu
items specific to the simulator.
Now that you have a project with an assembly source file, you can build the project. MPLAB’s
project manager manages the build steps for you. From the Project menu, click “Make”. The
“Make” function determines which source files need to be built and calls the associated language
tool as necessary. In this case, it calls the assembler once for the source file in our project. It then
calls the linker to link in the appropriate libraries.
The Build tab of MPLAB’s Output window shows what language-tool commands executed. It
also shows the output from the language tools. Any build errors or warnings will appear in this
window. “BUILD SUCCEEDED” appears in this window when the ELF object file was
successfully generated and loaded.
At this point, we are almost ready to begin debugging. The simulator has problems if you try to
associate a breakpoint with a macro instruction like la because the assembler expands this macro
instruction into two real instructions. It is recommended that you put nop’s in your code where
you would like to have breakpoints. Set a breakpoint by placing your curser on the assembly
language instruction in the source code where you want a breakpoint. Right click the mouse
button and select “Set Breakpoint”. A red breakpoint icon will appear in the gutter.
Now select “Run” under the Debugger menu to begin the simulation. You should momentarily
see a progress bar in the bottom status bar of the MPLAB window. This progress bar indicates
that the simulator target is running. Once the simulation reaches the breakpoint, a green arrow
appears in the gutter on top of the breakpoint icon. This green arrow indicates that the target
device’s program counter halted at the address associated with that line of your source code. Any

time you modify the source code you have to “Make” the project again. When you are done for
the day use: Project > Save, and then Project > Close.
When you are ready to get back to work use: Project > Open.
Now that we have an assembly language program running on the MPLAB simulator, the next
goal is to download the code to the flash memory of a Cerebot development board, and actually
run the program on the PIC32 microcontroller. A good streaming video demonstration is
available at: http://www.digilentinc.com/Products/Detail.cfm?NavPath=2,739,756&Prod=CEREBOT32MX4
Here is a quick overview of the steps involved:
1. Using the USB 2 cable, plug-in the Cerebot board and flip the power switch on.
2. Launch the MPLAB IDE and open the “Blink” project.
3. Click: Debugger > Select Tool > PIC32 Starter Kit
4. Click: Project > Make.
5. Click: Debugger > Programming > Program All Memories.
6. Click “Yes” when warned about overwriting the PIC32 configuration.
7. Run the program as a standalone application by clicking: Debugger > None.
9.13 Projects
We now propose to challenge you with a series of projects. We will first implement a project in
MIPS assembly language to run on the Cerebot development board, and then we will implement
the same project in the C programming language.
Related Documents