SLR 1 FT. SLR 3 FT. SLR 5 FT. SLR 7 FT. AQUIDNECK ISLAND, RI SOCIOECONOMICS OF SEA LEVEL RISE COASTAL FACTSHEET 2010 Census Population 2010 Census Median Age 2014 ACS Median Household Income 58,211 $69,682 41.3 Aquidneck Island comprises three of Rhode Island’s coastal communities: Portsmouth, Middletown and Newport, Rhode Island. The three communities of Aquidneck Island have a calculated household size of 2.15-2.19 residents per housing unit. The calculated household size and the percentage of occupied housing units were used to calculate a population estimate. Approximately 63- 71% of the residential units located within SLR inundation zones 3, 5 and 7 FT. are occupied units. Single family (SF), multi-family (MF) and mobile home units were identified in GIS using the e-911 shapefile. The majority of the residential units located in the SLR inundation zones are single family units. There is a significant change between the estimated population located in the 3 and 5 FT. inundation zones, with an additional 525 people estimated in the 5 FT. zone. The 7 FT. inundation zone has the greatest population and number of homes, with 1194 people estimated within the zone and 556 occupied residential units. The maps above illustrate each of the SLR inundation zones. Single family units are represented by orange points in the SLR inundation zone maps, while multi-family units are represented by green points. Purple points signify mobile home units. Island Park Beach, Portsmouth RI Sept. 2015 King Tide, Photo Courtesy of Mycoast.org, submitted by Thurston Gray Rhode Island’s municipalities are in the preliminary stages of integrating planning for sea level rise and climate change into their comprehensive planning process. To support these planning efforts of RI cities and towns, RISPP developed the Socioeconomics of Sea Level Rise project. The project aims to assist coastal municipalities in their long-term planning by attempting to identify population characteristics of the people located within sea level rise (SLR) inundation zones 1, 3, 5 and 7 FT. The data presented in this factsheet places a focus on Environmental Justice and Title VI populations. The RISPP utilized 2010 Decennial Census data and the latest American Community Survey (ACS) estimates to conduct an extensive data analysis. Staff also utilized CRMC’s STORMTOOLS GIS shapefiles to identify the SLR inundation zones. In addition, RI Geographic Information Systems (RIGIS) e-911 data was utilized to identify single family, multi-family and mobile home residential points located within each SLR inundation zone. For more information on the methodology, please reference the full report on our website. PROJECT OVERVIEW METHODOLOGY AQUIDNECK ISLAND QUICK FACTS AQUIDNECK ISLAND’S OCCUPIED RESIDENTIAL UNITS & POPULATION ESTIMATES SLR INUNDATION ZONES

Welcome message from author
This document is posted to help you gain knowledge. Please leave a comment to let me know what you think about it! Share it to your friends and learn new things together.
Transcript
SLR 1 FT. SLR 3 FT. SLR 5 FT. SLR 7 FT.
A Q U I D N E C K I S L A N D , R ISOCIOECONOMICS OF SEA LEVEL RISE COASTAL FACTSHEET
2010 Census Populat ion
2010 Census Median Age
2014 ACS Median Household Income
58,211
$69,68241.3
Aquidneck Island comprises three of Rhode Island’s coastal communities: Portsmouth, Middletown and Newport, Rhode Island.
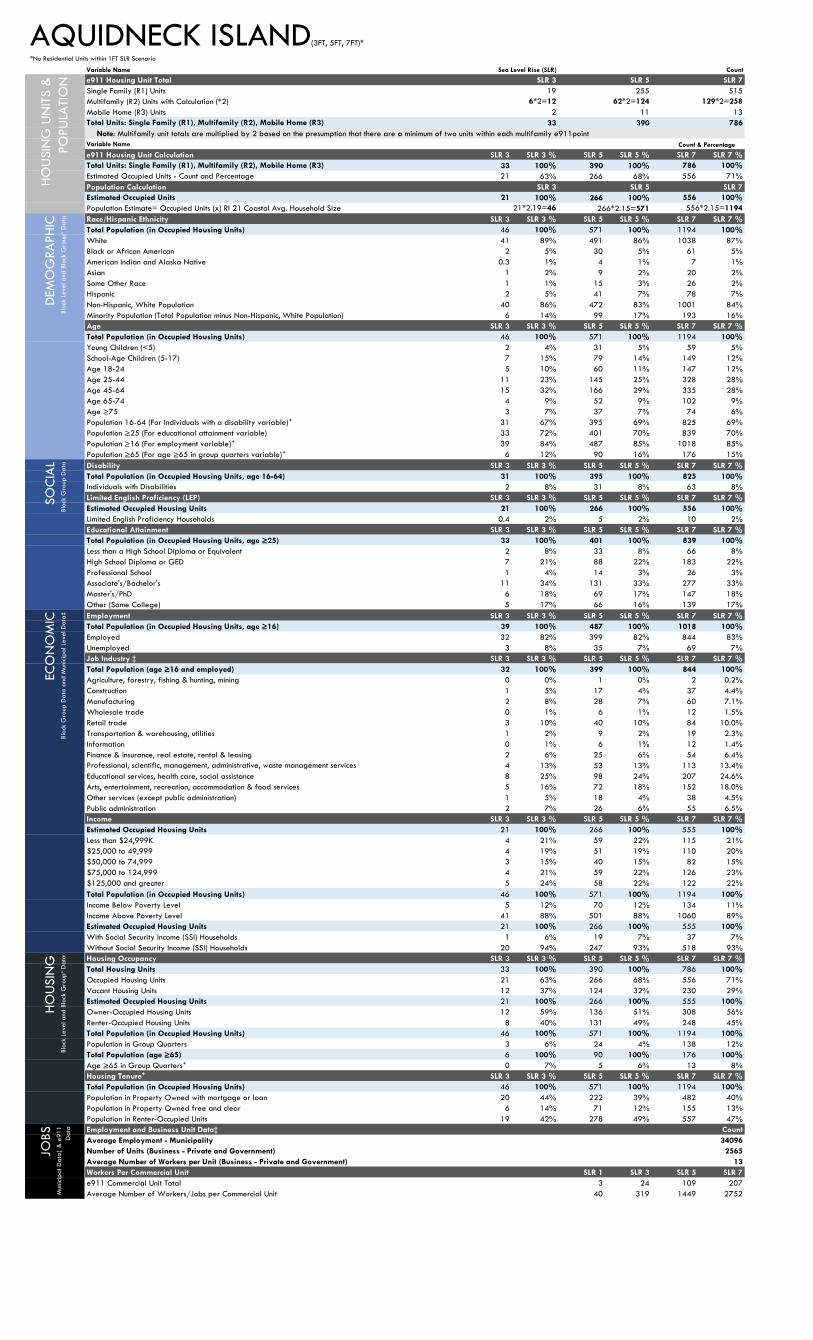
The three communities of Aquidneck Island have a calculated household size of 2.15-2.19 residents per housing unit. The calculated household size and the percentage of occupied housing units were used to calculate a population estimate. Approximately 63-71% of the residential units located within SLR inundation zones 3, 5 and 7 FT. are occupied units. Single family (SF), multi-family (MF) and mobile home units were identified in GIS using the e-911 shapefile. The majority of the residential units located in the SLR inundation zones are single family units. There is a significant change between the estimated population located in the 3 and 5 FT. inundation zones, with an additional 525 people estimated in the 5 FT. zone. The 7 FT. inundation zone has the greatest population and number of homes, with 1194 people estimated within the zone and 556 occupied residential units.
The maps above illustrate each of the SLR inundation zones. Single family units are represented by orange points in the SLR inundation zone maps, while multi-family units are represented by green points. Purple points signify mobile home units.
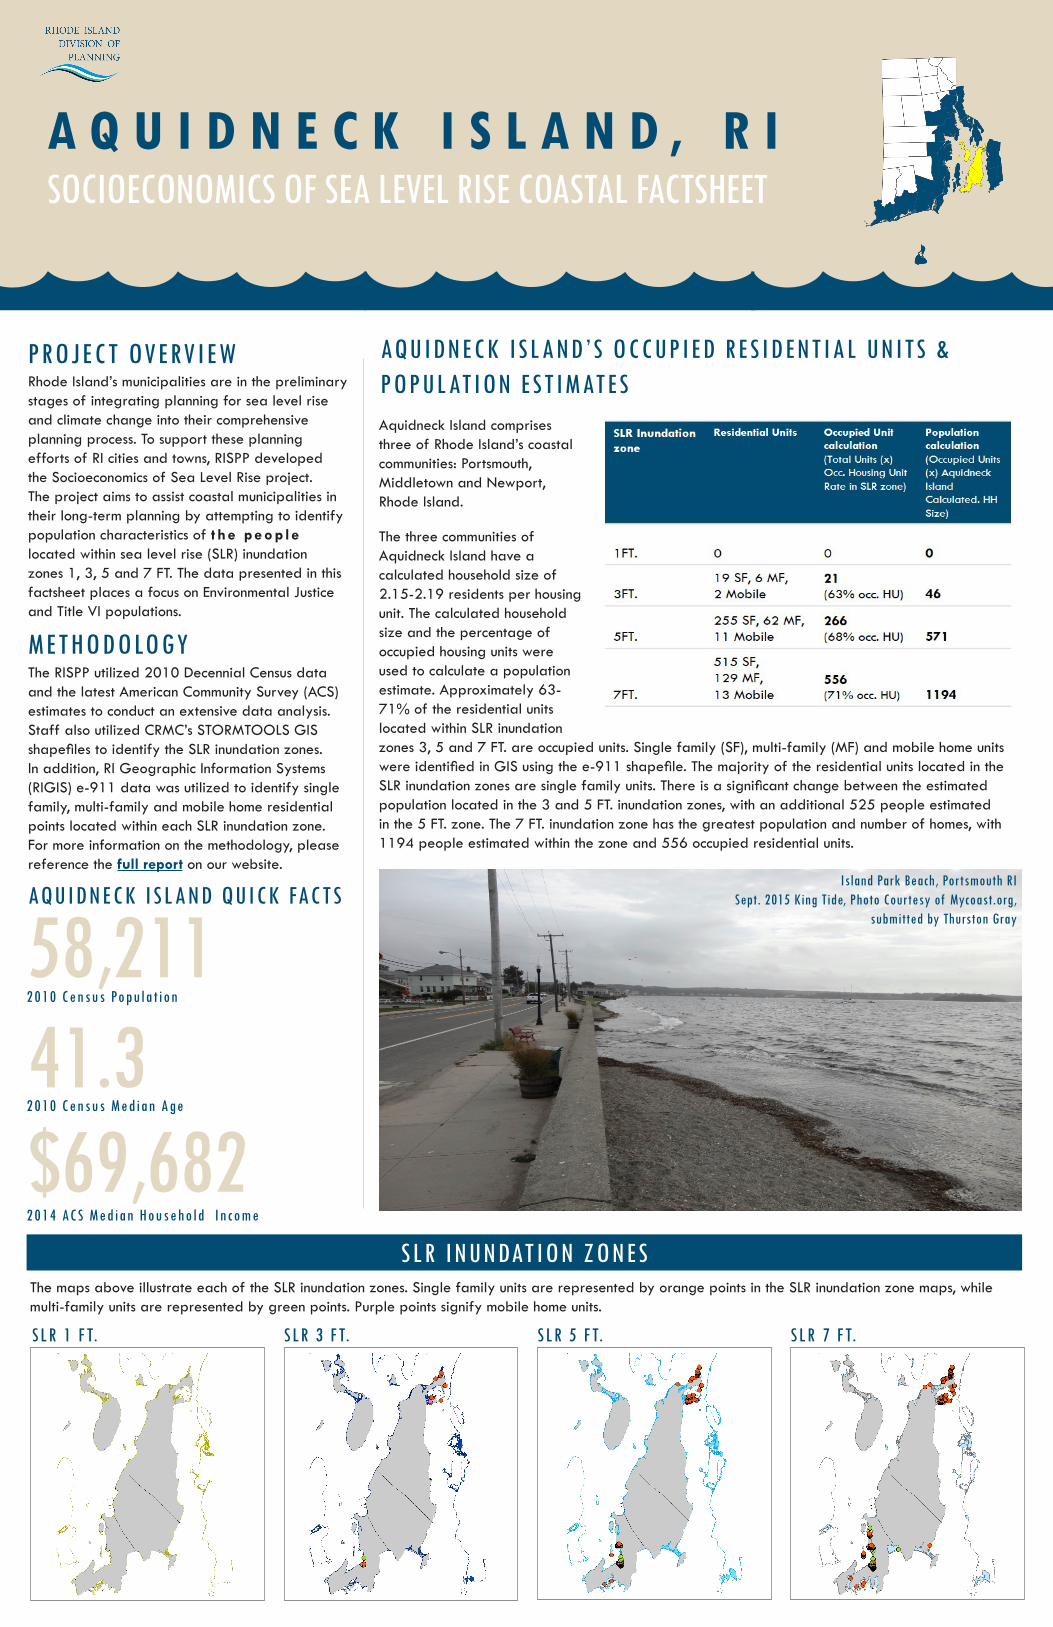
Island Park Beach, Portsmouth RISept. 2015 King Tide, Photo Courtesy of Mycoast.org,
submitted by Thurston Gray
Rhode Island’s municipalities are in the preliminary stages of integrating planning for sea level rise and climate change into their comprehensive planning process. To support these planning efforts of RI cities and towns, RISPP developed the Socioeconomics of Sea Level Rise project. The project aims to assist coastal municipalities in their long-term planning by attempting to identify population characteristics of t he peop l e located within sea level rise (SLR) inundation zones 1, 3, 5 and 7 FT. The data presented in this factsheet places a focus on Environmental Justice and Title VI populations.
The RISPP utilized 2010 Decennial Census data and the latest American Community Survey (ACS) estimates to conduct an extensive data analysis. Staff also utilized CRMC’s STORMTOOLS GIS shapefiles to identify the SLR inundation zones. In addition, RI Geographic Information Systems (RIGIS) e-911 data was utilized to identify single family, multi-family and mobile home residential points located within each SLR inundation zone. For more information on the methodology, please reference the full report on our website.
PROJECT OVERVIEW
METHODOLOGY
AQUIDNECK ISLAND QUICK FACTS
AQUIDNECK ISLAND’S OCCUPIED RESIDENTIAL UNITS & POPULATION ESTIMATES
SLR INUNDATION ZONES

18%
21%
20%
25%
16%
Less than 24,999K 25,000 to 49,999 50,000 to 74,999 75,000 to 124,999 125,000 and up
21%
19%
15%
21%
24% 22%
19%
15%
22%
22% 21%
20%
15%
23%
22%
RACE
&
AG
E SO
CIA
L CH
ARA
CTER
ISTI
CSH
OU
SEH
OLD
IN
COM
EH
OU
SEH
OLD
CH
ARA
CTER
ISTI
CS
A Q U I D N E C K I S L A N D , R ISOCIOECONOMICS OF SEA LEVEL RISE COASTAL FACTSHEET
44% Owned with Mortgage/Loan
39% Owned with Mortgage/Loan
40% Owned with Mortgage/Loan
42% Renter Occupied 49% Renter Occupied 47% Renter Occupied
14% Owned Outright 12% Owned Outright 13% Owned Outright
SLR 1 SLR 3 SLR 5 SLR 7EST. POPULATION: 46 EST. OCCUPIED HOUSEHOLDS: 21
EST. POPULATION: 0 EST. OCCUPIED HOUSEHOLDS: 0
There were zero residential units located within the e-911 shapefile in the 1 FT. SLR inundation scenario. Please note, a zero value does not imply that zero people or structures will be impacted in a 1 FT. SLR scenario.
EST. POPULATION: 571 EST. OCCUPIED HOUSEHOLDS: 266
EST. POPULATION: 1194 EST. OCCUPIED HOUSEHOLDS: 556
86% or 491 - White 5% or 30 - Black 1% or 4 - American Indian/Alaska Native 2% or 9 - Asian 7% or 41- Hispanic 17% or 99 - Minority
89% or 41 - White 5% or 2 - Black 1% or 0.3 - American Indian/Alaska Native 2% or 1 - Asian 5% or 2 - Hispanic 14% or 6 - Minority
87% or 1038- White 5% or 61 - Black 1% or 7 - American Indian/ Alaska Native 2% or 20 - Asian 7% or 78 - Hispanic 16% or 193 - Minority
7%or 3 - Age 75 or older
7%or 37 - Age 75 or older
6%or 74 - Age 75 or older
8% or 2 are Individuals with Disabilities
2% or 0.4 are Limited English Proficiency Households
8% or 3 are Unemployed
12% or 5 are Individuals Below Poverty Level
6% or 1 Households receive SSI
8% or 31are Individuals with Disabilities
2% or 5 are Limited English Proficiency Households
7% or 35 are Unemployed
12% or 70 are Individuals Below Poverty Level
7% or 19 Households receive SSI
8% or 63 are Individuals with Disabilities
2% or 10 are Limited English Proficiency Households
7% or 69 are Unemployed
11% or 134 are Individuals Below Poverty Level
7% or 37 Households receive SSI
- In Estimated Occupied Housing Units
- Percent of Population in Housing Type
Variable Name
e911 Housing Unit Total
Single Family (R1) Units 19 255 515
Multifamily (R2) Units with Calculation (*2) 6*2=12 62*2=124 129*2=258
Mobile Home (R3) Units 2 11 13
Total Units: Single Family (R1), Multifamily (R2), Mobile Home (R3) 33 390 786
Variable Name
e911 Housing Unit Calculation SLR 3 SLR 3 % SLR 5 SLR 5 % SLR 7 SLR 7 %
Total Units: Single Family (R1), Multifamily (R2), Mobile Home (R3) 33 100% 390 100% 786 100%
Estimated Occupied Units - Count and Percentage 21 63% 266 68% 556 71%
Population Calculation
Estimated Occupied Units 21 100% 266 100% 556 100%
Population Estimate= Occupied Units (x) RI 21 Coastal Avg. Household Size
Race/Hispanic Ethnicity SLR 3 SLR 3 % SLR 5 SLR 5 % SLR 7 SLR 7 %
Total Population (in Occupied Housing Units) 46 100% 571 100% 1194 100%
White 41 89% 491 86% 1038 87%
Black or African American 2 5% 30 5% 61 5%
American Indian and Alaska Native 0.3 1% 4 1% 7 1%
Asian 1 2% 9 2% 20 2%
Some Other Race 1 1% 15 3% 26 2%
Hispanic 2 5% 41 7% 78 7%
Non-Hispanic, White Population 40 86% 472 83% 1001 84%
Minority Population (Total Population minus Non-Hispanic, White Population) 6 14% 99 17% 193 16%
Age SLR 3 SLR 3 % SLR 5 SLR 5 % SLR 7 SLR 7 %
Total Population (in Occupied Housing Units) 46 100% 571 100% 1194 100%
Young Children (<5) 2 4% 31 5% 59 5%
School-Age Children (5-17) 7 15% 79 14% 149 12%
Age 18-24 5 10% 60 11% 147 12%
Age 25-44 11 23% 145 25% 328 28%
Age 45-64 15 32% 166 29% 335 28%
Age 65-74 4 9% 52 9% 102 9%
Age ≥75 3 7% 37 7% 74 6%
Population 16-64 (For Individuals with a disability variable)⁺ 31 67% 395 69% 825 69%
Population ≥25 (For educational attainment variable) 33 72% 401 70% 839 70%
Population ≥16 (For employment variable)⁺ 39 84% 487 85% 1018 85%
Population ≥65 (For age ≥65 in group quarters variable)⁺ 6 12% 90 16% 176 15%
Disability SLR 3 SLR 3 % SLR 5 SLR 5 % SLR 7 SLR 7 %
Total Population (in Occupied Housing Units, age 16-64) 31 100% 395 100% 825 100%
Individuals with Disabilities 2 8% 31 8% 63 8%
Limited English Proficiency (LEP) SLR 3 SLR 3 % SLR 5 SLR 5 % SLR 7 SLR 7 %
Estimated Occupied Housing Units 21 100% 266 100% 556 100%
Limited English Proficiency Households 0.4 2% 5 2% 10 2%
Educational Attainment SLR 3 SLR 3 % SLR 5 SLR 5 % SLR 7 SLR 7 %
Total Population (in Occupied Housing Units, age ≥25) 33 100% 401 100% 839 100%
Less than a High School Diploma or Equivalent 2 8% 33 8% 66 8%
High School Diploma or GED 7 21% 88 22% 183 22%
Professional School 1 4% 14 3% 26 3%
Associate's/Bachelor's 11 34% 131 33% 277 33%
Master's/PhD 6 18% 69 17% 147 18%
Other (Some College) 5 17% 66 16% 139 17%
Employment SLR 3 SLR 3 % SLR 5 SLR 5 % SLR 7 SLR 7 %
Total Population (in Occupied Housing Units, age ≥16) 39 100% 487 100% 1018 100%
Employed 32 82% 399 82% 844 83%
Unemployed 3 8% 35 7% 69 7%
Job Industry ‡ SLR 3 SLR 3 % SLR 5 SLR 5 % SLR 7 SLR 7 %
Total Population (age ≥16 and employed) 32 100% 399 100% 844 100%
Agriculture, forestry, fishing & hunting, mining 0 0% 1 0% 2 0.2%
Construction 1 5% 17 4% 37 4.4%
Manufacturing 2 8% 28 7% 60 7.1%
Wholesale trade 0 1% 6 1% 12 1.5%
Retail trade 3 10% 40 10% 84 10.0%
Transportation & warehousing, utilities 1 2% 9 2% 19 2.3%
Information 0 1% 6 1% 12 1.4%
Finance & insurance, real estate, rental & leasing 2 6% 25 6% 54 6.4%
Professional, scientific, management, administrative, waste management services 4 13% 53 13% 113 13.4%
Educational services, health care, social assistance 8 25% 98 24% 207 24.6%
Arts, entertainment, recreation, accommodation & food services 5 16% 72 18% 152 18.0%
Other services (except public administration) 1 5% 18 4% 38 4.5%
Public administration 2 7% 26 6% 55 6.5%
Income SLR 3 SLR 3 % SLR 5 SLR 5 % SLR 7 SLR 7 %
Estimated Occupied Housing Units 21 100% 266 100% 555 100%
Less than $24,999K 4 21% 59 22% 115 21%
$25,000 to 49,999 4 19% 51 19% 110 20%
$50,000 to 74,999 3 15% 40 15% 82 15%
$75,000 to 124,999 4 21% 59 22% 126 23%
$125,000 and greater 5 24% 58 22% 122 22%
Total Population (in Occupied Housing Units) 46 100% 571 100% 1194 100%
Income Below Poverty Level 5 12% 70 12% 134 11%
Income Above Poverty Level 41 88% 501 88% 1060 89%
Estimated Occupied Housing Units 21 100% 266 100% 555 100%
With Social Security Income (SSI) Households 1 6% 19 7% 37 7%
Without Social Security Income (SSI) Households 20 94% 247 93% 518 93%
Housing Occupancy SLR 3 SLR 3 % SLR 5 SLR 5 % SLR 7 SLR 7 %
Total Housing Units 33 100% 390 100% 786 100%
Occupied Housing Units 21 63% 266 68% 556 71%
Vacant Housing Units 12 37% 124 32% 230 29%
Estimated Occupied Housing Units 21 100% 266 100% 555 100%
Owner-Occupied Housing Units 12 59% 136 51% 308 56%
Renter-Occupied Housing Units 8 40% 131 49% 248 45%
Total Population (in Occupied Housing Units) 46 100% 571 100% 1194 100%
Population in Group Quarters 3 6% 24 4% 138 12%
Total Population (age ≥65) 6 100% 90 100% 176 100%
Age ≥65 in Group Quarters⁺ 0 7% 5 6% 13 8%
Housing Tenure⁺ SLR 3 SLR 3 % SLR 5 SLR 5 % SLR 7 SLR 7 %
Total Population (in Occupied Housing Units) 46 100% 571 100% 1194 100%
Population in Property Owned with mortgage or loan 20 44% 222 39% 482 40%
Population in Property Owned free and clear 6 14% 71 12% 155 13%
Population in Renter-Occupied Units 19 42% 278 49% 557 47%
Employment and Business Unit Data‡
Average Employment - Municipality
Number of Units (Business - Private and Government) 2565
Average Number of Workers per Unit (Business - Private and Government) 13
Workers Per Commercial Unit SLR 1 SLR 3 SLR 5 SLR 7
e911 Commercial Unit Total 3 24 109 207
Average Number of Workers/Jobs per Commercial Unit 40 319 1449 2752
AQUIDNECK ISLAND(3FT, 5FT, 7FT)*
*No Residential Units within 1FT SLR ScenarioEC
ON
OM
ICBlo
ck G
roup
Data
and
Mun
icip
al Le
vel D
ata
‡
HO
USIN
GBlo
ck L
eve
l and
Blo
ck G
roup
⁺ D
ata
JOBS
Mun
icip
al D
ata
‡ &
e911
Data Count
34096
21*2.19=46 266*2.15=571 556*2.15=1194
DEM
OG
RA
PH
ICBlo
ck L
eve
l and
Blo
ck G
roup
⁺ D
ata
SO
CIA
L Blo
ck G
roup
Data
Count & Percentage
SLR 3 SLR 5 SLR 7
Sea Level Rise (SLR) Count
HO
USIN
G U
NIT
S &
PO
PU
LATIO
N SLR 3 SLR 5 SLR 7
Note: Multifamily unit totals are multiplied by 2 based on the presumption that there are a minimum of two units within each multifamily e911point
Related Documents