Aqueous flat-cells perpendicular to the electric field for use in electron paramagnetic resonance spectroscopy, II: design Jason W. Sidabras a , Richard R. Mett a,b , James S. Hyde a, * a Department of Biophysics, Medical College of Wisconsin, 8701 Watertown Plank Road, Milwaukee, WI 53226-0509, USA b Milwaukee School of Engineering, Milwaukee, WI 53202-3109, USA Received 27 August 2004; revised 1 November 2004 Available online 2 December 2004 Abstract This paper builds on the work of Mett and Hyde [J. Magn. Reson. 165 (2003) 137]. Various aqueous flat-cell geometries in the perpendicular orientation have been studied using Ansoft High Frequency Structure Simulator (version 9.0, Pittsburgh, PA) and Computer Simulation Technology Microwave Studio (version 5.0, Wellesley Hills, MA). The analytic theory of Mett and Hyde has been refined to predict optimum dimensions of multiple sample cell structures including the effect of the sample holder dielectric properties and the interaction of the cells with each other on EPR signal strength. From these calculations and simulations we pro- pose a practical multiple cell sample structure for use in commercial rectangular TE 102 cavities that yields 2.0–2.3 times higher sen- sitivity relative to a single flat-cell in the nodal orientation. We also describe a modified TE 102 resonator design with square rather than cylindrical sample-access stacks that is predicted to give a factor of 2.2–2.7 enhancement in EPR signal strength of a single flat- cell in the nodal orientation. These signal enhancements are predicted with sample holders fabricated from polytetrafluoroethylene. Additional improvement in EPR signal of up to 75% can be achieved by using sample holder materials with lower dielectric constants. Ó 2004 Elsevier Inc. All rights reserved. Keywords: EPR; Finite-element; Microwave cavities; Dielectric loss; Aqueous samples 1. Introduction A conventional procedure for observation of aqueous EPR samples at X-band is to introduce the sample to a flat-cell cuvette that is placed in a rectangular TE 102 cav- ity as shown in Fig. 1A. The cell lies in a nodal plane where the RF electric field intensity is zero and the RF magnetic field is maximum. Sample placement is very critical and only a few degrees of misalignment of the cell with respect to the x-axis results in a sharp decrease in the Q-value of the cavity. However, by rotating the cell precisely 90° from the so-called parallel orientation in the electric field node, Fig. 1A, to the perpendicular orientation, Fig. 1B, the Q-value recovers and good EPR signals can be obtained. Aqueous sample flat-cells oriented such that the RF electric field is perpendicular to the surface of the cell, Fig. 1B, were first studied by Hyde [1] and further discussed by Eaton and Eaton [2]. In both of these papers, experiments using more than one cell in perpendicular orientation were reported. More recently, Mett and Hyde [3] carried out a detailed theoretical analysis of the microwave fields when aque- ous sample flat-cells are in the perpendicular orienta- tion. They predicted that by placing multiple parallel flat-cells in a TE 102 cavity with cell thickness (x-dimen- sion), width (y-dimension), and the spacing between cells carefully optimized, a significant (3–6 times) EPR signal improvement can be achieved compared with a single optimized flat-cell in the parallel orientation of Fig. 1A. 1090-7807/$ - see front matter Ó 2004 Elsevier Inc. All rights reserved. doi:10.1016/j.jmr.2004.11.006 * Corresponding author. Fax: +1 414 456 6512. E-mail address: [email protected] (J.S. Hyde). www.elsevier.com/locate/jmr Journal of Magnetic Resonance 172 (2005) 333–341

Welcome message from author
This document is posted to help you gain knowledge. Please leave a comment to let me know what you think about it! Share it to your friends and learn new things together.
Transcript
www.elsevier.com/locate/jmr
Journal of Magnetic Resonance 172 (2005) 333–341
Aqueous flat-cells perpendicular to the electric field for usein electron paramagnetic resonance spectroscopy, II: design
Jason W. Sidabrasa, Richard R. Metta,b, James S. Hydea,*
a Department of Biophysics, Medical College of Wisconsin, 8701 Watertown Plank Road, Milwaukee, WI 53226-0509, USAb Milwaukee School of Engineering, Milwaukee, WI 53202-3109, USA
Received 27 August 2004; revised 1 November 2004Available online 2 December 2004
Abstract
This paper builds on the work of Mett and Hyde [J. Magn. Reson. 165 (2003) 137]. Various aqueous flat-cell geometries in theperpendicular orientation have been studied using Ansoft High Frequency Structure Simulator (version 9.0, Pittsburgh, PA) andComputer Simulation Technology Microwave Studio (version 5.0, Wellesley Hills, MA). The analytic theory of Mett and Hydehas been refined to predict optimum dimensions of multiple sample cell structures including the effect of the sample holder dielectricproperties and the interaction of the cells with each other on EPR signal strength. From these calculations and simulations we pro-pose a practical multiple cell sample structure for use in commercial rectangular TE102 cavities that yields 2.0–2.3 times higher sen-sitivity relative to a single flat-cell in the nodal orientation. We also describe a modified TE102 resonator design with square ratherthan cylindrical sample-access stacks that is predicted to give a factor of 2.2–2.7 enhancement in EPR signal strength of a single flat-cell in the nodal orientation. These signal enhancements are predicted with sample holders fabricated from polytetrafluoroethylene.Additional improvement in EPR signal of up to 75% can be achieved by using sample holder materials with lower dielectricconstants.� 2004 Elsevier Inc. All rights reserved.
Keywords: EPR; Finite-element; Microwave cavities; Dielectric loss; Aqueous samples
1. Introduction
A conventional procedure for observation of aqueousEPR samples at X-band is to introduce the sample to aflat-cell cuvette that is placed in a rectangular TE102 cav-ity as shown in Fig. 1A. The cell lies in a nodal planewhere the RF electric field intensity is zero and the RFmagnetic field is maximum. Sample placement is verycritical and only a few degrees of misalignment of thecell with respect to the x-axis results in a sharp decreasein the Q-value of the cavity. However, by rotating thecell precisely 90� from the so-called parallel orientationin the electric field node, Fig. 1A, to the perpendicular
1090-7807/$ - see front matter � 2004 Elsevier Inc. All rights reserved.
doi:10.1016/j.jmr.2004.11.006
* Corresponding author. Fax: +1 414 456 6512.E-mail address: [email protected] (J.S. Hyde).
orientation, Fig. 1B, the Q-value recovers and goodEPR signals can be obtained. Aqueous sample flat-cellsoriented such that the RF electric field is perpendicularto the surface of the cell, Fig. 1B, were first studied byHyde [1] and further discussed by Eaton and Eaton[2]. In both of these papers, experiments using morethan one cell in perpendicular orientation were reported.More recently, Mett and Hyde [3] carried out a detailedtheoretical analysis of the microwave fields when aque-ous sample flat-cells are in the perpendicular orienta-tion. They predicted that by placing multiple parallelflat-cells in a TE102 cavity with cell thickness (x-dimen-sion), width (y-dimension), and the spacing betweencells carefully optimized, a significant (3–6 times) EPRsignal improvement can be achieved compared with asingle optimized flat-cell in the parallel orientation ofFig. 1A.

Fig. 1. Rectangular TE102 cavity cross-section. (A) Flat-cell instandard electric field nodal plane orientation. (B) Flat-cell inperpendicular orientation. The cavity dimensions are the same as theVarian Multipurpose resonator, 4.36 · 1.02 · 2.29 cm, with a sample-access stack diameter of 1.1 cm.
334 J.W. Sidabras et al. / Journal of Magnetic Resonance 172 (2005) 333–341
The present paper builds on the analytic work ofMett and Hyde [3]. Extensive use is made of finite-ele-ment modeling of electromagnetic fields and analyticequations to calculate the optimum sample clusterdimensions. The analytic theory of Mett and Hyde [3]is extended and refined to make predictions of optimumsample cluster sizes and dimensions in the presence of adielectric sample holder. Several practical multiple cellsample geometries are proposed for the X-band VarianMultipurpose TE102 cavity. Dimensions of this cavityare given in the caption of Fig 1. Extension to the similarBruker cavity is straightforward.
Predicted EPR signals consistent with [3] were ob-tained using an assembly of identical flat-cells that ex-tended from side-wall to side-wall when the relativedielectric constant of the sample holder was close tounity. These EPR signals were found to be 3.9–4.7 timesthat of a single flat-cell in standard orientation for 15–27cells. We found that a sample holder of larger dielectricconstant significantly lowered performance. For a poly-tetrafluoroethylene (PTFE) sample holder, the corre-sponding predicted EPR signal enhancement ratioswere 2.2–2.7. We also found that the geometrical con-straints imposed by the cylindrical 11 mm diametersample-access stacks, see Fig. 1, further loweredperformance by 8–24%, depending on the number ofcells. Results using a 15-cell sample structure yieldedabout a factor of 2 better than the standard flat-cellgeometry. Thus we propose a new TE102 resonator de-sign with a square rather than circular sample-accessstack, which is shown here to give a factor of 2.7enhancement in EPR signal strength using a 27-cell sam-ple assembly relative to the conventional flat-cell geom-etry of Fig 1A. Finally we consider the rectangularuniform field mode, TEU02, [4–6] as well as the cylindri-cal TM110 cavity, both of which are compatible withaqueous sample flat-cell geometry in the perpendicularorientation [1].
Three types of power loss in an aqueous sample flat-cell were identified by Mett and Hyde, Types I, II, andIII. Type I loss is the only type that is active in the par-allel flat-cell geometry of Fig. 1A. There are no Ez com-ponents and negligible Ey components of the electricfield, only Ex. All lines of RF electric field in the cavityare parallel to the flat-cell surface. The boundary condi-tion at the cell surface is that the electric field tangentialto the surface Etan be continuous across the surface.Power loss is determined by integration of E2 withinthe sample volume. This geometry was analyzed by anumber of workers in the early literature (see particu-larly Stoodley�s paper [7]). It was recently reconsideredin the context of Uniform Field rectangular cavities ina paper from this laboratory [8].
All three types of power loss occur in the perpendic-ular orientation, Fig. 1B, and are defined below. Finite-element simulations that illustrate the electric fieldsgiving rise to these sources of loss are shown in Fig. 2.The sample boundary is outlined in black in this figure,and the relative dielectric constant of the sample holderis unity. Dimensions of the sample cell are 0.4 · 8 ·22.9 mm, which are the same as commercial cells for usein the geometry of Fig. 1A. Fig. 2A shows the electricfield magnitude in an x–y plane with the nodal electricfield null portrayed as a dark blue band. The flat-cell isperpendicular to the nodal plane. Fig. 2B shows onlythe component of electric field perpendicular to thesurface, Ex, in an expanded view, while Figs. 2C and Dshow the electric field tangential to the surface, Ey.
A major and perhaps surprising finding of Mett andHyde [3] was that Type I loss exists when the flat-cell isin the perpendicular orientation, which requires that Ey
be non-zero. This component of the RF electric field isstrictly zero in the empty cavity. The existence of non-zero Ey is understood as follows: polarization chargesterminate the lines of RF electric field in the x-directionbecause of the discontinuity in Ex occurring at the sam-ple surface, noting the high dielectric constant of water.Because Ex changes approximately linearly along thesample in the y-direction, the density of polarizationcharges also changes approximately linearly in they-direction along the surface of the sample. This givesrise to a component of E along y, and thus to Type Iloss. For this effect to occur, it is necessary thatoEx/oy > 0—that the sample lie in a gradient of theRF electric field.
Fig. 2C shows that the polarities of Ey on either sideof the sample are opposite creating a zero at the centerof the sample slab (green color). A major finding of Mettand Hyde [3] is that tangential electric field nulls existwithin each cell in the multiple cell configuration. Fig.2C also shows that Ey peaks half way between the y-edges of the sample with a maximum value occurringat y = 0, which is the nodal plane for Ex and the pointof maximum gradient in Ex.

Fig. 2. Spatial electric field profiles in the x–y plane for the sample of Fig. 1B showing three EPR signal loss types. (A) Magnitude of the electric fieldE showing Type III loss, which is associated with partial electric field cancellation at the end of the sample. (B) Electric field in the x-direction Ex
showing Type II loss which is associated with the perpendicular electric field within the sample. (C) Electric field in the y-direction Ey showing Type Iloss, which is associated with the tangential electric field within the sample. (D) Expanded view of (C).
J.W. Sidabras et al. / Journal of Magnetic Resonance 172 (2005) 333–341 335
Type II loss can be seen in Fig. 2B. Although Ex isdiscontinuous at the sample surface because of the highdielectric constant of water and is greatly reduced insidethe sample, it nevertheless has a finite value and resultsin loss. There is a small variation of Ex across the samplethickness predicted by the analytical equations of Mettand Hyde [3]. It is an effect that depends on the wave-length in water at X-band. When optimum, Type I lossplus the cavity wall power loss is approximately equal tothe Type II loss when the samples are in the perpendic-ular orientation as predicted in Mett and Hyde.
Type III loss refers to the regions of complexity at theedges of the sample where local electric field intensitiesbecome quite high. Polarization charges on oppositecorners of an edge give rise to electric field vectors thattend to oppose the applied electric field in free space.Nevertheless, there is a residual component of Ex atthe edge that penetrates the sample because it is tangen-tial to the edge surface. This penetration increases thetotal electric field in the sample near the edge abouttwo times relative to what would be expected from TypeII loss alone. Type III loss was analyzed extensively byMett and Hyde [3].
2. Methods
The results of this paper are based on finite-elementsimulations of electromagnetic fields. Two commercialprograms were available to us: Ansoft High FrequencyStructure Simulator (HFSS) (version 9.0, Pittsburgh,PA) and Computer Simulation Technology (CST)
Microwave Studio (version 5.0, Wellesley Hills, MA).Both programs permit ‘‘driven mode’’ and ‘‘eigenmode’’solutions ofMaxwell�s equations. The eigenmodemethodwas used exclusively in the work described here.Although these programs are similar, they differ in a num-ber of respects including (i) methods to create the finite-element mesh, (ii) the drawing package describing themicrowave structure, and (iii) graphic display options.
Two computers were used, Compaq W8000 worksta-tion with dual Xeon 1.7 GHz processors with 4 GB ofRAM and HP workstation xw8000 with dual PentiumXeon 3.2 GHz processors with 1 MB of cache and4 GB of RAM. The operating system was Windows2000 for both computers. The newer 3.2 GHz computerwas benchmarked at about two times faster perfor-mance than the older 1.7 GHz model in this application.
All simulations were done at X-band (9.5 GHz) foraqueous samples in a rectangular TE102 cavity madefrom copper. Dimensions are given in the caption ofFig. 1. The relative dielectric constant of water at10 GHz and 25 �C was taken as ers = 55(1 + 0.54i) [9].Some simulations were with no sample holder; othersimulations included the effect of a sample holder madeof PTFE, erh = 2.08(1 + 3.7 · 10�4i) [9].
In all cases, the EPR sample was considered to be sat-urable with the available microwave power. For thisclass of samples in EPR spectroscopy, experimentalcomparisons between resonator geometries are madeby readjusting the incident power such that the peak va-lue of the microwave RF magnetic field in the region ofthe sample is held constant [8,10]. Experimentally, theEPR spectroscopist typically determines P1/2, the value

336 J.W. Sidabras et al. / Journal of Magnetic Resonance 172 (2005) 333–341
of the incident microwave power where the signal inten-sity is half of what it would be if no microwave powersaturation occurred. The power is then reduced by afixed amount in order to avoid significant microwavepower saturation of the sample. It is then assumed thatthe experimental signal intensity is an integration of thecontributions of all spins over the cosine distribution ofH1 along the sample and that none of these spins exhibitsignificant microwave power saturation. It is this exper-imental procedure that is duplicated in the simulationand analysis of fields.
In the eigenmode solution method, HFSS sets themost intense electric field magnitude to 1 V/m, whilethe CST software assumes 1 W of power is feeding thestructure. Neither program directly permits normalizingthe RF magnetic fields, but both programs allow inte-gration of peak magnetic field energy stored in the sam-ple and in the cavity. Using Eqs. (31)–(40) of [3], it isstraightforward to derive Eq. (1), which can be usedwith both HFSS and CTS to compare signal intensitiesfor saturable samples.
Ssat ¼l0pf
l0104Hm
RH 2
s dV sffiffiffiffiffiP l
p : ð1Þ
Here, f is the frequency, l0 is the magnetic permeability,Hm is the magnitude of the maximum magnetic fieldwithin the cavity (A/m), Hs is the magnetic field withinthe sample, and Pl is the power input into the cavity.In this equation the units of the numerator and denom-inator are Joules and Gauss, respectively. The powerinto the cavity can be found from
P l ¼2pfU c
Ql
; ð2Þ
where Uc is the stored energy within the cavity and Ql isthe loaded quality factor of the cavity.
A possible concern in the simulations is the assump-tion of ideal sample cells with sharp interior cornersand uniform wall thickness, planarity, and spacing.We have a high level of confidence in the simulations,and would attribute any difference between actual andpredicted performance to a failure to model the actualstructure. Fully rounding the inner corners of a standardflat-cell was found to decrease the predicted EPR signalby only 0.2%.
Fig. 3. EPR signal strength normalized to unity at the cavity center asa function of cell position, b, for a single cell in perpendicularorientation. The solid line is for a cell of standard dimensions, and thedashed line is for a cell of half the standard width. The numerical noisein the data comes from the finite-element simulations.
3. Results
3.1. Single-cell to n-cell analysis
A major finding of Mett and Hyde [3] is that eachindividual sample cell has a tangential electric field nodewithin it. Sample cell placement within the cavity wasfound to have a major influence on the position of this
node. Because of the linear variation of the tangentialelectric field within the sample, Type I loss is four timessmaller if the node is perfectly centered within the sam-ple than if the node is on the sample surface. This factorof four reduction in dielectric loss results in a significantenhancement in the EPR signal strength, Eq. (1).
The EPR signal strength normalized to unity at thecavity center (x = 0) is shown in Fig. 3 as a functionof the x-sample position b for a single sample in perpen-dicular orientation. The solid line is for sample width of8 mm. The signal is constant until the sample gets quiteclose to the cavity wall. As the sample approaches thewall, the tangential electric field null shifts off-center,increasing the loss and decreasing the EPR signalstrength. When the sample is on the wall, the signalstrength is lower by nearly 30%. This is because the TypeI losses have quadrupled since the null is not centered inthe sample, while the Type II loss and cavity wall losshave remained constant. At optimum signal, Type I lossis comparable to the cavity wall losses plus Type II loss[3]. The dashed line of Fig. 3 is for a sample width of4 mm. In this case, the tangential electric field peak is re-duced, which allows the sample cell to approach the wallmore closely before the tangential electric field null ismoved off-center. Although decreasing the sample widthYs is beneficial in reducing the effect of nearby bound-aries, it also can produce a non-optimum cell dimensionthat lowers the EPR signal.
Mett and Hyde [3] found that to reduce power lossesone could divide the sample cell into multiple cells. Max-imum reduction of the tangential electric field for anoptimum sample thickness and number of cells isachieved when the tangential electric field null is cen-tered within each sample. The location of this null de-pends on the positioning of the cells within the cavity.Using Ansoft HFSS, it was found that uniform cell-to-cell spacing and half-spacing from an edge-cell to thecavity wall produces perfect centering of the tangential
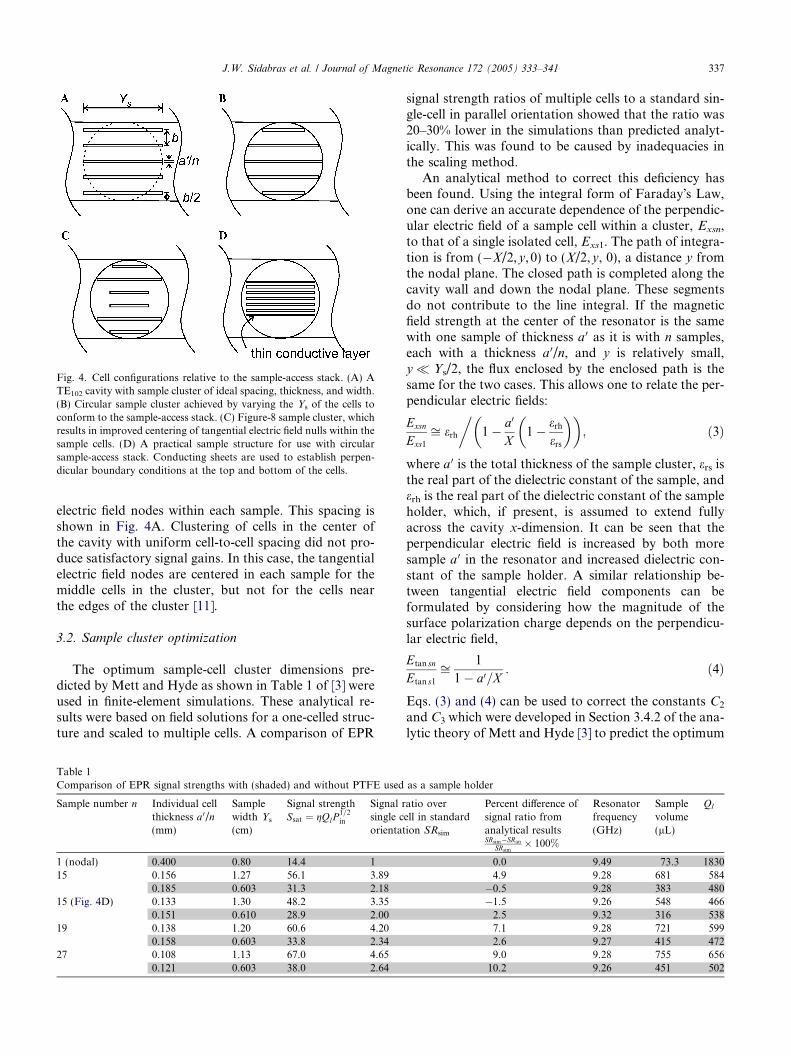
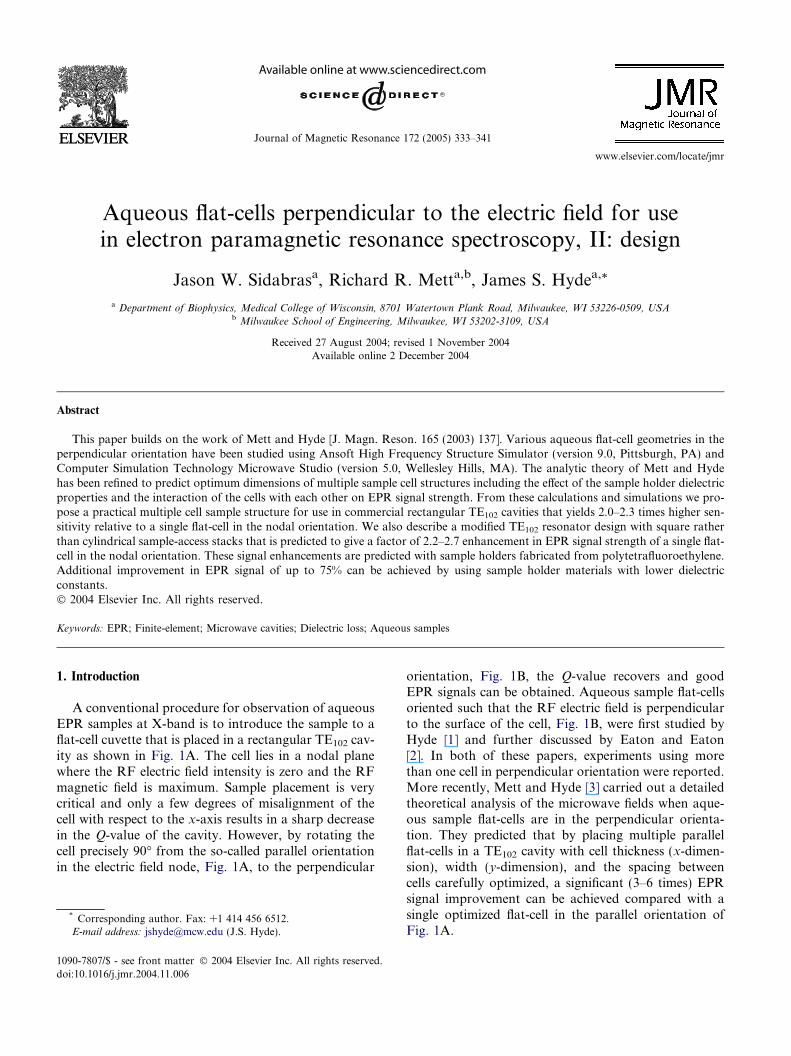
Fig. 4. Cell configurations relative to the sample-access stack. (A) ATE102 cavity with sample cluster of ideal spacing, thickness, and width.(B) Circular sample cluster achieved by varying the Ys of the cells toconform to the sample-access stack. (C) Figure-8 sample cluster, whichresults in improved centering of tangential electric field nulls within thesample cells. (D) A practical sample structure for use with circularsample-access stack. Conducting sheets are used to establish perpen-dicular boundary conditions at the top and bottom of the cells.
J.W. Sidabras et al. / Journal of Magnetic Resonance 172 (2005) 333–341 337
electric field nodes within each sample. This spacing isshown in Fig. 4A. Clustering of cells in the center ofthe cavity with uniform cell-to-cell spacing did not pro-duce satisfactory signal gains. In this case, the tangentialelectric field nodes are centered in each sample for themiddle cells in the cluster, but not for the cells nearthe edges of the cluster [11].
3.2. Sample cluster optimization
The optimum sample-cell cluster dimensions pre-dicted by Mett and Hyde as shown in Table 1 of [3] wereused in finite-element simulations. These analytical re-sults were based on field solutions for a one-celled struc-ture and scaled to multiple cells. A comparison of EPR
Table 1Comparison of EPR signal strengths with (shaded) and without PTFE used
Sample number n Individual cellthickness a0/n(mm)
Samplewidth Ys
(cm)
Signal strengthSsat ¼ gQlP
1=2in
Signal rsingle corientat
1 (nodal) 0.400 0.80 14.4 115 0.156 1.27 56.1 3.89
0.185 0.603 31.3 2.1815 (Fig. 4D) 0.133 1.30 48.2 3.35
0.151 0.610 28.9 2.0019 0.138 1.20 60.6 4.20
0.158 0.603 33.8 2.3427 0.108 1.13 67.0 4.65
0.121 0.603 38.0 2.64
signal strength ratios of multiple cells to a standard sin-gle-cell in parallel orientation showed that the ratio was20–30% lower in the simulations than predicted analyt-ically. This was found to be caused by inadequacies inthe scaling method.
An analytical method to correct this deficiency hasbeen found. Using the integral form of Faraday�s Law,one can derive an accurate dependence of the perpendic-ular electric field of a sample cell within a cluster, Exsn,to that of a single isolated cell, Exs1. The path of integra-tion is from (�X/2,y, 0) to (X/2,y, 0), a distance y fromthe nodal plane. The closed path is completed along thecavity wall and down the nodal plane. These segmentsdo not contribute to the line integral. If the magneticfield strength at the center of the resonator is the samewith one sample of thickness a 0 as it is with n samples,each with a thickness a 0/n, and y is relatively small,y � Ys/2, the flux enclosed by the enclosed path is thesame for the two cases. This allows one to relate the per-pendicular electric fields:
Exsn
Exs1ffi erh
�1� a0
X1� erh
ers
� �� �; ð3Þ
where a 0 is the total thickness of the sample cluster, ers isthe real part of the dielectric constant of the sample, anderh is the real part of the dielectric constant of the sampleholder, which, if present, is assumed to extend fullyacross the cavity x-dimension. It can be seen that theperpendicular electric field is increased by both moresample a 0 in the resonator and increased dielectric con-stant of the sample holder. A similar relationship be-tween tangential electric field components can beformulated by considering how the magnitude of thesurface polarization charge depends on the perpendicu-lar electric field,
Etan sn
Etan s1ffi 1
1� a0=X: ð4Þ
Eqs. (3) and (4) can be used to correct the constants C2
and C3 which were developed in Section 3.4.2 of the ana-lytic theory of Mett and Hyde [3] to predict the optimum
as a sample holder
atio overell in standardion SRsim
Percent difference ofsignal ratio fromanalytical resultsSRsim�SRan
SRsim� 100%
Resonatorfrequency(GHz)
Samplevolume(lL)
Ql
0.0 9.49 73.3 18304.9 9.28 681 584
�0.5 9.28 383 480�1.5 9.26 548 4662.5 9.32 316 5387.1 9.28 721 5992.6 9.27 415 4729.0 9.28 755 65610.2 9.26 451 502

338 J.W. Sidabras et al. / Journal of Magnetic Resonance 172 (2005) 333–341
sample cluster dimensions for maximum EPR signalstrength. The replacements read
C2 ! C2 erh 1� a0
X1� erh
ers
� ��� �� �2; ð5Þ
C3 ! C3
1
1� a0=X
� �2
: ð6Þ
To fully account for the dielectric of the sampleholder, an additional scaling must be made to accountfor the shortening of the wavelength in the y-directionwithin the sample holder dielectric relative to that of freespace [12]. This wavelength shortening is predicted bythe dispersion relation within the sample holderdielectric,
4p2f 2
erhc2¼ k2x þ k2y þ k2z ; ð7Þ
where c represents the speed of light in vacuum and k isthe wavenumber. The increased variation of electric fieldwith y is carried into the sample. By reducing the samplewidth Ys predicted by the analytic theory as
Y s ! Y s=ffiffiffiffiffiffierh
p; ð8Þ
an optimum sample size was found.The analytic theory of Mett and Hyde was modified
according to Eqs. (5), (6), and (8), and more accurateoptimum sample cluster dimensions were predicted.For low sample holder dielectric constant, the new pre-dicted optima have larger sample widths and smallerthicknesses than the original analytic theory due to theincreased electric field within the sample. For higher val-ues of dielectric constant, the optimum sample widthsdecrease and the thicknesses increase.
Ansoft HFSS was used to calculate the EPR signalstrength for the predicted optimum sample clusterdimensions from the new analytic model for 15-, 19-,and 27-cell clusters. Results for a sample holder with adielectric constant of free space are shown as the non-shaded entries in Table 1. Significant EPR signalenhancement factors of 3.9–4.7 are shown. In thesecases, signal strength was observed to continue to in-crease slowly with sample width with a correspondingdecrease in Ql, consistent with the observations of Mettand Hyde [3]. The optima were chosen to correspond toa practical microwave bridge-limited Ql value of approx-imately 500. The optima were confirmed by simulatingsample clusters with 5% variations in total sample thick-ness and width. The EPR signal was observed to de-crease in all cases.
The effects of the number of cells on the electric fieldsare plotted in Fig. 5. Holding Ys constant, all cell thick-nesses have been optimized for maximum EPR signalstrength for the given number of cells. One cell (A),three cells (B), and nine cells (C) are shown. The firstcolumn (i) shows the x-dependence of the tangential
electric field Ey in the center of the cavity on the nodalplane of the perpendicular electric field Ex. In each case(A), (B), and (C), the tangential electric field nodes arecentered within each cell, minimizing the Type I loss.The second column (ii) shows the x-dependence of theperpendicular electric field at a y-position away fromthe nodal plane of Ex. The y-position is 2/3 of the dis-tance from the center to the edge of the sample such thatthere is significant perpendicular electric field, but littlecontribution from Type III losses. Column (ii) shows aprogressive increase in the perpendicular electric fieldwith the number of samples. The third column (iii)shows the y-dependence of the perpendicular electricfield along the sample width. The linear variation inthe center region is Type II loss and the near-doublingof the field magnitude in the vicinity of the sample edgeis Type III loss. In row (D) of Fig. 5, a three-celled struc-ture is shown where the cells are spaced too closely to-gether. In column (i) the vertical lines represent thecenter of the sample, where the tangential electric fieldstrength has the same magnitude as the tangential elec-tric field strength for a one sample case. But the tangen-tial electric field nulls are not centered in the samplecells. In column (ii), the perpendicular electric fieldsare larger when the cell spacing is smaller, increasingthe losses within the sample. These effects decrease theQ and EPR signal strength.
3.3. Cluster design to fit the circular sample-access stack
As a first step in the design of a practicalmulti-cell sam-ple structure, the assumption was made that the dielectricconstant of the sample holder is unity and that it should fitthe existing Varian Multipurpose TE102 resonator de-picted inFig. 1.Dimensionsmust permit insertion thoughthe sample-access stack of 11 mm diameter. A naive ap-proach is to place cells of varying widths along the entrystack as shown in Fig. 4B. This configuration does notproduce tangential electric field nulls that are centeredin all cells, increasing the dielectric losses and degradingthe EPR signal. This effect can be corrected somewhatby reducing the amount of sample in the center of the cav-ity, resulting in the figure-8 sample configuration shownin Fig. 4C. In this configuration, Type II losses are re-duced, and some improvement in the null centering is ob-served. A gain of about 1.5 in signal strength over thecircular structure of Fig. 4B is obtained using the figure-8.
A better approach is to place a thin layer of conduct-ing material along each x-boundary of the sample clus-ter as shown in Fig. 4D. Since the x-dimension of theTE102 cavity is a free parameter, conducting plates canbe added to the sides of the sample cluster without sig-nificantly distorting the rectangular TE102 mode fields.The electric field is perpendicular at these conductingboundaries. Cells are spaced uniformly apart betweenthe conducting plates. The new optimum sample thick-

Fig. 5. Perpendicular and tangential electric fields (V/m) normalized to the magnetic field Hm (A/m) in the cavity center. Rows (A), (B), and (C)correspond to increase in number of sample cells for ideal spacing, n = (A) 1, (B) 3, (C) 9 sample cells, and row (D) for 3 cells with non-ideal spacing.Columns (i) and (ii) show the tangential and perpendicular electric fields, respectively, across the sample thickness, while Column (iii) shows thevariation of the perpendicular electric field across the sample width.
J.W. Sidabras et al. / Journal of Magnetic Resonance 172 (2005) 333–341 339
ness and width for 15 cells are found with the analytictheory of Section 3 using a cavity with x-dimensionequal to the distance between the conducting plates,X = 0.735 cm. The finite-element simulation with thefull-size cavity and the sample insert yields EPR signalsapproximately equal to those predicted by the analytictheory as shown in Table 1. The 15-cell cluster has anEPR signal 3.4 times that of the standard flat-cell.
Adding the conducting plates to the sample cell clus-ter increases the electric field across the sample regioncompared to that outside the cluster. The magnetic fieldwithin the sample is correspondingly increased through$ · E. This enhancement of the magnetic field increasesthe filling factor and the overall EPR signal over whatwould be expected if the magnetic field were the same in-side and outside the cluster. As the distance betweenconducting plates Xc approaches the cavity wall dimen-sion X, this effect becomes less pronounced. It was foundthat limiting Xc to no more than 3
4X produces a satisfac-
tory EPR signal enhancement. Conducting plates are
helpful when the sample cluster is not oriented exactly90� with respect to the nodal plane.
3.4. Use of PTFE as a sample holder material
Up to this point, we have considered a sample holderthat has the dielectric constant of free space. We nowmodel the sample holder using the dielectric constantof PTFE. A dielectric sample holder produces an in-crease in the perpendicular electric field strength insidethe sample by a factor of erh as shown by Eq. (3),whereas the tangential electric field strength is not chan-ged by the dielectric properties of the sample holder, Eq.(4). There is also a reduction in the sample width, Eq.(8). The shaded entries in Table 1 show Ansoft HFSSsimulations using 15-, 19-, and 27-celled structures witha sample holder made of PTFE. The dielectric fills all re-gions between sample cells in the x-dimension and ex-tends 0.3 mm beyond the sample width boundary onboth sides of the sample giving the sample holder dimen-

340 J.W. Sidabras et al. / Journal of Magnetic Resonance 172 (2005) 333–341
sions of (X,Ys + 0.6 mm,L). There is uniform cell-to-cellspacing and half-spacing from an edge-cell to the con-ducting wall. Sample thicknesses and scaled widths pre-dicted to be optimum by the analytic theory are shown,Table 1. Significant signal enhancement ratios of 2.0–2.7are indicated.
Finite-element simulations verified that when PTFEis introduced, the perpendicular electric field within thesample increases. In Fig. 6, the perpendicular electricfield in a nine-celled structure with and without PTFEsample holder is shown. There is an increase in Ex withinthe sample by approximately erh (A) and (B). Calcula-tions of the integral of E2 over the sample volumeshowed that reducing Ys by
ffiffiffiffiffiffierh
preduces the dielectric
losses to values comparable to those with a sampleholder of free space.
With the adjustments of Ys, the conductive boundaryof Fig. 4D with a PTFE sample holder is practical. Afactor of 2.0 improvement in EPR signal strength overthe standard flat-cell in the nodal position was found.Similar adjustments for the figure-8 configuration ofFig. 4C yielded little recovery in EPR signal after theaddition of PTFE due to the lack of centering of the tan-gential electric field nodes.
Further EPR signal improvement over the multi-celled sample structure of Fig. 4D is possible with thedesign of a new TE102 cavity containing a square sam-ple-access stack. Such a structure is shown in Fig. 4Aand results in a factor of 2.2–2.7 or greater increase in
Fig. 6. Comparison of electric field with a sample holder dielectricconstant of free space (solid) and PTFE (dashed) for a given magneticfield Hm in the cavity center. (A) Perpendicular electric field for a nine-celled structure. (B) Perpendicular electric field variation across thesample width.
signal strength depending on the practicality of extrusiontechniques, the number of cells and the Q factor. Intro-ducing a square sample-access stack will allow idealplacement of cells perpendicular to the cavity walls. Thisalso will allow easier alignment of the sample stack. An-other benefit of a new resonator design is the opportunityto increase the x-dimension of the resonator. IncreasingX permits more sample cells to be placed in perpendicu-lar orientation, increasing the EPR signal strength.
It is important for the spectroscopist to know the ef-fect of the perpendicular orientation on the uniformityof the RF magnetic field. Calculations using AnsoftHFSS show a maximum of the magnetic field in the cen-ter of the sample cluster near the electric field nodalplane and a decrease in magnetic field strength with dis-tance along y. For optimum sample cluster dimensions,the magnetic field strength decreases by about 35–45%from the center to the edge of the sample. The largerpercentage occurs with a PTFE sample holder.
4. Other resonator types
Other resonator types, such as the uniform field reso-nator [4–6] developed in this laboratory, have been con-sidered. The uniform field resonator is desirable for EPRspectroscopy because the RF magnetic field is uniformalong two free dimensions X and L (the cavity centralsection z-dimension) and saturates the sample evenly.The multiple sample analysis done here and in Mettand Hyde [3] carries over to the uniform field resonatorwithout modification. Around a 10% reduction in EPRsignal strength is seen with the U02 mode resonatorcaused by the more rapid variation in fields in the y
direction. This signal reduction is compensated by theuniformity in magnetic field in z and can be more thanregained by increasing L.
Another mode that was considered is the cylindricalTM110 cavity. This mode is analogous to the rectangularTE102 in that the electric fields lie along x and have twoopposing regions of concentration separated by a nodalplane. The magnetic field patterns are also similar. Theanalysis of the paper carries over to this mode withoutmuch modification, allowing a change in optimum Ys
because of the geometrical differences between a TE102
and a TM110 cavity.
5. Conclusions
The multiple flat-cell clusters in perpendicular orien-tation proposed by Mett and Hyde [3] have been simu-lated and analyzed with the use of finite-elementcodes. Modifications of the analytic theory of Mettand Hyde [3] that include the effects of the sample holderdielectric and the interaction of the cells with each other

J.W. Sidabras et al. / Journal of Magnetic Resonance 172 (2005) 333–341 341
resulted in improved predictions of optimum flat-cellcluster dimensions. The analysis resulted in sample clus-ters that produce gains of 2.0–2.7 times the EPR signalstrength over the standard flat-cell in parallel orienta-tion [13]. Further increases in signal are possible byusing larger numbers of sample cells, but fabricationof the sample holder becomes difficult. Additional in-creases in signal of up to 75% are also possible by usinga sample holder dielectric material with lower dielectricconstant.
The perpendicular electric field in the sample cells isincreased by the interaction of the cells with each otherand by the dielectric properties of the sample holder,Eq. (3). The tangential electric field strength is only influ-enced by the number and thickness of cells, Eq. (4). Thesample holder also shortens the wavelength across thesample width by
ffiffiffiffiffiffierh
p, Eq. (8). All of these physical effects
strongly influence the optimum sample dimensions.Using the commercial rectangular TE102 cavity with a
circular 11 mm sample-access stack, and limiting thenumber of sample cells to 15, a factor of 2 in EPR signalstrength over the standard flat-cell can be achieved. Thissample cluster is sandwiched between two metallicplates, which produce a symmetric field pattern betweenthem. A rectangular TE102 cavity with a square sample-access stack would yield a further improvement of EPRsignal of 2.2–2.7 over the standard flat-cell. This samplecluster does not require the metallic shields.
Acknowledgments
This work was supported by Grants EB001417 andEB001980 from the National Institute of BiomedicalImaging and Bioengineering of the National Institutesof Health.
References
[1] J.S. Hyde, A new principle for aqueous sample cells for EPR, Rev.Sci. Instrum. 43 (1972) 629–631.
[2] S.S. Eaton, G.R. Eaton, Electron paramagnetic resonance samplecell for lossy samples, Anal. Chem. 49 (1977) 1277–1278.
[3] R.R. Mett, J.S. Hyde, Aqueous flat cells perpendicular to theelectric field for use in electron paramagnetic resonance spectros-copy, J. Magn. Reson. 165 (2003) 137–152.
[4] R.R. Mett, W. Froncisz, J.S. Hyde, Axially uniform resonantcavity modes for potential us in electron paramagnetic resonancespectroscopy, Rev. Sci. Instrum. 72 (2001) 4188–4200.
[5] J. Anderson, R.R. Mett, J.S. Hyde, Cavities with axially uniformfield for use in electron paramagnetic resonance. II. Free spacegeneralization, Rev. Sci. Instrum. 73 (2002) 3027–3037.
[6] J. Hyde, R. Mett, J. Anderson, Cavities with axially uniform fieldfor use in electron paramagnetic resonance. III. Re-entrantgeometries, Rev. Sci. Instrum. 73 (2002) 4003–4009.
[7] L.G. Stoodley, The sensitivity of microwave electron spin reso-nance spectrometers for use with aqueous solutions, J. Electron.Control 14 (1963) 531.
[8] J.S. Hyde, R.R. Mett, Aqueous sample considerations in uniformfield resonators for electron paramagnetic resonance spectros-copy, Curr. Top. Biophys. 26 (2002) 7–14.
[9] A. Von Hippel, Dielectric Materials and Applications, ArtechHouse, Boston, 1954.
[10] J.S. Hyde, W. Froncisz, Loop-gap resonators, in: A.J. Hoff (Ed.),Advanced EPR: Applications in Biology and Biochemistry,Elsevier, Amsterdam, 1989, pp. 277–306.
[11] A coding error in Mett and Hyde [3] led to the conclusion thata closely-packed cell cluster would produce optimum tangentialelectric field node centering in the cells. This error is manifest inFig. 3E of [3] and was caused by a sign error in programming.All equations and all other graphs in [3] are believed to beaccurate.
[12] Here, we hold the resonator dimensions fixed and assume that thedielectric of the sample holder does not have a significant effect onthe resonant frequency. As indicated in Table 1, the largestfrequency shift caused by the Teflon sample holder is less than 1%.
[13] In the rectangular TE102 cavity, a standard flat-cell in nodalorientation has 4.1 times the signal of a standard capillary of1.1 mm diameter, neglecting the effects of the sample holderdielectrics.
Related Documents