WORKING PAPER | January 2013 | 1 Working Paper CONTENTS Executive Summary........................................................ 1 Total water withdrawal .................................................... 2 Consumptive and non-consumptive use ........................ 5 Total blue water (Bt) ....................................................... 6 Available blue water (Ba) ............................................... .7 Baseline water stress...................................................... 9 Inter-annual variability ................................................. 10 Seasonal variability ...................................................... 11 Flood occurrence ......................................................... 12 Drought severity ........................................................... 13 Upstream storage ......................................................... 14 Return flow ratio ........................................................... 15 Dissolved oxygen (DO) ................................................ 16 Electrical conductivity (EC) .......................................... 17 Total dissolved solids (TDS) ........................................ 18 Media coverage ............................................................ 19 Threatened amphibians ................................................ 20 AQUEDUCT METADATA DOCUMENT COLORADO RIVER BASIN STUDY FRANCIS GASSERT, TIEN SHIAO, AND MATT LUCK Disclaimer: Working Papers contain preliminary research, analysis, findings, and recommendations. They are circulated to stimulate timely discussion and critical feedback and to influence ongoing debate on emerging issues. Most working papers are eventually published in another form and their content may be revised. Suggested Citation: Gassert, F., T. Shiao, and M. Luck. 2013. “Colorado River Basin Study.” Working Paper. Washington, DC: World Resources Institute. Available online at http://www. wri.org/publication/aqueduct-metadata-colorado-river-basin EXECUTIVE SUMMARY Prior to the creation of the global Aqueduct Water Risk Atlas, water risk indicators (Table 1) were developed and tested in a number of river basins worldwide. The results of these basin studies helped inform and shape the global Aqueduct Water Risk Framework. Complete guidelines and processes for indicator selection, data collection, calcula- tions, and mapping techniques are described in the Aque- duct Water Risk Framework available online. 1 This study focuses on the specific characteristics of the indicator data and calculation in the Colorado River Basin (CRB). The data selection and validation process for the Colorado River Basin Study involved three steps: (1) a literature review, (2) identification of data sources in the public domain, and (3) the compilation and expert review of selected data sources. Calculation of 5 of the 12 indicators requires the creation of original datasets to estimate water availability and use at a sub-basin scale. The hydrological catchments used in the exercise are merged HUC-8 sub-basins from the National Watershed Boundary Dataset 2 by the U.S. Department of Agriculture, Natural Resources Conservation Service (USDA–NRCS) and the Inter-annual variability Upstream storage Media coverage Flood occurrence Water quality (3 indicators) Threatened amphibians Baseline water stress Drought severity Seasonal variability Return flow ratio Table 1 | Aqueduct Indicators

Welcome message from author
This document is posted to help you gain knowledge. Please leave a comment to let me know what you think about it! Share it to your friends and learn new things together.
Transcript

WORKING PAPER | January 2013 | 1
Working Paper
CONTENTSExecutive Summary........................................................ 1
Total water withdrawal .................................................... 2
Consumptive and non-consumptive use ........................ 5
Total blue water (Bt) ....................................................... 6
Available blue water (Ba) ............................................... .7
Baseline water stress ...................................................... 9
Inter-annual variability ................................................. 10
Seasonal variability ...................................................... 11
Flood occurrence ......................................................... 12
Drought severity ........................................................... 13
Upstream storage ......................................................... 14
Return flow ratio ........................................................... 15
Dissolved oxygen (DO) ................................................ 16
Electrical conductivity (EC) .......................................... 17
Total dissolved solids (TDS) ........................................ 18
Media coverage ............................................................ 19
Threatened amphibians ................................................ 20
AqUEDUCT METADATA DOCUMENT
COlORADO RIvER BASIN STUDyFrancis Gassert, tien shiao, and Matt Luck
Disclaimer: Working Papers contain preliminary research, analysis, findings, and recommendations. They are circulated to stimulate timely discussion and critical feedback and to influence ongoing debate on emerging issues. Most working papers are eventually published in another form and their content may be revised.
Suggested Citation: Gassert, F., T. Shiao, and M. Luck.2013. “Colorado River Basin Study.” Working Paper. Washington, DC: World Resources Institute. Available online at http://www.wri.org/publication/aqueduct-metadata-colorado-river-basin
ExEcutivE Summary Prior to the creation of the global Aqueduct Water Risk Atlas, water risk indicators (Table 1) were developed and tested in a number of river basins worldwide. The results of these basin studies helped inform and shape the global Aqueduct Water Risk Framework. Complete guidelines and processes for indicator selection, data collection, calcula-tions, and mapping techniques are described in the Aque-duct Water Risk Framework available online.1 This study focuses on the specific characteristics of the indicator data and calculation in the Colorado River Basin (CRB).
The data selection and validation process for the Colorado River Basin Study involved three steps: (1) a literature review, (2) identification of data sources in the public domain, and (3) the compilation and expert review of selected data sources. Calculation of 5 of the 12 indicators requires the creation of original datasets to estimate water availability and use at a sub-basin scale. The hydrological catchments used in the exercise are merged HUC-8 sub-basins from the National Watershed Boundary Dataset2 by the U.S. Department of Agriculture, Natural Resources Conservation Service (USDA–NRCS) and the
Inter-annual variability
Upstream storage Media coverage
Flood occurrenceWater quality (3 indicators)
Threatened amphibians
Baseline water stress
Drought severity
Seasonal variability Return flow ratio
Table 1 | aqueduct indicators
2 |
Binational Watersheds Database by the U.S. Geological Survey (USGS) Border Environmental Health Initiative (BEHI).3 Computation of the original datasets was completed by ISciences, L.L.C.
Two measures of water use were used in this study: total withdrawal, the total amount of water abstracted from freshwater sources for human use, and consumptive use, the portion of withdrawn water that evaporates or is incorporated into a product thus is no longer available for further use. Withdrawals for the Colorado River’s Upper Basin are estimated from recorded Bureau of Reclamation (BOR) consumptive use for the year 2005 by multiplying by ratios of USGS estimates of withdrawals by sector divided by consumptive use by sector, most recently generated for the year 1995. For the Lower Basin, USGS county-level withdrawals for 2005 were spatially disaggre-gated by sector based on regressions with spatial datasets selected to maximize the correlation with the reported withdrawals and re-aggregated to hydrological catchments using sector specific spatial correlates (irrigated areas for agricultural, nighttime lights for industrial, and population for domestic withdrawals). BOR data was recorded at the hydrological catchment scale and did not require spatial disaggregation. Both total withdrawal and consumptive use were coded at the hydrological catchment scale.
Two metrics of water supply were computed: total blue water and available blue water. Total blue water approxi-mates natural river discharge and does not account for withdrawals or consumptive use. Available blue water is an estimate of surface water availability minus upstream consumptive use. Modeled estimates of water supply were calculated using a catchment-to-catchment flow accumulation approach developed by ISciences, L.L.C., which aggregates water by catchment and transports it to the next downstream catchment. Water supply is com-puted from runoff (R), the water available to flow across the landscape from a particular location, and is calculated as the remainder of precipitation (P) after evapotrans-piration (ET) and change in soil moisture storage (∆S) are accounted for (i.e., R = P – ET – ∆S). The runoff data is courtesy of Livneh et al.4 Rainfall and the calibrated parameters are used to generate runoff values for 1950 to 2010.
The remainder of this document contains definitions, formulas, and data sources for the Colorado River Basin Study.
TOTAL WITHDRAWALDescription: Total withdrawal is the total amount of water removed from freshwater sources for human use.
Calculation: Withdrawals for the Upper Basin were estimated from the Bureau of Reclamation (BOR) con-sumptive use for a target year 2005 by multiplying by ratios of USGS estimates of withdrawals by sector divided by consumptive use by sector, most recently generated for the year 1995. For the Lower Basin, the USGS county-level withdrawals for 2005 were spatial disaggregated by sector based on regressions with spatial datasets selected to maximize the correlation with the reported withdrawals and re-aggregated to hydrological catchments using sector specific spatial correlates (irrigated areas for agricultural, nighttime lights for industrial, and population for domestic withdrawals).
Data Sources
VARIAbLe bASIn DeLIneATIOnS
Authors
United States Department of Agriculture-Natural Resources Conservation Service (USDA-NRCS), U.S. Geological Survey (USGS), and Environmental Protection Agency (EPA)
Title National Watershed Boundary Dataset (WBD)
Date Accessed February 3, 2012
URLhttp://www.nrcs.usda.gov/wps/portal/nrcs/detail/national/ngmc/?cid=nrcs143_021630
Resolution Sub-basin (HUC8)
VARIAbLe bASIn DeLIneATIOnS
Author U.S. Geological Survey (USGS) Border Environmental Health Initiative (BEHI)
Title Binational Watersheds Database
Year of publication 2006
URLhttp://borderhealth.cr.usgs.gov/datalayers.html
Resolution Sub-basin

Colorado River Basin Study
WORKING PAPER | January 2013 | 3
Data Sources
variabLE cOnSumptivE uSE in uppEr baSin
Author U.S. Department of the Interior Bureau of Reclamation
Title Provisional Upper Colorado River Basin Consumptive Uses and losses Report 2006-2010
year of publication 2012
Time covered in analysis
2005
URlhttp://www.usbr.gov/uc/library/envdocs/reports/crs/pdfs/cul2006-2010prov.pdf
Resolution Sub-basin (HUC8)
variabLEWatEr WitHDraWaLS by SEctOr (uSED fOr LOWEr baSin)
Author U.S. Geological Survey (USGS)
Title Estimated Use of Water in the United States in 2005
year of publication 2009
URl http://pubs.usgs.gov/circ/1344/
Resolution County
variabLEcOnSumptivE uSE anD WatEr WitHDraWaLS by SEctOr (ratiOS uSED fOr EntirE baSin)
Author U.S. Geological Survey (USGS)
Title Estimated Use of Water in the United States in 1995
year of publication 1998
Time covered in analysis 1995
Resolution County
variabLE GriDDED pOpuLatiOn
Authors
Center for International Earth Science Information Network (CIESIN), Columbia University; United Nations Food and Agricultural Organization (FAO); and Centro Internacional de Agricultura Tropical (CIAT)
Title Gridded Population of the World version 3 (GPWv3): Population Count Grid, Future Estimates
year of publication 2005
Time covered in analysis
2005
URl http://sedac.ciesin.columbia.edu/gpw
Resolution 2.5 arc minute raster
variabLE niGHttimE LiGHtS
Author NOAA National Geophysical Data Center (NGDC)
Title version 4 DMSP-OlS Nighttime lights Time Series
year of publication 2010
Time covered in analysis
2000
URlhttp://www.ngdc.noaa.gov/dmsp/down-loadv4composites.html
Resolution 30 arc second raster

4 |
Data Sources total Withdrawal
tOtaL WitHDraWaL, cOntinuED
variabLE GLObaL irriGatiOn arEaS
Authors S. Siebert, P. Döll, S. Feick, J. Hoogeveen, and K. Frenken
Title Global Map of Irrigation Areas version 4.0.1
year of publication 2007
Time covered in analysis
2000
URlhttp://www.fao.org/nr/water/aquastat/ir-rigationmap/index60.stm
Resolution 5 arc minute raster
variabLE pOWEr pLantS
Author Union of Concerned Scientists (UCS)
Title UCS 2011 EW3 Energy-Water Database v.1.2
year of publication 2008
Resolution Facility (point)
variabLE cattLE DEnSity
Author Food and Agriculture Organization of the United Nations (FAO)
Title Predicted Global Cattle Density (2005), Corrected for Unsuitability, Adjusted to Match Observed Totals
year of publication 2008
URlhttp://www.fao.org/AG/againfo/resources/en/glw/GlW_dens.html
Resolution 0.05 degree raster

Colorado River Basin Study
WORKING PAPER | January 2013 | 5
cOnSumptivE anD nOn-cOnSumptivE uSE Description: Consumptive use is the portion of all water withdrawn that is consumed through evaporation or incorporation into a product, thus is no longer avail-able for reuse. Non-consumptive use is the remainder of withdrawals that are not consumed and returns to ground or surface water bodies.
Calculation: Consumptive and non-consumptive use for the Lower Basin is calculated by multiplying USGS (2009) withdrawals by sector with USGS (1998) estimates of consumptive use by sector in 1995 divided by USGS (1998) withdrawals by sector. Consumptive use for the Upper Basin was provided by the Bureau of Reclamation.
Data Sources
consumptive Water use
variabLE WitHDraWaLS
Comments See Total Withdrawal
variabLEcOnSumptivE uSE anD WatEr WitHDraWaLS by SEctOr
Comments See Total Withdrawal
variabLEcOnSumptivE uSE in tHE uppEr baSin
Comments See Total Withdrawal

6 |
tOtaL bLuE WatEr (bt)Description: Total blue water (Bt) for each catchment is the accumulated runoff upstream of the catchment plus the runoff in the catchment.
Calculation: Bt(i) = Rup(i) + R(i) where Rup(i) = ∑ Bt(iup), iup is the set of catchments immediately upstream of catchment i that flow into catchment i, and Rup(i) is the summed runoff in all upstream catchments. For first-order catchments (those without upstream catchments, e.g., headwater catchments), Rup(i) is zero, and total blue water is simply the volume of runoff in the catchment.
Data Sources
total blue Water
variabLE baSin DELinEatiOnS
Comments See Total Withdrawal
variabLE runOff
Authors B. livneh, E.A. Rosenberg, C. lin, v. Mishra, K.M. Andreadis, E.P. Maurer, and D.P. lettenmaier
Title
“Extension and Spatial Refinement of a long-Term Hydrologically Based Dataset of land Surface Fluxes and States for the Conterminous United States,” Journal of Climate
year of publication in review
Time covered in analysis
1950 – 2010
Resolution 1/8 degree raster

Colorado River Basin Study
WORKING PAPER | January 2013 | 7
avaiLabLE bLuE WatEr (ba)Description: Available blue water (Ba) is the total amount of water available to a catchment before any uses are satisfied. It is calculated as all water flowing into the catchment from upstream catchments minus upstream consumptive use plus the runoff in the catchment.
Calculation: Ba(i) = R(i) + Eim(i) + ∑ Qout(iup) where Qout is defined as the volume of water exiting a catchment to its downstream neighbor: Qout(i) = max(0, Ba(i) – Uc(i) – L(i) – Ex(i)), Uc(i) are the consumptive uses, L(i) are the in-stream losses due to reservoirs and other infrastruc-ture, and Ex(i) are the exports of water from catchment i. Negative values of Qout are set to zero. In first-order catch-ments, ∑Qout(j) is zero, so available blue water is runoff plus imports.
Data Sources
variabLE runOff
Comments See Total Blue Water
variabLE cOnSumptivE uSE
Comments See Consumptive and Non-consumptive Use
variabLE tranSbaSin DivErSiOnS
Author U.S. Department of the Interior Bureau of Reclamation
Title Colorado River Accounting and Water Use Report: Arizona, California, and Nevada
year of publication 2012
Time covered in analysis
2005
URlhttp://www.usbr.gov/lc/region/g4000/wtracct.html
Resolution Diversion (point)
Comments See Total Withdrawal
variabLE uppEr baSin EvapOrativE LOSSES
Author U.S. Department of the Interior Bureau of Reclamation
Title Provisional Upper Colorado River Basin Consumptive Uses and losses Report 2006–2010
year of publication 2012
Time covered in analysis
2005
URlhttp://www.usbr.gov/uc/library/envdocs/reports/crs/pdfs/cul2006-2010prov.pdf
Resolution Sub-basin (HUC8)
variabLE LOWEr baSin EvapOrativE LOSSES
Author U.S. Department of the Interior Bureau of Reclamation
Title Colorado River Accounting and Water Use Report: Arizona, California, and Nevada
year of publication 2012
Time covered in analysis
2005
URlhttp://www.usbr.gov/lc/region/g4000/wtracct.html
Resolution Reservoir (point)
Data Sources

8 |
available blue WaterData Sources
variabLE rivEr fLOW GauGES
Author U.S. Geological Survey (USGS)
Title National Water Information System
Date Accessed June 25, 2012
Time covered in analysis
2005
URl http://waterdata.usgs.gov/nwis
Resolution Monitoring site (point)
CommentsThe following USGS gauges were used for calibration: 09380000, 09402500, 09421500, 09427520.
variabLE rivEr fLOW GauGES
Author International Boundary and Water Commis-sion (IBWC)
Title Colorado River Historical Mean Daily Discharge Data
Date Accessed June 25, 2012
Time covered in analysis
2005
URlhttp://www.ibwc.state.gov/Water_Data/histflo2.htm
Resolution Monitoring site (point)
CommentsThe following IBWC gauge was used for calibration: 09-5220.00.
Resolution Sub-basin
avaiLabLE bLuE WatEr, cOntinuED
Colorado River Basin Study
WORKING PAPER | January 2013 | 9
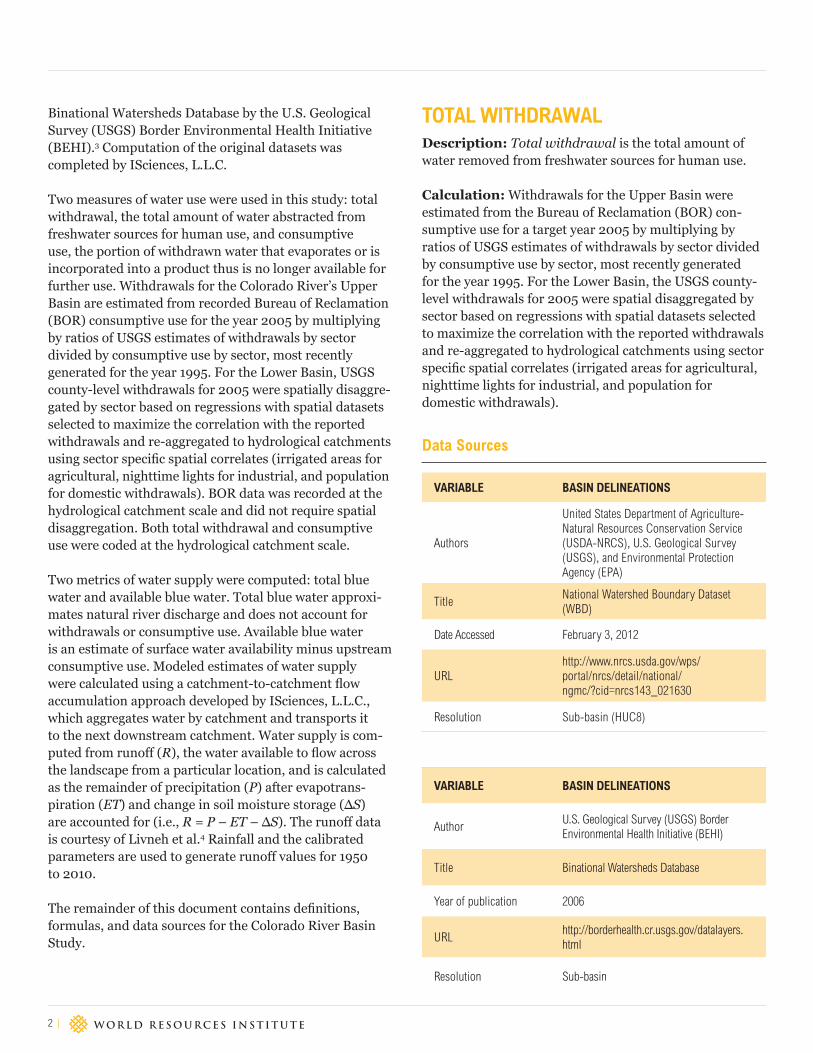
baSELinE WatEr StrESSDescription: Baseline water stress measures total annual water withdrawals (municipal, industrial, and agricultural) expressed as a percentage of the total annual available blue water. Higher values indicate more competition among users.
Calculation: Annual water withdrawals divided by the mean of available blue water (1950–2010). Water exports are counted as withdrawals for the purposes of calculating this indicator. Areas with available blue water and water withdrawal equal to zero are coded as missing data.
Data Sources
variabLE WitHDraWaLS
Comments See Total Withdrawal
variabLE avaiLabLE bLuE WatEr
Comments See Available Blue Water
baseline Water Stress

10 |
intEr-annuaL variabiLityDescription: Inter-annual variability measures the variation in water supply between years.
Calculation: Standard deviation of annual total blue water divided by the mean of annual total blue water (1950–2010). The coefficient of variation is widely used to measure variability in water supply (e.g., rainfall, runoff, and stream flow) due to seasonal and/or inter-annual fluctuations.
variabLE tOtaL bLuE WatEr
Comments See Total Blue Water
Data Sources
inter-annual variability

Colorado River Basin Study
WORKING PAPER | January 2013 | 11
SEaSOnaL variabiLityDescription: Seasonal variability measures variation in water supply between months of the year.
Calculation: Standard deviation of monthly total blue water divided by the mean of monthly total blue water (1950–2010). The mean of total blue water for each of the 12 months of the year is first calculated, then the variance is estimated between the mean monthly values.
variabLE tOtaL bLuE WatEr
Comments See Total Blue Water
Data Sources
Seasonal variability

12 |
fLOOD OccurrEncEDescription: Flood occurrence is the number of floods recorded from 1985 to 2011.
Calculation: Number of flood occurrences (1985-2011). Flood counts were calculated by intersecting hydrological units with estimated flood extent polygons. Only floods whose extent polygons’ centroids lay within the Colorado River Basin were counted.
variabLE fLOOD EvEntS
Author G.R. Brakenridge, Dartmouth Flood Observatory, University of Colorado
Title Global Active Archive of large Flood Events
Time covered in analysis 1985 – October 2011
URlhttp://floodobservatory.colorado.edu/Archives/index.html
Date Accessed October 15, 2011
Resolution Flood extent polygons (multiple scales)
Comments
The Global Active Archive of Major Flood Events aggregates flood events from news, governmental, instrumental, and remote sensing sources and estimates the extent of flooding based on reports of affected regions.
Data Sources
flood Occurrence

Colorado River Basin Study
WORKING PAPER | January 2013 | 13
DrOuGHt SEvErityDescription: Drought severity measures the average length of droughts times the dryness of the droughts from 1901 to 2008.
Calculation: Drought severity is the mean of the lengths times the dryness of all droughts occurring in an area. Drought is defined as a contiguous period when soil moisture remains below the 20th percentile. Length is measured in months and dryness is the average number of percentage points by which soil moisture drops below the 20th percentile. Drought data was resampled from its original raster form into hydrological catchments.
variabLE DrOuGHt SEvErity
Authors J. Sheffield and E.F. Wood
Title Projected Changes in Drought Occurrence un-der Future Global Warming from Multi-Model, Multi-Scenario, IPCC AR4 Simulations
year of publication 2007
Time covered in analysis 1901–2008
URlhttp://ruby.fgcu.edu/courses/twimberley/EnviroPhilo/Drought.pdf
Resolution 1 degree raster
Comments
Sheffield and Wood’s drought dataset com-bines a suite of global observation-based datasets with the National Centers for Environmental Prediction–National Center for Atmospheric Research (NCEP-NCAR) reanalysis, and creates a global drought event occurrence dataset with a spatial resolution of 1 degree.
Data Sources
Drought Severity

14 |
upStrEam StOraGEDescription: Upstream storage measures the water storage capacity available upstream of a location relative to the total water supply at that location. Higher values indicate areas more capable of buffering variations in water supply (i.e. inter-annual and seasonal variation) because they have more water storage upstream.
Calculation: Upstream storage capacity (2010) divided by the mean total blue water (1950–2010). Areas with storage capacity equal to zero were coded as missing data.
Data Sources
variabLE tOtaL bLuE WatEr
Comments See Total Blue Water
variabLE majOr DamS anD rESErvOirS
AuthorsB. lehner, C. R-liermann, C. Revenga, C. vörösmarty, B. Fekete, P. Crouzet, P. Döll, et al.
Title Global Reservoir and Dam (GRanD) Data-base version 1.1
year of publication 2011
Time covered in analysis 2010
URlhttp://atlas.gwsp.org/index.php?option=com_content
Resolution Dams (point)
Comments
GRanD database includes reservoirs with a storage capacity of more than 0.1 cubic km although many smaller reservoirs were included. The GRanD database was cross referenced with the U.S. Bureau of Reclamation website and extended with two additional reservoirs.
Flow accumulated reservoir storage for each hydrological basin is calculated as the sum of reservoir capacity within that basin and all upstream basins.
upstream Storage

Colorado River Basin Study
WORKING PAPER | January 2013 | 15
rEturn fLOW ratiODescription: Return flow ratio measures the percent of available water previously used and discharged upstream as wastewater. Higher values indicate higher dependency on treatment plants and potentially worse water quality in areas that lack sufficient treatment infrastructure and policies.
Calculation: Upstream non-consumptive use (2005) divided by the mean of available blue water (1950–2010). Areas with available blue water and water withdrawal equal to zero were coded as missing data.
Data Sources
variabLE nOn-cOnSumptivE uSE
Comments See Consumptive and Non-consumptive Use
variabLE avaiLabLE bLuE WatEr
Comments See Available Blue Water
return flow ratio

16 |
WatEr quaLity— DiSSOLvED OxyGEn (DO)Description: Dissolved oxygen (DO) measures the avail-ability of oxygen in water. In general, lower values reflect poorer water quality.
Calculation: DO is reported using empirical sample data and averaged over the year. Catchments were assigned values equal to the average of all water quality sample data within the polygon. Catchments that did not include sample data for which a given parameter was measured were coded as missing data.
variabLE DiSSOLvED OxyGEn (DO)
Author U.S. Geological Survey (USGS)
Title National Water Information System
Time covered in analysis 2011
URl http://waterdata.usgs.gov/nwis
Date Accessed February 3, 2012
Resolution Monitoring site (point)
CommentsWater quality parameters are averaged over the year and only sites with at least six observations over the year are counted.
Data Sources
Water quality – Dissolved Oxygen

Colorado River Basin Study
WORKING PAPER | January 2013 | 17
WatEr quaLity— ELEctricaL cOnDuctivity (Ec)Description: Electrical conductivity (EC) measures how easily electricity passes through water and is a common proxy for salinity. In general, higher values reflect higher salinity, thus poorer water quality.
Calculation: EC is reported using empirical sample data and averaged over a year. Catchments were assigned values equal to the average of all water-quality sample data within the polygon. Catchments that did not include sample data for which a given parameter was measured were coded as missing data.
variabLE ELEctricaL cOnDuctivity (Ec)
Author U.S. Geological Survey (USGS)
Title National Water Information System
Time covered in analysis
2011
URl http://waterdata.usgs.gov/nwis
Date Accessed February 3, 2012
Resolution Sites (point)
CommentsWater quality parameters are averaged over the year and only sites with at least six observations over the year are counted.
Data Sources
Water quality – Electrical conductivity

18 |
WatEr quaLity— tOtaL DiSSOLvED SOLiDS (tDS)Description: Total dissolved solids (TDS) measures the portion of solids in water that can pass through a filter of a specific pore size and is a common proxy for salinity. In general, higher values reflect poorer water quality.
Calculation: The TDS is reported from modeled results courtesy of Anning et al. Catchments were assigned the flow-weighted concentration of TDS for all stream segments within the basin.
variabLE tOtaL DiSSOLvED SOLiDS (tDS)
Authors
D.W. Anning, N.J. Bauch, S.J. Gerner, M.E. Flynn, S.N. Hamlin, S.J. Moore, D.H. Schaefer, S.K. Anderholm, and l.E. Spangler
Title Dissolved Solids in Basin-Fill Aquifers and Streams in the Southwestern United States version 1.1
Time covered in analysis 2006
URl http://pubs.usgs.gov/sir/2006/5315
Date Accessed April 24, 2012
Resolution Stream segment
Data Sources
Water quality – total Dissolved Solids

Colorado River Basin Study
WORKING PAPER | January 2013 | 19
mEDia cOvEraGEDescription: Media coverage measures the percent-age of media articles in an area on water-related issues. Higher values indicate areas with higher public awareness of water issues, and consequently higher reputational risks to those not sustainably managing water.
Calculation: Percentage of all media articles on water scarcity and/or pollution in an administrative unit. Google Archives was used to search a string of keywords includ-ing river name, “water shortage” or “water pollution,” and administrative unit (e.g. “Colorado River + water shortage + Arizona.”) The time frame was limited to the past 10 years from January 1, 2002 to December 31, 2011. For each state, the total number of articles for both water shortage and water pollution was summed and divided by the total number of articles on any topic returned when searching only for the administrative unit.
variabLE mEDia cOvEraGE
Author Google
Title Google News
Time covered in analysis
2002–2011
URlhttp://news.google.com/news/advanced_news_search?as_drrb=a
Date accessed February 14, 2012
Resolution State
Data Sources
media coverage

20 |
THREATENED AMPHIBIANSDescription: Threatened amphibians measures the percentage of freshwater amphibian species classified by IUCN as threatened. Higher values indicate more fragile freshwater ecosystems and thus areas more likely to be subject to water withdrawal and discharge regulations.
Calculation: The percentage of amphibian species clas-sified by IUCN as threatened in a particular area. For each catchment, the total number of threatened freshwater amphibian species was counted and divided by the total number of species whose ranges overlap the catchment. Catchments with fewer than two amphibian species were excluded.
VARIABlE THREATENED AMPHIBIANS
Author International Union for Conservation of Nature (IUCN)
Title The IUCN Red List of Threatened Species
Year of publication October 2010
URLhttp://www.iucnredlist.org/technical-docu-ments/spatial-data#amphibians
Resolution Ranges (multiple scales)
Comments
Amphibian species status database is joined to the known species range spatial data. Several name corrections were made in joining the data.
Data Sources
Threatened Amphibians

Colorado River Basin Study
WORKING PAPER | January 2013 | 21
ACKNOWlEDGMENTS This publication was made possible thanks to the ongoing support of the World Resources Institute Markets and Enterprise Program and the Aqueduct Alliance. The authors would like to thank the following people for provid-ing invaluable insight and assistance: Eric Rosenberg, John Rogers, vince Tidewell, Barbara Moreland, Caitlin Callaghan, Paul Reig, Charles Iceland, Robert Kimball, Kirsty Jenkinson, Betsy Otto, David Tomberlin, Thomas Parris, Pragyajan Rai, Tianyi luo, and Katalyn voss as well as Nick Price and Hyacinth Billings for graphic support and final editing.
WITH SUPPORT FROMthe aqueduct alliance:
Goldman Sachs
General Electric
Skoll Global Threats Fund
Bloomberg
Talisman Energy Inc.
Dow Chemical Company
Royal Dutch Shell
Dutch Government
United Technologies Corporation
DuPont
John Deere
Procter & Gamble Company
ENDNOTES 1. Reig, P., T. Shiao, and F. Gassert. 2013. “Aqueduct Water Risk Framework.”
Working Paper. Washington, DC: World Resources Institute. Available online at http://www.wri.org/publication/aqueduct-water-risk-framework.
2. U.S. Department of Agriculture–Natural Resources Conservation Service (USDA–NRCS), U.S. Geological Survey (USGS), and Environmental Protec-tion Agency (EPA). National Watershed Boundary Dataset (WBD), accessed March 2, 2012.
3. U.S. Geological Survey (USGS)–Border Environmental Health Initiative (BEHI). Binational Watersheds Database, 2006.
4. B. livneh, E.A. Rosenberg, C. lin, v. Mishra, K.M. Andreadis, E.P. Maurer, and D.P. lettenmaier. “Extension and Spatial Refinement of a long-Term Hydrologically Based Dataset of land Surface Fluxes and States for the Conterminous United States,” Journal of Climate, in review.
ABOUT WRI WRI focuses on the intersection of the environment and socio-economic development. We go beyond research to put ideas into action, working globally with governments, business, and civil society to build transformative solutions that protect the earth and improve people’s lives. Solutions to urgent Sustainability challenges WRI’s transformative ideas protect the earth, promote development, and advance social equity because sustainability is essential to meeting human needs today, and fulfilling human aspirations tomorrow. practical Strategies for change WRI spurs progress by providing practical strategies for change and effective tools to implement them. We measure our success in the form of new policies, products, and practices that shift the ways governments work, businesses operate, and people act. Global action We operate globally because today’s problems know no boundaries. We are avid communicators because people everywhere are inspired by ideas, empowered by knowledge, and moved to change by greater understanding. We provide innovative paths to a sustainable planet through work that is accurate, fair, and independent.
ABOUT THE AUTHORSfrancis Gassert is a research assistant with the Markets and Enterprise Program at WRI, where he manages the data collection and GIS analysis of the Aqueduct project. Contact: [email protected].
tien Shiao is a senior associate with the Markets and Enterprise Program at WRI, where she oversees the design and development of the Aqueduct project and manages the application and road testing for companies and investors. Contact: [email protected]
matt Luck is a research scientist at ISciences, l.l.C., where he develops and applies hydrological algorithms and models.

Copyright 2013 World Resources Institute. This work is licensed under the Creative Commons Attribution 3.0 license. To view a copy of the license, visit http://creativecommons.org/licenses/by/3.0/
10 G Street, NE | Washington, DC 20002 | www.Wri.org
Related Documents