AQUATIC MICROBIAL ECOLOGY Aquat Microb Ecol Vol. 75: 103–116, 2015 doi: 10.3354/ame01750 Published online June 4 INTRODUCTION In marine ecosystems, assimilation of dissolved organic matter (DOM) sustains bacterial metabolism, especially in oligotrophic regions. Sulfur (S) is an essential nutrient found in 2 of the 20 common amino acids as well as in other organic molecules (Sievert et al. 2007). S is also present in copious amounts in the ocean in the oxidized form as sulfate (28 mM); how- ever, many organisms prefer to obtain S from DOM in an already reduced form in order to diminish metabolic energetic expenditure (Kiene et al. 1999, 2000). The ability to reduce sulfate and assimilate it into cellular material was previously considered to be © Inter-Research 2015 · www.int-res.com *Corresponding author: [email protected] Methionine and dimethylsulfoniopropionate as sources of sulfur to the microbial community of the North Pacific Subtropical Gyre Daniela A. del Valle 1, *, Sandra Martínez-García 1,5 , Sergio A. Sañudo-Wilhelmy 2 , Ronald P. Kiene 3,4 , David M. Karl 1 1 Department of Oceanography, Daniel K. Inouye Center for Microbial Oceanography: Research and Education (C-MORE), University of Hawaii, Honolulu, Hawaii 96822, USA 2 Department of Biological Sciences, Marine Environmental Biology; and Department of Earth Science, University of Southern California, Los Angeles, California 90089, USA 3 Department of Marine Sciences, University of South Alabama, Mobile, Alabama 36688, USA 4 Dauphin Island Sea Lab, Dauphin Island, Alabama 36528, USA 5 Present address: Centre for Ecology and Evolution in Microbial model Systems (EEMiS), Linnaeus University, 39182 Kalmar, Sweden ABSTRACT: Methionine (Met) and dimethylsulfoniopropionate (DMSP) are 2 important sub- strates that can serve as sources of sulfur and carbon to microbial communities in the sea. We studied the vertical and diel distributions and the assimilation rates of dissolved Met (dMet) and dissolved DMSP (dDMSP) into proteins of different microbial groups at Stn ALOHA, in the oligo- trophic North Pacific Subtropical Gyre (NPSG). Concentrations of dMet never exceeded 50 pM and were at their daily minimum during the night-time (< 0.17 pM). dMet assimilation into pro- teins accounted for < 30% of the dMet lost from the dissolved pool, suggesting that other metabolic pathways were also important. Concentrations of dDMSP ranged from 0.35 to 1.0 nM in surface waters and did not present a distinguishable diel pattern. Cell-sorted Prochlorococcus, high nucleic acid (HNA), and low nucleic acid (LNA) non-pigmented bacteria showed a clear diel pat- tern for dMet and dDMSP assimilation, with higher rates during the night-time. Among the differ- ent groups, HNA bacteria had the highest per-cell assimilation rate for dMet and dDMSP, but when accounting for cell numbers in each group, the HNA and LNA bacterial group assimilation rates were comparable for both dDMSP and dMet. Integrated water column (0 to 125 m) dDMSP assimilation rates by the entire microbial assemblage were 1.7- to 5.3-fold faster than those for dMet, suggesting that dDMSP constitutes a more important source of sulfur than dMet to the microbial community of the NPSG during the time of our study. KEY WORDS: S cycle · Methionine · DMSP · Amino acids · DOM · Station ALOHA · Oligotrophic Resale or republication not permitted without written consent of the publisher FREE REE ACCESS CCESS

Welcome message from author
This document is posted to help you gain knowledge. Please leave a comment to let me know what you think about it! Share it to your friends and learn new things together.
Transcript

AQUATIC MICROBIAL ECOLOGYAquat Microb Ecol
Vol. 75: 103–116, 2015doi: 10.3354/ame01750
Published online June 4
INTRODUCTION
In marine ecosystems, assimilation of dissolvedorganic matter (DOM) sustains bacterial metabolism,especially in oligotrophic regions. Sulfur (S) is anessential nutrient found in 2 of the 20 common aminoacids as well as in other organic molecules (Sievert et
al. 2007). S is also present in copious amounts in theocean in the oxidized form as sulfate (28 mM); how-ever, many organisms prefer to obtain S from DOMin an already reduced form in order to diminishmetabolic energetic expenditure (Kiene et al. 1999,2000). The ability to reduce sulfate and assimilate itinto cellular material was previously considered to be
© Inter-Research 2015 · www.int-res.com*Corresponding author: [email protected]
Methionine and dimethylsulfoniopropionate assources of sulfur to the microbial community of the
North Pacific Subtropical Gyre
Daniela A. del Valle1,*, Sandra Martínez-García1,5, Sergio A. Sañudo-Wilhelmy2, Ronald P. Kiene3,4, David M. Karl1
1Department of Oceanography, Daniel K. Inouye Center for Microbial Oceanography: Research and Education (C-MORE), University of Hawaii, Honolulu, Hawaii 96822, USA
2Department of Biological Sciences, Marine Environmental Biology; and Department of Earth Science, University of Southern California, Los Angeles, California 90089, USA
3Department of Marine Sciences, University of South Alabama, Mobile, Alabama 36688, USA4Dauphin Island Sea Lab, Dauphin Island, Alabama 36528, USA
5Present address: Centre for Ecology and Evolution in Microbial model Systems (EEMiS), Linnaeus University, 39182 Kalmar, Sweden
ABSTRACT: Methionine (Met) and dimethylsulfoniopropionate (DMSP) are 2 important sub-strates that can serve as sources of sulfur and carbon to microbial communities in the sea. We studied the vertical and diel distributions and the assimilation rates of dissolved Met (dMet) anddissolved DMSP (dDMSP) into proteins of different microbial groups at Stn ALOHA, in the oligo-trophic North Pacific Subtropical Gyre (NPSG). Concentrations of dMet never exceeded 50 pMand were at their daily minimum during the night-time (<0.17 pM). dMet assimilation into pro-teins accounted for <30% of the dMet lost from the dissolved pool, suggesting that other metabolicpathways were also important. Concentrations of dDMSP ranged from 0.35 to 1.0 nM in surfacewaters and did not present a distinguishable diel pattern. Cell-sorted Prochlorococcus, highnucleic acid (HNA), and low nucleic acid (LNA) non-pigmented bacteria showed a clear diel pat-tern for dMet and dDMSP assimilation, with higher rates during the night-time. Among the differ-ent groups, HNA bacteria had the highest per-cell assimilation rate for dMet and dDMSP, butwhen accounting for cell numbers in each group, the HNA and LNA bacterial group assimilationrates were comparable for both dDMSP and dMet. Integrated water column (0 to 125 m) dDMSPassimilation rates by the entire microbial assemblage were 1.7- to 5.3-fold faster than those fordMet, suggesting that dDMSP constitutes a more important source of sulfur than dMet to themicrobial community of the NPSG during the time of our study.
KEY WORDS: S cycle · Methionine · DMSP · Amino acids · DOM · Station ALOHA · Oligotrophic
Resale or republication not permitted without written consent of the publisher
FREEREE ACCESSCCESS
Aquat Microb Ecol 75: 103–116, 2015
universal, but 2 strains of SAR11, the dominant het-erotrophic bacteria in oligotrophic regions, werereported to be unable to reduce sulfate and thusrequire an external source of reduced S to grow(Tripp et al. 2008). This potential auxotrophy forreduced S has now also been reported for 2 othergroups: SAR86 (Dupont et al. 2012) and marinegroup II Euryarchaeota (Iverson et al. 2012).
The ability to assimilate organic nitrogen (N) in theform of dissolved amino acids provides a significantadvantage to certain bacterial groups (e.g. Coffin1989, Keil & Kirchman 1991, Kujawinski 2011). Pro-teins, and therefore amino acids, are also an impor-tant component of the particulate matter pool (e.g.Degens 1970, Riley 1971). Methionine (Met) is anespecially important amino acid because it isinvolved in several cellular biochemical cycles (e.g.transfer of methyl groups through the intermediateS-adenosylmethionine) and might also have anantioxidant function (Luo & Levine 2009). Informa-tion on the abundance and dynamics of dissolvedMet (dMet) in oceanic waters is scarce because of themethodological difficulties involved in detecting it atlow concentrations, therefore limiting our knowledgeabout cycling of this amino acid in seawater. Usinga specific and sensitive analytical approach for thedetermination of dMet, Sañudo-Wilhelmy et al.(2012) found that dMet can reach surface concentra-tions of up to 500 pM but may also be depleted(<0.17 pM) in vast areas off the coast of California.
Dimethylsulfoniopropionate (DMSP) is producedby a variety of phytoplankton taxa (Keller et al. 1989).Within the cell, DMSP can act as an osmoprotectantand a cryoprotectant (Stefels et al. 1996, Welsh 2000),as a scavenger of reactive oxygen species under cel-lular stress conditions (Sunda et al. 2002), and as aproduct of overflow photosynthesis during N limita-tion (Stefels 2000). Outside the cell, DMSP can alsoact as a chemoattractant for bacteria, phytoplankton,and microzooplankton (Miller et al. 2004, Seymour etal. 2010). Besides these functions, DMSP constitutesan important source of both carbon (C) and S to themicrobial community (Kiene & Linn 2000). In the sur-face waters of the North Pacific Subtropical Gyre(NPSG), DMSP can satisfy up to 10% and 67% of theestimated bacterial C and S demand, respectively,due to its high turnover rates (del Valle et al. 2012).Moreover, the utilization of the DMSP-S appears tobe a widespread trait among active marine bacteria(Malmstrom et al. 2004b, Vila et al. 2004).
Met and DMSP are highly interrelated compounds.Algal DMSP producers utilize Met in the synthesis ofDMSP (Gage et al. 1997), and DMSP production can
be controlled by Met availability (Gröne & Kirst1992). In turn, the DMSP produced primarily byphytoplankton can be utilized by heterotrophic bac-teria to synthesize Met (Kiene et al. 1999). Moreover,both substrates can be transported from the dissolvedphase into the cell interior of phytoplankton and bac-teria to be utilized as a source of reduced C andmethyl groups (Kiene & Linn 2000, Reisch et al.2011). In this study, we present the distribution andassimilation of dMet at Stn ALOHA in the oligo -trophic NPSG and compare this source of S to dis-solved DMSP (dDMSP), both for the entire microbialassemblage and by differentiating the activity ofProchlorococcus (PRO), low nucleic acid (LNA), andhigh nucleic acid (HNA) non-pigmented bacteriausing flow cytometric cell sorting.
MATERIALS AND METHODS
Study site and sampling
Seawater samples were collected at Stn ALOHA(22° 45’ N, 158° 00’ W), the sampling site for theHawaii Ocean Time-series (HOT; Karl & Lukas 1996),aboard the R/V ‘Kilo Moana’ from 22 August to 11September 2012. All seawater samples were collectedusing 12 l polyvinylchloride (PVC) sample bottles at-tached to a conductivity, temperature, and depth(CTD) rosette. Depth profiles (0 to 125 m) for dMetand dDMSP concentrations and assimilation experi-ments were collected at 16:00 h, local time. A diel cy-cle experiment was conducted on 31 August and 1September 2012, in which samples for dMet anddDMSP concentrations and assimilation experimentswere collected at 25 m every 4 h for a period of 44 h.
dMet and dDMSP concentrations
Single samples for dMet concentration analysiswere filtered directly from the PVC sampling bottleusing a sterile 0.8 µm/0.2 µm AcroPak capsule filter.The filtrate (1 l) was collected in a methanol/hydrochloric acid/Milli-Q water-washed polyethyl-ene bottle, immediately frozen at −20°C, and storeduntil analyzed using the method of Sañudo-Wilhelmyet al. (2012). Briefly, samples were adsorbed onto aC18 resin, extracted at 2 different pH levels, and thenquantified using liquid chromatography/tandemmass spectrometry. Triplicate samples for dDMSPconcentrations were analyzed following the proce-dures of del Valle et al. (2012). Samples were GF/F
104
del Valle et al.: Methionine and DMSP as S sources 105
filtered, and the filtrate (3.5 ml) was preserved fol-lowing the procedures detailed by Kiene & Slezak(2006). The filtrate was then treated with sodiumhydroxide to cleave DMSP into dimethylsufide,which was cryotrapped and then injected into a Shi-madzu GC-14A gas chromatograph equipped with aS-selective flame photometric detector for quantifica-tion (Kiene & Service 1991).
dMet and dDMSP assimilation rates
For determination of dMet assimilation rate con-stants, 13 ml of seawater were pipetted into a series of14 ml serum vials. Radiolabeled L-35S-Met (specificactivity: 30 to 32 TBq mmol−1, American RadiolabeledChemicals) was added in a series of 1, 3, 5, and 10 pMin triplicate, and samples were incubated for 30 min.Dead controls consisted of samples killed withtrichloroacetic acid (TCA, 5% final concentration)prior to the addition of 10 pM 35S-Met. Preliminarytests showed that dMet assimilation behaved linearlyfor a period of at least 3 h (data not shown). At the endof the incubation, the calculated total radioactivityadded to each sample was confirmed by counting a1 ml subsample of the spiked seawater sample in Ultima Gold scintillation cocktail. The measured totalradioactivity added to the sample was always within4% of the calculated value. The remainder of thesample was killed with cold TCA (5% final concen-tration in sample), which ensures precipitation of pro-teins. Samples and dead controls were then filteredthrough a 0.2 µm Nylon filter using gentle vacuum(<5 mm Hg), and the incubation vial was rinsed 1time with 80% ethanol (to remove lipid-associated la-beled material) and 3 times with Milli-Q water. Thefilter was then placed in scintillation cocktail andcounted to obtain the assimilated activity. Turnover ofdMet due to assimilation was calculated from the y-intercept of the linear regression of turnover time foreach dMet addition against the added dMet concen-tration (Wright & Hobbie 1966). The turnover corre-sponding to each dMet addition was calculated by di-viding the incubation time by the fraction of totalactivity assimilated. This calculation assumes no as-similation at T0 of the incubation, which was corrobo-rated by the lack of a significant assimilation (com-pared to blanks) in the dead controls.
Radiolabeled 35S-DMSP (specific activity: 8.1 to9.6 TBq mmol−1) was synthesized from 35S-Met(Howard et al. 2011). Based on previous work, theaddition of radiolabeled DMSP was considered to bea tracer addition (del Valle et al. 2012); therefore,
only 1 amendment of 35S-DMSP (7 pM) was per-formed, in triplicate. This assumption was later con-firmed when the in situ dDMSP concentrations dur-ing the time of the study were measured (0.5 to 1 nMin situ dDMSP, see ‘Results; Diel variability ofdDMSP concentration and assimilation’). Sampleswere incubated in parallel to dMet assimilation sam-ples. Because, in this system, the assimilation ofdDMSP behaves linearly for ~8 h (del Valle et al.2012), only 2 time points at 1.5 and 3 h were taken tocalculate the assimilation rate constant. The treat-ment of the samples was the same as for dMet rate-constant determination. The rate constant was calcu-lated as the slope of the regression line between thefraction of the added label present in the protein frac-tion and time, assuming first-order kinetics and con-sidering no significant assimilation at T0 of the incu-bation.
Samples for dMet and dDMSP assimilation ratesfrom water column profiles were incubated in thedark at in situ temperature. During the diel cycleexperiment, samples were incubated in a flow-through, blue acrylic, on-deck incubator at 50% surface irradiance levels.
Cell- and group-specific dMet and dDMSP assimilation rates
Samples for flow cytometric sorting were amendedwith 140 to 190 pM 35S-Met or 145 to 230 pM 35S-DMSP and incubated in 10 ml serum vials for 2 h fordMet and 2.8 h for dDMSP at in situ temperatureunder the same light/dark conditions as parallel sam-ples for rate-constant determinations. After incuba-tion, the samples were fixed with 0.24% vol/vol para-formaldehyde (final concentration), frozen in liquidN2, and preserved at −80°C until analyzed. Theabundances of PRO and heterotrophic bacteria weredetermined using a Cytopeia Influx Mariner flowcytometer following the procedures detailed byMartínez-García et al. (2013). For this work, cellswere sorted at a rate of 100 to 200 particles s−1, andan average of 2 × 10⁶ cells were sorted for eachgroup. PRO was identified in unstained samples inplots of forward scatter (FSC) versus red fluorescence(692 nm) and then sub-gated in plots of FSC versusorange fluorescence (580 nm). For heterotrophic bac-teria, cells were stained prior to analysis with 2.5 mMSybrGreen I DNA fluorochrome and then classifiedbased on plots of side scatter versus green fluores-cence (530 nm) as HNA or LNA bacteria. These 2subgroups could be resolved in all samples.
Aquat Microb Ecol 75: 103–116, 2015
Sorted cells were then filtered through a 0.2 µmNylon membrane filter (Osmonics) and rinsed with0.2 µm filtered seawater, and then the activity on thefilters was counted. The activity resulting from thesorting of the HNA group was corrected for the pres-ence of PRO. Dead controls were processed on 3occasions following the same procedures as a livesample, but the signal obtained was not significantlyhigher than the blanks (0.17 to 0.18 Bq) for any of thesorted groups for either 35S-dMet or 35S-dDMSP.Assimilation in dead controls was considered equalto the assimilation at the beginning of the incubation(T0). The added concentration of labeled substratewas expected to significantly affect the in situ con-centration of both dDMSP (30 to 60%) and dMet(>350%); however, this addition was necessary toobtain enough signal for the sorting of all groups.Because of this, dMet assimilation rates obtainedusing this methodological approach are higher thanin situ rates and should not be considered a quantita-tive reflection of the actual assimilation by eachgroup in the system but rather the relative assimila-tion capacity. Moreover, these rates cannot be considered ‘potential’ because we cannot assurethat experimental concentrations were saturating.Because the assimilation of dMet by specific groupswas assessed after the amendment of only 1 non-tracer concentration (instead of a series of concentra-tions, as employed for the in situ rate constant, seeabove), we calculated the cell-specific assimilationrate as the product of the fraction of labeled com-pound assimilated per cell per unit of time and theexperimental concentration, which was consideredto be the sum of the in situ concentration plus thelabeled amendment. Group-specific assimilationrates were calculated as the product of the cell-spe-cific rate and the cell abundance of the correspon-ding group. The same calculations were performedfor cell- and group-specific dDMSP assimilationrates.
Effect of different S substrates on dMet and dDMSP assimilation
To test for the effect of potentially competing re -duced S substrates on the assimilation of dMet anddDMSP, samples from 25 m were amended with dif-ferent S compounds (DMSP, methionine, cysteine,thiosulfate, and dimethylsulfoxide) at concentrationsof 1, 50, and 125 nM. Samples were aliquoted into14 ml serum vials, amended with the different S com-pounds, and incubated for 2 h. After this pre-incuba-
tion, samples were amended with either 35S-DMSP(5 pM) or 35S-Met (5 pM), and incubated for an addi-tional 2 h. Samples with no S-compound added con-stituted the control. All treatments were carried outin quadruplicate.
Statistical tests
The significance of differences between day- andnight-time assimilation rates and rate constants weretested using a t-test at a 0.05 level of significance.Differences among groups (PRO, LNA, and HNA)were tested for significance using 1-way analysis ofvariance followed by post hoc comparisons usingTukey’s procedure.
RESULTS
Diel variability of dMet concentration and assimilation
In surface waters (25 m) of the NPSG, dMet con-centrations presented a strong diel cycle, with con-centrations reaching minimum values (<0.17 pM) atnight and rising to maximum values in the late after-noon (28.4 and 40.2 pM on 31 August and 1 Septem-ber 2012, respectively) (Fig. 1A). Significantly higherdMet assimilation rate constants (kdMet) were ob -served during the night (mean ± SE = 0.083 ±0.020 h−1, n = 6) than during the day (0.009 ±0.002 h−1, n = 6) (Fig. 1B). Because our lowest 35S-dMet addition (1 pM) was above the night-time dMetconcentrations (<0.17 pM), the night-time kdMet maybe underestimated because increasing the pool con-centration would tend to slow its turnover. If weassume that the night-time kdMet values are truly rep-resentative of the ambient conditions, then we canplace an upper limit on dMet assimilation at night bymultiplying the kdMet by the detection limit of thedMet concentration method (0.17 pM). This yieldsestimates of dMet assimilation at night (0.10 ±0.05 pM h−1, n = 6) that are significantly lower thandaytime rates (0.22 ± 0.07 pM h−1, n = 6) (Fig. 1C).Estimated upper limits for night-time dMet assimila-tion rates accounted for only 4 to 29% of theobserved decrease in dMet concentrations at dusk,suggesting that there were other fates of dMet thatwere not measured.
dMet cell-specific and group-specific assimilationrates were significantly higher during the nightcompared to the day for PRO, LNA bacteria, and
106

del Valle et al.: Methionine and DMSP as S sources
HNA bacteria (Fig. 2). HNA bacteria presentedhigher cell-specific dMet assimilation rates thanLNA during both the day- and night-time(Fig. 2A). However, dMet group-specific assimila-tion rates were not significantly different between
these 2 groups during either the day- or night-time (Fig. 2B). Cell-specific dMet assimilationrates by PRO were significantly lower than byHNA bacteria during the day- and night-time butwere only significantly lower than LNA bacterialassimilation rates during the night-time (Fig. 2A).However, dMet group-specific assimilation ratesby PRO were significantly lower than by HNAand LNA bacteria for both day- and night-time(Fig. 2B).
Diel variability of dDMSP concentration andassimilation
Daytime concentrations of dDMSP (0.42 ± 0.02 nM,n = 6) were not significantly different from night-time concentrations (0.42 ± 0.03 nM, n = 6) (Fig.3A). dDMSP assimilation rate constants (kdDMSP)and dDMSP assimilation rates were significantlyhigher during the night than during the day (4.9 ×10⁻³ ± 0.4 × 10⁻³ h−1 vs. 3.2 × 10⁻³ ± 0.3 × 10⁻³ h−1
and 2.04 ± 0.15 pM h−1 vs. 1.35 ± 0.18 pM h−1)(Fig. 3B,C).
Cell-specific and group-specific dDMSP assimila-tion rates were significantly higher during thenight than during the day for all groups studied(i.e. PRO, LNA, and HNA) (Fig. 4). During thenight, HNA bacteria presented the highest cell-specific dDMSP assimilation rate compared to bothPRO and LNA bacteria. During the day, the cell-
107
Fig. 2. Temporal variations of (A) cell-specific and (B) group-specific dMet assimilation rates (AR). Rates were obtainedafter addition of non-tracer 35S-dMet concentrations andtherefore are not a reflection of in situ rates. Seawater from25 m was sampled every 4 h on 31 August and 1 September2012 at Stn ALOHA. PRO: Prochlorococcus, LNA bacteria:low nucleic acid bacteria, HNA bacteria: high nucleic acidbacteria. Grey background indicates night-time, whilewhite background indicates daytime. Error bars denotestandard deviation and are shown when larger than symbols
Fig. 3. Temporal variations of (A) dissolved dimethylsulfo-niopropionate (dDMSP) concentrations, (B) dDMSP assimi-lation rate constants (kdDMSP), and (C) dDMSP assimilation
rates (AR). See Fig. 2 for further details
Fig. 1. Temporal variations of (A) dissolved methionine(dMet) concentrations, (B) dMet assimilation rate constants(kdMet), and (C) dMet assimilation rates (AR). Open circles de-note times of the day at which dMet was below the detectionlimit (0.17 pM). Seawater from 25 m was sampled every 4 hon 31 August and 1 September 2012, at Stn ALOHA. Greybackground indicates night-time, while white backgroundindicates daytime. Error bars in (B) and (C) denote standard
deviation and are shown when larger than symbols
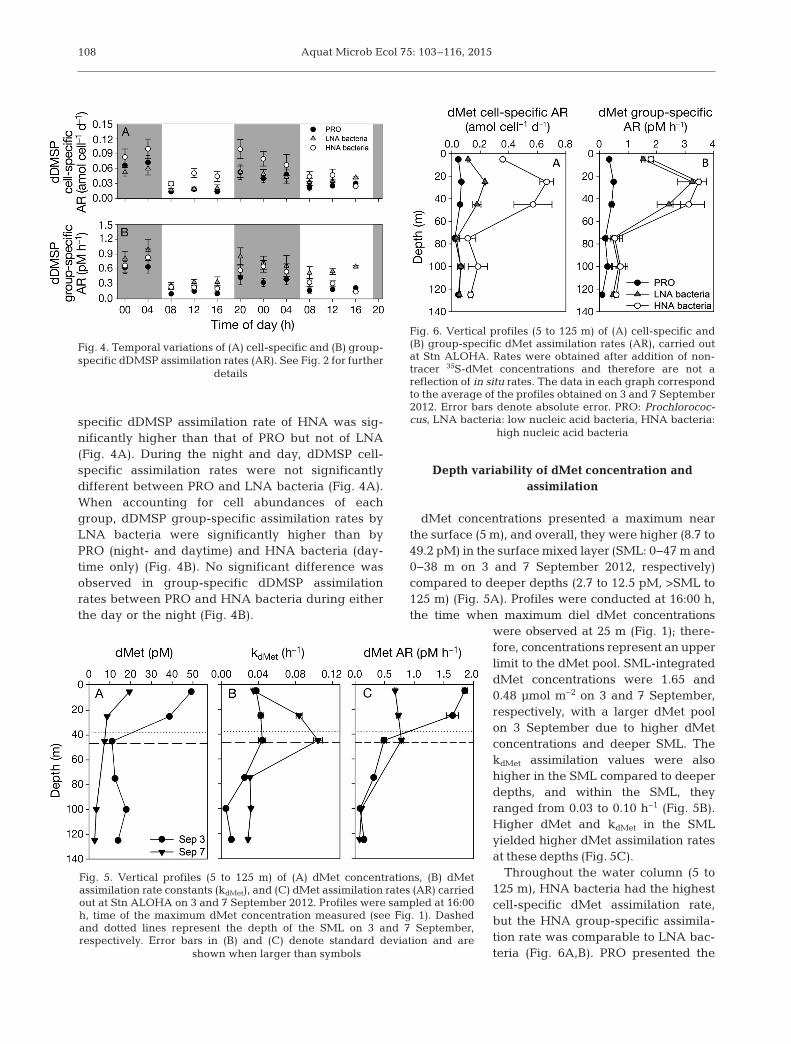
Aquat Microb Ecol 75: 103–116, 2015108
specific dDMSP assimilation rate of HNA was sig-nificantly higher than that of PRO but not of LNA(Fig. 4A). During the night and day, dDMSP cell-specific assimilation rates were not significantlydifferent between PRO and LNA bacteria (Fig. 4A).When accounting for cell abundances of eachgroup, dDMSP group-specific assimilation rates byLNA bacteria were significantly higher than byPRO (night- and daytime) and HNA bacteria (day-time only) (Fig. 4B). No significant difference wasobserved in group-specific dDMSP assimilationrates between PRO and HNA bacteria during eitherthe day or the night (Fig. 4B).
Depth variability of dMet concentration and assimilation
dMet concentrations presented a maximum nearthe surface (5 m), and overall, they were higher (8.7 to49.2 pM) in the surface mixed layer (SML: 0−47 m and0−38 m on 3 and 7 September 2012, respectively) compared to deeper depths (2.7 to 12.5 pM, >SML to125 m) (Fig. 5A). Profiles were conducted at 16:00 h,the time when maximum diel dMet concentrations
were observed at 25 m (Fig. 1); there-fore, concentrations re present an upperlimit to the dMet pool. SML-integrateddMet concen trations were 1.65 and0.48 µmol m−2 on 3 and 7 September,respectively, with a larger dMet poolon 3 September due to higher dMetconcentrations and deeper SML. ThekdMet as similation values were alsohigher in the SML compared to deeperdepths, and within the SML, theyranged from 0.03 to 0.10 h−1 (Fig. 5B).Higher dMet and kdMet in the SMLyielded higher dMet assimilation ratesat these depths (Fig. 5C).
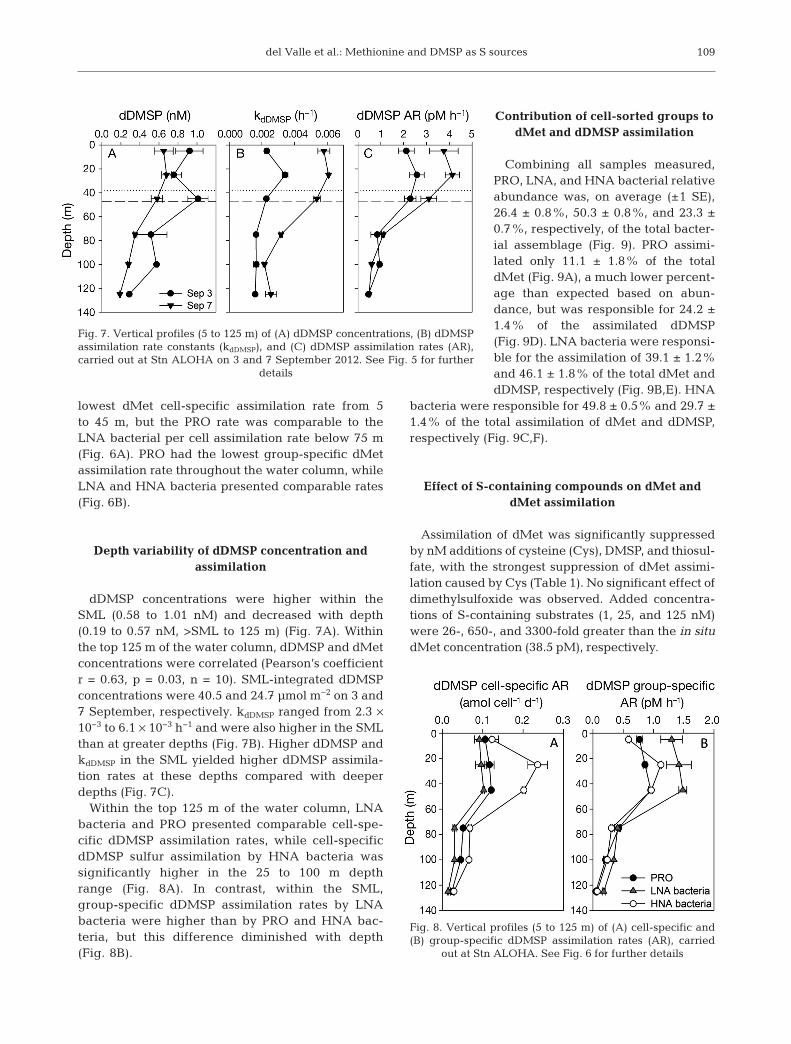
Throughout the water column (5 to125 m), HNA bacteria had the highestcell-specific dMet assimilation rate,but the HNA group-specific assimila-tion rate was comparable to LNA bac-teria (Fig. 6A,B). PRO presented the
Fig. 4. Temporal variations of (A) cell-specific and (B) group-specific dDMSP assimilation rates (AR). See Fig. 2 for further
details
Fig. 5. Vertical profiles (5 to 125 m) of (A) dMet concentrations, (B) dMetassimilation rate constants (kdMet), and (C) dMet assimilation rates (AR) carriedout at Stn ALOHA on 3 and 7 September 2012. Profiles were sampled at 16:00h, time of the maximum dMet concentration measured (see Fig. 1). Dashedand dotted lines represent the depth of the SML on 3 and 7 September,respectively. Error bars in (B) and (C) denote standard deviation and are
shown when larger than symbols
Fig. 6. Vertical profiles (5 to 125 m) of (A) cell-specific and(B) group-specific dMet assimilation rates (AR), carried outat Stn ALOHA. Rates were obtained after addition of non-tracer 35S-dMet concentrations and therefore are not areflection of in situ rates. The data in each graph correspondto the average of the profiles obtained on 3 and 7 September2012. Error bars denote absolute error. PRO: Prochlorococ-cus, LNA bacteria: low nucleic acid bacteria, HNA bacteria:
high nucleic acid bacteria
del Valle et al.: Methionine and DMSP as S sources
lowest dMet cell-specific assimilation rate from 5to 45 m, but the PRO rate was comparable to theLNA bacterial per cell assimilation rate below 75 m(Fig. 6A). PRO had the lowest group-specific dMetassimilation rate throughout the water column, whileLNA and HNA bacteria presented comparable rates(Fig. 6B).
Depth variability of dDMSP concentration andassimilation
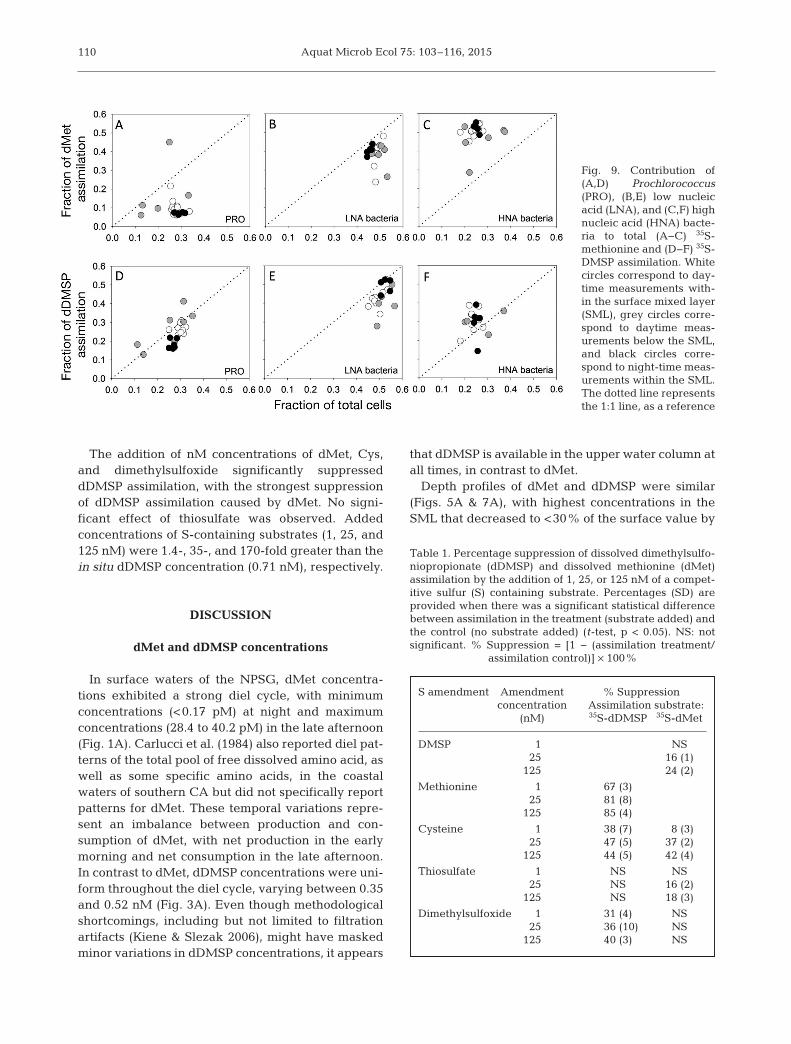
dDMSP concentrations were higher within theSML (0.58 to 1.01 nM) and decreased with depth(0.19 to 0.57 nM, >SML to 125 m) (Fig. 7A). Withinthe top 125 m of the water column, dDMSP and dMetconcentrations were correlated (Pearson’s coefficientr = 0.63, p = 0.03, n = 10). SML-integrated dDMSPconcentrations were 40.5 and 24.7 µmol m−2 on 3 and7 September, respectively. kdDMSP ranged from 2.3 ×10⁻³ to 6.1 × 10⁻³ h−1 and were also higher in the SMLthan at greater depths (Fig. 7B). Higher dDMSP andkdDMSP in the SML yielded higher dDMSP assimila-tion rates at these depths compared with deeperdepths (Fig. 7C).
Within the top 125 m of the water column, LNAbacteria and PRO presented comparable cell-spe-cific dDMSP assimilation rates, while cell-specificdDMSP sulfur assimilation by HNA bacteria wassignificantly higher in the 25 to 100 m depthrange (Fig. 8A). In contrast, within the SML,group-specific dDMSP assimilation rates by LNAbacteria were higher than by PRO and HNA bac-teria, but this difference diminished with depth(Fig. 8B).
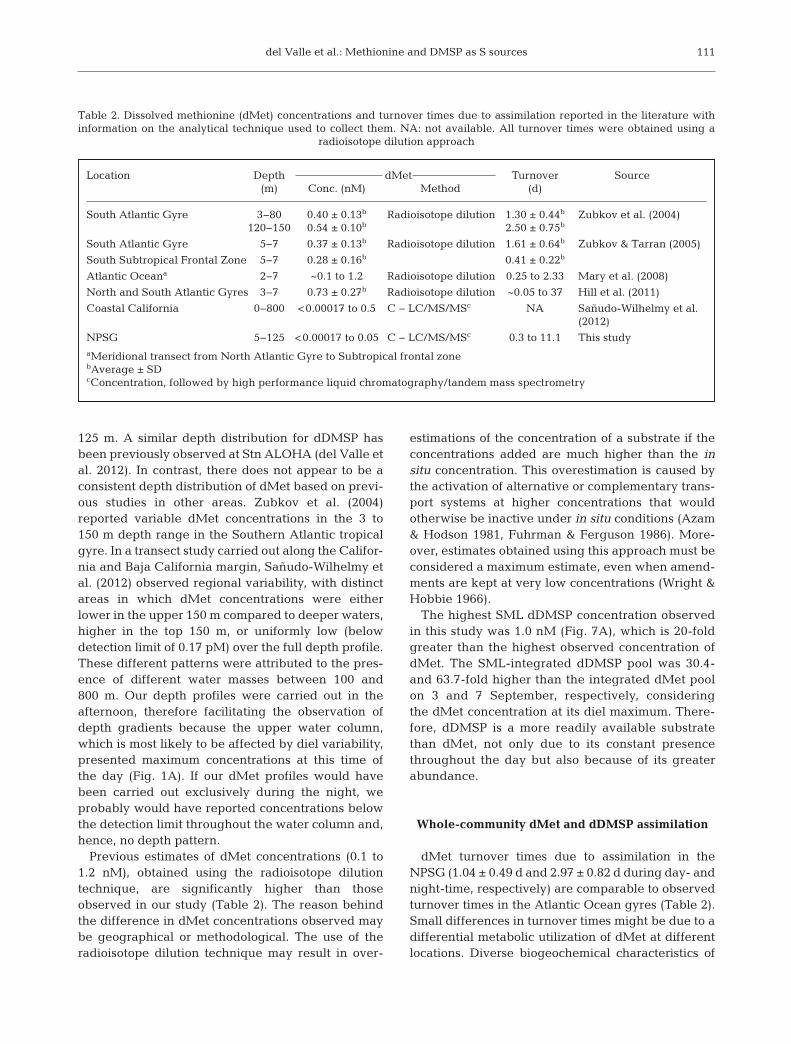
Contribution of cell-sorted groups todMet and dDMSP assimilation
Combining all samples measured,PRO, LNA, and HNA bacterial relativeabundance was, on average (±1 SE),26.4 ± 0.8%, 50.3 ± 0.8%, and 23.3 ±0.7%, respectively, of the total bacter-ial assemblage (Fig. 9). PRO assimi-lated only 11.1 ± 1.8% of the totaldMet (Fig. 9A), a much lower percent-age than expected based on abun-dance, but was responsible for 24.2 ±1.4% of the assimilated dDMSP(Fig. 9D). LNA bacteria were responsi-ble for the assimilation of 39.1 ± 1.2%and 46.1 ± 1.8% of the total dMet anddDMSP, respectively (Fig. 9B,E). HNA
bacteria were responsible for 49.8 ± 0.5% and 29.7 ±1.4% of the total assimilation of dMet and dDMSP,respectively (Fig. 9C,F).
Effect of S-containing compounds on dMet anddMet assimilation
Assimilation of dMet was significantly suppressedby nM additions of cysteine (Cys), DMSP, and thiosul-fate, with the strongest suppression of dMet assimi -lation caused by Cys (Table 1). No significant effect ofdimethylsulfoxide was observed. Added concentra-tions of S-containing substrates (1, 25, and 125 nM)were 26-, 650-, and 3300-fold greater than the in situdMet concentration (38.5 pM), respectively.
109
Fig. 7. Vertical profiles (5 to 125 m) of (A) dDMSP concentrations, (B) dDMSPassimilation rate constants (kdDMSP), and (C) dDMSP assimilation rates (AR),carried out at Stn ALOHA on 3 and 7 September 2012. See Fig. 5 for further
details
Fig. 8. Vertical profiles (5 to 125 m) of (A) cell-specific and(B) group-specific dDMSP assimilation rates (AR), carried
out at Stn ALOHA. See Fig. 6 for further details
Aquat Microb Ecol 75: 103–116, 2015
The addition of nM concentrations of dMet, Cys,and dimethylsulfoxide significantly suppresseddDMSP assimilation, with the strongest suppressionof dDMSP assimilation caused by dMet. No signi -ficant effect of thiosulfate was observed. Added con centrations of S-containing substrates (1, 25, and125 nM) were 1.4-, 35-, and 170-fold greater than thein situ dDMSP concentration (0.71 nM), respectively.
DISCUSSION
dMet and dDMSP concentrations
In surface waters of the NPSG, dMet concentra-tions exhibited a strong diel cycle, with minimumconcentrations (<0.17 pM) at night and maximumconcentrations (28.4 to 40.2 pM) in the late afternoon(Fig. 1A). Carlucci et al. (1984) also reported diel pat-terns of the total pool of free dissolved amino acid, aswell as some specific amino acids, in the coastalwaters of southern CA but did not specifically reportpatterns for dMet. These temporal variations repre-sent an imbalance between production and con-sumption of dMet, with net production in the earlymorning and net consumption in the late afternoon.In contrast to dMet, dDMSP concentrations were uni-form throughout the diel cycle, varying between 0.35and 0.52 nM (Fig. 3A). Even though methodologicalshortcomings, including but not limited to filtrationartifacts (Kiene & Slezak 2006), might have maskedminor variations in dDMSP concentrations, it appears
that dDMSP is available in the upper water column atall times, in contrast to dMet.
Depth profiles of dMet and dDMSP were similar(Figs. 5A & 7A), with highest concentrations in theSML that decreased to <30% of the surface value by
110
Fig. 9. Contribution of(A,D) Prochlorococcus(PRO), (B,E) low nu cleicacid (LNA), and (C,F) highnucleic acid (HNA) bacte-ria to total (A−C) 35S-methionine and (D−F) 35S-DMSP assimilation. Whitecircles correspond to day-time measure ments with -in the surface mixed layer(SML), grey circles corre-spond to daytime meas-urements below the SML,and black circles corre-spond to night-time meas-urements within the SML.The dotted line representsthe 1:1 line, as a reference
S amendment Amendment % Suppressionconcentration Assimilation substrate:
(nM) 35S-dDMSP 35S-dMet
DMSP 1 NS25 16 (1)
125 24 (2)
Methionine 1 67 (3)25 81 (8)
125 85 (4)
Cysteine 1 38 (7) 8 (3)25 47 (5) 37 (2)
125 44 (5) 42 (4)
Thiosulfate 1 NS NS25 NS 16 (2)
125 NS 18 (3)
Dimethylsulfoxide 1 31 (4) NS25 36 (10) NS
125 40 (3) NS
Table 1. Percentage suppression of dissolved dimethylsulfo-niopropionate (dDMSP) and dissolved methionine (dMet)assimilation by the addition of 1, 25, or 125 nM of a compet-itive sulfur (S) containing substrate. Percentages (SD) areprovided when there was a significant statistical differencebetween assimilation in the treatment (substrate added) andthe control (no substrate added) (t-test, p < 0.05). NS: notsignificant. % Suppression = [1 − (assimilation treatment/
assimilation control)] × 100%
del Valle et al.: Methionine and DMSP as S sources
125 m. A similar depth distribution for dDMSP hasbeen previously observed at Stn ALOHA (del Valle etal. 2012). In contrast, there does not appear to be aconsistent depth distribution of dMet based on previ-ous studies in other areas. Zubkov et al. (2004)reported variable dMet concentrations in the 3 to150 m depth range in the Southern Atlantic tropicalgyre. In a transect study carried out along the Califor-nia and Baja California margin, Sañudo-Wilhelmy etal. (2012) observed regional variability, with distinctareas in which dMet concentrations were eitherlower in the upper 150 m compared to deeper waters,higher in the top 150 m, or uniformly low (belowdetection limit of 0.17 pM) over the full depth profile.These different patterns were attributed to the pres-ence of different water masses between 100 and800 m. Our depth profiles were carried out in theafternoon, therefore facilitating the observation ofdepth gradients because the upper water column,which is most likely to be affected by diel variability,presented maximum concentrations at this time ofthe day (Fig. 1A). If our dMet profiles would havebeen carried out exclusively during the night, weprobably would have reported concentrations belowthe detection limit throughout the water column and,hence, no depth pattern.
Previous estimates of dMet concentrations (0.1 to1.2 nM), obtained using the radioisotope dilutiontechnique, are significantly higher than thoseobserved in our study (Table 2). The reason behindthe difference in dMet concentrations observed maybe geographical or methodological. The use of theradioisotope dilution technique may result in over -
estimations of the concentration of a substrate if theconcentrations added are much higher than the insitu concentration. This overestimation is caused bythe activation of alternative or complementary trans-port systems at higher concentrations that would otherwise be inactive under in situ conditions (Azam& Hodson 1981, Fuhrman & Ferguson 1986). More-over, estimates obtained using this approach must beconsidered a maximum estimate, even when amend-ments are kept at very low concentrations (Wright &Hobbie 1966).
The highest SML dDMSP concentration observedin this study was 1.0 nM (Fig. 7A), which is 20-foldgreater than the highest observed concentration ofdMet. The SML-integrated dDMSP pool was 30.4-and 63.7-fold higher than the integrated dMet poolon 3 and 7 September, respectively, consideringthe dMet concentration at its diel maximum. There-fore, dDMSP is a more readily available substratethan dMet, not only due to its constant presencethroughout the day but also because of its greaterabundance.
Whole-community dMet and dDMSP assimilation
dMet turnover times due to assimilation in theNPSG (1.04 ± 0.49 d and 2.97 ± 0.82 d during day- andnight-time, respectively) are comparable to observedturnover times in the Atlantic Ocean gyres (Table 2).Small differences in turnover times might be due to adifferential metabolic utilization of dMet at differentlocations. Diverse biogeochemical characteristics of
111
Location Depth dMet Turnover Source(m) Conc. (nM) Method (d)
South Atlantic Gyre 3−80 0.40 ± 0.13b Radioisotope dilution 1.30 ± 0.44b Zubkov et al. (2004)120−150 0.54 ± 0.10b 2.50 ± 0.75b
South Atlantic Gyre 5−7 0.37 ± 0.13b Radioisotope dilution 1.61 ± 0.64b Zubkov & Tarran (2005)
South Subtropical Frontal Zone 5−7 0.28 ± 0.16b 0.41 ± 0.22b
Atlantic Oceana 2−7 ~0.1 to 1.2 Radioisotope dilution 0.25 to 2.33 Mary et al. (2008)
North and South Atlantic Gyres 3−7 0.73 ± 0.27b Radioisotope dilution ~0.05 to 37 Hill et al. (2011)
Coastal California 0−800 <0.00017 to 0.5 C − LC/MS/MSc NA Sañudo-Wilhelmy et al. (2012)
NPSG 5−125 <0.00017 to 0.05 C − LC/MS/MSc 0.3 to 11.1 This studyaMeridional transect from North Atlantic Gyre to Subtropical frontal zonebAverage ± SDcConcentration, followed by high performance liquid chromatography/tandem mass spectrometry
Table 2. Dissolved methionine (dMet) concentrations and turnover times due to assimilation reported in the literature withinformation on the analytical technique used to collect them. NA: not available. All turnover times were obtained using a
radioisotope dilution approach
Aquat Microb Ecol 75: 103–116, 2015
the different locations might cause dMet to be chan-neled into different metabolic uses that may competewith direct assimilation into proteins. At Stn ALOHA,the rapid decrease in dMet concentrations at nightcannot be accounted for exclusively by assimilationinto cells (<29%), meaning that, at least at this time ofthe day, dMet is not only being assimilated into pro-teins but is also metabolized in some other way. Res-piration constitutes a major sink for certain aminoacids, although the fraction that is respired is depend-ent on the specific amino acid (Suttle et al. 1991) andits concentration (J.R. Casey, P.J. Falkowski & D.M.Karl pers. comm.). For example, respiration has beenreported to account for 60 to 80% of the losses ofadded glutamate, glutamine, glycine, and alanine butonly 5 to 10% of leucine losses (Suttle et al. 1991, Hillet al. 2013). The lower respiration of leucine might bebecause this amino acid is primarily directed into pro-tein synthesis instead of being routed to respirationpathways (Kirchman et al. 1985). Regardless of theultimate metabolic fate of dMet, this substrate mustbe of importance to the microbial community, sincedriving the dMet concentrations as low as observedduring the night probably requires costly, highly effi-cient uptake systems.
Throughout the day, dMet accumulates, which, atleast partly, is due to an increase in dMet turnovertime due to assimilation (Fig. 1). This increase in con-centration might also be partly caused by a decreasein the importance of other sinks of dMet (e.g. respira-tion, as discussed above, or production of DMSP; Ste-fels 2007) and/or a higher release of Met into the dis-solved phase during daytime than at night. Althoughwe could not find specific information about Met,amino acid synthesis by phytoplankton has beenobserved to be linked to primary production (Ham-mer & Brockmann 1983), which in turn may beaccompanied by a greater release or leakage into thedissolved phase during daytime (Carlucci et al.1984). Autolysis of cells, viral lysis, and grazing mightbe other factors contributing to the increase of dMetconcentrations during the day.
Assimilation rates of dDMSP presented a clear dielcycle, with higher assimilation during the night;however, dDMSP concentrations lacked any cleardiel pattern (Fig. 3). Since assimilation of dDMSP intoproteins is known to be only a minor fate of DMSPmetabolism in oligotrophic waters, constituting only2% of the metabolized dDMSP (del Valle et al. 2012),it is expected that changes in dDMSP assimilationrates will not translate into obvious changes indDMSP concentrations. However, turnover times dueto dDMSP consumption (i.e. sum of assimilation, oxi-
dation, and transformation into volatiles) are rapidwithin the SML, ranging from 4.1 to 7.4 h, which indi-cates that this is a very dynamic pool (del Valle et al.2012). The fact that most of the dDMSP is not assimi-lated could suggest that it is not important as a Ssource; however, because of the size of the pool, thesmall fraction of dDMSP assimilated contributed 20to 67% of the bacterial S demand in these oligotro-phic waters (del Valle et al. 2012).
Compared to SML-integrated dMet assimilationrates, dDMSP assimilation rates were 1.7- and 5.3-fold faster (on 3 and 7 September 2012, respectively),indicating that dDMSP constitutes a more importantsource of S than dMet for the microbial community asa whole under natural conditions during the time ofour study. This pattern is driven by the higher abun-dance of the dDMSP pool, since microbes appear toprefer dMet against dDMSP, if dMet were to be pres-ent at comparable concentrations (Table 1). dDMSPassimilation was greatly suppressed by nM additionsof dMet, while additions of dDMSP had a lessereffect on dMet assimilation (Table 1), which high-lights the importance of dMet acquisition formicrobes in this system. Cys significantly suppressedthe assimilation of dDMSP and to a lesser extent ofdMet (Table 1). Cys is an essential amino acid thatcan be synthesized from Met and also from DMSP(Kiene et al. 1999). The effect of Cys additions todDMSP and dMet assimilation emphasizes howinterrelated these compounds are in sulfur aminoacid metabolism. The effect of Cys on dDMSP anddMet assimilation suggests that these compounds areprecursors of Cys in this system and/or that Cys canact as a precursor of Met and DMSP and thereforereplace the need for their uptake if Cys is available atsufficiently high concentrations.
Group-specific dMet and dDMSP assimilation
PRO is a group of phototrophic cyanobacteria thatis abundant in the surface waters of the central oligo-trophic areas of the ocean, with average cell concen-trations of 1.7 × 10⁵ cell ml−1 at 25 m at Stn ALOHA(2007 to 2011, http://hahana.soest.hawaii. edu/hot/hot-dogs/). One possible adaptive advantage overother taxa that allows PRO to succeed in highly oligo-trophic environments is its capacity to incorporateorganic substrates (Rocap et al. 2003, Zubkov et al.2003). Even though PRO has all of the genes neces-sary to synthesize amino acids (Rocap et al. 2003), ithas been reported to be an important contributor toamino acid cycling. In culture, PRO assimilates Met
112
del Valle et al.: Methionine and DMSP as S sources
and leucine at high rates despite the presence of amuch higher concentration of ammonium in themedia (Mary et al. 2008), suggesting that there is apreference for amino acids, presumably becausethey can be directly incorporated into proteins. AtStn ALOHA, PRO accounted for, on average, only11.1% of total dMet assimilation in the SML, a muchlower percentage than what would be expectedbased exclusively on its abundance (27%) (Fig. 9). Inthe Arabian Sea and the South Atlantic Ocean, thepercentage of dMet assimilated by PRO was similarto what was expected based on its abundance(Zubkov et al. 2003, Zubkov & Tarran 2005). How-ever, at Stn ALOHA, PRO does not appear to exert astrong competitive pressure on other microbial popu-lations with respect to dMet assimilation. The rea-sons behind this low assimilation of dMet by PRO arenot clear. One possibility might be that the transportof organic compounds naturally present at such lowconcentrations (low pM), and even virtually absent atcertain times of the day, is not energetically favorablefor PRO. Also, PRO may not be able to regulate theuptake of dMet as efficiently as LNA and HNA bac-teria (Rocap et al. 2003, García-Fernández et al.2004) in response to the enriched concentrations ofdMet utilized for our flow sorting experiments (140 to190 pM). This would represent a significant dis -advantage to PRO if it cannot respond quickly toincreased fluxes of essential organic nutrients. Mich-elou et al. (2007) reported that PRO contributed upto 24% of total leucine assimilation when suppliedat a concentration of 20 nM but only 10% of theassimilation of a mix of different amino acids sup-plied at 0.5 nM, which could suggest that PRO mightcompete better for amino acid uptake when these arepresent at high concentrations. However, these re -sults may also be explained by a preferential assimi-lation of leucine, as explained in ‘Whole-communitydMET and dDSMP assimilation’. At Stn ALOHA,assimilation by PRO of leucine supplied in the pMrange (~160 pM) was also much lower than expectedbased on abundance (13%, data not shown), similarto dMet assimilation. In contrast, PRO were morecompetitive in the assimilation of dDMSP, beingresponsible for 26 and 18% of total assimilation during the day and night, respectively, suggestingthat PRO have a preference for DMSP as their Ssource.
Bacterial cells with HNA and LNA content havebeen extensively discriminated using flow cytometry(e.g. Li et al. 1995, Gasol et al. 1999, Lebaron et al.2001, Zubkov et al. 2001, Mary et al. 2006). Severalstudies have reported the presence of SAR11 exclu-
sively within the LNA bacterial group (Mary et al.2006, Hill 2010, Schattenhofer et al. 2011, Vila-Costaet al. 2012), although to our knowledge this has notbeen investigated in the Pacific Ocean. Based onSAR11 typical abundance at Stn ALOHA (Eiler et al.2009) and their incapacity to reduce sulfate (Tripp etal. 2008), SAR11 might be responsible for an impor-tant portion of the assimilation observed within theLNA bacterial group. LNA bacteria at Stn ALOHAare responsible for an average of 42% of the totalassimilation of dMet within the SML. This observa-tion agrees with the expectation of LNA bacteriabeing responsible for an important fraction of theuptake of small dissolved organic molecules (Mary etal. 2006). Similar to our results, the contribution ofLNA bacteria to dMet assimilation in a transect alongthe Atlantic was the same as expected based on itsabundance (both 36%; Mary et al. 2006). In theNPSG, LNA bacteria may outcompete other prokary-otes for labile compounds, not because of their per-cell assimilation rate but mainly as a result of theirhigh abundance in these waters.
From our study, if we assume that all LNA bacterialcells are SAR11, then SAR11 assimilation of dDMSPwould account for 38–63% of total bacterial assimila-tion. However, a more realistic assumption would beto consider that ~60% of LNA bacteria belong to theSAR11 clade (Mary et al. 2006, Schattenhofer et al.2011), decreasing the SAR11 contribution to dDMSPassimilation to 23–38%. This estimate agrees wellwith results from the Atlantic Ocean obtained usingquantitative microautoradiography and fluorescencein situ hybridization that reported SAR11 beingresponsible for 30% of dDMSP assimilation in sur-face waters (Malmstrom et al. 2004a). The impor-tance of SAR11 in the cycling of DMSP is highlightedin the fact that this group contributes 80% of the totalgene pool for the key-degrading enzyme, DMSPdemethylase (dmdA), in the NPSG (Varaljay et al.2012).
HNA bacteria are usually considered the moredynamic constituent of the bacterial assembly (Gasolet al. 1999, Lebaron et al. 2001, Longnecker et al.2006), and this is in agreement with our observationof high per-cell assimilation rates of both dMet anddDMSP in surface waters. The highest per-cellassimilation rate of HNA bacteria, compared to PROand LNA bacteria, may be due to their faster growthrate or may be only due to their larger size, sincewithin the HNA bacterial group a positive relationbetween leucine incorporation and nucleic acid cellcontent and biovolume has been previously reported(Lebaron et al. 2002).
113

Aquat Microb Ecol 75: 103–116, 2015
All the sorted groups (i.e. PRO, LNA, and HNA)presented higher dMet assimilation during the night,which is in agreement with the finding of an over-abundance of transcripts related to amino acid trans-port and metabolism during the night at Stn ALOHAfor PRO and heterotrophic taxa (Poretsky et al. 2009).Our results are also in agreement with Mary et al.(2008), who reported a diel cycle for dMet assimila-tion by PRO in surface waters of the tropical AtlanticOcean and in culture, with maximum assimilation atdusk and minimum assimilation at noon. At StnALOHA, assimilation of dDMSP into proteins alsopresented a clear diel cycle by all groups. Whetherthese patterns are imposed by metabolic regulationor are the result of a response to cross-species syn-chronous patterns is not known (Ottesen et al. 2013).The slower assimilation rate of dDMSP during theday may also be partially explained by the light his-tory of the collected sample because negative effectsof solar radiation, especially UV, on bacterial DMSPmetabolism have been reported (Slezak et al. 2001,Ruiz-González et al. 2012).
CONCLUSIONS
The widespread capability of marine microbes toassimilate DMSP and amino acids (Cottrell & Kirch-man 2003, Malmstrom et al. 2004a,b, Vila et al. 2004)highlights the importance of these compounds tomicrobial metabolism. This study shows thatdMet constitutes a very dynamic pool and a signifi-cant source of S to the microbial community atStn ALOHA. However, during summer, dDMSP isthe dominant S source, probably due to its higherconcentration and availability.
Acknowledgements. We thank Chief Scientist S. Wilson forfacilitating our research objectives. We also acknowledge K.Doggett for carrying out the flow cytometric sorting of thesamples, as well as C. Suffridge and L. Cutter for their meas-urement of dMet concentrations. Finally, we thank 2 anony-mous reviewers for helpful comments and suggestions. Thisresearch was supported by National Science Foundation(NSF) Grants EF-0424599 (D.M.K.), OCE-0928968 (R.P.K.),and OCE-0962209 (S.A.S-W.) as well as the Gordon andBetty Moore Foundation Marine Microbiology Investigatorawards #480.01 and #3794 (D.M.K.).
LITERATURE CITED
Azam F, Hodson RE (1981) Multiphasic kinetics for D-glu-cose uptake by assemblages of natural marine bacteria.Mar Ecol Prog Ser 6: 213−222
Carlucci AF, Craven DB, Henrichs SM (1984) Diel produc-tion and microheterotrophic utilization of dissolved freeamino acids in waters off Southern California. Appl Environ Microbiol 48: 165−170
Coffin RB (1989) Bacterial uptake of dissolved free and com-bined amino acids in estuarine waters. Limnol Oceanogr34: 531−542
Cottrell MT, Kirchman DL (2003) Contribution of major bac-terial groups to bacterial biomass production (thymidineand leucine incorporation) in the Delaware estuary. Limnol Oceanogr 48: 168−178
Degens ET (1970) Molecular nature of nitrogenous com-pounds in sea water and recent marine sediments. In: Hood DW (ed) Organic matter in natural waters. Inst MarSci Occas Publ 1. University of Alaska, Fairbanks, AK,p 77−106
del Valle DA, Kiene RP, Karl DM (2012) Effect of visible lighton dimethylsulfoniopropionate assimilation and conver-sion to dimethylsulfide in the North Pacific SubtropicalGyre. Aquat Microb Ecol 66: 47−62
Dupont CL, Rusch DB, Yooseph S, Lombardo MJ and others(2012) Genomic insights to SAR86, an abundant anduncultivated marine bacterial lineage. ISME J 6: 1186−1199
Eiler A, Hayakawa DH, Church MJ, Karl DM, Rappé MS(2009) Dynamics of the SAR11 bacterioplankton lineagein relation to environmental conditions in the oligotro-phic North Pacific subtropical gyre. Environ Microbiol11: 2291−2300
Fuhrman JA, Ferguson RL (1986) Nanomolar concentrationsand rapid turnover of dissolved free amino acids in sea-water: agreement between chemical and microbiologicalmeasurements. Mar Ecol Prog Ser 33: 237−242
Gage DA, Rhodes D, Nolte KD, Hicks WA, Leustek T,Cooper AJ, Hanson AD (1997) A new route for the syn-thesis of dimethylsulfoniopropionate in marine algae.Nature 387: 891−894
García-Fernández JM, de Marsac NT, Diez J (2004) Stream-lined regulation and gene loss as adaptive mechanismsin Prochlorococcus for optimized nitrogen utilization inoligotrophic environments. Microbiol Mol Biol Rev 68: 630−638
Gasol JM, Zweifel UL, Peters F, Fuhrman JA, Hagström Å(1999) Significance of size and nucleic acid content het-erogeneity as measured by flow cytometry in naturalplanktonic bacteria. Appl Environ Microbiol 65: 4475−4483
Gröne T, Kirst GO (1992) The effect of nitrogen deficiency,methionine and inhibitors of methionine metabolism onthe DMSP contents of Tetraselmis subcordiformis (Stein).Mar Biol 112: 497−503
Hammer K, Brockmann U (1983) Rhythmic release of dis-solved free amino acids from partly synchronized Tha-lassiosira rotula under nearly natural conditions. MarBiol 74: 305−312
Hill PG (2010) Bacterioplankton dynamics in surface watersof the north-eastern (sub-)tropical Atlantic Oceanaffected by aeolian dust. PhD dissertation, University ofSouthampton, Southampton
Hill PG, Mary I, Purdie DA, Zubkov MV (2011) Similarity inmicrobial amino acid uptake in surface waters of theNorth and South Atlantic (sub-)tropical gyres. ProgOceanogr 91: 437−446
Hill PG, Warwick PE, Zubkov MV (2013) Low microbial res-piration of leucine at ambient oceanic concentration in
114

del Valle et al.: Methionine and DMSP as S sources
the mixed layer of the central Atlantic Ocean. LimnolOceanogr 58: 1597−1604
Howard EC, Sun S, Reisch CR, del Valle DA, Bürgmann H,Kiene RP, Moran MA (2011) Changes in dimethylsulfo-niopropionate demethylase gene assemblages inresponse to an induced phytoplankton bloom. Appl Environ Microbiol 77: 524−531
Iverson V, Morris RM, Frazar CD, Berthiaume CT, MoralesRL, Armbrust EV (2012) Untangling genomes frommetagenomes: revealing an uncultured class of marineeuryarchaeota. Science 335: 587−590
Karl DM, Lukas R (1996) The Hawaii Ocean Time-series(HOT) program: background, rationale and field imple-mentation. Deep-Sea Res II 43: 129−156
Keil RG, Kirchman DL (1991) Contribution of dissolved freeamino acids and ammonium to the nitrogen require-ments of heterotrophic bacterioplankton. Mar Ecol ProgSer 73: 1−10
Keller MD, Bellows W, Guillard R (1989) Dimethyl sulfideproduction in marine phytoplankton In: Saltzman E,Cooper WJ (eds) Biogenic sulfur in the environment.American Chemical Society, New York, NY, p 167−182
Kiene RP, Linn LJ (2000) The fate of dissolved dimethylsul-foniopropionate (DMSP) in seawater: tracer studies using35S-DMSP. Geochim Cosmochim Acta 64: 2797−2810
Kiene RP, Service SK (1991) Decomposition of dissolvedDMSP and DMS in estuarine waters: dependence ontemperature and substrate concentration. Mar Ecol ProgSer 76: 1−11
Kiene RP, Slezak D (2006) Low dissolved DMSP concentra-tions in seawater revealed by small volume gravity filtra-tion and dialysis sampling. Limnol Oceanogr Methods 4: 80−95
Kiene RP, Linn LJ, González J, Moran MA, Bruton JA (1999)Dimethylsulfoniopropionate and methanethiol are im -portant precursors of methionine and protein-sulfur inmarine bacterioplankton. Appl Environ Microbiol 65: 4549−4558
Kiene RP, Linn LJ, Bruton JA (2000) New and importantroles for DMSP in marine microbial communities. J SeaRes 43: 209−224
Kirchman D, K’nees E, Hodson R (1985) Leucine incorpora-tion and its potential as a measure of protein synthesis bybacteria in natural aquatic systems. Appl Environ Micro-biol 49: 599−607
Kujawinski EB (2011) The impact of microbial metabolismon marine dissolved organic matter. Annu Rev Mar Sci 3: 567−599
Lebaron P, Servais P, Agogue H, Courties C, Joux F (2001)Does the high nucleic acid content of individual bacterialcells allow us to discriminate between active cells andinactive cells in aquatic systems? Appl Environ Microbiol67: 1775−1782
Lebaron P, Servais P, Baudoux AC, Bourrain M, Courties C,Parthuisot N (2002) Variations of bacterial-specific activ-ity with cell size and nucleic acid content assessed byflow cytometry. Aquat Microb Ecol 28: 131−140
Li WKW, Jellett JF, Dickie PM (1995) DNA distributions inplanktonic bacterial stained with TOTO or TO-PRO.Limnol Oceanogr 40: 1485−1495
Longnecker K, Sherr BF, Sherr EB (2006) Variation in cell-specific rates of leucine and thymidine incorporation bymarine bacteria with high and with low nucleic acid con-tent off the Oregon coast. Aquat Microb Ecol 43: 113−125
Luo S, Levine RL (2009) Methionine in proteins defends
against oxidative stress. FASEB J 23: 464−472Malmstrom RR, Kiene RP, Cottrell MT, Kirchman DL (2004a)
Contribution of SAR11 bacteria to dissolved dimethylsul-foniopropionate and amino acid uptake in the NorthAtlantic Ocean. Appl Environ Microbiol 70: 4129−4135
Malmstrom RR, Kiene RP, Kirchman DL (2004b) Identifica-tion and enumeration of bacteria assimilating dimethyl-sulfoniopropionate (DMSP) in the North Atlantic andGulf of Mexico. Limnol Oceanogr 49: 597−606
Martínez-García S, Fernández E, del Valle DA, Karl DM,Teira E (2013) Experimental assessment of marine bac -terial respiration. Aquat Microb Ecol 70: 189−205
Mary I, Heywood JL, Fuchs BM, Amann R, Tarran GA,Burkill PH, Zubkov MV (2006) SAR11 dominance amongmetabolically active low nucleic acid bacterioplankton insurface waters along an Atlantic meridional transect.Aquat Microb Ecol 45: 107−113
Mary I, Tarran GA, Warwick PE, Terry MJ, Scanlan DJ,Burkill PH, Zubkov MV (2008) Light enhanced aminoacid uptake by dominant bacterioplankton groups in sur-face waters of the Atlantic Ocean. FEMS Microbiol Ecol63: 36−45
Michelou VK, Cottrell MT, Kirchman DL (2007) Light-stimu-lated bacterial production and amino acid assimilationby cyanobacteria and other microbes in the NorthAtlantic Ocean. Appl Environ Microbiol 73: 5539−5546
Miller TR, Hnilicka K, Dziedzic A, Desplats P, Belas R (2004)Chemotaxis of Silicibacter sp. strain TM1040 towarddinoflagellate products. Appl Environ Microbiol 70: 4692−4701
Ottesen EA, Young CR, Eppley JM, Ryan JP, Chavez FP,Scholin CA, DeLong EF (2013) Pattern and synchrony ofgene expression among sympatric marine microbial populations. Proc Natl Acad Sci USA 110: E488−E497
Poretsky RS, Hewson I, Sun S, Allen AE, Zehr JP, Moran MA(2009) Comparative day/night metatranscriptomic analysis of microbial communities in the North Pacificsubtropical gyre. Environ Microbiol 11: 1358−1375
Reisch CR, Moran MA, Whitman WB (2011) Bacterial cata -bolism of dimethylsulfoniopropionate (DMSP). FrontMicrobiol 2: 172
Riley GA (1971) Particulate organic matter in sea water. AdvMar Biol 8: 1−118
Rocap G, Larimer F, Lamerdin J, Malfatti S and others (2003)Genome divergence in two Prochlorococcus ecotypesreflects oceanic niche differentiation. Nature 424: 1042−1047
Ruiz-González C, Galí M, Gasol JM, Simó R (2012) Sunlighteffects on the DMSP-sulfur and leucine assimilationactivities of polar heterotrophic bacterioplankton. Bio-geochemistry 110: 57−74
Sañudo-Wilhelmy SA, Cutter LS, Durazo R, Smail EA andothers (2012) Multiple B-vitamin depletion in large areasof the coastal ocean. Proc Natl Acad Sci USA 109: 14041−14045
Schattenhofer M, Wulf J, Kostadinov I, Glöckner FO,Zubkov MV, Fuchs BM (2011) Phylogenetic characterisa-tion of picoplanktonic populations with high and lownucleic acid content in the North Atlantic Ocean. SystAppl Microbiol 34: 470−475
Seymour JR, Simó R, Ahmed T, Stocker R (2010) Chemo -attraction to dimethylsulfoniopropionate throughout themarine microbial food web. Science 329: 342−345
Sievert SM, Kiene RK, Schulz-Vogt HN (2007) The sulfurcycle. Oceanography 20: 117−123
115

Aquat Microb Ecol 75: 103–116, 2015116
Slezak D, Brugger A, Herndl GJ (2001) Impact of solar radiation on the biological removal of dimethylsulfonio-propionate and dimethylsulfide in marine surfacewaters. Aquat Microb Ecol 25: 87−97
Stefels J (2000) Physiological aspects of the production andconversion of DMSP in marine algae and higher plants.J Sea Res 43: 183−197
Stefels J (2007) Sulfur in the marine environment. In: Hawkesford MJ, De Kok LJ (eds) Sulfur in plants: an eco-logical perspective. Springer, Dordrecht, p 77−90
Stefels J, Gieskes WWC, Dijkhuizen L (1996) Intriguingfunctionality of the production and conversion of DMSPin Phaeocystis sp. In: Kiene RP, Visscher PT, Keller MD,Kirst GO (eds) Biological and environmental chemistry ofDMSP and related sulfonium compounds. Plenum Press,New York, NY, p 307−313
Sunda W, Kieber DJ, Kiene RP, Huntsman S (2002) Anantioxidant function for DMSP and DMS in marine algae.Nature 418: 317−320
Suttle C, Chan A, Fuhrman J (1991) Dissolved free aminoacids in the Sargasso Sea: uptake and respiration rates,turnover times, and concentrations. Mar Ecol Prog Ser70: 189−199
Tripp HJ, Kitner JB, Schwalbach MS, Dacey JW, WilhelmLJ, Giovannoni SJ (2008) SAR11 marine bacteria requireexogenous reduced sulphur for growth. Nature 452: 741−744
Varaljay VA, Gifford SM, Wilson ST, Sharma S, Karl DM,Moran MA (2012) Bacterial dimethylsulfoniopropionatedegradation genes in the oligotrophic North Pacific Sub-tropical Gyre. Appl Environ Microbiol 78: 2775−2782
Vila M, Simó R, Kiene RP, Pinhassi J, González JM, MoranMA, Pedrós-Alió C (2004) Use of microautoradiography
combined with fluorescence in situ hybridization todetermine dimethylsulfoniopropionate incorporation bymarine bacterioplankton taxa. Appl Environ Microbiol70: 4648−4657
Vila-Costa M, Gasol JM, Sharma S, Moran MA (2012)Community analysis of high and low nucleic acid con-taining bacteria in NW Mediterranean coastal watersusing 16S rDNA pyrosequencing. Environ Microbiol 14: 1390−1402
Welsh DT (2000) Ecological significance of compatiblesolute accumulation by micro-organisms: from singlecells to global climate. FEMS Microbiol Rev 24: 263−290
Wright RR, Hobbie JE (1966) Use of glucose and acetate bybacteria and algae in aquatic ecosystems. Ecology 47: 447−464
Zubkov MV, Tarran GA (2005) Amino acid uptake ofProchlorococcus spp. in surface waters across the SouthAtlantic Subtropical Front. Aquat Microb Ecol 40: 241−249
Zubkov MV, Fuchs BM, Archer SD, Kiene RP, Amann R,Burkill PH (2001) Linking the composition of bacterio-plankton to rapid turnover of dissolved dimethylsul -phoniopropionate in an algal bloom in the North Sea.Environ Microbiol 3: 304−311
Zubkov MV, Fuchs BM, Tarran GA, Burkill PH, Amann R(2003) High rate of uptake of organic nitrogen com-pounds by Prochlorococcus cyanobacteria as a key totheir dominance in oligotrophic oceanic waters. ApplEnviron Microbiol 69: 1299−1304
Zubkov MV, Tarran GA, Fuchs BM (2004) Depth relatedamino acid uptake by Prochlorococcus cyanobacteria inthe Southern Atlantic tropical gyre. FEMS Microbiol Ecol50: 153−161
Editorial responsibility: Josep Gasol,Barcelona, Spain
Submitted: October 9, 2014; Accepted: March 10, 2015Proofs received from author(s): May 2, 2015
➤
➤
➤
➤
➤
➤
➤
➤
➤
➤
➤
➤
➤
➤
Related Documents