Aquaculture-associated factors in QPX disease of hard clams: density and seed source Susan E. Ford a, * , John N. Kraeuter a , Robert D. Barber a , George Mathis b a Haskin Shellfish Research Laboratory, Institute of Marine and Coastal Sciences and Cook College, Rutgers University, 6959 Miller Avenue, Port Norris, NJ 08349 USA b Mathis and Mathis Enterprises, Egg Harbor City, NJ 08215 USA Received 6 July 2001; received in revised form 4 September 2001; accepted 5 September 2001 Abstract Quahog Parasite Unknown (QPX), a recently discovered pathogen of hard clams, Mercenaria mercenaria, appears to be most prevalent in clams held in hatchery or nursery tanks or grown to market in culture parks. The persistent link with cultured clams indicated that culture practices might increase the susceptibility of clams to an opportunistic or facultative parasite. We investigated two hypotheses: (1) that increased density would accelerate the development of QPX infections and (2) that seed originating from nonlocal (i.e. another state) sources would be more susceptible than seed from local sources. There was a significant trend toward higher QPX levels at higher planting densities, but considerable variability in the data made it difficult to determine the effect of density with a high degree of confidence. During 1995 – 1998, 3-year classes of clams imported as seed from a South Carolina hatchery and grown at several sites in New Jersey acquired heavy QPX infections and suffered mortalities of 26% to 92%. Clams of the same age from New Jersey hatcheries that had been planted in adjacent plots for the same length of time acquired few or no detectable infections and experienced no unusual deaths. QPX seems to be widespread in clam growing waters from Canada to at least Virginia, but causes disease and mortality only in certain groups that may be disadvantaged in some way, perhaps from an unfavorable genotype– environment interaction. The fact that no mortalities have been reported in New Jersey since the purchase of South Carolina seed was curtailed indicates that the problem was localized to these clams and has neither spread nor 0044-8486/02/$ - see front matter D 2002 Elsevier Science B.V. All rights reserved. PII:S0044-8486(01)00795-5 * Corresponding author. Tel.: +1-856-785-0074; fax: +1-856-785-1544. E-mail address: [email protected] (S.E. Ford). www.elsevier.com/locate/aqua-online Aquaculture 208 (2002) 23 – 38

Welcome message from author
This document is posted to help you gain knowledge. Please leave a comment to let me know what you think about it! Share it to your friends and learn new things together.
Transcript

Aquaculture-associated factors in QPX disease of
hard clams: density and seed source
Susan E. Ford a,*, John N. Kraeuter a, Robert D. Barber a,George Mathis b
aHaskin Shellfish Research Laboratory, Institute of Marine and Coastal Sciences and Cook College,
Rutgers University, 6959 Miller Avenue, Port Norris, NJ 08349 USAbMathis and Mathis Enterprises, Egg Harbor City, NJ 08215 USA
Received 6 July 2001; received in revised form 4 September 2001; accepted 5 September 2001
Abstract
Quahog Parasite Unknown (QPX), a recently discovered pathogen of hard clams, Mercenaria
mercenaria, appears to be most prevalent in clams held in hatchery or nursery tanks or grown to
market in culture parks. The persistent link with cultured clams indicated that culture practices might
increase the susceptibility of clams to an opportunistic or facultative parasite. We investigated two
hypotheses: (1) that increased density would accelerate the development of QPX infections and (2)
that seed originating from nonlocal (i.e. another state) sources would be more susceptible than seed
from local sources. There was a significant trend toward higher QPX levels at higher planting
densities, but considerable variability in the data made it difficult to determine the effect of density
with a high degree of confidence. During 1995–1998, 3-year classes of clams imported as seed from
a South Carolina hatchery and grown at several sites in New Jersey acquired heavy QPX infections
and suffered mortalities of 26% to 92%. Clams of the same age from New Jersey hatcheries that had
been planted in adjacent plots for the same length of time acquired few or no detectable infections
and experienced no unusual deaths. QPX seems to be widespread in clam growing waters from
Canada to at least Virginia, but causes disease and mortality only in certain groups that may be
disadvantaged in some way, perhaps from an unfavorable genotype–environment interaction. The
fact that no mortalities have been reported in New Jersey since the purchase of South Carolina seed
was curtailed indicates that the problem was localized to these clams and has neither spread nor
0044-8486/02/$ - see front matter D 2002 Elsevier Science B.V. All rights reserved.
PII: S0044 -8486 (01 )00795 -5
* Corresponding author. Tel.: +1-856-785-0074; fax: +1-856-785-1544.
E-mail address: [email protected] (S.E. Ford).
www.elsevier.com/locate/aqua-online
Aquaculture 208 (2002) 23–38

persisted to a noticeable extent. Nevertheless, the results underscore the potential dangers of using
nonlocal stocks in molluscan aquaculture. D 2002 Elsevier Science B.V. All rights reserved.
Keywords: Pathogen; Mercenaria; Importation; Transmission; Stress; Mollusc
1. Introduction
Hard clams, Mercenaria mercenaria, are native to the east coast of North America
from the Maritime Provinces of Canada to Florida, USA. For about the past 25 years, a
hatchery-based culture industry for this species has been responsible for an increasing
component of the overall production. The United States Department of Agriculture
(USDA, 2000) reported that clam aquaculture (mostly hard clam) on the US Atlantic
coast had a value of nearly US$38 million in 1998, the last year for which data are
available. Although difficult to assess from available statistics, the best estimate is that
aquaculture is responsible for 30% to 50% of the value of total hard clam landings.
Disease-caused losses have been rare in hard clam culture (Ford, 2001), but beginning
in 1989, an infectious agent, labeled QPX for Quahog Parasite Unknown, was associated
with high mortality of clams held in a hatchery in Prince Edward Island (PEI), Canada
(Whyte et al., 1994). Descriptions of protistan parasites associated with two earlier
mortalities, in PEI, Canada in the early 1960s and in Barnegat Bay, New Jersey, USA, in
the 1970s, indicated that the same, or similar, organisms were involved (Drinnan and
Henderson, 1963; unpublished report of the Haskin Shellfish Laboratory, 1977).
Subsequently, QPX or QPX-like organisms were found in Massachusetts and Virginia
(Ragone Calvo et al., 1998; Smolowitz et al., 1998) as well as in additional locations in
the Canadian maritime provinces (MacCallum and McGladdery, 2000). Sequence
analysis of the ssRNA gene of QPX places the organism in the phylum Labyrinthulo-
mycota (Maas et al., 1999), a group that is ubiquitous in marine and estuarine environ-
ments, but which has been associated with diseases in molluscs held or grown in captivity
(Polglase, 1980; McLean and Porter, 1982; Jones and O’Dor, 1983; Bower, 1987).
QPX appears to be most prevalent in cultured clams, in clams being held in the hatchery
or nursery, or occasionally in densely set natural populations. Anecdotal evidence that
imported seed was more susceptible than locally produced clams raised early questions as to
whether the parasite might be present in hatchery/nursery reared seed clams that are often
produced in one state and shipped to another. A 2-year survey of seed from hatcheries in six
states and in cultured clams during their first year of growout, examined by pathologists in
three laboratories, failed to show QPX or QPX-like organisms in standard tissue sections
(Ford et al., 1997). Although these results indicated that hatcheries are an unlikely source for
QPX, the persistent link with cultured clams indicated that culture practices might increase
the susceptibility of clams to an opportunistic or facultative parasite. To help answer this
question, we surveyed cultured and wild clams in three northeastern states and investigated
two hypotheses: (1) that increased density would accelerate the development of QPX
infections and (2) that seed originating from nonlocal (i.e. another state) sources would be
more susceptible than seed from local sources.
S.E. Ford et al. / Aquaculture 208 (2002) 23–3824

2. Materials and methods
2.1. Density experiment
Histological examination of clams (N = 20) being grown in a tidal marsh, tributary
creek of Great Bay, New Jersey in March 1997 showed a single clam with a light,
localized QPX infection. The stock, which was purchased at 1 mm from a hatchery in
South Carolina in 1995, had experienced an estimated 30% mortality in February 1997.
This group was selected for the density experiment to maximize the probability of QPX
infection pressure in the test. The clams, which were approximately 2 years old with a
mean (F S.E.M.) shell length of 32.0F 0.86 mm, were recovered and redeployed on July
25, 1997, at three densities (215, 430, and 860 clams m � 2) in a 3� 3 Latin Square
design. The densities are referred to as 1� , 2� and 4� , respectively. The lowest
figure approximates commercial density for this size clam. The Latin Square design was
implemented to account for possible inshore–offshore/upstream–downstream differen-
ces. Each of the nine plots was 1 m2 and delineated by PVC pipe. The plots were
separated from each other by a 30-cm-wide corridor and were covered with protective
netting. The entire Latin Square was replicated in two adjacent beds in the creek, which
was about 40 m wide at that location. One bed was intertidal in a sand substrate. The
second, just offshore, was subtidal in mud substrate. The former was considered a more
stressful environment for the clams because of the wider variation in temperature.
Temperature was recorded at the intertidal bed using a continuous temperature logger.
We did not measure salinity, but the normal range is between 20 and 30 ppt with most
readings being near 25 ppt (G. Mathis, personal records).
An initial sample of 50 clams haphazardly selected from those to be deployed was set
aside for size and condition index measurements, as described below; another 30 were
processed for histopathology. This sample represented Time 0 (July 25) for all exper-
imental groups (Table 1). On October 3, 1997, the plots were sampled for the first time.
Clams were collected by hand until at least nine live individuals had been obtained from
each plot. These and all dead clams encountered in the same grabs were returned to the
laboratory for size measurement and histopathology. The same procedure was followed in
the subtidal bed at a second sampling on November 29, 1997; however, all clams, dead and
alive, were removed from the intertidal bed at this time. The intertidal portion of the
experiment was terminated because intertidal clams do not always survive the winter at this
location. The subtidal bed was retained and sampled for the last time on May 20, 1998,
when all live and dead clams were removed. Final mortality was determined from live and
dead counts, adjusted for the interim samples removed, at the final sample dates when all
clams were removed from the beds. Interim mortalities were estimated from live and dead
counts of the samples removed for histology, but were not used in statistical analyses.
At each sampling, the shell length (longest dimension) of all live clams was measured
to the nearest 0.1 mm. The valves of dead clams were measured in October and
November. Nine individuals from each plot (27 per density per bed) were shucked,
examined visually for nodules or mantle-edge swelling (which can be associated with
QPX (Smolowitz et al., 1998)) and fixed in Davidson’s fixative. The tissues of dead and
dying clams (gapers) were also fixed. Additional measurements were obtained from 25
S.E. Ford et al. / Aquaculture 208 (2002) 23–38 25

live clams from each plot (75 per density per bed), where available, at the final sample
dates. Because of high mortality levels, sufficient clams were not available for both
condition index and histopathology in all plots in the May 1998 sample. Preference was
given to providing histological samples, but least five individuals were available for the
Table 1
Growth (meanF S.E.M.) and mortality statistics of clams in the density experiment
Mortalities are based on pooled live and dead counts for three plots in each density.
T0 (July 25, 1997) T1 (October 3, 1997) T2 (November 29, 1997) T3 (May 20, 1998)
Shell length (mm)
32.0 (0.86), N= 50
Intertidal
215 m� 2 38.3 (0.76), N= 28 38.2 (0.52), N = 75
430 m� 2 37.4 (0.85), N= 27 38.1 (0.51), N = 75
860 m� 2 37.9 (0.62), N= 28 38.7 (0.58), N = 75
Subtidal
215 m� 2 37.2 (0.74), N= 27 37.8 (0.91), N = 31 40.2 (0.84), N= 30
430 m� 2 38.2 (0.94), N= 28 38.0 (0.98), N = 29 44.1 (0.66), N= 45
860 m� 2 35.1 (0.62), N= 27 37.7 (0.82), N = 29 40.1 (0.69), N= 31
Dry meat weight (g)
0.323 (0.018), N= 50
Intertidal
215 m� 2 0.486 (0.019), N= 75
430 m� 2 0.508 (0.018), N= 75
860 m� 2 0.524 (0.019), N= 75
Subtidal
215 m� 2 0.408 (0.027), N= 30
430 m� 2 0.557 (0.027), N= 45
860 m� 2 0.405 (0.021), N= 31
Condition index
0.991 (0.045), N= 50
Intertidal
215 m� 2 1.244 (0.036), N= 75
430 m� 2 1.310 (0.034), N= 75
860 m� 2 1.354 (0.051), N= 75
Subtidal
215 m� 2 0.990 (0.049), N= 30
430 m� 2 1.239 (0.045), N= 45
860 m� 2 0.995 (0.036), N= 31
Percent mortality
Intertidal
215 m� 2 8.9 21.3
430 m� 2 13.6 28.5
860 m� 2 12.2 22.9
Subtidal
215 m� 2 17.7 11.4 87.8
430 m� 2 24.7 22.8 94.0
860 m� 2 20.2 21.4 93.6
S.E. Ford et al. / Aquaculture 208 (2002) 23–3826
additional assays from all plots, but one low-density plot. To facilitate analysis of the
Latin Square design, a mean from the other two low density plots was substituted for
length, dry meat weight, and CI for this plot. Clams for condition index determination
were measured for shell height, length, and width, then shucked. The meats were dried at
50 jC for at least a week, then weighed to the nearest 0.0001 g. A condition index was
calculated as the ratio of dry meat weight to shell length� 100.
2.2. Geographical distribution survey
From November 1996 to June 1999, hard clam samples (N = 18 to 50 individuals per
sample) were obtained from growers in New Jersey, New York, and Connecticut. Both wild
and cultured clams were examined in order to extend the known distribution of QPX
infections in the northeastern United States The clams were processed for histological
examination as described below.
2.3. Seed origin study
Five of the New Jersey samples collected for the geographical survey consisted of
cultured clams, produced in a South Carolina hatchery. They were being grown adjacent to
cultured clams from New Jersey hatcheries in several locations, and were reported by many
growers to be suffering high mortalities. The clams were processed for histological
examination as described below. In three of these cases, the grower collected all live and
dead clams from a plot, which allowed us to estimate mortality.
2.4. Histopathology
A 5-mm-thick transverse section, taken from the hinge to the ventral margin of each fixed
clam, was embedded in paraffin, processed into tissue sections, and stained using a
modification of the Masson’s trichrome stain (Humason, 1979). Each section was com-
pletely scanned for the presence of QPX and for other parasites and pathological conditions.
When present, QPX was identified as being in one of three body compartments: gill, mantle,
and visceral mass (digestive gland, intestinal tract, kidney, heart, foot, and gonad.) The
extent of infection was classified within each compartment as focal, multifocal, or diffuse,
and rated as 1, 2, or 3, respectively. The severity of the lesion was classified according to its
diameter as mild—less than 250 Am, moderate—between 250 and 700 Am, or severe—
greater than 700 Am, or diffuse or focally extensive, and scored as 1, 2, or 3, respectively. For
each tissue, an intensity score was computed as the product of the extent and the severity
ratings, and these were summed to calculate an overall score for the clam. The maximum
possible score for an individual was 27. A sample QPX intensity was calculated as the mean
score for all individuals, including those with no detectable infections.
2.5. Statistical analysis
The data were analyzed for each sampling date using a General Linear Model ANOVA
that separated the experimental design into the components time, row, column, density,
S.E. Ford et al. / Aquaculture 208 (2002) 23–38 27
and bed location. Analysis was conducted on length, dry meat weight, condition index,
prevalence, sample intensity, and mortality. Percent mortality and prevalence were arcsine
transformed before analysis. Differences were considered significant at a = 0.05. In only
one case (CI for row only) was there any row or column effect or interaction between rows
and columns, indicating that position within the bed was not important. Means of
significant ANOVA effects were compared by the Tukey or LSD tests. A regression
analysis was also performed to identify a possible trend between increased density and
QPX levels.
3. Results
3.1. Density experiment
3.1.1. Temperature
Temperature at the late July deployment was about 25 jC. Over the next month, the
mean remained about 25 jC, but with spikes up to 28–30 jC during daily low tide and
lows of 22–24 jC at high tide. Although we did not deploy a temperature logger in the
subtidal bed, temperatures near the surface of the intertidal site during low tide in mid day
are several degree warmer than the water. In early September, temperatures began
gradually decreasing to between 5 and 6 jC when the late November sample was
collected. The recorder was lost over the winter, but temperatures at the intertidal site
typically approach or reach 0 jC for a few weeks in mid winter, then begin to rise in early
February and reach 20–22 jC by late May, when the final sample was taken.
3.1.2. Growth and condition index
Mean shell length increased from 32 mm at the end of July to 38 mm at the first
sampling in early October, then changed little through November (Table 1). By May, it had
increased to 42 mm, suggesting either spring growth or a differential mortality of small
individuals over winter (see mortality below). There were no effects of bed location or
density at any date. Dead clams were significantly smaller than live clams in the October
and November samples (mean shell length for pooled dates = 32.5F 3.1 vs. 37.5F 4.5
mm, p < 0.0001). Dry meat weight increased over time from a mean of 0.32 g at planting
to 0.51 g in November (intertidal bed) and 0.48 g in May (subtidal bed) (Table 1), but was
not affected by location or density.
Mean condition index at all densities increased significantly between the initial, July
sample (0.991) and the final sample of the intertidal bed in late November (1.302), but the
May subtidal sample (1.075) was the same as the July sample (Table 1). Condition index
was not affected by density or bed location in any sample.
3.1.3. Mortality
Between deployment and the November terminal sample of the intertidal bed, 21% to
29% of the clams died, and the interim grab sample of the subtidal bed indicated similar
values in the subtidal bed (Table 1). The presence of numerous gapers in samples from
both beds indicated an ongoing mortality, which continued in the remaining subtidal bed
S.E. Ford et al. / Aquaculture 208 (2002) 23–3828
and elevated the total mortality to 88% to 94% by May. There was no significant effect of
density on final mortality in either bed.
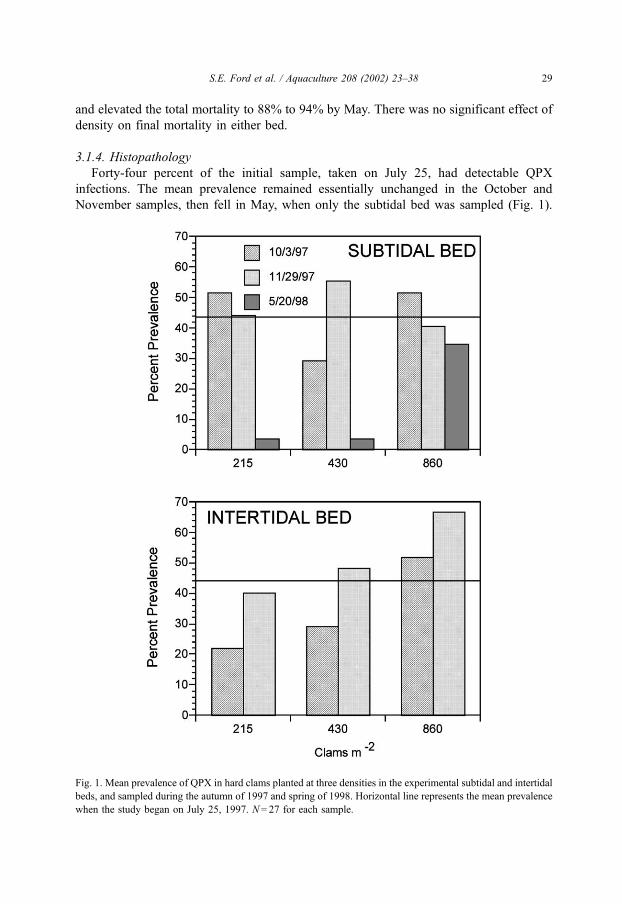
3.1.4. Histopathology
Forty-four percent of the initial sample, taken on July 25, had detectable QPX
infections. The mean prevalence remained essentially unchanged in the October and
November samples, then fell in May, when only the subtidal bed was sampled (Fig. 1).
Fig. 1. Mean prevalence of QPX in hard clams planted at three densities in the experimental subtidal and intertidal
beds, and sampled during the autumn of 1997 and spring of 1998. Horizontal line represents the mean prevalence
when the study began on July 25, 1997. N= 27 for each sample.
S.E. Ford et al. / Aquaculture 208 (2002) 23–38 29
There was no statistical effect of density or bed location in the autumn 1997 samples, even
though there was a trend toward higher prevalence with increasing density in the intertidal
bed (Fig. 1). A similar pattern was present in May 1998 sample of the subtidal bed, in
which prevalence in the 1� and 2� clams was markedly lower than it had been the
previous autumn, whereas that in the 4� clams was similar to the autumn level, and
significantly ( p = 0.017) higher than in the 1� and 2� plots.
In both beds and at all densities, sample intensity increased several fold during the late
summer and autumn, but showed no bed-location effect. It then decreased in May in the
subtidal bed (Fig. 2). Density had no effect in October or November, but was onlymarginally
insignificant ( p = 0.076) in the November intertidal bed. In spite of the marginally
insignificant ANOVA, the LSD (T) analysis of the sample means suggested an intensity
difference between the 4� (4.6) and 1� (1.8) density plots, but both were statistically the
same as the 2� density (2.6). At the final sample in May, the density effect mirrored that of
the November intertidal sample except that it was significant ( p = 0.048) in the ANOVA.
The LSD (T) test showed that the 4� clams had significantly higher infection levels than
did the 1� and 2� clams, whichwere the same (Fig. 2).We used linear regression analysis
to further examine the apparent trends between density and QPX sample intensity in the
November and May samples. The regression was significant for the November intertidal
( p = 0.018, r2 = 0.574) and the May subtidal ( p = 0.012, r2 = 0.619) samples, but not for the
November subtidal bed.
The appearance of QPX parasites and the lesions they caused in clam tissues resembled
that described earlier, including an intense host response (Ragone Calvo et al., 1998;
Smolowitz et al., 1998). Like Ragone Calvo et al. (1998) in Virginia, we did not see the
nodules or mantle swelling reported by Smolowitz et al. (1998) in Massachusetts. The
mantle was the tissue most often infected, although prevalences in the gill were equally high
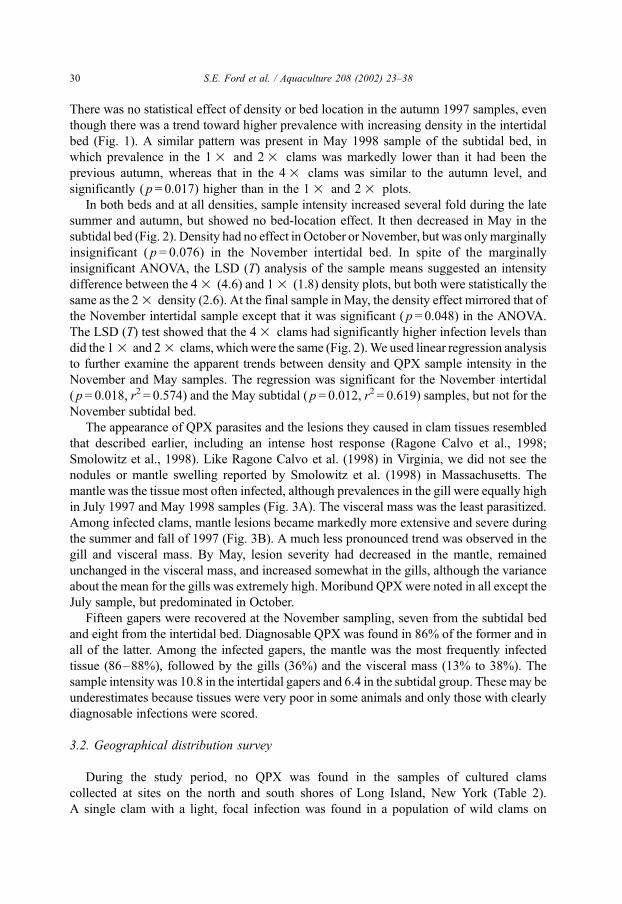
in July 1997 and May 1998 samples (Fig. 3A). The visceral mass was the least parasitized.
Among infected clams, mantle lesions became markedly more extensive and severe during
the summer and fall of 1997 (Fig. 3B). A much less pronounced trend was observed in the
gill and visceral mass. By May, lesion severity had decreased in the mantle, remained
unchanged in the visceral mass, and increased somewhat in the gills, although the variance
about the mean for the gills was extremely high. Moribund QPX were noted in all except the
July sample, but predominated in October.
Fifteen gapers were recovered at the November sampling, seven from the subtidal bed
and eight from the intertidal bed. Diagnosable QPX was found in 86% of the former and in
all of the latter. Among the infected gapers, the mantle was the most frequently infected
tissue (86–88%), followed by the gills (36%) and the visceral mass (13% to 38%). The
sample intensity was 10.8 in the intertidal gapers and 6.4 in the subtidal group. These may be
underestimates because tissues were very poor in some animals and only those with clearly
diagnosable infections were scored.
3.2. Geographical distribution survey
During the study period, no QPX was found in the samples of cultured clams
collected at sites on the north and south shores of Long Island, New York (Table 2).
A single clam with a light, focal infection was found in a population of wild clams on
S.E. Ford et al. / Aquaculture 208 (2002) 23–3830

the Connecticut shore of Long Island Sound. The results of New Jersey clam analyses
are presented below.
3.3. Seed origin study
Of the 15 samples collected in New Jersey, all of which were cultured clams, 10 were
produced in New Jersey hatcheries and the remainder came from a hatchery in South
Fig. 2. MeanF S.E.M. sample intensity of QPX in hard clams planted at three densities in the experimental
subtidal and intertidal beds, and sampled during the autumn of 1997 and spring of 1998. Horizontal line
represents the mean prevalence when the study began on July 25, 1997. N = 27 for each sample.
S.E. Ford et al. / Aquaculture 208 (2002) 23–38 31
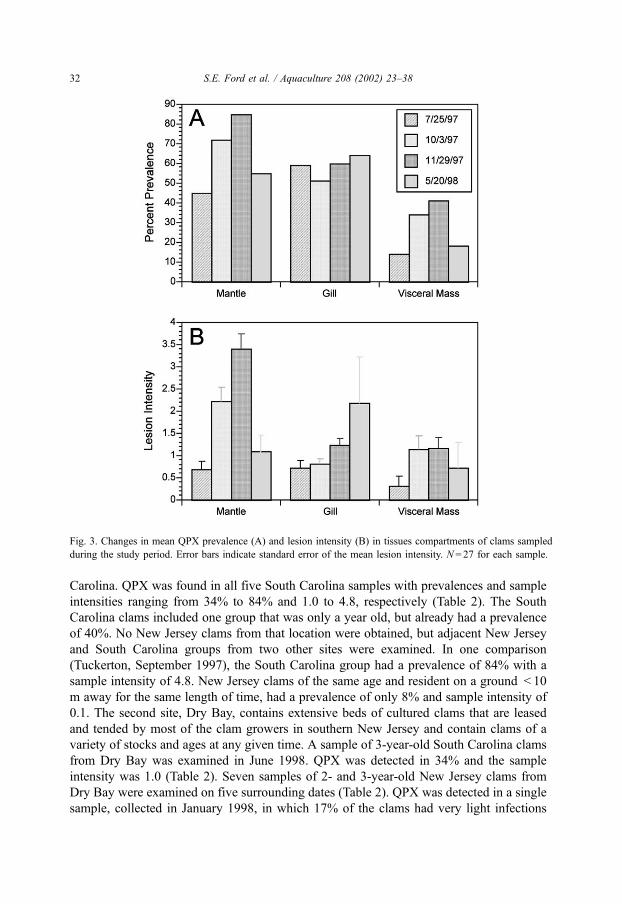
Carolina. QPX was found in all five South Carolina samples with prevalences and sample
intensities ranging from 34% to 84% and 1.0 to 4.8, respectively (Table 2). The South
Carolina clams included one group that was only a year old, but already had a prevalence
of 40%. No New Jersey clams from that location were obtained, but adjacent New Jersey
and South Carolina groups from two other sites were examined. In one comparison
(Tuckerton, September 1997), the South Carolina group had a prevalence of 84% with a
sample intensity of 4.8. New Jersey clams of the same age and resident on a ground < 10
m away for the same length of time, had a prevalence of only 8% and sample intensity of
0.1. The second site, Dry Bay, contains extensive beds of cultured clams that are leased
and tended by most of the clam growers in southern New Jersey and contain clams of a
variety of stocks and ages at any given time. A sample of 3-year-old South Carolina clams
from Dry Bay was examined in June 1998. QPX was detected in 34% and the sample
intensity was 1.0 (Table 2). Seven samples of 2- and 3-year-old New Jersey clams from
Dry Bay were examined on five surrounding dates (Table 2). QPX was detected in a single
sample, collected in January 1998, in which 17% of the clams had very light infections
Fig. 3. Changes in mean QPX prevalence (A) and lesion intensity (B) in tissues compartments of clams sampled
during the study period. Error bars indicate standard error of the mean lesion intensity. N = 27 for each sample.
S.E. Ford et al. / Aquaculture 208 (2002) 23–3832
(sample intensity = 0.2). From counts of live and dead clams submitted by growers in June
and July 1998, we estimated mortality to range from 26% to 92% in the South Carolina
groups. Based on the density experiment results, we conclude that this mortality had
occurred since the previous autumn. No unusual mortalities were reported in New Jersey
clams at any location.
4. Discussion
Density has been proposed as a possible factor in QPX infections because of the strong
association between QPX and cultured clams, which are likely to be maintained at higher
densities than they are in nature (Whyte et al., 1994; Ragone Calvo et al., 1998; Smolowitz
et al., 1998; MacCallum and McGladdery, 2000). Density could increase infections in two
ways: by increasing transmission rates or by posing a stress to clams that would increase
susceptibility (Brown, 1987; Hofmann et al., 1995; Peterson, 2001). At the final samplings
of both intertidal and subtidal beds, we found a significant positive correlation between
Table 2
QPX levels in hard clams collected from three states during the study period
In New Jersey, the clam seed was originally from New Jersey and South Carolina hatcheries. In addition to these
South Carolina groups, the clams in the density experiment were from the South Carolina hatchery.
Date State Location Hatchery
location
Year
class
Sample
size
Percent
prevalence
Sample
intensity
5/8/96 NJ Dry Bay New Jersey f 1993 50 0.0 0.00
11/21/96 NJ Dry Bay New Jersey 1995 18 0.0 0.00
11/21/96 NJ Dry Bay New Jersey 1995 20 0.0 0.00
3/13/97 NJ Dry Bay New Jersey 1995 20 0.0 0.00
3/13/97 NJ Dry Bay New Jersey 1995 20 0.0 0.00
3/27/97 NJ Tuckerton New Jersey f 1994 50 0.0 0.00
9/29/97 NJ Tuckerton New Jersey 1995 24 8.3 0.08
4/23/98 NJ Dry Bay New Jersey 1995 25 0.0 0.00
1/19/99 NJ Dry Bay New Jersey 1995 35 17.1 0.17
6/13/99 NJ Dry Bay New Jersey 1995 35 0.0 0.00
9/29/97 NJ Tuckerton South Carolina 1995 25 84.0 4.80
6/8/98 NJ Dry Bay South Carolina 1995 35 34.3 0.97
6/19/98 NJ Steelmans Bay South Carolina 1996 35 65.7 0.89
7/16/98 NJ Risley Channel South Carolina 1996 26 57.7 3.19
7/16/98 NJ Risley Channel South Carolina 1997 25 40.0 2.24
1/28/97 NY Great South Bay Wild clams mixed 50 0.0 0.00
12/2/97 NY Great South Bay New York 1993–1996 35 0.0 0.00
5/26/98 NY Great South Bay New York 1993–1996 35 0.0 0.00
11/11/97 NY Oyster Bay New York 1995 34 0.0 0.00
5/26/98 NY Oyster Bay New York 1995 35 0.0 0.00
1/25/99 NY Oyster Bay New York 1995 35 0.0 0.00
5/25/99 NY Oyster Bay New York 1995 35 0.0 0.00
11/11/97 CT Long Island Sound Wild clams mixed 35 0.0 0.00
6/16/98 CT Long Island Sound Wild clams mixed 35 2.9 0.06
1/12/99 CT Long Island Sound Wild clams mixed 35 0.0 0.00
5/20/99 CT Long Island Sound Wild clams mixed 35 0.0 0.00
S.E. Ford et al. / Aquaculture 208 (2002) 23–38 33

density and sample intensity. It is interesting that this trend developed first in the intertidal
plot, which was considered to be more stressful to the clams. The clams were already
infected at the start of the study and the correlation was due primarily to the development
of heavier infections, which might be associated with stress, rather than to a greater
number of new infections, which would be associated with transmission. This additional
stress has not been quantified, but intertidal clams are exposed longer at low tide, have less
time to feed, and experience more extreme temperature fluctuations. For instance, hard
clams pumping rate, oxygen consumption and growth rate peak at about 25 jC (Grizzle et
al., 2001) and summer temperatures at the intertidal site often exceeded this value by up to
5 jC. On the other hand, we found no evidence that increased density affected any other
measured parameter, as has been the case with most other hard clam studies (Fegley,
2001). Although our data did not always show statistical associations between QPX levels
and density in the ANOVAs, the statistically significant correlations that we report are
consistent with an hypothesis that a combination of stress (high temperature), or more
effective transmission (high density), or both favored the development of more intense
infections.
Smolowitz et al. (1998) reported that QPX-infected clams grew more slowly and had a
lower condition index than uninfected animals and, in our study, dead and dying clams,
which had very heavy QPX infections, were significantly smaller than living ones. We
were not, however, able to demonstrate a correlation of sample condition index with either
QPX or density. Condition index is often used as an index to the metabolic condition of a
bivalve and is related to the quantity of glycogen stored or the amount of gametes
produced (Gabbott and Stephenson, 1974; Mann, 1978; Soniat and Ray, 1985). The
decline in condition index of clams between November and May could have been
influenced by QPX, but normal seasonal variation, including spawning in the late spring
and early summer, could also have played a role (Peterson and Fegley, 1986), especially
since intense QPX infections in the fall did not diminish this measure. Although we did not
quantify gonadal condition, most clams contained moderate to abundant amounts of eggs
or sperm in November, whereas about half were spawned out in May. Analysis of infection
intensity and condition index on the same individuals is perhaps the most convincing way
to demonstrate the effect of disease on condition of molluscs (Barber et al., 1988; Rogan et
al., 1991). Even though we could not show that QPX infection influenced metabolic
condition, the association of high infection levels with ongoing and subsequent mortality
and the fact that dead and dying clams had much more advanced infections than live clams
collected at the same date, and the fact that no other pathogen was prevalent in the clams,
supports the conclusion that QPX was the immediate cause of death of infected clams.
High infection prevalence and intensity in the mantle and gills (Ragone Calvo et al.,
1998; Smolowitz et al., 1998; MacCallum and McGladdery, 2000; this study) suggests that
they are the portals of entry for QPX. In fact, members of the phylum Labyrinthulomycota,
including QPX-like organisms, commonly inhabit the pallial fluid of bivalves, which bathe
these organs (Perkins, 1973; Bacon et al., 1999). The massive hemocyte accumulations
around QPX and the failure of parasites to become dispersed throughout the tissues over
time suggests that the hemocyte response may limit the spread of QPX within the clam
(Smolowitz et al., 1998), even though it may not be successful in preventing death. Even
in dead clams, infections predominated in the mantle, indicating that relatively localized,
S.E. Ford et al. / Aquaculture 208 (2002) 23–3834
albeit severe, lesions became lethal. This pattern contrasts with that of other molluscan
microparasites, which are spread via the circulatory system and become fairly evenly
distributed throughout the tissues as infections intensify and become lethal (Balouet et al.,
1983; Hine, 1991; Ford and Tripp, 1996; Blackbourne et al., 1998).
Our most significant finding was that clams purchased as seed from a South Carolina
hatchery and planted in New Jersey consistently had high QPX prevalences and
intensities, and experienced heavy mortalities, whereas groups from New Jersey hatch-
eries, which were the same age and had been planted in adjacent plots for the same length
of time, had few or no infections and little reported mortality. The broodstock used by New
Jersey hatcheries has been a mixture of stocks derived from hatcheries in Maine,
Massachusetts, and Virginia that have been backcrossed with native New Jersey stocks.
That used by the South Carolina hatchery was a mixture of stocks imported from several
other states, including Massachusetts, Virginia, and South Carolina. Thus, neither the New
Jersey nor the South Carolina seed was obtained solely from local broodstock and it is
impossible to definitely state what percentage of the mixture was local. In fact, both
groups were derived from broodstocks that ultimately came from many of the same
hatcheries. Although we cannot discount the possibility that QPX is imported in hatchery
produced seed, we believe the weight of evidence is against it (Ford et al., 1997). QPX
appears to be widespread in clams, including some wild stocks, in high salinity bays from
Virginia to the Maritime provinces of Canada (Ragone Calvo et al., 1998; Smolowitz et al.,
1998; MacCallum and McGladdery, 2000), although generally at low prevalence and
without causing noticeable mortality. To date, outbreaks of disease and mortality
associated with QPX have been localized and we found little or no detectable QPX in
most of the samples from New York or Connecticut. In New Jersey, QPX outbreaks were
clearly associated with out-of-state seed. Whether the problem is genetic or one of poor
acclimation, or some combination of the two, is unknown. The fact that QPX typically
does not appear in clams until they have been in the field for at least 1 year suggests that
acclimation is not the problem (Ford et al., 1997; Smolowitz et al., 1998). On the other
hand, the contribution of the same parental stocks to both the New Jersey and South
Carolina clams does not favor a strictly genetic explanation. Currently, we are participating
in a study in which clams from five geographic locations along the eastern United States
(Massachusetts to Florida), produced in the same hatchery, are being evaluated for growth,
survival, and QPX susceptibility at three sites (Massachusetts, New Jersey, and Virginia).
The result of this study should help answer these questions.
A recent QPX outbreak, apparently localized in clams from Florida being grown in
Virginia, adds to the evidence that imported clams can be highly susceptible to QPX (L.
Ragone-Calvo, Virginia Institute of Marine Science, personal communication, August
2001). Whatever the reason, these results illustrate the potential problems of using
nonlocally produced stocks, even when they appear to offer economic advantages. For
instance, New Jersey growers began buying South Carolina seed as early as 1993, but
large quantities were not purchased until 1995. They were bought because they were cheap
and could be obtained earlier in the year than could local seed. Since the 1996–1998 QPX
epizootics in South Carolina clams, however, New Jersey growers no longer purchase seed
from this source. On the other hand, hard clam seed, produced in New Jersey or in
southern hatcheries, are being moved to and from New Jersey and southern locations, as
S.E. Ford et al. / Aquaculture 208 (2002) 23–38 35

they have been for at least 20 years. These seed are presumably from stocks that have good
survival characteristics in New Jersey. The advantage to using the southern locations is
that seed grown or over-wintered there is larger when it is returned to New Jersey for
planting in the spring, which reduces loss to predation and other sources of mortality that
are size related (Kraeuter, 2001) and shortens time to market. Notwithstanding this
practice, no mortalities of the scale associated with the 1996–1998 QPX outbreak in
the South Carolina clams have been reported before or since.
High QPX levels were found in 3-year classes of South Carolina clams from four sites in
New Jersey. In at least two of these sites, New Jersey clams were planted within 10–20 m of
these heavily infected clams, yet acquired few or no detectable infections themselves. A
large number of growers experienced heavy mortality of South Carolina clams. Because
lease sites are restricted in New Jersey, they presumably had New Jersey clams planted
nearby and as far as we can ascertain, the latter did not experience excessive mortality. Our
data are consistent with findings in other areas that QPX is widespread in clam growing
waters, but causes disease and mortality only in certain groups that may be disadvantaged in
some way, perhaps including unfavorable genotype–environment interactions. The fact that
no mortalities have been reported in New Jersey since the purchase of South Carolina seed
was curtailed indicates that the problem was localized to these clams and has neither spread
nor persisted to a noticeable extent.
Acknowledgements
We are particularly indebted to those individuals who provided samples of their clams
for analysis. Without their cooperation, much of the ancillary data we are reporting would
not have been available and the picture of the QPX outbreak would have been less clear.
We also thank Dr. Roxanna Smolowitz for valuable insights into QPX dynamics and for
comments on the manuscript. This study was funded by Grant No: 96-38500-3032 from
the Northeastern Regional Aquaculture Center to Roxanna Smolowitz and SEF. This is
Contribution No. 2001-15 from the Institute of Marine Sciences, Rutgers University and
NJAES Publication No. 32405-3-01, supported by state funds.
References
Bacon, G.S., McGladdery, S.E., MacDonald, B.A., 1999. Quahog parasite X (‘‘QPX’’) of hard-shell clams,
Mercenaria mercenaria and M. mercenaria var. notata in Atlantic Canada: observations from wild and
cultured clams. J. Shellfish Res. 18, 295.
Balouet, G., Poder, M., Cahour, A., 1983. Haemocytic parasitosis: morphology and pathology of lesions in the
French flat oyster, Ostrea edulis. L. Aquaculture 34, 1–14.
Barber, B.J., Ford, S.E., Haskin, H.H., 1988. Effects of the parasite MSX (Haplosporidium nelsoni) on oyster
(Crassostrea virginica) energy metabolism: I. Condition index and relative fecundity. J. Shellfish Res. 7, 25–
31.
Blackbourne, J., Bower, S.M., Meyer, G.R., 1998. Perkinsus qugwadi sp. nov. (incertae sedis), a pathogenic
protoxoan parasite of Japanese scallops, Patinopecten yessoensis, cultured in British Columbia, Canada.
Can. J. Zool. 76, 942–953.
S.E. Ford et al. / Aquaculture 208 (2002) 23–3836

Bower, S.M., 1987. Labyrinthuloides haliotidis n. sp. (Protozoa: Labyrinthomorpha), a pathogenic parasite of
small juvenile abalone in a British Columbia mariculture facility. Can. J. Zool. 65, 1996–2007.
Brown, G., 1987. Modeling. In: Fuxa, J.R., Tanada, Y. (Eds.), Epizootiology of Insect Diseases. Wiley, New
York, pp. 43–68.
Drinnan, R.E., Henderson, E.B., 1963. 1962 mortalities and a possible disease organism in Neguac quahaugs.
Biological Station, St. Andrews, New Brunswick, Canada.
Fegley, S.E., 2001. Demographics and dynamics of hard clam populations. In: Kraeuter, J.N., Castagna, M.
(Eds.), The Biology of the Hard Clam, Mercenaria mercenaria (Linne). Elsevier, Amsterdam, pp. 383–422.
Ford, S.E., 2001. Pests, parasites, diseases, and defense mechanisms. In: Kraeuter, J.N., Castagna, M. (Eds.), The
Biology of the Hard Clam, Mercenaria mercenaria (Linne). Elsevier, Amsterdam, pp. 591–628.
Ford, S.E., Tripp, M.R., 1996. Diseases and defense mechanisms. In: Newell, R.I.E., Kennedy, V.S., Eble, A.F.
(Eds.), The Eastern Oyster Crassostrea virginica. Maryland Sea Grant College, College Park, MD, pp. 383–
450.
Ford, S.E., Smolowitz, R., Ragone-Calvo, L., Barber, R.D., Kraeuter, J.N., 1997. Evidence that QPX (Quahog
Parasite Unknown) is not present in hatchery-produced hard clam seed. J. Shellfish Res. 16, 519–521.
Gabbott, P.A., Stephenson, R.R., 1974. A note on the relationship between the dry weight condition index and the
glycogen content of adult oysters (Ostrea edulis L.) kept in the laboratory. J. Cons., Cons. Int. Explor. Mer.
35, 359–361.
Grizzle, R.E., Bricelj, V.M., Shumway, S.E., 2001. Physiological ecology of Mercenaria mercenaria. In:
Kraeuter, J.N., Castagna, M. (Eds.), Biology of the Hard Clam. Elsevier, Amsterdam, pp. 305–382.
Hine, P.M., 1991. The annual pattern of infection by Bonamia sp. in New Zealand flat oysters, Tiostrea chilensis.
Aquaculture 93, 241–251.
Hofmann, E.E., Powell, E.N., Klinck, J.M., Saunders, G., 1995. Modelling diseased oyster populations: I.
Modelling Perkinsus marinus infections in oysters. J. Shellfish Res. 14, 121–151.
Humason, G.L., 1979. Animal Tissue Techniques. W.H. Freeman, San Francisco.
Jones, G., O’Dor, R.K., 1983. Ultrastructural observations on a Thraustochytrid fungus parasitic in the gills of
squid (Illex illecebrosus Lesueur). J. Parasitol. 69, 903–911.
Kraeuter, J.N., 2001. Predators and predation. In: Kraeuter, J.N., Castagna, M. (Eds.), The Biology of the Hard
Clam, Mercenaria mercenaria (Linne). Elsevier, Amsterdam, pp. 441–589.
Maas, P.A.Y., Kleinschuster, S.J., Dykstra, M.J., Smolowitz, R., Parent, J., 1999. Molecular characterization of
QPX (Quahog Parasite Unknown), a pathogen of Mercenaria mercenaria. J. Shellfish Res. 18, 561–567.
MacCallum, G.S., McGladdery, S.E., 2000. Quahog Parasite Unknown (QPX) in the northern quahogMercenaria
mercenaria (Linnaeus, 1758) and M. mercenaria var. notata from Atlantic Canada, survey results from three
maritime provinces. J. Shellfish Res. 19, 43–50.
Mann, R., 1978. A comparison of morphometric, biochemical, and physiological indexes of condition in marine
bivalve molluscs. In: Thorp, J.H., Gibbons, J.W. (Eds.), Energy and Environmental Stress in Aquatic Systems.
Technical Information Center, U.S. Department of Energy, Springfield, VA, pp. 484–497.
McLean, N., Porter, D., 1982. The yellow spot disease of Tritonia diomedea Bergh, 1894 (Mollusca: Gastro-
poda; Nudibranchia): encapsulation of the Traustochytreaceous parasite by host amoebocytes. J. Parasitol.
68, 243–252.
Perkins, F.O., 1973. A new species of marine Labyrinthulid. Ark. Mikrobiol. 90, 1–17.
Peterson, C.H., 2001. Integrating nutritional physiology and ecology to explain interactions between physics and
biology in Mercenaria mercenaria. In: Kraeuter, J.N., Castagna, M. (Eds.), The Biology of the Hard Clam,
Mercenaria mercenaria (Linne). Elsevier, Amsterdam, pp. 423–439.
Peterson, C.H., Fegley, S.R., 1986. Seasonal allocation of resources to growth of shell, soma, and gonads in
Mercenaria mercenaria. Biol. Bull. 171, 597–610.
Polglase, J.L., 1980. A preliminary report on the Thraustochytrid(s) and Labyrinthulid(s) associated with a
pathological condition in the lesser octopus Eledone cirrhosa. Bot. Mar. 23, 699–706.
Ragone Calvo, L.M., Walker, J.G., Burreson, E.M., 1998. Prevalence and distribution of QPX, Quahog
Parasite Unknown, in hard clams, Mercenaria mercenaria, in Virginia, USA. Dis. Aquat. Org. 33, 209–
219.
Rogan, E., Culloty, S.C., Cross, T.F., Mulcahy, M.F., 1991. The detection of Bonamia ostreae (Pichot et al., 1980)
in frozen oysters (Ostrea edulis L.) and the effect of the parasite on condition. Aquaculture 97, 311–315.
S.E. Ford et al. / Aquaculture 208 (2002) 23–38 37

Smolowitz, R., Leavitt, D., Perkins, F., 1998. Observations of a protistan disease similar to QPX in Mercenaria
mercenaria (hard clams) from the coast of Massachusetts. J. Invertebr. Pathol. 71, 9–25.
Soniat, T.M., Ray, S.M., 1985. Relationships between possible available food and the composition, condition and
reproductive state of oysters from Galveston Bay, Texas. Contrib. Mar. Sci. 28, 109–121.
USDA, 2000. Census of Aquaculture 1998. US Department of Agriculture, Washington, DC.
Whyte, S.K., Cawthorn, R.J., McGladdery, S.E., 1994. QPX (Quahaug Parasite X) a pathogen of northern
quahaug Mercenaria mercenaria from the Gulf of St. Lawrence, Canada. Dis. Aquat. Org. 19, 129–136.
S.E. Ford et al. / Aquaculture 208 (2002) 23–3838
Related Documents