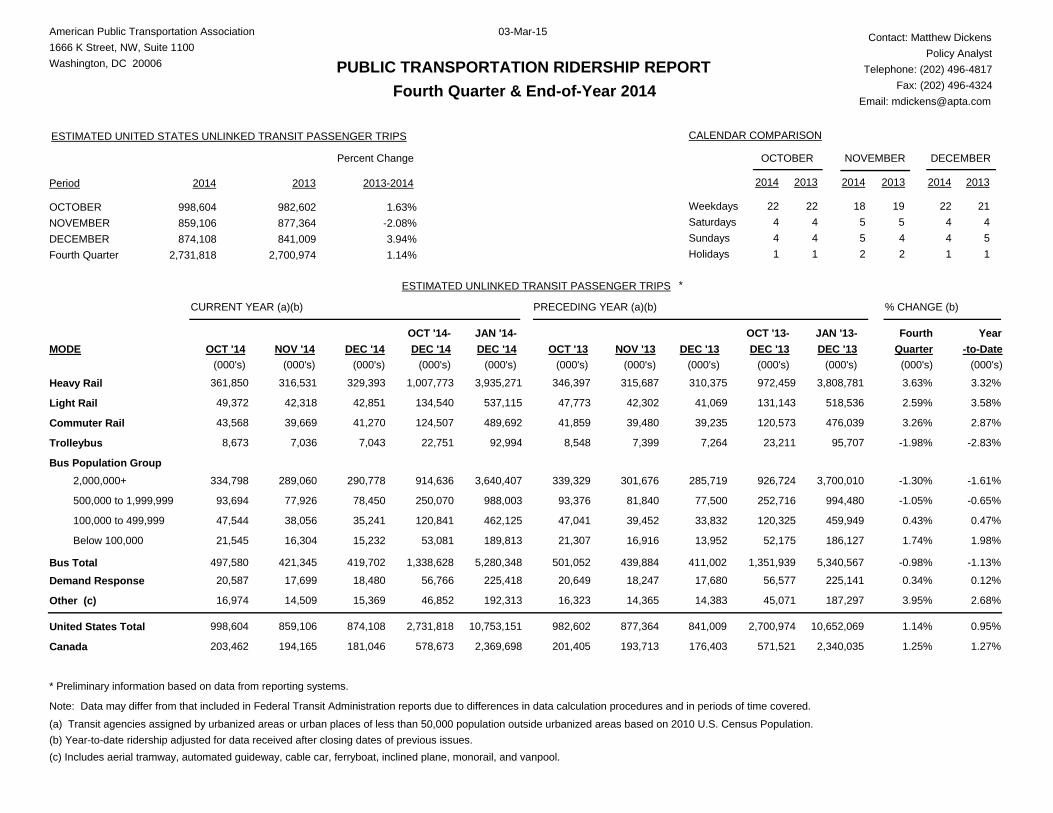
PUBLIC TRANSPORTATION RIDERSHIP REPORT American Public Transportation Association 1666 K Street, NW, Suite 1100 Washington, DC 20006 Fourth Quarter & End-of-Year 2014 Contact: Matthew Dickens Policy Analyst Telephone: (202) 496-4817 ESTIMATED UNITED STATES UNLINKED TRANSIT PASSENGER TRIPS Period 2014 2013 OCTOBER NOVEMBER DECEMBER CALENDAR COMPARISON OCTOBER NOVEMBER DECEMBER 2014 2013 2014 2013 2014 2013 Weekdays Saturdays Sundays Holidays Fourth Quarter ESTIMATED UNLINKED TRANSIT PASSENGER TRIPS CURRENT YEAR (a)(b) PRECEDING YEAR (a)(b) % CHANGE (b) 22 4 4 1 22 4 4 1 18 22 5 5 4 4 1 2 5 4 19 2 21 4 5 1 Percent Change 2013-2014 Fax: (202) 496-4324 Email: [email protected] 03-Mar-15 998,604 859,106 874,108 2,731,818 982,602 877,364 841,009 2,700,974 1.63% 1.14% -2.08% 3.94% * MODE OCT '14 NOV '14 DEC '14 OCT '14- DEC '14 OCT '13 NOV '13 DEC '13 OCT '13- DEC '13 Fourth Quarter Year -to-Date (000's) (000's) (000's) (000's) (000's) (000's) (000's) (000's) JAN '14- DEC '14 (000's) JAN '13- DEC '13 (000's) (000's) (000's) Note: Data may differ from that included in Federal Transit Administration reports due to differences in data calculation procedures and in periods of time covered. (a) Transit agencies assigned by urbanized areas or urban places of less than 50,000 population outside urbanized areas based on 2010 U.S. Census Population. (b) Year-to-date ridership adjusted for data received after closing dates of previous issues. (c) Includes aerial tramway, automated guideway, cable car, ferryboat, inclined plane, monorail, and vanpool. Bus Population Group Bus Total -1.13% 421,345 419,702 5,280,348 501,052 439,884 5,340,567 -0.98% 497,580 1,338,628 1,351,939 411,002 United States Total 0.95% 859,106 874,108 10,753,151 982,602 877,364 10,652,069 1.14% 998,604 2,731,818 2,700,974 841,009 * Preliminary information based on data from reporting systems. Heavy Rail 3.32% 316,531 329,393 3,935,271 346,397 315,687 310,375 3,808,781 3.63% 361,850 1,007,773 972,459 Light Rail 3.58% 42,318 42,851 537,115 47,773 42,302 41,069 518,536 2.59% 49,372 134,540 131,143 Commuter Rail 2.87% 39,669 41,270 489,692 41,859 39,480 39,235 476,039 3.26% 43,568 124,507 120,573 Trolleybus -2.83% 7,036 7,043 92,994 8,548 7,399 7,264 95,707 -1.98% 8,673 22,751 23,211 -1.61% 289,060 290,778 3,640,407 339,329 301,676 285,719 3,700,010 -1.30% 334,798 914,636 926,724 2,000,000+ -0.65% 77,926 78,450 988,003 93,376 81,840 77,500 994,480 -1.05% 93,694 250,070 252,716 500,000 to 1,999,999 0.47% 38,056 35,241 462,125 47,041 39,452 33,832 459,949 0.43% 47,544 120,841 120,325 100,000 to 499,999 1.98% 16,304 15,232 189,813 21,307 16,916 13,952 186,127 1.74% 21,545 53,081 52,175 Below 100,000 Demand Response 0.12% 17,699 18,480 225,418 20,649 18,247 17,680 225,141 0.34% 20,587 56,766 56,577 Other (c) 2.68% 14,509 15,369 192,313 16,323 14,365 14,383 187,297 3.95% 16,974 46,852 45,071 Canada 1.27% 194,165 181,046 2,369,698 201,405 193,713 176,403 2,340,035 1.25% 203,462 578,673 571,521

Welcome message from author
This document is posted to help you gain knowledge. Please leave a comment to let me know what you think about it! Share it to your friends and learn new things together.
Transcript
PUBLIC TRANSPORTATION RIDERSHIP REPORT
American Public Transportation Association1666 K Street, NW, Suite 1100Washington, DC 20006
Fourth Quarter & End-of-Year 2014
Contact: Matthew DickensPolicy Analyst
Telephone: (202) 496-4817
ESTIMATED UNITED STATES UNLINKED TRANSIT PASSENGER TRIPS
Period 2014 2013
OCTOBERNOVEMBERDECEMBER
CALENDAR COMPARISON
OCTOBER NOVEMBER DECEMBER
2014 2013 2014 2013 2014 2013
WeekdaysSaturdaysSundaysHolidaysFourth Quarter
ESTIMATED UNLINKED TRANSIT PASSENGER TRIPS
CURRENT YEAR (a)(b) PRECEDING YEAR (a)(b) % CHANGE (b)
22441
22441
18 2255
4412
54
19
2
21451
Percent Change
2013-2014
Fax: (202) 496-4324Email: [email protected]
03-Mar-15
998,604859,106874,108
2,731,818
982,602877,364841,009
2,700,974
1.63%
1.14%
-2.08%3.94%
*
MODE OCT '14 NOV '14 DEC '14OCT '14-DEC '14 OCT '13 NOV '13 DEC '13
OCT '13-DEC '13
FourthQuarter
Year-to-Date
(000's) (000's) (000's) (000's) (000's) (000's) (000's) (000's)
JAN '14-DEC '14
(000's)
JAN '13-DEC '13
(000's)(000's) (000's)
Note: Data may differ from that included in Federal Transit Administration reports due to differences in data calculation procedures and in periods of time covered.
(a) Transit agencies assigned by urbanized areas or urban places of less than 50,000 population outside urbanized areas based on 2010 U.S. Census Population.(b) Year-to-date ridership adjusted for data received after closing dates of previous issues.(c) Includes aerial tramway, automated guideway, cable car, ferryboat, inclined plane, monorail, and vanpool.
Bus Population Group
Bus Total -1.13%421,345 419,702 5,280,348 501,052 439,884 5,340,567 -0.98%497,580 1,338,628 1,351,939411,002
United States Total 0.95%859,106 874,108 10,753,151 982,602 877,364 10,652,069 1.14%998,604 2,731,818 2,700,974841,009
* Preliminary information based on data from reporting systems.
Heavy Rail 3.32%316,531 329,393 3,935,271 346,397 315,687 310,375 3,808,781 3.63%361,850 1,007,773 972,459
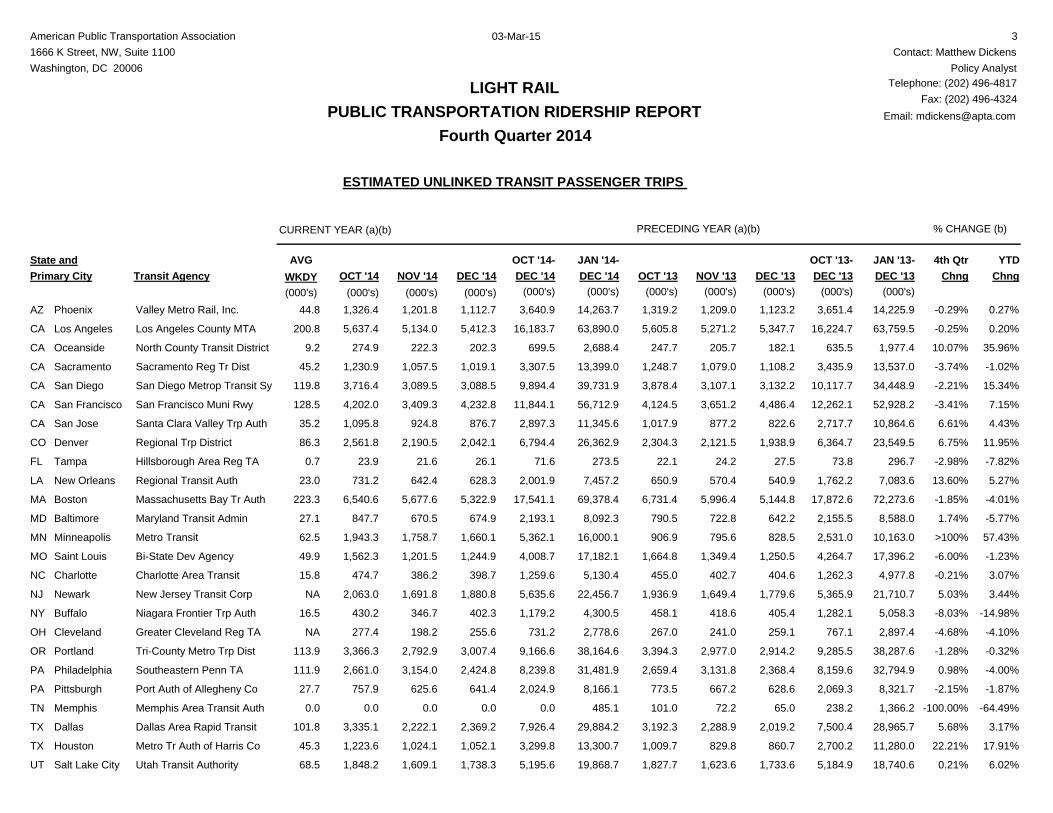
Light Rail 3.58%42,318 42,851 537,115 47,773 42,302 41,069 518,536 2.59%49,372 134,540 131,143
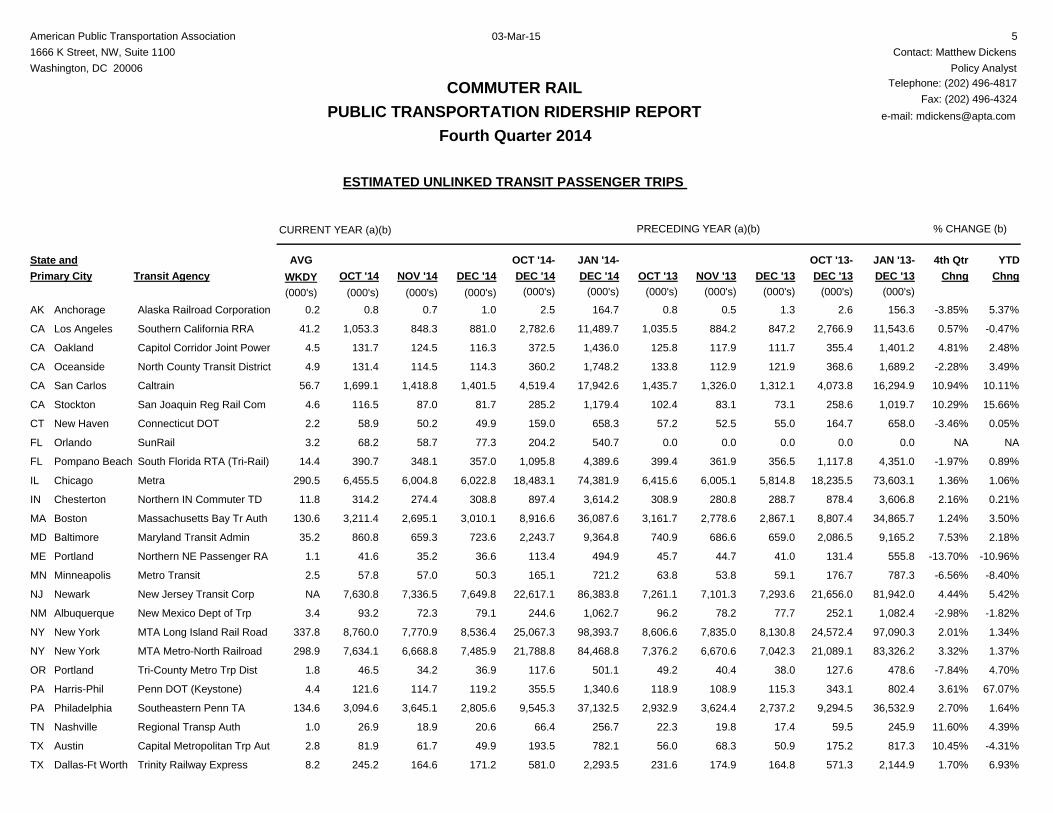
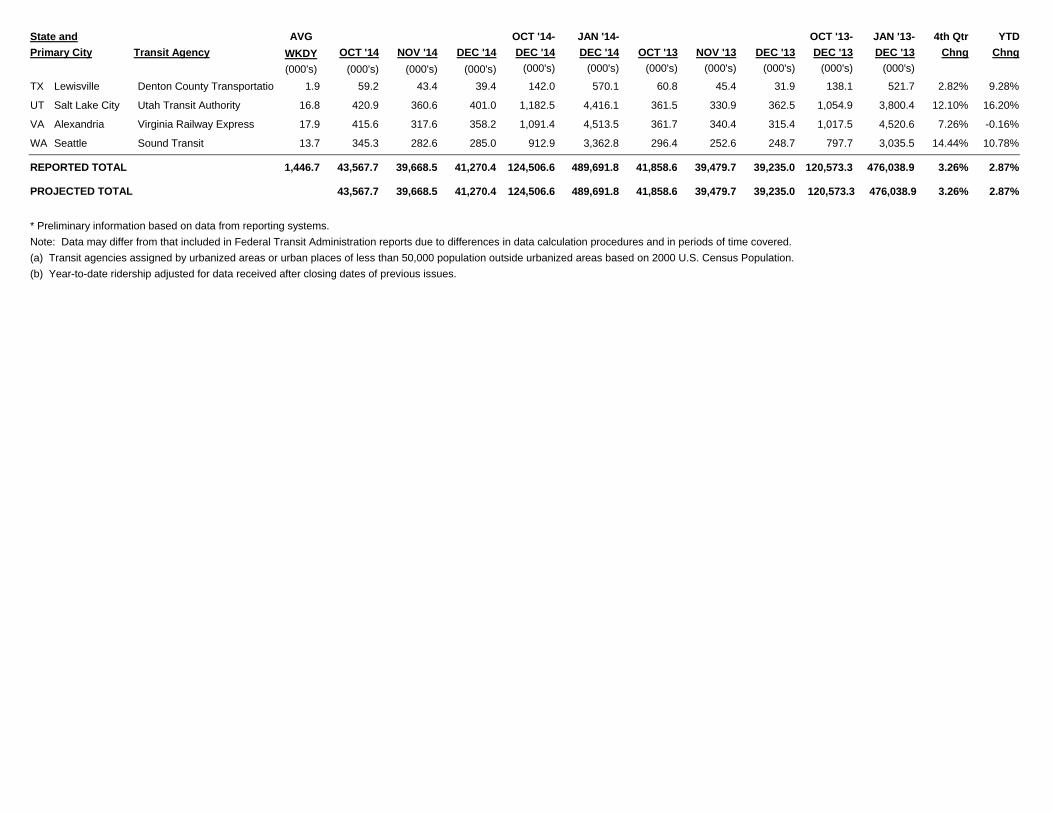
Commuter Rail 2.87%39,669 41,270 489,692 41,859 39,480 39,235 476,039 3.26%43,568 124,507 120,573
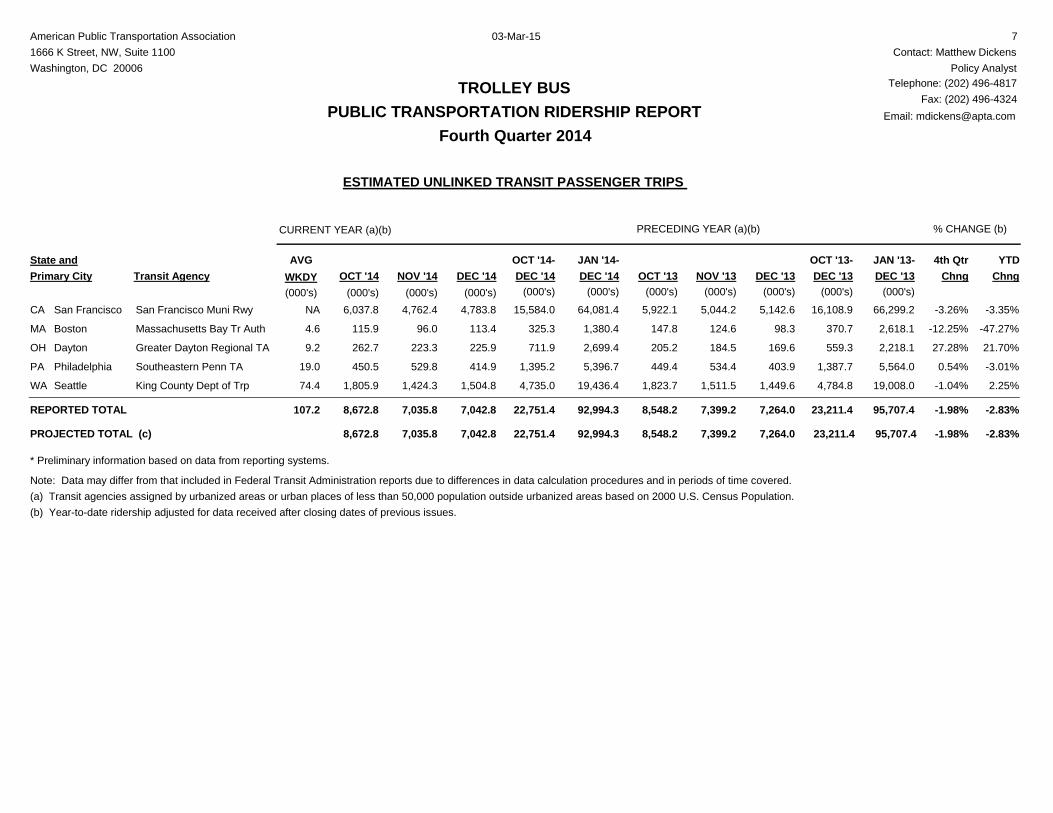
Trolleybus -2.83%7,036 7,043 92,994 8,548 7,399 7,264 95,707 -1.98%8,673 22,751 23,211
-1.61%289,060 290,778 3,640,407 339,329 301,676 285,719 3,700,010 -1.30%334,798 914,636 926,7242,000,000+
-0.65%77,926 78,450 988,003 93,376 81,840 77,500 994,480 -1.05%93,694 250,070 252,716500,000 to 1,999,999
0.47%38,056 35,241 462,125 47,041 39,452 33,832 459,949 0.43%47,544 120,841 120,325100,000 to 499,999
1.98%16,304 15,232 189,813 21,307 16,916 13,952 186,127 1.74%21,545 53,081 52,175Below 100,000
Demand Response 0.12%17,699 18,480 225,418 20,649 18,247 17,680 225,141 0.34%20,587 56,766 56,577
Other (c) 2.68%14,509 15,369 192,313 16,323 14,365 14,383 187,297 3.95%16,974 46,852 45,071
Canada 1.27%194,165 181,046 2,369,698 201,405 193,713 176,403 2,340,035 1.25%203,462 578,673 571,521

American Public Transportation Association1666 K Street, NW, Suite 1100Washington, DC 20006
Contact: Matthew DickensPolicy Analyst
Telephone: (202) 496-4817
PRECEDING YEAR (a)(b) % CHANGE (b)
Fax: (202) 496-4324
CURRENT YEAR (a)(b)
2
Email: [email protected] TRANSPORTATION RIDERSHIP REPORTFourth Quarter 2014
ESTIMATED UNLINKED TRANSIT PASSENGER TRIPS
HEAVY RAIL
03-Mar-15
OCT '14 NOV '14 DEC '14 DEC '14 NOV '13 DEC '13JAN '13-
DEC '134th Qtr
ChngYTD
Chng(000's) (000's) (000's) (000's) (000's) (000's) (000's)
JAN '14-
(000's)OCT '13Transit Agency
State andPrimary City
AVGWKDY(000's)
DEC '14OCT '14-
(000's)DEC '13
OCT '13-
(000's)
Los Angeles Los Angeles County MTA 4,291.2 3,938.6 4,136.1 4,629.5 4,285.5 4,335.548,724.7 51,030.7 -6.68% -4.52%CA 153.0 12,365.9 13,250.5
San Francisco San Francisco Bay Area RTD 12,563.6 10,361.5 10,769.8 10,007.4 10,100.4 10,196.1132,314.2 124,747.3 11.19% 6.07%CA 447.2 33,694.9 30,303.9
Washington Washington Metro Area TA 24,698.9 20,160.8 20,565.1 22,568.6 20,536.0 19,205.9271,160.0 273,464.8 5.00% -0.84%DC 829.2 65,424.8 62,310.5
Miami Miami-Dade Transit Agency 1,976.1 1,706.4 1,810.8 1,918.5 1,723.2 1,722.121,722.1 21,275.4 2.41% 2.10%FL 74.6 5,493.3 5,363.8
Atlanta Metro Atlanta Rapid Tr Auth 6,752.7 5,548.0 5,846.5 6,376.0 5,527.1 5,393.771,504.6 69,905.4 4.92% 2.29%GA 232.1 18,147.2 17,296.8
Chicago Chicago Transit Authority 22,443.5 18,760.5 18,365.8 21,394.7 19,216.3 17,508.7238,100.2 228,684.4 2.50% 4.12%IL 753.6 59,569.8 58,119.7
Boston Massachusetts Bay Tr Auth 16,576.5 14,029.0 13,869.0 15,692.3 13,873.1 12,803.9174,820.2 166,672.8 4.97% 4.89%MA 560.5 44,474.5 42,369.3
Baltimore Maryland Transit Admin 1,366.0 1,099.1 1,152.1 1,362.3 1,195.1 1,130.814,555.1 15,034.4 -1.93% -3.19%MD 48.0 3,617.2 3,688.2
Jersey City Port Authority of NY & NJ 6,734.8 5,639.2 6,079.5 6,776.9 5,859.6 5,884.173,649.0 72,798.5 -0.36% 1.17%NJ 250.7 18,453.5 18,520.6
Lindenwold Port Authority Transit Corp 920.9 773.9 814.6 954.8 836.6 812.510,007.3 10,542.2 -3.63% -5.07%NJ 35.3 2,509.4 2,603.9
New York MTA New York City Transit 253,204.6 223,055.6 236,759.7 244,414.1 220,975.1 222,317.02,758,485.0 2,651,804.6 3.68% 4.02%NY 9,060.8 713,019.9 687,706.2
New York MTA Staten Island Railway 712.0 582.1 611.7 703.4 582.2 574.77,228.6 6,985.1 2.45% 3.49%NY 26.9 1,905.8 1,860.3
Cleveland Greater Cleveland Reg TA 597.1 524.9 529.1 596.7 548.8 531.36,203.2 6,422.8 -1.53% -3.42%OH NA 1,651.1 1,676.8
Philadelphia Southeastern Penn TA 8,100.1 9,668.9 7,451.7 7,853.9 9,556.8 7,172.296,709.4 98,438.0 2.59% -1.76%PA 342.6 25,220.7 24,582.9
San Juan Puerto Rico DOT 912.0 682.0 631.0 1,148.2 871.4 786.410,087.5 10,974.5 -20.71% -8.08%PR 33.7 2,225.0 2,806.0
1,007,773.0REPORTED TOTAL 316,530.5 329,392.5 3,935,271.1 346,397.3 315,687.2 3,808,780.9 3.63% 3.32%
PROJECTED TOTAL
310,374.9361,850.012,848.3 972,459.4
Note: Data may differ from that included in Federal Transit Administration reports due to differences in data calculation procedures and in periods of time covered.(a) Transit agencies assigned by urbanized areas or urban places of less than 50,000 population outside urbanized areas based on 2000 U.S. Census Population.(b) Year-to-date ridership adjusted for data received after closing dates of previous issues.
* Preliminary information based on data from reporting systems.
3,935,271.11,007,773.0 3.32%316,530.5 329,392.5 346,397.3 315,687.2 310,374.9 3,808,780.9 3.63%361,850.0 972,459.4
American Public Transportation Association1666 K Street, NW, Suite 1100Washington, DC 20006
Contact: Matthew DickensPolicy Analyst
Telephone: (202) 496-4817
PRECEDING YEAR (a)(b) % CHANGE (b)
Fax: (202) 496-4324
CURRENT YEAR (a)(b)
3
Email: [email protected] TRANSPORTATION RIDERSHIP REPORTFourth Quarter 2014
ESTIMATED UNLINKED TRANSIT PASSENGER TRIPS
LIGHT RAIL
03-Mar-15
OCT '14 NOV '14 DEC '14 DEC '14 NOV '13 DEC '13JAN '13-
DEC '134th Qtr
ChngYTD
Chng(000's) (000's) (000's) (000's) (000's) (000's) (000's)
JAN '14-
(000's)OCT '13Transit Agency
State andPrimary City
AVGWKDY(000's)
DEC '14OCT '14-
(000's)DEC '13
OCT '13-
(000's)
Valley Metro Rail, Inc. 1,326.4 1,201.8 1,112.7 1,319.2 1,209.0 1,123.214,263.7 14,225.9 -0.29% 0.27%AZ 44.8Phoenix 3,640.9 3,651.4
Los Angeles County MTA 5,637.4 5,134.0 5,412.3 5,605.8 5,271.2 5,347.763,890.0 63,759.5 -0.25% 0.20%CA 200.8Los Angeles 16,183.7 16,224.7
North County Transit District 274.9 222.3 202.3 247.7 205.7 182.12,688.4 1,977.4 10.07% 35.96%CA 9.2Oceanside 699.5 635.5
Sacramento Reg Tr Dist 1,230.9 1,057.5 1,019.1 1,248.7 1,079.0 1,108.213,399.0 13,537.0 -3.74% -1.02%CA 45.2Sacramento 3,307.5 3,435.9
San Diego Metrop Transit Sy 3,716.4 3,089.5 3,088.5 3,878.4 3,107.1 3,132.239,731.9 34,448.9 -2.21% 15.34%CA 119.8San Diego 9,894.4 10,117.7
San Francisco Muni Rwy 4,202.0 3,409.3 4,232.8 4,124.5 3,651.2 4,486.456,712.9 52,928.2 -3.41% 7.15%CA 128.5San Francisco 11,844.1 12,262.1
Santa Clara Valley Trp Auth 1,095.8 924.8 876.7 1,017.9 877.2 822.611,345.6 10,864.6 6.61% 4.43%CA 35.2San Jose 2,897.3 2,717.7
Regional Trp District 2,561.8 2,190.5 2,042.1 2,304.3 2,121.5 1,938.926,362.9 23,549.5 6.75% 11.95%CO 86.3Denver 6,794.4 6,364.7
Hillsborough Area Reg TA 23.9 21.6 26.1 22.1 24.2 27.5273.5 296.7 -2.98% -7.82%FL 0.7Tampa 71.6 73.8
Regional Transit Auth 731.2 642.4 628.3 650.9 570.4 540.97,457.2 7,083.6 13.60% 5.27%LA 23.0New Orleans 2,001.9 1,762.2
Massachusetts Bay Tr Auth 6,540.6 5,677.6 5,322.9 6,731.4 5,996.4 5,144.869,378.4 72,273.6 -1.85% -4.01%MA 223.3Boston 17,541.1 17,872.6
Maryland Transit Admin 847.7 670.5 674.9 790.5 722.8 642.28,092.3 8,588.0 1.74% -5.77%MD 27.1Baltimore 2,193.1 2,155.5
Metro Transit 1,943.3 1,758.7 1,660.1 906.9 795.6 828.516,000.1 10,163.0 >100% 57.43%MN 62.5Minneapolis 5,362.1 2,531.0
Bi-State Dev Agency 1,562.3 1,201.5 1,244.9 1,664.8 1,349.4 1,250.517,182.1 17,396.2 -6.00% -1.23%MO 49.9Saint Louis 4,008.7 4,264.7
Charlotte Area Transit 474.7 386.2 398.7 455.0 402.7 404.65,130.4 4,977.8 -0.21% 3.07%NC 15.8Charlotte 1,259.6 1,262.3
New Jersey Transit Corp 2,063.0 1,691.8 1,880.8 1,936.9 1,649.4 1,779.622,456.7 21,710.7 5.03% 3.44%NJ NANewark 5,635.6 5,365.9
Niagara Frontier Trp Auth 430.2 346.7 402.3 458.1 418.6 405.44,300.5 5,058.3 -8.03% -14.98%NY 16.5Buffalo 1,179.2 1,282.1
Greater Cleveland Reg TA 277.4 198.2 255.6 267.0 241.0 259.12,778.6 2,897.4 -4.68% -4.10%OH NACleveland 731.2 767.1
Tri-County Metro Trp Dist 3,366.3 2,792.9 3,007.4 3,394.3 2,977.0 2,914.238,164.6 38,287.6 -1.28% -0.32%OR 113.9Portland 9,166.6 9,285.5
Southeastern Penn TA 2,661.0 3,154.0 2,424.8 2,659.4 3,131.8 2,368.431,481.9 32,794.9 0.98% -4.00%PA 111.9Philadelphia 8,239.8 8,159.6
Port Auth of Allegheny Co 757.9 625.6 641.4 773.5 667.2 628.68,166.1 8,321.7 -2.15% -1.87%PA 27.7Pittsburgh 2,024.9 2,069.3
Memphis Area Transit Auth 0.0 0.0 0.0 101.0 72.2 65.0485.1 1,366.2 -100.00% -64.49%TN 0.0Memphis 0.0 238.2
Dallas Area Rapid Transit 3,335.1 2,222.1 2,369.2 3,192.3 2,288.9 2,019.229,884.2 28,965.7 5.68% 3.17%TX 101.8Dallas 7,926.4 7,500.4
Metro Tr Auth of Harris Co 1,223.6 1,024.1 1,052.1 1,009.7 829.8 860.713,300.7 11,280.0 22.21% 17.91%TX 45.3Houston 3,299.8 2,700.2
Utah Transit Authority 1,848.2 1,609.1 1,738.3 1,827.7 1,623.6 1,733.619,868.7 18,740.6 0.21% 6.02%UT 68.5Salt Lake City 5,195.6 5,184.9

OCT '14 NOV '14 DEC '14 DEC '14 NOV '13 DEC '13JAN '13-
DEC '134th Qtr
ChngYTD
Chng(000's) (000's) (000's) (000's) (000's) (000's) (000's)
JAN '14-
(000's)OCT '13Transit Agency
State andPrimary City
AVGWKDY(000's)
DEC '14OCT '14-
(000's)DEC '13
OCT '13-
(000's)
Hampton Roads Transit 167.5 123.4 124.2 149.8 112.2 108.81,695.9 1,609.6 11.95% 5.36%VA 5.8Hampton 415.1 370.8
King County Dept of Trp 58.9 50.3 53.8 63.7 52.7 56.0707.7 760.9 -5.45% -6.99%WA 2.2Seattle 163.0 172.4
Sound Transit 1,013.4 891.2 958.6 971.2 853.8 890.211,915.9 10,672.7 5.45% 11.65%WA 35.2Seattle 2,863.2 2,715.2
REPORTED TOTAL 42,317.6 42,850.9 537,115.0 47,772.7 42,301.6 518,536.2 2.59% 3.58%
PROJECTED TOTAL (c)
41,069.149,371.81,600.9 134,540.3 131,143.4
Note: Data may differ from that included in Federal Transit Administration reports due to differences in data calculation procedures and in periods of time covered.(a) Transit agencies assigned by urbanized areas or urban places of less than 50,000 population outside urbanized areas based on 2000 U.S. Census Population.(b) Year-to-date ridership adjusted for data received after closing dates of previous issues.
(c) Includes missing agencies (Central Arkansas TA and Kenosha Transit).
* Preliminary information based on data from reporting systems.
3.58%42,317.6 42,850.9 537,115.0 47,772.7 42,301.6 41,069.1 518,536.2 2.59%49,371.8 134,540.3 131,143.4
American Public Transportation Association1666 K Street, NW, Suite 1100Washington, DC 20006
Contact: Matthew DickensPolicy Analyst
Telephone: (202) 496-4817
PRECEDING YEAR (a)(b) % CHANGE (b)
Fax: (202) 496-4324
CURRENT YEAR (a)(b)
5
e-mail: [email protected] TRANSPORTATION RIDERSHIP REPORTFourth Quarter 2014
ESTIMATED UNLINKED TRANSIT PASSENGER TRIPS
COMMUTER RAIL
03-Mar-15
OCT '14 NOV '14 DEC '14 DEC '14 NOV '13 DEC '13JAN '13-
DEC '134th Qtr
ChngYTD
Chng(000's) (000's) (000's) (000's) (000's) (000's) (000's)
JAN '14-
(000's)OCT '13Transit Agency
State andPrimary City
AVGWKDY(000's)
DEC '14OCT '14-
(000's)DEC '13
OCT '13-
(000's)
Alaska Railroad Corporation 0.8 0.7 1.0 0.8 0.5 1.3164.7 156.3 -3.85% 5.37%AK 0.2Anchorage 2.5 2.6
Southern California RRA 1,053.3 848.3 881.0 1,035.5 884.2 847.211,489.7 11,543.6 0.57% -0.47%CA 41.2Los Angeles 2,782.6 2,766.9
Capitol Corridor Joint Power 131.7 124.5 116.3 125.8 117.9 111.71,436.0 1,401.2 4.81% 2.48%CA 4.5Oakland 372.5 355.4
North County Transit District 131.4 114.5 114.3 133.8 112.9 121.91,748.2 1,689.2 -2.28% 3.49%CA 4.9Oceanside 360.2 368.6
Caltrain 1,699.1 1,418.8 1,401.5 1,435.7 1,326.0 1,312.117,942.6 16,294.9 10.94% 10.11%CA 56.7San Carlos 4,519.4 4,073.8
San Joaquin Reg Rail Com 116.5 87.0 81.7 102.4 83.1 73.11,179.4 1,019.7 10.29% 15.66%CA 4.6Stockton 285.2 258.6
Connecticut DOT 58.9 50.2 49.9 57.2 52.5 55.0658.3 658.0 -3.46% 0.05%CT 2.2New Haven 159.0 164.7
SunRail 68.2 58.7 77.3 0.0 0.0 0.0540.7 0.0 NA NAFL 3.2Orlando 204.2 0.0
South Florida RTA (Tri-Rail) 390.7 348.1 357.0 399.4 361.9 356.54,389.6 4,351.0 -1.97% 0.89%FL 14.4Pompano Beach 1,095.8 1,117.8
Metra 6,455.5 6,004.8 6,022.8 6,415.6 6,005.1 5,814.874,381.9 73,603.1 1.36% 1.06%IL 290.5Chicago 18,483.1 18,235.5
Northern IN Commuter TD 314.2 274.4 308.8 308.9 280.8 288.73,614.2 3,606.8 2.16% 0.21%IN 11.8Chesterton 897.4 878.4
Massachusetts Bay Tr Auth 3,211.4 2,695.1 3,010.1 3,161.7 2,778.6 2,867.136,087.6 34,865.7 1.24% 3.50%MA 130.6Boston 8,916.6 8,807.4
Maryland Transit Admin 860.8 659.3 723.6 740.9 686.6 659.09,364.8 9,165.2 7.53% 2.18%MD 35.2Baltimore 2,243.7 2,086.5
Northern NE Passenger RA 41.6 35.2 36.6 45.7 44.7 41.0494.9 555.8 -13.70% -10.96%ME 1.1Portland 113.4 131.4
Metro Transit 57.8 57.0 50.3 63.8 53.8 59.1721.2 787.3 -6.56% -8.40%MN 2.5Minneapolis 165.1 176.7
New Jersey Transit Corp 7,630.8 7,336.5 7,649.8 7,261.1 7,101.3 7,293.686,383.8 81,942.0 4.44% 5.42%NJ NANewark 22,617.1 21,656.0
New Mexico Dept of Trp 93.2 72.3 79.1 96.2 78.2 77.71,062.7 1,082.4 -2.98% -1.82%NM 3.4Albuquerque 244.6 252.1
MTA Long Island Rail Road 8,760.0 7,770.9 8,536.4 8,606.6 7,835.0 8,130.898,393.7 97,090.3 2.01% 1.34%NY 337.8New York 25,067.3 24,572.4
MTA Metro-North Railroad 7,634.1 6,668.8 7,485.9 7,376.2 6,670.6 7,042.384,468.8 83,326.2 3.32% 1.37%NY 298.9New York 21,788.8 21,089.1
Tri-County Metro Trp Dist 46.5 34.2 36.9 49.2 40.4 38.0501.1 478.6 -7.84% 4.70%OR 1.8Portland 117.6 127.6
Penn DOT (Keystone) 121.6 114.7 119.2 118.9 108.9 115.31,340.6 802.4 3.61% 67.07%PA 4.4Harris-Phil 355.5 343.1
Southeastern Penn TA 3,094.6 3,645.1 2,805.6 2,932.9 3,624.4 2,737.237,132.5 36,532.9 2.70% 1.64%PA 134.6Philadelphia 9,545.3 9,294.5
Regional Transp Auth 26.9 18.9 20.6 22.3 19.8 17.4256.7 245.9 11.60% 4.39%TN 1.0Nashville 66.4 59.5
Capital Metropolitan Trp Aut 81.9 61.7 49.9 56.0 68.3 50.9782.1 817.3 10.45% -4.31%TX 2.8Austin 193.5 175.2
Trinity Railway Express 245.2 164.6 171.2 231.6 174.9 164.82,293.5 2,144.9 1.70% 6.93%TX 8.2Dallas-Ft Worth 581.0 571.3
OCT '14 NOV '14 DEC '14 DEC '14 NOV '13 DEC '13JAN '13-
DEC '134th Qtr
ChngYTD
Chng(000's) (000's) (000's) (000's) (000's) (000's) (000's)
JAN '14-
(000's)OCT '13Transit Agency
State andPrimary City
AVGWKDY(000's)
DEC '14OCT '14-
(000's)DEC '13
OCT '13-
(000's)
Denton County Transportatio 59.2 43.4 39.4 60.8 45.4 31.9570.1 521.7 2.82% 9.28%TX 1.9Lewisville 142.0 138.1
Utah Transit Authority 420.9 360.6 401.0 361.5 330.9 362.54,416.1 3,800.4 12.10% 16.20%UT 16.8Salt Lake City 1,182.5 1,054.9
Virginia Railway Express 415.6 317.6 358.2 361.7 340.4 315.44,513.5 4,520.6 7.26% -0.16%VA 17.9Alexandria 1,091.4 1,017.5
Sound Transit 345.3 282.6 285.0 296.4 252.6 248.73,362.8 3,035.5 14.44% 10.78%WA 13.7Seattle 912.9 797.7
REPORTED TOTAL 39,668.5 41,270.4 489,691.8 41,858.6 39,479.7 476,038.9 3.26% 2.87%
PROJECTED TOTAL
39,235.043,567.71,446.7 124,506.6 120,573.3
Note: Data may differ from that included in Federal Transit Administration reports due to differences in data calculation procedures and in periods of time covered.(a) Transit agencies assigned by urbanized areas or urban places of less than 50,000 population outside urbanized areas based on 2000 U.S. Census Population.(b) Year-to-date ridership adjusted for data received after closing dates of previous issues.
* Preliminary information based on data from reporting systems.
2.87%39,668.5 41,270.4 489,691.8 41,858.6 39,479.7 39,235.0 476,038.9 3.26%43,567.7 124,506.6 120,573.3
American Public Transportation Association1666 K Street, NW, Suite 1100Washington, DC 20006
Contact: Matthew DickensPolicy Analyst
Telephone: (202) 496-4817
PRECEDING YEAR (a)(b) % CHANGE (b)
Fax: (202) 496-4324
CURRENT YEAR (a)(b)
7
Email: [email protected] TRANSPORTATION RIDERSHIP REPORTFourth Quarter 2014
ESTIMATED UNLINKED TRANSIT PASSENGER TRIPS
TROLLEY BUS
03-Mar-15
OCT '14 NOV '14 DEC '14 DEC '14 NOV '13 DEC '13JAN '13-
DEC '134th Qtr
ChngYTD
Chng(000's) (000's) (000's) (000's) (000's) (000's) (000's)
JAN '14-
(000's)OCT '13Transit Agency
State andPrimary City
AVGWKDY(000's)
DEC '14OCT '14-
(000's)DEC '13
OCT '13-
(000's)
San Francisco Muni Rwy 6,037.8 4,762.4 4,783.8 5,922.1 5,044.2 5,142.664,081.4 66,299.2 -3.26% -3.35%CA NASan Francisco 15,584.0 16,108.9
Massachusetts Bay Tr Auth 115.9 96.0 113.4 147.8 124.6 98.31,380.4 2,618.1 -12.25% -47.27%MA 4.6Boston 325.3 370.7
Greater Dayton Regional TA 262.7 223.3 225.9 205.2 184.5 169.62,699.4 2,218.1 27.28% 21.70%OH 9.2Dayton 711.9 559.3
Southeastern Penn TA 450.5 529.8 414.9 449.4 534.4 403.95,396.7 5,564.0 0.54% -3.01%PA 19.0Philadelphia 1,395.2 1,387.7
King County Dept of Trp 1,805.9 1,424.3 1,504.8 1,823.7 1,511.5 1,449.619,436.4 19,008.0 -1.04% 2.25%WA 74.4Seattle 4,735.0 4,784.8
REPORTED TOTAL 7,035.8 7,042.8 92,994.3 8,548.2 7,399.2 95,707.4 -1.98% -2.83%
PROJECTED TOTAL (c)
7,264.08,672.8107.2 22,751.4 23,211.4
Note: Data may differ from that included in Federal Transit Administration reports due to differences in data calculation procedures and in periods of time covered.(a) Transit agencies assigned by urbanized areas or urban places of less than 50,000 population outside urbanized areas based on 2000 U.S. Census Population.(b) Year-to-date ridership adjusted for data received after closing dates of previous issues.
* Preliminary information based on data from reporting systems.
-2.83%7,035.8 7,042.8 92,994.3 8,548.2 7,399.2 7,264.0 95,707.4 -1.98%8,672.8 22,751.4 23,211.4
American Public Transportation Association1666 K Street, NW, Suite 1100Washington, DC 20006
Contact: Matthew DickensPolicy Analyst
Telephone: (202) 496-4817
PRECEDING YEAR (a)(b) % CHANGE (b)
Fax: (202) 496-4324
CURRENT YEAR (a)(b)
8
Email: [email protected] TRANSPORTATION RIDERSHIP REPORT
Fourth Quarter 2014ESTIMATED UNLINKED TRANSIT PASSENGER TRIPS
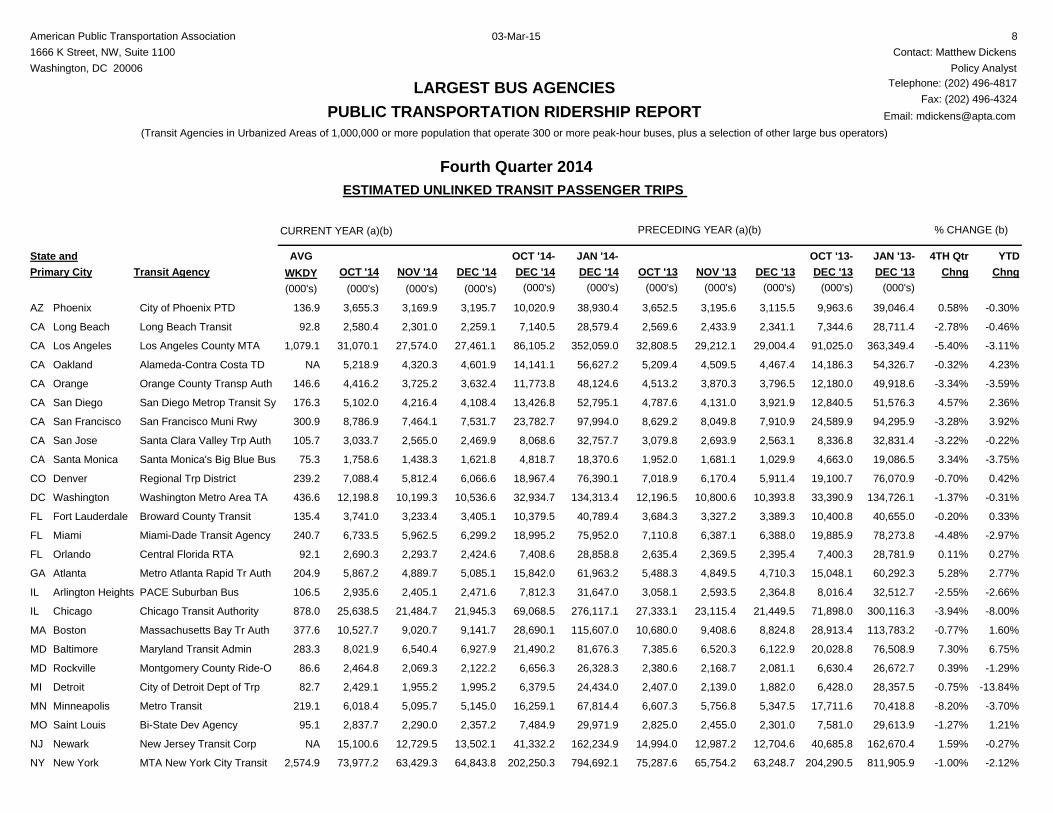
LARGEST BUS AGENCIES
03-Mar-15
(Transit Agencies in Urbanized Areas of 1,000,000 or more population that operate 300 or more peak-hour buses, plus a selection of other large bus operators)
OCT '14 NOV '14 DEC '14 DEC '14 NOV '13 DEC '13JAN '13-
DEC '134TH Qtr
ChngYTD
Chng(000's) (000's) (000's) (000's) (000's) (000's) (000's)
JAN '14-
(000's)OCT '13Transit Agency
State andPrimary City
AVGWKDY(000's)
DEC '14OCT '14-
(000's)DEC '13
OCT '13-
(000's)
City of Phoenix PTD 3,655.3 3,169.9 3,195.7 3,652.5 3,195.6 3,115.538,930.4 39,046.4 0.58% -0.30%AZ 136.9Phoenix 10,020.9 9,963.6
Long Beach Transit 2,580.4 2,301.0 2,259.1 2,569.6 2,433.9 2,341.128,579.4 28,711.4 -2.78% -0.46%CA 92.8Long Beach 7,140.5 7,344.6
Los Angeles County MTA 31,070.1 27,574.0 27,461.1 32,808.5 29,212.1 29,004.4352,059.0 363,349.4 -5.40% -3.11%CA 1,079.1Los Angeles 86,105.2 91,025.0
Alameda-Contra Costa TD 5,218.9 4,320.3 4,601.9 5,209.4 4,509.5 4,467.456,627.2 54,326.7 -0.32% 4.23%CA NAOakland 14,141.1 14,186.3
Orange County Transp Auth 4,416.2 3,725.2 3,632.4 4,513.2 3,870.3 3,796.548,124.6 49,918.6 -3.34% -3.59%CA 146.6Orange 11,773.8 12,180.0
San Diego Metrop Transit Sy 5,102.0 4,216.4 4,108.4 4,787.6 4,131.0 3,921.952,795.1 51,576.3 4.57% 2.36%CA 176.3San Diego 13,426.8 12,840.5
San Francisco Muni Rwy 8,786.9 7,464.1 7,531.7 8,629.2 8,049.8 7,910.997,994.0 94,295.9 -3.28% 3.92%CA 300.9San Francisco 23,782.7 24,589.9
Santa Clara Valley Trp Auth 3,033.7 2,565.0 2,469.9 3,079.8 2,693.9 2,563.132,757.7 32,831.4 -3.22% -0.22%CA 105.7San Jose 8,068.6 8,336.8
Santa Monica's Big Blue Bus 1,758.6 1,438.3 1,621.8 1,952.0 1,681.1 1,029.918,370.6 19,086.5 3.34% -3.75%CA 75.3Santa Monica 4,818.7 4,663.0
Regional Trp District 7,088.4 5,812.4 6,066.6 7,018.9 6,170.4 5,911.476,390.1 76,070.9 -0.70% 0.42%CO 239.2Denver 18,967.4 19,100.7
Washington Metro Area TA 12,198.8 10,199.3 10,536.6 12,196.5 10,800.6 10,393.8134,313.4 134,726.1 -1.37% -0.31%DC 436.6Washington 32,934.7 33,390.9
Broward County Transit 3,741.0 3,233.4 3,405.1 3,684.3 3,327.2 3,389.340,789.4 40,655.0 -0.20% 0.33%FL 135.4Fort Lauderdale 10,379.5 10,400.8
Miami-Dade Transit Agency 6,733.5 5,962.5 6,299.2 7,110.8 6,387.1 6,388.075,952.0 78,273.8 -4.48% -2.97%FL 240.7Miami 18,995.2 19,885.9
Central Florida RTA 2,690.3 2,293.7 2,424.6 2,635.4 2,369.5 2,395.428,858.8 28,781.9 0.11% 0.27%FL 92.1Orlando 7,408.6 7,400.3
Metro Atlanta Rapid Tr Auth 5,867.2 4,889.7 5,085.1 5,488.3 4,849.5 4,710.361,963.2 60,292.3 5.28% 2.77%GA 204.9Atlanta 15,842.0 15,048.1
PACE Suburban Bus 2,935.6 2,405.1 2,471.6 3,058.1 2,593.5 2,364.831,647.0 32,512.7 -2.55% -2.66%IL 106.5Arlington Heights 7,812.3 8,016.4
Chicago Transit Authority 25,638.5 21,484.7 21,945.3 27,333.1 23,115.4 21,449.5276,117.1 300,116.3 -3.94% -8.00%IL 878.0Chicago 69,068.5 71,898.0
Massachusetts Bay Tr Auth 10,527.7 9,020.7 9,141.7 10,680.0 9,408.6 8,824.8115,607.0 113,783.2 -0.77% 1.60%MA 377.6Boston 28,690.1 28,913.4
Maryland Transit Admin 8,021.9 6,540.4 6,927.9 7,385.6 6,520.3 6,122.981,676.3 76,508.9 7.30% 6.75%MD 283.3Baltimore 21,490.2 20,028.8
Montgomery County Ride-O 2,464.8 2,069.3 2,122.2 2,380.6 2,168.7 2,081.126,328.3 26,672.7 0.39% -1.29%MD 86.6Rockville 6,656.3 6,630.4
City of Detroit Dept of Trp 2,429.1 1,955.2 1,995.2 2,407.0 2,139.0 1,882.024,434.0 28,357.5 -0.75% -13.84%MI 82.7Detroit 6,379.5 6,428.0
Metro Transit 6,018.4 5,095.7 5,145.0 6,607.3 5,756.8 5,347.567,814.4 70,418.8 -8.20% -3.70%MN 219.1Minneapolis 16,259.1 17,711.6
Bi-State Dev Agency 2,837.7 2,290.0 2,357.2 2,825.0 2,455.0 2,301.029,971.9 29,613.9 -1.27% 1.21%MO 95.1Saint Louis 7,484.9 7,581.0
New Jersey Transit Corp 15,100.6 12,729.5 13,502.1 14,994.0 12,987.2 12,704.6162,234.9 162,670.4 1.59% -0.27%NJ NANewark 41,332.2 40,685.8
MTA New York City Transit 73,977.2 63,429.3 64,843.8 75,287.6 65,754.2 63,248.7794,692.1 811,905.9 -1.00% -2.12%NY 2,574.9New York 202,250.3 204,290.5
OCT '14 NOV '14 DEC '14 DEC '14 NOV '13 DEC '13JAN '13-
DEC '134TH Qtr
ChngYTD
Chng(000's) (000's) (000's) (000's) (000's) (000's) (000's)
JAN '14-
(000's)OCT '13Transit Agency
State andPrimary City
AVGWKDY(000's)
DEC '14OCT '14-
(000's)DEC '13
OCT '13-
(000's)
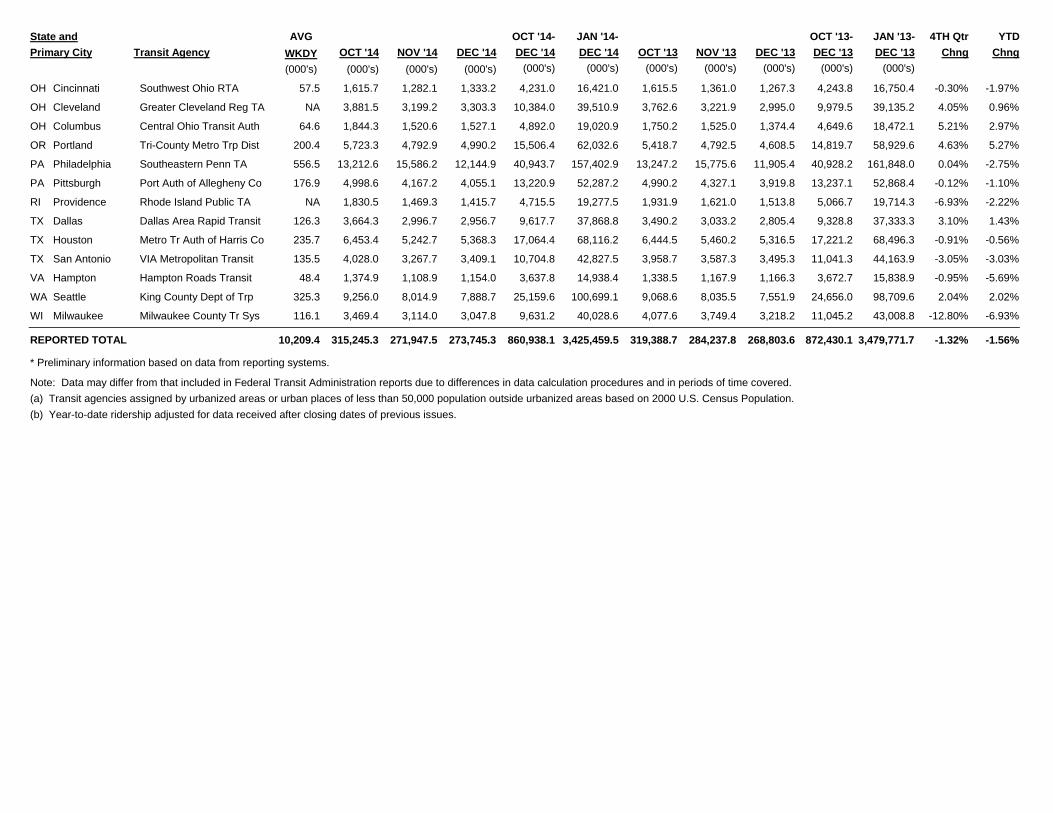
Southwest Ohio RTA 1,615.7 1,282.1 1,333.2 1,615.5 1,361.0 1,267.316,421.0 16,750.4 -0.30% -1.97%OH 57.5Cincinnati 4,231.0 4,243.8
Greater Cleveland Reg TA 3,881.5 3,199.2 3,303.3 3,762.6 3,221.9 2,995.039,510.9 39,135.2 4.05% 0.96%OH NACleveland 10,384.0 9,979.5
Central Ohio Transit Auth 1,844.3 1,520.6 1,527.1 1,750.2 1,525.0 1,374.419,020.9 18,472.1 5.21% 2.97%OH 64.6Columbus 4,892.0 4,649.6
Tri-County Metro Trp Dist 5,723.3 4,792.9 4,990.2 5,418.7 4,792.5 4,608.562,032.6 58,929.6 4.63% 5.27%OR 200.4Portland 15,506.4 14,819.7
Southeastern Penn TA 13,212.6 15,586.2 12,144.9 13,247.2 15,775.6 11,905.4157,402.9 161,848.0 0.04% -2.75%PA 556.5Philadelphia 40,943.7 40,928.2
Port Auth of Allegheny Co 4,998.6 4,167.2 4,055.1 4,990.2 4,327.1 3,919.852,287.2 52,868.4 -0.12% -1.10%PA 176.9Pittsburgh 13,220.9 13,237.1
Rhode Island Public TA 1,830.5 1,469.3 1,415.7 1,931.9 1,621.0 1,513.819,277.5 19,714.3 -6.93% -2.22%RI NAProvidence 4,715.5 5,066.7
Dallas Area Rapid Transit 3,664.3 2,996.7 2,956.7 3,490.2 3,033.2 2,805.437,868.8 37,333.3 3.10% 1.43%TX 126.3Dallas 9,617.7 9,328.8
Metro Tr Auth of Harris Co 6,453.4 5,242.7 5,368.3 6,444.5 5,460.2 5,316.568,116.2 68,496.3 -0.91% -0.56%TX 235.7Houston 17,064.4 17,221.2
VIA Metropolitan Transit 4,028.0 3,267.7 3,409.1 3,958.7 3,587.3 3,495.342,827.5 44,163.9 -3.05% -3.03%TX 135.5San Antonio 10,704.8 11,041.3
Hampton Roads Transit 1,374.9 1,108.9 1,154.0 1,338.5 1,167.9 1,166.314,938.4 15,838.9 -0.95% -5.69%VA 48.4Hampton 3,637.8 3,672.7
King County Dept of Trp 9,256.0 8,014.9 7,888.7 9,068.6 8,035.5 7,551.9100,699.1 98,709.6 2.04% 2.02%WA 325.3Seattle 25,159.6 24,656.0
Milwaukee County Tr Sys 3,469.4 3,114.0 3,047.8 4,077.6 3,749.4 3,218.240,028.6 43,008.8 -12.80% -6.93%WI 116.1Milwaukee 9,631.2 11,045.2
REPORTED TOTAL 271,947.5 273,745.3 3,425,459.5 319,388.7 284,237.8 3,479,771.7 -1.32% -1.56%268,803.6315,245.310,209.4 860,938.1 872,430.1
Note: Data may differ from that included in Federal Transit Administration reports due to differences in data calculation procedures and in periods of time covered.(a) Transit agencies assigned by urbanized areas or urban places of less than 50,000 population outside urbanized areas based on 2000 U.S. Census Population.(b) Year-to-date ridership adjusted for data received after closing dates of previous issues.
* Preliminary information based on data from reporting systems.
APTA PUBLIC TRANSPORTATION RIDERSHIP REPORT
State and Primary City
Transit Agency Mode
Average
Weekday Oct '14
Trips for Trips for
Nov '14
Trips for
Dec '14
Trips Thru
Dec '14
Trips for
Oct '13
Trips for
Nov '13
Trips for
Dec '13
Trips Thru
Dec '13 Quarterly
Change
Year-
Change
Fourth Quarter, 2014
(000's) (000's) (000's) (000's) (000's) (000's) (000's) (000's)(000's)
to-Date
10
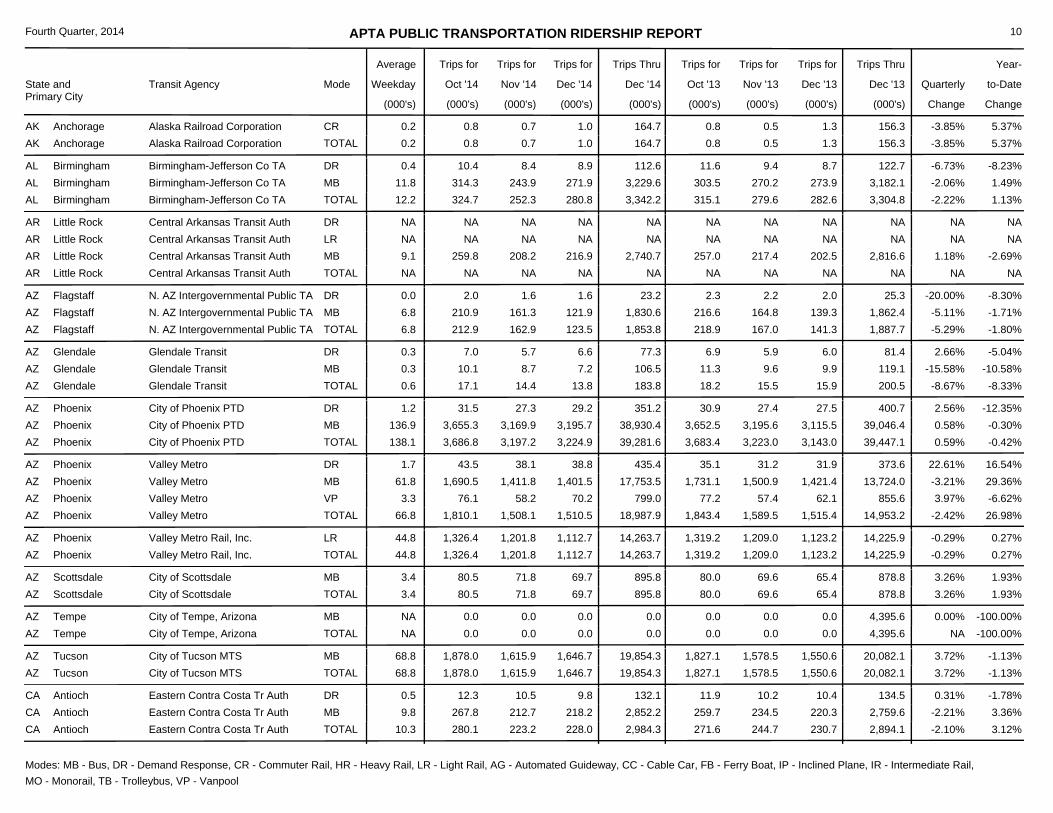
0.80.7 1.0 0.5 1.30.2 -3.85%164.7 156.3 5.37%0.8AK Anchorage Alaska Railroad Corporation TOTAL0.80.8 0.7 1.00.2CR 0.5 1.3 -3.85%164.7 156.3 5.37%Alaska Railroad CorporationAK Anchorage
315.1252.3 280.8 279.6 282.612.2 -2.22%3,342.2 3,304.8 1.13%324.7AL Birmingham Birmingham-Jefferson Co TA TOTAL
11.610.4 8.4 8.90.4DR 9.4 8.7 -6.73%112.6 122.7 -8.23%Birmingham-Jefferson Co TAAL Birmingham303.5314.3 243.9 271.911.8MB 270.2 273.9 -2.06%3,229.6 3,182.1 1.49%Birmingham-Jefferson Co TAAL Birmingham
NANA NA NA NANA NANA NA NANAAR Little Rock Central Arkansas Transit Auth TOTAL
NANA NA NANADR NA NA NANA NA NACentral Arkansas Transit AuthAR Little RockNANA NA NANALR NA NA NANA NA NACentral Arkansas Transit AuthAR Little Rock
257.0259.8 208.2 216.99.1MB 217.4 202.5 1.18%2,740.7 2,816.6 -2.69%Central Arkansas Transit AuthAR Little Rock
218.9162.9 123.5 167.0 141.36.8 -5.29%1,853.8 1,887.7 -1.80%212.9AZ Flagstaff N. AZ Intergovernmental Public TA TOTAL
2.32.0 1.6 1.60.0DR 2.2 2.0 -20.00%23.2 25.3 -8.30%N. AZ Intergovernmental Public TAAZ Flagstaff216.6210.9 161.3 121.96.8MB 164.8 139.3 -5.11%1,830.6 1,862.4 -1.71%N. AZ Intergovernmental Public TAAZ Flagstaff
18.214.4 13.8 15.5 15.90.6 -8.67%183.8 200.5 -8.33%17.1AZ Glendale Glendale Transit TOTAL
6.97.0 5.7 6.60.3DR 5.9 6.0 2.66%77.3 81.4 -5.04%Glendale TransitAZ Glendale11.310.1 8.7 7.20.3MB 9.6 9.9 -15.58%106.5 119.1 -10.58%Glendale TransitAZ Glendale
3,683.43,197.2 3,224.9 3,223.0 3,143.0138.1 0.59%39,281.6 39,447.1 -0.42%3,686.8AZ Phoenix City of Phoenix PTD TOTAL
30.931.5 27.3 29.21.2DR 27.4 27.5 2.56%351.2 400.7 -12.35%City of Phoenix PTDAZ Phoenix3,652.53,655.3 3,169.9 3,195.7136.9MB 3,195.6 3,115.5 0.58%38,930.4 39,046.4 -0.30%City of Phoenix PTDAZ Phoenix
1,843.41,508.1 1,510.5 1,589.5 1,515.466.8 -2.42%18,987.9 14,953.2 26.98%1,810.1AZ Phoenix Valley Metro TOTAL
35.143.5 38.1 38.81.7DR 31.2 31.9 22.61%435.4 373.6 16.54%Valley MetroAZ Phoenix1,731.11,690.5 1,411.8 1,401.561.8MB 1,500.9 1,421.4 -3.21%17,753.5 13,724.0 29.36%Valley MetroAZ Phoenix
77.276.1 58.2 70.23.3VP 57.4 62.1 3.97%799.0 855.6 -6.62%Valley MetroAZ Phoenix
1,319.21,201.8 1,112.7 1,209.0 1,123.244.8 -0.29%14,263.7 14,225.9 0.27%1,326.4AZ Phoenix Valley Metro Rail, Inc. TOTAL1,319.21,326.4 1,201.8 1,112.744.8LR 1,209.0 1,123.2 -0.29%14,263.7 14,225.9 0.27%Valley Metro Rail, Inc.AZ Phoenix
80.071.8 69.7 69.6 65.43.4 3.26%895.8 878.8 1.93%80.5AZ Scottsdale City of Scottsdale TOTAL80.080.5 71.8 69.73.4MB 69.6 65.4 3.26%895.8 878.8 1.93%City of ScottsdaleAZ Scottsdale
0.00.0 0.0 0.0 0.0NA NA0.0 4,395.6 -100.00%0.0AZ Tempe City of Tempe, Arizona TOTAL0.00.0 0.0 0.0NAMB 0.0 0.0 0.00%0.0 4,395.6 -100.00%City of Tempe, ArizonaAZ Tempe
1,827.11,615.9 1,646.7 1,578.5 1,550.668.8 3.72%19,854.3 20,082.1 -1.13%1,878.0AZ Tucson City of Tucson MTS TOTAL1,827.11,878.0 1,615.9 1,646.768.8MB 1,578.5 1,550.6 3.72%19,854.3 20,082.1 -1.13%City of Tucson MTSAZ Tucson
271.6223.2 228.0 244.7 230.710.3 -2.10%2,984.3 2,894.1 3.12%280.1CA Antioch Eastern Contra Costa Tr Auth TOTAL
11.912.3 10.5 9.80.5DR 10.2 10.4 0.31%132.1 134.5 -1.78%Eastern Contra Costa Tr AuthCA Antioch259.7267.8 212.7 218.29.8MB 234.5 220.3 -2.21%2,852.2 2,759.6 3.36%Eastern Contra Costa Tr AuthCA Antioch
Modes: MB - Bus, DR - Demand Response, CR - Commuter Rail, HR - Heavy Rail, LR - Light Rail, AG - Automated Guideway, CC - Cable Car, FB - Ferry Boat, IP - Inclined Plane, IR - Intermediate Rail, MO - Monorail, TB - Trolleybus, VP - Vanpool
APTA PUBLIC TRANSPORTATION RIDERSHIP REPORT
State and Primary City
Transit Agency Mode
Average
Weekday Oct '14
Trips for Trips for
Nov '14
Trips for
Dec '14
Trips Thru
Dec '14
Trips for
Oct '13
Trips for
Nov '13
Trips for
Dec '13
Trips Thru
Dec '13 Quarterly
Change
Year-
Change
Fourth Quarter, 2014
(000's) (000's) (000's) (000's) (000's) (000's) (000's) (000's)(000's)
to-Date
11
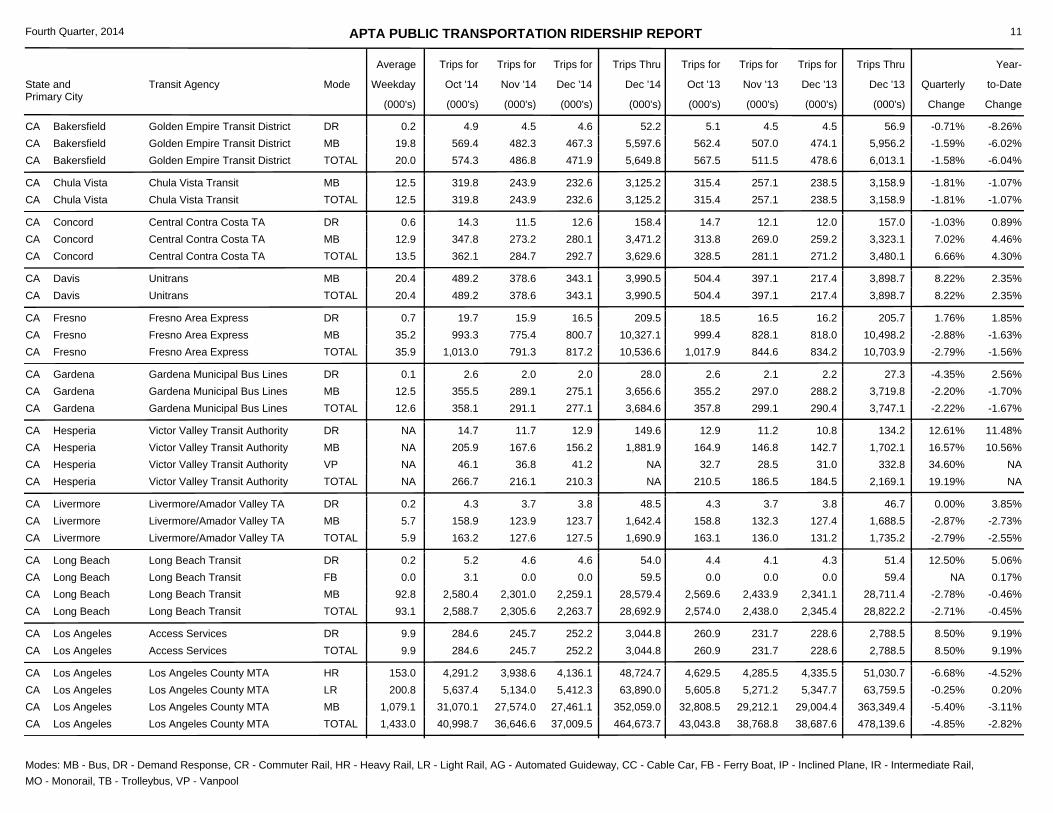
567.5486.8 471.9 511.5 478.620.0 -1.58%5,649.8 6,013.1 -6.04%574.3CA Bakersfield Golden Empire Transit District TOTAL
5.14.9 4.5 4.60.2DR 4.5 4.5 -0.71%52.2 56.9 -8.26%Golden Empire Transit DistrictCA Bakersfield562.4569.4 482.3 467.319.8MB 507.0 474.1 -1.59%5,597.6 5,956.2 -6.02%Golden Empire Transit DistrictCA Bakersfield
315.4243.9 232.6 257.1 238.512.5 -1.81%3,125.2 3,158.9 -1.07%319.8CA Chula Vista Chula Vista Transit TOTAL315.4319.8 243.9 232.612.5MB 257.1 238.5 -1.81%3,125.2 3,158.9 -1.07%Chula Vista TransitCA Chula Vista
328.5284.7 292.7 281.1 271.213.5 6.66%3,629.6 3,480.1 4.30%362.1CA Concord Central Contra Costa TA TOTAL
14.714.3 11.5 12.60.6DR 12.1 12.0 -1.03%158.4 157.0 0.89%Central Contra Costa TACA Concord313.8347.8 273.2 280.112.9MB 269.0 259.2 7.02%3,471.2 3,323.1 4.46%Central Contra Costa TACA Concord
504.4378.6 343.1 397.1 217.420.4 8.22%3,990.5 3,898.7 2.35%489.2CA Davis Unitrans TOTAL504.4489.2 378.6 343.120.4MB 397.1 217.4 8.22%3,990.5 3,898.7 2.35%UnitransCA Davis
1,017.9791.3 817.2 844.6 834.235.9 -2.79%10,536.6 10,703.9 -1.56%1,013.0CA Fresno Fresno Area Express TOTAL
18.519.7 15.9 16.50.7DR 16.5 16.2 1.76%209.5 205.7 1.85%Fresno Area ExpressCA Fresno999.4993.3 775.4 800.735.2MB 828.1 818.0 -2.88%10,327.1 10,498.2 -1.63%Fresno Area ExpressCA Fresno
357.8291.1 277.1 299.1 290.412.6 -2.22%3,684.6 3,747.1 -1.67%358.1CA Gardena Gardena Municipal Bus Lines TOTAL
2.62.6 2.0 2.00.1DR 2.1 2.2 -4.35%28.0 27.3 2.56%Gardena Municipal Bus LinesCA Gardena355.2355.5 289.1 275.112.5MB 297.0 288.2 -2.20%3,656.6 3,719.8 -1.70%Gardena Municipal Bus LinesCA Gardena
210.5216.1 210.3 186.5 184.5NA 19.19%NA 2,169.1 NA266.7CA Hesperia Victor Valley Transit Authority TOTAL
12.914.7 11.7 12.9NADR 11.2 10.8 12.61%149.6 134.2 11.48%Victor Valley Transit AuthorityCA Hesperia164.9205.9 167.6 156.2NAMB 146.8 142.7 16.57%1,881.9 1,702.1 10.56%Victor Valley Transit AuthorityCA Hesperia32.746.1 36.8 41.2NAVP 28.5 31.0 34.60%NA 332.8 NAVictor Valley Transit AuthorityCA Hesperia
163.1127.6 127.5 136.0 131.25.9 -2.79%1,690.9 1,735.2 -2.55%163.2CA Livermore Livermore/Amador Valley TA TOTAL
4.34.3 3.7 3.80.2DR 3.7 3.8 0.00%48.5 46.7 3.85%Livermore/Amador Valley TACA Livermore158.8158.9 123.9 123.75.7MB 132.3 127.4 -2.87%1,642.4 1,688.5 -2.73%Livermore/Amador Valley TACA Livermore
2,574.02,305.6 2,263.7 2,438.0 2,345.493.1 -2.71%28,692.9 28,822.2 -0.45%2,588.7CA Long Beach Long Beach Transit TOTAL
4.45.2 4.6 4.60.2DR 4.1 4.3 12.50%54.0 51.4 5.06%Long Beach TransitCA Long Beach0.03.1 0.0 0.00.0FB 0.0 0.0 NA59.5 59.4 0.17%Long Beach TransitCA Long Beach
2,569.62,580.4 2,301.0 2,259.192.8MB 2,433.9 2,341.1 -2.78%28,579.4 28,711.4 -0.46%Long Beach TransitCA Long Beach
260.9245.7 252.2 231.7 228.69.9 8.50%3,044.8 2,788.5 9.19%284.6CA Los Angeles Access Services TOTAL260.9284.6 245.7 252.29.9DR 231.7 228.6 8.50%3,044.8 2,788.5 9.19%Access ServicesCA Los Angeles
43,043.836,646.6 37,009.5 38,768.8 38,687.61,433.0 -4.85%464,673.7 478,139.6 -2.82%40,998.7CA Los Angeles Los Angeles County MTA TOTAL
4,629.54,291.2 3,938.6 4,136.1153.0HR 4,285.5 4,335.5 -6.68%48,724.7 51,030.7 -4.52%Los Angeles County MTACA Los Angeles5,605.85,637.4 5,134.0 5,412.3200.8LR 5,271.2 5,347.7 -0.25%63,890.0 63,759.5 0.20%Los Angeles County MTACA Los Angeles
32,808.531,070.1 27,574.0 27,461.11,079.1MB 29,212.1 29,004.4 -5.40%352,059.0 363,349.4 -3.11%Los Angeles County MTACA Los Angeles
Modes: MB - Bus, DR - Demand Response, CR - Commuter Rail, HR - Heavy Rail, LR - Light Rail, AG - Automated Guideway, CC - Cable Car, FB - Ferry Boat, IP - Inclined Plane, IR - Intermediate Rail, MO - Monorail, TB - Trolleybus, VP - Vanpool
APTA PUBLIC TRANSPORTATION RIDERSHIP REPORT
State and Primary City
Transit Agency Mode
Average
Weekday Oct '14
Trips for Trips for
Nov '14
Trips for
Dec '14
Trips Thru
Dec '14
Trips for
Oct '13
Trips for
Nov '13
Trips for
Dec '13
Trips Thru
Dec '13 Quarterly
Change
Year-
Change
Fourth Quarter, 2014
(000's) (000's) (000's) (000's) (000's) (000's) (000's) (000's)(000's)
to-Date
12
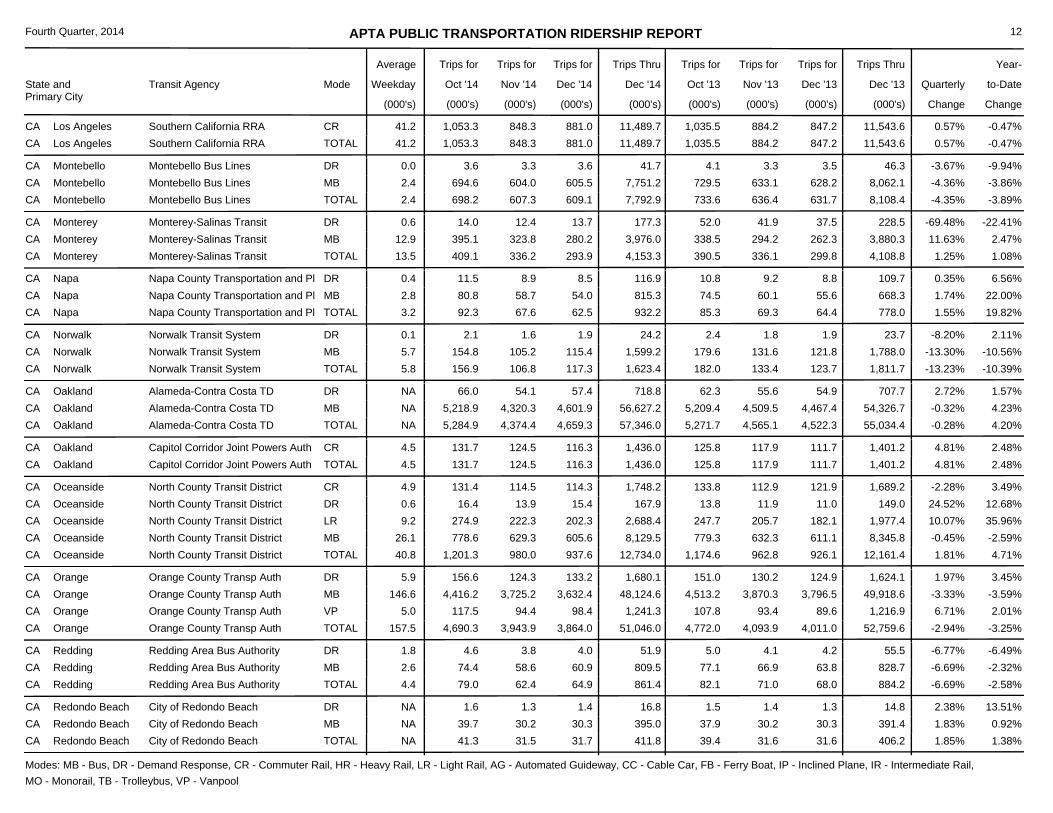
1,035.5848.3 881.0 884.2 847.241.2 0.57%11,489.7 11,543.6 -0.47%1,053.3CA Los Angeles Southern California RRA TOTAL1,035.51,053.3 848.3 881.041.2CR 884.2 847.2 0.57%11,489.7 11,543.6 -0.47%Southern California RRACA Los Angeles
733.6607.3 609.1 636.4 631.72.4 -4.35%7,792.9 8,108.4 -3.89%698.2CA Montebello Montebello Bus Lines TOTAL
4.13.6 3.3 3.60.0DR 3.3 3.5 -3.67%41.7 46.3 -9.94%Montebello Bus LinesCA Montebello729.5694.6 604.0 605.52.4MB 633.1 628.2 -4.36%7,751.2 8,062.1 -3.86%Montebello Bus LinesCA Montebello
390.5336.2 293.9 336.1 299.813.5 1.25%4,153.3 4,108.8 1.08%409.1CA Monterey Monterey-Salinas Transit TOTAL
52.014.0 12.4 13.70.6DR 41.9 37.5 -69.48%177.3 228.5 -22.41%Monterey-Salinas TransitCA Monterey338.5395.1 323.8 280.212.9MB 294.2 262.3 11.63%3,976.0 3,880.3 2.47%Monterey-Salinas TransitCA Monterey
85.367.6 62.5 69.3 64.43.2 1.55%932.2 778.0 19.82%92.3CA Napa Napa County Transportation and Pl TOTAL
10.811.5 8.9 8.50.4DR 9.2 8.8 0.35%116.9 109.7 6.56%Napa County Transportation and PlCA Napa74.580.8 58.7 54.02.8MB 60.1 55.6 1.74%815.3 668.3 22.00%Napa County Transportation and PlCA Napa
182.0106.8 117.3 133.4 123.75.8 -13.23%1,623.4 1,811.7 -10.39%156.9CA Norwalk Norwalk Transit System TOTAL
2.42.1 1.6 1.90.1DR 1.8 1.9 -8.20%24.2 23.7 2.11%Norwalk Transit SystemCA Norwalk179.6154.8 105.2 115.45.7MB 131.6 121.8 -13.30%1,599.2 1,788.0 -10.56%Norwalk Transit SystemCA Norwalk
5,271.74,374.4 4,659.3 4,565.1 4,522.3NA -0.28%57,346.0 55,034.4 4.20%5,284.9CA Oakland Alameda-Contra Costa TD TOTAL
62.366.0 54.1 57.4NADR 55.6 54.9 2.72%718.8 707.7 1.57%Alameda-Contra Costa TDCA Oakland5,209.45,218.9 4,320.3 4,601.9NAMB 4,509.5 4,467.4 -0.32%56,627.2 54,326.7 4.23%Alameda-Contra Costa TDCA Oakland
125.8124.5 116.3 117.9 111.74.5 4.81%1,436.0 1,401.2 2.48%131.7CA Oakland Capitol Corridor Joint Powers Auth TOTAL125.8131.7 124.5 116.34.5CR 117.9 111.7 4.81%1,436.0 1,401.2 2.48%Capitol Corridor Joint Powers AuthCA Oakland
1,174.6980.0 937.6 962.8 926.140.8 1.81%12,734.0 12,161.4 4.71%1,201.3CA Oceanside North County Transit District TOTAL
133.8131.4 114.5 114.34.9CR 112.9 121.9 -2.28%1,748.2 1,689.2 3.49%North County Transit DistrictCA Oceanside13.816.4 13.9 15.40.6DR 11.9 11.0 24.52%167.9 149.0 12.68%North County Transit DistrictCA Oceanside
247.7274.9 222.3 202.39.2LR 205.7 182.1 10.07%2,688.4 1,977.4 35.96%North County Transit DistrictCA Oceanside779.3778.6 629.3 605.626.1MB 632.3 611.1 -0.45%8,129.5 8,345.8 -2.59%North County Transit DistrictCA Oceanside
4,772.03,943.9 3,864.0 4,093.9 4,011.0157.5 -2.94%51,046.0 52,759.6 -3.25%4,690.3CA Orange Orange County Transp Auth TOTAL
151.0156.6 124.3 133.25.9DR 130.2 124.9 1.97%1,680.1 1,624.1 3.45%Orange County Transp AuthCA Orange4,513.24,416.2 3,725.2 3,632.4146.6MB 3,870.3 3,796.5 -3.33%48,124.6 49,918.6 -3.59%Orange County Transp AuthCA Orange
107.8117.5 94.4 98.45.0VP 93.4 89.6 6.71%1,241.3 1,216.9 2.01%Orange County Transp AuthCA Orange
82.162.4 64.9 71.0 68.04.4 -6.69%861.4 884.2 -2.58%79.0CA Redding Redding Area Bus Authority TOTAL
5.04.6 3.8 4.01.8DR 4.1 4.2 -6.77%51.9 55.5 -6.49%Redding Area Bus AuthorityCA Redding77.174.4 58.6 60.92.6MB 66.9 63.8 -6.69%809.5 828.7 -2.32%Redding Area Bus AuthorityCA Redding
39.431.5 31.7 31.6 31.6NA 1.85%411.8 406.2 1.38%41.3CA Redondo Beach City of Redondo Beach TOTAL
1.51.6 1.3 1.4NADR 1.4 1.3 2.38%16.8 14.8 13.51%City of Redondo BeachCA Redondo Beach37.939.7 30.2 30.3NAMB 30.2 30.3 1.83%395.0 391.4 0.92%City of Redondo BeachCA Redondo Beach
Modes: MB - Bus, DR - Demand Response, CR - Commuter Rail, HR - Heavy Rail, LR - Light Rail, AG - Automated Guideway, CC - Cable Car, FB - Ferry Boat, IP - Inclined Plane, IR - Intermediate Rail, MO - Monorail, TB - Trolleybus, VP - Vanpool
APTA PUBLIC TRANSPORTATION RIDERSHIP REPORT
State and Primary City
Transit Agency Mode
Average
Weekday Oct '14
Trips for Trips for
Nov '14
Trips for
Dec '14
Trips Thru
Dec '14
Trips for
Oct '13
Trips for
Nov '13
Trips for
Dec '13
Trips Thru
Dec '13 Quarterly
Change
Year-
Change
Fourth Quarter, 2014
(000's) (000's) (000's) (000's) (000's) (000's) (000's) (000's)(000's)
to-Date
13
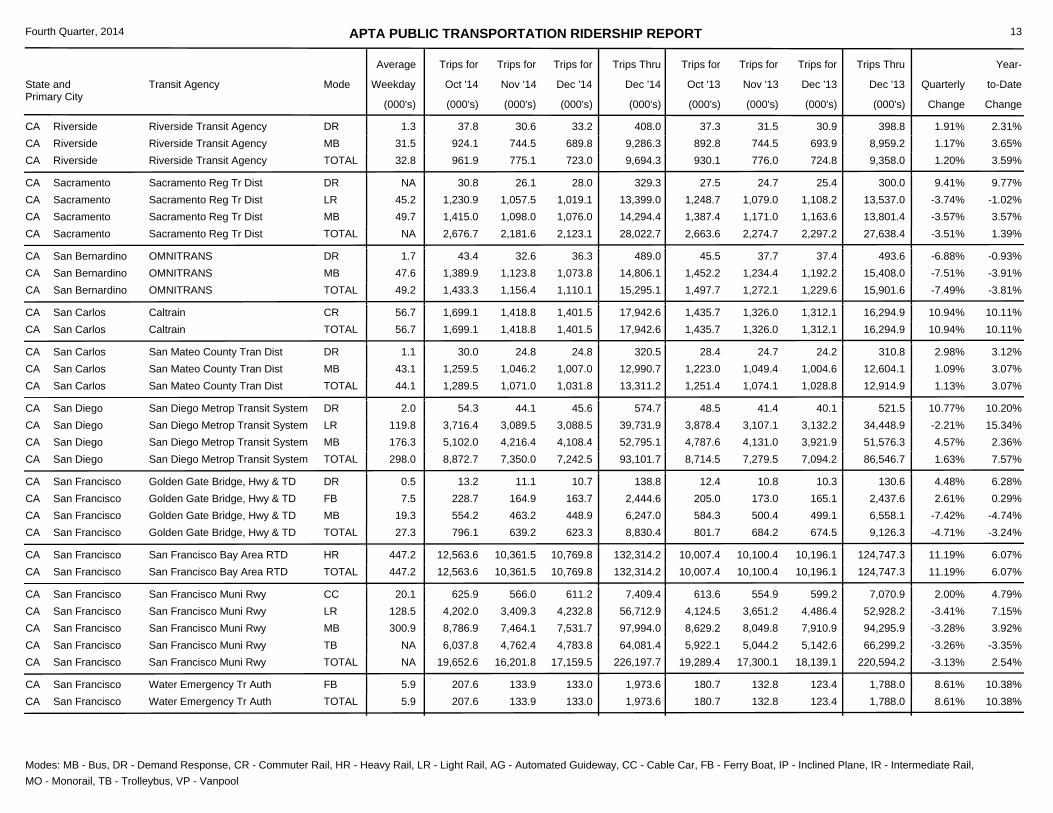
930.1775.1 723.0 776.0 724.832.8 1.20%9,694.3 9,358.0 3.59%961.9CA Riverside Riverside Transit Agency TOTAL
37.337.8 30.6 33.21.3DR 31.5 30.9 1.91%408.0 398.8 2.31%Riverside Transit AgencyCA Riverside892.8924.1 744.5 689.831.5MB 744.5 693.9 1.17%9,286.3 8,959.2 3.65%Riverside Transit AgencyCA Riverside
2,663.62,181.6 2,123.1 2,274.7 2,297.2NA -3.51%28,022.7 27,638.4 1.39%2,676.7CA Sacramento Sacramento Reg Tr Dist TOTAL
27.530.8 26.1 28.0NADR 24.7 25.4 9.41%329.3 300.0 9.77%Sacramento Reg Tr DistCA Sacramento1,248.71,230.9 1,057.5 1,019.145.2LR 1,079.0 1,108.2 -3.74%13,399.0 13,537.0 -1.02%Sacramento Reg Tr DistCA Sacramento1,387.41,415.0 1,098.0 1,076.049.7MB 1,171.0 1,163.6 -3.57%14,294.4 13,801.4 3.57%Sacramento Reg Tr DistCA Sacramento
1,497.71,156.4 1,110.1 1,272.1 1,229.649.2 -7.49%15,295.1 15,901.6 -3.81%1,433.3CA San Bernardino OMNITRANS TOTAL
45.543.4 32.6 36.31.7DR 37.7 37.4 -6.88%489.0 493.6 -0.93%OMNITRANSCA San Bernardino1,452.21,389.9 1,123.8 1,073.847.6MB 1,234.4 1,192.2 -7.51%14,806.1 15,408.0 -3.91%OMNITRANSCA San Bernardino
1,435.71,418.8 1,401.5 1,326.0 1,312.156.7 10.94%17,942.6 16,294.9 10.11%1,699.1CA San Carlos Caltrain TOTAL1,435.71,699.1 1,418.8 1,401.556.7CR 1,326.0 1,312.1 10.94%17,942.6 16,294.9 10.11%CaltrainCA San Carlos
1,251.41,071.0 1,031.8 1,074.1 1,028.844.1 1.13%13,311.2 12,914.9 3.07%1,289.5CA San Carlos San Mateo County Tran Dist TOTAL
28.430.0 24.8 24.81.1DR 24.7 24.2 2.98%320.5 310.8 3.12%San Mateo County Tran DistCA San Carlos1,223.01,259.5 1,046.2 1,007.043.1MB 1,049.4 1,004.6 1.09%12,990.7 12,604.1 3.07%San Mateo County Tran DistCA San Carlos
8,714.57,350.0 7,242.5 7,279.5 7,094.2298.0 1.63%93,101.7 86,546.7 7.57%8,872.7CA San Diego San Diego Metrop Transit System TOTAL
48.554.3 44.1 45.62.0DR 41.4 40.1 10.77%574.7 521.5 10.20%San Diego Metrop Transit SystemCA San Diego3,878.43,716.4 3,089.5 3,088.5119.8LR 3,107.1 3,132.2 -2.21%39,731.9 34,448.9 15.34%San Diego Metrop Transit SystemCA San Diego4,787.65,102.0 4,216.4 4,108.4176.3MB 4,131.0 3,921.9 4.57%52,795.1 51,576.3 2.36%San Diego Metrop Transit SystemCA San Diego
801.7639.2 623.3 684.2 674.527.3 -4.71%8,830.4 9,126.3 -3.24%796.1CA San Francisco Golden Gate Bridge, Hwy & TD TOTAL
12.413.2 11.1 10.70.5DR 10.8 10.3 4.48%138.8 130.6 6.28%Golden Gate Bridge, Hwy & TDCA San Francisco205.0228.7 164.9 163.77.5FB 173.0 165.1 2.61%2,444.6 2,437.6 0.29%Golden Gate Bridge, Hwy & TDCA San Francisco584.3554.2 463.2 448.919.3MB 500.4 499.1 -7.42%6,247.0 6,558.1 -4.74%Golden Gate Bridge, Hwy & TDCA San Francisco
10,007.410,361.5 10,769.8 10,100.4 10,196.1447.2 11.19%132,314.2 124,747.3 6.07%12,563.6CA San Francisco San Francisco Bay Area RTD TOTAL10,007.412,563.6 10,361.5 10,769.8447.2HR 10,100.4 10,196.1 11.19%132,314.2 124,747.3 6.07%San Francisco Bay Area RTDCA San Francisco
19,289.416,201.8 17,159.5 17,300.1 18,139.1NA -3.13%226,197.7 220,594.2 2.54%19,652.6CA San Francisco San Francisco Muni Rwy TOTAL
613.6625.9 566.0 611.220.1CC 554.9 599.2 2.00%7,409.4 7,070.9 4.79%San Francisco Muni RwyCA San Francisco4,124.54,202.0 3,409.3 4,232.8128.5LR 3,651.2 4,486.4 -3.41%56,712.9 52,928.2 7.15%San Francisco Muni RwyCA San Francisco8,629.28,786.9 7,464.1 7,531.7300.9MB 8,049.8 7,910.9 -3.28%97,994.0 94,295.9 3.92%San Francisco Muni RwyCA San Francisco5,922.16,037.8 4,762.4 4,783.8NATB 5,044.2 5,142.6 -3.26%64,081.4 66,299.2 -3.35%San Francisco Muni RwyCA San Francisco
180.7133.9 133.0 132.8 123.45.9 8.61%1,973.6 1,788.0 10.38%207.6CA San Francisco Water Emergency Tr Auth TOTAL180.7207.6 133.9 133.05.9FB 132.8 123.4 8.61%1,973.6 1,788.0 10.38%Water Emergency Tr AuthCA San Francisco
Modes: MB - Bus, DR - Demand Response, CR - Commuter Rail, HR - Heavy Rail, LR - Light Rail, AG - Automated Guideway, CC - Cable Car, FB - Ferry Boat, IP - Inclined Plane, IR - Intermediate Rail, MO - Monorail, TB - Trolleybus, VP - Vanpool

APTA PUBLIC TRANSPORTATION RIDERSHIP REPORT
State and Primary City
Transit Agency Mode
Average
Weekday Oct '14
Trips for Trips for
Nov '14
Trips for
Dec '14
Trips Thru
Dec '14
Trips for
Oct '13
Trips for
Nov '13
Trips for
Dec '13
Trips Thru
Dec '13 Quarterly
Change
Year-
Change
Fourth Quarter, 2014
(000's) (000's) (000's) (000's) (000's) (000's) (000's) (000's)(000's)
to-Date
14
4,165.83,545.6 3,402.8 3,628.5 3,440.3143.5 -0.80%44,827.9 44,427.9 0.90%4,196.8CA San Jose Santa Clara Valley Trp Auth TOTAL
68.167.3 55.8 56.22.5DR 57.4 54.6 -0.44%724.6 731.9 -1.00%Santa Clara Valley Trp AuthCA San Jose1,017.91,095.8 924.8 876.735.2LR 877.2 822.6 6.61%11,345.6 10,864.6 4.43%Santa Clara Valley Trp AuthCA San Jose3,079.83,033.7 2,565.0 2,469.9105.7MB 2,693.9 2,563.1 -3.22%32,757.7 32,831.4 -0.22%Santa Clara Valley Trp AuthCA San Jose
783.1618.1 545.7 640.6 552.125.8 -1.56%7,626.7 7,752.0 -1.62%781.1CA Santa Barbara Santa Barbara MTD TOTAL
4.75.4 4.5 4.70.2DR 4.1 4.1 13.18%57.7 52.3 10.33%Santa Barbara MTDCA Santa Barbara778.4775.7 613.6 541.025.6MB 636.5 548.0 -1.66%7,569.0 7,699.7 -1.70%Santa Barbara MTDCA Santa Barbara
333.2276.0 258.1 279.1 267.412.1 -1.27%3,518.4 3,586.7 -1.90%334.4CA Santa Clarita Santa Clarita Transit TOTAL
9.910.1 8.4 8.60.4DR 8.8 8.3 0.37%111.0 111.4 -0.36%Santa Clarita TransitCA Santa Clarita323.3324.3 267.6 249.511.6MB 270.3 259.1 -1.33%3,407.4 3,475.3 -1.95%Santa Clarita TransitCA Santa Clarita
1,974.21,457.9 1,641.2 1,699.6 1,047.576.3 3.39%18,617.7 19,330.8 -3.69%1,782.4CA Santa Monica Santa Monica's Big Blue Bus TOTAL
22.223.8 19.6 19.41.0DR 18.5 17.6 7.72%247.1 244.3 1.15%Santa Monica's Big Blue BusCA Santa Monica1,952.01,758.6 1,438.3 1,621.875.3MB 1,681.1 1,029.9 3.34%18,370.6 19,086.5 -3.75%Santa Monica's Big Blue BusCA Santa Monica
102.487.0 81.7 83.1 73.14.6 10.29%1,179.4 1,019.7 15.66%116.5CA Stockton San Joaquin Reg Rail Comm TOTAL102.4116.5 87.0 81.74.6CR 83.1 73.1 10.29%1,179.4 1,019.7 15.66%San Joaquin Reg Rail CommCA Stockton
420.7330.4 326.2 343.6 307.5NA -0.16%4,456.5 4,361.7 2.17%413.5CA Stockton San Joaquin Reg Trans Dist TOTAL
4.04.8 3.7 3.8NADR 5.8 6.1 -22.64%57.9 61.2 -5.39%San Joaquin Reg Trans DistCA Stockton416.7408.7 326.7 322.4NAMB 337.8 301.4 0.18%4,398.6 4,300.5 2.28%San Joaquin Reg Trans DistCA Stockton
448.7396.0 400.4 401.8 389.616.0 1.56%4,924.7 4,703.1 4.71%463.1CA Thousand Palms SunLine Transit Agency TOTAL
12.714.3 11.7 13.60.5DR 10.8 10.4 16.81%147.4 138.3 6.58%SunLine Transit AgencyCA Thousand Palms436.0448.8 384.3 386.815.5MB 391.0 379.2 1.14%4,777.3 4,564.8 4.66%SunLine Transit AgencyCA Thousand Palms
390.0304.2 305.0 327.5 313.413.6 -3.71%4,059.2 4,094.2 -0.85%383.5CA Torrance Torrance Transit System TOTAL
4.95.7 5.3 5.10.3DR 4.8 4.8 11.03%64.3 58.7 9.54%Torrance Transit SystemCA Torrance385.1377.8 298.9 299.913.3MB 322.7 308.6 -3.92%3,994.9 4,035.5 -1.01%Torrance Transit SystemCA Torrance
139.0109.6 113.1 117.3 115.45.0 -2.45%1,447.3 1,435.3 0.84%139.9CA Vallejo Solano County Transit (SolTrans) TOTAL
3.43.1 2.6 2.70.1DR 2.9 2.5 -4.55%32.9 39.3 -16.28%Solano County Transit (SolTrans)CA Vallejo135.6136.8 107.0 110.44.9MB 114.4 112.9 -2.40%1,414.4 1,396.0 1.32%Solano County Transit (SolTrans)CA Vallejo
100.777.5 69.8 83.6 72.03.4 -4.80%984.9 1,040.6 -5.35%96.7CA Ventura Ventura County Transp Comm TOTAL
17.916.0 12.2 12.40.5DR 15.5 15.1 -16.29%175.9 203.3 -13.48%Ventura County Transp CommCA Ventura82.880.7 65.3 57.42.8MB 68.1 56.9 -2.12%809.0 837.3 -3.38%Ventura County Transp CommCA Ventura
167.9138.0 137.2 138.2 130.45.8 1.03%1,725.2 1,792.7 -3.77%165.8CA Visalia Visalia City Coach TOTAL
3.23.3 2.6 2.90.1DR 2.8 2.7 1.15%36.1 36.1 0.00%Visalia City CoachCA Visalia164.7162.5 135.4 134.35.7MB 135.4 127.7 1.03%1,689.1 1,756.6 -3.84%Visalia City CoachCA Visalia
Modes: MB - Bus, DR - Demand Response, CR - Commuter Rail, HR - Heavy Rail, LR - Light Rail, AG - Automated Guideway, CC - Cable Car, FB - Ferry Boat, IP - Inclined Plane, IR - Intermediate Rail, MO - Monorail, TB - Trolleybus, VP - Vanpool

APTA PUBLIC TRANSPORTATION RIDERSHIP REPORT
State and Primary City
Transit Agency Mode
Average
Weekday Oct '14
Trips for Trips for
Nov '14
Trips for
Dec '14
Trips Thru
Dec '14
Trips for
Oct '13
Trips for
Nov '13
Trips for
Dec '13
Trips Thru
Dec '13 Quarterly
Change
Year-
Change
Fourth Quarter, 2014
(000's) (000's) (000's) (000's) (000's) (000's) (000's) (000's)(000's)
to-Date
15
1,338.21,180.6 1,116.8 1,151.3 1,094.857.9 3.09%14,772.3 14,259.7 3.59%1,397.8CA West Covina Foothill Transit TOTAL1,338.21,397.8 1,180.6 1,116.857.9MB 1,151.3 1,094.8 3.09%14,772.3 14,259.7 3.59%Foothill TransitCA West Covina
284.0234.7 251.4 236.5 226.311.2 5.42%3,268.8 2,986.6 9.45%301.2CO Colorado Springs Mountain Metropolitan Transit TOTAL
26.024.1 19.5 20.91.0DR 21.6 22.8 -8.38%268.0 267.5 0.19%Mountain Metropolitan TransitCO Colorado Springs252.7270.5 210.1 224.910.0MB 210.8 199.1 6.47%2,934.9 2,668.7 9.97%Mountain Metropolitan TransitCO Colorado Springs
5.36.6 5.1 5.60.3VP 4.1 4.4 25.36%65.9 50.4 30.75%Mountain Metropolitan TransitCO Colorado Springs
9,524.28,167.6 8,289.8 8,460.9 8,022.4342.8 1.17%104,962.3 101,761.2 3.15%9,854.9CO Denver Regional Trp District TOTAL
159.5163.6 130.6 140.715.5DR 132.6 135.7 1.66%1,758.4 1,684.3 4.40%Regional Trp DistrictCO Denver2,304.32,561.8 2,190.5 2,042.186.3LR 2,121.5 1,938.9 6.75%26,362.9 23,549.5 11.95%Regional Trp DistrictCO Denver7,018.97,088.4 5,812.4 6,066.6239.2MB 6,170.4 5,911.4 -0.70%76,390.1 76,070.9 0.42%Regional Trp DistrictCO Denver
41.541.1 34.1 40.41.8VP 36.4 36.4 1.14%450.9 456.5 -1.23%Regional Trp DistrictCO Denver
87.069.4 74.0 75.0 68.63.3 -2.17%919.1 990.6 -7.22%82.2CO Grand Junction Mesa County Reg Transp Office TOTAL
1.61.5 1.2 1.30.1DR 1.4 1.3 -6.98%17.4 15.9 9.43%Mesa County Reg Transp OfficeCO Grand Junction85.480.7 68.2 72.73.2MB 73.6 67.3 -2.08%901.7 974.7 -7.49%Mesa County Reg Transp OfficeCO Grand Junction
6.65.3 6.0 5.7 5.60.2 0.56%69.9 69.3 0.87%6.7CT Hartford Connecticut DOT TOTAL6.66.7 5.3 6.00.2DR 5.7 5.6 0.56%69.9 69.3 0.87%Connecticut DOTCT Hartford
2,642.52,153.5 2,295.1 2,265.1 2,132.994.4 0.19%27,747.4 27,734.4 0.05%2,605.0CT Hartford Connecticut Transit TOTAL2,642.52,605.0 2,153.5 2,295.194.4MB 2,265.1 2,132.9 0.19%27,747.4 27,734.4 0.05%Connecticut TransitCT Hartford
41.733.8 36.3 36.2 35.31.5 0.27%450.8 433.9 3.89%43.4CT Hartford Greater Hartford Tran Dist TOTAL41.743.4 33.8 36.31.5DR 36.2 35.3 0.27%450.8 433.9 3.89%Greater Hartford Tran DistCT Hartford
57.250.2 49.9 52.5 55.02.2 -3.46%658.3 658.0 0.05%58.9CT New Haven Connecticut DOT TOTAL57.258.9 50.2 49.92.2CR 52.5 55.0 -3.46%658.3 658.0 0.05%Connecticut DOTCT New Haven
NANA NA NA NANA NANA NA NANACT Waterbury Northeast Transportation Co., Inc. TOTAL
6.66.7 5.3 6.00.2DR 5.7 5.6 0.56%69.9 69.3 0.87%Northeast Transportation Co., Inc.CT WaterburyNANA NA NANAMB NA NA NANA NA NANortheast Transportation Co., Inc.CT Waterbury
34,765.130,360.1 31,101.7 31,336.6 29,599.71,265.7 2.78%405,473.4 408,190.9 -0.67%36,897.7DC Washington Washington Metro Area TA TOTAL
22,568.624,698.9 20,160.8 20,565.1829.2HR 20,536.0 19,205.9 5.00%271,160.0 273,464.8 -0.84%Washington Metro Area TADC Washington12,196.512,198.8 10,199.3 10,536.6436.6MB 10,800.6 10,393.8 -1.37%134,313.4 134,726.1 -0.31%Washington Metro Area TADC Washington
1,034.3785.2 842.1 870.4 854.537.1 -5.34%10,597.3 11,319.3 -6.38%984.5DE Wilmington Delaware Transit Corp TOTAL
95.194.4 74.9 82.63.7DR 82.1 79.5 -1.87%1,010.8 1,029.5 -1.82%Delaware Transit CorpDE Wilmington939.2890.1 710.3 759.533.4MB 788.3 775.0 -5.70%9,586.5 10,289.8 -6.83%Delaware Transit CorpDE Wilmington
Modes: MB - Bus, DR - Demand Response, CR - Commuter Rail, HR - Heavy Rail, LR - Light Rail, AG - Automated Guideway, CC - Cable Car, FB - Ferry Boat, IP - Inclined Plane, IR - Intermediate Rail, MO - Monorail, TB - Trolleybus, VP - Vanpool
APTA PUBLIC TRANSPORTATION RIDERSHIP REPORT
State and Primary City
Transit Agency Mode
Average
Weekday Oct '14
Trips for Trips for
Nov '14
Trips for
Dec '14
Trips Thru
Dec '14
Trips for
Oct '13
Trips for
Nov '13
Trips for
Dec '13
Trips Thru
Dec '13 Quarterly
Change
Year-
Change
Fourth Quarter, 2014
(000's) (000's) (000's) (000's) (000's) (000's) (000's) (000's)(000's)
to-Date
16
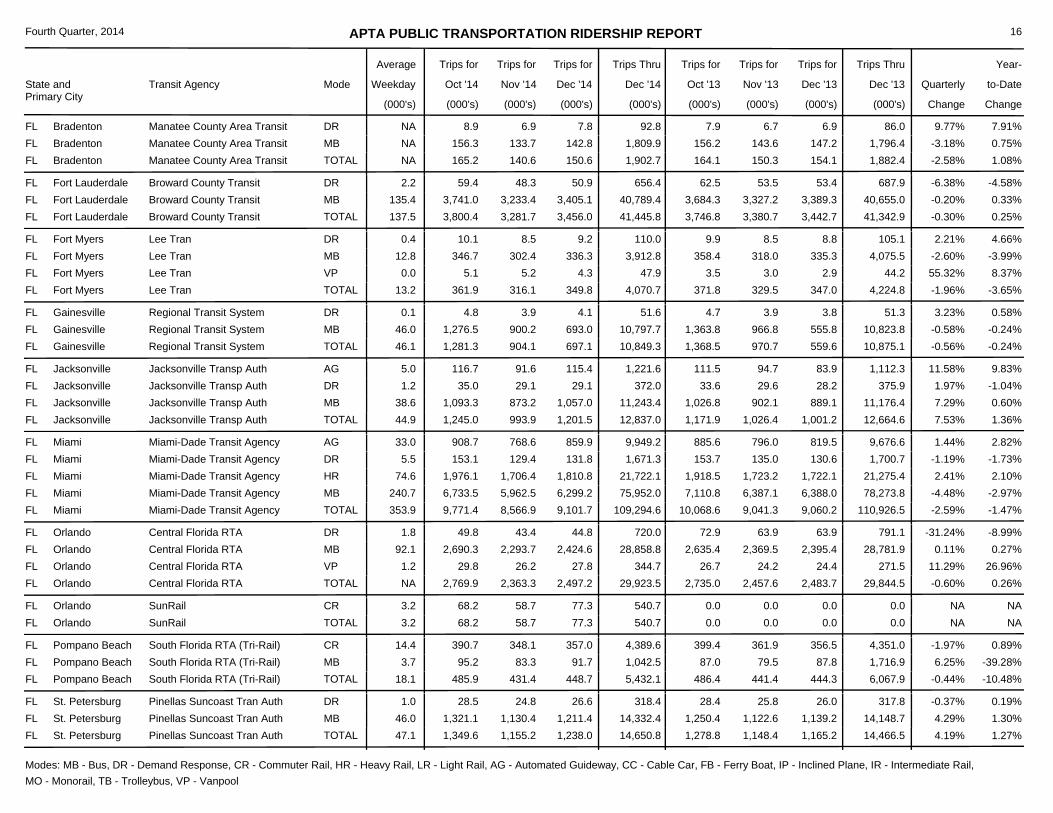
164.1140.6 150.6 150.3 154.1NA -2.58%1,902.7 1,882.4 1.08%165.2FL Bradenton Manatee County Area Transit TOTAL
7.98.9 6.9 7.8NADR 6.7 6.9 9.77%92.8 86.0 7.91%Manatee County Area TransitFL Bradenton156.2156.3 133.7 142.8NAMB 143.6 147.2 -3.18%1,809.9 1,796.4 0.75%Manatee County Area TransitFL Bradenton
3,746.83,281.7 3,456.0 3,380.7 3,442.7137.5 -0.30%41,445.8 41,342.9 0.25%3,800.4FL Fort Lauderdale Broward County Transit TOTAL
62.559.4 48.3 50.92.2DR 53.5 53.4 -6.38%656.4 687.9 -4.58%Broward County TransitFL Fort Lauderdale3,684.33,741.0 3,233.4 3,405.1135.4MB 3,327.2 3,389.3 -0.20%40,789.4 40,655.0 0.33%Broward County TransitFL Fort Lauderdale
371.8316.1 349.8 329.5 347.013.2 -1.96%4,070.7 4,224.8 -3.65%361.9FL Fort Myers Lee Tran TOTAL
9.910.1 8.5 9.20.4DR 8.5 8.8 2.21%110.0 105.1 4.66%Lee Tran FL Fort Myers358.4346.7 302.4 336.312.8MB 318.0 335.3 -2.60%3,912.8 4,075.5 -3.99%Lee Tran FL Fort Myers
3.55.1 5.2 4.30.0VP 3.0 2.9 55.32%47.9 44.2 8.37%Lee Tran FL Fort Myers
1,368.5904.1 697.1 970.7 559.646.1 -0.56%10,849.3 10,875.1 -0.24%1,281.3FL Gainesville Regional Transit System TOTAL
4.74.8 3.9 4.10.1DR 3.9 3.8 3.23%51.6 51.3 0.58%Regional Transit SystemFL Gainesville1,363.81,276.5 900.2 693.046.0MB 966.8 555.8 -0.58%10,797.7 10,823.8 -0.24%Regional Transit SystemFL Gainesville
1,171.9993.9 1,201.5 1,026.4 1,001.244.9 7.53%12,837.0 12,664.6 1.36%1,245.0FL Jacksonville Jacksonville Transp Auth TOTAL
111.5116.7 91.6 115.45.0AG 94.7 83.9 11.58%1,221.6 1,112.3 9.83%Jacksonville Transp AuthFL Jacksonville33.635.0 29.1 29.11.2DR 29.6 28.2 1.97%372.0 375.9 -1.04%Jacksonville Transp AuthFL Jacksonville
1,026.81,093.3 873.2 1,057.038.6MB 902.1 889.1 7.29%11,243.4 11,176.4 0.60%Jacksonville Transp AuthFL Jacksonville
10,068.68,566.9 9,101.7 9,041.3 9,060.2353.9 -2.59%109,294.6 110,926.5 -1.47%9,771.4FL Miami Miami-Dade Transit Agency TOTAL
885.6908.7 768.6 859.933.0AG 796.0 819.5 1.44%9,949.2 9,676.6 2.82%Miami-Dade Transit AgencyFL Miami153.7153.1 129.4 131.85.5DR 135.0 130.6 -1.19%1,671.3 1,700.7 -1.73%Miami-Dade Transit AgencyFL Miami
1,918.51,976.1 1,706.4 1,810.874.6HR 1,723.2 1,722.1 2.41%21,722.1 21,275.4 2.10%Miami-Dade Transit AgencyFL Miami7,110.86,733.5 5,962.5 6,299.2240.7MB 6,387.1 6,388.0 -4.48%75,952.0 78,273.8 -2.97%Miami-Dade Transit AgencyFL Miami
2,735.02,363.3 2,497.2 2,457.6 2,483.7NA -0.60%29,923.5 29,844.5 0.26%2,769.9FL Orlando Central Florida RTA TOTAL
72.949.8 43.4 44.81.8DR 63.9 63.9 -31.24%720.0 791.1 -8.99%Central Florida RTAFL Orlando2,635.42,690.3 2,293.7 2,424.692.1MB 2,369.5 2,395.4 0.11%28,858.8 28,781.9 0.27%Central Florida RTAFL Orlando
26.729.8 26.2 27.81.2VP 24.2 24.4 11.29%344.7 271.5 26.96%Central Florida RTAFL Orlando
0.058.7 77.3 0.0 0.03.2 NA540.7 0.0 NA68.2FL Orlando SunRail TOTAL0.068.2 58.7 77.33.2CR 0.0 0.0 NA540.7 0.0 NASunRailFL Orlando
486.4431.4 448.7 441.4 444.318.1 -0.44%5,432.1 6,067.9 -10.48%485.9FL Pompano Beach South Florida RTA (Tri-Rail) TOTAL
399.4390.7 348.1 357.014.4CR 361.9 356.5 -1.97%4,389.6 4,351.0 0.89%South Florida RTA (Tri-Rail)FL Pompano Beach87.095.2 83.3 91.73.7MB 79.5 87.8 6.25%1,042.5 1,716.9 -39.28%South Florida RTA (Tri-Rail)FL Pompano Beach
1,278.81,155.2 1,238.0 1,148.4 1,165.247.1 4.19%14,650.8 14,466.5 1.27%1,349.6FL St. Petersburg Pinellas Suncoast Tran Auth TOTAL
28.428.5 24.8 26.61.0DR 25.8 26.0 -0.37%318.4 317.8 0.19%Pinellas Suncoast Tran AuthFL St. Petersburg1,250.41,321.1 1,130.4 1,211.446.0MB 1,122.6 1,139.2 4.29%14,332.4 14,148.7 1.30%Pinellas Suncoast Tran AuthFL St. Petersburg
Modes: MB - Bus, DR - Demand Response, CR - Commuter Rail, HR - Heavy Rail, LR - Light Rail, AG - Automated Guideway, CC - Cable Car, FB - Ferry Boat, IP - Inclined Plane, IR - Intermediate Rail, MO - Monorail, TB - Trolleybus, VP - Vanpool
APTA PUBLIC TRANSPORTATION RIDERSHIP REPORT
State and Primary City
Transit Agency Mode
Average
Weekday Oct '14
Trips for Trips for
Nov '14
Trips for
Dec '14
Trips Thru
Dec '14
Trips for
Oct '13
Trips for
Nov '13
Trips for
Dec '13
Trips Thru
Dec '13 Quarterly
Change
Year-
Change
Fourth Quarter, 2014
(000's) (000's) (000's) (000's) (000's) (000's) (000's) (000's)(000's)
to-Date
17
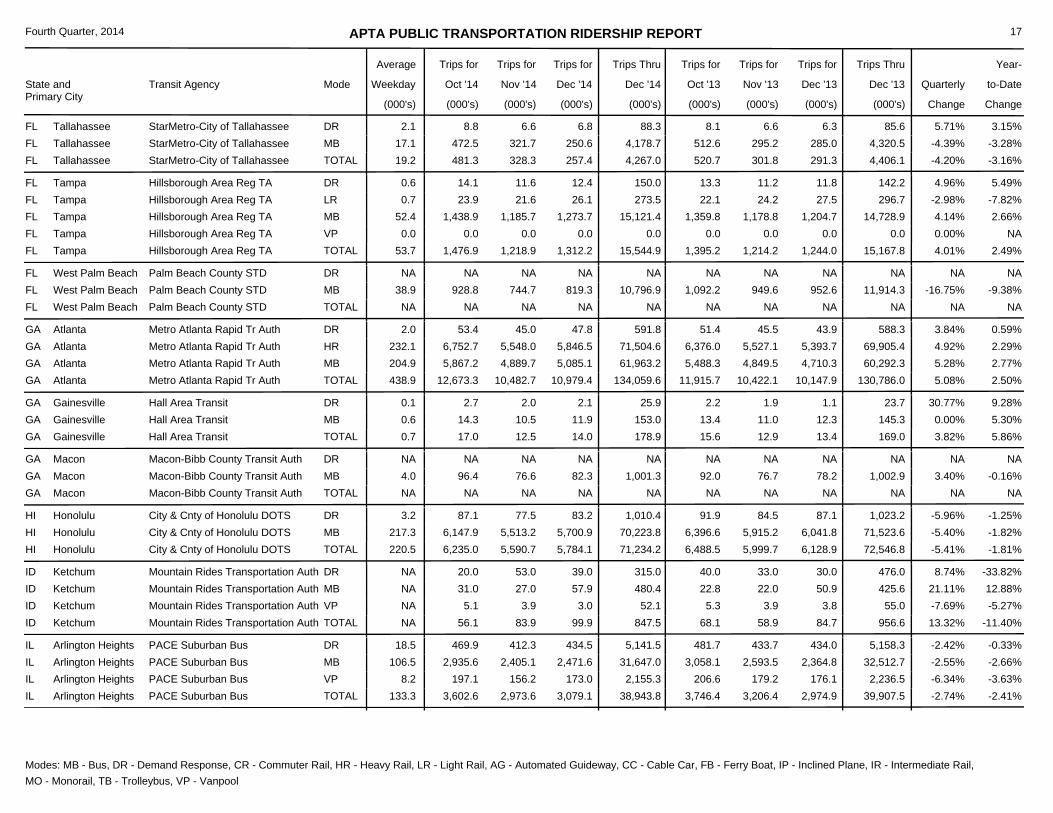
520.7328.3 257.4 301.8 291.319.2 -4.20%4,267.0 4,406.1 -3.16%481.3FL Tallahassee StarMetro-City of Tallahassee TOTAL
8.18.8 6.6 6.82.1DR 6.6 6.3 5.71%88.3 85.6 3.15%StarMetro-City of TallahasseeFL Tallahassee512.6472.5 321.7 250.617.1MB 295.2 285.0 -4.39%4,178.7 4,320.5 -3.28%StarMetro-City of TallahasseeFL Tallahassee
1,395.21,218.9 1,312.2 1,214.2 1,244.053.7 4.01%15,544.9 15,167.8 2.49%1,476.9FL Tampa Hillsborough Area Reg TA TOTAL
13.314.1 11.6 12.40.6DR 11.2 11.8 4.96%150.0 142.2 5.49%Hillsborough Area Reg TAFL Tampa22.123.9 21.6 26.10.7LR 24.2 27.5 -2.98%273.5 296.7 -7.82%Hillsborough Area Reg TAFL Tampa
1,359.81,438.9 1,185.7 1,273.752.4MB 1,178.8 1,204.7 4.14%15,121.4 14,728.9 2.66%Hillsborough Area Reg TAFL Tampa0.00.0 0.0 0.00.0VP 0.0 0.0 0.00%0.0 0.0 NAHillsborough Area Reg TAFL Tampa
NANA NA NA NANA NANA NA NANAFL West Palm Beach Palm Beach County STD TOTAL
NANA NA NANADR NA NA NANA NA NAPalm Beach County STDFL West Palm Beach1,092.2928.8 744.7 819.338.9MB 949.6 952.6 -16.75%10,796.9 11,914.3 -9.38%Palm Beach County STDFL West Palm Beach
11,915.710,482.7 10,979.4 10,422.1 10,147.9438.9 5.08%134,059.6 130,786.0 2.50%12,673.3GA Atlanta Metro Atlanta Rapid Tr Auth TOTAL
51.453.4 45.0 47.82.0DR 45.5 43.9 3.84%591.8 588.3 0.59%Metro Atlanta Rapid Tr AuthGA Atlanta6,376.06,752.7 5,548.0 5,846.5232.1HR 5,527.1 5,393.7 4.92%71,504.6 69,905.4 2.29%Metro Atlanta Rapid Tr AuthGA Atlanta5,488.35,867.2 4,889.7 5,085.1204.9MB 4,849.5 4,710.3 5.28%61,963.2 60,292.3 2.77%Metro Atlanta Rapid Tr AuthGA Atlanta
15.612.5 14.0 12.9 13.40.7 3.82%178.9 169.0 5.86%17.0GA Gainesville Hall Area Transit TOTAL
2.22.7 2.0 2.10.1DR 1.9 1.1 30.77%25.9 23.7 9.28%Hall Area TransitGA Gainesville13.414.3 10.5 11.90.6MB 11.0 12.3 0.00%153.0 145.3 5.30%Hall Area TransitGA Gainesville
NANA NA NA NANA NANA NA NANAGA Macon Macon-Bibb County Transit Auth TOTAL
NANA NA NANADR NA NA NANA NA NAMacon-Bibb County Transit AuthGA Macon92.096.4 76.6 82.34.0MB 76.7 78.2 3.40%1,001.3 1,002.9 -0.16%Macon-Bibb County Transit AuthGA Macon
6,488.55,590.7 5,784.1 5,999.7 6,128.9220.5 -5.41%71,234.2 72,546.8 -1.81%6,235.0HI Honolulu City & Cnty of Honolulu DOTS TOTAL
91.987.1 77.5 83.23.2DR 84.5 87.1 -5.96%1,010.4 1,023.2 -1.25%City & Cnty of Honolulu DOTSHI Honolulu6,396.66,147.9 5,513.2 5,700.9217.3MB 5,915.2 6,041.8 -5.40%70,223.8 71,523.6 -1.82%City & Cnty of Honolulu DOTSHI Honolulu
68.183.9 99.9 58.9 84.7NA 13.32%847.5 956.6 -11.40%56.1ID Ketchum Mountain Rides Transportation Auth TOTAL
40.020.0 53.0 39.0NADR 33.0 30.0 8.74%315.0 476.0 -33.82%Mountain Rides Transportation AuthID Ketchum22.831.0 27.0 57.9NAMB 22.0 50.9 21.11%480.4 425.6 12.88%Mountain Rides Transportation AuthID Ketchum5.35.1 3.9 3.0NAVP 3.9 3.8 -7.69%52.1 55.0 -5.27%Mountain Rides Transportation AuthID Ketchum
3,746.42,973.6 3,079.1 3,206.4 2,974.9133.3 -2.74%38,943.8 39,907.5 -2.41%3,602.6IL Arlington Heights PACE Suburban Bus TOTAL
481.7469.9 412.3 434.518.5DR 433.7 434.0 -2.42%5,141.5 5,158.3 -0.33%PACE Suburban BusIL Arlington Heights3,058.12,935.6 2,405.1 2,471.6106.5MB 2,593.5 2,364.8 -2.55%31,647.0 32,512.7 -2.66%PACE Suburban BusIL Arlington Heights
206.6197.1 156.2 173.08.2VP 179.2 176.1 -6.34%2,155.3 2,236.5 -3.63%PACE Suburban BusIL Arlington Heights
Modes: MB - Bus, DR - Demand Response, CR - Commuter Rail, HR - Heavy Rail, LR - Light Rail, AG - Automated Guideway, CC - Cable Car, FB - Ferry Boat, IP - Inclined Plane, IR - Intermediate Rail, MO - Monorail, TB - Trolleybus, VP - Vanpool

APTA PUBLIC TRANSPORTATION RIDERSHIP REPORT
State and Primary City
Transit Agency Mode
Average
Weekday Oct '14
Trips for Trips for
Nov '14
Trips for
Dec '14
Trips Thru
Dec '14
Trips for
Oct '13
Trips for
Nov '13
Trips for
Dec '13
Trips Thru
Dec '13 Quarterly
Change
Year-
Change
Fourth Quarter, 2014
(000's) (000's) (000's) (000's) (000's) (000's) (000's) (000's)(000's)
to-Date
18
48,727.840,245.2 40,311.1 42,331.7 38,958.21,631.6 -1.06%514,217.3 528,800.7 -2.76%48,082.0IL Chicago Chicago Transit Authority TOTAL
0.00.0 0.0 0.00.0DR 0.0 0.0 0.00%0.0 0.0 NAChicago Transit AuthorityIL Chicago21,394.722,443.5 18,760.5 18,365.8753.6HR 19,216.3 17,508.7 2.50%238,100.2 228,684.4 4.12%Chicago Transit AuthorityIL Chicago27,333.125,638.5 21,484.7 21,945.3878.0MB 23,115.4 21,449.5 -3.94%276,117.1 300,116.3 -8.00%Chicago Transit AuthorityIL Chicago
6,415.66,004.8 6,022.8 6,005.1 5,814.8290.5 1.36%74,381.9 73,603.1 1.06%6,455.5IL Chicago Metra TOTAL6,415.66,455.5 6,004.8 6,022.8290.5CR 6,005.1 5,814.8 1.36%74,381.9 73,603.1 1.06%MetraIL Chicago
283.1217.7 215.5 232.3 206.110.3 -0.11%2,896.7 2,890.3 0.22%287.5IL Granite City Madison County Trans Dist TOTAL
6.36.2 5.1 5.50.2DR 5.3 5.2 0.00%66.6 66.8 -0.30%Madison County Trans DistIL Granite City260.6264.9 200.5 197.99.4MB 212.8 188.1 0.27%2,651.5 2,606.2 1.74%Madison County Trans DistIL Granite City16.216.4 12.1 12.10.6VP 14.2 12.8 -6.02%178.6 217.3 -17.81%Madison County Trans DistIL Granite City
62.052.0 55.0 52.0 44.01.2 9.49%664.0 626.0 6.07%66.0IL Harrisburg Rides Mass Transit District TOTAL62.066.0 52.0 55.01.2MB 52.0 44.0 9.49%664.0 626.0 6.07%Rides Mass Transit DistrictIL Harrisburg
265.6176.2 159.8 197.5 115.68.4 1.78%1,933.5 1,951.2 -0.91%253.0IL Macomb Go West Transit TOTAL265.6253.0 176.2 159.88.4MB 197.5 115.6 1.78%1,933.5 1,951.2 -0.91%Go West TransitIL Macomb
322.6282.8 296.4 307.7 304.811.8 -4.98%3,518.6 3,571.8 -1.49%309.3IL Moline Rock Island County MMTD TOTAL
6.46.4 5.5 6.00.2DR 5.6 5.8 0.56%70.2 70.3 -0.14%Rock Island County MMTDIL Moline0.10.2 0.0 0.00.0FB 0.0 0.0 100.00%30.8 30.4 1.32%Rock Island County MMTDIL Moline
316.1302.7 277.3 290.411.7MB 302.1 299.0 -5.10%3,417.6 3,471.1 -1.54%Rock Island County MMTDIL Moline
241.6226.0 200.1 225.1 190.511.3 10.26%2,738.1 2,324.5 17.79%298.5IL Normal Bloomington-Normal Public Transit TOTAL
6.07.3 5.9 6.10.3DR 5.1 5.0 19.88%71.4 61.7 15.72%Bloomington-Normal Public Transit IL Normal235.6291.2 220.1 194.011.0MB 220.0 185.5 10.01%2,666.7 2,262.8 17.85%Bloomington-Normal Public Transit IL Normal
324.2281.8 296.1 285.5 260.610.5 6.24%3,578.7 3,500.1 2.25%346.7IL Peoria Greater Peoria Mass Tr Dist TOTAL
13.714.8 11.9 12.70.5DR 11.4 11.4 7.95%152.2 143.9 5.77%Greater Peoria Mass Tr DistIL Peoria310.5331.9 269.9 283.410.0MB 274.1 249.2 6.16%3,426.5 3,356.2 2.09%Greater Peoria Mass Tr DistIL Peoria
175.9NA NA 161.1 143.2NA NANA 1,906.2 NANAIL Rockford Rockford Mass Transit Dist TOTAL
8.5NA NA NANADR 7.4 7.2 NANA 93.9 NARockford Mass Transit DistIL Rockford167.4160.3 133.9 141.45.8MB 153.7 136.0 -4.70%1,782.4 1,812.3 -1.65%Rockford Mass Transit DistIL Rockford
1,534.71,234.6 1,067.0 1,219.3 1,040.253.7 2.95%13,614.0 12,660.8 7.53%1,604.7IL Urbana Champaign-Urbana MTD TOTAL
14.416.3 13.7 12.40.6DR 10.8 11.2 16.48%144.3 128.5 12.30%Champaign-Urbana MTDIL Urbana1,520.31,588.4 1,220.9 1,054.653.1MB 1,208.5 1,029.0 2.82%13,469.7 12,532.3 7.48%Champaign-Urbana MTDIL Urbana
308.9274.4 308.8 280.8 288.711.8 2.16%3,614.2 3,606.8 0.21%314.2IN Chesterton Northern IN Commuter TD TOTAL308.9314.2 274.4 308.811.8CR 280.8 288.7 2.16%3,614.2 3,606.8 0.21%Northern IN Commuter TDIN Chesterton
Modes: MB - Bus, DR - Demand Response, CR - Commuter Rail, HR - Heavy Rail, LR - Light Rail, AG - Automated Guideway, CC - Cable Car, FB - Ferry Boat, IP - Inclined Plane, IR - Intermediate Rail, MO - Monorail, TB - Trolleybus, VP - Vanpool
APTA PUBLIC TRANSPORTATION RIDERSHIP REPORT
State and Primary City
Transit Agency Mode
Average
Weekday Oct '14
Trips for Trips for
Nov '14
Trips for
Dec '14
Trips Thru
Dec '14
Trips for
Oct '13
Trips for
Nov '13
Trips for
Dec '13
Trips Thru
Dec '13 Quarterly
Change
Year-
Change
Fourth Quarter, 2014
(000's) (000's) (000's) (000's) (000's) (000's) (000's) (000's)(000's)
to-Date
19
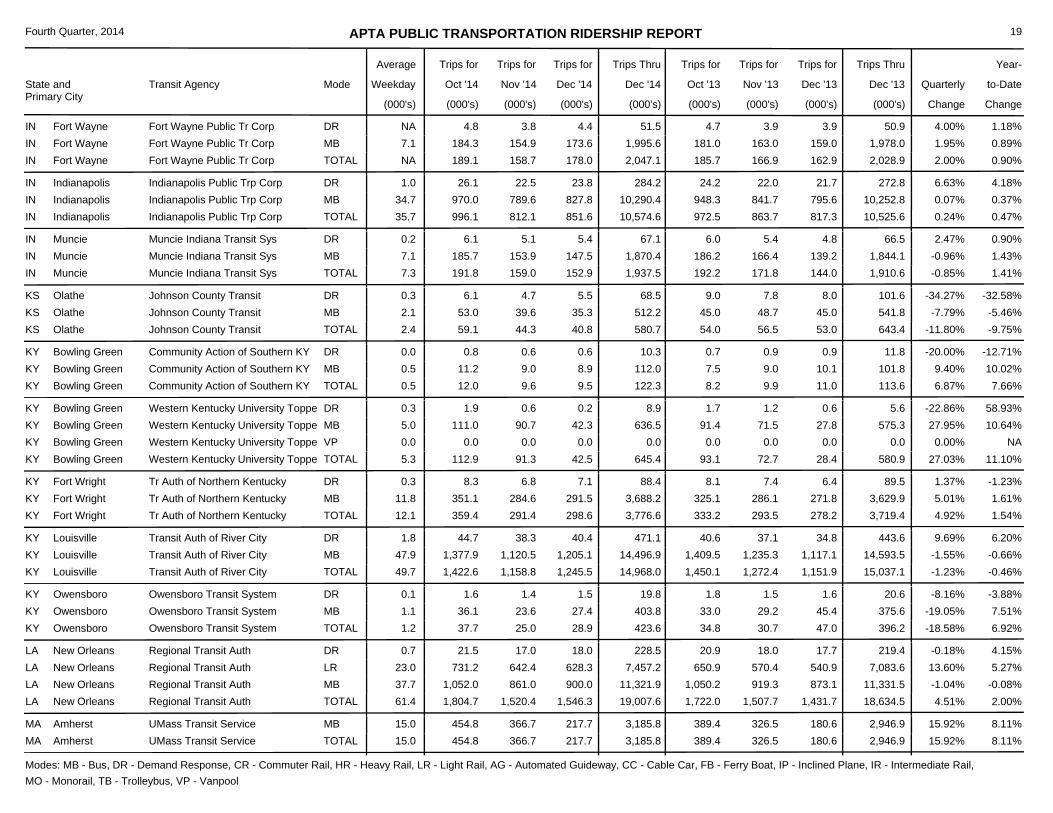
185.7158.7 178.0 166.9 162.9NA 2.00%2,047.1 2,028.9 0.90%189.1IN Fort Wayne Fort Wayne Public Tr Corp TOTAL
4.74.8 3.8 4.4NADR 3.9 3.9 4.00%51.5 50.9 1.18%Fort Wayne Public Tr CorpIN Fort Wayne181.0184.3 154.9 173.67.1MB 163.0 159.0 1.95%1,995.6 1,978.0 0.89%Fort Wayne Public Tr CorpIN Fort Wayne
972.5812.1 851.6 863.7 817.335.7 0.24%10,574.6 10,525.6 0.47%996.1IN Indianapolis Indianapolis Public Trp Corp TOTAL
24.226.1 22.5 23.81.0DR 22.0 21.7 6.63%284.2 272.8 4.18%Indianapolis Public Trp CorpIN Indianapolis948.3970.0 789.6 827.834.7MB 841.7 795.6 0.07%10,290.4 10,252.8 0.37%Indianapolis Public Trp CorpIN Indianapolis
192.2159.0 152.9 171.8 144.07.3 -0.85%1,937.5 1,910.6 1.41%191.8IN Muncie Muncie Indiana Transit Sys TOTAL
6.06.1 5.1 5.40.2DR 5.4 4.8 2.47%67.1 66.5 0.90%Muncie Indiana Transit SysIN Muncie186.2185.7 153.9 147.57.1MB 166.4 139.2 -0.96%1,870.4 1,844.1 1.43%Muncie Indiana Transit SysIN Muncie
54.044.3 40.8 56.5 53.02.4 -11.80%580.7 643.4 -9.75%59.1KS Olathe Johnson County Transit TOTAL
9.06.1 4.7 5.50.3DR 7.8 8.0 -34.27%68.5 101.6 -32.58%Johnson County Transit KS Olathe45.053.0 39.6 35.32.1MB 48.7 45.0 -7.79%512.2 541.8 -5.46%Johnson County Transit KS Olathe
8.29.6 9.5 9.9 11.00.5 6.87%122.3 113.6 7.66%12.0KY Bowling Green Community Action of Southern KY TOTAL
0.70.8 0.6 0.60.0DR 0.9 0.9 -20.00%10.3 11.8 -12.71%Community Action of Southern KYKY Bowling Green7.511.2 9.0 8.90.5MB 9.0 10.1 9.40%112.0 101.8 10.02%Community Action of Southern KYKY Bowling Green
93.191.3 42.5 72.7 28.45.3 27.03%645.4 580.9 11.10%112.9KY Bowling Green Western Kentucky University Toppe TOTAL
1.71.9 0.6 0.20.3DR 1.2 0.6 -22.86%8.9 5.6 58.93%Western Kentucky University ToppeKY Bowling Green91.4111.0 90.7 42.35.0MB 71.5 27.8 27.95%636.5 575.3 10.64%Western Kentucky University ToppeKY Bowling Green0.00.0 0.0 0.00.0VP 0.0 0.0 0.00%0.0 0.0 NAWestern Kentucky University ToppeKY Bowling Green
333.2291.4 298.6 293.5 278.212.1 4.92%3,776.6 3,719.4 1.54%359.4KY Fort Wright Tr Auth of Northern Kentucky TOTAL
8.18.3 6.8 7.10.3DR 7.4 6.4 1.37%88.4 89.5 -1.23%Tr Auth of Northern KentuckyKY Fort Wright325.1351.1 284.6 291.511.8MB 286.1 271.8 5.01%3,688.2 3,629.9 1.61%Tr Auth of Northern KentuckyKY Fort Wright
1,450.11,158.8 1,245.5 1,272.4 1,151.949.7 -1.23%14,968.0 15,037.1 -0.46%1,422.6KY Louisville Transit Auth of River City TOTAL
40.644.7 38.3 40.41.8DR 37.1 34.8 9.69%471.1 443.6 6.20%Transit Auth of River CityKY Louisville1,409.51,377.9 1,120.5 1,205.147.9MB 1,235.3 1,117.1 -1.55%14,496.9 14,593.5 -0.66%Transit Auth of River CityKY Louisville
34.825.0 28.9 30.7 47.01.2 -18.58%423.6 396.2 6.92%37.7KY Owensboro Owensboro Transit System TOTAL
1.81.6 1.4 1.50.1DR 1.5 1.6 -8.16%19.8 20.6 -3.88%Owensboro Transit SystemKY Owensboro33.036.1 23.6 27.41.1MB 29.2 45.4 -19.05%403.8 375.6 7.51%Owensboro Transit SystemKY Owensboro
1,722.01,520.4 1,546.3 1,507.7 1,431.761.4 4.51%19,007.6 18,634.5 2.00%1,804.7LA New Orleans Regional Transit Auth TOTAL
20.921.5 17.0 18.00.7DR 18.0 17.7 -0.18%228.5 219.4 4.15%Regional Transit AuthLA New Orleans650.9731.2 642.4 628.323.0LR 570.4 540.9 13.60%7,457.2 7,083.6 5.27%Regional Transit AuthLA New Orleans
1,050.21,052.0 861.0 900.037.7MB 919.3 873.1 -1.04%11,321.9 11,331.5 -0.08%Regional Transit AuthLA New Orleans
389.4366.7 217.7 326.5 180.615.0 15.92%3,185.8 2,946.9 8.11%454.8MA Amherst UMass Transit Service TOTAL389.4454.8 366.7 217.715.0MB 326.5 180.6 15.92%3,185.8 2,946.9 8.11%UMass Transit ServiceMA Amherst
Modes: MB - Bus, DR - Demand Response, CR - Commuter Rail, HR - Heavy Rail, LR - Light Rail, AG - Automated Guideway, CC - Cable Car, FB - Ferry Boat, IP - Inclined Plane, IR - Intermediate Rail, MO - Monorail, TB - Trolleybus, VP - Vanpool
APTA PUBLIC TRANSPORTATION RIDERSHIP REPORT
State and Primary City
Transit Agency Mode
Average
Weekday Oct '14
Trips for Trips for
Nov '14
Trips for
Dec '14
Trips Thru
Dec '14
Trips for
Oct '13
Trips for
Nov '13
Trips for
Dec '13
Trips Thru
Dec '13 Quarterly
Change
Year-
Change
Fourth Quarter, 2014
(000's) (000's) (000's) (000's) (000's) (000's) (000's) (000's)(000's)
to-Date
20
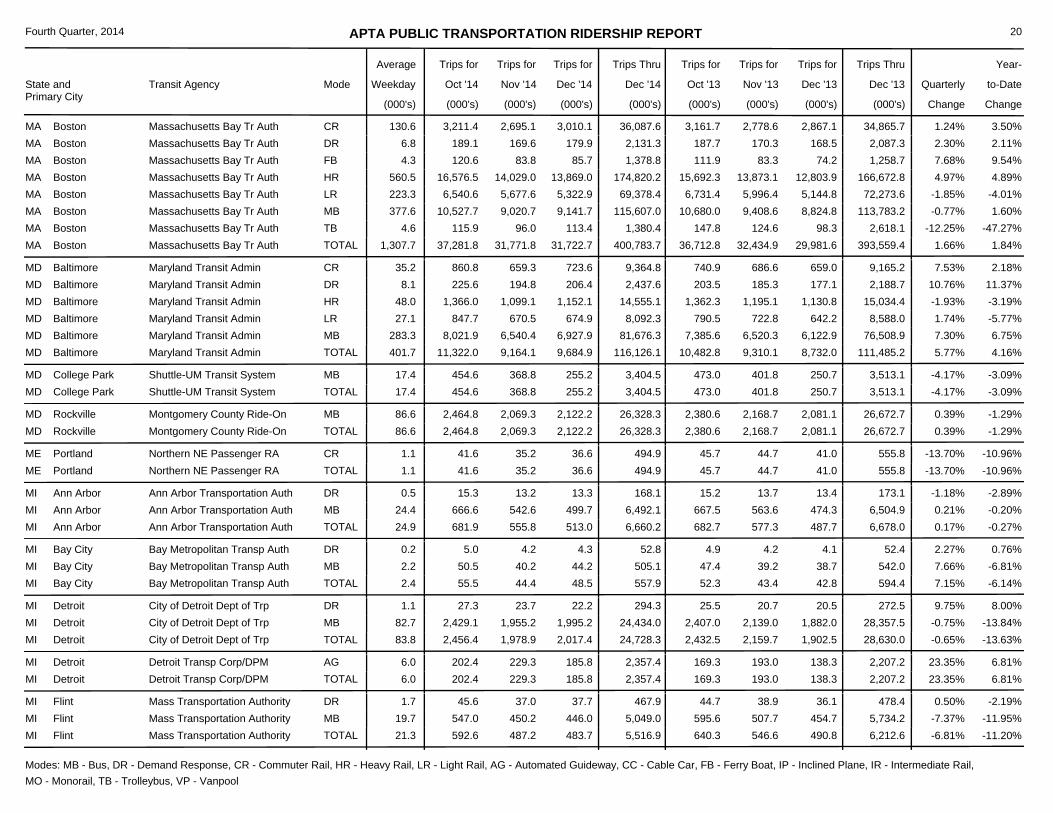
36,712.831,771.8 31,722.7 32,434.9 29,981.61,307.7 1.66%400,783.7 393,559.4 1.84%37,281.8MA Boston Massachusetts Bay Tr Auth TOTAL
3,161.73,211.4 2,695.1 3,010.1130.6CR 2,778.6 2,867.1 1.24%36,087.6 34,865.7 3.50%Massachusetts Bay Tr AuthMA Boston187.7189.1 169.6 179.96.8DR 170.3 168.5 2.30%2,131.3 2,087.3 2.11%Massachusetts Bay Tr AuthMA Boston111.9120.6 83.8 85.74.3FB 83.3 74.2 7.68%1,378.8 1,258.7 9.54%Massachusetts Bay Tr AuthMA Boston
15,692.316,576.5 14,029.0 13,869.0560.5HR 13,873.1 12,803.9 4.97%174,820.2 166,672.8 4.89%Massachusetts Bay Tr AuthMA Boston6,731.46,540.6 5,677.6 5,322.9223.3LR 5,996.4 5,144.8 -1.85%69,378.4 72,273.6 -4.01%Massachusetts Bay Tr AuthMA Boston
10,680.010,527.7 9,020.7 9,141.7377.6MB 9,408.6 8,824.8 -0.77%115,607.0 113,783.2 1.60%Massachusetts Bay Tr AuthMA Boston147.8115.9 96.0 113.44.6TB 124.6 98.3 -12.25%1,380.4 2,618.1 -47.27%Massachusetts Bay Tr AuthMA Boston
10,482.89,164.1 9,684.9 9,310.1 8,732.0401.7 5.77%116,126.1 111,485.2 4.16%11,322.0MD Baltimore Maryland Transit Admin TOTAL
740.9860.8 659.3 723.635.2CR 686.6 659.0 7.53%9,364.8 9,165.2 2.18%Maryland Transit AdminMD Baltimore203.5225.6 194.8 206.48.1DR 185.3 177.1 10.76%2,437.6 2,188.7 11.37%Maryland Transit AdminMD Baltimore
1,362.31,366.0 1,099.1 1,152.148.0HR 1,195.1 1,130.8 -1.93%14,555.1 15,034.4 -3.19%Maryland Transit AdminMD Baltimore790.5847.7 670.5 674.927.1LR 722.8 642.2 1.74%8,092.3 8,588.0 -5.77%Maryland Transit AdminMD Baltimore
7,385.68,021.9 6,540.4 6,927.9283.3MB 6,520.3 6,122.9 7.30%81,676.3 76,508.9 6.75%Maryland Transit AdminMD Baltimore
473.0368.8 255.2 401.8 250.717.4 -4.17%3,404.5 3,513.1 -3.09%454.6MD College Park Shuttle-UM Transit System TOTAL473.0454.6 368.8 255.217.4MB 401.8 250.7 -4.17%3,404.5 3,513.1 -3.09%Shuttle-UM Transit SystemMD College Park
2,380.62,069.3 2,122.2 2,168.7 2,081.186.6 0.39%26,328.3 26,672.7 -1.29%2,464.8MD Rockville Montgomery County Ride-On TOTAL2,380.62,464.8 2,069.3 2,122.286.6MB 2,168.7 2,081.1 0.39%26,328.3 26,672.7 -1.29%Montgomery County Ride-OnMD Rockville
45.735.2 36.6 44.7 41.01.1 -13.70%494.9 555.8 -10.96%41.6ME Portland Northern NE Passenger RA TOTAL45.741.6 35.2 36.61.1CR 44.7 41.0 -13.70%494.9 555.8 -10.96%Northern NE Passenger RAME Portland
682.7555.8 513.0 577.3 487.724.9 0.17%6,660.2 6,678.0 -0.27%681.9MI Ann Arbor Ann Arbor Transportation Auth TOTAL
15.215.3 13.2 13.30.5DR 13.7 13.4 -1.18%168.1 173.1 -2.89%Ann Arbor Transportation AuthMI Ann Arbor667.5666.6 542.6 499.724.4MB 563.6 474.3 0.21%6,492.1 6,504.9 -0.20%Ann Arbor Transportation AuthMI Ann Arbor
52.344.4 48.5 43.4 42.82.4 7.15%557.9 594.4 -6.14%55.5MI Bay City Bay Metropolitan Transp Auth TOTAL
4.95.0 4.2 4.30.2DR 4.2 4.1 2.27%52.8 52.4 0.76%Bay Metropolitan Transp AuthMI Bay City47.450.5 40.2 44.22.2MB 39.2 38.7 7.66%505.1 542.0 -6.81%Bay Metropolitan Transp AuthMI Bay City
2,432.51,978.9 2,017.4 2,159.7 1,902.583.8 -0.65%24,728.3 28,630.0 -13.63%2,456.4MI Detroit City of Detroit Dept of Trp TOTAL
25.527.3 23.7 22.21.1DR 20.7 20.5 9.75%294.3 272.5 8.00%City of Detroit Dept of TrpMI Detroit2,407.02,429.1 1,955.2 1,995.282.7MB 2,139.0 1,882.0 -0.75%24,434.0 28,357.5 -13.84%City of Detroit Dept of TrpMI Detroit
169.3229.3 185.8 193.0 138.36.0 23.35%2,357.4 2,207.2 6.81%202.4MI Detroit Detroit Transp Corp/DPM TOTAL169.3202.4 229.3 185.86.0AG 193.0 138.3 23.35%2,357.4 2,207.2 6.81%Detroit Transp Corp/DPMMI Detroit
640.3487.2 483.7 546.6 490.821.3 -6.81%5,516.9 6,212.6 -11.20%592.6MI Flint Mass Transportation Authority TOTAL
44.745.6 37.0 37.71.7DR 38.9 36.1 0.50%467.9 478.4 -2.19%Mass Transportation AuthorityMI Flint595.6547.0 450.2 446.019.7MB 507.7 454.7 -7.37%5,049.0 5,734.2 -11.95%Mass Transportation AuthorityMI Flint
Modes: MB - Bus, DR - Demand Response, CR - Commuter Rail, HR - Heavy Rail, LR - Light Rail, AG - Automated Guideway, CC - Cable Car, FB - Ferry Boat, IP - Inclined Plane, IR - Intermediate Rail, MO - Monorail, TB - Trolleybus, VP - Vanpool

APTA PUBLIC TRANSPORTATION RIDERSHIP REPORT
State and Primary City
Transit Agency Mode
Average
Weekday Oct '14
Trips for Trips for
Nov '14
Trips for
Dec '14
Trips Thru
Dec '14
Trips for
Oct '13
Trips for
Nov '13
Trips for
Dec '13
Trips Thru
Dec '13 Quarterly
Change
Year-
Change
Fourth Quarter, 2014
(000's) (000's) (000's) (000's) (000's) (000's) (000's) (000's)(000's)
to-Date
21
1,457.01,066.7 930.2 1,150.0 880.4NA -0.60%12,493.1 12,535.2 -0.34%1,469.7MI Grand Rapids Interurban Transit Partnership TOTAL
37.235.8 28.8 32.2NADR 32.0 30.7 -3.10%398.8 408.3 -2.33%Interurban Transit PartnershipMI Grand Rapids1,414.21,429.0 1,033.7 893.847.8MB 1,113.4 845.4 -0.49%12,038.5 12,070.9 -0.27%Interurban Transit PartnershipMI Grand Rapids
5.64.9 4.2 4.20.2VP 4.6 4.3 -8.28%55.8 56.0 -0.36%Interurban Transit PartnershipMI Grand Rapids
324.7257.5 248.8 285.5 238.411.4 -2.29%3,171.0 3,120.1 1.63%322.9MI Kalamazoo Kalamazoo Metro Transit Sys TOTAL
12.914.2 11.1 11.90.5DR 11.0 9.6 11.04%143.4 132.6 8.14%Kalamazoo Metro Transit SysMI Kalamazoo311.8308.7 246.4 236.910.9MB 274.5 228.8 -2.83%3,027.6 2,987.5 1.34%Kalamazoo Metro Transit SysMI Kalamazoo
1,317.21,110.5 801.1 1,159.0 755.839.8 0.54%11,602.4 11,747.6 -1.24%1,338.0MI Lansing Capital Area Transp Authority TOTAL
48.948.5 41.1 41.11.8DR 42.4 38.4 0.77%516.0 510.4 1.10%Capital Area Transp AuthorityMI Lansing1,268.31,289.5 1,069.4 760.038.0MB 1,116.6 717.4 0.54%11,086.4 11,237.2 -1.34%Capital Area Transp AuthorityMI Lansing
39.333.9 35.3 33.5 31.91.5 4.58%422.9 417.9 1.20%40.3MI Monroe Lake Erie Transp Commission TOTAL
12.812.3 10.6 10.50.5DR 10.7 9.3 1.83%126.8 134.8 -5.93%Lake Erie Transp CommissionMI Monroe26.528.0 23.3 24.81.0MB 22.8 22.6 5.84%296.1 283.1 4.59%Lake Erie Transp CommissionMI Monroe
68.951.7 57.1 60.1 55.82.5 -5.79%697.6 731.1 -4.58%65.3MI Muskegon Heights Muskegon Area Transit Sys TOTAL
2.72.7 2.3 2.40.1DR 2.4 2.4 -1.33%29.1 27.6 5.43%Muskegon Area Transit SysMI Muskegon Heights66.262.6 49.4 54.72.4MB 57.7 53.4 -5.98%668.5 703.5 -4.98%Muskegon Area Transit SysMI Muskegon Heights
147.1121.6 128.9 127.6 121.05.0 0.91%1,609.2 1,539.7 4.51%148.8MI Port Huron Blue Water Area Transp Comm TOTAL
59.259.1 47.7 48.91.9DR 50.0 43.8 1.76%619.5 584.9 5.92%Blue Water Area Transp CommMI Port Huron87.989.7 73.9 80.03.2MB 77.6 77.2 0.37%989.7 954.8 3.66%Blue Water Area Transp CommMI Port Huron
262.3210.8 212.0 217.2 203.910.3 0.29%2,812.6 2,706.2 3.93%262.6MN Burnsville Minnesota Valley Transit Auth TOTAL
2.22.5 2.0 2.10.1DR 1.9 1.6 15.79%24.0 21.9 9.59%Minnesota Valley Transit AuthMN Burnsville260.1260.1 208.8 209.910.2MB 215.3 202.3 0.16%2,788.6 2,684.3 3.89%Minnesota Valley Transit AuthMN Burnsville
98.680.8 78.2 78.9 75.44.1 2.53%1,107.8 1,032.9 7.25%100.3MN Eden Prairie Southwest Metro Transit TOTAL98.6100.3 80.8 78.24.1MB 78.9 75.4 2.53%1,107.8 1,032.9 7.25%Southwest Metro TransitMN Eden Prairie
7,578.06,911.4 6,855.4 6,606.2 6,235.1284.1 6.69%84,535.7 81,369.1 3.89%8,019.5MN Minneapolis Metro Transit TOTAL
63.857.8 57.0 50.32.5CR 53.8 59.1 -6.56%721.2 787.3 -8.40%Metro TransitMN Minneapolis906.91,943.3 1,758.7 1,660.162.5LR 795.6 828.5 >100%16,000.1 10,163.0 57.43%Metro TransitMN Minneapolis
6,607.36,018.4 5,095.7 5,145.0219.1MB 5,756.8 5,347.5 -8.20%67,814.4 70,418.8 -3.70%Metro TransitMN Minneapolis
49.438.0 38.0 39.8 38.32.0 -2.98%509.0 506.5 0.49%47.7MN Plymouth Plymouth Metrolink & DAR TOTAL
4.03.8 3.1 3.50.2DR 3.4 3.3 -2.80%41.8 41.7 0.24%Plymouth Metrolink & DARMN Plymouth45.443.9 34.9 34.51.8MB 36.4 35.0 -3.00%467.2 464.8 0.52%Plymouth Metrolink & DARMN Plymouth
224.4171.6 172.9 188.8 168.58.8 -3.83%2,187.9 2,251.3 -2.82%214.9MN Saint Cloud St. Cloud Metrop Trans Comm TOTAL
10.011.2 9.2 10.00.5DR 8.8 9.2 8.57%125.4 118.3 6.00%St. Cloud Metrop Trans CommMN Saint Cloud214.4203.7 162.4 162.98.3MB 180.0 159.3 -4.46%2,062.5 2,133.0 -3.31%St. Cloud Metrop Trans CommMN Saint Cloud
Modes: MB - Bus, DR - Demand Response, CR - Commuter Rail, HR - Heavy Rail, LR - Light Rail, AG - Automated Guideway, CC - Cable Car, FB - Ferry Boat, IP - Inclined Plane, IR - Intermediate Rail, MO - Monorail, TB - Trolleybus, VP - Vanpool

APTA PUBLIC TRANSPORTATION RIDERSHIP REPORT
State and Primary City
Transit Agency Mode
Average
Weekday Oct '14
Trips for Trips for
Nov '14
Trips for
Dec '14
Trips Thru
Dec '14
Trips for
Oct '13
Trips for
Nov '13
Trips for
Dec '13
Trips Thru
Dec '13 Quarterly
Change
Year-
Change
Fourth Quarter, 2014
(000's) (000's) (000's) (000's) (000's) (000's) (000's) (000's)(000's)
to-Date
22
1,511.51,232.2 1,274.3 1,302.5 1,218.153.4 -0.20%16,293.3 16,166.0 0.79%1,517.7MO Kansas City Kansas City Area Trp Auth TOTAL
35.434.4 29.1 29.81.4DR 30.0 28.8 -0.96%375.7 388.5 -3.29%Kansas City Area Trp AuthMO Kansas City1,470.61,477.0 1,198.0 1,239.651.8MB 1,267.5 1,184.8 -0.21%15,851.5 15,711.3 0.89%Kansas City Area Trp AuthMO Kansas City
5.56.3 5.1 4.90.3VP 5.0 4.5 8.67%66.1 66.2 -0.15%Kansas City Area Trp AuthMO Kansas City
4,541.73,535.5 3,649.7 3,851.6 3,597.6146.8 -2.95%47,730.1 47,596.2 0.28%4,451.7MO Saint Louis Bi-State Dev Agency TOTAL
51.951.7 44.0 47.61.9DR 47.2 46.1 -1.31%576.1 586.1 -1.71%Bi-State Dev AgencyMO Saint Louis1,664.81,562.3 1,201.5 1,244.949.9LR 1,349.4 1,250.5 -6.00%17,182.1 17,396.2 -1.23%Bi-State Dev AgencyMO Saint Louis2,825.02,837.7 2,290.0 2,357.295.1MB 2,455.0 2,301.0 -1.27%29,971.9 29,613.9 1.21%Bi-State Dev AgencyMO Saint Louis
137.1118.7 124.8 123.0 110.85.2 3.32%1,541.0 1,481.0 4.05%139.7MO Springfield City Utilities of Springfield TOTAL
1.71.7 1.5 1.40.1DR 1.5 1.3 2.22%17.3 19.2 -9.90%City Utilities of SpringfieldMO Springfield135.4138.0 117.2 123.45.1MB 121.5 109.5 3.33%1,523.7 1,461.8 4.23%City Utilities of SpringfieldMO Springfield
135.9111.5 115.7 115.7 112.84.8 -0.33%1,466.9 NA NA136.0NC Asheville City of Asheville, Asheville Redefine TOTAL
2.52.5 1.9 2.10.1DR 2.1 2.1 -2.99%26.1 NA NACity of Asheville, Asheville RedefineNC Asheville133.4133.5 109.6 113.64.7MB 113.6 110.7 -0.28%1,440.8 1,429.7 0.78%City of Asheville, Asheville RedefineNC Asheville
238.4197.6 105.2 191.8 103.27.8 4.18%1,814.9 1,710.7 6.09%252.9NC Boone AppalCART TOTAL238.4252.9 197.6 105.27.8MB 191.8 103.2 4.18%1,814.9 1,710.7 6.09%AppalCARTNC Boone
723.4555.2 404.5 626.7 395.826.6 -4.11%6,641.1 6,880.4 -3.48%714.4NC Chapel Hill Chapel Hill Transit TOTAL
6.15.0 4.0 3.90.2DR 5.4 4.7 -20.37%58.0 66.4 -12.65%Chapel Hill TransitNC Chapel Hill717.3709.4 551.2 400.626.4MB 621.3 391.1 -3.96%6,583.1 6,814.0 -3.39%Chapel Hill TransitNC Chapel Hill
2,370.81,990.9 2,040.0 2,076.3 1,995.1NA -0.13%25,351.8 25,967.9 -2.37%2,403.1NC Charlotte Charlotte Area Transit TOTAL
33.834.5 27.7 30.11.4DR 28.9 27.1 2.78%362.9 373.0 -2.71%Charlotte Area TransitNC Charlotte455.0474.7 386.2 398.715.8LR 402.7 404.6 -0.21%5,130.4 4,977.8 3.07%Charlotte Area TransitNC Charlotte
1,860.71,872.4 1,560.4 1,593.069.1MB 1,626.7 1,545.4 -0.14%19,621.7 20,382.3 -3.73%Charlotte Area TransitNC Charlotte21.321.5 16.6 18.20.9VP 18.0 18.0 -1.75%236.8 234.8 0.85%Charlotte Area TransitNC Charlotte
463.0377.2 348.4 396.1 348.016.0 -1.96%4,607.8 4,803.3 -4.07%457.9NC Greensboro Greensboro Transit Auth TOTAL
21.519.9 17.0 17.60.7DR 18.1 17.6 -4.72%225.6 230.1 -1.96%Greensboro Transit AuthNC Greensboro441.5438.0 360.2 330.815.2MB 378.0 330.4 -1.82%4,382.2 4,573.2 -4.18%Greensboro Transit AuthNC Greensboro
7,097.55,923.9 6,408.5 6,133.2 6,205.1262.2 -0.24%76,721.8 76,363.6 0.47%7,057.5NJ Jersey City Port Authority of NY & NJ TOTAL
218.5214.2 204.2 238.47.2AG 194.3 244.7 -0.11%1,979.9 2,386.9 -17.05%Port Authority of NY & NJNJ Jersey City102.1108.5 80.5 90.64.3FB 79.3 76.3 8.50%1,092.9 1,178.2 -7.24%Port Authority of NY & NJNJ Jersey City
6,776.96,734.8 5,639.2 6,079.5250.7HR 5,859.6 5,884.1 -0.36%73,649.0 72,798.5 1.17%Port Authority of NY & NJNJ Jersey City
954.8773.9 814.6 836.6 812.535.3 -3.63%10,007.3 10,542.2 -5.07%920.9NJ Lindenwold Port Authority Transit Corp TOTAL954.8920.9 773.9 814.635.3HR 836.6 812.5 -3.63%10,007.3 10,542.2 -5.07%Port Authority Transit CorpNJ Lindenwold
Modes: MB - Bus, DR - Demand Response, CR - Commuter Rail, HR - Heavy Rail, LR - Light Rail, AG - Automated Guideway, CC - Cable Car, FB - Ferry Boat, IP - Inclined Plane, IR - Intermediate Rail, MO - Monorail, TB - Trolleybus, VP - Vanpool
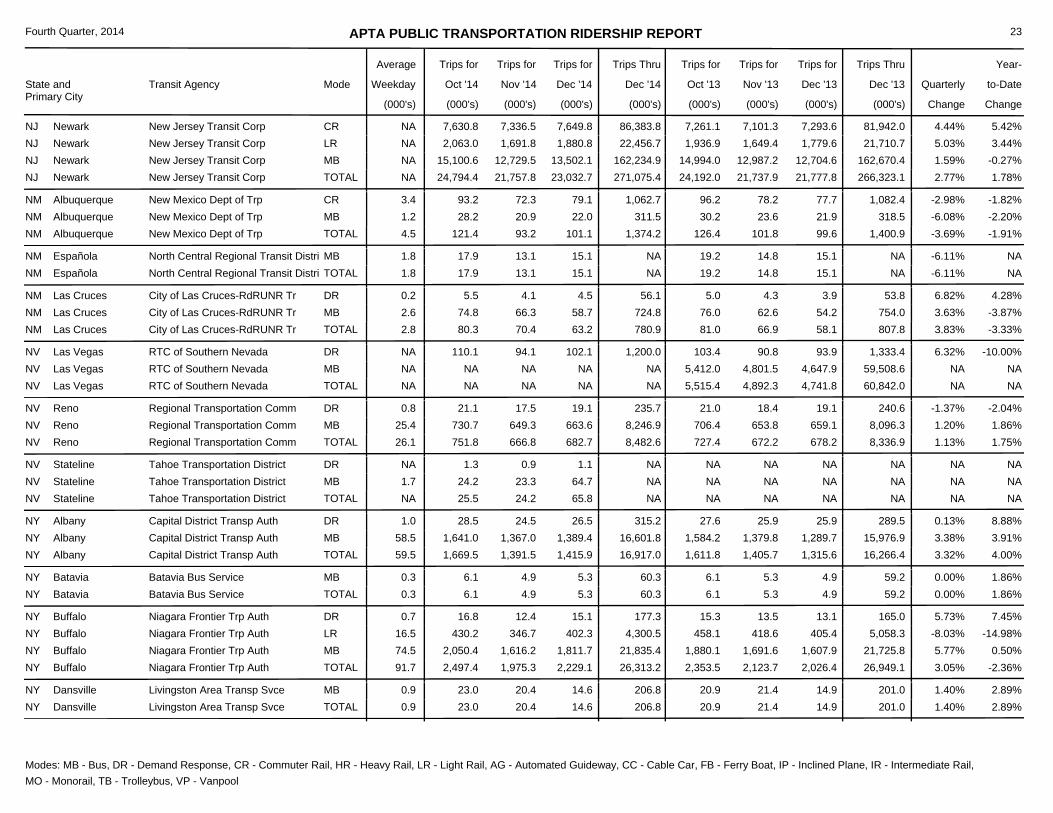
APTA PUBLIC TRANSPORTATION RIDERSHIP REPORT
State and Primary City
Transit Agency Mode
Average
Weekday Oct '14
Trips for Trips for
Nov '14
Trips for
Dec '14
Trips Thru
Dec '14
Trips for
Oct '13
Trips for
Nov '13
Trips for
Dec '13
Trips Thru
Dec '13 Quarterly
Change
Year-
Change
Fourth Quarter, 2014
(000's) (000's) (000's) (000's) (000's) (000's) (000's) (000's)(000's)
to-Date
23
24,192.021,757.8 23,032.7 21,737.9 21,777.8NA 2.77%271,075.4 266,323.1 1.78%24,794.4NJ Newark New Jersey Transit Corp TOTAL
7,261.17,630.8 7,336.5 7,649.8NACR 7,101.3 7,293.6 4.44%86,383.8 81,942.0 5.42%New Jersey Transit CorpNJ Newark1,936.92,063.0 1,691.8 1,880.8NALR 1,649.4 1,779.6 5.03%22,456.7 21,710.7 3.44%New Jersey Transit CorpNJ Newark
14,994.015,100.6 12,729.5 13,502.1NAMB 12,987.2 12,704.6 1.59%162,234.9 162,670.4 -0.27%New Jersey Transit CorpNJ Newark
126.493.2 101.1 101.8 99.64.5 -3.69%1,374.2 1,400.9 -1.91%121.4NM Albuquerque New Mexico Dept of Trp TOTAL
96.293.2 72.3 79.13.4CR 78.2 77.7 -2.98%1,062.7 1,082.4 -1.82%New Mexico Dept of TrpNM Albuquerque30.228.2 20.9 22.01.2MB 23.6 21.9 -6.08%311.5 318.5 -2.20%New Mexico Dept of TrpNM Albuquerque
19.213.1 15.1 14.8 15.11.8 -6.11%NA NA NA17.9NM Española North Central Regional Transit Distri TOTAL19.217.9 13.1 15.11.8MB 14.8 15.1 -6.11%NA NA NANorth Central Regional Transit DistriNM Española
81.070.4 63.2 66.9 58.12.8 3.83%780.9 807.8 -3.33%80.3NM Las Cruces City of Las Cruces-RdRUNR Tr TOTAL
5.05.5 4.1 4.50.2DR 4.3 3.9 6.82%56.1 53.8 4.28%City of Las Cruces-RdRUNR TrNM Las Cruces76.074.8 66.3 58.72.6MB 62.6 54.2 3.63%724.8 754.0 -3.87%City of Las Cruces-RdRUNR TrNM Las Cruces
5,515.4NA NA 4,892.3 4,741.8NA NANA 60,842.0 NANANV Las Vegas RTC of Southern Nevada TOTAL
103.4110.1 94.1 102.1NADR 90.8 93.9 6.32%1,200.0 1,333.4 -10.00%RTC of Southern NevadaNV Las Vegas5,412.0NA NA NANAMB 4,801.5 4,647.9 NANA 59,508.6 NARTC of Southern NevadaNV Las Vegas
727.4666.8 682.7 672.2 678.226.1 1.13%8,482.6 8,336.9 1.75%751.8NV Reno Regional Transportation Comm TOTAL
21.021.1 17.5 19.10.8DR 18.4 19.1 -1.37%235.7 240.6 -2.04%Regional Transportation CommNV Reno706.4730.7 649.3 663.625.4MB 653.8 659.1 1.20%8,246.9 8,096.3 1.86%Regional Transportation CommNV Reno
NA24.2 65.8 NA NANA NANA NA NA25.5NV Stateline Tahoe Transportation District TOTAL
NA1.3 0.9 1.1NADR NA NA NANA NA NATahoe Transportation DistrictNV StatelineNA24.2 23.3 64.71.7MB NA NA NANA NA NATahoe Transportation DistrictNV Stateline
1,611.81,391.5 1,415.9 1,405.7 1,315.659.5 3.32%16,917.0 16,266.4 4.00%1,669.5NY Albany Capital District Transp Auth TOTAL
27.628.5 24.5 26.51.0DR 25.9 25.9 0.13%315.2 289.5 8.88%Capital District Transp AuthNY Albany1,584.21,641.0 1,367.0 1,389.458.5MB 1,379.8 1,289.7 3.38%16,601.8 15,976.9 3.91%Capital District Transp AuthNY Albany
6.14.9 5.3 5.3 4.90.3 0.00%60.3 59.2 1.86%6.1NY Batavia Batavia Bus Service TOTAL6.16.1 4.9 5.30.3MB 5.3 4.9 0.00%60.3 59.2 1.86%Batavia Bus ServiceNY Batavia
2,353.51,975.3 2,229.1 2,123.7 2,026.491.7 3.05%26,313.2 26,949.1 -2.36%2,497.4NY Buffalo Niagara Frontier Trp Auth TOTAL
15.316.8 12.4 15.10.7DR 13.5 13.1 5.73%177.3 165.0 7.45%Niagara Frontier Trp AuthNY Buffalo458.1430.2 346.7 402.316.5LR 418.6 405.4 -8.03%4,300.5 5,058.3 -14.98%Niagara Frontier Trp AuthNY Buffalo
1,880.12,050.4 1,616.2 1,811.774.5MB 1,691.6 1,607.9 5.77%21,835.4 21,725.8 0.50%Niagara Frontier Trp AuthNY Buffalo
20.920.4 14.6 21.4 14.90.9 1.40%206.8 201.0 2.89%23.0NY Dansville Livingston Area Transp Svce TOTAL20.923.0 20.4 14.60.9MB 21.4 14.9 1.40%206.8 201.0 2.89%Livingston Area Transp SvceNY Dansville
Modes: MB - Bus, DR - Demand Response, CR - Commuter Rail, HR - Heavy Rail, LR - Light Rail, AG - Automated Guideway, CC - Cable Car, FB - Ferry Boat, IP - Inclined Plane, IR - Intermediate Rail, MO - Monorail, TB - Trolleybus, VP - Vanpool
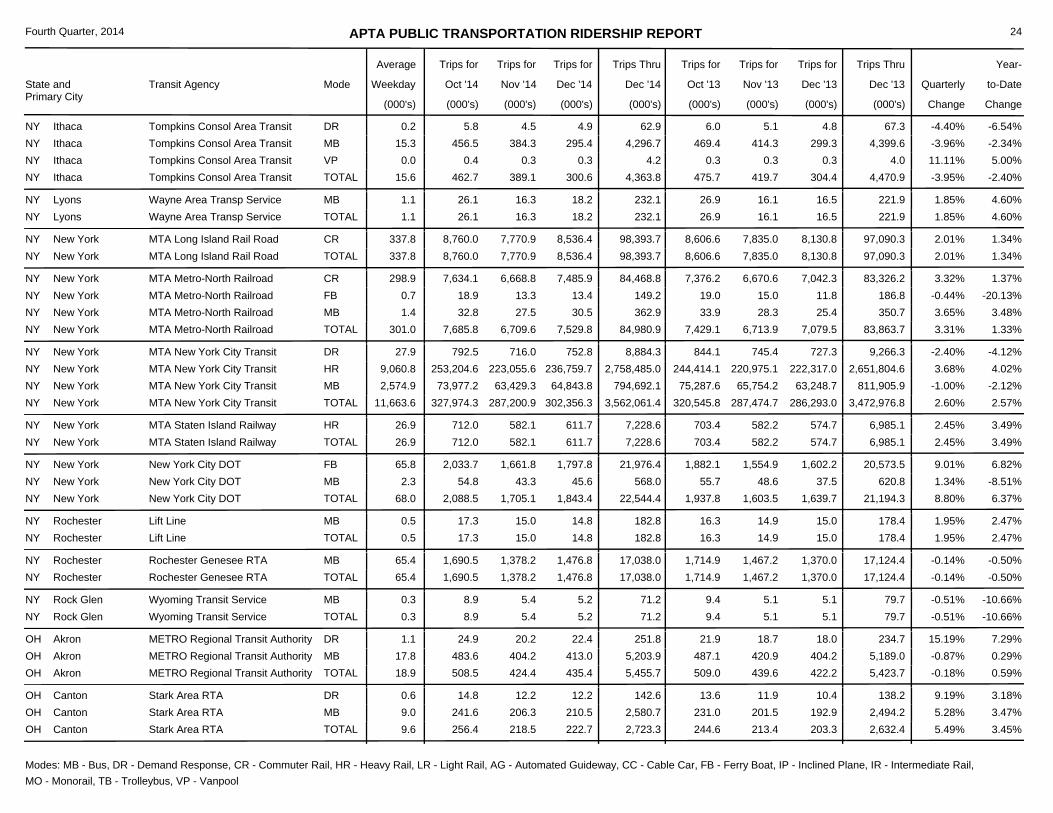
APTA PUBLIC TRANSPORTATION RIDERSHIP REPORT
State and Primary City
Transit Agency Mode
Average
Weekday Oct '14
Trips for Trips for
Nov '14
Trips for
Dec '14
Trips Thru
Dec '14
Trips for
Oct '13
Trips for
Nov '13
Trips for
Dec '13
Trips Thru
Dec '13 Quarterly
Change
Year-
Change
Fourth Quarter, 2014
(000's) (000's) (000's) (000's) (000's) (000's) (000's) (000's)(000's)
to-Date
24
475.7389.1 300.6 419.7 304.415.6 -3.95%4,363.8 4,470.9 -2.40%462.7NY Ithaca Tompkins Consol Area Transit TOTAL
6.05.8 4.5 4.90.2DR 5.1 4.8 -4.40%62.9 67.3 -6.54%Tompkins Consol Area TransitNY Ithaca469.4456.5 384.3 295.415.3MB 414.3 299.3 -3.96%4,296.7 4,399.6 -2.34%Tompkins Consol Area TransitNY Ithaca
0.30.4 0.3 0.30.0VP 0.3 0.3 11.11%4.2 4.0 5.00%Tompkins Consol Area TransitNY Ithaca
26.916.3 18.2 16.1 16.51.1 1.85%232.1 221.9 4.60%26.1NY Lyons Wayne Area Transp Service TOTAL26.926.1 16.3 18.21.1MB 16.1 16.5 1.85%232.1 221.9 4.60%Wayne Area Transp ServiceNY Lyons
8,606.67,770.9 8,536.4 7,835.0 8,130.8337.8 2.01%98,393.7 97,090.3 1.34%8,760.0NY New York MTA Long Island Rail Road TOTAL8,606.68,760.0 7,770.9 8,536.4337.8CR 7,835.0 8,130.8 2.01%98,393.7 97,090.3 1.34%MTA Long Island Rail RoadNY New York
7,429.16,709.6 7,529.8 6,713.9 7,079.5301.0 3.31%84,980.9 83,863.7 1.33%7,685.8NY New York MTA Metro-North Railroad TOTAL
7,376.27,634.1 6,668.8 7,485.9298.9CR 6,670.6 7,042.3 3.32%84,468.8 83,326.2 1.37%MTA Metro-North RailroadNY New York19.018.9 13.3 13.40.7FB 15.0 11.8 -0.44%149.2 186.8 -20.13%MTA Metro-North RailroadNY New York33.932.8 27.5 30.51.4MB 28.3 25.4 3.65%362.9 350.7 3.48%MTA Metro-North RailroadNY New York
320,545.8287,200.9 302,356.3 287,474.7 286,293.011,663.6 2.60%3,562,061.4 3,472,976.8 2.57%327,974.3NY New York MTA New York City Transit TOTAL
844.1792.5 716.0 752.827.9DR 745.4 727.3 -2.40%8,884.3 9,266.3 -4.12%MTA New York City TransitNY New York244,414.1253,204.6 223,055.6 236,759.79,060.8HR 220,975.1 222,317.0 3.68%2,758,485.0 2,651,804.6 4.02%MTA New York City TransitNY New York75,287.673,977.2 63,429.3 64,843.82,574.9MB 65,754.2 63,248.7 -1.00%794,692.1 811,905.9 -2.12%MTA New York City TransitNY New York
703.4582.1 611.7 582.2 574.726.9 2.45%7,228.6 6,985.1 3.49%712.0NY New York MTA Staten Island Railway TOTAL703.4712.0 582.1 611.726.9HR 582.2 574.7 2.45%7,228.6 6,985.1 3.49%MTA Staten Island RailwayNY New York
1,937.81,705.1 1,843.4 1,603.5 1,639.768.0 8.80%22,544.4 21,194.3 6.37%2,088.5NY New York New York City DOT TOTAL
1,882.12,033.7 1,661.8 1,797.865.8FB 1,554.9 1,602.2 9.01%21,976.4 20,573.5 6.82%New York City DOTNY New York55.754.8 43.3 45.62.3MB 48.6 37.5 1.34%568.0 620.8 -8.51%New York City DOTNY New York
16.315.0 14.8 14.9 15.00.5 1.95%182.8 178.4 2.47%17.3NY Rochester Lift Line TOTAL16.317.3 15.0 14.80.5MB 14.9 15.0 1.95%182.8 178.4 2.47%Lift LineNY Rochester
1,714.91,378.2 1,476.8 1,467.2 1,370.065.4 -0.14%17,038.0 17,124.4 -0.50%1,690.5NY Rochester Rochester Genesee RTA TOTAL1,714.91,690.5 1,378.2 1,476.865.4MB 1,467.2 1,370.0 -0.14%17,038.0 17,124.4 -0.50%Rochester Genesee RTANY Rochester
9.45.4 5.2 5.1 5.10.3 -0.51%71.2 79.7 -10.66%8.9NY Rock Glen Wyoming Transit Service TOTAL9.48.9 5.4 5.20.3MB 5.1 5.1 -0.51%71.2 79.7 -10.66%Wyoming Transit ServiceNY Rock Glen
509.0424.4 435.4 439.6 422.218.9 -0.18%5,455.7 5,423.7 0.59%508.5OH Akron METRO Regional Transit Authority TOTAL
21.924.9 20.2 22.41.1DR 18.7 18.0 15.19%251.8 234.7 7.29%METRO Regional Transit AuthorityOH Akron487.1483.6 404.2 413.017.8MB 420.9 404.2 -0.87%5,203.9 5,189.0 0.29%METRO Regional Transit AuthorityOH Akron
244.6218.5 222.7 213.4 203.39.6 5.49%2,723.3 2,632.4 3.45%256.4OH Canton Stark Area RTA TOTAL
13.614.8 12.2 12.20.6DR 11.9 10.4 9.19%142.6 138.2 3.18%Stark Area RTAOH Canton231.0241.6 206.3 210.59.0MB 201.5 192.9 5.28%2,580.7 2,494.2 3.47%Stark Area RTAOH Canton
Modes: MB - Bus, DR - Demand Response, CR - Commuter Rail, HR - Heavy Rail, LR - Light Rail, AG - Automated Guideway, CC - Cable Car, FB - Ferry Boat, IP - Inclined Plane, IR - Intermediate Rail, MO - Monorail, TB - Trolleybus, VP - Vanpool
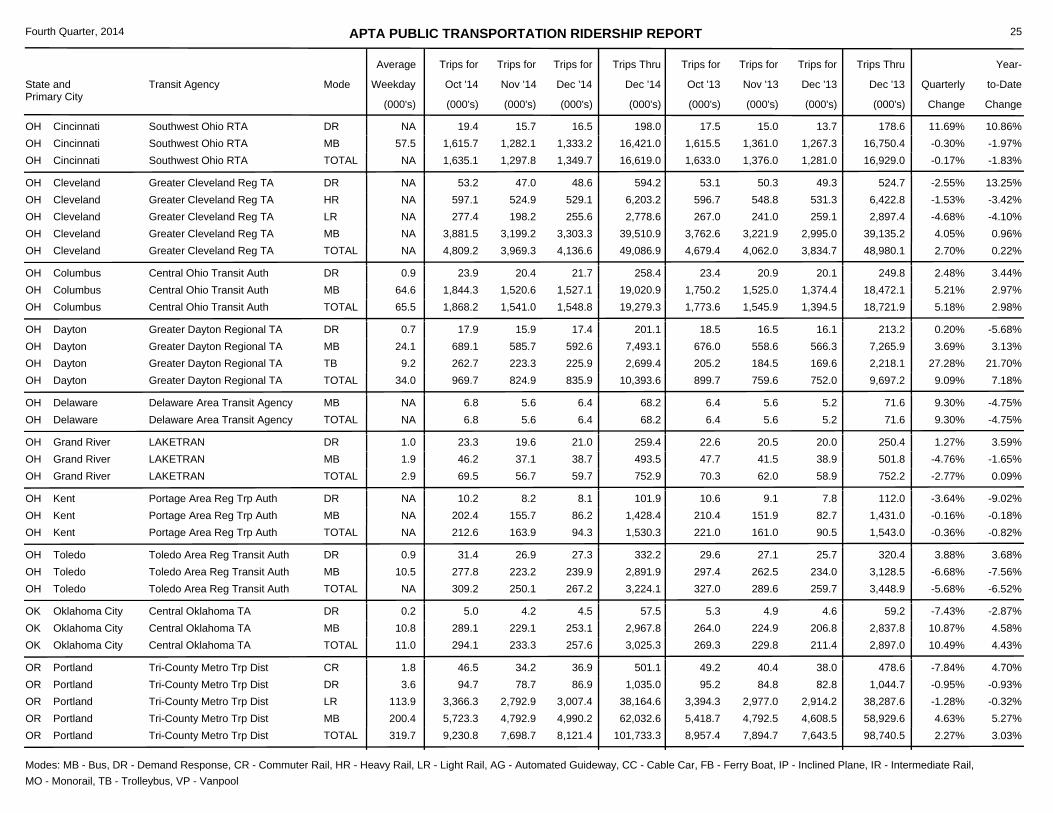
APTA PUBLIC TRANSPORTATION RIDERSHIP REPORT
State and Primary City
Transit Agency Mode
Average
Weekday Oct '14
Trips for Trips for
Nov '14
Trips for
Dec '14
Trips Thru
Dec '14
Trips for
Oct '13
Trips for
Nov '13
Trips for
Dec '13
Trips Thru
Dec '13 Quarterly
Change
Year-
Change
Fourth Quarter, 2014
(000's) (000's) (000's) (000's) (000's) (000's) (000's) (000's)(000's)
to-Date
25
1,633.01,297.8 1,349.7 1,376.0 1,281.0NA -0.17%16,619.0 16,929.0 -1.83%1,635.1OH Cincinnati Southwest Ohio RTA TOTAL
17.519.4 15.7 16.5NADR 15.0 13.7 11.69%198.0 178.6 10.86%Southwest Ohio RTAOH Cincinnati1,615.51,615.7 1,282.1 1,333.257.5MB 1,361.0 1,267.3 -0.30%16,421.0 16,750.4 -1.97%Southwest Ohio RTAOH Cincinnati
4,679.43,969.3 4,136.6 4,062.0 3,834.7NA 2.70%49,086.9 48,980.1 0.22%4,809.2OH Cleveland Greater Cleveland Reg TA TOTAL
53.153.2 47.0 48.6NADR 50.3 49.3 -2.55%594.2 524.7 13.25%Greater Cleveland Reg TAOH Cleveland596.7597.1 524.9 529.1NAHR 548.8 531.3 -1.53%6,203.2 6,422.8 -3.42%Greater Cleveland Reg TAOH Cleveland267.0277.4 198.2 255.6NALR 241.0 259.1 -4.68%2,778.6 2,897.4 -4.10%Greater Cleveland Reg TAOH Cleveland
3,762.63,881.5 3,199.2 3,303.3NAMB 3,221.9 2,995.0 4.05%39,510.9 39,135.2 0.96%Greater Cleveland Reg TAOH Cleveland
1,773.61,541.0 1,548.8 1,545.9 1,394.565.5 5.18%19,279.3 18,721.9 2.98%1,868.2OH Columbus Central Ohio Transit Auth TOTAL
23.423.9 20.4 21.70.9DR 20.9 20.1 2.48%258.4 249.8 3.44%Central Ohio Transit AuthOH Columbus1,750.21,844.3 1,520.6 1,527.164.6MB 1,525.0 1,374.4 5.21%19,020.9 18,472.1 2.97%Central Ohio Transit AuthOH Columbus
899.7824.9 835.9 759.6 752.034.0 9.09%10,393.6 9,697.2 7.18%969.7OH Dayton Greater Dayton Regional TA TOTAL
18.517.9 15.9 17.40.7DR 16.5 16.1 0.20%201.1 213.2 -5.68%Greater Dayton Regional TAOH Dayton676.0689.1 585.7 592.624.1MB 558.6 566.3 3.69%7,493.1 7,265.9 3.13%Greater Dayton Regional TAOH Dayton205.2262.7 223.3 225.99.2TB 184.5 169.6 27.28%2,699.4 2,218.1 21.70%Greater Dayton Regional TAOH Dayton
6.45.6 6.4 5.6 5.2NA 9.30%68.2 71.6 -4.75%6.8OH Delaware Delaware Area Transit Agency TOTAL6.46.8 5.6 6.4NAMB 5.6 5.2 9.30%68.2 71.6 -4.75%Delaware Area Transit AgencyOH Delaware
70.356.7 59.7 62.0 58.92.9 -2.77%752.9 752.2 0.09%69.5OH Grand River LAKETRAN TOTAL
22.623.3 19.6 21.01.0DR 20.5 20.0 1.27%259.4 250.4 3.59%LAKETRANOH Grand River47.746.2 37.1 38.71.9MB 41.5 38.9 -4.76%493.5 501.8 -1.65%LAKETRANOH Grand River
221.0163.9 94.3 161.0 90.5NA -0.36%1,530.3 1,543.0 -0.82%212.6OH Kent Portage Area Reg Trp Auth TOTAL
10.610.2 8.2 8.1NADR 9.1 7.8 -3.64%101.9 112.0 -9.02%Portage Area Reg Trp AuthOH Kent210.4202.4 155.7 86.2NAMB 151.9 82.7 -0.16%1,428.4 1,431.0 -0.18%Portage Area Reg Trp AuthOH Kent
327.0250.1 267.2 289.6 259.7NA -5.68%3,224.1 3,448.9 -6.52%309.2OH Toledo Toledo Area Reg Transit Auth TOTAL
29.631.4 26.9 27.30.9DR 27.1 25.7 3.88%332.2 320.4 3.68%Toledo Area Reg Transit AuthOH Toledo297.4277.8 223.2 239.910.5MB 262.5 234.0 -6.68%2,891.9 3,128.5 -7.56%Toledo Area Reg Transit AuthOH Toledo
269.3233.3 257.6 229.8 211.411.0 10.49%3,025.3 2,897.0 4.43%294.1OK Oklahoma City Central Oklahoma TA TOTAL
5.35.0 4.2 4.50.2DR 4.9 4.6 -7.43%57.5 59.2 -2.87%Central Oklahoma TAOK Oklahoma City264.0289.1 229.1 253.110.8MB 224.9 206.8 10.87%2,967.8 2,837.8 4.58%Central Oklahoma TAOK Oklahoma City
8,957.47,698.7 8,121.4 7,894.7 7,643.5319.7 2.27%101,733.3 98,740.5 3.03%9,230.8OR Portland Tri-County Metro Trp Dist TOTAL
49.246.5 34.2 36.91.8CR 40.4 38.0 -7.84%501.1 478.6 4.70%Tri-County Metro Trp DistOR Portland95.294.7 78.7 86.93.6DR 84.8 82.8 -0.95%1,035.0 1,044.7 -0.93%Tri-County Metro Trp DistOR Portland
3,394.33,366.3 2,792.9 3,007.4113.9LR 2,977.0 2,914.2 -1.28%38,164.6 38,287.6 -0.32%Tri-County Metro Trp DistOR Portland5,418.75,723.3 4,792.9 4,990.2200.4MB 4,792.5 4,608.5 4.63%62,032.6 58,929.6 5.27%Tri-County Metro Trp DistOR Portland
Modes: MB - Bus, DR - Demand Response, CR - Commuter Rail, HR - Heavy Rail, LR - Light Rail, AG - Automated Guideway, CC - Cable Car, FB - Ferry Boat, IP - Inclined Plane, IR - Intermediate Rail, MO - Monorail, TB - Trolleybus, VP - Vanpool
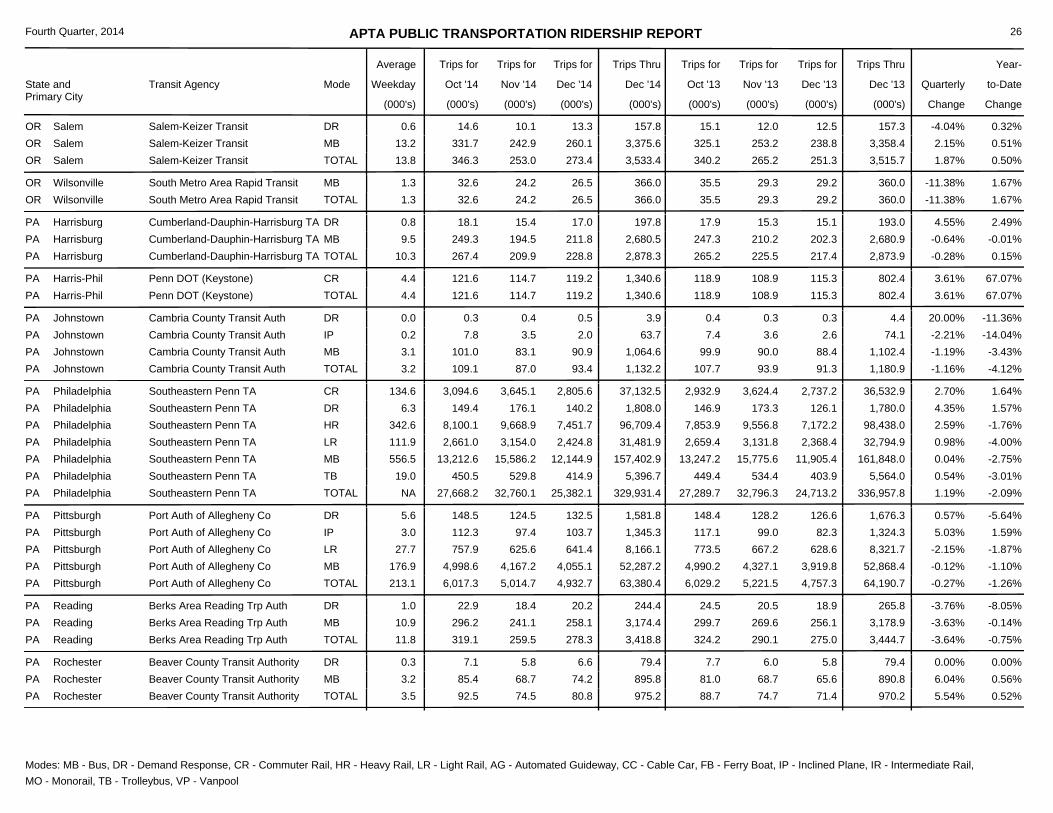
APTA PUBLIC TRANSPORTATION RIDERSHIP REPORT
State and Primary City
Transit Agency Mode
Average
Weekday Oct '14
Trips for Trips for
Nov '14
Trips for
Dec '14
Trips Thru
Dec '14
Trips for
Oct '13
Trips for
Nov '13
Trips for
Dec '13
Trips Thru
Dec '13 Quarterly
Change
Year-
Change
Fourth Quarter, 2014
(000's) (000's) (000's) (000's) (000's) (000's) (000's) (000's)(000's)
to-Date
26
340.2253.0 273.4 265.2 251.313.8 1.87%3,533.4 3,515.7 0.50%346.3OR Salem Salem-Keizer Transit TOTAL
15.114.6 10.1 13.30.6DR 12.0 12.5 -4.04%157.8 157.3 0.32%Salem-Keizer TransitOR Salem325.1331.7 242.9 260.113.2MB 253.2 238.8 2.15%3,375.6 3,358.4 0.51%Salem-Keizer TransitOR Salem
35.524.2 26.5 29.3 29.21.3 -11.38%366.0 360.0 1.67%32.6OR Wilsonville South Metro Area Rapid Transit TOTAL35.532.6 24.2 26.51.3MB 29.3 29.2 -11.38%366.0 360.0 1.67%South Metro Area Rapid TransitOR Wilsonville
265.2209.9 228.8 225.5 217.410.3 -0.28%2,878.3 2,873.9 0.15%267.4PA Harrisburg Cumberland-Dauphin-Harrisburg TA TOTAL
17.918.1 15.4 17.00.8DR 15.3 15.1 4.55%197.8 193.0 2.49%Cumberland-Dauphin-Harrisburg TAPA Harrisburg247.3249.3 194.5 211.89.5MB 210.2 202.3 -0.64%2,680.5 2,680.9 -0.01%Cumberland-Dauphin-Harrisburg TAPA Harrisburg
118.9114.7 119.2 108.9 115.34.4 3.61%1,340.6 802.4 67.07%121.6PA Harris-Phil Penn DOT (Keystone) TOTAL118.9121.6 114.7 119.24.4CR 108.9 115.3 3.61%1,340.6 802.4 67.07%Penn DOT (Keystone)PA Harris-Phil
107.787.0 93.4 93.9 91.33.2 -1.16%1,132.2 1,180.9 -4.12%109.1PA Johnstown Cambria County Transit Auth TOTAL
0.40.3 0.4 0.50.0DR 0.3 0.3 20.00%3.9 4.4 -11.36%Cambria County Transit AuthPA Johnstown7.47.8 3.5 2.00.2IP 3.6 2.6 -2.21%63.7 74.1 -14.04%Cambria County Transit AuthPA Johnstown
99.9101.0 83.1 90.93.1MB 90.0 88.4 -1.19%1,064.6 1,102.4 -3.43%Cambria County Transit AuthPA Johnstown
27,289.732,760.1 25,382.1 32,796.3 24,713.2NA 1.19%329,931.4 336,957.8 -2.09%27,668.2PA Philadelphia Southeastern Penn TA TOTAL
2,932.93,094.6 3,645.1 2,805.6134.6CR 3,624.4 2,737.2 2.70%37,132.5 36,532.9 1.64%Southeastern Penn TAPA Philadelphia146.9149.4 176.1 140.26.3DR 173.3 126.1 4.35%1,808.0 1,780.0 1.57%Southeastern Penn TAPA Philadelphia
7,853.98,100.1 9,668.9 7,451.7342.6HR 9,556.8 7,172.2 2.59%96,709.4 98,438.0 -1.76%Southeastern Penn TAPA Philadelphia2,659.42,661.0 3,154.0 2,424.8111.9LR 3,131.8 2,368.4 0.98%31,481.9 32,794.9 -4.00%Southeastern Penn TAPA Philadelphia
13,247.213,212.6 15,586.2 12,144.9556.5MB 15,775.6 11,905.4 0.04%157,402.9 161,848.0 -2.75%Southeastern Penn TAPA Philadelphia449.4450.5 529.8 414.919.0TB 534.4 403.9 0.54%5,396.7 5,564.0 -3.01%Southeastern Penn TAPA Philadelphia
6,029.25,014.7 4,932.7 5,221.5 4,757.3213.1 -0.27%63,380.4 64,190.7 -1.26%6,017.3PA Pittsburgh Port Auth of Allegheny Co TOTAL
148.4148.5 124.5 132.55.6DR 128.2 126.6 0.57%1,581.8 1,676.3 -5.64%Port Auth of Allegheny CoPA Pittsburgh117.1112.3 97.4 103.73.0IP 99.0 82.3 5.03%1,345.3 1,324.3 1.59%Port Auth of Allegheny CoPA Pittsburgh773.5757.9 625.6 641.427.7LR 667.2 628.6 -2.15%8,166.1 8,321.7 -1.87%Port Auth of Allegheny CoPA Pittsburgh
4,990.24,998.6 4,167.2 4,055.1176.9MB 4,327.1 3,919.8 -0.12%52,287.2 52,868.4 -1.10%Port Auth of Allegheny CoPA Pittsburgh
324.2259.5 278.3 290.1 275.011.8 -3.64%3,418.8 3,444.7 -0.75%319.1PA Reading Berks Area Reading Trp Auth TOTAL
24.522.9 18.4 20.21.0DR 20.5 18.9 -3.76%244.4 265.8 -8.05%Berks Area Reading Trp AuthPA Reading299.7296.2 241.1 258.110.9MB 269.6 256.1 -3.63%3,174.4 3,178.9 -0.14%Berks Area Reading Trp AuthPA Reading
88.774.5 80.8 74.7 71.43.5 5.54%975.2 970.2 0.52%92.5PA Rochester Beaver County Transit Authority TOTAL
7.77.1 5.8 6.60.3DR 6.0 5.8 0.00%79.4 79.4 0.00%Beaver County Transit AuthorityPA Rochester81.085.4 68.7 74.23.2MB 68.7 65.6 6.04%895.8 890.8 0.56%Beaver County Transit AuthorityPA Rochester
Modes: MB - Bus, DR - Demand Response, CR - Commuter Rail, HR - Heavy Rail, LR - Light Rail, AG - Automated Guideway, CC - Cable Car, FB - Ferry Boat, IP - Inclined Plane, IR - Intermediate Rail, MO - Monorail, TB - Trolleybus, VP - Vanpool
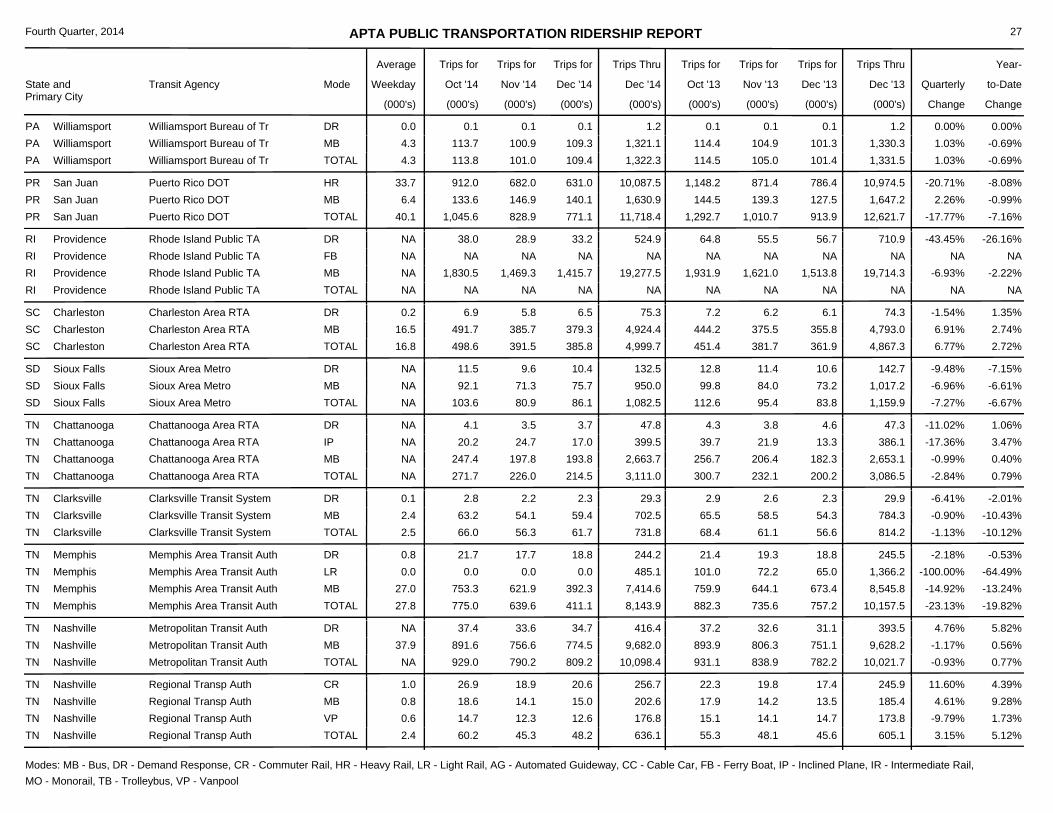
APTA PUBLIC TRANSPORTATION RIDERSHIP REPORT
State and Primary City
Transit Agency Mode
Average
Weekday Oct '14
Trips for Trips for
Nov '14
Trips for
Dec '14
Trips Thru
Dec '14
Trips for
Oct '13
Trips for
Nov '13
Trips for
Dec '13
Trips Thru
Dec '13 Quarterly
Change
Year-
Change
Fourth Quarter, 2014
(000's) (000's) (000's) (000's) (000's) (000's) (000's) (000's)(000's)
to-Date
27
114.5101.0 109.4 105.0 101.44.3 1.03%1,322.3 1,331.5 -0.69%113.8PA Williamsport Williamsport Bureau of Tr TOTAL
0.10.1 0.1 0.10.0DR 0.1 0.1 0.00%1.2 1.2 0.00%Williamsport Bureau of TrPA Williamsport114.4113.7 100.9 109.34.3MB 104.9 101.3 1.03%1,321.1 1,330.3 -0.69%Williamsport Bureau of TrPA Williamsport
1,292.7828.9 771.1 1,010.7 913.940.1 -17.77%11,718.4 12,621.7 -7.16%1,045.6PR San Juan Puerto Rico DOT TOTAL
1,148.2912.0 682.0 631.033.7HR 871.4 786.4 -20.71%10,087.5 10,974.5 -8.08%Puerto Rico DOTPR San Juan144.5133.6 146.9 140.16.4MB 139.3 127.5 2.26%1,630.9 1,647.2 -0.99%Puerto Rico DOTPR San Juan
NANA NA NA NANA NANA NA NANARI Providence Rhode Island Public TA TOTAL
64.838.0 28.9 33.2NADR 55.5 56.7 -43.45%524.9 710.9 -26.16%Rhode Island Public TARI ProvidenceNANA NA NANAFB NA NA NANA NA NARhode Island Public TARI Providence
1,931.91,830.5 1,469.3 1,415.7NAMB 1,621.0 1,513.8 -6.93%19,277.5 19,714.3 -2.22%Rhode Island Public TARI Providence
451.4391.5 385.8 381.7 361.916.8 6.77%4,999.7 4,867.3 2.72%498.6SC Charleston Charleston Area RTA TOTAL
7.26.9 5.8 6.50.2DR 6.2 6.1 -1.54%75.3 74.3 1.35%Charleston Area RTASC Charleston444.2491.7 385.7 379.316.5MB 375.5 355.8 6.91%4,924.4 4,793.0 2.74%Charleston Area RTASC Charleston
112.680.9 86.1 95.4 83.8NA -7.27%1,082.5 1,159.9 -6.67%103.6SD Sioux Falls Sioux Area Metro TOTAL
12.811.5 9.6 10.4NADR 11.4 10.6 -9.48%132.5 142.7 -7.15%Sioux Area MetroSD Sioux Falls99.892.1 71.3 75.7NAMB 84.0 73.2 -6.96%950.0 1,017.2 -6.61%Sioux Area MetroSD Sioux Falls
300.7226.0 214.5 232.1 200.2NA -2.84%3,111.0 3,086.5 0.79%271.7TN Chattanooga Chattanooga Area RTA TOTAL
4.34.1 3.5 3.7NADR 3.8 4.6 -11.02%47.8 47.3 1.06%Chattanooga Area RTATN Chattanooga39.720.2 24.7 17.0NAIP 21.9 13.3 -17.36%399.5 386.1 3.47%Chattanooga Area RTATN Chattanooga
256.7247.4 197.8 193.8NAMB 206.4 182.3 -0.99%2,663.7 2,653.1 0.40%Chattanooga Area RTATN Chattanooga
68.456.3 61.7 61.1 56.62.5 -1.13%731.8 814.2 -10.12%66.0TN Clarksville Clarksville Transit System TOTAL
2.92.8 2.2 2.30.1DR 2.6 2.3 -6.41%29.3 29.9 -2.01%Clarksville Transit SystemTN Clarksville65.563.2 54.1 59.42.4MB 58.5 54.3 -0.90%702.5 784.3 -10.43%Clarksville Transit SystemTN Clarksville
882.3639.6 411.1 735.6 757.227.8 -23.13%8,143.9 10,157.5 -19.82%775.0TN Memphis Memphis Area Transit Auth TOTAL
21.421.7 17.7 18.80.8DR 19.3 18.8 -2.18%244.2 245.5 -0.53%Memphis Area Transit AuthTN Memphis101.00.0 0.0 0.00.0LR 72.2 65.0 -100.00%485.1 1,366.2 -64.49%Memphis Area Transit AuthTN Memphis759.9753.3 621.9 392.327.0MB 644.1 673.4 -14.92%7,414.6 8,545.8 -13.24%Memphis Area Transit AuthTN Memphis
931.1790.2 809.2 838.9 782.2NA -0.93%10,098.4 10,021.7 0.77%929.0TN Nashville Metropolitan Transit Auth TOTAL
37.237.4 33.6 34.7NADR 32.6 31.1 4.76%416.4 393.5 5.82%Metropolitan Transit AuthTN Nashville893.9891.6 756.6 774.537.9MB 806.3 751.1 -1.17%9,682.0 9,628.2 0.56%Metropolitan Transit AuthTN Nashville
55.345.3 48.2 48.1 45.62.4 3.15%636.1 605.1 5.12%60.2TN Nashville Regional Transp Auth TOTAL
22.326.9 18.9 20.61.0CR 19.8 17.4 11.60%256.7 245.9 4.39%Regional Transp AuthTN Nashville17.918.6 14.1 15.00.8MB 14.2 13.5 4.61%202.6 185.4 9.28%Regional Transp AuthTN Nashville15.114.7 12.3 12.60.6VP 14.1 14.7 -9.79%176.8 173.8 1.73%Regional Transp AuthTN Nashville
Modes: MB - Bus, DR - Demand Response, CR - Commuter Rail, HR - Heavy Rail, LR - Light Rail, AG - Automated Guideway, CC - Cable Car, FB - Ferry Boat, IP - Inclined Plane, IR - Intermediate Rail, MO - Monorail, TB - Trolleybus, VP - Vanpool
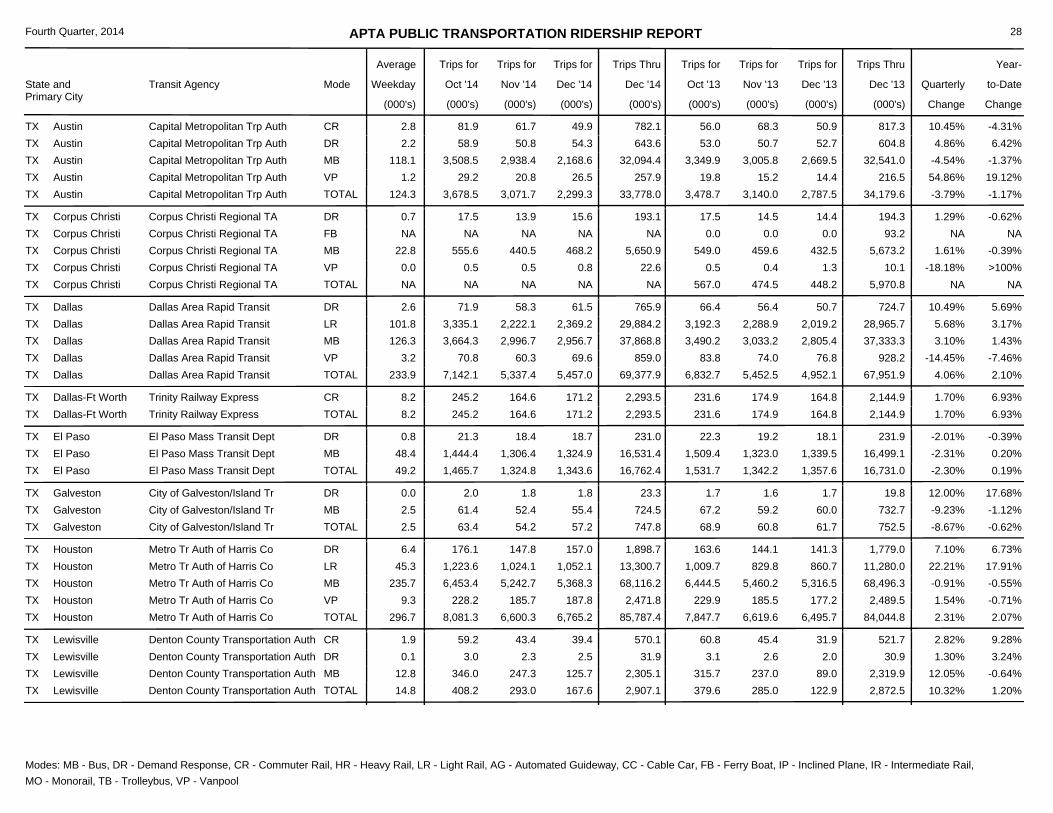
APTA PUBLIC TRANSPORTATION RIDERSHIP REPORT
State and Primary City
Transit Agency Mode
Average
Weekday Oct '14
Trips for Trips for
Nov '14
Trips for
Dec '14
Trips Thru
Dec '14
Trips for
Oct '13
Trips for
Nov '13
Trips for
Dec '13
Trips Thru
Dec '13 Quarterly
Change
Year-
Change
Fourth Quarter, 2014
(000's) (000's) (000's) (000's) (000's) (000's) (000's) (000's)(000's)
to-Date
28
3,478.73,071.7 2,299.3 3,140.0 2,787.5124.3 -3.79%33,778.0 34,179.6 -1.17%3,678.5TX Austin Capital Metropolitan Trp Auth TOTAL
56.081.9 61.7 49.92.8CR 68.3 50.9 10.45%782.1 817.3 -4.31%Capital Metropolitan Trp AuthTX Austin53.058.9 50.8 54.32.2DR 50.7 52.7 4.86%643.6 604.8 6.42%Capital Metropolitan Trp AuthTX Austin
3,349.93,508.5 2,938.4 2,168.6118.1MB 3,005.8 2,669.5 -4.54%32,094.4 32,541.0 -1.37%Capital Metropolitan Trp AuthTX Austin19.829.2 20.8 26.51.2VP 15.2 14.4 54.86%257.9 216.5 19.12%Capital Metropolitan Trp AuthTX Austin
567.0NA NA 474.5 448.2NA NANA 5,970.8 NANATX Corpus Christi Corpus Christi Regional TA TOTAL
17.517.5 13.9 15.60.7DR 14.5 14.4 1.29%193.1 194.3 -0.62%Corpus Christi Regional TATX Corpus Christi0.0NA NA NANAFB 0.0 0.0 NANA 93.2 NACorpus Christi Regional TATX Corpus Christi
549.0555.6 440.5 468.222.8MB 459.6 432.5 1.61%5,650.9 5,673.2 -0.39%Corpus Christi Regional TATX Corpus Christi0.50.5 0.5 0.80.0VP 0.4 1.3 -18.18%22.6 10.1 >100%Corpus Christi Regional TATX Corpus Christi
6,832.75,337.4 5,457.0 5,452.5 4,952.1233.9 4.06%69,377.9 67,951.9 2.10%7,142.1TX Dallas Dallas Area Rapid Transit TOTAL
66.471.9 58.3 61.52.6DR 56.4 50.7 10.49%765.9 724.7 5.69%Dallas Area Rapid TransitTX Dallas3,192.33,335.1 2,222.1 2,369.2101.8LR 2,288.9 2,019.2 5.68%29,884.2 28,965.7 3.17%Dallas Area Rapid TransitTX Dallas3,490.23,664.3 2,996.7 2,956.7126.3MB 3,033.2 2,805.4 3.10%37,868.8 37,333.3 1.43%Dallas Area Rapid TransitTX Dallas
83.870.8 60.3 69.63.2VP 74.0 76.8 -14.45%859.0 928.2 -7.46%Dallas Area Rapid TransitTX Dallas
231.6164.6 171.2 174.9 164.88.2 1.70%2,293.5 2,144.9 6.93%245.2TX Dallas-Ft Worth Trinity Railway Express TOTAL231.6245.2 164.6 171.28.2CR 174.9 164.8 1.70%2,293.5 2,144.9 6.93%Trinity Railway ExpressTX Dallas-Ft Worth
1,531.71,324.8 1,343.6 1,342.2 1,357.649.2 -2.30%16,762.4 16,731.0 0.19%1,465.7TX El Paso El Paso Mass Transit Dept TOTAL
22.321.3 18.4 18.70.8DR 19.2 18.1 -2.01%231.0 231.9 -0.39%El Paso Mass Transit DeptTX El Paso1,509.41,444.4 1,306.4 1,324.948.4MB 1,323.0 1,339.5 -2.31%16,531.4 16,499.1 0.20%El Paso Mass Transit DeptTX El Paso
68.954.2 57.2 60.8 61.72.5 -8.67%747.8 752.5 -0.62%63.4TX Galveston City of Galveston/Island Tr TOTAL
1.72.0 1.8 1.80.0DR 1.6 1.7 12.00%23.3 19.8 17.68%City of Galveston/Island TrTX Galveston67.261.4 52.4 55.42.5MB 59.2 60.0 -9.23%724.5 732.7 -1.12%City of Galveston/Island TrTX Galveston
7,847.76,600.3 6,765.2 6,619.6 6,495.7296.7 2.31%85,787.4 84,044.8 2.07%8,081.3TX Houston Metro Tr Auth of Harris Co TOTAL
163.6176.1 147.8 157.06.4DR 144.1 141.3 7.10%1,898.7 1,779.0 6.73%Metro Tr Auth of Harris CoTX Houston1,009.71,223.6 1,024.1 1,052.145.3LR 829.8 860.7 22.21%13,300.7 11,280.0 17.91%Metro Tr Auth of Harris CoTX Houston6,444.56,453.4 5,242.7 5,368.3235.7MB 5,460.2 5,316.5 -0.91%68,116.2 68,496.3 -0.55%Metro Tr Auth of Harris CoTX Houston
229.9228.2 185.7 187.89.3VP 185.5 177.2 1.54%2,471.8 2,489.5 -0.71%Metro Tr Auth of Harris CoTX Houston
379.6293.0 167.6 285.0 122.914.8 10.32%2,907.1 2,872.5 1.20%408.2TX Lewisville Denton County Transportation Auth TOTAL
60.859.2 43.4 39.41.9CR 45.4 31.9 2.82%570.1 521.7 9.28%Denton County Transportation AuthTX Lewisville3.13.0 2.3 2.50.1DR 2.6 2.0 1.30%31.9 30.9 3.24%Denton County Transportation AuthTX Lewisville
315.7346.0 247.3 125.712.8MB 237.0 89.0 12.05%2,305.1 2,319.9 -0.64%Denton County Transportation AuthTX Lewisville
Modes: MB - Bus, DR - Demand Response, CR - Commuter Rail, HR - Heavy Rail, LR - Light Rail, AG - Automated Guideway, CC - Cable Car, FB - Ferry Boat, IP - Inclined Plane, IR - Intermediate Rail, MO - Monorail, TB - Trolleybus, VP - Vanpool
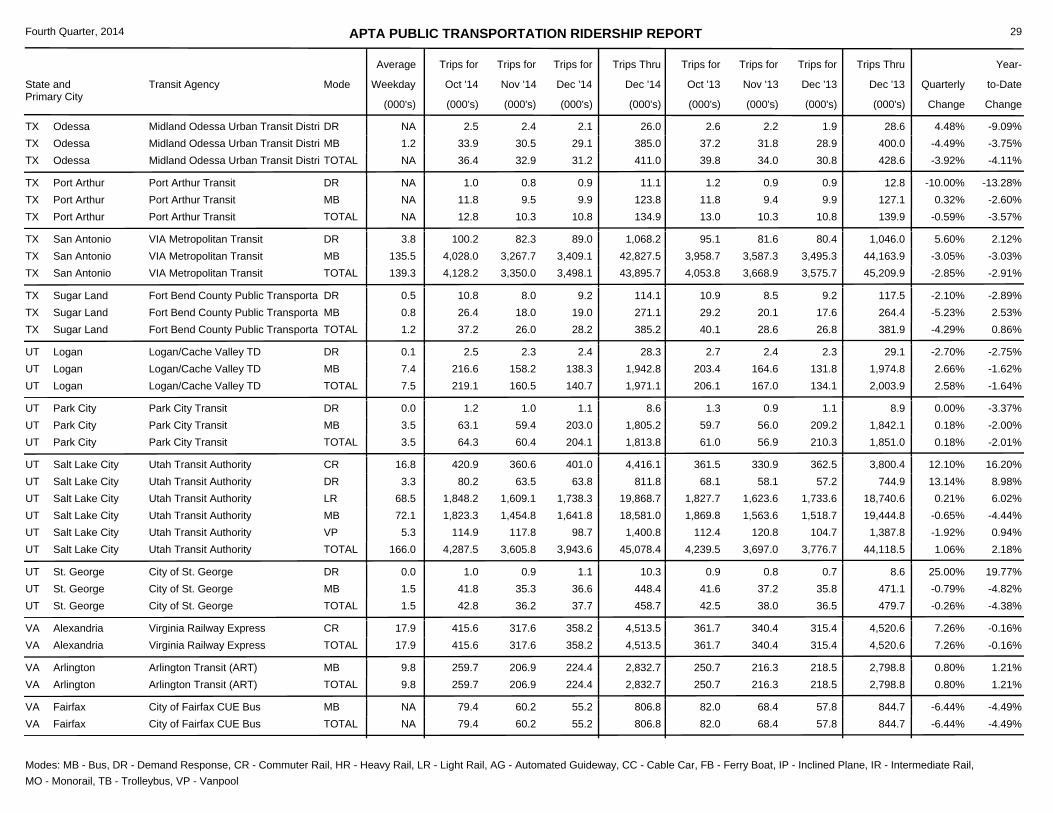
APTA PUBLIC TRANSPORTATION RIDERSHIP REPORT
State and Primary City
Transit Agency Mode
Average
Weekday Oct '14
Trips for Trips for
Nov '14
Trips for
Dec '14
Trips Thru
Dec '14
Trips for
Oct '13
Trips for
Nov '13
Trips for
Dec '13
Trips Thru
Dec '13 Quarterly
Change
Year-
Change
Fourth Quarter, 2014
(000's) (000's) (000's) (000's) (000's) (000's) (000's) (000's)(000's)
to-Date
29
39.832.9 31.2 34.0 30.8NA -3.92%411.0 428.6 -4.11%36.4TX Odessa Midland Odessa Urban Transit Distri TOTAL
2.62.5 2.4 2.1NADR 2.2 1.9 4.48%26.0 28.6 -9.09%Midland Odessa Urban Transit DistriTX Odessa37.233.9 30.5 29.11.2MB 31.8 28.9 -4.49%385.0 400.0 -3.75%Midland Odessa Urban Transit DistriTX Odessa
13.010.3 10.8 10.3 10.8NA -0.59%134.9 139.9 -3.57%12.8TX Port Arthur Port Arthur Transit TOTAL
1.21.0 0.8 0.9NADR 0.9 0.9 -10.00%11.1 12.8 -13.28%Port Arthur TransitTX Port Arthur11.811.8 9.5 9.9NAMB 9.4 9.9 0.32%123.8 127.1 -2.60%Port Arthur TransitTX Port Arthur
4,053.83,350.0 3,498.1 3,668.9 3,575.7139.3 -2.85%43,895.7 45,209.9 -2.91%4,128.2TX San Antonio VIA Metropolitan Transit TOTAL
95.1100.2 82.3 89.03.8DR 81.6 80.4 5.60%1,068.2 1,046.0 2.12%VIA Metropolitan TransitTX San Antonio3,958.74,028.0 3,267.7 3,409.1135.5MB 3,587.3 3,495.3 -3.05%42,827.5 44,163.9 -3.03%VIA Metropolitan TransitTX San Antonio
40.126.0 28.2 28.6 26.81.2 -4.29%385.2 381.9 0.86%37.2TX Sugar Land Fort Bend County Public Transporta TOTAL
10.910.8 8.0 9.20.5DR 8.5 9.2 -2.10%114.1 117.5 -2.89%Fort Bend County Public TransportaTX Sugar Land29.226.4 18.0 19.00.8MB 20.1 17.6 -5.23%271.1 264.4 2.53%Fort Bend County Public TransportaTX Sugar Land
206.1160.5 140.7 167.0 134.17.5 2.58%1,971.1 2,003.9 -1.64%219.1UT Logan Logan/Cache Valley TD TOTAL
2.72.5 2.3 2.40.1DR 2.4 2.3 -2.70%28.3 29.1 -2.75%Logan/Cache Valley TDUT Logan203.4216.6 158.2 138.37.4MB 164.6 131.8 2.66%1,942.8 1,974.8 -1.62%Logan/Cache Valley TDUT Logan
61.060.4 204.1 56.9 210.33.5 0.18%1,813.8 1,851.0 -2.01%64.3UT Park City Park City Transit TOTAL
1.31.2 1.0 1.10.0DR 0.9 1.1 0.00%8.6 8.9 -3.37%Park City TransitUT Park City59.763.1 59.4 203.03.5MB 56.0 209.2 0.18%1,805.2 1,842.1 -2.00%Park City TransitUT Park City
4,239.53,605.8 3,943.6 3,697.0 3,776.7166.0 1.06%45,078.4 44,118.5 2.18%4,287.5UT Salt Lake City Utah Transit Authority TOTAL
361.5420.9 360.6 401.016.8CR 330.9 362.5 12.10%4,416.1 3,800.4 16.20%Utah Transit AuthorityUT Salt Lake City68.180.2 63.5 63.83.3DR 58.1 57.2 13.14%811.8 744.9 8.98%Utah Transit AuthorityUT Salt Lake City
1,827.71,848.2 1,609.1 1,738.368.5LR 1,623.6 1,733.6 0.21%19,868.7 18,740.6 6.02%Utah Transit AuthorityUT Salt Lake City1,869.81,823.3 1,454.8 1,641.872.1MB 1,563.6 1,518.7 -0.65%18,581.0 19,444.8 -4.44%Utah Transit AuthorityUT Salt Lake City
112.4114.9 117.8 98.75.3VP 120.8 104.7 -1.92%1,400.8 1,387.8 0.94%Utah Transit AuthorityUT Salt Lake City
42.536.2 37.7 38.0 36.51.5 -0.26%458.7 479.7 -4.38%42.8UT St. George City of St. George TOTAL
0.91.0 0.9 1.10.0DR 0.8 0.7 25.00%10.3 8.6 19.77%City of St. GeorgeUT St. George41.641.8 35.3 36.61.5MB 37.2 35.8 -0.79%448.4 471.1 -4.82%City of St. GeorgeUT St. George
361.7317.6 358.2 340.4 315.417.9 7.26%4,513.5 4,520.6 -0.16%415.6VA Alexandria Virginia Railway Express TOTAL361.7415.6 317.6 358.217.9CR 340.4 315.4 7.26%4,513.5 4,520.6 -0.16%Virginia Railway ExpressVA Alexandria
250.7206.9 224.4 216.3 218.59.8 0.80%2,832.7 2,798.8 1.21%259.7VA Arlington Arlington Transit (ART) TOTAL250.7259.7 206.9 224.49.8MB 216.3 218.5 0.80%2,832.7 2,798.8 1.21%Arlington Transit (ART)VA Arlington
82.060.2 55.2 68.4 57.8NA -6.44%806.8 844.7 -4.49%79.4VA Fairfax City of Fairfax CUE Bus TOTAL82.079.4 60.2 55.2NAMB 68.4 57.8 -6.44%806.8 844.7 -4.49%City of Fairfax CUE BusVA Fairfax
Modes: MB - Bus, DR - Demand Response, CR - Commuter Rail, HR - Heavy Rail, LR - Light Rail, AG - Automated Guideway, CC - Cable Car, FB - Ferry Boat, IP - Inclined Plane, IR - Intermediate Rail, MO - Monorail, TB - Trolleybus, VP - Vanpool
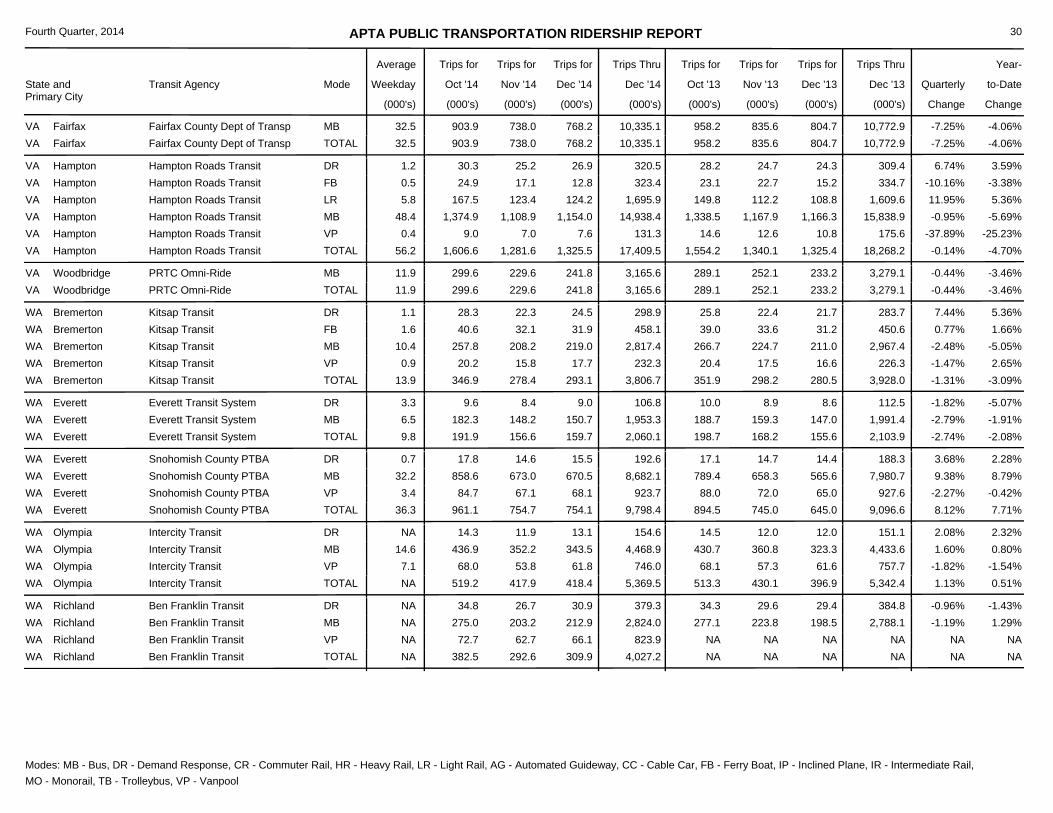
APTA PUBLIC TRANSPORTATION RIDERSHIP REPORT
State and Primary City
Transit Agency Mode
Average
Weekday Oct '14
Trips for Trips for
Nov '14
Trips for
Dec '14
Trips Thru
Dec '14
Trips for
Oct '13
Trips for
Nov '13
Trips for
Dec '13
Trips Thru
Dec '13 Quarterly
Change
Year-
Change
Fourth Quarter, 2014
(000's) (000's) (000's) (000's) (000's) (000's) (000's) (000's)(000's)
to-Date
30
958.2738.0 768.2 835.6 804.732.5 -7.25%10,335.1 10,772.9 -4.06%903.9VA Fairfax Fairfax County Dept of Transp TOTAL958.2903.9 738.0 768.232.5MB 835.6 804.7 -7.25%10,335.1 10,772.9 -4.06%Fairfax County Dept of TranspVA Fairfax
1,554.21,281.6 1,325.5 1,340.1 1,325.456.2 -0.14%17,409.5 18,268.2 -4.70%1,606.6VA Hampton Hampton Roads Transit TOTAL
28.230.3 25.2 26.91.2DR 24.7 24.3 6.74%320.5 309.4 3.59%Hampton Roads TransitVA Hampton23.124.9 17.1 12.80.5FB 22.7 15.2 -10.16%323.4 334.7 -3.38%Hampton Roads TransitVA Hampton
149.8167.5 123.4 124.25.8LR 112.2 108.8 11.95%1,695.9 1,609.6 5.36%Hampton Roads TransitVA Hampton1,338.51,374.9 1,108.9 1,154.048.4MB 1,167.9 1,166.3 -0.95%14,938.4 15,838.9 -5.69%Hampton Roads TransitVA Hampton
14.69.0 7.0 7.60.4VP 12.6 10.8 -37.89%131.3 175.6 -25.23%Hampton Roads TransitVA Hampton
289.1229.6 241.8 252.1 233.211.9 -0.44%3,165.6 3,279.1 -3.46%299.6VA Woodbridge PRTC Omni-Ride TOTAL289.1299.6 229.6 241.811.9MB 252.1 233.2 -0.44%3,165.6 3,279.1 -3.46%PRTC Omni-RideVA Woodbridge
351.9278.4 293.1 298.2 280.513.9 -1.31%3,806.7 3,928.0 -3.09%346.9WA Bremerton Kitsap Transit TOTAL
25.828.3 22.3 24.51.1DR 22.4 21.7 7.44%298.9 283.7 5.36%Kitsap TransitWA Bremerton39.040.6 32.1 31.91.6FB 33.6 31.2 0.77%458.1 450.6 1.66%Kitsap TransitWA Bremerton
266.7257.8 208.2 219.010.4MB 224.7 211.0 -2.48%2,817.4 2,967.4 -5.05%Kitsap TransitWA Bremerton20.420.2 15.8 17.70.9VP 17.5 16.6 -1.47%232.3 226.3 2.65%Kitsap TransitWA Bremerton
198.7156.6 159.7 168.2 155.69.8 -2.74%2,060.1 2,103.9 -2.08%191.9WA Everett Everett Transit System TOTAL
10.09.6 8.4 9.03.3DR 8.9 8.6 -1.82%106.8 112.5 -5.07%Everett Transit SystemWA Everett188.7182.3 148.2 150.76.5MB 159.3 147.0 -2.79%1,953.3 1,991.4 -1.91%Everett Transit SystemWA Everett
894.5754.7 754.1 745.0 645.036.3 8.12%9,798.4 9,096.6 7.71%961.1WA Everett Snohomish County PTBA TOTAL
17.117.8 14.6 15.50.7DR 14.7 14.4 3.68%192.6 188.3 2.28%Snohomish County PTBAWA Everett789.4858.6 673.0 670.532.2MB 658.3 565.6 9.38%8,682.1 7,980.7 8.79%Snohomish County PTBAWA Everett88.084.7 67.1 68.13.4VP 72.0 65.0 -2.27%923.7 927.6 -0.42%Snohomish County PTBAWA Everett
513.3417.9 418.4 430.1 396.9NA 1.13%5,369.5 5,342.4 0.51%519.2WA Olympia Intercity Transit TOTAL
14.514.3 11.9 13.1NADR 12.0 12.0 2.08%154.6 151.1 2.32%Intercity TransitWA Olympia430.7436.9 352.2 343.514.6MB 360.8 323.3 1.60%4,468.9 4,433.6 0.80%Intercity TransitWA Olympia68.168.0 53.8 61.87.1VP 57.3 61.6 -1.82%746.0 757.7 -1.54%Intercity TransitWA Olympia
NA292.6 309.9 NA NANA NA4,027.2 NA NA382.5WA Richland Ben Franklin Transit TOTAL
34.334.8 26.7 30.9NADR 29.6 29.4 -0.96%379.3 384.8 -1.43%Ben Franklin TransitWA Richland277.1275.0 203.2 212.9NAMB 223.8 198.5 -1.19%2,824.0 2,788.1 1.29%Ben Franklin TransitWA Richland
NA72.7 62.7 66.1NAVP NA NA NA823.9 NA NABen Franklin TransitWA Richland
Modes: MB - Bus, DR - Demand Response, CR - Commuter Rail, HR - Heavy Rail, LR - Light Rail, AG - Automated Guideway, CC - Cable Car, FB - Ferry Boat, IP - Inclined Plane, IR - Intermediate Rail, MO - Monorail, TB - Trolleybus, VP - Vanpool
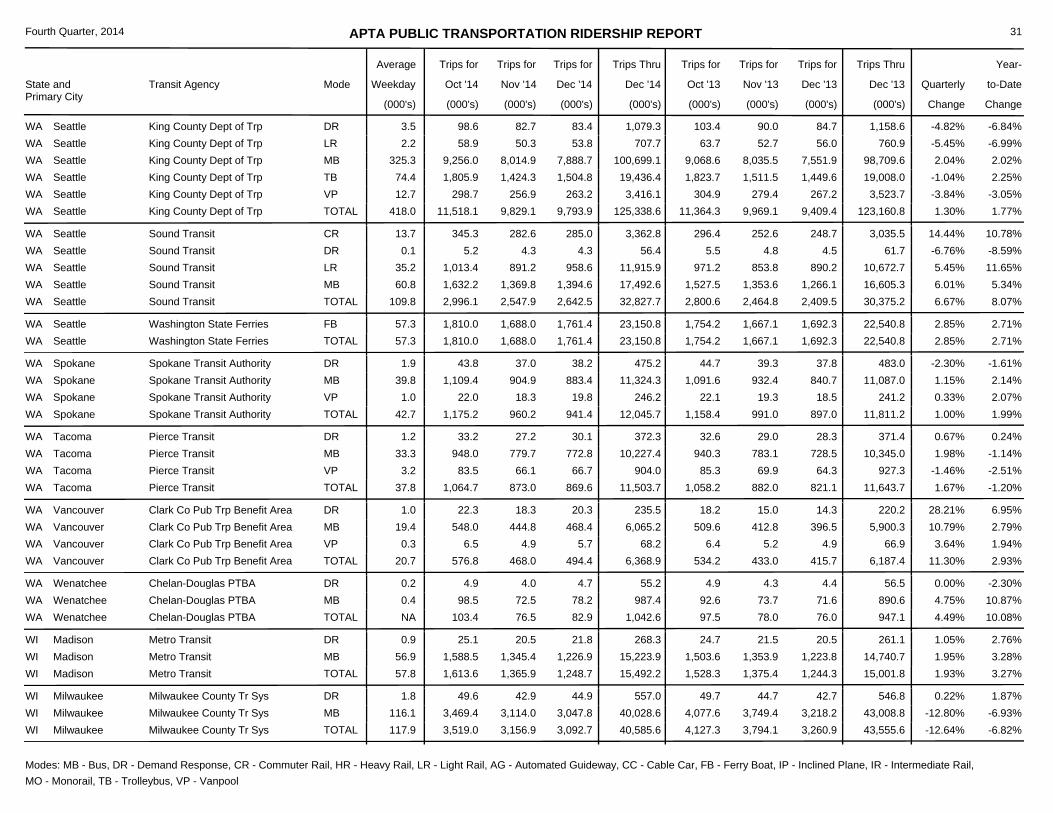
APTA PUBLIC TRANSPORTATION RIDERSHIP REPORT
State and Primary City
Transit Agency Mode
Average
Weekday Oct '14
Trips for Trips for
Nov '14
Trips for
Dec '14
Trips Thru
Dec '14
Trips for
Oct '13
Trips for
Nov '13
Trips for
Dec '13
Trips Thru
Dec '13 Quarterly
Change
Year-
Change
Fourth Quarter, 2014
(000's) (000's) (000's) (000's) (000's) (000's) (000's) (000's)(000's)
to-Date
31
11,364.39,829.1 9,793.9 9,969.1 9,409.4418.0 1.30%125,338.6 123,160.8 1.77%11,518.1WA Seattle King County Dept of Trp TOTAL
103.498.6 82.7 83.43.5DR 90.0 84.7 -4.82%1,079.3 1,158.6 -6.84%King County Dept of TrpWA Seattle63.758.9 50.3 53.82.2LR 52.7 56.0 -5.45%707.7 760.9 -6.99%King County Dept of TrpWA Seattle
9,068.69,256.0 8,014.9 7,888.7325.3MB 8,035.5 7,551.9 2.04%100,699.1 98,709.6 2.02%King County Dept of TrpWA Seattle1,823.71,805.9 1,424.3 1,504.874.4TB 1,511.5 1,449.6 -1.04%19,436.4 19,008.0 2.25%King County Dept of TrpWA Seattle
304.9298.7 256.9 263.212.7VP 279.4 267.2 -3.84%3,416.1 3,523.7 -3.05%King County Dept of TrpWA Seattle
2,800.62,547.9 2,642.5 2,464.8 2,409.5109.8 6.67%32,827.7 30,375.2 8.07%2,996.1WA Seattle Sound Transit TOTAL
296.4345.3 282.6 285.013.7CR 252.6 248.7 14.44%3,362.8 3,035.5 10.78%Sound TransitWA Seattle5.55.2 4.3 4.30.1DR 4.8 4.5 -6.76%56.4 61.7 -8.59%Sound TransitWA Seattle
971.21,013.4 891.2 958.635.2LR 853.8 890.2 5.45%11,915.9 10,672.7 11.65%Sound TransitWA Seattle1,527.51,632.2 1,369.8 1,394.660.8MB 1,353.6 1,266.1 6.01%17,492.6 16,605.3 5.34%Sound TransitWA Seattle
1,754.21,688.0 1,761.4 1,667.1 1,692.357.3 2.85%23,150.8 22,540.8 2.71%1,810.0WA Seattle Washington State Ferries TOTAL1,754.21,810.0 1,688.0 1,761.457.3FB 1,667.1 1,692.3 2.85%23,150.8 22,540.8 2.71%Washington State FerriesWA Seattle
1,158.4960.2 941.4 991.0 897.042.7 1.00%12,045.7 11,811.2 1.99%1,175.2WA Spokane Spokane Transit Authority TOTAL
44.743.8 37.0 38.21.9DR 39.3 37.8 -2.30%475.2 483.0 -1.61%Spokane Transit AuthorityWA Spokane1,091.61,109.4 904.9 883.439.8MB 932.4 840.7 1.15%11,324.3 11,087.0 2.14%Spokane Transit AuthorityWA Spokane
22.122.0 18.3 19.81.0VP 19.3 18.5 0.33%246.2 241.2 2.07%Spokane Transit AuthorityWA Spokane
1,058.2873.0 869.6 882.0 821.137.8 1.67%11,503.7 11,643.7 -1.20%1,064.7WA Tacoma Pierce Transit TOTAL
32.633.2 27.2 30.11.2DR 29.0 28.3 0.67%372.3 371.4 0.24%Pierce TransitWA Tacoma940.3948.0 779.7 772.833.3MB 783.1 728.5 1.98%10,227.4 10,345.0 -1.14%Pierce TransitWA Tacoma85.383.5 66.1 66.73.2VP 69.9 64.3 -1.46%904.0 927.3 -2.51%Pierce TransitWA Tacoma
534.2468.0 494.4 433.0 415.720.7 11.30%6,368.9 6,187.4 2.93%576.8WA Vancouver Clark Co Pub Trp Benefit Area TOTAL
18.222.3 18.3 20.31.0DR 15.0 14.3 28.21%235.5 220.2 6.95%Clark Co Pub Trp Benefit AreaWA Vancouver509.6548.0 444.8 468.419.4MB 412.8 396.5 10.79%6,065.2 5,900.3 2.79%Clark Co Pub Trp Benefit AreaWA Vancouver
6.46.5 4.9 5.70.3VP 5.2 4.9 3.64%68.2 66.9 1.94%Clark Co Pub Trp Benefit AreaWA Vancouver
97.576.5 82.9 78.0 76.0NA 4.49%1,042.6 947.1 10.08%103.4WA Wenatchee Chelan-Douglas PTBA TOTAL
4.94.9 4.0 4.70.2DR 4.3 4.4 0.00%55.2 56.5 -2.30%Chelan-Douglas PTBAWA Wenatchee92.698.5 72.5 78.20.4MB 73.7 71.6 4.75%987.4 890.6 10.87%Chelan-Douglas PTBAWA Wenatchee
1,528.31,365.9 1,248.7 1,375.4 1,244.357.8 1.93%15,492.2 15,001.8 3.27%1,613.6WI Madison Metro Transit TOTAL
24.725.1 20.5 21.80.9DR 21.5 20.5 1.05%268.3 261.1 2.76%Metro TransitWI Madison1,503.61,588.5 1,345.4 1,226.956.9MB 1,353.9 1,223.8 1.95%15,223.9 14,740.7 3.28%Metro TransitWI Madison
4,127.33,156.9 3,092.7 3,794.1 3,260.9117.9 -12.64%40,585.6 43,555.6 -6.82%3,519.0WI Milwaukee Milwaukee County Tr Sys TOTAL
49.749.6 42.9 44.91.8DR 44.7 42.7 0.22%557.0 546.8 1.87%Milwaukee County Tr SysWI Milwaukee4,077.63,469.4 3,114.0 3,047.8116.1MB 3,749.4 3,218.2 -12.80%40,028.6 43,008.8 -6.93%Milwaukee County Tr SysWI Milwaukee
Modes: MB - Bus, DR - Demand Response, CR - Commuter Rail, HR - Heavy Rail, LR - Light Rail, AG - Automated Guideway, CC - Cable Car, FB - Ferry Boat, IP - Inclined Plane, IR - Intermediate Rail, MO - Monorail, TB - Trolleybus, VP - Vanpool
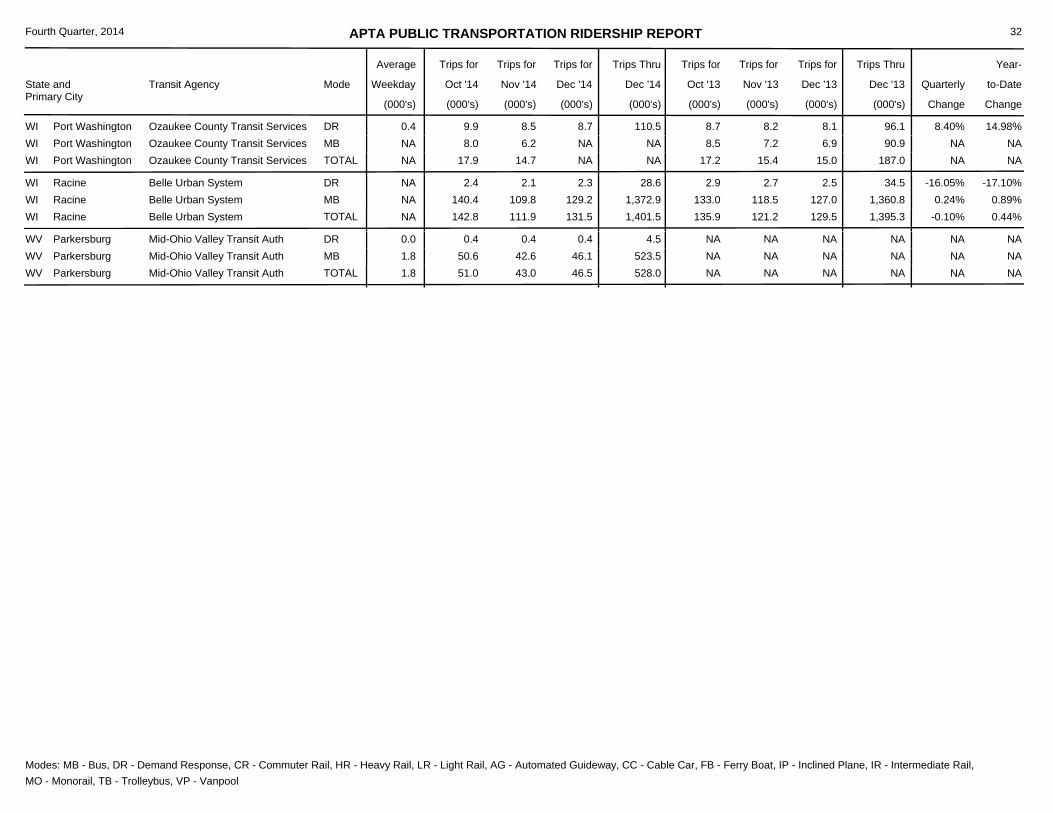
APTA PUBLIC TRANSPORTATION RIDERSHIP REPORT
State and Primary City
Transit Agency Mode
Average
Weekday Oct '14
Trips for Trips for
Nov '14
Trips for
Dec '14
Trips Thru
Dec '14
Trips for
Oct '13
Trips for
Nov '13
Trips for
Dec '13
Trips Thru
Dec '13 Quarterly
Change
Year-
Change
Fourth Quarter, 2014
(000's) (000's) (000's) (000's) (000's) (000's) (000's) (000's)(000's)
to-Date
32
17.214.7 NA 15.4 15.0NA NANA 187.0 NA17.9WI Port Washington Ozaukee County Transit Services TOTAL
8.79.9 8.5 8.70.4DR 8.2 8.1 8.40%110.5 96.1 14.98%Ozaukee County Transit ServicesWI Port Washington8.58.0 6.2 NANAMB 7.2 6.9 NANA 90.9 NAOzaukee County Transit ServicesWI Port Washington
135.9111.9 131.5 121.2 129.5NA -0.10%1,401.5 1,395.3 0.44%142.8WI Racine Belle Urban System TOTAL
2.92.4 2.1 2.3NADR 2.7 2.5 -16.05%28.6 34.5 -17.10%Belle Urban SystemWI Racine133.0140.4 109.8 129.2NAMB 118.5 127.0 0.24%1,372.9 1,360.8 0.89%Belle Urban SystemWI Racine
NA43.0 46.5 NA NA1.8 NA528.0 NA NA51.0WV Parkersburg Mid-Ohio Valley Transit Auth TOTAL
NA0.4 0.4 0.40.0DR NA NA NA4.5 NA NAMid-Ohio Valley Transit AuthWV ParkersburgNA50.6 42.6 46.11.8MB NA NA NA523.5 NA NAMid-Ohio Valley Transit AuthWV Parkersburg
Modes: MB - Bus, DR - Demand Response, CR - Commuter Rail, HR - Heavy Rail, LR - Light Rail, AG - Automated Guideway, CC - Cable Car, FB - Ferry Boat, IP - Inclined Plane, IR - Intermediate Rail, MO - Monorail, TB - Trolleybus, VP - Vanpool

APTA PUBLIC TRANSPORTATION RIDERSHIP REPORT
Province and City Transit Agency Mode
Average
Weekday Oct '14
Trips for Trips for
Nov '14
Trips for
Dec '14
Trips Thru
Dec '14
Trips for
Oct '13
Trips for
Nov '13
Trips for
Dec '13
Trips Thru
Dec '13 Quarterly
Change
Year-
Change
Fourth Quarter, 2014
(000's) (000's) (000's) (000's) (000's) (000's) (000's) (000's)(000's)
to-Date
33
CANADA
13,293.3 12,789.4 13,154.8 13,044.8 12,997.4NA 1.11%143,041.2 139,782.7 2.33%13,550.2AB Edmonton Edmonton Transit System TOTAL
3,374.0 3,310.1 3,184.6NALR 3,117.8 3,091.6 3,080.4 6.23%34,751.4 33,128.6 4.90%Edmonton Transit SystemAB Edmonton10,176.2 9,983.2 9,604.8NAMB 10,037.0 9,953.2 9,917.0 -0.48%108,289.8 106,654.1 1.53%Edmonton Transit SystemAB Edmonton
6.5 5.1 5.5 4.9 4.0NA 26.39%58.2 54.0 7.78%6.6AB Leduc City of Leduc, Leduc Transit Service TOTAL6.6 6.5 5.1NAMB 5.5 4.9 4.0 26.39%58.2 54.0 7.78%City of Leduc, Leduc Transit ServiceAB Leduc
28,294.2 27,530.1 30,697.6 28,528.3 26,587.51,134.0 0.35%356,930.0 355,160.4 0.50%30,290.4BC Burnaby Greater Vancouver Transp Auth TOTAL
10,390.0 10,177.2 9,721.2390.6AG 10,530.9 10,056.2 9,731.6 -0.10%117,727.2 117,216.7 0.44%Greater Vancouver Transp AuthBC Burnaby241.0 207.3 204.810.6CR 249.4 226.0 205.4 -4.07%2,625.4 2,750.2 -4.54%Greater Vancouver Transp AuthBC Burnaby132.7 119.7 112.44.8DR 127.7 120.6 99.6 4.86%1,464.1 1,460.1 0.27%Greater Vancouver Transp AuthBC Burnaby479.3 445.7 457.218.3FB 513.4 455.1 452.1 -2.70%5,968.7 6,044.8 -1.26%Greater Vancouver Transp AuthBC Burnaby
14,001.5 12,748.3 12,569.2522.3MB 14,216.3 12,852.1 11,805.0 1.15%169,414.6 167,585.4 1.09%Greater Vancouver Transp AuthBC Burnaby5,045.9 4,596.0 4,465.3187.4TB 5,059.9 4,818.3 4,293.8 -0.46%59,730.0 60,103.2 -0.62%Greater Vancouver Transp AuthBC Burnaby
2,564.1 2,355.1 2,810.4 2,652.2 2,518.895.5 -4.98%29,704.0 28,840.3 2.99%2,664.6BC Victoria BC Transit TOTAL
34.5 32.5 32.31.2DR 35.9 33.8 31.7 -2.07%400.9 409.4 -2.08%BC TransitBC Victoria2,630.1 2,531.6 2,322.894.3MB 2,774.5 2,618.4 2,487.1 -5.02%29,303.1 28,430.9 3.07%BC TransitBC Victoria
93.1 87.6 NA NA NA1.0 NA1,098.0 NA NA103.4MB Brandon City of Brandon TOTAL103.4 93.1 87.61.0MB NA NA NA NA1,098.0 NA NACity of BrandonMB Brandon
1,823.3 1,717.5 1,898.3 1,822.2 1,411.673.2 7.96%20,518.1 19,405.6 5.73%2,000.0ON Brampton Brampton Transit TOTAL2,000.0 1,823.3 1,717.573.2MB 1,898.3 1,822.2 1,411.6 7.96%20,518.1 19,405.6 5.73%Brampton TransitON Brampton
357.3 305.6 385.2 364.0 292.414.3 -0.67%4,058.1 3,989.7 1.71%371.7ON Oakville Oakville Transit TOTAL
7.9 7.6 7.20.4DR 6.9 6.5 5.7 18.85%84.3 71.9 17.25%Oakville TransitON Oakville363.8 349.7 298.414.0MB 378.3 357.5 286.7 -1.04%3,973.8 3,917.8 1.43%Oakville TransitON Oakville
12,870.3 12,111.9 13,472.6 13,138.6 11,868.4532.4 0.03%140,596.9 140,801.1 -0.15%13,510.3ON Ottawa OC Transpo/Para Transpo TOTAL
76.2 74.1 69.52.9DR 77.1 75.2 70.1 -1.17%883.8 864.4 2.24%OC Transpo/Para TranspoON Ottawa319.1 298.2 282.112.4LR 413.0 390.7 261.6 -15.57%3,012.7 2,067.5 45.72%OC Transpo/Para TranspoON Ottawa
13,115.0 12,498.0 11,760.3517.1MB 12,982.5 12,672.7 11,536.7 0.49%136,700.4 137,869.2 -0.85%OC Transpo/Para TranspoON Ottawa
1,978.0 1,736.4 2,126.9 2,067.6 1,724.080.4 -0.10%22,445.6 22,709.5 -1.16%2,198.0ON Richmond Hill York Region Transit TOTAL2,198.0 1,978.0 1,736.480.4MB 2,126.9 2,067.6 1,724.0 -0.10%22,445.6 22,709.5 -1.16%York Region TransitON Richmond Hill
Modes: MB - Bus, DR - Demand Response, CR - Commuter Rail, HR - Heavy Rail, LR - Light Rail, AG - Automated Guideway, CC - Cable Car, FB - Ferry Boat, IP - Inclined Plane, IR - Intermediate Rail, MO - Monorail, TB - Trolleybus, VP - Vanpool
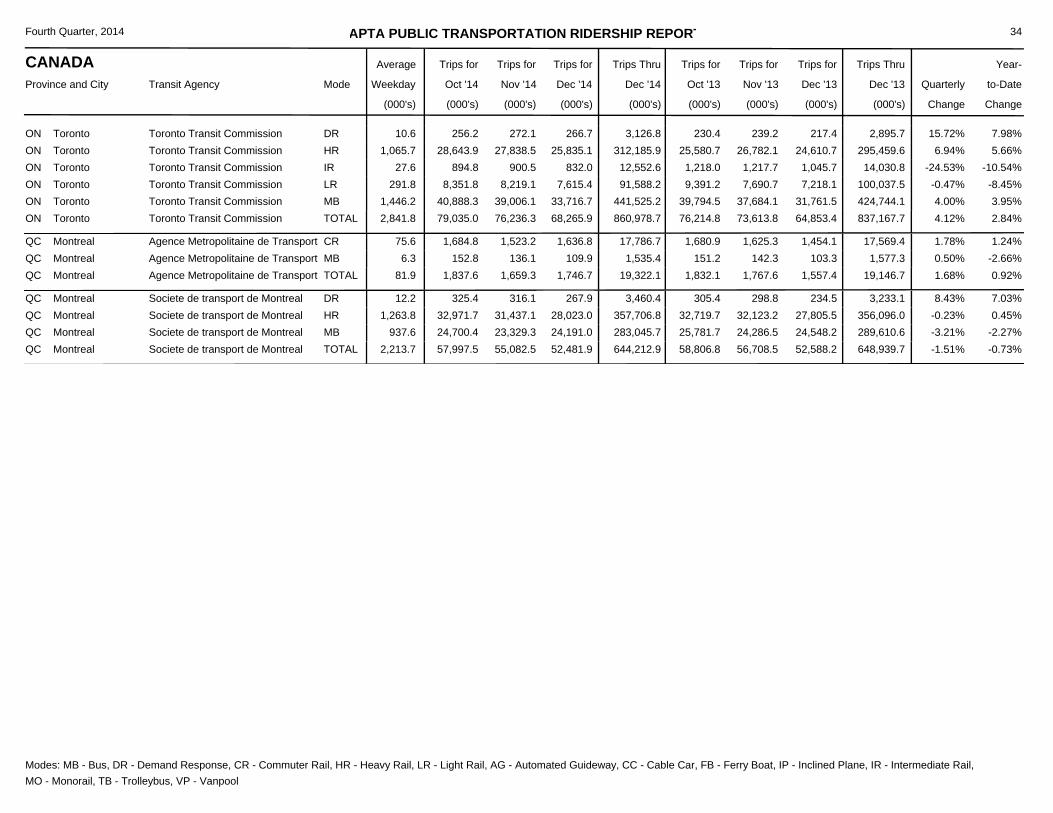
APTA PUBLIC TRANSPORTATION RIDERSHIP REPORT
Province and City Transit Agency Mode
Average
Weekday Oct '14
Trips for Trips for
Nov '14
Trips for
Dec '14
Trips Thru
Dec '14
Trips for
Oct '13
Trips for
Nov '13
Trips for
Dec '13
Trips Thru
Dec '13 Quarterly
Change
Year-
Change
Fourth Quarter, 2014
(000's) (000's) (000's) (000's) (000's) (000's) (000's) (000's)(000's)
to-Date
34
CANADA
76,236.3 68,265.9 76,214.8 73,613.8 64,853.42,841.8 4.12%860,978.7 837,167.7 2.84%79,035.0ON Toronto Toronto Transit Commission TOTAL
256.2 272.1 266.710.6DR 230.4 239.2 217.4 15.72%3,126.8 2,895.7 7.98%Toronto Transit CommissionON Toronto28,643.9 27,838.5 25,835.11,065.7HR 25,580.7 26,782.1 24,610.7 6.94%312,185.9 295,459.6 5.66%Toronto Transit CommissionON Toronto
894.8 900.5 832.027.6IR 1,218.0 1,217.7 1,045.7 -24.53%12,552.6 14,030.8 -10.54%Toronto Transit CommissionON Toronto8,351.8 8,219.1 7,615.4291.8LR 9,391.2 7,690.7 7,218.1 -0.47%91,588.2 100,037.5 -8.45%Toronto Transit CommissionON Toronto
40,888.3 39,006.1 33,716.71,446.2MB 39,794.5 37,684.1 31,761.5 4.00%441,525.2 424,744.1 3.95%Toronto Transit CommissionON Toronto
1,659.3 1,746.7 1,832.1 1,767.6 1,557.481.9 1.68%19,322.1 19,146.7 0.92%1,837.6QC Montreal Agence Metropolitaine de Transport TOTAL
1,684.8 1,523.2 1,636.875.6CR 1,680.9 1,625.3 1,454.1 1.78%17,786.7 17,569.4 1.24%Agence Metropolitaine de TransportQC Montreal152.8 136.1 109.96.3MB 151.2 142.3 103.3 0.50%1,535.4 1,577.3 -2.66%Agence Metropolitaine de TransportQC Montreal
55,082.5 52,481.9 58,806.8 56,708.5 52,588.22,213.7 -1.51%644,212.9 648,939.7 -0.73%57,997.5QC Montreal Societe de transport de Montreal TOTAL
325.4 316.1 267.912.2DR 305.4 298.8 234.5 8.43%3,460.4 3,233.1 7.03%Societe de transport de MontrealQC Montreal32,971.7 31,437.1 28,023.01,263.8HR 32,719.7 32,123.2 27,805.5 -0.23%357,706.8 356,096.0 0.45%Societe de transport de MontrealQC Montreal24,700.4 23,329.3 24,191.0937.6MB 25,781.7 24,286.5 24,548.2 -3.21%283,045.7 289,610.6 -2.27%Societe de transport de MontrealQC Montreal
Modes: MB - Bus, DR - Demand Response, CR - Commuter Rail, HR - Heavy Rail, LR - Light Rail, AG - Automated Guideway, CC - Cable Car, FB - Ferry Boat, IP - Inclined Plane, IR - Intermediate Rail, MO - Monorail, TB - Trolleybus, VP - Vanpool
Related Documents