April 27, 2022

Welcome message from author
This document is posted to help you gain knowledge. Please leave a comment to let me know what you think about it! Share it to your friends and learn new things together.
Transcript

April 27, 2022

2

Metropolitan Transit Commission April 27, 2022 Agenda
METROPOLITAN TRANSIT COMMISSION Wednesday, April 27, 2022
5:00pm Charlotte-Mecklenburg Government Center
WebEx AGENDA
I. Call to Order ................................................................................. Commissioner Leigh Altman • Attendance (Roll Call)
II. Approval of the March 23, 2022 Summary (p.5-10) ..................... Commissioner Leigh Alman
III. Report from the Chair of the Transit Service Advisory Committee (TSAC) .... Krissy Oechslin
IV. Report from the Chair of the Citizens Transit Advisory Group (CTAG) .............. Adam Paisak
V. Public Comments
VI. Informational Items• Envision My Ride – Bus Priority Study Update (p.12-32) ........................... Bruce Jones • Regional Coordinated Human Services Plan Update (p.34-50) ................ Arlanda Rouse
VII. Action Items• FY2022 Amended Operating and Debt Service Budget (p.52-58) ...... Blanche Sherman
FY2022-FY2026 Amended Capital Investment Plan • FY2023 Proposed Operating & Debt Services Budgets (p.60-113) ......... John Lewis, Jr
FY2023-27 Capital Investment Plan .................................................... Blanche Sherman
VIII. MTC Commissioners’ Business• None
IX. Chief Executive Officer’s Report (p.115-118) .................................................... John Lewis, Jr
X. Adjourn
3

4

Metropolitan Transit Commission Meeting Summary March 23, 2022 Page 1 of 6
METROPOLITAN TRANSIT COMMISSION MEETING SUMMARY
March 23, 2022
Presiding: Commissioner Leigh Altman, Mecklenburg County Board of Commissioners Present: Marcus Jones, (City Manager, Charlotte) Mayor Woody Washam (Town of Cornelius) Andrew Grant (Town Manager, Cornelius) Mayor Rusty Knox (Town of Davidson) Jamie Justice (Town Manager, Davidson) Mayor Melinda Bales (Town of Huntersville) Anthony Roberts (Town Manager, Huntersville) Mayor John Higdon (Town of Matthews) Mayor Pro-Tem Renee Garner (Matthews)
Brian Welch (Town Manager, Mint Hill) Randy Hemann (Town Manager, Mooresville) Bill Thunberg (Mooresville Representative) Mayor Walker Reid III, (City of Gastonia) Michael Peoples (City Manager, Gastonia) Randi Gates (GCLMPO, Gastonia) Brian Borne (Interim City Manager, Monroe) Mayor William Dusch, (City of Concord)
CATS Chief Executive Officer: John Lewis, Jr
I. Call to Order
The regular meeting of Metropolitan Transit Commission was called to order via WebEx conferencing at 5:30pm by Mecklenburg County Commissioner Leigh Altman.
II. Review of Meeting Summary The meeting summary of February 23, 2022 was approved.
III. Transit Services Advisory Committee (TSAC) Chairman’s Report
Krissy Oechslin (Chairwoman) reported the following recap: At our last TSAC meeting we heard about the battery electric bus pilot that's currently being rolled out. We also had an in-depth look at the Envision My Ride Bus Priority Study that will be coming before the MTC for a vote in the coming months. As transit riders we support all efforts to improve the bus system by providing more and better bus stop amenities and by improving the frequency and reliability of the bus system through things like traffic signal priority and queue jumping. We also got a preview of all the service changes that CATS is planning to roll out throughout the year, such as increasing frequency on many local and express bus routes, as well as some potential new cross-town routes. Finally, we heard that CATS has been able to increase the frequency of trains on the Blue Line. It's been a recurring theme in our monthly meetings that we've heard feedback from train riders that ridership was increasing, and trains were crowded because it was such a long wait between trains. Moving from 20-minute headways to 15 minutes during peak hours is a step in the right direction. We hope that service frequency will continue to improve as needed, especially during sports events when there have been significant crowds and long waits for trains.
IV. Citizens Transit Advisory Group (CTAG) Chairman’s Report – No Report
V. Public Comments – None
5

Metropolitan Transit Commission Meeting Summary March 23, 2022 Page 2 of 6
VI. Informational ItemA. LYNX Silver Line Rail Trail Study Update Jason LawrenceJason Lawrence – CATS Senior Transportation Planner – made a presentation an update onLYNX Silver Line Rail Trail Study, based on pages 12-27 in the MTC Agenda packet for March 23rd,2022 meeting.
Discussion:COMMISSIONER ALTMAN (Mecklenburg County): What would be the funding source
for this? Is it the MTC budget?
MR. LAWRENCE: I think that's where we are working through. Really that comes down to the definition of what the project is built with. If there's an opportunity to construct the project, which we're still trying to ascertain whether or not that's possible, if it's considered part of the station access that could be an opportunity, but we're still in the early stages of where all of that funding would lay out. It could be part of a capital improvement plan. We've done Blue Line South and Northeast, there was capital investment plans around each station that built roads and sidewalk connections with the station project. That could be another potential funding source as we look at bonded city projects. I think that's still to be determined. We'll be getting more information about that as we move along in the plan.
COMMISSIONER ALTMAN (Mecklenburg County Board of Commissioners): Okay. And the South End Rail Trail, who paid for that?
MR. LAWRENCE: Large sections of that project were built with the development community as they built out the project. There were sections that were built through City CATS funds, but the majority of the project as I understand, most of it was built through the development coordination.
COMMISSIONER ALTMAN (Mecklenburg County Board of Commissioners): Well, it is a much-loved amenity, and I'm glad and excited by the planning and thinking, more thought given to extending that amenity throughout this proposed line.
B. Silver Line TOD Planning Study Update John Howard John Howard – CATS Transportation Planner – made a presentation an update on Silver Line TOD Planning Study, based on pages 29-37 in the MTC Agenda packet for March 23rd, 2022 meeting.
Discussion: COMMISSIONER ALTMAN (Mecklenburg County Board of Commissioners): If I
understand, page 13 of the presentation tells us that you have a grant. And that this is something that's coming, that this study is going to be done. By the way, who funded this grant? Where did the funds come from for the grant?
MR. HOWARD: Just like a TOD study, it was an FTA award.
COMMISSIONER ALTMAN (Mecklenburg County Board of Commissioners): It's federal dollars?
6

Metropolitan Transit Commission Meeting Summary March 23, 2022 Page 3 of 6
MR. HOWARD: Yes
COMMISSIONER ALTMAN (Mecklenburg County Board of Commissioners): You're going to be bringing in a group that's expert in this or this is our staff doing this?
MR. HOWARD: Similar to the other projects here we would probably bring in a consultant to help with this level of work. It's going to be pretty intensive and again lots of meetings and lots of coordination efforts with neighborhoods and other groups, so this would be consultant-driven but also with a lot of staff input as well.
COMMISSIONER ALTMAN (Mecklenburg County Board of Commissioners): That's great. Do you expect the consultant to obviously build on, I guess 1 through 9, is what staff has already developed in our toolbox and we're looking for the consultant to help add additional strategies, is that what we're doing with this?
MR. HOWARD: I think partly that is what we're going to do is continue this conversation, but again, getting more granular with the public about it and maybe having them also give ideas that aren't on this list. It's not exhaustive, but it is a way to get the conversation kind of restarted if you will and just do a little more focus work about what equity means. We do look at probably expanding this list possibly. We're still working on refining the scope for the grant, given the reduced amount that we got. We actually applied for 800,000 and we got 405,000, so we had to go back over the scope again to make sure we can meet the project goals.
COMMISSIONER ALTMAN (Mecklenburg County Board of Commissioners): That's great; that's wonderful.
CATS CEO LEWIS: I'd like to add a little bit to John's response on that. One of the reasons that we began this study was clearly the broader goals of the City and the community outside of the mobility aspect. As John mentioned, housing and equitable transit-oriented development are a few of those, but one of the things we learned very clearly from lessons learned from the Blue Line extension and the South Corridor is that CATS could not address these issues on its own, and a lot of this was not just identifying the strategies that could be used, but an important part of this is going to be engaging the coalition of partners that will help us achieve these broader goals. I think when we look back at the South Corridor and some of the areas where CATS went alone, we fell short of the goal.
We can talk about Scaleybark. We thought at that time that if we accumulated property, we put a station there, that the market would handle the rest. I think what was obvious is that we needed to be intentional, we needed to cast a wide net, and we needed to come up with a very specific outcome-based strategy at the beginning of the project, not after we had built the project. What you are seeing here is some of the recommendations. Our second grant will help us get more detailed and really work hard on that coalition bill.
COMMISSIONER ALTMAN (Mecklenburg County Board of Commissioners): Wow, I think that's wonderful, and I'm excited at the prospect of this becoming more granular with public input, so thank you very much.
7

Metropolitan Transit Commission Meeting Summary March 23, 2022 Page 4 of 6
MAYOR HIGDON (Town of Matthews): Will the grant opportunity extend beyond Charlotte or is it going to be focused only in Charlotte?
MR. HOWARD: Mostly focused within the city limits. We do have some supporting document from Matthews, but it will be primarily a Charlotte centric study.
COMMISSIONER ALTMAN (Mecklenburg County Board of Commissioners): Well, Mr. Lewis, we certainly want our Towns to be able to benefit from this important work, and I'm concerned if we have towns that have that interest and may sort of be missing the boat. Do you have any thoughts on that?
CATS CEO LEWIS: I think we will have the opportunity as we're working through the scope of this project to identify working with the Towns, identify ways that we can expand this project. I think typically, these kind of housing and economic developments, are outside the scope of the transit focus, but if it is the goal of the MTC and if it is the consensus of the Board that we'd like to expand, we'll find a way to make that work.
VII. Action Item - None
VIII. MTC Commissioners’ Business - None IX. Chief Executive Officer’s Report
John Lewis, Jr. – CATS CEO provided the following report: Echoing some of the comments that were made by our chair of our Transit Service Advisory Committee, over the last two years we know as a result of the pandemic and many external factors that went along with that reality, transit ridership across the nation dropped precipitously. In March of 2020 our ridership was reduced almost overnight by anywhere from 70% to 80%. Since then, our bus ridership has continued to grow on a steady basis. We are about 50% to 60% of where we were this time two years ago. But our rail ridership, which is very much in sync with the employment commute and the state of the environment from an economic and employment standpoint, the rail ridership has lagged behind. But I think we have a couple of bright spots on the horizon that point to the fact that transit is going to make a comeback. When we had large events in Uptown, whether that be Panthers games or Hornets games or recent soccer games, the amount of demand for our rail ridership has been as great as it was before the pandemic. I think that points to when citizens in our region have destinations that they want to go to, and particularly our rail and bus service can serve those needs, they're coming back and making use of our system. Now, we were a little bit surprised by the level of ridership that we've had for the most recent soccer games. We are making those adjustments, but from a transit provider standpoint, full trains are a good thing, full platforms are a good thing. This past weekend we inserted four unscheduled trains to help relieve that, but I think this bodes well for us into the future. Also, working with our Transit Service Advisory Committee we've heard anecdotally that as businesses are beginning to reopen to in-person workplace that our rail ridership and some trains in the morning and in the afternoon commute times are a little more crowded than we've been used to in the last couple of years. Anticipating not just the recent opening of Wells Fargo but the imminent back to work notices from Bank of America, we are going to adjust our service levels in the next week on the Blue Line from 20-minute headways or intervals to 15 minutes.
8

Metropolitan Transit Commission Meeting Summary March 23, 2022 Page 5 of 6
We're doing our best to continue to follow demand of our customers and provide the service levels that they will need.
I think this trend will continue as whether or not we are transitioning out of the pandemic or learning to live with the pandemic, we're definitely seeing a rising demand in public transit services and we'll continue to meet that demand, paying particular attention to our ridership and keeping in close contact with our TSAC committee.
One of the things that we heard, again working with TSAC and our riders committee, is the need to take advantage of technology to provide real-time information to our customers. We launched our CATS-Pass bus app in October of last year, and this app has had great utilization. Over 40,000 users on a daily basis have downloaded the app and continue to use that.
One of the things that we've learned is we need to do a better job at marketing that. Some of our customers are still going to our old application. We are working hard to provide the information they need to transition to our new app but also providing tutorials for customers to really understand how to use this new technology which gives you real-time information of where your next bus is. I'd just like to give a shout-out to our marketing communications department. This is our latest marketing campaign that will be released later this week. We are really excited about the future of this app as we continue. We are planning to integrate our Light Rail and Gold Line streetcar services later this spring, and I will say I am most excited about our fare capping option that we will be rolling out soon. That really is an equity issue, for so many of our cash paying customers who are laying out $2.20 each and every time they are using our service, generally they're paying more for the same service that many others are getting a discount for by laying out $88 at the beginning of the month.
This application will allow us that once our cash paying customers reach that monthly pass limit, that the rest of the month they will be acting as if they have that monthly pass. This really levels the playing field from an equity standpoint and something that we're really excited about rolling out. Stay tuned for that, but we're really pleased with the functionality of our new CATS-Pass app thus far.
Discussion: MS. OECHSLIN (TSAC Chairwoman): This is amazing news. We've been pushing for fare
capping for several years at least, ever since I've been on TSAC, I'm like super excited to hear this. I hope we'll hear more. I mean I'm certain we'll hear more in the TSAC meeting but I hope we'll hear more in an MTC meeting. Just like you said, fare capping is like a payment plan for people who can't afford the upfront cost because it's expensive to be poor. People who can at least afford it should also enjoy the benefits of a monthly pass. I'm really thrilled to hear that.
Also, I was wondering if you had a time frame to when the trains would be included in the CATS-Pass app real-time tracking.
CATS CEO LEWIS: Our goal is by early summer, but I will get you an exact date at the next MTC meeting.
X. Other Business – None
XI. Adjourn
9

Metropolitan Transit Commission Meeting Summary March 23, 2022 Page 6 of 6
The meeting was adjourned at 6:28 p.m. Mecklenburg County Commissioner Leigh Altman – MTC Chairwoman.
NEXT MTC MEETING: WEDNESDAY, APRIL 27TH, 2022; STARTS AT 5:00 P.M.
10

11

METROPOLITAN TRANSIT COMMISSION INFORMATION ITEM
INFORMATION SUMMARY SUBJECT: Envision My Ride: Bus Priority Study Update DATE: April 27, 2022 1.0 PURPOSE/SCOPE: CATS will provide information on the ongoing Envision My Ride Bus
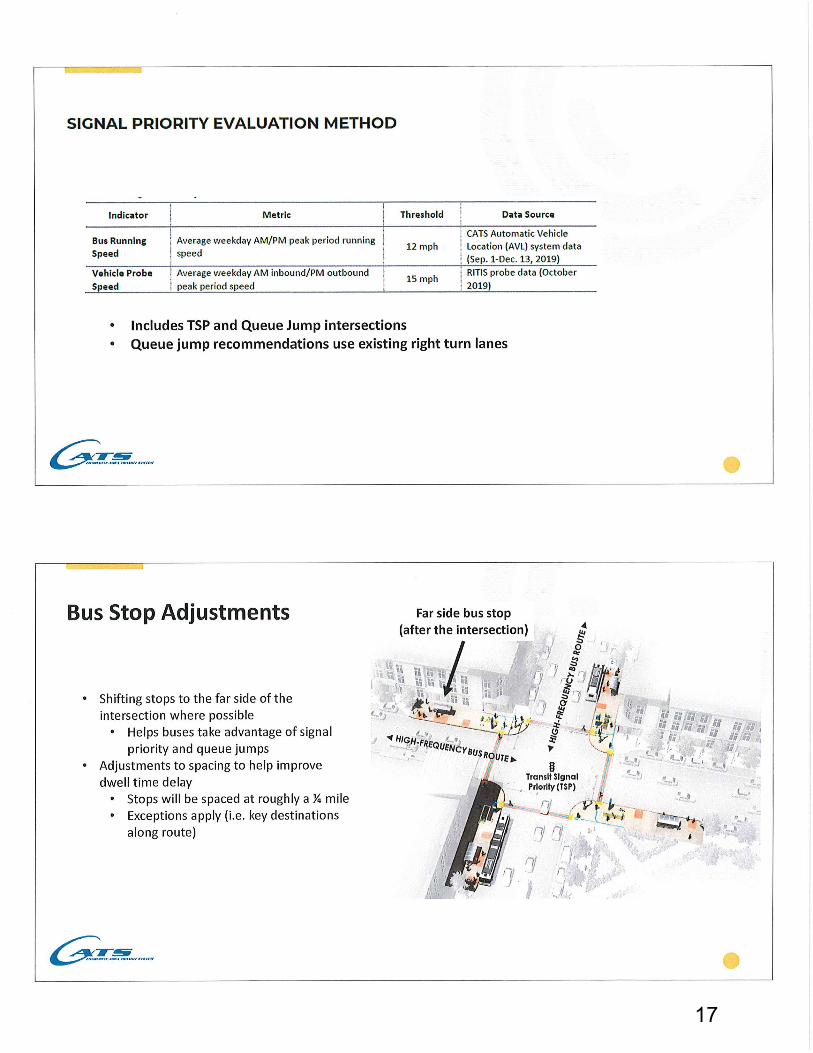
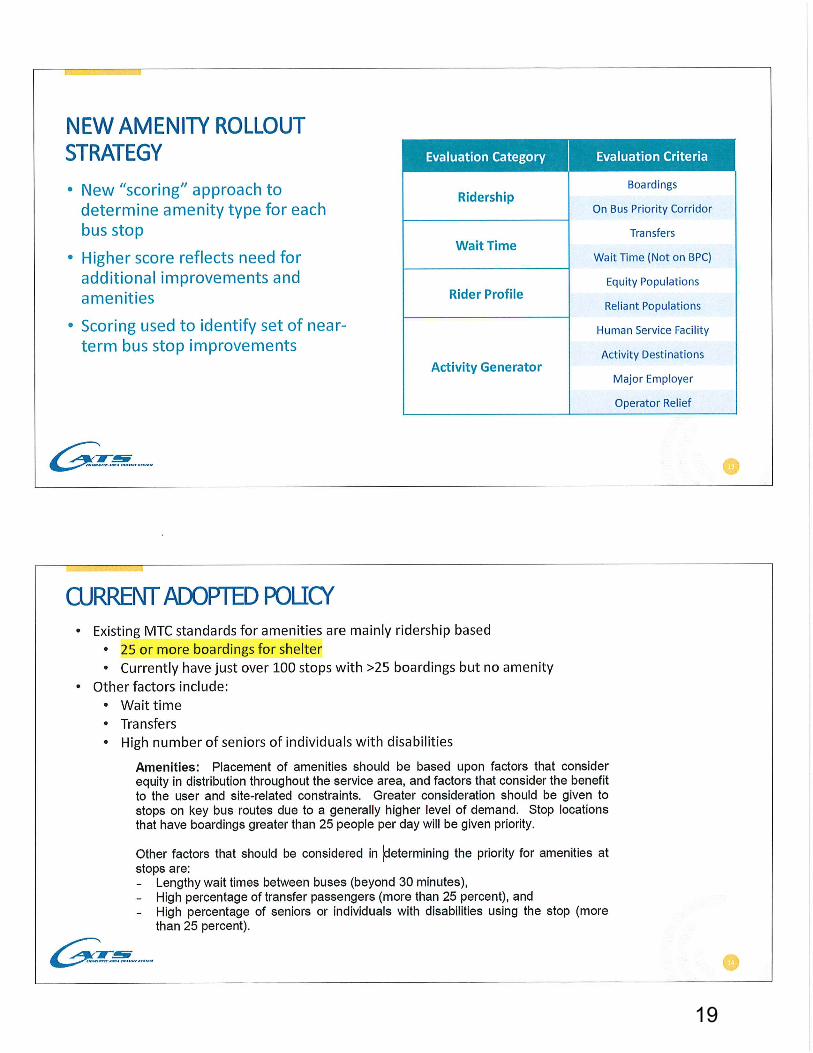
Priority Study during the April meeting before seeking MTC plan adoption in May of this year. The presentation will focus on the recommendations of the study which include the future high frequency bus network, priority bus treatment types, mobility hub locations, a bus stop and ADA improvement plan, policy updates to improve the bus stop amenity rollout process, and microtransit zones to support first / last mile connections.
BACKGROUND/JUSTIFICATION: As a continuation of the Envision My Ride (EMR) effort, CATS began a Bus Priority study in 2021. This study will develop speed and reliability recommendations for the proposed EMR high frequency network. This analysis will include an evaluation of the following: queue jumpers, signal priority/preemption, dedicated bus lanes and related bus priority treatments. Additional deliverables will include proposed system wide bus stop amenity improvements, mobility hub locations, first / last mile solutions, and recommendations to improve the customer experience.
2.0 PROCUREMENT BACKGROUND: N/A 3.0 POLICY IMPACT: N/A 4.0 ECONOMIC IMPACT: N/A 5.0 ALTERNATIVES: N/A 6.0 RECOMMENDATION: N/A 7.0 ATTACHMENT(S): N/A
SUBMITTED AND RECOMMENDED BY:
__________________________________________ John M. Lewis, Jr. Chief Executive Officer, Charlotte Area Transit System
Director of Public Transit, City of Charlotte
12

13

14

15

16
17

18
19

20

21

22

23

24

25
26

27

28

29

30

31

32

33

METROPOLITAN TRANSIT COMMISSION INFORMATION ITEM STAFF SUMMARY
SUBJECT: Regional Coordinated Human Services Plan Update DATE: April 27, 2022
1.0 PURPOSE/SCOPE: To present the draft Coordinated Public Transit Human Services Transportation Plan Update. The plan presentation will assess current transportation services available in the region for older adults and individuals with disabilities, as well as provide recommendations to address unmet needs and opportunities for the coordination of transportation services, and the next steps for the plan implementation.
2.0 BACKGROUND/JUSTIFICATION: The plan is required under the federal Enhanced Mobility of Seniors & Individuals with Disabilities-Section 5310. The plan is updated every 5 years, with the last plan update occurring in 2016.
The region is allocated Section 5310 funds annually. CATS was designated to serve as the direct recipient of the 5310 funding, and is responsible for the administrative of the funds, which includes awarding, reporting, and subrecipient oversite.
Transit agencies and non-profits are eligible to apply for the funding through a competitive selection process. To apply for funding, agencies must submit applications, which provide background information, assurance of matching funds and details of plans to address an unmet need found within the “Recommendations” section of the Coordinated Public Transit Human Services Transportation Plan.
3.0 POLICY IMPACT: N/A
4.0 ECONOMIC IMPACT: N/A
5.0 ALTERNATIVES: N/A
6.0 RECOMMENDATION: N/A
7.0 ATTACHMENT(S): Draft Coordinated Public Transit Human Services Transportation Plan Recommendations
SUBMITTED AND RECOMMENDED BY:
__________________________________________ John M Lewis, Jr. Chief Executive Officer, Charlotte Area Transit System Director of Public Transit, City of Charlotte
34

Implmmmntation
PmriodTypm Rmcommmndation Dmscription
Near-Term Mobility Management and
Agency Coordination
Establish iegional Mobility
Manager position(s)
(CONNECT Beyond C-09)
The iegional Mobility Manager would help coordinate on
policies that support public transit, build local partnerships and
help coordinate transportatoin services across service providers
and funding agencies in the region. The iegional Mobility
Manager would also support the development of information
tools and trip planning tools for transit riders.
Near-Term Mobility Management and
Agency Coordination
Establish a Paratransit
Working Group (CONNECT
Beyond D-03)
Establish a Paratransit Working Group that is made up of
representatives from each Community Transportation Provider in
the region and is coordinated by the iegional Mobility Manager.
The objective of this Working Group should be to coordinate
paratransit policies and operations region-wide and to work
together to implement CONNECT Beyond recommendations
related to Community Transportation Services.
Near-Term Mobility Management and
Agency CoordinationTravel Training
Establish transportation kiosks in senior / low income housing
and social service locations, create a demonstration bus, create a
mobile classroom, and provide one-on-one instruction, as well
as group instruction, to target populations for “first and last mile”
access
Near-Term Organizational Assessments
ieview the Impacts of
Medicaid Managed Care on
Transportation Providers in
the iegion (CONNECT
beyond C-03)
Community Transportation Providers should assess the impact of
Medicaid Managed Care by maintaining records for system
ridership and financials to determine impacts on system
operations.
Near-Term Customer Serviceiegional Information Center
(CONNECT Beyond D-37)
One-Click One-Call Center or iegional Transit Information
Website
Near-Term Customer Service Improve service times
ieduce reservation wait times and expand eligibility and
frequency for on-demand trips in areas served by Community
Transportation Providers (outside of existing fixed route and
deviated fixed route service areas).
Near-TermFacility Improvements and
Safety
Develop a comprehensive
transit safety and convenience
program (CONNECT Beyond
D-26)
Develop a comprehensive safety and convenience program for
transit users, operators, other staff, and the public (a systematic
approach to review issues in proximity to transit stops and
address them through lighting, access improvements, safety
officers, etc .).
Near-TermFacility Improvements and
Safety
Improve access to existing
public transit stops
Upgrade bus stops with highest ridership with bus shelters,
improve ADA compliant bus stop pads and upgrade lighting.
Add Braille to fixed-route bus stops signs.
Near-termMobility Management and
Agency Coordination
Improve marketing and
information sharing about
existing services (short-term)
Help seniors and individuals with disabilities connect with
existing transit services, coordinate with travel training for seniors
and individuals with disabilities to help them navigate transit
services.
Mid-Term ConnectivityMicrotransit /Community
Shuttle Pilot Program
Test a pilot and implement microtransit /on-demand community
shuttle services with ADA-accessible vehicles and same day
reservation capabilities in high demand areas to expand the
reach of existing fixed route and deviated fixed route transit
Charlottm Urbanizmd Arma Coordinatmd Public Transit-Human SmrTicms Transportation Plan Draft Rmcommmndations
April 2022
35

Implmmmntation
PmriodTypm Rmcommmndation Dmscription
Mid-Term Connectivity Mobility Hubs pilot program
Test a pilot and implement mobility hubs at key station areas to
improve transfer and waiting areas with access to a variety of last-
mile solutions including pedestrian access, ride sharing,
microtransit/shuttles and taxi services
Mid-Term Customer Service
ieduce reservation wait times
for on-demand transportation
and ADA Paratransit
Provide same-day on-demand transportation services including
ADA Paratransit /Special Transportation Service (STS)
Mid-Term Service Expansion Increase Service Increase trips for on-demand non-emergency trips
Mid-term Service Expansion Expand service Expand On-Demand and Community Transportation Service
Hours (Evenings and Weekends)
Mid-Term Connectivity
Volunteer Transportation
Services Program (CONNECT
Beyond C-20)
Launch a redesigned regional Volunteer Transportation Services
Program for older adults and people with disabilities. This
program is intended as a safety net service for those who do not
qualify or cannot access other transit services.
Mid-term ConnectivityExpand Mobility Choices
(CONNECT Beyond B-21)
Identify small area or station area plans that coincide with
mobility hub candidate areas and incorporate hub elements into
the area plans. This should be completed after the alternatives
analysis study for future HCT and in coordination with existing
fixed-route and human services plans.
Mid-Term Connectivity
Establishing connecting
service procedures between
transit providers
Create new and improved transfer locations, improve
communication methods, and schedule software, and improve
agreements between agencies to be able to transfer passengers
for longer trips
Mid-Term Connectivity
Strengthen iural to Urban
Connections (CONNECT
Beyond C-01)
Involve Community Transportation Providers in CONNECT
Beyond Service Planning Working Group to ensure service
improvements are coordinated at a regional level (2-3
times/year )
Mid-Term Customer Serviceiegional Fare Strategy
(CONNECT Beyond B-19)
Develop fare interoperability agreements between CATS, iider,
ICATS and other connecitng agencies. Implement a shared
regional mobile ticketing platform that allows for access by under-
banked individuals and individuals with disabilities
Mid-Term Customer Service
iegional Platform for Demand
iesponse Trip Scheduling and
Dispatching (CONNECT
Beyond D-53)
Integrate demand response trip scheduling and dispatching
systems into a single regional platform.
36
Implmmmntation
PmriodTypm Rmcommmndation Dmscription
Mid-Term Customer Service
Develop a standardized ADA
certification process across all
agencies and reciprocity
agreements (CONNECT
Beyond D-19)
A standardized process and reciprocity agreements would greatly
improve user experience by eliminating unnecessary transfers .
Mid-Term Customer Service Sensitivity TrainingProvide disability sensitivity training to taxi and limousine drivers.
Mid-termMobility Management and
Agency Coordination
Expand Mobility Choices-
Promote iegional
Coordinatoin on Emerging
Mobility Technology
(CONNECT Beyond B-06)
In coordination with the existing Connected and Autonomous
Vehicle Task Force convened by Centralina iegional Council
iegional Council, establish an Emerging Mobility Working Group.
The Group will engage transit stakeholders to understand current
and future technology needs and set a path for the effective
Mid-term Organizational Assessments
iegional Paratransit and
Community Transportation
Scheduling Integration
(CONNECT Beyond D-09)
Perform a regional Paratransit and Community Transportation
Scheduling Integration and Implementation Study.
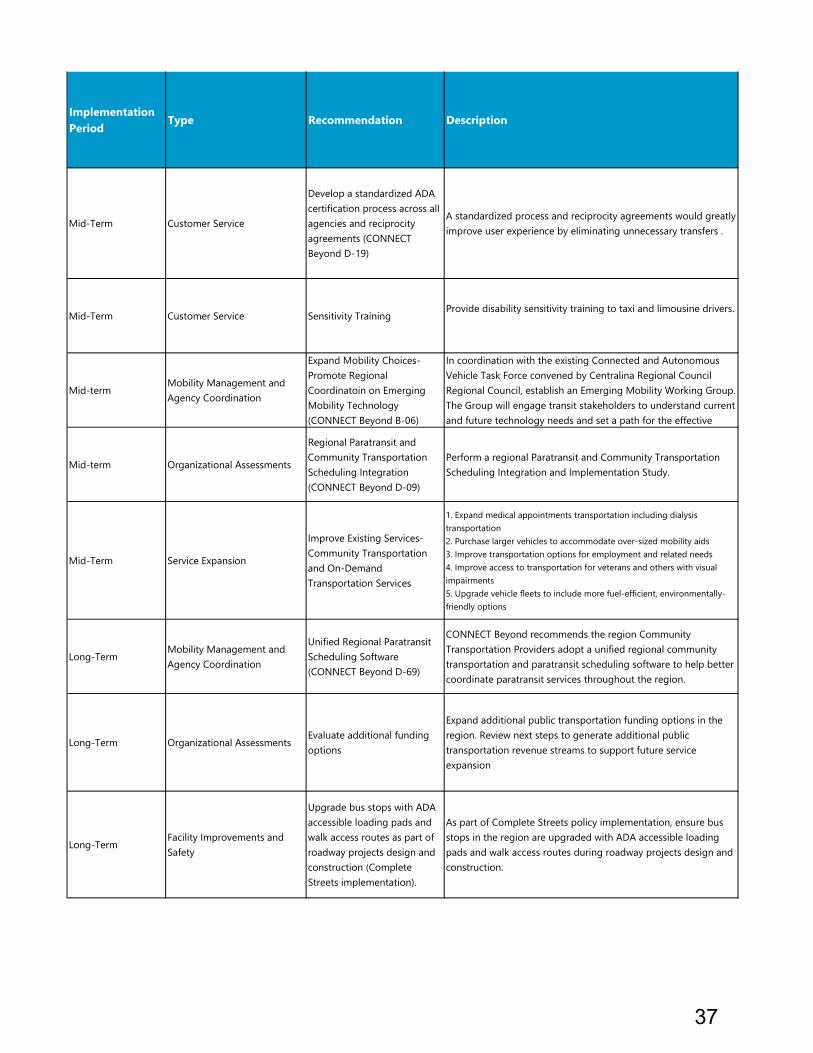
Mid-Term Service Expansion
Improve Existing Services-
Community Transportation
and On-Demand
Transportation Services
1. Expand medical appointments transportation including dialysis
transportation
2. Purchase larger vehicles to accommodate over-sized mobility aids
3. Improve transportation options for employment and related needs
4. Improve access to transportation for veterans and others with visual
impairments
5. Upgrade vehicle fleets to include more fuel-efficient, environmentally-
friendly options
Long-TermMobility Management and
Agency Coordination
Unified iegional Paratransit
Scheduling Software
(CONNECT Beyond D-69)
CONNECT Beyond recommends the region Community
Transportation Providers adopt a unified regional community
transportation and paratransit scheduling software to help better
coordinate paratransit services throughout the region.
Long-Term Organizational AssessmentsEvaluate additional funding
options
Expand additional public transportation funding options in the
region. ieview next steps to generate additional public
transportation revenue streams to support future service
expansion
Long-TermFacility Improvements and
Safety
Upgrade bus stops with ADA
accessible loading pads and
walk access routes as part of
roadway projects design and
construction (Complete
Streets implementation).
As part of Complete Streets policy implementation, ensure bus
stops in the region are upgraded with ADA accessible loading
pads and walk access routes during roadway projects design and
construction.
37

38

39

40

41

42

43

44

45

46

47

48

49

50

51

METROPOLITAN TRANSIT COMMISSION ACTION ITEM
STAFF SUMMARY
SUBJECT: MTC Approval DATE: April 27, 2022 FY2022 Transit Operating Budget Amendments FY2022 Transit Capital Investment Plan (CIP) Budget Amendment
1.0 ACTION: In compliance with the Transit Governance Interlocal Agreement, the Metropolitan Transit Commission is required to take action concerning the CATS’ FY2022 operating and capital budget amendments based on the chief executive officer’s recommendation.
2.0 BACKGROUND: On April 20, 2021, the Metropolitan Transit Commission took action to approve the FY2022 Transit Operating Budget and The FY2022-2026 Transit Capital Investment Plan (CIP) budget. The CATS FY2022 Operating Budget and The FY2022-2026 Capital Investment Plan (CIP) were presented in compliance with the Transit Governance Interlocal Agreement. The balanced budgets were developed in compliance with CATS Financial Policy guidelines and objectives.
Based on anticipated revenue decreases and employee incentives, CATS’ staff is requesting the following budget amendments:
Changes to the FY2022 Operating Revenue Budget are below:o Estimated reduction in Fare Revenue $6,669,364o Reduction of SMAP Funding $1,854,444
Of the $11,063,205 estimated for FY2022 only $9,208,761 wasallocated to Charlotte.
o Increase in Sales Tax Operating Allocation $9,050,910 As a result of the Sales Tax Trendline adjustment
o Slight decreased in COVID relief funding $527,102 needed for cleaning. Changes to the FY2022 Operating Expense Budget are below:
o Increase in Security $760,000 Enhancements to Safety & Security contract
o Increase for Recruitment and Retention Bonuses $1,970,000o Reduction for Staff Vacancies $2,730,000
RevenueFY2022 Adopted Budget 185,836,947$ Fare Revenue (6,669,364) Sales Tax Operating Allocation 9,050,910 COVID Relief Funding (527,102) Non-Operating Revenue (SMAP) (1,854,444) FY2022 Amended Operating Revenue 185,836,947$
ExpensesFY2022 Adopted Budget 185,836,947$ Security Enhancements 760,000 Recruitment and Retention Bonuses 1,970,000 Staff Vacancies (2,730,000) FY2022 Amended Operating Expenses 185,836,947$
52
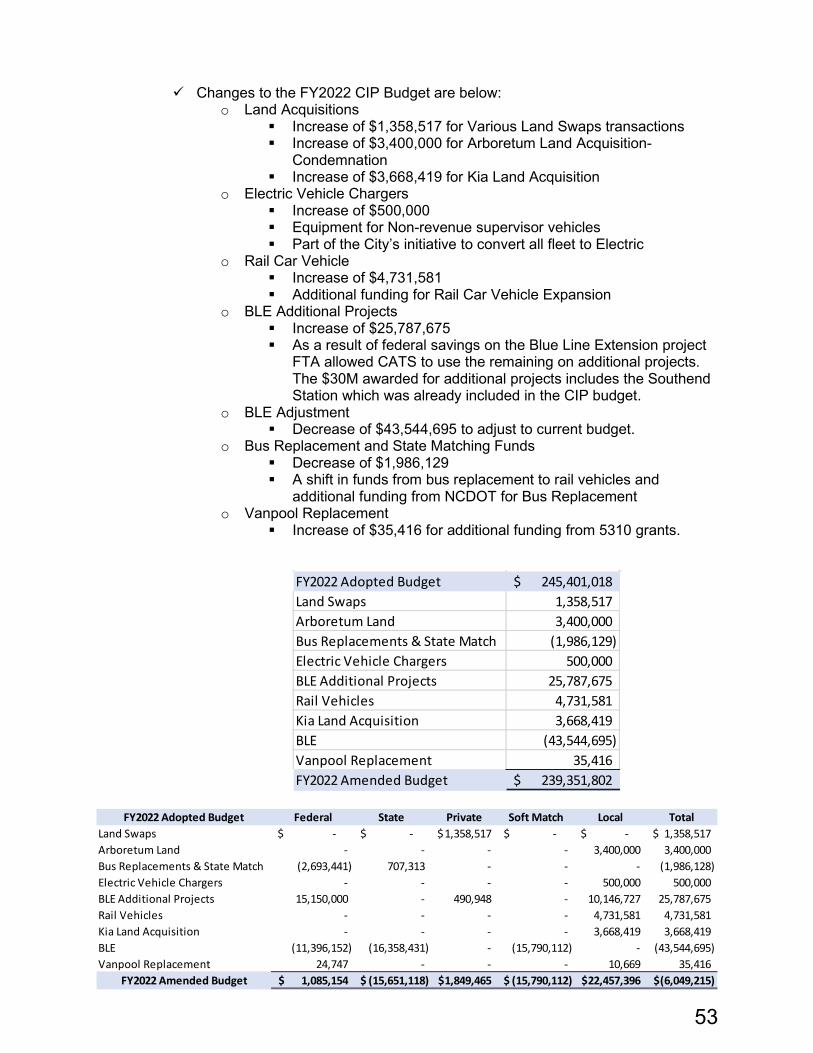
Changes to the FY2022 CIP Budget are below: o Land Acquisitions
Increase of $1,358,517 for Various Land Swaps transactions Increase of $3,400,000 for Arboretum Land Acquisition-
Condemnation Increase of $3,668,419 for Kia Land Acquisition
o Electric Vehicle Chargers Increase of $500,000 Equipment for Non-revenue supervisor vehicles Part of the City’s initiative to convert all fleet to Electric
o Rail Car Vehicle Increase of $4,731,581 Additional funding for Rail Car Vehicle Expansion
o BLE Additional Projects Increase of $25,787,675 As a result of federal savings on the Blue Line Extension project
FTA allowed CATS to use the remaining on additional projects. The $30M awarded for additional projects includes the Southend Station which was already included in the CIP budget.
o BLE Adjustment Decrease of $43,544,695 to adjust to current budget.
o Bus Replacement and State Matching Funds Decrease of $1,986,129 A shift in funds from bus replacement to rail vehicles and
additional funding from NCDOT for Bus Replacement o Vanpool Replacement
Increase of $35,416 for additional funding from 5310 grants.
FY2022 Adopted Budget 245,401,018$ Land Swaps 1,358,517 Arboretum Land 3,400,000 Bus Replacements & State Match (1,986,129) Electric Vehicle Chargers 500,000 BLE Additional Projects 25,787,675 Rail Vehicles 4,731,581 Kia Land Acquisition 3,668,419 BLE (43,544,695) Vanpool Replacement 35,416 FY2022 Amended Budget 239,351,802$
FY2022 Adopted Budget Federal State Private Soft Match Local TotalLand Swaps -$ -$ 1,358,517$ -$ -$ 1,358,517$ Arboretum Land - - - - 3,400,000 3,400,000 Bus Replacements & State Match (2,693,441) 707,313 - - - (1,986,128) Electric Vehicle Chargers - - - - 500,000 500,000 BLE Additional Projects 15,150,000 - 490,948 - 10,146,727 25,787,675 Rail Vehicles - - - - 4,731,581 4,731,581 Kia Land Acquisition - - - - 3,668,419 3,668,419 BLE (11,396,152) (16,358,431) - (15,790,112) - (43,544,695) Vanpool Replacement 24,747 - - - 10,669 35,416
FY2022 Amended Budget 1,085,154$ (15,651,118)$ 1,849,465$ (15,790,112)$ 22,457,396$ (6,049,215)$
53

3.0 PROCUREMENT BACKGROUND: N/A
4.0 POLICY IMPACT: The recommended FY2022 Operating and Capital Investment Plan
(CIP) Budget Amendment remain in compliance with the following MTC Policy directives, except where impacted by the COVID-19 pandemic A. CATS Mission, Vision, and Strategic Goals B. CATS Financial Policies (Rev. 2016) C. The 2030 Transit Corridor System Plan D. CATS Service and Fare Policies
5.0 ECONOMIC IMPACT: N/A
6.0 ALTERNATIVES: N/A
7.0 RECOMMENDATION: CATS Chief Executive Officer recommends approval of the
FY2022 budget amendments.
8.0 ATTACHMENT(S): N/A SUBMITTED AND RECOMMENDED BY:
______________________________________________ John M. Lewis, Jr. Chief Executive Officer, Charlotte Area Transit System Director of Public Transit, City of Charlotte
54

55

56

57

58

59

METROPOLITAN TRANSIT COMMISSION ACTION ITEM
STAFF SUMMARY
SUBJECT: MTC Approval DATE: April 27, 2022 FY2023 Transit Operating Budget & Debt Services Budget FY2023-2027 Transit Capital Investment Plan (CIP)
1.0 ACTION: In compliance with the Transit Governance Interlocal Agreement, the Metropolitan Transit Commission is required to take action on CATS budgets and CIP by April 30 of each year. MTC Action is included in Resolution 2022-02
2.0 BACKGROUND: On January 26, 2022, CATS presented the CEO recommended FY2023 Operating Budget, FY2023 Debt Service Budget and FY2023-2027 Capital Investment Plan (CIP) to the Metropolitan Transit Commission.
Key elements of the Operating Budgets are:
COVID-19 Reliefo Funding for Transit to cover cost incurred as result of the COVID-19
pandemic, including personal protective equipment, protection equipmenton fleet, services excess operating expenses, preventive maintenanceand mid-life overhaul expenses
Safety and Supporto Safety Enhancements to support Bus, Rail, Streetcar operations,
Charlotte Transportation Center (CTC), and funding for new personnel. New All-Access Pass Agreements
o Funding for universities and colleges along the CityLYNX Goldlinecorridor such as Johnson and Wales and Johnson C. Smith Universitiesand Central Piedmont Community College.
Key elements of the Capital Budgets are:
State of Good Repairo Priorities include replacement of fixed-route diesel buses with fully electric
buses, Special Transportation Services (STS) buses and vanpoolvehicles, and facility upgrades and enhancements.
Technology Upgradeso Funding to enhance delivery of transit services, asset and financial
management, including replacing the City’s Enterprise system, AccessControl System Upgrade, and Automatic Vehicle Locator (AVL)replacement.
3.0 RECOMMENDATION: CATS Chief Executive Officer recommends approval of the following budgets: FY2023 Operating Budget FY2023 Debt Service Budget FY2023-2027 Community Investment Plan
60

4.0 ATTACHMENT(S): CATS FY2023 Proposed Operating and Debt Service Budget and FY2023-2027 Proposed Capital Investment Plan Information Booklet
SUBMITTED AND RECOMMENDED BY:
______________________________________________ John M. Lewis, Jr. Chief Executive Officer, Charlotte Area Transit System City of Charlotte Director of Public Transit
61

RESOLUTION No. 2022-02
ADOPTION OF THE FY2023 TRANSIT OPERATING BUDGET, FY2023 TRANSIT DEBT SERVICE BUDGET AND FY2023-2027 CAPITAL INVESTMENT PLAN
A motion was made by __________ (____) and seconded by _________ (_______) for the adoption of the following resolution, and upon being put to a vote was duly adopted by the Metropolitan Transit Commission (MTC).
WHEREAS, The Amended Transit Governance Interlocal Agreement (11-28-2005) provides that the Chief Transit Official shall submit to the MTC by January 30 of each year a proposed transit budget and program delineating the public transit services, activities and programs to be undertaken in the upcoming fiscal year starting July 1, and the financial resources required to carry out the services, activities and programs, and
WHEREAS, the Chief Transit Official provided budget and program recommendations to the MTC on January 26, 2022, which have been developed in compliance with CATS Mission, Vision, Strategic Goals and Financial and Fare Policies, and
WHEREAS, the Chief Transit Official’s recommended budgets and programs have been reviewed by the Citizens Transit Advisory Group and the Transit Services Advisory Committee in accordance with the provisions of the Transit Governance Interlocal Agreement and the Metropolitan Transit Commission Rules of Procedures, and
WHEREAS the Metropolitan Transit Commission has reviewed the recommended FY2023 Transit Operating and Debt Service Budgets and Programs and the FY2023-2027 Capital Investment Plan and Projects to determine the transit program plans for meeting transportation needs of the Charlotte-Mecklenburg community,
NOW THEREFORE, be it resolved that the Metropolitan Transit Commission hereby
1. Approves the FY2023 Transit Operating Budget, the FY2023 Transit Debt Service Budgetand the FY2023-2027 Transit Capital Investment Plan (attached to this Resolution)
2. Authorizes Chief Transit Official to present the FY2023 Transit Operating Budget, theFY2023 Debt Service Budget and the FY2023-2027 Capital Investment Plan to the CharlotteCity Council for their review, approval and inclusion in the City of Charlotte’s FY2023 BudgetOrdinance.
This resolution shall take effect immediately upon its adoption.
I, Mecklenburg County Commissioner Leigh Altman, Chairwoman of the Metropolitan Transit Commission do hereby certify that the above Resolution is a true and correct documentation of the MTC’s action from their meeting duly held on April 27, 2022.
_________________________________ Signature of MTC Chairperson
62

63

April 27, 2022
To: The Chair and Members of the Metropolitan Transit CommissionCharlotte, North Carolina
I am pleased to present to you the CATS’ FY2023 Proposed Operating Budget and FY2023 ProposedDebt Service Budget, which includes the Staffing Summary and Financial and Business PerformanceTargets and the FY2023-2027 Capital Investment Plan (CIP) for the Charlotte Area Transit System(CATS.) The balanced budget maintains current services and commitments with a focus on employeesafety, asset management and flexible mobility options.
CATS’ FY2023 Proposed Operating Budget is supported primarily by the transit sales tax, fare revenues,service reimbursements, maintenance of effort, Coronavirus Disease 2019 (COVID-19) Funds,operating and non-operating assistance from the Federal and State government and othermiscellaneous sources. The budget is balanced, meets CATS Financial performance objectives (unlessimpacted by the COVID-19 pandemic) and delivers a variety of transportation options for thecommunity.
FY2023 Priorities:The FY2023 budget reflects priorities in the Metropolitan Transit Commission’s approved Mission and Strategic Goals for CATS.
• Outstanding community-wide public transportation services• Focused Regional Growth• Safety and Accountability• Safe, affordable mobility options to jobs, education and housing• Contribution to economic development in the County and region• Investment in employees
FY2023 Preliminary Operating Budget Highlights:
• Safety and Support Cost including Security Enhancements to support Bus, Rail, Streetcar,Charlotte Transit Center (CTC) operations, recruitment and retention cost and funding for newpersonnel.
• COVID-19 Relief funding for Transit will cover costs incurred as a result of the COVID-19pandemic, including personal protective equipment, protective equipment on fleet, services,excess operating expenses, preventive maintenance and mid-life overhaul expenses.
• New All Access Pass Agreements for Universities and colleges along the CityLYNX Goldlinecorridor such as Johnson and Wales and Johnson C. Smith Universities and Central PiedmontCommunity College.
Chief Executive Officer’s Transmittal Letter
FY 2023 Proposed Budget CEO’s Transmittal Letter | 1
64

FY2023 Proposed Capital Budget Highlights:
• State of Good Repair priorities including replacement of fixed-route diesel buses with fullyelectric buses, Special Transportation Services (STS) buses and vanpool vehicles; and facilityupgrades and enhancements.
• Technology Upgrades to enhance delivery of transit services, asset & financial management,including replacing the City’s Enterprise system, Access Control System Upgrade andAutomatic Vehicle Locator (AVL) replacement.
The FY2023 Operating and Capital Budget is mostly supported by an Increase in Sales Tax Revenueand COVID-19 Relief funding. Though fare revenue has not returned to pre-pandemic levels theoverall cost of operations has increased due to supply chain issues, increased material cost andthe on-going need for fleet and facility maintenance. The capital program has also grown as theCity enters an agreement to update the current transit center that may cause CATS to temporarilyre-locate. CATS plans to continue to work with current funding sources to advance the 2030Transit Corridor System Plan but will need significant new funding sources to advance throughcompletion.
Respectfully Submitted,
John M. Lewis, Jr.
Chief Executive Officer
CEO’s Transmittal Letter | 2
Chief Executive Officer’s Transmittal Letter
CEO’s Transmittal Letter | 2FY 2023 Proposed Budget65

Executive Summary 4
Section I – Operating Budget 5
Section II – Debt Service Budget 11
Section III - Revenue Reserve Fund 11
Section IV – Capital Investment Plan 12
Section V – Performance Objectives 15
Section VI – CATS Services and Ridership 16
Section VII – CATS At A Glance 17
Appendix 1 – Operating Budget Summary 19
Appendix 2 – Performance Objectives 20
Appendix 3 – Staffing Summary 22
Appendix 4 – Operating Budget 23
Appendix 5 – Debt Service Summary 25
Appendix 6 – Capital Revenue Summary; Capital Expenditure Summary & Detail
28
Appendix 7 – Grant-Funded Operating Projects 34
Appendix 8 – Other Capital Projects Managed by CATS 37
Appendix 9 – FY2023 Budget Schedule 39
Table of Contents | 3
Table of Contents
FY 2021 Proposed BudgetFY 2023 Proposed Budget66

The budget reflects the continued effort to provide outstanding community-wide public transportationservices while proactively contributing to focused growth and sustainable regional development.
The FY2023 proposed operating budget totals $211.2 million and remains aligned with MTC approvedmission and strategic goals. The budget continues to reflects the impact of the current healthpandemic, estimated fare revenue decreases, and increased assistance from the Federal Governmentfor operations and maintenance.
CATS is projecting to contain operating cost in FY2022 as the pandemic continues and plans tomaintain expense controls through FY2023. Although fuel consumption reduced from prior year, theaverage price slightly increased. Sales tax growth is expected to continue in FY2023. Additionalrevenue from new pass agreements and COVID-19 relief funding are also expected in FY2023.
The FY2023 Capital Investment Plan (CIP) budget totals $280.9 million which includes projects such asa Temporary Facility for the Charlotte Transit Center, State of Good Repair and Technology Upgrades.The CIP plan is guided by the 2030 Transit Corridor System Plan, CATS’ financial policies and CATS’ longrange financial plan. The FY2023 Debt Service totals $18.1 million, a decrease from the prior yearamount of $62.1 million due to principal payments for temporary debts, debt payoffs and savings fromrefinancing.
Executive Summary | 4
Executive Summary
FY 2021 Proposed BudgetFY 2023 Proposed Budget
*FY2023 Capital Budget includes carryover
BUDGET SUMMARYFY2022 FY2023 Variance Variance
AmendedBudget
(millions)
Proposed Budget(millions)
(millions) (%)
Operating Revenues 185.8$ 211.2$ 25.4$ 13.7%CATS Control Account - - -$ 0.0%Total Operating Revenue 185.8$ 211.2$ 25.4$ 13.7%
Operating Expenditures 185.8$ 211.1$ 25.3$ 13.6%Transfer to Capital - 0.1 0.1 0.1%Total Operating Expenditures and Transfers 185.8$ 211.2$ 25.4$ 13.7%
Debt Service Budget 62.1$ 18.1$ (44.0)$ -70.9%Capital Budget* 245.4$ 280.9$ 35.5$ 14.5%
67

Section I. Operating Budget | 5
I. OPERATING BUDGETThe FY2023 Proposed Operating Budget is $211.2 million.
Reference: Appendix 1
The FY2023 Proposed Operating Budget covers cost for transit provided by the City of Charlotte andcontracted employees. Approximately 57.8% (or $122.1 million) of the Operating Budget includesPersonnel Services with the remaining 42.2% covering other operating expenses (or $89.1 million.)
Direct services such as Bus, Rail, Streetcar, Special Transportation Services and Vanpool operations,Vehicle and Track Maintenance, Facilities, Planning and Scheduling, Customer Service, Revenuecollections and Safety and Security account for 85.5% (or $180.6 million) of the Operating Budget.Support services such as admin, marketing, technology, Human Resources and Civil Rights andDevelopment and other indirect services account for 14.5% (or $30.6 million) of the Operating Budget.
Budget Summary
FY 2021 Proposed BudgetFY 2023 Proposed Budget
*FY2023 Capital Budget includes carryover
BUDGET SUMMARYFY2022 FY2023 Variance Variance
AmendedBudget
(millions)
Proposed Budget(millions)
(millions) (%)
Operating Revenues 185.8$ 211.2$ 25.4$ 13.7%CATS Control Account - - -$ 0.0%Total Operating Revenue 185.8$ 211.2$ 25.4$ 13.7%
Operating ExpendituresCurrent Service Levels 185.7$ 207.6$ 21.9$ 11.8%Service Level Changes 0.1 3.5$ 3.4$ 1.8%
Subtotal Operating Expenditures 185.8$ 211.1$ 25.3$ 13.6%
Transfer to Capital - 0.1 0.1 0.1%
Total Operating Expenditures and Transfers 185.8$ 211.2$ 25.4$ 13.7%
Debt Service Budget 62.1$ 18.1$ (44.0)$ -70.9%Capital Budget* 245.4$ 280.9$ 35.5$ 14.5%
Total $211.2 million
68

Section I. Operating Budget | 6
A. Operating Revenues: $211.2 millionIn FY2023, operating revenues are projected at $211.2 million, an increase of $25.4 million compared tothe FY2022 Amended Budget, which represents an increase of 13.7%.
Compared to the FY2022 Amended Budget Passenger Fare revenue will increase by $0.9 million asdemand for service increases. Despite an increase, Fare Revenue is not expected to reach pre-pandemiclevels in FY2023. Service Reimbursement and Transit Passes are expected to increased by $0.4 million.The overall increase is a result of $1.5 million in new All Access passes for Johnson & Wales and JohnsonC. Smith Universities and Central Piedmont Community College and elimination of the Airport All AccessPass and Lowe’s Agreement.
Service Income decreased by $3.4 million due to a significant adjustment for interest earnings and leaseincome. Federal Operating Assistance increased by $7.3 million to support on-going operations anddirect expenses associated with the pandemic with the use of COVID-19 operating assistance funding toensure our system maintains a state of good repair throughout the pandemic.
Sales tax increased by $7.5 million as result of an increase in the trend-line resulting from growth inCATS’ sales tax revenue. Non-Operating revenue increased by $10.9 million due to an increase inavailable COVID-19 funding to be used for preventative maintenance cost. Other changes include a $0.7million increase in Maintenance of Effort funding and $1.0 million for Goldline Operations, both fundedby the City of Charlotte.
The following chart identifies the sources of the $211.2 million in revenue that will fund the FY2023operating programs.
Budget Summary
FY 2021 Proposed Budget
FY2023: Where the Money Comes From
FY 2023 Proposed Budget
Total $211.2 million
69

Budget SummaryKey changes in revenue in the FY2023 Proposed Operating Budget versus the FY2022 Amended Operating Budget are as follows:
Section I. Operating Budget | 7FY 2021 Proposed BudgetFY 2023 Proposed Budget
FY2022 FY2023 Variance VarianceAmended
Budget(millions)
Proposed Budget(millions)
(millions ) (%)
Operating Allocation 97.3$ 104.8$ 7.5$ 7.7%The Operating Allocation increase reflects an updated sales taxtrendline due to a significant growth in sales tax revenueFare Revenues 12.5$ 13.4$ 0.9$ 7.1%Fares are projected to increase as demand for service increase. Despite the slight, increase Fare Revenue has not returned to pre-pandemiclevels
All Access Pass & Service Reimbursements 3.3$ 3.7$ 0.4$ 12.1%New All Access (Johnson C Smith, Johnson & Wales, CPCC) passesreplenish passes that will not continue in FY2023 such as Lowe's andAirport. In addition, slight increased revenue for service providersbased on increased operating cost.
Maintenance of Effort 24.0$ 24.7$ 0.7$ 2.9%Maintenance of Effort are funds received from the City of Charlotte,which are paid to CATS in compliance with state law. The City ofCharlotte increases its annual contribution by 3%.
Operating Assistance 5.6$ 13.9$ 8.3$ 148.2%The increase is a combination of Federal COVID-19 Relief funding andCity of Charlotte funds for Goldline operations. Federal COVID-19Relief Funding provides operating assistance to Transit Agencies tohelp combat the impact of the current health pandemic. It coversdirect expenses such as PPE, social distancing equipment, cleaningservices in addition to a operating loss. The total increase for COVID-19Relief funding is $7.3 million. Operating assistance from the City ofCharlotte will increase by $1.0 million for Goldline operations.
Other (Miscellaneous) 8.1$ 4.8$ (3.3)$ -40.7%Other Miscellaneous revenues include advertising, lease agreementsand interest earned. Interest earnings are expected to decrease by$2.4 million based on prior year actuals and current trend. Advertisingdecreased by $0.6 million and miscellanous income increased by $0.7million due to bringing the advertising production and installation inhouse. All cost is reimbursable from the client. Parking deck, Leasesand Private partner agreements are expected to decrease by a netamount of $1.2 million. Non-Operating Revenue 35.0$ 45.9$ 10.9$ 31.1%COVID -19 Relief funding increased by $5.0 million as funding shiftedfrom Operating Assistance to Non-Operating Revenue ensuring thesystem can remain in a state of good repair during the pandemic.Grant Funded operating projects such as Preventive Maintenance,anticipated grant awards for planning and studies such as TransitOriented Development, and Unified Planning Work Program (UPWP)funding will increase by $5.9 million.
Total Operating Budgetary Increases (Decreases) 185.8$ 211.2$ 25.4$ 13.7%
Revenue Source
70

Section I. Operating Budget | 8
B. Operating Expenses: $211.2 millionIn FY2023, operating expenses are projected at $211.2 million, an increase of $25.4 millioncompared to the FY2022 Amended Budget, or 13.7% increase. This increase is primarily due topersonnel and maintenance costs. Personnel Services cost increased by $10.1 million due toadditional staff for administrative support and employee recruitment and retention cost. As thesystem continues to grow funds have been heavily allocated for operation staff failing to considerthe increased amount of administrative support needed to maintain funding, hiring, planning,technology and security. Maintenance costs increased by $7.2 million due to mid-life overhauls,incremental S70 Overhauls for the light rail vehicles, on-going State of Good repair for Bus andSpecial Transportation Services vehicles, operating cost for new electric fleet and the direct COVIDrelated expenses for social distancing requirements. Other operating expenses increased by $8.5million due to security enhancements, MOUs for facility services, planning and developmentservices, streetcar operations, subrecipient funding, and shared city support cost. Fuel is expected todecrease by $0.4 million in FY2023 due to lower consumption due to an increase in electric vehicles.
C. Operating Balance: $0.1 millionThe Operating Balance is transferred to the capital program and provides a portion of the ‘matchingfund’ dollars required by federal and/or state grants as well as being programmed to fund capitalprojects where grant funds are not available. In FY2023 the department will shift a portion to theCity’s capital account to fund the City’s planning grant program.
FY2023: Where the Money Goes
Budget Summary
FY 2021 Proposed BudgetFY 2023 Proposed Budget
Total $211.2 million
71

Section I. Operating Budget | 9
Key changes in expenses in the FY2023 Proposed Operating Budget versus the FY2022 Amended Operating Budget are as follows:
Budget Summary
FY 2021 Proposed BudgetFY 2023 Proposed Budget
Expenditure FY2022 FY2023 Variance Variance
Amended Budget(millions)
Proposed Operating Budget
(millions) (millions) (%)
Personnel Services 112.0$ 122.1$ 10.1$ 9.0%
Fuel 6.1$ 5.7$ (0.4)$ -6.6%
Maintenance 15.8$ 23.0$ 7.2$ 45.6%
Other Operating Expense 51.9$ 60.4$ 8.5$ 16.4%
Total Operating Budgetary Increases (Decreases) $ 185.8 $ 211.2 $ 25.4 13.7%
Personnel Services increased due to the following:'-Increases for Annual Merit-Increase headcount by 31 positions to support operations andadministration.-Overtime for Bus and Rail Operators due to the national shortage ofoperators
Diesel fuel for Bus & STS Operations is forward purchased atapproximately $2.03/gallon in FY2023 for 2.6 gallons. In FY2022 it wasforward purchased at $1.80/gallon for 3.2 gallons. As a result of thelower consumption fuel is expected to decrease in FY2023.
Maintenance cost for Bus, STS, and Rail increased by $7.2 million due toaging fleet and repairs, mid-life overhaul and COVID related cleaningand PPE.
Facility services increased by $2.9 million due to MOU increases, andincreased cost for building and maintenance repair such as astormwater reparis and carpet replacement at S. Tryon facility.Planning and Scheduling increased by $1.3 million due to anticipatedRoute Restoration planning grant, an automoous vehicle pilot programwith NCDOT and connect beyond rail trail studies. Developmentincreased by $1.0 million due to a an anticipated grant for TransitOriented Development and a modeling consultant for futuredevelopment. Marketing increased by $.08 million due changes in theadvertising program, to bring the installation and prodcution in house.This cost is reimbursable by the vendor. Transit Security increased by$2.0 million for CMPD MOU and contractual services such for police andsecurity along the Rail alignment, Bus Routes, Streetcar and CharlotteTransportation Center (CTC). City Shared Cost increased by $0.5million. CATS is responsible for paying a portion of City Cost related toAdministrative Support; Finance, Budget, Proucrement, Legal,Communications and Technology.
72

Section I. Operating Budget | 10
D. Service Level Changes
The FY2023 Proposed Operating Budget includes service level changes totaling $3.5 million in additional personal cost for 31 additional City full-time equivalent (FTE) positions:
E. Staffing
The FY2023 Proposed Operating Budget provides for 610.75 full-time equivalent (FTE) positions,which includes 31 additional City full-time equivalent (FTE) position. A staffing summary by sectioncan be found in Appendix 3.
Budget Summary
FY 2021 Proposed Budget
(The area of this page intentionally left blank.)
FY 2023 Proposed Budget
Section Position FTE Additional Budget411010- Admin AOIV 1 115,108$ 411010- Admin Management Analyst 1 105,130 413001- Development Senior Engineer- Bus Infrastructure 1 132,028 413001- Development Senior Project Manager- Goldline Phase 3 1 158,806 418010- Planning and Scheduling Transportation Planner II- Scheduling Sr 1 115,108 414010- Marketing & Communications Marketing Rep 1 91,872 414030- Technology Applications Adminstrator 1 120,475 414030- Technology Technology Support Specialist 1 87,868 416010- Rail Chief Rail Controllers 2 219,994 416010- Rail Rail Controllers 3 329,992 416011- Rail Admin Transit Asset Management Position 1 115,108 416011- Rail Admin Administrative Officer II 1 91,872 416011- Rail Admin Administrative Officer III 1 84,053 416011- Rail Admin Transit Energy Analyst 1 91,872 416011- Rail Admin Maintenance Training Supervisor 1 115,108 416011- Rail Admin Safety Training Supervisor 1 115,108 416011- Rail Admin Transit Energy Coordinator 1 120,475 416011- Rail Admin Training Specialist 3 315,389 416012- Rail Car Maintenance Rail Car Maintenance Shift Managers 2 289,528 417010- Safety & Security Safety Coordinator 3 329,992 417010- Safety & Security Safety Coordinator- Senior 1 120,475 419010- HR AO III 2 200,988
31 3,466,349$
73

Section II. Debt Service Budget | 11
II. DEBT SERVICE BUDGET
A. Debt Service Revenues: $18.1 millionNo new debt financing is planned for FY2023. Key sources of revenue for payment of the currentdebt expenses are federal and state grants and the transit sales tax (local).
Debt financing proceeds are utilized to fund CATS’ capital investment projects.
B. Debt Service Expenses: $18.1 millionDebt service expenses include principal and interest costs on project financings, together with feesand miscellaneous costs associated with capital financings.
In FY2023, debt service expenses are as follows:• $18.0 million is for principal and interest payments shown below• $ 0.1 million covers miscellaneous fees
Reference: Appendix 5
III. REVENUE RESERVE FUND
In 2016, the MTC approved the revision of CATS’ Financial Policies, which created a CATS ControlAccount. This account receives sales tax revenue in excess of the sales tax trend line only when thebalance in the Revenue Reserve Fund has reached the maximum required balance of $30 million.
The Revenue Reserve Fund (RRF) reached the required balance of $30 million in FY2017. Therefore,the projected FY2023 $16.8 million of sales tax dollars that would have been deposited into thisfund will transfer directly to the CATS Control Account. In accordance with Section 3.3 of MTCFinancial Policies MTC-01, “the Transit CEO may recommend use of such funds, for operating orcapital programs, to the Metropolitan Transit Commission as a part of the CEO RecommendedBudget in January of each year.”
Budget Summary
FY 2021 Proposed BudgetFY 2023 Proposed Budget
Federal -$ State -$ Local 8.3$
Blue Line & Transit Facilities Local 6.1$ Federal 3.0$ Local 0.7$
Total FY2023 Proposed Debt Service 18.1$
Blue Line Extension
South Tryon Bus Garage
Project Source of FundingFY2023
Principal & Interest(millions)
74

Section IV. Capital Investment Plan | 12
IV. CAPITAL INVESTMENT PLAN (CIP)
CATS’ $377.9 million five-year CIP is prioritized to continue the system’s State of Good Repair byreplacing vehicles, facility upgrades and enhancements, and technology upgrades. The breakout ofCIP revenues and expenses over five years is shown below:
Note:Excludes Grant-Funded Operating Projects
A. Capital Revenues: $377.9 millionRevenues for CATS’ five-year capital program include funds from federal and state grants, transitsales tax and private funding.
The FY2023 through FY2027 CATS’ capital program consists of the following:
• $92.3 million from federal grants including Federal Formula, Surface Transportation Block Grant,and Bus and Bus Facilities funding.
• $7.6 million from state grants including the Urban State Matching funds for vehicle purchasesand Strategic Transportation Investment (STI) funding.
• $44.1 million from transit sales tax (transfer from the operating balance, CATS Control Accountand CATS Fund Balance).
• $233.8 million in carryover project balances to continue existing projects.
Budget Summary
FY 2021 Proposed BudgetFY 2023 Proposed Budget
Sources of Funds FY2023 FY2024 FY2025 FY2026 FY2027 TotalGrants- Federal 25,233,161$ 19,281,862$ 14,274,362$ 16,499,538$ 17,046,329$ 92,335,252$ Grants-State 2,512,798 1,126,781 1,145,322 1,302,802 1,559,108 7,646,811 Local 1/2% Sales Tax 17,638,789 5,869,509 4,900,250 2,981,636 11,033,209 42,423,393 Re-allocated from Prior Year Savings- Local 1,721,201 - - - - 1,721,201
Carry Over Projects-Federal 153,230,596 - - - - 153,230,596 Carry Over Projects-State 11,126,422 - - - - 11,126,422 Carry Over Projects-Private 2,959,592 - - - - 2,959,592 Carry Over Projects-Soft Match 7,284,509 - - - - 7,284,509 Carry Over Projects-Local 59,152,976 - - - - 59,152,976 Total 280,860,044$ 26,278,152$ 20,319,934$ 20,783,976$ 29,638,646$ 377,880,752$
CAPITAL EXPENDITURES FY2023 FY2024 FY2025 FY2026 FY2027 TotalState of Good Repair- Vehicle Replacement
19,666,943$ 21,905,699$ 13,383,086$ 15,591,085$ 24,556,365$ 95,103,178$
State of Good Repair- Facilities & Others
1,800,000 1,625,000 1,351,000 1,079,000 1,570,000 7,425,000
Transit Safety & Security 348,897 326,136 2,396,339 686,339 736,339 4,494,050 Transit Long Range Capital Improvement
18,947,054 200,000 250,000 250,000 - 19,647,054
Non-Revenue Vehicle 390,530 650,740 70,000 833,212 1,319,942 3,264,424 Transit New Equipment 5,952,525 1,570,577 2,869,509 2,344,340 1,456,000 14,192,951 Carry Over Projects 233,754,095 - - - - 233,754,095 Total 280,860,044$ 26,278,152$ 20,319,934$ 20,783,976$ 29,638,646$ 377,880,752$
75

Section IV. Capital Investment Plan | 13
B. Capital Expenditures: $377.9 millionCATS’ five-year capital investment plan key expenses include the following:
Notes:1. Excludes Covid Operating Assistance and Grant-Funded Operating Projects totaling $134.5 million for FY2023 –
FY2027
Budget Summary
FY 2021 Proposed BudgetFY 2023 Proposed Budget
State of Good Repair - Vehicle ReplacementsReplacement of revenue service vehicles that have reached the end of their usefullife. In FY2023 CATS will replace 16 Buses, 11 Special Transportation Servicesvehicles, and 9 Vanpool vehicles for the Vanpool program.
95,103,178$ State of Good Repair - Facilities and OthersReplacement, upgrades or repair of transit assets including renovations/repairs oftransit facilities to comply with federal Transit Asset Management guidelines.
7,425,000 Transit Safety & SecurityPrograms and projects to advance safe, reliable, and equitable transit servicethroughout the system including camera replacements and dispatch upgrades.
4,494,050 Transit Long Range Capital ImprovementDesign services for rapid transit, rail, bus, streetcar and facility improvements tobetter serve the region. Projects include ADA enhancements, design andconstruction of the Hambright Park and Ride Lot and Transit Center, and atemporary bus facility.
19,647,054 Transit Non-Revenue VehiclesPurchase and replacement of non-revenue vehicles for supervisory staff,maintenance and repair calls.
3,264,424 Transit New EquipmentThe purchase of new equipment essential to the bus and rail divisions andtechnology upgrades.
14,192,951 Carry Over ProjectsContinued funding for existing capital projects.
233,754,095 Total 5-year Capital Investment Plan 1 377,880,752$
Capital Program/Project FY2023-FY2027 Total
76

Section IV. Capital Investment Plan | 14
CAPITAL PROGRAMS MANAGED BY CATS
CATS manages two (2) transit capital investment programs which receive funds from the federal andstate governments and the City of Charlotte.
The Charlotte Gateway Station – Rail Project (Phase I)
The Charlotte Gateway Station (CGS) Project is a planned multi-modal transit center located in Center City Charlotte.
The City of Charlotte and the North Carolina Department of Transportation (NCDOT) are partners inthe phased implementation of this project which:• Improves both regional (Amtrak) passenger rail service and regional freight rail operations
through the construction of track and bridge improvements.• Includes a future multi-modal passenger station facility, the completion of which will mark the
return of Amtrak service to Uptown Charlotte, with supporting modal connections to CityLYNXGoldline, regional bus connections and CATS local bus routes.
Design and engineering of the first phase of the project is underway, and construction of the initialtrack and bridge improvements began in 2018. Phase I is being funded with federal, state and Cityof Charlotte (local) funds.
The CityLYNX Goldline Streetcar Project – Phase II
The CityLYNX Goldline Streetcar Project - Phase II is an extension of the approximately 1.5 mileCityLYNX Goldline Phase I project completed in July 2015. Phase II consists of the design andconstruction of approximately 2.5 miles of double-track in-street running streetcar line. The finalproject results in a total of approximately a 4-mile long double-track streetcar system which extendsfrom Johnson C. Smith University through Center City Charlotte, to Novant Health and SunnysideAvenue.
The project was funded by a federal small starts grant and an American Rescue Plan Act funding fora total of $84.2 million and with a local match of $77.0 million funded by the City of Charlotte.CityLYNX Goldline Streetcar opened for service in August 2021.
Budget Summary
FY 2021 Proposed BudgetFY 2023 Proposed Budget
Reference: Appendix 8
77

Section V. Performance Objectives | 15
FINANCIAL PERFORMANCE OBJECTIVES
CATS Financial Policies provide guidelines on how financial resources shall be utilized to fulfill themission of the transit system, meet obligations and to protect the public interest.
CATS TRAX SCORECARD OBJECTIVES
CATS Trax is a quarterly performance scorecard that provides employees, customers, electedofficials, and the general public with a snapshot of how we are doing at a high level. Metrics arealigned with CATS goals and customer satisfaction index.
Customer Satisfaction Index• Measures how well we are doing as related to customer’s top drivers of satisfaction• Allows customers to choose and prioritize what is most important to them• Gauges performance relative to the customer’s priorities and perceptions• Helps highlight priorities for improvement
Performance Objectives
FY 2021 Proposed Budget
(The area of this page intentionally left blank.)
(The area of this page intentionally left blank.)
FY 2023 Proposed Budget78

Section VI. Services & Ridership | 16
CATS’ SERVICES AND RIDERSHIP
CATS is anticipating to provide approximately 11.4 million rides in FY2023 on its bus, light rail,streetcar, vanpool and Special Transportation Services vehicles.
The Goldline Phase II extension opened August 2021 and provides an additional 2.5 miles of servicefrom Sunnyside Avenue through Center City and terminates at French Street near Johnson C. SmithUniversity. Having opened during the pandemic ridership is expected to gradually increase over thenext two years.
Blue Line Extension continues to attract ridership and is expected to slightly increase in FY2023 asdevelopment around the alignment continues to grow and existing businesses re-open at fullcapacity. Customers wholly new to transit are also expected to contribute to an increase in light railridership as ridership matures over the first few years of operations.
The FY2023 budget reflects revenue hours on track to full service (pre-pandemic) despite the lowridership numbers. As the department expects ridership to return to pre-pandemic levels (orgreater) at some point it is important to keep revenue hours at a certain level.
CATS’ Services and Ridership
FY 2021 Proposed BudgetFY 2023 Proposed Budget
FY2022 FY2023 FY2024 FY2022 FY2023 FY2024Projected Proposed Budget Estimated Projected Proposed Budget Estimated
Bus 6,456,736 7,102,410 8,167,771 745,562 800,177 852,502 Light Rail 3,215,592 3,537,151 4,067,724 118,076 131,812 141,548 Streetcar 383,922 482,645 555,042 9,137 18,275 18,275 Vanpool 37,536 41,290 47,483 17,462 18,384 19,305 Special Transportation Svc. 219,396 230,366 241,884 121,123 131,126 141,129 Total 10,313,182 11,393,862 13,079,904 1,011,360 1,099,774 1,172,759
ModeRidership Revenue Service Hours
79

Section VII. CATS At A Glance | 17
The City provides additional support to CATS through a City Cost Allocation Plan.
CATS At A Glance
FY 2021 Proposed BudgetFY 2023 Proposed Budget
CHIEF EXECUTIVE OFFICESets strategic direction for the department and manages the overall operation and administration, including budgeting,
training, coordinating with City Manager’s office and support of the Metropolitan Transit Commission
BUS / STS / VANPOOL
Provides transit services in the City of Charlotte, andin the Towns of Cornelius, Davidson, Huntersville,Matthews, Mint Hill , and Pinevil le.
FINANCE & PROCUREMENT
Manage all fiscal aspects and procurements fortransit operations and capital projects includingbudget, grants, debt financing, revenue collections &financial reporting
LIGHT RAIL / STREETCAR
Provides a light rail service with over 19 miles and 26stations from just north of the town of Pinevil le to theUNC Charlotte campus. CityLYNX Gold Line Phase 2provides services through Center City Charlotte.
DEVELOPMENT & PLANNING
Responsible for planning and construction of transitprojects including quality control and assurance of allproject developments
SAFETY & SECURITY
Responsible for safety & security of all CATSamenities, facilities and individuals that come incontact with CATS
FACILITIES
Manage and maintain light rail stations, park & ridelots, parking decks, bus garages, light rail facilities,transit centers, and bus stops
CUSTOMER SERVICE,MARKETING & TECHNOLOGY
Manage public relations, customer service requests,trip planning assistance and technology for transitoperations
HUMAN RESOURCE &CIVIL RIGHTS
Oversee compliance with federal, state & localguidelines to ensure fair and equal treatment ofcustomers and employees
80

Appendices | 18
Appendices
FY 2021 Proposed BudgetFY 2023 Proposed Budget
Appendix 1 - Operating Budget Summary
Appendix 2 - Performance ObjectivesFinancial Performance ObjectivesBalanced Scorecard: CATS TRAX
Appendix 3 - Staffing Summary
Appendix 4 - Operating BudgetOperating RevenuesOperating Expenditures
Appendix 5 - Debt Service SummaryDebt Service Revenue DetailsDebt Service Expenditure Details
Appendix 6 - Capital Revenue & Expenditures5-year Capital Revenue & Expenditure Summary5-year Capital Expenditure Details including Carryover
Appendix 7 - Grant-Funded Operating ProjectsFederal Grant-Funded Operating ProjectsState Grant-Funded Operating Projects
Appendix 8 - Other Capital Projects Managed by CATSCharlotte Gateway StationCityLYNX Goldline Phase II
Appendix 9 - FY2023 Budget Schedule
APPENDICES
81

Appendices | 19
Appendix 1 – Operating Budget Summary
FY 2021 Proposed BudgetFY 2023 Proposed Budget
FY2020 FY2021 FY2022 FY2022 FY2023
Actuals ActualsAudited
AmendedBudget
Year-End Projection
Proposed Budget
Sales Tax AllocationA Sales Tax Receipts 107,778,981$ 116,669,192$ 133,470,264$ 133,470,264$ 136,807,021$ B Less Sales Tax Trendline (97,000,000) (105,201,000) (114,252,020) (114,252,020) (120,000,475)
A - B = C Net Difference 10,778,981$ 11,468,192$ 19,218,244$ 19,218,244$ 16,806,546$
Sales Tax Available for Allocation:D Transfer to (from) Revenue Reserve -$ -$ -$ -$ -$ E Transfer to Debt Service Fund 17,667,788 16,975,589 16,939,110 16,939,110 15,168,881 F Transfer to Operating Fund (Operating Alloc) 79,332,212 88,225,410 97,312,910 97,312,910 104,831,594 G CATS Control Account 10,778,981 11,468,192 19,218,244 19,218,244 16,806,546
D + E + F + G= I Sales Tax Allocation to Other Funds 107,778,981$ 116,669,192$ 133,470,264$ 133,470,264$ 136,807,021$ Operating Fund
Revenues:Operating Revenues:
Sales Tax Operating Allocation 79,332,212$ 88,225,411$ 97,312,910$ 97,312,910$ 104,831,594$ Fares and Service Reimbursements 21,028,419 11,113,790 15,767,931 15,767,931 17,015,602 Maintenance of Effort - Charlotte 22,629,679 23,308,600 24,007,826 24,007,826 24,728,061 Operating Assistance 6,528,812 24,928,652 5,579,802 5,579,802 13,917,567 CATS Control Account - - - - - Other (Advertising, Misc) 5,621,239 (1,112,534) 8,153,918 8,153,918 4,764,204 Subtotal 135,140,361$ 146,463,919$ 150,822,387$ 150,822,387$ 165,257,028$
Non-Operating Revenue 24,253,043 14,702,805 35,014,560 35,014,560 45,948,561
Total Operating Revenues 159,393,404$ 161,166,724$ 185,836,947$ 185,836,947$ 211,205,589$
Operating ExpendituresTransportation Services 142,016,893$ 141,970,655$ 158,931,571$ 158,931,571$ 180,629,952$ Transit Development 3,705,109 4,005,534 5,382,272 5,382,272 6,760,505 Marketing and Communications 3,086,973 3,567,664 6,073,403 6,073,403 6,346,175 Executive and Administration 11,227,571 11,586,995 15,449,701 15,449,701 17,368,958 Subtotal 160,036,546$ 161,130,848$ 185,836,947$ 185,836,947$ 211,105,589$
Transfers to Eligible CIP Projects (1,139,477) (590,405) - - -
Total Net Operating Expense 158,897,069$ 160,540,443$ 185,836,947$ 185,836,947$ 211,105,589$
Transfer from Operating to CIP 981,600 - - - 100,000
Total Operating Expenditures 159,878,669$ 160,540,443$ 185,836,947$ 185,836,947$ 211,205,589$
Excess (Shorftall) Revenue over Expenses (485,265)$ 626,282$ -$ -$ -$
Proposed Operating Budget Summary
82

Appendices | 20
Appendix 2 – Performance Objectives
Notes:
1) In the FY2023 Proposed Budget the total Operating Expense used to calculate System Subsidy, OperatingRatio and Net Debt Service Coverage does not include $1,917,083 in pass through funding forsubrecipient projects.
2) In FY2022 ridership and fares are expected to significantly decline due to the COVID-19 pandemic causingthe agency to rely on other sources of revenue to continue operations. The decline is expected tocontinue in FY2023. As a result, the system subsidy exceeds the 80% threshold.
1
2
FY 2021 Proposed BudgetFY 2023 Proposed Budget
FY2020 FY2021 FY2022 FY2022 FY2023
Actuals ActualsAmended
BudgetYear End
ProjectionProposed Budget
SYSTEM SUBSIDY≤ 80% of Total Operating Cost 83.1% 93.8% 87.1% 86.9% 89.5%
OPERATING RATIO (W/O Capital Interest) 16.9% 6.2% 12.9% 13.1% 10.5%(≥ 20%)PASSENGERS PER HOUR (Bus ≥ 20 passengers per hour) 12.7 8.6 12.6 8.7 8.9 (Light Rail ≥ 90 passengers per hour) 97.4 44.4 72.7 52.8 47.8
ADMINISTRATIVE OVERHEAD 11.1% 13.13% 15.37% 14.90% 14.49% (≤ 15%)
GROSS DEBT SERVICE COVERAGE 5.74 6.15 7.76 7.76 9.1(> 3.0)
NET DEBT SERVICE COVERAGE(≥ 1.15) 1.52 1.47 1.92 2.01 2.06
Performance Objectives
Financial Performance Objectives
83

Appendices | 21
Appendix 2 – Performance Objectives
FY 2021 Proposed BudgetFY 2023 Proposed Budget84

Appendices | 22
Appendix 3 – Staffing Summary
FY 2021 Proposed BudgetFY 2023 Proposed Budget
Approved in FY2022
Transfers Reductions FY2023 SLC TOTAL FTES
Bus Operations Division (BOD) EmployeesTransportation Services415010 BOD - Operations 644.00 - - - 644.00 - 415011 BOD - Administration 14.00 - - - 14.00 - 415012 BOD - Maintenance 178.00 - - - 178.00 - 415013 BOD - STS Maintenance 9.00 - - - 9.00 - Subtotal BOD Employees 845.00 0.00 0.00 0.00 845.00 -
City EmployeesTransportation Services415050 Special Transportation Services 131.75 - - - 131.75 - 411060 Treasury/Revenues 12.00 - - - 12.00 - 412020 Facilities 14.00 - - - 14.00 - 414020 Customer Svc & Information 21.00 - - - 21.00 - 416010 Light Rail Operations 89.00 - - 5.00 94.00 - 416011 Light Rail Administration 19.00 2.00 - 9.00 30.00 - 416012 Light Rail Maintenance 72.00 - - 2.00 74.00 - 416013 Maintenance of Way 51.00 (2.00) - - 49.00 - 416020 CityLYNX GoldLine 38.00 - - - 38.00 - 417010 Transit Security 20.00 - - 4.00 24.00 - 415001 Bus General Management 4.00 - - - 4.00 - 418010 Planning And Scheduling 11.00 - - 1.00 12.00 - 415040 Van Pool Division 4.00 - - - 4.00 - Transit Development413001 Development Administration 22.00 - - 3.00 25.00 - 413002 Quality Assurance 6.00 - - - 6.00 - Marketing & Communications414010 Marketing & Communications 14.00 - - 1.00 15.00 - 414030 Technology 16.00 - - 2.00 18.00 -
Executive & Administration 411010 Administration Division 22.00 - - 2.00 24.00 1.00 419010 HR and Civil Rights 11.00 - - 2.00 13.00 - 411040 Executive Division 2.00 - - - 2.00 - Subtotal City Employees 579.75 0.00 0.00 31.00 610.75 1.00
Total Employees 1,424.75 0.00 0.00 31.00 1,455.75 1.00
FY2023 Staffing LevelsFTE
Temps
85

Appendices | 23
Appendix 4 – Operating Budget
Operating Revenues
FY 2021 Proposed BudgetFY 2023 Proposed Budget
FY2020 FY2021 FY2022 FY2022 FY2023
Actuals Audited ActualsAmended
BudgetYear End
ProjectionProposed
BudgetService Passenger Fares
Bus 14,683,327$ 6,993,617$ 7,748,083$ 7,748,083$ 8,522,892$ Light Rail 2,730,923 1,032,650 3,344,216 3,344,216 3,678,637 Streetcar - - 740,000 740,000 482,645 Vanpool 372,328 195,739 110,356 110,356 121,393 Paratransit 549,072 423,111 537,520 537,520 564,397 Subtotal 18,335,650$ 8,645,117$ 12,480,175$ 12,480,175$ 13,369,964$
All Access PassAll Access Pass- Johnson and Wales -$ -$ -$ -$ 75,000$ All Access Pass- Johnson C Smith - - - 55,000 All Access Pass- CPCC - - - 925,000 CMGS 514,567 514,345 484,787 484,787 518,568 Lowe's Agreement - - 175,000 175,000 - Airport All Access Pass - 572,000 870,584 870,584 - UNCC Pass Purchases 1,347,612 1,344,175 1,400,000 1,400,000 1,330,866 Subtotal 1,862,179$ 2,430,520$ 2,930,371$ 2,930,371$ 2,904,434$
Service Reimb & Funding PartnersAirport Connector Services 200,000$ (200,000)$ -$ -$ -$ Fort Mill (WellsFargo) Rt 44 Carowinds 7,791 (675) - - - Union County Express 74x 131,724 98,144 94,458 94,458 180,221 Rock Hill Express Commuter Bus 155,341 104,554 74,491 74,491 270,224 Gastonia Express Commuter Bus 177,702 152,931 82,236 82,236 270,800 Carowinds (N&BS U MYEP) 102,102 (48,500) 97,800 97,800 - DSS 3,265 - 8,400 8,400 8,400 Ramsey Creek Beach Park 52,665 (68,301) - - 11,559 Subtotal 830,590$ 38,153$ 357,385$ 357,385$ 741,204$
Service IncomeCharlotte Transit Center 465,436$ 414,789$ 479,398$ 479,398$ 397,867$ Advertising 2,846,062 (75,643) 2,469,160 2,469,160 1,831,999 Parking - BLE Decks - - 391,000 391,000 119,650 Parking - CGS 104,005 251,398 98,004 98,004 98,004 Volkswagen Parking Lease 26,214 36,706 26,214 26,214 30,000 Parking Lease-Norfolk Southern Land 213,030 - 438,842 438,842 99,972 Lowe's Agreement (Naming Rights) - - 310,500 310,500 - Interest Earnings 1,234,108 (2,231,887) 3,302,194 3,302,194 941,000 Agreements/Leases 40,115 19,119 29,227 29,227 14,033 User Fees for Development Reviews - 103,951 223,929 223,929 281,118 Miscellaneous 692,269 369,033 385,450 385,450 950,561 Subtotal 5,621,239$ (1,112,534)$ 8,153,918$ 8,153,918$ 4,764,204$
Sales Tax RevenueOperating Allocation 79,332,212$ 88,225,411$ 97,312,910$ 97,312,910$ 104,831,594$ CATS Control AccountSubtotal 79,332,212$ 88,225,411$ 97,312,910$ 97,312,910$ 104,831,594$
Maintenance of EffortCity of Charlotte 22,629,679$ 23,308,600$ 24,007,826$ 24,007,826$ 24,728,061$ Subtotal 22,629,679$ 23,308,600$ 24,007,826$ 24,007,826$ 24,728,061$
Operating AssistanceFederal CMAQ (for Service Expansions) 4,595,535$ 1,727,122$ -$ -$ -$ City of Charlotte - GoldLine Operations 1,471,896 3,090,755 3,679,257 3,679,257 4,702,069 COVID-19 255,686 20,131,377 1,900,545 1,900,545 9,215,498 NCDOT (I-77 Mitigation) 82,085 - - - - Sugar Creek (I-77 Mitigation) 123,610 (20,602) - - - Subtotal 6,528,812$ 24,928,652$ 5,579,802$ 5,579,802$ 13,917,567$
Non Operating RevenueGrant Funded Operating Expenses - Fed 14,304,879$ 14,352,641$ 5,751,445$ 5,751,445$ 9,765,069$ Grant Funded Operating Expenses -COVID 19 - - 19,581,655 19,581,655 24,560,581 Grant Funded Operating Expenses - State 145,986 138,656 225,247 225,247 348,198 State Maintenance Assist. Prog. (SMAP) 9,590,670 - 9,208,761 9,208,761 11,063,205 Mecklenburg County - 192,942 192,942 192,942 192,942 Town of Huntersville 211,508 18,566 18,566 18,566 18,566 City of Charlotte-TOD Match - - 30,235 30,235 - Gastonia-TOD Match - - 3,959 3,959 - Belmont-TOD Match - - 1,750 1,750 - Subtotal 24,253,043$ 14,702,805$ 35,014,560$ 35,014,560$ 45,948,561$
TOTAL OPERATING REVENUES 159,393,404$ 161,166,724$ 185,836,947$ 185,836,947$ 211,205,589$ 86

Appendices | 24
Appendix 4 – Operating Budget
Operating Expenses
FY 2021 Proposed BudgetFY 2023 Proposed Budget
FY2020 2021 FY2022 FY2022 FY2023
ActualsActualsAudited
AmendedBudget
Year End Projection
Proposed Budget
Transportation Services411060 Treasury/Revenues 1,290,993$ 849,965$ 1,430,198$ 1,430,198$ 1,297,491$ 412010 Transit Center Operations 1,079,388 1,053,663 1,023,944 1,023,944 1,023,944 412020 Facilities 7,996,344 7,783,174 8,009,463 8,009,463 10,860,788 414020 Customer Svc & Information 1,826,679 1,489,280 2,346,463 2,346,463 2,001,482 415001 Bus General Management 438,110 399,208 590,720 590,720 571,862 415010 BOD - Operations 60,275,656 59,999,797 58,829,232 58,829,232 60,451,302 415011 BOD - Administration 2,427,012 2,477,129 2,596,229 2,596,229 2,716,790 415012 BOD - Maintenance 20,529,509 19,648,868 22,587,326 22,587,326 24,403,234 415013 BOD - STS Maintenance 935,651 844,147 1,221,476 1,221,476 1,058,609 415020 County Human Svc Transp 303,265 300,000 310,000 310,000 310,000 418010 Planning And Scheduling 1,436,929 1,330,628 1,591,621 1,591,621 2,833,770 415040 Van Pool Division 580,581 596,089 717,880 717,880 722,168 415050 Special Transportation Svc 8,843,960 8,720,583 9,947,800 9,947,800 11,256,443 416010 Light Rail Operations 11,681,669 11,211,254 13,440,412 13,440,412 14,301,271 416011 Light Rail Administration 1,679,533 1,841,880 2,341,733 2,341,733 4,076,553 416012 Light Rail Maintenance 5,266,192 8,791,983 11,488,521 11,488,521 19,155,087 416013 Maintenance of Way 4,732,491 4,074,712 5,485,877 5,485,877 6,524,654 416020 CityLYNX GoldLine 1,170,161 2,071,743 4,449,989 4,449,989 5,184,714 417010 Transit Security 9,520,707 8,486,552 10,522,687 10,522,687 11,879,790 Subtotal 142,014,830$ 141,970,655$ 158,931,571$ 158,931,571$ 180,629,952$
Executive & Administration 411010 Administration Division 1,880,046$ 2,705,149$ 2,859,633$ 2,859,633$ 3,192,591$ 411020 Procurement Services 215,259 145,839 237,987 237,987 163,367 419010 HR & Civil Rights 1,542,905 678,398 2,235,039 2,235,039 25,918 419010 HR - - - - 712,159 419020 Civil Rights - - - - 2,401,089 411040 Executive Division 868,793 493,345 852,770 852,770 1,046,698 411050 MTC & Committees Division 67,885 61,836 76,850 76,850 76,850 411070 City Support Costs 6,565,659 7,502,428 9,187,422 9,187,422 9,750,285 Subtotal 11,140,547$ 11,586,995$ 15,449,701$ 15,449,701$ 17,368,958$
Transit Development413001 Development 2,072,881$ 2,673,430$ 4,630,601$ 4,630,601$ 5,700,652$ 413002 Quality Assurance 582,745 741,699 751,671 751,671 1,059,853 Subtotal 2,655,626$ 3,415,128$ 5,382,272$ 5,382,272$ 6,760,505$
Marketing & Technology414010 Marketing & Communications 1,489,068$ 1,391,754$ 1,959,234$ 1,959,234$ 2,491,555$ 414030 Technology 1,596,998 2,175,910 4,114,169 4,114,169 3,854,620 Subtotal 3,086,066$ 3,567,664$ 6,073,403$ 6,073,403$ 6,346,175$
Transfer to Capital 981,600$ -$ -$ -$ 100,000
Total Operating Expenditures 159,878,669$ 160,540,442$ 185,836,947$ 185,836,947$ 211,205,589$
87

Appendices | 25
Appendix 5 – Debt Service Summary
FY 2021 Proposed BudgetFY 2023 Proposed Budget
FY2021 FY2022 FY2023Audited Actuals
AdoptedBudget
ProposedBudget
REVENUESFederal Grants-BLE 1,726,061$ 619,900$ -$ Federal Grants- Non-BLE 2,920,059 2,929,440 2,929,475 State Grants-BLE 863,031 41,637,850 - State Grants-Non-BLE - - - Local Sales Tax 99,178,654 16,939,110 15,168,881 Interest on Investments 35,502 - -
TOTAL REVENUES 104,723,308$ 62,126,300$ 18,098,356$
EXPENDITURESPrincipal Payments-BLE 85,791,094$ 45,424,000$ 3,368,581$ Principal Payments-Non-BLE 5,555,000 5,790,000 5,551,419 Interest Payments-BLE 8,729,031 6,410,600 4,944,119 Interest Payments-Non-BLE 4,600,920 4,387,700 4,120,237 Other Payments 47,263 114,000 114,000 Transfers to Other - - -
TOTAL EXPENDITURES 104,723,308$ 62,126,300$ 18,098,356$
FY2023 FY2024 FY2025 FY2026 FY2027 FY2023-FY2027Proposed
BudgetPlan Plan Plan Plan Total
REVENUESFederal Grants- Non-BLE 2,929,475$ 2,927,875$ 2,925,675$ 2,927,275$ 2,929,515$ 14,639,815$ State Grants-BLE - - - - - - State Grants-Non-BLE - - - - - - Local Sales Tax 15,168,881 15,169,091 15,158,431 15,166,671 15,161,391 75,824,466 Interest on Investments - - - - - -
TOTAL REVENUES 18,098,356$ 18,096,966$ 18,084,106$ 18,093,946$ 18,090,906$ 90,464,282$
EXPENDITURESPrincipal Payments-BLE 3,368,581$ 3,539,221$ 3,712,347$ 3,899,259$ 4,093,488$ 18,612,896$ Principal Payments-Non-BLE 5,551,419 5,825,779 6,107,653 6,395,741 6,686,512 30,567,104 Interest Payments-BLE 4,944,119 4,773,979 4,598,603 4,411,441 4,218,462 22,946,604 Interest Payments-Non-BLE 4,120,237 3,843,987 3,551,503 3,273,505 2,978,444 17,767,678 Other Payments 114,000 114,000 114,000 114,000 114,000 570,000 Transfers to Other - - - - - -
TOTAL EXPENDITURES 18,098,356$ 18,096,966$ 18,084,106$ 18,093,946$ 18,090,906$ 90,464,282$
88

Appe
ndic
es |
26
Appe
ndix
5 –
Debt
Ser
vice
Det
ails
FY 2
023
Prop
osed
Bud
get
FY20
23FY
2024
FY20
25FY
2026
FY20
27FY
2023
-FY2
027
BLE
= Bl
ue Li
ne E
xten
sion
Prop
osed
Bu
dget
Plan
Plan
Plan
Plan
TOTA
L
Debt
Ser
vice
Rev
enue
Det
ails
REVE
NU
ES B
LE- C
OPS
Prin
cipal
Onl
y
Fed
eral
-$
-
$
-$
-
$
-$
-
$
S
tate
- -
- -
- -
L
ocal
- -
- -
- -
S
ubto
tal
-$
-
$
-$
-
$
-$
BLE
- CO
PS In
tere
st O
nly
F
eder
al (5
0%)
-$
-
$
-$
-
$
-$
-
$
S
tate
(25%
)-
- -
- -
-
Loc
al (2
5%)
- -
- -
- -
S
ubto
tal
-$
-
$
-$
-
$
-$
-
$
BLE
- TI
FIA
Onl
y - P
rincip
al &
Inte
rest
F
eder
al (0
%)
-$
-
$
-$
-
$
-$
-
$
S
tate
(0%
)-
- -
- -
-
Loc
al (1
00%
)8,
312,
700
8,
313,
200
8,
310,
950
8,
310,
700
8,
311,
950
41
,559
,500
Sub
tota
l8,
312,
700
$
8,
313,
200
$
8,31
0,95
0$
8,
310,
700
$
8,31
1,95
0$
41
,559
,500
$
Non
-BLE
- Pr
incip
al &
Inte
rest
2
013C
CO
PS
Fed
eral
(80%
)2,
929,
475
$
2,
927,
875
$
2,92
5,67
5$
2,
927,
275
$
2,92
9,51
5$
14
,639
,815
$
Sta
te (0
%)
- -
- -
- -
L
ocal
(20%
)73
2,36
9
731,
969
73
1,41
9
731,
819
73
2,37
9
3,65
9,95
4
S
ubto
tal
3,66
1,84
4$
3,65
9,84
4$
3,
657,
094
$
3,65
9,09
4$
3,
661,
894
$
18,2
99,7
69$
-
200
8A C
OPS
(100
% Lo
cal)
1,84
1,95
0$
1,84
5,31
0$
1,
841,
700
$
1,84
5,29
0$
1,
840,
700
$
9,21
4,95
0$
2015
B CO
PS (1
00%
Loca
l)4,
167,
863
4,
164,
613
4,
160,
363
4,
164,
863
4,
162,
363
20
,820
,063
O
ther
(100
% Lo
cal)
114,
000
11
4,00
0
114,
000
11
4,00
0
114,
000
57
0,00
0
S
ubto
tal
6,12
3,81
3$
6,12
3,92
3$
6,
116,
063
$
6,12
4,15
3$
6,
117,
063
$
30,6
05,0
13$
TOTA
L REV
ENU
ES18
,098
,356
$
18
,096
,966
$
18
,084
,106
$
18
,093
,946
$
18
,090
,906
$
90
,464
,282
$
89

Appe
ndic
es |
27
Appe
ndix
5 –
Debt
Ser
vice
Det
ails
FY 2
023
Prop
osed
Bud
get
FY20
23FY
2024
FY20
25FY
2026
FY20
27FY
2023
-FY2
027
BLE
= Bl
ue Li
ne E
xten
sion
Prop
osed
Bu
dget
Plan
Plan
Plan
Plan
TOTA
L
Debt
Ser
vice
Exp
endi
ture
Det
ails
PRIN
CIPA
L B
lue
Line
Exte
nsio
n
201
3B C
OPS
-$
-
$
-$
-
$
-$
-
$
2
013F
CO
PS-
- -
- -
-
201
5D T
IFIA
2
021A
CO
PS (
TIFI
A RE
F PO
RTIO
N)
3,36
8,58
1
3,53
9,22
1
3,71
2,34
7
3,89
9,25
9
4,09
3,48
8
18,6
12,8
96
S
ubto
tal
3,36
8,58
1$
3,53
9,22
1$
3,
712,
347
$
3,89
9,25
9$
4,
093,
488
$
18,6
12,8
96$
Non
-Blu
e Lin
e Ex
tens
ion
2
021A
CO
PS (
2008
A RE
F PO
RTIO
N)
746,
419
$
785,
779
$
82
2,65
3$
865,
741
$
90
6,51
2$
4,12
7,10
4$
2
008A
CO
PS
201
3C C
OPS
2,34
0,00
0
2,45
5,00
0
2,57
5,00
0
2,68
0,00
0
2,79
0,00
0
12,8
40,0
00
2
015B
CO
PS2,
465,
000
2,
585,
000
2,
710,
000
2,
850,
000
2,
990,
000
13
,600
,000
Sub
tota
l5,
551,
419
$
5,
825,
779
$
6,10
7,65
3$
6,
395,
741
$
6,68
6,51
2$
30
,567
,104
$
INTE
REST
Blu
e Lin
e Ex
tens
ion
-TIF
IA O
nly
2
013B
CO
PS
202
1A C
OPS
( TI
FIA
REF
PORT
ION
)4,
944,
119
$
4,
773,
979
$
4,59
8,60
3$
4,
411,
441
$
4,21
8,46
2$
22
,946
,604
$
Sub
tota
l4,
944,
119
$
4,
773,
979
$
4,59
8,60
3$
4,
411,
441
$
4,21
8,46
2$
22
,946
,604
$
Non
-Blu
e Lin
e Ex
tens
ion
2
021A
CO
PS (
2008
A RE
F PO
RTIO
N)
1,09
5,53
1$
1,05
9,53
1$
1,
019,
047
$
979,
549
$
93
4,18
8$
5,08
7,84
6$
2
013C
CO
PS1,
321,
844
1,
204,
844
1,
082,
094
97
9,09
4
871,
894
5,
459,
769
201
5B C
OPS
1,70
2,86
3
1,57
9,61
3
1,45
0,36
3
1,31
4,86
3
1,17
2,36
3
7,22
0,06
3
S
ubto
tal
4,12
0,23
7$
3,84
3,98
7$
3,
551,
503
$
3,27
3,50
5$
2,
978,
444
$
17,7
67,6
78$
INTE
REST
O
ther
Fee
s11
4,00
0$
11
4,00
0$
114,
000
$
11
4,00
0$
114,
000
$
57
0,00
0$
Sub
tota
l11
4,00
0$
11
4,00
0$
114,
000
$
11
4,00
0$
114,
000
$
57
0,00
0$
TOTA
L EXP
ENDI
TURE
S18
,098
,356
$
18
,096
,966
$
18
,084
,106
$
18
,093
,946
$
18
,090
,906
$
90
,464
,282
$
90

Appendices | 28
Appendix 6 –Capital Revenue & Expenditure Summary
Notes:1. Excludes Covid Operating Assistance and Grant-Funded Operating Projects totaling $134.5 million for FY2023 –
FY2027
FY 2021 Proposed BudgetFY 2023 Proposed Budget
FY2023 FY2024 FY2025 FY2026 FY2027 TotalProposed
BudgetPlan Plan Plan Plan
FY2023 - FY2027
CAPITAL REVENUESFederal Funding
Formula Apportionment 15,708,143$ 17,067,135$ 12,059,635$ 14,284,811$ 14,831,602$ 73,951,326$ Federal Surface Transportation Block Grant (STBG) 7,310,291 - - - 7,310,291 Bus & Bus Facilities 2,214,727 2,214,727 2,214,727 2,214,727 2,214,727 11,073,635 Total Federal Funding 25,233,161$ 19,281,862$ 14,274,362$ 16,499,538$ 17,046,329$ 92,335,252$
State FundingUrban Match State Grants 1,050,740$ 1,126,781$ 1,145,322$ 1,302,802$ 1,559,108$ 6,184,753$ Strategic Transportation Investment (STI) 1,462,058 - - - - 1,462,058 Total State Funding 2,512,798$ 1,126,781$ 1,145,322$ 1,302,802$ 1,559,108$ 7,646,811$
Local Funding CATS Control Account 17,638,789$ 5,869,509$ 4,900,250$ 2,981,636$ 11,033,209$ 42,423,393$ Re-allocated from Prior Year Savings- Local 1,721,201 - - - - 1,721,201 Total Local Funding 19,359,990$ 5,869,509$ 4,900,250$ 2,981,636$ 11,033,209$ 44,144,594$
Carryover Project Balance Continue Existing Projects- Federal 153,230,596$ -$ -$ -$ -$ 153,230,596$ Continue Existing Projects- State 11,126,422 - - - - 11,126,422 Continue Existing Projects- Private 2,959,592 - - - - 2,959,592
7,284,509 - - - - 7,284,509 Continue Existing Projects- Local 59,152,976 - - - - 59,152,976 Total Continue Existing Projects 233,754,095$ -$ -$ -$ -$ 233,754,095$
Total Capital Revenues 1 280,860,044$ 26,278,152$ 20,319,934$ 20,783,976$ 29,638,646$ 377,880,752$
Continue Existing Projects- Short Term Debt/Soft Match
FY2023 FY2024 FY2025 FY2026 FY2027 TotalProposed
BudgetPlan Plan Plan Plan
FY2023 - FY2027
CAPITAL EXPENDITURESState of Good Repair- Vehicle Replacement 19,666,943$ 21,905,699$ 13,383,086$ 15,591,085$ 24,556,365$ 95,103,178$
State of Good Repair- Facilities & Others 1,800,000 1,625,000 1,351,000 1,079,000 1,570,000 7,425,000
Transit Safety & Security 348,897 326,136 2,396,339 686,339 736,339 4,494,050
18,947,054 200,000 250,000 250,000 - 19,647,054 390,530 650,740 70,000 833,212 1,319,942 3,264,424
Transit New Equipment 5,952,525 1,570,577 2,869,509 2,344,340 1,456,000 14,192,951 Carry Over Projects 233,754,095 - - - - 233,754,095
Total Capital Expenditures 1 280,860,044$ 26,278,152$ 20,319,934$ 20,783,976$ 29,638,646$ 377,880,752$
Transit Long Range Capital ImprovementNon-Revenue Vehicle
91

Appe
ndic
es |
29
Appe
ndix
6 –
Capi
tal E
xpen
ditu
re D
etai
ls
FY 2
023
Prop
osed
Bud
get
FY20
23FY
2024
FY20
25FY
2026
FY20
27FY
2023
- FY
2027
Prop
osed
Budg
et P
lan
Pla
n P
lan
Pla
n T
OTA
L
Stat
e of
Goo
d Re
pair-
Veh
icle
Rep
lace
men
tBu
s Rep
lace
men
tsBu
sAn
nual
Bus
Rep
lace
men
ts p
er y
ear
Aver
age
cost
incl
udes
cost
of c
amer
as a
nd p
lant
vis
itsFY
23: R
epla
ce 1
6 Bu
ses @
$1,
094,
374
FY24
: Rep
lace
17
Buse
s @ $
1,12
7,20
5 ea
ch
FY25
: Rep
lace
9 B
uses
@ $
1,16
1,02
1 ea
chF Y
26: R
epla
ce 1
1 Bu
ses @
$1,
195,
852
each
FY27
: Rep
lace
10
Buse
s @ $
1,23
1,72
8 ea
ch
17,5
22,2
53$
19
,693
,789
$
11,1
04,8
22$
13
,154
,373
$
12,3
17,2
80$
73
,792
,517
$
STS
Repl
acem
ents
STS
Annu
al S
TS R
epla
cem
ents
per
yea
rAv
erag
e co
st in
clud
es co
st o
f cam
eras
and
pla
nt v
isits
FY
23: R
epla
ce 1
1 Bu
ses @
$16
4,80
0 ea
chFY
24: R
epla
ce 1
1 Bu
ses
@ $
169,
744
each
FY25
: Rep
lace
11
Buse
s @
$17
4,83
6 ea
chF Y
26: R
epla
ce 1
1 Bu
ses
@ $
200,
000
each
FY27
: Rep
lace
17
Buse
s @20
6,00
0 ea
ch
1,81
2,80
0
1,
867,
184
1,92
3,19
6
2,
200,
000
3,50
2,00
0
11
,305
,180
$
Vanp
ool R
epla
cem
ents
Vanp
ool
Annu
al V
anpo
ol R
epla
cem
ents
per
yea
rAv
erag
e co
st in
clud
es ca
mer
as a
nd p
lant
vis
itsFY
23: R
epla
ce 9
van
s @ $
36,8
77 e
ach
(tw
o 15
-pas
seng
er a
nd se
ven
7-pa
ssen
ger)
FY24
: Rep
lace
9 m
iniv
ans @
$38
,303
eac
hFY
25: R
epla
ce 9
min
ivan
s @ $
39,4
52 e
ach
F Y26
: Rep
lace
6 m
iniv
ans @
$39
,452
eac
hFY
27: R
epla
ce 1
0 m
iniv
ans @
$40
,635
eac
h
331,
890
34
4,72
6
355,
068
23
6,71
2
406,
350
1,
674,
746
$
Elec
tric
Veh
icle
Cha
rger
sFa
cilit
ies
Purc
hase
52
EV C
harg
ers @
160
,206
eac
h-
- -
- 8,
330,
735
8,33
0,73
5$
Subt
otal
19,6
66,9
43$
21
,905
,699
$
13,3
83,0
86$
15
,591
,085
$
24,5
56,3
65$
95
,103
,178
$
St
ate
of G
ood
Repa
ir- F
acili
ties &
Oth
ers
Envi
sion
My
Ride
Bus
She
lters
Faci
litie
sRe
plac
e an
d/or
Upd
ate
CATS
bus
stop
am
eniti
es to
enh
ance
cust
omer
exp
erie
nce
500,
000
$
50
0,00
0$
500,
000
$
50
0,00
0$
-$
2,
000,
000
$
Dr
aina
ge Im
prov
emen
tsFa
cilit
ies
Drai
nage
Impr
ovem
ents
500,
000
52
5,00
0
551,
000
57
9,00
0
- 2,
155,
000
$
So
uth
Corr
idor
Ligh
ting
Upgr
ades
Faci
litie
sCr
itica
l lig
htin
g fo
r Sou
th C
orrid
or a
lignm
ent
300,
000
30
0,00
0
300,
000
-
- 90
0,00
0$
LE
D Li
ghtin
g Up
grad
esFa
cilit
ies
Rail
& B
us F
acili
ty LE
D Li
ghtin
g Up
grad
es30
0,00
0
300,
000
-
- -
600,
000
$
Cont
inge
ncy
for F
acili
ties P
roje
cts
Faci
litie
sCo
ntig
ency
for P
roje
cts
200,
000
-
- -
- 20
0,00
0$
S.
Tryo
n&
S.Bo
ulev
ard
Ligh
tRa
ilFa
cilit
y Bo
iler R
epla
cem
ents
Faci
litie
sIm
prov
e en
ergy
cons
umpt
ion
and
redu
ce m
aint
enan
ce co
sts w
ith b
oile
r rep
lace
men
t pr
ojec
t-
- -
- 45
0,00
0
450,
000
$
N. D
avid
son
IT A
C Re
plac
emen
tFa
cilit
ies
Repl
acem
ent o
f IT
room
min
i spl
it sy
stem
s use
d to
supp
ort c
ompu
ter e
quip
men
t-
- -
- 12
0,00
0
120,
000
$
S. T
ryon
Gen
erat
or R
epla
cem
ents
Faci
litie
sRe
plac
e cu
rren
t gen
erat
or w
ith a
new
die
sel p
ower
ed g
ener
ator
- -
- -
500,
000
50
0,00
0$
So
lar P
anel
Add
ition
sFa
cilit
ies
Redu
ce o
vera
ll en
ergy
cost
s with
sola
r pan
el a
dditi
ons f
or b
us ca
nopy
- -
- -
500,
000
50
0,00
0$
Su
btot
al1,
800,
000
$
1,62
5,00
0$
1,
351,
000
$
1,07
9,00
0$
1,
570,
000
$
7,42
5,00
0$
Tran
sit S
afet
y &
Sec
urity
BLE
Cam
eras
Safe
ty &
Sec
urity
Repl
ace
cam
eras
alo
ng th
e al
ignm
ent
223,
897
$
22
6,13
6$
350,
000
$
35
0,00
0$
400,
000
$
1,
550,
033
$
Ac
cess
Cont
rol
Fire
Pane
lRe
plac
emen
tSa
fety
& S
ecur
ityRe
plac
e fir
e pa
nels
with
in C
ATS
acce
ss co
ntro
l equ
ipm
ent
50,0
00
25,0
00
10,0
00
- -
85,0
00$
Guar
d Sh
acks
/Bol
lard
sSa
fety
& S
ecur
ityAd
dgu
ard
shac
ksat
vario
usCA
TSfa
cilit
ies
and
Park
NRi
delo
catio
nsan
dbo
llard
sat
CATS
Fac
ilitie
s and
alo
ng th
e al
ignm
ent
75,0
00
75,0
00
- -
- 15
0,00
0$
Acce
ss C
ontr
ol S
yste
m U
pgra
deSa
fety
& S
ecur
ityRe
plac
eol
dan
dou
tdat
edle
gacy
syst
ems
with
inCA
TSac
cess
cont
role
quip
men
tand
esta
blis
h on
-goi
ng a
sset
man
agem
ent f
or th
ese
syst
ems
- -
1,70
0,00
0
-
- 1,
700,
000
$
Mob
ile V
ideo
Rep
lace
men
tSa
fety
& S
ecur
ityRe
plac
e/up
grad
e m
obile
vid
eo ca
mer
as o
n ra
il, fi
xed
rout
e bu
s and
STS
veh
icle
s-
- 33
6,33
9
336,
339
33
6,33
9
1,00
9,01
7$
Subt
otal
348,
897
$
32
6,13
6$
2,39
6,33
9$
68
6,33
9$
736,
339
$
4,
494,
050
$
92

Appe
ndic
es |
30
Appe
ndix
6 –
Capi
tal E
xpen
ditu
re D
etai
ls
FY 2
023
Prop
osed
Bud
get
FY20
23FY
2024
FY20
25FY
2026
FY20
27FY
2023
- FY
2027
Prop
osed
Budg
et P
lan
Pla
n P
lan
Pla
n T
OTA
L
Tran
sit L
ong
Rang
e Ca
pita
l Im
prov
emen
tAD
ADe
velo
pmen
tIm
plem
ent
corr
ectio
ns,
enha
ncem
ents
and
impr
ovem
ents
requ
ired
unde
rAD
Aba
sed
on th
e re
sults
from
the
2-ye
ar A
DA A
sses
smen
t20
0,00
0$
200,
000
$
25
0,00
0$
250,
000
$
-
$
900,
000
$
Ham
brig
ht P
ark
& R
ide
Lot a
nd
Tran
sit C
ente
rDe
velo
pmen
tDe
sign
and
cons
truc
tion
at H
ambr
ight
Roa
d an
d I-7
7 in
Hun
ters
ville
, NC
9,74
7,05
4
-
- -
- 9,
747,
054
$
CTC
Tem
pora
ry F
acili
tyDe
velo
pmen
tTe
mpo
rary
Tra
nsit
Faci
lity
whi
le cu
rren
t CTC
is u
pdat
ed9,
000,
000
- -
- -
9,00
0,00
0$
Subt
otal
18,9
47,0
54$
20
0,00
0$
250,
000
$
25
0,00
0$
-$
19
,647
,054
$
Tr
ansi
t Non
-Rev
enue
Veh
icle
Non
-Rev
enue
Veh
icle
:Bu
s Ope
ratio
ns (B
OD)
Bus
Annu
al re
plac
emen
t per
yea
r:FY
23: R
epla
ce 5
non
-rev
enue
veh
icle
s @ $
28,7
90 e
ach
FY24
: Rep
lace
5 n
on-r
even
ue v
ehic
les @
$30
,240
eac
hFY
26: R
epla
ce 2
non
-rev
enue
veh
icle
s @ $
32,0
81 e
ach
FY27
: Rep
lace
1 n
on-r
even
ue v
ehic
le @
$33
,433
eac
h
143,
950
$
15
1,20
0$
-$
64
,162
$
33,4
33$
39
2,74
5$
Non
-Rev
enue
Veh
icle
:Bu
s Mai
nten
ance
(BO
D)Bu
sAn
nual
Rep
lace
men
t per
yea
r:FY
23: R
epla
ce 1
non
-rev
enue
veh
icle
@ $
79,8
00 e
ach
79,8
00
- -
- -
79,8
00$
Non
-Rev
enue
Veh
icle
:ST
S De
part
men
tBu
sAn
nual
Rep
lace
men
t per
yea
r:FY
23: R
epla
ce 2
non
-rev
enue
veh
icle
s @ $
53,3
90 e
ach
FY24
: Rep
lace
2 n
on-r
even
ue v
ehic
les @
$54
,770
eac
hFY
27: R
epla
ce 3
non
-rev
enue
veh
icle
s @ $
80,0
00 e
ach
106,
780
10
9,54
0
- -
240,
000
45
6,32
0$
Non
-Rev
enue
Veh
icle
:Fa
cilit
ies M
aint
enan
ceBu
sAn
nual
Rep
lace
men
t per
yea
r:FY
23: R
epla
ce 2
non
-rev
enue
veh
icle
s @ $
30,0
00 e
ach
FY24
: Rep
lace
2 n
on-r
even
ue v
ehic
les @
$30
,000
eac
hFY
27: R
epla
ce n
on-r
even
ue v
ehic
les 2
@ $
35,8
21 e
ach
and
1 @
$10
0,00
0
60,0
00
60,0
00
- -
171,
643
29
1,64
3$
Non
-Rev
enue
Veh
icle
:Sa
fety
& S
ecur
ityBu
sVe
hicl
e Ex
pans
ion:
FY24
: Pur
chas
e 4
non-
reve
nue
vehi
cles
@ $
45,0
00 e
ach
- 18
0,00
0
- -
- 18
0,00
0$
Non
-Rev
enue
Veh
icle
:Sa
fety
& S
ecur
ityBu
sAn
nual
Rep
lace
men
t per
yea
r:FY
24: R
epla
ce 3
non
-rev
enue
veh
icle
s @
$50
,000
eac
hFY
26: R
epla
ce 9
non
-rev
enue
veh
icle
s @ $
60,0
00 e
ach
FY27
: Rep
lace
5 n
on-r
even
ue v
ehic
les @
$60
,000
eac
h
- 15
0,00
0
- 54
0,00
0
300,
000
99
0,00
0$
Non
-Rev
enue
Veh
icle
:Te
chno
logy
Bus
Annu
al R
epla
cem
ent p
er y
ear:
FY25
: Rep
lace
2 n
on-r
even
ue v
ehic
les @
$35
,000
eac
hFY
26: R
epla
ce 1
non
-rev
enue
veh
icle
@ $
36,0
50
- -
70,0
00
36,0
50
- 10
6,05
0$
Non
-Rev
enue
Vehi
cle:
Reve
nue
&Ad
min
Bus
Annu
al R
epla
cem
ent p
er y
ear:
FY26
: Rep
lace
2 n
on-r
even
ue v
ehic
les @
$36
,500
eac
h-
- -
73,0
00
- 73
,000
$
Non
-Rev
enue
Veh
icle
:Ra
il Bu
sAn
nual
Rep
lace
men
t per
yea
r:FY
26: R
epla
ce 4
non
-rev
enue
veh
icle
s @ $
30,0
00 e
ach
FY27
:Rep
lace
non-
reve
nue
vehi
cles
;8@
$36,
000
each
,1@
$60,
000,
and
4@
$40,
000
each
- -
- 12
0,00
0
508,
000
62
8,00
0$
Non
-Rev
enue
Veh
icle
:De
velo
pmen
t & P
lann
ing
Bus
Annu
al R
epla
cem
ent p
er y
ear:
FY27
: Rep
lace
2 n
on-r
even
ue v
ehic
les @
$33
,433
eac
h-
- -
- 66
,866
66
,866
$
Subt
otal
390,
530
$
65
0,74
0$
70,0
00$
83
3,21
2$
1,31
9,94
2$
3,
264,
424
$
93

Appe
ndic
es |
31
Appe
ndix
6 –
Capi
tal E
xpen
ditu
re D
etai
ls
FY 2
023
Prop
osed
Bud
get
FY20
23FY
2024
FY20
25FY
2026
FY20
27FY
2023
- FY
2027
Prop
osed
Budg
et P
lan
Pla
n P
lan
Pla
n T
OTA
L
Tran
sit N
ew E
quip
men
tM
isce
llane
ous C
apita
l Pro
ject
sFi
nanc
eTr
ansi
t-re
late
d ca
pita
l pro
ject
s for
em
erge
nt n
eeds
thro
ugho
ut th
e fis
cal y
ear
2,47
1,20
1$
-
$
-$
-
$
-$
2,
471,
201
$
Serv
er R
efre
sh (T
MP
2.4)
Tech
nolo
gyYe
arly
refr
esh
of o
lder
serv
ers w
ith fo
ur-y
ear u
sefu
l life
; per
City
stan
dard
s34
,000
53
8,00
0
504,
000
13
8,00
0
100,
000
1,
314,
000
$
As
set
Man
agem
ent
Tool
-Spe
arRe
plac
emen
tTe
chno
logy
New
ass
et m
anag
emen
t too
l to
assi
st w
ith in
vent
ory
trac
king
1,15
9,81
5
-
- -
- 1,
159,
815
$
Davi
dson
Net
wor
k Re
fres
hTe
chno
logy
Repl
ace
core
switc
hes t
o m
aint
ain
syst
em co
mpa
tibili
ty22
0,00
0
42,5
00
24,0
00
- -
286,
500
$
UPS
Refr
esh
for
Loca
lSe
rver
s&
Switc
hes
Tech
nolo
gyRe
plac
ed 6
com
mer
cial
UPS
uni
ts a
t Sou
th T
ryon
- -
240,
000
-
- 24
0,00
0$
CATS
Net
wor
k Re
fres
hTe
chno
logy
Annu
al re
fres
h: 1
4 ca
taly
st 3
850
netw
ork
switc
hes f
or th
e fa
cilit
ies/
rail
envi
ronm
ent
- 10
0,00
0
100,
000
-
- 20
0,00
0$
LR
SCA
DA F
irew
all R
efre
shTe
chno
logy
Refr
esh
the
firew
all o
pera
ting
syst
em25
0,00
0
- -
- -
250,
000
$
DR S
yste
m U
pgra
deBu
sUp
grad
eDR
syst
emto
oper
ate
the
enun
ciat
ion
syst
eman
dpr
ovid
ew
irele
ssda
taup
load
ing
and
dow
nloa
ding
.-
- 66
1,43
2
- -
661,
432
$
City
of C
harlo
tte
ERP
Initi
ativ
esFi
nanc
eCA
TSpo
rtio
nof
City
'sCI
Pex
pens
es(~
11%
ofto
tal):
MUN
ISup
grad
es;
repo
rtin
gso
lutio
ns;
MW
SBE/
DBE
mod
ule;
trai
ning
initi
ativ
es;
trav
elm
odul
e;eP
rocu
rem
ent
mod
ule;
Bud
get S
yste
m u
pgra
de79
0,07
7
790,
077
79
0,07
7
- -
2,37
0,23
1$
Cont
inge
ncy
for I
T Pr
ojec
tsTe
chno
logy
Cont
inge
ncy
for I
T Pr
ojec
ts10
0,00
0
100,
000
10
0,00
0
100,
000
10
0,00
0
500,
000
$
BLE
Net
wor
k Re
fres
hTe
chno
logy
Phas
e I o
f BLE
Net
wor
k Re
fres
h-
- -
- 50
0,00
0
500,
000
$
Park
& R
ide
Net
wor
k Re
fres
hTe
chno
logy
Syst
em re
fres
h of
Par
k an
d Ri
de E
quip
men
t-
- -
- 19
5,00
0
195,
000
$
Rail
Shop
Equ
ipm
ent
Rail
Equi
pmen
t for
Mai
nten
ance
of W
ay /
Rail
Mai
nten
ance
327,
432
-
- -
- 32
7,43
2$
Ha
stus
Soft
war
e Up
grad
eTe
chno
logy
Upgr
ade
Hast
usso
ftw
are
used
for
sche
dulin
g,tr
ippl
anni
ng,
call
cent
er,
mob
ileap
plic
aton
s, d
ispa
tchi
ng, a
ssig
nmen
ts, a
nd p
ayro
ll60
0,00
0
- -
- -
600,
000
$
Radi
o Di
spat
ch C
onso
le R
efre
shTe
chno
logy
Repl
ace
exis
ting
radi
o di
spat
ch co
nsol
es w
ith th
e la
test
mod
els a
vaila
ble
- -
450,
000
-
- 45
0,00
0$
Fr
ictio
n M
odifi
ers
Rail
Equi
pmen
tdec
reas
esth
efr
ictio
nin
the
inte
ract
ion
betw
een
the
trac
kan
dth
ew
heel
to d
ecre
ase
stre
ss a
nd p
ress
ure
on b
oth
- -
- 14
6,34
0
- 14
6,34
0$
Stea
m B
ay Li
ft a
t S. T
ryon
Bus
Repl
ace
the
stea
mba
ylif
twhi
chhe
lps
inth
ebu
srep
airp
roce
ssby
iden
tifyi
ngle
aks
that
nee
d to
be
repa
ired
- -
- 16
0,00
0
160,
000
32
0,00
0$
AVL S
yste
mTe
chno
logy
New
AVL
Sys
tem
to re
plac
e Tr
ansi
t Mas
ter
- -
- 1,
800,
000
- 1,
800,
000
$
Sc
rubb
erBu
sPu
rcha
se 2
scru
bber
s @ $
20,0
00 e
ach
- -
- -
40,0
00
40,0
00$
Sh
op F
loor
Scr
ubbe
rBu
sPu
rcha
se 8
Sho
p Fl
oor S
crub
bers
@ $
7,00
0 ea
ch-
- -
- 56
,000
56
,000
$
Fork
Lift
sBu
sPu
rcha
se 4
For
k Li
fts @
$17
,500
eac
h-
- -
- 70
,000
70
,000
$
Rim
Pol
ishe
rBu
sAs
sist
s with
iden
tific
atio
n of
stru
ctur
al in
tegr
ity is
sues
and
dam
ages
to b
us w
heel
s-
- -
- 14
0,00
0
140,
000
$
Clim
ate
Cont
rolle
d Co
ntai
ners
Rail
Cont
aine
rs u
sed
to st
ore
larg
e el
ectr
onic
and
rubb
er LR
V &
Str
eetc
ar sp
ares
- -
- -
75,0
00
75,0
00$
Br
ake
Roto
r Lat
heBu
sEq
uipm
entu
sed
forc
urin
gno
ise
and
vibr
atio
npr
oble
ms
and
assi
stin
prol
ongi
ngth
elif
e of
bus
bra
ke sy
stem
s-
- -
- 20
,000
20
,000
$
Subt
otal
5,95
2,52
5$
1,
570,
577
$
2,86
9,50
9$
2,
344,
340
$
1,45
6,00
0$
14
,192
,951
$
Gra
nt-F
unde
d Ca
pita
l Pro
ject
s Sub
tota
l47
,105
,949
$
26,2
78,1
52$
20
,319
,934
$
20,7
83,9
76$
29
,638
,646
$
144,
126,
657
$
94

Appe
ndic
es |
32
Appe
ndix
6 –
Capi
tal E
xpen
ditu
re D
etai
ls
FY 2
023
Prop
osed
Bud
get
FY20
23FY
2024
FY20
25FY
2026
FY20
27FY
2023
- FY
2027
Prop
osed
Budg
et P
lan
Pla
n P
lan
Pla
n T
OTA
L
Carr
y O
ver C
apita
l Pro
ject
s
Depa
rtm
ent
Proj
ect D
escr
iptio
nSa
fety
& S
ecur
ityAc
cess
Con
trol
- Fi
re P
anel
50,0
00$
-
$
-$
-
$
-$
50
,000
$
Deve
lopm
ent
ADA
Asse
ssm
ent
200,
000
-
- -
- 20
0,00
0
Rail
BLE
Orig
in S
tudy
1,93
7
- -
- -
1,93
7
Safe
ty &
Sec
urity
Blue
Line
Cam
era
Repl
acem
ent
440,
793
-
- -
- 44
0,79
3
Bus
Bus C
omm
unic
atio
ns S
yste
m28
,434
-
- -
- 28
,434
Bu
sBu
s Lan
e Im
prov
emen
ts75
0,00
0
- -
- -
750,
000
Bu
sBu
s New
Equ
ipm
ent
344,
781
-
- -
- 34
4,78
1
Bus
Bus R
epla
cem
ents
47,5
92,9
72
-
- -
- 47
,592
,972
Bus
Bus S
hiel
ds64
8,23
2
- -
- -
648,
232
Fa
cilit
ies
Bus S
top
Impr
ovem
ents
1,35
1,19
3
-
- -
- 1,
351,
193
Bus
Bus W
ash
/ Bay
Lift
s77
9,39
1
- -
- -
779,
391
Sa
fety
& S
ecur
ityCa
mer
a Up
grad
es21
4,06
7
- -
- -
214,
067
De
velo
pmen
tCh
arlo
tte
Gate
way
Sta
tion
- Non
-FRA
6,49
3,70
3
-
- -
- 6,
493,
703
Faci
litie
s - B
LE S
avin
gsCo
mfo
rt S
tatio
n @
OCR
600,
000
-
- -
- 60
0,00
0
Tech
nolo
gyCo
ntin
uum
/Tw
o Fa
ctor
Sec
urity
65,0
00
- -
- -
65,0
00
Safe
ty &
Sec
urity
Core
and
Pad
lock
Rep
lace
men
t at F
acili
ties
218,
854
-
- -
- 21
8,85
4
Tech
nolo
gyCT
C Ca
mer
a Up
grad
es30
6,05
0
- -
- -
306,
050
Te
chno
logy
Davi
dson
Net
wor
k Re
fres
h52
,500
-
- -
- 52
,500
Ra
il-BL
E Sa
ving
sDr
aina
ge Im
prov
emen
ts2,
585,
552
- -
- -
2,58
5,55
2
Sa
fety
& S
ecur
ity-B
LE S
avin
gsEg
ress
Gat
e Pr
ojec
t30
0,00
0
- -
- -
300,
000
Fa
cilit
ies
Elec
tric
Cha
rgin
g St
atio
ns50
0,00
0
- -
- -
500,
000
Ra
ilEm
erge
ncy
Resp
onse
Veh
icle
529,
449
-
- -
- 52
9,44
9
Faci
litie
sFa
cilit
ies P
roje
cts
259,
884
-
- -
- 25
9,88
4
Faci
litie
sFa
cilit
y Pr
ojec
ts15
0,00
0
- -
- -
150,
000
Ra
ilFa
re C
olle
ctio
n Sy
stem
1,48
6,04
8
-
- -
- 1,
486,
048
Faci
litie
sFe
ncin
g Re
plac
emen
t32
5,00
0
- -
- -
325,
000
Te
chno
logy
Genf
are
Proj
ect
103,
516
-
- -
- 10
3,51
6
Rail
Germ
icid
al R
ails
300,
000
-
- -
- 30
0,00
0
Safe
ty &
Sec
urity
Guar
d Sh
acks
175,
000
-
- -
- 17
5,00
0
Deve
lopm
ent
Ham
brig
ht P
ark
& R
ide
2,95
0,44
6
-
- -
- 2,
950,
446
Bus
HAST
US S
yste
m44
9,44
1
- -
- -
449,
441
Fa
cilit
ies
HVAC
Rep
lace
men
t77
8,83
7
- -
- -
778,
837
Te
chno
logy
Inte
ract
ive
Voic
e Re
spon
se45
5,82
0
- -
- -
455,
820
De
velo
pmen
tLa
nd A
cqui
sitio
ns11
,496
,957
- -
- -
11,4
96,9
57
Fa
cilit
ies
Ligh
ting
Upgr
ades
600,
000
-
- -
- 60
0,00
0
Faci
litie
sLi
ghtin
g Up
grad
es -
Sout
h Co
rrid
or30
0,00
0
- -
- -
300,
000
Ra
il-BL
E Sa
ving
sLR
V Tr
uck
Ove
rhau
l EM
I Miti
gatio
n3,
800,
000
- -
- -
3,80
0,00
0
De
velo
pmen
tLY
NX
Blue
Line
Cap
acity
Exp
ansi
on P
roje
ct53
4,48
8
- -
- -
534,
488
De
velo
pmen
tLY
NX
Blue
Line
Ext
ensi
on48
,115
,572
- -
- -
48,1
15,5
72
De
velo
pmen
tLY
NX
Blue
Line
Ext
ensi
on -
Non
-FFG
A(3
5,00
0)
- -
- -
(35,
000)
De
velo
pmen
tLY
NX
Silv
er Li
ne28
,920
,074
- -
- -
28,9
20,0
74
Ad
min
istr
atio
nM
isc.
Cap
ital P
roje
cts
675,
384
-
- -
- 67
5,38
4
Rail
Mis
c. R
ail E
quip
men
t68
6,05
1
- -
- -
686,
051
Te
chno
logy
Mob
ile A
pplic
atio
n Ph
ase
220
9,02
2
- -
- -
209,
022
Unex
pend
ed a
ppro
pria
tions
est
imat
ed a
s of F
ebru
ary
28, 2
022
for p
revi
ousl
y au
thor
ized
mul
ti-ye
ar ca
ptia
l pro
ject
s or g
rant
pro
ject
s are
re-a
ppro
pria
ted
for e
xpen
ditu
re in
FY2
022;
loca
l gra
nt-m
atch
ing
oblig
atio
ns th
at w
ere
prev
ious
ly
auth
oriz
ed a
s par
t of m
ulti-
year
gra
nt p
roje
cts a
re a
lso
re-a
ppro
pria
ted
for e
xpen
ditu
re in
FY2
022.
95

Appe
ndic
es |
33
Appe
ndix
6 –
Capi
tal E
xpen
ditu
re D
etai
ls
FY 2
023
Prop
osed
Bud
get
FY20
23FY
2024
FY20
25FY
2026
FY20
27FY
2023
- FY
2027
Prop
osed
Budg
et P
lan
Pla
n P
lan
Pla
n T
OTA
L
Carr
y O
ver C
apita
l Pro
ject
s
Depa
rtm
ent
Proj
ect D
escr
iptio
nSa
fety
& S
ecur
ityM
obile
Vid
eo R
epla
cem
ent
1,93
7,38
3
-
- -
- 1,
937,
383
Rail
MO
W B
atte
ry R
epla
cem
ent
94,4
11
- -
- -
94,4
11
Rail
MO
W C
ivil
Engi
neer
ing
Serv
ices
1,20
7,29
1
-
- -
- 1,
207,
291
Bus
MO
W T
ract
ion
803,
000
-
- -
- 80
3,00
0
Deve
lopm
ent -
BLE
Sav
ings
N. Y
ard
Land
Acq
uisi
tions
7,50
0,00
0
-
- -
- 7,
500,
000
Bus
Non
Rev
enue
Veh
icle
s - B
us35
6,25
0
- -
- -
356,
250
Bu
sN
on R
even
ue V
ehic
les -
Dev
elop
men
t45
,000
-
- -
- 45
,000
Bu
sN
on R
even
ue V
ehic
les -
Fac
ilitie
s73
,446
-
- -
- 73
,446
Bu
sN
on R
even
ue V
ehic
les -
Rai
l54
8,69
2
- -
- -
548,
692
Bu
sN
on R
even
ue V
ehic
les -
STS
101,
260
-
- -
- 10
1,26
0
Bus
Non
Rev
enue
Veh
icle
s - T
echn
olog
y21
,000
-
- -
- 21
,000
Bu
sN
on-R
even
ue V
ehic
les -
Bus
366,
300
-
- -
- 36
6,30
0
Bus
Non
-Rev
enue
Veh
icle
s - F
acili
ties
60,0
00
- -
- -
60,0
00
Bus
Non
-Rev
enue
Veh
icle
s - M
arke
ting
90,0
00
- -
- -
90,0
00
Bus
Non
-Rev
enue
Veh
icle
s - R
ail
1,17
2,39
4
-
- -
- 1,
172,
394
Bus
Non
-Rev
enue
Veh
icle
s - S
afet
y &
Sec
urity
14,7
45
- -
- -
14,7
45
Bus
Non
-Rev
enue
Veh
icle
s - S
TS18
8,02
0
- -
- -
188,
020
Fa
cilit
ies-
BLE
Savi
ngs
Ope
rato
r Bre
akro
om a
t UCB
800,
000
-
- -
- 80
0,00
0
Safe
ty &
Sec
urity
Polic
e Di
spat
ch79
,617
-
- -
- 79
,617
Te
chno
logy
Priv
ate
Mob
ile N
etw
ork
211,
671
-
- -
- 21
1,67
1
Rail
Rai l
Car E
xpan
sion
22,5
00,0
00
-
- -
- 22
,500
,000
Rail
Rail
Shop
Equ
ipm
ent
250,
000
-
- -
- 25
0,00
0
Safe
ty &
Sec
urity
SCLR
Ligh
ting
Upgr
ades
300,
000
-
- -
- 30
0,00
0
Safe
ty &
Sec
urity
Secu
rity
Enha
ncem
ents
405,
306
-
- -
- 40
5,30
6
Tech
nolo
gySe
rver
Ref
resh
TM
P (2
.4)
297,
500
-
- -
- 29
7,50
0
Deve
lopm
ent
Silv
erlin
e Co
nsul
tant
s1,
016,
017
- -
- -
1,01
6,01
7
Te
chno
logy
Sout
h Tr
yon
Net
wor
k In
fras
truc
ture
Ref
resh
15,2
63
- -
- -
15,2
63
Deve
lopm
ent -
BLE
Sav
ings
Sout
hend
Sta
tion
15,0
00,0
01
-
- -
- 15
,000
,001
Bus
STS
Repl
acem
ents
7,14
6,08
0
-
- -
- 7,
146,
080
Tech
nolo
gyTe
chno
logy
Pro
ject
s14
0,86
3
- -
- -
140,
863
Ra
ilTr
ack
4 Fa
ll Pr
otec
tion
325,
440
-
- -
- 32
5,44
0
Rail
Tran
sit B
ridge
260,
640
-
- -
- 26
0,64
0
Deve
lopm
ent
Tran
sit S
yste
m P
lann
ing
& D
evel
opm
ent
8,89
4
- -
- -
8,89
4
Rail
UPS
Equi
pmen
t33
2,58
7
- -
- -
332,
587
Te
chno
logy
UPS
Refr
esh
210,
000
-
- -
- 21
0,00
0
Bus
Van
Pool
Rep
lace
men
ts2,
742,
988
- -
- -
2,74
2,98
8
Sa
fety
& S
ecur
ityVi
deo
Solu
tion
111,
452
-
- -
- 11
1,45
2
Tech
nolo
gyVM
F Re
fres
h4,
781
-
- -
- 4,
781
Fa
cilit
ies
VMF
Tran
sfer
Sw
itch
22,1
96
- -
- -
22,1
96
Tech
nolo
gyW
orks
tatio
n &
Ser
ver R
efre
sh20
4,16
0
- -
- -
204,
160
Gra
nt-F
unde
d Ca
pita
l Pro
ject
s Sub
tota
l $
233
,754
,095
$
- $
- $
- $
- $
233
,754
,095
280,
860,
044
$
26
,278
,152
$
20,3
19,9
34$
20
,783
,976
$
29,6
38,6
46$
37
7,88
0,75
2$
Unex
pend
ed a
ppro
pria
tions
est
imat
ed a
s of F
ebru
ary
28, 2
022
for p
revi
ousl
y au
thor
ized
mul
ti-ye
ar ca
ptia
l pro
ject
s or g
rant
pro
ject
s are
re-a
ppro
pria
ted
for e
xpen
ditu
re in
FY2
022;
loca
l gra
nt-m
atch
ing
oblig
atio
ns th
at w
ere
prev
ious
ly
auth
oriz
ed a
s par
t of m
ulti-
year
gra
nt p
roje
cts a
re a
lso
re-a
ppro
pria
ted
for e
xpen
ditu
re in
FY2
022.
TOTA
L Inc
ludi
ng C
arry
Ove
r Cap
ital P
roje
cts,
Exc
ludi
ng G
rant
-Fun
ded
Ope
ratin
g Pr
ojec
ts
96

Appe
ndic
es |
34
Appe
ndix
7 –
Gran
t-Fu
nded
Ope
ratin
g Pr
ojec
ts
FY 2
023
Prop
osed
Bud
get
FY20
23FY
2024
FY20
25FY
2026
FY20
27FY
2023
- FY
2027
Prop
osed
Budg
et P
lan
Pla
n P
lan
Pla
n T
OTA
L
Gra
nt F
unde
d CO
VID
Ope
ratin
g As
sist
ance
Pro
ject
s- F
eder
al S
hare
Onl
y
Prof
essi
onal
& T
echn
ical
Ser
vice
sDe
velo
pmen
t &
Civi
l Rig
hts
Ride
rshi
p fo
reca
stin
g, ca
ptio
ning
serv
ices
, ADA
and
Titl
e VI
rela
ted
prof
essi
onal
serv
ice
requ
irem
ents
to a
ccom
mod
ate
virt
ual m
eetin
gs.
502,
500
$
-$
-
$
-$
-
$
502,
500
$
Mis
cella
neou
s Con
trac
tual
, Ja
nito
rial &
Cle
anin
g Se
rvic
esFa
cilit
ies,
Bus
, &
Rail
Prof
essi
onal
dee
p cl
eani
ng a
nd d
isin
fect
ion
serv
ices
in h
igh
freq
uenc
y ar
eas
373,
307
- -
- -
373,
307
Oth
er C
OVI
D-Re
late
d Pr
ojec
tsVa
rious
De
part
men
tsRe
venu
esh
ortf
all,
oper
atin
gas
sist
ance
nece
ssar
yto
oper
ate,
mai
ntai
n,an
d m
anag
e a
publ
ic tr
ansp
orta
tion
syst
em.
8,33
9,69
1
- -
- -
8,33
9,69
1
Gra
nt-F
unde
d CO
VID
Ope
ratin
g As
sist
ance
Pro
ject
s Tot
al9,
215,
498
$
-
$
-$
-
$
-$
9,
215,
498
$
97

Appe
ndic
es |
35
Appe
ndix
7 –
Gran
t-Fu
nded
Ope
ratin
g Pr
ojec
ts
FY 2
023
Prop
osed
Bud
get
FY20
23FY
2024
FY20
25FY
2026
FY20
27FY
2023
- FY
2027
Prop
osed
Budg
et P
lan
Pla
n P
lan
Pla
n T
OTA
L
Gra
nt F
unde
d O
pera
ting
Proj
ects
- Fed
eral
Sha
re O
nly
Regi
onal
Tra
nsit
Plan
Stu
dy-
UPW
P Pr
ojec
tsDe
velo
pmen
tRe
gion
al T
rans
it Pl
an S
tudy
-$
40
0,00
0$
-
$
-$
-
$
400,
000
$
UPW
P Pr
ogra
mDe
velo
pmen
tUn
ified
Pla
nnin
g W
ork
Prog
ram
89,3
07
- -
- -
89,3
07
Tran
sit O
rient
ed D
evel
opm
ent
(TO
D) P
lann
ing
Gran
tDe
velo
pmen
tEq
uita
ble
TOD
Stud
y - S
ilver
line
405,
000
- -
- -
405,
000
Rout
e Re
stor
atio
n Pl
anni
ng G
rant
Deve
lopm
ent
Rout
e Re
stor
atio
n Pl
anni
ng d
esig
ned
to in
crea
se ri
ders
hip
and
redu
ce
trav
el ti
mes
750,
000
- -
- -
750,
000
Tran
sit P
lann
ing
Deve
lopm
ent
5303
Pla
nnin
g Gr
ant
1,37
5,34
6
- -
- -
1,37
5,34
6
Tran
sit P
lann
ing
Deve
lopm
ent
Conn
ect &
Bey
ond
80,0
00
- -
- -
80,0
00
Tran
sit P
lann
ing
Deve
lopm
ent
Rail
Trai
l68
,800
-
- -
- 68
,800
Ra
il Sa
fety
Cam
paig
nM
arke
ting
Safe
ty ca
mpa
ign
for C
ityLY
NX
rail
syst
em20
,080
-
- -
- 20
,080
Enha
nced
Mob
ility
Pro
ject
Ad
min
istr
atio
nCi
vil R
ight
sAd
min
istr
ativ
e&
mon
itorin
gco
sts
ofth
eEn
hanc
edM
obili
tyGr
anta
ndsu
brec
ipie
nt p
roje
ct e
xpen
ses
2,00
8,95
5
891,
980
891,
980
891,
980
891,
980
5,57
6,87
5
Wor
ksta
tions
Tech
nolo
gyYe
arly
refr
esh
of o
lder
wor
ksta
tions
, val
ued
unde
r $5,
000
per u
nit.
174,
400
225,
120
- -
- 39
9,52
0
Prev
entiv
e M
aint
enan
ce-
Faci
litie
sFa
cilit
ies
Bus s
top
base
s5,
600
-
- -
- 5,
600
SBLR
F Ro
of R
epla
cem
ent
Faci
litie
sRo
of R
epla
cem
ent a
t Sou
th B
lvd
Ligh
t Rai
l Fac
ility
691,
200
- -
- -
691,
200
S. C
orrid
or R
ail S
tate
of G
ood
Repa
irFa
cilit
ies
Stat
ion
win
dscr
een
and
tile
colu
mn
repl
acem
ents
80,0
00
- -
- -
80,0
00
S. T
ryon
Car
pet R
epla
cem
ent
Faci
litie
sCa
rpet
repl
acem
ent a
t Sou
th T
ryon
Bus
Fac
ility
160,
000
- -
- -
160,
000
Prev
entiv
e M
aint
enan
ce -
Bus
Bus
Rout
ine
mai
nten
ce fo
r rev
enue
bus
& S
TS v
ehic
les
12,8
40,0
00
12,8
30,0
85
10,7
99,8
70
4,52
3,98
8
4,54
4,25
8
45,5
38,2
01
Prev
entiv
e M
aint
enan
ce -
Rail
Rail
Rout
ine
mai
nten
ce fo
r rai
l veh
icle
s7,
503,
956
7,
000,
000
5,
350,
000
85
0,00
0
85
0,00
0
21
,553
,956
S70
Ove
rhau
l Eng
inee
ring
Rail
Supp
orta
ndQ
Ase
rvic
esfo
rveh
icle
over
haul
sto
incl
ude,
mai
nten
ance
,e l
ectr
ical
and
mec
hani
cal
upgr
ades
ofLR
Vsy
stem
san
dsu
b-sy
stem
,de
velo
pmen
t,im
plem
enta
tion,
and
engi
neer
ing
toco
ver
the
OEM
reco
mm
ende
d m
aint
enan
ce se
rvic
es fo
r veh
icle
syst
ems.
206,
641
266,
050
208,
283
208,
283
208,
283
1,09
7,54
0
S70
Ove
rhau
l Equ
ipm
ent
Rail
Equi
pmen
tnec
essa
ryfo
rmai
nten
ance
upgr
ades
ofLR
Vsy
stem
san
dsu
b-sy
stem
fort
he20
vehi
cle
light
rail
fleet
.The
S70
over
haul
prog
ram
will
be p
erfo
rmed
by
cont
ract
or.
3,14
5,78
4
2,32
6,63
2
2,25
8,86
6
2,25
8,86
6
2,25
8,86
6
12,2
49,0
14
S70
Mid
-Life
Ove
rhau
lRa
ilM
idlif
e ov
erha
ul fo
r rai
l car
veh
icle
s4,
720,
581
10
,000
,000
10
,000
,000
10
,000
,000
-
34,7
20,5
81
Gra
nt-F
unde
d O
pera
ting
Proj
ects
Tot
al34
,325
,650
$
33
,939
,867
$
29
,508
,999
$
18
,733
,117
$
8,
753,
387
$
12
5,26
1,02
0$
98

Appe
ndic
es |
36
Appe
ndix
7 –
Gran
t-Fu
nded
Ope
ratin
g Pr
ojec
ts
FY 2
023
Prop
osed
Bud
get
FY20
23FY
2024
FY20
25FY
2026
FY20
27FY
2023
- FY
2027
Prop
osed
Budg
et P
lan
Pla
n P
lan
Pla
n T
OTA
L
Gra
nt F
unde
d O
pera
ting
Proj
ects
- Sta
te S
hare
Onl
y
Ride
shar
e Pr
ogra
mVa
npoo
lPr
ogra
m to
enc
oura
ge a
s a v
iabl
e al
tern
ativ
e, th
e us
e of
Pub
lic T
rans
it th
roug
h th
e Va
npoo
l Pro
gram
.14
1,81
3$
-
$
-$
-
$
-$
14
1,81
3$
Appr
entic
e Pr
ogra
mVa
rious
Prog
ram
to cr
eate
uni
que
lear
ning
opp
ortu
nitie
s in
vario
us d
epar
tmen
ts
with
in C
ATS
for c
olle
ge st
uden
ts w
ho sh
ow in
tere
st in
pub
lic tr
ansi
t.13
5,70
2
-
- -
- 13
5,70
2
Tran
sit P
lann
ing
Deve
lopm
ent
Conn
ect &
Bey
ond
10,0
00
- -
- -
10,0
00
Tran
sit P
lann
ing
Deve
lopm
ent
Rail
Trai
l8,
600
-
- -
- 8,
600
Gra
nt-F
unde
d O
pera
ting
Proj
ects
Tot
al29
6,11
5$
-
$
-$
-
$
-$
29
6,11
5$
99

Appendices | 37
Appendix 8 – Other Capital Projects Managed by CATS
FY 2021 Proposed BudgetFY 2023 Proposed Budget
Charlotte Gateway StationSources of Capital Funding Funding Share Funding Amount
Federal Railroad Administration Cooperative AgreementFederal TIGER VII Grant Program (FRA) 57% 30,000,000$ Match to TIGER VII Grant (Strategic Transportation Investments) 43% 22,719,131 FRA Federal Project Total 100% 52,719,131$
MPO Allocated State funds (formerly Surface Transportation Block Grant) 17,350,000$ Strategic Transportation Investments (STI- Preliminary Engineering & Construction) 7,280,869 City of Charlotte funds for engineering, construction & other uses 9,034,986 Non-FRA Federal Project Total 33,665,855$
FRA Cooperative Agreement Total 86,384,986$
Federal Transit Administration GrantsFederal Grants NC-04-006 & NC-04-0018 for engineering & construction 80% 22,030,772$ Match to FTA 20% 5,507,693 FTA Project Total 100% 27,538,465$
Other Funding Sources & UsesMPO Allocated State funds (formerly Surface Transportation Block Grant) 1,400,000$ Strategic Transportation Investments (STI- Preliminary Engineering & Construction) 9,600,000 Proceeds from Sale of Land 11,842,625 NCDOT Rail Division PE Funds 1,925,375 City of Charlotte funds for engineering, construction & other uses 23,965,014 Other Funding Sources Total 48,733,014$
TOTAL PROJECT BUDGET 162,656,465$
100

Appendices | 38
Appendix 8 – Other Capital Projects Managed by CATS
FY 2021 Proposed BudgetFY 2023 Proposed Budget
CityLYNX Goldline Phase IISources of Capital Funding Funding Share Funding Amount
Federal Section 5309 Small Starts Federal Funds 54% 73,087,380$ Local Funds Match to Federal Funding (City of Charlotte) 46% 61,965,236 Federal Section 5309 Project Total 100% 135,052,616$
Federal Section 5309 American Rescue Plan Federal Funds 100% 11,122,146
100% Local Funds (City of Charlotte) 3,912,619 100% Local Funds (City of Charlotte) 11,122,146 TOTAL PROJECT BUDGET 161,209,527$
Uses of Capital Funding (as of 02/28/2022) Budget Amount Expenditures to Date 10. Guideway & Track Elements 19,476,843$ 17,443,745$ 20. Stations, Stops, Terminals, Intermodal 2,392,680 2,024,387 30. Support Facilities: Yards, Shops, Admin Buildings - - 40.Sitework & Special Conditions 33,872,415 23,792,135 50. Systems 28,500,365 25,951,567 60. ROW, Land, Exisiting Improvements 1,791,415 1,490,496 70. Vehicles 42,104,503 38,657,800 80. Professional Services 21,861,778 20,662,412 90. Unallocated Contingency - - 100. Finance Charges - - 100% Local Funded Art in Transit - 279,061 100% Local Funded 87,381 - 100% Local Funded 11,122,146 - TOTAL PROJECT EXPENSE 161,209,526$ 130,301,601$
101

Appendices | 39
Appendix 9 – FY2023 Budget Schedule
FY 2021 Proposed BudgetFY 2023 Proposed Budget
Month Date Present/Deliver To Details
Jan 26 Metropolitan Transit Commission (MTC)Presentation of Preliminary Budget: Overview
Feb 10 Transit Services Advisory Committee (TSAC)Presentation of Preliminary Budget: Overview
15 Citizens Transit Advisory Group (CTAG)Presentation of Preliminary Budget: Overview
16 MTC Managers n/a
23 Metropolitan Transit Commission (MTC) n/a
Mar 16 MTC Managers n/a
23 Metropolitan Transit Commission (MTC) n/a
Apr 19 Citizens Transit Advisory Group (CTAG)Presentation of CEO Recommended Budget to MTC
20 MTC ManagersOverview of CEO Recommended Budget to City Council
27 Metropolitan Transit Commission (MTC)Presentation of CEO Recommended Budget to City Council
Jun 13 Charlotte City Council Adopt Budget
102

(This page intentionally left blank.)
103

104

105

106

107

108

109

110

111
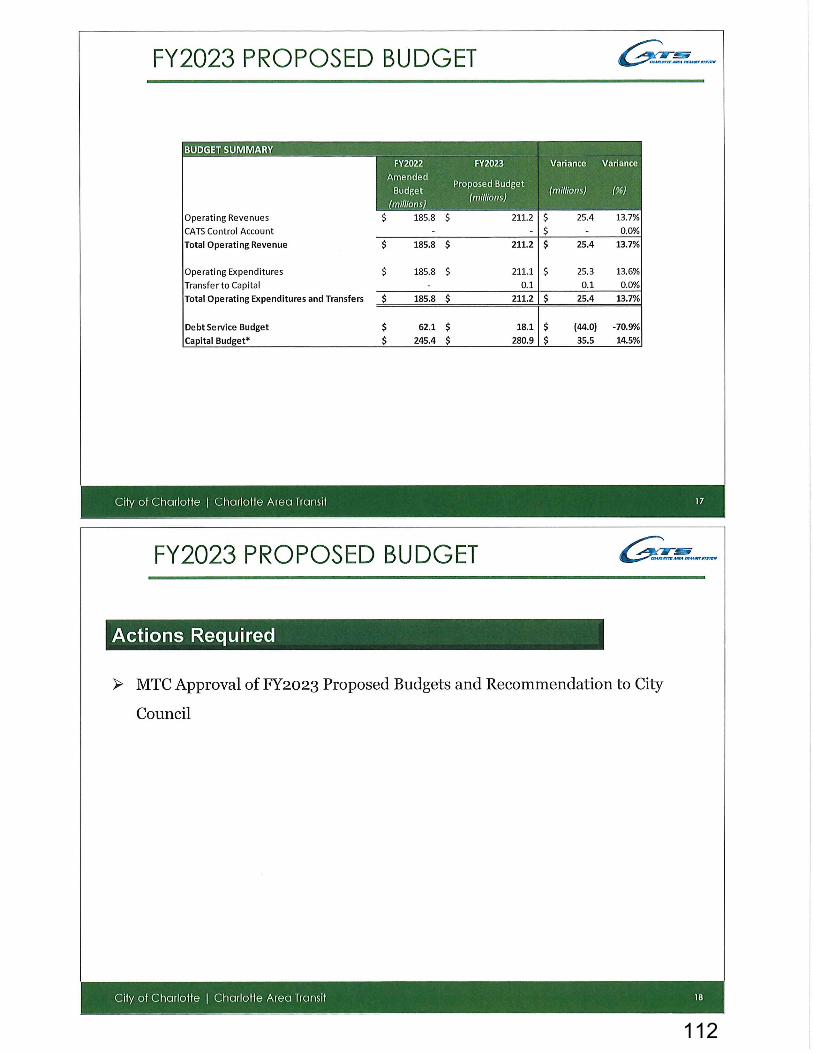
112

113

114

Metropolitan Transit Commission
Charlotte Area Transit System Ridership Report
Mar-22
Mode / Service Percent YTD YTD Percent Avg Daily Ridership per MonthMar-22 Mar-21 Increase/Decrease FY 2022 FY 2021 Increase/Decrease WeekDay Saturday Sunday
Local BOD Local 478,630 475,421 0.7 % 4,154,488 4,185,240 -0.7 % 17,311 11,621 8,510 Subtotal 478,630 475,421 0.7 % 4,154,488 4,185,240 -0.7 % 17,311 11,621 8,510Local Express Harrisburg Road Express 652 303 115.2 % 4,959 2,593 91.2 % 28 - - Northcross Express 1,946 286 580.4 % 5,749 2,311 148.8 % 85 - - Idlewild Road Express 836 201 315.9 % 4,990 2,679 86.3 % 36 - - Independence Blvd Express 1,766 129 1,269.0 % 5,993 1,084 452.9 % 77 - - Lawyers Road Express 849 354 139.8 % 3,989 2,707 47.4 % 37 - - Northlake Express 1,434 326 339.9 % 4,595 1,946 136.1 % 62 - - North Mecklenburg Express 3,214 205 1,467.8 % 11,158 1,951 471.9 % 140 - - Huntersville Express 2,720 421 546.1 % 9,871 3,156 212.8 % 118 - - Rea Road Express 1,162 285 307.7 % 5,293 2,553 107.3 % 51 - - Huntersville Greenhouse Express 302 176 71.6 % 1,233 1,117 10.4 % 13 - - Subtotal 14,881 2,686 454.0 % 57,830 22,097 161.7 % 647 -Regional Express Gastonia Express 983 462 112.8 % 5,891 4,659 26.4 % 43 - - Rock Hill Express 897 253 254.5 % 3,968 2,225 78.3 % 39 - - Union County Express 664 220 201.8 % 3,109 2,048 51.8 % 29 - - Subtotal 2,544 935 172.1 % 12,968 8,932 45.2 % 111 -Community Circulator Neighborhood Shuttles 12,745 14,979 -14.9 % 111,045 133,227 -16.6 % 470 365 119 Eastland Neighborhood Shuttle 7,926 8,333 -4.9 % 65,138 76,056 -14.4 % 268 259 179 Pineville-Matthews Road 1,322 1,446 -8.6 % 11,225 12,879 -12.8 % 51 37 - Village Rider 3,553 3,805 -6.6 % 29,051 32,391 -10.3 % 131 79 56 Subtotal 25,546 28,563 -10.6 % 216,459 254,553 -15.0 % 920 740 354Human Services Transportation Special Transportation Services 14,008 13,055 7.3 % 120,609 102,550 17.6 % 551 193 136 DSS 298 3,103 -90.4 % 19,115 14,336 33.3 % 13 - - Subtotal 14,306 16,158 -11.5 % 139,724 116,886 19.5 % 564 193 136Rideshare Services Vanpool 3,741 2,883 29.8 % 28,000 28,141 -0.5 % 151 27 39 Subtotal 3,741 2,883 29.8 % 28,000 28,141 -0.5 % 151 27 39Rail LYNX Blue Line 389,434 209,692 85.7 % 2,692,200 1,900,475 41.7 % 12,767 16,474 7,476
115

Metropolitan Transit Commission
Charlotte Area Transit System Ridership Report
Mar-22
Mode / Service Percent YTD YTD Percent Avg Daily Ridership per MonthMar-22 Mar-21 Increase/Decrease FY 2022 FY 2021 Increase/Decrease WeekDay Saturday Sunday
CityLynx Gold Line 41,849 - n/a 223,151 - n/a 1,402 1,603 796 Subtotal 431,283 209,692 105.7 % 2,915,351 1,900,475 53.4 % 14,169 18,077 8,272
Total 970,931 736,338 31.9 % 7,524,820 6,516,324 15.5 % 33,873 30,658 17,311
116

117
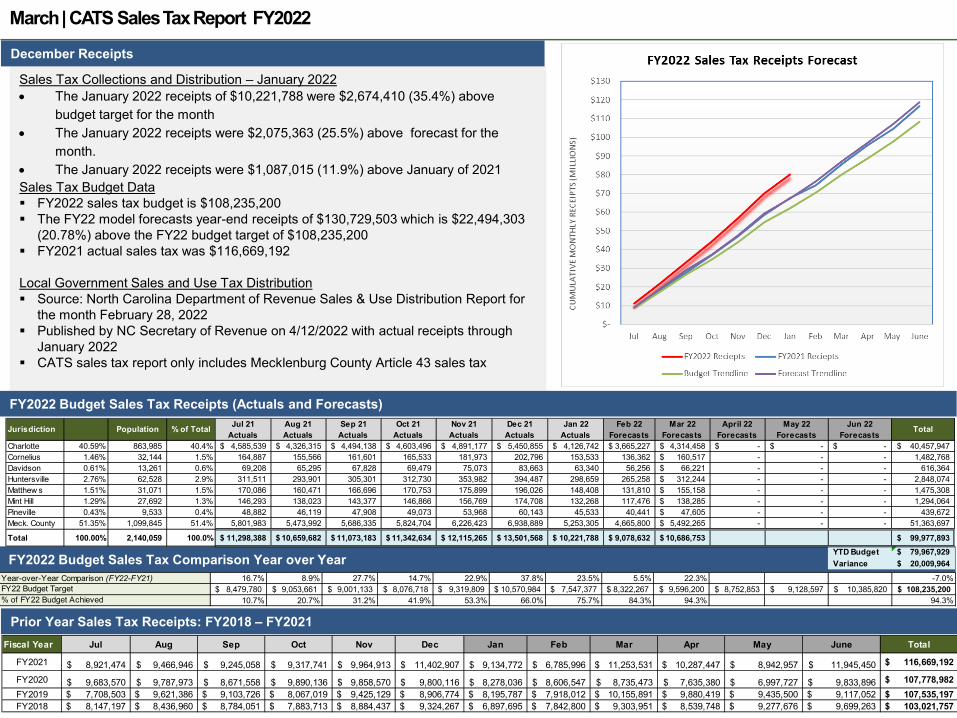
Sales Tax Collections and Distribution – January 2022• The January 2022 receipts of $10,221,788 were $2,674,410 (35.4%) above
budget target for the month• The January 2022 receipts were $2,075,363 (25.5%) above forecast for the
month.• The January 2022 receipts were $1,087,015 (11.9%) above January of 2021Sales Tax Budget Data FY2022 sales tax budget is $108,235,200 The FY22 model forecasts year-end receipts of $130,729,503 which is $22,494,303
(20.78%) above the FY22 budget target of $108,235,200 FY2021 actual sales tax was $116,669,192
Local Government Sales and Use Tax Distribution Source: North Carolina Department of Revenue Sales & Use Distribution Report for
the month February 28, 2022 Published by NC Secretary of Revenue on 4/12/2022 with actual receipts through
January 2022 CATS sales tax report only includes Mecklenburg County Article 43 sales tax
FY2022 Budget Sales Tax Receipts (Actuals and Forecasts)
Prior Year Sales Tax Receipts: FY2018 – FY2021
March | CATS Sales Tax Report FY2022
December Receipts
FY2022 Budget Sales Tax Comparison Year over Year
Fiscal Year Jul Aug Sep Oct Nov Dec Jan Feb Mar Apr May June Total
FY2021 8,921,474$ 9,466,946$ 9,245,058$ 9,317,741$ 9,964,913$ 11,402,907$ 9,134,772$ 6,785,996$ 11,253,531$ 10,287,447$ 8,942,957$ 11,945,450$ 116,669,192$
FY2020 9,683,570$ 9,787,973$ 8,671,558$ 9,890,136$ 9,858,570$ 9,800,116$ 8,278,036$ 8,606,547$ 8,735,473$ 7,635,380$ 6,997,727$ 9,833,896$ 107,778,982$ FY2019 7,708,503$ 9,621,386$ 9,103,726$ 8,067,019$ 9,425,129$ 8,906,774$ 8,195,787$ 7,918,012$ 10,155,891$ 9,880,419$ 9,435,500$ 9,117,052$ 107,535,197$ FY2018 8,147,197$ 8,436,960$ 8,784,051$ 7,883,713$ 8,884,437$ 9,324,267$ 6,897,695$ 7,842,800$ 9,303,951$ 8,539,748$ 9,277,676$ 9,699,263$ 103,021,757$
16.7% 8.9% 27.7% 14.7% 22.9% 37.8% 23.5% 5.5% 22.3% -7.0%8,479,780$ 9,053,661$ 9,001,133$ 8,076,718$ 9,319,809$ 10,570,984$ 7,547,377$ 8,322,267$ 9,596,200$ 8,752,853$ 9,128,597$ 10,385,820$ 108,235,200$
10.7% 20.7% 31.2% 41.9% 53.3% 66.0% 75.7% 84.3% 94.3% 94.3%FY22 Budget Target% of FY22 Budget Achieved
Year-over-Year Comparison (FY22-FY21)
Jurisdiction Population % of Total Jul 21Actuals
Aug 21Actuals
Sep 21Actuals
Oct 21 Actuals
Nov 21Actuals
Dec 21Actuals
Jan 22Actuals
Feb 22Forecasts
Mar 22Forecasts
April 22Forecasts
May 22Forecasts
Jun 22Forecasts
Total
Charlotte 40.59% 863,985 40.4% 4,585,539$ 4,326,315$ 4,494,138$ 4,603,496$ 4,891,177$ 5,450,855$ 4,126,742$ 3,665,227$ 4,314,458$ -$ -$ -$ 40,457,947$ Cornelius 1.46% 32,144 1.5% 164,887 155,566 161,601 165,533 181,973 202,796 153,533 136,362 160,517$ - - - 1,482,768 Davidson 0.61% 13,261 0.6% 69,208 65,295 67,828 69,479 75,073 83,663 63,340 56,256 66,221$ - - - 616,364 Huntersville 2.76% 62,528 2.9% 311,511 293,901 305,301 312,730 353,982 394,487 298,659 265,258 312,244$ - - - 2,848,074 Matthew s 1.51% 31,071 1.5% 170,086 160,471 166,696 170,753 175,899 196,026 148,408 131,810 155,158$ - - - 1,475,308 Mint Hill 1.29% 27,692 1.3% 146,293 138,023 143,377 146,866 156,769 174,708 132,268 117,476 138,285$ - - - 1,294,064 Pineville 0.43% 9,533 0.4% 48,882 46,119 47,908 49,073 53,968 60,143 45,533 40,441 47,605$ - - - 439,672 Meck. County 51.35% 1,099,845 51.4% 5,801,983 5,473,992 5,686,335 5,824,704 6,226,423 6,938,889 5,253,305 4,665,800 5,492,265$ - - - 51,363,697
Total 100.00% 2,140,059 100.0% 11,298,388$ 10,659,682$ 11,073,183$ 11,342,634$ 12,115,265$ 13,501,568$ 10,221,788$ 9,078,632$ 10,686,753$ 99,977,893$ YTD Budget 79,967,929$ Variance 20,009,964$

119
Related Documents


