Ingenious News Issue 2 April 2015 www.palsystem.com Determination of C2-C12 aldehydes in water by SPME Arrow on-fiber deri- vatization and GC/MS page 2 New LC-GC application systems for the analysis of food and food contaminants page 6 Automated SPE clean-up of QuEChERS extracts for multi-residue pesticide analysis page 8

Welcome message from author
This document is posted to help you gain knowledge. Please leave a comment to let me know what you think about it! Share it to your friends and learn new things together.
Transcript

IngeniousNewsIssue 2April 2015
www.palsystem.com
Determination of C2-C12 aldehydes in water by SPME Arrow on-fiber deri-vatization and GC/MS
page 2
New LC-GC application systems for the analysis of food and food contaminants
page 6
Automated SPE clean-up of QuEChERS extracts for multi-residue pesticide analysis
page 8

2 IngeniousNews 02/2015
Determination of C2-C12 aldehydes in water by SPME on-fiber derivatization and GC/MS
Peter Egli1, Beat Schilling1, Guenter Boehm2
1 BGB Analytik AG, Adliswil, Switzerland, 2 CTC Analytics AG, Zwingen, Switzerland
Aldehydes
Aldehydes are widely found in nature. Natural sources for aldehydes are, e. g., the alcoholic fermentation, lipid oxidation or atmospheric processes. Aldehydes have also been identified as by-products of drinking water disinfec-tion, particularly ozonation. The primary aldehydes that have been measured are formaldehyde, acetaldehyde, glyoxal, and methyl glyoxal, but aldehydes with higher molecular weights have also been reported. Total aldehyde concen-trations in drinking water disinfected with ozone range from less than 5 μg/L to 300 μg/L.
Some aldehydes are important flavor compounds, in some cases unde-sirable off flavors. The formation of aldehydes is a major contributor to the deterioration in flavor of beer upon storage. Certain aldehydes have extremely low odor thresholds, such as (E)-alkenals or (E,E)-alkadienals. The means to detect the presence of such compounds is therefore important for a large variety of food samples as they contribute considerably to flavor quality or cause off-flavors, such as the known cardboard note in beer or packaging materials.
A non-natural source of aldehydes in food, particularly beverages is the wide-spread use of polyethylene terephthal-ate (PET) containers. It is assumed that aldehydes are formed during the
production of the PET container and then slowly released into the food.
Furthermore, aldehydes are considered as markers for enhanced oxidative stress in biological systems, and have also been proposed as a diagnostic marker of cancer status.
Although no legislation has been established for their control, the World Health Organisation has published a drinking water guideline value of 900 μg/L for formaldehyde.
In order to monitor treatment prac-tices, assess exposure to consumers, and control health risks that might be associated with this class of by-prod-ucts, a reliable and sensitive monitoring method is required.
SPME with on-fiber derivatization
Since a publication by Martos and Pawliszyn in 1998 (ref.1) a significant number of publications on this topic have appeared, dealing with environ-mental, clinical, flavor, and chemical topics. Procedures for a wide range of analytes have been established apply-ing both headspace and immersion derivatization.
Here we describe the on SPME fiber derivatization and subsequent anal-ysis of a number of aldehydes with O-(2,3,4,5,6-pentafluorobenzyl)- hy-droxylamine hydrochloride (PFBHA) in aqueous solution to form pentafluoro-benzyl oxime derivatives (Fig. 1).PFBHA reacts quantitatively, even with conjugated aliphatic aldehydes.
SPME fiber max. 0.6 µL sorption phase
SPME Arrow max. 15.3 µL sorption phase
Arrow shaped tip foreasy penetration of septa
Figure 2: PAL SPME Arrow compared to a conventional SPME fiber. Size and position of the sorptive phases
are shown in red.
OR
R
FF
FF
F C NH2OH2 +
FF
FF
F C NOH2
R
R+ H2O
Figure 1: Reaction of O-(2,3,4,5,6-pentafluorobenzyl)- hydroxylamine hydrochloride (PFBHA) with aldehydes and
ketones in aqueous solution

3IngeniousNews 02/2015
The resulting oximes (E- and Z-iso-mers) do not decompose at elevated temperatures, neither do they require a time-consuming clean-up step and can easily be resolved by GC. The detection is achieved by either electron capture, thermionic or mass-selective detec-tion. EPA method 556 is based on this reaction, but applying derivatization in solution rather than on-fiber.
The SPME “fibers” used in this work are PAL SPME Arrows. Besides the greatly improved mechanical stability SPME Arrows feature a much larger surface area/sorption phase volume than SPME fibers, which is beneficial for achieving good sensitivities (Fig. 2,4).
Experimental
Chemicals:
Water:Sartorius arium ultrapure with UV lamp (water according to ISO 3696), further purified by heating to 90°C for 60 minAldehydes analyzed:Acetaldehyd (C2), propanal (C3), bu-tanal (C4), hexanal (C6), heptanal (C7), octanal (C8), nonanal (C9), decanal (C10), undecanal (C11), dodecanal (C12), (Fluka, puriss. purity > 99%)
Internal standard (Int Std):10 μl 2,3,5,6-Tetrafluorobenzaldehyd (Fluka 328936, purity > 97%) in 10 ml methanol (Carlo Erba HPLC Grade, 412383)
Derivatization reagent:100 mg PFBOA O-(2,3,4,5,6-Pentaflu-orobenzyl)hydroxylamin hydrochlorid (Fluka 76735, purity > 99%) dissolved in 10 ml 0.05 M H2SO4 (Fluka, purity > 90%), further purified by heating to 90°C for 60 min
Procedure:
The SPME Arrow is dipped into the derivatizating reagent (s. above). Then the fiber is exposed for 30 min to the headspace of a 5 mL water sample (60°C) in a 20 mL headspace vial.
Extraction/derivatization conditions: Sampling Tool: PAL SPME
Arrow 1.15 mm diameter
Phase type: PDMSPhase length: 20 mmPhase thickness: 100 μmPre conditioning: 0:30 minPre incubation time: 1:00 minIncubation temp: 60°CAgitation speed: 500 rpmNeedle penetration: 22 mmFiber penetration: 30 mmExtraction time: 30:00 minDesorption time: 2:00 min
Analytical conditions:
GC: Varian 3400MS: Varian Saturn Ion
TrapColumn: 30 m x 0.25 mm
0.25 μm BGB-5Carrier gas: Hydrogen 5.0 psiTemp. program: 70°C for 1min, then
5°C/min > 280°CInjector: PI 250°C, isothermalMass range: 75 - 230 m/z
Figure 3: Optimization of extraction/reaction time, reaction temperature was 60°C. Note that the reaction yields
stereoisomers, hence the doublets in the chromatogram.
Figure 4: PAL SPME Arrow Tool for PAL RTC
and PAL RSI.
4 IngeniousNews 02/2015
Results:
Reaction conditions:
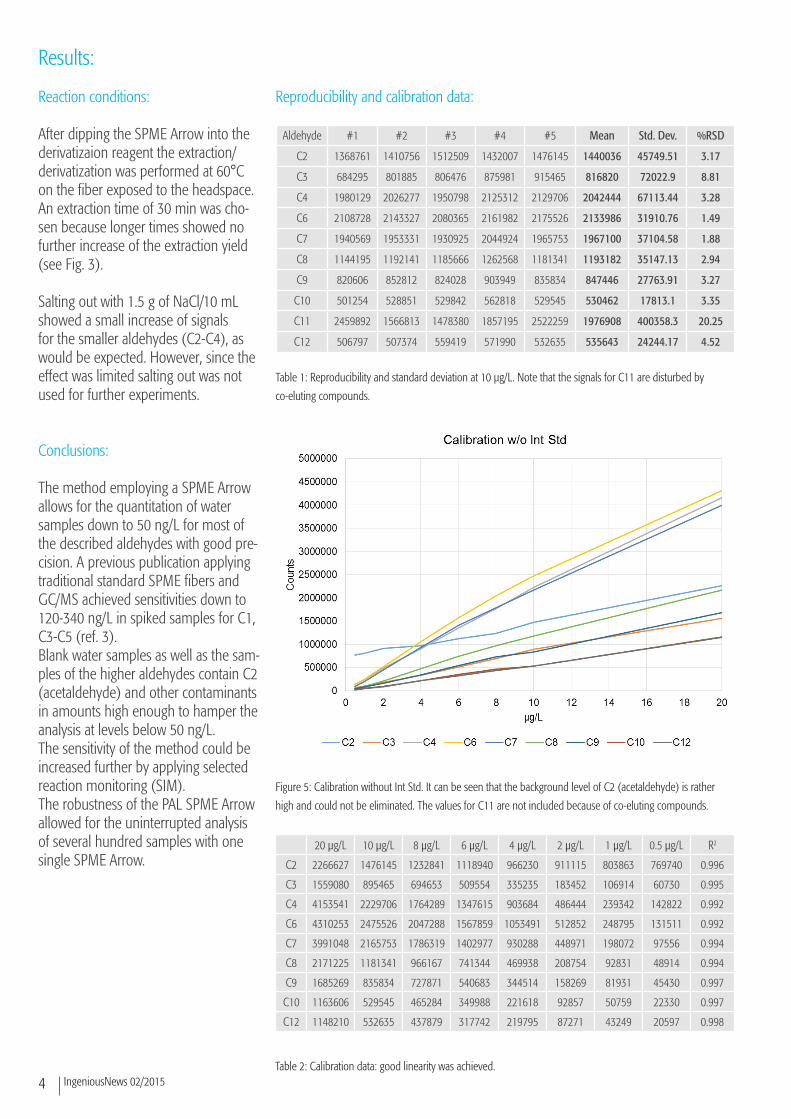
After dipping the SPME Arrow into the derivatizaion reagent the extraction/derivatization was performed at 60°C on the fiber exposed to the headspace. An extraction time of 30 min was cho-sen because longer times showed no further increase of the extraction yield (see Fig. 3).
Salting out with 1.5 g of NaCl/10 mL showed a small increase of signals for the smaller aldehydes (C2-C4), as would be expected. However, since the effect was limited salting out was not used for further experiments.
Conclusions:
The method employing a SPME Arrow allows for the quantitation of water samples down to 50 ng/L for most of the described aldehydes with good pre-cision. A previous publication applying traditional standard SPME fibers and GC/MS achieved sensitivities down to 120-340 ng/L in spiked samples for C1, C3-C5 (ref. 3).Blank water samples as well as the sam-ples of the higher aldehydes contain C2 (acetaldehyde) and other contaminants in amounts high enough to hamper the analysis at levels below 50 ng/L.The sensitivity of the method could be increased further by applying selected reaction monitoring (SIM).The robustness of the PAL SPME Arrow allowed for the uninterrupted analysis of several hundred samples with one single SPME Arrow.
Aldehyde #1 #2 #3 #4 #5 Mean Std. Dev. %RSD
C2 1368761 1410756 1512509 1432007 1476145 1440036 45749.51 3.17
C3 684295 801885 806476 875981 915465 816820 72022.9 8.81
C4 1980129 2026277 1950798 2125312 2129706 2042444 67113.44 3.28
C6 2108728 2143327 2080365 2161982 2175526 2133986 31910.76 1.49
C7 1940569 1953331 1930925 2044924 1965753 1967100 37104.58 1.88
C8 1144195 1192141 1185666 1262568 1181341 1193182 35147.13 2.94
C9 820606 852812 824028 903949 835834 847446 27763.91 3.27
C10 501254 528851 529842 562818 529545 530462 17813.1 3.35
C11 2459892 1566813 1478380 1857195 2522259 1976908 400358.3 20.25
C12 506797 507374 559419 571990 532635 535643 24244.17 4.52
Table 1: Reproducibility and standard deviation at 10 μg/L. Note that the signals for C11 are disturbed by
co-eluting compounds.
Reproducibility and calibration data:
Figure 5: Calibration without Int Std. It can be seen that the background level of C2 (acetaldehyde) is rather
high and could not be eliminated. The values for C11 are not included because of co-eluting compounds.
20 μg/L 10 μg/L 8 μg/L 6 μg/L 4 μg/L 2 μg/L 1 μg/L 0.5 μg/L R2
C2 2266627 1476145 1232841 1118940 966230 911115 803863 769740 0.996
C3 1559080 895465 694653 509554 335235 183452 106914 60730 0.995
C4 4153541 2229706 1764289 1347615 903684 486444 239342 142822 0.992
C6 4310253 2475526 2047288 1567859 1053491 512852 248795 131511 0.992
C7 3991048 2165753 1786319 1402977 930288 448971 198072 97556 0.994
C8 2171225 1181341 966167 741344 469938 208754 92831 48914 0.994
C9 1685269 835834 727871 540683 344514 158269 81931 45430 0.997
C10 1163606 529545 465284 349988 221618 92857 50759 22330 0.997
C12 1148210 532635 437879 317742 219795 87271 43249 20597 0.998
Table 2: Calibration data: good linearity was achieved.

5IngeniousNews 02/2015
Figure 6: Reproducibility and siganl/noise (s/n) ratios of the different aldehydes at 160 ng/L
Figure 7: Sample @ 160 ng/L (orange) compared to a blank water sample (green).
References: [1] Sampling and Determination of Formaldehyde Using SPME with On-Fiber Derivatization. P. Martos, J. Pawliszyn; Anal. Chem. 1998, 70, 2311-2320.
[2] Determination of aldehydes in drinking water using penta-fluorobenzylhydroxylamine derivat-ization and solid-phase microextraction. F.Ventura, B. Cancho, M. T. Galceran; J. Chromato-gr. A. 2002, 943, 1-13.
[3] Analysis of aldehydes in water by solid-phase microextraction with on-fiber derivatization. S.W. Tsai, C.M. Chang; J. Chromatogr. A. 2003, 1015, 143.
[4] Evaluation of solid-phase microextraction meth-ods for the determination of trace concentration aldehydes in aqueous solution. J. Beranek, A. Kubatova; J. Chromatogr. A. 2008, 1209, 44-54.

6 IngeniousNews 02/2015
New LC-GC application systems for the analysis of food and food contaminants
Introduction
Over the last years a number of food scares have attracted the attention of a wider public. Foodstuffs have been found to contain mineral oil residues, which originate in many cases from the packaging materials. A migration of hydrocarbons into the foodstuffs can occur in particular through the use of printing inks containing mineral oils. This effect is more pronounced with re-cycled packaging, but also found when using packaging containing fresh fibres. The prerequisite for this migration is unhindered contact between food and packaging, as is the case with a large number of foodstuffs such as rice, for example.
A number of products have been found to contain elevated levels of mineral oil saturated hydrocar-bons (MOSHs) and mineral oil aromatic hydrocarbons (MOAHs). These hydro-carbons lie mainly in the boiling range
between C10 and C30 and are consid-ered to be particularly migration-inten-sive.In many countries authorities have meanwhile issued recommendations as to control foodstuffs for the levels of MOSH/MOAH and to take actions limiting the transfer of mineral oils into foodstuffs. Regular analyses for MOSH/MOAH are advised. In 2011 an inter-national symposium highlighted this problem (read more - QR-code at the end of the article). Since then, special attention has been paid to the detection of these contami-nations in foodstuffs.Food samples are a complex matrix and therefore a high chromatographic resolving power is required in order to analyse for MOSH/MOAH. Grob et al. (Kantonales Labor Zurich, Switzerland, refs.1,2) pioneered the application of a LC-GC coupling (LC-GC) for analysing MOSH/MOAH in food. With LC-GC the sample is separated by LC (most often normal phase LC). Fractions of the LC eluate are then injected into a GC by a large volume on-column injection.
A recent review of LC-GC applications for the analysis of mineral oil contami-nations is avaliable (ref.3).
Axel Semrau® has developed LC-GC application systems not only for the analysis of MOSH/MOAH, but also for sterols (e.g. quality control of edible oils) and polyaromatic hydrocarbons (PAHs). The Axel Semrau® system achieves reproducibilities comparable to normal split/splitless injections in a GC. The system detects concentrations down to 0.6 mg MOSH/kg. The linearity covers the entire range of concentrations of MOSHs relevant to food quality.The direct coupling drastically reduces the risk of contaminations, which is very high with manual methods.The particular highlight of the system is its equipment with two FIDs, allowing the parallel measurement of MOSHs and MOAHs in a single pass. This dou-bles the sample throughput and halves solvent consumption. The PAL RTC’s unique capability to change tools auto-matically raises the productivity further,
e.g. by changing between syringes for the injection and addition of an internal standard.
The LC-GC solutions from Axel Semrau® are preassembled in
the application laboratory, tested and delivered to the user ready for operation. This ensures the fastest possible
commencement of routine measur-ing operations.
Figure 1: The new LC-GC system based on the PAL RTC
7IngeniousNews 02/2015
Advantages of the LC-GC application system
• High sample throughput• High degree of automation, high
productivity• No risk of contamination• Excellent reproducibility, optimum
sensitivity• Investment safety, the system can
be expanded for further applications
Further information on the LC-GC sys-tems presented here can be found at:(read more - in German, QR-code at the end of the article)
International customers will find the nearest PAL System representative here:http://www.palsystem.com/index.php?id=138
Sample chromatogram
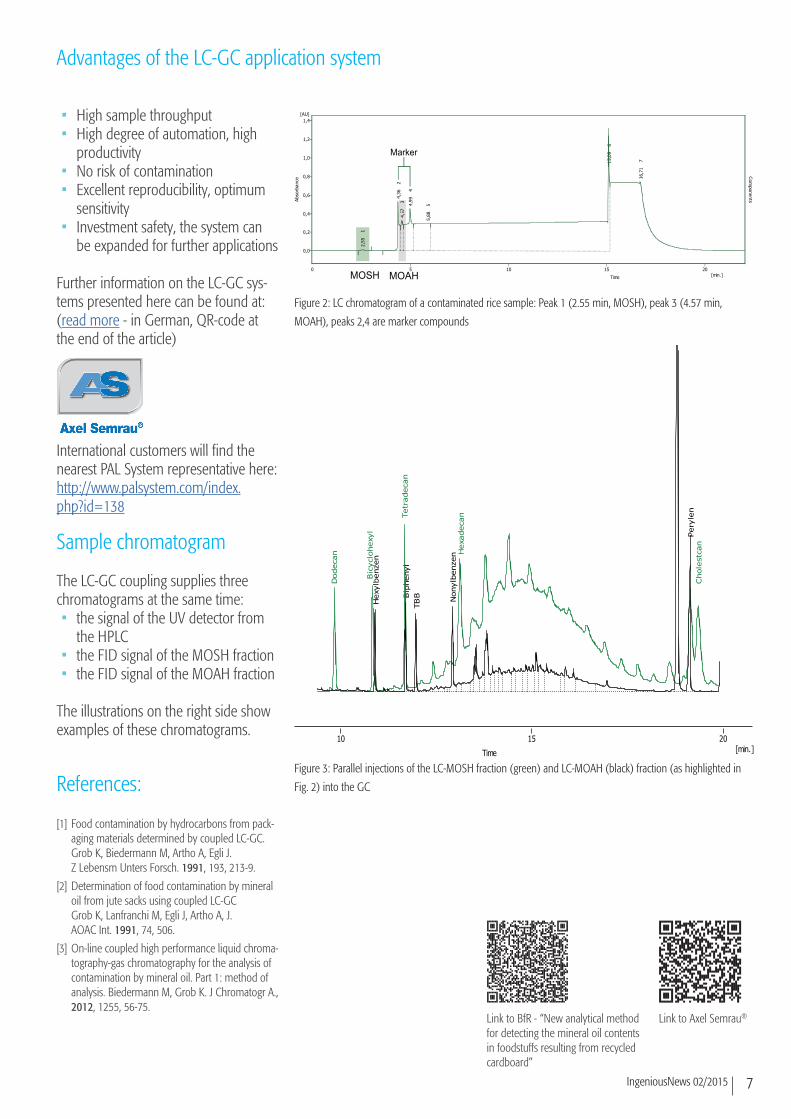
The LC-GC coupling supplies three chromatograms at the same time:• the signal of the UV detector from
the HPLC• the FID signal of the MOSH fraction• the FID signal of the MOAH fraction
The illustrations on the right side show examples of these chromatograms.
References:
[1] Food contamination by hydrocarbons from pack-aging materials determined by coupled LC-GC.Grob K, Biedermann M, Artho A, Egli J. Z Lebensm Unters Forsch. 1991, 193, 213-9.
[2] Determination of food contamination by mineral oil from jute sacks using coupled LC-GC Grob K, Lanfranchi M, Egli J, Artho A, J. AOAC Int. 1991, 74, 506.
[3] On-line coupled high performance liquid chroma-tography-gas chromatography for the analysis of contamination by mineral oil. Part 1: method of analysis. Biedermann M, Grob K. J Chromatogr A., 2012, 1255, 56-75.
[min.]Time
0 5 10 15 20
[AU]
Abs
orba
nce
0,0
0,2
0,4
0,6
0,8
1,0
1,2
1,4
Com
ponents
2,55
1
4,36
2
4,57
3 4,99
4
5,88
5
15,0
9
6
16,7
1
7
MOSH
Marker
MOAH
4,57
3
Figure 2: LC chromatogram of a contaminated rice sample: Peak 1 (2.55 min, MOSH), peak 3 (4.57 min,
MOAH), peaks 2,4 are marker compounds
[min.]Time
10 15 20
Dodeca
n
Tetr
adeca
n
Hexa
deca
n
Chole
stca
n
Bic
ycl
ohexy
l
Hexy
lbenze
n
Bip
henyl
TB
B
N
onylb
enze
n
Pery
len
Figure 3: Parallel injections of the LC-MOSH fraction (green) and LC-MOAH (black) fraction (as highlighted in
Fig. 2) into the GC
Link to Axel Semrau®Link to BfR - “New analytical method for detecting the mineral oil contents in foodstuffs resulting from recycled cardboard”

8 IngeniousNews 02/2015
Automated SPE clean-up of QuEChERS extracts for multi-residue pesticide analysis
Bruce Morris and Richard Schriner.RJ Hill Laboratories Ltd, Hamilton, New Zealand.
Introduction
The QuEChERS (Quick, Easy, Cheap, Effective, Rugged, Safe, s. ref. 1) method for extraction of pesticides from fruits and vegetables has become widely used by commercial testing laboratories worldwide, due to its simplicity and applicability to a wide range of sample-types and pesticide chemistries. Typi-cally, dispersive solid-phase extraction (dSPE) is used to clean up acetonitrile extracts prior to LC-MS/MS analysis, using mixtures of primary-secondary amine and C-18 functionalized silicas, with graphitized carbon black (MgSO4/PSA/C-18/GCB), to remove matrix sugars, oils and pigments. Column SPE (cSPE) is generally accepted as giving improved removal of sample matrix, however it is more time consuming, and costly. This note covers the develop-ment and use of miniaturized cSPE for QuEChERS, using Instrument Top Sam-ple Prep (ITSP, http://www.itspsolutions.com/ ) cartridges (Figure 1), automated on a PAL System autosampler.
This allows high-throughput cSPE clean-up on an LC-MS/MS instrument, in place of dSPE in the laboratory, reduc-ing time, cost and solvent usage.
Oily extracts are often poorly cleaned up by dSPE using MgSO4/PSA/C-18/GCB, giving rise to cloudy extracts when aqueous buffer is added for LC-MS/MS injection, contamination of the LC system and possible losses of non-polar pesticides into oil droplets. Therefore, ITSP sorbent mixtures and unique elu-tion solvents were developed to allow effective removal of oils and some pigments, with acceptable recoveries for a suite of 274 pesticide analytes.
QuEChERS-ITSP Automation
SPE clean-up of QuEChERS extracts is undertaken in scavenging mode, where unwanted matrix is retained by the sorbent, and pesticide analytes are recovered. To enable this on a PAL Sys-tem autosampler, extracts are loaded onto and eluted from cartridges sitting directly on 2-mL vials with split-sep-ta caps, and both load and elution volumes collected. The cartridge tips are able to pass through the split-septa into the vials, while still providing a seal against solvent evaporation. An aluminum cover for the 54-well tray holds the cartridges vertically in place between load and elution steps, and allows the cartridges to be removed from the vials at the end of the SPE cycle, without lifting the vials from the tray (Figures 2 and 3).
The PAL System unit provides the ability to use low flow-rates (2 μL/min) which avoids high back-pressures, and gives some degree of chromatography on the cartridge sorbent bed.
Septum
NeedleGuide
Sorbentbed
Figure 1: ITSP SPE cartdrige
Figure 2: Aluminum cover for 54-well vial tray, with
ITSP cartridge positioned over vial.
Figure 3: Elution of QuEChERS extract through an
ITSP cartrdidge, using the aluminum tray cover.

9IngeniousNews 02/2015
QuEChERS-ITSP Method and Instrumentation
Autosampler: PAL RTC (or PAL-xt), fitted with HW-KITQ hardware kit.LC-MS/MS: Sciex Triple Quad 5500, positive ESI, with an Agilent 1200
pump.HPLC column: Ascentis Express C-18, 10 cm × 2.1 mm, 2.7μm particles
(Supelco).Injection volume: 10 μLColumn Temp.: 50 °CSolvent A: 10mM ammonium formate (pH = 4)/MeOH (9:1).Solvent B: MeOHGradient: Total Time
(min)Flow Rate (μl/min)
A (%) B (%)
0.0 400 87.5 12.50.5 400 87.5 12.52.0 400 60.0 40.08.0 400 37.3 62.714.0 400 5.0 95.016.0 400 5.0 95.016.5 400 87.5 12.518.5 400 87.5 12.5
Table 1: LC-MS/MS instrument parameters.
Condition c-SPE ITSP cartridgewith elution solution
Load QuEChERS extract ontocartridge at 2 µL/min, collectingthe eluent.
Elute with elution solution at2 µL/min, collecting eluent.
Dilute combined eluent 5-foldwith aqueous buffer solutionfor LC-MS/MS.
Figure 4: QuEChERS-ITSP steps.
Figure 5: LC-MS/MS chromatogram for a 0.02 mg/kg spike of pesticides, cleaned up by ITSP.
10 IngeniousNews 02/2015
Effectiveness of extract clean-up
Avocado was chosen to represent samples containing high levels of lipids, with up to 30% by weight of mono-, di- and triacylglyerides, free fatty acids, sterols and tocopherols. An extract was obtained using the European Commit-tee for Standardization (CEN) QuECh-ERS method, with citrate buffering, and a 1:2 ratio of blended fruit to acetoni-trile (5 g of fruit, 10 mL of acetonitrile).
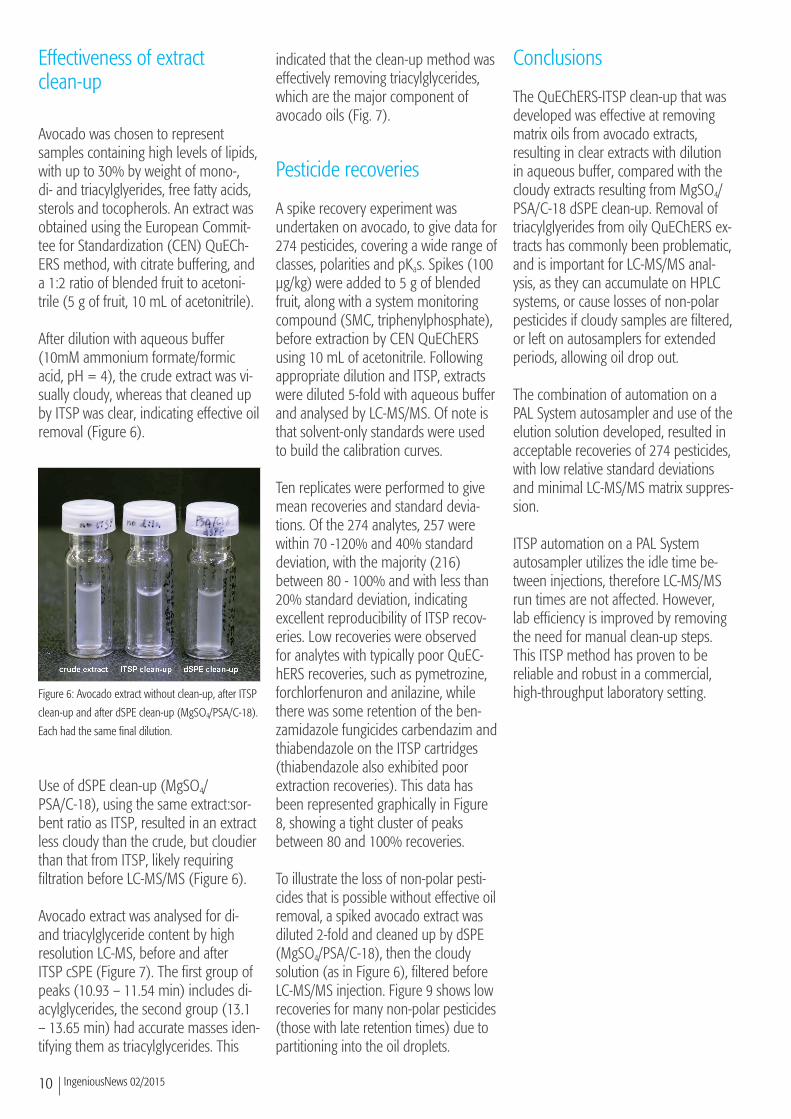
After dilution with aqueous buffer (10mM ammonium formate/formic acid, pH = 4), the crude extract was vi-sually cloudy, whereas that cleaned up by ITSP was clear, indicating effective oil removal (Figure 6).
Use of dSPE clean-up (MgSO4/PSA/C-18), using the same extract:sor-bent ratio as ITSP, resulted in an extract less cloudy than the crude, but cloudier than that from ITSP, likely requiring filtration before LC-MS/MS (Figure 6).
Avocado extract was analysed for di- and triacylglyceride content by high resolution LC-MS, before and after ITSP cSPE (Figure 7). The first group of peaks (10.93 – 11.54 min) includes di-acylglycerides, the second group (13.1 – 13.65 min) had accurate masses iden-tifying them as triacylglycerides. This
indicated that the clean-up method was effectively removing triacylglycerides, which are the major component of avocado oils (Fig. 7).
Pesticide recoveries
A spike recovery experiment was undertaken on avocado, to give data for 274 pesticides, covering a wide range of classes, polarities and pKas. Spikes (100 μg/kg) were added to 5 g of blended fruit, along with a system monitoring compound (SMC, triphenylphosphate), before extraction by CEN QuEChERS using 10 mL of acetonitrile. Following appropriate dilution and ITSP, extracts were diluted 5-fold with aqueous buffer and analysed by LC-MS/MS. Of note is that solvent-only standards were used to build the calibration curves.
Ten replicates were performed to give mean recoveries and standard devia-tions. Of the 274 analytes, 257 were within 70 -120% and 40% standard deviation, with the majority (216) between 80 - 100% and with less than 20% standard deviation, indicating excellent reproducibility of ITSP recov-eries. Low recoveries were observed for analytes with typically poor QuEC-hERS recoveries, such as pymetrozine, forchlorfenuron and anilazine, while there was some retention of the ben-zamidazole fungicides carbendazim and thiabendazole on the ITSP cartridges (thiabendazole also exhibited poor extraction recoveries). This data has been represented graphically in Figure 8, showing a tight cluster of peaks between 80 and 100% recoveries.
To illustrate the loss of non-polar pesti-cides that is possible without effective oil removal, a spiked avocado extract was diluted 2-fold and cleaned up by dSPE (MgSO4/PSA/C-18), then the cloudy solution (as in Figure 6), filtered before LC-MS/MS injection. Figure 9 shows low recoveries for many non-polar pesticides (those with late retention times) due to partitioning into the oil droplets.
Conclusions
The QuEChERS-ITSP clean-up that was developed was effective at removing matrix oils from avocado extracts, resulting in clear extracts with dilution in aqueous buffer, compared with the cloudy extracts resulting from MgSO4/PSA/C-18 dSPE clean-up. Removal of triacylglyerides from oily QuEChERS ex-tracts has commonly been problematic, and is important for LC-MS/MS anal-ysis, as they can accumulate on HPLC systems, or cause losses of non-polar pesticides if cloudy samples are filtered, or left on autosamplers for extended periods, allowing oil drop out.
The combination of automation on a PAL System autosampler and use of the elution solution developed, resulted in acceptable recoveries of 274 pesticides, with low relative standard deviations and minimal LC-MS/MS matrix suppres-sion.
ITSP automation on a PAL System autosampler utilizes the idle time be-tween injections, therefore LC-MS/MS run times are not affected. However, lab efficiency is improved by removing the need for manual clean-up steps. This ITSP method has proven to be reliable and robust in a commercial, high-throughput laboratory setting.
Figure 6: Avocado extract without clean-up, after ITSP
clean-up and after dSPE clean-up (MgSO4/PSA/C-18).
Each had the same final dilution.

11IngeniousNews 02/2015
Figure 7: High resolution LC-MS chromatograms for crude avocado extract and the same extract diluted 2-fold
then cleaned up by ITSP. Final dilutions were the same for both prior to injection. Chromatograms have the
same y-axis scale.
Figure 8: Percent recoveries versus percent standard deviations for 100 μg/kg spikes of 274 pesticide analytes
on avocado, extracted by CEN QuEChERS, cleaned up by ITSP and analysed by LC-MS/MS. Calibrated against
solvent-only standards, normalized to triphenylphosphate, N = 10.
Figure 9: Percent pesticide recoveries versus LC-MS/MS retention times, for a 50 μg/kg spike on avocado, ext-
racted by CEN QuEChERS, diluted 2-fold, cleaned up by dSPE (MgSO4/PSA/C-18), diluted 5-fold with aqueous
buffer, then filtered (0.4 μm cellulose syringe filter) before analysis. Calibrated against solvent-only standards.
References:
[1] Fast and Easy Multiresidue Method Employing Acetonitrile Extraction/Partitioning and “Disper-sive Solid-Phase Extraction” for the Determination of Pesticide Residues in Produce, Anastassiades, M., S. J. Lehotay, Štajnbaher, D. and Schenck, F. J. Journal of AOAC International 2003, 86(2): 412-431.

www.palsystem.comVisit our homepage for more information.
Imprint
IngeniousNews 02/2015
Date of print: 04.2015
CTC Analytics AGIndustriestrasse 20CH-4222 ZwingenSwitzerland T +41 61 765 81 00F +41 61 765 81 99 Contact: [email protected]
Legal Statements
CTC Analytics AG reserves the right to make improvements and/or changes to the product(s) described in this document at any time without prior notice.
CTC Analytics AG makes no warranty of any kind pertaining to this product, including but not limited to implied warran-ties of merchantability and suitability for a particular purpose.
Under no circumstances shall CTC Analytics AG be held liable for any coincidental damage or damages arising as a con-sequence of or from the use of this document.
© 2015 CTC Analytics AG. All rights reserved. Neither this publication nor any part hereof may be copied, photocopied, reproduced, translated, distributed or reduced to electronic medium or machine readable form without the prior written permission from CTC Analytics AG, except as permitted under copyright laws.
CTC Analytics AG acknowledges all trade names and trademarks used as the property of their respective owners.
PAL is a registered trademark of CTC Analytics AG | Switzerland
Related Documents