& PPIC STATEWIDE SURVEY Californians Mark Baldassare Dean Bonner Lunna Lopes Sonja Petek supported with funding from the S. D. Bechtel, Jr. Foundation, The Dirk and Charlene Kabcenell Foundation, the Silver Giving Foundation, and the Stuart Foundation CONTENTS About the Survey 2 Press Release 3 Policy Preferences 6 Perceptions and Attitudes 13 Regional Map 24 Methodology 25 Questionnaire and Results 27 education APRIL 2015

Welcome message from author
This document is posted to help you gain knowledge. Please leave a comment to let me know what you think about it! Share it to your friends and learn new things together.
Transcript
&
ppic statewide survey
Californians Mark Baldassare
Dean Bonner
Lunna Lopes
Sonja Petek
supported with funding from
the S. D. Bechtel, Jr. Foundation, The Dirk and Charlene Kabcenell Foundation, the Silver Giving Foundation, and the Stuart Foundation
CONTENTS
About the Survey 2
Press Release 3
Policy Preferences 6
Perceptions and Attitudes 13
Regional Map 24
Methodology 25
Questionnaire and Results 27
education
A P R I L 2 0 1 5
ABOUT THE SURVEY
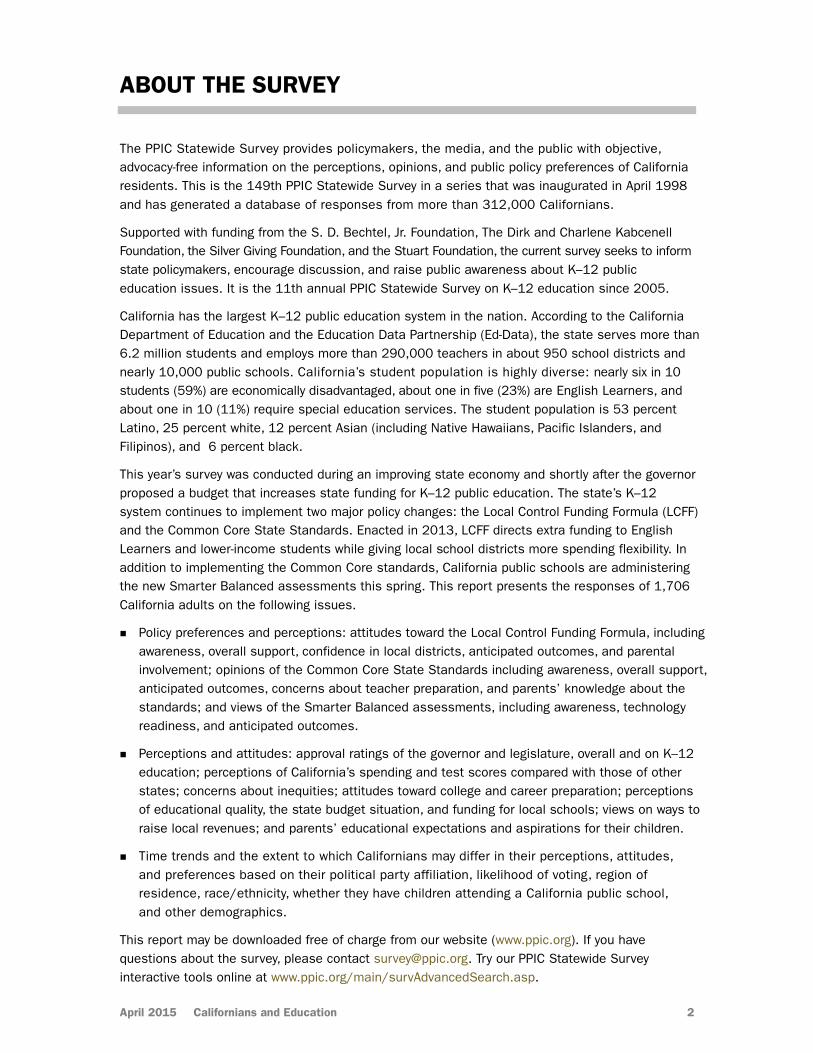
The PPIC Statewide Survey provides policymakers, the media, and the public with objective, advocacy-free information on the perceptions, opinions, and public policy preferences of California residents. This is the 149th PPIC Statewide Survey in a series that was inaugurated in April 1998 and has generated a database of responses from more than 312,000 Californians.
Supported with funding from the S. D. Bechtel, Jr. Foundation, The Dirk and Charlene Kabcenell Foundation, the Silver Giving Foundation, and the Stuart Foundation, the current survey seeks to inform state policymakers, encourage discussion, and raise public awareness about K–12 public education issues. It is the 11th annual PPIC Statewide Survey on K–12 education since 2005.
California has the largest K–12 public education system in the nation. According to the California Department of Education and the Education Data Partnership (Ed-Data), the state serves more than 6.2 million students and employs more than 290,000 teachers in about 950 school districts and nearly 10,000 public schools. California’s student population is highly diverse: nearly six in 10 students (59%) are economically disadvantaged, about one in five (23%) are English Learners, and about one in 10 (11%) require special education services. The student population is 53 percent Latino, 25 percent white, 12 percent Asian (including Native Hawaiians, Pacific Islanders, and Filipinos), and 6 percent black.
This year’s survey was conducted during an improving state economy and shortly after the governor proposed a budget that increases state funding for K–12 public education. The state’s K–12 system continues to implement two major policy changes: the Local Control Funding Formula (LCFF) and the Common Core State Standards. Enacted in 2013, LCFF directs extra funding to English Learners and lower-income students while giving local school districts more spending flexibility. In addition to implementing the Common Core standards, California public schools are administering the new Smarter Balanced assessments this spring. This report presents the responses of 1,706 California adults on the following issues.
Policy preferences and perceptions: attitudes toward the Local Control Funding Formula, including awareness, overall support, confidence in local districts, anticipated outcomes, and parental involvement; opinions of the Common Core State Standards including awareness, overall support, anticipated outcomes, concerns about teacher preparation, and parents’ knowledge about the standards; and views of the Smarter Balanced assessments, including awareness, technology readiness, and anticipated outcomes.
Perceptions and attitudes: approval ratings of the governor and legislature, overall and on K–12 education; perceptions of California’s spending and test scores compared with those of other states; concerns about inequities; attitudes toward college and career preparation; perceptions of educational quality, the state budget situation, and funding for local schools; views on ways to raise local revenues; and parents’ educational expectations and aspirations for their children.
Time trends and the extent to which Californians may differ in their perceptions, attitudes, and preferences based on their political party affiliation, likelihood of voting, region of residence, race/ethnicity, whether they have children attending a California public school, and other demographics.
This report may be downloaded free of charge from our website (www.ppic.org). If you have questions about the survey, please contact [email protected]. Try our PPIC Statewide Survey interactive tools online at www.ppic.org/main/survAdvancedSearch.asp.
April 2015 Californians and Education 2
PPIC
Statewide
Survey
CONTACT
Linda Strean 415-291-4412
Serina Correa 415-291-4417
NEWS RELEASE
EMBARGOED: Do not publish or broadcast until 9:00 p.m. PDT on Wednesday, April 22, 2105.
Para ver este comunicado de prensa en español, por favor visite nuestra página de internet: http://www.ppic.org/main/pressreleaseindex.asp
PPIC STATEWIDE SURVEY: CALIFORNIANS AND EDUCATION
Most Public School Parents Unfamiliar With New Online Tests HIGH HOPES BUT LITTLE KNOWLEDGE ABOUT COMMON CORE, NEW FUNDING FORMULA
SAN FRANCISCO, April 22, 2015—As California schools begin administering new online standardized tests, most public school parents say they have heard nothing about them, according to a statewide survey by the Public Policy Institute of California (PPIC).
A majority (55%) say they have heard nothing at all about the Smarter Balanced Assessment System, which replaces paper-based tests. The new tests are based on the Common Core math and English standards. About a third of public school parents (36%) have heard a little about the tests, and just 8 percent say they have heard a lot. Latino public school parents (54%) are much more likely than white parents (32%) to say they have heard about the tests.
While concerns have been raised about whether all schools have enough computers, bandwidth, and technology staff to effectively administer the online tests, most public school parents say they are very confident (29%) or somewhat confident (42%) that their local schools do.
Other states have found that the switch to the Common Core standards and new tests significantly reduced student scores. How do California public school parents expect students to score on the Smarter Balanced tests? A plurality (42%) predict that scores will be about the same as those on past tests, while 29 percent expect scores to be higher and 23 percent predict that they will be lower.
More generally, Californians are divided about whether standardized tests are accurate measures of a student’s progress and abilities, with 51 percent very or somewhat confident that this is true, and 46 percent not too confident or not at all confident. But few say there is too much testing in their local schools (24% too much in elementary and middle schools, 22% too much in high schools).
A year after the Common Core State Standards were implemented, 66 percent of public school parents have heard of them (43% a little, 23% a lot), while a third (32%) say they have heard nothing at all. White public school parents are nearly three times as likely as Latinos to say they have heard a lot (38% vs. 13%).
A third of public school parents (34%) say their child’s school or district has provided them with information about the Common Core standards and that this information has been adequate. But 20 percent say they have received inadequate information, and the largest share of parents (42%) say they received no information about the standards.
“Many public school parents are in the dark when it comes to Common Core," said Mark Baldassare, PPIC president and CEO. “Local schools need to do a better job of keeping parents informed as the state implements the new English and math standards.”
April 2015 Californians and Education 3
PPIC Statewide Survey
Based on what they’ve read and heard about Common Core, 47 percent of adults and 57 percent of public school parents favor the standards. There is a partisan divide, with Democrats (49%) much more likely to be in favor than independents (37%) or Republicans (30%).
Concerns have been raised about teachers’ readiness to teach the new standards—concerns that are shared by California adults (73% very or somewhat concerned) and public school parents (80% very or somewhat concerned). But Californians are optimistic that Common Core will meet two goals: Most (57%) are confident that implementing the standards will make students more college or career ready, and most (57%) are confident that the standards will help students develop critical thinking and problem solving skills. Public school parents express even higher levels of optimism (71% confident about each goal).
Baldassare summed up: “Most Californians are hopeful about the effect of Common Core on improving student achievement, but many worry that teachers are not fully prepared to implement these new standards in the classroom.”
Across racial/ethnic groups, Latinos are much more likely than other groups to express confidence that Common Core will make students more college and career ready (75% Latinos, 65% Asians, 58% blacks, 44% whites) and help students develop critical thinking and problem solving skills (77% Latinos, 60% blacks, 51% Asians, 45% whites). Yet Latinos are also the most likely to express concerns about teacher preparedness to implement the standards (80% Latinos, 79% blacks, 70% Asians, 67% whites).
MOST EXPECT NEW FUNDING FORMULA TO BOOST ACHIEVEMENT
As the state implements a new system for financing schools—the Local Control Funding Formula (LCFF)—most Californians say they have heard nothing about it (75% adults, 69% public school parents). Across racial/ethnic groups, Latinos (30%) are the most likely to have heard a little or a lot about the LCFF, followed by Asians (27%), blacks (20%), and whites (19%).
When they are read a brief description of the LCFF, strong majorities of adults (70%) and public school parents (73%) favor it. Among those who have heard at least a little about the LCFF, 75 percent favor it.
The LCFF allocates extra money to districts with more English Learners and lower-income students. Californians have long expressed the view in PPIC surveys that school districts in lower-income areas of the state lack the same resources—including good teachers and classroom materials—as those in wealthier areas. Today, 82 percent hold this view, which is consistent with their support of the LCFF. A majority (59%) also say they are very concerned that students in lower-income areas are less likely than other students to be ready for college when they finish high school. About half of Californians (48%) say they are very concerned that English Learners score lower on standardized tests than other students.
The LCFF allows local districts more control over spending decisions, and it gives additional funding to districts with more lower-income students and English Learners. How confident are Californians that districts receiving the extra money will spend it to support these students? Most adults (56%) are at least somewhat confident, and public school parents (66%) are especially likely to express this view. Will the LCFF improve academic achievement of English Learners and lower-income students? Strong majorities of adults (68%) and public school parents (78%) say it will, at least somewhat. Latinos (85%) are much more likely to expect improvement than Asians (67%), blacks (62%), and whites (59%).
The LCFF requires each school district to get input from parents in designing a Local Control Accountability Plan. While 42 percent of public school parents say they were given information about how to get involved, most (54%) say they did not receive any. Lower-income parents (51% of those with household incomes under $40,000) were much more likely than wealthier parents (37% of those with incomes of $40,000 or more) to say their child’s school or district provided them with information.
April 2015 Californians and Education 4
PPIC Statewide Survey
Among the parents who received information about participating, most (72%) say they were not involved in the process. Notably, public school parents with lower household income are more likely than those with higher incomes to be involved (25% with incomes under $40,000 vs. 8% $40,000 or more).
STATE FUNDING FOR SCHOOLS IS UP, BUT MOST SAY IT’S NOT ENOUGH
California funding for K–12 public education has been rising in recent years, but 60 percent of all adults and 70 percent of public school parents today say current state funding for their local public schools is not enough. Among likely voters, 54 percent say there is not enough funding. Asked to identify the most important issues facing public education today, Californians are most likely to mention lack of funding (16%) and quality of teachers (12%). Public school parents are most likely to mention lack of funding (18%), large class sizes (13%), and quality of teachers (12%).
How do residents think California K–12 education compares to that of other states? About a third of adults (35%) say California’s spending per pupil is lower than average and 26 percent say it is higher than average. Only 29 percent correctly say that spending per pupil is average. Asked about K–12 test scores, 46 percent correctly say California’s results are lower than average (11% higher than average, 38% average).
How can California significantly improve the quality of public schools? Just 9 percent say increased funding alone will do this, while 38 percent prefer using existing funding more wisely. The largest share (49%) prefers that the state do both.
The survey also asks a series of questions about ways to fund education projects.
A state bond for school construction projects: 66 percent of adults and 55 percent of likely voters say they would vote yes if there were a measure on the ballot.
A local bond for school construction projects: 65 percent of adults and 53 percent of likely voters would vote yes if their local districts put a measure on the ballot. (A 55% majority vote is required for passage.)
A local parcel tax for schools: 57 percent of adults and 49 percent of likely voters would approve an increase in local parcel taxes to benefit local schools. (A two-thirds majority vote is required for passage.) Half of adults (50%) think it is a good idea to replace the two-thirds requirement with a 55 percent majority vote to pass local parcel taxes for local public schools. However, only 44 percent of likely voters express support—short of the majority vote required to make the change.
MORE KEY FINDINGS
Half approve of Brown’s job performance—page 14
The governor’s approval rating is holding steady (50% adults, 53% likely voters), as is the legislature’s (42% adults, 36% likely voters). Approval of the way both the governor and legislature are handling of K–12 education is lower.
Local schools get record-high ratings for college, career preparation—page 18
Most adults (58%) say their local public schools are doing a good to excellent job of preparing students for college, and 48 percent rate their schools as good to excellent when asked how well they are preparing students for the workforce.
Half give local schools an A or B—page 20
While 53 percent of all adults give their neighborhood schools good grades, blacks are much less likely than other racial/ethnic groups to do so (blacks 38%, whites 50%, Latinos 59%, Asians 63%).
This PPIC survey is conducted with funding from the S. D. Bechtel, Jr. Foundation, The Dirk and Charlene Kabcenell Foundation, the Silver Giving Foundation, and the Stuart Foundation.
April 2015 Californians and Education 5
POLICY PREFERENCES
KEY FINDINGS
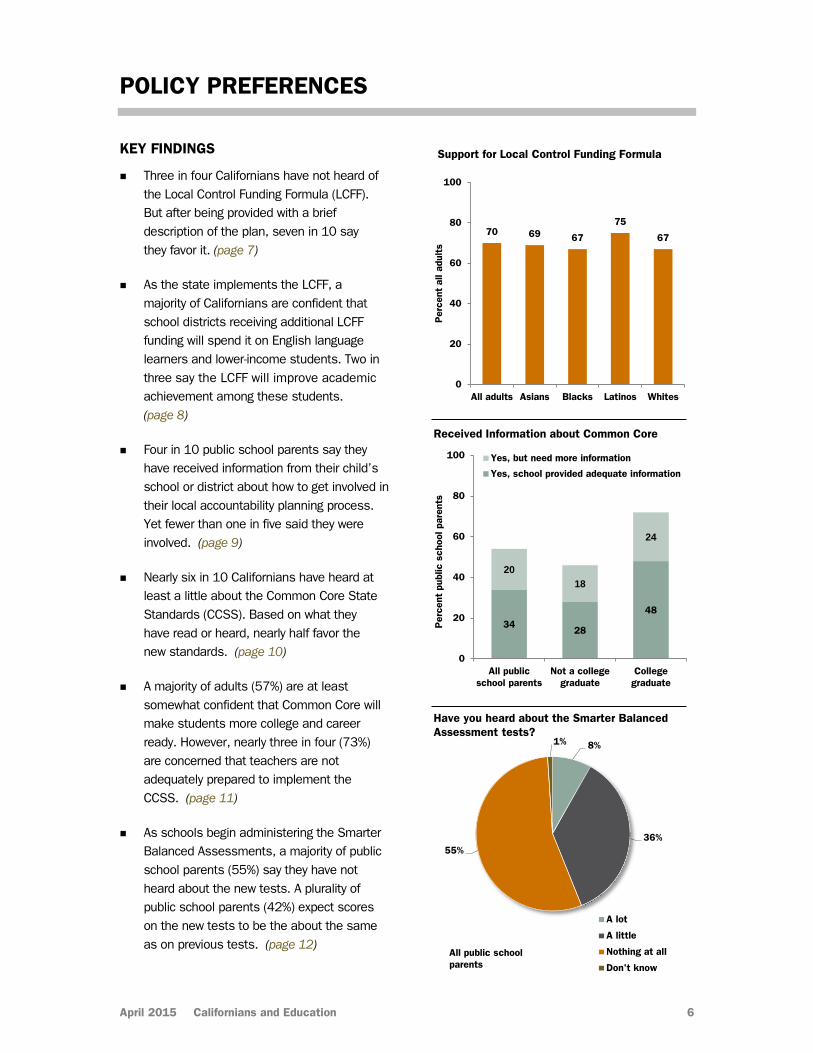
Three in four Californians have not heard of the Local Control Funding Formula (LCFF). But after being provided with a brief description of the plan, seven in 10 say they favor it. (page 7)
As the state implements the LCFF, a majority of Californians are confident that school districts receiving additional LCFF funding will spend it on English language learners and lower-income students. Two in three say the LCFF will improve academic achievement among these students. (page 8)
Four in 10 public school parents say they have received information from their child’s school or district about how to get involved in their local accountability planning process. Yet fewer than one in five said they were involved. (page 9)
Nearly six in 10 Californians have heard at least a little about the Common Core State Standards (CCSS). Based on what they have read or heard, nearly half favor the new standards. (page 10)
A majority of adults (57%) are at least somewhat confident that Common Core will make students more college and career ready. However, nearly three in four (73%) are concerned that teachers are not adequately prepared to implement the CCSS. (page 11)
As schools begin administering the Smarter Balanced Assessments, a majority of public school parents (55%) say they have not heard about the new tests. A plurality of public school parents (42%) expect scores on the new tests to be the about the same as on previous tests. (page 12)
8%
36%55%
1%
A lot
A little
Nothing at all
Don't know
Have you heard about the Smarter Balanced Assessment tests?
All public school parents
3428
48
2018
24
0
20
40
60
80
100
All publicschool parents
Not a collegegraduate
Collegegraduate
Per
cent
pub
lic s
choo
l par
ents
Yes, but need more information
Yes, school provided adequate information
Received Information about Common Core
70 69 67
75
67
0
20
40
60
80
100
All adults Asians Blacks Latinos Whites
Per
cent
all
adul
ts
Support for Local Control Funding Formula
April 2015 Californians and Education 6
PPIC Statewide Survey
THE LOCAL CONTROL FUNDING FORMULA
As the state implements the Local Control Funding Formula (LCFF), Californians continue to say there are inequities between school districts in wealthier areas of the state and those in lower-income areas. An overwhelming majority of Californians (82%) say that school districts in lower-income areas do not have the same amount of resources as districts in wealthier parts of the state. This matches a record high from April 2012—before the LCFF was enacted. Since we began asking this question in 2005, at least three in four adults have said that districts in lower-income areas do not have the same resources. Today, at least seven in 10 across all political parties and demographic groups say that school districts in lower-income areas of the state do not have the same amount of resources as those in wealthier areas.
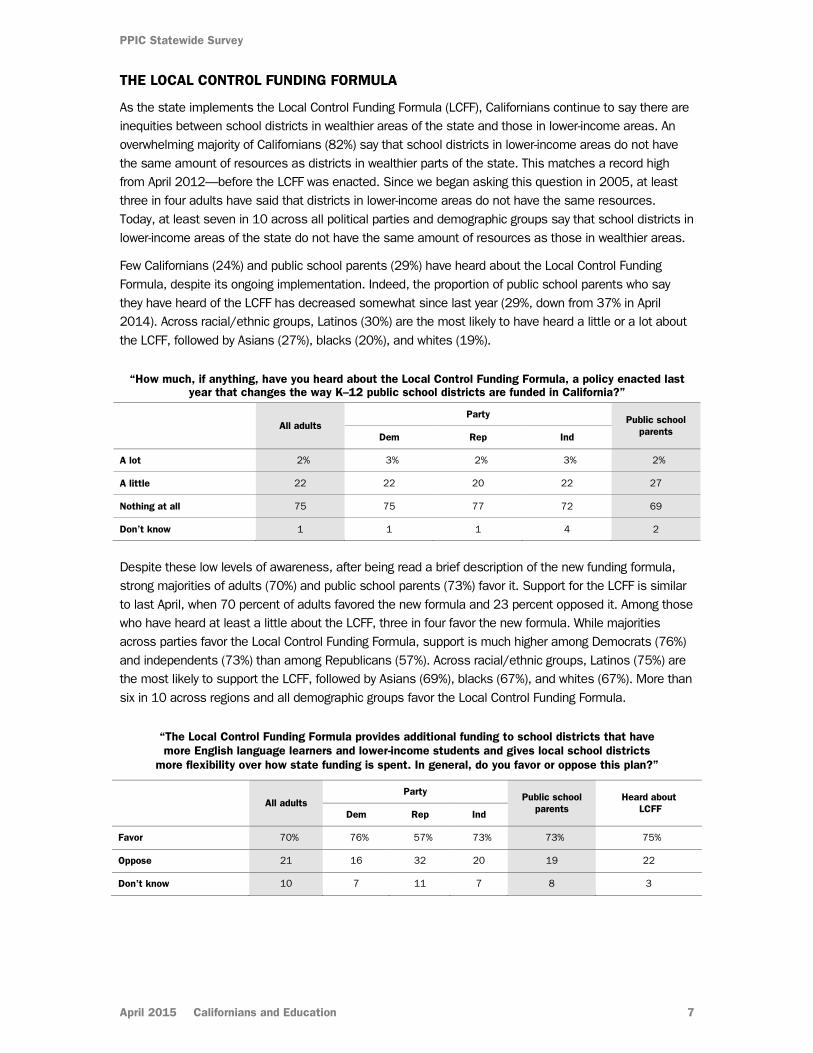
Few Californians (24%) and public school parents (29%) have heard about the Local Control Funding Formula, despite its ongoing implementation. Indeed, the proportion of public school parents who say they have heard of the LCFF has decreased somewhat since last year (29%, down from 37% in April 2014). Across racial/ethnic groups, Latinos (30%) are the most likely to have heard a little or a lot about the LCFF, followed by Asians (27%), blacks (20%), and whites (19%).
“How much, if anything, have you heard about the Local Control Funding Formula, a policy enacted last year that changes the way K–12 public school districts are funded in California?”
All adults
Party Public school parents Dem Rep Ind
A lot 2% 3% 2% 3% 2%
A little 22 22 20 22 27
Nothing at all 75 75 77 72 69
Don’t know 1 1 1 4 2
Despite these low levels of awareness, after being read a brief description of the new funding formula, strong majorities of adults (70%) and public school parents (73%) favor it. Support for the LCFF is similar to last April, when 70 percent of adults favored the new formula and 23 percent opposed it. Among those who have heard at least a little about the LCFF, three in four favor the new formula. While majorities across parties favor the Local Control Funding Formula, support is much higher among Democrats (76%) and independents (73%) than among Republicans (57%). Across racial/ethnic groups, Latinos (75%) are the most likely to support the LCFF, followed by Asians (69%), blacks (67%), and whites (67%). More than six in 10 across regions and all demographic groups favor the Local Control Funding Formula.
“The Local Control Funding Formula provides additional funding to school districts that have more English language learners and lower-income students and gives local school districts
more flexibility over how state funding is spent. In general, do you favor or oppose this plan?”
All adults
Party Public school parents
Heard about LCFF Dem Rep Ind
Favor 70% 76% 57% 73% 73% 75%
Oppose 21 16 32 20 19 22
Don’t know 10 7 11 7 8 3
April 2015 Californians and Education 7
PPIC Statewide Survey
IMPLEMENTATION OF THE LOCAL CONTROL FUNDING FORMULA
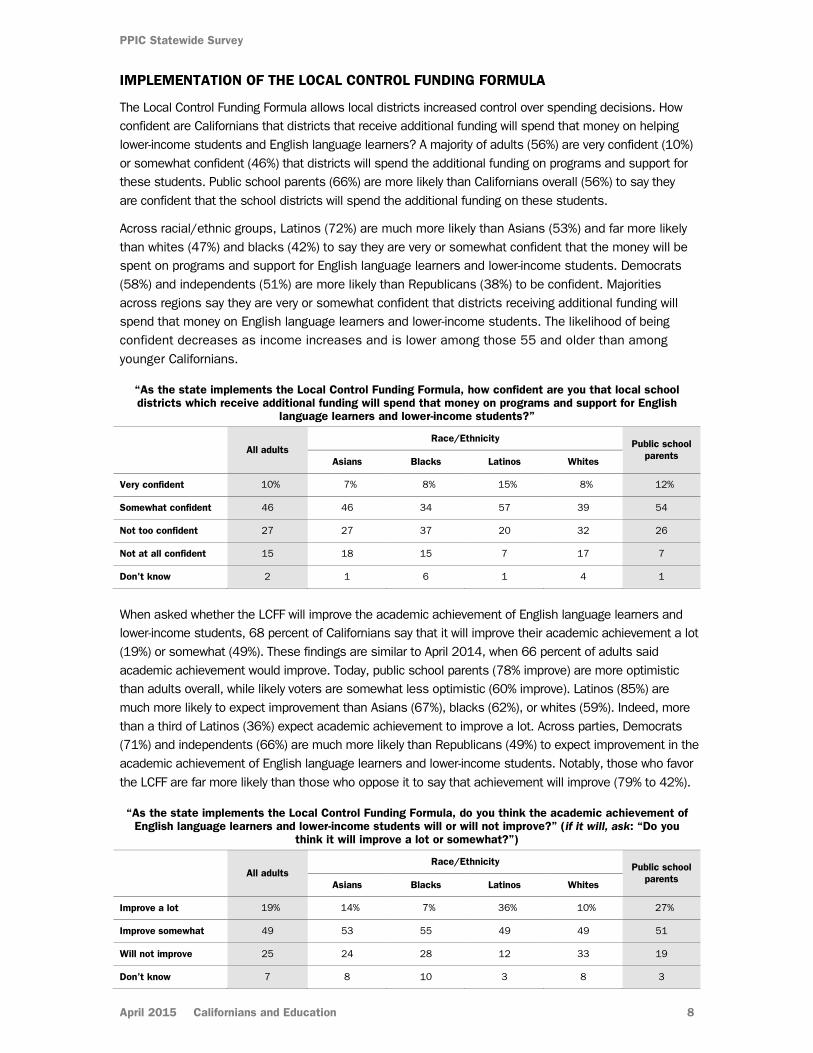
The Local Control Funding Formula allows local districts increased control over spending decisions. How confident are Californians that districts that receive additional funding will spend that money on helping lower-income students and English language learners? A majority of adults (56%) are very confident (10%) or somewhat confident (46%) that districts will spend the additional funding on programs and support for these students. Public school parents (66%) are more likely than Californians overall (56%) to say they are confident that the school districts will spend the additional funding on these students.
Across racial/ethnic groups, Latinos (72%) are much more likely than Asians (53%) and far more likely than whites (47%) and blacks (42%) to say they are very or somewhat confident that the money will be spent on programs and support for English language learners and lower-income students. Democrats (58%) and independents (51%) are more likely than Republicans (38%) to be confident. Majorities across regions say they are very or somewhat confident that districts receiving additional funding will spend that money on English language learners and lower-income students. The likelihood of being confident decreases as income increases and is lower among those 55 and older than among younger Californians.
“As the state implements the Local Control Funding Formula, how confident are you that local school districts which receive additional funding will spend that money on programs and support for English
language learners and lower-income students?”
All adults
Race/Ethnicity Public school parents Asians Blacks Latinos Whites
Very confident 10% 7% 8% 15% 8% 12%
Somewhat confident 46 46 34 57 39 54
Not too confident 27 27 37 20 32 26
Not at all confident 15 18 15 7 17 7
Don't know 2 1 6 1 4 1
When asked whether the LCFF will improve the academic achievement of English language learners and lower-income students, 68 percent of Californians say that it will improve their academic achievement a lot (19%) or somewhat (49%). These findings are similar to April 2014, when 66 percent of adults said academic achievement would improve. Today, public school parents (78% improve) are more optimistic than adults overall, while likely voters are somewhat less optimistic (60% improve). Latinos (85%) are much more likely to expect improvement than Asians (67%), blacks (62%), or whites (59%). Indeed, more than a third of Latinos (36%) expect academic achievement to improve a lot. Across parties, Democrats (71%) and independents (66%) are much more likely than Republicans (49%) to expect improvement in the academic achievement of English language learners and lower-income students. Notably, those who favor the LCFF are far more likely than those who oppose it to say that achievement will improve (79% to 42%).
“As the state implements the Local Control Funding Formula, do you think the academic achievement of English language learners and lower-income students will or will not improve?” (if it will, ask: “Do you
think it will improve a lot or somewhat?”)
All adults
Race/Ethnicity Public school parents Asians Blacks Latinos Whites
Improve a lot 19% 14% 7% 36% 10% 27%
Improve somewhat 49 53 55 49 49 51
Will not improve 25 24 28 12 33 19
Don’t know 7 8 10 3 8 3
April 2015 Californians and Education 8
PPIC Statewide Survey
PARENTAL INVOLVEMENT AND THE LOCAL CONTROL FUNDING FORMULA
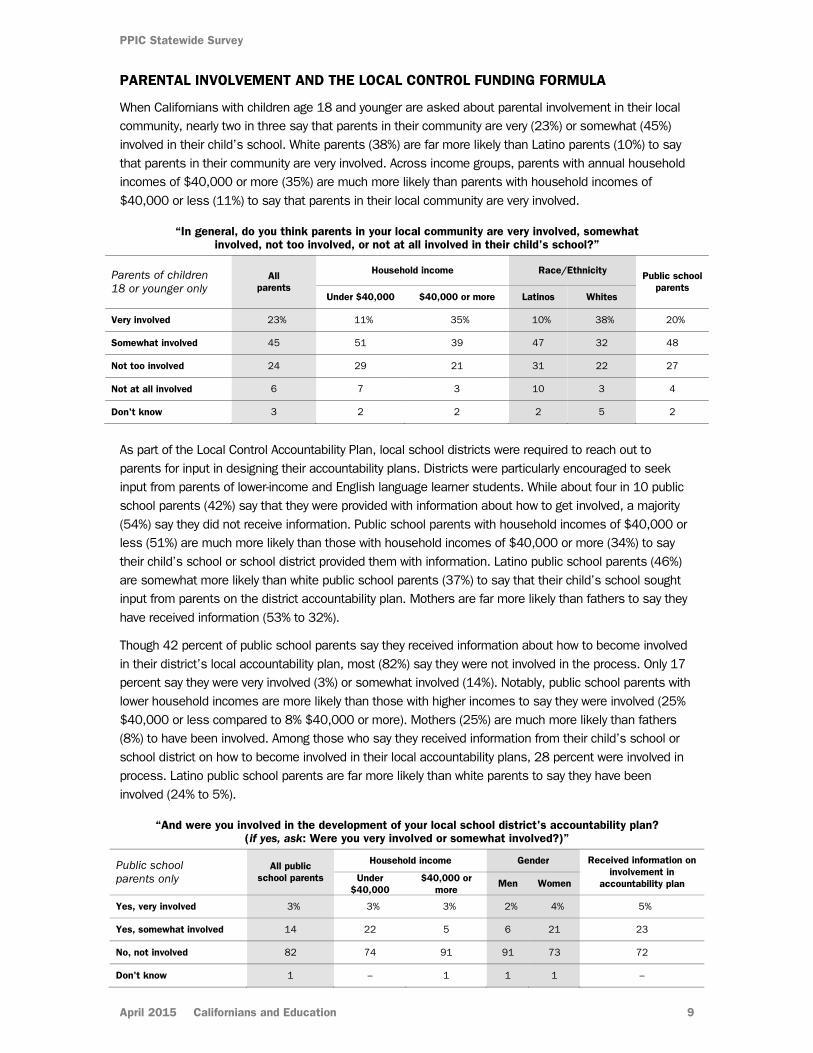
When Californians with children age 18 and younger are asked about parental involvement in their local community, nearly two in three say that parents in their community are very (23%) or somewhat (45%) involved in their child’s school. White parents (38%) are far more likely than Latino parents (10%) to say that parents in their community are very involved. Across income groups, parents with annual household incomes of $40,000 or more (35%) are much more likely than parents with household incomes of $40,000 or less (11%) to say that parents in their local community are very involved.
“In general, do you think parents in your local community are very involved, somewhat involved, not too involved, or not at all involved in their child's school?”
Parents of children 18 or younger only
All parents
Household income Race/Ethnicity Public school parents
Under $40,000 $40,000 or more Latinos Whites
Very involved 23% 11% 35% 10% 38% 20%
Somewhat involved 45 51 39 47 32 48
Not too involved 24 29 21 31 22 27
Not at all involved 6 7 3 10 3 4
Don't know 3 2 2 2 5 2
As part of the Local Control Accountability Plan, local school districts were required to reach out to parents for input in designing their accountability plans. Districts were particularly encouraged to seek input from parents of lower-income and English language learner students. While about four in 10 public school parents (42%) say that they were provided with information about how to get involved, a majority (54%) say they did not receive information. Public school parents with household incomes of $40,000 or less (51%) are much more likely than those with household incomes of $40,000 or more (34%) to say their child’s school or school district provided them with information. Latino public school parents (46%) are somewhat more likely than white public school parents (37%) to say that their child’s school sought input from parents on the district accountability plan. Mothers are far more likely than fathers to say they have received information (53% to 32%).
Though 42 percent of public school parents say they received information about how to become involved in their district’s local accountability plan, most (82%) say they were not involved in the process. Only 17 percent say they were very involved (3%) or somewhat involved (14%). Notably, public school parents with lower household incomes are more likely than those with higher incomes to say they were involved (25% $40,000 or less compared to 8% $40,000 or more). Mothers (25%) are much more likely than fathers (8%) to have been involved. Among those who say they received information from their child’s school or school district on how to become involved in their local accountability plans, 28 percent were involved in process. Latino public school parents are far more likely than white parents to say they have been involved (24% to 5%).
“And were you involved in the development of your local school district's accountability plan? (if yes, ask: Were you very involved or somewhat involved?)”
Public school parents only
All public school parents
Household income Gender Received information on involvement in
accountability plan Under $40,000
$40,000 or more
Men Women
Yes, very involved 3% 3% 3% 2% 4% 5%
Yes, somewhat involved 14 22 5 6 21 23
No, not involved 82 74 91 91 73 72
Don't know 1 – 1 1 1 –
April 2015 Californians and Education 9
PPIC Statewide Survey
COMMON CORE STATE STANDARDS
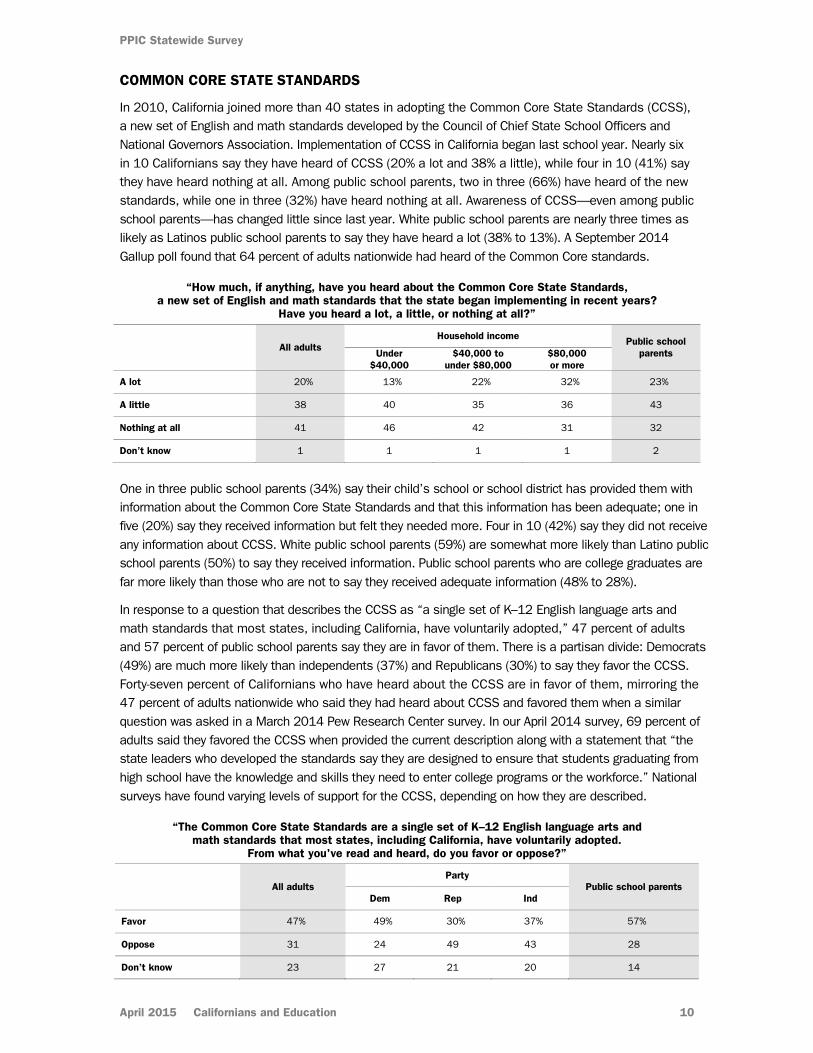
In 2010, California joined more than 40 states in adopting the Common Core State Standards (CCSS), a new set of English and math standards developed by the Council of Chief State School Officers and National Governors Association. Implementation of CCSS in California began last school year. Nearly six in 10 Californians say they have heard of CCSS (20% a lot and 38% a little), while four in 10 (41%) say they have heard nothing at all. Among public school parents, two in three (66%) have heard of the new standards, while one in three (32%) have heard nothing at all. Awareness of CCSS—even among public school parents—has changed little since last year. White public school parents are nearly three times as likely as Latinos public school parents to say they have heard a lot (38% to 13%). A September 2014 Gallup poll found that 64 percent of adults nationwide had heard of the Common Core standards.
“How much, if anything, have you heard about the Common Core State Standards, a new set of English and math standards that the state began implementing in recent years?
Have you heard a lot, a little, or nothing at all?”
All adults
Household income Public school parents Under
$40,000 $40,000 to
under $80,000 $80,000 or more
A lot 20% 13% 22% 32% 23%
A little 38 40 35 36 43
Nothing at all 41 46 42 31 32
Don’t know 1 1 1 1 2
One in three public school parents (34%) say their child’s school or school district has provided them with information about the Common Core State Standards and that this information has been adequate; one in five (20%) say they received information but felt they needed more. Four in 10 (42%) say they did not receive any information about CCSS. White public school parents (59%) are somewhat more likely than Latino public school parents (50%) to say they received information. Public school parents who are college graduates are far more likely than those who are not to say they received adequate information (48% to 28%).
In response to a question that describes the CCSS as “a single set of K–12 English language arts and math standards that most states, including California, have voluntarily adopted,” 47 percent of adults and 57 percent of public school parents say they are in favor of them. There is a partisan divide: Democrats (49%) are much more likely than independents (37%) and Republicans (30%) to say they favor the CCSS. Forty-seven percent of Californians who have heard about the CCSS are in favor of them, mirroring the 47 percent of adults nationwide who said they had heard about CCSS and favored them when a similar question was asked in a March 2014 Pew Research Center survey. In our April 2014 survey, 69 percent of adults said they favored the CCSS when provided the current description along with a statement that “the state leaders who developed the standards say they are designed to ensure that students graduating from high school have the knowledge and skills they need to enter college programs or the workforce.” National surveys have found varying levels of support for the CCSS, depending on how they are described.
“The Common Core State Standards are a single set of K–12 English language arts and math standards that most states, including California, have voluntarily adopted.
From what you've read and heard, do you favor or oppose?”
All adults
Party Public school parents
Dem Rep Ind
Favor 47% 49% 30% 37% 57%
Oppose 31 24 49 43 28
Don’t know 23 27 21 20 14
April 2015 Californians and Education 10
PPIC Statewide Survey
IMPLEMENTATION OF COMMON CORE STATE STANDARDS
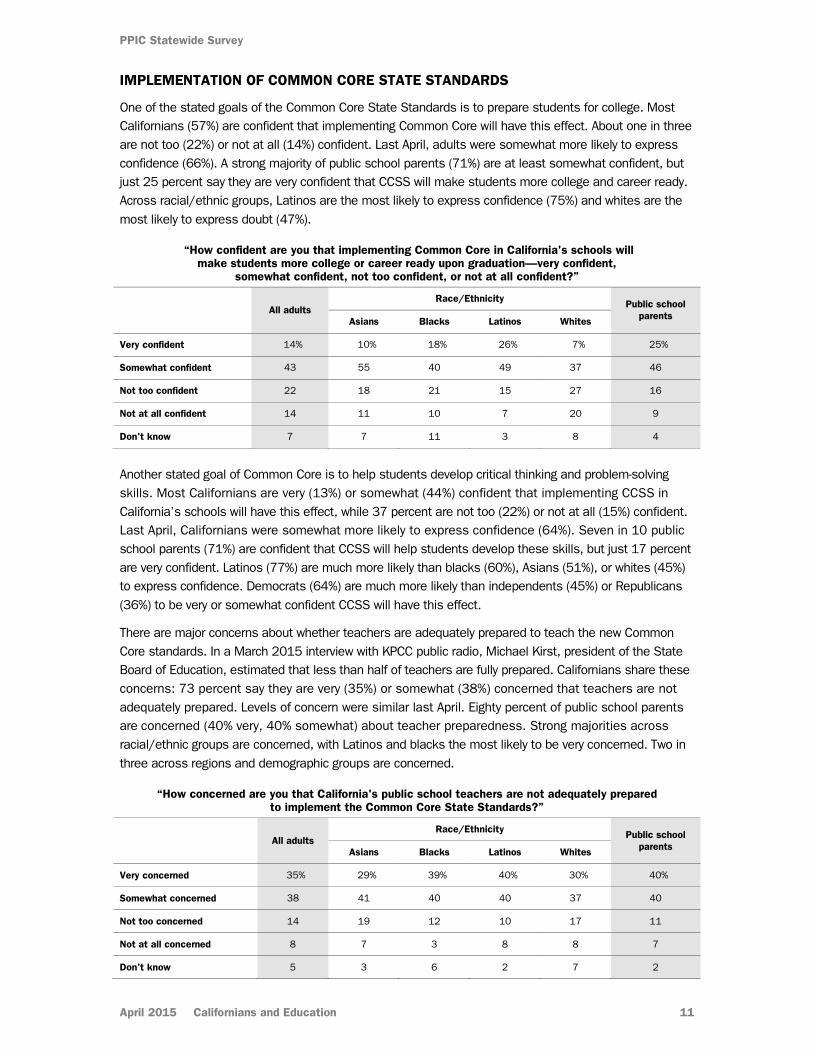
One of the stated goals of the Common Core State Standards is to prepare students for college. Most Californians (57%) are confident that implementing Common Core will have this effect. About one in three are not too (22%) or not at all (14%) confident. Last April, adults were somewhat more likely to express confidence (66%). A strong majority of public school parents (71%) are at least somewhat confident, but just 25 percent say they are very confident that CCSS will make students more college and career ready. Across racial/ethnic groups, Latinos are the most likely to express confidence (75%) and whites are the most likely to express doubt (47%).
“How confident are you that implementing Common Core in California's schools will make students more college or career ready upon graduation—very confident,
somewhat confident, not too confident, or not at all confident?”
All adults
Race/Ethnicity Public school parents Asians Blacks Latinos Whites
Very confident 14% 10% 18% 26% 7% 25%
Somewhat confident 43 55 40 49 37 46
Not too confident 22 18 21 15 27 16
Not at all confident 14 11 10 7 20 9
Don't know 7 7 11 3 8 4
Another stated goal of Common Core is to help students develop critical thinking and problem-solving skills. Most Californians are very (13%) or somewhat (44%) confident that implementing CCSS in California’s schools will have this effect, while 37 percent are not too (22%) or not at all (15%) confident. Last April, Californians were somewhat more likely to express confidence (64%). Seven in 10 public school parents (71%) are confident that CCSS will help students develop these skills, but just 17 percent are very confident. Latinos (77%) are much more likely than blacks (60%), Asians (51%), or whites (45%) to express confidence. Democrats (64%) are much more likely than independents (45%) or Republicans (36%) to be very or somewhat confident CCSS will have this effect.
There are major concerns about whether teachers are adequately prepared to teach the new Common Core standards. In a March 2015 interview with KPCC public radio, Michael Kirst, president of the State Board of Education, estimated that less than half of teachers are fully prepared. Californians share these concerns: 73 percent say they are very (35%) or somewhat (38%) concerned that teachers are not adequately prepared. Levels of concern were similar last April. Eighty percent of public school parents are concerned (40% very, 40% somewhat) about teacher preparedness. Strong majorities across racial/ethnic groups are concerned, with Latinos and blacks the most likely to be very concerned. Two in three across regions and demographic groups are concerned.
“How concerned are you that California's public school teachers are not adequately prepared to implement the Common Core State Standards?”
All adults
Race/Ethnicity Public school parents Asians Blacks Latinos Whites
Very concerned 35% 29% 39% 40% 30% 40%
Somewhat concerned 38 41 40 40 37 40
Not too concerned 14 19 12 10 17 11
Not at all concerned 8 7 3 8 8 7
Don't know 5 3 6 2 7 2
April 2015 Californians and Education 11
PPIC Statewide Survey
PARENTS’ PERCEPTIONS OF THE SMARTER BALANCED ASSESSMENTS
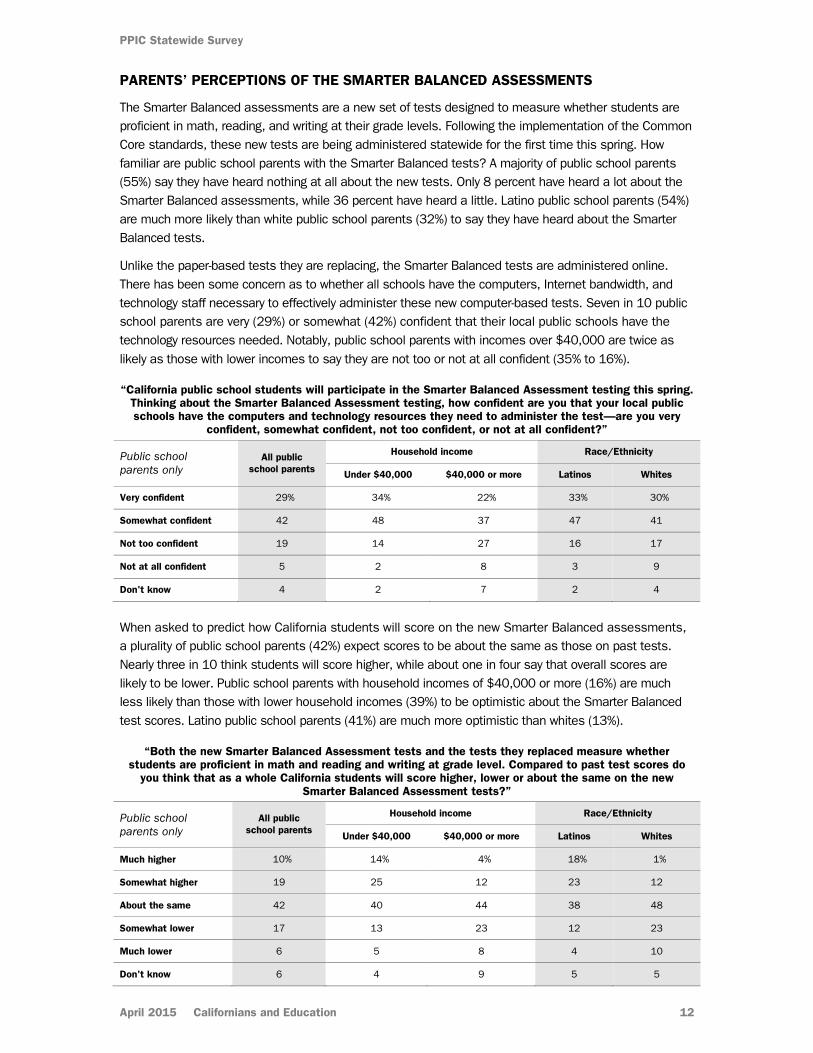
The Smarter Balanced assessments are a new set of tests designed to measure whether students are proficient in math, reading, and writing at their grade levels. Following the implementation of the Common Core standards, these new tests are being administered statewide for the first time this spring. How familiar are public school parents with the Smarter Balanced tests? A majority of public school parents (55%) say they have heard nothing at all about the new tests. Only 8 percent have heard a lot about the Smarter Balanced assessments, while 36 percent have heard a little. Latino public school parents (54%) are much more likely than white public school parents (32%) to say they have heard about the Smarter Balanced tests.
Unlike the paper-based tests they are replacing, the Smarter Balanced tests are administered online. There has been some concern as to whether all schools have the computers, Internet bandwidth, and technology staff necessary to effectively administer these new computer-based tests. Seven in 10 public school parents are very (29%) or somewhat (42%) confident that their local public schools have the technology resources needed. Notably, public school parents with incomes over $40,000 are twice as likely as those with lower incomes to say they are not too or not at all confident (35% to 16%).
“California public school students will participate in the Smarter Balanced Assessment testing this spring. Thinking about the Smarter Balanced Assessment testing, how confident are you that your local public schools have the computers and technology resources they need to administer the test—are you very
confident, somewhat confident, not too confident, or not at all confident?”
Public school parents only
All public school parents
Household income Race/Ethnicity
Under $40,000 $40,000 or more Latinos Whites
Very confident 29% 34% 22% 33% 30%
Somewhat confident 42 48 37 47 41
Not too confident 19 14 27 16 17
Not at all confident 5 2 8 3 9
Don't know 4 2 7 2 4
When asked to predict how California students will score on the new Smarter Balanced assessments, a plurality of public school parents (42%) expect scores to be about the same as those on past tests. Nearly three in 10 think students will score higher, while about one in four say that overall scores are likely to be lower. Public school parents with household incomes of $40,000 or more (16%) are much less likely than those with lower household incomes (39%) to be optimistic about the Smarter Balanced test scores. Latino public school parents (41%) are much more optimistic than whites (13%).
“Both the new Smarter Balanced Assessment tests and the tests they replaced measure whether students are proficient in math and reading and writing at grade level. Compared to past test scores do
you think that as a whole California students will score higher, lower or about the same on the new Smarter Balanced Assessment tests?”
Public school parents only
All publicschool parents
Household income Race/Ethnicity
Under $40,000 $40,000 or more Latinos Whites
Much higher 10% 14% 4% 18% 1%
Somewhat higher 19 25 12 23 12
About the same 42 40 44 38 48
Somewhat lower 17 13 23 12 23
Much lower 6 5 8 4 10
Don't know 6 4 9 5 5
April 2015 Californians and Education 12
PERCEPTIONS AND ATTITUDES
KEY FINDINGS
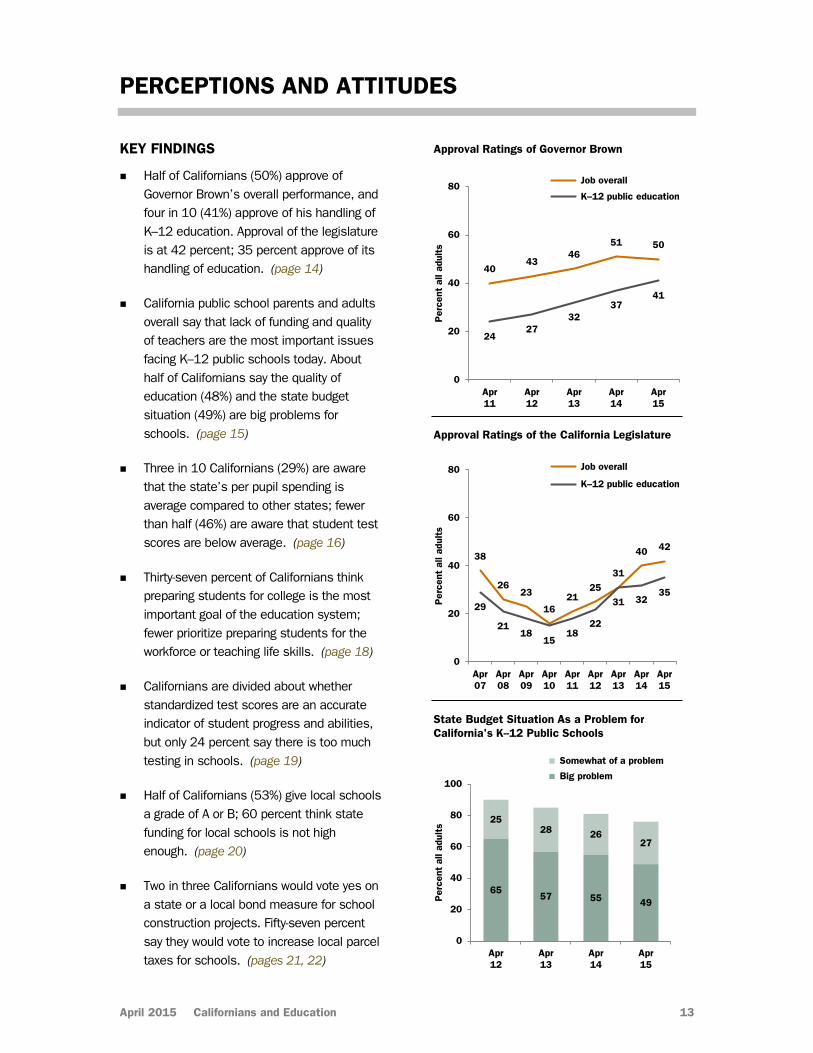
Half of Californians (50%) approve ofGovernor Brown’s overall performance, andfour in 10 (41%) approve of his handling ofK–12 education. Approval of the legislatureis at 42 percent; 35 percent approve of itshandling of education. (page 14)
California public school parents and adultsoverall say that lack of funding and qualityof teachers are the most important issuesfacing K–12 public schools today. Abouthalf of Californians say the quality ofeducation (48%) and the state budgetsituation (49%) are big problems forschools. (page 15)
Three in 10 Californians (29%) are awarethat the state’s per pupil spending isaverage compared to other states; fewerthan half (46%) are aware that student testscores are below average. (page 16)
Thirty-seven percent of Californians thinkpreparing students for college is the mostimportant goal of the education system;fewer prioritize preparing students for theworkforce or teaching life skills. (page 18)
Californians are divided about whetherstandardized test scores are an accurateindicator of student progress and abilities,but only 24 percent say there is too muchtesting in schools. (page 19)
Half of Californians (53%) give local schoolsa grade of A or B; 60 percent think statefunding for local schools is not highenough. (page 20)
Two in three Californians would vote yes ona state or a local bond measure for schoolconstruction projects. Fifty-seven percentsay they would vote to increase local parceltaxes for schools. (pages 21, 22)
38
2623
1621
2531
40 42
29
2118
1518
22
31 3235
0
20
40
60
80
Apr07
Apr08
Apr09
Apr10
Apr11
Apr12
Apr13
Apr14
Apr15
Per
cent
all
adul
ts
Job overall
K–12 public education
Approval Ratings of the California Legislature
4043
4651 50
2427
3237
41
0
20
40
60
80
Apr11
Apr12
Apr13
Apr14
Apr15
Per
cent
all
adul
ts
Job overall
K–12 public education
Approval Ratings of Governor Brown
6557 55 49
2528 26
27
0
20
40
60
80
100
Apr12
Apr13
Apr14
Apr15
Per
cent
all
adul
ts
Somewhat of a problem
Big problem
State Budget Situation As a Problem for California's K--12 Public Schools
April 2015 Californians and Education 13
PPIC Statewide Survey
APPROVAL RATINGS OF STATE ELECTED OFFICIALS
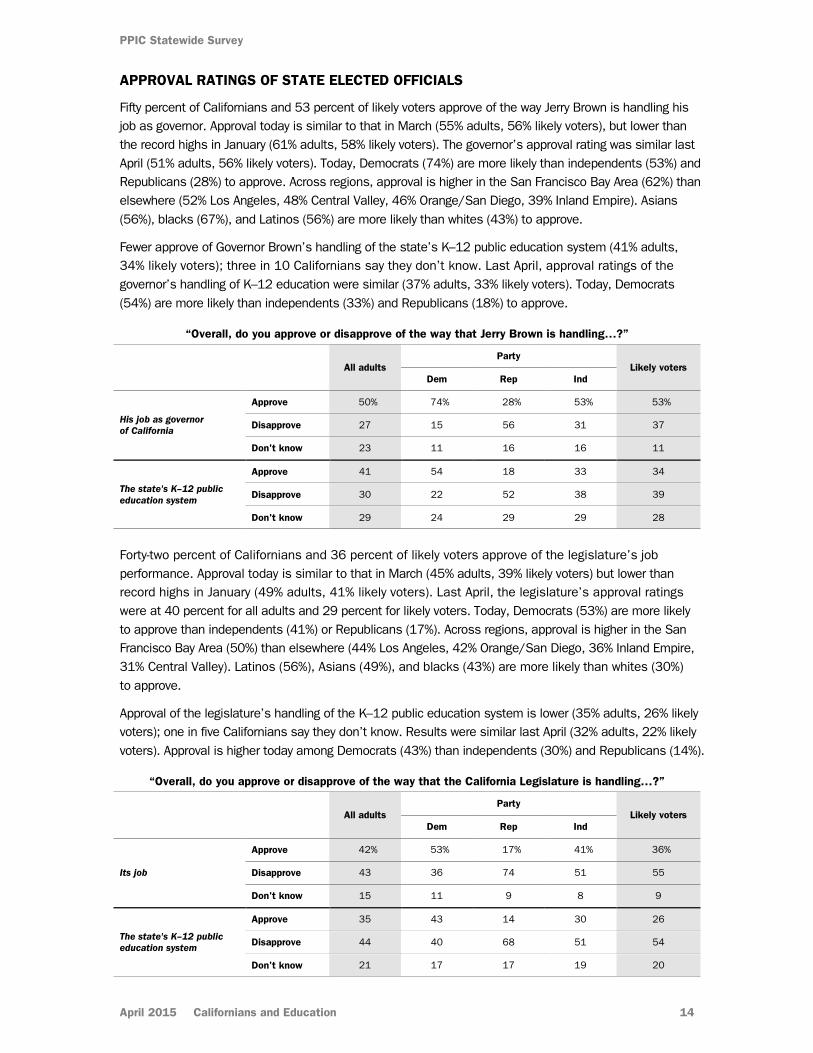
Fifty percent of Californians and 53 percent of likely voters approve of the way Jerry Brown is handling his job as governor. Approval today is similar to that in March (55% adults, 56% likely voters), but lower than the record highs in January (61% adults, 58% likely voters). The governor’s approval rating was similar last April (51% adults, 56% likely voters). Today, Democrats (74%) are more likely than independents (53%) and Republicans (28%) to approve. Across regions, approval is higher in the San Francisco Bay Area (62%) than elsewhere (52% Los Angeles, 48% Central Valley, 46% Orange/San Diego, 39% Inland Empire). Asians (56%), blacks (67%), and Latinos (56%) are more likely than whites (43%) to approve.
Fewer approve of Governor Brown’s handling of the state’s K–12 public education system (41% adults, 34% likely voters); three in 10 Californians say they don’t know. Last April, approval ratings of the governor’s handling of K–12 education were similar (37% adults, 33% likely voters). Today, Democrats (54%) are more likely than independents (33%) and Republicans (18%) to approve.
“Overall, do you approve or disapprove of the way that Jerry Brown is handling…?”
All adults Party
Likely voters Dem Rep Ind
His job as governor of California
Approve 50% 74% 28% 53% 53%
Disapprove 27 15 56 31 37
Don't know 23 11 16 16 11
The state's K–12 public education system
Approve 41 54 18 33 34
Disapprove 30 22 52 38 39
Don't know 29 24 29 29 28
Forty-two percent of Californians and 36 percent of likely voters approve of the legislature’s job performance. Approval today is similar to that in March (45% adults, 39% likely voters) but lower than record highs in January (49% adults, 41% likely voters). Last April, the legislature’s approval ratings were at 40 percent for all adults and 29 percent for likely voters. Today, Democrats (53%) are more likely to approve than independents (41%) or Republicans (17%). Across regions, approval is higher in the San Francisco Bay Area (50%) than elsewhere (44% Los Angeles, 42% Orange/San Diego, 36% Inland Empire, 31% Central Valley). Latinos (56%), Asians (49%), and blacks (43%) are more likely than whites (30%) to approve.
Approval of the legislature’s handling of the K–12 public education system is lower (35% adults, 26% likely voters); one in five Californians say they don’t know. Results were similar last April (32% adults, 22% likely voters). Approval is higher today among Democrats (43%) than independents (30%) and Republicans (14%).
“Overall, do you approve or disapprove of the way that the California Legislature is handling…?”
All adults Party
Likely voters Dem Rep Ind
Its job
Approve 42% 53% 17% 41% 36%
Disapprove 43 36 74 51 55
Don't know 15 11 9 8 9
The state's K–12 public education system
Approve 35 43 14 30 26
Disapprove 44 40 68 51 54
Don't know 21 17 17 19 20
April 2015 Californians and Education 14
PPIC Statewide Survey
ISSUES OF CONCERN IN K–12 EDUCATION
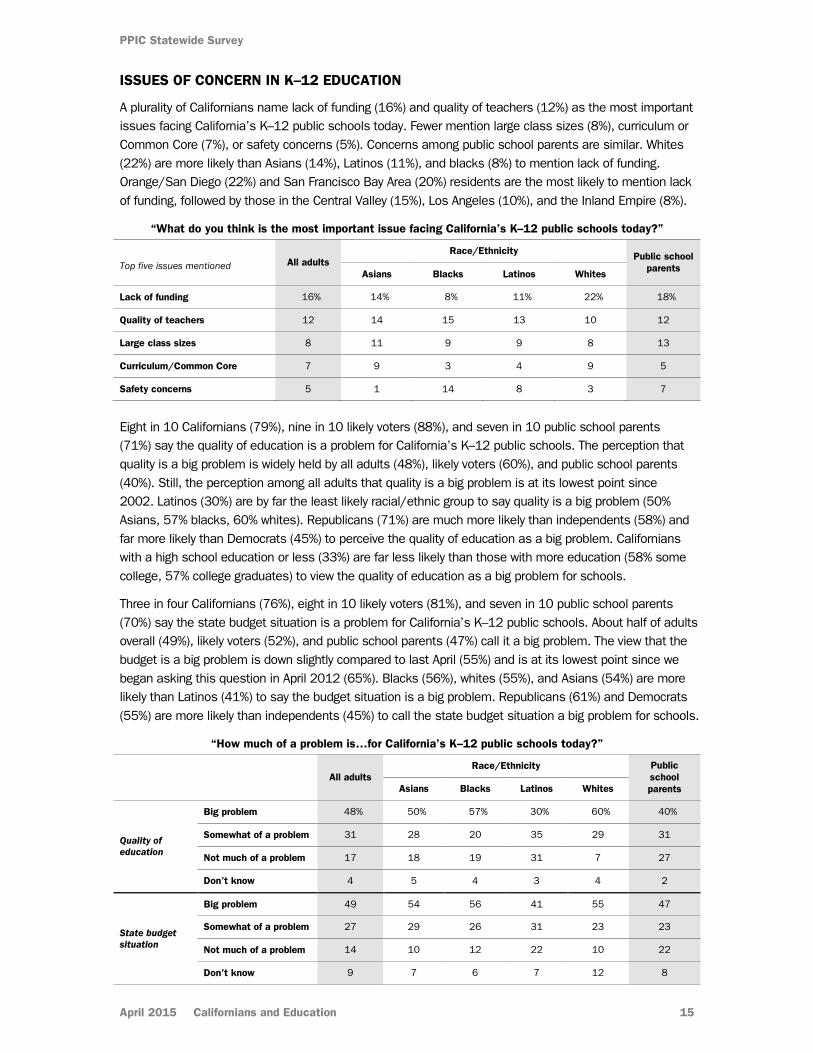
A plurality of Californians name lack of funding (16%) and quality of teachers (12%) as the most important issues facing California’s K–12 public schools today. Fewer mention large class sizes (8%), curriculum or Common Core (7%), or safety concerns (5%). Concerns among public school parents are similar. Whites (22%) are more likely than Asians (14%), Latinos (11%), and blacks (8%) to mention lack of funding. Orange/San Diego (22%) and San Francisco Bay Area (20%) residents are the most likely to mention lack of funding, followed by those in the Central Valley (15%), Los Angeles (10%), and the Inland Empire (8%).
“What do you think is the most important issue facing California’s K–12 public schools today?”
Top five issues mentioned
All adults Race/Ethnicity Public school
parents Asians Blacks Latinos Whites
Lack of funding 16% 14% 8% 11% 22% 18%
Quality of teachers 12 14 15 13 10 12
Large class sizes 8 11 9 9 8 13
Curriculum/Common Core 7 9 3 4 9 5
Safety concerns 5 1 14 8 3 7
Eight in 10 Californians (79%), nine in 10 likely voters (88%), and seven in 10 public school parents (71%) say the quality of education is a problem for California’s K–12 public schools. The perception that quality is a big problem is widely held by all adults (48%), likely voters (60%), and public school parents (40%). Still, the perception among all adults that quality is a big problem is at its lowest point since 2002. Latinos (30%) are by far the least likely racial/ethnic group to say quality is a big problem (50% Asians, 57% blacks, 60% whites). Republicans (71%) are much more likely than independents (58%) and far more likely than Democrats (45%) to perceive the quality of education as a big problem. Californians with a high school education or less (33%) are far less likely than those with more education (58% some college, 57% college graduates) to view the quality of education as a big problem for schools.
Three in four Californians (76%), eight in 10 likely voters (81%), and seven in 10 public school parents (70%) say the state budget situation is a problem for California’s K–12 public schools. About half of adults overall (49%), likely voters (52%), and public school parents (47%) call it a big problem. The view that the budget is a big problem is down slightly compared to last April (55%) and is at its lowest point since we began asking this question in April 2012 (65%). Blacks (56%), whites (55%), and Asians (54%) are more likely than Latinos (41%) to say the budget situation is a big problem. Republicans (61%) and Democrats (55%) are more likely than independents (45%) to call the state budget situation a big problem for schools.
“How much of a problem is…for California’s K–12 public schools today?”
All adults Race/Ethnicity Public
school parents Asians Blacks Latinos Whites
Quality of education
Big problem 48% 50% 57% 30% 60% 40%
Somewhat of a problem 31 28 20 35 29 31
Not much of a problem 17 18 19 31 7 27
Don’t know 4 5 4 3 4 2
State budget situation
Big problem 49 54 56 41 55 47
Somewhat of a problem 27 29 26 31 23 23
Not much of a problem 14 10 12 22 10 22
Don’t know 9 7 6 7 12 8
April 2015 Californians and Education 15
PPIC Statewide Survey
CALIFORNIA’S RELATIVE RANKINGS
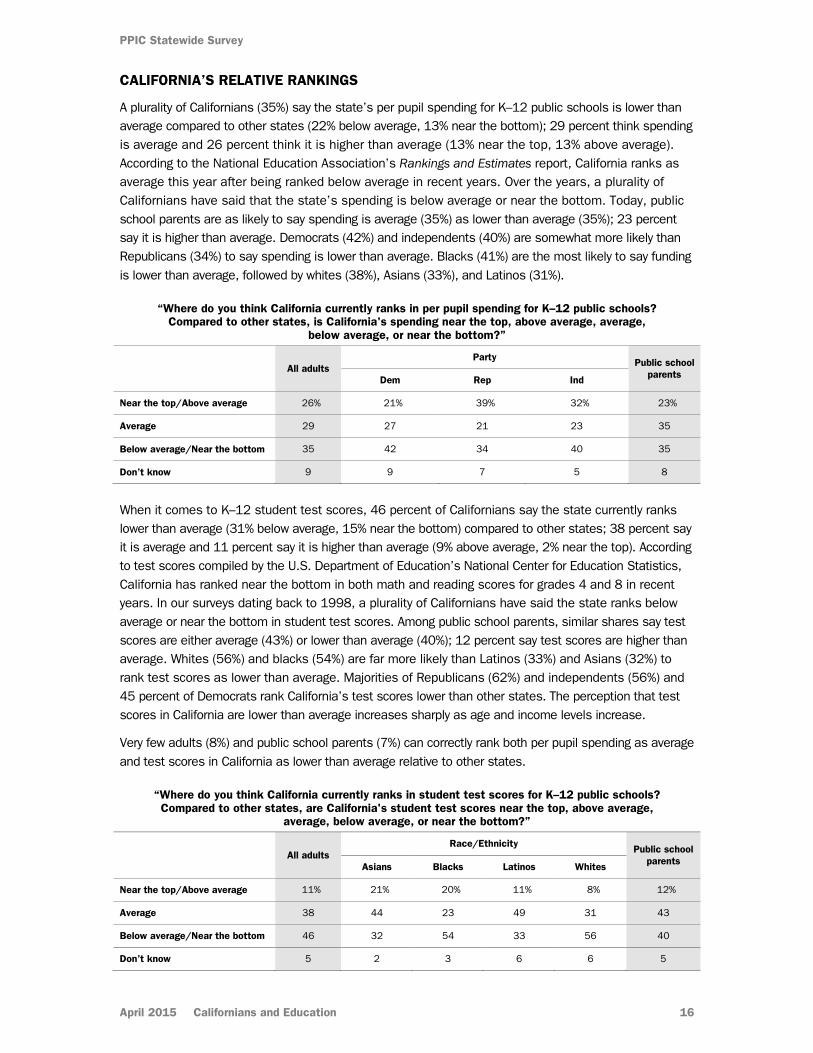
A plurality of Californians (35%) say the state’s per pupil spending for K–12 public schools is lower than average compared to other states (22% below average, 13% near the bottom); 29 percent think spending is average and 26 percent think it is higher than average (13% near the top, 13% above average). According to the National Education Association’s Rankings and Estimates report, California ranks as average this year after being ranked below average in recent years. Over the years, a plurality of Californians have said that the state’s spending is below average or near the bottom. Today, public school parents are as likely to say spending is average (35%) as lower than average (35%); 23 percent say it is higher than average. Democrats (42%) and independents (40%) are somewhat more likely than Republicans (34%) to say spending is lower than average. Blacks (41%) are the most likely to say funding is lower than average, followed by whites (38%), Asians (33%), and Latinos (31%).
“Where do you think California currently ranks in per pupil spending for K–12 public schools? Compared to other states, is California's spending near the top, above average, average,
below average, or near the bottom?”
All adults
Party Public school parents Dem Rep Ind
Near the top/Above average 26% 21% 39% 32% 23%
Average 29 27 21 23 35
Below average/Near the bottom 35 42 34 40 35
Don’t know 9 9 7 5 8
When it comes to K–12 student test scores, 46 percent of Californians say the state currently ranks lower than average (31% below average, 15% near the bottom) compared to other states; 38 percent say it is average and 11 percent say it is higher than average (9% above average, 2% near the top). According to test scores compiled by the U.S. Department of Education’s National Center for Education Statistics, California has ranked near the bottom in both math and reading scores for grades 4 and 8 in recent years. In our surveys dating back to 1998, a plurality of Californians have said the state ranks below average or near the bottom in student test scores. Among public school parents, similar shares say test scores are either average (43%) or lower than average (40%); 12 percent say test scores are higher than average. Whites (56%) and blacks (54%) are far more likely than Latinos (33%) and Asians (32%) to rank test scores as lower than average. Majorities of Republicans (62%) and independents (56%) and 45 percent of Democrats rank California’s test scores lower than other states. The perception that test scores in California are lower than average increases sharply as age and income levels increase.
Very few adults (8%) and public school parents (7%) can correctly rank both per pupil spending as average and test scores in California as lower than average relative to other states.
“Where do you think California currently ranks in student test scores for K–12 public schools? Compared to other states, are California's student test scores near the top, above average,
average, below average, or near the bottom?”
All adults
Race/Ethnicity Public school parents Asians Blacks Latinos Whites
Near the top/Above average 11% 21% 20% 11% 8% 12%
Average 38 44 23 49 31 43
Below average/Near the bottom 46 32 54 33 56 40
Don’t know 5 2 3 6 6 5
April 2015 Californians and Education 16
PPIC Statewide Survey
CONCERNS ABOUT INEQUITIES
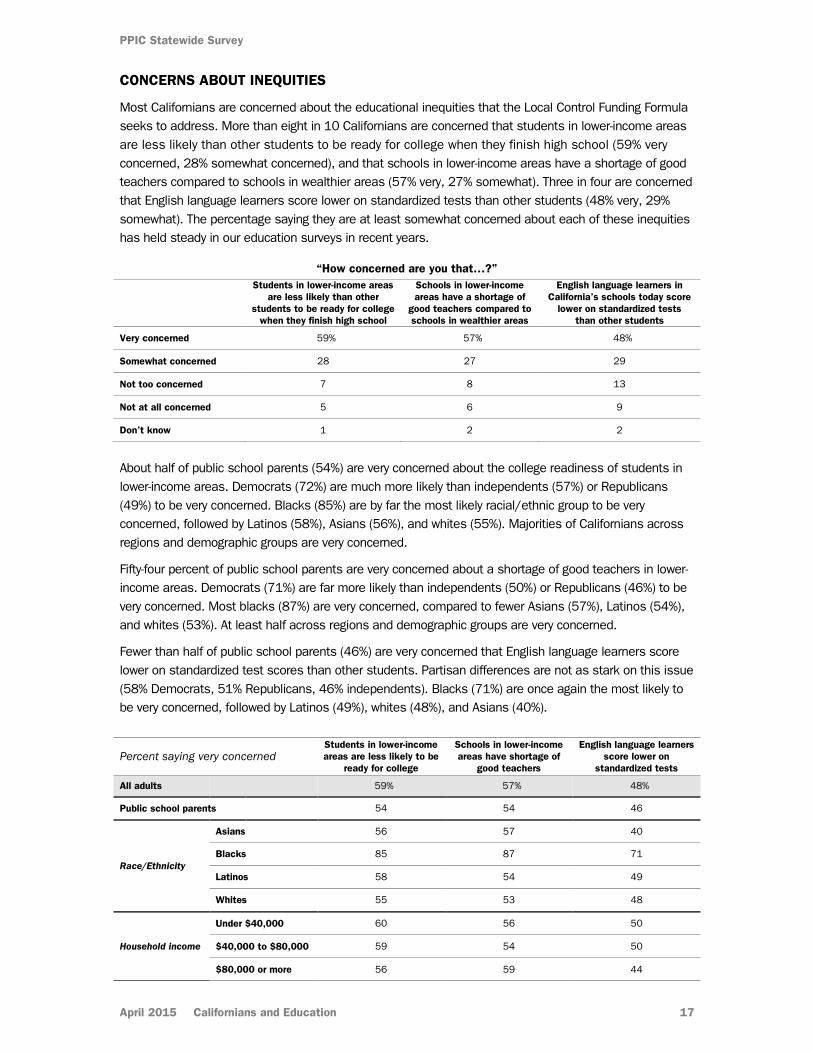
Most Californians are concerned about the educational inequities that the Local Control Funding Formula seeks to address. More than eight in 10 Californians are concerned that students in lower-income areas are less likely than other students to be ready for college when they finish high school (59% very concerned, 28% somewhat concerned), and that schools in lower-income areas have a shortage of good teachers compared to schools in wealthier areas (57% very, 27% somewhat). Three in four are concerned that English language learners score lower on standardized tests than other students (48% very, 29% somewhat). The percentage saying they are at least somewhat concerned about each of these inequities has held steady in our education surveys in recent years.
“How concerned are you that…?”
Students in lower-income areas are less likely than other
students to be ready for college when they finish high school
Schools in lower-income areas have a shortage of
good teachers compared to schools in wealthier areas
English language learners in California’s schools today score
lower on standardized tests than other students
Very concerned 59% 57% 48%
Somewhat concerned 28 27 29
Not too concerned 7 8 13
Not at all concerned 5 6 9
Don’t know 1 2 2
About half of public school parents (54%) are very concerned about the college readiness of students in lower-income areas. Democrats (72%) are much more likely than independents (57%) or Republicans (49%) to be very concerned. Blacks (85%) are by far the most likely racial/ethnic group to be very concerned, followed by Latinos (58%), Asians (56%), and whites (55%). Majorities of Californians across regions and demographic groups are very concerned.
Fifty-four percent of public school parents are very concerned about a shortage of good teachers in lower-income areas. Democrats (71%) are far more likely than independents (50%) or Republicans (46%) to be very concerned. Most blacks (87%) are very concerned, compared to fewer Asians (57%), Latinos (54%), and whites (53%). At least half across regions and demographic groups are very concerned.
Fewer than half of public school parents (46%) are very concerned that English language learners score lower on standardized test scores than other students. Partisan differences are not as stark on this issue (58% Democrats, 51% Republicans, 46% independents). Blacks (71%) are once again the most likely to be very concerned, followed by Latinos (49%), whites (48%), and Asians (40%).
Percent saying very concerned Students in lower-income areas are less likely to be
ready for college
Schools in lower-income areas have shortage of
good teachers
English language learners score lower on
standardized tests
All adults 59% 57% 48%
Public school parents 54 54 46
Race/Ethnicity
Asians 56 57 40
Blacks 85 87 71
Latinos 58 54 49
Whites 55 53 48
Household income
Under $40,000 60 56 50
$40,000 to $80,000 59 54 50
$80,000 or more 56 59 44
April 2015 Californians and Education 17
PPIC Statewide Survey
PREPARING STUDENTS FOR COLLEGE AND CAREERS
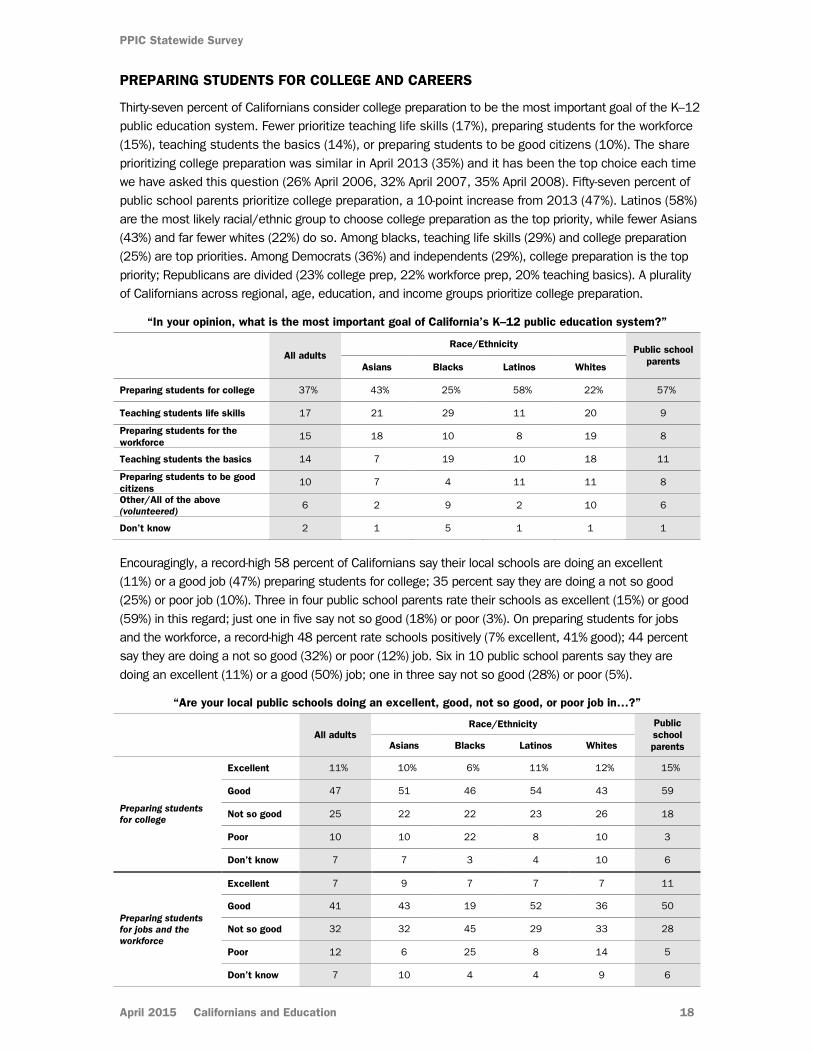
Thirty-seven percent of Californians consider college preparation to be the most important goal of the K–12 public education system. Fewer prioritize teaching life skills (17%), preparing students for the workforce (15%), teaching students the basics (14%), or preparing students to be good citizens (10%). The share prioritizing college preparation was similar in April 2013 (35%) and it has been the top choice each time we have asked this question (26% April 2006, 32% April 2007, 35% April 2008). Fifty-seven percent of public school parents prioritize college preparation, a 10-point increase from 2013 (47%). Latinos (58%) are the most likely racial/ethnic group to choose college preparation as the top priority, while fewer Asians (43%) and far fewer whites (22%) do so. Among blacks, teaching life skills (29%) and college preparation (25%) are top priorities. Among Democrats (36%) and independents (29%), college preparation is the top priority; Republicans are divided (23% college prep, 22% workforce prep, 20% teaching basics). A plurality of Californians across regional, age, education, and income groups prioritize college preparation.
“In your opinion, what is the most important goal of California’s K–12 public education system?”
All adults
Race/Ethnicity Public school parents Asians Blacks Latinos Whites
Preparing students for college 37% 43% 25% 58% 22% 57%
Teaching students life skills 17 21 29 11 20 9
Preparing students for the workforce
15 18 10 8 19 8
Teaching students the basics 14 7 19 10 18 11
Preparing students to be good citizens
10 7 4 11 11 8
Other/All of the above (volunteered)
6 2 9 2 10 6
Don’t know 2 1 5 1 1 1
Encouragingly, a record-high 58 percent of Californians say their local schools are doing an excellent (11%) or a good job (47%) preparing students for college; 35 percent say they are doing a not so good (25%) or poor job (10%). Three in four public school parents rate their schools as excellent (15%) or good (59%) in this regard; just one in five say not so good (18%) or poor (3%). On preparing students for jobs and the workforce, a record-high 48 percent rate schools positively (7% excellent, 41% good); 44 percent say they are doing a not so good (32%) or poor (12%) job. Six in 10 public school parents say they are doing an excellent (11%) or a good (50%) job; one in three say not so good (28%) or poor (5%).
“Are your local public schools doing an excellent, good, not so good, or poor job in…?”
All adults
Race/Ethnicity Public school parents Asians Blacks Latinos Whites
Preparing students for college
Excellent 11% 10% 6% 11% 12% 15%
Good 47 51 46 54 43 59
Not so good 25 22 22 23 26 18
Poor 10 10 22 8 10 3
Don’t know 7 7 3 4 10 6
Preparing students for jobs and the workforce
Excellent 7 9 7 7 7 11
Good 41 43 19 52 36 50
Not so good 32 32 45 29 33 28
Poor 12 6 25 8 14 5
Don’t know 7 10 4 4 9 6
April 2015 Californians and Education 18
PPIC Statewide Survey
STUDENT TESTING
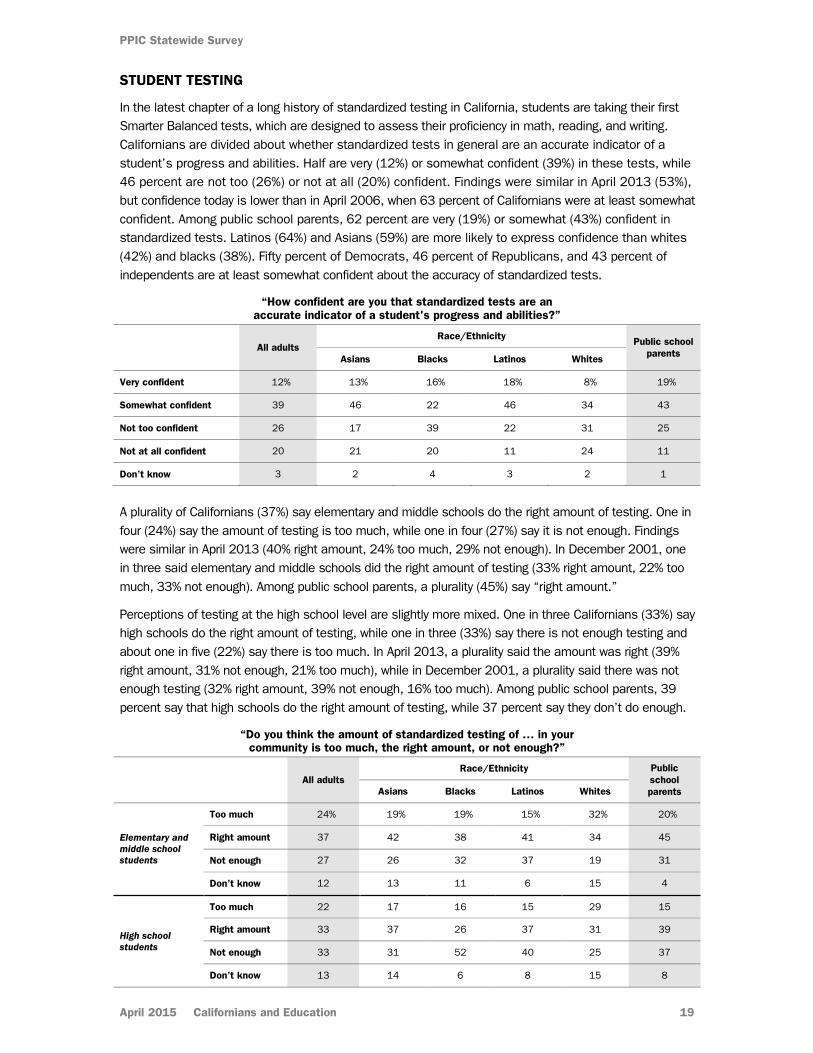
In the latest chapter of a long history of standardized testing in California, students are taking their first Smarter Balanced tests, which are designed to assess their proficiency in math, reading, and writing. Californians are divided about whether standardized tests in general are an accurate indicator of a student’s progress and abilities. Half are very (12%) or somewhat confident (39%) in these tests, while 46 percent are not too (26%) or not at all (20%) confident. Findings were similar in April 2013 (53%), but confidence today is lower than in April 2006, when 63 percent of Californians were at least somewhat confident. Among public school parents, 62 percent are very (19%) or somewhat (43%) confident in standardized tests. Latinos (64%) and Asians (59%) are more likely to express confidence than whites (42%) and blacks (38%). Fifty percent of Democrats, 46 percent of Republicans, and 43 percent of independents are at least somewhat confident about the accuracy of standardized tests.
“How confident are you that standardized tests are an accurate indicator of a student's progress and abilities?”
All adults
Race/Ethnicity Public school parents Asians Blacks Latinos Whites
Very confident 12% 13% 16% 18% 8% 19%
Somewhat confident 39 46 22 46 34 43
Not too confident 26 17 39 22 31 25
Not at all confident 20 21 20 11 24 11
Don’t know 3 2 4 3 2 1
A plurality of Californians (37%) say elementary and middle schools do the right amount of testing. One in four (24%) say the amount of testing is too much, while one in four (27%) say it is not enough. Findings were similar in April 2013 (40% right amount, 24% too much, 29% not enough). In December 2001, one in three said elementary and middle schools did the right amount of testing (33% right amount, 22% too much, 33% not enough). Among public school parents, a plurality (45%) say “right amount.”
Perceptions of testing at the high school level are slightly more mixed. One in three Californians (33%) say high schools do the right amount of testing, while one in three (33%) say there is not enough testing and about one in five (22%) say there is too much. In April 2013, a plurality said the amount was right (39% right amount, 31% not enough, 21% too much), while in December 2001, a plurality said there was not enough testing (32% right amount, 39% not enough, 16% too much). Among public school parents, 39 percent say that high schools do the right amount of testing, while 37 percent say they don’t do enough.
“Do you think the amount of standardized testing of … in your community is too much, the right amount, or not enough?”
All adults Race/Ethnicity Public
school parents Asians Blacks Latinos Whites
Elementary and middle school students
Too much 24% 19% 19% 15% 32% 20%
Right amount 37 42 38 41 34 45
Not enough 27 26 32 37 19 31
Don’t know 12 13 11 6 15 4
High school students
Too much 22 17 16 15 29 15
Right amount 33 37 26 37 31 39
Not enough 33 31 52 40 25 37
Don’t know 13 14 6 8 15 8
April 2015 Californians and Education 19
PPIC Statewide Survey
LOCAL SCHOOLS AND FUNDING
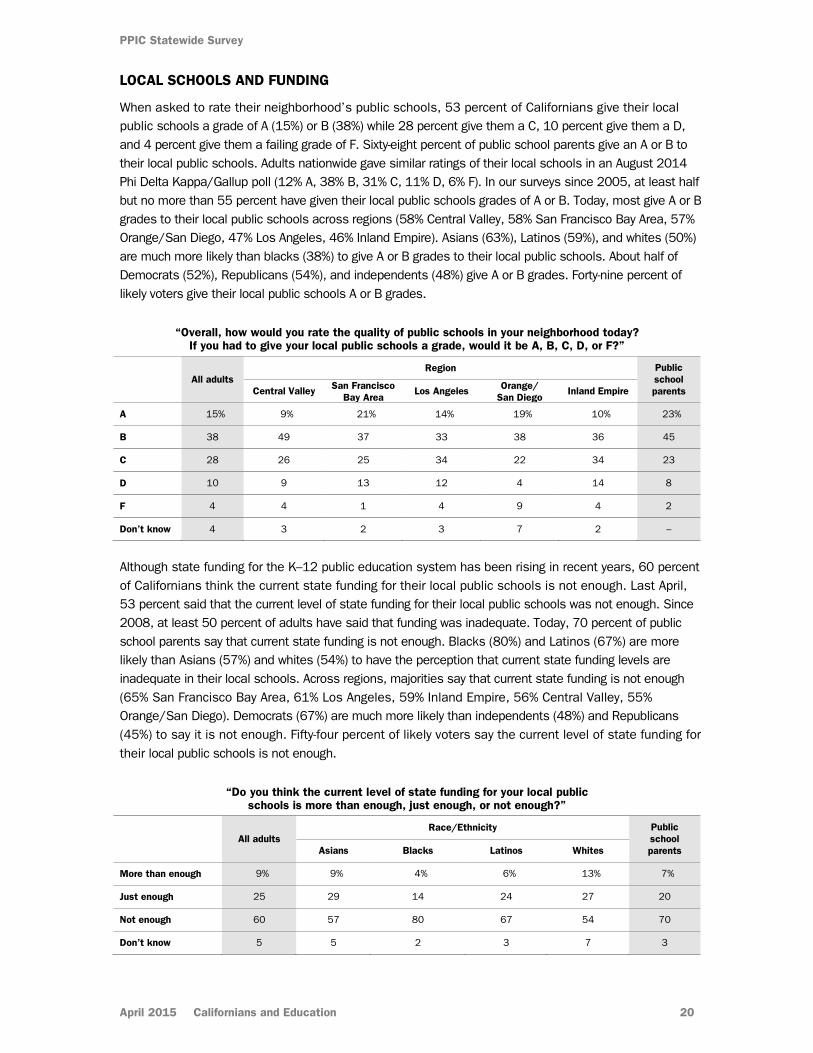
When asked to rate their neighborhood’s public schools, 53 percent of Californians give their local public schools a grade of A (15%) or B (38%) while 28 percent give them a C, 10 percent give them a D, and 4 percent give them a failing grade of F. Sixty-eight percent of public school parents give an A or B to their local public schools. Adults nationwide gave similar ratings of their local schools in an August 2014 Phi Delta Kappa/Gallup poll (12% A, 38% B, 31% C, 11% D, 6% F). In our surveys since 2005, at least half but no more than 55 percent have given their local public schools grades of A or B. Today, most give A or B grades to their local public schools across regions (58% Central Valley, 58% San Francisco Bay Area, 57% Orange/San Diego, 47% Los Angeles, 46% Inland Empire). Asians (63%), Latinos (59%), and whites (50%) are much more likely than blacks (38%) to give A or B grades to their local public schools. About half of Democrats (52%), Republicans (54%), and independents (48%) give A or B grades. Forty-nine percent of likely voters give their local public schools A or B grades.
“Overall, how would you rate the quality of public schools in your neighborhood today? If you had to give your local public schools a grade, would it be A, B, C, D, or F?”
All adults
Region Public school parents Central Valley San Francisco
Bay Area Los Angeles Orange/
San Diego Inland Empire
A 15% 9% 21% 14% 19% 10% 23%
B 38 49 37 33 38 36 45
C 28 26 25 34 22 34 23
D 10 9 13 12 4 14 8
F 4 4 1 4 9 4 2
Don’t know 4 3 2 3 7 2 –
Although state funding for the K–12 public education system has been rising in recent years, 60 percent of Californians think the current state funding for their local public schools is not enough. Last April, 53 percent said that the current level of state funding for their local public schools was not enough. Since 2008, at least 50 percent of adults have said that funding was inadequate. Today, 70 percent of public school parents say that current state funding is not enough. Blacks (80%) and Latinos (67%) are more likely than Asians (57%) and whites (54%) to have the perception that current state funding levels are inadequate in their local schools. Across regions, majorities say that current state funding is not enough (65% San Francisco Bay Area, 61% Los Angeles, 59% Inland Empire, 56% Central Valley, 55% Orange/San Diego). Democrats (67%) are much more likely than independents (48%) and Republicans (45%) to say it is not enough. Fifty-four percent of likely voters say the current level of state funding for their local public schools is not enough.
“Do you think the current level of state funding for your local public schools is more than enough, just enough, or not enough?”
All adults
Race/Ethnicity Public school parents Asians Blacks Latinos Whites
More than enough 9% 9% 4% 6% 13% 7%
Just enough 25 29 14 24 27 20
Not enough 60 57 80 67 54 70
Don’t know 5 5 2 3 7 3
April 2015 Californians and Education 20
PPIC Statewide Survey
SCHOOLS AND STATE REVENUES
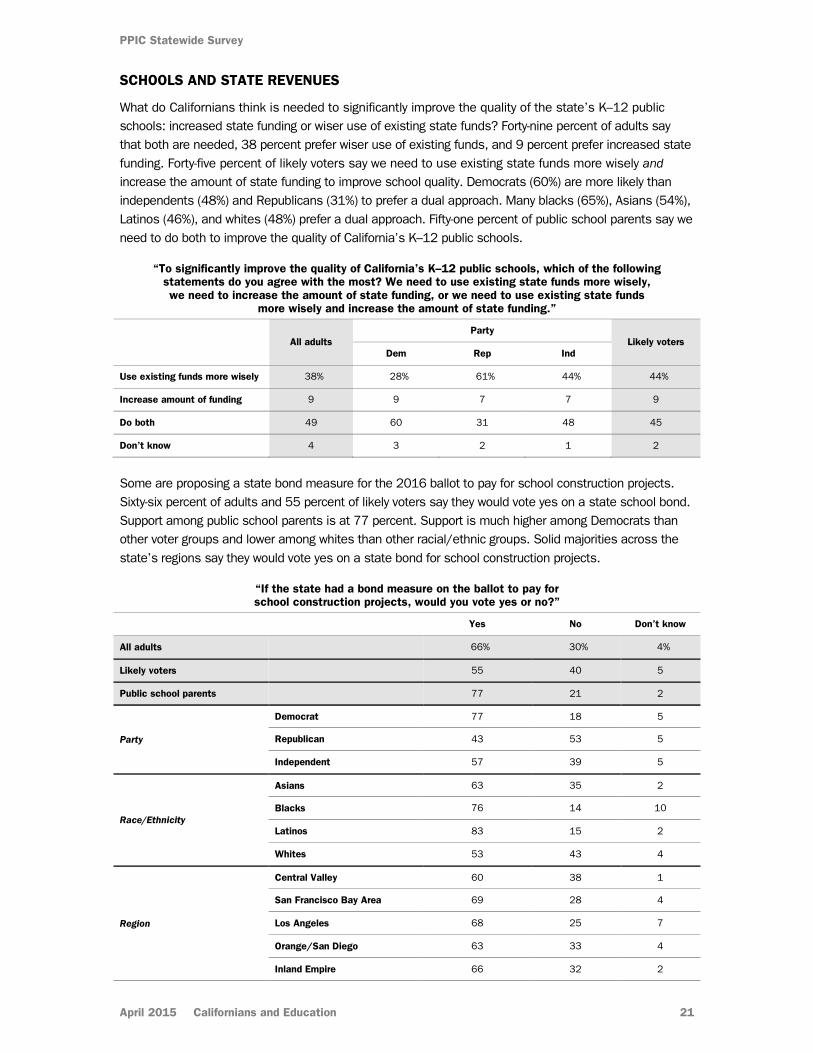
What do Californians think is needed to significantly improve the quality of the state’s K–12 public schools: increased state funding or wiser use of existing state funds? Forty-nine percent of adults say that both are needed, 38 percent prefer wiser use of existing funds, and 9 percent prefer increased state funding. Forty-five percent of likely voters say we need to use existing state funds more wisely and increase the amount of state funding to improve school quality. Democrats (60%) are more likely than independents (48%) and Republicans (31%) to prefer a dual approach. Many blacks (65%), Asians (54%), Latinos (46%), and whites (48%) prefer a dual approach. Fifty-one percent of public school parents say we need to do both to improve the quality of California’s K–12 public schools.
“To significantly improve the quality of California’s K–12 public schools, which of the following statements do you agree with the most? We need to use existing state funds more wisely, we need to increase the amount of state funding, or we need to use existing state funds
more wisely and increase the amount of state funding.”
All adults
Party Likely voters
Dem Rep Ind
Use existing funds more wisely 38% 28% 61% 44% 44%
Increase amount of funding 9 9 7 7 9
Do both 49 60 31 48 45
Don’t know 4 3 2 1 2
Some are proposing a state bond measure for the 2016 ballot to pay for school construction projects. Sixty-six percent of adults and 55 percent of likely voters say they would vote yes on a state school bond. Support among public school parents is at 77 percent. Support is much higher among Democrats than other voter groups and lower among whites than other racial/ethnic groups. Solid majorities across the state’s regions say they would vote yes on a state bond for school construction projects.
“If the state had a bond measure on the ballot to pay for school construction projects, would you vote yes or no?”
Yes No Don’t know
All adults 66% 30% 4%
Likely voters 55 40 5
Public school parents 77 21 2
Party
Democrat 77 18 5
Republican 43 53 5
Independent 57 39 5
Race/Ethnicity
Asians 63 35 2
Blacks 76 14 10
Latinos 83 15 2
Whites 53 43 4
Region
Central Valley 60 38 1
San Francisco Bay Area 69 28 4
Los Angeles 68 25 7
Orange/San Diego 63 33 4
Inland Empire 66 32 2
April 2015 Californians and Education 21
PPIC Statewide Survey
RAISING LOCAL SCHOOL REVENUES
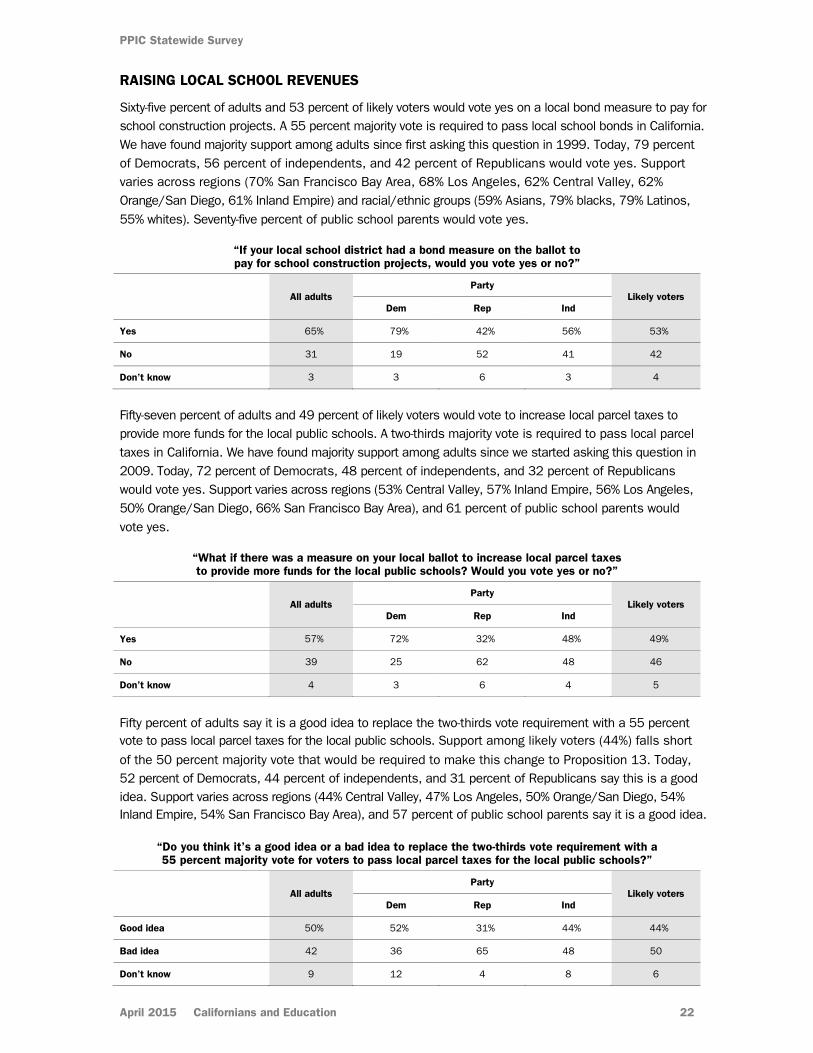
Sixty-five percent of adults and 53 percent of likely voters would vote yes on a local bond measure to pay for school construction projects. A 55 percent majority vote is required to pass local school bonds in California. We have found majority support among adults since first asking this question in 1999. Today, 79 percent of Democrats, 56 percent of independents, and 42 percent of Republicans would vote yes. Support varies across regions (70% San Francisco Bay Area, 68% Los Angeles, 62% Central Valley, 62% Orange/San Diego, 61% Inland Empire) and racial/ethnic groups (59% Asians, 79% blacks, 79% Latinos, 55% whites). Seventy-five percent of public school parents would vote yes.
“If your local school district had a bond measure on the ballot to pay for school construction projects, would you vote yes or no?”
All adults Party
Likely voters Dem Rep Ind
Yes 65% 79% 42% 56% 53%
No 31 19 52 41 42
Don’t know 3 3 6 3 4
Fifty-seven percent of adults and 49 percent of likely voters would vote to increase local parcel taxes to provide more funds for the local public schools. A two-thirds majority vote is required to pass local parcel taxes in California. We have found majority support among adults since we started asking this question in 2009. Today, 72 percent of Democrats, 48 percent of independents, and 32 percent of Republicans would vote yes. Support varies across regions (53% Central Valley, 57% Inland Empire, 56% Los Angeles, 50% Orange/San Diego, 66% San Francisco Bay Area), and 61 percent of public school parents would vote yes.
“What if there was a measure on your local ballot to increase local parcel taxes to provide more funds for the local public schools? Would you vote yes or no?”
All adults Party
Likely voters Dem Rep Ind
Yes 57% 72% 32% 48% 49%
No 39 25 62 48 46
Don’t know 4 3 6 4 5
Fifty percent of adults say it is a good idea to replace the two-thirds vote requirement with a 55 percent vote to pass local parcel taxes for the local public schools. Support among likely voters (44%) falls short
of the 50 percent majority vote that would be required to make this change to Proposition 13. Today, 52 percent of Democrats, 44 percent of independents, and 31 percent of Republicans say this is a good idea. Support varies across regions (44% Central Valley, 47% Los Angeles, 50% Orange/San Diego, 54% Inland Empire, 54% San Francisco Bay Area), and 57 percent of public school parents say it is a good idea.
“Do you think it’s a good idea or a bad idea to replace the two-thirds vote requirement with a 55 percent majority vote for voters to pass local parcel taxes for the local public schools?”
All adults Party
Likely voters Dem Rep Ind
Good idea 50% 52% 31% 44% 44%
Bad idea 42 36 65 48 50
Don’t know 9 12 4 8 6
April 2015 Californians and Education 22
PPIC Statewide Survey
EDUCATIONAL EXPECTATIONS AND ASPIRATIONS
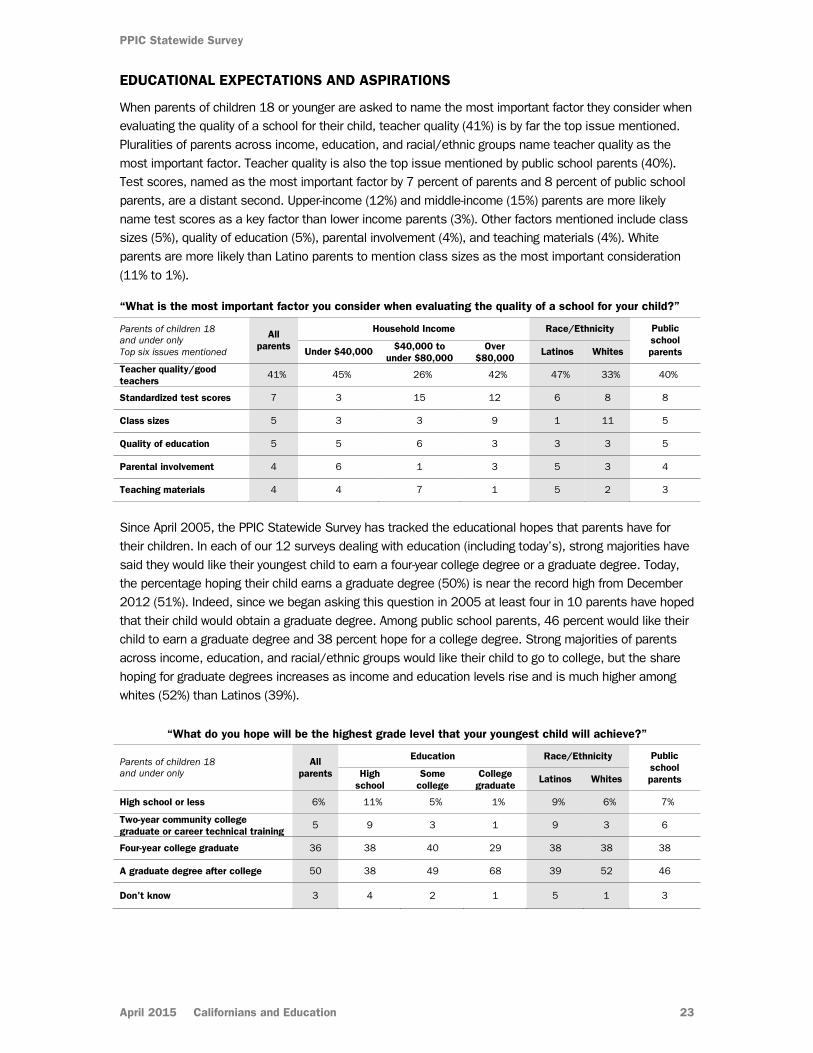
When parents of children 18 or younger are asked to name the most important factor they consider when evaluating the quality of a school for their child, teacher quality (41%) is by far the top issue mentioned. Pluralities of parents across income, education, and racial/ethnic groups name teacher quality as the most important factor. Teacher quality is also the top issue mentioned by public school parents (40%). Test scores, named as the most important factor by 7 percent of parents and 8 percent of public school parents, are a distant second. Upper-income (12%) and middle-income (15%) parents are more likely name test scores as a key factor than lower income parents (3%). Other factors mentioned include class sizes (5%), quality of education (5%), parental involvement (4%), and teaching materials (4%). White parents are more likely than Latino parents to mention class sizes as the most important consideration (11% to 1%).
“What is the most important factor you consider when evaluating the quality of a school for your child?”
Parents of children 18 and under only Top six issues mentioned
All parents
Household Income Race/Ethnicity Public school parents Under $40,000 $40,000 to
under $80,000 Over
$80,000 Latinos Whites
Teacher quality/good teachers
41% 45% 26% 42% 47% 33% 40%
Standardized test scores 7 3 15 12 6 8 8
Class sizes 5 3 3 9 1 11 5
Quality of education 5 5 6 3 3 3 5
Parental involvement 4 6 1 3 5 3 4
Teaching materials 4 4 7 1 5 2 3
Since April 2005, the PPIC Statewide Survey has tracked the educational hopes that parents have for their children. In each of our 12 surveys dealing with education (including today’s), strong majorities have said they would like their youngest child to earn a four-year college degree or a graduate degree. Today, the percentage hoping their child earns a graduate degree (50%) is near the record high from December 2012 (51%). Indeed, since we began asking this question in 2005 at least four in 10 parents have hoped that their child would obtain a graduate degree. Among public school parents, 46 percent would like their child to earn a graduate degree and 38 percent hope for a college degree. Strong majorities of parents across income, education, and racial/ethnic groups would like their child to go to college, but the share hoping for graduate degrees increases as income and education levels rise and is much higher among whites (52%) than Latinos (39%).
“What do you hope will be the highest grade level that your youngest child will achieve?”
Parents of children 18 and under only
All parents
Education Race/Ethnicity Public school parents High
school
Some college
College graduate
Latinos Whites
High school or less 6% 11% 5% 1% 9% 6% 7%
Two-year community college graduate or career technical training
5 9 3 1 9 3 6
Four-year college graduate 36 38 40 29 38 38 38
A graduate degree after college 50 38 49 68 39 52 46
Don't know 3 4 2 1 5 1 3
April 2015 Californians and Education 23
REGIONAL MAP
April 2015 Californians and Education 24
METHODOLOGY
The PPIC Statewide Survey is directed by Mark Baldassare, president and CEO and survey director at the Public Policy Institute of California, with assistance from Lunna Lopes, project manager for this survey, Dean Bonner, associate survey director, and survey research associate Sonja Petek. This survey on Californians and Education is supported with funding from the S. D. Bechtel, Jr. Foundation, The Dirk and Charlene Kabcenell Foundation, the Silver Giving Foundation, and the Stuart Foundation. The PPIC Statewide Survey invites input, comments, and suggestions from policy and public opinion experts and from its own advisory committee, but survey methods, questions, and content are determined solely by PPIC’s survey team.
Findings in this report are based on a survey of 1,706 California adult residents, including 1,023 interviewed on landline telephones and 683 interviewed on cell phones. Interviews took an average of 19 minutes to complete. Interviewing took place on weekend days and weekday nights from April 3–13, 2015.
Landline interviews were conducted using a computer-generated random sample of telephone numbers that ensured that both listed and unlisted numbers were called. All landline telephone exchanges in California were eligible for selection, and the sample telephone numbers were called as many as six times to increase the likelihood of reaching eligible households. Once a household was reached, an adult respondent (age 18 or older) was randomly chosen for interviewing using the “last birthday method” to avoid biases in age and gender.
Cell phone interviews were conducted using a computer-generated random sample of cell phone numbers. All cell phone numbers with California area codes were eligible for selection, and the sample telephone numbers were called as many as eight times to increase the likelihood of reaching an eligible respondent. Once a cell phone user was reached, it was verified that this person was age 18 or older, a resident of California, and in a safe place to continue the survey (e.g., not driving).
Cell phone respondents were offered a small reimbursement to help defray the cost of the call. Cell phone interviews were conducted with adults who have cell phone service only and with those who have both cell phone and landline service in the household.
Live landline and cell phone interviews were conducted by Abt SRBI, Inc., in English and Spanish, according to respondents’ preferences. Accent on Languages, Inc., translated new survey questions into Spanish.
Abt SRBI uses the U.S. Census Bureau’s 2011–2013 American Community Survey’s (ACS) Public Use Microdata Series for California (with regional coding information from the University of Minnesota’s Integrated Public Use Microdata Series for California) to compare certain demographic characteristics of the survey sample—region, age, gender, race/ethnicity, and education—with the characteristics of California’s adult population. The survey sample was closely comparable to the ACS figures. To estimate landline and cell phone service in California, Abt SRBI used 2013 state-level estimates released by the National Center for Health Statistics—which used data from the National Health Interview Survey (NHIS) and the ACS—and 2014 estimates for the West Census Region in the latest NHIS report. The estimates for California were then compared against landline and cell phone service reported in this survey. We also used voter registration data from the California Secretary of State to compare the party registration of registered voters in our sample to party registration statewide. The landline and cell phone samples were then integrated using a frame integration weight, while sample
April 2015 Californians and Education 25
PPIC Statewide Survey
balancing adjusted for differences across regional, age, gender, race/ethnicity, education, telephone service, and party registration groups.
The sampling error, taking design effects from weighting into consideration, is ±3.7 percent at the 95 percent confidence level for the total unweighted sample of 1,706 adults. This means that 95 times out of 100, the results will be within 3.7 percentage points of what they would be if all adults in California were interviewed. The sampling error for unweighted subgroups is larger: for the 1,405 registered voters, the sampling error is ±4 percent; for the 1,069 likely voters, it is ±4.4 percent; for the 501 parents it is ±6.4 percent; for the 355 public school parents it is ±7.7 percent. Sampling error is only one type of error to which surveys are subject. Results may also be affected by factors such as question wording, question order, and survey timing.
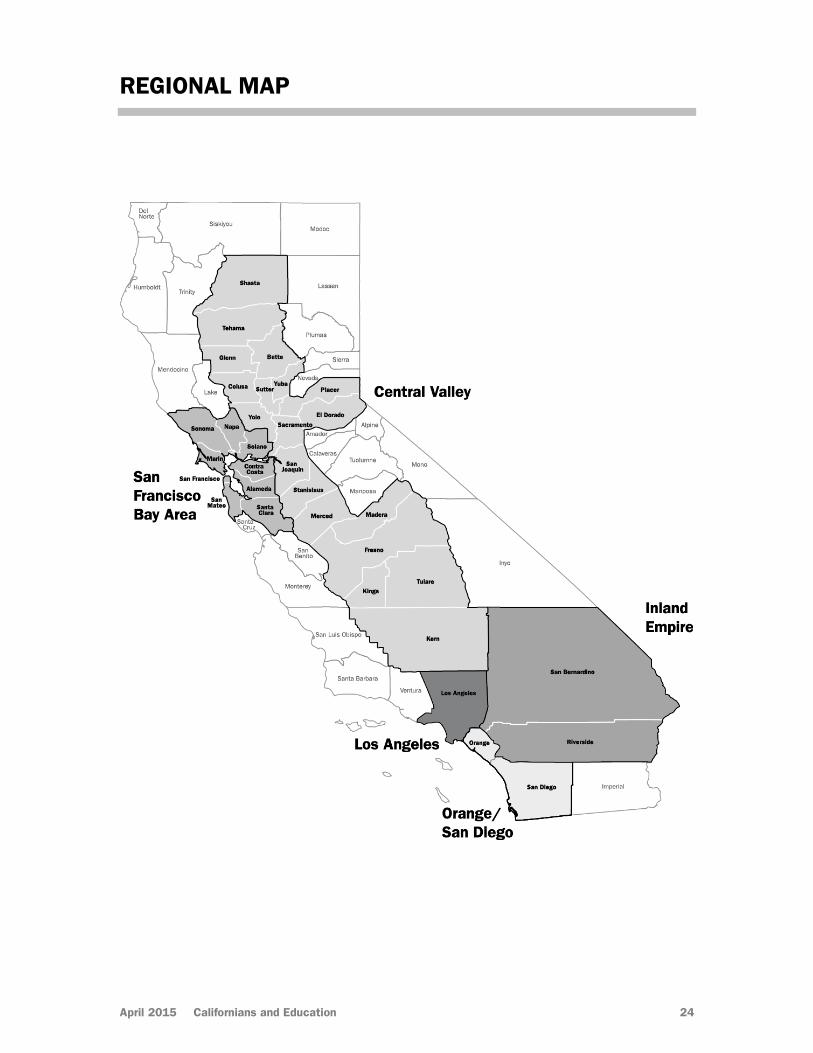
We present results for five geographic regions, accounting for approximately 90 percent of the state population. “Central Valley” includes Butte, Colusa, El Dorado, Fresno, Glenn, Kern, Kings, Madera, Merced, Placer, Sacramento, San Joaquin, Shasta, Stanislaus, Sutter, Tehama, Tulare, Yolo, and Yuba Counties. “San Francisco Bay Area” includes Alameda, Contra Costa, Marin, Napa, San Francisco, San Mateo, Santa Clara, Solano, and Sonoma Counties. “Los Angeles” refers to Los Angeles County, “Inland Empire” refers to Riverside and San Bernardino Counties, and “Orange/San Diego” refers to Orange and San Diego Counties. Residents of other geographic areas are included in the results reported for all adults, registered voters, and likely voters, but sample sizes for these less populous areas are not large enough to report separately. In several places, we refer to coastal and inland counties. The coastal region refers to the counties along the California coast from Del Norte County to San Diego County and includes all the San Francisco Bay Area counties. All other counties are included in the inland region.
We present specific results for non-Hispanic whites, who account for 43 percent of the state’s adult population, and also for Latinos, who account for about a third of the state’s adult population and constitute one of the fastest-growing voter groups. We also present results for non-Hispanic Asians, who make up about 15 percent of the state’s adult population, and non-Hispanic blacks, who comprise about 6 percent. Results for other racial/ethnic groups—such as Native Americans—are included in the results reported for all adults, public school parents, registered voters, and likely voters, but sample sizes are not large enough for separate analysis. We compare the opinions of those who report they are registered Democrats, registered Republicans, and decline-to-state or independent voters; the results for those who say they are registered to vote in other parties are not large enough for separate analysis. We also analyze the responses of likely voters—so designated per their responses to voter registration survey questions, previous election participation, and current interest in politics.
The percentages presented in the report tables and in the questionnaire may not add to 100 due to rounding.
We compare current PPIC Statewide Survey results to those in our earlier surveys and to those in national surveys by Gallup, Phi Delta Kappa/Gallup, and Pew Research Center. Additional details about our methodology can be found at www.ppic.org/content/other/SurveyMethodology.pdf and are available upon request through [email protected].
April 2015 Californians and Education 26
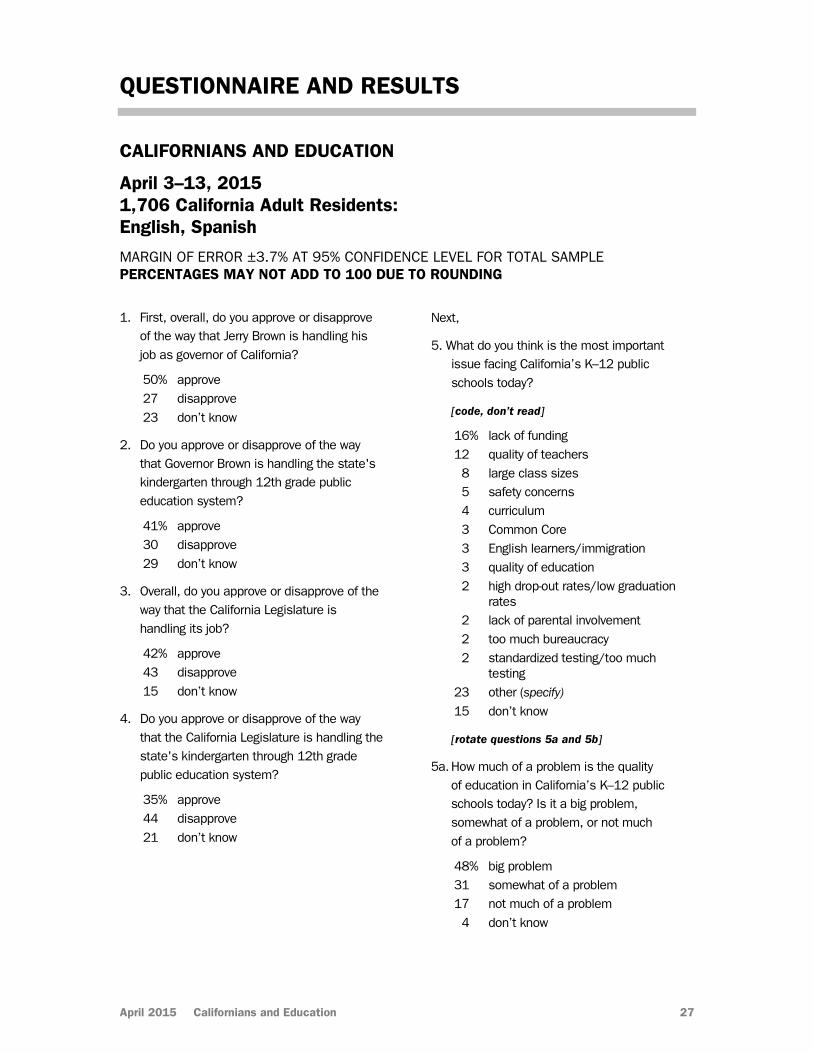
QUESTIONNAIRE AND RESULTS
CALIFORNIANS AND EDUCATION
April 3–13, 2015 1,706 California Adult Residents: English, Spanish
MARGIN OF ERROR ±3.7% AT 95% CONFIDENCE LEVEL FOR TOTAL SAMPLE PERCENTAGES MAY NOT ADD TO 100 DUE TO ROUNDING
1. First, overall, do you approve or disapprove of the way that Jerry Brown is handling his job as governor of California?
50% approve 27 disapprove 23 don’t know
2. Do you approve or disapprove of the way that Governor Brown is handling the state's kindergarten through 12th grade public education system?
41% approve 30 disapprove 29 don’t know
3. Overall, do you approve or disapprove of the way that the California Legislature is handling its job?
42% approve 43 disapprove 15 don’t know
4. Do you approve or disapprove of the way that the California Legislature is handling the state's kindergarten through 12th grade public education system?
35% approve 44 disapprove 21 don’t know
Next,
5. What do you think is the most important issue facing California’s K–12 public schools today?
[code, don’t read]
16% lack of funding 12 quality of teachers 8 large class sizes 5 safety concerns 4 curriculum 3 Common Core 3 English learners/immigration 3 quality of education 2 high drop-out rates/low graduation
rates 2 lack of parental involvement 2 too much bureaucracy 2 standardized testing/too much
testing 23 other (specify) 15 don’t know
[rotate questions 5a and 5b]
5a. How much of a problem is the quality of education in California’s K–12 public schools today? Is it a big problem, somewhat of a problem, or not much of a problem?
48% big problem 31 somewhat of a problem 17 not much of a problem 4 don’t know
April 2015 Californians and Education 27
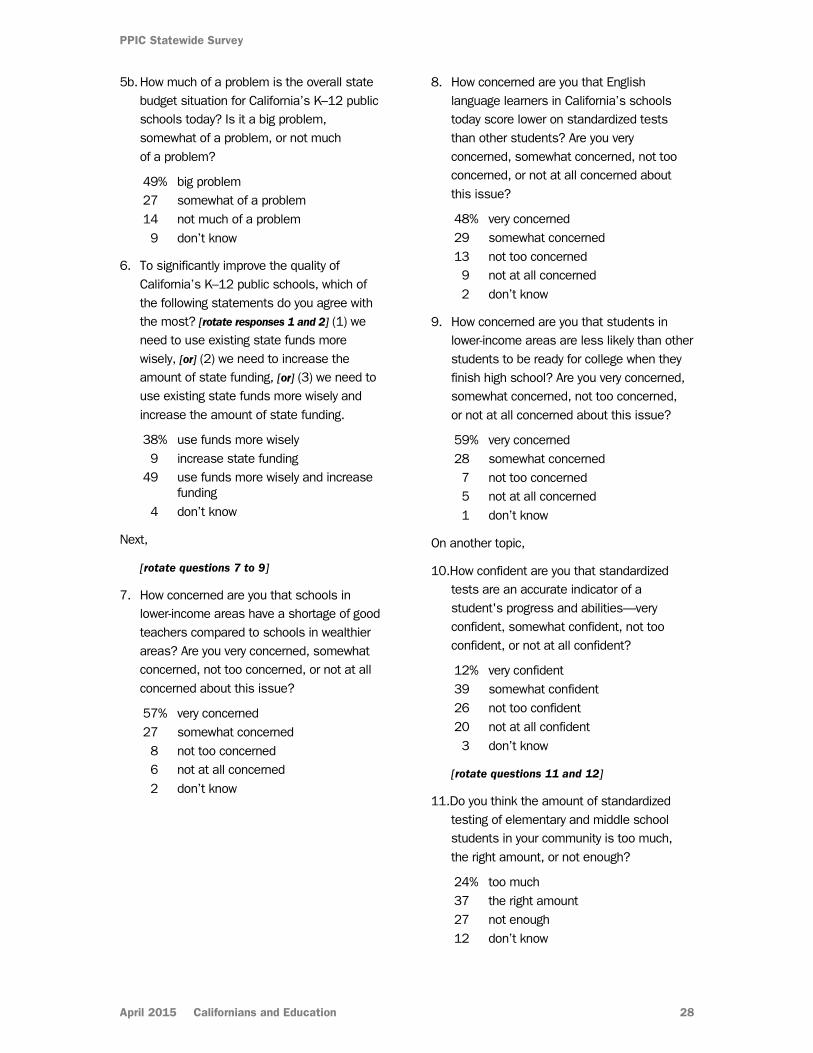
PPIC Statewide Survey
5b. How much of a problem is the overall state budget situation for California’s K–12 public schools today? Is it a big problem, somewhat of a problem, or not much of a problem?
49% big problem 27 somewhat of a problem 14 not much of a problem 9 don’t know
6. To significantly improve the quality of California’s K–12 public schools, which of the following statements do you agree with the most? [rotate responses 1 and 2] (1) we need to use existing state funds more wisely, [or] (2) we need to increase the amount of state funding, [or] (3) we need to use existing state funds more wisely and increase the amount of state funding.
38% use funds more wisely 9 increase state funding 49 use funds more wisely and increase
funding 4 don’t know
Next,
[rotate questions 7 to 9]
7. How concerned are you that schools in lower-income areas have a shortage of good teachers compared to schools in wealthier areas? Are you very concerned, somewhat concerned, not too concerned, or not at all concerned about this issue?
57% very concerned 27 somewhat concerned 8 not too concerned 6 not at all concerned 2 don’t know
8. How concerned are you that English language learners in California’s schools today score lower on standardized tests than other students? Are you very concerned, somewhat concerned, not too concerned, or not at all concerned about this issue?
48% very concerned 29 somewhat concerned 13 not too concerned 9 not at all concerned 2 don’t know
9. How concerned are you that students in lower-income areas are less likely than other students to be ready for college when they finish high school? Are you very concerned, somewhat concerned, not too concerned, or not at all concerned about this issue?
59% very concerned 28 somewhat concerned 7 not too concerned 5 not at all concerned 1 don’t know
On another topic,
10.How confident are you that standardized tests are an accurate indicator of a student's progress and abilities—very confident, somewhat confident, not too confident, or not at all confident?
12% very confident 39 somewhat confident 26 not too confident 20 not at all confident 3 don’t know
[rotate questions 11 and 12]
11.Do you think the amount of standardized testing of elementary and middle school students in your community is too much, the right amount, or not enough?
24% too much 37 the right amount 27 not enough 12 don’t know
April 2015 Californians and Education 28
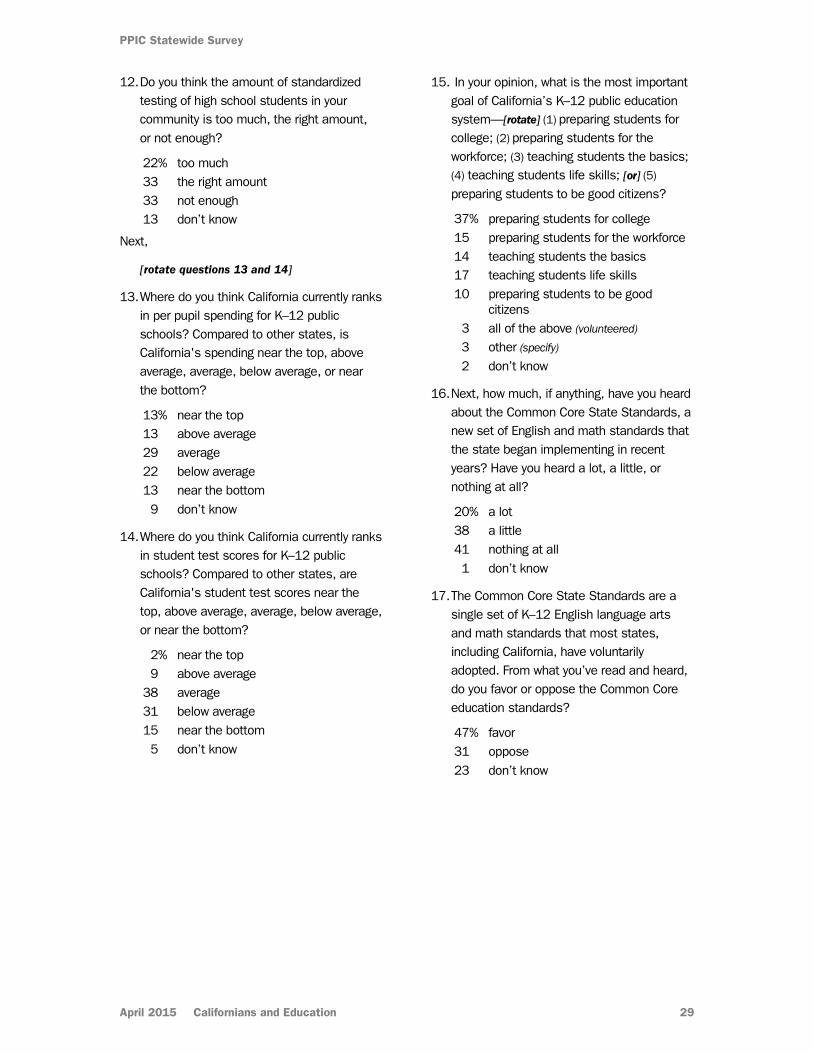
PPIC Statewide Survey
12. Do you think the amount of standardized testing of high school students in your community is too much, the right amount, or not enough?
22% too much 33 the right amount 33 not enough 13 don’t know
Next,
[rotate questions 13 and 14]
13. Where do you think California currently ranks in per pupil spending for K–12 public schools? Compared to other states, is California's spending near the top, above average, average, below average, or near the bottom?
13% near the top 13 above average 29 average 22 below average 13 near the bottom 9 don’t know
14. Where do you think California currently ranks in student test scores for K–12 public schools? Compared to other states, are California's student test scores near the top, above average, average, below average, or near the bottom?
2% near the top 9 above average 38 average 31 below average 15 near the bottom 5 don’t know
15. In your opinion, what is the most important goal of California’s K–12 public education system—[rotate] (1) preparing students for college; (2) preparing students for the workforce; (3) teaching students the basics; (4) teaching students life skills; [or] (5) preparing students to be good citizens?
37% preparing students for college 15 preparing students for the workforce 14 teaching students the basics 17 teaching students life skills 10 preparing students to be good
citizens 3 all of the above (volunteered) 3 other (specify) 2 don’t know
16. Next, how much, if anything, have you heard about the Common Core State Standards, a new set of English and math standards that the state began implementing in recent years? Have you heard a lot, a little, or nothing at all?
20% a lot 38 a little 41 nothing at all 1 don’t know
17. The Common Core State Standards are a single set of K–12 English language arts and math standards that most states, including California, have voluntarily adopted. From what you’ve read and heard, do you favor or oppose the Common Core education standards?
47% favor 31 oppose 23 don’t know
April 2015 Californians and Education 29
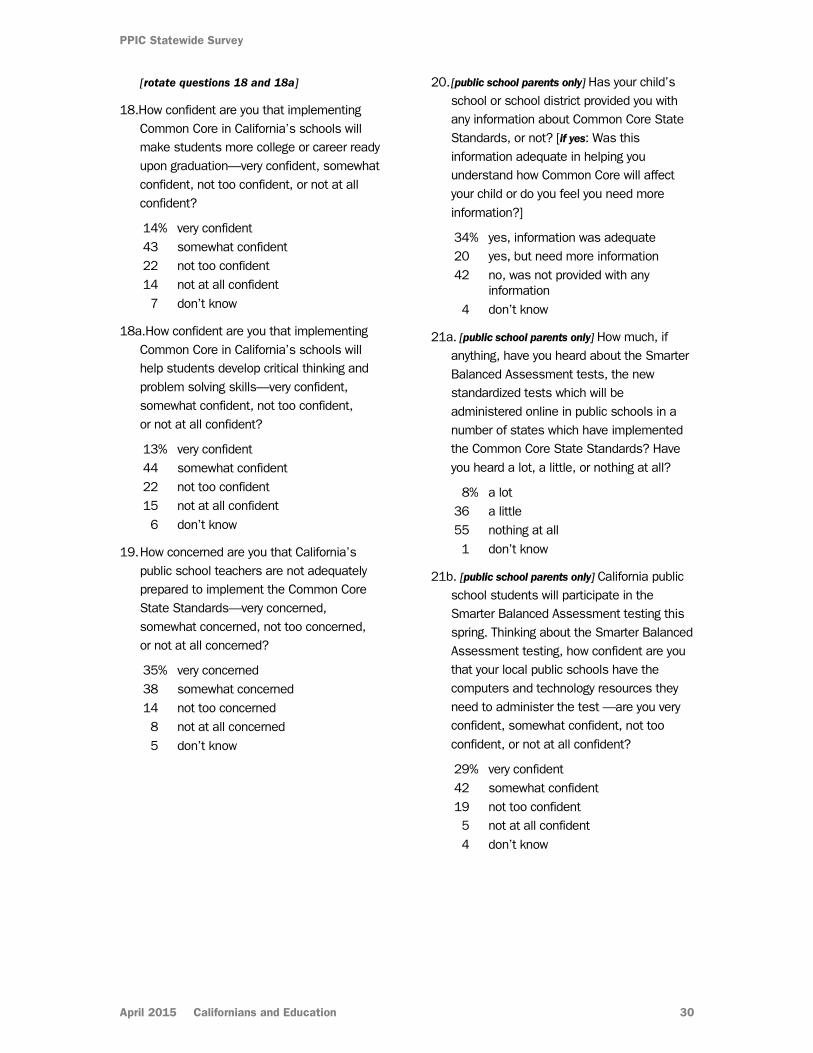
PPIC Statewide Survey
[rotate questions 18 and 18a]
18.How confident are you that implementing Common Core in California’s schools will make students more college or career ready upon graduation—very confident, somewhat confident, not too confident, or not at all confident?
14% very confident 43 somewhat confident 22 not too confident 14 not at all confident 7 don’t know
18a.How confident are you that implementing Common Core in California’s schools will help students develop critical thinking and problem solving skills—very confident, somewhat confident, not too confident, or not at all confident?
13% very confident 44 somewhat confident 22 not too confident 15 not at all confident 6 don’t know
19. How concerned are you that California’s public school teachers are not adequately prepared to implement the Common Core State Standards—very concerned, somewhat concerned, not too concerned, or not at all concerned?
35% very concerned 38 somewhat concerned 14 not too concerned 8 not at all concerned 5 don’t know
20. [public school parents only] Has your child’s school or school district provided you with any information about Common Core State Standards, or not? [if yes: Was this information adequate in helping you understand how Common Core will affect your child or do you feel you need more information?]
34% yes, information was adequate 20 yes, but need more information 42 no, was not provided with any
information 4 don’t know
21a. [public school parents only] How much, if anything, have you heard about the Smarter Balanced Assessment tests, the new standardized tests which will be administered online in public schools in a number of states which have implemented the Common Core State Standards? Have you heard a lot, a little, or nothing at all?
8% a lot 36 a little 55 nothing at all 1 don’t know
21b. [public school parents only] California public school students will participate in the Smarter Balanced Assessment testing this spring. Thinking about the Smarter Balanced Assessment testing, how confident are you that your local public schools have the computers and technology resources they need to administer the test —are you very confident, somewhat confident, not too confident, or not at all confident?
29% very confident 42 somewhat confident 19 not too confident 5 not at all confident 4 don’t know
April 2015 Californians and Education 30
PPIC Statewide Survey
21c. [public school parents only] Both the new Smarter Balanced Assessment tests and the tests they replaced measure whether students are proficient in math and reading and writing at grade level. Compared to past test scores do you think that as a whole California students will score higher, lower or about the same on the new Smarter Balanced Assessment tests? [if higher: Do you think California students will score much higher or somewhat higher?] [if lower: Do you think California students will score much lower or somewhat lower?]
10% much higher 19 somewhat higher 42 about the same 17 somewhat lower 6 much lower 6 don’t know
22. Next, overall, how would you rate the quality of public schools in your neighborhood today? If you had to give your local public schools a grade, would it be A, B, C, D, or F?
15% A 38 B 28 C 10 D 4 F 4 don’t know
[rotate questions 23 and 24]
23. Are your local public schools doing an excellent, good, not so good, or poor job in preparing students for college?
11% excellent 47 good 25 not so good 10 poor 7 don’t know
24. Are your local public schools doing an excellent, good, not so good, or poor job in preparing students for jobs and the workforce?
7% excellent 41 good 32 not so good 12 poor 7 don’t know
25. Do you think the current level of state funding for your local public schools is more than enough, just enough, or not enough?
9% more than enough 25 just enough 60 not enough 5 don’t know
26. If the state had a bond measure on the ballot to pay for school construction projects, would you vote yes or no?
66% yes 30 no 4 don’t know
[rotate questions 27 and 28]
27. If your local school district had a bond measure on the ballot to pay for school construction projects, would you vote yes or no?
65% yes 31 no 3 don’t know
28. What if there was a measure on your local ballot to increase local parcel taxes to provide more funds for the local public schools? Would you vote yes or no?
57% yes 39 no 4 don’t know
April 2015 Californians and Education 31
PPIC Statewide Survey
29. Do you think it’s a good idea or a bad idea to replace the two-thirds vote requirement with a 55 percent majority vote for voters to pass local parcel taxes for the local public schools?
50% good idea 42 bad idea 9 don’t know
Changing topics,
30. Do you think that school districts in lower-income areas of the state have the same amount of resources—including good teachers and classroom materials—as school districts in wealthier areas, or not?
13% yes, have the same amount of resources
82 no, do not have the same amount of resources
5 don’t know
31. Next, how much, if anything, have you heard about the Local Control Funding Formula, a policy enacted last year that changes the way K–12 public school districts are funded in California? Have you heard a lot, a little, or nothing at all?
2% a lot 22 a little 75 nothing at all 1 don’t know
32. The Local Control Funding Formula provides additional funding to school districts that have more [rotate] [English language learners] [and] [lower-income students] and gives local school districts more flexibility over how state funding is spent. In general, do you favor or oppose this plan?
70% favor 21 oppose 10 don’t know
33. As the state implements the Local Control Funding Formula, how confident are you that local school districts which receive additional funding will spend that money on programs and support for [rotate in same
order as q32] [English language learners] [and] [lower-income students]? Are you very confident, somewhat confident, not too confident, or not at all confident?
10% very confident 46 somewhat confident 27 not too confident 15 not at all confident 2 don’t know
34. As the state implements the Local Control Funding Formula, do you think the academic achievement of [rotate in same order as q32]
[English language learners] [and] [lower-income students] will or will not improve? (if it will: Do you think it will improve a lot or somewhat?)
19% improve a lot 49 improve somewhat 25 will not improve 7 don’t know
35a. [public school parents only] California’s new school funding law, the Local Control Funding Formula requires school districts to seek input from parents in developing their accountability plans for how to allocate resources. Did your child’s school or school district provide you with information about how to become involved, or not?
42% yes 54 no 4 don’t know
35b. [public school parents only] And were you involved in the development of your local school district’s accountability plan? [if yes: Were you very involved or somewhat involved?]
3% yes, very involved 14 yes, somewhat involved 82 no, not involved 1 don’t know
April 2015 Californians and Education 32
PPIC Statewide Survey
36. [parents of children 18 and under only] What is the most important factor you consider when evaluating the quality of a school for your child?
[code, don’t read]
41% teacher quality/good teachers 7 standardized test scores 5 class sizes 5 quality of education 4 parental involvement 4 teaching materials 2 availability of college level classes 2 safety concerns 2 school facilities 20 other (specify) 8 don’t know
36a. [parents of children 18 and under only] In general, do you think parents in your local community are very involved, somewhat involved, not too involved, or not at all involved in their child’s school?
23% very involved 45 somewhat involved 24 not too involved 6 not at all involved 3 don’t know
36b. [parents of children 18 and under only] What do you hope will be the highest grade level that your youngest child will achieve: some high school; high school graduate; two-year community college graduate or career technical training; four-year college graduate; or a graduate degree after college?
– some high school 6% high school graduate 5 two-year community college graduate
or career technical training 36 four-year college graduate 50 a graduate degree after college 3 don’t know
36c. [parents of children 18 and under only] Overall, how would you rate the quality of your child’s school’s technology resources, such as computers, Internet speed, and trained IT staff? Would you say the quality is excellent, good, fair or poor?
17% excellent 38 good 29 fair 6 poor 10 don’t know
37. Next, some people are registered to vote and others are not. Are you absolutely certain that you are registered to vote in California?
66% yes [ask q37a] 34 no [skip to q38b]
37a.Are you registered as a Democrat, a Republican, another party, or are you registered as a decline-to-state or independent voter?
43% Democrat [ask q38] 28 Republican [ask q38a] 5 another party (specify) [skip to q39] 24 independent [skip to q38b]
38. Would you call yourself a strong Democrat or not a very strong Democrat?
57% strong 41 not very strong 2 don’t know
[skip to q39]
38a.Would you call yourself a strong Republican or not a very strong Republican?
57% strong 39 not very strong 5 don’t know
[skip to q39]
38b.Do you think of yourself as closer to the Republican Party or Democratic Party?
19% Republican Party 46 Democratic Party 25 neither 11 don’t know
April 2015 Californians and Education 33
PPIC Statewide Survey
39. Next, would you consider yourself to be politically: [read list, rotate order top to bottom]
11% very liberal 20 somewhat liberal 29 middle-of-the-road 25 somewhat conservative 13 very conservative 3 don’t know
40. Generally speaking, how much interest would you say you have in politics—a great deal, a fair amount, only a little, or none?
21% great deal 32 fair amount 36 only a little 11 none – don’t know
[d1 to d18:demographic questions]
April 2015 Californians and Education 34
PPIC STATEWIDE SURVEY ADVISORY COMMITTEE
Ruben Barrales President and CEO GROW Elect
Angela Blackwell Founder and CEO PolicyLink
Mollyann Brodie Senior Vice President Kaiser Family Foundation
Bruce E. Cain Director Bill Lane Center for the American West Stanford University
Jon Cohen Vice President of Survey Research SurveyMonkey
Joshua J. Dyck Co-Director Center for Public Opinion University of Massachusetts, Lowell
Russell Hancock President and CEO Joint Venture Silicon Valley Network
Sherry Bebitch Jeffe Senior Scholar School of Policy, Planning, and Development University of Southern California
Robert Lapsley President California Business Roundtable
Carol S. Larson President and CEO The David and Lucile Packard Foundation
Monica Lozano Chairman US Hispanic Media, Inc.
Donna Lucas Chief Executive Officer Lucas Public Affairs
Lisa Pitney Vice President, Government Relations The Walt Disney Company
Robert K. Ross, M.D. President and CEO The California Endowment
Most Reverend Jaime Soto Bishop of Sacramento Roman Catholic Diocese of Sacramento
Carol Whiteside President Emeritus Great Valley Center
The PPIC Statewide Survey Advisory Committee is a diverse group of experts who provide advice on survey issues.
However, survey methods, questions, content, and timing are determined solely by PPIC.
PPIC BOARD OF DIRECTORS
Donna Lucas, Chair Chief Executive Officer Lucas Public Affairs
Mark Baldassare President and CEO Public Policy Institute of California
Ruben Barrales President and CEO GROW Elect
María Blanco Executive Director Undocumented Student Legal Services Center University of California Office of the President
Brigitte Bren Attorney
Louise Henry Bryson Chair Emerita, Board of Trustees J. Paul Getty Trust
Walter B. Hewlett Member, Board of Directors The William and Flora Hewlett Foundation
Phil Isenberg Vice Chair, Delta Stewardship Council
Mas Masumoto Author and Farmer
Steven A. Merksamer Senior Partner Nielsen, Merksamer, Parrinello, Gross & Leoni, LLP
Kim Polese Chairman ClearStreet, Inc.
Thomas C. Sutton Retired Chairman and CEO Pacific Life Insurance Company
The Public Policy Institute of California is dedicated to informing and improving public policy in California through independent, objective, nonpartisan research on major economic, social, and political issues. The institute’s goal is to raise public awareness and to give elected representatives and other decision makers a more informed basis for developing policies and programs.
The institute’s research focuses on the underlying forces shaping California’s future, cutting across a wide range of public policy concerns, including economic development, education, environment and resources, governance, population, public finance, and social and health policy.
PPIC is a public charity. It does not take or support positions on any ballot measures or on any local, state, or federal legislation, nor does it endorse, support, or oppose any political parties or candidates for public office. PPIC was established in 1994 with an endowment from William R. Hewlett.
Mark Baldassare is President and CEO of PPIC. Donna Lucas is Chair of the Board of Directors.
Short sections of text, not to exceed three paragraphs, may be quoted without written permission provided that full attribution is given to the source and the copyright notice below is included. Copyright © 2015 Public Policy Institute of California All rights reserved. San Francisco, CA PUBLIC POLICY INSTITUTE OF CALIFORNIA 500 Washington Street, Suite 600 San Francisco, California 94111 phone: 415.291.4400 fax: 415.291.4401
PPIC SACRAMENTO CENTER Senator Office Building 1121 L Street, Suite 801 Sacramento, California 95814 phone: 916.440.1120 fax: 916.440.1121
www.ppic.org [email protected]
Related Documents