April 18, 2022 Philippine Dealing & Exchange Corp. 29F, BDO Equitable Tower, 8751 Paseo de Roxas, Makati City 1226 Attention: ATTY. MARIE ROSE M. MAGALLEN-LIRIO HEAD - Issuer Compliance & Disclosure Department (ICDD) Subject: Submission of SEC 17-A Annual Report Dear Atty. Lirio, Relative to the Structured Continuing Disclosure Requirements for Listed Companies of the Exchange, we hereby submit a copy of our SEC Form 17-A (Annual Report) with Sustainability Report as of December 31, 2021. We hope that you will find everything in order. Thank you very much. Very truly yours, Perfecto Ramon Z. Dimayuga, Jr. SVP and Treasurer

Welcome message from author
This document is posted to help you gain knowledge. Please leave a comment to let me know what you think about it! Share it to your friends and learn new things together.
Transcript
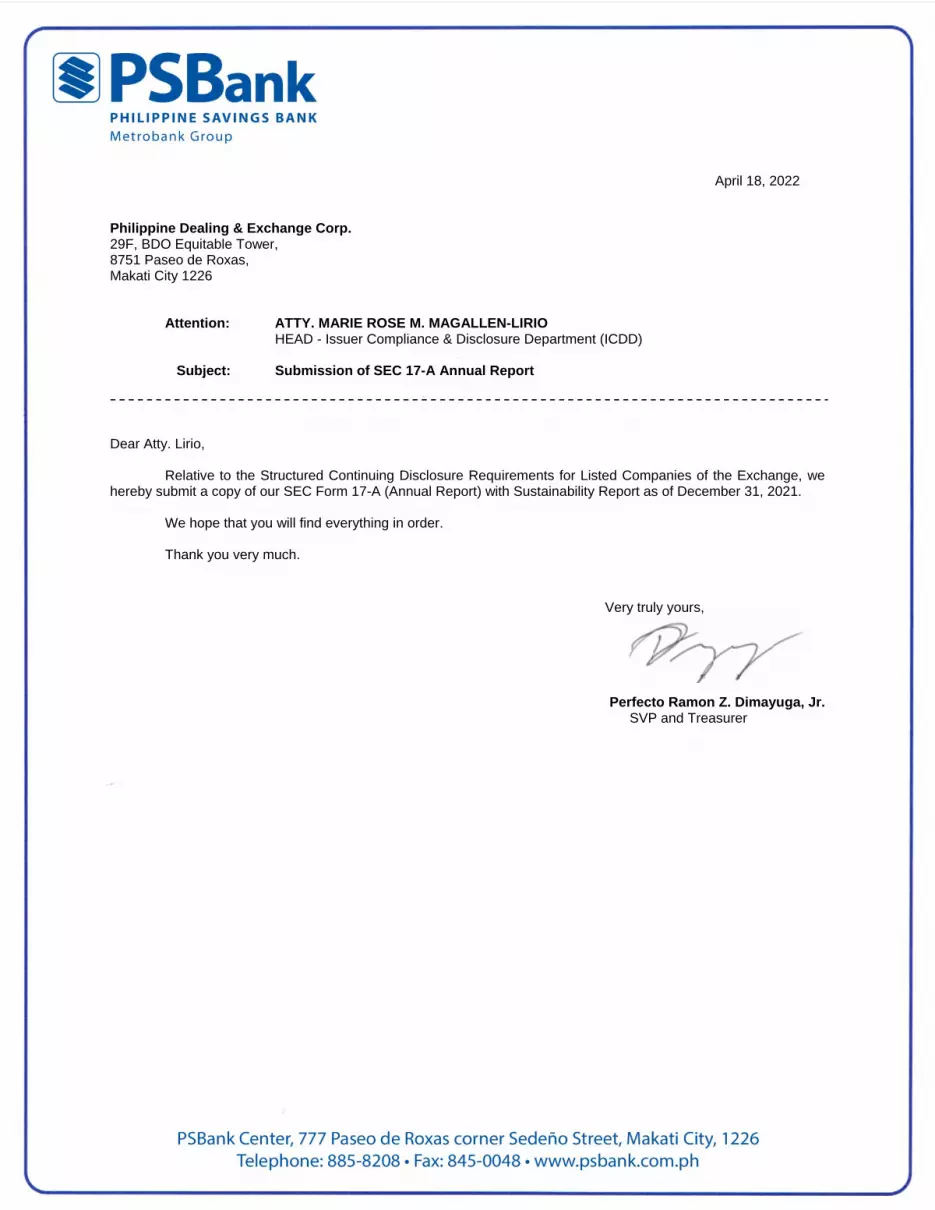
April 18, 2022
Philippine Dealing & Exchange Corp. 29F, BDO Equitable Tower, 8751 Paseo de Roxas, Makati City 1226
Attention: ATTY. MARIE ROSE M. MAGALLEN-LIRIO HEAD - Issuer Compliance & Disclosure Department (ICDD)
Subject: Submission of SEC 17-A Annual Report
Dear Atty. Lirio,
Relative to the Structured Continuing Disclosure Requirements for Listed Companies of the Exchange, we hereby submit a copy of our SEC Form 17-A (Annual Report) with Sustainability Report as of December 31, 2021.
We hope that you will find everything in order. Thank you very much.
Very truly yours,
Perfecto Ramon Z. Dimayuga, Jr. SVP and Treasurer
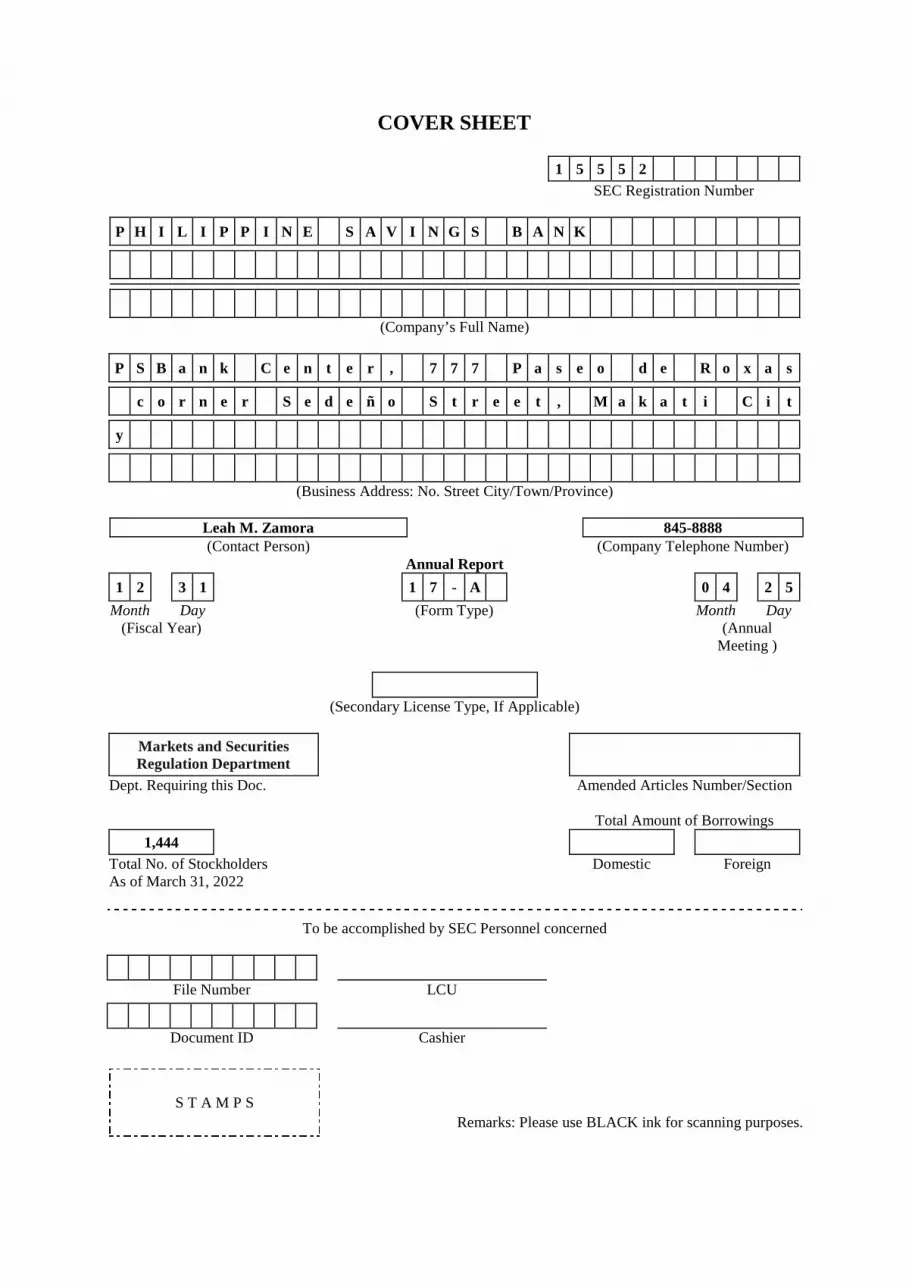
COVER SHEET
1 5 5 5 2 SEC Registration Number
P H I L I P P I N E S A V I N G S B A N K
(Company’s Full Name)
P S B a n k C e n t e r , 7 7 7 P a s e o d e R o x a s
c o r n e r S e d e ñ o S t r e e t , M a k a t i C i t
y
(Business Address: No. Street City/Town/Province)
Leah M. Zamora 845-8888 (Contact Person) (Company Telephone Number)
Annual Report
1 2 3 1 1 7 - A 0 4 2 5
Month Day (Form Type) Month Day (Fiscal Year) (Annual
Meeting )
(Secondary License Type, If Applicable)
Markets and Securities Regulation Department
Dept. Requiring this Doc. Amended Articles Number/Section Total Amount of Borrowings
1,444 Total No. of Stockholders As of March 31, 2022
Domestic Foreign
To be accomplished by SEC Personnel concerned
File Number LCU
Document ID Cashier
S T A M P S Remarks: Please use BLACK ink for scanning purposes.
SEC Number 15552 FILE Number
PHILIPPINE SAVINGS BANK (COMPANY’S NAME)
PSBank Center 777 Paseo de Roxas cor. Sedeño St., Makati City 1226 (COMPANY’S ADDRESS)
8885-82-08 (TELEPHONE NUMBER)
DECEMBER 31 (FISCAL YEAR ENDING MONTH & DAY)
SEC FORM 17-A (FORM TYPE)
December 31, 2021 (PERIOD ENDED DATE)
Government Securities Eligible Dealer (SECONDARY LICENSE TYPE AND FILE NUMBER)

- 1 -
SECURITIES AND EXCHANGE COMMISSION SEC FORM 17-A
ANNUAL REPORT PURSUANT TO SECTION 17
OF THE SECURITIES REGULATIONS CODE AND SECTION 141 OF CORPORATION CODE OF THE PHILIPPINES
1. For the fiscal year ended : December 31, 2021
2. SEC Identification No. : 15552
3. BIR Tax Identification No. : 000-663-983-000
4. Exact name of registrant as specified in its charter : Philippine Savings Bank
5. Province, Country or other jurisdiction or organization : Metro Manila, Philippines
6. Industry Classification Code : (SEC Use only)
7. Address of principal office : 777 Paseo de Roxas corner Sedeño Sts., Makati City 1226
8. Registrant’s telephone No. : 632) 8885- 8208
9. Former name, address, and former fiscal year, if changed since last report
: Not Applicable
10. Securities registered pursuant to Section 8 & 12 of the SRC
Title of each class : Common Shares
Number of shares outstanding : As of December 31, 2021 – 426,859,416
11. Are any or all of these securities listed with the Philippine Stock Exchange
: Yes
12. Check whether the issuer:
1. has filed all report required to be filed under Section 17 of the SRC and SRC Rule 17 thereunder or Section 11 of the RSA and RSA Rule 11(a)-1 thereunder and Section 26 and 141 of The Corporation Code of the Philippines during the preceding 12 months (or for such shorter period that the registrant was required to file such reports)
: Yes
2. has been subject to such filing requirements for the past ninety (90) days
: Yes
- 2 -
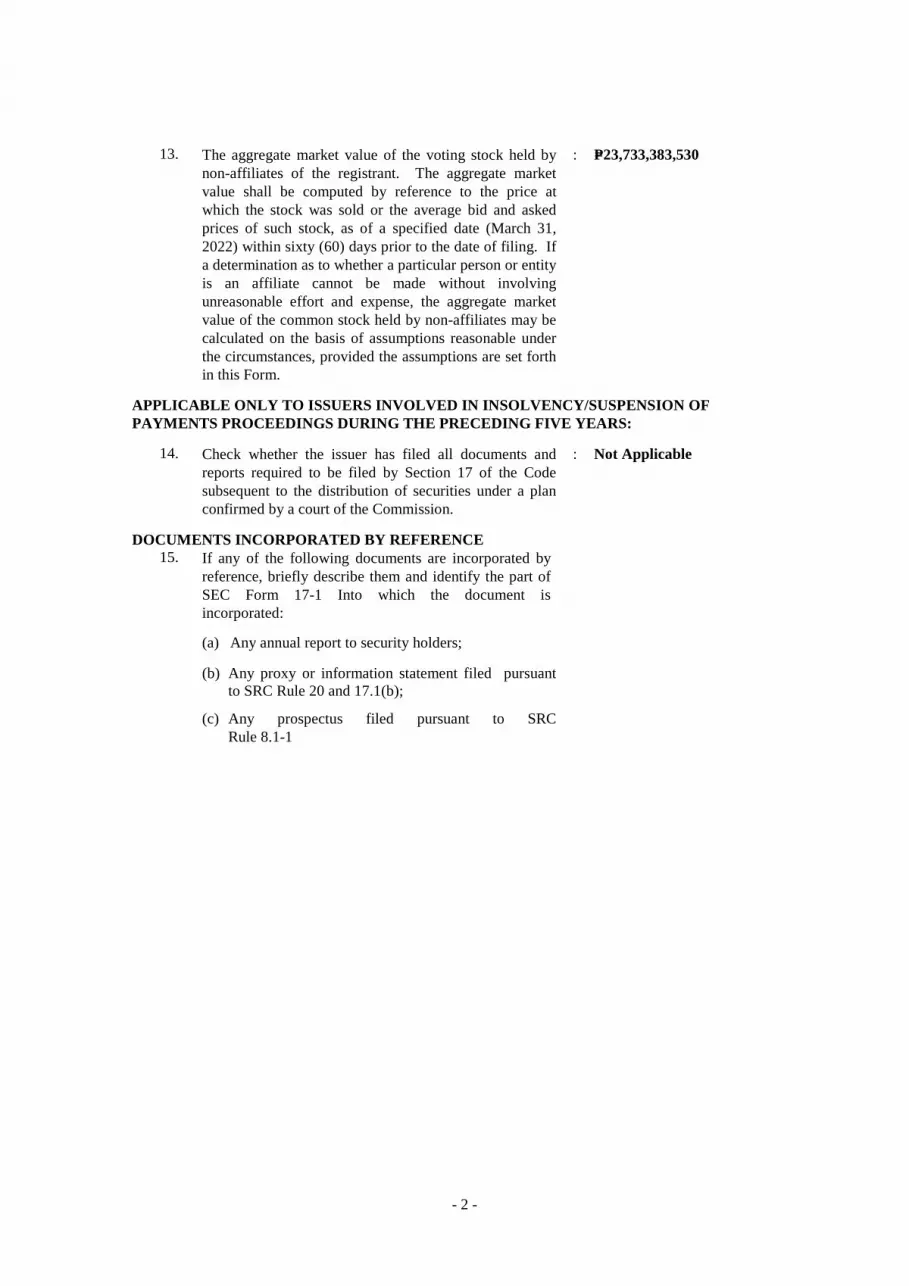
13. The aggregate market value of the voting stock held by non-affiliates of the registrant. The aggregate market value shall be computed by reference to the price at which the stock was sold or the average bid and asked prices of such stock, as of a specified date (March 31, 2022) within sixty (60) days prior to the date of filing. If a determination as to whether a particular person or entity is an affiliate cannot be made without involving unreasonable effort and expense, the aggregate market value of the common stock held by non-affiliates may be calculated on the basis of assumptions reasonable under the circumstances, provided the assumptions are set forth in this Form.
: P=23,733,383,530
APPLICABLE ONLY TO ISSUERS INVOLVED IN INSOLVENCY/S USPENSION OF PAYMENTS PROCEEDINGS DURING THE PRECEDING FIVE YEAR S:
14. Check whether the issuer has filed all documents and reports required to be filed by Section 17 of the Code subsequent to the distribution of securities under a plan confirmed by a court of the Commission.
: Not Applicable
DOCUMENTS INCORPORATED BY REFERENCE 15. If any of the following documents are incorporated by
reference, briefly describe them and identify the part of SEC Form 17-1 Into which the document is incorporated:
(a) Any annual report to security holders;
(b) Any proxy or information statement filed pursuant to SRC Rule 20 and 17.1(b);
(c) Any prospectus filed pursuant to SRC Rule 8.1-1
- 3 -
TABLE OF CONTENTS
Page No. PART I – BUSINESS AND GENERAL INFORMATION Item 1. Business 4 Item 2. Properties 18 Item 3 Legal Proceedings 18 Item 4. Submission of Matters to a Vote of Security Holders 18 PART II – OPERATIONAL AND FINANCIAL INFORMATION Item 5. Market for Issuer’s Common Equity and Related Stockholder Matters 19 Item 6 Management’s Discussion and Analysis or Plan of Operation 21 Item 7. Financial Statements 37 Item 8. Changes in and Disagreements with Accountants and Financial Disclosure 37 PART III – CONTROL AND COMPENSATION INFORMATION Item 9 Directors and Executive Officers of the Issuer 38 Item 10. Executive Compensation 51 Item 11. Security Ownership of Certain Record and Beneficial Owners and
Management 52
Item 12. Certain Relationships and Related Transactions 53 PART IV – CORPORATE GOVERNANCE Item 13. Corporate Governance (This portion has been deleted pursuant to SEC
Memorandum Circular No. 2013-5. Please refer to I-ACGR to be submitted on or before May 30, 2018)
54
PART V – EXHIBITS AND SCHEDULES Item 14. Exhibits and Schedules 72 SIGNATURES 73

- 4 -
PART I. BUSINESS AND GENERAL INFORMATION
Item 1. Business
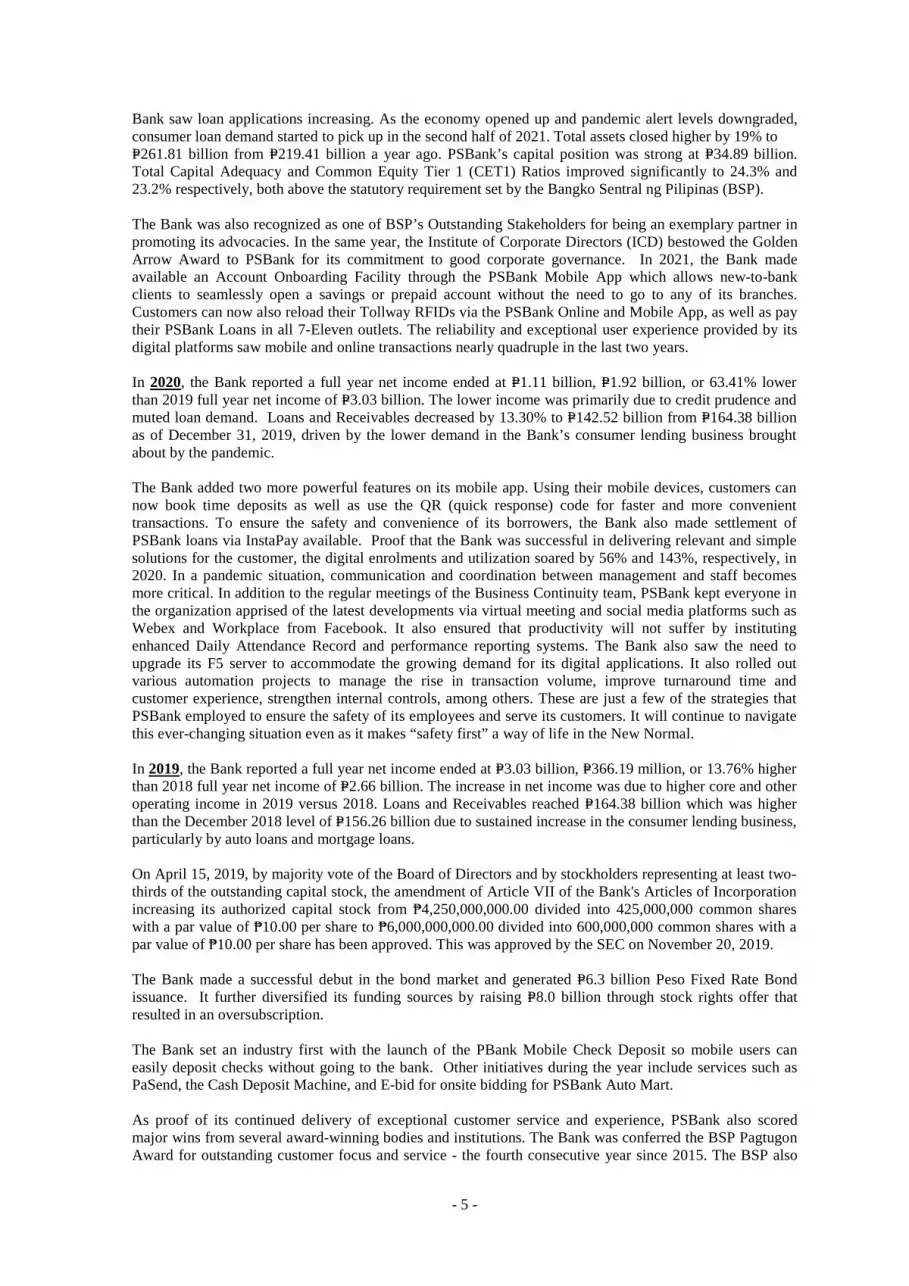
Description of Business 1. Business Development Philippine Savings Bank (the Bank) was incorporated in the Philippines primarily to engage in savings and mortgage banking. The Bank’s shares are listed in the Philippine Stock Exchange (PSE). The Bank offers a wide range of products and services such as deposit products, loans, treasury and trust functions that mainly serve the retail and consumer markets. On September 6, 1991, the Bank was authorized to perform trust functions. As of December 31, 2021 and 2020, the Bank had 250 branches. In 2021, the Bank had 271 Automated Teller Machines (ATMs) in the branches (on-site) and 276 in other locations (off-site) bringing its total number of ATMs to 547 as of December 31, 2021 and 535 as of December 31, 2020. The Bank’s original Certificate of Incorporation was issued by the Securities and Exchange Commission (SEC) on June 30, 1959. On March 28, 2006, the Board of Directors (BOD) of the Bank approved the amendment of Article IV of its Amended Articles of Incorporation to extend the corporate term of the Bank, which expired on June 30, 2009, for another 50 years or up to June 30, 2059. This was subsequently approved by stockholders representing at least two-thirds of the outstanding capital stock of the Bank on April 25, 2006. The Amended Articles of Incorporation was approved by the SEC on September 27, 2006. On April 27, 2010, by majority vote of the BOD and by stockholders representing two-thirds of the outstanding capital stock, the amendment of Article VI of its Amended Articles of Incorporation reducing the number of directors from a maximum of eleven (11) to a maximum of nine (9) has been approved. This was approved by the SEC on August 26, 2010. On March 24, 2014, the BOD approved Article III of Articles of Incorporation to specify its principal address from Makati City to PSBank Center, 777 Paseo de Roxas corner Sedeño Street, Makati City 1226. The Amended Articles of Incorporation was approved by the SEC on December 22, 2014. As of December 31, 2021 and 2020, Metropolitan Bank & Trust Company (MBTC), the Bank’s ultimate parent, owned eighty-eight percent (88%) of the Bank. As of December 31, 2021 and 2020, the Bank has a 30% interest in Sumisho Motor Finance Corporation (SMFC), a partnership with Sumitomo Corporation. SMFC is not listed in the stock exchange. The Bank continues to grow its core business which is primarily consumer banking. It offers deposit and loan products to retail customers and small and medium enterprises (SMEs). For many years now, the Bank has prepositioned itself for sustainable growth by investing in technology, artificial intelligence, Big Data, and machine learning. The Bank’s financial performance in 2021 is the direct result of its agility and strength that enabled the organization to quickly deploy and redeploy resources where needed, adapt to volatile market conditions, navigate the new normal, and stay attuned to its customers’ preferences, whether onsite or online.
As of December 31 Total Assets Net Income Branch 2021 P=261.81 billion P=1.54 billion 250 branches 2020 P=219.41 billion P=1.11 billion 250 branches 2019 P=224.91 billion P=3.03 billion 250 branches
In 2021, the Bank closed the year with a net income of P=1.5 billion, higher by 39% from previous year. The strong income performance was on the back of the increase in fee income by 22%, operating efficiencies which saw expenses decline by 3%, and the reduction in loan loss provisions owing largely to improved asset quality and effective collection efforts. Net non-performing loans ratio significantly dropped to 3.4% from 5.2% in 2020. Total deposits grew 29% to P=216.80 billion from P=167.46 billion. Year-on-year, the
- 5 -
Bank saw loan applications increasing. As the economy opened up and pandemic alert levels downgraded, consumer loan demand started to pick up in the second half of 2021. Total assets closed higher by 19% to P=261.81 billion from P=219.41 billion a year ago. PSBank’s capital position was strong at P=34.89 billion. Total Capital Adequacy and Common Equity Tier 1 (CET1) Ratios improved significantly to 24.3% and 23.2% respectively, both above the statutory requirement set by the Bangko Sentral ng Pilipinas (BSP). The Bank was also recognized as one of BSP’s Outstanding Stakeholders for being an exemplary partner in promoting its advocacies. In the same year, the Institute of Corporate Directors (ICD) bestowed the Golden Arrow Award to PSBank for its commitment to good corporate governance. In 2021, the Bank made available an Account Onboarding Facility through the PSBank Mobile App which allows new-to-bank clients to seamlessly open a savings or prepaid account without the need to go to any of its branches. Customers can now also reload their Tollway RFIDs via the PSBank Online and Mobile App, as well as pay their PSBank Loans in all 7-Eleven outlets. The reliability and exceptional user experience provided by its digital platforms saw mobile and online transactions nearly quadruple in the last two years. In 2020, the Bank reported a full year net income ended at P=1.11 billion, P=1.92 billion, or 63.41% lower than 2019 full year net income of P=3.03 billion. The lower income was primarily due to credit prudence and muted loan demand. Loans and Receivables decreased by 13.30% to P=142.52 billion from P=164.38 billion as of December 31, 2019, driven by the lower demand in the Bank’s consumer lending business brought about by the pandemic. The Bank added two more powerful features on its mobile app. Using their mobile devices, customers can now book time deposits as well as use the QR (quick response) code for faster and more convenient transactions. To ensure the safety and convenience of its borrowers, the Bank also made settlement of PSBank loans via InstaPay available. Proof that the Bank was successful in delivering relevant and simple solutions for the customer, the digital enrolments and utilization soared by 56% and 143%, respectively, in 2020. In a pandemic situation, communication and coordination between management and staff becomes more critical. In addition to the regular meetings of the Business Continuity team, PSBank kept everyone in the organization apprised of the latest developments via virtual meeting and social media platforms such as Webex and Workplace from Facebook. It also ensured that productivity will not suffer by instituting enhanced Daily Attendance Record and performance reporting systems. The Bank also saw the need to upgrade its F5 server to accommodate the growing demand for its digital applications. It also rolled out various automation projects to manage the rise in transaction volume, improve turnaround time and customer experience, strengthen internal controls, among others. These are just a few of the strategies that PSBank employed to ensure the safety of its employees and serve its customers. It will continue to navigate this ever-changing situation even as it makes “safety first” a way of life in the New Normal. In 2019, the Bank reported a full year net income ended at P=3.03 billion, P=366.19 million, or 13.76% higher than 2018 full year net income of P=2.66 billion. The increase in net income was due to higher core and other operating income in 2019 versus 2018. Loans and Receivables reached P=164.38 billion which was higher than the December 2018 level of P=156.26 billion due to sustained increase in the consumer lending business, particularly by auto loans and mortgage loans. On April 15, 2019, by majority vote of the Board of Directors and by stockholders representing at least two-thirds of the outstanding capital stock, the amendment of Article VII of the Bank's Articles of Incorporation increasing its authorized capital stock from ₱4,250,000,000.00 divided into 425,000,000 common shares with a par value of ₱10.00 per share to ₱6,000,000,000.00 divided into 600,000,000 common shares with a par value of ₱10.00 per share has been approved. This was approved by the SEC on November 20, 2019. The Bank made a successful debut in the bond market and generated P=6.3 billion Peso Fixed Rate Bond issuance. It further diversified its funding sources by raising P=8.0 billion through stock rights offer that resulted in an oversubscription. The Bank set an industry first with the launch of the PBank Mobile Check Deposit so mobile users can easily deposit checks without going to the bank. Other initiatives during the year include services such as PaSend, the Cash Deposit Machine, and E-bid for onsite bidding for PSBank Auto Mart. As proof of its continued delivery of exceptional customer service and experience, PSBank also scored major wins from several award-winning bodies and institutions. The Bank was conferred the BSP Pagtugon Award for outstanding customer focus and service - the fourth consecutive year since 2015. The BSP also
- 6 -
recognized PSBank as an “Outstanding Partner in Digital Transformation” for its effective adoption of digital strategies that enhance customer experience. PSBank also bagged five trophies at the 2019 Customer Experience (CX) Asia Excellence Awards held in Singapore, including the top prize: gold for the Best Customer Experience in Asia Pacific, besting 245 other entries. PSBank also won a gold for having the “Best Digital Experience,” a silver for the “Best CX Team” for the second consecutive year, a bronze for having the “Best Social Media Experience,” and an honorary mention for its efforts in employee engagement. Over the past 59 years, PSBank has become an immensely entrepreneurial, agile, adaptive, and innovative organization. The Bank’s digital capabilities and data-driven processes that the Bank steadily invested in building up over the past years, will give the Bank greater confidence that it will remain resilient and well positioned to weather any storm, particularly in the face of rising competition, technological disruptions, regulations, and other unsettling challenges such as the COVID-19 virus outbreak. 2. Business of Issuer a. Products and Services
Philippine Savings Bank (PSBank) is the consumer and retail thrift bank arm of the Metrobank Group, one of the Philippines’ largest and leading banks. For more than 50 years, PSBank has built a reputation for its Simple Lang. Maaasahan (simple and reliable) brand of banking. Enabled by digital technology, we are able to delight our customers at every encounter. The core business of PSBank is focused on expansion of the consumer business by growing its retail deposit and consumer loans, including SME, through various channels which include, but are not limited to, branch and digital channels. Deposits Savings Accounts Time Deposit Accounts PSBank Kiddie & Teen Savings PSBank Peso Prime Time Deposit PSBank Peso Personal ATM Savings PSBank Peso Time Deposit PSBank Peso Passbook Savings PSBank Peso OFW ATM Savings Foreign Currency Accounts Checking Accounts PSBank Dollar Savings PSBank Peso Regular Checking PSBank Dollar Time Deposit PSBank Premium Peso Checking Consumer Loans PSBank Auto Loan with Prime Rebate PSBank Home Construction Loan PSBank Flexi Personal Loan with Prime Rebate PSBank Multipurpose Loan PSBank Home Loan with Prime Rebate PSBank Payroll Cash Advance PSBank Home Credit Line Commercial Loans PSBank SME Business Credit Line PSBank Credit Line PSBank SME Term Loan with Prime Rebate PSBank Standby Credit Line Certification PSBank Domestic Bills Purchase Line Trust Products and Services PSBank Money Market Fund Investment Management Account Escrow Account Personal Management Trust Employee Benefit/ Retirement Fund Management e-Trust Other Products and Services PSBank Debit Mastercard PSBank Mobile Time Deposit Placement PSBank Prepaid Mastercard PSBank QR Code PSBank Credit Mastercard PSBank Toll RFID Reload PSBank Online PSBank PaSend Mobile Remittance PSBank Mobile PSBank Remittance Services PSBank Business Online Buddy (Corporate Internet Banking)
PSBank & AXA Bancassurance Cross-selling Arrangement
PSBank e-Credit PSBank Bills Payment Collection PSBank Online Account Opening PSBank LiveChat PSBank Online Loan Application PSBank ISSA Chatbot Service PSBank Mobile Check Deposit
- 7 -
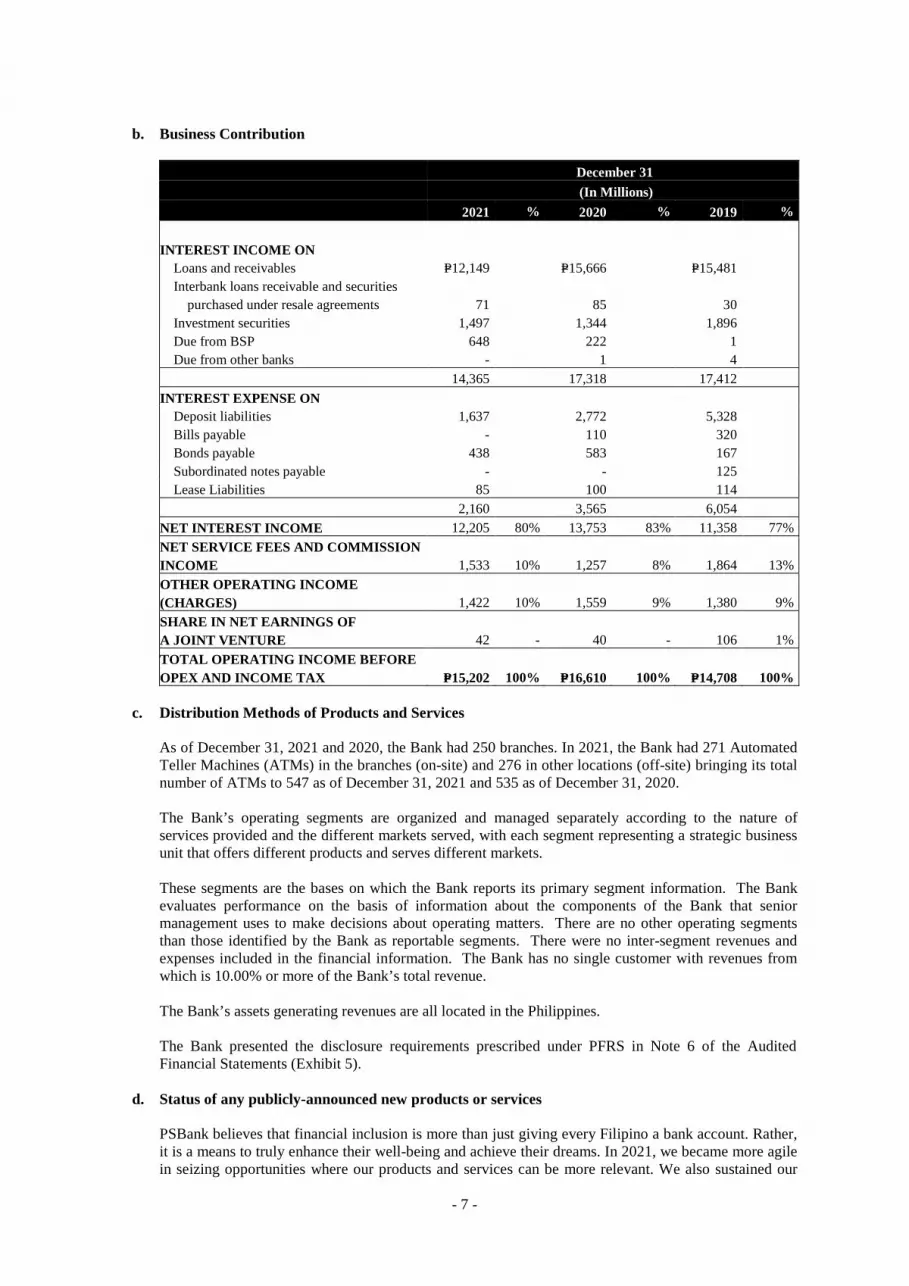
b. Business Contribution
December 31 (In Millions)
2021 % 2020 % 2019 %
INTEREST INCOME ON
Loans and receivables P=12,149 P=15,666 P=15,481 Interbank loans receivable and securities
purchased under resale agreements 71 85 30 Investment securities 1,497 1,344 1,896 Due from BSP 648 222 1 Due from other banks - 1 4
14,365 17,318 17,412
INTEREST EXPENSE ON Deposit liabilities 1,637 2,772 5,328
Bills payable - 110 320
Bonds payable 438 583 167
Subordinated notes payable - - 125
Lease Liabilities 85 100 114
2,160 3,565 6,054
NET INTEREST INCOME 12,205 80% 13,753 83% 11,358 77%
NET SERVICE FEES AND COMMISSION INCOME 1,533 10% 1,257 8% 1,864 13%
OTHER OPERATING INCOME (CHARGES) 1,422 10% 1,559 9% 1,380 9%
SHARE IN NET EARNINGS OF A JOINT VENTURE 42 - 40 - 106 1%
TOTAL OPERATING INCOME BEFORE OPEX AND INCOME TAX P=15,202 100% P=16,610 100% P=14,708 100%
c. Distribution Methods of Products and Services
As of December 31, 2021 and 2020, the Bank had 250 branches. In 2021, the Bank had 271 Automated Teller Machines (ATMs) in the branches (on-site) and 276 in other locations (off-site) bringing its total number of ATMs to 547 as of December 31, 2021 and 535 as of December 31, 2020. The Bank’s operating segments are organized and managed separately according to the nature of services provided and the different markets served, with each segment representing a strategic business unit that offers different products and serves different markets. These segments are the bases on which the Bank reports its primary segment information. The Bank evaluates performance on the basis of information about the components of the Bank that senior management uses to make decisions about operating matters. There are no other operating segments than those identified by the Bank as reportable segments. There were no inter-segment revenues and expenses included in the financial information. The Bank has no single customer with revenues from which is 10.00% or more of the Bank’s total revenue. The Bank’s assets generating revenues are all located in the Philippines. The Bank presented the disclosure requirements prescribed under PFRS in Note 6 of the Audited Financial Statements (Exhibit 5).
d. Status of any publicly-announced new products or services
PSBank believes that financial inclusion is more than just giving every Filipino a bank account. Rather, it is a means to truly enhance their well-being and achieve their dreams. In 2021, we became more agile in seizing opportunities where our products and services can be more relevant. We also sustained our
- 8 -
financial literacy campaigns meant to empower them to make better, informed choices when it comes to their financial welfare and future. To enable our customers to perform hassle-free, safe, easy, and secure banking transactions while staying safely at home, we further improved our PSBank Online. The redesigned internet banking facility now features a fresh interface and optimized mobile view, as well as an expanded suite of intuitive and easy to-navigate functionalities. To deliver on our promise of “Simple Lang, Maaasahan” service, we made banking more accessible, simpler and safer with our Online Account Opening via PSBank Mobile App. Our newest digital offering enables Filipinos to open a PSBank peso savings or prepaid account with just a selfie, a valid ID, and with literally just a few taps. Since we launched this product innovation on social media through the “Tap, Tap, Tapos Agad” campaign in September 2021, the App registered an average daily number of new-to-bank depositors of over 150 per day - proof of wide customer acceptance of its simplicity, safety, and accessibility. Futher, the Bank provided more options and make it easy for our customers to pay their Auto Loan, Home Loan, Flexi Personal Loan, and Business Loan without the need to go to our branches, we partnered with Electronic Commerce Payments Inc. (ECPay), the leading electronic payment service provider in the country. PSBank borrowers can pay their loans in any 7-Eleven branches nationwide. To help improve financial literacy in the country, we continue to run our award-winning financial literacy campaigns: “Be Aware” and “Good to Know.” Through “Be Aware,” we aim to raise awareness on various scams that the banking public may encounter, and empower them with information so they will not fall prey to these fraudulent schemes. “Good to Know” promotes the value of saving and investing to better equip clients in making sound financial decisions. In 2021, these campaigns have reached an audience of 3.52 million through external and internal media platforms. We extended our simple and convenient PSBanking to the employees of the payroll companies of our parent bank, Metrobank. Through the VALE (Payroll Cash Advance Facility), eligible employees can advance and withdraw a portion of their salary from any Metrobank and PSBank ATMs nationwide while payments are collected every payroll period via auto-debit facility.
Products/Services Launch Date
PSBank Payroll Cash Advance (VALE) May 7, 2021
PSBank Toll RFID Reload via PSBank Mobile June 24, 2021
Payment of PSBank Loans via 7-Eleven July 5, 2021
PSBank Online Account Opening September 24, 2021
Redesigned PSBank Online (Internet Banking) November 8, 2021
e. Competition
The Philippine banking system remains safe and sound, with overall credit conditions providing ample support to economic activity. According to Bangko Sentral ng Pilipinas (BSP) as of December 31, 2021, the country’s banking system comprised of 46 universal banks and commercial banks, 47 thrift banks and 413 rural banks. As the thrift banking arm of the Metrobank Group, Philippine Savings Bank (PSBank) is backed by the resources of one of the largest financial conglomerates in the Philippines and a track record that spans more than six decades. Creating value has always been fundamental to the way we do business. The sustainability of our success relies on the delivery of our promise to be Simple Lang, Maaasahan to our various stakeholders. PSBank accounted for 21% of total assets among thrift banks as of end-December 2021 based on the latest published financial statements of the BSP. It has been aggressive in the consumer and retail banking arena, launching various marketing campaigns to go head on against competition. Amid tight competition and market uncertainty, PSBank managed to sustain its growth momentum through the integration of various efficiencies in its operations.
- 9 -
f. Innovations and Promotions
For some, 2021 was a game changer. For PSBank, it was an opportunity to demonstrate our STRENGTH and AGILITY in the face of rapidly evolving challenges. We consistently offer products and services that meet our customers’ needs through our network of 250 branches and over 500 ATMs strategically located nationwide; and via our 24/7 banking services-- PSBank Mobile and Online; and PSBank Business Online Buddy (Corporate Internet Banking). Customers can also engage us through our PSBank LiveChat, ISSA Chatbot, PSBank Official Social Media Accounts, and Customer Experience Hotlines.
Over the years, we launched several digital innovations to add more value to our customers and improve their banking experience. Among these are the Account Online Onboarding via the Mobile App, Mobile Check Deposit, Cardless Withdrawal, ATM Lock/Unlock, and PayMe which we pioneered. Consistent with our resolve to always deliver exceptional customer experience, we make sure that our mobile and online banking services are always available and capable of processing customer requests fast. We also placed security features in our digital facilities to ensure the safety and privacy of customer data and transactions. We likewise promote financial literacy and raise customer awareness on issues that affect their personal finances. More than investing and allocating resources in projects that benefit the environment, we also contribute to environmental sustainability by managing the impact of our own operations and the buildings we own. Mobility restrictions due to the COVID-19 pandemic consequently led to shortened operating hours, fewer employees physically reporting on site, and lower waste generated. These resulted in the further reduction of our greenhouse gas emissions.
g. Customer/Clients There is no single customer that accounts for 20% or more of the Bank’s deposits and loans.
h. Transactions with and/or dependence on related parties
Transactions with related parties and with certain directors, officers, stockholders and related interests (DOSRI) are discussed in Note 29 of the Audited Financial Statements (Exhibit 5).
i. Patents, Trademarks, Copyrights, Licenses, Franchises, etc. The Bank sells its products and services thru the PSBank trademarks and/or trade names.
j. Government approval of principal products or services Its authority to operate as a thrift bank governs the Bank’s principal products and services. Existing products and services are within the scope allowed under the Bank’s regulatory licenses. Effect of Existing or Probable Government Regulations Capital Adequacy Under existing BSP regulations, the determination of the Bank’s compliance with regulatory requirements and ratios is based on the amount of the Bank’s unimpaired capital (regulatory capital) as reported to the BSP. This is determined on the basis of regulatory accounting policies which differ from PFRS in some respects.
In addition, the risk-based capital ratio of a bank, expressed as a percentage of qualifying capital to risk-weighted assets, should not be less than 10.00% for both solo basis and consolidated basis. Qualifying capital and risk-weighted assets are computed based on BSP regulations.
Risk-weighted assets consist of total assets less cash on hand, due from BSP, loans covered by hold-out on or assignment of deposits, loans or acceptances under letters of credit to the extent covered by margin deposits and other non-risk items determined by the Monetary Board of the BSP.

- 10 -
On January 15, 2013, the BSP issued Circular No. 781, Basel III Implementing Guidelines on Minimum Capital Requirements, which states the implementing guidelines on the revised risk-based capital adequacy framework, particularly on the minimum capital and disclosure requirements for universal banks and commercial banks, as well as their subsidiary banks and quasi-banks, in accordance with the Basel III standards. The Circular took effect on January 1, 2014.
The Circular sets out a minimum Common Equity Tier 1 (CET1) ratio of 6.00% and Tier 1 capital ratio of 7.50%. It also introduces a capital conservation buffer of 2.50% comprised of CET1 capital. The BSP’s existing requirement for Total CAR remains unchanged at 10.00% and these ratios shall be maintained at all times.
Regulatory qualifying capital consists of Tier 1 (going concern) capital, which comprises capital stock, surplus, surplus reserves, net unrealized gains on FVOCI securities, cumulative foreign currency translation and remeasurements of net defined benefit asset. Certain adjustments are made to PFRS-based results and reserves, as prescribed by the BSP. The other component of regulatory capital is Tier 2 (gone-concern) capital, which is comprised of the Bank’s general loan loss provision and unsecured subordinated debt (refer to Note 17). Certain items are deducted from the regulatory Gross Qualifying Capital, such as but not limited to, outstanding unsecured credit accommodations, both direct and indirect, to DOSRI, and unsecured loans, other credit accommodations, and guarantees granted to subsidiaries and affiliates (net of specific provisions), deferred tax assets, goodwill, other intangible assets and significant minority investments in a joint venture.
Risk-weighted assets are determined by assigning defined risk weights to amounts of on-balance sheet exposures and to the credit equivalent amounts of off-balance sheet exposures.
In 2017, the General loan loss provision is limited to a maximum of 1% of credit risk-weighted assets, and any amount in excess thereof is deducted from the credit risk-weighted assets in computing the denominator of the risk-based capital ratio. Meanwhile, the credit-risk weighted asset is net of General loan loss provision, in excess of the amount permitted to be included in Tier 2. On August 14, 2018, the Bangko Sentral ng Pilipinas (BSP) issued Circular No. 1011 covering guidelines on the adoption of the Philippine Financial Reporting Standard (PFRS) 9 - Financial Instruments. Under the said circular, banks shall set up general loan loss provision (GLLP) equivalent to one percent (1%) of all outstanding Stage 1 on-balance sheet loans, except for accounts considered as credit risk-free under existing regulations. Banks are not required to provide a one percent (l%) GP on other credit exposures covered by PFRS 9 such as off-balance sheet accounts and investments. Banks shall use Retained Earnings Reserve-Others as temporary account of Retained Earnings-General Provision (RE-GP). As a temporary presentation in CAR reports, the Retained Earnings (RE) included in Common Equity Tier (CET)/Core Tier 1 shall be net of Retained Earnings-General Provision. In computing Tier 2 Capital, the General Loan Loss provision (GLLP), shall include the RE-GP. However, the GLLP added back to on-balance sheet assets subject to risk-weight shall not include the RE-GP since when appropriating the RE, total assets is not affected. The Bank is compliant with the BSP Circular No. 1011. In 2018, the computation of GLLP is in compliance with BSP Circular No. 1011, wherein the Bank developed ECL parameters and methodologies for each portfolio of its loans and receivables, using historical data as well as forward-looking inputs and assumptions. Risk-weighted on-balance sheet assets covered by credit risk mitigants were based on collateralized transactions as well as guarantees by the Philippine National Government (PNG) and those guarantors and exposures with highest credit rating. Third party credit assessments were based on the ratings by Standard & Poor’s, Moody’s, Fitch and PhilRatings on exposures to Sovereigns, MDBs, Banks, LGUs, Government Corporations and Corporates. The Bank has no exposures to securitization structures. Further, it has no structured products issued or purchased. The Bank uses the standardized approach to compute the market risk exposures for the Capital Adequacy Ratio. For each separate risk area (credit, market, operational, interest rate risk), the details of risk exposures and assessments are disclosed in Note 5 of the audited financial statements. The Bank uses the Basic Indicator Approach in computing for the operational risk capital charge.
- 11 -
The description of the main features of capital instruments issued on common shares and those eligible as Tier 2 capital are presented in Note 21 and Note 17 of the audited financial statements, respectively. As of December 31, 2021 and 2020, the Bank has complied with the requirements of BSP Circular No. 781 and BSP Circular No. 538.
On October 29, 2014, the BSP issued Circular No. 856 which covers the implementing guidelines on the framework for dealing with domestic systemically important banks (DSIBs) in accordance with the Basel III standards. Banks identified as DSIBs shall be required to have higher loss absorbency, on top of the minimum CET1 capital and capital conservation buffer. Compliance with this requirement was phased-in starting January 1, 2017, with full compliance on January 1, 2019. On September 27, 2019, the BSP issued Circular No. 1051 which covers the enhancements in the assessment methodology of D-SIBs. The Bank has complied with this requirement. The issuance of BSP Circular No. 639 covering the Internal Capital Adequacy Assessment Process (ICAAP) in 2009 supplements the BSP’s risk-based capital adequacy framework under BSP Circular No. 538. In compliance with this new circular, the Metrobank Group has adopted and developed its ICAAP framework to ensure that appropriate level and quality of capital are maintained by the Group. Under this framework, the assessment of risks extends beyond the Pillar 1 set of credit, market and operational risks and onto other risks deemed material by the Group. The level and structure of capital are assessed and determined in light of the Group’s business environment, plans, performance, risks and budget, as well as regulatory directives. The Bank follows the Group’s ICAAP framework and submits the result of its assessment to the Parent Company. Per BSP Circular No. 869, effective January 31, 2015, submission of an ICAAP document is required by BSP every March 31 of each year. The Bank has complied with this requirement.
The Bank has taken into consideration the impact of the foregoing requirements to ensure that the appropriate level and quality of capital are maintained on an ongoing basis. Leverage Ratio On June 9, 2015, the BSP issued Circular No. 881 covering the implementing guidelines on the Basel III Leverage Ratio Framework which is designed to act as a supplementary measure to the risk-based capital requirements and shall not be less than 5.0 percent. The monitoring period has been set every quarter starting December 31, 2014 and extended until June 30, 2018 under BSP Circular No. 990 issued on January 22, 2018. Effective July 1, 2018, the monitoring of the leverage ratio was implemented as a Pillar I minimum requirement.
The Basel III Leverage Ratio is designed to act as a supplementary measure to the risk-based capital requirements. The Basel III Leverage Ratio is defined as the capital measure (the numerator) divided by the exposure measure (the denominator), with this ratio expressed as percentage. Capital measure is the Tier 1 capital. Exposure measure is the sum of on-balance sheet exposures, derivative exposures, security financing exposures and off-balance sheet items. The leverage ratio shall not be less than 5.0 percent computed on both solo (head office plus branches) and consolidated bases (including subsidiary financial allied undertakings but excluding insurance companies).
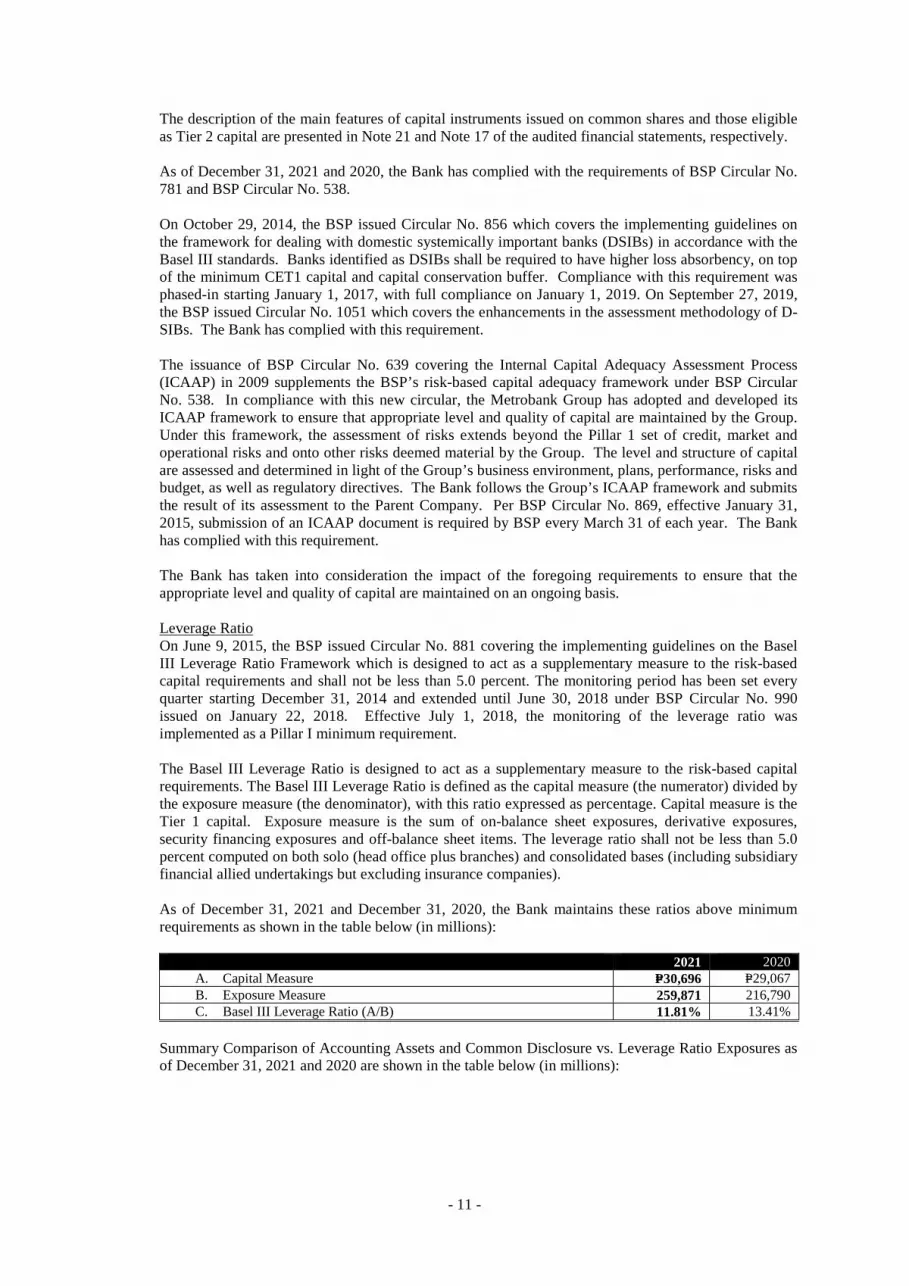
As of December 31, 2021 and December 31, 2020, the Bank maintains these ratios above minimum requirements as shown in the table below (in millions):
2021 2020
A. Capital Measure P=30,696 P=29,067 B. Exposure Measure 259,871 216,790 C. Basel III Leverage Ratio (A/B) 11.81% 13.41%
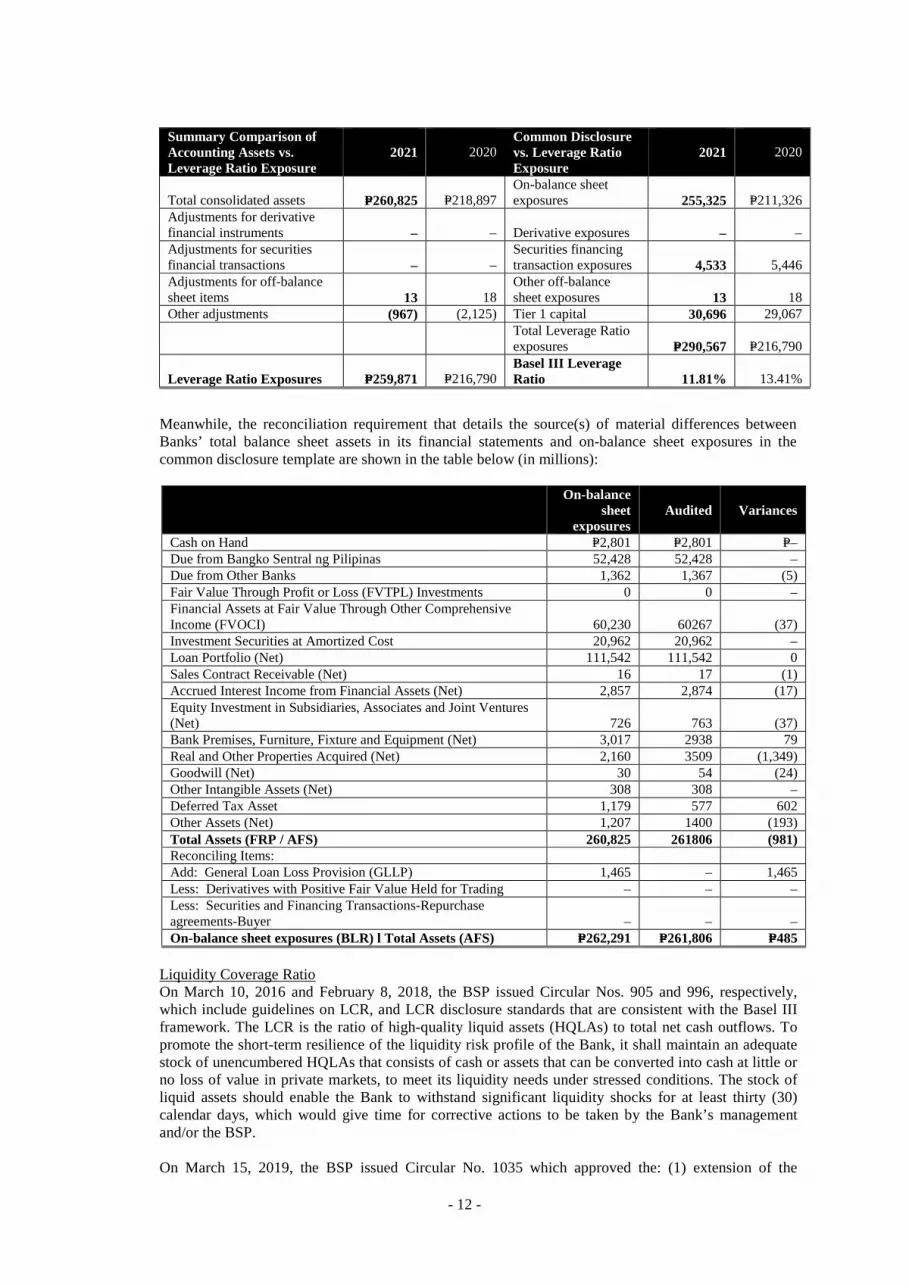
Summary Comparison of Accounting Assets and Common Disclosure vs. Leverage Ratio Exposures as of December 31, 2021 and 2020 are shown in the table below (in millions):
- 12 -
Summary Comparison of Accounting Assets vs. Leverage Ratio Exposure
2021
2020
Common Disclosure vs. Leverage Ratio Exposure
2021
2020
Total consolidated assets P=260,825 P=218,897 On-balance sheet exposures 255,325 P=211,326
Adjustments for derivative financial instruments
–
–
Derivative exposures
–
–
Adjustments for securities financial transactions
–
–
Securities financing transaction exposures 4,533 5,446
Adjustments for off-balance sheet items
13
18
Other off-balance sheet exposures 13 18
Other adjustments (967) (2,125) Tier 1 capital 30,696 29,067 Total Leverage Ratio
exposures
P=290,567
P=216,790 Leverage Ratio Exposures
P=259,871
P=216,790
Basel III Leverage Ratio
11.81%
13.41%
Meanwhile, the reconciliation requirement that details the source(s) of material differences between Banks’ total balance sheet assets in its financial statements and on-balance sheet exposures in the common disclosure template are shown in the table below (in millions):
On-balance
sheet exposures
Audited
Variances
Cash on Hand P=2,801 P=2,801 P=– Due from Bangko Sentral ng Pilipinas 52,428 52,428 – Due from Other Banks 1,362 1,367 (5) Fair Value Through Profit or Loss (FVTPL) Investments 0 0 – Financial Assets at Fair Value Through Other Comprehensive Income (FVOCI) 60,230 60267 (37) Investment Securities at Amortized Cost 20,962 20,962 – Loan Portfolio (Net) 111,542 111,542 0 Sales Contract Receivable (Net) 16 17 (1) Accrued Interest Income from Financial Assets (Net) 2,857 2,874 (17) Equity Investment in Subsidiaries, Associates and Joint Ventures (Net) 726 763 (37) Bank Premises, Furniture, Fixture and Equipment (Net) 3,017 2938 79 Real and Other Properties Acquired (Net) 2,160 3509 (1,349) Goodwill (Net) 30 54 (24) Other Intangible Assets (Net) 308 308 – Deferred Tax Asset 1,179 577 602 Other Assets (Net) 1,207 1400 (193) Total Assets (FRP / AFS) 260,825 261806 (981) Reconciling Items: Add: General Loan Loss Provision (GLLP) 1,465 – 1,465 Less: Derivatives with Positive Fair Value Held for Trading – – – Less: Securities and Financing Transactions-Repurchase agreements-Buyer – – – On-balance sheet exposures (BLR) l Total Assets (AFS) P=262,291 P=261,806 P=485
Liquidity Coverage Ratio On March 10, 2016 and February 8, 2018, the BSP issued Circular Nos. 905 and 996, respectively, which include guidelines on LCR, and LCR disclosure standards that are consistent with the Basel III framework. The LCR is the ratio of high-quality liquid assets (HQLAs) to total net cash outflows. To promote the short-term resilience of the liquidity risk profile of the Bank, it shall maintain an adequate stock of unencumbered HQLAs that consists of cash or assets that can be converted into cash at little or no loss of value in private markets, to meet its liquidity needs under stressed conditions. The stock of liquid assets should enable the Bank to withstand significant liquidity shocks for at least thirty (30) calendar days, which would give time for corrective actions to be taken by the Bank’s management and/or the BSP. On March 15, 2019, the BSP issued Circular No. 1035 which approved the: (1) extension of the

- 13 -
observation period of the minimum Basel III LCR requirement to December 31, 2019 for subsidiary banks and quasi-banks (QBs) of universal and commercial banks (U/KBs), (2) adoption of a seventy percent (70%) LCR floor for subsidiary banks and QBs during the observation period, (3) minimum requirement of one hundred (100%) starting January 1, 2020. As of December 31, 2021 and 2020, the LCR in single currency as reported to the BSP is shown in the table below (in millions):
2021 2020 A. Total Stock of High-Quality Liquid Assets 139,134 P=62,433 B. Total Net Cash Outflows 87,250 38,294 C. Liquidity Coverage Ratio [A/B] 159.47% 163.03%
Net Stable Funding Ratio On June 6, 2018, the BSP issued Circular No. 1007, covering the implementing guidelines on the adoption of the Basel III Framework on Liquidity Standards - NSFR. The NSFR limits overreliance on short-term wholesale funding and promotes enhanced assessment of funding risk across all on- and off-balance sheet accounts. The NSFR complements the LCR, which promotes short term resilience of the Bank's liquidity profile. The covered bank shall maintain an NSFR of at least 100.0 percent at all times. Compliance with this requirement was phased-in effective July 1, 2018, with full implementation of the minimum NSFR on January 1, 2019.
On March 15, 2019, the BSP issued Circular No. 1034 which approved the extension of the observation period for the Basel III Framework on Liquidity Standards - NSFR for subsidiary banks/quasi-banks. The implementation of the minimum NSFR shall be phased in to help ensure that the covered banks/QBs can meet the standard through reasonable measures without disrupting credit extension and financial market activities. In order to facilitate compliance, covered banks/QBs shall undergo an observation period before the NSFR becomes a minimum requirement. Subsidiary banks/QBs of U/KBs shall be subject to an NSFR floor of seventy percent (70%) during the observation period. Starting January 1, 2020, the minimum NSFR for subsidiary banks/quasi-banks of universal and commercial banks (UBs/KBs) shall be 100%. As of December 31, 2021 and 2020, the NSFR as reported to the BSP is shown in the table below (in millions):
2021 2020 A. Available Stable Funding P=167,808 P=172,004 B. Required Stable Funding 108,126 135,806 C. Net Stable Funding Ratio [A/B] 155.20% 126.65%
Basel III Countercyclical Capital Buffer On December 6, 2018, the BSP issued Circular No. 1024 covering the Philippine adoption of the Basel III Countercyclical Capital Buffer (CCyB) which imposed the following capital buffers: • Capital Conservation buffer (CCB) of two and a half percent (2.5%); and • Countercyclical capital buffer (CCyB) of zero percent (0%) subject to upward adjustment to a rate
determined by the Monetary Board of the BSP when systemic conditions warrant but not to exceed two and a half percent (2.5%). Any increase in the CCyB rate shall be effective 12 months after its announcements. Decreases shall be effective immediately.
The prescribed ratios shall be maintained at all times. Applicable Tax Regulations Under Philippine tax laws, the Bank is subject to percentage and other taxes (presented as ‘Taxes and licenses’ in the statements of income) as well as income taxes. Percentage and other taxes paid consist principally of gross receipts tax (GRT) and documentary stamp tax (DST). Income taxes include corporate income tax, further discussed below, and final taxes paid at the rate of 20.00%, which is a final withholding tax on gross interest income from government securities and other deposit substitutes.
- 14 -
On March 26, 2021, RA No. 11534, otherwise known as Corporate Recovery and Tax Incentives for Enterprises (CREATE) Act was signed into law. CREATE reduced the RCIT rate from 30.00% to 25.00% depending on the criteria set by the law effective July 1, 2020. With the implementation of this Act, interest expense allowed as a deductible expense shall be reduced by 20.00% of the interest income subjected to final tax, compared to the 33.00% reduction prior to the Act.
The regulations also provide for MCIT of 2.00% (prior to CREATE) and 1.00% from (July 1, 2020 to June 30, 2023 before reverting to 2.00%) on modified gross income and allow a NOLCO. The MCIT and NOLCO may be applied against the Bank’s income tax liability and taxable income, respectively, over a three-year period from the year of inception. For the taxable years 2020 and 2021, the NOLCO incurred can be carried over as a deduction for the next five (5) consecutive taxable years, pursuant to Revenue Regulation (RR) No. 25-2020. Based on the provisions of RR No. 5-2021 dated April 8, 2021 issued by the BIR, the transitory RCIT and MCIT rates of the Bank for the taxable year 2020 are 27.50% and 1.50%, respectively. The reduced amounts were reflected in the Bank’s 2020 annual income tax returns filed in 2021. However, for financial reporting purposes, the changes were only recognized in the 2021 financial statements. The deferred tax assets and liabilities as of December 31, 2020 were also remeasured using the lower RCIT rate of 25.00%. These reductions were recognized in the 2021 financial statements. Starting July 1, 2008, the Optional Standard Deduction (OSD) equivalent to 40.00% of gross income may be claimed as an alternative deduction in computing for the RCIT. The Bank elected to claim itemized expense deductions instead of the OSD in computing for the RCIT in 2021 and 2020. Current tax regulations also provide for the ceiling on the amount of EAR expense that can be claimed as a deduction against taxable income. Under the regulations, EAR expense allowed as a deductible expense for a service company is limited to the actual EAR paid or incurred but not to exceed 1.00% of net revenue.
FCDU offshore income (income from non-residents) is tax-exempt while gross onshore income (income from residents) is subject to 10.00% income tax. In addition, interest income on deposit placements with other FCDUs and OBUs is taxed at 15.00% in 2021 and 2020. Under current tax regulations, the income derived by the FCDU from foreign currency transactions with non-residents, OBUs, local commercial banks, including branches of foreign banks, is tax-exempt while interest income on foreign currency loans from residents other than OBUs or other depository banks under the expanded system is subject to 10.00% income tax.
k. Research and Development Costs There are no major expenses on research and development activities. Expenses incurred related to these activities are included into the regular business expense of the Bank.
l. Employees In 2021, as the global pandemic continued to challenge business and organizations, the Bank remained steadfast in its resolve to serve its customers and employees. Workplace Wellness and Employee Well-being Health, safety, wellness, and overall well-being of its employees are among the top priorities. The Bank initiated several programs which addressed mental health, physical fitness, social connection, spiritual consciousness, environmental stewardship, and the COVID-19 pandemic. Among the highlights of the Bank’s efforts to protect its base are the following:
• With a very active #PSBakuna campaign, the Bank achieved 99.65% vaccination rate. 2,814 out of 2,824 PSBankers became certified #PSBakunado in 2021.

- 15 -
• People Communication remained as a way of connecting to all teams and employees, releasing a total of 28 COVID-19 Advisories and 81 HR Advisories.
• Initiatives led by the Health & Safety team are as follows.
o The 24/7 Flu Management team recorded 99.75% (788/790) recoveries among PSBankers who tested positive to COVID-19.
o A total of 52 Advisories on Health and 4 on Safety were released.
o The Occupational Safety and Health Committee (OSHCom) was among the most active institutional committees, conducting 12 monthly meetings throughout the year to regularly review the Bank’s Health & Safety protocols and align them with the Guidelines of DTI, DOLE, DOH, IATF, and other concerned government agencies.
The Bank continued its special focus on Mental Health too:
o Mind Over Matter – the Bank’s primary program to support Mental Health was in full force in 2021.
o The Psychological Consultation Policies and Procedures – a first for the Bank, was developed. A total of 888 PSBankers responded to Psychological Assessments and 46 attended Psychological Sessions.
o A team of Psychological First Aiders was formed – 18 are now certified including
certain Group/Division Heads.
o The regular Mental Health Advisory via #SelfcareSunday continued – 52 Advisories were released.
The Bank also launched the #PSBankCares Webinar Series – the first of which was Loosening Grip on Grief: Letting Go After Loss which was opened to the public and attended by 30 customers and customers-to-be.
• The PSBank Clinic also operated a Community Clinic – providing accessible healthcare to PSBankers reporting onsite. It offered PSBankers access to their basic clinic needs all year-round. As the Bank’s Wellness Center, it continued with its mandate to provide immediate healthcare to employees, as their first point of contact with a health professional, and further address needs for outpatient medical, nursing, and other types of care services.
• Overall well-being initiatives continued in 2021 – holding Spiritual Activities and Services for
the Soul such as regular virtual masses for Catholics and virtual fellowships for other religious denominations.
• To ensure the continuity of the Bank’s operations while keeping the employees safe during the
second year of the pandemic, several measures to manage workforce and productivity were adopted including the following:
o Disaster preparedness drills (i.e. fire and earthquake drills) and Business Continuity Plan (BCP) Refresher to ensure that operations are not hampered during an emergency scenario and that PSBankers are reminded of their respective roles during such scenarios. Reporting to the back-up site for certain critical units and services was activated and proved ready for BAU requirements.
o Pick-up Point to PSBank (P2P) Shuttle Service continued operating and serving employees until November 2021. The shuttle services were offered FREE during the Enhanced Community Quarantine (ECQ) and lower quarantine classifications. A route-based premium charging via contactless QR remained in place.
- 16 -
Employee Diversity
The Bank believes in the power of diversity to promote innovation, inclusive growth, and a collaborative enterprise. It has 2,824 employees – 63.53% are female employees, and 36.47% are male. In terms of age, 71.39% are between ages 30 to 50, followed by the ones below 30 at 21.81% and those over age 50 at 6.80%. The Bank’s Board of Directors has 9 members, two of which are female or 22% of the board make-up. Labor Relations As a unionized organization, the Bank maintains an agreement with the PSBank Employee’s Union (PSBEU) with the intent and purpose of promoting and improving the economic and social relationship between the Bank and the Union through the Collective Bargaining Agreement (CBA). The CBA establishes a better understanding relative to the rates of pay, hours of work and other terms and conditions of employment, providing expeditious means for the amicable adjustment of all industrial disputes, and to otherwise mutually confirm industrial peace and harmony. A CBA negotiation is held every three years between the Bank and the Union and the Bank closed the negotiation for the 2022-2024 cycle in 2021. It was the first to be done virtually from kick-off to actual negotiations to ceremonial signing. The Bank and PSBEU continues to align regularly through the Labor Management Council (LMC) appropriately called Talks on Employee Affairs and other Matters or TEAM. The Council is composed of three representatives from management and union who meet once a month to discuss any or all matters affecting the employees of the Bank. In strengthening its Employee Discipline Management, the Bank beefed up its People and Labor Relations team. Employee cases are now being documented, investigated, and closed at the shortest turnaround time. In 2021, TAT for handling of cases was significantly reduced to 16.18 days in 2021 from 34.43 days the year before.
The continuous challenge of the pandemic made the Bank even more committed to ensure a sound Employee Experience despite the absence of physical activities. The need to connect with colleagues and the observance of various global, national, and institutional celebrations were done virtually which boosted Employee Advocacy and Employee Engagement. The Bank’s efforts on this front was greatly appreciated by PSBankers as they gave the highest scores on record for both Workforce Engagement Score or WES-60 and employee-Net Promoter Score (e-NPS).
• On WES-60, all dimensions were rated very high (even higher than the previous year). With the highest possible score being 4.0, the Bank’s comparative scores for 2020 vs 2021 are as follows:
o Company Support (3.66 to 3.73/4.00) o Job Performance (3.81 to 3.85/4.00) o Working Relationships (3.80 to 3.83/4.00) o Dedication (3.85 to 3.88/4.00); and o Company Policies and Goals (3.90 to 3.92/4.00)
• On e-NPS, the Bank achieved an all-time high of +87, a +7 increase from the previous year’s +80.
The Bank has always been committed to provide several government-mandated and voluntary benefits to its employees such as leaves, salary loans, several loans options, medical benefits, and other benefits. Many of the benefits administration activities were automated for greater efficiency and service delivery to employees and their dependents. As a matter of policy, the compulsory retirement age for regular employees (officers and staff) is at 55 years old. This has been established in our Retirement and Gratuity Plan, duly approved by the Bureau of Internal Revenue. To aid in workforce planning, HR reviews the roster of employees who shall be reaching the compulsory retirement age before the end of the applicable year. Appropriate notification is arranged, and deferential treatment is accorded to retired employees, ensuring that they receive the compensations for their loyal service within 30 days after their effective date of retirement. As part of
- 17 -
their closing their Employee Experience loop in the Bank, they are likewise provided an Offboarding Kit which contains send-off tokens and mementos. Voluntary turn-over rate in 2021 was lower at 5.4% alongside a lower involuntary turnover rate for employees at 0.7% Employee Training and Development PSBank recognizes that training and education are critical components of the goal to strengthen employee skills and competencies, aside from supporting their professional and personal development. In 2021, through the PSBank Business Campus (PBC), the Bank’s official training arm, 45,184 hours were dedicated to employee training. Total expenditure was PHP 3,813,161, which is 4.70% higher than the previous year’s expense because of dozens of additional training programs. A total of 665 trainings were conducted, significantly increasing the previous year’s total of only 189. The PBC operates as a strategic business hub for non-stop learning which deploys accelerated, targeted, and immersive programs for continuous employee Learning & Development.
• The Bank scored 100% on all regulatory trainings: AMLA Refresher, Occupational Safety and Health, RPT Refresher, FCP Refresher, DPA Refresher, BCP Refresher, and Sustainable Finance Framework on its first roll out.
• Ladderized Programs and Developmental Assignments (DA) were further strengthened for various teams – from seven (7) in programs in 2020 to thirteen in 2021.
• Management Trainings and other Development Programs continued to run in 2021. Redefining Institutional Sales Efficiency (RISE) for Branch Heads on DA trained 12 personnel. Staff Professional Enhancement and Educational Development Accelerated Learning (SPEED AX-L) for rank-and-file staff levelling up to become Branch Service and Control Officers had a total of 25 graduates and 18 new candidates. The New Accounts Clerk (NAC) Step Up for Branch Banking’s Customer Service Associates (CSAs) had 20 graduates. The New Normal Account Officer (NNAO), a special program for the Salesforce was launched with 70 Account/Sales Officers participating in its first module on the Art of CounSelling.
Employee Volunteerism and Corporate Social Responsibility We continued to promote the PSBayanihan as the Bank’s main vehicle for employee volunteerism. Its 2021 iteration, PaSaBayanihan: Biyaya ay Ipasa became an avenue for PSBankers to share their blessings and pay them forward. In May to June, PSBankers once again showed their compassion for those affected by the pandemic by donating 65 bags of groceries and 170 bags of vegetables to various local communities in Metro Manila and neighboring provinces. During the Father’s Day celebration, PSBankers gave out 125 grocery packs to the Bank’s service agency personnel who heads of their family, as part of PaSaBayanihan: Pag-asa ay IpadAMA. After the onslaught of Typhoon Odette in December, PSBankers generously poured donations via Pagtutulungang Taimtim Para Sa Typhoon Odette Victims – 41 employees, 33 Security Guards, and 16 Messengers/Janitors were provided with PhP 5,000 each to aid them in rehabilitation and recovery after their houses were destroyed/ We likewise sustained our corporate social responsibility (CSR) program amidst the lingering impact of the pandemic. These are the following:
• Educational Assistance Program with partner institutions Chiang Kai Shek College (CKSC) and the Association of Chinese-Filipino Schools (ACFS) to provide quality educational opportunities to talented but financially challenged students. For academic year 2021-2022, PSBank supported 10 college students taking up Engineering, Computer Science, Accountancy, and Marketing from CKSC and 29 grades 2- 12 students from 15 schools under ACFS during the first semester.
• Regular partnerships with cause-oriented groups Resources for the Blind, Inc.; World Vision Philippines; and Chosen Children Village Foundation, Inc.
• The Bank also partnered with iVolunteer Philippines for iVoluntree for Christmas to fulfill the wishlists of different organizations and communities. 1,100 pcs of agri bags and other fishing
- 18 -
equipment and mangrove nursery materials were provided to fisherfolks in Cavite and Batangas through the Nature Awareness and Conservation Club Inc. Solar home units were provided to Dumagat families in Sta.Ines, Tanay, Rizal through Solar Hope. 351 students in five (5) different schools in Marikina and Rizal were provided with Iwas Sa-Kit (Hygiene Kits) through Silid Aralan.
• The Bank continued its partnership with Trails to Empower Kids (TREK) too which provided 1,000 learning kits for teachers and pupils of nine (9) primary and minority schools in Occidental Mindoro.
Manpower Complement The following table shows the Bank’s existing manpower complement:
As of December 31, 2021 As of March 31 , 2022
Senior Officers 55 53 Junior Officers 1,076 1,071 Staff 1,693 1,654
Total 2,824 2,778
m. Risk Management
PSBank is exposed to all business risks that confront all banks in general, such as credit, market, interest, liquidity, legal, regulatory and operational risk. The Bank’s risk management structure and process that serve as mechanism to identify, assess and manage these risks are further discussed in Note 5 of the Audited Financial Statements (Exhibit 5).
Item 2. Properties
The Bank owns the premises it occupies for the Head Office and 28 of its branches. These offices and branches are all in good condition and there is no mortgage or lien on any of these properties owned by the Bank. Schedule of owned branch sites are shown in Exhibit 1. The rest of the Bank’s branch premises are under lease agreements. The Bank leases the premises occupied by its branches for periods ranging from 1 to 20 years renewable under certain terms and conditions. Various lease contracts include escalation clauses, most of which bear an annual rent increase of 10.00%. The Bank recognized interest expense on lease liabilities (included in ‘Interest expense’ in the statements of income) amounting to P=85.2 million, P=99.5 million and P=113.6 in 2021, 2020 and 2019, respectively, rent expense from short-term leases and leases of low-value assets amounting (included in ‘Occupancy and equipment-related costs’ in the statements of income) to P=130.9 million in 2021, P=140.7 million in 2020 and P=94.1 million in 2019. The Bank has no immediate plans to acquire properties in relation to its branch expansion programs. Please refer to Exhibit 2 for the schedule of branch sites under lease agreements.
Item 3. Legal Proceedings
The Bank in the course of its operations and in running its business has several legal cases that are filed in its behalf and against it. However, these cases will not give any material effect to its financial status nor would have any material impact in continuing its operations. These cases are part of its daily business activities and consequence of its collection efforts and business dealings with the public.
Item 4. Submission of Matters to a Vote of Security Holders
No matter was submitted during the fourth quarter of the fiscal year covered by this report to a vote of security holders through the solicitation of proxies or otherwise.

- 19 -
PART II. OPERATIONAL AND FINANCIAL INFORMATION
Item 5. Market for Issuer’s Common Equity and Related Stockholder Matters
1. Market Information
PSBank common shares were listed in the Philippine Stock Exchange (PSE) in 1994. The shares are traded under the symbol “PSB”.
The high and low sales prices of the Shares as reported in the PSE for each quarter in the years ending December 31, 2021 and 2020 and subsequent interim periods were as follows:
Highest Lowest 2022: January 58.20 55.80 February 57.80 55.90 March 57.80 54.80 2021: Highest Lowest First quarter 56.70 53.00 Second quarter 84.75 53.05 Third quarter 77.00 50.20 Fourth quarter 58.10 55.00 2020: First quarter 54.60 34.20 Second quarter 52.00 40.10 Third quarter 52.00 47.00 Fourth quarter 54.60 51.00
Closing price as of April 8, 2022 was at P=55.50 per share.
2. Holders As of March 31, 2022, the Bank has 1,444 stockholders. The Top 20 Stockholders as of March 31, 2022 are as follow:
Name of Stockholders No. of Shares % to Total
1 METROPOLITAN BANK & TRUST COMPANY ** 377,279,068 88.3849% 2 DOLOR, DANILO L. 14,051,043 3.2917%
3 DOLOR, ERLINDA L. 8,474,411 1.9853% 4 PCD NOMINEE CORPORATION (FILIPINO) * 5,174,979 1.2123% 5 DE LEON, MARIA SOLEDAD S. 4,456,795 1.0441% 6 DE LEON, GIAN CARLO SERRANO 3,054,440 0.7156% 7 DE LEON, LEONARD FREDERICK SERRANO 2,895,061 0.6782% 8 DE LEON, ALVIN BENJAMIN SERRANO 2,716,290 0.6363% 9 DE LEON, KEVIN ANTHONY SERRANO 2,682,950 0.6285% 10 PCD NOMINEE CORPORATION (NON-FILIPINO) 2,666,393 0.6247% 11 GO, JAMES 332,947 0.0780%
12 GRAND ASIA REALTY INVESTMENT CORPORATION 325,958 0.0764% 13 QUE, LIONG H. 75,834 0.0178% 14 CHOA, JOHNNY K. 72,247 0.0169% 15 CHOA, VICTORIA K. 68,940 0.0162% 16 TY, ALEJANDRO 63,893 0.0150%
17 CHENG, BERCK Y. OR ALVIN Y. CHENG OR DIANA Y. CHENG OR CHERYL Y. CHENG 50,138 0.0117%
18 SY, VICTOR GAN 45,654 0.0107% 19 PEREZ, MA. GEORGINA V. 44,418 0.0104% 20 DY BUNCIO, ANJANETTE TY 42,710 0.0100%
* Net of 206,331,982 shares owned by Metropolitan Bank & Trust Company and 18 shares owned by Arthur Ty ** Includes 206,331,982 shares lodged with PCD Nominee Corp.
- 20 -
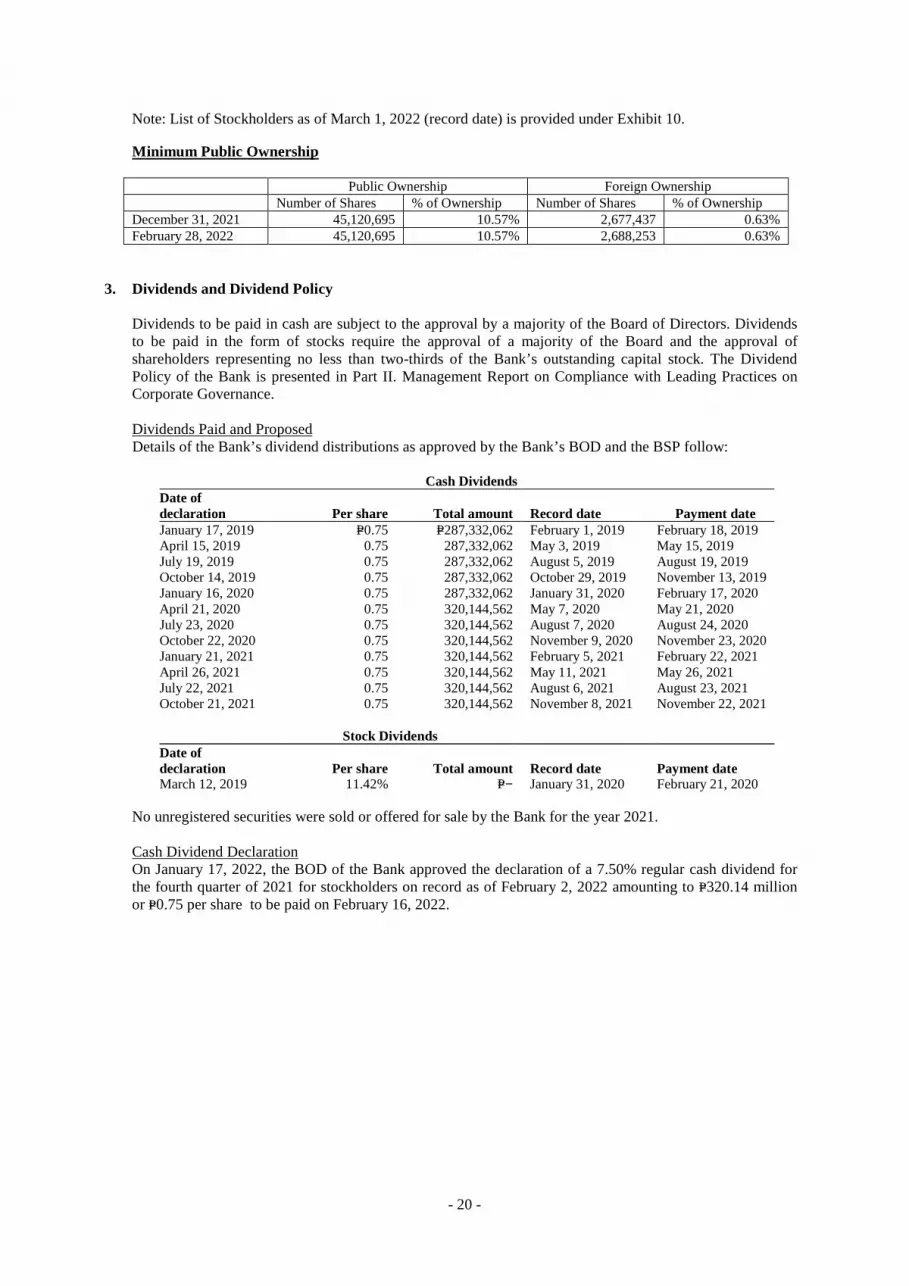
Note: List of Stockholders as of March 1, 2022 (record date) is provided under Exhibit 10.
Minimum Public Ownership Public Ownership Foreign Ownership Number of Shares % of Ownership Number of Shares % of Ownership December 31, 2021 45,120,695 10.57% 2,677,437 0.63% February 28, 2022 45,120,695 10.57% 2,688,253 0.63%
3. Dividends and Dividend Policy Dividends to be paid in cash are subject to the approval by a majority of the Board of Directors. Dividends to be paid in the form of stocks require the approval of a majority of the Board and the approval of shareholders representing no less than two-thirds of the Bank’s outstanding capital stock. The Dividend Policy of the Bank is presented in Part II. Management Report on Compliance with Leading Practices on Corporate Governance. Dividends Paid and Proposed Details of the Bank’s dividend distributions as approved by the Bank’s BOD and the BSP follow:
Cash Dividends Date of declaration Per share Total amount Record date Payment date January 17, 2019 P=0.75 P=287,332,062 February 1, 2019 February 18, 2019 April 15, 2019 0.75 287,332,062 May 3, 2019 May 15, 2019 July 19, 2019 0.75 287,332,062 August 5, 2019 August 19, 2019 October 14, 2019 0.75 287,332,062 October 29, 2019 November 13, 2019 January 16, 2020 0.75 287,332,062 January 31, 2020 February 17, 2020 April 21, 2020 0.75 320,144,562 May 7, 2020 May 21, 2020 July 23, 2020 0.75 320,144,562 August 7, 2020 August 24, 2020 October 22, 2020 0.75 320,144,562 November 9, 2020 November 23, 2020 January 21, 2021 0.75 320,144,562 February 5, 2021 February 22, 2021 April 26, 2021 0.75 320,144,562 May 11, 2021 May 26, 2021 July 22, 2021 0.75 320,144,562 August 6, 2021 August 23, 2021 October 21, 2021 0.75 320,144,562 November 8, 2021 November 22, 2021
Stock Dividends Date of declaration Per share Total amount Record date Payment date March 12, 2019 11.42% P=− January 31, 2020 February 21, 2020
No unregistered securities were sold or offered for sale by the Bank for the year 2021. Cash Dividend Declaration On January 17, 2022, the BOD of the Bank approved the declaration of a 7.50% regular cash dividend for the fourth quarter of 2021 for stockholders on record as of February 2, 2022 amounting to P=320.14 million or P=0.75 per share to be paid on February 16, 2022.
21
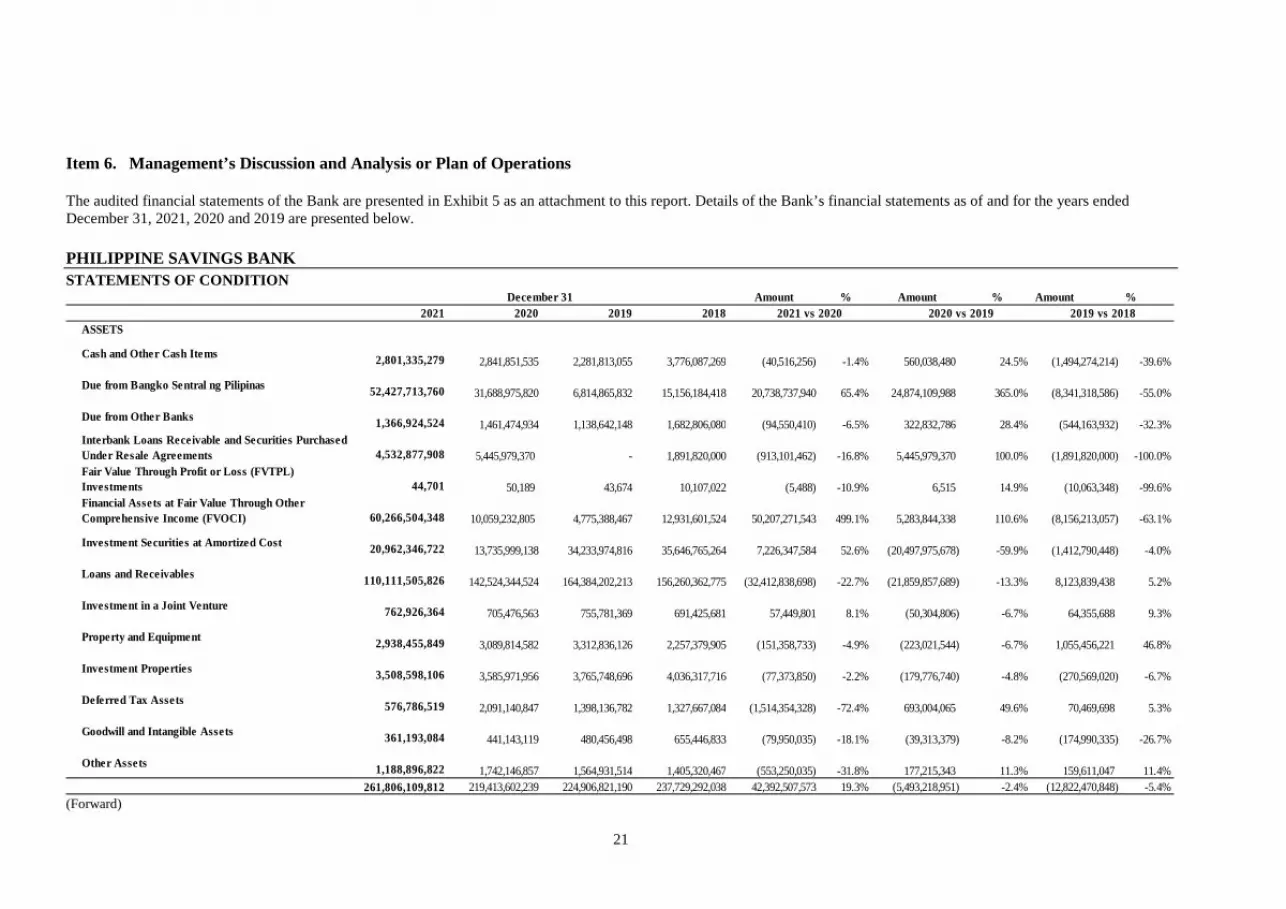
Item 6. Management’s Discussion and Analysis or Plan of Operations The audited financial statements of the Bank are presented in Exhibit 5 as an attachment to this report. Details of the Bank’s financial statements as of and for the years ended December 31, 2021, 2020 and 2019 are presented below. PHILIPPINE SAVINGS BANK STATEMENTS OF CONDITION
Amount % Amount % Amount % 2021 2020 2019 2018
ASSETS
Cash and Other Cash Items 2,801,335,279 2,841,851,535 2,281,813,055 3,776,087,269 (40,516,256) -1.4% 560,038,480 24.5% (1,494,274,214) -39.6%
Due from Bangko Sentral ng Pilipinas 52,427,713,760 31,688,975,820 6,814,865,832 15,156,184,418 20,738,737,940 65.4% 24,874,109,988 365.0% (8,341,318,586) -55.0%
Due from Other Banks 1,366,924,524 1,461,474,934 1,138,642,148 1,682,806,080 (94,550,410) -6.5% 322,832,786 28.4% (544,163,932) -32.3%Interbank Loans Receivable and Securities Purchased Under Resale Agreements 4,532,877,908 5,445,979,370 - 1,891,820,000 (913,101,462) -16.8% 5,445,979,370 100.0% (1,891,820,000) -100.0%Fair Value Through Profit or Loss (FVTPL) Investments 44,701 50,189 43,674 10,107,022 (5,488) -10.9% 6,515 14.9% (10,063,348) -99.6%Financial Assets at Fair Value Through Other Comprehensive Income (FVOCI) 60,266,504,348 10,059,232,805 4,775,388,467 12,931,601,524 50,207,271,543 499.1% 5,283,844,338 110.6% (8,156,213,057) -63.1%
Investment Securities at Amortized Cost 20,962,346,722 13,735,999,138 34,233,974,816 35,646,765,264 7,226,347,584 52.6% (20,497,975,678) -59.9% (1,412,790,448) -4.0%
Loans and Receivables 110,111,505,826 142,524,344,524 164,384,202,213 156,260,362,775 (32,412,838,698) -22.7% (21,859,857,689) -13.3% 8,123,839,438 5.2%
Investment in a Joint Venture 762,926,364 705,476,563 755,781,369 691,425,681 57,449,801 8.1% (50,304,806) -6.7% 64,355,688 9.3%
Property and Equipment 2,938,455,849 3,089,814,582 3,312,836,126 2,257,379,905 (151,358,733) -4.9% (223,021,544) -6.7% 1,055,456,221 46.8%
Investment Properties 3,508,598,106 3,585,971,956 3,765,748,696 4,036,317,716 (77,373,850) -2.2% (179,776,740) -4.8% (270,569,020) -6.7%
Deferred Tax Assets 576,786,519 2,091,140,847 1,398,136,782 1,327,667,084 (1,514,354,328) -72.4% 693,004,065 49.6% 70,469,698 5.3%
Goodwill and Intangible Assets 361,193,084 441,143,119 480,456,498 655,446,833 (79,950,035) -18.1% (39,313,379) -8.2% (174,990,335) -26.7%
Other Assets 1,188,896,822 1,742,146,857 1,564,931,514 1,405,320,467 (553,250,035) -31.8% 177,215,343 11.3% 159,611,047 11.4% 261,806,109,812 219,413,602,239 224,906,821,190 237,729,292,038 42,392,507,573 19.3% (5,493,218,951) -2.4% (12,822,470,848) -5.4%
December 31 2021 vs 2020 2020 vs 2019 2019 vs 2018
(Forward)
22
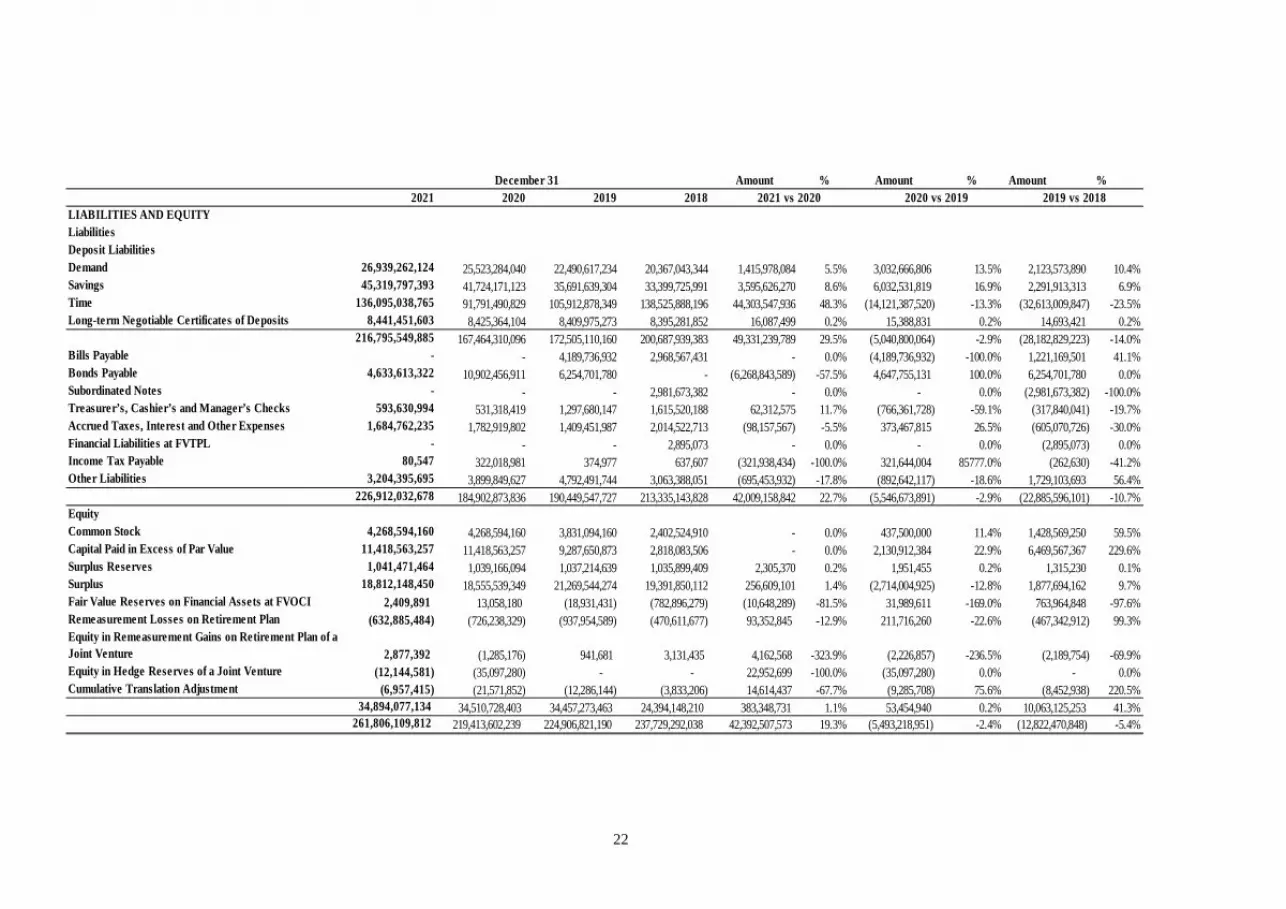
Amount % Amount % Amount %
2021 2020 2019 2018LIABILITIES AND EQUITYLiabilitiesDeposit Liabilities Demand 26,939,262,124 25,523,284,040 22,490,617,234 20,367,043,344 1,415,978,084 5.5% 3,032,666,806 13.5% 2,123,573,890 10.4%Savings 45,319,797,393 41,724,171,123 35,691,639,304 33,399,725,991 3,595,626,270 8.6% 6,032,531,819 16.9% 2,291,913,313 6.9%Time 136,095,038,765 91,791,490,829 105,912,878,349 138,525,888,196 44,303,547,936 48.3% (14,121,387,520) -13.3% (32,613,009,847) -23.5%Long-term Negotiable Certificates of Deposits 8,441,451,603 8,425,364,104 8,409,975,273 8,395,281,852 16,087,499 0.2% 15,388,831 0.2% 14,693,421 0.2%
216,795,549,885 167,464,310,096 172,505,110,160 200,687,939,383 49,331,239,789 29.5% (5,040,800,064) -2.9% (28,182,829,223) -14.0%Bills Payable - - 4,189,736,932 2,968,567,431 - 0.0% (4,189,736,932) -100.0% 1,221,169,501 41.1%Bonds Payable 4,633,613,322 10,902,456,911 6,254,701,780 - (6,268,843,589) -57.5% 4,647,755,131 100.0% 6,254,701,780 0.0%Subordinated Notes - - - 2,981,673,382 - 0.0% - 0.0% (2,981,673,382) -100.0%Treasurer’s, Cashier’s and Manager’s Checks 593,630,994 531,318,419 1,297,680,147 1,615,520,188 62,312,575 11.7% (766,361,728) -59.1% (317,840,041) -19.7%Accrued Taxes, Interest and Other Expenses 1,684,762,235 1,782,919,802 1,409,451,987 2,014,522,713 (98,157,567) -5.5% 373,467,815 26.5% (605,070,726) -30.0%Financial Liabilities at FVTPL - - - 2,895,073 - 0.0% - 0.0% (2,895,073) 0.0%Income Tax Payable 80,547 322,018,981 374,977 637,607 (321,938,434) -100.0% 321,644,004 85777.0% (262,630) -41.2%Other Liabilities 3,204,395,695 3,899,849,627 4,792,491,744 3,063,388,051 (695,453,932) -17.8% (892,642,117) -18.6% 1,729,103,693 56.4%
226,912,032,678 184,902,873,836 190,449,547,727 213,335,143,828 42,009,158,842 22.7% (5,546,673,891) -2.9% (22,885,596,101) -10.7%EquityCommon Stock 4,268,594,160 4,268,594,160 3,831,094,160 2,402,524,910 - 0.0% 437,500,000 11.4% 1,428,569,250 59.5%Capital Paid in Excess of Par Value 11,418,563,257 11,418,563,257 9,287,650,873 2,818,083,506 - 0.0% 2,130,912,384 22.9% 6,469,567,367 229.6%Surplus Reserves 1,041,471,464 1,039,166,094 1,037,214,639 1,035,899,409 2,305,370 0.2% 1,951,455 0.2% 1,315,230 0.1%Surplus 18,812,148,450 18,555,539,349 21,269,544,274 19,391,850,112 256,609,101 1.4% (2,714,004,925) -12.8% 1,877,694,162 9.7%Fair Value Reserves on Financial Assets at FVOCI 2,409,891 13,058,180 (18,931,431) (782,896,279) (10,648,289) -81.5% 31,989,611 -169.0% 763,964,848 -97.6%Remeasurement Losses on Retirement Plan (632,885,484) (726,238,329) (937,954,589) (470,611,677) 93,352,845 -12.9% 211,716,260 -22.6% (467,342,912) 99.3%Equity in Remeasurement Gains on Retirement Plan of a Joint Venture 2,877,392 (1,285,176) 941,681 3,131,435 4,162,568 -323.9% (2,226,857) -236.5% (2,189,754) -69.9%Equity in Hedge Reserves of a Joint Venture (12,144,581) (35,097,280) - - 22,952,699 -100.0% (35,097,280) 0.0% - 0.0%Cumulative Translation Adjustment (6,957,415) (21,571,852) (12,286,144) (3,833,206) 14,614,437 -67.7% (9,285,708) 75.6% (8,452,938) 220.5%
34,894,077,134 34,510,728,403 34,457,273,463 24,394,148,210 383,348,731 1.1% 53,454,940 0.2% 10,063,125,253 41.3% 261,806,109,812 219,413,602,239 224,906,821,190 237,729,292,038 42,392,507,573 19.3% (5,493,218,951) -2.4% (12,822,470,848) -5.4%
2021 vs 2020 2020 vs 2019 2019 vs 2018 December 31

23
PHILIPPINE SAVINGS BANK STATEMENTS OF INCOME
Amount % Amount % Amount % 2021 2020 2019 2018
INTEREST INCOMELoans and receivables 12,148,774,170 15,666,265,787 15,481,189,433 14,268,805,623 (3,517,491,617) -22.5% 185,076,354 1.2% 1,212,383,810 8.5%Financial assets at FVOCI and investment securities at amortized cost 1,486,019,162 1,298,471,798 1,896,257,446 1,985,357,651 187,547,364 14.4% (597,785,648) -31.5% (89,100,205) -4.5%Interbank loans receivable and securities purchased under resale agreements 70,592,184 85,056,319 30,140,459 89,723,370 (14,464,135) -17.0% 54,915,860 182.2% (59,582,911) -66.4%Due from other banks 47,132 1,178,094 4,066,446 4,338,859 (1,130,962) -96.0% (2,888,352) -71.0% (272,413) -6.3%Due from Bangko Sentral ng Pilipinas 648,063,197 221,893,610 831,792 16,662,587 426,169,587 192.1% 221,061,818 26576.6% (15,830,795) -95.0%FVTPL investments 11,272,985 45,039,478 2,152 9,088,886 (33,766,493) -75.0% 45,037,326 2092812.5% (9,086,734) -100.0%
14,364,768,830 17,317,905,086 17,412,487,728 16,373,976,976 (2,953,136,256) -17.1% (94,582,642) -0.5% 1,038,510,752 6.3%INTEREST EXPENSE Deposit liabilities 1,637,233,919 2,771,606,957 5,327,625,405 4,818,493,359 (1,134,373,038) -40.9% (2,556,018,448) -48.0% 509,132,046 10.6%Bonds payable 437,530,261 583,408,268 167,596,354 - (145,878,007) -25.0% 415,811,914 248.1% 167,596,354 100.0%Lease Liabilities 85,201,992 99,539,323 113,560,729 - (14,337,331) -14.4% (14,021,406) -12.3% 113,560,729 100.0%Bills payable 41,972 110,397,939 319,718,630 55,857,635 (110,355,967) -100.0% (209,320,691) -65.5% 263,860,995 472.4%Subordinated notes - - 125,118,285 167,675,686 - 0.0% (125,118,285) -100.0% (42,557,401) -25.4%
2,160,008,144 3,564,952,487 6,053,619,403 5,042,026,680 (1,404,944,343) -39.4% (2,488,666,916) -41.1% 1,011,592,723 20.1%NET INTEREST INCOME 12,204,760,686 13,752,952,599 11,358,868,325 11,331,950,296 (1,548,191,913) -11.3% 2,394,084,274 21.1% 26,918,029 0.2%Service fees and commission income 1,581,126,848 1,308,210,530 1,951,941,673 1,721,745,423 272,916,318 20.9% (643,731,143) -33.0% 230,196,250 13.4%Service fees and commission expense 47,816,732 50,825,805 88,437,296 96,107,664 (3,009,073) -5.9% (37,611,491) -42.5% (7,670,368) -8.0%
NET SERVICE FEES AND COMMISSION INCOME 1,533,310,116 1,257,384,725 1,863,504,377 1,625,637,759 275,925,391 21.9% (606,119,652) -32.5% 237,866,618 14.6%
OTHER OPERATING INCOME (CHARGES)Gain on foreclosure and sale of investment properties - net 571,276,769 326,868,825 611,833,898 421,975,957 244,407,944 74.8% (284,965,073) -46.6% 189,857,941 45.0%Gain on foreclosure and sale of chattel mortgage properties - 142,185,112 (458,776,805) (84,902,195) 232,063,012 600,961,917 -131.0% (373,874,610) 440.4% (316,965,207) -136.6%Gain on disposal of investment securities at amortized cost 11,711,129 1,291,913,518 - - (1,280,202,389) -99.1% 1,291,913,518 100.0% - 0.0%Foreign exchange gain - net (8,168,185) 27,217,634 65,884,165 88,032,388 (35,385,819) -130.0% (38,666,531) -58.7% (22,148,223) -25.2%Trading and securities gains (losses) - net 2,733,476 354,430,046 223,992,445 (133,297,506) (351,696,570) -99.2% 130,437,601 58.2% 357,289,951 -268.0%Gain on sale of property and equipment 2,042,084 2,045,386 8,132,940 7,918,569 (3,302) -0.2% (6,087,554) -74.9% 214,371 2.7%Miscellaneous 700,430,805 15,466,028 554,897,890 624,299,435 684,964,777 4428.8% (539,431,862) -97.2% (69,401,545) -11.1%
1,422,211,190 1,559,164,632 1,379,839,143 1,240,991,855 (136,953,442) -8.8% 179,325,489 13.0% 138,847,288 11.2%TOTAL OPERATING INCOME 15,160,281,992 16,569,501,956 14,602,211,845 14,198,579,910 (1,409,219,964) -8.5% 1,967,290,111 13.5% 403,631,935 2.8%
Years Ended December 31 2020 vs 2019 2019 vs 2018 2021 vs 2020
24
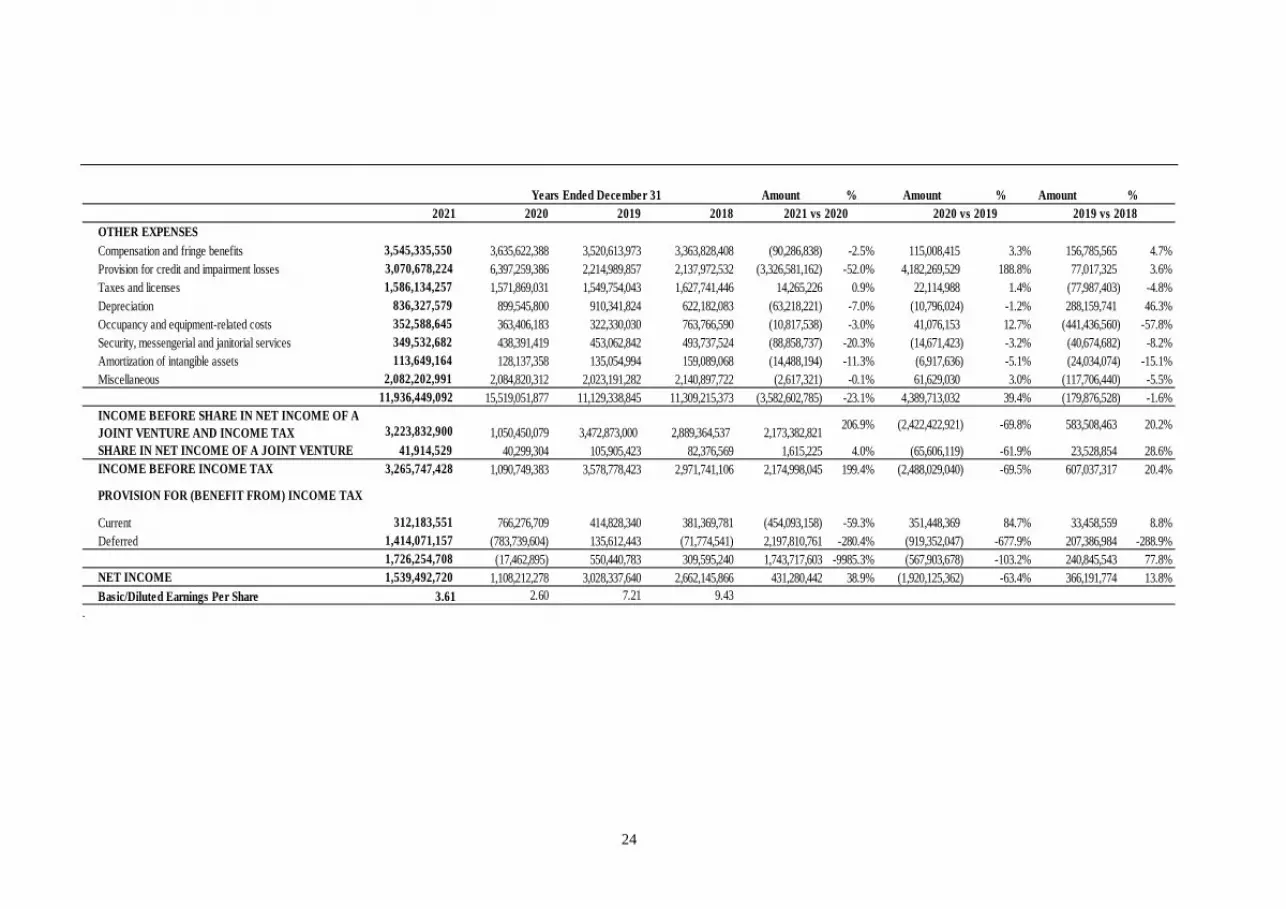
Amount % Amount % Amount %
2021 2020 2019 2018OTHER EXPENSESCompensation and fringe benefits 3,545,335,550 3,635,622,388 3,520,613,973 3,363,828,408 (90,286,838) -2.5% 115,008,415 3.3% 156,785,565 4.7%Provision for credit and impairment losses 3,070,678,224 6,397,259,386 2,214,989,857 2,137,972,532 (3,326,581,162) -52.0% 4,182,269,529 188.8% 77,017,325 3.6%Taxes and licenses 1,586,134,257 1,571,869,031 1,549,754,043 1,627,741,446 14,265,226 0.9% 22,114,988 1.4% (77,987,403) -4.8%Depreciation 836,327,579 899,545,800 910,341,824 622,182,083 (63,218,221) -7.0% (10,796,024) -1.2% 288,159,741 46.3%Occupancy and equipment-related costs 352,588,645 363,406,183 322,330,030 763,766,590 (10,817,538) -3.0% 41,076,153 12.7% (441,436,560) -57.8%Security, messengerial and janitorial services 349,532,682 438,391,419 453,062,842 493,737,524 (88,858,737) -20.3% (14,671,423) -3.2% (40,674,682) -8.2%Amortization of intangible assets 113,649,164 128,137,358 135,054,994 159,089,068 (14,488,194) -11.3% (6,917,636) -5.1% (24,034,074) -15.1%Miscellaneous 2,082,202,991 2,084,820,312 2,023,191,282 2,140,897,722 (2,617,321) -0.1% 61,629,030 3.0% (117,706,440) -5.5%
11,936,449,092 15,519,051,877 11,129,338,845 11,309,215,373 (3,582,602,785) -23.1% 4,389,713,032 39.4% (179,876,528) -1.6%INCOME BEFORE SHARE IN NET INCOME OF A JOINT VENTURE AND INCOME TAX 3,223,832,900 1,050,450,079 3,472,873,000 2,889,364,537 2,173,382,821
206.9% (2,422,422,921) -69.8% 583,508,463 20.2%
SHARE IN NET INCOME OF A JOINT VENTURE 41,914,529 40,299,304 105,905,423 82,376,569 1,615,225 4.0% (65,606,119) -61.9% 23,528,854 28.6%INCOME BEFORE INCOME TAX 3,265,747,428 1,090,749,383 3,578,778,423 2,971,741,106 2,174,998,045 199.4% (2,488,029,040) -69.5% 607,037,317 20.4%
PROVISION FOR (BENEFIT FROM) INCOME TAX
Current 312,183,551 766,276,709 414,828,340 381,369,781 (454,093,158) -59.3% 351,448,369 84.7% 33,458,559 8.8%Deferred 1,414,071,157 (783,739,604) 135,612,443 (71,774,541) 2,197,810,761 -280.4% (919,352,047) -677.9% 207,386,984 -288.9%
1,726,254,708 (17,462,895) 550,440,783 309,595,240 1,743,717,603 -9985.3% (567,903,678) -103.2% 240,845,543 77.8%NET INCOME 1,539,492,720 1,108,212,278 3,028,337,640 2,662,145,866 431,280,442 38.9% (1,920,125,362) -63.4% 366,191,774 13.8%Basic/Diluted Earnings Per Share 3.61 2.60 7.21 9.43
2021 vs 2020 2019 vs 2018 Years Ended December 31
2020 vs 2019
.
- 25 -
A. Plan of Operation The core business of PSBank is focused on the expansion of the consumer business by growing its retail deposits and consumer loans, including small and medium enterprises, through its various channels and digital ecosystem. Ultimately, the aim is to make things simple for the customers by providing them solutions based on actual need and enhancing their 24/7 banking experience – at every encounter in their most preferred platform. The bank has a network of 250 branches and 545 ATMs strategically located nationwide as at end-March 2022.
B. Management’s Discussion And Analysis
As of December 31, 2021 and 2020 In 2021, the Bank recorded Total Assets at P=261.81 billion, P=42.39 million higher as compared to the December 2020 level of P=219.41 billion. The growth was primarily due to increases in investment portfolio, including placements in Bangko Sentral ng Pilipinas (BSP). Loans and Receivables, net of allowance and unearned interest and discounts, representing 42.06% of total assets were posted at P=110.11 billion, lower by P=32.41 billion from December 2020 level of P=142.52 billion. Auto Loans and Mortgage Loans decreased by 26.41% and 10.21%, respectively. Interbank Loans Receivable and Securities Purchased under Resale Agreements decreased by 16.77% from P=5.45 billion in 2020 to P=4.53 billion in December 2021. Financial Assets at Fair Value through Other Comprehensive Income (FVOCI) increased to P=60.27 billion in December 2021, or P=50.21 billion higher than the December 2020 level of P=10.06 billion. Meanwhile, Investment securities at amortized cost amounted to P=20.96 billion, 52.61% higher compared to December 2020 level of P=13.74 billion. Fair Value through Profit or Loss Investments (FVTPL) amounted to P=0.04 million in December 2021. Overall, these investment accounts comprised 31.03% of the total assets. In 2020, the Bank sold investment securities classified as investment securities at amortized cost with total carrying amount of P=19.6 billion, resulting in gain on disposal of investment securities at amortized cost totaling P=1.3 billion. The sale was made as there were changes in the Bank’s funding requirements given its assessment on the impact of a prolonged pandemic. In aggregate, the disposals in 2020 were assessed as not inconsistent with the Bank’s HTC business model as the disposals were considered infrequent even if significant in value. In 2021, the Bank sold investment securities classified as investment securities at amortized cost with total carrying amount of P=378.7 million, resulting in gain on disposal of investment securities at amortized cost amounting to P=11.7 million. The disposal in 2021 was assessed as not inconsistent with the Bank’s HTC business model as the disposal was considered infrequent and insignificant in value. Further, the Bank assessed that the disposals did not reflect a change in the Bank’s objectives for the HTC business model. Accordingly, the remaining investment securities in the affected HTC portfolio continue to be measured at amortized cost. Due from Other Banks was registered at P=1.37 billion, 6.47% or P=94.55 million lower than the December 2020 level of P=1.46 billion. Likewise, Cash and Other Cash Items also decreased to P=2.80 billion versus P=2.84 billion in December 2020. Due from Bangko Sentral ng Pilipinas increased by P=20.74 billion to P=52.43 billion versus P=31.69 billion as of December 2020. Investment in a joint venture went up by P=57.45 million to P=762.93 million from P=705.48 million in December 2020 due to cash dividend received by the Bank. Investment Properties went down to P=3.51 billion as of December 2021 from P=3.59 billion compared last year due to sale of investment properties. Property and Equipment decreased by P=151.36 million to P=2.94 billion as of December 2021. Effective January 1, 2019, the Bank adopted PFRS 16, Leases. The adoption resulted to recognition of right of use asset under ‘property and equipment’ and lease liability under ‘other liabilities’ accounts.
- 26 -
Deferred Tax Asset was lower at P=0.58 billion from P=2.09 billion while Goodwill and Intangible Assets decreased to P=361.19 million in December 2021 from P=441.14 million in December 2020. Other Assets decreased by 31.76% or P=553.25 million to P=1.19 billion from P=1.74 billion as of December 2020. The Bank’s deposit level, representing 95.54% of total liabilities reached P=216.80 billion as of December 2021, 29.46% higher than the P=167.46 billion posted last year. As of December 2021, the Bank’s Bonds Payable, net of prepaid expenses, amounted to P=4.63 billion. The P=6.30 billion Peso Fixed Rate Bonds (PFRBs) issued last July 2019 matured in July 2021. The 2-year bond was priced at 5.60% per annum with interest payments made every quarter and full principal paid out at maturity. On December 10, 2018, the Bank issued MTFNs amounting to P=3.0 billion with a tenor of one (1) year and six (6) Months and due on June 10, 2020 with interest rate of 7.07% per annum payable quarterly. Interest payment dates shall commence on March 10, 2019 and up to and including the maturity date. The minimum investment size for the MTFNs is P=10.0 million with increments of P=0.1 million thereafter. On June 10, 2020, the Bank paid its outstanding MTFNs. Treasurer’s, Cashier’s and Manager’s Checks increased to P=0.59 billion from P=0.53 billion last December 31, 2020. On the other hand, Accrued Taxes, Interest and Other Expenses decreased by P=98.16 million to P=1.68 billion in December 2021 from P=1.78 billion as of December 31, 2020. Income Tax Payable went down to P=0.08 million as of December 2021 from P=322.02 million in December 2020. Other Liabilities decreased to P=3.20 billion, 17.83% lower from P=3.90 billion posted last year. Total Capital remained strong at P=34.89 billion, P=383.35 million higher from the P=34.51 billion posted as of December 2020. The Bank reflected a P=2.41 million Fair Value Reserves on Financial Assets at FVOCI, P=10.65 million lower than P=13.06 million in December 2020. On January 16, 2020, the Securities and Exchange Commission (“SEC”) approved the stock dividend equivalent to 43,750,000 common share of PSBank with January 31, 2020 as record date and February 21, 2020 as payment date for the required subscription to the increase in capital stock of the Bank from P=4.25 billion to P=6.00 billion. Return on Average Equity (ROAE) stood at 4.44% in December 2021 versus 3.21% in December 2020. Return on Average Assets (ROAA) increased to 0.64% in 2021 from 0.50% in 2020. As of December 31, 2020 and 2019 The Bank’s Total Assets as of December 31, 2020 stood at P=219.41 billion, P=5.49 billion lower than the December 2019 level of P=224.91 billion. Loans and Receivables, net of allowance and unearned interest and discounts, representing 64.96% of total assets were posted at P=142.52 billion, lower by P=21.86 billion from December 2019 level of P=164.38 billion. Auto Loans and Mortgage Loans decreased by 16.40% and 3.64%, respectively. As of December 31, 2020, Interbank Loans Receivable and Securities Purchased under Resale Agreements amounted to P=5.45 billion. Financial Assets at Fair Value through Other Comprehensive Income (FVOCI) increased to P=10.06 billion in December 2020, or P=5.28 billion higher than the December 2019 level of P=4.78 billion. Meanwhile, Investment securities at amortized cost amounted to P=13.74 billion as of December 2020, 59.88% lower compared to December 2019 level of P=34.23 billion. Fair Value through Profit or Loss Investments (FVTPL) amounted to P=0.05 million in December 2020. Overall, these investment accounts comprised 10.84% of the total assets. In 2020, the Bank sold investment securities classified as investment securities at amortized cost with total carrying amount of P=19.6 billion resulting in gain on disposal of investment securities at amortized cost totaling P=1.3 billion. The sale was made as there were changes in the Bank’s funding requirements given its assessment on the impact of a prolonged pandemic. In aggregate, the sale in 2020 is not inconsistent with the Bank’s HTC business model as the sale was considered infrequent even if significant in value. Accordingly, the remaining investment securities in the affected HTC portfolio continue to be measured at amortized cost.
- 27 -
Further, the Bank assessed that the sale did not reflect a change in the Bank’s objectives for the HTC business model. Due from Other Banks as of December 2020 was at P=1.46 billion, 28.35% or P=322.83 million higher than the December 2019 level of P=1.14 billion. Likewise, Cash and Other Cash Items also increased to P=2.84 billion versus P=2.28 billion in December 2019. Due from Bangko Sentral ng Pilipinas increased by P=24.87 billion to P=31.69 billion versus P=6.81 billion as of December 2019. Investment in a joint venture went down by P=50.30 million to P=705.48 million from P=755.78 million in December 2019 due to cash dividend received by the Bank. Investment Properties went down to P=3.59 billion as of December 2020 from P=3.77 billion in December 2019 due to sale of investment properties. Property and Equipment decreased by P=223.02 million to P=3.09 billion as of December 2020. Effective January 1, 2019, the Bank adopted PFRS 16, Leases. The adoption resulted to recognition of right of use asset under ‘property and equipment’ and lease liability under ‘other liabilities’ accounts. Deferred Tax Asset was higher at P=2.09 billion from P=1.40 billion while Intangible Assets and Goodwill slightly decreased to P=441.14 million in December 2020 from P=480.46 million in December 2019. Other Assets increased by 11.32% or P=177.22 million to P=1.74 billion from P=1.56 billion as of December 2019 mainly due to the increase in foreclosed chattel mortgage. The Bank’s deposit level, comprising 90.57% of total liabilities reached P=167.46 billion as of December 2020, 2.92% lower than the P=172.51 billion as of December 2019. As of December 31, 2019, Bills Payable representing Interbank Borrowing and Securities Sold under Repurchase Agreement (SSURA) amounted to P=4.19 billion. The Bonds payables, net of debt issuance cost was recorded at P=10.90 billion in December 2020, 74.31% or P=4.65 billion higher than the year-end level of P=6.25 billion. On February 04, 2020, the Bank issued fixed rate bonds amounting to P=4.65 billion with a tenor of three (3) years and due on February 4, 2023 with interest rate of 4.5% per annum payable quarterly. On December 10, 2018, the Bank issued MTFNs amounting to P=3.0 billion with a tenor of one (1) year and six (6) months and due on June 10, 2020 with interest rate of 7.07% per annum payable quarterly. On June 10, 2020, the Bank paid its outstanding MTFNs. Treasurer’s, Cashier’s and Manager’s Checks decreased to P=0.53 billion from P=1.30 billion last December 31, 2019. On the other hand, Accrued Taxes, Interest and Other Expenses increased by P=373.47 million to P=1.78 billion in December 2020 from P=1.41 billion as of December 31, 2019. Lease Liabilities went down to P=1.34 billion in December 2020 versus P=1.47 billion recorded in December 2019 as the Bank adopted in January 2019 PFRS 16, Leases. Income Tax Payable in December 2020 stood at P=322.02 million. Other Liabilities was posted at P=2.56 billion from P=3.33 billion as of December 2019. Total Capital stood at P=34.51 billion, P=53.45 million higher from the P=34.46 billion posted as of December 2019. The Bank reflected a P=13.06 million Fair Value Reserves on Financial Assets at FVOCI from (P=18.93) million in December 2019. On January 16, 2020, the Securities and Exchange Commission (“SEC”) approved the stock dividend equivalent to 43,750,000 common share of PSBank with January 31, 2020 as record date and February 21, 2020 as payment date for the required subscription to the increase in capital stock of the Bank from P=4.25 billion to P=6.00 billion. Return on Average Equity (ROAE) slid to 3.21% in December 2020 versus 10.29% in December 2019. Return on Average Assets (ROAA) decreased to 0.50% in 2020 from 1.31% in 2019.

- 28 -
As of December 31, 2019 and 2018 The Bank’s Total Assets for the year ended December 31, 2019 stood at P=224.91 billion, 5.39% lower than the P=237.73 billion as of December 31, 2018. The decrease was primarily due to the reduction in regulatory reserve requirements and investment securities. As of December 31, 2019, Loans and Receivables, net of allowance and unearned interest and discounts, representing 73.09% of total assets was higher by 5.20% to P=164.38 billion from P=156.26 billion as of December 31, 2018 as driven by our Auto and Mortgage loan business. Auto loans increased by 4.36% while Mortgage loans grew by 5.02%. Cash and Other Cash Items decreased by P=1.49 billion or 39.57% to P=2.28 billion in 2019 from P=3.78 billion in 2018. Due from Other Banks also decreased by P=544.16 million or 32.34% compared to last year’s level of P=1.68 billion as a net effect of movements in the balances maintained with various local and foreign banks. Further, Due from BSP went down by P=8.34 billion to P=6.81 billion in 2019 from P=15.16 billion in 2018 due to BSP’s reduction in reserve requirements. As of December 31, 2019 and 2018, Interbank Loans Receivable and Securities Purchased under Resale Agreements (SPURA) amounted to nil and P=1.89 billion, respectively. Investments securities represent 17.34% and 20.44% of total assets as of December 31, 2019 and 2018, respectively. As of December 31, 2019, Investment Securities at Amortized Cost representing 15.22% of total assets was recorded at P=34.23 billion or P=1.41 billion lower than the last year’s balance. Financial Assets at Fair Value through Other Comprehensive Income (FVOCI) amounted to P=4.78 billion and P=12.93 billion as of December 31, 2019 and 2018, respectively. The decrease in the account by 63.07% or P=8.17 billion resulted from the net disposals of FVOCI during the year. Financial Assets at Fair Value through Profit or Loss (FVTPL) stood at P=0.04 million and P=10.11 million as of December 31, 2019 and 2018, respectively. The declines on Investment securities were caused by both sale and maturities. Investment in a Joint Venture increased by P=64.36 million or 9.31% to P=755.78 million from P=691.43 million, due to the recognition of PSBank’s share in the net earnings of Sumisho Motor Finance Corporation (SMFC), a joint venture between PSBank and Sumitomo Corporation. The increase from the recognition of share in net earnings was partially reduced by the dividend received by the Bank from SMFC amounting to P=39.36 million. As of December 31, 2019 and 2018, the Bank’s ownership interest in SMFC is 30.00%. Property and Equipment increased by 46.76% or P=1.06 billion to P=3.31 billion as of December 31, 2019 from P=2.26 billion as of December 31, 2018 due to the Bank’s adoption of PFRS 16, Leases effective January 1, 2019. The adoption resulted in the initial recognition of right of uses under ‘property and equipment’ and lease liability under ‘other liabilities’ amounting to P=1.44 billion and P=1.63 billion, respectively. Investment properties decreased by 6.70% or P=270.57 million from P=4.04 billion as of December 31, 2018 to P=3.77 billion as of December 31, 2019 due to sale of investment properties. Deferred Tax Assets increased by P=70.47 million to P=1.40 billion as of December 31, 2019 from P=1.33 billion as of December 31, 2018 due to the recognition of deferred tax benefits from loan loss provisioning during the year. Goodwill and Intangible Assets dropped by 26.70% or P=174.99 million to P=480.46 million from P=655.45 million posted last year as a result of retirement and amortization of software cost and license fees. Other Assets increased by 11.36% or P=159.61 million to P=1.56 billion from P=1.41 billion primarily due to additions in chattel mortgage properties. The Bank’s deposits representing 90.58% of total liabilities decreased by 14.04% or P=28.18 billion to P=172.51 billion as of December 31, 2019 from P=200.69 billion as of December 31, 2018 as it continued to rebalance its funding mix to focus on retail and alternative sources. Demand deposits and Savings Deposits were recorded at P=22.49 billion and P=35.69 billion, respectively, or an improvement by 10.43% and 6.86%, respectively. Meanwhile, Time Deposits decreased by 23.54% or P=32.61 billion to P=105.91 billion. As of December 31, 2019 and 2018, Long Term Negotiable Certificate of Time Deposits (LTNCTD) amounted to P=8.41 billion and P=8.40 billion, respectively.
- 29 -
Bills payable reached P=4.19 billion, 41.14% more than the P=2.97 billion level in 2018. This comprised of Interbank Loans Borrowing of P=1.20 billion and Medium-Term Fixed Rate Notes, net of prepaid expenses, of P=2.99 billion. As of December 31, 2019, the carrying value of the bonds amounted to P=6.25 billion. On July 24, 2019, the Bank issued fixed rate bonds amounting to P=6.30 billion with a tenor of two (2) years and due on July 24, 2021 with interest rate of 5.6% per annum payable quarterly. Debt issue cost related to the issuance amounted to P=56.90 million. Proceeds from the fund-raising exercise will support the Bank’s initiatives in expanding its consumer business. In August 2019, the Bank exercised the call option of its P=3.00 billion BASEL III compliant Tier 2 Notes issued in May 2014. Financial Liabilities at FVTPL stood at nil and P=2.90 million as of December 31, 2019 and 2018, respectively. Accrued Taxes, Interest and Other Expenses decreased by P=605.07 million or 30.04% to P=2.01 billion as of December 31, 2019 due to lower accrued interest and accrued other expenses payable. Treasurer’s, Cashier’s and Manager’s Checks decreased by 19.67% to P=1.30 billion from P=1.62 billion last year as a result of normal banking operations of the Bank. Income tax payable was lower at P=0.37 million versus P=0.64 million a year-ago. Meanwhile, Other Liabilities which include Accounts Payables, Withholding tax payables, Net Retirement Liability and Lease Liability increased by P=1.73 billion due to the Bank’s adoption of PFRS 16. As of December 31, 2019, Capital funds stood at P=34.46 billion, up by 41.25% from last year’s level of P=24.39 billion primarily due to better Fair Value Reserves on Financial Assets at FVOCI amounted to (P=18.93) million and (P=782.90) million as of December 2019 and 2018, respectively. On January 2019, the Bank successfully completed its stock rights offering amounting to P=8.00 billion. The Bank recorded Remeasurement Losses on Retirement Plan of P=937.95 million in December 2019. On the other hand, the Bank’s share in the Remeasurement Gains on Retirement Plan of its joint venture was posted at P=0.94 million from P=3.13 million in December 2018. As of December 31, 2019 and 2018, the Bank recorded loss on ‘Cumulative Translation Adjustment’ under equity amounting to P=12.29 million and P=3.83 million, respectively. As of December 31, 2019 Capital adequacy Ratio (CAR) was at 17.76%. This is above the minimum regulatory requirement of 10%. Meanwhile Return on Average Equity (ROAE) decreased to 10.29% in 2019 versus 11.38% in 2018. Return on Average Assets (ROAA) increased to 1.31% in 2019 from 1.15% in 2018. Analysis of Results of Operations
For the years ended December 31, 2021 and 2020
The Bank registered a Net Income after Tax of P=1.54 billion for the year ended December 2021, 38.92% or P=0.43 billion higher compared last year. This was largely driven by an increase in fee income by 21.94%, operating efficiencies which saw expenses decline by 2.81%, and reduction in loan loss provisions owing largely to improved asset quality and effective collection efforts. Total Interest Income decreased by 17.05% compared to previous year. Interest income on Loans and Receivables was recorded at P=12.15 billion, 22.45% lower than the P=15.67 billion recorded last year. Interest income on Financial Assets at FVOCI and Investment Securities at Amortized cost went up to P=1.49 billion from P=1.30 billion year on year. Interest Income on FVTPL Investments slid to P=11.27 million from P=45.04 million in 2020. On the other hand, Interest earned from deposits with BSP increased by P=426.17 million to P=648.06 million from P=221.89 million due to higher placements in 2021. Interest earned from Interbank Loans Receivable and SPURA was recorded at P=70.59
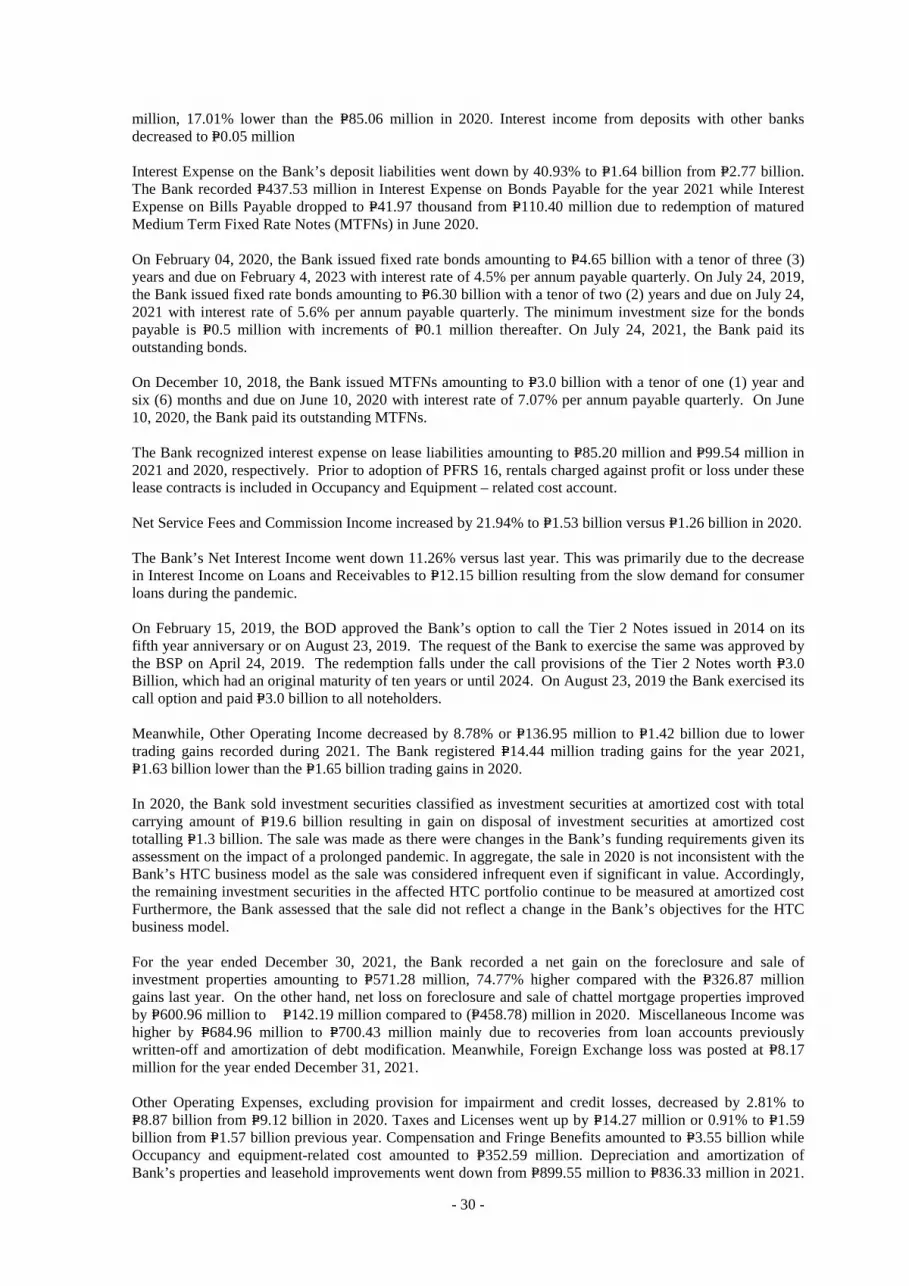
- 30 -
million, 17.01% lower than the P=85.06 million in 2020. Interest income from deposits with other banks decreased to P=0.05 million Interest Expense on the Bank’s deposit liabilities went down by 40.93% to P=1.64 billion from P=2.77 billion. The Bank recorded P=437.53 million in Interest Expense on Bonds Payable for the year 2021 while Interest Expense on Bills Payable dropped to P=41.97 thousand from P=110.40 million due to redemption of matured Medium Term Fixed Rate Notes (MTFNs) in June 2020. On February 04, 2020, the Bank issued fixed rate bonds amounting to P=4.65 billion with a tenor of three (3) years and due on February 4, 2023 with interest rate of 4.5% per annum payable quarterly. On July 24, 2019, the Bank issued fixed rate bonds amounting to P=6.30 billion with a tenor of two (2) years and due on July 24, 2021 with interest rate of 5.6% per annum payable quarterly. The minimum investment size for the bonds payable is P=0.5 million with increments of P=0.1 million thereafter. On July 24, 2021, the Bank paid its outstanding bonds. On December 10, 2018, the Bank issued MTFNs amounting to P=3.0 billion with a tenor of one (1) year and six (6) months and due on June 10, 2020 with interest rate of 7.07% per annum payable quarterly. On June 10, 2020, the Bank paid its outstanding MTFNs. The Bank recognized interest expense on lease liabilities amounting to P=85.20 million and P=99.54 million in 2021 and 2020, respectively. Prior to adoption of PFRS 16, rentals charged against profit or loss under these lease contracts is included in Occupancy and Equipment – related cost account. Net Service Fees and Commission Income increased by 21.94% to P=1.53 billion versus P=1.26 billion in 2020. The Bank’s Net Interest Income went down 11.26% versus last year. This was primarily due to the decrease in Interest Income on Loans and Receivables to P=12.15 billion resulting from the slow demand for consumer loans during the pandemic. On February 15, 2019, the BOD approved the Bank’s option to call the Tier 2 Notes issued in 2014 on its fifth year anniversary or on August 23, 2019. The request of the Bank to exercise the same was approved by the BSP on April 24, 2019. The redemption falls under the call provisions of the Tier 2 Notes worth P=3.0 Billion, which had an original maturity of ten years or until 2024. On August 23, 2019 the Bank exercised its call option and paid P=3.0 billion to all noteholders. Meanwhile, Other Operating Income decreased by 8.78% or P=136.95 million to P=1.42 billion due to lower trading gains recorded during 2021. The Bank registered P=14.44 million trading gains for the year 2021, P=1.63 billion lower than the P=1.65 billion trading gains in 2020. In 2020, the Bank sold investment securities classified as investment securities at amortized cost with total carrying amount of P=19.6 billion resulting in gain on disposal of investment securities at amortized cost totalling P=1.3 billion. The sale was made as there were changes in the Bank’s funding requirements given its assessment on the impact of a prolonged pandemic. In aggregate, the sale in 2020 is not inconsistent with the Bank’s HTC business model as the sale was considered infrequent even if significant in value. Accordingly, the remaining investment securities in the affected HTC portfolio continue to be measured at amortized cost Furthermore, the Bank assessed that the sale did not reflect a change in the Bank’s objectives for the HTC business model. For the year ended December 30, 2021, the Bank recorded a net gain on the foreclosure and sale of investment properties amounting to P=571.28 million, 74.77% higher compared with the P=326.87 million gains last year. On the other hand, net loss on foreclosure and sale of chattel mortgage properties improved by P=600.96 million to P=142.19 million compared to (P=458.78) million in 2020. Miscellaneous Income was higher by P=684.96 million to P=700.43 million mainly due to recoveries from loan accounts previously written-off and amortization of debt modification. Meanwhile, Foreign Exchange loss was posted at P=8.17 million for the year ended December 31, 2021. Other Operating Expenses, excluding provision for impairment and credit losses, decreased by 2.81% to P=8.87 billion from P=9.12 billion in 2020. Taxes and Licenses went up by P=14.27 million or 0.91% to P=1.59 billion from P=1.57 billion previous year. Compensation and Fringe Benefits amounted to P=3.55 billion while Occupancy and equipment-related cost amounted to P=352.59 million. Depreciation and amortization of Bank’s properties and leasehold improvements went down from P=899.55 million to P=836.33 million in 2021.

- 31 -
Security, messengerial and janitorial services was posted at P=349.53 million. Meanwhile, amortization of software was recorded at P=113.65 million. Miscellaneous Expenses was lower by 0.13% to P=0.08 billion. For the year ended December 31, 2021, the Bank set aside P=3.07 billion in provision for impairment and credit losses. This was 52.00% lower than previous year due to improvement in delinquencies from credit and collection efforts. The Bank also reported share in net income from its investment in Sumisho Motor Finance Corporation (SMFC) amounting to P=41.91 million and P=40.30 million for the years ended December 31, 2021 and 2020, respectively.
For the years ended December 31, 2020 and 2019
The Bank posted a Net Income after Tax of P=1.11 billion as of December 2020 or P=1.92 billion lower compared to the same period last year. The lower income was primarily due to credit prudence and muted loan demand. Total Interest Income recorded in 2020 amounted to P=17.32 billion. Interest income on Loans and Receivables was 1.20% higher at P=15.67 billion from P=15.48 billion. Interest earned from Interbank Loans Receivable and SPURA increased to P=85.06 million or P=54.92 million better than the P=30.14 million posted in 2019. Interest income from Financial Assets at FVOCI and Investment securities at amortized cost went down to P=1.30 billion in 2020 from P=1.90 billion. Meanwhile, Interest income from FVTPL investments stood at P=45.04 million in 2020. Interest earned from deposits with BSP increased to P=221.89 million from P=0.83 million in 2019. On the other hand, interest income from other banks decreased by 71.03% to P=1.18 million in 2020. Interest Expense on the Bank’s deposit liabilities decreased by 47.98% to P=2.77 billion from P=5.33 billion. Interest Expense on Bills payable declined to P=110.40 million or 65.47% lower from P=319.72 million last year. On the other hand, Interest Expense on Bonds payable increased to P=583.41 million or P=415.81 million higher from P=167.60 million in 2019. On February 04, 2020, the Bank issued fixed rate bonds amounting to P=4.65 billion with a tenor of three (3) years and due on February 4, 2023 with interest rate of 4.5% per annum payable quarterly. On December 10, 2018, the Bank issued MTFNs amounting to P=3.0 billion with a tenor of one (1) year and six (6) months and due on June 10, 2020 with interest rate of 7.07% per annum payable quarterly. On June 10, 2020, the Bank paid its outstanding MTFNs. Interest expense incurred on Subordinated (Tier 2) notes amounted to P=125.1 million in 2019 and nil in 2020. On February 15, 2019, the BOD approved the Bank’s option to call the Tier 2 Notes issued in 2014 on its fifth year anniversary or on August 23, 2019. The request of the Bank to exercise the same was approved by the BSP on April 24, 2019. The redemption falls under the call provisions of the Tier 2 Notes worth P=3.0 Billion, which had an original maturity of ten years or until 2024. On August 23, 2019 the Bank exercised its call option and paid P=3.0 billion to all noteholders. The Bank recognized interest expense on lease liabilities (included in ‘Interest expense’ in the statements of income) amounting to P=99.54 million and P=113.56 million in 2020 and 2019, respectively. Prior to adoption of PFRS 16, rentals charged against profit or loss under these lease contracts are included in ‘Occupancy and equipment-related costs’. As of December 2020, Net interest Income improved to P=13.75 billion from P=11.36 billion in 2019. Net Service Fees and Commission Income decreased to P=1.26 billion, 32.53% lower from the P=1.86 billion recorded last year.
- 32 -
Meanwhile, Other Operating Income increased by 13.00% or P=179.33 million to P=1.56 billion due to higher trading gains recorded during 2020. The Bank reflected a P=1.29 billion Gain on disposal of investment securities at amortized cost and P=354.43 million trading and securities gains in 2020. In 2020, the Bank sold investment securities classified as investment securities at amortized cost with total carrying amount of P=19.6 billion resulting in gain on disposal of investment securities at amortized cost totaling P=1.3 billion. The sale was made as there were changes in the Bank’s funding requirements given its assessment on the impact of a prolonged pandemic. In aggregate, the sale in 2020 is not inconsistent with the Bank’s HTC business model as the sale was considered infrequent even if significant in value. Accordingly, the remaining investment securities in the affected HTC portfolio continue to be measured at amortized cost Furthermore, the Bank assessed that the sale did not reflect a change in the Bank’s objectives for the HTC business model. The Bank registered a net loss on foreclosure and sale of chattel mortgage amounting to P=458.78 million from P=84.90 million in 2019. As of December 2020, the Bank posted a P=326.87 million gains on foreclosure and sale of investment properties versus P=611.83 million a year-ago. Gain on sale of property and equipment decreased by P=6.09 million to P=2.05 million from year-ago level of P=8.13 million. Miscellaneous Income was lower by P=539.43 million to P=15.47 million. On March 25, 2020, Republic Act No. 11469, otherwise known as the Bayanihan to Heal as One Act (“Bayanihan 1 Act”) was enacted. Bayanihan 1 Act provides that all covered institutions shall implement a 30-day grace period for all loans with principal and/or interest and lease amortization falling due within the ECQ Period without incurring interest on interest, penalties, fees and other charges. Subsequently, on September 11, 2020, Republic Act No. 11494, otherwise known as the Bayanihan to Recover as One Act (“Bayanihan 2 Act”), was enacted. Under Bayanihan 2 Act, a one-time sixty (60)-day grace period is granted for the payment of all existing, current and outstanding loans falling due, or any part thereof, on or before December 31, 2020, without incurring interest on interests, penalties, fees, or other charges and thereby extending the maturity of the said loans. Furthermore, a minimum 30-day grace period shall also be granted by covered institutions to all payments due within the period of community quarantine on rent and utility-related expenditures without incurring penalties, interest and other charges. Total modification loss due to the modified cash flow resulting from the extension of the client’s loan term recognized in the statement of income under ‘Miscellaneous income’ amounted to P426.52 million. Foreign Exchange gain was posted at P=27.22 million from P=65.88 million recorded a year ago. Other Operating Expenses, excluding provision for impairment and credit losses, increased by 2.33% to P=9.12 billion from P=8.91 billion in 2019. Taxes and Licenses went up by P=22.11 million or 1.43% to P=1.57 billion from P=1.55 billion. Depreciation and amortization of Bank’s properties and leasehold improvements decreased from P=910.34 million to P=899.55 million. Meanwhile, amortization of software costs was recorded at P=128.14 million. Compensation and Fringe Benefits amounted to P=3.64 billion while security, messengerial and janitorial services was at P=438.39 million. Miscellaneous Expenses was registered at P=2.08 billion versus P=2.02 billion during the same period last year. As of December 2020, the Bank set aside P=6.40 billion in provision for impairment and credit losses. The Bank also reported share in net income from its investment in Sumisho Motor Finance Corporation (SMFC) amounting to P=40.30 million from P=105.91 million as of December 2019.
For the years ended December 31, 2019 and 2018 The Bank registered a net income after tax of P=3.03 billion higher than the P=2.66 billion recorded for the same period last year. Total Interest Income increased by 6.34% or P=1.04 billion, better than the P=16.37 billion recorded last year mainly a result of an increase from Interest Income on Loans and Receivables. In 2019, Net Interest Income rose by P=26.92 million or 0.24% year-on-year, from P=11.33 billion in 2018 to P=11.36 billion in 2019 primarily due to increase in Interest Income on Loans and Receivables by 8.50% or P=1.21 billion to P=15.48 billion in 2019.

- 33 -
Interest income on financial assets at FVOCI/AFS investments and investment securities at amortized cost/HTM investments went down to P=1.90 billion from P=1.99 billion. Meanwhile, Interest earned from Interbank Loans Receivable and SPURA decreased by P=59.58 million to P=30.14 million in 2019 versus P=89.72 million in 2018. Interest earned from deposits with BSP slid by P=15.83 million to P=0.83 million while interest income from other banks was down by P=0.27 million to P=4.0 million in 2019. Interest income from FVTPL investments declined by P=9.01 million or 99.98% from P=9.09 million in 2018. Interest Expense on the Bank’s deposit liabilities increased by 10.57% to P=5.33 billion compared to P=4.82 billion during the same period last year due to rise in deposit cost of funds. Meanwhile, Interest Expense on Bills Payable was at P=319.72 million from P=55.86 million in 2018. Interest Expense on Bonds Payable was at P=167.60 million in 2019. Interest on subordinated notes decreased by 25.38% due to the Bank’s exercise of its call option in August 2019. Interest expense on lease liability amounting to P=113.56 million was recognized in 2019 in relation to the Bank’s adoption of PFRS 16. Net Service Fees and Commission Income increased by 14.63% to P=1.86 billion from P=1.63 billion in 2018. Other Operating Income was higher by 11.19% in 2019 compared with previous year. Other Operating Income increased to P=1.38 billion from P=1.24 billion. The Bank recorded a net gain on foreclosure and sale of investment properties amounting to P=611.83 million, P=189.86 million higher compared with the P=421.98 million during the same period last year. On the other hand, the Bank recorded a net loss on the foreclosure and sale of chattel mortgage properties amounting to P=84.90 million in 2019 as compared to the net gain on foreclosure and sale of chattel mortgage properties amounting to P=232.06 million recorded in 2018. Also, the Bank registered a net trading and securities gain of P=223.99 million in 2019. Foreign Exchange gain was lower at P=65.88 million from P=88.03 million. Miscellaneous Income was lower by P=69.40 million to P=544.90 million from P=624.30 million during the same period last year. Other Operating Expenses, excluding provision for impairment, decreased by 2.80% to P=8.91 billion from the year ago level of P=9.17 billion. The Bank set aside a total of P=2.21 billion provisions for credit and impairment losses in 2019, 3.60% higher than the P=2.14 billion allocated in 2018. Occupancy and equipment-related costs decreased by 57.80% to P=322.33 million from P=763.77 million as a result of lower rent expense. Amortization of Software Cost declined by 15.11% to P=135.05 million. On the other hand, Depreciation and amortization of Bank’s properties and leasehold improvements rose to P=910.34 million from P=622.18 million. Compensation and Fringe Benefits went up by 4.66% to P=3.52 billion. Meanwhile, Taxes and Licenses decreased by 4.79% to P=1.55 billion compared to last year due to lower Documentary Stamps Taxes paid in 2019. Security, messengerial, and janitorial services also dropped by 8.24% or P=40.67 million to P=453.06 million in 2019. Miscellaneous Expenses went down by 5.50% to P=2.02 billion. The Bank also recorded income from its investment in Sumisho Motor Finance Corporation (SMFC) amounting to P=105.91 million in 2019. This was higher by 28.56% versus the same period last year. Analysis of Financial Soundness Indicators
2021
2020
2019
Return on Average Assets ROAA 0.64% 0.50% 1.31% Return on Average Equity ROAE 4.44% 3.21% 10.29% Net Interest Margin on Average Earning Assets
NIM
5.81% 7.26% 5.82%
Debt-Equity Ratio DER 6.50:1 5.36:1 5.53:1 Asset-to-Equity Ratio AER 7.50:1 6.36:1 6.53:1 Interest Rate Coverage Ratio IRCR 2.51:1 1.31:1 1.59:1 Liquidity/Current Ratio LR 65.57% 43.60% 19.70%
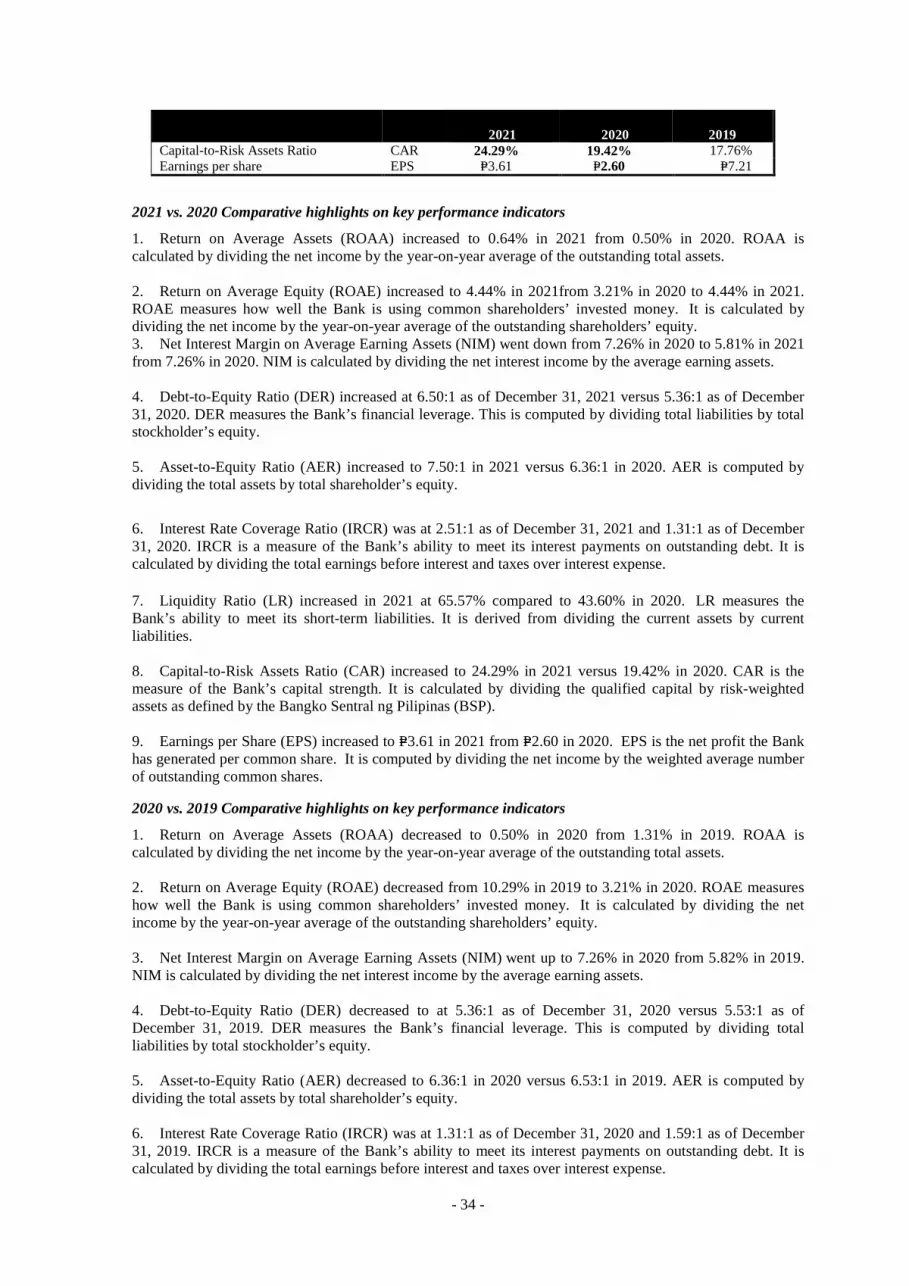
- 34 -
2021
2020
2019
Capital-to-Risk Assets Ratio CAR 24.29% 19.42% 17.76% Earnings per share EPS P=3.61 P=2.60 P=7.21
2021 vs. 2020 Comparative highlights on key performance indicators
1. Return on Average Assets (ROAA) increased to 0.64% in 2021 from 0.50% in 2020. ROAA is calculated by dividing the net income by the year-on-year average of the outstanding total assets. 2. Return on Average Equity (ROAE) increased to 4.44% in 2021from 3.21% in 2020 to 4.44% in 2021. ROAE measures how well the Bank is using common shareholders’ invested money. It is calculated by dividing the net income by the year-on-year average of the outstanding shareholders’ equity. 3. Net Interest Margin on Average Earning Assets (NIM) went down from 7.26% in 2020 to 5.81% in 2021 from 7.26% in 2020. NIM is calculated by dividing the net interest income by the average earning assets. 4. Debt-to-Equity Ratio (DER) increased at 6.50:1 as of December 31, 2021 versus 5.36:1 as of December 31, 2020. DER measures the Bank’s financial leverage. This is computed by dividing total liabilities by total stockholder’s equity. 5. Asset-to-Equity Ratio (AER) increased to 7.50:1 in 2021 versus 6.36:1 in 2020. AER is computed by dividing the total assets by total shareholder’s equity.
6. Interest Rate Coverage Ratio (IRCR) was at 2.51:1 as of December 31, 2021 and 1.31:1 as of December 31, 2020. IRCR is a measure of the Bank’s ability to meet its interest payments on outstanding debt. It is calculated by dividing the total earnings before interest and taxes over interest expense. 7. Liquidity Ratio (LR) increased in 2021 at 65.57% compared to 43.60% in 2020. LR measures the Bank’s ability to meet its short-term liabilities. It is derived from dividing the current assets by current liabilities. 8. Capital-to-Risk Assets Ratio (CAR) increased to 24.29% in 2021 versus 19.42% in 2020. CAR is the measure of the Bank’s capital strength. It is calculated by dividing the qualified capital by risk-weighted assets as defined by the Bangko Sentral ng Pilipinas (BSP). 9. Earnings per Share (EPS) increased to P=3.61 in 2021 from P=2.60 in 2020. EPS is the net profit the Bank has generated per common share. It is computed by dividing the net income by the weighted average number of outstanding common shares.
2020 vs. 2019 Comparative highlights on key performance indicators
1. Return on Average Assets (ROAA) decreased to 0.50% in 2020 from 1.31% in 2019. ROAA is calculated by dividing the net income by the year-on-year average of the outstanding total assets. 2. Return on Average Equity (ROAE) decreased from 10.29% in 2019 to 3.21% in 2020. ROAE measures how well the Bank is using common shareholders’ invested money. It is calculated by dividing the net income by the year-on-year average of the outstanding shareholders’ equity. 3. Net Interest Margin on Average Earning Assets (NIM) went up to 7.26% in 2020 from 5.82% in 2019. NIM is calculated by dividing the net interest income by the average earning assets. 4. Debt-to-Equity Ratio (DER) decreased to at 5.36:1 as of December 31, 2020 versus 5.53:1 as of December 31, 2019. DER measures the Bank’s financial leverage. This is computed by dividing total liabilities by total stockholder’s equity. 5. Asset-to-Equity Ratio (AER) decreased to 6.36:1 in 2020 versus 6.53:1 in 2019. AER is computed by dividing the total assets by total shareholder’s equity. 6. Interest Rate Coverage Ratio (IRCR) was at 1.31:1 as of December 31, 2020 and 1.59:1 as of December 31, 2019. IRCR is a measure of the Bank’s ability to meet its interest payments on outstanding debt. It is calculated by dividing the total earnings before interest and taxes over interest expense.
- 35 -
7. Liquidity Ratio (LR) increased in 2020 at 43.60% compared to 19.70% in 2019. LR measures the Bank’s ability to meet its short-term liabilities. It is derived from dividing the current assets by current liabilities. 8. Capital-to-Risk Assets Ratio (CAR) increased from 17.76% to 19.42% in 2020. CAR is the measure of the Bank’s capital strength. It is calculated by dividing the qualified capital by risk-weighted assets as defined by the Bangko Sentral ng Pilipinas (BSP). 9. Earnings per Share (EPS) decreased to P=2.60 in 2020 from P=7.21 in 2019. EPS is the net profit the Bank has generated per common share. It is computed by dividing the net income by the weighted average number of outstanding common shares. EPS for the year ended December 31, 2019 and December 31, 2018 was restated to show the effect of stock dividends issued in 2020. 2019 vs 2018 Comparative highlights on key performance indicators
1. Return on Average Assets (ROAA) increased to 1.31% in 2019 from 1.15% in 2018. ROAA is calculated by dividing the net income by the year-on-year average of the outstanding total assets. 2. Return on Average Equity (ROAE) decreased from 11.38% in 2018 to 10.29% in 2019. ROAE measures how well the Bank is using common shareholders’ invested money. It is calculated by dividing the net income by the year-on-year average of the outstanding shareholders’ equity. 3. Net Interest Margin on Average Earning Assets (NIM) slightly went up to 5.82% in 2019 from 5.79% in 2018. NIM is calculated by dividing the net interest income by the average earning assets. 4. Debt-to-Equity Ratio (DER) decreased to at 5.53:1 as of December 31, 2019 versus 8.75:1 as of December 31, 2018. DER measures the Bank’s financial leverage. This is computed by dividing total liabilities by total stockholder’s equity. 5. Asset-to-Equity Ratio (AER) decreased to 6.53:1 in 2019 versus 9.75:1 in 2018. AER is computed by dividing the total assets by total shareholder’s equity.
6. Interest Rate Coverage Ratio (IRCR) was at 1.59:1 as of December 31, 2019 and 2018. IRCR is a measure of the Bank’s ability to meet its interest payments on outstanding debt. It is calculated by dividing the total earnings before interest and taxes over interest expense. 7. Liquidity Ratio (LR) decreased in 2019 at 19.70% compared to 23.47% in 2018. LR measures the Bank’s ability to meet its short-term liabilities. It is derived from dividing the current assets by current liabilities. 8. Capital-to-Risk Assets Ratio (CAR) increased from 13.38% to 17.76% in 2019. CAR is the measure of the Bank’s capital strength. It is calculated by dividing the qualified capital by risk-weighted assets as defined by the Bangko Sentral ng Pilipinas (BSP). 9. Earnings per Share (EPS) decreased to P=7.21 in 2019 from P=9.43 in 2018. EPS is the net profit the Bank has generated per common share. It is computed by dividing the net income by the weighted average number of outstanding common shares. EPS for the year ended December 31, 2018 was restated to show the effect of stock dividends issued in January 2020.
C. Key Variables and Other Qualitative and Quantitative Factors
Liquidity PSBank manages its liquidity position to ensure that it has more than adequate funds to meet its obligations at any given time. The Bank monitors its daily liquidity and reserve position by determining inflows and outflows, short-term and long-term obligations, holdings and repayments. Short-term liquidity management identifies obligations and repayments in the next 12-months, aids in the determination of the securities trading strategy, and influences the Bank’s pricing mechanism. On the other hand, long-term liquidity
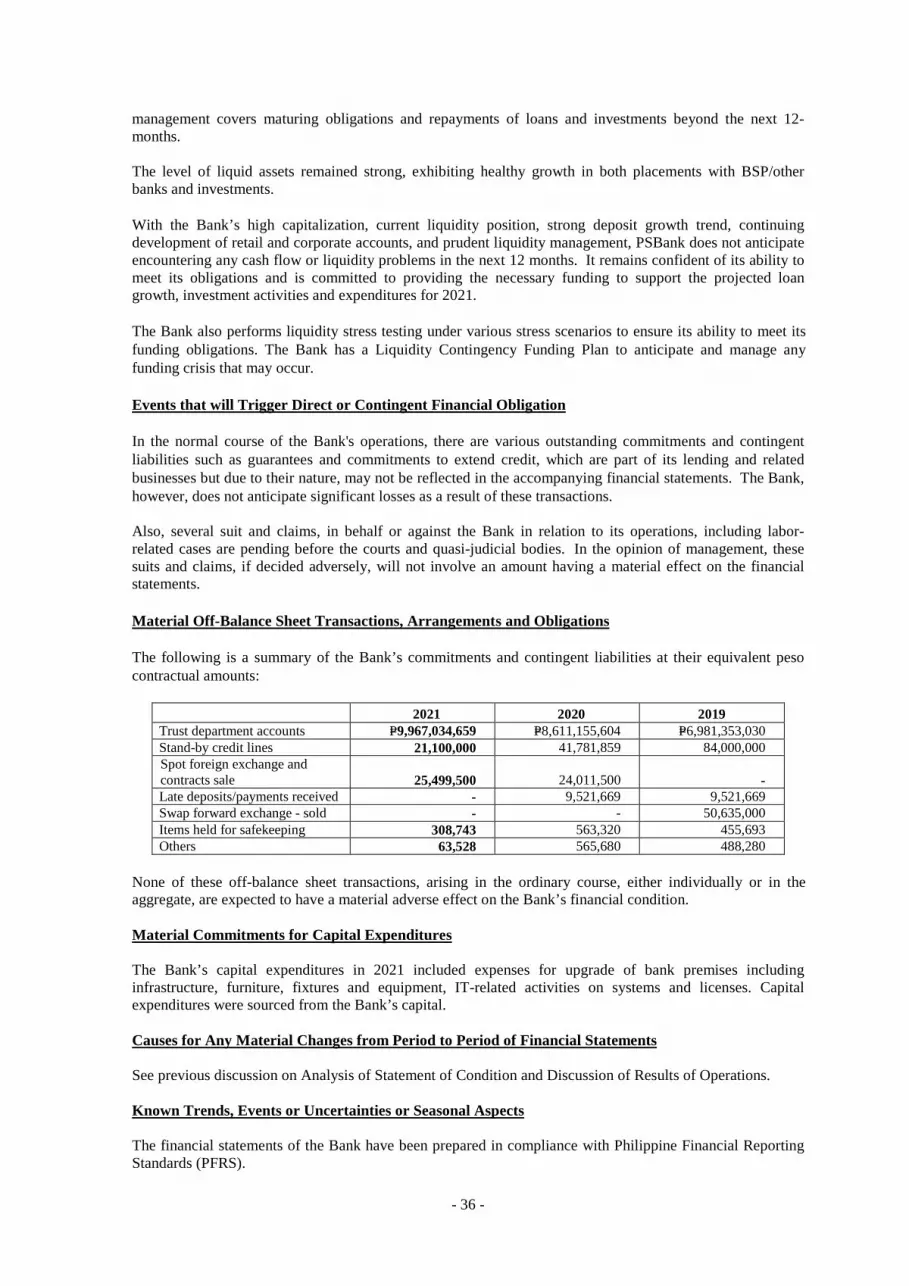
- 36 -
management covers maturing obligations and repayments of loans and investments beyond the next 12-months. The level of liquid assets remained strong, exhibiting healthy growth in both placements with BSP/other banks and investments. With the Bank’s high capitalization, current liquidity position, strong deposit growth trend, continuing development of retail and corporate accounts, and prudent liquidity management, PSBank does not anticipate encountering any cash flow or liquidity problems in the next 12 months. It remains confident of its ability to meet its obligations and is committed to providing the necessary funding to support the projected loan growth, investment activities and expenditures for 2021. The Bank also performs liquidity stress testing under various stress scenarios to ensure its ability to meet its funding obligations. The Bank has a Liquidity Contingency Funding Plan to anticipate and manage any funding crisis that may occur. Events that will Trigger Direct or Contingent Financial Obligation In the normal course of the Bank's operations, there are various outstanding commitments and contingent liabilities such as guarantees and commitments to extend credit, which are part of its lending and related businesses but due to their nature, may not be reflected in the accompanying financial statements. The Bank, however, does not anticipate significant losses as a result of these transactions. Also, several suit and claims, in behalf or against the Bank in relation to its operations, including labor-related cases are pending before the courts and quasi-judicial bodies. In the opinion of management, these suits and claims, if decided adversely, will not involve an amount having a material effect on the financial statements. Material Off-Balance Sheet Transactions, Arrangements and Obligations The following is a summary of the Bank’s commitments and contingent liabilities at their equivalent peso contractual amounts:
2021 2020 2019 Trust department accounts P=9,967,034,659 P=8,611,155,604 P=6,981,353,030 Stand-by credit lines 21,100,000 41,781,859 84,000,000 Spot foreign exchange and contracts sale 25,499,500 24,011,500 - Late deposits/payments received - 9,521,669 9,521,669 Swap forward exchange - sold - - 50,635,000 Items held for safekeeping 308,743 563,320 455,693 Others 63,528 565,680 488,280
None of these off-balance sheet transactions, arising in the ordinary course, either individually or in the aggregate, are expected to have a material adverse effect on the Bank’s financial condition. Material Commitments for Capital Expenditures The Bank’s capital expenditures in 2021 included expenses for upgrade of bank premises including infrastructure, furniture, fixtures and equipment, IT-related activities on systems and licenses. Capital expenditures were sourced from the Bank’s capital. Causes for Any Material Changes from Period to Period of Financial Statements See previous discussion on Analysis of Statement of Condition and Discussion of Results of Operations. Known Trends, Events or Uncertainties or Seasonal Aspects The financial statements of the Bank have been prepared in compliance with Philippine Financial Reporting Standards (PFRS).
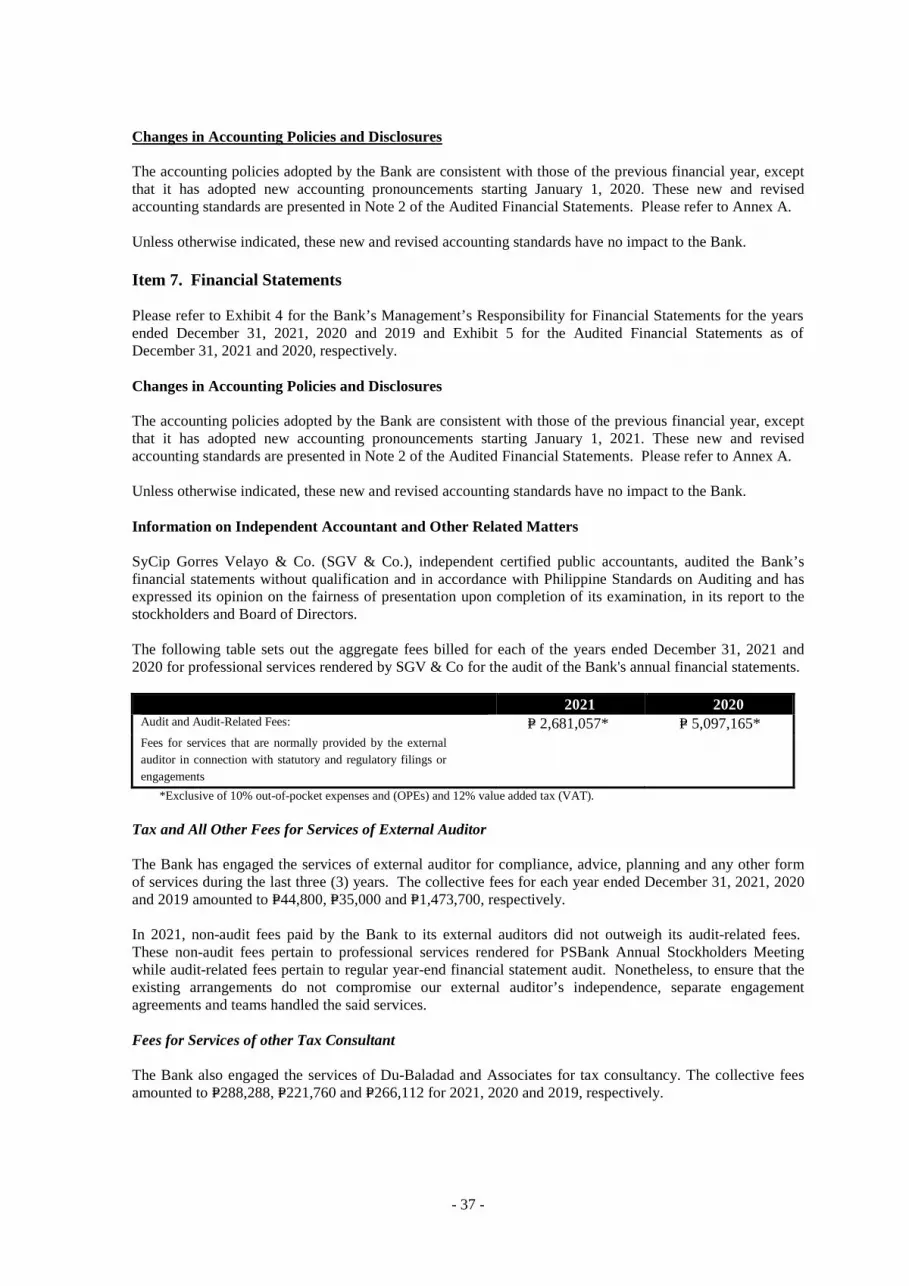
- 37 -
Changes in Accounting Policies and Disclosures The accounting policies adopted by the Bank are consistent with those of the previous financial year, except that it has adopted new accounting pronouncements starting January 1, 2020. These new and revised accounting standards are presented in Note 2 of the Audited Financial Statements. Please refer to Annex A. Unless otherwise indicated, these new and revised accounting standards have no impact to the Bank. Item 7. Financial Statements
Please refer to Exhibit 4 for the Bank’s Management’s Responsibility for Financial Statements for the years ended December 31, 2021, 2020 and 2019 and Exhibit 5 for the Audited Financial Statements as of December 31, 2021 and 2020, respectively. Changes in Accounting Policies and Disclosures
The accounting policies adopted by the Bank are consistent with those of the previous financial year, except that it has adopted new accounting pronouncements starting January 1, 2021. These new and revised accounting standards are presented in Note 2 of the Audited Financial Statements. Please refer to Annex A. Unless otherwise indicated, these new and revised accounting standards have no impact to the Bank. Information on Independent Accountant and Other Related Matters SyCip Gorres Velayo & Co. (SGV & Co.), independent certified public accountants, audited the Bank’s financial statements without qualification and in accordance with Philippine Standards on Auditing and has expressed its opinion on the fairness of presentation upon completion of its examination, in its report to the stockholders and Board of Directors. The following table sets out the aggregate fees billed for each of the years ended December 31, 2021 and 2020 for professional services rendered by SGV & Co for the audit of the Bank's annual financial statements.
2021 2020 Audit and Audit-Related Fees: P= 2,681,057* P= 5,097,165* Fees for services that are normally provided by the external auditor in connection with statutory and regulatory filings or engagements
*Exclusive of 10% out-of-pocket expenses and (OPEs) and 12% value added tax (VAT). Tax and All Other Fees for Services of External Auditor The Bank has engaged the services of external auditor for compliance, advice, planning and any other form of services during the last three (3) years. The collective fees for each year ended December 31, 2021, 2020 and 2019 amounted to P=44,800, P=35,000 and P=1,473,700, respectively. In 2021, non-audit fees paid by the Bank to its external auditors did not outweigh its audit-related fees. These non-audit fees pertain to professional services rendered for PSBank Annual Stockholders Meeting while audit-related fees pertain to regular year-end financial statement audit. Nonetheless, to ensure that the existing arrangements do not compromise our external auditor’s independence, separate engagement agreements and teams handled the said services. Fees for Services of other Tax Consultant The Bank also engaged the services of Du-Baladad and Associates for tax consultancy. The collective fees amounted to P=288,288, P=221,760 and P=266,112 for 2021, 2020 and 2019, respectively.

- 38 -
Audit Committee’s Approval Policies and Procedures for Above Services As Metrobank subsidiary, the Bank adopted the Parent’s policies and procedures on audit engagement contract for external auditors. The same was discussed and approved by the Audit Committee. Included in the duties and responsibilities of the Audit Committee as provided for in the Audit Committee Charter are to recommend to the Board the appointment, re-appointment and dismissal of external auditors; to review and evaluate the external auditors’ qualifications, performance, independence, and objectivity; and to review the external auditors’ audit plan and scope among others. The following are the members of Bank’s Audit Committee:
Committee Members Position Attendance % EDUARDO A. SAHAGUN Independent Director Chairperson 14/14 100% SAMSON C. LIM Independent Director Member 14/14 100% JOSE T. PARDO Independent Director Member 14/14 100% ATTY. EMMA B. CO Chief Audit Executive Secretary 14/14 100%
Item 8. Changes in and Disagreements with Accountants on Accounting and Financial Disclosure
SGV & Co. has acted as the Bank’s external auditors since 1979. Ms. Veronica Mae A. Arce has been the certifying partner from SGV and Co. since 2019, in compliance with the 7-year rotation requirement. The Bank has no disagreements on accounting and financial disclosures with its current external auditors for the same periods or any subsequent interim period. The same group of independent public accountants has been recommended by the Audit Committee to be re-appointed as the external auditors of the company for the year 2022. The re-appointment of SGV complies with the requirement of SEC under SRC Rule 68 (3) (b) (IV). Representatives of SGV are expected to be present at the Annual Stockholders’ Meeting and will have the opportunity to make a statement if they desire to do so and will be available to answer appropriate questions.
PART III. CONTROL AND COMPENSATION INFORMATION Item 9. Directors and Executive Officers of the Issuer A. Directors and Executive Officers Directors
Name/ Position Age Citizenship Business Experience and Present and
Past Directorship with Other Companies for the last five (5) years
Relatives up to 4th Civil degree
Jose T. Pardo Chairman/ Independent Director
82 Filipino Present Involvements • Chairman since Jan 2003/ Independent Director since
May 2007, Philippine Savings Bank* • Chairman and Independent Director, Philippine
Seven Corporation* since 2015 • Chairman and Independent Director, Philippine Stock
Exchange* since 2011 • Chairman and Independent Director, Securities
Clearing Corporation of the Philippines since 2011
None
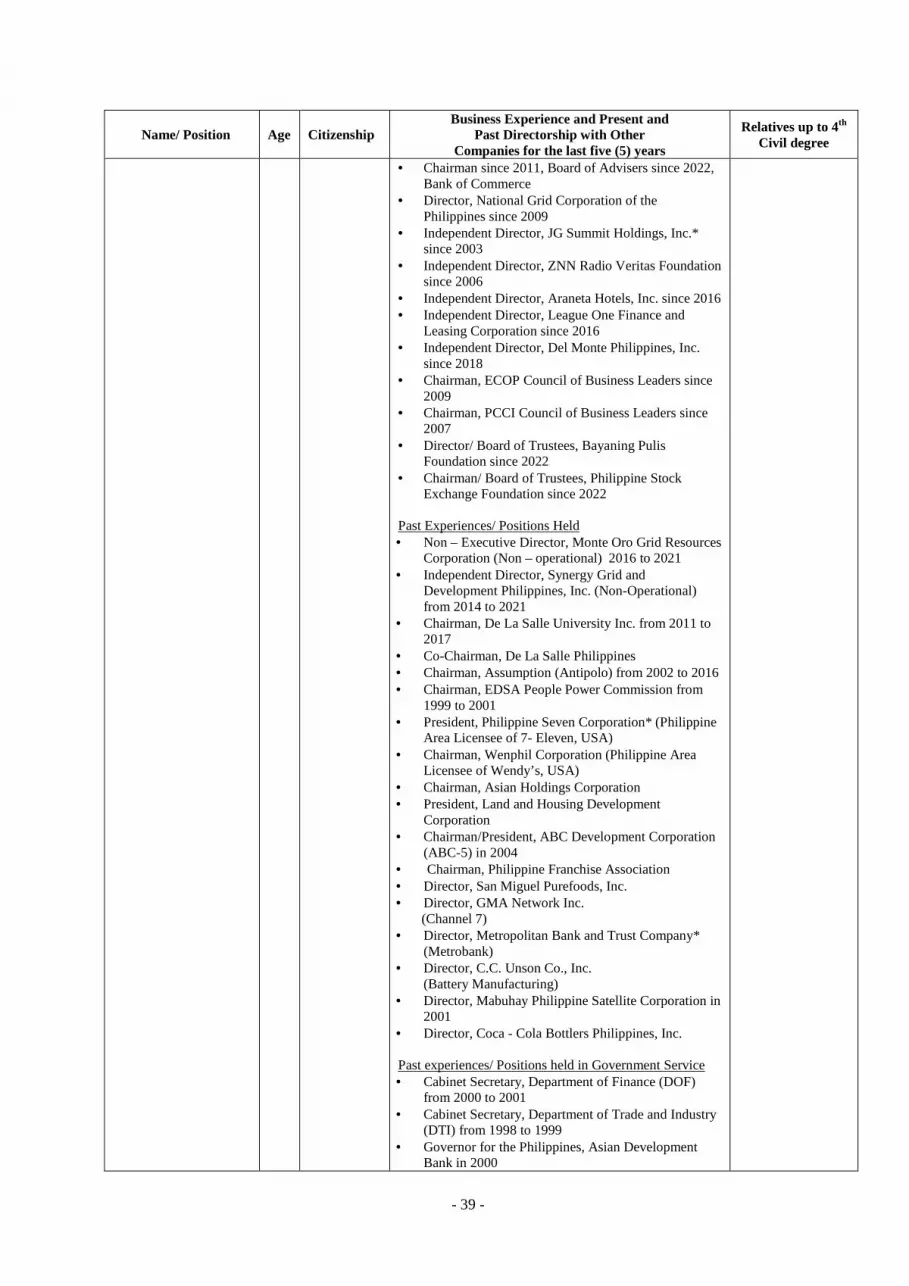
- 39 -
Name/ Position Age Citizenship Business Experience and Present and
Past Directorship with Other Companies for the last five (5) years
Relatives up to 4th Civil degree
• Chairman since 2011, Board of Advisers since 2022, Bank of Commerce
• Director, National Grid Corporation of the Philippines since 2009
• Independent Director, JG Summit Holdings, Inc.* since 2003
• Independent Director, ZNN Radio Veritas Foundation since 2006
• Independent Director, Araneta Hotels, Inc. since 2016 • Independent Director, League One Finance and
Leasing Corporation since 2016 • Independent Director, Del Monte Philippines, Inc.
since 2018 • Chairman, ECOP Council of Business Leaders since
2009 • Chairman, PCCI Council of Business Leaders since
2007 • Director/ Board of Trustees, Bayaning Pulis
Foundation since 2022 • Chairman/ Board of Trustees, Philippine Stock
Exchange Foundation since 2022 Past Experiences/ Positions Held • Non – Executive Director, Monte Oro Grid Resources
Corporation (Non – operational) 2016 to 2021 • Independent Director, Synergy Grid and
Development Philippines, Inc. (Non-Operational) from 2014 to 2021
• Chairman, De La Salle University Inc. from 2011 to 2017
• Co-Chairman, De La Salle Philippines • Chairman, Assumption (Antipolo) from 2002 to 2016 • Chairman, EDSA People Power Commission from
1999 to 2001 • President, Philippine Seven Corporation* (Philippine
Area Licensee of 7- Eleven, USA) • Chairman, Wenphil Corporation (Philippine Area
Licensee of Wendy’s, USA) • Chairman, Asian Holdings Corporation • President, Land and Housing Development
Corporation • Chairman/President, ABC Development Corporation
(ABC-5) in 2004 • Chairman, Philippine Franchise Association • Director, San Miguel Purefoods, Inc. • Director, GMA Network Inc.
(Channel 7) • Director, Metropolitan Bank and Trust Company*
(Metrobank) • Director, C.C. Unson Co., Inc.
(Battery Manufacturing) • Director, Mabuhay Philippine Satellite Corporation in
2001 • Director, Coca - Cola Bottlers Philippines, Inc. Past experiences/ Positions held in Government Service • Cabinet Secretary, Department of Finance (DOF)
from 2000 to 2001 • Cabinet Secretary, Department of Trade and Industry
(DTI) from 1998 to 1999 • Governor for the Philippines, Asian Development
Bank in 2000
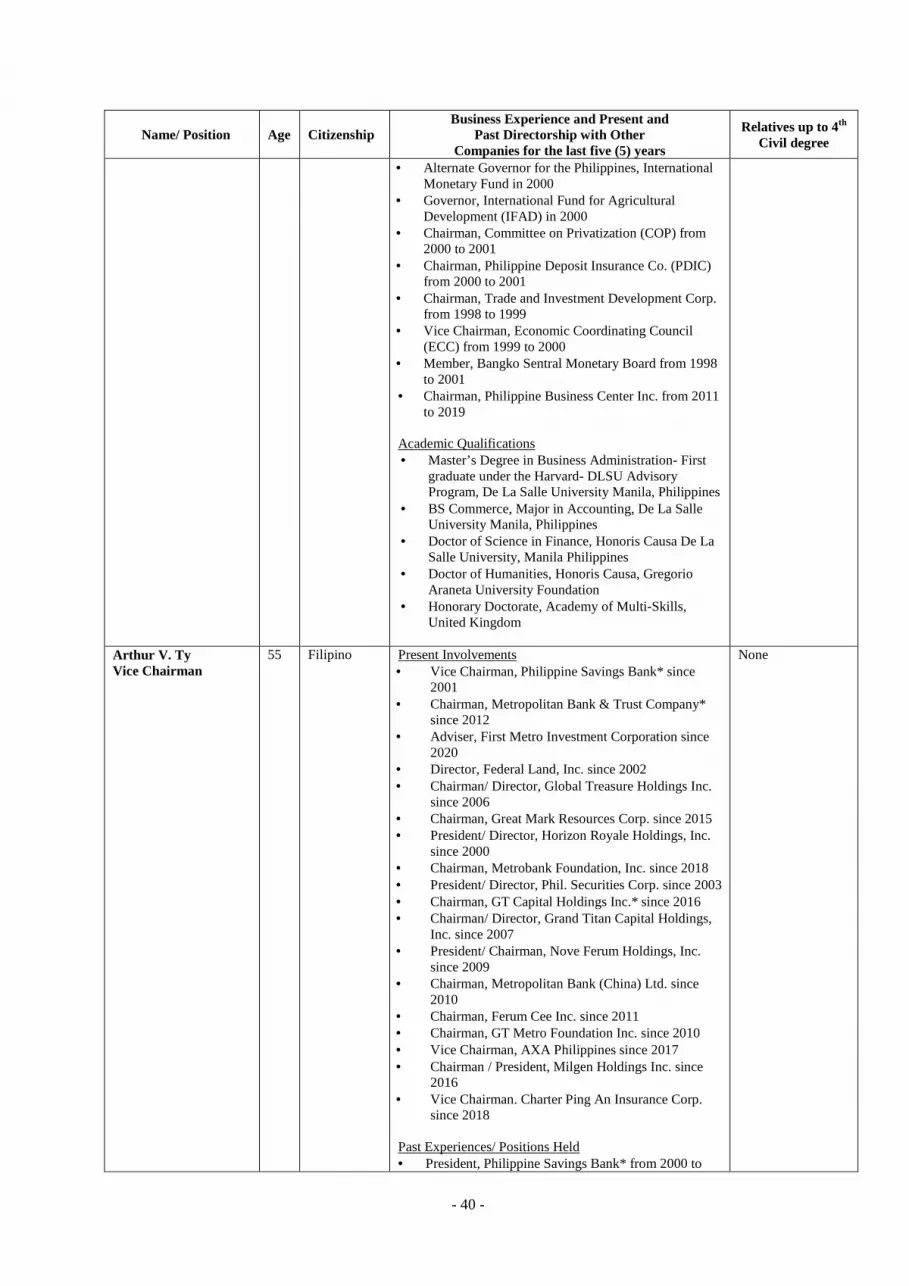
- 40 -
Name/ Position Age Citizenship Business Experience and Present and
Past Directorship with Other Companies for the last five (5) years
Relatives up to 4th Civil degree
• Alternate Governor for the Philippines, International Monetary Fund in 2000
• Governor, International Fund for Agricultural Development (IFAD) in 2000
• Chairman, Committee on Privatization (COP) from 2000 to 2001
• Chairman, Philippine Deposit Insurance Co. (PDIC) from 2000 to 2001
• Chairman, Trade and Investment Development Corp. from 1998 to 1999
• Vice Chairman, Economic Coordinating Council (ECC) from 1999 to 2000
• Member, Bangko Sentral Monetary Board from 1998 to 2001
• Chairman, Philippine Business Center Inc. from 2011 to 2019
Academic Qualifications • Master’s Degree in Business Administration- First
graduate under the Harvard- DLSU Advisory Program, De La Salle University Manila, Philippines
• BS Commerce, Major in Accounting, De La Salle University Manila, Philippines
• Doctor of Science in Finance, Honoris Causa De La Salle University, Manila Philippines
• Doctor of Humanities, Honoris Causa, Gregorio Araneta University Foundation
• Honorary Doctorate, Academy of Multi-Skills, United Kingdom
Arthur V. Ty Vice Chairman
55 Filipino Present Involvements • Vice Chairman, Philippine Savings Bank* since
2001 • Chairman, Metropolitan Bank & Trust Company*
since 2012 • Adviser, First Metro Investment Corporation since
2020 • Director, Federal Land, Inc. since 2002 • Chairman/ Director, Global Treasure Holdings Inc.
since 2006 • Chairman, Great Mark Resources Corp. since 2015 • President/ Director, Horizon Royale Holdings, Inc.
since 2000 • Chairman, Metrobank Foundation, Inc. since 2018 • President/ Director, Phil. Securities Corp. since 2003 • Chairman, GT Capital Holdings Inc.* since 2016 • Chairman/ Director, Grand Titan Capital Holdings,
Inc. since 2007 • President/ Chairman, Nove Ferum Holdings, Inc.
since 2009 • Chairman, Metropolitan Bank (China) Ltd. since
2010 • Chairman, Ferum Cee Inc. since 2011 • Chairman, GT Metro Foundation Inc. since 2010 • Vice Chairman, AXA Philippines since 2017 • Chairman / President, Milgen Holdings Inc. since
2016 • Vice Chairman. Charter Ping An Insurance Corp.
since 2018
Past Experiences/ Positions Held • President, Philippine Savings Bank* from 2000 to
None
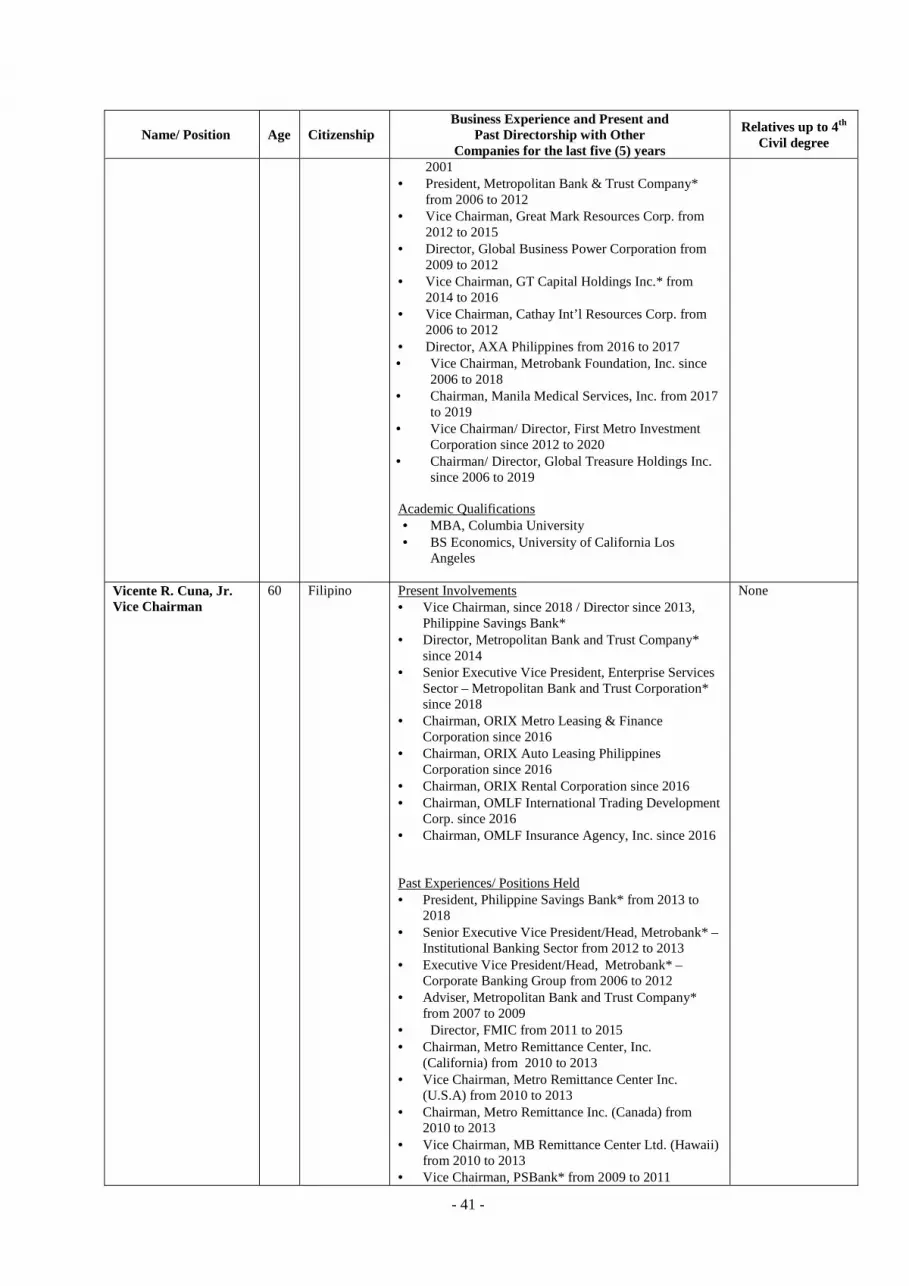
- 41 -
Name/ Position Age Citizenship Business Experience and Present and
Past Directorship with Other Companies for the last five (5) years
Relatives up to 4th Civil degree
2001 • President, Metropolitan Bank & Trust Company*
from 2006 to 2012 • Vice Chairman, Great Mark Resources Corp. from
2012 to 2015 • Director, Global Business Power Corporation from
2009 to 2012 • Vice Chairman, GT Capital Holdings Inc.* from
2014 to 2016 • Vice Chairman, Cathay Int’l Resources Corp. from
2006 to 2012 • Director, AXA Philippines from 2016 to 2017 • Vice Chairman, Metrobank Foundation, Inc. since
2006 to 2018 • Chairman, Manila Medical Services, Inc. from 2017
to 2019 • Vice Chairman/ Director, First Metro Investment
Corporation since 2012 to 2020 • Chairman/ Director, Global Treasure Holdings Inc.
since 2006 to 2019 Academic Qualifications • MBA, Columbia University • BS Economics, University of California Los
Angeles
Vicente R. Cuna, Jr. Vice Chairman
60 Filipino Present Involvements • Vice Chairman, since 2018 / Director since 2013,
Philippine Savings Bank* • Director, Metropolitan Bank and Trust Company*
since 2014 • Senior Executive Vice President, Enterprise Services
Sector – Metropolitan Bank and Trust Corporation* since 2018
• Chairman, ORIX Metro Leasing & Finance Corporation since 2016
• Chairman, ORIX Auto Leasing Philippines Corporation since 2016
• Chairman, ORIX Rental Corporation since 2016 • Chairman, OMLF International Trading Development
Corp. since 2016 • Chairman, OMLF Insurance Agency, Inc. since 2016
Past Experiences/ Positions Held • President, Philippine Savings Bank* from 2013 to
2018 • Senior Executive Vice President/Head, Metrobank* –
Institutional Banking Sector from 2012 to 2013 • Executive Vice President/Head, Metrobank* –
Corporate Banking Group from 2006 to 2012 • Adviser, Metropolitan Bank and Trust Company*
from 2007 to 2009 • Director, FMIC from 2011 to 2015 • Chairman, Metro Remittance Center, Inc.
(California) from 2010 to 2013 • Vice Chairman, Metro Remittance Center Inc.
(U.S.A) from 2010 to 2013 • Chairman, Metro Remittance Inc. (Canada) from
2010 to 2013 • Vice Chairman, MB Remittance Center Ltd. (Hawaii)
from 2010 to 2013 • Vice Chairman, PSBank* from 2009 to 2011
None
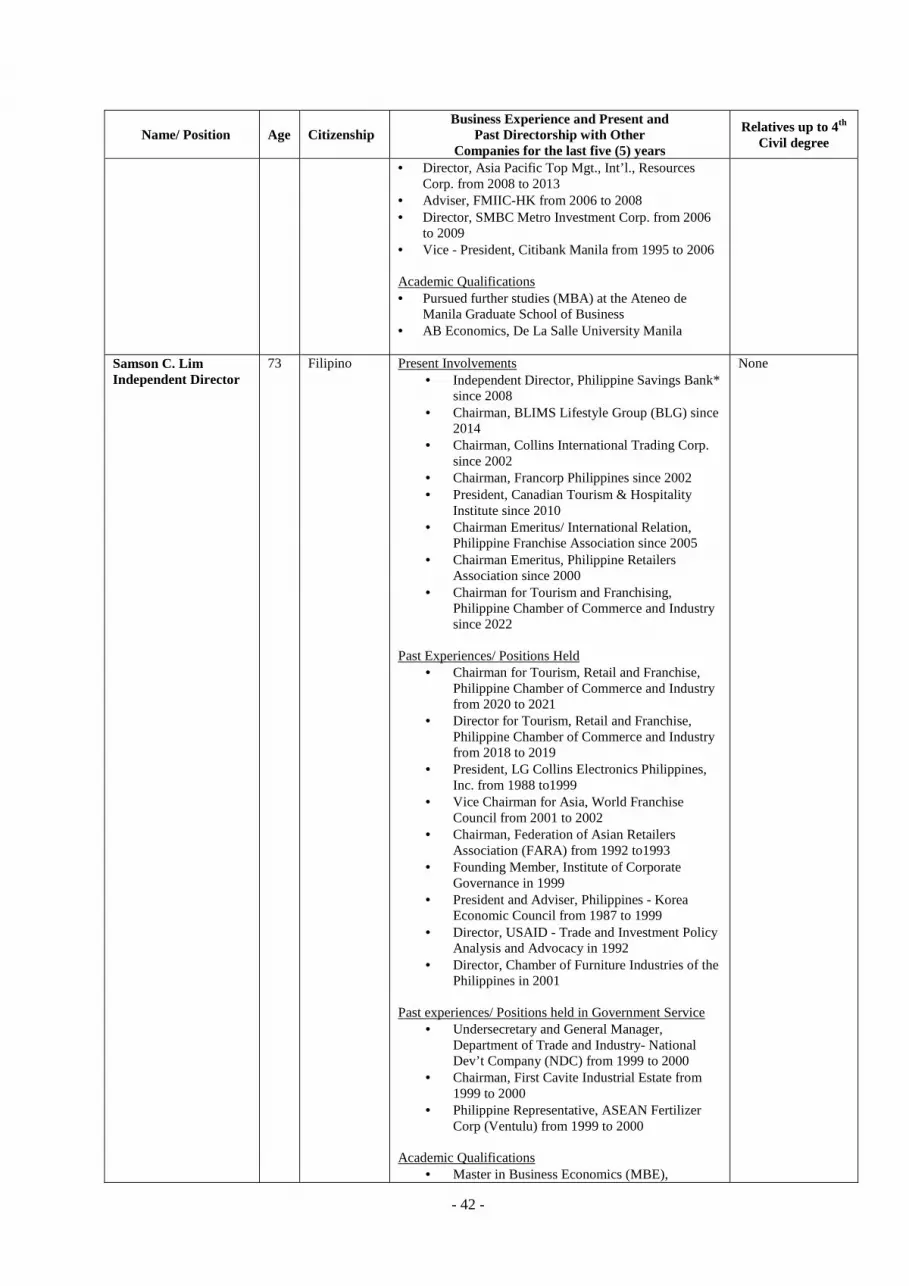
- 42 -
Name/ Position Age Citizenship Business Experience and Present and
Past Directorship with Other Companies for the last five (5) years
Relatives up to 4th Civil degree
• Director, Asia Pacific Top Mgt., Int’l., Resources Corp. from 2008 to 2013
• Adviser, FMIIC-HK from 2006 to 2008 • Director, SMBC Metro Investment Corp. from 2006
to 2009 • Vice - President, Citibank Manila from 1995 to 2006
Academic Qualifications • Pursued further studies (MBA) at the Ateneo de
Manila Graduate School of Business • AB Economics, De La Salle University Manila
Samson C. Lim Independent Director
73 Filipino Present Involvements • Independent Director, Philippine Savings Bank*
since 2008 • Chairman, BLIMS Lifestyle Group (BLG) since
2014 • Chairman, Collins International Trading Corp.
since 2002 • Chairman, Francorp Philippines since 2002 • President, Canadian Tourism & Hospitality
Institute since 2010 • Chairman Emeritus/ International Relation,
Philippine Franchise Association since 2005 • Chairman Emeritus, Philippine Retailers
Association since 2000 • Chairman for Tourism and Franchising,
Philippine Chamber of Commerce and Industry since 2022
Past Experiences/ Positions Held
• Chairman for Tourism, Retail and Franchise, Philippine Chamber of Commerce and Industry from 2020 to 2021
• Director for Tourism, Retail and Franchise, Philippine Chamber of Commerce and Industry from 2018 to 2019
• President, LG Collins Electronics Philippines, Inc. from 1988 to1999
• Vice Chairman for Asia, World Franchise Council from 2001 to 2002
• Chairman, Federation of Asian Retailers Association (FARA) from 1992 to1993
• Founding Member, Institute of Corporate Governance in 1999
• President and Adviser, Philippines - Korea Economic Council from 1987 to 1999
• Director, USAID - Trade and Investment Policy Analysis and Advocacy in 1992
• Director, Chamber of Furniture Industries of the Philippines in 2001
Past experiences/ Positions held in Government Service
• Undersecretary and General Manager, Department of Trade and Industry- National Dev’t Company (NDC) from 1999 to 2000
• Chairman, First Cavite Industrial Estate from 1999 to 2000
• Philippine Representative, ASEAN Fertilizer Corp (Ventulu) from 1999 to 2000
Academic Qualifications
• Master in Business Economics (MBE),
None
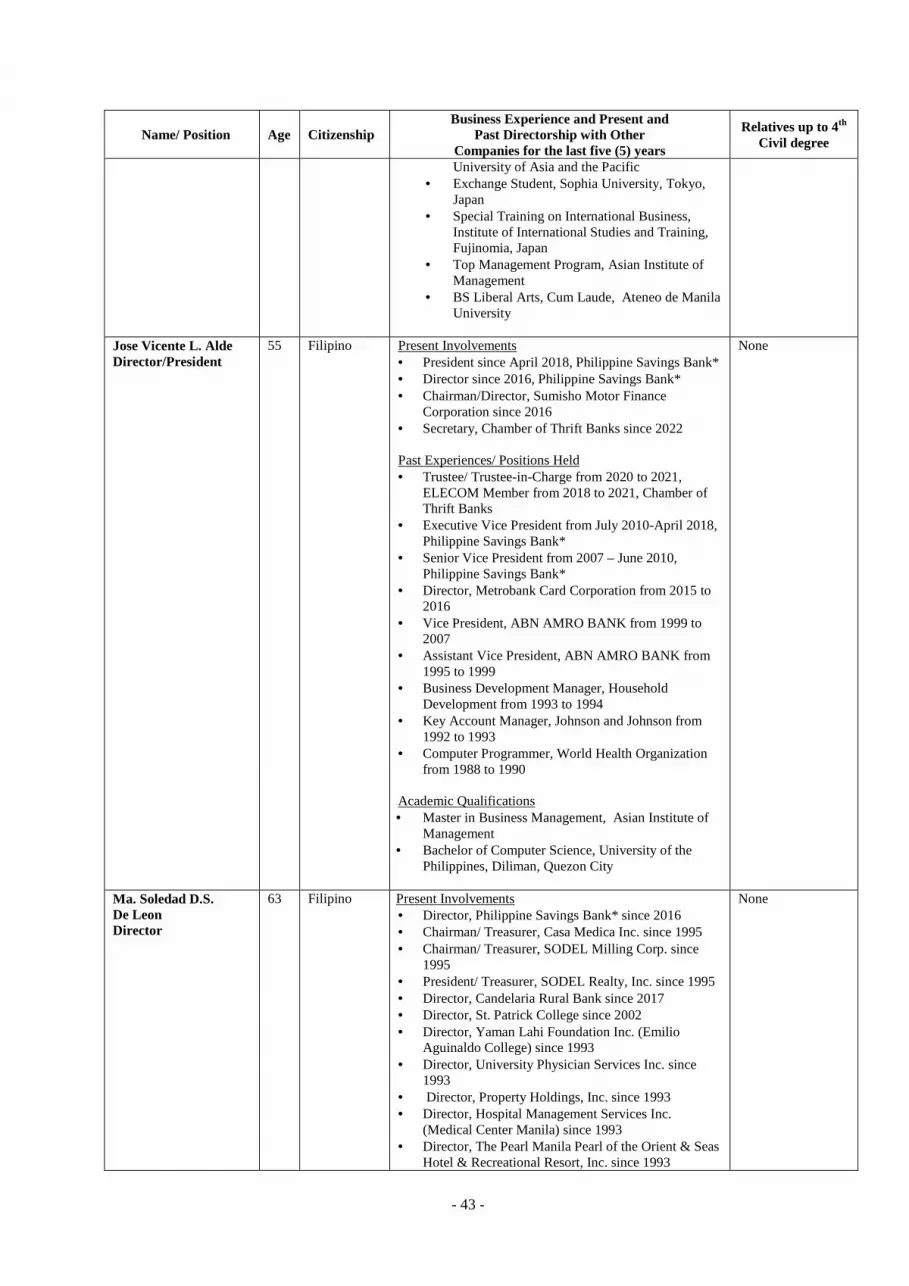
- 43 -
Name/ Position Age Citizenship Business Experience and Present and
Past Directorship with Other Companies for the last five (5) years
Relatives up to 4th Civil degree
University of Asia and the Pacific • Exchange Student, Sophia University, Tokyo,
Japan • Special Training on International Business,
Institute of International Studies and Training, Fujinomia, Japan
• Top Management Program, Asian Institute of Management
• BS Liberal Arts, Cum Laude, Ateneo de Manila University
Jose Vicente L. Alde Director/President
55 Filipino Present Involvements • President since April 2018, Philippine Savings Bank* • Director since 2016, Philippine Savings Bank* • Chairman/Director, Sumisho Motor Finance
Corporation since 2016 • Secretary, Chamber of Thrift Banks since 2022 Past Experiences/ Positions Held • Trustee/ Trustee-in-Charge from 2020 to 2021,
ELECOM Member from 2018 to 2021, Chamber of Thrift Banks
• Executive Vice President from July 2010-April 2018, Philippine Savings Bank*
• Senior Vice President from 2007 – June 2010, Philippine Savings Bank*
• Director, Metrobank Card Corporation from 2015 to 2016
• Vice President, ABN AMRO BANK from 1999 to 2007
• Assistant Vice President, ABN AMRO BANK from 1995 to 1999
• Business Development Manager, Household Development from 1993 to 1994
• Key Account Manager, Johnson and Johnson from 1992 to 1993
• Computer Programmer, World Health Organization from 1988 to 1990
Academic Qualifications • Master in Business Management, Asian Institute of
Management • Bachelor of Computer Science, University of the
Philippines, Diliman, Quezon City
None
Ma. Soledad D.S. De Leon Director
63 Filipino Present Involvements • Director, Philippine Savings Bank* since 2016 • Chairman/ Treasurer, Casa Medica Inc. since 1995 • Chairman/ Treasurer, SODEL Milling Corp. since
1995 • President/ Treasurer, SODEL Realty, Inc. since 1995 • Director, Candelaria Rural Bank since 2017 • Director, St. Patrick College since 2002 • Director, Yaman Lahi Foundation Inc. (Emilio
Aguinaldo College) since 1993 • Director, University Physician Services Inc. since
1993 • Director, Property Holdings, Inc. since 1993 • Director, Hospital Management Services Inc.
(Medical Center Manila) since 1993 • Director, The Pearl Manila Pearl of the Orient & Seas
Hotel & Recreational Resort, Inc. since 1993
None
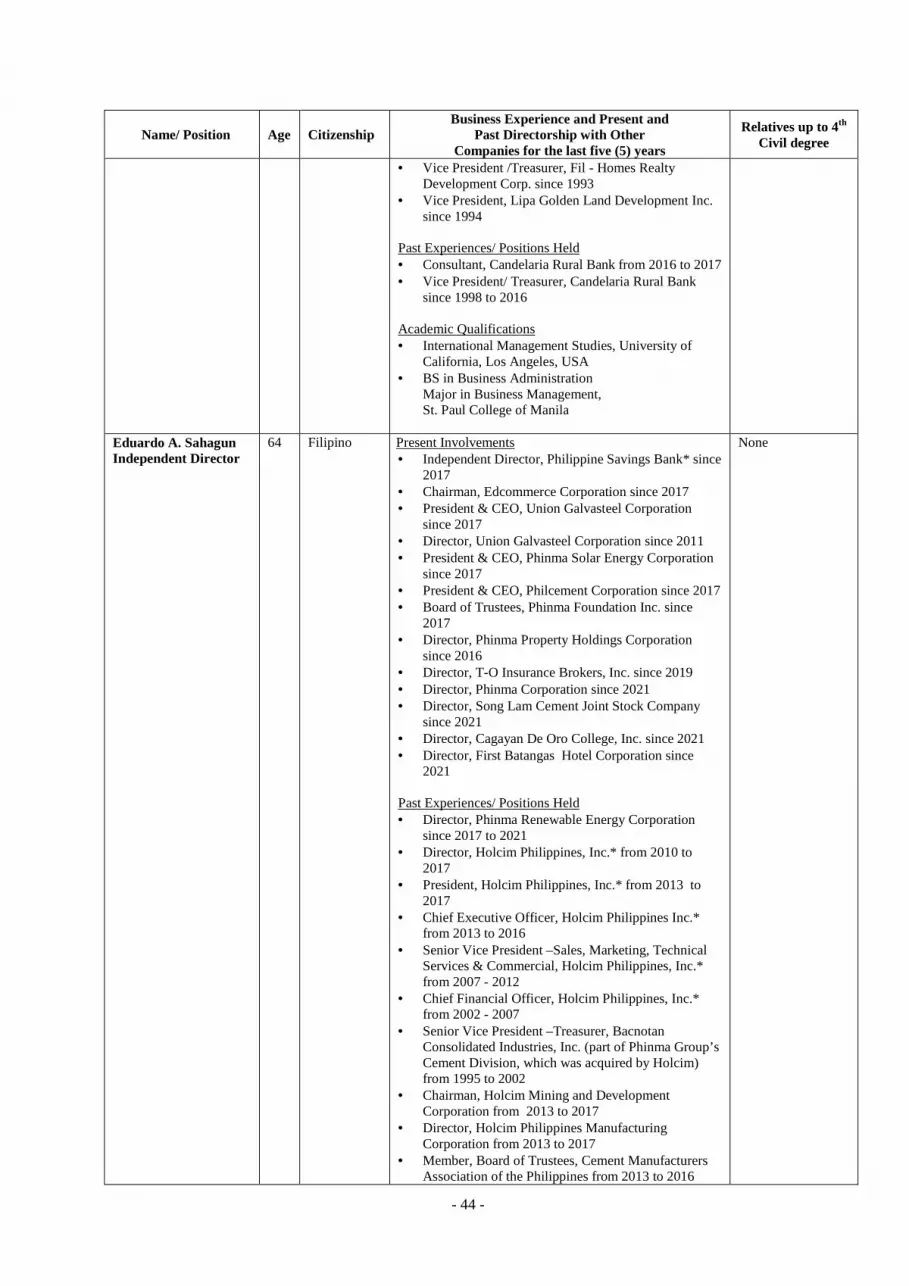
- 44 -
Name/ Position Age Citizenship Business Experience and Present and
Past Directorship with Other Companies for the last five (5) years
Relatives up to 4th Civil degree
• Vice President /Treasurer, Fil - Homes Realty Development Corp. since 1993
• Vice President, Lipa Golden Land Development Inc. since 1994
Past Experiences/ Positions Held • Consultant, Candelaria Rural Bank from 2016 to 2017 • Vice President/ Treasurer, Candelaria Rural Bank
since 1998 to 2016 Academic Qualifications • International Management Studies, University of
California, Los Angeles, USA • BS in Business Administration
Major in Business Management, St. Paul College of Manila
Eduardo A. Sahagun Independent Director
64 Filipino Present Involvements • Independent Director, Philippine Savings Bank* since
2017 • Chairman, Edcommerce Corporation since 2017 • President & CEO, Union Galvasteel Corporation
since 2017 • Director, Union Galvasteel Corporation since 2011 • President & CEO, Phinma Solar Energy Corporation
since 2017 • President & CEO, Philcement Corporation since 2017 • Board of Trustees, Phinma Foundation Inc. since
2017 • Director, Phinma Property Holdings Corporation
since 2016 • Director, T-O Insurance Brokers, Inc. since 2019 • Director, Phinma Corporation since 2021 • Director, Song Lam Cement Joint Stock Company
since 2021 • Director, Cagayan De Oro College, Inc. since 2021 • Director, First Batangas Hotel Corporation since
2021 Past Experiences/ Positions Held • Director, Phinma Renewable Energy Corporation
since 2017 to 2021 • Director, Holcim Philippines, Inc.* from 2010 to
2017 • President, Holcim Philippines, Inc.* from 2013 to
2017 • Chief Executive Officer, Holcim Philippines Inc.*
from 2013 to 2016 • Senior Vice President –Sales, Marketing, Technical
Services & Commercial, Holcim Philippines, Inc.* from 2007 - 2012
• Chief Financial Officer, Holcim Philippines, Inc.* from 2002 - 2007
• Senior Vice President –Treasurer, Bacnotan Consolidated Industries, Inc. (part of Phinma Group’s Cement Division, which was acquired by Holcim) from 1995 to 2002
• Chairman, Holcim Mining and Development Corporation from 2013 to 2017
• Director, Holcim Philippines Manufacturing Corporation from 2013 to 2017
• Member, Board of Trustees, Cement Manufacturers Association of the Philippines from 2013 to 2016
None
- 45 -
Name/ Position Age Citizenship Business Experience and Present and
Past Directorship with Other Companies for the last five (5) years
Relatives up to 4th Civil degree
• Member, Board of Trustees, Philippine Business for the Environment, Inc. from 2014 to 2016
• Treasurer, Phinma Cement Group (Central Cement Corporation, Davao Union Cement Corporation and Hi Cement Corporation since 1995 to 2002
Academic Qualifications • Masters in Management Science, Arthur D. Little
Management Education Institute, (now Hult International Business School) Boston, USA
• Masters in Business Administration, Ateneo Graduate School of Business
• BS Commerce , Major in Accounting, Holy Angel University
• Senior Management Program, Senior Leadership Program, Managing Change Program, IMD, Switzerland
Rosanna F. De Vera Director
53 Filipino Present Involvements • Director, Philippine Savings Bank* since 2018 • First Vice President & Credit Group Division Head,
Metropolitan Bank & Trust Company* since 2008 Past Experiences/ Positions Held • Vice President – Team Head, Commercial Banking
Group, Banco de Oro* from 2007 to 2008 • Vice President - Head of Small Business, Equitable
PCI Bank from 2006 to 2007 • Assistant Vice President – Corporate Banking Group,
Equitable PCI Bank from 2003 to 2006 • Senior Manager – Corporate Banking Group,
Equitable PCI Bank from 2001 to 2002 • Manager – Corporate Banking Group , PCI Bank
from 1999 to 2000 Academic Qualifications • MBA (36 Units), Ateneo Graduate School of
Business • BSC-Accounting , University of Sto. Tomas
Antonell S. Interino Vice President 2nd degree relative by affinity
Francisco S. Magsajo, Jr., Independent Director
74
Filipino
Present Involvements • Independent Director, Philippine Savings Bank*,
April 2021 • Director, Philippines Veterans Bank since November
since 2020 • Director, Intervest Project, Inc./Intervest Insurance,
Inc. since 2020
None
Past Experiences/ Positions Held • Independent Director, First Metro Investment
Corporation from 2020 to 2021 • Independent Director, Metrobank Credit Card
Corporation from 2016 to 2019 • Board Chairman, RCBC Savings Bank in 2007 • President and CEO, RCBC Unibank from 2004 to
2007 • President and CEO, RCBC Savings Bank from 1999
to 2004 • Consultant, Allied Banking Group from 1998 to 1999 • Executive Vice President, Philippine National Bank*
from 1994 to 1998 • Director, Bulawan Mining Corporation from 1996 to
- 46 -
Name/ Position Age Citizenship Business Experience and Present and
Past Directorship with Other Companies for the last five (5) years
Relatives up to 4th Civil degree
1997 • Director, Passi Sugar Central from 1995 to 1997 • Director, Batangas Sugar Central from 1991 to 1997 • Managing Director, PNB International Finance HK
from 1991 to 1995 Academic Qualifications • BS Economics, Lyceum of the Philippines
*Company listed at The Philippine Stock Exchange, Inc.
Executive Officers
Name/ Position Age Citizenship Experience Relatives up to 4th Civil degree
Jose Vicente L. Alde President/Director
55
Filipino
Present Involvements • President since April 2018 • Chairman, Sumisho Motor Finance Corporation
since 2016 • Trustee, Chamber of Thrift Banks since 2020
Past Experiences/ Positions Held • Director since 2016/ Executive Vice President from
July 2010-April 2018, Senior Vice President from 2007 – June 2010 Philippine Savings Bank*
• Director, Metrobank Card Corporation from 2015 to 2016
• Vice President, ABN AMRO BANK from 1999 to 2007
• Assistant Vice President, ABN AMRO BANK from 1995 to 1999
• Business Development Manager, Household Development from 1993 to 1994
• Key Account Manager, Johnson and Johnson from 1992 to 1993
• Computer Programmer, World Health Organization from 1988 to 1990
None
Noli S. Gomez Executive Vice President
56 Filipino Present Involvements • EVP and Head at PSBank’s* Office of the Executive
Vice President since October 2019 • Director, Sumisho Motor Finance Corporation since
June 2018
Past Involvements • SVP and Head of PSBank’s* Operations Group
from January 2006 – September 2019 • Chief Finance Officer at PSBank* from October
2001 to December 2005 • Head of Systems and Methods and Chief Risk
Officer SAVP and VP at DBS Bank Phils., Inc. from September 1998 to October 2001
• SAVP at Southeast Asia from February 1997 to August 1998
• System Management Officer of the AVP at Bank of the Philippine Islands* from August 1996 to January 1997
• Citytrust Banking Corporation from November 1992 to July 1996
None

- 47 -
Name/ Position Age Citizenship Experience Relatives up to 4th Civil degree
Perfecto Ramon Z. Dimayuga, Jr. Senior Vice President/Treasurer/ Corporate Secretary
60
Filipino Present Involvements • Corporate Secretary since January 2022 • Treasurer since January 2017 and Head of Corporate
Services Office since April 2019 • Corporate Secretary, Sumisho Motor Finance Corp.
since December 2009
Past Involvements • SVP, Chief Finance Officer and Finance Group
Head, PSBank* from March 2008 to December 2016
• FVP, Chief Finance Officer and Finance Group Head, PSBank* from Jan 2006 – March 2008
• Treasurer, PSBank* from June 2002 to June 2004 • Held various treasury positions in Development
Bank of Singapore (DBS) Phils., Inc., Bank of the Philippine Islands*, Mindanao Development Bank, Citytrust Banking Corp. and Rizal Commercial Banking Corp.* from 1988 to 2002
None
Emmanuel A. Tuazon Senior Vice President
58 Filipino Present Involvement • SVP and Head of PSBank’s* Marketing Group since
June 2016
Past Involvements • SVP and Head of PSBank’s* Marketing and
Customer Experience Group from July 2014 – June 2016
• Senior Vice President and Chief Marketing Officer, Philippine National Bank and Allied Bank Savings from January 2008 to July 2014
• Vice President for Marketing at Security Bank from 2005 – 2008
• Vice President for Marketing, Consumer Sales and Marketing at Robinsons Bank from 2002 - 2005
• Vice President for Sales Marketing at ABN AMRO Bank from 1999 to 2002
• Vice President for Marketing at Jardine Pacific Finance from 1997 to 1999
None
Neil C. Estrellado Senior Vice President
50 Filipino Present Involvement • SVP since 2015 and Head of PSBank’s* IT Group
since 2002
Past Involvements • Held various positions in the following Banks: - Project Leader, Overseas Chinese Banking
Corporation (OCBC), Singapore from 2001 - 2002 - Lead IT Analyst, Development Bank of Singapore
from 2000 - 2001 - Manager, DBS Philippines Inc. (formerly Bank of
Southeast Asia) from 1997 - 2000 - Assistant Manager, BPI* (formerly Citytrust
Banking Corporation) from 1992 - 1996 - Systems Analyst, Bank of the Philippine Islands
None
- 48 -
Name/ Position Age Citizenship Experience Relatives up to 4th Civil degree
Francis C. Llanera Senior Vice President
50 Filipino Present Involvement • SVP since October 2016 and Head of Branch
Banking Group since October 2012.
Past Involvements • FVP and Head of PSBank Loans Operations Group
from January 2011 to October 2012 • Remedial Management Division Head from
December 2007 to December 2010 • Held various positions in the following Banks: - Senior Manager and Credit Card Collections Head
at Union Bank from May 2001 – November 2007 - Assistant Manager, Credit Risk at AIG from May
2000 – April 2001 - Assistant Cashier, Credit Card Department at Far
East Bank & Trust Co from July 1993 – April 2000
None
Jose Jesus B. Custodio Senior Vice President
62 Filipino Present Involvement • SVP since Oct 2013 and Head PSBank-Indirect Sales
Channel Group Past Involvements • FVP and Group Head of PSBank*-Indirect Sales
Channel Group from 2010 to 2013 • Vice President and Division Head of Dealer Sales
from 2004 to 2010 • AVP and Department Head of Dealer Sales from
2003 to 2004 • Senior Manager and Department Head of Dealer
Sales from 2001 to 2003 • Head of Auto Loans-Retail Sales at Citytrust
Banking Corp. • Head of Fleet and Floor Stock Department at BPI
Family Savings Bank •
None
Mary Jane M. Valero Senior Vice President
53 Filipino Present Involvement • SVP since December 2020 and Head PSBank-
Customer Experience and Human Resources Group
Past Involvements • FVP and Group Head of PSBank- Customer
Experience and Human Resources Group from September 2019 to Nov 2020
• FVP and Group Head of PSBank- Customer Experience and People Development Group from January 2019 to September 2019
• FVP and Group Head of PSBank- Customer Experience Group from July 2017 to January 2019
• VP and Division Head of Customer Experience Division from November 2014 to July 2017
• VP and Division Head of Customer Service Division from February 2008 to November 2014
• VP and Division Head of Service Quality Division from August 2004 to January 2008
• AVP and Division Head of Service Quality Division from August 2002 to July 2004
• Part-Time Professor of Enderun Colleges from June 2013 to June 2014
• Front Office Manager of Mandarin Oriental Manila from January 1999 to August 2002
• Duty Manager of Westin Philippine Plaza from January 1992 to January 1999.
None

- 49 -
Name/ Position Age Citizenship Experience Relatives up to 4th Civil degree
Leah M. Zamora Senior Vice President
48 Filipino Present Involvement • SVP since December 2020 and Controller and
Finance Group Head of PSBank-Finance Group
Past Involvements • FVP and Controller and Finance Group Head of
PSBank-Finance Group from January 2017 to November 2020
• FVP and Division Head of Business Information Management Services Division from April 2010 to December 2016
• Held various positions in the following Banks: - VP, FP&A Manager of GE Money Bank from May
2006 to April 2010 - Senior Manager of Banco de Oro Universal Bank
from March 2000 to May 2006 - Administrative Officer of Equitable Banking
Corporation from June 1993 to June 1998
None
* Company listed at The Philippine Stock Exchange, Inc. None of the Bank’s directors and officers works with the government. All of the above-mentioned officers have been involved in the banking industry for more than five years. Significant Employees Except for the above-mentioned executives, there are no other significant employees as contemplated under the Securities Regulations Code. Nomination Procedures 1. A stockholder may submit nominations for directorial positions to the Corporate Governance Committee. 2. The nominating stockholder shall submit his proposed nomination in writing to the Corporate Governance Committee together with the biodata, acceptance and conformity by the would-be nominee. In case of a nominee for the position of an independent director, the would-be nominee is also required to submit a Certification that he/she has all the qualifications and none of the disqualifications to become an independent auditor.
3. The Corporate Governance Committee shall screen the nomination of directors prior to the submission of the Definitive Information Statement and come up with the Final List of Candidates.
4. Only nominees whose names appear in the Final List of Candidates shall be eligible for election as director.
5. The nomination process of the Bank is incorporated in the company’s amended Code of By-Laws duly approved by the Securities and Exchange Commission as early as September 27, 2006 and also in the Bank's annually updated and Board-approved Corporate Governance Manual. The following are the members of the Bank’s Corporate Governance Committee:
Name Position Jose T. Pardo, Independent Director Chairperson Samson C. Lim, Independent Director Member Eduardo A. Sahagun, Independent Director Member Gilbert L. Nunag, Chief Compliance Officer Secretary

- 50 -
Nominee Directors The following have been duly nominated to become members of the Bank’s 2022-2023 Board of Directors: Incumbent Directors:* Jose T. Pardo Arthur V. Ty Samson C. Lim Eduardo A. Sahagun Vicente R. Cuna, Jr. Ma. Soledad D.S. De Leon Jose Vicente L. Alde Rosanna F. De Vera Francisco S. Magsajo, Jr. *Please refer to Item 5. Directors and Executive Officers (a) Directors for brief professional background. All nominations were submitted, evaluated and approved by the Bank’s Corporate Governance Committee. As such, all nominees possess the qualifications and none of the disqualifications to become directors of the Bank for 2022-2023. Of the above-named nominees, Messrs. Jose T. Pardo, Samson C. Lim, Eduardo A. Sahagun and Francisco S. Magsajo, Jr. have been nominated as Independent Directors by Mr. Joaquin Aligguy, Ms. Yolanda L. dela Paz, Ms. Jeanne Frances T. Chua and Ms. Dulce D. Arcebal, respectively, with whom they are not related. Based on the Bank’s Manual of Corporate Governance and as required by existing laws and regulations, the stockholders must elect at least three (3) members of the Board or such number as may constitute one-third (1/3) of the members of the Board, whichever is higher, as Independent Directors. Messrs. Pardo, Lim, Sahagun and Magsajo possess the qualifications and none of the disqualifications to become independent directors.
Involvement in Certain Legal Proceedings
To the knowledge and information of the Bank, none of its directors and executive officers are involved or have been involved for the past five (5) years in any legal proceeding which will have material or substantial effect to the Bank, its operation, reputation, or financial condition. To the knowledge and information of the Bank, none of its directors and executive officers have been involved or subject of the following legal proceedings during the past five (5) years up to latest date that are material to an evaluation of their ability or integrity: (a) Any bankruptcy petition filed by or against any business of which such person was a general partner or executive officer either at the time of the bankruptcy or within two years prior to that time; (b) Any conviction by final judgment, in a criminal proceeding, domestic or foreign, or being subject to a pending criminal proceeding, domestic or foreign; (c) Being subject to any order, judgment, or decree, not subsequently reversed, suspended or vacated, of any court of competent jurisdiction, domestic or foreign, permanently or temporarily enjoining, barring, suspending or otherwise limiting his involvement in any type of business, securities, commodities or banking activities; and (d) Being found by a domestic or foreign court of competent jurisdiction (in a civil action), the Commission or comparable foreign body, or a domestic or foreign Exchange or other organized trading market or self-regulatory organization, to have violated a securities or commodities law or regulation, and the judgment has not been reversed, suspended, or vacated.
- 51 -
Item 10. Executive Compensation
Name and Principal Position 2022 (estimate)
Salary Bonus *Others (Per Diem)
Jose Vicente L. Alde – President
Noli S. Gomez – Executive Vice President Jose Jesus B. Custodio – Senior Vice President Perfecto Ramon Z. Dimayuga, Jr. – Senior Vice President Emmanuel A. Tuazon – Senior Vice President TOTAL* P=61.78 million P=24.57 million ALL OFFICERS (AVP UP)* P=175.15 million P=73.45million Jose T. Pardo - Chairman / Independent Director Arthur Ty - Vice Chairman Vicente R. Cuna Jr. - Vice Chairman
Jose Vicente L. Alde - Director / President Samson C. Lim - Independent Director Francisco S. Magsajo - Independent Director Eduardo A. Sahagun - Independent Director Ma. Soledad D.S. De Leon – Director Rosanna F. De Vera – Director
ALL DIRECTORS** P=22.10 million * Estimated (Increased 2021 figures by 5%) **same with 2021
Name and Principal Position 2021
Salary Bonus *Others (Per Diem)
Jose Vicente L. Alde – President
Noli S. Gomez – Executive Vice President Jose Jesus B. Custodio – Senior Vice President Perfecto Ramon Z. Dimayuga, Jr. – Senior Vice President Emmanuel A. Tuazon – Senior Vice President TOTAL P=58.84 million P=23.4 million ALL OFFICERS (AVP UP) P=166.81 million P=69.95 million Jose T. Pardo - Chairman / Independent Director Arthur Ty - Vice Chairman Vicente R. Cuna Jr. - Vice Chairman Jose Vicente L. Alde - Director / President
Samson C. Lim - Indpendent Director Benedicto Jose R. Arcinas - Independent Director Eduardo A. Sahagun - Independent Director Ma. Soledad D.S. De Leon - Director Rosanna F. De Vera - Director
ALL DIRECTORS P=22.10 million
Name and Principal Position 2020
Salary Bonus *Others (Per Diem)
Jose Vicente L. Alde – President
Noli S. Gomez – Executive Vice President Jose Jesus B. Custodio – Senior Vice President Perfecto Ramon Z. Dimayuga, Jr. – Senior Vice President Emmanuel A. Tuazon – Senior Vice President
TOTAL P=55.72 million P=28.50 million ALL OFFICERS (AVP UP) P=160.84 million P=83.07 million

- 52 -
Name and Principal Position 2020
Salary Bonus *Others (Per Diem)
Jose T. Pardo - Chairman / Independent Director Arthur Ty - Vice Chairman Vicente R. Cuna Jr. - Vice Chairman Jose Vicente L. Alde - Director / President Samson C. Lim - Indpendent Director Benedicto Jose R. Arcinas - Independent Director
Eduardo A. Sahagun - Independent Director Ma. Soledad D.S. De Leon - Director Rosanna F. De Vera - Director
ALL DIRECTORS P=21.91 million
*Each director receives a monthly professional fee for attending Board and committee meetings. This is also in consideration of their valuable contributions in the formulation of the Bank’s overall strategy. The total per diem and transportation allowance paid to directors for their attendance in Board and committee meetings amounted to P=22.10 million, P= 21.91 million, and P=19.04 million in 2021, 2020, and 2019, respectively. This translates to an average of P=204,657, P=202,889, and P=176,269, per month/per director in 2021, 2020, and 2019, respectively. Aside from said amounts, they have no other compensation plan or arrangement with the Bank. The directors receive per diem, bonuses and allowances that are already included in the amounts stated above. Aside from said amounts, they have no other compensation plan or arrangement with the bank. The executive officers receive salaries, bonuses and other usual bank benefits that are also included in the amounts stated above. Aside from these, they have no other compensation plan or arrangement with the bank. For the protection and security of its directors and officers, the Bank is unable to provide their individual compensation. There are no warrants or options held by the Bank’s officers and directors. Item 11. Security Ownership of Certain Record and Beneficial Owners and Management
Control and Compensation Information Voting Securities and Principal Holders Thereof a) No. of Shares outstanding as of March 31, 2022 : 426,859,416 Common Shares No. of votes to which each share is entitled : one (1) vote per share b) Record date to determine stockholders entitled to Notice and to vote at the regular meeting : March 1, 2022 c) Election of Directors: Majority vote is required for the election of directors. Security holders shall have the right to cumulative voting. Cumulative voting is allowed provided that the total votes cast by a stockholder shall not exceed the number of shares registered in the name of that security holder in the books of the Bank as of the record date multiplied by the whole number of directors to be elected. There is no condition precedent to the exercise of the right to cumulative voting. d) Arthur V. Ty is the person authorized to vote the MBTC shares in PSBank. e) Security Ownership of Certain Record and Beneficial Owners and Management (1) Security Ownership of Certain Record and Beneficial Owners As of March 31, 2022, the following stockholder owns more than 5% of the common voting securities:
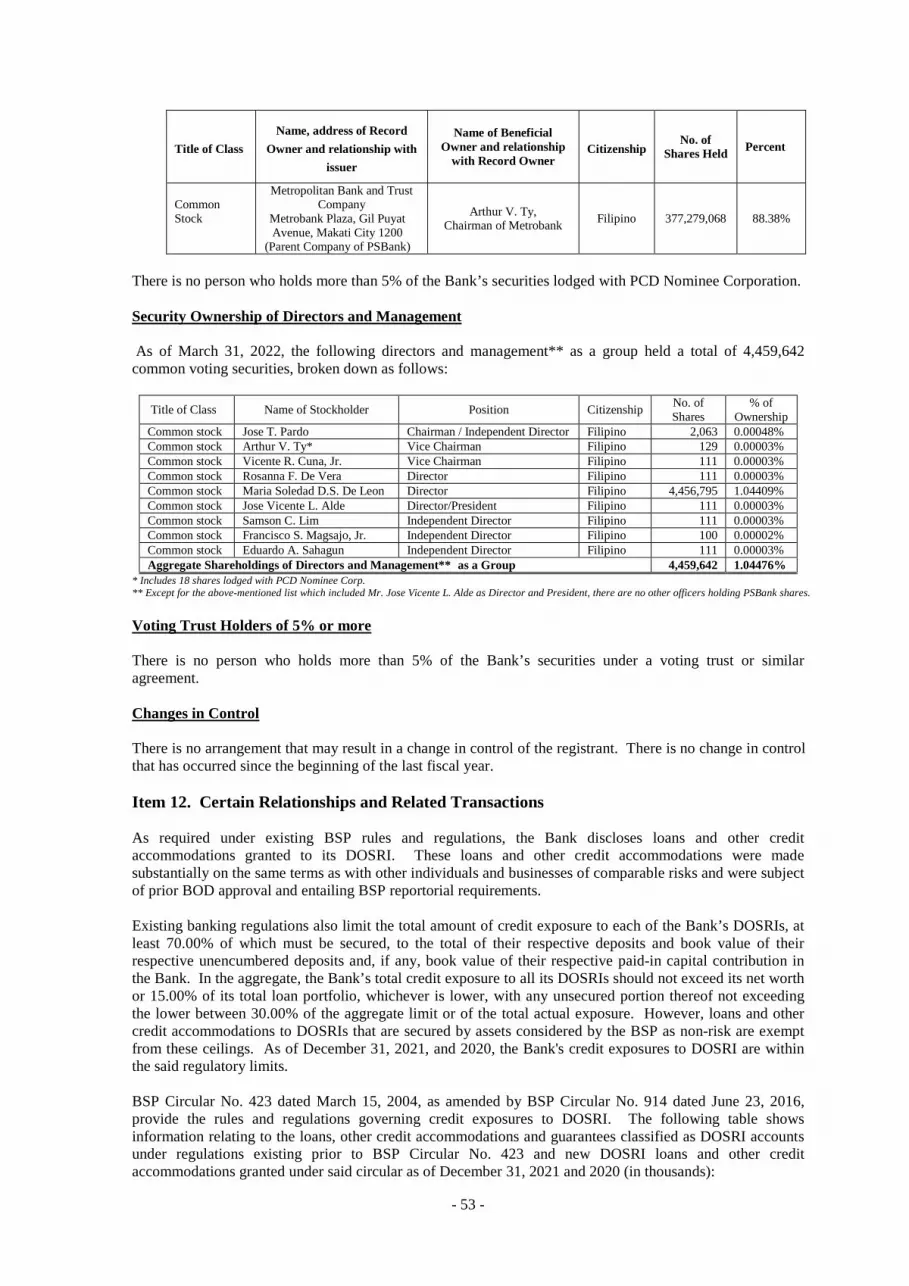
- 53 -
Title of Class
Name, address of Record
Owner and relationship with
issuer
Name of Beneficial Owner and relationship
with Record Owner Citizenship
No. of Shares Held Percent
Common Stock
Metropolitan Bank and Trust Company
Metrobank Plaza, Gil Puyat Avenue, Makati City 1200
(Parent Company of PSBank)
Arthur V. Ty, Chairman of Metrobank
Filipino 377,279,068 88.38%
There is no person who holds more than 5% of the Bank’s securities lodged with PCD Nominee Corporation. Security Ownership of Directors and Management As of March 31, 2022, the following directors and management** as a group held a total of 4,459,642 common voting securities, broken down as follows:
Title of Class Name of Stockholder Position Citizenship No. of Shares
% of Ownership
Common stock Jose T. Pardo Chairman / Independent Director Filipino 2,063 0.00048% Common stock Arthur V. Ty* Vice Chairman Filipino 129 0.00003% Common stock Vicente R. Cuna, Jr. Vice Chairman Filipino 111 0.00003% Common stock Rosanna F. De Vera Director Filipino 111 0.00003% Common stock Maria Soledad D.S. De Leon Director Filipino 4,456,795 1.04409% Common stock Jose Vicente L. Alde Director/President Filipino 111 0.00003% Common stock Samson C. Lim Independent Director Filipino 111 0.00003% Common stock Francisco S. Magsajo, Jr. Independent Director Filipino 100 0.00002% Common stock Eduardo A. Sahagun Independent Director Filipino 111 0.00003% Aggregate Shareholdings of Directors and Management** as a Group 4,459,642 1.04476%
* Includes 18 shares lodged with PCD Nominee Corp. ** Except for the above-mentioned list which included Mr. Jose Vicente L. Alde as Director and President, there are no other officers holding PSBank shares.
Voting Trust Holders of 5% or more There is no person who holds more than 5% of the Bank’s securities under a voting trust or similar agreement. Changes in Control There is no arrangement that may result in a change in control of the registrant. There is no change in control that has occurred since the beginning of the last fiscal year. Item 12. Certain Relationships and Related Transactions As required under existing BSP rules and regulations, the Bank discloses loans and other credit accommodations granted to its DOSRI. These loans and other credit accommodations were made substantially on the same terms as with other individuals and businesses of comparable risks and were subject of prior BOD approval and entailing BSP reportorial requirements. Existing banking regulations also limit the total amount of credit exposure to each of the Bank’s DOSRIs, at least 70.00% of which must be secured, to the total of their respective deposits and book value of their respective unencumbered deposits and, if any, book value of their respective paid-in capital contribution in the Bank. In the aggregate, the Bank’s total credit exposure to all its DOSRIs should not exceed its net worth or 15.00% of its total loan portfolio, whichever is lower, with any unsecured portion thereof not exceeding the lower between 30.00% of the aggregate limit or of the total actual exposure. However, loans and other credit accommodations to DOSRIs that are secured by assets considered by the BSP as non-risk are exempt from these ceilings. As of December 31, 2021, and 2020, the Bank's credit exposures to DOSRI are within the said regulatory limits. BSP Circular No. 423 dated March 15, 2004, as amended by BSP Circular No. 914 dated June 23, 2016, provide the rules and regulations governing credit exposures to DOSRI. The following table shows information relating to the loans, other credit accommodations and guarantees classified as DOSRI accounts under regulations existing prior to BSP Circular No. 423 and new DOSRI loans and other credit accommodations granted under said circular as of December 31, 2021 and 2020 (in thousands):
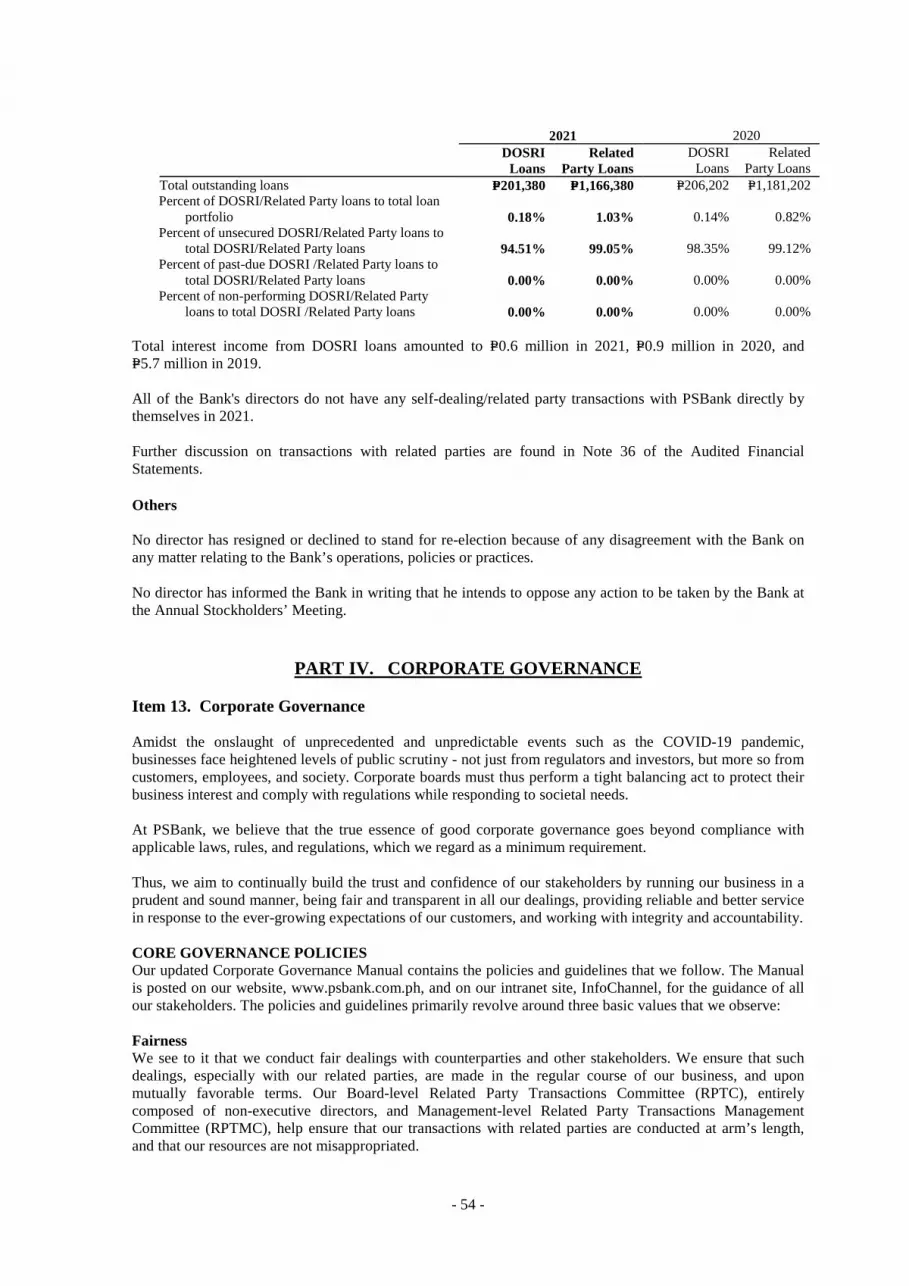
- 54 -
2021 2020
DOSRI
Loans Related
Party Loans DOSRI
Loans Related
Party Loans Total outstanding loans P=201,380 P=1,166,380 P=206,202 P=1,181,202 Percent of DOSRI/Related Party loans to total loan
portfolio 0.18% 1.03% 0.14% 0.82% Percent of unsecured DOSRI/Related Party loans to
total DOSRI/Related Party loans 94.51% 99.05% 98.35% 99.12% Percent of past-due DOSRI /Related Party loans to
total DOSRI/Related Party loans 0.00% 0.00% 0.00% 0.00% Percent of non-performing DOSRI/Related Party
loans to total DOSRI /Related Party loans 0.00% 0.00% 0.00% 0.00% Total interest income from DOSRI loans amounted to P=0.6 million in 2021, P=0.9 million in 2020, and P=5.7 million in 2019.
All of the Bank's directors do not have any self-dealing/related party transactions with PSBank directly by themselves in 2021. Further discussion on transactions with related parties are found in Note 36 of the Audited Financial Statements. Others No director has resigned or declined to stand for re-election because of any disagreement with the Bank on any matter relating to the Bank’s operations, policies or practices. No director has informed the Bank in writing that he intends to oppose any action to be taken by the Bank at the Annual Stockholders’ Meeting.
PART IV. CORPORATE GOVERNANCE
Item 13. Corporate Governance Amidst the onslaught of unprecedented and unpredictable events such as the COVID-19 pandemic, businesses face heightened levels of public scrutiny - not just from regulators and investors, but more so from customers, employees, and society. Corporate boards must thus perform a tight balancing act to protect their business interest and comply with regulations while responding to societal needs. At PSBank, we believe that the true essence of good corporate governance goes beyond compliance with applicable laws, rules, and regulations, which we regard as a minimum requirement. Thus, we aim to continually build the trust and confidence of our stakeholders by running our business in a prudent and sound manner, being fair and transparent in all our dealings, providing reliable and better service in response to the ever-growing expectations of our customers, and working with integrity and accountability. CORE GOVERNANCE POLICIES Our updated Corporate Governance Manual contains the policies and guidelines that we follow. The Manual is posted on our website, www.psbank.com.ph, and on our intranet site, InfoChannel, for the guidance of all our stakeholders. The policies and guidelines primarily revolve around three basic values that we observe: Fairness We see to it that we conduct fair dealings with counterparties and other stakeholders. We ensure that such dealings, especially with our related parties, are made in the regular course of our business, and upon mutually favorable terms. Our Board-level Related Party Transactions Committee (RPTC), entirely composed of non-executive directors, and Management-level Related Party Transactions Management Committee (RPTMC), help ensure that our transactions with related parties are conducted at arm’s length, and that our resources are not misappropriated.

- 55 -
These are in accordance with our Board-approved Related Party Transactions (RPT) policy and its specific guidelines and handling procedures vis-à-vis set transaction materiality thresholds and exposure limits. Our RPT policy is regularly reviewed and updated on an annual basis. It was last updated in October 2021 to streamline certain processes, realign with parent-Metrobank’s latest RPT policy, and articulate to clarify and enhance certain provisions therein. Our transaction materiality thresholds for RPTs were set on a per transaction type basis, taking into account the high end of their historical ticket sizes, their nature, and our risk appetite. These thresholds are applied on a per single transaction basis for one-time or non-recurring transactions, or the aggregate amount of multiple transactions expected in a year for some arrangements with recurring/continuing transactions. Except for loan transactions to Directors, Officers, Stockholders, and their Related Interests (DOSRI), as well as to subsidiaries and affiliates requiring prior approval of the Board of Directors under existing Bangko Sentral ng Pilipinas (BSP) rules regardless of their amounts, RPTs with amounts within these thresholds are subject to the review and approval of the Management-level RPTMC and endorsement of the Board-level RPTC for the Board of Directors’ confirmation. On the other hand, those beyond such thresholds are considered “material” and shall pass through the Board-level RPTC for review and endorsement for Board approval prior to their consummation and for stockholders’ confirmation in the Annual Stockholders’ Meeting. In 2021, the following material RPTs were entered into between the Bank and its related parties (see material RPTs table on the next page and Note 29 of the Audited Financial Statements).
In Millions of PhP
Related Parties Relationship Nature of Transaction Terms & Conditions Original Amount
Dec. 31, 2021 Balance
INSURANCE AXA Philippines (AXA)
Affiliate Annual Renewal of the Bank’s Fire Insurance Coverage for ROPA-Real Estate Properties
Total sum insured is Php3.008 Billion with a gross annual premium rate of 0.19% thereof.
5.72 N/A
Annual Renewal of Bank’s Money, Securities, Payroll & Robbery Insurance Coverage
Total sum insured is Php425 Million with a gross annual premium rate of 2.15% thereof.
9.12 N/A
Annual Renewal of the Bank’s Fire Insurance Coverage for ROPA-Auto Units
Total sum insured for ROPA auto units inside covered spaces is at Php893 Million with a gross annual premium rate of 0.28% while those in the open spaces is at Php731 Million with a gross annual premium rate 0.55% .
6.54 N/A
INTERCOMPANY COUNTERPARTY LINES Metropolitan Bank & Trust Company (MBTC)
Parent-Bank Annual Renewal of Related Intercompany Counterparty Lines of Treasury Group
Clean/unsecured lines for Interbank Call Loans (IBCL) only; secured lines are collateralized by non-risk assets i.e. Government securities (GS)
Clean – 2,000;
Secured -16,000;
Settlement – 1,500 &
Pre-Settlement
-750 (same/no changes)
N/A
First Metro Investment Corporation (FMIC)
Affiliate Clean/unsecured lines for Interbank Call Loans (IBCL) only; secured lines are collateralized by non-risk assets i.e. Government securities (GS)
Pre-Settlement
– 85 (same/no changes)
N/A
ORIX Metro Leasing & Financing Corporation (OMLFC)
Affiliate Clean/unsecured lines for Interbank Call Loans (IBCL) only
Clean –1,000
(same/no changes)
N/A
First Metro Investment Corporation
Affiliate Annual Renewal of Related Intercompany Lines of Trust Division
Counterparty line for fixed income securities (i.e., corporate bonds, government securities)
Pre-Settlement
– 70 &
N/A

- 56 -
In Millions of PhP
Related Parties Relationship Nature of Transaction Terms & Conditions Original Amount
Dec. 31, 2021 Balance
(FMIC) Settlement – 700
(same/no changes)
First Metro Securities Brokerage Corp. (FMSBC)
Affiliate Counterparty line for equity transactions of various trust accounts
Pre-Settlement
– 500 & Settlement
– 500 (same/no changes)
N/A
Metropolitan Bank & Trust Company (MBTC)
Parent-Bank Counterparty line for fixed income securities (i.e., corporate bonds, government securities)
Clean – 1,000; Pre-Settlement
– 5; Settlement
– 50 & IMA – 100
(same/no changes)
N/A
LOANS AND OTHER CREDIT ACCOMMODATIONS First Metro Investment Corporation (FMIC)
Affiliate Credit Line Setup of a Credit Line available via PNs of up to 30 days for additional working capital purposes and to gap intraday funding requirements with interest rate to be fixed upon draw down which should not be less than the BSP's Overnight Lending Facility (OLF) rate plus 50-75 basis points (bps) spread
3,000 N/A
Principal Officer of parent-MBTC
Corresponding Persons of Affiliated Companies
Home Loan – Refinancing with Construction
15-year term home loan with interest rate of 6.88% p.a. fixed for five years.
25.0 9.77
PSBank Trust Division
Bank Proper Credit /Domestic Bill Purchase Line
Renewal of Domestic Bills Purchase Line for the purchase of local and regional checks issued by PSBank Trust Division’s clients payable to PSBank Trust Division for outright crediting of their investments.
1,000
N/A
Director of parent-MBTC
Corresponding Persons of Affiliated Companies
Renewal of Business Credit Line One-year business credit line for working capital purposes with interest rate of 7.00% p.a.
30.00
29.35
OTHERS GT Capital Holdings, Inc. (GTCap)
Affiliate Reimbursement Arrangement for the actual cost of Moderna vaccines ordered by the Bank under the Group’s Covid-19 Vaccination program
Payment to GTCap as reimbursement for the actual cost of COVID-19 Moderna vaccines ordered by the Bank (without any mark-up or profit)
20.99 N/A
Metropolitan Bank & Trust Company (MBTC)
Parent-Bank Outsourcing Arrangement of ATM Offsite Servicing
MBTC to perform cash replenishment and maintenance services for the Bank's offsite ATMs
N/A N/A
Our RPT policy likewise requires our directors and officers with personal interest in our transaction (e.g., they themselves or any of their close family members act as our counterparty) to inhibit or abstain from the discussion, approval, and management of such a transaction, except to provide material information to the

- 57 -
RPTC or Board about the transaction. Provisions against conflict of interest situations are also stipulated in our Board approved “Code of Conduct” such as the prohibition of self-dealing transactions. Pursuant to Memorandum Circular No. 10 s2019 of the Securities and Exchange Commission (SEC), or the “Rules on Material Related Party Transactions for Publicly-Listed Companies,” the Bank also adopted since August 2019 a Board-approved Material Related Party Transactions (MRPT) policy that exclusively applies to related party transaction(s) amounting to at least 10% of its Total Assets based on its latest Audited Financial Statement (AFS), either individually or in aggregate over a 12-month period with the same related party. Save for a few differences in terms of scope, approval, reportorial and disclosure requirements, this separate policy espouses the same key principles in handling related party transactions and is likewise posted in our corporate website and intranet site. We also ensure that our stockholders are treated equally and without discrimination by preserving stockholders’ rights and protecting our minority stockholders’ interests, including the latter’s right to nominate candidates to our Board of Directors. Integrity and Accountability We uphold at all times the value of honesty as the best policy. We believe that our reputation precedes us in the business of trust and confidence. We continue to enhance a working culture of integrity, guided by a Code of Conduct that defines the standards that we must follow in our business dealings and relationships. Code of Conduct Our Code of Conduct is our guide in defining the norms, rules, and responsibilities of each and every PSBanker. It includes provisions on: • Disciplinary process; • General policies to establish a professional working environment and secure a favourable reputation for our Bank; • Corrective measures for unacceptable behavior or failure to comply with our rules, such as on Financial Consumer Protection, Anti-Money Laundering/Terrorism Financing and Data Privacy, and our other policies and procedures; • Schedule of penalties for attendance and punctuality, required corporate attire, conduct and behavior, dishonesty, health, safety and security, reporting of violations, and information security; and, • Provisions on management of personal finances, conflict of interest, anti-sexual harassment, non-disclosure of information and insider information. Insider Trading Under our Policy Against Insider Trading, reporting insiders are required to disclose their and their associates’ initial beneficial ownership in PSBank shares and any changes thereof on the next trading day after their election/appointment and from the date of changes thereof, respectively. They are likewise prohibited from selling or buying PSBank shares during “blackout periods,” i.e., upon obtaining material on non-public information up to two trading days after such information is disclosed. The Bank did not have any trading transactions with reporting insiders and/or their associates in 2021. Directors’ level of share ownership and movements throughout 2021 are summarized in the table below:
# Name of Director Position
Rollforward of Common Shares
Beginning Movements End
12/31/2020 % Additions Deductions 12/31/2021 %
1 Jose T. Pardo Chairman and Independent Director 2,063 0.000483
- - 2,063 0.000483
2 Arthur V. Ty Vice-Chairman 129 0.000030 - - 129 0.000030
3 Vicente R. Cuna Jr. Vice-Chairman 111 0.000026 - - 111 0.000026
4 Samson C. Lim Independent Director 111 0.000026 - - 111 0.000026
5 Francisco S. MagsajoJr.* Independent Director - - 100 - 100 0.000023
6 Eduardo A. Sahagun Independent Director 111 0.000026 - - 111 0.000026
7 Jose Vicente L. Alde President and Director 111 0.000026 - - 111 0.000026
8 Ma. Soledad D.S. De Leon Director 4,456,795 1.044090 - - 4,456,795 1.044090

- 58 -
# Name of Director Position
Rollforward of Common Shares
Beginning Movements End
12/31/2020 % Additions Deductions 12/31/2021 %
9 Rosanna F. De Vera Director 111 0.000026 - - 111 0.000026
Total 4,459,542 1.044733 100 - 4,459,642 1.044756 * Mr. Magsajo was elected as Director during the Annual Stockholders’ Meeting in April 2021.
Whistleblowing PSBank’s whistleblowing policy requires our employees to report any impropriety or malpractice committed by co-employee/s or third party/ies to their group heads or to the customer experience and human resources group head, the fraud management group head/division heads, or the chief audit executive/internal audit group head for evaluation if it would warrant an investigation. Under the Code of Conduct, concealment or non-reporting is considered as an impropriety or malpractice in itself. The whistleblower is protected from any form of harassment as a result of any disclosure which was made in good faith believing the disclosure to be true and was not made maliciously or for personal gain. The policy considers any attempt to determine the whistleblower’s identity as a breach of confidentiality which is subject to disciplinary sanctions. Anti-Money Laundering/Combating Financing of Terror ism (AML/CFT) PSBank subscribes to and adopts the State’s policy to protect the integrity and confidentiality of accounts and to ensure that it shall not be used as a money laundering/terrorism financing site and/or conduit for the proceeds of unlawful activities; and life, liberty and property from acts of terrorism by condemning such acts and those who support and finance it as a crime against the Filipino people, against humanity and against the law of nations. We ensure that we execute transactions with our customers in accordance with the AML/CFT policy guidelines, procedures, tools, and controls set forth in our regularly updated Money Laundering & Terrorism Financing Prevention Program (MLTFPP). Our MLTFPP, as posted in our intranet site for the guidance of all our implementing personnel, primarily revolves around the following basic AML/CFT controls required under existing AML/CFT laws, rules and regulations: 1. Know Your Customer (KYC)/Customer Due Diligence (CDD) and Know Your Employee (KYE) 2. Ongoing Monitoring of Customers and their Transactions 3. Covered and Suspicious Transactions Reporting 4. Records Keeping and Retention 5. Employee Training and Continuing Education Our MLTFPP was last updated in September 2021 to address the recommendations of the most recent BSP examination and to incorporate the recent Anti-Money Laundering (AMLC) and BSP issuances, among other updates. Compliance with the requirements of this MLTFPP is continuously monitored by our Board-designated AML Compliance Officer (AMLCO) as lead implementer under the Compliance Office. Transparency and Open Communication As a publicly listed company and a responsible financial institution, we abide by the various disclosure requirements of the BSP, the SEC, and the Philippine Stock Exchange (PSE). We ensure that we are transparent to our stakeholders by posting the latest public disclosures on the Investor Relations section of our website and in our press releases. In compliance with SEC Memorandum Circular No. 11 s2014, we regularly update our website to include all required disclosures in accordance with the SEC-prescribed web template for our stakeholders to readily check our corporate governance practices. We also maintain an open communication line and use feedback from our stakeholders to develop better policies, products, and services. We likewise accommodate requests for information on the management of our Bank, stockholders rights, or any other Bank-related matters, while remaining mindful of disclosure limitations under existing laws on the secrecy of bank deposits and data privacy. Our Corporate Governance Manual (CGM) serves as a valuable guide and reference in our implementation of corporate governance rules and regulations, and standards of both the BSP and the SEC. Our CGM is reviewed on an annual basis and was last updated in October 2021 to incorporate reputational risk

- 59 -
management per BSP Circular No. 1114 and governance policy for operators of payment system per BSP Circular No. 1127 in the Board’s duties and responsibilities as well as to include the minority shareholders’ right to call for a special stockholders’ meeting per SEC Memorandum Circular No. 7 s2021, among other updates. Financial Consumer Protection With customers at the forefront of our priorities and incompliance with BSP Circular No. 857 as amended by BSP Circular No. 1048 (BSP Regulations on Financial Consumer Protection), our corporate governance system and culture includes a Financial Consumer Protection (FCP) Framework to ensure that consumer protection standards and practices are duly observed and embedded in our business operations. This framework comprises FCP Policies and Procedures, FCP Code of Conduct, Consumer Assistance Management System, FCP Training Program, FCP Risk Management System, FCP Compliance Program, FCP Audit Program, and Financial Consumer Education and Awareness Program. The framework revolves around the core principles of consumer protection, namely: 1. Disclosure and transparency 2. Protection of client information 3. Fair treatment 4. Effective recourse 5. Financial education and awareness This FCP Framework was last updated in October 2021 to include authorized agents and service providers in the Bank’s mandatory annual FCP training refresher course as currently being practiced and to add a provision as to the unit responsible for securing and safekeeping all FCP-related training materials and records, among other updates. The Board of Directors, jointly with the senior management, is ultimately responsible in establishing an effective oversight over our consumer protection programs as well as in ensuring that consumer protection practices are embedded in our business operations. As part of our corporate-wide risk management system spearheaded by our Risk Management Office (RMO), an FCP Risk Management System (FCPRMS) is instituted to identify, measure, monitor, and control consumer protection risks (both risks to the financial consumers and the Bank) inherent in our operations. PSBank aims to differentiate itself from other banks by providing excellent customer experience. Being attentive and proactive to all customer feedback is one of the effective means of doing so. While positive feedback is welcome, we are more vigilant about negative feedback or complaints as they cover areas for improvement. For data analytics purposes, complaints received from clients are lodged in an automated tracking system to manage our defined turnaround time in resolving them and to serve as a database of all customer complaints, including the record of actions taken. This process is implemented in four steps, namely: (1) Acknowledgement (2) Decision/Disposition by designated senior officers (3) Investigation and communication of feedback to the customer concerned (4) Resolution of complaint While all personnel are given access to the system for the reporting of customer complaints and feedback, the investigation and resolution are handled by the following: • Service Recovery Team (SRT): consists of the Consumer Assistance Management Department. The team is responsible for investigation, resolution, and documentation of all customer complaints and feedback received across all channels. The SRT also works with other departments, divisions, or groups in the implementation of interim and long-term resolution (e.g., process improvement efforts, policy revision, system enhancement, personnel training). • Designated Senior Officers: consists of senior officers or group heads tasked to provide decision/disposition to the customer complaint.
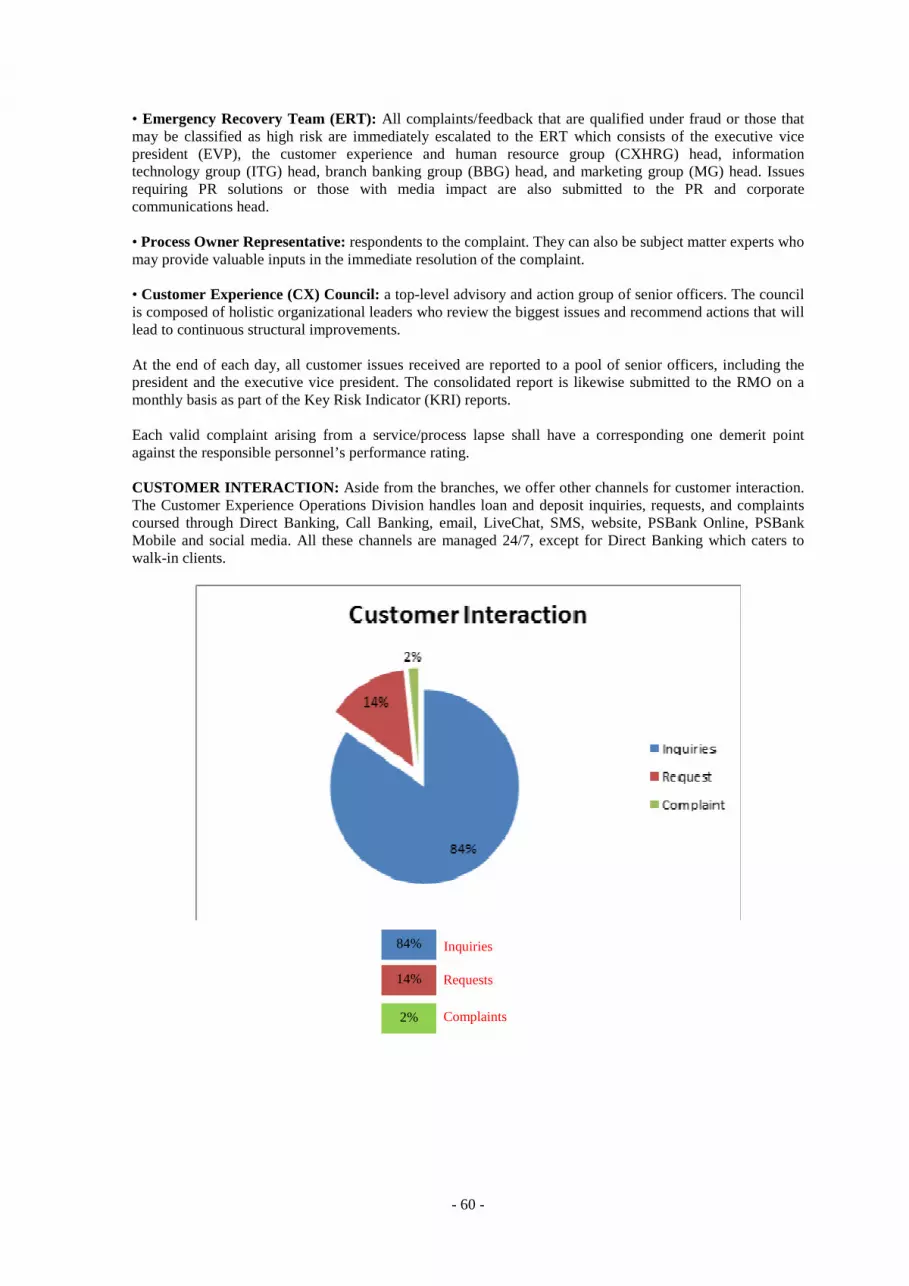
- 60 -
• Emergency Recovery Team (ERT): All complaints/feedback that are qualified under fraud or those that may be classified as high risk are immediately escalated to the ERT which consists of the executive vice president (EVP), the customer experience and human resource group (CXHRG) head, information technology group (ITG) head, branch banking group (BBG) head, and marketing group (MG) head. Issues requiring PR solutions or those with media impact are also submitted to the PR and corporate communications head. • Process Owner Representative: respondents to the complaint. They can also be subject matter experts who may provide valuable inputs in the immediate resolution of the complaint. • Customer Experience (CX) Council: a top-level advisory and action group of senior officers. The council is composed of holistic organizational leaders who review the biggest issues and recommend actions that will lead to continuous structural improvements. At the end of each day, all customer issues received are reported to a pool of senior officers, including the president and the executive vice president. The consolidated report is likewise submitted to the RMO on a monthly basis as part of the Key Risk Indicator (KRI) reports. Each valid complaint arising from a service/process lapse shall have a corresponding one demerit point against the responsible personnel’s performance rating. CUSTOMER INTERACTION: Aside from the branches, we offer other channels for customer interaction. The Customer Experience Operations Division handles loan and deposit inquiries, requests, and complaints coursed through Direct Banking, Call Banking, email, LiveChat, SMS, website, PSBank Online, PSBank Mobile and social media. All these channels are managed 24/7, except for Direct Banking which caters to walk-in clients.
Inquiries
Requests
Complaints
84%
14%
2%

- 61 -
System
Policy
Environment
Process
People
Data Privacy PSBank respects and values data privacy rights and makes sure that all personal data collected from its data subjects (i.e. employees, clients & customers, suppliers, etc.) are processed in adherence to the principles of transparency, legitimate purpose, proportionality, quality and security in compliance with Republic Act No. 10173 otherwise known as “The Data Privacy Act of 2012”, its Implementing Rules and Regulations and the related issuances of the National Privacy Commission (NPC). Our Board-approved Data Privacy Policy, which was last updated in June 2020 to add a new chapter about Privacy Impact Assessment (PIA) and include another chapter regarding Work From Home (WFH) arrangement, encapsulates the privacy and data protection protocols/security measures that need to be observed and carried out within the Bank for specific circumstances (i.e. from collection to destruction) directed towards the fulfilment and realization of the rights of our data subjects and protection of personal data against natural dangers such as accidental loss or destruction, and human dangers such as unlawful access, fraudulent misuse, unlawful destruction, alteration and contamination. BOARD OVERSIGHT The Board of Directors sets the corporate governance tone in our organization by ensuring adherence to principles and standards. It is accountable to our stakeholders in running our Bank in a prudent and sound manner to ensure long-term sustainability and success. It is primarily responsible for developing, reviewing, and approving our strategic objectives annually and thereafter monitoring and overseeing the effective implementation with due consideration of our risk strategies, corporate governance and corporate values. It monitors management’s performance against set targets and makes sure that appropriate controls and systems of checks and balances are in place and operating effectively. In 2021, there were nine directors in our Board, four of whom are independent directors, four are non-executive directors, and one is an executive director who is also the president of the Bank. They are all qualified business professionals with the required expertise and experience in directing our strategic path. Their selection was based on their qualifications (i.e., integrity/probity, physical/mental fitness, competence, relevant education/financial literacy/training, diligence and knowledge/experience) without discrimination against gender, age, and ethnic, political, religious, or cultural backgrounds, and therefore achieving diversity in the Board. In accordance with our By-Laws, directors are elected by the vote of the holders of common stock of the Bank in accordance with Section 23 of the Revised Corporation Code of the Philippines and other pertinent applicable laws. Any stockholder may submit nominations for directorial positions to the Corporate Governance Committee. The Committee then screens the qualifications of the nominees in accordance with
93%
3%
2%
1%
1%

- 62 -
screening policies and procedures, and parameters, including alignment with our strategic directions by attaining an optimal mix of skills and talents and balanced board membership. In identifying or screening potential candidates, the Committee may consult whatever resources it deems appropriate, including but not limited to, referrals from existing directors and officers, recommendations from a third-party search firm or suggestions from stockholders or by checking on the external databases of the Institute of Corporate Directors (ICD) or other professional search firms. Only nominees whose names appear in the final list of candidates are considered for election as directors at the annual meeting of the stockholders. We have consistently maintained independent directors who provide independent judgment, outside experience, and objectivity. In our nine-seat Board, we have four independent directors, including our board chairman. This is more than the required minimum number of independent directors. We do not have any non-executive director holding a total of more than five board seats in publicly listed companies. Non-executive directors, including independent directors, meet regularly on an annual basis, other than in meetings of the Audit, Risk Oversight, Corporate Governance and other Board-level committees in the absence of any executive director and senior management, with the external auditor and the heads of internal audit, compliance and risk management functions to scrutinize management’s performance particularly in meeting our goals and objectives and to determine the integrity of our internal controls and effectiveness of risk management systems. Further, the Board also meets annually with the Audit Committee without the presence of the president/chief executive officer (CEO) and any other management team members to discuss and resolve any significant issues. Our chairman provides active leadership by ensuring that our Board and its various committees function effectively, including maintaining a relationship of trust among Board members. Our chairman also ensures that our Board follows a sound decision making process. Individual directors are tasked to observe the fit-and-proper rule. They are expected to conduct fair business dealings, avoid conflict of interest, and observe confidentiality. They must act honestly, judiciously and in good faith, and uphold the best interest of our Bank and its stakeholders. They must also devote time and attention to their duties and responsibilities and contribute to our Board’s decision-making process. They must exercise independent judgment and have a working knowledge of laws, rules and regulations applicable to our Bank. All new members of the Board of Directors are furnished with a copy of their duties and responsibilities and are provided with a comprehensive training on corporate governance, as part of the BSP’s requirements in confirming elected bank directors. Together with our principal officers, our directors attended in March 2021 an annual refresher program on Corporate Governance via Zoom webinar pursuant to SEC Memorandum Circular No. 20 s2013 and as conducted by the ICD, a SEC-accredited training provider. Topics covered in said webinar are Risk Management in the Age of COVID-19, AMLA in a Digital World, Building Business Resilience in the Corporate Strategy and Digital Transformation. Our Board has access to our corporate secretary who manages the flow of information to the Board prior to the meetings. The Office of the Corporate Secretary plays a significant role in supporting the Board in discharging its responsibilities as it administers, attends, and prepares the agenda and minutes of Board meetings, and ensures that notices required under the By-Laws are given to all directors and stockholders. Since 2020, regular Board meetings were scheduled in advance and were normally set every third Thursday of the month. Our Board also reviews and approves all policy manuals to ensure that regulatory changes and best practices are included. They have access to a permanent compilation of documents related to past Board activities. They can readily seek clarification from senior management should they have concerns about our Bank or any item submitted for their consideration. Board Committees A number of Board-level committees were created to aid our Board in its various tasks to ensure efficiency and provide greater focus. Four of these committees are in charge of governance oversight functions, as follows:
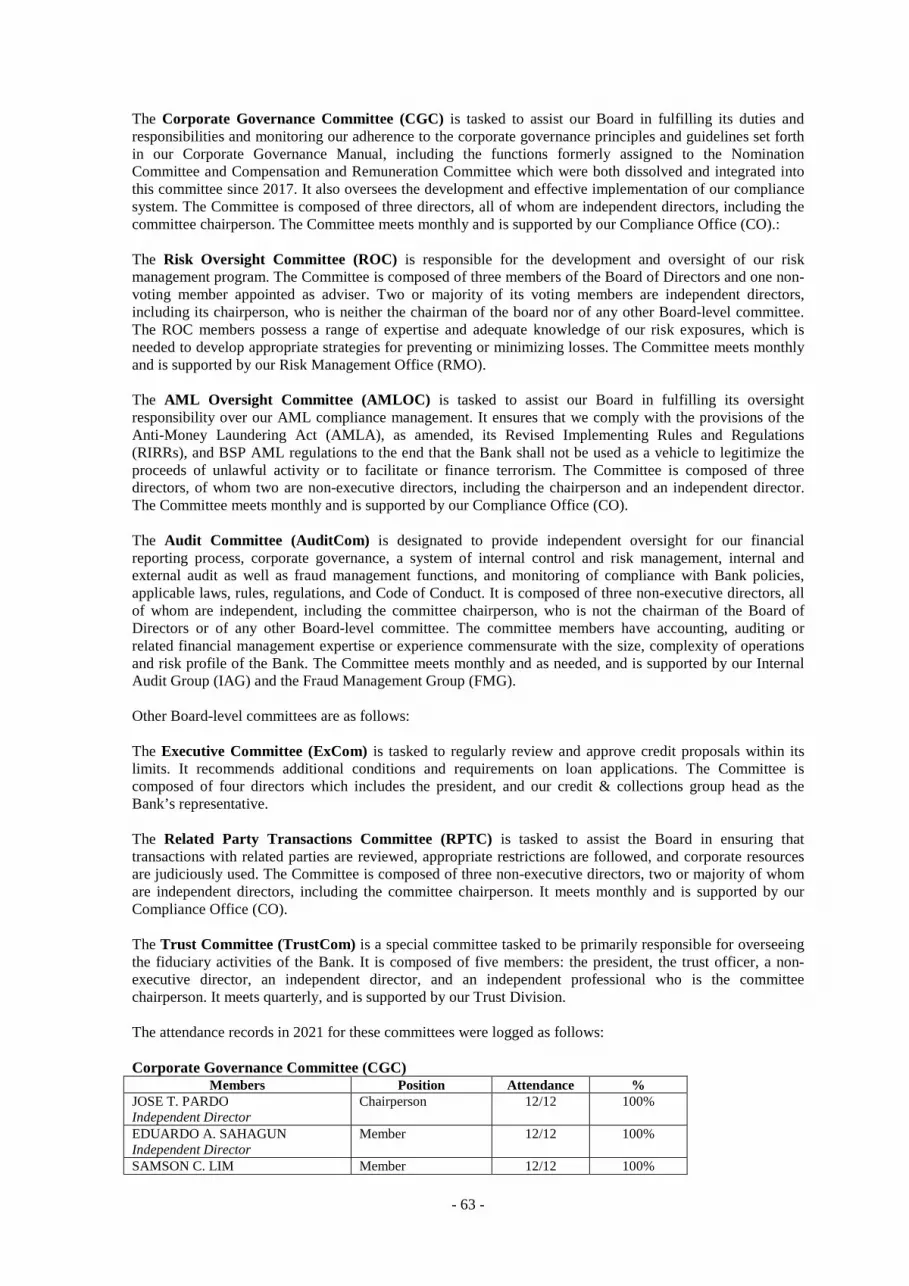
- 63 -
The Corporate Governance Committee (CGC) is tasked to assist our Board in fulfilling its duties and responsibilities and monitoring our adherence to the corporate governance principles and guidelines set forth in our Corporate Governance Manual, including the functions formerly assigned to the Nomination Committee and Compensation and Remuneration Committee which were both dissolved and integrated into this committee since 2017. It also oversees the development and effective implementation of our compliance system. The Committee is composed of three directors, all of whom are independent directors, including the committee chairperson. The Committee meets monthly and is supported by our Compliance Office (CO).: The Risk Oversight Committee (ROC) is responsible for the development and oversight of our risk management program. The Committee is composed of three members of the Board of Directors and one non-voting member appointed as adviser. Two or majority of its voting members are independent directors, including its chairperson, who is neither the chairman of the board nor of any other Board-level committee. The ROC members possess a range of expertise and adequate knowledge of our risk exposures, which is needed to develop appropriate strategies for preventing or minimizing losses. The Committee meets monthly and is supported by our Risk Management Office (RMO). The AML Oversight Committee (AMLOC) is tasked to assist our Board in fulfilling its oversight responsibility over our AML compliance management. It ensures that we comply with the provisions of the Anti-Money Laundering Act (AMLA), as amended, its Revised Implementing Rules and Regulations (RIRRs), and BSP AML regulations to the end that the Bank shall not be used as a vehicle to legitimize the proceeds of unlawful activity or to facilitate or finance terrorism. The Committee is composed of three directors, of whom two are non-executive directors, including the chairperson and an independent director. The Committee meets monthly and is supported by our Compliance Office (CO). The Audit Committee (AuditCom) is designated to provide independent oversight for our financial reporting process, corporate governance, a system of internal control and risk management, internal and external audit as well as fraud management functions, and monitoring of compliance with Bank policies, applicable laws, rules, regulations, and Code of Conduct. It is composed of three non-executive directors, all of whom are independent, including the committee chairperson, who is not the chairman of the Board of Directors or of any other Board-level committee. The committee members have accounting, auditing or related financial management expertise or experience commensurate with the size, complexity of operations and risk profile of the Bank. The Committee meets monthly and as needed, and is supported by our Internal Audit Group (IAG) and the Fraud Management Group (FMG). Other Board-level committees are as follows: The Executive Committee (ExCom) is tasked to regularly review and approve credit proposals within its limits. It recommends additional conditions and requirements on loan applications. The Committee is composed of four directors which includes the president, and our credit & collections group head as the Bank’s representative. The Related Party Transactions Committee (RPTC) is tasked to assist the Board in ensuring that transactions with related parties are reviewed, appropriate restrictions are followed, and corporate resources are judiciously used. The Committee is composed of three non-executive directors, two or majority of whom are independent directors, including the committee chairperson. It meets monthly and is supported by our Compliance Office (CO). The Trust Committee (TrustCom) is a special committee tasked to be primarily responsible for overseeing the fiduciary activities of the Bank. It is composed of five members: the president, the trust officer, a non-executive director, an independent director, and an independent professional who is the committee chairperson. It meets quarterly, and is supported by our Trust Division. The attendance records in 2021 for these committees were logged as follows: Corporate Governance Committee (CGC)
Members Position Attendance % JOSE T. PARDO Independent Director
Chairperson 12/12 100%
EDUARDO A. SAHAGUN Independent Director
Member 12/12 100%
SAMSON C. LIM Member 12/12 100%
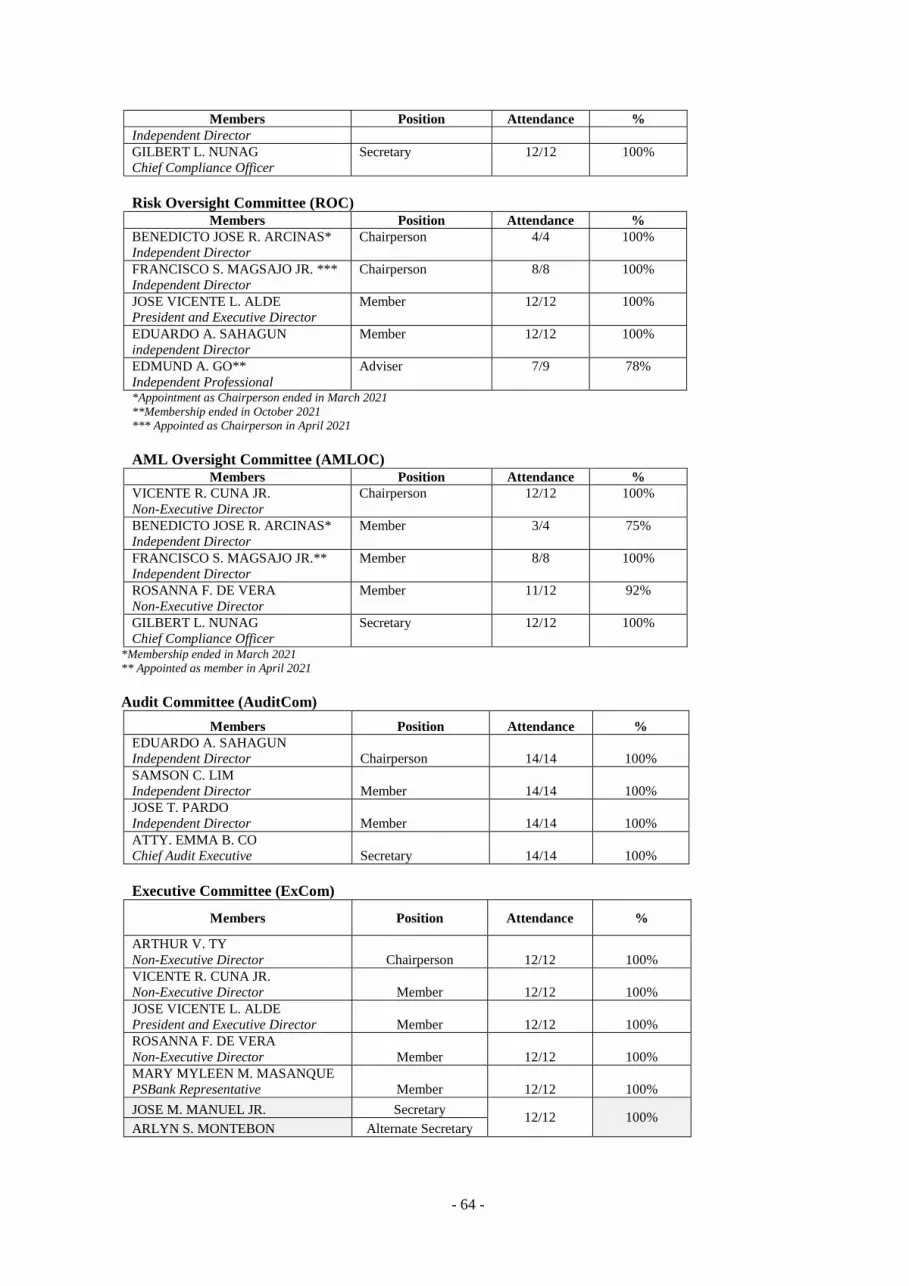
- 64 -
Members Position Attendance % Independent Director GILBERT L. NUNAG Chief Compliance Officer
Secretary 12/12 100%
Risk Oversight Committee (ROC)
Members Position Attendance % BENEDICTO JOSE R. ARCINAS* Independent Director
Chairperson 4/4 100%
FRANCISCO S. MAGSAJO JR. *** Independent Director
Chairperson 8/8 100%
JOSE VICENTE L. ALDE President and Executive Director
Member 12/12 100%
EDUARDO A. SAHAGUN independent Director
Member 12/12 100%
EDMUND A. GO** Independent Professional
Adviser 7/9 78%
*Appointment as Chairperson ended in March 2021 **Membership ended in October 2021 *** Appointed as Chairperson in April 2021 AML Oversight Committee (AMLOC)
Members Position Attendance % VICENTE R. CUNA JR. Non-Executive Director
Chairperson 12/12 100%
BENEDICTO JOSE R. ARCINAS* Independent Director
Member 3/4 75%
FRANCISCO S. MAGSAJO JR.** Independent Director
Member 8/8 100%
ROSANNA F. DE VERA Non-Executive Director
Member 11/12 92%
GILBERT L. NUNAG Chief Compliance Officer
Secretary 12/12 100%
*Membership ended in March 2021 ** Appointed as member in April 2021 Audit Committee (AuditCom)
Members Position Attendance % EDUARDO A. SAHAGUN Independent Director Chairperson 14/14 100% SAMSON C. LIM Independent Director Member 14/14 100% JOSE T. PARDO Independent Director Member 14/14 100% ATTY. EMMA B. CO Chief Audit Executive Secretary 14/14 100% Executive Committee (ExCom)
Members Position Attendance %
ARTHUR V. TY Non-Executive Director Chairperson 12/12 100% VICENTE R. CUNA JR. Non-Executive Director Member 12/12 100% JOSE VICENTE L. ALDE President and Executive Director Member 12/12 100% ROSANNA F. DE VERA Non-Executive Director Member 12/12 100% MARY MYLEEN M. MASANQUE PSBank Representative Member 12/12 100%
JOSE M. MANUEL JR. Secretary 12/12 100%
ARLYN S. MONTEBON Alternate Secretary
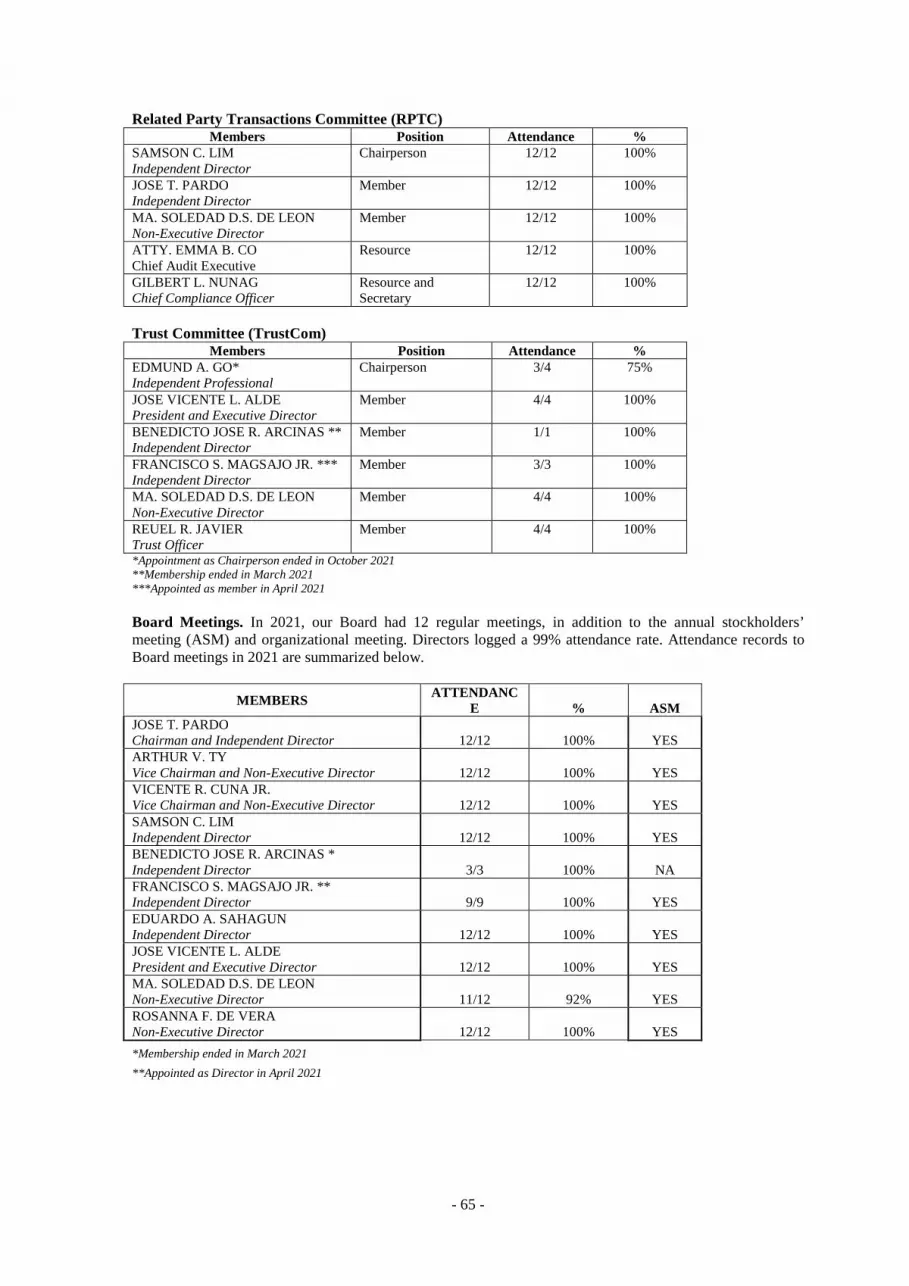
- 65 -
Related Party Transactions Committee (RPTC) Members Position Attendance %
SAMSON C. LIM Independent Director
Chairperson 12/12 100%
JOSE T. PARDO Independent Director
Member 12/12 100%
MA. SOLEDAD D.S. DE LEON Non-Executive Director
Member 12/12 100%
ATTY. EMMA B. CO Chief Audit Executive
Resource 12/12 100%
GILBERT L. NUNAG Chief Compliance Officer
Resource and Secretary
12/12 100%
Trust Committee (TrustCom)
Members Position Attendance % EDMUND A. GO* Independent Professional
Chairperson 3/4 75%
JOSE VICENTE L. ALDE President and Executive Director
Member 4/4 100%
BENEDICTO JOSE R. ARCINAS ** Independent Director
Member 1/1 100%
FRANCISCO S. MAGSAJO JR. *** Independent Director
Member 3/3 100%
MA. SOLEDAD D.S. DE LEON Non-Executive Director
Member 4/4 100%
REUEL R. JAVIER Trust Officer
Member 4/4 100%
*Appointment as Chairperson ended in October 2021 **Membership ended in March 2021 ***Appointed as member in April 2021
Board Meetings. In 2021, our Board had 12 regular meetings, in addition to the annual stockholders’ meeting (ASM) and organizational meeting. Directors logged a 99% attendance rate. Attendance records to Board meetings in 2021 are summarized below.
MEMBERS ATTENDANCE % ASM
JOSE T. PARDO Chairman and Independent Director 12/12 100% YES ARTHUR V. TY Vice Chairman and Non-Executive Director 12/12 100% YES VICENTE R. CUNA JR. Vice Chairman and Non-Executive Director 12/12 100% YES SAMSON C. LIM Independent Director 12/12 100% YES BENEDICTO JOSE R. ARCINAS * Independent Director 3/3 100% NA FRANCISCO S. MAGSAJO JR. ** Independent Director 9/9 100% YES EDUARDO A. SAHAGUN Independent Director 12/12 100% YES JOSE VICENTE L. ALDE President and Executive Director 12/12 100% YES MA. SOLEDAD D.S. DE LEON Non-Executive Director 11/12 92% YES ROSANNA F. DE VERA Non-Executive Director 12/12 100% YES
*Membership ended in March 2021
**Appointed as Director in April 2021
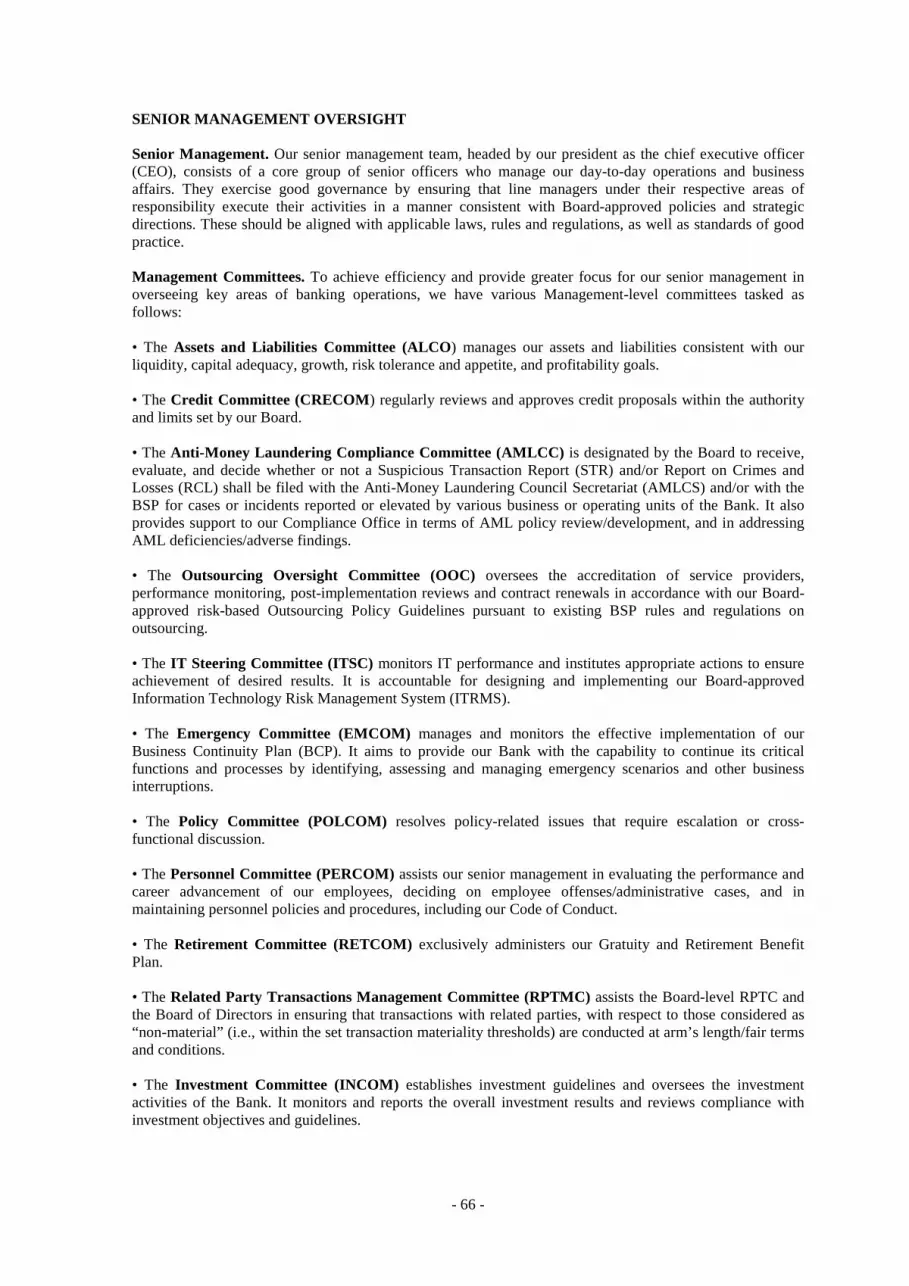
- 66 -
SENIOR MANAGEMENT OVERSIGHT Senior Management. Our senior management team, headed by our president as the chief executive officer (CEO), consists of a core group of senior officers who manage our day-to-day operations and business affairs. They exercise good governance by ensuring that line managers under their respective areas of responsibility execute their activities in a manner consistent with Board-approved policies and strategic directions. These should be aligned with applicable laws, rules and regulations, as well as standards of good practice. Management Committees. To achieve efficiency and provide greater focus for our senior management in overseeing key areas of banking operations, we have various Management-level committees tasked as follows: • The Assets and Liabilities Committee (ALCO) manages our assets and liabilities consistent with our liquidity, capital adequacy, growth, risk tolerance and appetite, and profitability goals. • The Credit Committee (CRECOM) regularly reviews and approves credit proposals within the authority and limits set by our Board. • The Anti-Money Laundering Compliance Committee (AMLCC) is designated by the Board to receive, evaluate, and decide whether or not a Suspicious Transaction Report (STR) and/or Report on Crimes and Losses (RCL) shall be filed with the Anti-Money Laundering Council Secretariat (AMLCS) and/or with the BSP for cases or incidents reported or elevated by various business or operating units of the Bank. It also provides support to our Compliance Office in terms of AML policy review/development, and in addressing AML deficiencies/adverse findings. • The Outsourcing Oversight Committee (OOC) oversees the accreditation of service providers, performance monitoring, post-implementation reviews and contract renewals in accordance with our Board-approved risk-based Outsourcing Policy Guidelines pursuant to existing BSP rules and regulations on outsourcing. • The IT Steering Committee (ITSC) monitors IT performance and institutes appropriate actions to ensure achievement of desired results. It is accountable for designing and implementing our Board-approved Information Technology Risk Management System (ITRMS). • The Emergency Committee (EMCOM) manages and monitors the effective implementation of our Business Continuity Plan (BCP). It aims to provide our Bank with the capability to continue its critical functions and processes by identifying, assessing and managing emergency scenarios and other business interruptions. • The Policy Committee (POLCOM) resolves policy-related issues that require escalation or cross-functional discussion. • The Personnel Committee (PERCOM) assists our senior management in evaluating the performance and career advancement of our employees, deciding on employee offenses/administrative cases, and in maintaining personnel policies and procedures, including our Code of Conduct. • The Retirement Committee (RETCOM) exclusively administers our Gratuity and Retirement Benefit Plan. • The Related Party Transactions Management Committee (RPTMC) assists the Board-level RPTC and the Board of Directors in ensuring that transactions with related parties, with respect to those considered as “non-material” (i.e., within the set transaction materiality thresholds) are conducted at arm’s length/fair terms and conditions. • The Investment Committee (INCOM) establishes investment guidelines and oversees the investment activities of the Bank. It monitors and reports the overall investment results and reviews compliance with investment objectives and guidelines.
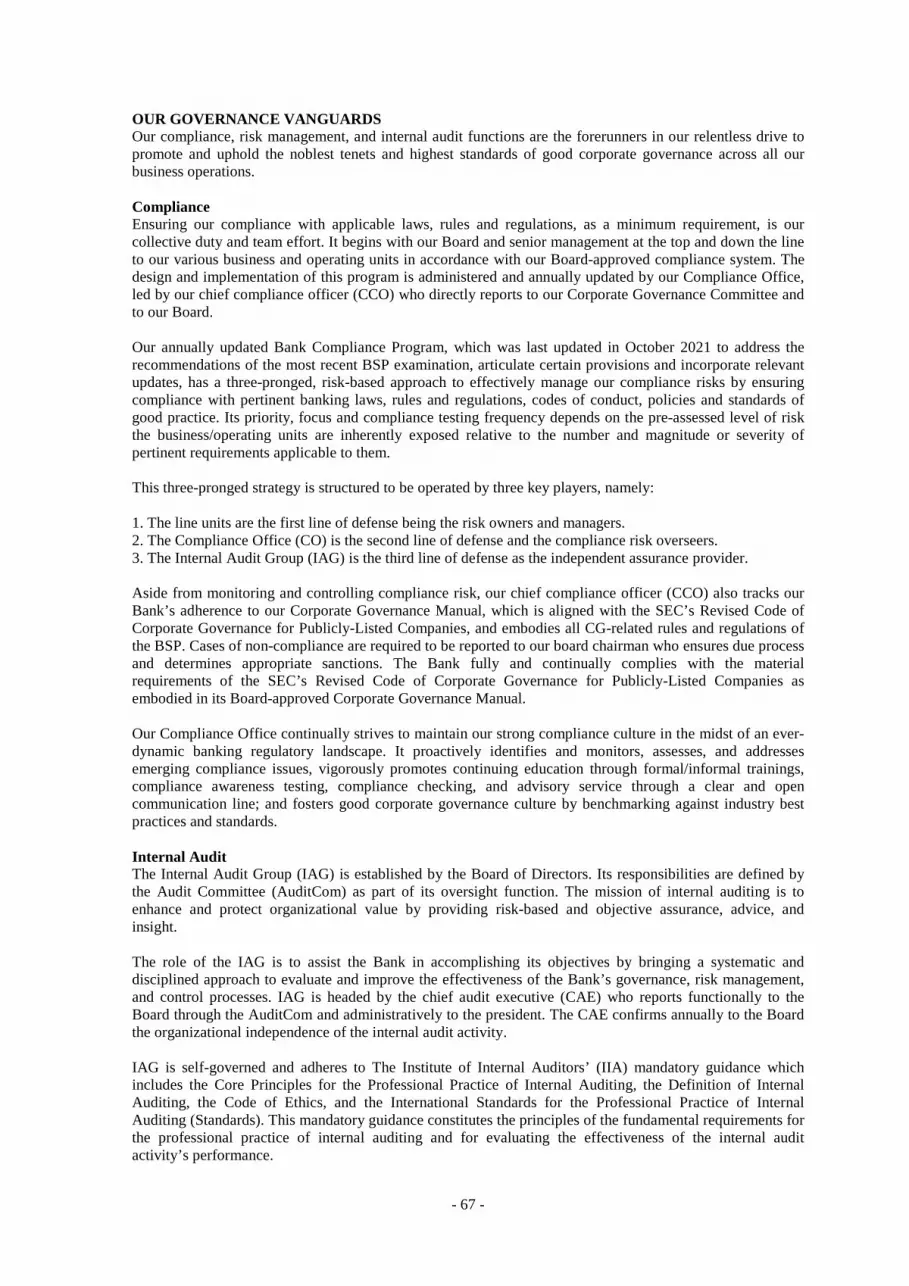
- 67 -
OUR GOVERNANCE VANGUARDS Our compliance, risk management, and internal audit functions are the forerunners in our relentless drive to promote and uphold the noblest tenets and highest standards of good corporate governance across all our business operations. Compliance Ensuring our compliance with applicable laws, rules and regulations, as a minimum requirement, is our collective duty and team effort. It begins with our Board and senior management at the top and down the line to our various business and operating units in accordance with our Board-approved compliance system. The design and implementation of this program is administered and annually updated by our Compliance Office, led by our chief compliance officer (CCO) who directly reports to our Corporate Governance Committee and to our Board. Our annually updated Bank Compliance Program, which was last updated in October 2021 to address the recommendations of the most recent BSP examination, articulate certain provisions and incorporate relevant updates, has a three-pronged, risk-based approach to effectively manage our compliance risks by ensuring compliance with pertinent banking laws, rules and regulations, codes of conduct, policies and standards of good practice. Its priority, focus and compliance testing frequency depends on the pre-assessed level of risk the business/operating units are inherently exposed relative to the number and magnitude or severity of pertinent requirements applicable to them. This three-pronged strategy is structured to be operated by three key players, namely: 1. The line units are the first line of defense being the risk owners and managers. 2. The Compliance Office (CO) is the second line of defense and the compliance risk overseers. 3. The Internal Audit Group (IAG) is the third line of defense as the independent assurance provider. Aside from monitoring and controlling compliance risk, our chief compliance officer (CCO) also tracks our Bank’s adherence to our Corporate Governance Manual, which is aligned with the SEC’s Revised Code of Corporate Governance for Publicly-Listed Companies, and embodies all CG-related rules and regulations of the BSP. Cases of non-compliance are required to be reported to our board chairman who ensures due process and determines appropriate sanctions. The Bank fully and continually complies with the material requirements of the SEC’s Revised Code of Corporate Governance for Publicly-Listed Companies as embodied in its Board-approved Corporate Governance Manual. Our Compliance Office continually strives to maintain our strong compliance culture in the midst of an ever-dynamic banking regulatory landscape. It proactively identifies and monitors, assesses, and addresses emerging compliance issues, vigorously promotes continuing education through formal/informal trainings, compliance awareness testing, compliance checking, and advisory service through a clear and open communication line; and fosters good corporate governance culture by benchmarking against industry best practices and standards. Internal Audit The Internal Audit Group (IAG) is established by the Board of Directors. Its responsibilities are defined by the Audit Committee (AuditCom) as part of its oversight function. The mission of internal auditing is to enhance and protect organizational value by providing risk-based and objective assurance, advice, and insight. The role of the IAG is to assist the Bank in accomplishing its objectives by bringing a systematic and disciplined approach to evaluate and improve the effectiveness of the Bank’s governance, risk management, and control processes. IAG is headed by the chief audit executive (CAE) who reports functionally to the Board through the AuditCom and administratively to the president. The CAE confirms annually to the Board the organizational independence of the internal audit activity. IAG is self-governed and adheres to The Institute of Internal Auditors’ (IIA) mandatory guidance which includes the Core Principles for the Professional Practice of Internal Auditing, the Definition of Internal Auditing, the Code of Ethics, and the International Standards for the Professional Practice of Internal Auditing (Standards). This mandatory guidance constitutes the principles of the fundamental requirements for the professional practice of internal auditing and for evaluating the effectiveness of the internal audit activity’s performance.
- 68 -
IAG, with strict accountability for confidentiality and safeguarding records and information, is authorized to: 1. Have full, free, and unrestricted access to all Bank functions, records, properties, and personnel pertinent to carrying out any engagement; 2. Have direct and unrestricted access to senior management and the AuditCom; 3. Allocate resources, set frequencies, select subjects, determine scopes of work, apply the procedures and techniques required to accomplish audit objectives, and issue reports; and 4. Obtain necessary assistance from personnel in other units of the Bank where they perform audits, as well as other specialized services from within or outside the Bank. IAG remains free from interference by any element in the organization, including matters of audit selection, scope, procedures, frequency, timing, or report content to permit maintenance of an independent and objective mental attitude. OUR REMUNERATION POLICY Our directors and officers are provided with an industry competitive compensation package to attract, motivate, and retain highly qualified people. The salary scales of our officers, including that of our president or chief executive officer (our sole executive director), are generally based on the nature of their jobs, positions and ranks. These are reviewed annually vis-à-vis annual performance scorecards so structured to achieve business objectives and adjusted as needed, based on performance. Our compensation package for non-officers/rank-and-file employees is in accordance with labor law requirements and is linked to both performance and our contractual obligation under a collective bargaining agreement which include loyalty bonuses for long-term employees. We also grant fixed bonuses, including a 13th-month pay in accordance with the law, and a performance bonus (non-guaranteed) based on our overall performance, individual performance, and market conditions. Our Board sees to it that this remuneration strategy is regularly reviewed to ensure that the policy is commensurate with corporate and individual performance, aligned with our long-term interests, compliant with labor laws and regulations, and benchmarked against our industry peers and other market considerations, while also maintaining internal equity. Except for the president/chief executive officer (our sole executive director), each director receives a monthly professional fee for attending Board and committee meetings. This is also in consideration of their valuable contributions in the formulation of our Bank’s overall strategy. The total per diem and transportation allowance paid to directors for their attendance in Board meetings for the period January to December 2021 was PhP22.1 million. Our remuneration policy for directors indicates that the chairman, vice chairpersons, and each of the directors receive reasonable per diems for attendance at any Board meeting. There is nothing in our By-Laws that prevents any director from serving any other capacity and receiving compensation. We have been consistent in preaching the philosophy of meritocracy, such that our compensation and rewards programs are geared towards providing incentives to employees who have contributed to the success of the Bank. • Merit Increase. Annual increases are given to employees based on their relative performance within the organization. The Bank has adopted an increase matrix that rewards high performers without neglecting those rated as standard performers, or those who were able to perform as expected. Rewarding the most productive encourages others to perform better. This procedure on merit increase comes immediately after the performance appraisal exercise for the employees to relish the fruits of their hard work and contributions to the growth of the Bank. • Other Performance Incentives. Based on the overall company performance, i.e., attainment by the Bank of a stipulated income, we grant a return on equity (ROE) bonus to rank-and-file employees. • HE1GHTS: Reaching the Peak of Top-notch Performance. This productivity-based award is given quarterly and annually to an individual or group for achieving exceptional performance. In 2021, top-performing PSBankers from Branch Banking Group, Collections and Remedial Management Division, and Credit Verification Division were recognized for exceeding more than 100% of their target productivity.

- 69 -
• Job Evaluation. We regularly conduct job evaluation on new positions resulting from our reorganization. This was an offshoot of a bank-wide job evaluation conducted every three years, which aimed to measure and benchmark all Bank positions vis-à-vis the banking industry. • Salary Structure Program. We conduct salary restructuring to ensure that the salaries of our employees are equitable to what the industry offers. The Bank recognizes the need to attract and retain top talent, thus it reviews the existing scale periodically to ensure competitiveness. SENIOR MANAGEMENT SELECTION PROCESS The Bank has pre-defined job descriptions for its senior management positions (i.e., those to be held by officers from assistant vice president and up). It evaluates the qualifications of internal and/or external candidates for the available positions. Every candidate undergoes a series of interviews by the line head, Customer Experience and Human Resources Group, and the president. Any hiring or appointment to the role is endorsed by the Management-level Personnel Committee for approval of the president and the Board of Directors. OUR RETIREMENT AND SUCCESSION POLICY As a matter of policy, the compulsory retirement age for our regular employees (officers and staff) is at 55 years old. This has been established in our Retirement and Gratuity Plan, duly approved by the Bureau of Internal Revenue. To aid in workforce planning, we review the roster of employees reaching the compulsory retirement age before the end of the applicable year. Appropriate notification is arranged, and deferential treatment is accorded to retired employees, ensuring that they receive the compensation for their loyal service within 30 days after their effective date of retirement. In 2021, succession was among our focus areas. A more comprehensive Succession Planning Program was launched which consists of five stages: (1) identification of the successor, (2) assessment of the gap, (3) addressing of the gap, (4) evaluation, and (5) implementation. This instituted program helps ensure the continuity and viability of the business. Positions that are critical to the business have identified “Ready Now” and “Ready Later – Ready in 1-3 Years or Ready in 3-5 Years” replacements, which are reviewed periodically. Potential successors are subjected to Individual Development Plans, which are a combination of classroom training, cross-postings, immersions, and development assignments. Strategic workforce planning is also implemented annually to ensure that critical positions are filled up and that Talent Management is ready to provide external talents if deemed necessary. Except for certain persons such as Filipino citizens with recognized stature, influence and reputation in the banking and business community, and whose business practices stand as testimonies to good corporate governance, we have adopted an age limit of 75 years old as a general rule for directors, patterned after that of our parent bank. Upon the recommendation of the Corporate Governance Committee, this age limit for directors may be waived by the Board if such a waiver is deemed to the best interest of the Bank. Our independent directors may only serve as such for a maximum cumulative term of nine years from 2012, after which the independent director shall be perpetually barred from re-election, but may continue to qualify for nomination and election as a non-independent or regular director. If the Bank wants to retain an independent director who has already served for nine years, the Board should provide meritorious justification/s and seek prior BSP’s approval as well as shareholders’ approval during the Annual Shareholders’ Meeting. Succession or filling up any vacancies in the Board of Directors shall be made by the vote of at least a majority of the remaining directors, if still constituting a quorum. Vacancies occurring by reason of removal by the stockholders, by expiration of term, or by an increase in the number of directors, however, shall be filled by the stockholders in a regular or special meeting called for this purpose. OUR DIVIDEND POLICY Dividends to be paid in cash are subject to the approval by a majority of the Board of Directors. Dividends to be paid in the form of stocks require the approval of a majority of the Board and the approval of shareholders representing no less than two-thirds of our outstanding capital stock. Consistent with SEC rules, cash dividends declared by the Bank must have a record date of not less than 10 but not more than 30 business days from the date the cash dividends are declared/approved by the Board. With respect to stock dividends, the record date should not be less than 10 but not more than 30 business days from the date of the stockholders’ approval; provided, however, that the set record date should not be less than 10 business days after the PSE has received the notice of declaration of stock dividend. BSP regulations
- 70 -
have since allowed banks to fix the record date and payment date on the date of dividend declaration, and pay such dividends without prior BSP approval, with the exception of banks with major supervisory concerns. In the event that a stock dividend is declared in connection with an increase in authorized capital stock, the corresponding record date is to be fixed by the SEC. Unless approved by a majority vote of the Board at a different rate depending on our earnings/results of operations, cash flow, financial condition and other factors or otherwise restricted/prohibited from declaring/paying dividends, the Bank regularly declares out of its unrestricted retained earnings and pays cash dividends at a payout ratio of PhP3.00 per share per annum or PhP0.75 per share per quarter, provided that these comply with the regulatory requirements of the SEC and the BSP. Circumstances which could restrict the payment of cash dividends include, but are not limited to, when the Bank undertakes major projects and developments requiring substantial cash expenditures or when it is restricted from paying cash dividends by its loan covenants. Provided likewise that the Bank is not restricted/prohibited from declaring/paying dividends and that all such regulatory requirements are complied with, the Bank may also declare out of its unrestricted retained earnings and pay out special cash dividends (on top of its regular quarterly cash dividends) at such rate as may also be approved via majority vote of the Board of Directors. The aggregate amount of quarterly cash dividends declared by the Bank in 2021 stood at PhP1.28 billion. Details are shown under Note 21 of the Audited Financial Statements section. OUR GOVERNANCE EVALUATION Every first quarter of each year, our Board, individual directors, their respective oversight committees, and all other Board-level committees, as well as the president and all Management-level committees, conduct annual self-rating exercises on their performance during the immediately preceding calendar year. Using scorecards, this exercise aims to gauge their effectiveness and determines the areas of improvement vis-à-vis set performance standards that are consistent with our strategic objectives and business plans designed to continuously create value to all our stakeholders. Items subject to rating are the pertinent standards, as well as their duties and responsibilities, under a 3-point rating scale, to wit: “3”-Meets Standards (MS),“2”-Needs Improvement (NI), and “1”-Not Observed (NO), with an enjoinder to provide suggestions on how to address the deficiencies/improve performance on items rated either “1” or “2”. Our Corporate Governance Committee reviews the scorecard results, which are reported to our Board of Directors and, thereafter, regularly tracked in terms of the status of addressing the areas needing improvement. This annual performance rating exercises also include that of the chairman of the board, the chief risk officer, the chief audit executive, the chief compliance officer, directors/officers with multiple/interlocking positions and of the entire Bank. Information Technology (IT) Training In 2021, despite the continued challenges and limitations brought about by the COVID-19 pandemic, the PSBank Business Campus (PBC) remained focused on ensuring that employees get the Learning and Development programs they need. As a strategic business hub for interesting, integrated, and immersive programs – PBC delivered non-stop trainings for PSBankers all year-round.
Among the teams which received customized and targeted programs is the Bank’s Information Technology Group (ITG). With the goal of making the Bank’s IT workforce adept with Industrial Revolution 4.0 skills, they were included again in the priority learners for 2021. The IT trainings with the most number of attendees were the following:
IT Training Program Number of
Participants
A Practical Introduction to Cloud Computing 170
CI CD Pipeline - Devops Automation in 1 Hour 13
Cloud Security Architecture - An Introduction 89
Complete Agile Scrum Management + Kanban + 4 Extra Courses 11
Develop Effective Team Leaders 13
Developing Cloud-Native Apps w/ Microservice Architectures 85
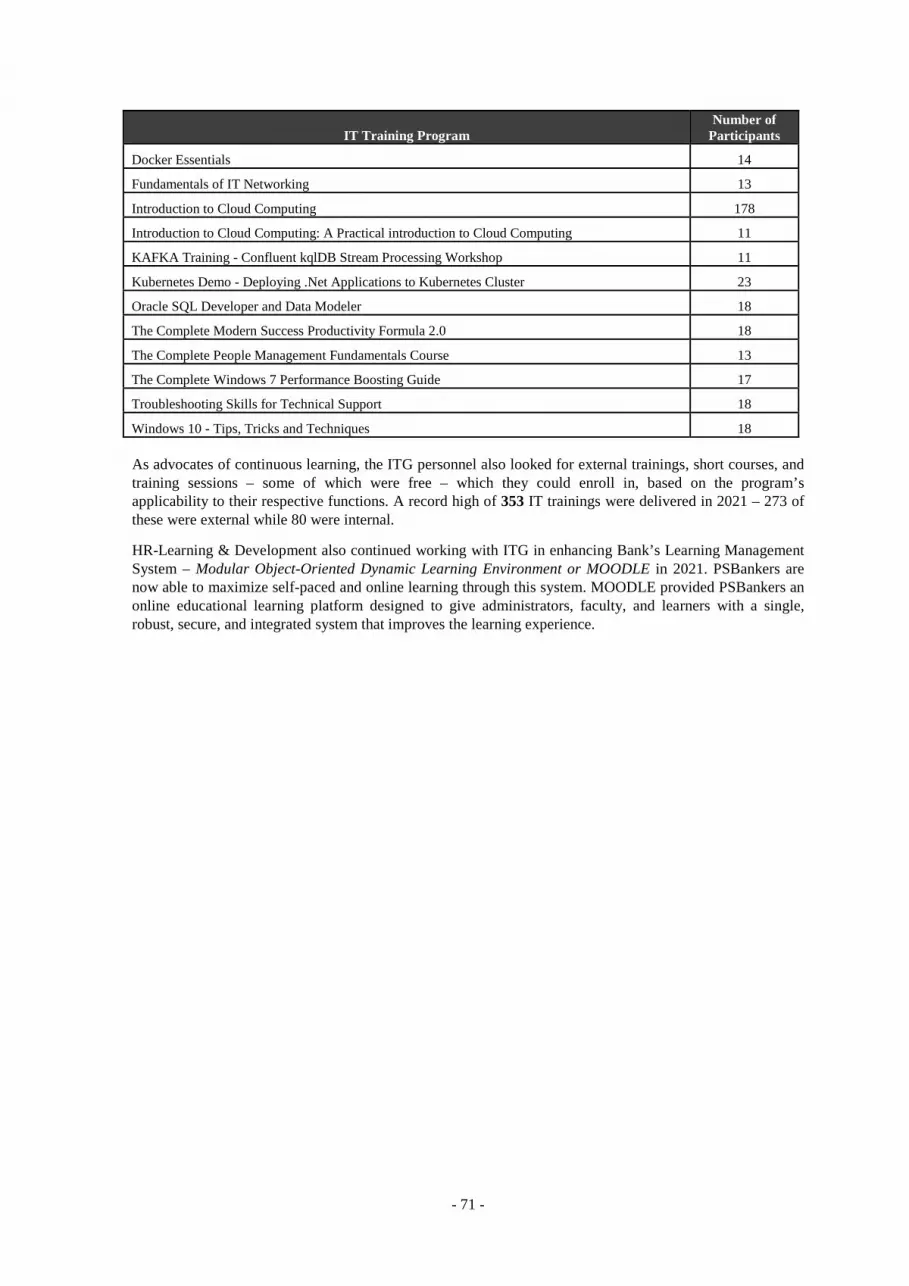
- 71 -
IT Training Program Number of
Participants
Docker Essentials 14
Fundamentals of IT Networking 13
Introduction to Cloud Computing 178
Introduction to Cloud Computing: A Practical introduction to Cloud Computing 11
KAFKA Training - Confluent kqlDB Stream Processing Workshop 11
Kubernetes Demo - Deploying .Net Applications to Kubernetes Cluster 23
Oracle SQL Developer and Data Modeler 18
The Complete Modern Success Productivity Formula 2.0 18
The Complete People Management Fundamentals Course 13
The Complete Windows 7 Performance Boosting Guide 17
Troubleshooting Skills for Technical Support 18
Windows 10 - Tips, Tricks and Techniques 18 As advocates of continuous learning, the ITG personnel also looked for external trainings, short courses, and training sessions – some of which were free – which they could enroll in, based on the program’s applicability to their respective functions. A record high of 353 IT trainings were delivered in 2021 – 273 of these were external while 80 were internal.
HR-Learning & Development also continued working with ITG in enhancing Bank’s Learning Management System – Modular Object-Oriented Dynamic Learning Environment or MOODLE in 2021. PSBankers are now able to maximize self-paced and online learning through this system. MOODLE provided PSBankers an online educational learning platform designed to give administrators, faculty, and learners with a single, robust, secure, and integrated system that improves the learning experience.

- 72 -
PART V. EXHIBITS AND SCHEDULES Item 14. Exhibits and Reports on SEC Form 17-C (a) Reports on SEC Form 17-C
Refer to Exhibit 3 for the reports filed during the year to the date of filing the SEC Form 17-A.
(b) Exhibits
1 Schedule of Bank/Branch Sites Owned by the Bank 2 Schedule of Bank/Branch Sites Under Lease Agreements 3 SEC Form 17-C 4 Statement of Management’s Responsibility 5 Audited Financial Statements as of December 31, 2021 and 2020
and for the Years Ended December 31, 2021, 2020 and 2019 and Independent Auditor’s Report
6 Independent Auditors’ Report on Supplementary Schedules 7 Independent Auditors’ Report on Components of Financial
Soundness Indicators 8 Index to the Financial Statements and Supplementary Schedules
Annex 1 • Reconciliation of retained earnings available for
dividend declaration
Annex 2
• Map showing the relationships between and among the company and its ultimate parent company, middle parent, subsidiaries or co-subsidiaries, and associates, wherever located or registered
Annex 3 • Supplementary schedules as required by Revised SRC
Rule 68 - Annex 68- J Annex 4 • Schedule of financial soundness indicators
9 Sustainability Report 10 List of Stockholders as of March 1, 2022
- 73 -
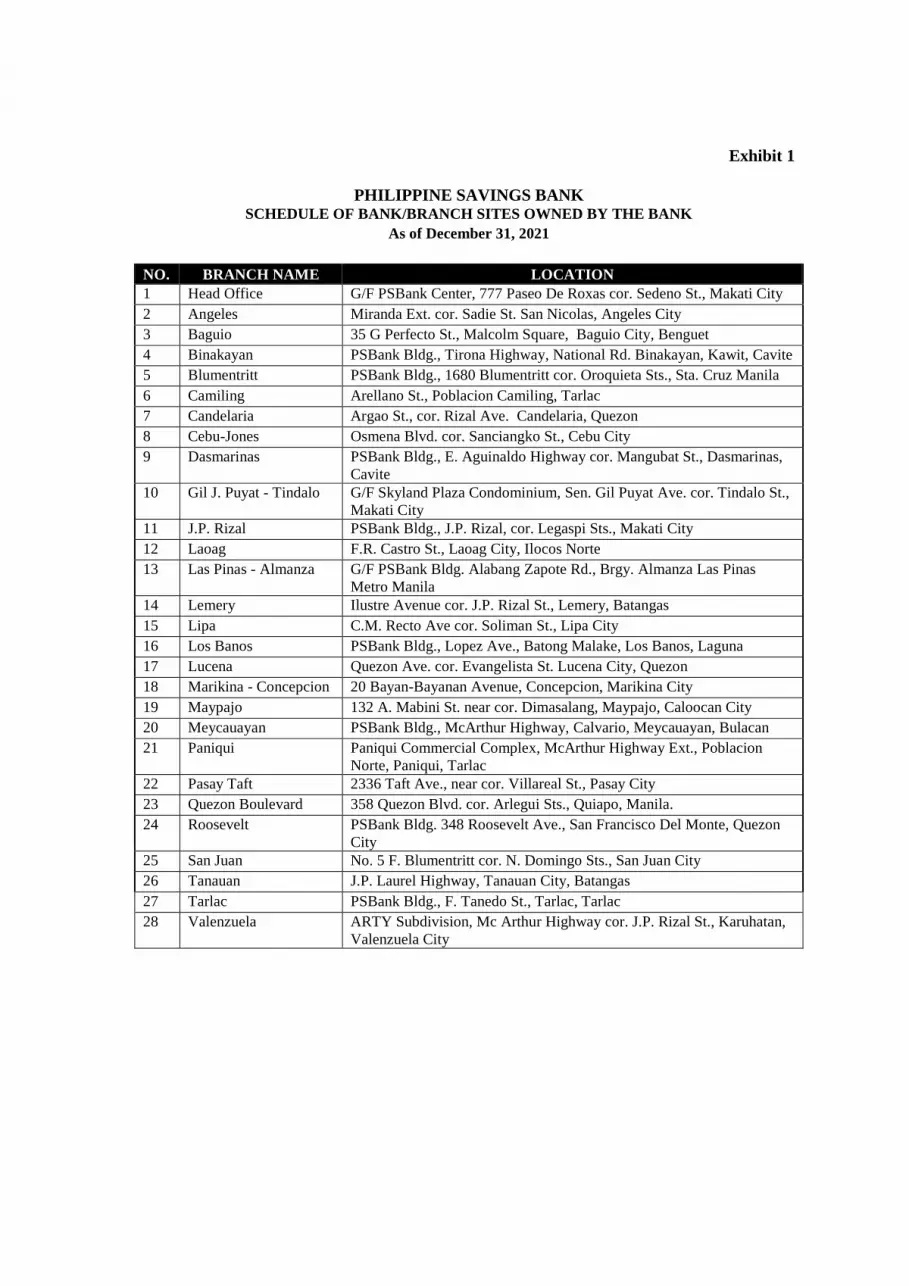
Exhibit 1
PHILIPPINE SAVINGS BANK SCHEDULE OF BANK/BRANCH SITES OWNED BY THE BANK
As of December 31, 2021
NO. BRANCH NAME LOCATION 1 Head Office G/F PSBank Center, 777 Paseo De Roxas cor. Sedeno St., Makati City 2 Angeles Miranda Ext. cor. Sadie St. San Nicolas, Angeles City 3 Baguio 35 G Perfecto St., Malcolm Square, Baguio City, Benguet 4 Binakayan PSBank Bldg., Tirona Highway, National Rd. Binakayan, Kawit, Cavite 5 Blumentritt PSBank Bldg., 1680 Blumentritt cor. Oroquieta Sts., Sta. Cruz Manila 6 Camiling Arellano St., Poblacion Camiling, Tarlac 7 Candelaria Argao St., cor. Rizal Ave. Candelaria, Quezon 8 Cebu-Jones Osmena Blvd. cor. Sanciangko St., Cebu City 9 Dasmarinas PSBank Bldg., E. Aguinaldo Highway cor. Mangubat St., Dasmarinas,
Cavite 10 Gil J. Puyat - Tindalo G/F Skyland Plaza Condominium, Sen. Gil Puyat Ave. cor. Tindalo St.,
Makati City 11 J.P. Rizal PSBank Bldg., J.P. Rizal, cor. Legaspi Sts., Makati City 12 Laoag F.R. Castro St., Laoag City, Ilocos Norte 13 Las Pinas - Almanza G/F PSBank Bldg. Alabang Zapote Rd., Brgy. Almanza Las Pinas
Metro Manila 14 Lemery Ilustre Avenue cor. J.P. Rizal St., Lemery, Batangas 15 Lipa C.M. Recto Ave cor. Soliman St., Lipa City 16 Los Banos PSBank Bldg., Lopez Ave., Batong Malake, Los Banos, Laguna 17 Lucena Quezon Ave. cor. Evangelista St. Lucena City, Quezon 18 Marikina - Concepcion 20 Bayan-Bayanan Avenue, Concepcion, Marikina City 19 Maypajo 132 A. Mabini St. near cor. Dimasalang, Maypajo, Caloocan City 20 Meycauayan PSBank Bldg., McArthur Highway, Calvario, Meycauayan, Bulacan 21 Paniqui Paniqui Commercial Complex, McArthur Highway Ext., Poblacion
Norte, Paniqui, Tarlac 22 Pasay Taft 2336 Taft Ave., near cor. Villareal St., Pasay City 23 Quezon Boulevard 358 Quezon Blvd. cor. Arlegui Sts., Quiapo, Manila. 24 Roosevelt PSBank Bldg. 348 Roosevelt Ave., San Francisco Del Monte, Quezon
City 25 San Juan No. 5 F. Blumentritt cor. N. Domingo Sts., San Juan City 26 Tanauan J.P. Laurel Highway, Tanauan City, Batangas 27 Tarlac PSBank Bldg., F. Tanedo St., Tarlac, Tarlac 28 Valenzuela ARTY Subdivision, Mc Arthur Highway cor. J.P. Rizal St., Karuhatan,
Valenzuela City
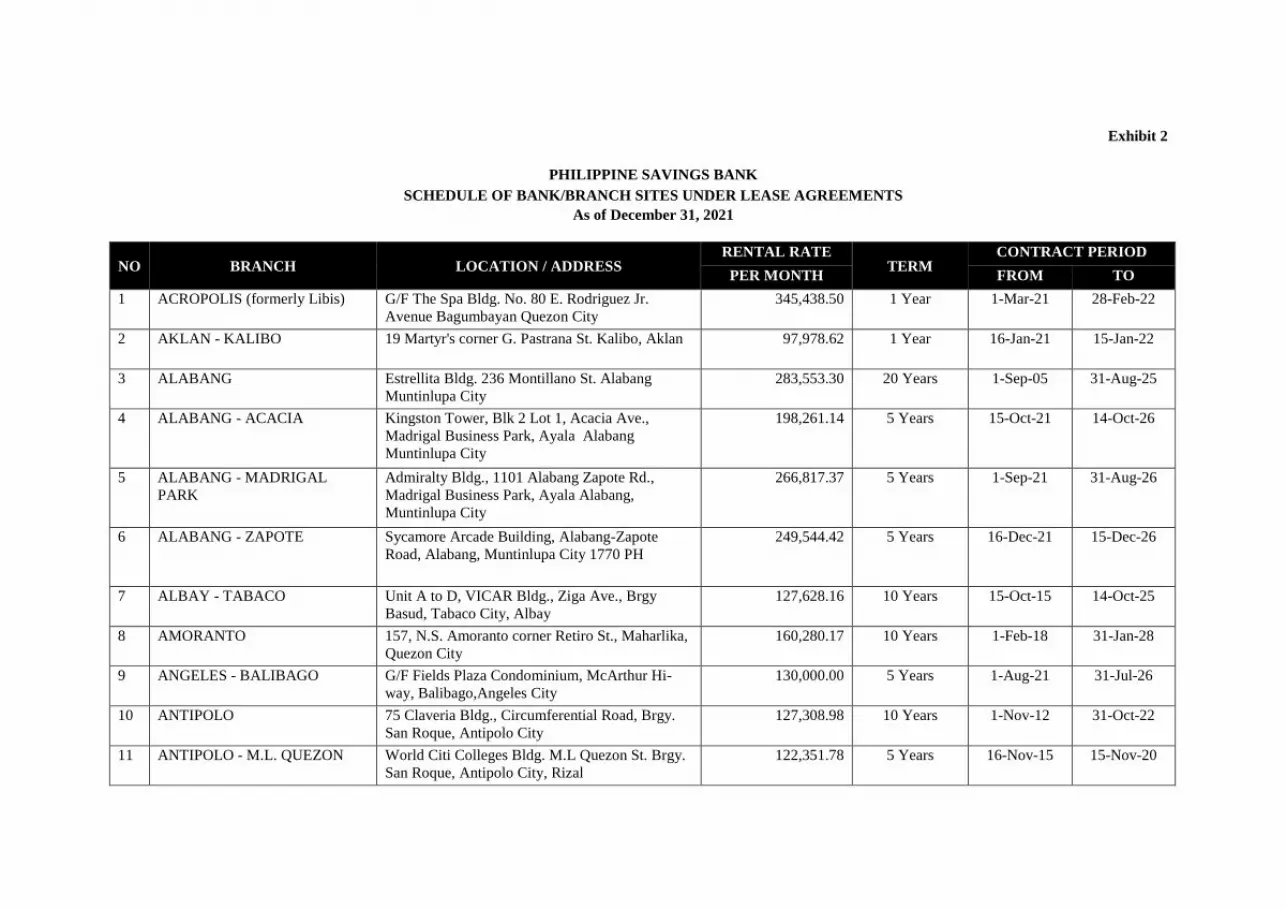
Exhibit 2
PHILIPPINE SAVINGS BANK
SCHEDULE OF BANK/BRANCH SITES UNDER LEASE AGREEMENT S As of December 31, 2021
NO BRANCH LOCATION / ADDRESS RENTAL RATE
TERM CONTRACT PERIOD
PER MONTH FROM TO
1 ACROPOLIS (formerly Libis) G/F The Spa Bldg. No. 80 E. Rodriguez Jr. Avenue Bagumbayan Quezon City
345,438.50 1 Year 1-Mar-21 28-Feb-22
2 AKLAN - KALIBO 19 Martyr's corner G. Pastrana St. Kalibo, Aklan 97,978.62 1 Year 16-Jan-21 15-Jan-22
3 ALABANG Estrellita Bldg. 236 Montillano St. Alabang Muntinlupa City
283,553.30 20 Years 1-Sep-05 31-Aug-25
4 ALABANG - ACACIA Kingston Tower, Blk 2 Lot 1, Acacia Ave., Madrigal Business Park, Ayala Alabang Muntinlupa City
198,261.14 5 Years 15-Oct-21 14-Oct-26
5 ALABANG - MADRIGAL PARK
Admiralty Bldg., 1101 Alabang Zapote Rd., Madrigal Business Park, Ayala Alabang, Muntinlupa City
266,817.37 5 Years 1-Sep-21 31-Aug-26
6 ALABANG - ZAPOTE Sycamore Arcade Building, Alabang-Zapote Road, Alabang, Muntinlupa City 1770 PH
249,544.42 5 Years 16-Dec-21 15-Dec-26
7 ALBAY - TABACO Unit A to D, VICAR Bldg., Ziga Ave., Brgy Basud, Tabaco City, Albay
127,628.16 10 Years 15-Oct-15 14-Oct-25
8 AMORANTO 157, N.S. Amoranto corner Retiro St., Maharlika, Quezon City
160,280.17 10 Years 1-Feb-18 31-Jan-28
9 ANGELES - BALIBAGO G/F Fields Plaza Condominium, McArthur Hi-way, Balibago,Angeles City
130,000.00 5 Years 1-Aug-21 31-Jul-26
10 ANTIPOLO 75 Claveria Bldg., Circumferential Road, Brgy. San Roque, Antipolo City
127,308.98 10 Years 1-Nov-12 31-Oct-22
11 ANTIPOLO - M.L. QUEZON World Citi Colleges Bldg. M.L Quezon St. Brgy. San Roque, Antipolo City, Rizal
122,351.78 5 Years 16-Nov-15 15-Nov-20

NO BRANCH LOCATION / ADDRESS RENTAL RATE
TERM CONTRACT PERIOD
PER MONTH FROM TO
12 ANTIPOLO - MASINAG G/F Tripolee Bldg., Marcos Highway, Brgy. Mayamot, Antipolo City, Rizal
337,615.24 10 Years 1-Jul-11 30-Jun-21
13 ANTIQUE - SAN JOSE GF, D123C Bldng., Moscoso St. cor. Tobias Fornier St. San Jose De Buenavista, Antique
77,175.00 10 Years 1-Jun-14 31-May-24
14 ARNAIZ AVENUE 824 Ginbo Bldg., Arnaiz Ave., San Lorenzo, Makati City
186,187.78 10 Years 15-Jan-13 14-Jan-23
15 BACLARAN 2935 Bagvpi Trade Center, FB Harrison St., cor. Ortigas st., pasay city
200,471.00 6 Years 1-Jan-21 31-Dec-26
16 BACOLOD G/F A. Yu Bldg. Locsin St. (between Gonzaga and Luzurriga Sts. ) Bacolod City
118,795.90 5 Years 1-Jul-20 30-Jun-25
17 BACOLOD - NORTH DRIVE Del Rio 2 Building, BS Aquino Drive, Bacolod City (G/F Riverside Pharmacy Bldg., BS Aquino Drive, Bacolod City)
50,145.90 5 Years 16-Oct-19 15-Oct-24
18 BALANGA G/F SHP Building II, Don Manuel Banzon Avenue, Balanga, Bataan
118,165.33 20 Years 1-Oct-08 30-Sep-28
19 BALIC-BALIC PSBANK Bldg., G Tuazon Cor Calabash A, Balic Balic, Brgy. 549, Sampaloc, Metro Manila
255,315.79 3 Years 15-Nov-19 14-Nov-22
20 BALINTAWAK 1238 GO SOC Bldg. Edsa Balintawak Q.C. 157,931.13 5 Years 1-Sep-17 31-Aug-22
21 BANAWE 245 PPSTA BLDG 3, 245 Banawe Street, Quezon City.
94,342.88 5 Years 6-May-21 05-May-26
22 BATANGAS P. Burgos St., Brgy. 16, Batangas City, 125,199.57 5 Years 1-Dec-17 30-Nov-22
23 BATANGAS - BALAYAN GF, Commercial Bldg, Plaza Rizal St. corner Fe St., Balayan, Batangas
97,839.74 10 Years 15-Aug-14 14-Aug-24
24 BATANGAS - BAUAN Era Building, Kapitan Ponso St. corner Ylagan St. Poblacion IV, Bauan, Batangas
159,535.20 1 Year 1-Oct-21 1-Oct-22
25 BATANGAS - STO. TOMAS GF, New Bldg. Maharlika Hway, Brgy. San Antonio, Sto. Tomas, Batangas
141,652.80 10 Years 21-Jul-14 20-Jul-24
26 BENGUET - LA TRINIDAD GF, Ramon Bldng., JB-25 Km 4, Brgy. Pico, La Trinidad, Benguet
98,398.13 15 Years 1-Jul-14 30-Jun-29

NO BRANCH LOCATION / ADDRESS RENTAL RATE
TERM CONTRACT PERIOD
PER MONTH FROM TO
27 BF HOMES #11 President Ave.corner Elizalde St., BF Homes Paranaque City
300,102.43 5 Years 1-Sep-21 31-Aug-26
28 BF RESORT DRIVE #1 Alice Crisostomo cor. BF Resort Drive, BF Resort Village, Las Pinas City 1740
48,958.79 10 Years 1-Apr-14 31-Mar-24
29 BICUTAN #40 Doña Soledad Ave., Better Living Subd., Paranaque City 1711
224,471.72 3 Years 8-Oct-19 8-Oct-22
30 BINAN PSBank Bldg, A.Bonifacio St. Brgy Canlalay, Binan, Laguna
165,000.00 10 Years 1-Jan-20 31-Dec-29
31 BONI AVENUE 641 Cifra Bldg. Boni Avenue, Mandaluyong City 154,430.07 10 Years 8-Oct-13 7-Oct-23
32 BONI SERRANO (St. Ignatius) G/F PSMBFI Building, Boni Serrano Avenue, corner 1st and 2nd Streets, West Crame, San Juan City
79,561.08 5 Years 1-Jun-19 31-May-24
33 BONIFACIO GLOBAL CITY Unit 1 G/F Bonifacio Technology Center, 31st St cor. 2nd St Bonifacio Global City, Taguig
199,842.56 4 Years 15-Sep-17 31-Dec-21
34 BUKIDNON - MALAYBALAY Ramos Bldg, Fortich Street, Malaybalay City, Bukidnon 8700F
93,979.99 5 Years 1-Oct-20 30-Sep-25
35 BUKIDNON - VALENCIA G/F TAMAY LANG ARCADE, ALKUI NO ST. COR. MANUEL A. ROXAS ST., VALENCIA CITY BUKIDNON
118,013.40 5 Years 1-Jul-20 30-Jun-25
36 BULACAN - BALAGTAS BAGS building Mc Arthur Highway San Juan Balagtas Bulacan
127,628.16 15 Years 1-Oct-11 30-Sep-26
37 BULACAN - BALIUAG B.S. Aquino Ave. cor Lopez Jaena St. Bagong Nayon, Baliwag, Bulacan
71,135.96 15 Years 1-Aug-11 31-Jul-26
38 BULACAN - MARILAO GF, RCH Bldg., Mc Arthur Highway corner Magalang St., Brgy. Ibayo, Marilao, Bulacan
79,767.07 10 Years 1-Oct-14 30-Sep-24
39 BULACAN - PLARIDEL GF Javier Building, Pan Philippine Highway, Banga 1st, Plaridel Bulacan
124,663.55 10 Years 1-Mar-14 28-Feb-24
40 BULACAN - PULILAN Doña Remedios Trinidad Highway, Sto Cristo, Pulilan, Bulacan
91,922.96 12 Years 1-Dec-10 30-Nov-22

NO BRANCH LOCATION / ADDRESS RENTAL RATE
TERM CONTRACT PERIOD
PER MONTH FROM TO
41 BULACAN - SAN JOSE DEL MONTE
G/F FLB Building Provincial Road Brgy. Tungkong Mangga San Jose Del Monte Bulacan
128,184.03 10 Years 15-Nov-12 14-Nov-22
42 BUSTILLOS - LEGARDA GF, #415 EEC Bldg. J. Figueras St., Sampaloc, Manila
231,525.00 10 Years 31-Jul-15 30-Jul-25
43 BUTUAN J.C. Aquino Avenue corner Ochua Avenue, Butuan City, Agusan Del Norte
64,329.32 20 Years 1-Nov-08 31-Oct-28
44 CABANATUAN 782 – 784 Century Ent. Bldg., Melencio St. cor. Paco Roman St., Dimasalang, Cabanatuan City 3100
214,402.16 10 Years 1-Jan-12 31-Dec-21
45 CAGAYAN DE ORO BJS Building Don A Velez corner A. Mabini Sts. Cagayan de Oro, Misamis Oriental
135,130.33 5 Years 1-Apr-21 31-Mar-26
46 CAGAYAN DE ORO - LAPASAN
Unit 11-12, Puregold CDO, Claro M. Recto Ave., Lapasan, Cagayan de Oro City, Misamis Oriental
109,693.53 10 Years 4-Nov-15 3-Nov-25
47 CAINTA G/F Ortigas Royale Condominium, Ortigas Avenue Extension, Brgy. San Juan, Cainta, Rizal
198,107.60 1 Year 16-Sep-18 15-Sep-19
48 CAINTA - FELIX AVENUE Cainta Business Center Building, Felix Ave., cor Vista Verde Ext., Gate 2, Cainta, Rizal
130,802.27 5 Years 15-May-16 14-May-21
49 CALAMBA Ground Floor Andenson Building I, Parian, National Highway, Calamba City
121,459.25 10 Years 1-Jan-17 31-Dec-26
50 CALOOCAN - EDSA #382 Galauran Compound EDSA Caloocan City 147,586.77 5 Years 1-Sep-18 31-Aug-23
51 CALOOCAN - SAMSON ROAD G/F Erlinda Go Bldg. Samson Road corner Torres St. Caloocan City
171,407.97 10 Years 1-Sep-11 31-Aug-21
52 CAMARIN G/F Zabarte Town Center 588 Camarin Road, Kalookan City
155,587.06 11 Years 1-Jan-14 31-Dec-24
53 CAMARINES NORTE - DAET GF, New Bldng., F. Pimentel Ave. corner V. Basit St. Brgy. 8, Daet, Camarines Norte
92,610.00 10 Years 1-Jul-14 30-Jun-24
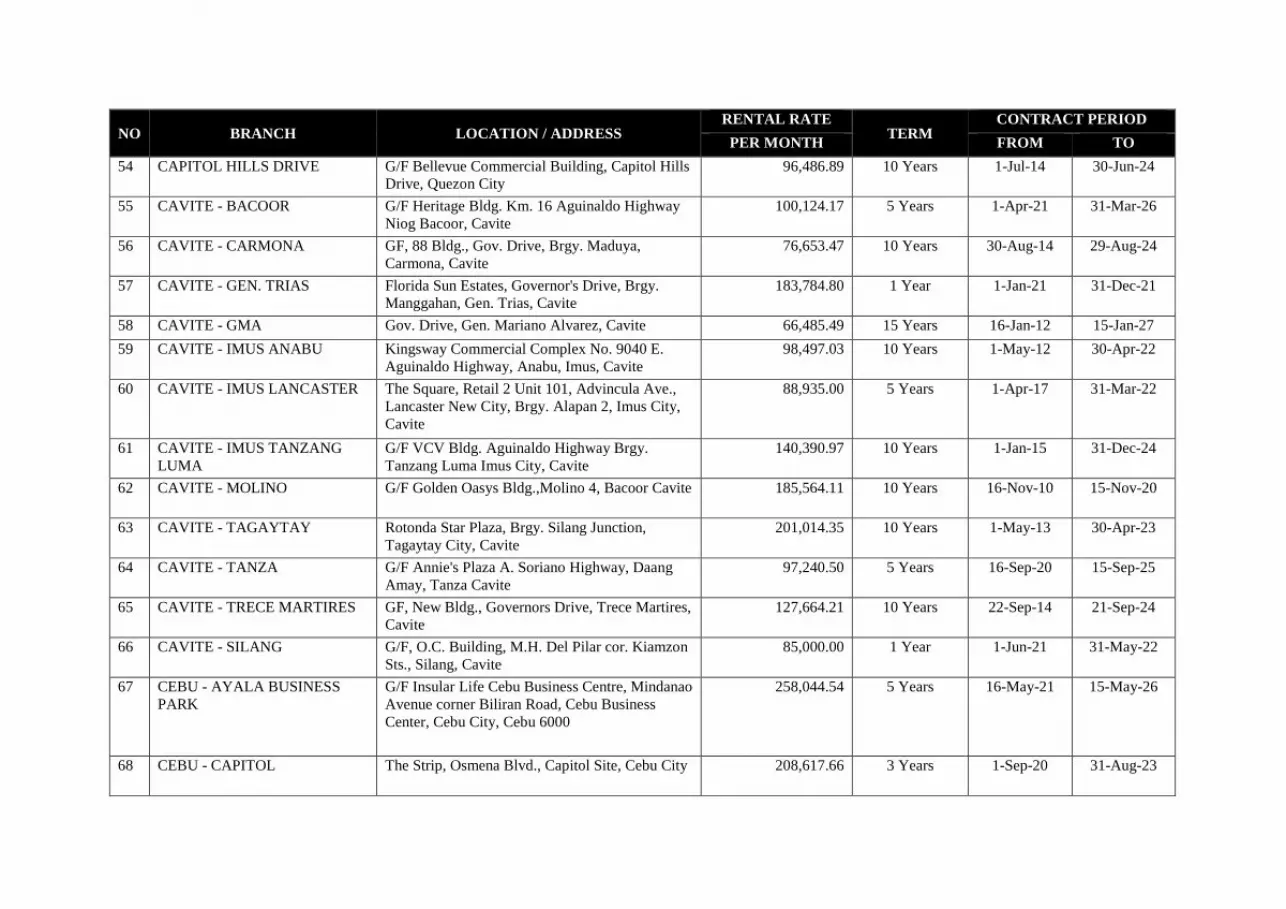
NO BRANCH LOCATION / ADDRESS RENTAL RATE
TERM CONTRACT PERIOD
PER MONTH FROM TO
54 CAPITOL HILLS DRIVE G/F Bellevue Commercial Building, Capitol Hills Drive, Quezon City
96,486.89 10 Years 1-Jul-14 30-Jun-24
55 CAVITE - BACOOR G/F Heritage Bldg. Km. 16 Aguinaldo Highway Niog Bacoor, Cavite
100,124.17 5 Years 1-Apr-21 31-Mar-26
56 CAVITE - CARMONA GF, 88 Bldg., Gov. Drive, Brgy. Maduya, Carmona, Cavite
76,653.47 10 Years 30-Aug-14 29-Aug-24
57 CAVITE - GEN. TRIAS Florida Sun Estates, Governor's Drive, Brgy. Manggahan, Gen. Trias, Cavite
183,784.80 1 Year 1-Jan-21 31-Dec-21
58 CAVITE - GMA Gov. Drive, Gen. Mariano Alvarez, Cavite 66,485.49 15 Years 16-Jan-12 15-Jan-27
59 CAVITE - IMUS ANABU Kingsway Commercial Complex No. 9040 E. Aguinaldo Highway, Anabu, Imus, Cavite
98,497.03 10 Years 1-May-12 30-Apr-22
60 CAVITE - IMUS LANCASTER The Square, Retail 2 Unit 101, Advincula Ave., Lancaster New City, Brgy. Alapan 2, Imus City, Cavite
88,935.00 5 Years 1-Apr-17 31-Mar-22
61 CAVITE - IMUS TANZANG LUMA
G/F VCV Bldg. Aguinaldo Highway Brgy. Tanzang Luma Imus City, Cavite
140,390.97 10 Years 1-Jan-15 31-Dec-24
62 CAVITE - MOLINO G/F Golden Oasys Bldg.,Molino 4, Bacoor Cavite 185,564.11 10 Years 16-Nov-10 15-Nov-20
63 CAVITE - TAGAYTAY Rotonda Star Plaza, Brgy. Silang Junction, Tagaytay City, Cavite
201,014.35 10 Years 1-May-13 30-Apr-23
64 CAVITE - TANZA G/F Annie's Plaza A. Soriano Highway, Daang Amay, Tanza Cavite
97,240.50 5 Years 16-Sep-20 15-Sep-25
65 CAVITE - TRECE MARTIRES GF, New Bldg., Governors Drive, Trece Martires, Cavite
127,664.21 10 Years 22-Sep-14 21-Sep-24
66 CAVITE - SILANG G/F, O.C. Building, M.H. Del Pilar cor. Kiamzon Sts., Silang, Cavite
85,000.00 1 Year 1-Jun-21 31-May-22
67 CEBU - AYALA BUSINESS PARK
G/F Insular Life Cebu Business Centre, Mindanao Avenue corner Biliran Road, Cebu Business Center, Cebu City, Cebu 6000
258,044.54 5 Years 16-May-21 15-May-26
68 CEBU - CAPITOL The Strip, Osmena Blvd., Capitol Site, Cebu City 208,617.66 3 Years 1-Sep-20 31-Aug-23
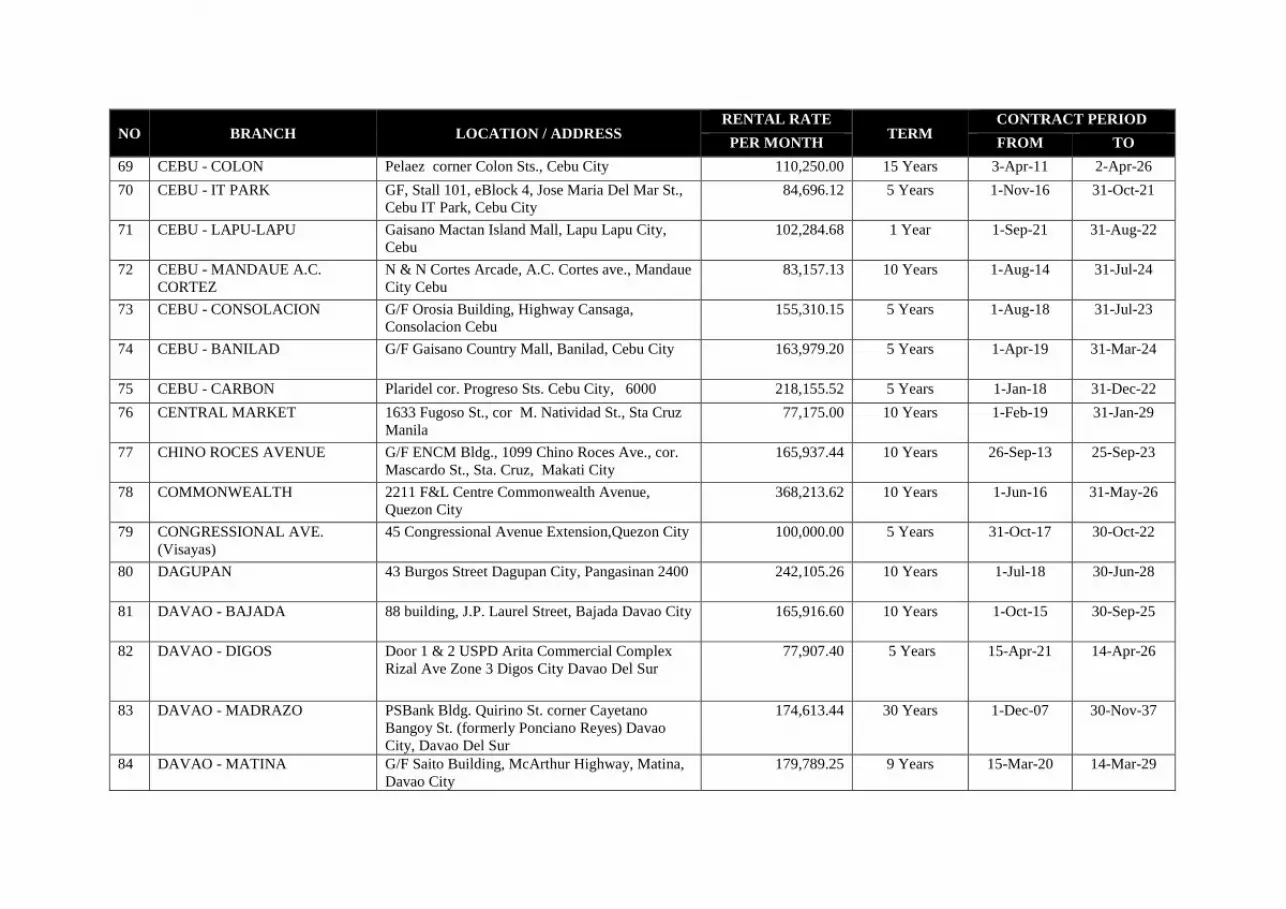
NO BRANCH LOCATION / ADDRESS RENTAL RATE
TERM CONTRACT PERIOD
PER MONTH FROM TO
69 CEBU - COLON Pelaez corner Colon Sts., Cebu City 110,250.00 15 Years 3-Apr-11 2-Apr-26
70 CEBU - IT PARK GF, Stall 101, eBlock 4, Jose Maria Del Mar St., Cebu IT Park, Cebu City
84,696.12 5 Years 1-Nov-16 31-Oct-21
71 CEBU - LAPU-LAPU Gaisano Mactan Island Mall, Lapu Lapu City, Cebu
102,284.68 1 Year 1-Sep-21 31-Aug-22
72 CEBU - MANDAUE A.C. CORTEZ
N & N Cortes Arcade, A.C. Cortes ave., Mandaue City Cebu
83,157.13 10 Years 1-Aug-14 31-Jul-24
73 CEBU - CONSOLACION G/F Orosia Building, Highway Cansaga, Consolacion Cebu
155,310.15 5 Years 1-Aug-18 31-Jul-23
74 CEBU - BANILAD G/F Gaisano Country Mall, Banilad, Cebu City 163,979.20 5 Years 1-Apr-19 31-Mar-24
75 CEBU - CARBON Plaridel cor. Progreso Sts. Cebu City, 6000 218,155.52 5 Years 1-Jan-18 31-Dec-22
76 CENTRAL MARKET 1633 Fugoso St., cor M. Natividad St., Sta Cruz Manila
77,175.00 10 Years 1-Feb-19 31-Jan-29
77 CHINO ROCES AVENUE G/F ENCM Bldg., 1099 Chino Roces Ave., cor. Mascardo St., Sta. Cruz, Makati City
165,937.44 10 Years 26-Sep-13 25-Sep-23
78 COMMONWEALTH 2211 F&L Centre Commonwealth Avenue, Quezon City
368,213.62 10 Years 1-Jun-16 31-May-26
79 CONGRESSIONAL AVE. (Visayas)
45 Congressional Avenue Extension,Quezon City 100,000.00 5 Years 31-Oct-17 30-Oct-22
80 DAGUPAN 43 Burgos Street Dagupan City, Pangasinan 2400 242,105.26 10 Years 1-Jul-18 30-Jun-28
81 DAVAO - BAJADA 88 building, J.P. Laurel Street, Bajada Davao City 165,916.60 10 Years 1-Oct-15 30-Sep-25
82 DAVAO - DIGOS Door 1 & 2 USPD Arita Commercial Complex Rizal Ave Zone 3 Digos City Davao Del Sur
77,907.40 5 Years 15-Apr-21 14-Apr-26
83 DAVAO - MADRAZO PSBank Bldg. Quirino St. corner Cayetano Bangoy St. (formerly Ponciano Reyes) Davao City, Davao Del Sur
174,613.44 30 Years 1-Dec-07 30-Nov-37
84 DAVAO - MATINA G/F Saito Building, McArthur Highway, Matina, Davao City
179,789.25 9 Years 15-Mar-20 14-Mar-29
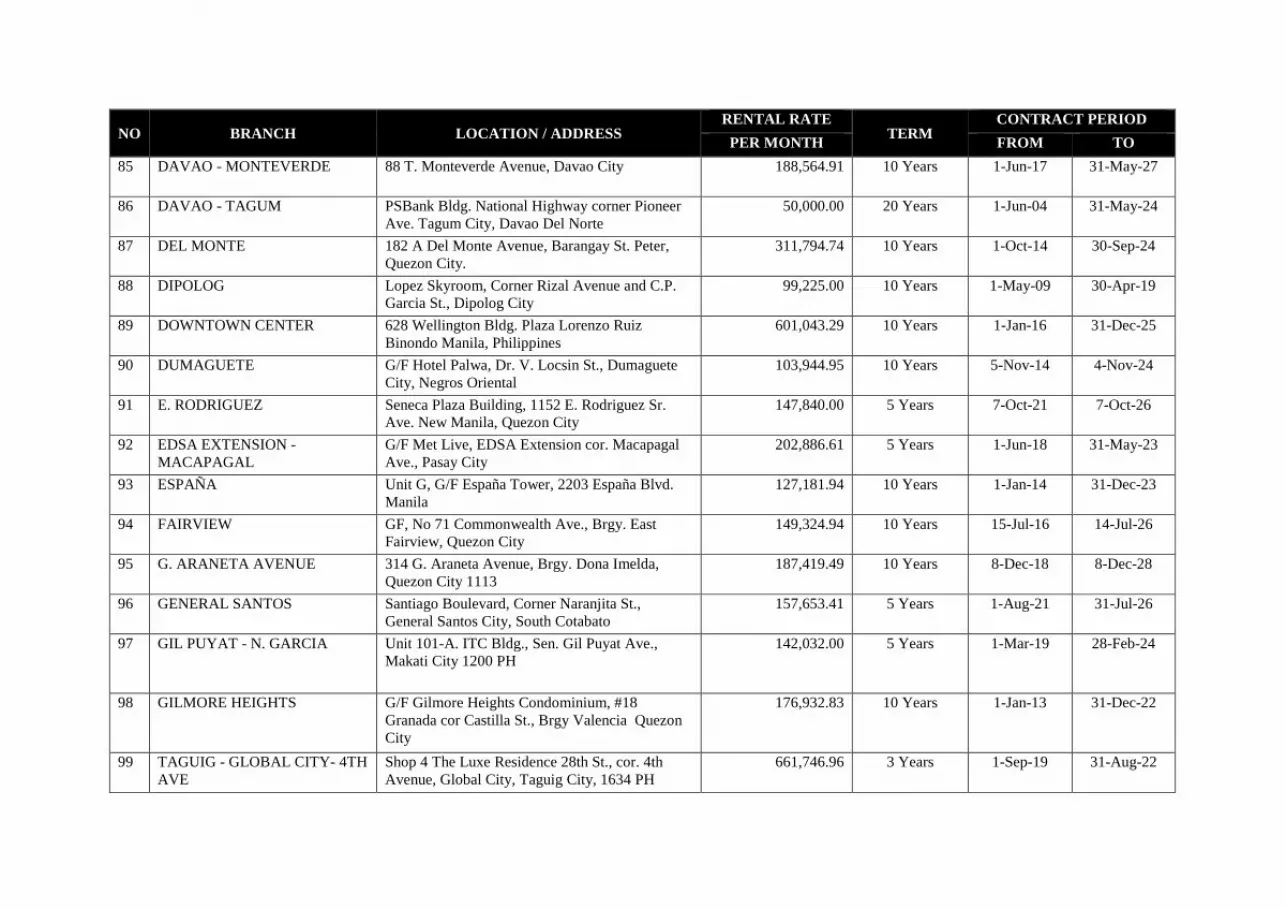
NO BRANCH LOCATION / ADDRESS RENTAL RATE
TERM CONTRACT PERIOD
PER MONTH FROM TO
85 DAVAO - MONTEVERDE 88 T. Monteverde Avenue, Davao City 188,564.91 10 Years 1-Jun-17 31-May-27
86 DAVAO - TAGUM PSBank Bldg. National Highway corner Pioneer Ave. Tagum City, Davao Del Norte
50,000.00 20 Years 1-Jun-04 31-May-24
87 DEL MONTE 182 A Del Monte Avenue, Barangay St. Peter, Quezon City.
311,794.74 10 Years 1-Oct-14 30-Sep-24
88 DIPOLOG Lopez Skyroom, Corner Rizal Avenue and C.P. Garcia St., Dipolog City
99,225.00 10 Years 1-May-09 30-Apr-19
89 DOWNTOWN CENTER 628 Wellington Bldg. Plaza Lorenzo Ruiz Binondo Manila, Philippines
601,043.29 10 Years 1-Jan-16 31-Dec-25
90 DUMAGUETE G/F Hotel Palwa, Dr. V. Locsin St., Dumaguete City, Negros Oriental
103,944.95 10 Years 5-Nov-14 4-Nov-24
91 E. RODRIGUEZ Seneca Plaza Building, 1152 E. Rodriguez Sr. Ave. New Manila, Quezon City
147,840.00 5 Years 7-Oct-21 7-Oct-26
92 EDSA EXTENSION - MACAPAGAL
G/F Met Live, EDSA Extension cor. Macapagal Ave., Pasay City
202,886.61 5 Years 1-Jun-18 31-May-23
93 ESPAÑA Unit G, G/F España Tower, 2203 España Blvd. Manila
127,181.94 10 Years 1-Jan-14 31-Dec-23
94 FAIRVIEW GF, No 71 Commonwealth Ave., Brgy. East Fairview, Quezon City
149,324.94 10 Years 15-Jul-16 14-Jul-26
95 G. ARANETA AVENUE 314 G. Araneta Avenue, Brgy. Dona Imelda, Quezon City 1113
187,419.49 10 Years 8-Dec-18 8-Dec-28
96 GENERAL SANTOS Santiago Boulevard, Corner Naranjita St., General Santos City, South Cotabato
157,653.41 5 Years 1-Aug-21 31-Jul-26
97 GIL PUYAT - N. GARCIA Unit 101-A. ITC Bldg., Sen. Gil Puyat Ave., Makati City 1200 PH
142,032.00 5 Years 1-Mar-19 28-Feb-24
98 GILMORE HEIGHTS G/F Gilmore Heights Condominium, #18 Granada cor Castilla St., Brgy Valencia Quezon City
176,932.83 10 Years 1-Jan-13 31-Dec-22
99 TAGUIG - GLOBAL CITY- 4TH AVE
Shop 4 The Luxe Residence 28th St., cor. 4th Avenue, Global City, Taguig City, 1634 PH
661,746.96 3 Years 1-Sep-19 31-Aug-22
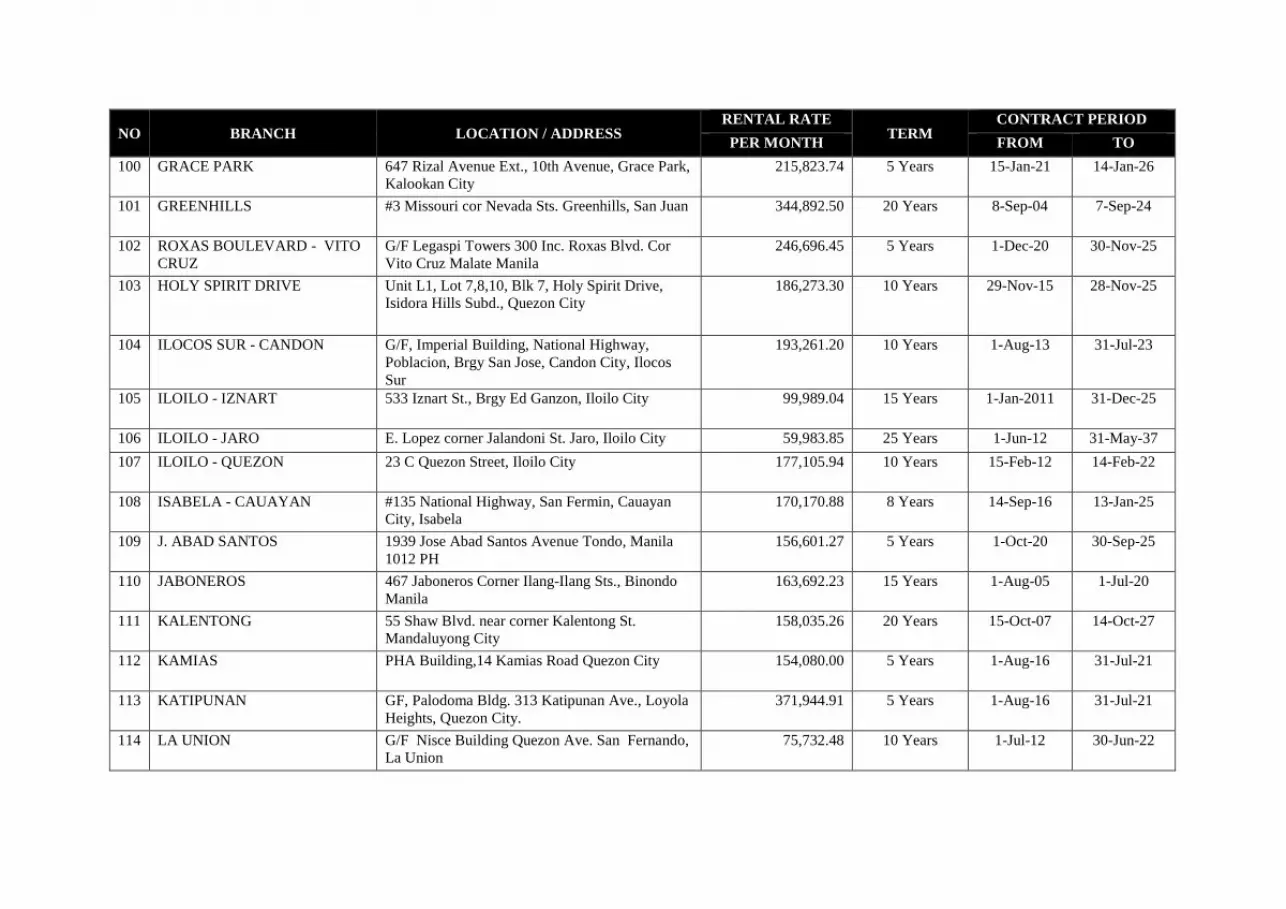
NO BRANCH LOCATION / ADDRESS RENTAL RATE
TERM CONTRACT PERIOD
PER MONTH FROM TO
100 GRACE PARK 647 Rizal Avenue Ext., 10th Avenue, Grace Park, Kalookan City
215,823.74 5 Years 15-Jan-21 14-Jan-26
101 GREENHILLS #3 Missouri cor Nevada Sts. Greenhills, San Juan 344,892.50 20 Years 8-Sep-04 7-Sep-24
102 ROXAS BOULEVARD - VITO CRUZ
G/F Legaspi Towers 300 Inc. Roxas Blvd. Cor Vito Cruz Malate Manila
246,696.45 5 Years 1-Dec-20 30-Nov-25
103 HOLY SPIRIT DRIVE Unit L1, Lot 7,8,10, Blk 7, Holy Spirit Drive, Isidora Hills Subd., Quezon City
186,273.30 10 Years 29-Nov-15 28-Nov-25
104 ILOCOS SUR - CANDON G/F, Imperial Building, National Highway, Poblacion, Brgy San Jose, Candon City, Ilocos Sur
193,261.20 10 Years 1-Aug-13 31-Jul-23
105 ILOILO - IZNART 533 Iznart St., Brgy Ed Ganzon, Iloilo City 99,989.04 15 Years 1-Jan-2011 31-Dec-25
106 ILOILO - JARO E. Lopez corner Jalandoni St. Jaro, Iloilo City 59,983.85 25 Years 1-Jun-12 31-May-37
107 ILOILO - QUEZON 23 C Quezon Street, Iloilo City 177,105.94 10 Years 15-Feb-12 14-Feb-22
108 ISABELA - CAUAYAN #135 National Highway, San Fermin, Cauayan City, Isabela
170,170.88 8 Years 14-Sep-16 13-Jan-25
109 J. ABAD SANTOS 1939 Jose Abad Santos Avenue Tondo, Manila 1012 PH
156,601.27 5 Years 1-Oct-20 30-Sep-25
110 JABONEROS 467 Jaboneros Corner Ilang-Ilang Sts., Binondo Manila
163,692.23 15 Years 1-Aug-05 1-Jul-20
111 KALENTONG 55 Shaw Blvd. near corner Kalentong St. Mandaluyong City
158,035.26 20 Years 15-Oct-07 14-Oct-27
112 KAMIAS PHA Building,14 Kamias Road Quezon City 154,080.00 5 Years 1-Aug-16 31-Jul-21
113 KATIPUNAN GF, Palodoma Bldg. 313 Katipunan Ave., Loyola Heights, Quezon City.
371,944.91 5 Years 1-Aug-16 31-Jul-21
114 LA UNION G/F Nisce Building Quezon Ave. San Fernando, La Union
75,732.48 10 Years 1-Jul-12 30-Jun-22
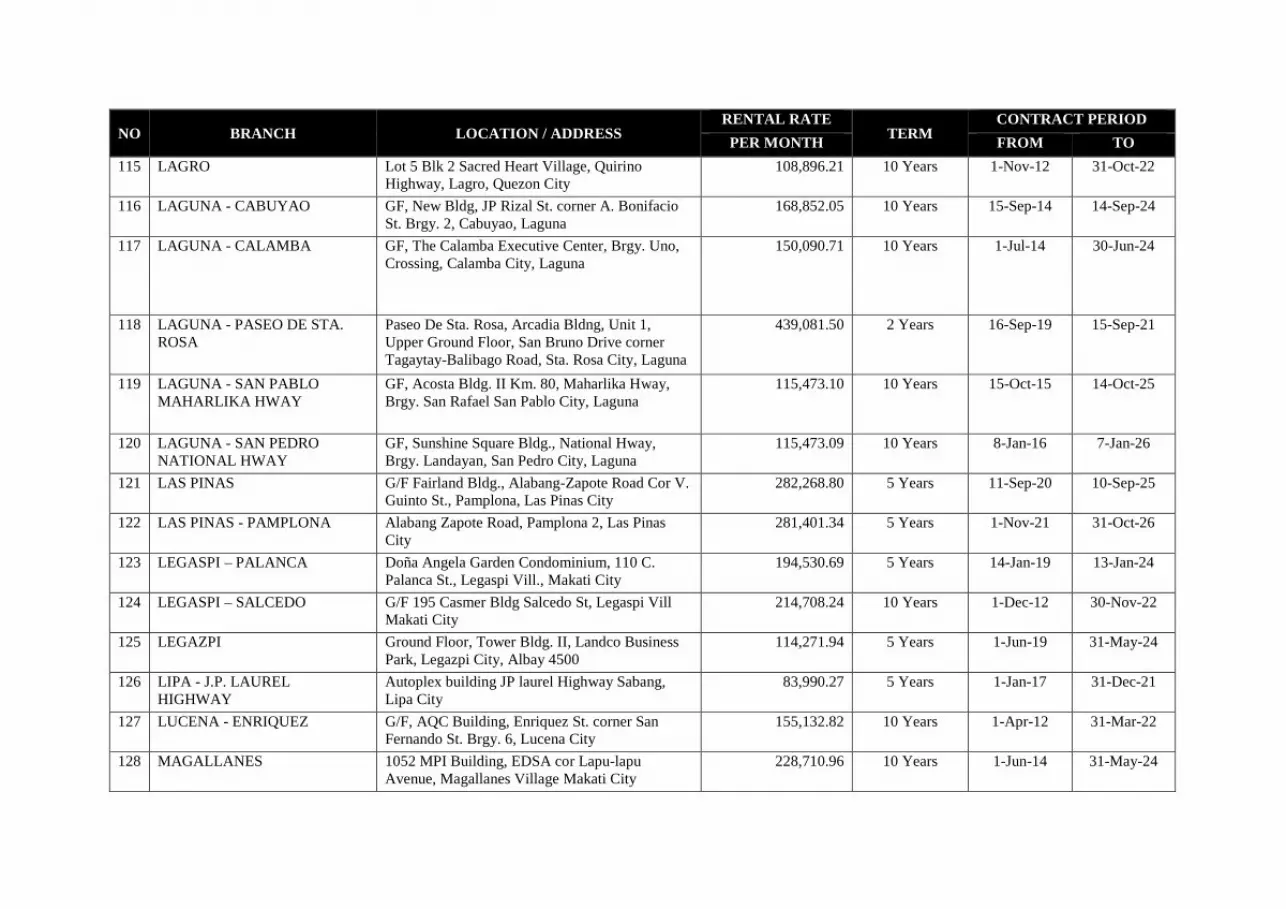
NO BRANCH LOCATION / ADDRESS RENTAL RATE
TERM CONTRACT PERIOD
PER MONTH FROM TO
115 LAGRO Lot 5 Blk 2 Sacred Heart Village, Quirino Highway, Lagro, Quezon City
108,896.21 10 Years 1-Nov-12 31-Oct-22
116 LAGUNA - CABUYAO GF, New Bldg, JP Rizal St. corner A. Bonifacio St. Brgy. 2, Cabuyao, Laguna
168,852.05 10 Years 15-Sep-14 14-Sep-24
117 LAGUNA - CALAMBA GF, The Calamba Executive Center, Brgy. Uno, Crossing, Calamba City, Laguna
150,090.71 10 Years 1-Jul-14 30-Jun-24
118 LAGUNA - PASEO DE STA. ROSA
Paseo De Sta. Rosa, Arcadia Bldng, Unit 1, Upper Ground Floor, San Bruno Drive corner Tagaytay-Balibago Road, Sta. Rosa City, Laguna
439,081.50 2 Years 16-Sep-19 15-Sep-21
119 LAGUNA - SAN PABLO MAHARLIKA HWAY
GF, Acosta Bldg. II Km. 80, Maharlika Hway, Brgy. San Rafael San Pablo City, Laguna
115,473.10 10 Years 15-Oct-15 14-Oct-25
120 LAGUNA - SAN PEDRO NATIONAL HWAY
GF, Sunshine Square Bldg., National Hway, Brgy. Landayan, San Pedro City, Laguna
115,473.09 10 Years 8-Jan-16 7-Jan-26
121 LAS PINAS G/F Fairland Bldg., Alabang-Zapote Road Cor V. Guinto St., Pamplona, Las Pinas City
282,268.80 5 Years 11-Sep-20 10-Sep-25
122 LAS PINAS - PAMPLONA Alabang Zapote Road, Pamplona 2, Las Pinas City
281,401.34 5 Years 1-Nov-21 31-Oct-26
123 LEGASPI – PALANCA Doña Angela Garden Condominium, 110 C. Palanca St., Legaspi Vill., Makati City
194,530.69 5 Years 14-Jan-19 13-Jan-24
124 LEGASPI – SALCEDO G/F 195 Casmer Bldg Salcedo St, Legaspi Vill Makati City
214,708.24 10 Years 1-Dec-12 30-Nov-22
125 LEGAZPI Ground Floor, Tower Bldg. II, Landco Business Park, Legazpi City, Albay 4500
114,271.94 5 Years 1-Jun-19 31-May-24
126 LIPA - J.P. LAUREL HIGHWAY
Autoplex building JP laurel Highway Sabang, Lipa City
83,990.27 5 Years 1-Jan-17 31-Dec-21
127 LUCENA - ENRIQUEZ G/F, AQC Building, Enriquez St. corner San Fernando St. Brgy. 6, Lucena City
155,132.82 10 Years 1-Apr-12 31-Mar-22
128 MAGALLANES 1052 MPI Building, EDSA cor Lapu-lapu Avenue, Magallanes Village Makati City
228,710.96 10 Years 1-Jun-14 31-May-24
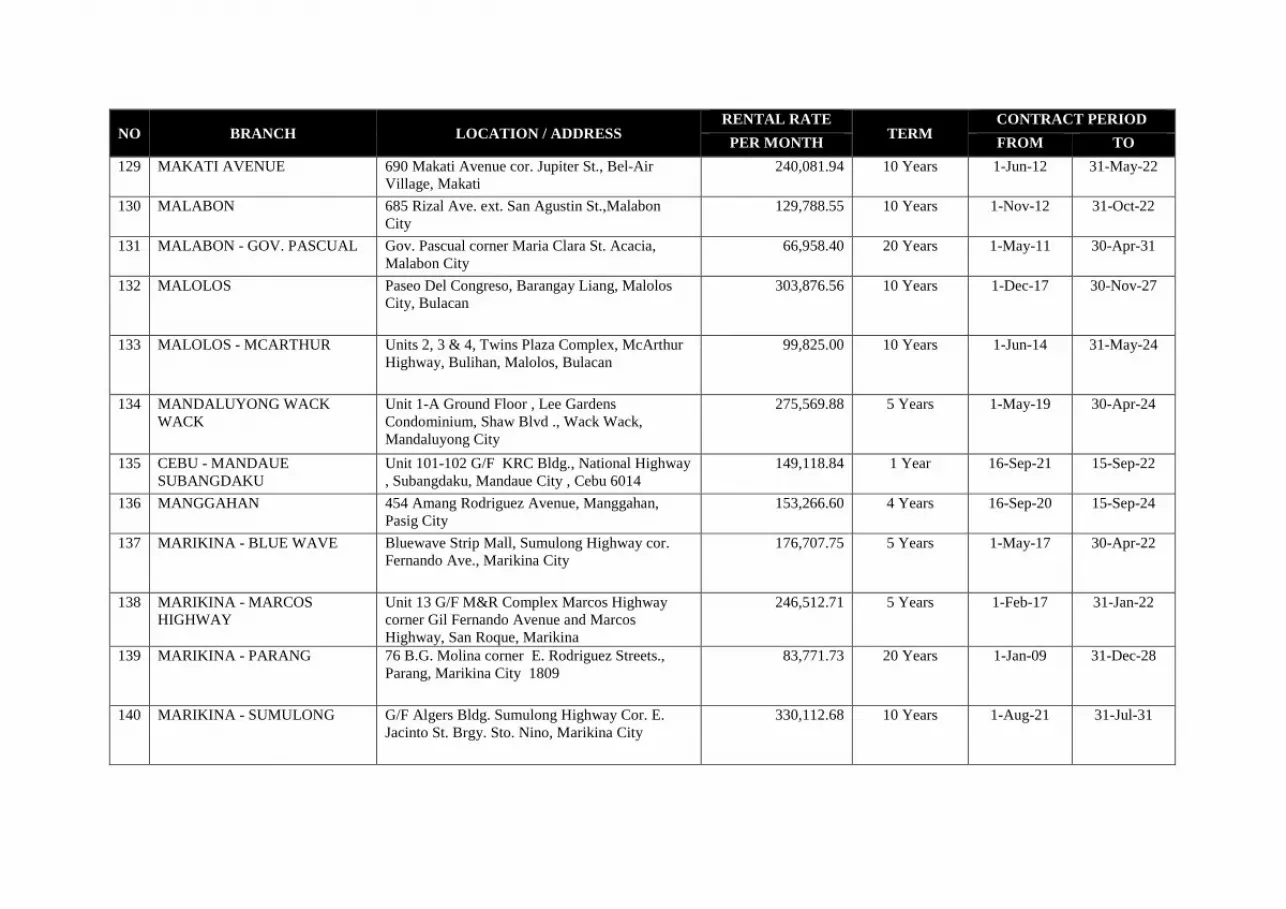
NO BRANCH LOCATION / ADDRESS RENTAL RATE
TERM CONTRACT PERIOD
PER MONTH FROM TO
129 MAKATI AVENUE 690 Makati Avenue cor. Jupiter St., Bel-Air Village, Makati
240,081.94 10 Years 1-Jun-12 31-May-22
130 MALABON 685 Rizal Ave. ext. San Agustin St.,Malabon City
129,788.55 10 Years 1-Nov-12 31-Oct-22
131 MALABON - GOV. PASCUAL Gov. Pascual corner Maria Clara St. Acacia, Malabon City
66,958.40 20 Years 1-May-11 30-Apr-31
132 MALOLOS Paseo Del Congreso, Barangay Liang, Malolos City, Bulacan
303,876.56 10 Years 1-Dec-17 30-Nov-27
133 MALOLOS - MCARTHUR Units 2, 3 & 4, Twins Plaza Complex, McArthur Highway, Bulihan, Malolos, Bulacan
99,825.00 10 Years 1-Jun-14 31-May-24
134 MANDALUYONG WACK WACK
Unit 1-A Ground Floor , Lee Gardens Condominium, Shaw Blvd ., Wack Wack, Mandaluyong City
275,569.88 5 Years 1-May-19 30-Apr-24
135 CEBU - MANDAUE SUBANGDAKU
Unit 101-102 G/F KRC Bldg., National Highway , Subangdaku, Mandaue City , Cebu 6014
149,118.84 1 Year 16-Sep-21 15-Sep-22
136 MANGGAHAN 454 Amang Rodriguez Avenue, Manggahan, Pasig City
153,266.60 4 Years 16-Sep-20 15-Sep-24
137 MARIKINA - BLUE WAVE Bluewave Strip Mall, Sumulong Highway cor. Fernando Ave., Marikina City
176,707.75 5 Years 1-May-17 30-Apr-22
138 MARIKINA - MARCOS HIGHWAY
Unit 13 G/F M&R Complex Marcos Highway corner Gil Fernando Avenue and Marcos Highway, San Roque, Marikina
246,512.71 5 Years 1-Feb-17 31-Jan-22
139 MARIKINA - PARANG 76 B.G. Molina corner E. Rodriguez Streets., Parang, Marikina City 1809
83,771.73 20 Years 1-Jan-09 31-Dec-28
140 MARIKINA - SUMULONG G/F Algers Bldg. Sumulong Highway Cor. E. Jacinto St. Brgy. Sto. Nino, Marikina City
330,112.68 10 Years 1-Aug-21 31-Jul-31
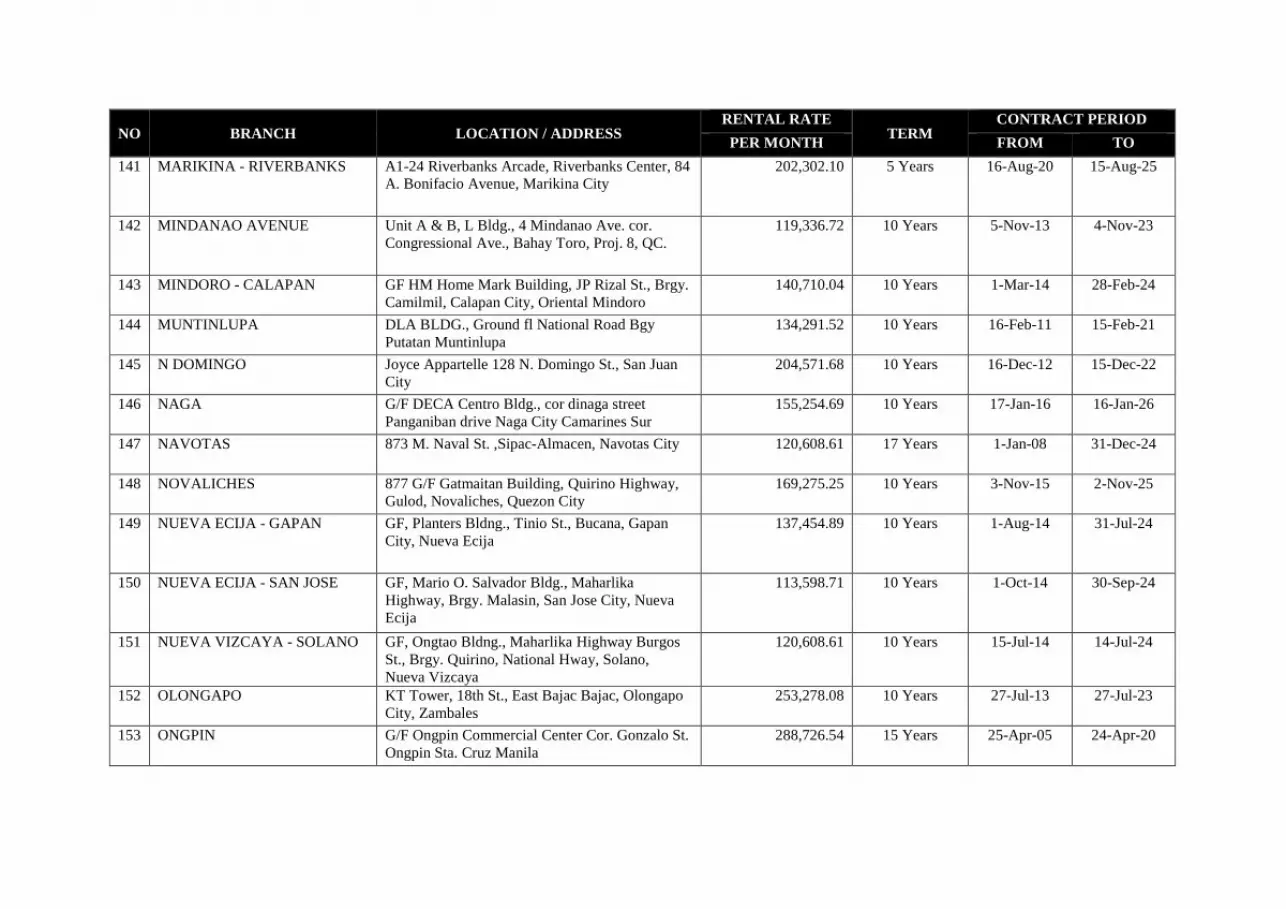
NO BRANCH LOCATION / ADDRESS RENTAL RATE
TERM CONTRACT PERIOD
PER MONTH FROM TO
141 MARIKINA - RIVERBANKS A1-24 Riverbanks Arcade, Riverbanks Center, 84 A. Bonifacio Avenue, Marikina City
202,302.10 5 Years 16-Aug-20 15-Aug-25
142 MINDANAO AVENUE Unit A & B, L Bldg., 4 Mindanao Ave. cor. Congressional Ave., Bahay Toro, Proj. 8, QC.
119,336.72 10 Years 5-Nov-13 4-Nov-23
143 MINDORO - CALAPAN GF HM Home Mark Building, JP Rizal St., Brgy. Camilmil, Calapan City, Oriental Mindoro
140,710.04 10 Years 1-Mar-14 28-Feb-24
144 MUNTINLUPA DLA BLDG., Ground fl National Road Bgy Putatan Muntinlupa
134,291.52 10 Years 16-Feb-11 15-Feb-21
145 N DOMINGO Joyce Appartelle 128 N. Domingo St., San Juan City
204,571.68 10 Years 16-Dec-12 15-Dec-22
146 NAGA G/F DECA Centro Bldg., cor dinaga street Panganiban drive Naga City Camarines Sur
155,254.69 10 Years 17-Jan-16 16-Jan-26
147 NAVOTAS 873 M. Naval St. ,Sipac-Almacen, Navotas City 120,608.61 17 Years 1-Jan-08 31-Dec-24
148 NOVALICHES 877 G/F Gatmaitan Building, Quirino Highway, Gulod, Novaliches, Quezon City
169,275.25 10 Years 3-Nov-15 2-Nov-25
149 NUEVA ECIJA - GAPAN GF, Planters Bldng., Tinio St., Bucana, Gapan City, Nueva Ecija
137,454.89 10 Years 1-Aug-14 31-Jul-24
150 NUEVA ECIJA - SAN JOSE GF, Mario O. Salvador Bldg., Maharlika Highway, Brgy. Malasin, San Jose City, Nueva Ecija
113,598.71 10 Years 1-Oct-14 30-Sep-24
151 NUEVA VIZCAYA - SOLANO GF, Ongtao Bldng., Maharlika Highway Burgos St., Brgy. Quirino, National Hway, Solano, Nueva Vizcaya
120,608.61 10 Years 15-Jul-14 14-Jul-24
152 OLONGAPO KT Tower, 18th St., East Bajac Bajac, Olongapo City, Zambales
253,278.08 10 Years 27-Jul-13 27-Jul-23
153 ONGPIN G/F Ongpin Commercial Center Cor. Gonzalo St. Ongpin Sta. Cruz Manila
288,726.54 15 Years 25-Apr-05 24-Apr-20
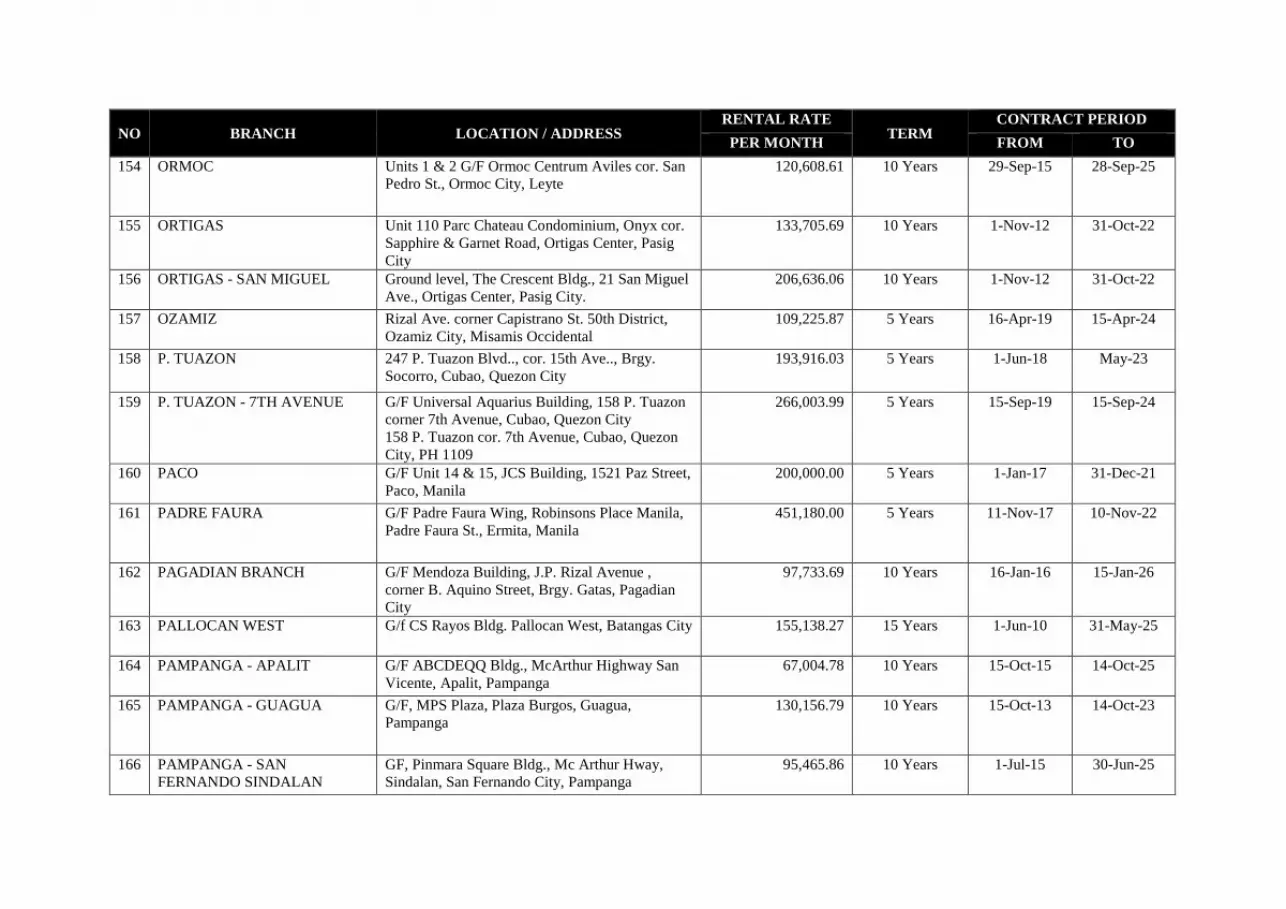
NO BRANCH LOCATION / ADDRESS RENTAL RATE
TERM CONTRACT PERIOD
PER MONTH FROM TO
154 ORMOC Units 1 & 2 G/F Ormoc Centrum Aviles cor. San Pedro St., Ormoc City, Leyte
120,608.61 10 Years 29-Sep-15 28-Sep-25
155 ORTIGAS Unit 110 Parc Chateau Condominium, Onyx cor. Sapphire & Garnet Road, Ortigas Center, Pasig City
133,705.69 10 Years 1-Nov-12 31-Oct-22
156 ORTIGAS - SAN MIGUEL Ground level, The Crescent Bldg., 21 San Miguel Ave., Ortigas Center, Pasig City.
206,636.06 10 Years 1-Nov-12 31-Oct-22
157 OZAMIZ Rizal Ave. corner Capistrano St. 50th District, Ozamiz City, Misamis Occidental
109,225.87 5 Years 16-Apr-19 15-Apr-24
158 P. TUAZON 247 P. Tuazon Blvd.., cor. 15th Ave.., Brgy. Socorro, Cubao, Quezon City
193,916.03 5 Years 1-Jun-18 May-23
159 P. TUAZON - 7TH AVENUE G/F Universal Aquarius Building, 158 P. Tuazon corner 7th Avenue, Cubao, Quezon City 158 P. Tuazon cor. 7th Avenue, Cubao, Quezon City, PH 1109
266,003.99 5 Years 15-Sep-19 15-Sep-24
160 PACO G/F Unit 14 & 15, JCS Building, 1521 Paz Street, Paco, Manila
200,000.00 5 Years 1-Jan-17 31-Dec-21
161 PADRE FAURA G/F Padre Faura Wing, Robinsons Place Manila, Padre Faura St., Ermita, Manila
451,180.00 5 Years 11-Nov-17 10-Nov-22
162 PAGADIAN BRANCH G/F Mendoza Building, J.P. Rizal Avenue , corner B. Aquino Street, Brgy. Gatas, Pagadian City
97,733.69 10 Years 16-Jan-16 15-Jan-26
163 PALLOCAN WEST G/f CS Rayos Bldg. Pallocan West, Batangas City 155,138.27 15 Years 1-Jun-10 31-May-25
164 PAMPANGA - APALIT G/F ABCDEQQ Bldg., McArthur Highway San Vicente, Apalit, Pampanga
67,004.78 10 Years 15-Oct-15 14-Oct-25
165 PAMPANGA - GUAGUA G/F, MPS Plaza, Plaza Burgos, Guagua, Pampanga
130,156.79 10 Years 15-Oct-13 14-Oct-23
166 PAMPANGA - SAN FERNANDO SINDALAN
GF, Pinmara Square Bldg., Mc Arthur Hway, Sindalan, San Fernando City, Pampanga
95,465.86 10 Years 1-Jul-15 30-Jun-25
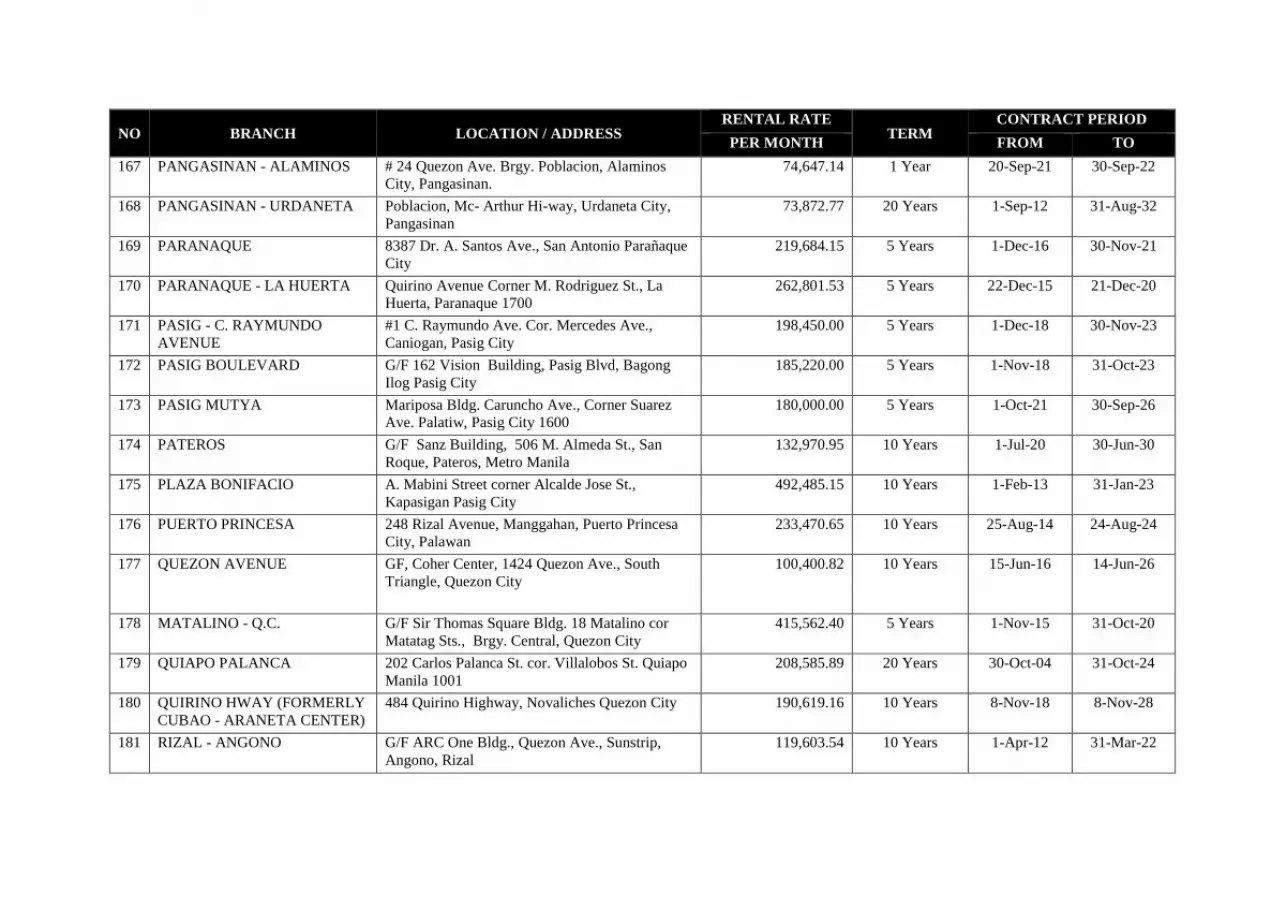
NO BRANCH LOCATION / ADDRESS RENTAL RATE
TERM CONTRACT PERIOD
PER MONTH FROM TO
167 PANGASINAN - ALAMINOS # 24 Quezon Ave. Brgy. Poblacion, Alaminos City, Pangasinan.
74,647.14 1 Year 20-Sep-21 30-Sep-22
168 PANGASINAN - URDANETA Poblacion, Mc- Arthur Hi-way, Urdaneta City, Pangasinan
73,872.77 20 Years 1-Sep-12 31-Aug-32
169 PARANAQUE 8387 Dr. A. Santos Ave., San Antonio Parañaque City
219,684.15 5 Years 1-Dec-16 30-Nov-21
170 PARANAQUE - LA HUERTA Quirino Avenue Corner M. Rodriguez St., La Huerta, Paranaque 1700
262,801.53 5 Years 22-Dec-15 21-Dec-20
171 PASIG - C. RAYMUNDO AVENUE
#1 C. Raymundo Ave. Cor. Mercedes Ave., Caniogan, Pasig City
198,450.00 5 Years 1-Dec-18 30-Nov-23
172 PASIG BOULEVARD G/F 162 Vision Building, Pasig Blvd, Bagong Ilog Pasig City
185,220.00 5 Years 1-Nov-18 31-Oct-23
173 PASIG MUTYA Mariposa Bldg. Caruncho Ave., Corner Suarez Ave. Palatiw, Pasig City 1600
180,000.00 5 Years 1-Oct-21 30-Sep-26
174 PATEROS G/F Sanz Building, 506 M. Almeda St., San Roque, Pateros, Metro Manila
132,970.95 10 Years 1-Jul-20 30-Jun-30
175 PLAZA BONIFACIO A. Mabini Street corner Alcalde Jose St., Kapasigan Pasig City
492,485.15 10 Years 1-Feb-13 31-Jan-23
176 PUERTO PRINCESA 248 Rizal Avenue, Manggahan, Puerto Princesa City, Palawan
233,470.65 10 Years 25-Aug-14 24-Aug-24
177 QUEZON AVENUE GF, Coher Center, 1424 Quezon Ave., South Triangle, Quezon City
100,400.82 10 Years 15-Jun-16 14-Jun-26
178 MATALINO - Q.C. G/F Sir Thomas Square Bldg. 18 Matalino cor Matatag Sts., Brgy. Central, Quezon City
415,562.40 5 Years 1-Nov-15 31-Oct-20
179 QUIAPO PALANCA 202 Carlos Palanca St. cor. Villalobos St. Quiapo Manila 1001
208,585.89 20 Years 30-Oct-04 31-Oct-24
180 QUIRINO HWAY (FORMERLY CUBAO - ARANETA CENTER)
484 Quirino Highway, Novaliches Quezon City 190,619.16 10 Years 8-Nov-18 8-Nov-28
181 RIZAL - ANGONO G/F ARC One Bldg., Quezon Ave., Sunstrip, Angono, Rizal
119,603.54 10 Years 1-Apr-12 31-Mar-22
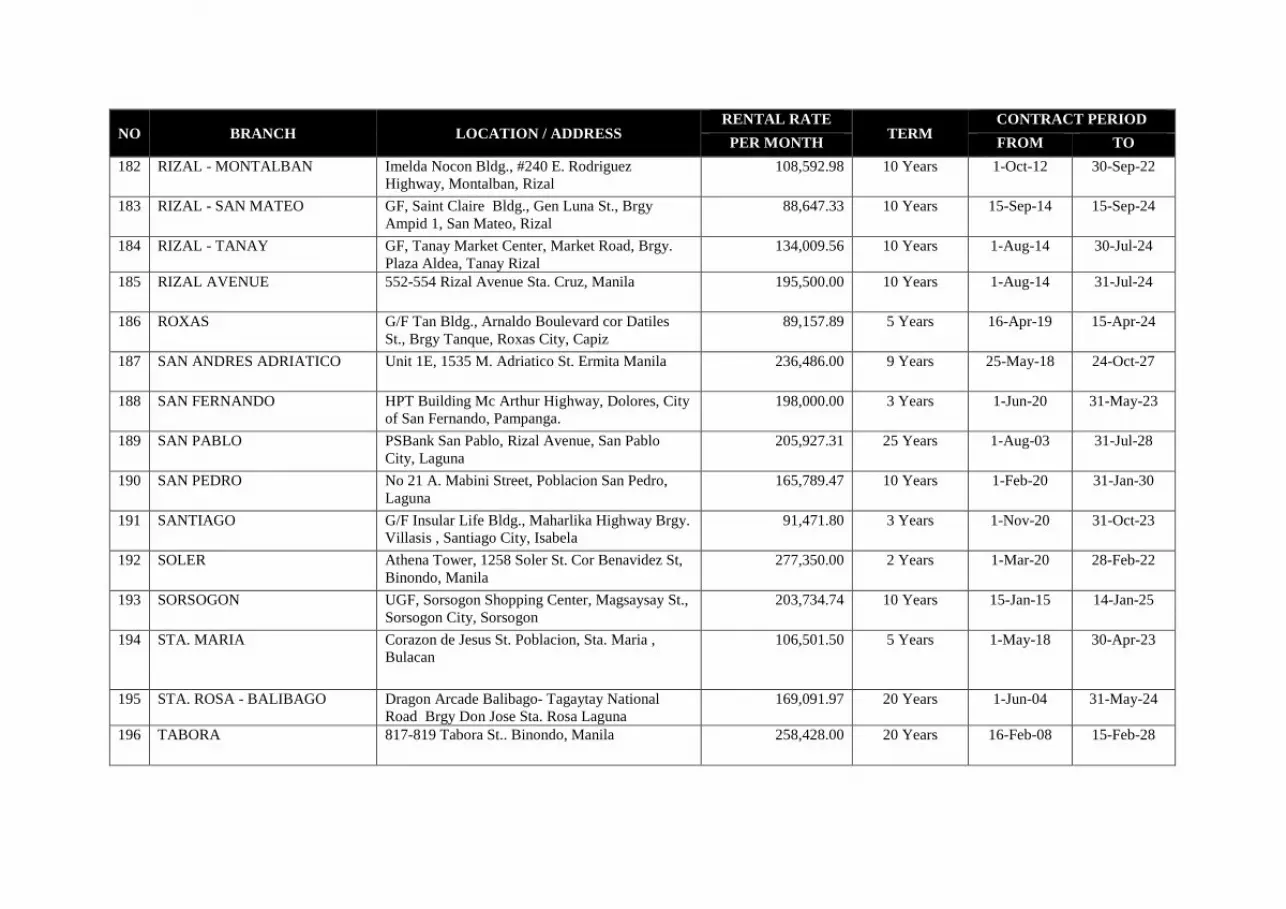
NO BRANCH LOCATION / ADDRESS RENTAL RATE
TERM CONTRACT PERIOD
PER MONTH FROM TO
182 RIZAL - MONTALBAN Imelda Nocon Bldg., #240 E. Rodriguez Highway, Montalban, Rizal
108,592.98 10 Years 1-Oct-12 30-Sep-22
183 RIZAL - SAN MATEO GF, Saint Claire Bldg., Gen Luna St., Brgy Ampid 1, San Mateo, Rizal
88,647.33 10 Years 15-Sep-14 15-Sep-24
184 RIZAL - TANAY GF, Tanay Market Center, Market Road, Brgy. Plaza Aldea, Tanay Rizal
134,009.56 10 Years 1-Aug-14 30-Jul-24
185 RIZAL AVENUE 552-554 Rizal Avenue Sta. Cruz, Manila 195,500.00 10 Years 1-Aug-14 31-Jul-24
186 ROXAS G/F Tan Bldg., Arnaldo Boulevard cor Datiles St., Brgy Tanque, Roxas City, Capiz
89,157.89 5 Years 16-Apr-19 15-Apr-24
187 SAN ANDRES ADRIATICO Unit 1E, 1535 M. Adriatico St. Ermita Manila 236,486.00 9 Years 25-May-18 24-Oct-27
188 SAN FERNANDO HPT Building Mc Arthur Highway, Dolores, City of San Fernando, Pampanga.
198,000.00 3 Years 1-Jun-20 31-May-23
189 SAN PABLO PSBank San Pablo, Rizal Avenue, San Pablo City, Laguna
205,927.31 25 Years 1-Aug-03 31-Jul-28
190 SAN PEDRO No 21 A. Mabini Street, Poblacion San Pedro, Laguna
165,789.47 10 Years 1-Feb-20 31-Jan-30
191 SANTIAGO G/F Insular Life Bldg., Maharlika Highway Brgy. Villasis , Santiago City, Isabela
91,471.80 3 Years 1-Nov-20 31-Oct-23
192 SOLER Athena Tower, 1258 Soler St. Cor Benavidez St, Binondo, Manila
277,350.00 2 Years 1-Mar-20 28-Feb-22
193 SORSOGON UGF, Sorsogon Shopping Center, Magsaysay St., Sorsogon City, Sorsogon
203,734.74 10 Years 15-Jan-15 14-Jan-25
194 STA. MARIA Corazon de Jesus St. Poblacion, Sta. Maria , Bulacan
106,501.50 5 Years 1-May-18 30-Apr-23
195 STA. ROSA - BALIBAGO Dragon Arcade Balibago- Tagaytay National Road Brgy Don Jose Sta. Rosa Laguna
169,091.97 20 Years 1-Jun-04 31-May-24
196 TABORA 817-819 Tabora St.. Binondo, Manila 258,428.00 20 Years 16-Feb-08 15-Feb-28
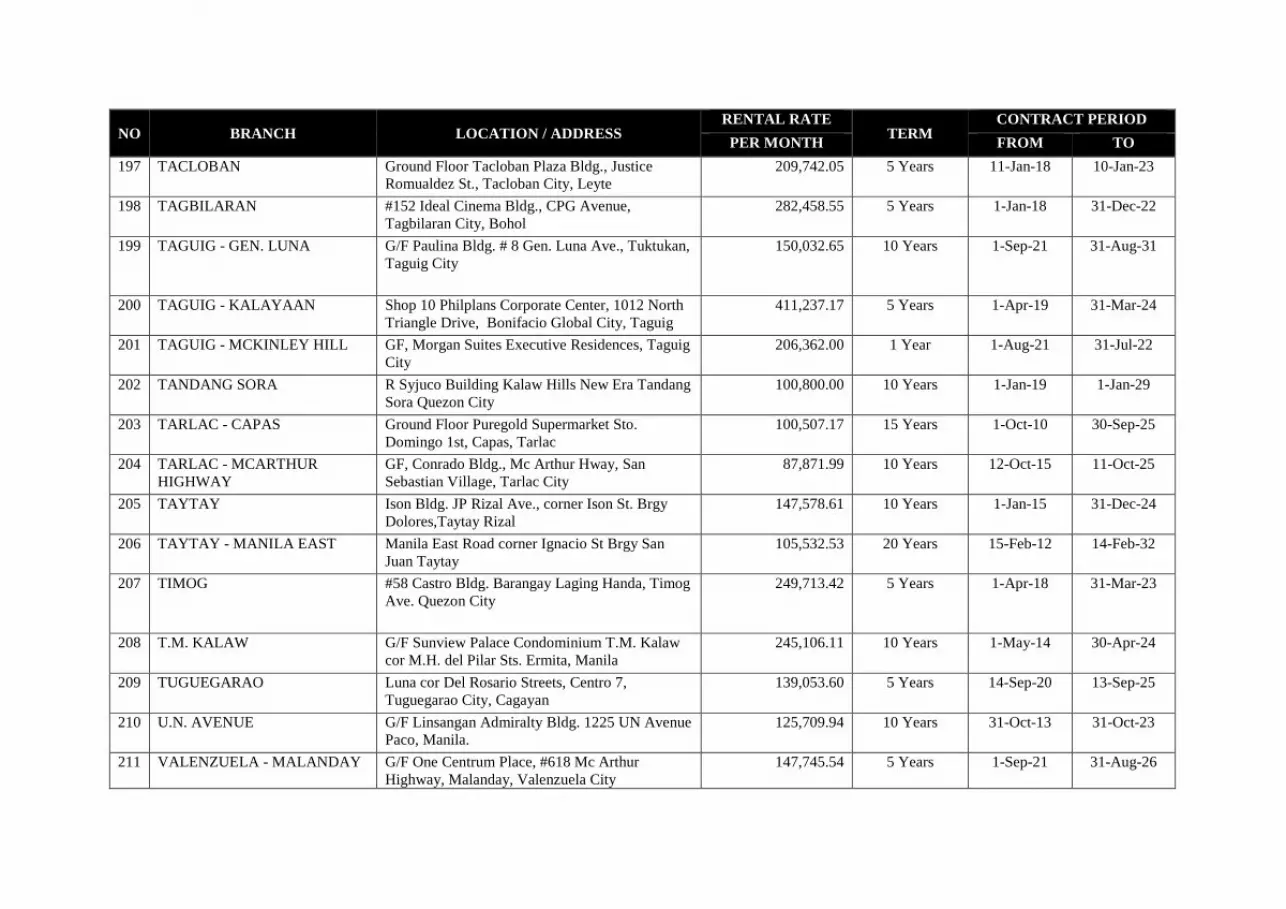
NO BRANCH LOCATION / ADDRESS RENTAL RATE
TERM CONTRACT PERIOD
PER MONTH FROM TO
197 TACLOBAN Ground Floor Tacloban Plaza Bldg., Justice Romualdez St., Tacloban City, Leyte
209,742.05 5 Years 11-Jan-18 10-Jan-23
198 TAGBILARAN #152 Ideal Cinema Bldg., CPG Avenue, Tagbilaran City, Bohol
282,458.55 5 Years 1-Jan-18 31-Dec-22
199 TAGUIG - GEN. LUNA G/F Paulina Bldg. # 8 Gen. Luna Ave., Tuktukan, Taguig City
150,032.65 10 Years 1-Sep-21 31-Aug-31
200 TAGUIG - KALAYAAN Shop 10 Philplans Corporate Center, 1012 North Triangle Drive, Bonifacio Global City, Taguig
411,237.17 5 Years 1-Apr-19 31-Mar-24
201 TAGUIG - MCKINLEY HILL GF, Morgan Suites Executive Residences, Taguig City
206,362.00 1 Year 1-Aug-21 31-Jul-22
202 TANDANG SORA R Syjuco Building Kalaw Hills New Era Tandang Sora Quezon City
100,800.00 10 Years 1-Jan-19 1-Jan-29
203 TARLAC - CAPAS Ground Floor Puregold Supermarket Sto. Domingo 1st, Capas, Tarlac
100,507.17 15 Years 1-Oct-10 30-Sep-25
204 TARLAC - MCARTHUR HIGHWAY
GF, Conrado Bldg., Mc Arthur Hway, San Sebastian Village, Tarlac City
87,871.99 10 Years 12-Oct-15 11-Oct-25
205 TAYTAY Ison Bldg. JP Rizal Ave., corner Ison St. Brgy Dolores,Taytay Rizal
147,578.61 10 Years 1-Jan-15 31-Dec-24
206 TAYTAY - MANILA EAST Manila East Road corner Ignacio St Brgy San Juan Taytay
105,532.53 20 Years 15-Feb-12 14-Feb-32
207 TIMOG #58 Castro Bldg. Barangay Laging Handa, Timog Ave. Quezon City
249,713.42 5 Years 1-Apr-18 31-Mar-23
208 T.M. KALAW G/F Sunview Palace Condominium T.M. Kalaw cor M.H. del Pilar Sts. Ermita, Manila
245,106.11 10 Years 1-May-14 30-Apr-24
209 TUGUEGARAO Luna cor Del Rosario Streets, Centro 7, Tuguegarao City, Cagayan
139,053.60 5 Years 14-Sep-20 13-Sep-25
210 U.N. AVENUE G/F Linsangan Admiralty Bldg. 1225 UN Avenue Paco, Manila.
125,709.94 10 Years 31-Oct-13 31-Oct-23
211 VALENZUELA - MALANDAY G/F One Centrum Place, #618 Mc Arthur Highway, Malanday, Valenzuela City
147,745.54 5 Years 1-Sep-21 31-Aug-26

NO BRANCH LOCATION / ADDRESS RENTAL RATE
TERM CONTRACT PERIOD
PER MONTH FROM TO
212 VALENZUELA - PASO DE BLAS
141 Paso De Blas St., Valenzuela City 79,695.36 20 Years 1-Jul-10 30-Jun-30
213 VIGAN G/F PM Prime Bldg. Florentino cor Jacinto St., Brgy 1, Vigan City, Ilocos Sur
179,834.17 5 Years 20-Jun-19 19-Jun-24
214 VITO CRUZ G/F Burgundy Westbay Tower, 820 Pablo Ocampo Street, Malate Manila
164,192.58 10 Years 1-Jan-14 31-Dec-23
215 WEST AVENUE 49 West Avenue, Brgy. Paltok, Quezon City 199,975.91 5 Years 1-Mar-20 28-Feb-25
216 WILSON #1 Barasoain cor. Wilson St., Little Baguio, San Juan City
154,916.00 10 Years 1-Dec-12 30-Nov-22
217 YLAYA 999 – 1003 Ylaya Street Tondo, Brgy 3 Zone 001, Manila 1012
159,038.20 20 Years 21-Apr-04 20-Apr-24
218 ZAMBALES - IBA GF, Iba Town Center, National Road Zone 1, Poblacion, Iba Zambales
166,319.22 5 Years 15-Aug-19 14-Aug-24
219 ZAMBALES - SUBIC TOWN GF, Unity Developers Corp Bldg., National Highway, Baraca - Camachile, Subic, Zambales
120,608.61 10 Years 21-Nov-15 20-Nov-25
220 ZAMBOANGA Mayor Vitaliano Agan Avenue, Camino Nuevo, Zamboanga City
85,568.68 20 Years 14-Jul-04 14-Jul-24
221 ZAMBOANGA - GUIWAN MCLL Highway, Guiwan, Zamboanga City 46,585.00 5 Years 1-Apr-21 31-Mar-26
222 ZAMBOANGA - PILAR G/F Martha Bldg. Pilar Street, Zone 4, Zamboanga City
125,583.71 5 Years 1-Sep-20 31-Aug-25

Exhibit 3
PHILIPPINE SAVINGS BANK EVENTS REPORTED UNDER FORM 17-C
(Reports filed during the year 2021)
No. Particulars Date Reported 1 PSBank reported the following information as of December 31, 2020:
1. Top 20 Stockholders 2. Top 100 Stockholders 3. Statement of Beneficial Ownership 4. Summary Report on Distribution of Stockholdings by Nationality 5. List of Major PSBank Stockholders Owning 5% or more 6. List of Stockholders and their Stockholdings 7. Changes in Stockholdings of Stockholders
January 19, 2021
2 PSBank reported that the Board of Directors, in its meeting held on 26 January 2021, passed a resolution declaring a 7.5% Regular Cash Dividend for the fourth quarter of 2020 amounting to Php 320.14 million equivalent to Php 0.75 per share. This will be payable to all common stockholders as of the Record Date of 05 February 2021 and will be paid no later than the Payment Date of 22 February 2021.
January 26, 2021
3 PSBank reported that the Board of Directors, in its meeting held on 26 January 2021, passed a resolution on the following: 1) Scheduling of the Annual Stockholders Meeting on April 26, 2021 at 3 o’clock
in the afternoon via CISCO WEBEX, a secure online/virtual meeting application platform, as part of the Bank's continuous preventive and security efforts for its employees and stakeholders in relation to the ongoing COVID-19 crisis and pursuant to the applicable SEC regulations on meeting via remote communication;
2) Setting March 5, 2021 as the Record Date for determining stockholders entitled to notice and to vote in the Meeting; and
3) Granting of authority to Mr. Jose Vicente L. Alde, PSBank President, to change the date, time and place of the Meeting as well as the record date and to decide on such other related matters as may be required by the regulators and other exigencies; and to sign, execute and deliver any and all documents and to do and perform any and all acts as may be necessary to carry into effect the intents and purposes of the foregoing.
January 26, 2021
4 PSBank reported its financial results for year-end 2020. March 9, 2021 5 PSBank reported the attendance of the Board of Directors with a corresponding
certification issued by our Corporate Secretary, Mr. Pocholo V. Dela Peña and also the attendance of the Principal / Key Officers of Philippine Savings Bank in the Corporate Governance Seminars / Webinars held on March 5 and 12, 2021.
March 19, 2021
6 In compliance with the SEC Notice dated March 16, 2021 on the alternative mode for distributing and providing copies of the Notice of Meeting, Information Statement, and other documents in connection with the holding of Annual Stockholders’ Meeting (“ASM”) for 2021, PSBank reported that the 2021 Notice of Annual Stockholders’ Meeting was published in two (2) major publications (print and online) on April 4 and April 5, 2021. Accordingly, the same had been disclosed to the Philippine Stock Exchange (PSE) pursuant to applicable PSE regulations.
April 8, 2021
7 PSBank reported the following information as of March 31, 2021: 1. Top 20 Stockholders 2. Top 100 Stockholders 3. Statement of Beneficial Ownership 4. Summary Report on Distribution of Stockholdings by Nationality 5. List of Major PSBank Stockholders Owning 5% or more 6. List of Stockholders and their Stockholdings 7. Changes in Stockholdings of Stockholders
April 21, 2021
8 PSBank reported the results of its Annual Stockholders’ Meeting held on 26 April 2021.
April 29, 2021
9 PSBank reported the results of its Organizational Meeting held on 26 April 2021. April 29, 2021 10 PSBank reported that the Board of Directors, in its meeting held on 26 April 2021,
passed a resolution declaring a 7.5% Regular Cash Dividend for the first quarter of 2021 amounting to Php 320.14 million equivalent to Php 0.75 per share. This will be payable to all common stockholders as of the Record Date of 11 May 2021 and will be paid no later than the Payment Date of 26 May 2021.
April 29, 2021
11 PSBank reported its financial results for first quarter of 2021. May 11, 2021
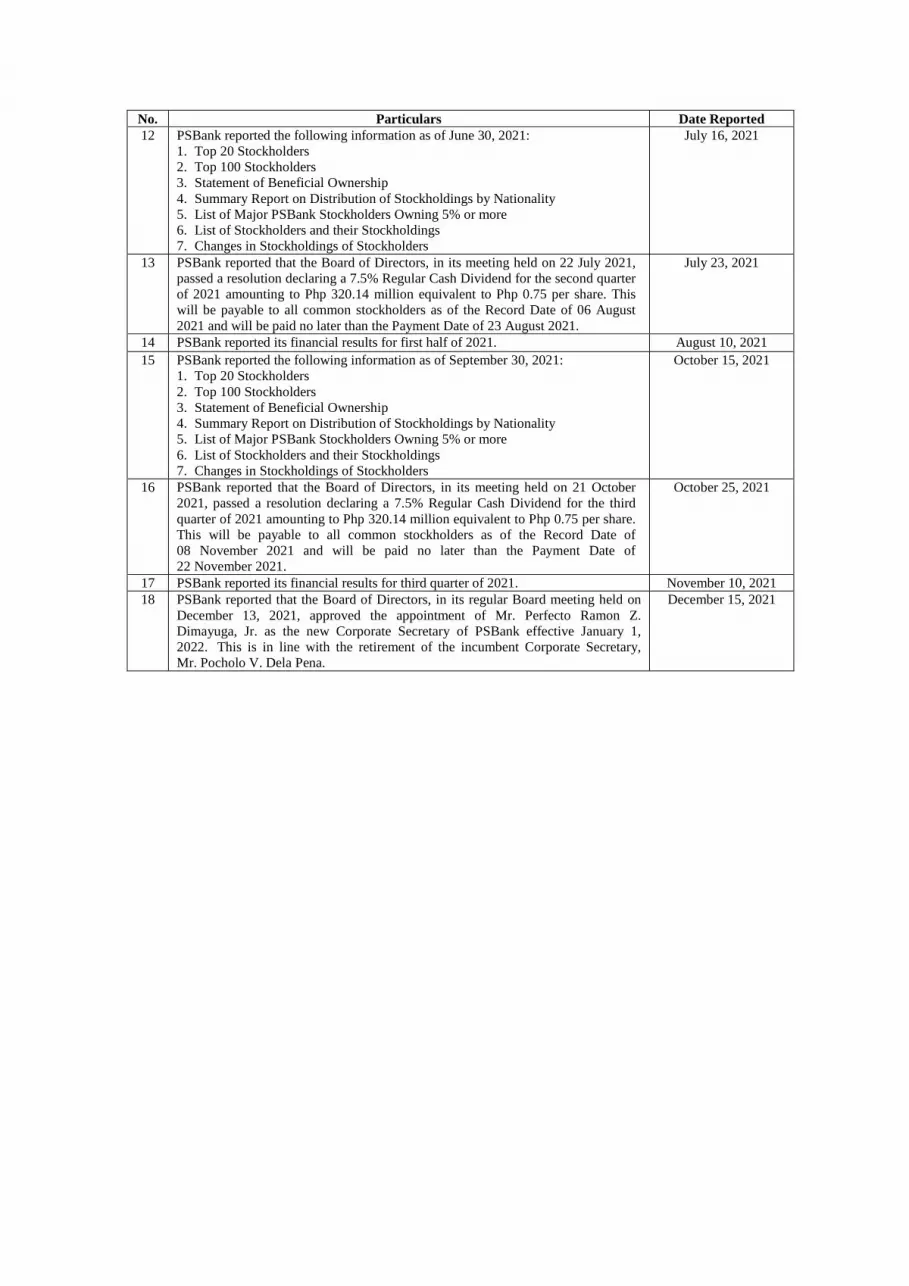
No. Particulars Date Reported 12 PSBank reported the following information as of June 30, 2021:
1. Top 20 Stockholders 2. Top 100 Stockholders 3. Statement of Beneficial Ownership 4. Summary Report on Distribution of Stockholdings by Nationality 5. List of Major PSBank Stockholders Owning 5% or more 6. List of Stockholders and their Stockholdings 7. Changes in Stockholdings of Stockholders
July 16, 2021
13 PSBank reported that the Board of Directors, in its meeting held on 22 July 2021, passed a resolution declaring a 7.5% Regular Cash Dividend for the second quarter of 2021 amounting to Php 320.14 million equivalent to Php 0.75 per share. This will be payable to all common stockholders as of the Record Date of 06 August 2021 and will be paid no later than the Payment Date of 23 August 2021.
July 23, 2021
14 PSBank reported its financial results for first half of 2021. August 10, 2021 15 PSBank reported the following information as of September 30, 2021:
1. Top 20 Stockholders 2. Top 100 Stockholders 3. Statement of Beneficial Ownership 4. Summary Report on Distribution of Stockholdings by Nationality 5. List of Major PSBank Stockholders Owning 5% or more 6. List of Stockholders and their Stockholdings 7. Changes in Stockholdings of Stockholders
October 15, 2021
16 PSBank reported that the Board of Directors, in its meeting held on 21 October 2021, passed a resolution declaring a 7.5% Regular Cash Dividend for the third quarter of 2021 amounting to Php 320.14 million equivalent to Php 0.75 per share. This will be payable to all common stockholders as of the Record Date of 08 November 2021 and will be paid no later than the Payment Date of 22 November 2021.
October 25, 2021
17 PSBank reported its financial results for third quarter of 2021. November 10, 2021 18 PSBank reported that the Board of Directors, in its regular Board meeting held on
December 13, 2021, approved the appointment of Mr. Perfecto Ramon Z. Dimayuga, Jr. as the new Corporate Secretary of PSBank effective January 1, 2022. This is in line with the retirement of the incumbent Corporate Secretary, Mr. Pocholo V. Dela Pena.
December 15, 2021

SECURITIES AND EXCHANGE COMMISSION G/F Secretariat Building PICC Complex, Roxas Boulevard Pasay City, 1307
STATEMENT OF MANAGEMENT’S RESPONSIBILITY FOR FINANCIAL STATEMENTS
The management of Philippine Savings Bank is responsible for the preparation and fair presentation of the financial statements including the schedules attached therein, for the years ended December 31, 2021 and 2020, in accordance with the prescribed financial reporting framework indicated therein, and for such internal control as management determines is necessary to enable the preparation of financial statements that are free from material misstatement, whether due to fraud or error.
In preparing the financial statements, management is responsible for assessing the company’s ability to continue as a going concern, disclosing, as applicable matters related to going concern and using the going concern basis of accounting unless management either intends to liquidate the company or to cease operations, or has no realistic alternative but to do so.
The Board of Directors is responsible for overseeing the company’s financial reporting process.
The Board of Directors reviews and approves the financial statements including the schedules attached therein, and submits the same to the stockholders or members.
SyCip, Gorres, Velayo & Co., the independent auditor appointed by the stockholders, has audited the financial statements of the company in accordance with Philippine Standards on Auditing, and in its report to the stockholders or members, has expressed its opinion on the fairness of presentation upon completion of such audit.
REPUBLIC OF THE PHILIPPINES CITY OF MAKATI ) S.S. SUBSCRIBED AND SWORN TO before me this_____________ affiants exhibiting to me their government-issued identification cards as follows: Name Passport/SSS Date of Issue Place of Issue Jose T. Pardo Jose Vicente L. Alde Leah M. Zamora
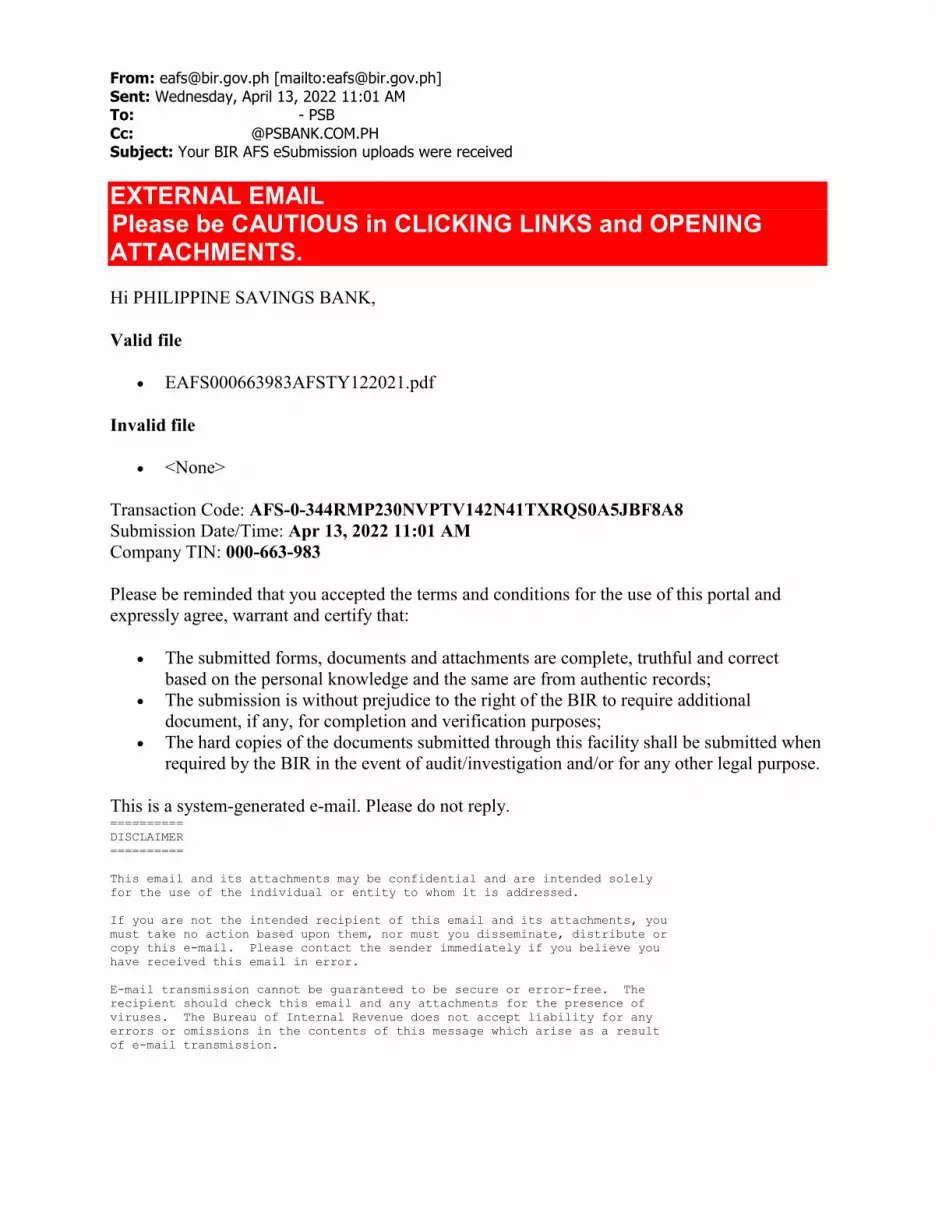
From: [email protected] [mailto:[email protected]]
Sent: Wednesday, April 13, 2022 11:01 AM To: Bardon Maria Teresa D - PSB
Cc: [email protected] Subject: Your BIR AFS eSubmission uploads were received
EXTERNAL EMAIL
Please be CAUTIOUS in CLICKING LINKS and OPENING
ATTACHMENTS.
Hi PHILIPPINE SAVINGS BANK,
Valid file
EAFS000663983AFSTY122021.pdf
Invalid file
<None>
Transaction Code: AFS-0-344RMP230NVPTV142N41TXRQS0A5JBF8A8
Submission Date/Time: Apr 13, 2022 11:01 AM
Company TIN: 000-663-983
Please be reminded that you accepted the terms and conditions for the use of this portal and
expressly agree, warrant and certify that:
The submitted forms, documents and attachments are complete, truthful and correct
based on the personal knowledge and the same are from authentic records;
The submission is without prejudice to the right of the BIR to require additional
document, if any, for completion and verification purposes;
The hard copies of the documents submitted through this facility shall be submitted when
required by the BIR in the event of audit/investigation and/or for any other legal purpose.
This is a system-generated e-mail. Please do not reply. ==========
DISCLAIMER
==========
This email and its attachments may be confidential and are intended solely
for the use of the individual or entity to whom it is addressed.
If you are not the intended recipient of this email and its attachments, you
must take no action based upon them, nor must you disseminate, distribute or
copy this e-mail. Please contact the sender immediately if you believe you
have received this email in error.
E-mail transmission cannot be guaranteed to be secure or error-free. The
recipient should check this email and any attachments for the presence of
viruses. The Bureau of Internal Revenue does not accept liability for any
errors or omissions in the contents of this message which arise as a result
of e-mail transmission.
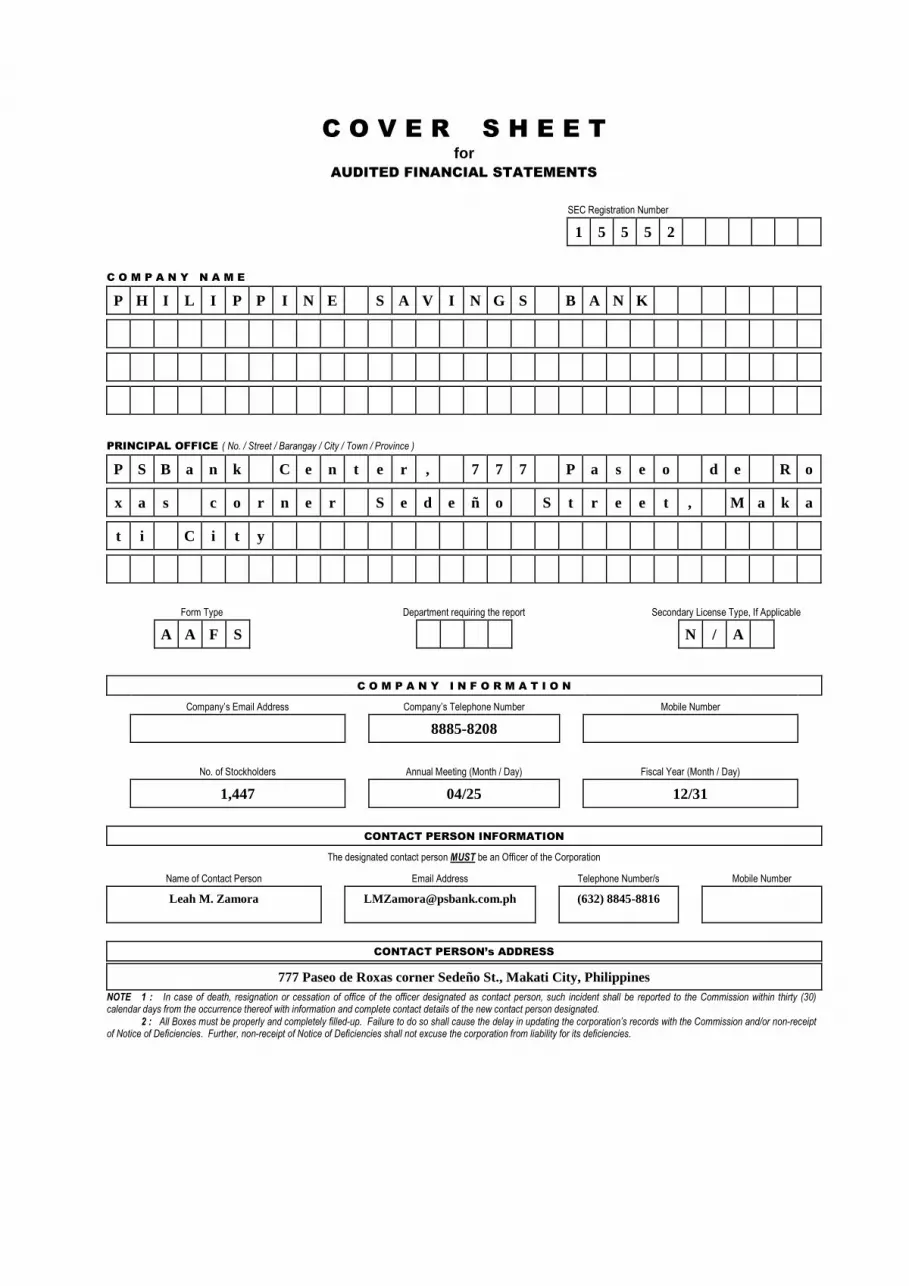
C O V E R S H E E T for
AUDITED FINANCIAL STATEMENTS
SEC Registration Number
1 5 5 5 2
C O M P A N Y N A M E
P H I L I P P I N E S A V I N G S B A N K
PRINCIPAL OFFICE ( No. / Street / Barangay / City / Town / Province )
P S B a n k C e n t e r , 7 7 7 P a s e o d e R o
x a s c o r n e r S e d e ñ o S t r e e t , M a k a
t i C i t y
Form Type Department requiring the report Secondary License Type, If Applicable
A A F S N / A
C O M P A N Y I N F O R M A T I O N
Company’s Email Address Company’s Telephone Number Mobile Number
8885-8208
No. of Stockholders Annual Meeting (Month / Day) Fiscal Year (Month / Day)
1,447 04/25 12/31
CONTACT PERSON INFORMATION
The designated contact person MUST be an Officer of the Corporation
Name of Contact Person Email Address Telephone Number/s Mobile Number
Leah M. Zamora [email protected] (632) 8845-8816
CONTACT PERSON’s ADDRESS
777 Paseo de Roxas corner Sedeño St., Makati City, Philippines NOTE 1 : In case of death, resignation or cessation of office of the officer designated as contact person, such incident shall be reported to the Commission within thirty (30) calendar days from the occurrence thereof with information and complete contact details of the new contact person designated.
2 : All Boxes must be properly and completely filled-up. Failure to do so shall cause the delay in updating the corporation’s records with the Commission and/or non-receipt of Notice of Deficiencies. Further, non-receipt of Notice of Deficiencies shall not excuse the corporation from liability for its deficiencies.
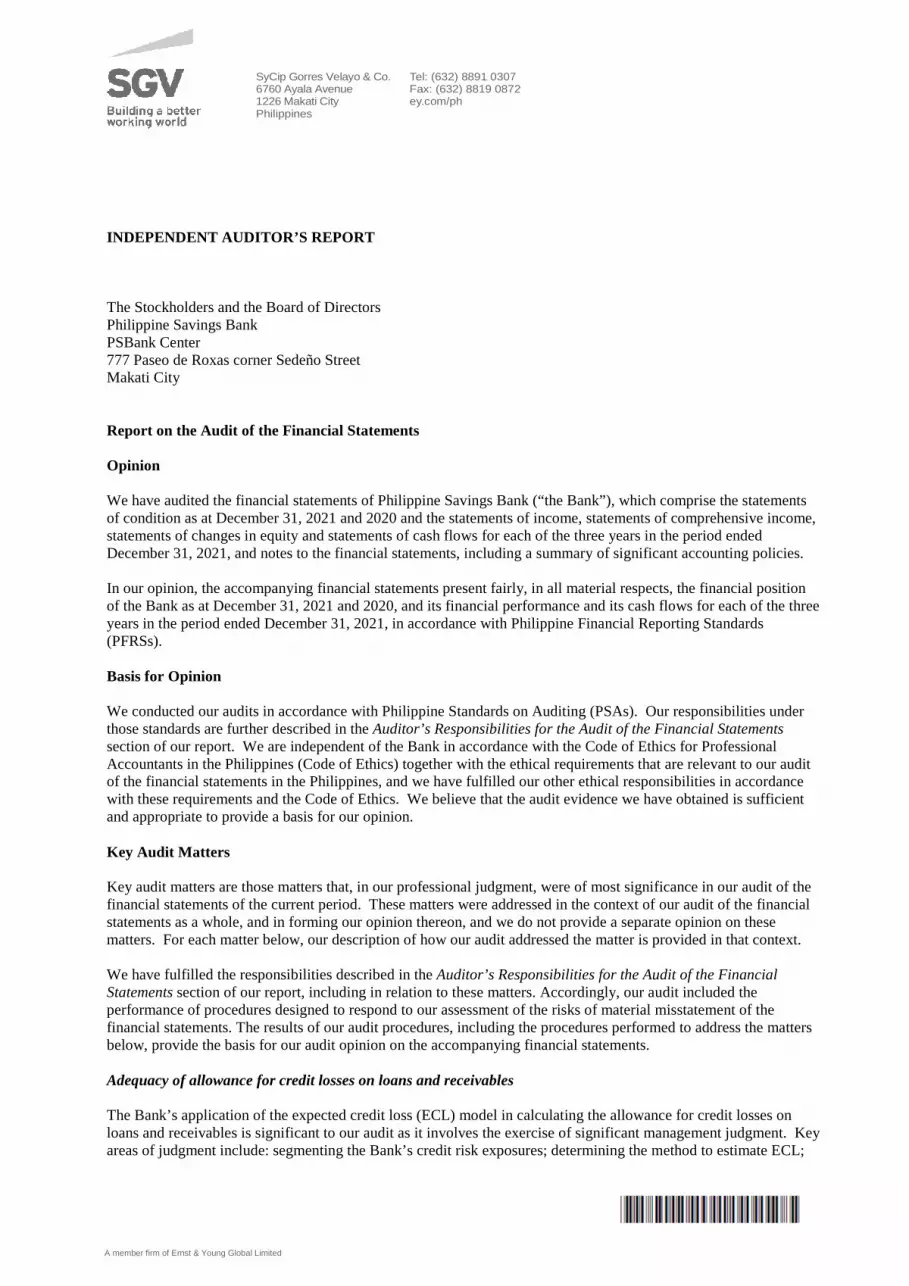
INDEPENDENT AUDITOR’S REPORT The Stockholders and the Board of Directors Philippine Savings Bank PSBank Center 777 Paseo de Roxas corner Sedeño Street Makati City Report on the Audit of the Financial Statements Opinion We have audited the financial statements of Philippine Savings Bank (“the Bank”), which comprise the statements of condition as at December 31, 2021 and 2020 and the statements of income, statements of comprehensive income, statements of changes in equity and statements of cash flows for each of the three years in the period ended December 31, 2021, and notes to the financial statements, including a summary of significant accounting policies. In our opinion, the accompanying financial statements present fairly, in all material respects, the financial position of the Bank as at December 31, 2021 and 2020, and its financial performance and its cash flows for each of the three years in the period ended December 31, 2021, in accordance with Philippine Financial Reporting Standards (PFRSs). Basis for Opinion We conducted our audits in accordance with Philippine Standards on Auditing (PSAs). Our responsibilities under those standards are further described in the Auditor’s Responsibilities for the Audit of the Financial Statements section of our report. We are independent of the Bank in accordance with the Code of Ethics for Professional Accountants in the Philippines (Code of Ethics) together with the ethical requirements that are relevant to our audit of the financial statements in the Philippines, and we have fulfilled our other ethical responsibilities in accordance with these requirements and the Code of Ethics. We believe that the audit evidence we have obtained is sufficient and appropriate to provide a basis for our opinion. Key Audit Matters Key audit matters are those matters that, in our professional judgment, were of most significance in our audit of the financial statements of the current period. These matters were addressed in the context of our audit of the financial statements as a whole, and in forming our opinion thereon, and we do not provide a separate opinion on these matters. For each matter below, our description of how our audit addressed the matter is provided in that context. We have fulfilled the responsibilities described in the Auditor’s Responsibilities for the Audit of the Financial Statements section of our report, including in relation to these matters. Accordingly, our audit included the performance of procedures designed to respond to our assessment of the risks of material misstatement of the financial statements. The results of our audit procedures, including the procedures performed to address the matters below, provide the basis for our audit opinion on the accompanying financial statements. Adequacy of allowance for credit losses on loans and receivables
The Bank’s application of the expected credit loss (ECL) model in calculating the allowance for credit losses on loans and receivables is significant to our audit as it involves the exercise of significant management judgment. Key areas of judgment include: segmenting the Bank’s credit risk exposures; determining the method to estimate ECL;
SyCip Gorres Velayo & Co. 6760 Ayala Avenue 1226 Makati City Philippines
Tel: (632) 8891 0307 Fax: (632) 8819 0872 ey.com/ph
A member firm of Ernst & Young Global Limited

- 2 - defining default; identifying exposures with significant deterioration in credit quality; determining assumptions to be used in the ECL model such as the counterparty credit risk rating, the expected life of the financial asset and expected recoveries from defaulted accounts, and impact of any financial support and credit enhancements extended by any party; and incorporating forward-looking information (called overlays), including the impact of the coronavirus pandemic, in calculating ECL. Allowance for credit losses on loans and receivables as of December 31, 2021 amounted to P7.5 billion. Provision for credit losses of the Bank in 2021 amounted to P3.1 billion.
The disclosures related to the allowance for credit losses on loans and receivables are included in Note 15 to the financial statements. Audit response
We obtained an understanding of the board-approved methodologies and models used for the Bank’s different credit exposures and assessed whether these considered the requirements of PFRS 9, Financial Instruments, to reflect an unbiased and probability-weighted outcome, the time value of money, and the best available forward-looking information.
We (a) assessed the Bank’s segmentation of its credit risk exposures based on homogeneity of credit risk characteristics; (b) tested the definition of default and significant increase in credit risk criteria against historical analysis of accounts and credit risk management policies and practices in place; (c) tested the Bank’s application of internal credit risk rating system, including the impact of the coronavirus pandemic on the borrowers, by reviewing the ratings of sample credit exposures; (d) assessed whether expected life is different from the contractual life by testing the maturity dates reflected in the Bank’s records and considering management’s assumptions regarding future collections, advances, extensions, renewals and modifications; (e) tested loss given default by inspecting historical recoveries including the timing, related direct costs, write-offs and collateral valuations, and the effects of any financial support and credit enhancements provided by any party; (f) tested exposure at default considering outstanding commitments and repayment scheme; (g) evaluated the forward-looking information used for overlay, including considerations to overlay for the impact of the coronavirus pandemic, through statistical test and corroboration using publicly available information and our understanding of the Bank’s lending portfolios and broader industry knowledge; and (h) tested the effective interest rate used in discounting the expected loss.
Further, we compared the data used in the ECL models from source system reports to the data warehouse and from the data warehouse to the loss allowance analysis/models and financial reporting systems. To the extent that the loss allowance analysis is based on credit exposures that have been disaggregated into subsets of debt financial assets with similar risk characteristics, we traced or re-performed the disaggregation from source systems to the loss allowance analysis. We also assessed the assumptions used where there are missing or insufficient data.
We recalculated impairment provisions on a sample basis. We involved our internal specialists in the performance of the above procedures. We reviewed the completeness of the disclosures made in the financial statements.
Recognition of deferred tax assets
As of December 31, 2021, the net deferred tax assets amounted to P576.8 million. The recognition of deferred tax assets is significant to our audit because the assessment process is complex and judgmental and is based on assumptions such as availability of future taxable income and the timing of the reversal of the temporary differences that are affected by expected future market or economic conditions and the expected performance of the Bank. The estimation uncertainty increased, as a result of the effect of coronavirus pandemic, on the macroeconomic factors used in developing the assumptions. The disclosures in relation to deferred income taxes are included in Note 27 to the financial statements.
A member firm of Ernst & Young Global Limited

- 3 -
Audit response
We involved our internal specialist in interpreting the tax regulations, testing the temporary differences identified by the Bank and the applicable tax rate. We also re-performed the calculation of the deferred tax assets. We evaluated the management’s assessment on the availability of future taxable income in reference to financial forecast and tax strategies. We evaluated management’s forecast by comparing the loan portfolio and deposit growth rates with that of the industry and the historical performance of the Bank, taking into consideration the impact associated with coronavirus pandemic. We also assessed the timing of the reversal of future taxable and deductible temporary differences. Other Information Management is responsible for the other information. The other information comprises the information included in the SEC Form 17-A, SEC Form 20-IS (Definitive Information Statement) and Annual Report for the year ended December 31, 2021 but does not include the financial statements and our auditor’s report thereon. The SEC Form 17-A, SEC Form 20-IS (Definitive Information Statement) and Annual Report for the year ended December 31, 2021 are expected to be made available to us after the date of this auditor's report. Our opinion on the financial statements does not cover the other information and we will not express any form of assurance conclusion thereon. In connection with our audits of the financial statements, our responsibility is to read the other information identified above when it becomes available and, in doing so, consider whether the other information is materially inconsistent with the financial statements or our knowledge obtained in the audits, or otherwise appears to be materially misstated. Responsibilities of Management and Those Charged with Governance for the Financial Statements Management is responsible for the preparation and fair presentation of the financial statements in accordance with PFRSs, and for such internal control as management determines is necessary to enable the preparation of financial statements that are free from material misstatement, whether due to fraud or error. In preparing the financial statements, management is responsible for assessing the Bank’s ability to continue as a going concern, disclosing, as applicable, matters related to going concern and using the going concern basis of accounting unless management either intends to liquidate the Bank or to cease operations, or has no realistic alternative but to do so. Those charged with governance are responsible for overseeing the Bank’s financial reporting process. Auditor’s Responsibilities for the Audit of the Financial Statements Our objectives are to obtain reasonable assurance about whether the financial statements as a whole are free from material misstatement, whether due to fraud or error, and to issue an auditor’s report that includes our opinion. Reasonable assurance is a high level of assurance but is not a guarantee that an audit conducted in accordance with PSAs will always detect a material misstatement when it exists. Misstatements can arise from fraud or error and are considered material if, individually or in the aggregate, they could reasonably be expected to influence the economic decisions of users taken on the basis of these financial statements.
A member firm of Ernst & Young Global Limited

- 4 - As part of an audit in accordance with PSAs, we exercise professional judgment and maintain professional skepticism throughout the audit. We also: • Identify and assess the risks of material misstatement of the financial statements, whether due to fraud or error,
design and perform audit procedures responsive to those risks, and obtain audit evidence that is sufficient and appropriate to provide a basis for our opinion. The risk of not detecting a material misstatement resulting from fraud is higher than for one resulting from error, as fraud may involve collusion, forgery, intentional omissions, misrepresentations, or the override of internal control.
• Obtain an understanding of internal control relevant to the audit in order to design audit procedures that are
appropriate in the circumstances, but not for the purpose of expressing an opinion on the effectiveness of the Bank’s internal control.
• Evaluate the appropriateness of accounting policies used and the reasonableness of accounting estimates and
related disclosures made by management. • Conclude on the appropriateness of management’s use of the going concern basis of accounting and, based on
the audit evidence obtained, whether a material uncertainty exists related to events or conditions that may cast significant doubt on the Bank’s ability to continue as a going concern. If we conclude that a material uncertainty exists, we are required to draw attention in our auditor’s report to the related disclosures in the financial statements or, if such disclosures are inadequate, to modify our opinion. Our conclusions are based on the audit evidence obtained up to the date of our auditor’s report. However, future events or conditions may cause the Bank to cease to continue as a going concern.
• Evaluate the overall presentation, structure and content of the financial statements, including the disclosures,
and whether the financial statements represent the underlying transactions and events in a manner that achieves fair presentation.
We communicate with those charged with governance regarding, among other matters, the planned scope and timing of the audit and significant audit findings, including any significant deficiencies in internal control that we identify during our audit. We also provide those charged with governance with a statement that we have complied with relevant ethical requirements regarding independence, and to communicate with them all relationships and other matters that may reasonably be thought to bear on our independence, and where applicable, related safeguards. From the matters communicated with those charged with governance, we determine those matters that were of most significance in the audit of the financial statements of the current period and are therefore the key audit matters. We describe these matters in our auditor’s report unless law or regulation precludes public disclosure about the matter or when, in extremely rare circumstances, we determine that a matter should not be communicated in our report because the adverse consequences of doing so would reasonably be expected to outweigh the public interest benefits of such communication. Reports on the Supplementary Information Required Under Bangko Sentral ng Pilipinas (BSP) Circular No. 1074 and Revenue Regulations No. 15-2010 Our audits were conducted for the purpose of forming an opinion on the basic financial statements taken as a whole. The supplementary information required under BSP Circular No. 1074 in Note 36 and Revenue Regulations 15-2010 in Note 37 to the financial statements is presented for purposes of filing with the BSP and Bureau of Internal Revenue, respectively, and is not a required part of the basic financial statements. Such information is the responsibility of the management of Philippine Savings Bank. The information has been subjected to the auditing procedures applied in our audit of the basic financial statements.
A member firm of Ernst & Young Global Limited

- 5 -
In our opinion, the information is fairly stated, in all material respects, in relation to the basic financial statements taken as a whole. The engagement partner on the audit resulting in this independent auditor’s report is Veronica Mae A. Arce. SYCIP GORRES VELAYO & CO. Veronica Mae A. Arce Partner CPA Certificate No. 0117208 Tax Identification No. 234-282-413 BOA/PRC Reg. No. 0001, August 25, 2021, valid until April 15, 2024 SEC Partner Accreditation No. 117208-SEC (Group A)
Valid to cover audit of 2021 to 2025 financial statements of SEC covered institutions SEC Firm Accreditation No. 0001-SEC (Group A)
Valid to cover audit of 2021 to 2025 financial statements of SEC covered institutions BIR Accreditation No. 08-001998-135-2021, November 10, 2021, valid until November 9, 2024 PTR No. 8853465, January 3, 2022, Makati City February 17, 2022
A member firm of Ernst & Young Global Limited

PHILIPPINE SAVINGS BANK STATEMENTS OF CONDITION December 31 2021 2020
ASSETS
Cash and Other Cash Items P=2,801,335,279 P=2,841,851,535 Due from Bangko Sentral ng Pilipinas (Notes 7 and 16) 52,427,713,760 31,688,975,820 Due from Other Banks (Note 29) 1,366,924,524 1,461,474,934 Interbank Loans Receivable and Securities Purchased
Under Resale Agreements (Note 7) 4,532,877,908 5,445,979,370 Fair Value Through Profit or Loss (FVTPL) Investments (Note 8) 44,701 50,189 Financial Assets at Fair Value Through Other Comprehensive Income
(FVOCI) (Note 8) 60,266,504,348 10,059,232,805 Investment Securities at Amortized Cost (Note 8) 20,962,346,722 13,735,999,138 Loans and Receivables (Note 9) 110,111,505,826 142,524,344,524 Investment in a Joint Venture (Notes 10 and 29) 762,926,364 705,476,563 Property and Equipment (Note 11) 2,938,455,849 3,089,814,582 Investment Properties (Note 12) 3,508,598,106 3,585,971,956 Deferred Tax Assets (Note 27) 576,786,519 2,091,140,847 Intangible Assets and Goodwill (Note 13) 361,193,084 441,143,119 Other Assets (Note 14) 1,188,896,822 1,742,146,857 P=261,806,109,812 P=219,413,602,239
LIABILITIES AND EQUITY
Liabilities Deposit Liabilities (Note 16) Demand P=26,939,262,124 P=25,523,284,040 Savings 45,319,797,393 41,724,171,123 Time 136,095,038,765 91,791,490,829 Long-term Negotiable Certificates of Deposits 8,441,451,603 8,425,364,104 216,795,549,885 167,464,310,096 Bonds Payable (Note 17) 4,633,613,322 10,902,456,911 Treasurer’s, Cashier’s and Manager’s Checks 593,630,994 531,318,419 Accrued Taxes, Interest and Other Expenses (Note 18) 1,684,762,235 1,782,919,802 Income Tax Payable 80,547 322,018,981 Other Liabilities (Note 19) 3,204,395,695 3,899,849,627 226,912,032,678 184,902,873,836
Equity Common Stock (Note 21) 4,268,594,160 4,268,594,160 Capital Paid in Excess of Par Value (Note 21) 11,418,563,257 11,418,563,257 Surplus Reserves (Note 30) 1,041,471,464 1,039,166,094 Surplus (Note 21) 18,812,148,450 18,555,539,349 Fair Value Reserves on Financial Assets at FVOCI (Note 8) 2,409,890 13,058,180 Remeasurement Losses on Retirement Plan (Note 24) (632,885,484) (726,238,329) Equity in Remeasurement Gains on Retirement Plan
of a Joint Venture (Note 10) 2,877,392 (1,285,176) Equity in Hedge Reserves of a Joint Venture (Note 10) (12,144,581) (35,097,280) Cumulative Translation Adjustment (6,957,414) (21,571,852) 34,894,077,134 34,510,728,403 P=261,806,109,812 P=219,413,602,239 See accompanying Notes to Financial Statements.
A member firm of Ernst & Young Global Limited

PHILIPPINE SAVINGS BANK STATEMENTS OF INCOME Years Ended December 31 2021 2020 2019
INTEREST INCOME Loans and receivables (Note 9) P=12,148,774,170 P=15,666,265,787 P=15,481,189,433 Financial assets at FVOCI and investment securities at amortized cost
(Note 8) 1,486,019,162 1,298,471,798 1,896,257,446 Due from Bangko Sentral ng Pilipinas (Note 7) 648,063,197 221,893,610 831,792 Interbank loans receivable and securities purchased under
resale agreements (Note 7) 70,592,184 85,056,319 30,140,459 FVTPL investments (Note 8) 11,272,985 45,039,478 2,152 Due from other banks 47,132 1,178,094 4,066,446 14,364,768,830 17,317,905,086 17,412,487,728
INTEREST EXPENSE Deposit liabilities (Note 16) 1,637,233,919 2,771,606,957 5,327,625,405 Bonds payable (Note 17) 437,530,261 583,408,268 167,596,354 Lease liabilities (Note 25) 85,201,992 99,539,323 113,560,729 Bills payable (Note 17) 41,972 110,397,939 319,718,630 Subordinated notes (Note 17) – – 125,118,285 2,160,008,144 3,564,952,487 6,053,619,403
NET INTEREST INCOME 12,204,760,686 13,752,952,599 11,358,868,325 Service fees and commission income (Note 22) 1,581,126,848 1,308,210,530 1,951,941,673 Service fees and commission expense (Note 22) 47,816,732 50,825,805 88,437,296
NET SERVICE FEES AND COMMISSION INCOME 1,533,310,116 1,257,384,725 1,863,504,377
OTHER OPERATING INCOME (CHARGES) Gain on foreclosure and sale of investment properties - net
(Note 12) 571,276,769 326,868,825 611,833,898 Gain (loss) on foreclosure and sale of chattel mortgage properties -
net (Note 14) 142,185,112 (458,776,805) (84,902,195))Gain on disposal of investment securities at amortized cost (Note 8) 11,711,129 1,291,913,518 – Foreign exchange gain (loss) - net (8,168,185) 27,217,634 65,884,165 Trading and securities gains - net (Note 8) 2,733,476 354,430,046 223,992,445 Gain on sale of property and equipment (Note 11) 2,042,084 2,045,386 8,132,940 Miscellaneous (Notes 12, 23 and 25) 700,430,805 15,466,028 554,897,890 1,422,211,190 1,559,164,632 1,379,839,143
TOTAL OPERATING INCOME 15,160,281,992 16,569,501,956 14,602,211,845
OTHER EXPENSES Compensation and fringe benefits (Notes 24 and 29) 3,545,335,550 3,635,622,388 3,520,613,973 Provision for credit and impairment losses (Note 15) 3,070,678,224 6,397,259,386 2,214,989,857 Taxes and licenses 1,586,134,257 1,571,869,031 1,549,754,043 Depreciation (Note 11) 836,327,579 899,545,800 910,341,824 Occupancy and equipment-related costs (Note 25) 352,588,645 363,406,183 322,330,030 Security, messengerial and janitorial services 349,532,682 438,391,419 453,062,842 Amortization of intangible assets (Note 13) 113,649,164 128,137,358 135,054,994 Miscellaneous (Notes 12 and 26) 2,082,202,992 2,084,820,312 2,023,191,282 11,936,449,093 15,519,051,877 11,129,338,845
(Forward)
- 2 - Years Ended December 31
2021 2020 2019
INCOME BEFORE SHARE IN NET INCOME OF A JOINT VENTUR E AND INCOME TAX P=3,223,832,899 P=1,050,450,079 P=3,472,873,000
SHARE IN NET INCOME OF A JOINT VENTURE (Notes 10 and 29) 41,914,529 40,299,304 105,905,423
INCOME BEFORE INCOME TAX 3,265,747,428 1,090,749,383 3,578,778,423
PROVISION FOR (BENEFIT FROM) INCOME TAX (Note 27)
Current 312,183,551 766,276,709 414,828,340 Deferred 1,414,071,157 (783,739,604) 135,612,443 1,726,254,708 (17,462,895) 550,440,783
NET INCOME P=1,539,492,720 P=1,108,212,278 P=3,028,337,640
Basic/Diluted Earnings Per Share (Note 28) P=3.61 P=2.60 P=7.21
See accompanying Notes to Financial Statements.

PHILIPPINE SAVINGS BANK STATEMENTS OF COMPREHENSIVE INCOME Years Ended December 31 2021 2020 2019
NET INCOME P=1,539,492,720 P=1,108,212,278 P=3,028,337,640
OTHER COMPREHENSIVE INCOME (LOSS) Items that recycle to profit or loss in subsequent periods: Equity in hedge reserves of a joint venture (Note 10) 22,952,699 (35,097,280) – Cumulative translation adjustment 14,614,438 (9,285,708) (8,452,938) Fair value reserves on debt securities at FVOCI (Note 8) (13,993,219) 33,528,337 762,418,992 23,573,918 (10,854,651) 753,966,054 Items that do not recycle to profit or loss in subsequent periods: Remeasurement gains (losses) on retirement plan (Note 24) 193,636,016 302,451,800 (667,632,731) Equity in remeasurement gains (losses) on retirement plan
of a joint venture (Note 10) 4,162,568 (2,226,857) (2,189,754) Fair value reserves on equity securities at FVOCI (Note 8) 3,344,929 (1,538,726) 1,545,856 Income tax effect (Note 27) (100,283,171) (90,735,540) 200,289,819 100,860,342 207,950,677 (467,986,810)
OTHER COMPREHENSIVE INCOME FOR THE YEAR, NET OF TAX 124,434,260 197,096,026 285,979,244
TOTAL COMPREHENSIVE INCOME, NET OF TAX P=1,663,926,980 P=1,305,308,304 P=3,314,316,884
See accompanying Notes to Financial Statements.

PHILIPPINE SAVINGS BANK STATEMENTS OF CHANGES IN EQUITY
Common Stock
(Note 21)
Capital Paid in Excess
of Par Value (Note 21)
Surplus Reserves (Note 30)
Surplus (Note 21)
Fair Value Reserves on
Financial Assets at FVOCI / Net
Unrealized Loss on Available-for-Sale Investments
(Note 8)
Remeasurement Losses on
Retirement Plan (Note 24)
Equity in Remeasurement
Gains on Retirement
Plan of a Joint Venture
(Note 10)
Equity in Hedge Reserves of a Joint Venture (Note 10)
Cumulative Translation Adjustment Total
Balance at January 1, 2021 P=4,268,594,160 P=11,418,563,257 P=1,039,166,094 P=18,555,539,349 P=13,058,180 (P=726,238,329) (P=1,285,176) (P=35,097,280) (P=21,571,852) P=34,510,728,403 Total comprehensive income (loss)
for the year − − − 1,539,492,720 (10,648,290) 93,352,845 4,162,568 22,952,699 14,614,438 1,663,926,980 Cash dividends (Note 21) − − − (1,280,578,249) − − − − − (1,280,578,249) Stock dividends (Note 21) − − − − − − − − − − Appropriation of surplus to trust
business (Note 30) − − 2,305,370 (2,305,370) − − − − − − Balance at December 31, 2021 P=4,268,594,160 P=11,418,563,257 P=1,041,471,464 P=18,812,148,450 P=2,409,890 (P=632,885,484) P=2,877,392 (P=12,144,581) (P=6,957,414) P=34,894,077,134 Balance at January 1, 2020 P=3,831,094,160 P=9,287,650,873 P=1,037,214,639 P=21,269,544,274 (P=18,931,431) (P=937,954,589) P=941,681 P=− (P=12,286,144) P=34,457,273,463 Total comprehensive income (loss)
for the year − − − 1,108,212,278 31,989,611 211,716,260 (2,226,857) (35,097,280) (9,285,708) 1,305,308,304 Cash dividends (Note 21) − − − (1,247,765,748) − − − − − (1,247,765,748) Stock dividends (Note 21) 437,500,000 2,130,912,384 − (2,572,500,000) − − − − − (4,087,616) Appropriation of surplus to trust
business (Note 30) − − 1,951,455 (1,951,455) − − − − − − Balance at December 31, 2020 P=4,268,594,160 P=11,418,563,257 P=1,039,166,094 P=18,555,539,349 P=13,058,180 (P=726,238,329) (P=1,285,176) (P=35,097,280) (P=21,571,852) P=34,510,728,403
Balance at January 1, 2019 P=2,402,524,910 P=2,818,083,506 P=1,035,899,409 P=19,391,850,112 (P=782,896,279) (P=470,611,677) P=3,131,435 P=− (P=3,833,206) P=24,394,148,210 Issuance of stock rights (Note 21) 1,428,569,250 6,469,567,367 − − − − − − − 7,898,136,617 Total comprehensive income (loss)
for the year − − − 3,028,337,640 763,964,848 (467,342,912) (2,189,754) − (8,452,938) 3,314,316,884 Cash dividends (Note 21) − − − (1,149,328,248) − − − − − (1,149,328,248) Appropriation of surplus to trust
business (Note 30) − − 1,315,230 (1,315,230) − − − − − − Balance at December 31, 2019 P=3,831,094,160 P=9,287,650,873 P=1,037,214,639 P=21,269,544,274 (P=18,931,431) (P=937,954,589) P=941,681 P=− (P=12,286,144) P=34,457,273,463
See accompanying Notes to Financial Statements.
PHILIPPINE SAVINGS BANK STATEMENTS OF CASH FLOWS Years Ended December 31 2021 2020 2019
CASH FLOWS FROM OPERATING ACTIVITIES Income before income tax P=3,265,747,428 P=1,090,749,383 P=3,578,778,423 Adjustments to reconcile income before income tax to net
cash provided by operations: Provision for credit and impairment losses (Note 15) 3,070,678,224 6,397,259,386 2,214,989,857
Amortization of premium (discount) on financial assets at fair value through other comprehensive income and investment securities at amortized cost (1,283,775,979) 615,127,658 1,038,248,791
Depreciation (Note 11) 836,327,579 899,545,800 910,341,824 Loss (gain) on foreclosure and sale of: Investment properties (Note 12) (571,276,769) (326,868,825) (611,833,898) Chattel mortgage properties (Note 14) (142,185,112) 458,776,805 84,902,195 Accretion of modified loans (Notes 9 ad 23 (134,649,231) (82,243,469) – Loss on modification of loans (Notes 9 and 23) – 508,760,865 – Amortization of:
Intangible assets (Note 13) 113,649,164 128,137,358 135,054,994 Debt issuance costs (Note 17) 31,156,411 50,742,829 51,072,480 Accretion of lease liabilities (Note 25) 85,201,992 99,539,323 113,560,729 Share in net income of a joint venture (Note 10) (41,914,529) (40,299,304) (105,905,423)
Realized loss (gain) on sale of financial assets at fair value through other comprehensive income (FVOCI) and amortized cost (Note 8) (15,711,131) (1,539,974,948) (224,424,552)
Gain on sale of property and equipment (Note 11) (2,042,084) (2,045,386) (8,132,940) Fair value loss (gain) on fair value through profit or loss investments
(Note 8) 5,488 (6,515) (9,784) Changes in operating assets and liabilities: Decrease (increase) in: Fair value through profit or loss investments – – 7,178,059 Loans and receivables 25,570,222,978 11,007,355,325 (13,941,308,215) Other assets (193,933,191) 151,134,047 9,737,244 Increase (decrease) in: Deposit liabilities 49,338,695,929 (5,045,415,314) (28,187,004,930) Treasurer’s, cashier’s and manager’s checks 62,312,575 (766,361,728) (317,840,041) Accrued taxes, interest and other expenses (98,156,780) 373,461,470 (415,997,141) Other liabilities (498,574,337) (465,493,094) (338,670,707) Cash generated from (used in) operations 79,391,778,625 13,511,881,666 (36,007,263,035) Income taxes paid (634,121,985) (444,632,705) (415,090,970) Dividends received from joint venture investment (Note 10) 11,579,995 53,279,973 39,359,981 Net cash provided by (used in) operating activities 78,769,236,635 13,120,528,934 (36,382,994,024)
CASH FLOWS FROM INVESTING ACTIVITIES Purchases of: Financial assets at FVOCI (486,598,968,817) (35,207,966,479) (1,924,784,626) Investment securities at amortized cost (7,842,285,003) – – Property and equipment (Note 11) (118,057,916) (159,221,567) (124,268,752) Other intangible assets (Note 13) (33,699,129) (97,105,773) (44,356,459) Proceeds from sale/maturities of: Financial assets at FVOCI (Note 8) 437,165,080,000 30,339,350,378 10,879,133,032 Chattel mortgage properties (Note 14) 4,152,276,913 2,857,721,303 2,688,067,819 Investment securities at amortized cost 1,128,720,734 21,033,629,069 557,776,500 Investment properties (Note 12) 986,515,245 698,999,099 1,276,797,669 Property and equipment (Note 11) 28,485,973 29,795,939 47,736,237 Net cash provided by (used in) investing activities (51,131,932,000) 19,495,201,969 13,356,101,420
CASH FLOWS FROM FINANCING ACTIVITIES Settlement of bonds payable (6,300,000,000) – – Dividends paid (Note 21) (1,280,578,249) (1,247,765,748) (1,149,328,248) Payment of lease liabilities (Notes 25 and 32) (479,330,246) (455,173,090) (439,476,020) Settlement of bills payable (Note 32) (413,930,000) (9,171,495,000) (381,298,646,855) Availments of bills payable (Note 32) 413,930,000 4,971,495,000 382,498,646,855 Issuance of bonds payable (Note 17 and 32) – 4,607,275,370 6,243,125,419 Issuance of stock dividends (Note 21) – (4,087,616) – Issuance of stock rights (Note 21) – – 7,898,136,617 Settlement of subordinated notes (Note 17 and 32) – – (3,000,000,000) Net cash provided by (used in) financing activities (8,059,908,495) (1,299,751,084) 10,752,457,768 Effect of exchange rate differences 485,670 (327,675) (180,999)
(Forward)
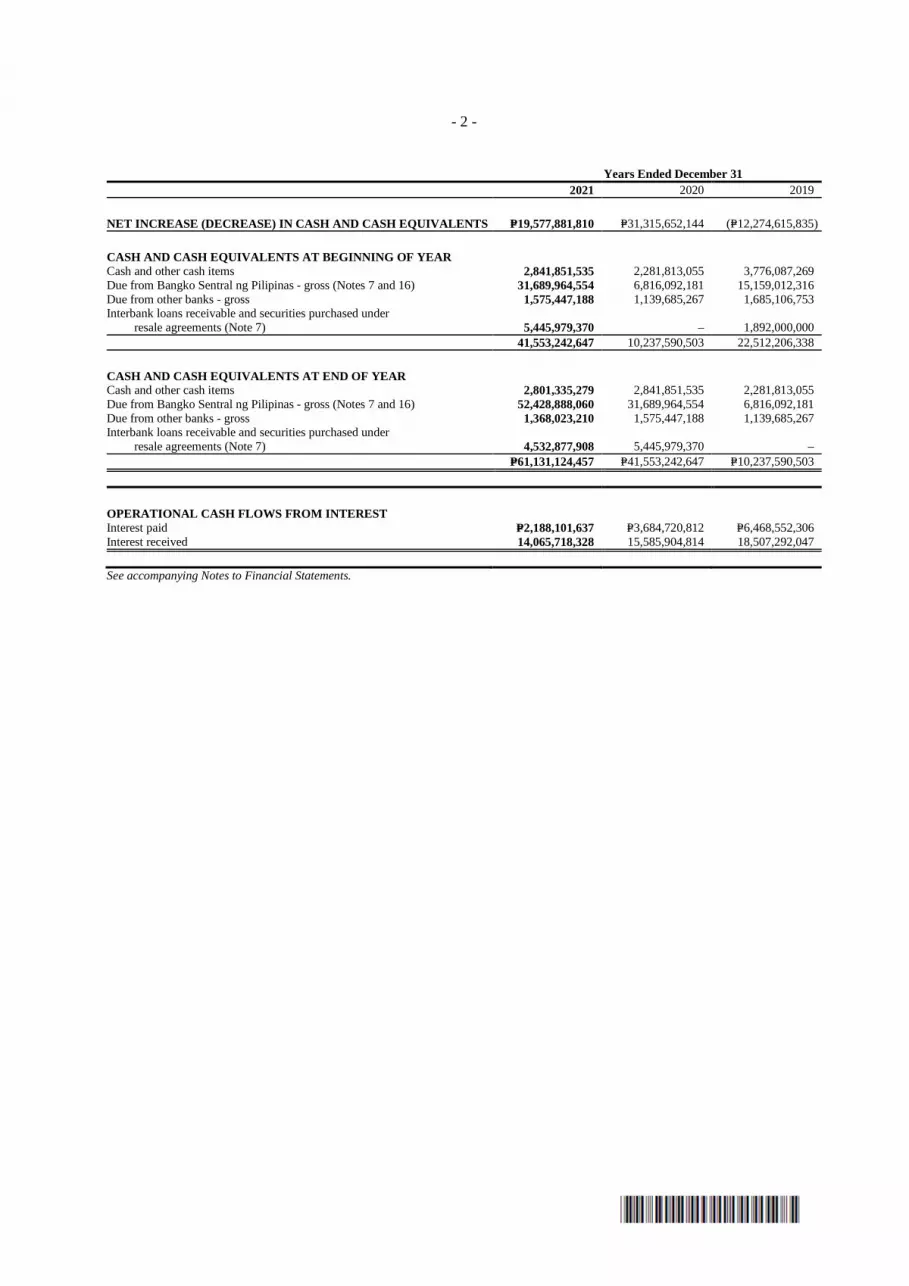
- 2 -
Years Ended December 31 2021 2020 2019
NET INCREASE (DECREASE) IN CASH AND CASH EQUIVALENT S P=19,577,881,810 P=31,315,652,144 (P=12,274,615,835)
CASH AND CASH EQUIVALENTS AT BEGINNING OF YEAR Cash and other cash items 2,841,851,535 2,281,813,055 3,776,087,269 Due from Bangko Sentral ng Pilipinas - gross (Notes 7 and 16) 31,689,964,554 6,816,092,181 15,159,012,316 Due from other banks - gross 1,575,447,188 1,139,685,267 1,685,106,753 Interbank loans receivable and securities purchased under
resale agreements (Note 7) 5,445,979,370 – 1,892,000,000 41,553,242,647 10,237,590,503 22,512,206,338
CASH AND CASH EQUIVALENTS AT END OF YEAR Cash and other cash items 2,801,335,279 2,841,851,535 2,281,813,055 Due from Bangko Sentral ng Pilipinas - gross (Notes 7 and 16) 52,428,888,060 31,689,964,554 6,816,092,181 Due from other banks - gross 1,368,023,210 1,575,447,188 1,139,685,267 Interbank loans receivable and securities purchased under
resale agreements (Note 7) 4,532,877,908 5,445,979,370 – P=61,131,124,457 P=41,553,242,647 P=10,237,590,503
OPERATIONAL CASH FLOWS FROM INTEREST Interest paid P=2,188,101,637 P=3,684,720,812 P=6,468,552,306 Interest received 14,065,718,328 15,585,904,814 18,507,292,047
See accompanying Notes to Financial Statements.
PHILIPPINE SAVINGS BANK NOTES TO FINANCIAL STATEMENTS 1. Corporate Information
Philippine Savings Bank (the Bank) was incorporated in the Philippines primarily to engage in savings and mortgage banking. The Bank’s shares are listed in the Philippine Stock Exchange (PSE). The Bank offers a wide range of products and services such as deposit products, loans, treasury and trust functions that mainly serve the retail and consumer markets. On September 6, 1991, the Bank was authorized to perform trust functions.
As of December 31, 2021 and 2020, the Bank had 250 branches. In 2021, the Bank had 271 Automated Teller Machines (ATMs) in the branches (on-site) and 276 in other locations (off-site) bringing its total number of ATMs to 547 as of December 31, 2021 and 535 as of December 31, 2020. The Bank’s original Certificate of Incorporation was issued by the Securities and Exchange Commission (SEC) on June 30, 1959. On March 28, 2006, the Board of Directors (BOD) of the Bank approved the amendment of Article IV of its Amended Articles of Incorporation to extend the corporate term of the Bank, which expired on June 30, 2009, for another 50 years or up to June 30, 2059. This was subsequently approved by stockholders representing at least two-thirds of the outstanding capital stock of the Bank on April 25, 2006. The Amended Articles of Incorporation was approved by the SEC on September 27, 2006.
On April 27, 2010, by majority vote of the BOD and by stockholders representing two-thirds of the outstanding capital stock, the amendment of Article VI of its Amended Articles of Incorporation reducing the number of directors from a maximum of eleven (11) to a maximum of nine (9) has been approved. This was approved by the SEC on August 26, 2010.
On March 24, 2014, the BOD approved Article III of Articles of Incorporation to specify its principal address from Makati City to PSBank Center, 777 Paseo de Roxas corner Sedeño Street, Makati City 1226. The Amended Articles of Incorporation was approved by the SEC on December 22, 2014.
As of December 31, 2021 and 2020, Metropolitan Bank & Trust Company (MBTC), the Bank’s ultimate parent, owned 88.38% of the Bank.
2. Significant Accounting Policies
Basis of Preparation The accompanying financial statements have been prepared on a historical cost basis except for financial assets and financial liabilities at fair value through profit or loss (FVTPL) and financial assets at fair value through other comprehensive income (FVOCI) that have been measured at fair value. All values are rounded to the nearest peso unless otherwise stated.
The financial statements of the Bank include the accounts maintained in the Regular Banking Unit (RBU) and Foreign Currency Deposit Unit (FCDU). The functional currency of RBU and FCDU is Philippine Peso (PHP) and United States Dollar (USD), respectively. For financial reporting purposes, FCDU accounts and foreign currency-denominated accounts in the RBU are translated into their equivalents in Philippine peso (see accounting policy on Foreign Currency Translation). The financial statements of these units are combined after eliminating inter-unit accounts.
The financial statements provide comparative information in respect of the previous period. In addition, the Bank presents an additional statement of condition at the beginning of the earliest period presented when there is a retrospective application of an accounting policy, a retrospective restatement, or a reclassification of items in financial statements.
Statement of Compliance The financial statements of the Bank have been prepared in compliance with Philippine Financial Reporting Standards (PFRSs).

- 2 -
Presentation of Financial Statements The Bank presents its statements of condition in order of liquidity. An analysis regarding recovery of assets or settlement of liabilities within twelve (12) months after the statement of condition date (current) and more than 12 months after the statement of condition date (non-current) is presented in Note 20.
Financial assets and financial liabilities are offset and the net amount is reported in the statements of condition only when there is a legally enforceable right to offset the recognized amounts and there is an intention to settle on a net basis, or to realize the assets and settle the liability simultaneously. The Bank assesses that it has a currently enforceable right of offset if the right is not contingent on a future event, and is legally enforceable in the normal course of business, event of default, and event of solvency or bankruptcy of the Bank and all of the counterparties.
Income and expenses are not offset in the statements of income unless required or permitted by any accounting standard or interpretation, and as specifically disclosed in the accounting policies of the Bank.
Changes in Accounting Policies and Disclosures The accounting policies adopted are consistent with those of the previous financial year, except for the adoption of new standards effective as at January 1, 2021. The Bank has not early adopted any standard, interpretation or amendment that has been issued but is not yet effective. Unless otherwise indicated, adoption of these new standards did not have an impact on the financial statements of the Bank.
• Amendment to PFRS 16, COVID-19-related Rent Concessions beyond 30 June 2021 • Amendments to PFRS 9, PAS 39, PFRS 7, PFRS 4 and PFRS 16, Interest Rate Benchmark Reform - Phase 2 Summary of Significant Accounting Policies
Foreign Currency Translation The financial statements are presented in PHP, which is the Bank’s functional and presentation currency.
The books of accounts of the RBU are maintained in PHP, while those of the FCDU are maintained in USD.
RBU As at reporting date, foreign currency monetary assets and liabilities of the RBU are translated in PHP based on the Bankers Association of the Philippines (BAP) closing rate prevailing at the statement of condition date, and foreign currency-denominated income and expenses, at the exchange rates as at the dates of the transactions. Foreign exchange differences arising from restatements of foreign currency-denominated assets and liabilities in the RBU are credited to or charged against profit or loss in the year in which the rates change. Non-monetary items that are measured in terms of historical cost in a foreign currency are translated using the exchange rates as at the dates of the initial transactions. Non-monetary items measured at fair value in a foreign currency are translated using the exchange rates at the date when the fair value is determined.
FCDU As at reporting date, the assets and liabilities of the FCDU are translated to the Bank’s presentation currency (PHP) at the BAP closing rate prevailing at the statement of condition date, and its income and expenses are translated using the exchange rates as at the dates of the transactions. Exchange differences arising on translation to the presentation currency are taken to the statements of comprehensive income under ‘Cumulative translation adjustment’. Upon disposal of the FCDU or upon actual remittance of FCDU profits to RBU, the deferred cumulative amount recognized in the statements of comprehensive income is recognized in the statements of income. Fair Value Measurement The Bank measures financial instruments, such as FVTPL investments, financial assets at FVOCI and derivative financial instruments, at fair value at each statement of condition date. Also, fair values of financial instruments measured at amortized cost and non-financial assets such as investment properties are disclosed in Note 4.
- 3 -
Fair value is the estimated price that would be received to sell an asset or paid to transfer a liability in an orderly transaction between market participants at the measurement date. The fair value measurement is based on the presumption that the transaction to sell the asset or transfer the liability takes place either:
• in the principal market for the asset or liability, or • in the absence of a principal market, in the most advantageous market for the asset or liability.
The principal or most advantageous market must be accessible to the Bank.
The fair value of an asset or a liability is measured using the assumptions that market participants would use when pricing the asset or liability, assuming that market participants act in their economic best interest.
If an asset or a liability measured at fair value has a bid price and an ask price (e.g., an input from a dealer market), the price between the bid-ask spread that is most representative of fair value in the circumstances shall be used to measure fair value regardless of where the input is categorized within the fair value hierarchy.
A fair value measurement of a non-financial asset takes into account a market participant's ability to generate economic benefits by using the asset in its highest and best use or by selling it to another market participant that would use the asset in its highest and best use.
The Bank uses valuation techniques that are appropriate in the circumstances and for which sufficient data are available to measure fair value, maximizing the use of relevant observable inputs and minimizing the use of unobservable inputs.
All assets and liabilities for which fair value is measured or disclosed in the financial statements are categorized within the fair value hierarchy, described as follows, based on the lowest level input that is significant to the fair value measurement as a whole:
• Level 1 - Quoted (unadjusted) market prices in active markets for identical assets or liabilities • Level 2 - Valuation techniques for which the lowest level input that is significant to the fair value
measurement is directly or indirectly observable • Level 3 - Valuation techniques for which the lowest level input that is significant to the fair value
measurement is unobservable
For assets and liabilities that are recognized in the financial statements on a recurring basis, the Bank determines whether transfers have occurred between Levels in the hierarchy by re-assessing categorization (based on the lowest level input that is significant to the fair value measurement as a whole) at the end of each reporting period.
For the purpose of fair value disclosures, the Bank has determined classes of assets and liabilities on the basis of the nature, characteristics and risks of the asset and liability and the level of the fair value hierarchy as explained above.
Cash and Cash Equivalents For purposes of reporting cash flows, cash and cash equivalents include cash and other cash items, due from BSP and other banks, interbank loans receivable and securities purchased under resale agreements (SPURA) that are convertible to known amounts of cash which have original maturities of three months or less from date of placements and that are subject to an insignificant risk of changes in value. Due from BSP includes the statutory reserves required by the BSP which the Bank considers as cash equivalents as withdrawals can be made to meet the Bank’s cash requirements as allowed by the BSP.
Financial Instruments - Initial Recognition and Subsequent Measurement Date of recognition Purchases or sales of financial assets, except for derivatives, that require delivery of assets within the time frame established by regulation or convention in the marketplace are recognized on the settlement date. Derivative financial instruments are recognized on a trade date basis. Deposits, amounts due to banks and loans and receivables are recognized when cash is received by the Bank or advanced to the borrowers.

- 4 -
Initial recognition of financial instruments All financial instruments are initially measured at fair value. Except for financial assets and financial liabilities at FVTPL, the initial measurement of financial instruments includes transaction costs. Day 1’ difference Where the transaction price in a non-active market is different from the fair value from other observable current market transactions in the same instrument or based on a valuation technique whose variables include only data from observable market, the Bank recognizes the difference between the transaction price and fair value (a ‘Day 1’ difference) in the statement of income. In cases where the transaction price used is made of data which is not observable, the difference between the transaction price and model value is only recognized in the statement of income when the inputs become observable or when the instrument is derecognized. For each transaction, the Bank determines the appropriate method of recognizing the ‘Day 1’ difference amount.
Financial Instruments – Classification and Subsequent Measurement Financial assets are measured at FVTPL unless these are measured at FVOCI or at amortized cost. Financial liabilities are classified as either financial liabilities at FVTPL or financial liabilities at amortized cost. The classification of financial assets depends on the contractual terms and the business model for managing the financial assets. Subsequent to initial recognition, the Bank may reclassify its financial assets only when there is a change in its business model for managing these financial assets. Reclassification of financial liabilities is not allowed.
The Bank determines its business model at the level that best reflects how it manages groups of financial assets to achieve its business objective. The Bank’s business model is not assessed on an instrument-by-instrument basis, but at a higher level of aggregated portfolios. As a second step of its classification process, the Bank assesses the contractual terms of financial assets to identify whether they pass the contractual cash flows test (SPPI test). Investments at FVTPL Financial assets or financial liabilities at FVTPL Financial assets and financial liabilities at FVTPL include financial assets and financial liabilities held for trading purposes and derivative instruments.
Financial instruments held-for-trading Financial assets or financial liabilities held for trading (HFT) are recorded in the statements of condition at fair value. Included in this classification are debt securities which have been acquired principally for the purpose of selling in the near term. Changes in fair value relating to the HFT positions are recognized in ‘Trading and securities gains (losses) - net’. Interest earned or incurred is recorded as interest income or expense, respectively, while dividend income is recorded in other operating income under ‘Miscellaneous’ when the right to receive payment has been established.
Derivatives recorded at FVTPL Derivative financial instruments are initially recorded at fair value on the date at which the derivative contract is entered into and are subsequently remeasured at fair value. Any gains or losses arising from changes in fair values of derivatives (except those accounted for as cash flow hedges) are taken directly to the statements of income and are included in ‘Foreign exchange gain - net’. Derivatives are carried as assets when the fair value is positive and as liabilities when the fair value is negative. As of December 31, 2021 and 2020, derivatives consist of Republic of the Philippines (ROP) paired warrants acquired to manage the Bank’s foreign currency risk, lower the risk-weighted assets and improve the capital adequacy ratio of the Bank. Financial assets at FVOCI Financial assets at FVOCI include debt and equity securities. After initial measurement, investment securities at FVOCI are subsequently measured at fair value. The unrealized gains and losses arising from the fair valuation of financial assets at FVOCI are excluded, net of tax as applicable, from the reported earnings and are included in the statements of comprehensive income as ‘Fair value reserves on financial assets at FVOCI’.
Debt securities at FVOCI are those that meet both of the following conditions: (i) the asset is held within a business model whose objective is to hold the financial assets in order to both collect contractual cash flows and sell financial assets; and (ii) the contractual terms of the financial asset give rise on specified dates to cash flows

- 5 -
that are SPPI on the outstanding principal amount. The effective yield component of debt securities at FVOCI, as well as the impact of restatements on foreign currency-denominated debt securities at FVOCI, is reported in the statements of income. Interest earned on holding debt securities at FVOCI are reported as ‘Interest income’ using the effective interest method. When the debt securities at FVOCI are disposed of, the cumulative gain or loss previously recognized in the statements of comprehensive income is recognized as ‘Trading and securities gain (loss) - net’ in the statements of income. The ECL arising from impairment of such investments are recognized in OCI with a corresponding charge to ‘Provision for credit and impairment losses’ in the statements of income.
Equity securities designated at FVOCI are those that the Bank made an irrevocable election to present in OCI the subsequent changes in fair value. Dividends earned on holding equity securities at FVOCI are recognized in the statements of income as ‘Dividends’ when the right to receive payment has been established, except when the Bank benefits from such proceeds as a recovery of part of the cost of the instrument, in which case, such gains are recorded in OCI. Gains and losses on disposal of these equity securities are never recycled to profit or loss, but the cumulative gain or loss previously recognized in the statements of comprehensive income is reclassified to ‘Surplus’ or any other appropriate equity account upon disposal. Equity securities at FVOCI are not subject to impairment assessment.
Financial assets at amortized cost Financial assets at amortized cost are debt financial assets that meet both of the following conditions: (i) these are held within a business model whose objective is to hold the financial assets in order to collect contractual cash flows; and (ii) the contractual terms give rise on specified dates to cash flows that are SPPI on the outstanding principal amount. This accounting policy relates to the statements of condition captions ‘Due from BSP’, ‘Due from other banks’, ‘Interbank loans receivable and SPURA’, ‘Investment securities at amortized cost’ and ‘Loans and receivables’.
After initial measurement, financial assets at amortized cost are subsequently measured at amortized cost using the effective interest method, less impairment in value. Amortized cost is calculated by taking into account any discount or premium on acquisition and fees that are an integral part of the effective interest rate (EIR). The amortization is included in ‘Interest income’ in the statements of income. Gains and losses are recognized in statements of income when these investments are derecognized or impaired, as well as through the amortization process. The ECL are recognized in the statements of income under ‘Provision for credit and impairment losses’. The effects of revaluation on foreign currency denominated investments are recognized in the statements of income.
Other financial liabilities carried at amortized cost This category represents issued financial instruments or their components, which are not designated at FVTPL and comprises deposit liabilities, bills payable, subordinated notes, treasurer’s, cashier’s and manager’s checks, accrued interest payable, accrued other expenses payable, accounts payable, bills purchased-contra, other credits, dividends payable, deposits for keys-safety deposit boxes (SDB), and overages, where the substance of the contractual arrangement results in the Bank having an obligation either to deliver cash or another financial asset to the holder, or to satisfy the obligation other than by the exchange of a fixed amount of cash or another financial asset for a fixed number of own equity shares.
After initial measurement, financial liabilities not qualified and not designated as FVTPL are subsequently measured at amortized cost using the effective interest amortization method. Amortized cost is calculated by taking into account any discount or premium on the issue and fees that are an integral part of the EIR.
A compound financial instrument which contains both a liability and an equity component is separated at the issue date. A portion of the net proceeds of the instrument is allocated to the debt component on the date of issue based on its fair value (which is generally determined based on quoted market prices for similar debt instruments). The residual amount determined after deducting the fair value of the debt component is assigned to the equity component. The value of any derivative features (such as a call option) embedded in the compound financial instrument other than the equity component is included in the debt component.
Financial Guarantees and Undrawn Loan Commitments The Bank issues financial guarantees and loan commitments. Financial guarantees are those issued by the Bank to creditors as allowed under existing rules and regulations whereby it guarantees third party obligations by

- 6 -
signing as guarantor in the contract/agreement. Undrawn loan commitments and letters of credit are commitments under which over the duration of the commitment, the Bank is required to provide a loan with pre-specified terms to the customer. The nominal contractual value of financial guarantees and undrawn loan commitments, where the loan agreed to be provided is on market terms, are not recorded in the statement of financial position. These contracts are in the scope of the ECL requirements where the Bank estimates the expected portion of the undrawn loan commitments that will be drawn over their expected life. The ECL related to financial guarantees and undrawn loan commitments is recognized in ‘Miscellaneous liabilities’ under ‘Other liabilities’.
Derecognition of Financial Assets and Liabilities Financial assets A financial asset (or, where applicable a part of a financial asset or part of a group of financial assets) is primarily derecognized when:
• the rights to receive cash flows from the asset have expires; • the Bank retains the right to receive cash flows from the asset, but has assumed an obligation to pay them in
full without material delay to a third party under a 'pass-through 'arrangement; • the Bank has transferred its rights to receive cash flows from the asset and either:
a. the Bank has transferred substantially all the risks and rewards of the asset or b. the Bank has neither transferred nor retained the risks and rewards of the asset but has transferred
control over the asset.
Where the Bank has transferred its rights to receive cash flows from an asset or has entered into a ‘pass-through’ arrangement, and has neither transferred nor retained substantially all the risks and rewards of the asset nor is transferred control over the asset, the asset recognized to the extent of the Bank’s continuing involvement in the asset. In this case, the Bank also recognizes an associated liability. The transferred asset and the associated liability are measured on a basis that reflects the rights and obligations that the Bank has retained.
Continuing involvement that takes the form of a guarantee over the transferred asset is measured at the lower of original carrying amount of the asset and the maximum amount of consideration that the Bank could be required to repay.
Financial assets are written off either partially or in their entirety only when the Bank has stopped pursuing the recovery. If a write-off is later recovered, any amounts formerly charged are credited to ‘Recovery on charged-off assets’ under ‘Miscellaneous income’ in the statements of income. Modification of financial assets The Bank derecognizes a financial asset when the terms and conditions have been renegotiated to the extent that, substantially, it becomes a new asset, with the difference between its carrying amount and the fair value of the new asset recognized as a derecognition gain or loss in profit or loss, to the extent that an impairment loss has not already been recorded. The Bank considers both qualitative and quantitative factors in assessing whether a modification of financial asset is substantial or not. When assessing whether a modification is substantial, the Bank considers the following factors, among others: • Change in currency • Introduction of an equity feature • Change in counterparty • If the modification results in the asset no longer considered “solely payment for principal and interest” The Bank also performs a quantitative assessment similar to that being performed for modification of financial liabilities. In performing the quantitative assessment, the Bank considers the new terms of a financial asset to be substantially different if the present value of the cash flows under the new terms, including any fees paid net of any fees received and discounted using the original effective interest rate, is at least 10% different from the present value of the remaining cash flows of the original financial asset.
- 7 -
When the contractual cash flows of a financial asset are renegotiated or otherwise modified and the renegotiation or modification does not result in the derecognition of that financial asset, the Bank recalculates the gross carrying amount of the financial asset as the present value of the renegotiated or modified contractual cash flows discounted at the original EIR (or credit-adjusted EIR for purchased or originated credit-impaired financial assets) and recognizes a modification gain or loss in the statement of income. When the modification of a financial asset results in the derecognition of the existing financial asset and the subsequent recognition of a new financial asset, the modified asset is considered a ‘new’ financial asset. Accordingly, the date of the modification shall be treated as the date of initial recognition of that financial asset when applying the impairment requirements to the modified financial asset. The newly recognized financial asset is classified as Stage 1 for ECL measurement purposes, unless the new financial asset is deemed to be originated as credit impaired (POCI).
Financial liabilities A financial liability (or a part of a financial liability) is derecognized when the obligation under the liability is discharged, cancelled or has expired. Where an existing financial liability is replaced by another from the same lender on substantially different terms, or the terms of an existing liability or a part of it are substantially modified, such an exchange or modification is treated as a derecognition of the original financial liability and the recognition of a new financial liability, and the difference in the respective carrying amounts is recognized in the statement of income. Exchange or modification of financial liabilities The Bank considers both qualitative and quantitative factors in assessing whether a modification of financial liabilities is substantial or not. The terms are considered substantially different if the present value of the cash flows under the new terms, including any fees paid net of any fees received and discounted using the original effective interest rate, is at least 10% different from the present value of the remaining cash flows of the original financial liability. However, under certain circumstances, modification or exchange of a financial liability may still be considered substantial, even where the present value of the cash flows under the new terms is less than 10% different from the present value of the remaining cash flows of the original financial liability. There may be situations where the modification of the financial liability is so fundamental that immediate derecognition of the original financial liability is appropriate (e.g., restructuring a financial liability to include an embedded equity component). When an existing financial liability is replaced by another from the same lender on substantially different terms, or the terms of an existing liability are substantially modified, such an exchange or modification is treated as a derecognition of the original liability and the recognition of a new liability. The difference between the carrying value of the original financial liability and the fair value of the new liability is recognized in profit or loss. When the exchange or modification of the existing financial liability is not considered as substantial, the Bank recalculates the gross carrying amount of the financial liability as the present value of the renegotiated or modified contractual cash flows discounted at the original EIR and recognizes a modification gain or loss in profit or loss. If modification of terms is accounted for as an extinguishment, any costs or fees incurred are recognized as part of the gain or loss on the extinguishment. If the modification is not accounted for as an extinguishment, any costs or fees incurred adjust the carrying amount of the financial instrument and are amortized over the remaining term of the modified financial instrument. Repurchase and Reverse Repurchase Agreements Securities sold under agreements to repurchase (SSURA) at a specified future date (‘repos’) are not derecognized from the statements of condition as the Bank retains substantially all the risks and rewards of ownership. The corresponding cash received, including accrued interest, is recognized in the statements of condition as a loan to the Bank under ‘Bills payable’, reflecting the economic substance of such transaction.
Conversely, SPURA at a specified future date (‘reverse repos’) are not recognized in the statements of condition. The consideration paid, including accrued interest, is recognized in the statements of condition as SPURA, and is
- 8 -
considered a loan to the counterparty. The difference between the purchase price and resale price is treated as interest income and is accrued over the life of the agreement using the effective interest amortization method. Reclassification of Financial Assets The Bank reclassifies its financial assets when there is a change in its business model for managing financial assets. A change in business model occurs when the Bank either begins or ceases to perform an activity that is significant to its operations. The Bank applies the reclassification prospectively from the reclassification date and does not restate any previously recognized gains, losses or interest.
Impairment of Financial Assets PFRS 9 requires the Bank to record ECL for all loans and other debt financial assets not classified as at FVTPL, together with loan commitments and financial guarantee contracts.
Expected credit loss methodology ECL represent credit losses that reflect an unbiased and probability-weighted amount which is determined by evaluating a range of possible outcomes, the time value of money and reasonable and supportable information about past events, current conditions and forecasts of future economic conditions. The objective is to record lifetime losses on all financial instruments which have experienced a significant increase in credit risk (SICR) since their initial recognition. As a result, ECL allowances are now measured at amounts equal to either (i) 12-month ECL or (ii) lifetime ECL for those financial instruments which have experienced a SICR since initial recognition (General Approach). The 12-month ECL is the portion of lifetime ECL that results from default events on a financial instrument that are possible within the 12 months after the reporting date. Lifetime ECL are credit losses that result from all possible default events over the expected life of a financial instrument. In comparison, the previous incurred loss model recognizes lifetime credit losses only when there is objective evidence of impairment.
Staging assessment For non-credit-impaired financial instruments: • Stage 1 is comprised of all non-impaired financial instruments which have not experienced a SICR since
initial recognition. The Bank recognizes a 12-month ECL for Stage 1 financial instruments. • Stage 2 is comprised of all non-impaired financial instruments which have experienced a SICR since initial
recognition. The Bank recognizes a lifetime ECL for Stage 2 financial instruments.
For credit-impaired financial instruments: • Financial instruments are classified as Stage 3 when there is objective evidence of impairment as a result of
one or more loss events that have occurred after initial recognition with a negative impact on the estimated future cash flows of a loan or a portfolio of loans. The ECL model requires that lifetime ECL be recognized for impaired financial instruments.
Definition of “default” and “cure” As a part of a qualitative assessment of whether a customer is in default, the Bank considers a variety of instances that may indicate unlikeliness to pay. The Bank’s definition of default is aligned with the non-performing loan criteria as prescribed in BSP Circular No. 941. Defaults refer to loans, investments, receivables, or any financial asset, even without any missed contractual payments, that satisfy any of the following conditions (1) impaired under existing accounting standards, (2) classified as doubtful or loss, (3) in litigation, (4) and/or there is evidence that full repayment of principal and interest is unlikely without foreclosure of collateral, if any. All other loans, even if not considered impaired, shall be considered non-performing if any principal and/or interest are unpaid for more than ninety (90) days from contractual due date, or accrued interests for more than ninety (90) days have been capitalized, refinanced, or delayed by agreement. Restructured loans shall be considered non-performing. However, if prior to restructuring, the loans were categorized as performing, such classification shall be retained. Defaults are characterized by financial assets that have objective evidence of impairment at the reporting date and as such classified under Stage 3 ECL treatment.
An instrument is considered to be no longer in default, i.e., to have cured, when it no longer meets any of the default criteria above and there is sufficient evidence to support full collection thru payments received for at least 6 months. Cured accounts are classified under Stage 1 ECL treatment.

- 9 -
Significant increase in credit risk (SICR) The criteria for determining whether credit risk has increased significantly vary by portfolio and include quantitative changes in probabilities of default and qualitative factors, including a backstop based on delinquency. The credit risk of a particular exposure is deemed to have increased significantly since initial recognition if, based on the Bank’s quantitative models, the borrower or counterparty’s credit rating has deteriorated by at least 2 notches. On the other hand, if based on the Bank’s internal credit assessment, the borrower or counterparty is determined to require close monitoring or with well-defined credit weaknesses, then credit risk may have significantly increased as well. Moreover, if contractual payments are more than 30 days past due threshold, the credit risk is deemed to have increased significantly since initial recognition. Days past due are determined by counting the number of days since the earliest elapsed due date in respect of which amortized payment has not been received. Due dates are determined without considering any grace period that might be available to the borrower. In subsequent reporting periods, if the credit risk of the financial instrument improves such that there is no longer a SICR since initial recognition, the Bank shall revert to recognizing a 12-month ECL.
Restructuring In certain circumstances, the Bank modifies the original terms and conditions of a credit exposure to form a new loan agreement or payment schedule. The modifications can be given depending on the borrower’s or counterparty’s current or expected financial difficulty. The modifications may include, but are not limited to, changes in maturity date, principal amount from capitalization of accrued interest, terms and conditions from conversion/consolidation or interest rates/repricing cycle that results in an extension in the loan maturity. Distressed restructuring with indications of unlikeliness to pay are categorized as impaired accounts and are initially moved to Stage 3.
The Bank implements a curing policy for restructured accounts compliant with BSP Circular No. 1011. Restructured accounts that have exhibited improvements in creditworthiness may be moved from Stage 3 after a total of one-year probation period. These accounts are transferred to Stage 2 after six months of full payments and consequently transferred to Stage 1 after making the next six months of full payments.
ECL parameters and methodologies ECL is a function of the probability of default (PD), exposure at default (EAD) and loss given default (LGD) with each of the parameter independently modelled.
The PD represents the likelihood that a credit exposure will not be repaid and will go into default in either a 12-month horizon for Stage 1 or lifetime horizon for Stage 2. The PD for each individual instrument is modelled based on historical data and is estimated based on current market conditions and reasonable and supportable information about future economic conditions. The Bank segmented its credit exposures based on homogenous risk characteristics and developed a corresponding PD methodology for each portfolio. The PD methodology for each relevant portfolio is determined based on the underlying nature or characteristic of the portfolio, behavior of the accounts and materiality of the segment as compared to the total portfolio.
EAD is modelled on historical data and represents an estimate of the outstanding amount of credit exposure at the time a default may occur. For off-balance sheet and undrawn amounts, EAD includes an estimate of any further amounts to be drawn at the time of default. LGD is the amount that may not be recovered in the event of default and is modelled based on historical cash flow recovery and reasonable and supportable information about future economic conditions, where appropriate. LGD takes into consideration the amount and quality of any collateral held.
Economic overlays and multiple economic scenarios The Bank incorporates economic overlays into the measurement of ECL to add a forward-looking risk measure parallel to multiple future macroeconomic atmosphere expectations. A broad range of economic indicators were considered for the economic inputs, such as GDP, GIR change, CPI change, PSE indices, foreign exchange rates and other BSP statistical indicators. The inputs and models used for calculating ECL may not always capture all characteristics of the market at the date of the financial statements. To address this, quantitative adjustments or overlays are occasionally made as temporary adjustments when such differences are significantly material.
- 10 -
The Bank’s loans and receivables consist of different portfolios, such as consumption, real estate, commercial and personal loans, as well as other receivables (e.g., sales contract receivables). In compliance with PFRS 9, the Bank developed ECL parameters and methodologies for each portfolio, using historical data as well as forward-looking inputs and assumptions.
Restructured loans Where possible, the Bank seeks to restructure loans rather than to take possession of collateral. This may involve extending the payment arrangements and the agreement on new loan conditions. Once the terms have been renegotiated, any impairment is measured using the original EIR as calculated before the modification of terms and the loan is no longer considered past due.
Management continuously reviews restructured loans to ensure that all criteria are met and that future payments are likely to occur. The loans continue to be subjected to an individual or collective impairment assessment, calculated using the loan’s original EIR if the original loan has a fixed interest rate and the current repriced rate if the original loan is repriceable. The difference between the recorded value of the original loan and the present value of the restructured cash flows, discounted at the applicable interest rate, is recognized in ‘Provision for credit and impairment losses’ in the statements of income.
Investment in a Joint Venture A joint venture is a type of joint arrangement whereby the parties that have joint control of the arrangement have rights to the net assets of the joint venture. Joint control is the contractually agreed sharing of control of an arrangement, which exists only when decisions about the relevant activities require unanimous consent of the parties sharing control.
The considerations made in determining significant influence or joint control are similar to those necessary to determine control over subsidiaries.
The Bank’s investment in its joint venture is accounted for using the equity method. Under the equity method, the investment in a joint venture is initially recognized at cost. The carrying amount of the investment is adjusted to recognize changes in the Bank’s share of net assets of the joint venture since the acquisition date. Goodwill relating to the joint venture is included in the carrying amount of the investment and is neither amortized nor individually tested for impairment.
The statement of income reflects the Bank’s share of the results of operations of the joint venture. Any change in OCI of those investees is presented as part of the Bank’s OCI. In addition, when there has been a change recognized directly in the equity of the joint venture, the Bank recognizes its share of any changes, when applicable, in the statement of changes in equity. Unrealized gains and losses resulting from transactions between the Bank and joint venture are eliminated to the extent of the interest in the joint venture.
The aggregate of the Bank’s share of profit or loss of a joint venture is shown on the face of the statement of income outside operating profit and represents profit or loss after tax and non-controlling interests in the subsidiaries of the joint venture.
The financial statements of a joint venture are prepared for the same reporting period as the Bank. The length of the reporting period is the same from period to period. When necessary, adjustments are made to bring the accounting policies in line with those of the Bank.
After application of the equity method, the Bank determines whether it is necessary to recognize an impairment loss on its investment in its joint venture. At each statement of condition date, the Bank determines whether there is objective evidence that the investment in the joint venture is impaired. If there is such evidence, the Bank calculates the amount of impairment as the difference between the recoverable amount of the joint venture and its carrying value, then recognizes the loss as ‘Share in net income of a joint venture’ in the statements of income.
Upon loss of joint control over the joint venture, the Bank measures and recognizes any retained investment at its fair value. Any difference between the carrying amount of the joint venture upon loss of joint control and the fair value of the retained investment and proceeds from disposal is recognized in profit or loss.
- 11 -
Property and Equipment Land is stated at cost less any impairment in value, while depreciable properties, including building, furniture, fixtures and equipment, and leasehold improvements, are stated at cost less accumulated depreciation and any accumulated impairment losses. The initial cost of property and equipment consists of its purchase price and any directly attributable costs of bringing the asset to its working condition and location for its intended use. Expenditures incurred after the assets have been put into operation, such as repairs and maintenance, are normally charged against profit or loss in the year in which the costs are incurred. In situations where it can be clearly demonstrated that the expenditures have resulted in an increase in the future economic benefits expected to be obtained from the use of property and equipment beyond its originally assessed standard of performance, the expenditures are capitalized as additional cost of property and equipment.
Depreciation is calculated using the straight-line method to write down the cost of the property and equipment to their residual values over their estimated useful lives. Land is not depreciated. The estimated useful lives are as follows:
Buildings 25-50 years Furniture, fixtures and equipment 3-5 years, depending on the type of assets Leasehold improvements 5 years or the term of the related lease,
whichever is shorter The assets’ residual values, useful lives and methods of depreciation are reviewed, and adjusted if appropriate, at each financial year-end to ensure that these are consistent with the expected pattern of economic benefits from the items of property and equipment.
An item of property and equipment is derecognized upon disposal or when no future economic benefits are expected from its use or disposal. Any gain or loss arising on derecognition of the asset (calculated as the difference between the net disposal proceeds and the carrying amount of the asset) is included in the statement of income in the year the asset is derecognized.
The carrying values of property and equipment are reviewed for impairment when events or changes in circumstances indicate the carrying value may not be recoverable. If any such indication exists and where the carrying values exceed the estimated recoverable amount, the asset is written down to its recoverable amount.
Leases Bank as lessee The Bank assesses at contract inception whether a contract is, or contains, a lease. That is, if the contract conveys the right to control the use of an identified asset for a period of time in exchange for consideration. The Bank applies a single recognition and measurement approach for all leases, except for short-term leases and leases of low-value assets. The Bank recognizes lease liabilities to make lease payments and right-of-use assets representing the right to use the underlying assets. i. Right-of-use assets
The Bank recognizes right-of-use assets (included in ‘Property and Equipment’) at the commencement date of the lease (i.e., the date the underlying asset is available for use). Right-of-use assets are measured at cost, less any accumulated depreciation and impairment losses, and adjusted for any remeasurement of lease liabilities. The cost of right-of-use assets includes the amount of lease liabilities recognized, initial direct costs incurred, and lease payments made at or before the commencement date less any lease incentives received. Right-of-use assets are depreciated on a straight line basis over the shorter of the lease term and estimated useful lives of the assets as follows:
Office space and warehouses 1 to 20 years ATM space 1 to 3 years
ii. Lease liabilities At the commencement date of the lease, the Bank recognizes lease liabilities measured at the present value of lease payments to be made over the lease term. The lease payments include fixed payments (including in-substance fixed payments) less any lease incentives receivable, variable lease payments that depend on an
- 12 -
index or a rate, and amounts expected to be paid under residual value guarantees. The lease payments also include the exercise price of a purchase option reasonably certain to be exercised by the Bank and payments of penalties for terminating a lease, if the lease term reflects the Bank exercising the option to terminate. Variable lease payments that do not depend on an index or a rate are recognized as expense (unless they are incurred to produce inventories) in the period on which the event or condition that triggers the payment occurs.
In calculating the present value of lease payments, the Bank uses its incremental borrowing rate at the lease commencement date because the interest rate implicit in the lease is not readily determinable. After the commencement date, the amount of lease liabilities is increased to reflect the accretion of interest and reduced for the lease payments made. In addition, the carrying amount of lease liabilities is remeasured if there is a modification, a change in the lease term, a change in the lease payments (e.g., changes to future payments resulting from a change in an index or rate used to determine such lease payments) or a change in the assessment of an option to purchase the underlying asset. The Bank recognizes right-of-use assets and lease liabilities, except for short-term leases and leases of low-value assets. The right-of-use assets were recognized based on the amount equal to the lease liabilities, adjusted for any related prepaid and accrued lease payments previously recognized. Lease liabilities are recognized based on the present value of the remaining lease payments, discounted using the incremental borrowing rate at the date of initial application.
Determining the lease term of contracts with renewal options The Bank determines the lease term as the non-cancellable term of the lease, together with any periods covered by an option to extend the lease if it is reasonably certain to be exercised, or any periods covered by an option to terminate the lease, if it is reasonably certain not to be exercised.
After the commencement date, the Bank reassesses the lease term if there is a significant event or change in circumstances that are within its control and affects its ability to exercise (or not to exercise) the option to renew (e.g., a change in business strategy).
The Bank’s lease liabilities are included in ‘Other Liabilities’.
iii. Short-term leases and leases of low-value assets
The Bank applies the short-term lease recognition exemption to its short-term leases of office equipment (i.e., those leases that have a lease term of 12 months or less from the commencement date and do not contain a purchase option). It also applies the lease of low-value assets recognition exemption to leases of ATMs and office equipment that are considered of low value (i.e., P=250,000 and below). Lease payments on short-term leases and leases of low-value assets are recognized as expense on a straight-line basis over the lease term.
Investment Properties Investment properties are measured initially at cost, including transaction costs. An investment property acquired through an exchange transaction is measured at the fair value of the asset acquired unless the fair value of such asset cannot be measured, in which case the investment property acquired is measured at the carrying amount of the asset given up. The difference between the fair value of the asset received and the carrying amount of the asset given up is recorded as ‘Gain on foreclosure of real assets and other properties acquired’ under ‘Gain on foreclosure and sale of investment properties’. Foreclosed properties are classified under investment properties from foreclosure date. Expenditures incurred after the investment properties are recognized, such as repairs and maintenance costs, are normally charged to income in the period in which the costs are incurred. Subsequent to initial recognition, investment properties are carried at cost less accumulated depreciation and impairment in value, except for land which is stated at cost less impairment in value. Depreciation is calculated using the straight-line method over the remaining useful lives from the time of acquisition of the investment properties. The estimated useful life of building and condominium units ranges from 10 to 40 years. Investment properties are derecognized when they have either been disposed of or when the investment property is permanently withdrawn from use and no future benefit is expected from its disposal. Any gains or losses on the

- 13 -
retirement or disposal of an investment property are recognized in the statement of income in ‘Gain on foreclosure and sale of investment properties - net’ in the year of retirement or disposal.
Transfers are made to investment properties when, and only when, there is a change in use evidenced by ending of owner occupation, commencement of an operating lease to another party or ending of construction or development. Transfers are made from investment properties when, and only when, there is a change in use evidenced by commencement of owner occupation or commencement of development with a view to sale.
Chattel Mortgage Properties Chattel mortgage properties comprise of repossessed vehicles. Chattel mortgage properties are stated at cost less accumulated depreciation and impairment in value. Chattel mortgage properties acquired are initially recognized at fair value. Depreciation is calculated using the straight-line method over the remaining useful lives from the time of acquisition of the vehicles. The useful lives of chattel mortgage properties are estimated to be five years. Chattel mortgage properties are derecognized when they have either been disposed of or when the chattel mortgage property is permanently withdrawn from use and no future benefit is expected from its disposal. Any gains or losses on disposal of chattel mortgage properties are recognized in the statements of income under ‘Gain (loss) on foreclosure and sale of chattel mortgage properties- net’ in the year of disposal.
Intangible Assets The Bank’s intangible assets include branch licenses and computer software. An intangible asset is recognized only when the cost can be measured reliably, and it is probable that the expected future economic benefits that are attributable to it will flow to the Bank.
Intangible assets acquired separately are measured on initial recognition at cost. The cost of intangible assets acquired in a business combination is its fair value as at the date of acquisition. Following initial recognition, intangible assets are carried at cost less any accumulated amortization and any accumulated impairment losses. Internally generated intangible assets, excluding capitalized development costs, are not capitalized and expenditure is reflected in the statements of income in the year in which the expenditure is incurred.
The useful lives of intangible assets are assessed to be either finite or indefinite. Intangible assets with finite lives are amortized over the useful economic life and assessed for impairment whenever there is an indication that the intangible assets may be impaired. The amortization period and the amortization method for an intangible asset with a finite useful life are reviewed at least at each financial year-end. Changes in the expected useful life or the expected pattern of consumption of future economic benefits embodied in the asset is accounted for by changing the amortization period or method, as appropriate, and they are treated as changes in accounting estimates. The amortization expense on intangible assets with finite lives is recognized in the statements of income under ‘Amortization of intangible assets’. Intangible assets with indefinite useful lives are tested for impairment annually either individually or at the cash-generating unit (CGU) level. Such intangibles are not amortized. The useful life of an intangible asset with an indefinite life is reviewed annually to determine whether indefinite life assessment continues to be supportable. If not, the change in the useful life assessment from indefinite to finite is made on a prospective basis.
Gains or losses arising from the derecognition of an intangible asset are measured as the difference between the net disposal proceeds and the carrying amount of the asset and are recognized in the statements of income when the asset is derecognized. Branch licenses Branch licenses arise from the acquisition of branches from local banks and licenses to operate new branches from the BSP. Branch licenses have indefinite useful lives and are tested for impairment on an annual basis.
Software costs Software costs are carried at cost less accumulated amortization and any impairment in value. Given the history of rapid changes in technology, computer software are susceptible to technological obsolescence. Therefore, it is likely that their useful life is short. Software costs are amortized on a straight-line basis over five years but maybe shorter depending on the period over which the Bank expects to use the asset.
- 14 -
Impairment of Non-financial Assets Property and equipment, investment properties and chattel mortgage properties At each statement of condition date, the Bank assesses whether there is any indication that its non-financial assets may be impaired. When an indicator of impairment exists or when an annual impairment testing for an asset is required, the Bank makes a formal estimate of the recoverable amount. An asset’s recoverable amount is the higher of an asset’s or CGU’s fair value less costs to sell and its value in use and is determined for an individual asset, unless the asset does not generate cash inflows that are largely independent of those from other assets or groups of assets, in which case the recoverable amount is assessed as part of the CGU to which it belongs. Where the carrying amount of an asset or CGU exceeds its recoverable amount, the asset is considered impaired and is written down to its recoverable amount.
In assessing value in use, the estimated future cash flows are discounted to their present value using a pre-tax discount rate that reflects current market assessments of the time value of money and the risks specific to the asset. In determining fair value less cost to sell, an appropriate valuation model is used. These calculations are corroborated by valuation multiples and other available fair value indicators.
An impairment loss is charged to operations in the year in which it arises.
An assessment is made at each statement of condition date as to whether there is any indication that previously recognized impairment losses may no longer exist or may have decreased. If such indication exists, the Bank estimates the asset’s or CGU’s recoverable amount. A previously recognized impairment loss is reversed only if there has been a change in the estimates used to determine the asset’s recoverable amount since the last impairment loss was recognized. The reversal is limited so that the carrying amount of the asset does not exceed its recoverable amount, nor exceeds the carrying amount that would have been determined, net of depreciation, had no impairment loss been previously recognized. Such reversal is recognized in the statement of income. After such reversal, the depreciation expense is adjusted in future years to allocate the asset’s revised carrying amount, less any residual value, on a systematic basis over its remaining life.
Goodwill Goodwill is reviewed for impairment, annually or more frequently if events or changes in circumstances indicate that the carrying value may be impaired.
Impairment is determined for goodwill by assessing the recoverable amount of the CGU (or group of CGU) to which the goodwill relates. Where the recoverable amount of the CGU (or group of CGU) is less than the carrying amount of the CGU (or group of CGU) to which goodwill has been allocated, an impairment loss is recognized immediately in the statements of income. Impairment losses relating to goodwill cannot be reversed for subsequent increases in its recoverable amount in future periods. The Bank performs its annual impairment test of goodwill as at December 31 of each year.
Intangible assets Intangible assets with indefinite useful lives are tested for impairment annually as at December 31 of each year, either individually or at the CGU level, as appropriate.
Intangible assets with finite lives are assessed for impairment whenever there is an indication that the intangible asset may be impaired.
Investment in a joint venture After application of the equity method, the Bank determines whether it is necessary to recognize an impairment loss on the Bank’s investment in a joint venture. The Bank determines at each statement of condition date whether there is any objective evidence that the investment a joint venture is impaired. If this is the case, the Bank calculates the amount of impairment as being the difference between the fair value of the investment in the joint venture and the carrying amount and recognizes such amount in the statements of income.
Common Stock Common stocks are recorded at par. Proceeds in excess of par value are recognized under equity as ‘Capital paid in excess of par value’ in the statements of condition. Incremental costs incurred which are directly attributable to the issuance of new shares are shown in equity as a deduction from proceeds, net of tax.
- 15 -
Revenue Recognition Revenue from contracts with customers is recognized upon transfer of services to the customer at an amount that reflects the consideration to which the Bank expects to be entitled in exchange for those services. The Bank assesses its revenue arrangements against specific criteria in order to determine if it is acting as a principal or agent. The Bank concluded that it is acting as a principal in all of its revenue arrangements.
Service fees and commission income Fees or components of fees that are linked to a certain performance are recognized after fulfilling the corresponding criteria. These fees include remittance fees, commissions, deposit-related and other credit-related fees.
Income from sale of property and equipment, investment property and chattel mortgage properties Income from sale of property and equipment, investment property and chattel mortgage properties is included in the profit or loss when the property is derecognized. The gain or loss arising from the derecognition of the property is determined as the difference between the net disposal proceeds and its carrying amount on the date of the transaction.
Revenue outside the scope of PFRS 15 Interest income For all financial instruments measured at amortized cost and interest-bearing financial instruments classified as financial assets at FVOCI investments, interest income is recorded at the EIR, which is the rate that exactly discounts estimated future cash receipts through the expected life of the financial instrument or a shorter period, where appropriate, to the net carrying amount of the financial asset. The calculation takes into account all contractual terms of the financial instrument (for example, prepayment options), including any fees or incremental costs that are directly attributable to the instrument and are an integral part of the EIR.
The carrying amount of the financial asset or financial liability is adjusted if the Bank revises its estimates of payments or receipts. The adjusted carrying amount is calculated based on the original EIR and the change in carrying amount is recorded as ‘Interest income’.
Under PFRS 9, when a financial asset becomes credit-impaired and is, therefore, regarded as Stage 3 (as discussed in “Impairment of Financial Assets” above), the Bank calculates interest income by applying the EIR to the net amortized cost of the financial asset. If the financial asset cures and is no longer credit-impaired, the Bank reverts to calculating interest income on a gross basis.
Recovery on charged-off assets Income arising from collections on accounts or recoveries from impairment of items previously written off are recognized in the year of recovery.
Trading and securities gains (losses) - net Trading and securities gain (loss) represents results arising from trading activities, including all gains and losses from changes in the fair values of FVTPL investments. It also includes gains and losses realized from sale of debt securities at FVOCI.
Realized gains and losses on disposals of FVTPL investments are calculated using weighted average method. It represents the difference between an instrument’s initial carrying amount and disposal amount. Gain on disposal of investments securities at amortized cost Gain on disposal of investment securities at amortized cost represents gain realized from sale of peso-denominated debt securities measured at amortized cost. Rental income Rental income arising from leased properties is accounted for on a straight-line basis over the lease terms of ongoing leases and is recorded in the statements of income under ‘Miscellaneous’ in other operating income.
- 16 -
Expense Recognition Expenses are recognized when it is probable that a decrease in future economic benefit related to a decrease in an asset or an increase in liability has occurred and the decrease in economic benefits can be measured reliably. Revenues and expenses that relate to the same transaction or other event are recognized simultaneously.
Interest expense Interest expense for all interest-bearing financial liabilities are recognized in ‘Interest expense’ in the statements of income using the EIR of the financial liabilities to which they relate.
Other expense Expenses encompass losses as well as those expenses that arise in the ordinary course of business of the Bank. Expenses are recognized when incurred.
Business Combination and Goodwill Business combinations are accounted for using the acquisition method. This involves recognizing identifiable assets (including previously unrecognized intangible assets) and liabilities (including contingent liabilities and excluding future restructuring) of the acquired business at fair value. Any excess of the cost of acquisition over the fair values of the identifiable net assets acquired is recognized as goodwill.
If the cost of acquisition is less than the fair values of the identifiable net assets acquired, the discount on acquisition is recognized directly in the statements of income in the year of acquisition.
Goodwill is initially measured at cost being the excess of the acquisition cost over the share in the net fair value of the acquired identifiable assets, liabilities and contingent liabilities. The Bank’s goodwill arose from past purchases of branch business/offices from the Parent Company.
After initial recognition, goodwill is measured at cost less any accumulated impairment losses. For the purpose of impairment testing, goodwill acquired is, from the acquisition date, allocated to each of the CGU or group of CGUs that are expected to benefit from the synergies of the combination, irrespective of whether the acquired other assets or liabilities are assigned to those units.
Where goodwill forms part of a CGU and part of the operation within that unit is disposed of, the goodwill associated with the operation disposed of is included in the carrying amount of the operation when determining the gain or loss on disposal of the operation. Goodwill disposed of in this circumstance is measured based on the relative values of the operation disposed of and the portion of the CGU retained.
Retirement Cost Defined benefit plan The net defined benefit liability or asset is the aggregate of the present value of the defined benefit obligation at the statement of condition date reduced by the fair value of plan assets, adjusted for any effect of limiting a net defined benefit asset to the asset ceiling. The present value of the defined benefit obligation is calculated annually by an independent actuary. The asset ceiling is the present value of any economic benefits available in the form of refunds from the plan or reductions in future contributions to the plan.
The cost of providing benefits under the defined benefit plan is actuarially determined using the projected unit credit method.
Defined benefit costs comprise the following: a. service cost; b. net interest on the net defined benefit liability or asset; and c. remeasurements of net defined benefit liability or asset.
Service costs, which include current service costs, past service costs and gains or losses on non-routine settlements are recognized as expense in profit or loss. Past service costs are recognized when plan amendment or curtailment occurs. These amounts are calculated periodically by independent qualified actuaries.
- 17 -
Net interest on the net defined benefit liability or asset is the change during the period in the net defined benefit liability or asset that arises from the passage of time which is determined by applying the discount rate based on Philippine government bonds to the net defined benefit liability or asset. Net interest on the net defined benefit liability or asset is recognized as expense or income in profit or loss.
Remeasurements comprising actuarial gains and losses, return on plan assets and any change in the effect of the asset ceiling (excluding net interest on defined benefit liability) are recognized immediately in OCI in the period in which they arise. Remeasurements are not reclassified to profit or loss in subsequent periods.
Plan assets are assets that are held by a long-term employee benefit fund or qualifying insurance policies. Plan assets are not available to the creditors of the Bank, nor can they be paid directly to the Bank. The fair value of plan assets is based on market price information. When no market price is available, the fair value of plan assets is estimated by discounting expected future cash flows using a discount rate that reflects both the risk associated with the plan assets and the maturity or expected disposal date of those assets (or, if they have no maturity, the expected period until the settlement of the related obligations). If the fair value of the plan assets is higher than the present value of the defined benefit obligation, the measurement of the resulting defined benefit asset is limited to the present value of economic benefits available in the form of refunds from the plan or reductions in future contributions to the plan.
The Bank’s right to be reimbursed of some or all of the expenditure required to settle a defined benefit obligation is recognized as a separate asset at fair value when and only when reimbursement is virtually certain.
Termination benefits Termination benefits are employee benefits provided in exchange for the termination of an employee’s employment as a result of either an entity’s decision to terminate an employee’s employment before the normal retirement date or an employee’s decision to accept an offer of benefits in exchange for the termination of employment.
A liability and expense for a termination benefit is recognized at the earlier of when the entity can no longer withdraw the offer of those benefits and when the entity recognizes related restructuring costs. Initial recognition and subsequent changes to termination benefits are measured in accordance with the nature of the employee benefit, as either post-employment benefits, short-term employee benefits, or other long-term employee benefits.
Employee leave entitlement Employee entitlements to annual leave are recognized as a liability when they are accrued to the employees. The undiscounted liability for leave expected to be settled after the end of the annual reporting period is recognized for services rendered by employees up to the end of the reporting period.
Provisions Provisions are recognized when the Bank has a present obligation (legal or constructive) as a result of a past event and it is probable that an outflow of resources embodying economic benefits will be required to settle the obligation and a reliable estimate can be made of the amount of the obligation. Where the Bank expects some or all of a provision to be reimbursed, for example, under an insurance contract, the reimbursement is recognized as a separate asset but only when the reimbursement is virtually certain. The expense relating to any provision is presented in the statement of income, net of any reimbursement. If the effect of the time value of money is material, provisions are determined by discounting the expected future cash flows at a pre-tax rate that reflects current market assessments of the time value of money and, where appropriate, the risks specific to the liability. Where discounting is used, the increase in the provision due to the passage of time is recognized as ‘Interest expense’.
Contingent Liabilities and Contingent Assets Contingent liabilities are not recognized in the financial statements but are disclosed unless the possibility of an outflow of resources embodying economic benefits is remote. Contingent assets are not recognized but are disclosed in the financial statements when an inflow of economic benefits is probable.

- 18 -
Debt Issue Costs Issuance, underwriting and other related expenses incurred in connection with the issuance of debt instruments are included in the measurement basis of the underlying debt instruments and are amortized as an adjustment to the interest on the underlying debt instruments using the effective interest method.
Income Taxes Income tax on profit or loss for the year comprises current and deferred tax. Income tax is determined in accordance with Philippine tax law. Income tax is recognized in the statement of income, except to the extent that it relates to OCI items recognized directly in the statements of comprehensive income.
Current tax Current income tax is the expected tax payable on the taxable income for the period, using the tax rates enacted at the statement of condition date, together with adjustments to tax payable in respect to prior years. Deferred tax Deferred income tax is provided, using the balance sheet liability method, on all temporary differences at the statement of condition date between the tax bases of assets and liabilities and their carrying amounts for financial reporting purposes.
Deferred tax liabilities are recognized for all taxable temporary differences, including asset revaluations. Deferred tax assets are recognized for all deductible temporary differences and carry forward of unused tax losses and tax credits from excess minimum corporate income tax (MCIT) over the regular corporate income tax (RCIT), to the extent that it is probable that future taxable profit will be available against which the deductible temporary differences and carry forward of unused tax losses and MCIT can be utilized.
The carrying amount of deferred tax assets is reviewed at each statement of condition date and reduced to the extent that it is no longer probable that sufficient future taxable profit will be available to allow all or part of the deferred tax assets to be utilized. Unrecognized deferred tax assets are reassessed at each statement of condition date and are recognized to the extent that it has become probable that future taxable profits will allow the deferred tax assets to be recovered.
Deferred tax assets and liabilities are measured at the tax rates that are applicable to the period when the asset is realized or the liability is settled, based on tax rates (and tax laws) that have been enacted or substantively enacted at the statement of condition date.
Deferred tax assets and deferred tax liabilities are offset if a legally enforceable right exists to set off current tax assets against current tax liabilities and deferred taxes related to the same taxable entity and the same taxation authority.
Current income tax and deferred income tax relating to items recognized directly in OCI is also recognized in OCI and not in the statements of income.
Earnings Per Share Basic earnings per share (EPS) is computed by dividing net income for the year by the weighted average number of common shares issued and outstanding during the year, after giving retroactive effect to stock dividends declared, stock rights exercised and stock splits, if any, declared during the year.
Dividends on Common Shares Dividends on common shares are recognized as a liability and deducted from equity when approved by the BOD of the Bank. Dividends for the year that are approved after the statements of condition date are dealt with as subsequent events.
Segment Reporting The Bank’s operating businesses are organized and managed separately according to the nature of the products and services provided, with each segment representing a strategic business unit that offers different products and serves different markets. Financial information on business segments is presented in Note 6. The Bank’s assets
- 19 -
generating revenues are all located in the Philippines (i.e., one geographical location). Therefore, geographical segment information is no longer presented.
Fiduciary Activities Assets and income arising from fiduciary activities together with related undertakings to return such assets to customers are excluded from the financial statements, where the Bank acts in a fiduciary capacity such as nominee, trustee or agent.
Subsequent Events Post year-end events that provide additional information about the Bank’s position at the statement of condition date (adjusting events) are reflected in the financial statements. Post year-end events that are not adjusting events are disclosed in the notes to the financial statements when material. Standards Issued but Not Yet Effective Pronouncements issued but not yet effective are listed below. Unless otherwise indicated, the Bank does not expect the future adoption of the said pronouncements to have a significant impact on its financial statements. The Bank intends to adopt the following pronouncements when they become effective.
Effective beginning on or after January 1, 2022 • Amendments to PFRS 3, Reference to the Conceptual Framework
The amendments are intended to replace a reference to the Framework for the Preparation and Presentation of Financial Statements, issued in 1989, with a reference to the Conceptual Framework for Financial Reporting issued in March 2018 without significantly changing its requirements. The amendments added an exception to the recognition principle of PFRS 3, Business Combinations to avoid the issue of potential ‘day 2’ gains or losses arising for liabilities and contingent liabilities that would be within the scope of PAS 37, Provisions, Contingent Liabilities and Contingent Assets or Philippine IFRIC 21, Levies, if incurred separately. At the same time, the amendments add a new paragraph to PFRS 3 to clarify that contingent assets do not qualify for recognition at the acquisition date. The amendments are effective for annual reporting periods beginning on or after January 1, 2022 and apply prospectively. The amendments are not expected to have a material impact on the Bank.
• Amendments to PAS 16, Plant and Equipment: Proceeds before Intended Use The amendments prohibit entities deducting from the cost of an item of property, plant and equipment, any proceeds from selling items produced while bringing that asset to the location and condition necessary for it to be capable of operating in the manner intended by management. Instead, an entity recognizes the proceeds from selling such items, and the costs of producing those items, in profit or loss. The amendment is effective for annual reporting periods beginning on or after January 1, 2022 and must be applied retrospectively to items of property, plant and equipment made available for use on or after the beginning of the earliest period presented when the entity first applies the amendment. The amendments are not expected to have a material impact on the Bank.
• Amendments to PAS 37, Onerous Contracts – Costs of Fulfilling a Contract The amendments specify which costs an entity needs to include when assessing whether a contract is onerous or loss-making. The amendments apply a “directly related cost approach”. The costs that relate directly to a contract to provide goods or services include both incremental costs and an allocation of costs directly related to contract activities. General and administrative costs do not relate directly to a contract and are excluded unless they are explicitly chargeable to the counterparty under the contract.
- 20 -
The amendments are effective for annual reporting periods beginning on or after January 1, 2022. The Bank will apply these amendments to contracts for which it has not yet fulfilled all its obligations at the beginning of the annual reporting period in which it first applies the amendments. The amendments are not expected to have a material impact on the Bank.
• Annual Improvements to PFRS Standards 2018-2020 Cycle
• Amendments to PFRS 1, First-time Adoption of Philippines Financial Reporting Standards, Subsidiary as a first-time adopter
The amendment permits a subsidiary that elects to apply paragraph D16(a) of PFRS 1 to measure cumulative translation differences using the amounts reported by the parent, based on the parent’s date of transition to PFRS. This amendment is also applied to an associate or joint venture that elects to apply paragraph D16(a) of PFRS 1.
The amendment is effective for annual reporting periods beginning on or after January 1, 2022 with earlier adoption permitted. The amendments are not expected to have a material impact on the Bank.
• Amendments to PFRS 9, Financial Instruments, Fees in the ’10 per cent’ test for derecognition of
financial liabilities
The amendment clarifies the fees that an entity includes when assessing whether the terms of a new or modified financial liability are substantially different from the terms of the original financial liability. These fees include only those paid or received between the borrower and the lender, including fees paid or received by either the borrower or lender on the other’s behalf. An entity applies the amendment to financial liabilities that are modified or exchanged on or after the beginning of the annual reporting period in which the entity first applies the amendment.
The amendment is effective for annual reporting periods beginning on or after January 1, 2022 with earlier adoption permitted. The Bank will apply the amendments to financial liabilities that are modified or exchanged on or after the beginning of the annual reporting period in which the entity first applies the amendment. The amendments are not expected to have a material impact on the Bank.
• Amendments to PAS 41, Agriculture, Taxation in fair value measurements The amendment removes the requirement in paragraph 22 of PAS 41 that entities exclude cash flows for taxation when measuring the fair value of assets within the scope of PAS 41.
An entity applies the amendment prospectively to fair value measurements on or after the beginning of the first annual reporting period beginning on or after January 1, 2022 with earlier adoption permitted.
The amendments are not expected to have a material impact on the Bank.
Effective beginning on or after January 1, 2023 • Amendments to PAS 12, Deferred Tax related to Assets and Liabilities arising from a Single Transaction
The amendments narrow the scope of the initial recognition exception under PAS 12, so that it no longer applies to transactions that give rise to equal taxable and deductible temporary differences. The amendments also clarify that where payments that settle a liability are deductible for tax purposes, it is a matter of judgement (having considered the applicable tax law) whether such deductions are attributable for tax purposes to the liability recognized in the financial statements (and interest expense) or to the related asset component (and interest expense). An entity applies the amendments to transactions that occur on or after the beginning of the earliest comparative period presented for annual reporting periods on or after January 1, 2023.
- 21 -
• Amendments to PAS 8, Definition of Accounting Estimates The amendments introduce a new definition of accounting estimates and clarify the distinction between changes in accounting estimates and changes in accounting policies and the correction of errors. Also, the amendments clarify that the effects on an accounting estimate of a change in an input or a change in a measurement technique are changes in accounting estimates if they do not result from the correction of prior period errors. An entity applies the amendments to changes in accounting policies and changes in accounting estimates that occur on or after January 1, 2023 with earlier adoption permitted. The amendments are not expected to have a material impact on the Bank.
• Amendments to PAS 1 and PFRS Practice Statement 2, Disclosure of Accounting Policies
The amendments provide guidance and examples to help entities apply materiality judgements to accounting policy disclosures. The amendments aim to help entities provide accounting policy disclosures that are more useful by:
• Replacing the requirement for entities to disclose their ‘significant’ accounting policies with a requirement to disclose their ‘material’ accounting policies, and
• Adding guidance on how entities apply the concept of materiality in making decisions about accounting policy disclosures
The amendments to the Practice Statement provide non-mandatory guidance. Meanwhile, the amendments to PAS 1 are effective for annual periods beginning on or after January 1, 2023. Early application is permitted as long as this fact is disclosed. The amendments are not expected to have a material impact on the Bank.
• Amendments to PAS 1, Classification of Liabilities as Current or Non-current
The amendments clarify paragraphs 69 to 76 of PAS 1, Presentation of Financial Statements, to specify the requirements for classifying liabilities as current or non-current. The amendments clarify:
• What is meant by a right to defer settlement • That a right to defer must exist at the end of the reporting period • That classification is unaffected by the likelihood that an entity will exercise its deferral right • That only if an embedded derivative in a convertible liability is itself an equity instrument would
the terms of a liability not impact its classification The amendments are effective for annual reporting periods beginning on or after January 1, 2023 and must be applied retrospectively. However, in November 2021, the International Accounting Standards Board (IASB) tentatively decided to defer the effective date to no earlier than January 1, 2024.
• PFRS 17, Insurance Contracts
PFRS 17 is a comprehensive new accounting standard for insurance contracts covering recognition and measurement, presentation and disclosure. Once effective, PFRS 17 will replace PFRS 4, Insurance Contracts. This new standard on insurance contracts applies to all types of insurance contracts (i.e., life, non-life, direct insurance and re-insurance), regardless of the type of entities that issue them, as well as to certain guarantees and financial instruments with discretionary participation features. A few scope exceptions will apply. The overall objective of PFRS 17 is to provide an accounting model for insurance contracts that is more useful and consistent for insurers. In contrast to the requirements in PFRS 4, which are largely based on grandfathering previous local accounting policies, PFRS 17 provides a comprehensive model for insurance
- 22 -
contracts, covering all relevant accounting aspects. The core of PFRS 17 is the general model, supplemented by:
• A specific adaptation for contracts with direct participation features (the variable fee approach) • A simplified approach (the premium allocation approach) mainly for short-duration contracts
On December 15, 2021, the FRSC amended the mandatory effective date of PFRS 17 from January 1, 2023 to January 1, 2025. This is consistent with Circular Letter No. 2020-62 issued by the Insurance Commission which deferred the implementation of PFRS 17 by two (2) years after its effective date as decided by the IASB. PFRS 17 is effective for reporting periods beginning on or after January 1, 2025, with comparative figures required. Early application is permitted. The amendments are not expected to have a material impact on the Bank.
Deferred effectivity • Amendments to PFRS 10, Consolidated Financial Statements, and PAS 28, Sale or Contribution of Assets
between an Investor and its Associate or Joint Venture
The amendments address the conflict between PFRS 10 and PAS 28 in dealing with the loss of control of a subsidiary that is sold or contributed to an associate or joint venture. The amendments clarify that a full gain or loss is recognized when a transfer to an associate or joint venture involves a business as defined in PFRS 3. Any gain or loss resulting from the sale or contribution of assets that does not constitute a business, however, is recognized only to the extent of unrelated investors’ interests in the associate or joint venture. On January 13, 2016, the Financial Reporting Standards Council deferred the original effective date of January 1, 2016 of the said amendments until the IASB completes its broader review of the research project on equity accounting that may result in the simplification of accounting for such transactions and of other aspects of accounting for associates and joint ventures.
3. Significant Accounting Judgments, Estimates and Assumptions
The preparation of the financial statements in accordance with PFRS requires the management to make judgments, estimates and assumptions that affect the reported amount of revenues, expenses, assets and liabilities, and the accompanying disclosures, as well as the disclosure of contingent assets and contingent liabilities. Uncertainty about these assumptions and estimates could result in outcomes that require a material adjustment to the carrying amount of assets and liabilities affected in future periods. The effects of any change in judgments, estimates and assumptions are reflected in the financial statements as they become reasonably determinable.
Judgments, estimates and assumptions are continually evaluated and are based on historical experience and other factors, including expectations of future events that are believed to be reasonable under the circumstances.
Judgments In the process of applying the Bank’s accounting policies, management has made the following judgments, which have the most significant effect on the amounts recognized in the financial statements:
(a) Fair value of financial instruments
When the fair values of financial assets and financial liabilities recorded in the statement of condition or disclosed in the notes to financial statements cannot be measured based on quoted prices in active markets, their fair value is measured using valuation techniques including the discounted cash flow model. The inputs to these models are taken from observable markets where possible, but where this is not feasible, a degree of judgement is required in establishing fair values. Judgments include considerations of inputs such as liquidity risk, credit risk and volatility for longer-dated derivatives and discount rates, prepayments and default rates assumptions. Changes in assumptions about these factors could affect the reported fair value of financial instruments.
- 23 -
The fair values of the Bank’s financial instruments are disclosed in Note 4.
(b) Classification of financial assets The Bank classifies its financial assets depending on the business model for managing those financial assets and whether the contractual terms of the financial asset are SPPI on the principal amount outstanding.
The Bank performs the business model assessment based on observable factors such as: • Performance of the business model and the financial assets held within that business model are
evaluated and reported to the Bank’s key management personnel • Risks that affect the performance of the business model (and the financial assets held within that
business model) and, in particular, the way those risks are managed • Compensation of business units whether based on the fair value of the assets managed or on the
contractual cash flows collected • Expected frequency, value and timing of sales
In performing the SPPI test, the Bank applies judgment and considers relevant factors such as the currency in which the financial asset is denominated, the period for which the interest rate is set, contingent events that would change the amount and timing of cash flows, leverage features, prepayment and extension terms and other features that may modify the consideration for the time value of money.
(c) Leases
Bank as lessor The Bank has entered into commercial property leases on its investment properties portfolio and over various items of furniture, fixtures and equipment. The Bank has determined, based on an evaluation of the terms and conditions of the arrangements (i.e., the lease does not transfer ownership of the asset to the lessee by the end of the lease term, the lessee has no option to purchase the asset at a price that is expected to be sufficiently lower than the fair value at the date the option is exercisable and the lease term is not for the major part of the asset’s economic life), that it retains all the significant risks and rewards of ownership of these properties which are leased out on operating leases. Bank as lessee The Bank determines the lease term as the non-cancellable term of the lease, together with any periods covered by an option to extend the lease if it is reasonably certain to be exercised, or any periods covered by an option to terminate the lease, if it is reasonably certain not to be exercised.
Extension and termination options The Bank has several lease contracts that include extension and termination options. The Bank applies judgment in evaluating whether it is reasonably certain whether or not to exercise the option to renew or terminate the lease. That is, it considers all relevant factors such as leasehold improvements and location that create an economic incentive for it to exercise either the renewal or termination. After the commencement date, the Bank reassess the lease term if there is a significant event or change in circumstances that is within its control and affects its ability to exercise or not to exercise the option to renew or to terminate.
Estimating the IBR for lease liabilities The Bank cannot readily determine the interest rate implicit in the lease, therefore, it uses its IBR to measure lease liabilities. The IBR for lease liabilities is the rate of interest that the Bank would have to pay to borrow over a similar term, and with a similar security, the funds necessary to obtain an asset of a similar value to the right-of-use asset in a similar economic environment. The Bank estimates the IBR for lease liabilities using observable inputs (by reference to prevailing risk-free rates) adjusted to take into account the entity’s credit risk (i.e., credit spread).
The carrying values of the Bank’s right-of-use assets and lease liabilities are disclosed in Notes 11, 19 and 25, respectively.
(d) Evaluation of business model in managing financial assets
The Bank manages its financial assets based on business models that maintain adequate level of financial assets to match its expected cash outflows, largely arising from customers’ withdrawals and continuing loan
- 24 -
disbursements to borrowers, while maintaining a strategic portfolio of financial assets for investment and trading activities consistent with its risk appetite.
In determining the classification of a financial instrument under PFRS 9, the Bank developed business models which reflect how it manages its portfolio of financial instruments. The Bank’s business models need not be assessed at entity level or as a whole but applied at the level of a portfolio of financial instruments (i.e., group of financial instruments that are managed together by the Bank) and not on an instrument-by-instrument basis (i.e., not based on intention or specific characteristics of individual financial instrument). The Bank evaluates in which business model a financial instrument or a portfolio of financial instruments belong to taking into consideration the objectives of each business model established by the Bank. In addition, PFRS 9 emphasizes that if more than an infrequent and more than an insignificant sale is made out of a portfolio of financial assets carried at amortized cost, an entity should assess whether and how such sales are consistent with the objective of collecting contractual cash flows. In making this judgment, the Bank considers certain circumstances documented in its business model manual to assess that an increase in the frequency or value of sales of financial instruments in a particular period is not necessarily inconsistent with a held-to-collect (HTC) business model if the Bank can explain the reasons for those sales and why those sales do not reflect a change in the Bank’s objective for the business model. In 2020, the Bank sold investment securities classified as investment securities at amortized cost with total carrying amount of P=19.6 billion, resulting in gain on disposal of investment securities at amortized cost totaling P=1.3 billion. The sale was made as there were changes in the Bank’s funding requirements given its assessment on the impact of a prolonged pandemic. In aggregate, the disposals in 2020 were assessed as not inconsistent with the Bank’s HTC business model as the disposals were considered infrequent even if significant in value. In 2021, the Bank sold investment securities classified as investment securities at amortized cost with total carrying amount of P=378.7 million, resulting in gain on disposal of investment securities at amortized cost amounting to P=11.7 million. The disposal in 2021 was assessed as not inconsistent with the Bank’s HTC business model as the disposal was considered infrequent and insignificant in value. Further, the Bank assessed that the disposals did not reflect a change in the Bank’s objectives for the HTC business model. Accordingly, the remaining investment securities in the affected HTC portfolio continue to be measured at amortized cost.
Estimates and Assumptions The key assumptions concerning the future and other key sources of estimation uncertainty at the statement of condition date, which have a significant risk of causing a material adjustment to the carrying amounts of assets and liabilities within the next period, are described below. The Bank based its assumptions and estimates on parameters available when the financial statements were prepared. Existing circumstances and assumptions about future developments, however, may change due to market changes or circumstances beyond the control of the Bank. Such changes are reflected in the assumptions when they occur.
(a) Credit losses on financial assets
The Bank’s ECL calculations are outputs of complex models with a number of underlying assumptions regarding the choice of variable inputs and their interdependencies. Significant factors affecting the estimates on the ECL model include:
• Segmentation of the portfolio, where the appropriate model or ECL approach is used • The criteria for assessing if there has been a significant increase in credit risk and so allowances for
financial assets should be measured on a lifetime ECL basis and the qualitative assessment. The segmentation of financial assets when their ECL is assessed on a collective basis
• Development of ECL models, including the various formulas and the choice of inputs. In 2021, the Bank redeveloped its ECL models covering the pandemic period data to ensure long-run effectivity of the ECL parameters.
• Determination of associations between macroeconomic scenarios and economic inputs and the effect on PDs, EADs and LGDs
• Selection of forward-looking macroeconomic scenarios and their probability weightings, to derive the economic inputs into the ECL models

- 25 -
The ECL model performance is reviewed periodically, and appropriate measures are taken to ensure provisions for credit losses are adequate. The gross carrying amounts of financial assets subject to ECL as of December 31, 2021 and the related allowance for credit losses are disclosed in Notes 5 and 15, respectively.
(b) Impairment of investment properties and chattel mortgage properties The Bank assesses impairment on its non-financial assets whenever events or changes in circumstances indicate that the carrying amount of an asset may not be recoverable. The factors that the Bank considers important which could trigger an impairment review include the following: • significant underperformance relative to expected historical or projected future operating results; • significant changes in the manner of use of the acquired assets or the strategy for overall business; and • significant negative industry or economic trends. The Bank recognizes an impairment loss whenever the carrying amount of an asset exceeds its recoverable amount. The recoverable amount is computed using the fair value less costs to sell for property and equipment, investment properties and chattel mortgage properties. Recoverable amounts are estimated for individual assets or, if it is not possible, for the CGU to which the asset belongs.
The carrying values of the Bank’s investment properties and chattel mortgage properties are disclosed in Notes 12 and 14, respectively.
(c) Present value of retirement obligation
The cost of defined benefit pension plans as well as the present value of the pension obligation are determined using actuarial valuations. The actuarial valuation involves making various assumptions. These include the determination of the discount rates, future salary increases, and future pension increases. Due to the complexity of the valuation, the underlying assumptions and its long-term nature, defined benefit obligations are highly sensitive to changes in these assumptions. All assumptions are reviewed at each statement of condition date.
In determining the appropriate discount rate, management considers the interest rates of Philippine government bonds that are denominated in the currency in which the benefits will be paid, with extrapolated maturities corresponding to the expected duration of the defined benefit obligation.
The details of assumptions used in the actuarial valuation and carrying value of the net pension liability are disclosed in Note 24.
(e) Recognition of deferred tax assets
Deferred tax assets are recognized for all unused tax and deductible temporary differences to the extent that it is probable that taxable profit will be available against which the losses can be utilized. Significant management judgment is required to determine the amount of deferred tax assets that can be recognized, based upon the likely timing and level of future taxable profits together with future tax planning strategies. The estimates of future taxable income indicate that certain temporary differences will be realized in the future. The Bank have considered the impact of the COVID-19 pandemic on future taxable income and on the recognition of deferred tax assets. The recognized net deferred assets and unrecognized deferred tax assets for the Bank are disclosed in Note 27.
(f) Contingent liabilities The Bank is a defendant in legal actions arising from its normal business activities. Management believes that the ultimate liability, if any, resulting from these cases will not have a material effect on the Bank’s financial statements are disclosed in Note 31.

- 26 -
4. Fair Value Measurement
Financial Instruments The following describes the methodologies and assumptions used to determine the fair values of financial instruments:
Cash and other cash items, due from BSP, due from other banks, interbank loans receivable and SPURA, accounts receivable, accrued interest receivable, bills purchased, RCOCI, shortages, and petty cash fund - Carrying amounts approximate fair values due to the relatively short-term maturities of these assets.
Debt investments - Fair values are generally based on quoted market prices. If the market prices are not readily available, fair values are estimated using either values obtained from independent parties offering pricing services or adjusted quoted market prices of comparable investments or using the discounted cash flow methodology, using rates currently available for debt on similar terms, credit risk and remaining maturities.
Equity investments - Fair values are based on quoted prices published in markets.
Receivable from customers, sales contract receivables and security deposits - Fair values are estimated using the discounted cash flow methodology, using the Bank’s current lending rates for similar types of loans. The discount rates used range from 4.20% to 41.76% and from 5.00% to 41.76% in 2021 and 2020, respectively.
Demand deposits, savings deposits, treasurer’s, cashier’s and manager’s checks, accrued interest payable, accounts payable, bills purchased-contra, other credits, deposits for keys-SDB, payment orders payable and overages - Carrying amounts approximate fair values due to either the demand nature or the relatively short-term maturities of these liabilities.
Bonds payable and time deposits - Fair values are estimated using the discounted cash flow methodology using the Bank’s borrowing rates for similar borrowings with maturities consistent with those remaining for the liability being valued. The discount rates used are the following:
Discount Rates
2021 2020 Bonds payable 4.50% 4.50% to 5.60% Time deposits 0.05% to 6.00% 0.13% to 6.00%
The inputs used in the fair value measurement based on Level 2 are as follows:
Government securities - interpolated rates based on market rates of benchmark securities as of statement of condition date.
The inputs used in estimating fair values of financial instruments carried at amortized cost and categorized under Level 3 include risk-free rates and applicable risk premium. Non-financial Assets Investment properties - Fair values of the investment properties have been determined based on valuations performed by independent external and in-house appraisers using valuation technique with significant inputs that are not based on observable market data (Level 3). The valuation of investment properties was based on the Sales Comparison Approach and considered recent sales of similar or substitute properties in the same areas where the investment properties are located, taking into account the economic conditions prevailing at the time of the valuation. Other factors considered were the location and shape of the properties, environmental issues, development controls such as the height restriction, building coverage and floor area ratio restrictions among others. Other significant unobservable inputs include shape, location, time element, discount and corner influence. The fair value of investment properties is based on its highest and best use, which is its current use.

- 27 -
The following tables summarize the carrying amount and fair values of the Bank’s financial instruments and investment properties, analyzed based on the hierarchy described in Note 2 (in thousands):
December 31, 2021
Carrying
Value Level 1 Level 2 Level 3 Total
Fair Value Assets measured at fair value: Financial Assets FVTPL investments HFT - government securities P=45 P=– P=45 P=– P=45 Financial assets at FVOCI Government debt securities 58,407,116 49,045,711 9,361,405 – 58,407,116 Private debt securities 1,845,811 1,845,811 – – 1,845,811 Equity securities 13,577 12,404 1,173 – 13,577
60,266,549 50,903,926 9,362,623 – 60,266,549
Assets for which fair values are disclosed: Financial Assets Investment securities at amortized cost Government 18,495,339 16,879,018 2,348,448 – 19,227,466 Private 2,467,008 2,538,630 – – 2,538,630 Loans and receivables Receivables from customers Consumption loans 53,839,278 – – 60,228,366 60,228,366 Real estate loans 44,634,259 – – 44,870,036 44,870,036 Commercial loans 6,880,926 – – 7,183,259 7,183,259 Personal loans 1,654,361 – – 2,947,698 2,947,698 Sales contract receivable 17,302 – – 16,931 16,931 Security deposits 197,494 – – 256,954 256,954 Non-Financial Assets Investment properties 3,508,598 – – 5,654,376 5,654,376 131,694,565 19,417,648 2,348,448 121,157,620 142,923,716
Liabilities for which fair values are disclosed: Deposit liabilities - time 136,095,039 – – 137,329,426 137,329,426 Deposit liabilities - LTNCD 8,441,452 – – 8,853,367 8,853,367 Bonds payable 4,633,613 – – 4,625,188 4,625,188 P=149,170,104 P=– P=– P=150,807,981 P=150,807,981
December 31, 2020
Carrying
Value Level 1 Level 2 Level 3 Total
Fair Value Assets measured at fair value: Financial Assets FVTPL investments HFT - government securities P=50 P=– P=50 P=– P=50 Financial assets at FVOCI Government debt securities 7,093,132 7,093,123 9 – 7,093,132 Private debt securities 2,955,869 2,737,316 218,553 – 2,955,869 Equity securities 10,232 9,060 1,172 – 10,232
10,059,283 9,839,499 219,784 – 10,059,283
Assets for which fair values are disclosed: Financial Assets Investment securities at amortized cost Government 11,107,727 12,009,243 322,323 – 12,331,566 Private 2,628,272 1,674,355 1,027,597 – 2,701,952 Loans and receivables Receivables from customers Consumption loans 74,803,191 – – 82,850,172 82,850,172 Real estate loans 49,402,438 – – 50,023,624 50,023,624 Commercial loans 10,361,220 – – 10,905,233 10,905,233 Personal loans 2,435,303 – – 2,686,415 2,686,415 Sales contract receivable 25,354 – – 24,208 24,208 Security deposits 201,235 – – 269,567 269,567 Non-Financial Assets Investment properties 3,585,972 – – 5,641,461 5,641,461 154,550,712 13,683,598 1,349,920 152,400,680 167,434,198
Liabilities for which fair values are disclosed: Deposit liabilities - time 91,791,491 – – 93,447,388 93,447,388 Deposit liabilities - LTNCD 8,425,364 – – 8,965,224 8,965,224 Bonds payable 10,902,457 – – 11,014,431 11,014,431 P=111,119,312 P=– P=– P=113,427,043 P=113,427,043
When fair values of listed equity and debt securities, as well as publicly traded derivatives at the reporting date are based on quoted market prices or binding dealer price quotations, without any adjustments for transaction costs, the instruments are included within Level 1 of the hierarchy.
- 28 -
For all other financial instruments, fair value is determined using valuation techniques. Valuation techniques include net present value techniques, comparison to similar instruments for which market observable prices exist and other revaluation models. Instruments included in Level 3 include those for which there is currently no active market.
As of December 31, 2021 and 2020, there were no transfers between Level 1 and Level 2 fair value measurements, and no transfers into and out of Level 3 fair value measurement.
As of December 31, 2021 and 2020, the Bank determined the market value of its warrants to be zero due to the absence of an active market for the Bank’s ROP warrants, as evidenced by the unavailability of quoted market prices.
5. Financial Risk Management Policies and Objectives
The Bank has exposure to the following risks from its use of financial instruments:
• Credit risk • Market risk • Liquidity risk
Organization risk management structure continues to be a top-down organization, with the BOD at the helm of all major initiatives.
Discussed below are the relevant sections on roles and responsibilities from the Risk Oversight Committee (ROC) Charter: Board of Directors (BOD) The corporate powers of the Bank are vested in and are exercised by the BOD, who conducts its business and controls its property. The BOD approves broad risk management strategies and policies and ensures that risk management initiatives and activities are consistent with the Bank’s overall objectives. The BOD appoints the members of the ROC. Risk Oversight Committee (ROC) The ROC is composed of at least three members of the Board, the majority of whom are independent directors including its Chairperson. The ROC Chairperson is not the Chairperson of the Board or of any other committee. Members of the ROC possess a range of expertise and adequate knowledge of the Bank’s risk exposures to be able to develop appropriate strategies for preventing losses and minimizing the impact of losses when they occur.
The BOD may also appoint non-directors to the ROC as part of the Metrobank Group risk oversight measures. However, only Bank directors shall be considered as voting members of the ROC. Non-voting members are appointed in an advisory capacity. The ROC oversees the system of limits to discretionary authority that the BOD delegates to the management and ensures that the system remains effective, the limits are observed, and that immediate corrective actions are taken whenever limits are breached.
The ROC meets on a monthly basis and is supported by the Risk Management Office (RMO). In the absence of the ROC Chairman, another Independent Director shall preside. ROC resolutions, which require the concurrence of the majority of its voting members, are presented to the BOD for confirmation.
- 29 -
Risk Management Office (RMO) The RMO, headed by the Chief Risk and Sustainability Officer, is a function that is independent from executive functions and business line responsibilities, operations and revenue-generating functions. It reports directly to the BOD, through the ROC. The RMO assists the ROC in carrying out its responsibilities by: • analyzing, communicating, implementing, and maintaining the risk management policies approved by the
ROC and the BOD; • spearheading the regular review of the Bank’s risk management policy manual and making or elevating
recommendations that enhance the risk management process to the ROC and the BOD, for their approval; and
• ensuring that the risks arising from the Bank’s activities are identified, measured, analyzed, reported to and understood by risk takers, management, and the board. The RMO analyzes limit exceptions and recommends enhancements to the limits structure.
The RMO does not assume risk-taking accountability nor does it have approving authority. The RMO’s role is to act as liaison and to provide support to the BOD, ROC, the President, management committees, risk takers and other support and control functions on risk-related matters.
The Risk Management Function is responsible for: • identifying the key risk exposures and assessing and measuring the extent of risk exposures of the Bank and
its trust operations; • monitoring the risk exposures and determining the corresponding capital requirement in accordance with the
Basel capital adequacy framework and based on the Bank’s internal capital adequacy assessment on an on-going basis;
• monitoring and assessing decisions to accept particular risks whether these are consistent with BOD-approved policies on risk tolerance and the effectiveness of the corresponding risk mitigation measures; and
• reporting on a regular basis to Senior Management and the BOD the results of assessment and monitoring.
President The President is the Chief Executive Officer of the Bank and has the primary responsibility of carrying out the policies and objectives of the BOD. The President exercises the authorities delegated to him by the BOD and may recommend such policies and objectives he deems necessary for the continuing progress of the Bank. Risk management The risk management framework aims to maintain a balance between the nature of the Bank’s businesses and the risk appetite of the BOD. Accordingly, policies and procedures are reviewed regularly and revised as the organization grows and as financial markets evolve. New policies or proposed changes in current policies are presented to the ROC and the BOD for approval.
a. Credit risk and concentration of assets and liabilities and off-balance sheet items
Credit risk is the risk that a counterparty will not settle its obligations in accordance with the agreed terms.
The Bank’s lending business follows credit policy guidelines set by the BOD, ROC and RMO. These policies serve as minimum standards for extending credit. The people engaged in the credit process are required to understand and adhere to these policies.
Product manuals are in place for all loans and deposit products that actually or potentially expose the Bank to all types of risks that may result in financial or reputational losses. They define the product and the risks associated with the product plus the corresponding risk-mitigating controls. They embody the business plans and define the business parameters within which the product or activity is to be performed.
The system of checks around extension of credit includes approval by at least two credit approvers through the Credit Committee (CreCom), Executive Committee (ExCom) or BOD. The ROC reviews the business strategies and ensures that revenue-generating activities are consistent with the risk tolerance and standards of the Bank. The Internal Audit Group conducts regular audit across all functional units. The BOD, through the ExCom, CreCom and ROC, ensure that sound credit policies and practices are followed through all the business segments.
- 30 -
Credit Approval Credit approval is the documented acceptance of credit risk in the credit proposal or application.
The Bank’s credit decision-making for consumer loans utilizes the recommendation of the credit scoring and is performed at the CreCom level appropriate to the size and risk of each transaction, in conformity with corporate policies and procedures in regulating credit risk activities. The Bank’s ExCom may approve deviations or exceptions, while the BOD approves material exceptions such as large exposures, loans to directors, officers, stockholders and other related interests (DOSRI) and related party transactions, and loan restructuring.
Credit delegation limits are identified, tracked and reviewed at least annually by the Bank’s Head of Credit and Collections together with the Credit Risk Manager.
Borrower Eligibility The Bank’s credit processing commences when a customer expresses his intention to borrow through a credit application. The Bank gathers data on the customer; ensures they are accurate, up-to-date and adequate to meet the minimum regulatory requirements and to render credit decision. These data are used for the intended purpose only and are managed in adherence to the customer information secrecy law.
The customer’s credit worthiness, repayment ability and cash flow are established before credit is extended. The Bank independently verifies critical data from the customer, ensuring compliance with Know Your Customer requirements under the anti-money laundering laws. The Bank requires that customer income be derived from legitimate sources and supported with government-accepted statements of income, assets and liabilities.
The Bank ascertains whether the customer is legally capable of entering a credit contract and of providing a charge over any asset presented as collateral for a loan. Guarantors or sureties may be accepted, provided they are a relative, partner, and have financial interest in the transaction, and they pass all credit acceptance criteria applied to the borrower.
Loan Structure The Bank structures loans for its customers based on the customer’s capability to pay, the purpose of the loan, and for a collateralized loan, the collateral’s economic life and liquidation value over time.
The Bank establishes debt burden guidelines and minimum income requirements to assess the customer’s capacity to pay.
The Bank utilizes credit bureau data, both external and internal, to obtain information on a customer’s current commitments and credit history.
The Bank takes into account environmental and social issues when reviewing credit proposals of small businesses and commercial mortgage customers. The Bank ensures that all qualified securities pass through the BOD for approval. Assignments of securities are confirmed and insurance are properly secured.
The Bank uses credit scoring models and decision systems for consumer loans as approved by the BOD. Borrower risk rating model and facility risk rating model, on the other hand, are available for SME loans, and supported with qualitative evaluation. Regular monitoring of all these tools and their performance is carried out to ensure that they remain effective.
Initial loan limits are recommended by the CreCom and ExCom and approved by the BOD. The Bank ensures that secured loans are within ceilings set by local regulators. Succeeding loan availments are based on account performance and customer’s credit worthiness.
Credit Management The Bank maintains credit records and documents on all borrowings and captures transaction details in its loan systems. The credit risk policies and system infrastructure ensure that loans are monitored and managed at all times.

- 31 -
The Bank’s Management Information System provides statistics that its business units need to identify opportunities for improving rewards without necessarily sacrificing risk. Statistical data on product, productivity, portfolio, profitability, performance and projection are made available regularly.
The Bank conducts regular loan review through the ROC, with the support of the RMO. The Bank examines its exposures, credit risk ratios, provisions and customer segments. The Bank’s unique customer identification and unique group identification methodology enables it to aggregate credit exposures by customer or group of borrowers. Aggregate exposures of at least P=100.0 million are put on a special monitoring.
The ROC assesses the adequacy of provisions for credit losses regularly. The Bank’s automated loan grading system enables the Bank to set up provision per account. The Bank also performs impairment analyses on loans and receivables, whether on an individual or collective basis, in accordance with PFRS 9.
The Bank carries out stress testing analyses using Board-approved statistical models relating the default trends to macroeconomic indicators. In March 2020, the World Health Organization (WHO) declared the coronavirus (COVID-19) a pandemic outbreak. To prevent the spread of the virus, governments were forced to impose lockdowns, travel restrictions and border closures which had a catastrophic impact in the global economy. Under PFRS 9, impairment allowances have a forward-looking component and thus must take into account forecasted economic conditions. In response to the dramatic change in the economic outlook due to the COVID-19 pandemic, the Bank undertook a reassessment exercise of the ECL parameters. Recalibrated probability weights for the forward looking multiple economic scenarios and actual recovery levels during the pandemic were imputed into the ECL models. These enhancements aim to ensure that provisions for credit losses are sufficient and robust. During this period, the Bank tightened credit standards as well in anticipation of higher default rates and losses. In 2021, the COVID pandemic that stunted the world’s economy lingered. Governments and economies have slowly adapted and the numerous efforts to mitigate an outbreak (such as movement restrictions, vaccines, etc.) have started to take their roots and created some level of stability. There has also been an observed shift in credit behavior of individuals, as more have accounted for the fluidity of the pandemic situation before engaging in significant credit-taking activities. With economic recovery close, the Bank gradually relaxed its credit standards for retail collateralized loans and ride the upcoming wave. For the existing portfolios, the Bank recalibrated its ECL models with new data generated from the pandemic period to ensure long-run effectivity of the provisioning process.
Maximum Exposure to Credit Risk The tables below show the analysis of the maximum exposure to credit risk of the Bank’s financial instruments, excluding those where the carrying values as reflected in the statement of condition and related notes already represent the financial instrument’s maximum exposure to credit risk, after taking into account collateral held or other credit enhancements (in thousands): 2021
Carrying Amount
Fair Value of Collateral
Maximum Exposure to Credit Risk
Financial Effect of Collateral
or Credit Enhancement
Due from other banks P=1,366,925 P=3,331,790 P=261,139 P=1,105,786 Receivables from customers Consumption loans 53,839,278 61,003,357 2,957,725 50,881,553 Real estate loans 44,634,259 68,323,398 11,278,290 33,355,969 Commercial loans 6,880,926 7,212,179 4,578,919 2,302,007 Other receivables Accrued interest receivable 2,873,845 1,008,572 1,865,274 1,008,571 Sales contract receivable 17,302 69,713 766 16,536 Total credit exposure P=109,612,535 P=140,949,009 P=20,942,113 P=88,670,422
2020

- 32 -
Carrying Amount
Fair Value of Collateral
Maximum Exposure to Credit Risk
Financial Effect of Collateral
or Credit Enhancement
Due from other banks P=1,461,475 P=3,639,230 P=201,120 P=1,260,355 Receivables from customers Consumption loans 74,803,191 99,062,218 2,219,214 72,583,977 Real estate loans 49,402,438 69,888,779 13,080,835 36,321,603 Commercial loans 10,361,220 6,873,087 7,648,100 2,713,120 Other receivables Accrued interest receivable 3,808,108 2,164,656 1,643,452 2,164,656 Sales contract receivable 25,354 83,426 1,830 23,524 Total credit exposure P=139,861,786 P=181,711,396 P=24,794,551 P=115,067,235
An analysis of the maximum credit risk exposure relating to financial assets under Stage 3 as of December 31, 2021 and 2020 is shown below: 2021
Carrying Amount
Fair Value of Collateral
Maximum Exposure to Credit Risk
Financial Effect of Collateral
or Credit Enhancement
Receivables from customers Consumption loans P=1,587,481 P=2,295,362 P=92,006 P=1,495,475 Real estate loans 2,280,598 3,194,907 674,810 1,605,788 Commercial loans 369,038 862,741 243,365 125,673 Other receivables Accrued interest receivable 166,045 114,754 51,426 114,619 Sales contract receivable 10,208 23,806 156 10,052 Total credit exposure P=4,413,370 P=6,491,570 P=1,061,763 P=3,351,607
2020
Carrying Amount
Fair Value of Collateral
Maximum Exposure to Credit Risk
Financial Effect of Collateral
or Credit Enhancement
Receivables from customers Consumption loans P=4,971,815 P=8,678,162 P=2,883 P=4,968,932 Real estate loans 2,648,522 3,810,174 677,760 1,970,762 Commercial loans 427,459 428,773 246,013 181,446 Other receivables Accrued interest receivable 233,487 654,033 – 233,487 Sales contract receivable 21,410 74,133 331 21,079 Total credit exposure P=8,302,693 P=13,645,275 P=926,987 P=7,375,706
Collateral and Other Credit Enhancements The amount and type of collateral required depends on an assessment of the credit risk of the counterparty. Guidelines are implemented regarding acceptability of types of collateral and valuation parameters.
The main types of collaterals obtained are as follows: • For Due from other banks: investment securities • For SPURA: investment securities • For commercial lending: mortgages over real estate properties, deposit accounts and securities • For consumer lending: mortgages over real estate and chattel
Management monitors the market value of collateral, requests additional collateral in accordance with the underlying agreement, and monitors the market value of collateral obtained during its review of the adequacy of the allowance for credit and impairment losses.
It is the Bank’s policy to dispose of repossessed properties in an orderly fashion and proceeds are used to repay or reduce the outstanding claim. In general, the Bank does not occupy repossessed properties for business use.
The Bank holds collateral against loans and receivables in the form of real estate and chattel mortgages, guarantees, and other registered securities over assets. Estimates of fair value are based on the value of the
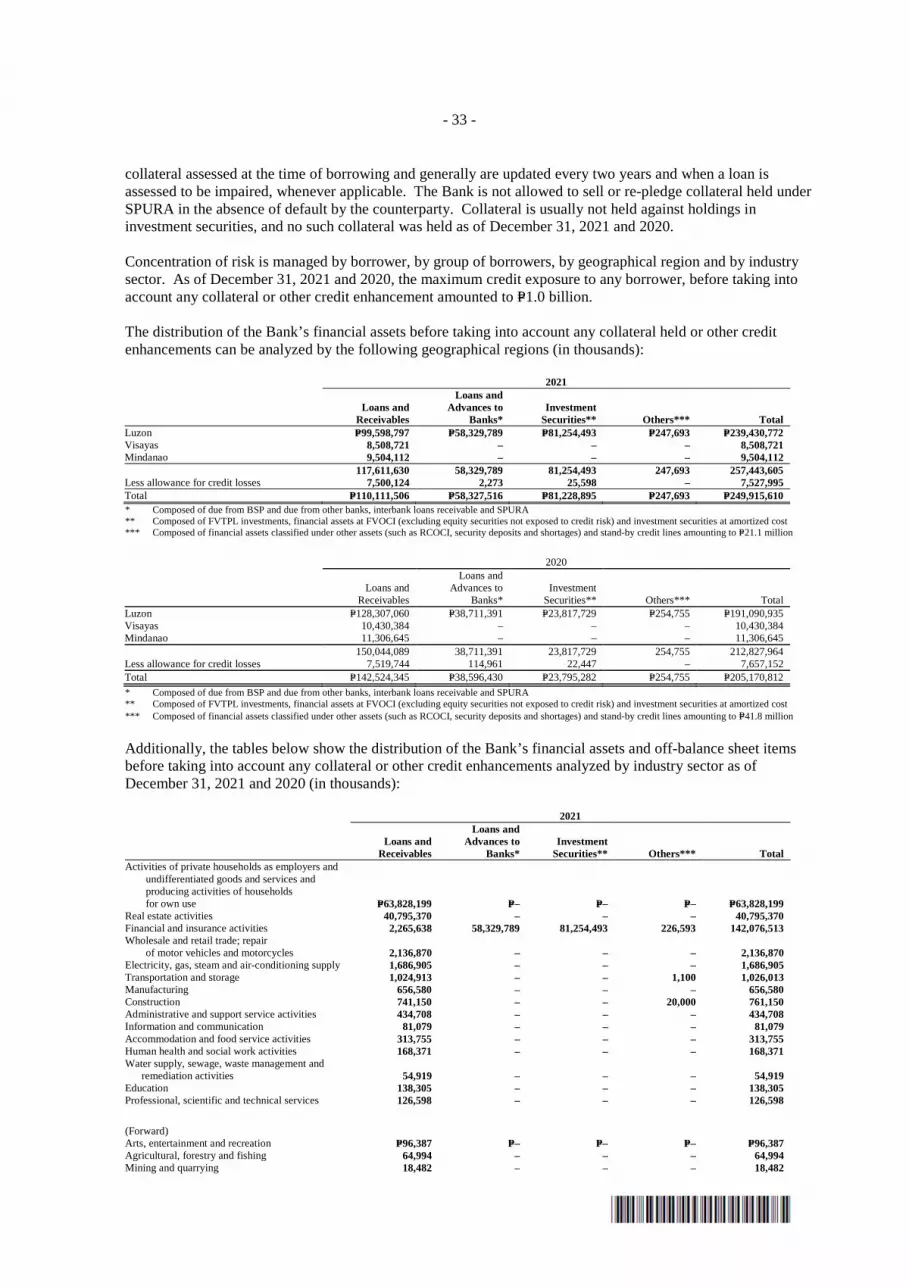
- 33 -
collateral assessed at the time of borrowing and generally are updated every two years and when a loan is assessed to be impaired, whenever applicable. The Bank is not allowed to sell or re-pledge collateral held under SPURA in the absence of default by the counterparty. Collateral is usually not held against holdings in investment securities, and no such collateral was held as of December 31, 2021 and 2020.
Concentration of risk is managed by borrower, by group of borrowers, by geographical region and by industry sector. As of December 31, 2021 and 2020, the maximum credit exposure to any borrower, before taking into account any collateral or other credit enhancement amounted to P=1.0 billion.
The distribution of the Bank’s financial assets before taking into account any collateral held or other credit enhancements can be analyzed by the following geographical regions (in thousands):
2021
Loans and
Receivables
Loans and Advances to
Banks* Investment
Securities** Others*** Total Luzon P=99,598,797 P=58,329,789 P=81,254,493 P=247,693 P=239,430,772 Visayas 8,508,721 – – – 8,508,721 Mindanao 9,504,112 – – – 9,504,112 117,611,630 58,329,789 81,254,493 247,693 257,443,605 Less allowance for credit losses 7,500,124 2,273 25,598 – 7,527,995 Total P=110,111,506 P=58,327,516 P=81,228,895 P=247,693 P=249,915,610 * Composed of due from BSP and due from other banks, interbank loans receivable and SPURA ** Composed of FVTPL investments, financial assets at FVOCI (excluding equity securities not exposed to credit risk) and investment securities at amortized cost *** Composed of financial assets classified under other assets (such as RCOCI, security deposits and shortages) and stand-by credit lines amounting to P=21.1 million
2020
Loans and
Receivables
Loans and Advances to
Banks* Investment
Securities** Others*** Total Luzon P=128,307,060 P=38,711,391 P=23,817,729 P=254,755 P=191,090,935 Visayas 10,430,384 – – – 10,430,384 Mindanao 11,306,645 – – – 11,306,645 150,044,089 38,711,391 23,817,729 254,755 212,827,964 Less allowance for credit losses 7,519,744 114,961 22,447 – 7,657,152 Total P=142,524,345 P=38,596,430 P=23,795,282 P=254,755 P=205,170,812
* Composed of due from BSP and due from other banks, interbank loans receivable and SPURA ** Composed of FVTPL investments, financial assets at FVOCI (excluding equity securities not exposed to credit risk) and investment securities at amortized cost *** Composed of financial assets classified under other assets (such as RCOCI, security deposits and shortages) and stand-by credit lines amounting to P=41.8 million
Additionally, the tables below show the distribution of the Bank’s financial assets and off-balance sheet items before taking into account any collateral or other credit enhancements analyzed by industry sector as of December 31, 2021 and 2020 (in thousands): 2021
Loans and
Receivables
Loans and Advances to
Banks* Investment
Securities** Others*** Total Activities of private households as employers and
undifferentiated goods and services and producing activities of households for own use P=63,828,199 P=– P=– P=– P=63,828,199
Real estate activities 40,795,370 – – – 40,795,370 Financial and insurance activities 2,265,638 58,329,789 81,254,493 226,593 142,076,513 Wholesale and retail trade; repair
of motor vehicles and motorcycles 2,136,870 – – – 2,136,870 Electricity, gas, steam and air-conditioning supply 1,686,905 – – – 1,686,905 Transportation and storage 1,024,913 – – 1,100 1,026,013 Manufacturing 656,580 – – – 656,580 Construction 741,150 – – 20,000 761,150 Administrative and support service activities 434,708 – – – 434,708 Information and communication 81,079 – – – 81,079 Accommodation and food service activities 313,755 – – – 313,755 Human health and social work activities 168,371 – – – 168,371 Water supply, sewage, waste management and
remediation activities 54,919 – – – 54,919 Education 138,305 – – – 138,305 Professional, scientific and technical services 126,598 – – – 126,598
(Forward) Arts, entertainment and recreation P=96,387 P=– P=– P=– P=96,387 Agricultural, forestry and fishing 64,994 – – – 64,994 Mining and quarrying 18,482 – – – 18,482
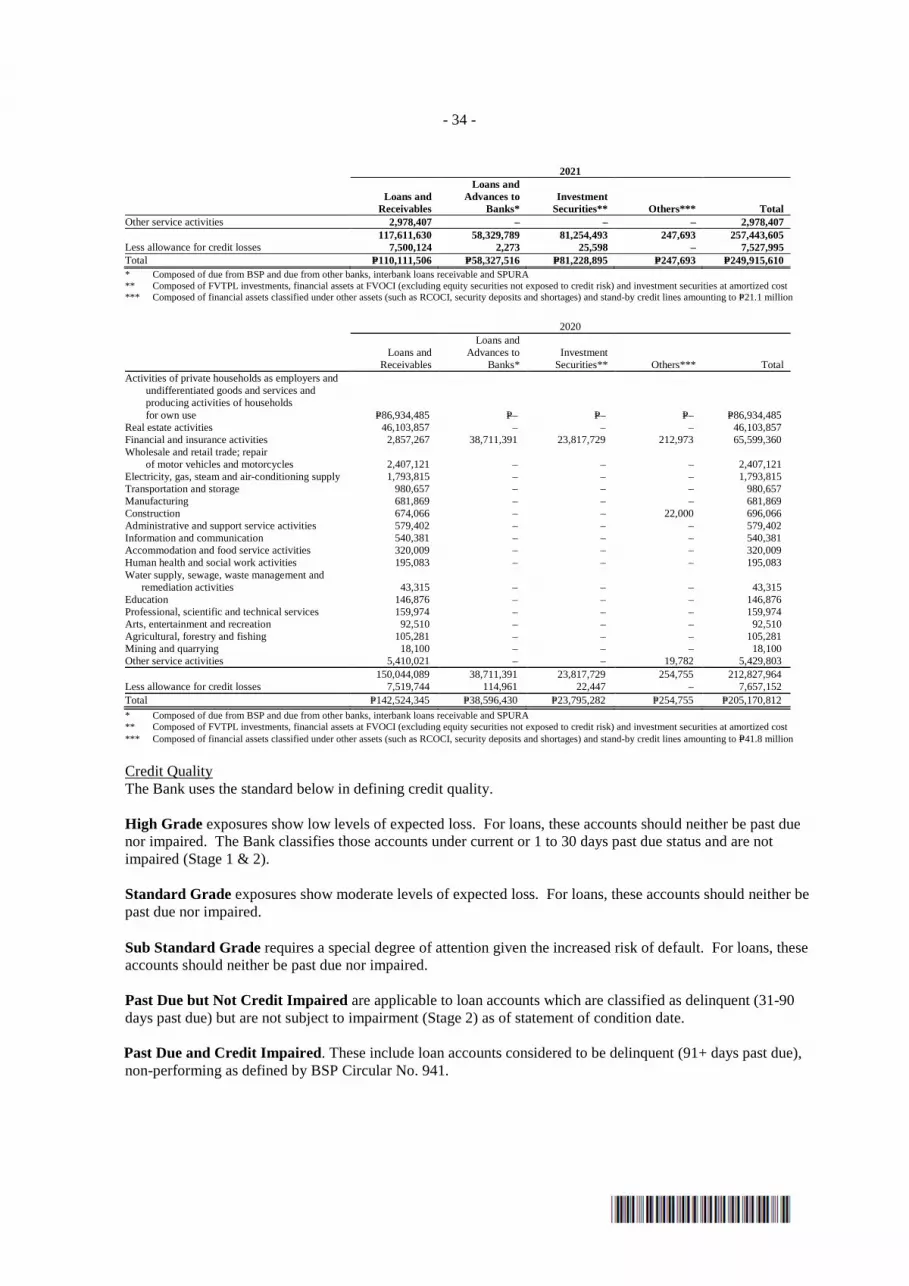
- 34 -
2021
Loans and
Receivables
Loans and Advances to
Banks* Investment
Securities** Others*** Total Other service activities 2,978,407 – – – 2,978,407 117,611,630 58,329,789 81,254,493 247,693 257,443,605 Less allowance for credit losses 7,500,124 2,273 25,598 – 7,527,995 Total P=110,111,506 P=58,327,516 P=81,228,895 P=247,693 P=249,915,610 * Composed of due from BSP and due from other banks, interbank loans receivable and SPURA ** Composed of FVTPL investments, financial assets at FVOCI (excluding equity securities not exposed to credit risk) and investment securities at amortized cost *** Composed of financial assets classified under other assets (such as RCOCI, security deposits and shortages) and stand-by credit lines amounting to P=21.1 million
2020
Loans and
Receivables
Loans and Advances to
Banks* Investment
Securities** Others*** Total Activities of private households as employers and
undifferentiated goods and services and producing activities of households for own use P=86,934,485 P=– P=– P=– P=86,934,485
Real estate activities 46,103,857 – – – 46,103,857 Financial and insurance activities 2,857,267 38,711,391 23,817,729 212,973 65,599,360 Wholesale and retail trade; repair
of motor vehicles and motorcycles 2,407,121 – – – 2,407,121 Electricity, gas, steam and air-conditioning supply 1,793,815 – – – 1,793,815 Transportation and storage 980,657 – – – 980,657 Manufacturing 681,869 – – – 681,869 Construction 674,066 – – 22,000 696,066 Administrative and support service activities 579,402 – – – 579,402 Information and communication 540,381 – – – 540,381 Accommodation and food service activities 320,009 – – – 320,009 Human health and social work activities 195,083 – – – 195,083 Water supply, sewage, waste management and
remediation activities 43,315 – – – 43,315 Education 146,876 – – – 146,876 Professional, scientific and technical services 159,974 – – – 159,974 Arts, entertainment and recreation 92,510 – – – 92,510 Agricultural, forestry and fishing 105,281 – – – 105,281 Mining and quarrying 18,100 – – – 18,100 Other service activities 5,410,021 – – 19,782 5,429,803 150,044,089 38,711,391 23,817,729 254,755 212,827,964 Less allowance for credit losses 7,519,744 114,961 22,447 – 7,657,152 Total P=142,524,345 P=38,596,430 P=23,795,282 P=254,755 P=205,170,812
* Composed of due from BSP and due from other banks, interbank loans receivable and SPURA ** Composed of FVTPL investments, financial assets at FVOCI (excluding equity securities not exposed to credit risk) and investment securities at amortized cost *** Composed of financial assets classified under other assets (such as RCOCI, security deposits and shortages) and stand-by credit lines amounting to P=41.8 million
Credit Quality The Bank uses the standard below in defining credit quality.
High Grade exposures show low levels of expected loss. For loans, these accounts should neither be past due nor impaired. The Bank classifies those accounts under current or 1 to 30 days past due status and are not impaired (Stage 1 & 2). Standard Grade exposures show moderate levels of expected loss. For loans, these accounts should neither be past due nor impaired.
Sub Standard Grade requires a special degree of attention given the increased risk of default. For loans, these accounts should neither be past due nor impaired.
Past Due but Not Credit Impaired are applicable to loan accounts which are classified as delinquent (31-90 days past due) but are not subject to impairment (Stage 2) as of statement of condition date.
Past Due and Credit Impaired. These include loan accounts considered to be delinquent (91+ days past due), non-performing as defined by BSP Circular No. 941.

- 35 -
Description of the internal credit rating system for loans, receivables and stand-by credit lines:
Internal Credit Rating System (ICRS) The Bank rates accounts on a scale of 1 to 10, with 1 being the best, based on the Board-approved credit ratings which utilize the expected credit loss and qualitative assessments. ICRS rating assessment considers both borrower and facility features. High Grade (ICRS Rating 1 - 4) 1 - Excellent An excellent rating is given to a borrower with a very low probability of going into default and/or low loss given default. The Bank’s internal rating system has given an outstanding rating to the borrower, indicative of excellent ability to meet credit obligation in full and consistently meet payment commitments. Accounts with excellent rating may have collateral, further diminishing any losses in case of a default. 2 - Strong This rating is given to borrowers with low probability of going into default in the coming year with low to moderate loss given default. The Bank’s internal rating system has given a high rating to the borrower. The borrower has the ability to meet credit obligation in full, except that the borrower may have a history of missing a payment. 3 - Good This rating is given to borrowers with low to moderate probability of going into default in the coming year with moderate loss given default. These are largely characterized by borrowers with good rating and have historically missed several payments. 4 - Satisfactory A ‘satisfactory’ rating is given to a borrower where clear risk elements exist and probability of default is somewhat greater with moderate to high loss given default. These are characterized by borrowers with good rating with a history of default. Standard Grade (ICRS Rating 5) 5 - Acceptable An ‘acceptable’ rating is given to a borrower whose risk elements are sufficiently pronounced although borrower should still be expected to meet their credit obligations in full. These are characterized by borrowers with moderate rating.
Substandard Grade (ICRS Rating 6-8) 6 or 7 - Loan Especially Mentioned An account assessed to have potential weaknesses which when left uncorrected, may affect the repayment of the account and thus increase credit risk to the Bank, will be assigned this rating. 8 - Substandard These accounts or portion thereof involves a substantial and an unreasonable degree of risk to the Bank because of unfavorable record or unsatisfactory characteristics. These accounts show possibility of future loss to the Bank unless given closer supervision and well-defined weaknesses that jeopardize the account liquidation. Past Due but Not Credit Impaired Otherwise known as under-performing loans, these accounts are characterized as showing signs of deterioration. These include loans that are delinquent by 31-90 days and are not subject to impairment (Stage 2) regardless of ICRS rating. Past Due and Credit Impaired Otherwise known as non-performing loans, these accounts are already impaired. These include accounts under Stage 3 ECL, delinquent by 91+ days and considered non-performing as defined by BSP Circular No. 941 regardless of ICRS rating. The following credit ratings will always be classified as credit impaired:
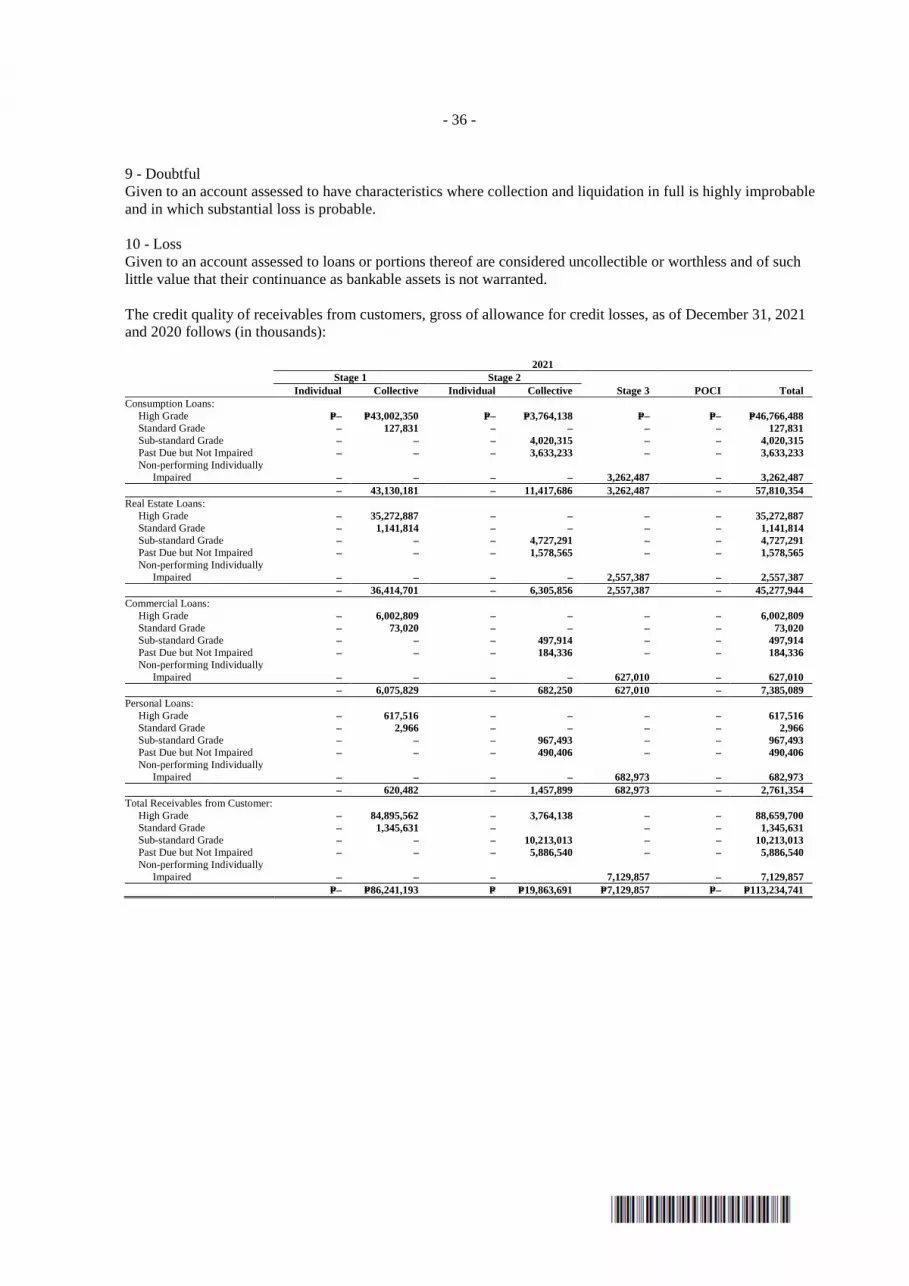
- 36 -
9 - Doubtful Given to an account assessed to have characteristics where collection and liquidation in full is highly improbable and in which substantial loss is probable. 10 - Loss Given to an account assessed to loans or portions thereof are considered uncollectible or worthless and of such little value that their continuance as bankable assets is not warranted.
The credit quality of receivables from customers, gross of allowance for credit losses, as of December 31, 2021 and 2020 follows (in thousands): 2021 Stage 1 Stage 2 Individual Collective Individual Collective Stage 3 POCI Total Consumption Loans:
High Grade P=– P=43,002,350 P=– P=3,764,138 P=– P=– P=46,766,488 Standard Grade – 127,831 – – – – 127,831 Sub-standard Grade – – – 4,020,315 – – 4,020,315 Past Due but Not Impaired – – – 3,633,233 – – 3,633,233 Non-performing Individually
Impaired – – – – 3,262,487 – 3,262,487 – 43,130,181 – 11,417,686 3,262,487 – 57,810,354
Real Estate Loans: High Grade – 35,272,887 – – – – 35,272,887 Standard Grade – 1,141,814 – – – – 1,141,814 Sub-standard Grade – – – 4,727,291 – – 4,727,291 Past Due but Not Impaired – – – 1,578,565 – – 1,578,565 Non-performing Individually
Impaired – – – – 2,557,387 – 2,557,387 – 36,414,701 – 6,305,856 2,557,387 – 45,277,944
Commercial Loans: High Grade – 6,002,809 – – – – 6,002,809 Standard Grade – 73,020 – – – – 73,020 Sub-standard Grade – – – 497,914 – – 497,914 Past Due but Not Impaired – – – 184,336 – – 184,336 Non-performing Individually
Impaired – – – – 627,010 – 627,010 – 6,075,829 – 682,250 627,010 – 7,385,089
Personal Loans: High Grade – 617,516 – – – – 617,516 Standard Grade – 2,966 – – – – 2,966 Sub-standard Grade – – – 967,493 – – 967,493 Past Due but Not Impaired – – – 490,406 – – 490,406 Non-performing Individually
Impaired – – – – 682,973 – 682,973 – 620,482 – 1,457,899 682,973 – 2,761,354
Total Receivables from Customer: High Grade – 84,895,562 – 3,764,138 – – 88,659,700 Standard Grade – 1,345,631 – – – 1,345,631 Sub-standard Grade – – – 10,213,013 – – 10,213,013 Past Due but Not Impaired – – – 5,886,540 – – 5,886,540 Non-performing Individually
Impaired – – – 7,129,857 – 7,129,857 P=– P=86,241,193 P= P=19,863,691 P=7,129,857 P=– P=113,234,741
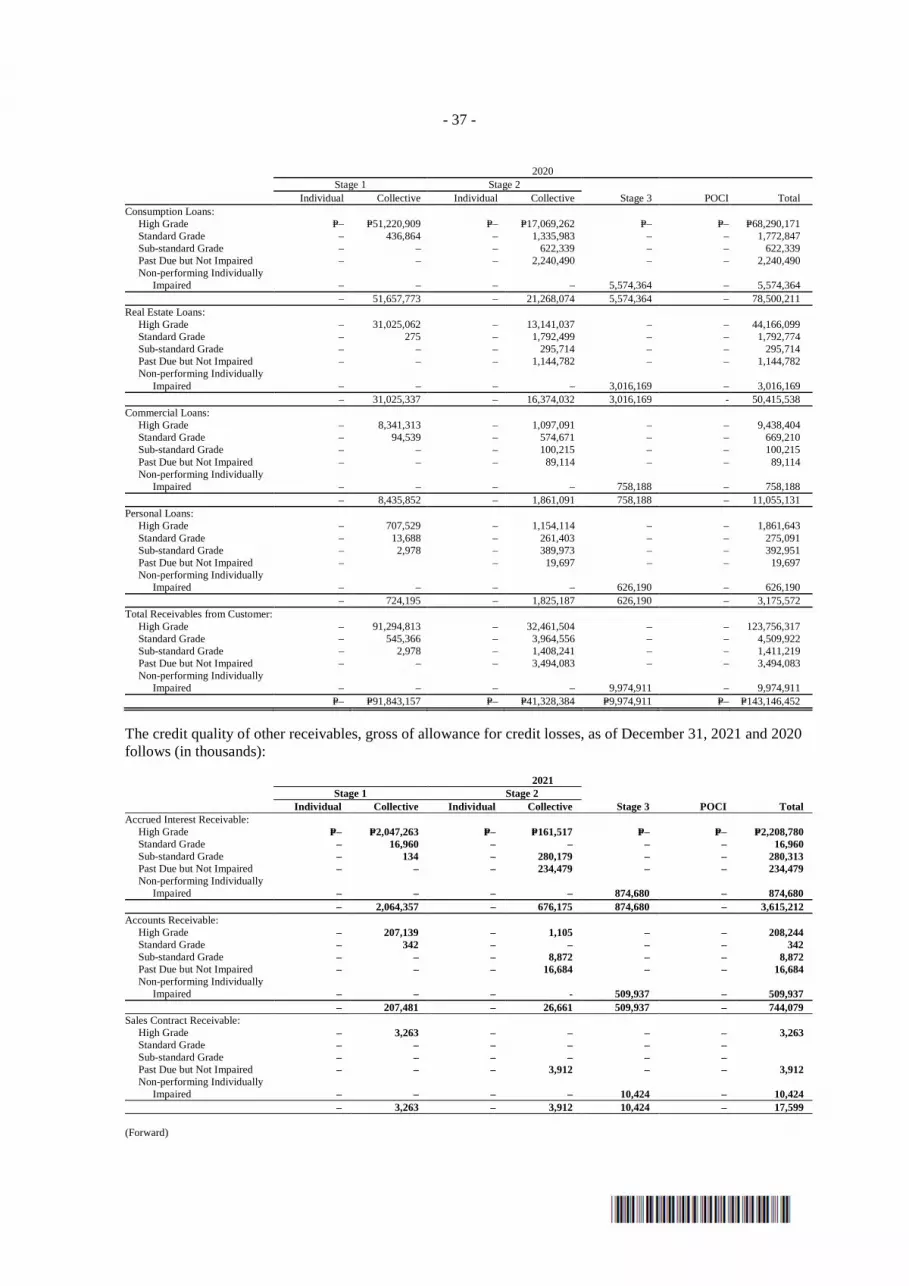
- 37 -
2020 Stage 1 Stage 2 Individual Collective Individual Collective Stage 3 POCI Total Consumption Loans:
High Grade P=– P=51,220,909 P=– P=17,069,262 P=– P=– P=68,290,171 Standard Grade – 436,864 – 1,335,983 – – 1,772,847 Sub-standard Grade – – – 622,339 – – 622,339 Past Due but Not Impaired – – – 2,240,490 – – 2,240,490 Non-performing Individually
Impaired – – – – 5,574,364 – 5,574,364 – 51,657,773 – 21,268,074 5,574,364 – 78,500,211
Real Estate Loans: High Grade – 31,025,062 – 13,141,037 – – 44,166,099 Standard Grade – 275 – 1,792,499 – – 1,792,774 Sub-standard Grade – – – 295,714 – – 295,714 Past Due but Not Impaired – – – 1,144,782 – – 1,144,782 Non-performing Individually
Impaired – – – – 3,016,169 – 3,016,169 – 31,025,337 – 16,374,032 3,016,169 - 50,415,538
Commercial Loans: High Grade – 8,341,313 – 1,097,091 – – 9,438,404 Standard Grade – 94,539 – 574,671 – – 669,210 Sub-standard Grade – – – 100,215 – – 100,215 Past Due but Not Impaired – – – 89,114 – – 89,114 Non-performing Individually
Impaired – – – – 758,188 – 758,188 – 8,435,852 – 1,861,091 758,188 – 11,055,131
Personal Loans: High Grade – 707,529 – 1,154,114 – – 1,861,643 Standard Grade – 13,688 – 261,403 – – 275,091 Sub-standard Grade – 2,978 – 389,973 – – 392,951 Past Due but Not Impaired – – 19,697 – – 19,697 Non-performing Individually
Impaired – – – – 626,190 – 626,190 – 724,195 – 1,825,187 626,190 – 3,175,572
Total Receivables from Customer: High Grade – 91,294,813 – 32,461,504 – – 123,756,317 Standard Grade – 545,366 – 3,964,556 – – 4,509,922 Sub-standard Grade – 2,978 – 1,408,241 – – 1,411,219 Past Due but Not Impaired – – – 3,494,083 – – 3,494,083 Non-performing Individually
Impaired – – – – 9,974,911 – 9,974,911 P=– P=91,843,157 P=– P=41,328,384 P=9,974,911 P=– P=143,146,452
The credit quality of other receivables, gross of allowance for credit losses, as of December 31, 2021 and 2020 follows (in thousands):
2021 Stage 1 Stage 2 Individual Collective Individual Collective Stage 3 POCI Total Accrued Interest Receivable:
High Grade P=– P=2,047,263 P=– P=161,517 P=– P=– P=2,208,780 Standard Grade – 16,960 – – – – 16,960 Sub-standard Grade – 134 – 280,179 – – 280,313 Past Due but Not Impaired – – – 234,479 – – 234,479 Non-performing Individually
Impaired – – – – 874,680 – 874,680 – 2,064,357 – 676,175 874,680 – 3,615,212
Accounts Receivable: High Grade – 207,139 – 1,105 – – 208,244 Standard Grade – 342 – – – – 342 Sub-standard Grade – – – 8,872 – – 8,872 Past Due but Not Impaired – – – 16,684 – – 16,684 Non-performing Individually
Impaired – – – - 509,937 – 509,937 – 207,481 – 26,661 509,937 – 744,079
Sales Contract Receivable: High Grade – 3,263 – – – – 3,263 Standard Grade – – – – – – Sub-standard Grade – – – – – – Past Due but Not Impaired – – – 3,912 – – 3,912 Non-performing Individually
Impaired – – – – 10,424 – 10,424 – 3,263 – 3,912 10,424 – 17,599
(Forward)
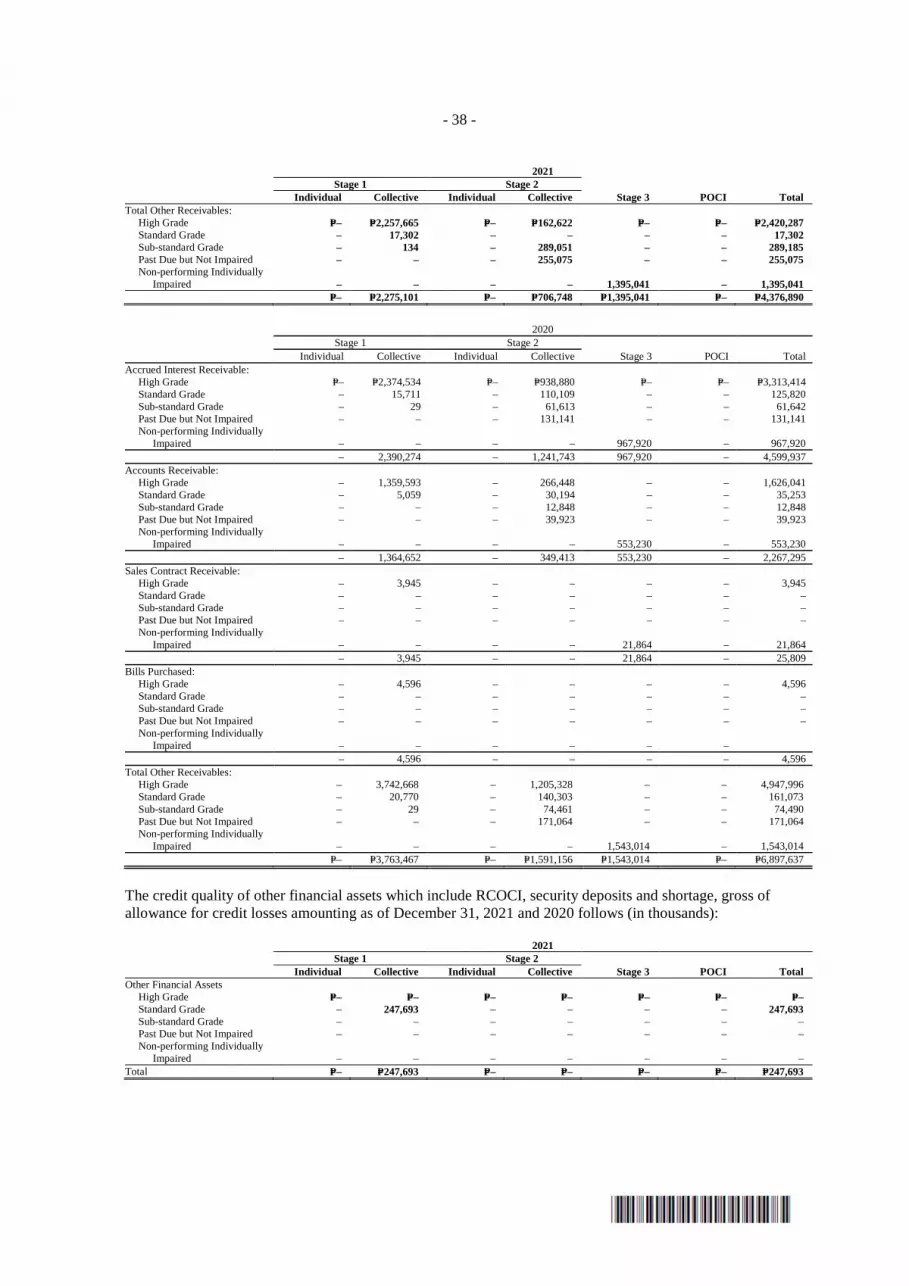
- 38 -
2021 Stage 1 Stage 2 Individual Collective Individual Collective Stage 3 POCI Total Total Other Receivables:
High Grade P=– P=2,257,665 P=– P=162,622 P=– P=– P=2,420,287 Standard Grade – 17,302 – – – – 17,302 Sub-standard Grade – 134 – 289,051 – – 289,185 Past Due but Not Impaired – – – 255,075 – – 255,075 Non-performing Individually
Impaired – – – – 1,395,041 – 1,395,041 P=– P=2,275,101 P=– P=706,748 P=1,395,041 P=– P=4,376,890
2020 Stage 1 Stage 2 Individual Collective Individual Collective Stage 3 POCI Total Accrued Interest Receivable:
High Grade P=– P=2,374,534 P=– P=938,880 P=– P=– P=3,313,414 Standard Grade – 15,711 – 110,109 – – 125,820 Sub-standard Grade – 29 – 61,613 – – 61,642 Past Due but Not Impaired – – – 131,141 – – 131,141 Non-performing Individually
Impaired – – – – 967,920 – 967,920 – 2,390,274 – 1,241,743 967,920 – 4,599,937
Accounts Receivable: High Grade – 1,359,593 – 266,448 – – 1,626,041 Standard Grade – 5,059 – 30,194 – – 35,253 Sub-standard Grade – – – 12,848 – – 12,848 Past Due but Not Impaired – – – 39,923 – – 39,923 Non-performing Individually
Impaired – – – – 553,230 – 553,230 – 1,364,652 – 349,413 553,230 – 2,267,295
Sales Contract Receivable: High Grade – 3,945 – – – – 3,945 Standard Grade – – – – – – – Sub-standard Grade – – – – – – – Past Due but Not Impaired – – – – – – – Non-performing Individually
Impaired – – – – 21,864 – 21,864 – 3,945 – – 21,864 – 25,809
Bills Purchased: High Grade – 4,596 – – – – 4,596 Standard Grade – – – – – – – Sub-standard Grade – – – – – – – Past Due but Not Impaired – – – – – – – Non-performing Individually
Impaired – – – – – – – 4,596 – – – – 4,596
Total Other Receivables: High Grade – 3,742,668 – 1,205,328 – – 4,947,996 Standard Grade – 20,770 – 140,303 – – 161,073 Sub-standard Grade – 29 – 74,461 – – 74,490 Past Due but Not Impaired – – – 171,064 – – 171,064 Non-performing Individually
Impaired – – – – 1,543,014 – 1,543,014 P=– P=3,763,467 P=– P=1,591,156 P=1,543,014 P=– P=6,897,637
The credit quality of other financial assets which include RCOCI, security deposits and shortage, gross of allowance for credit losses amounting as of December 31, 2021 and 2020 follows (in thousands):
2021 Stage 1 Stage 2 Individual Collective Individual Collective Stage 3 POCI Total Other Financial Assets
High Grade P=– P=– P=– P=– P=– P=– P=– Standard Grade – 247,693 – – – – 247,693 Sub-standard Grade – – – – – – – Past Due but Not Impaired – – – – – – – Non-performing Individually
Impaired – – – – – – – Total P=– P=247,693 P=– P=– P=– P=– P=247,693
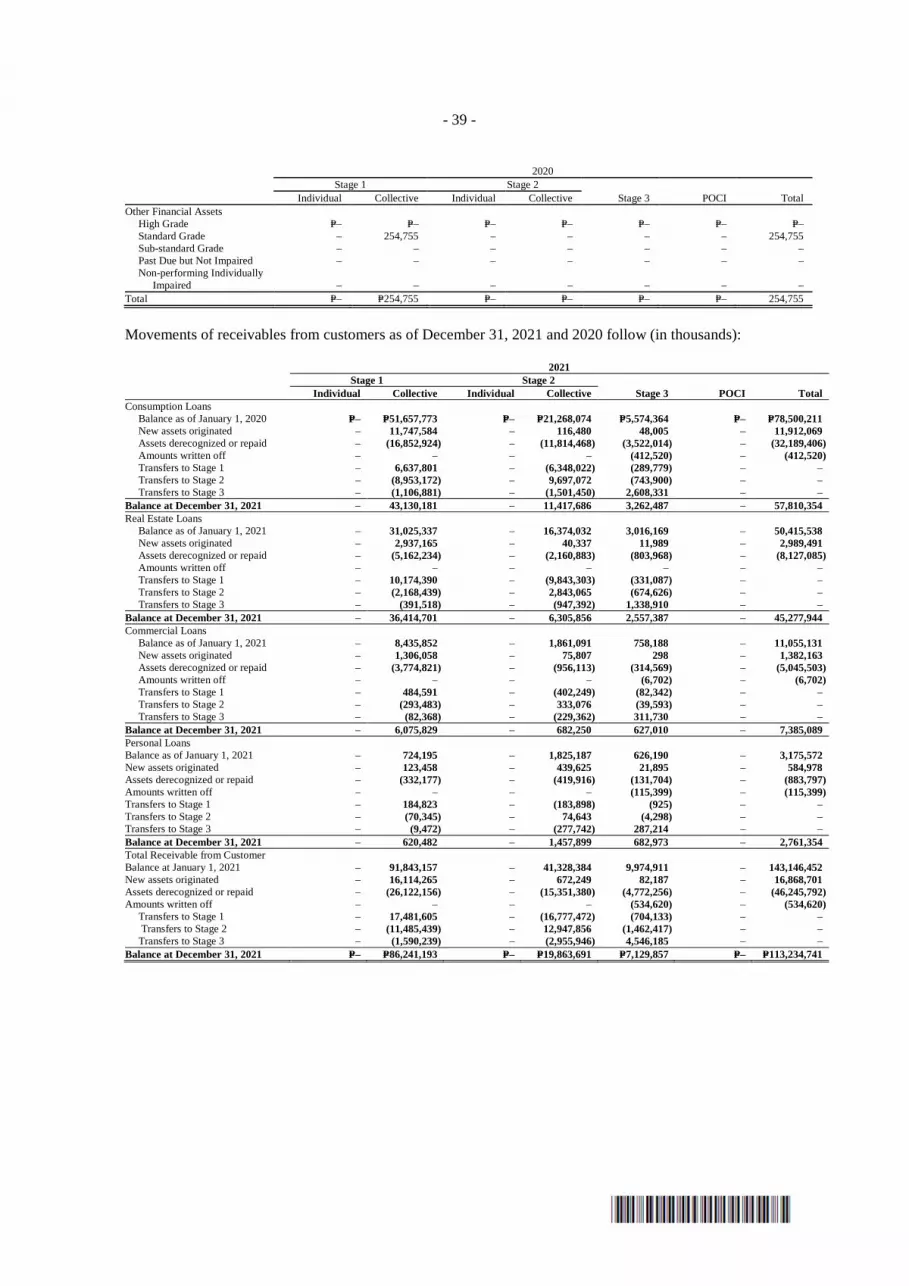
- 39 -
2020 Stage 1 Stage 2 Individual Collective Individual Collective Stage 3 POCI Total Other Financial Assets
High Grade P=– P=– P=– P=– P=– P=– P=– Standard Grade – 254,755 – – – – 254,755 Sub-standard Grade – – – – – – – Past Due but Not Impaired – – – – – – – Non-performing Individually
Impaired – – – – – – – Total P=– P=254,755 P=– P=– P=– P=– 254,755
Movements of receivables from customers as of December 31, 2021 and 2020 follow (in thousands): 2021 Stage 1 Stage 2 Individual Collective Individual Collective Stage 3 POCI Total Consumption Loans
Balance as of January 1, 2020 P=– P=51,657,773 P=– P=21,268,074 P=5,574,364 P=– P=78,500,211 New assets originated – 11,747,584 – 116,480 48,005 – 11,912,069 Assets derecognized or repaid – (16,852,924) – (11,814,468) (3,522,014) – (32,189,406) Amounts written off – – – – (412,520) – (412,520) Transfers to Stage 1 – 6,637,801 – (6,348,022) (289,779) – – Transfers to Stage 2 – (8,953,172) – 9,697,072 (743,900) – – Transfers to Stage 3 – (1,106,881) – (1,501,450) 2,608,331 – –
Balance at December 31, 2021 – 43,130,181 – 11,417,686 3,262,487 – 57,810,354 Real Estate Loans
Balance as of January 1, 2021 – 31,025,337 – 16,374,032 3,016,169 – 50,415,538 New assets originated – 2,937,165 – 40,337 11,989 – 2,989,491 Assets derecognized or repaid – (5,162,234) – (2,160,883) (803,968) – (8,127,085) Amounts written off – – – – – – – Transfers to Stage 1 – 10,174,390 – (9,843,303) (331,087) – – Transfers to Stage 2 – (2,168,439) – 2,843,065 (674,626) – – Transfers to Stage 3 – (391,518) – (947,392) 1,338,910 – –
Balance at December 31, 2021 – 36,414,701 – 6,305,856 2,557,387 – 45,277,944 Commercial Loans
Balance as of January 1, 2021 – 8,435,852 – 1,861,091 758,188 – 11,055,131 New assets originated – 1,306,058 – 75,807 298 – 1,382,163 Assets derecognized or repaid – (3,774,821) – (956,113) (314,569) – (5,045,503) Amounts written off – – – – (6,702) – (6,702) Transfers to Stage 1 – 484,591 – (402,249) (82,342) – – Transfers to Stage 2 – (293,483) – 333,076 (39,593) – – Transfers to Stage 3 – (82,368) – (229,362) 311,730 – –
Balance at December 31, 2021 – 6,075,829 – 682,250 627,010 – 7,385,089 Personal Loans Balance as of January 1, 2021 – 724,195 – 1,825,187 626,190 – 3,175,572 New assets originated – 123,458 – 439,625 21,895 – 584,978 Assets derecognized or repaid – (332,177) – (419,916) (131,704) – (883,797) Amounts written off – – – – (115,399) – (115,399) Transfers to Stage 1 – 184,823 – (183,898) (925) – – Transfers to Stage 2 – (70,345) – 74,643 (4,298) – – Transfers to Stage 3 – (9,472) – (277,742) 287,214 – – Balance at December 31, 2021 – 620,482 – 1,457,899 682,973 – 2,761,354 Total Receivable from Customer Balance at January 1, 2021 – 91,843,157 – 41,328,384 9,974,911 – 143,146,452 New assets originated – 16,114,265 – 672,249 82,187 – 16,868,701 Assets derecognized or repaid – (26,122,156) – (15,351,380) (4,772,256) – (46,245,792) Amounts written off – – – – (534,620) – (534,620)
Transfers to Stage 1 – 17,481,605 – (16,777,472) (704,133) – – Transfers to Stage 2 – (11,485,439) – 12,947,856 (1,462,417) – – Transfers to Stage 3 – (1,590,239) – (2,955,946) 4,546,185 – –
Balance at December 31, 2021 P=– P=86,241,193 P=– P=19,863,691 P=7,129,857 P=– P=113,234,741

- 40 -
2020 Stage 1 Stage 2 Individual Collective Individual Collective Stage 3 POCI Total Consumption Loans
Balance as of January 1, 2020 P=– P=79,398,166 P=– P=11,609,867 P=3,217,461 P=– P=94,225,494 New assets originated – 17,078,503 – 42,185 – – 17,120,688 Assets derecognized or repaid – (26,019,116) – (4,935,631) (1,144,915) – (32,099,662) Amounts written off – – – – (746,309) – (746,309) Transfers to Stage 1 – 564,353 – (508,945) (55,408) – – Transfers to Stage 2 – (16,677,607) – 16,986,609 (309,002) – – Transfers to Stage 3 – (2,686,526) – (1,926,011) 4,612,537 – –
Balance at December 31, 2020 – 51,657,773 – 21,268,074 5,574,364 – 78,500,211 Real Estate Loans
Balance as of January 1, 2020 – 41,049,925 – 9,557,057 1,872,205 – 52,479,187 New assets originated – 4,117,313 – 39,147 – – 4,156,460 Assets derecognized or repaid – (4,493,599) – (1,395,102) (247,083) – (6,135,784) Amounts written off – – – – (84,325) – (84,325) Transfers to Stage 1 – 1,204,764 – (1,126,708) (78,056) – – Transfers to Stage 2 – (9,872,502) – 10,374,189 (501,687) – – Transfers to Stage 3 – (980,564) – (1,074,551) 2,055,115 – –
Balance at December 31, 2020 – 31,025,337 – 16,374,032 3,016,169 – 50,415,538 Commercial Loans
Balance as of January 1, 2020 – 12,184,437 – 1,132,470 369,079 – 13,685,986 New assets originated – 4,225,129 – 29,174 21,756 – 4,276,059 Assets derecognized or repaid – (6,764,528) – (129,759) – – (6,894,287) Amounts written off – – – – (12,627) – (12,627) Transfers to Stage 1 – 62,308 – (53,278) (9,030) – – Transfers to Stage 2 – (1,013,744) – 1,032,085 (18,341) – – Transfers to Stage 3 – (257,750) – (149,601) 407,351 – –
Balance at December 31, 2020 – 8,435,852 – 1,861,091 758,188 – 11,055,131 Personal Loans Balance as of January 1, 2020 – 823,595 – 2,441,246 458,350 – 3,723,191
New assets originated – 196,552 – 494,254 98,852 – 789,658 Assets derecognized or repaid – (258,947) – (846,781) – – (1,105,728) Amounts written off – – – (104) (231,445) – (231,549) Transfers to Stage 1 – 96,952 – (96,393) (559) – – Transfers to Stage 2 – (117,307) – 121,739 (4,432) – – Transfers to Stage 3 – (16,650) – (288,774) 305,424 – –
Balance at December 31, 2020 – 724,195 – 1,825,187 626,190 – 3,175,572 Total Receivable from Customer Balance at January 1, 2020 – 133,456,123 – 24,740,640 5,917,095 – 164,113,858
New assets originated – 25,617,497 – 604,760 120,608 – 26,342,865 Assets derecognized or repaid – (37,536,190) – (7,307,273) (1,391,998) – (46,235,461) Amounts written off – – – (104) (1,074,706) – (1,074,810) Transfers to Stage 1 – 1,928,377 – (1,785,324) (143,053) – 0 Transfers to Stage 2 – (27,681,160) – 28,514,622 (833,462) – (0) Transfers to Stage 3 – (3,941,490) – (3,438,937) 7,380,427 – –
Balance at December 31, 2020 P=– P=91,843,157 P=– P=41,328,384 P=9,974,911 P=– P=143,146,452
Movements of other receivables as of December 31, 2021 and 2020 follow (in thousands):
2021 Stage 1 Stage 2 Individual Collective Individual Collective Stage 3 POCI Total Accrued Interest Receivable
Balance as of January 1, 2021 P=– P=2,390,274 P=– P=1,241,743 P=967,920 P=– P=4,599,937 New assets originated – 179,696 – 13,790 15,207 – 208,693 Assets derecognized or repaid – (553,038) – (414,177) (226,203) – (1,193,418) Amounts written off – – – – – Transfers to Stage 1 – 419,305 – (406,706) (12,599) – – Transfers to Stage 2 – (322,070) – 351,229 (29,159) – – Transfers to Stage 3 – (49,810) – (109,704) 159,514 – –
Balance at December 31, 2021 – 2,064,357 – 676,175 874,680 – 3,615,212 Sales Contract Receivable
Balance at January 1, 2021 – 3,945 – – 21,864 – 25,809 New assets originated – – – – – – – Assets derecognized or repaid – (2,219) – (2,462) (3,529) – (8,210) Amounts written off – – – – – – – Transfers to Stage 1 – 2,107 – – (2,107) – – Transfers to Stage 2 – (528) – 6,374 (5,846) – – Transfers to Stage 3 – (42) – – 42 – –
Balance at December 31, 2021 – 3,263 – 3,912 10,424 – 17,599 (Forward)
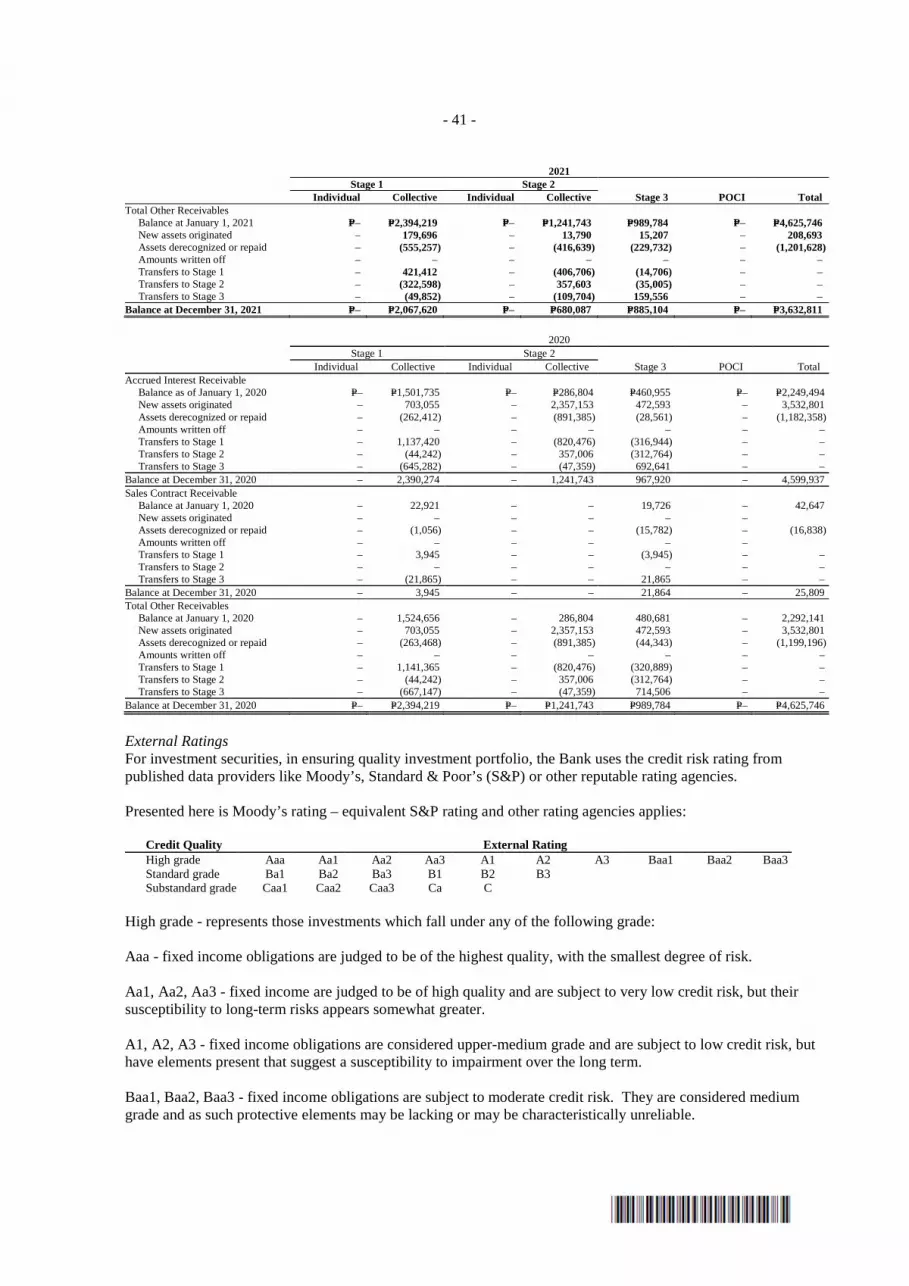
- 41 -
2021 Stage 1 Stage 2 Individual Collective Individual Collective Stage 3 POCI Total Total Other Receivables
Balance at January 1, 2021 P=– P=2,394,219 P=– P=1,241,743 P=989,784 P=– P=4,625,746 New assets originated – 179,696 – 13,790 15,207 – 208,693 Assets derecognized or repaid – (555,257) – (416,639) (229,732) – (1,201,628) Amounts written off – – – – – – – Transfers to Stage 1 – 421,412 – (406,706) (14,706) – – Transfers to Stage 2 – (322,598) – 357,603 (35,005) – – Transfers to Stage 3 – (49,852) – (109,704) 159,556 – –
Balance at December 31, 2021 P=– P=2,067,620 P=– P=680,087 P=885,104 P=– P=3,632,811
2020 Stage 1 Stage 2 Individual Collective Individual Collective Stage 3 POCI Total Accrued Interest Receivable
Balance as of January 1, 2020 P=– P=1,501,735 P=– P=286,804 P=460,955 P=– P=2,249,494 New assets originated – 703,055 – 2,357,153 472,593 – 3,532,801 Assets derecognized or repaid – (262,412) – (891,385) (28,561) – (1,182,358) Amounts written off – – – – – – – Transfers to Stage 1 – 1,137,420 – (820,476) (316,944) – – Transfers to Stage 2 – (44,242) – 357,006 (312,764) – – Transfers to Stage 3 – (645,282) – (47,359) 692,641 – –
Balance at December 31, 2020 – 2,390,274 – 1,241,743 967,920 – 4,599,937 Sales Contract Receivable
Balance at January 1, 2020 – 22,921 – – 19,726 – 42,647 New assets originated – – – – – – Assets derecognized or repaid – (1,056) – – (15,782) – (16,838) Amounts written off – – – – – – Transfers to Stage 1 – 3,945 – – (3,945) – – Transfers to Stage 2 – – – – – – – Transfers to Stage 3 – (21,865) – – 21,865 – –
Balance at December 31, 2020 – 3,945 – – 21,864 – 25,809 Total Other Receivables
Balance at January 1, 2020 – 1,524,656 – 286,804 480,681 – 2,292,141 New assets originated – 703,055 – 2,357,153 472,593 – 3,532,801 Assets derecognized or repaid – (263,468) – (891,385) (44,343) – (1,199,196) Amounts written off – – – – – – – Transfers to Stage 1 – 1,141,365 – (820,476) (320,889) – – Transfers to Stage 2 – (44,242) – 357,006 (312,764) – – Transfers to Stage 3 – (667,147) – (47,359) 714,506 – –
Balance at December 31, 2020 P=– P=2,394,219 P=– P=1,241,743 P=989,784 P=– P=4,625,746
External Ratings For investment securities, in ensuring quality investment portfolio, the Bank uses the credit risk rating from published data providers like Moody’s, Standard & Poor’s (S&P) or other reputable rating agencies.
Presented here is Moody’s rating – equivalent S&P rating and other rating agencies applies:
Credit Quality External Rating High grade Aaa Aa1 Aa2 Aa3 A1 A2 A3 Baa1 Baa2 Baa3 Standard grade Ba1 Ba2 Ba3 B1 B2 B3 Substandard grade Caa1 Caa2 Caa3 Ca C
High grade - represents those investments which fall under any of the following grade:
Aaa - fixed income obligations are judged to be of the highest quality, with the smallest degree of risk.
Aa1, Aa2, Aa3 - fixed income are judged to be of high quality and are subject to very low credit risk, but their susceptibility to long-term risks appears somewhat greater.
A1, A2, A3 - fixed income obligations are considered upper-medium grade and are subject to low credit risk, but have elements present that suggest a susceptibility to impairment over the long term. Baa1, Baa2, Baa3 - fixed income obligations are subject to moderate credit risk. They are considered medium grade and as such protective elements may be lacking or may be characteristically unreliable.
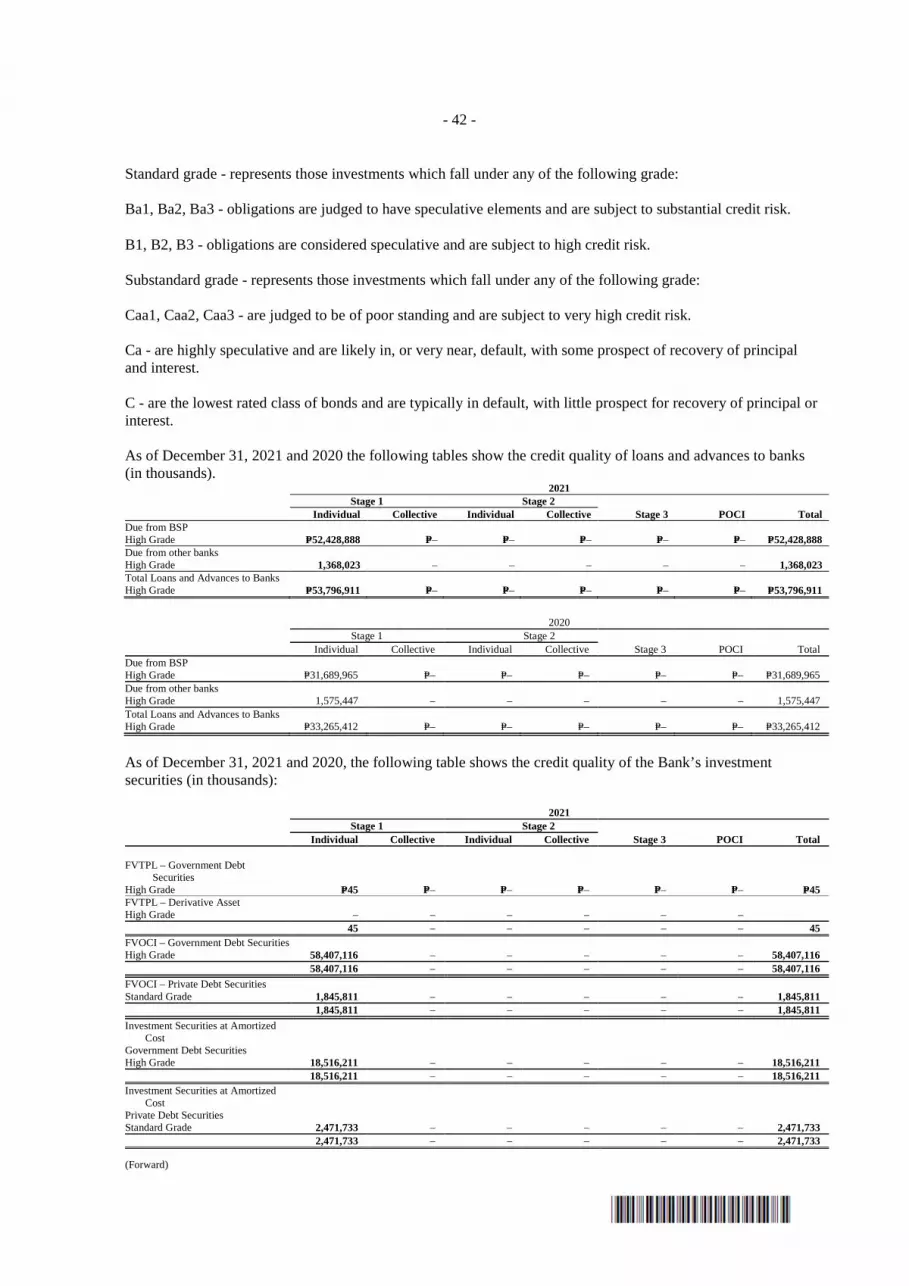
- 42 -
Standard grade - represents those investments which fall under any of the following grade:
Ba1, Ba2, Ba3 - obligations are judged to have speculative elements and are subject to substantial credit risk.
B1, B2, B3 - obligations are considered speculative and are subject to high credit risk. Substandard grade - represents those investments which fall under any of the following grade:
Caa1, Caa2, Caa3 - are judged to be of poor standing and are subject to very high credit risk.
Ca - are highly speculative and are likely in, or very near, default, with some prospect of recovery of principal and interest.
C - are the lowest rated class of bonds and are typically in default, with little prospect for recovery of principal or interest.
As of December 31, 2021 and 2020 the following tables show the credit quality of loans and advances to banks (in thousands). 2021 Stage 1 Stage 2 Individual Collective Individual Collective Stage 3 POCI Total Due from BSP High Grade P=52,428,888 P=– P=– P=– P=– P=– P=52,428,888 Due from other banks High Grade 1,368,023 – – – – – 1,368,023 Total Loans and Advances to Banks High Grade P=53,796,911 P=– P=– P=– P=– P=– P=53,796,911
2020 Stage 1 Stage 2 Individual Collective Individual Collective Stage 3 POCI Total Due from BSP High Grade P=31,689,965 P=– P=– P=– P=– P=– P=31,689,965 Due from other banks High Grade 1,575,447 – – – – – 1,575,447 Total Loans and Advances to Banks High Grade P=33,265,412 P=– P=– P=– P=– P=– P=33,265,412
As of December 31, 2021 and 2020, the following table shows the credit quality of the Bank’s investment securities (in thousands):
2021 Stage 1 Stage 2 Individual Collective Individual Collective Stage 3 POCI Total FVTPL – Government Debt
Securities
High Grade P=45 P=– P=– P=– P=– P=– P=45 FVTPL – Derivative Asset High Grade – – – – – – 45 – – – – – 45 FVOCI – Government Debt Securities High Grade 58,407,116 – – – – – 58,407,116
58,407,116 – – – – – 58,407,116
FVOCI – Private Debt Securities Standard Grade 1,845,811 – – – – – 1,845,811
1,845,811 – – – – – 1,845,811
Investment Securities at Amortized Cost
Government Debt Securities High Grade 18,516,211 – – – – – 18,516,211 18,516,211 – – – – – 18,516,211 Investment Securities at Amortized
Cost Private Debt Securities Standard Grade 2,471,733 – – – – – 2,471,733 2,471,733 – – – – – 2,471,733
(Forward)

- 43 -
2021 Stage 1 Stage 2 Individual Collective Individual Collective Stage 3 POCI Total Total Investment Securities High Grade P=76,923,372 P=– P=– P=– P=– P=– P=76,923,372 Standard Grade 4,317,544 – – – – – 4,317,544
P=81,240,916 P=– P=– P=– P=– P=– P=81,240,916
2020 Stage 1 Stage 2 Individual Collective Individual Collective Stage 3 POCI Total FVTPL – Government Debt
Securities
High Grade P=50 P=– P=– P=– P=– P=– P=50 FVTPL – Derivative Asset High Grade – – – – – – – 50 – – – – – 50 FVOCI – Government Debt Securities High Grade 7,093,132 – – – – – 7,093,132
7,093,132 – – – – – 7,093,132
FVOCI – Private Debt Securities Standard Grade 2,955,869 – – – – – 2,955,869
2,955,869 – – – – – 2,955,869
Investment Securities at Amortized Cost– Government Debt Securities
High Grade 11,115,902 – – – – – 11,115,902 11,115,902 – – – – – 11,115,902 Investment Securities at Amortized
Cost Private Debt Securities Standard Grade 2,642,544 – – – – – 2,642,544 2,642,544 – – – – – 2,642,544 Total Investment Securities High Grade 18,209,084 – – – – – 18,209,084 Standard Grade 5,598,413 – – – – – 5,598,413
P=23,807,497 P=– P=– P=– P=– P=– P=23,807,497
All of the Bank’s loan commitments and financial guarantees amounting to P=21.1 million and P=41.8 million as of December 31, 2021 and 2020, respectively, are classified as high grade under Stage 1. ECL Methodology Overview ECL represent credit losses that reflect an unbiased and probability-weighted amount which is determined by evaluating a range of possible outcomes, the time value of money and reasonable and supportable information about past events, current conditions and forecasts of future economic conditions.
The objective of the new impairment standard is to record lifetime losses on all financial instruments which have experienced a SICR since their initial recognition. As a result, ECL allowances will be measured at amounts equal to either (i) 12-month ECL or (ii) lifetime ECL for those financial instruments which have experienced a SICR since initial recognition (General Approach). The 12-month ECL is the portion of lifetime ECL that results from default events on a financial instrument that are possible within the 12 months after the reporting date. Lifetime ECL are credit losses that results from all possible default events over the expected life of a financial instrument. In comparison, the incurred loss model recognizes lifetime credit losses only when there is objective evidence of impairment.
Staging assessment For non-credit-impaired financial instruments: • Stage 1 is comprised of all non-impaired financial instruments which have not experienced a SICR since
initial recognition. The Bank recognizes a 12-month ECL for Stage 1 financial instruments. • Stage 2 is comprised of all non-impaired financial instruments which have experienced a SICR since initial
recognition. The Bank recognizes a lifetime ECL for Stage 2 financial instruments.

- 44 -
For credit-impaired financial instruments: • Financial instruments are classified as Stage 3 when there is objective evidence of impairment as a result of
one or more loss events that have occurred after initial recognition with a negative impact on the estimated future cash flows of a loan or a portfolio of loans. The ECL model requires that lifetime ECL be recognized for impaired financial instruments.
Two modelling approaches were employed to build a consistent framework for the development of all ECL models of the Bank. Both modeling approaches consider past events, current conditions and forecast of economic conditions in assessing impairment. The complex model approach is used for portfolios with a significant number of historical defaults. This approach was applied to the consumer loan portfolios. These quantitative models are built by applying statistical, economic, financial or mathematical theories, techniques and assumptions to calculate provisions. Where historical data are insufficient to develop statistical models, such as for Business Loans, Account Receivables, Sales Contract Receivables, etc. the simplified ECL approach was employed. The Bank observed the historical PD and LGD of the portfolio and applied forward looking economic data on PD to calculate the ECL.
Classification of Individual/Collective Impairment The Bank calculates provisions either in a collective or individual basis.
Collective impairment calculates risk provisions by grouping exposures into smaller homogeneous portfolios based on a combination of borrower and account characteristics. Accounts with similar risk attributes (i.e. facility, security, credit rating, months-on-books, utilization and collateral type, etc.) are pooled together for calculating provisions based on the expected credit loss models. All Stage 1 and 2 accounts of the Bank are categorized under collective impairment. Individual impairment is applicable for all accounts under Stage 3 or accounts deemed as significant exposures and show objective evidence of impairment. The indicators may be default in payment, restructuring, litigation or probable foreclosure.
As of December 31, 2021 and 2020, an analysis by past due status of receivables from customers wherein the SICR is based only on the past due information is as follows:
2021 Number of days past due
Up to
30 days 31-60 days 61-90 days 91-180 days 180 days Total Receivables from customers
Consumption loans P=949,282 P=1,826,791 P=738,039 P=796,188 P=1,856,711 P=6,167,011 Real estate loans 1,647,103 1,308,402 403,483 377,520 1,359,594 5,096,102 Commercial loans 41,149 45,230 35,453 37,406 535,055 694,293 Personal loans 192,737 16,987 12,618 41,431 472,098 735,871
Total P=2,830,271 P=3,197,410 P=1,189,593 P=1,252,545 P=4,223,458 P=12,693,277
2020 Number of days past due
Up to
30 days 31-60 days 61-90 days 91-180 days 180 days Total Receivables from customers
Consumption loans P=924,127 P=2,091,203 P=631,221 P=1,157,703 P=3,074,401 P=7,878,655 Real estate loans 848,587 1,159,972 268,275 532,054 1,531,130 4,340,018 Commercial loans 865,217 125,668 90,676 61,573 332,496 1,475,630 Personal loans 255,260 24,277 16,164 97,700 344,168 737,569
Total P=2,893,191 P=3,401,120 P=1,006,336 P=1,849,030 P=5,282,195 P=14,431,872
b. Market risk
Market risk management covers the areas of trading and interest rate risks. The Bank utilizes various measurement and monitoring tools to ensure that risk-taking activities are managed within instituted market risk parameters. The Bank revalues its trading portfolios on a daily basis and checks the revenue or loss generated by each portfolio in relation to their level of market risk.
- 45 -
The Bank’s risk policies and implementing guidelines are regularly reviewed by the Assets and Liabilities Committee (ALCO), ROC and BOD to ensure that these are up-to-date and in line with changes in the economy, environment and regulations. The ROC and the BOD set the comprehensive market risk limit structure and define the parameters of market activities that the Bank can engage in.
Market risk is the risk to earnings and capital arising from changes in the value of traded portfolios of financial instruments (trading market risk) and from movements in interest rates (interest rate risk). The Bank’s market risk originates primarily from holding peso and dollar-denominated debt securities. The Bank utilizes Value-at-Risk (VaR) to measure and manage market risk exposure. VaR estimates the potential decline in the value of a portfolio, under normal market conditions, for a given confidence level over a specified holding period.
Trading activities The Bank’s trading portfolios are currently composed of peso and dollar-denominated fixed income securities that are marked-to-market daily. The Bank also uses to measure the extent of market risk exposure arising from these portfolios.
VaR is a statistical measure that calculates the maximum potential loss from a portfolio over a holding period, within a given confidence level. The Bank’s current VaR model uses historical simulation for Peso and USD HFT portfolios with confidence level at 99.00% and a 1 day holding period. It utilizes a 250 days rolling data most recently observed daily percentage changes in price for each asset class in its portfolio.
VaR reports are prepared on a daily basis and submitted to Treasury Group and RMO. VaR is also reported to the ROC and BOD on a monthly basis. The President, ROC and BOD are advised of potential losses that exceed prudent levels or limits.
When there is a breach in VaR limits, Treasury Group is expected to close or reduce their position and bring it down within the limit unless approval from the President is obtained to retain the same. All breaches are reported to the President for regularization. In addition to the regularization and approval of the President, breaches in VaR limits and special approvals are likewise reported to the ROC and BOD for their information and confirmation.
Back-testing is employed to verify the effectiveness of the VaR model. The Bank performs back-testing to validate the VaR model and stress testing to determine the impact of extreme market movements on the portfolios. Results of backtesting are reported to the ROC and BOD on a monthly basis. Stress testing is also conducted, based on historical maximum percentage daily movement and on an ad-hoc rate shock to estimate potential losses in a crisis situation.
The Bank has established limits, VaR, stop loss limits and loss triggers, for its trading portfolios. Daily profit or losses of the trading portfolios are closely monitored against loss triggers and stop-loss limits.
Responsibility for managing the Bank’s trading market risk remains with the ROC. With the support of RMO, the ROC recommends to the BOD changes in market risk limits, approving authorities and other activities that need special consideration.
Discussed below are the limitations and assumptions applied by the Bank on its VaR methodology:
a. VaR is a statistical estimate and thus, does not give the precise amount of loss; b. VaR is not designed to give the probability of bank failure, but only attempts to quantify losses that may
arise from a bank’s exposure to market risk; c. Historical simulation does not involve any distributional assumptions, scenarios that are used in computing
VaR are limited to those that occurred in the historical sample; and d. VaR systems are backward-looking. It attempts to forecast likely future losses using past data. As such, this
assumes that past relationships will continue to hold in the future. Major shifts therefore (i.e., an unexpected collapse of the market) are not captured and may inflict losses much bigger than anything the VaR model may have calculated.

- 46 -
The Bank’s interest rate VaR follows (in thousands):
December 31, 2021 December 31, 2020 Peso USD Peso USD Year-end 1 – 4 – Average 2,181 – 4,978 – High 8,307 – 27,431 – Low 1 – 1 –
Non-trading activities The Bank follows a prudent policy on managing its assets and liabilities to ensure that fluctuations in interest rates are kept within acceptable limits. One method by which the Bank measures the sensitivity of its assets and liabilities to interest rate fluctuations is by way of “gap” analysis. This analysis provides the Bank with a static view of the maturity and repricing characteristics of the positions in its statement of condition. An interest rate gap report is prepared by classifying all assets and liabilities into various time period categories according to contracted maturities or anticipated repricing dates, whichever is earlier. Non-maturing deposits are considered as rate sensitive liabilities; no loan pre-payments assumptions are used. The difference in the amount of assets and liabilities maturing or being repriced in any time period category would then give the Bank an indication of the extent to which it is exposed to the risk of potential changes in net interest income.
The interest rate sensitivity gap report measures interest rate risk by identifying gaps between the repricing dates of assets and liabilities. The Bank’s sensitivity gap model calculates the effect of possible rate movements on its interest rate profile.
The Bank uses sensitivity gap model to estimate Earnings-at-Risk (EaR) should interest rates move against its interest rate profile. The Bank’s EaR limits are based on a percentage of the Bank’s projected earnings for the year or capital whichever is lower. The Bank also performs stress-testing to measure the impact of various scenarios based on interest rate volatility and shift in the yield curve. The EaR and stress testing reports are prepared on a monthly basis.
The ALCO is responsible for managing the Bank’s structural interest rate exposure. The ALCO’s goal is to achieve a desired overall interest rate profile while remaining flexible to interest rate movements and changes in economic conditions. The RMO and ROC review and oversee the Bank’s interest rate risks.
The table below demonstrates the sensitivity of equity. Equity sensitivity was computed by calculating mark-to-market changes of debt securities at FVOCI, assuming a parallel shift in the yield curve.
2021 2020
Change in
basis points Sensitivity of equity Change in
basis points Sensitivity of equity Currency PHP +10 (P=12,904,128) +10 (P=6,872,062) USD +10 (789,005) +10 (908,854)
Currency PHP -10 10,445,196 -10 6,890,109 USD -10 792,207 -10 913,361

- 47 -
The table below demonstrates the sensitivity of net interest income using the EAR model. Net interest income sensitivity was computed by calculating the changes in the banking book gaps assuming a parallel shift in the yield curve.
2021 2020
Change in
basis points Sensitivity of NII Change in
basis points Sensitivity of NII Currency PHP +10 P=9,071,574 +10 (P=7,785,315) USD +10 (10,037,171) +10 (9,288,433)
Currency PHP -10 (9,071,574) -10 7,785,315 USD -10 10,037,171 -10 9,288,433
Foreign Currency Risk Foreign currency risk is the risk of an investment's value changing due to an adverse movement in currency exchange rates. It arises due to a mismatch in the Bank's foreign currency assets and liabilities.
The Bank’s policy is to maintain foreign currency exposure within the approved position, stop loss, loss trigger, VaR limits and to remain within existing regulatory guidelines. To compute for VaR, the Bank uses historical simulation model for USD/PHP FX position, with confidence level at 99.00% and a 1 day holding period. The Bank’s VaR for its foreign exchange position for trading and non-trading activities are as follows (in thousands):
20211 20201 As of year-end P=447 P=848 Average 544 900 High 1,073 1,627 Low 9 2 1Using METRISK Historical Simulation VaR
As of December 31, 2021 and 2020, the Bank is not exposed to significant foreign currency risk.
c. Liquidity risk
The Bank’s policy on liquidity management emphasizes on three elements of liquidity, namely, cashflow management, ability to borrow in the interbank market, and maintenance of a stock of high-quality liquid assets. These three approaches complement one another with greater weight being given to a particular approach, depending upon the circumstances. The Bank’s objective in liquidity management is to ensure that the Bank has sufficient liquidity to meet obligations under normal and adverse circumstances and is able to take advantage of lending and investment opportunities as they arise.
The main tool that the Bank uses for monitoring its liquidity is the Maximum Cumulative Outflow (MCO) reports, which is also called liquidity gap or maturity matching gap reports. The MCO is a useful tool in measuring and analyzing the Bank’s cash flow projections and monitoring liquidity risks. The liquidity gap report shows the projected cash flows of assets and liabilities representing estimated funding sources and requirements under normal conditions, which also forms the basis for the Bank’s Liquidity Contingency Funding Plan (LCFP). The LCFP projects the Bank’s funding position during stress to help evaluate the Bank’s funding needs and strategies under various stress conditions.
The Bank discourages dependence on Large Funds Providers (LFPs) and monitors the deposit funding concentrations so that it will not be vulnerable to a substantial drop in deposit level should there be an outflow of large deposits and there is enough high-quality liquid assets to fund LFP withdrawals. ALCO is responsible for managing the liquidity of the Bank while RMO and ROC review and oversee the Bank’s overall liquidity risk management.
To mitigate potential liquidity problems caused by unexpected withdrawals of significant deposits, the Bank takes steps to cultivate good business relationships with clients and financial institutions, maintains high level of high-quality liquid assets, monitors the deposit funding concentrations and regularly updates the Liquidity
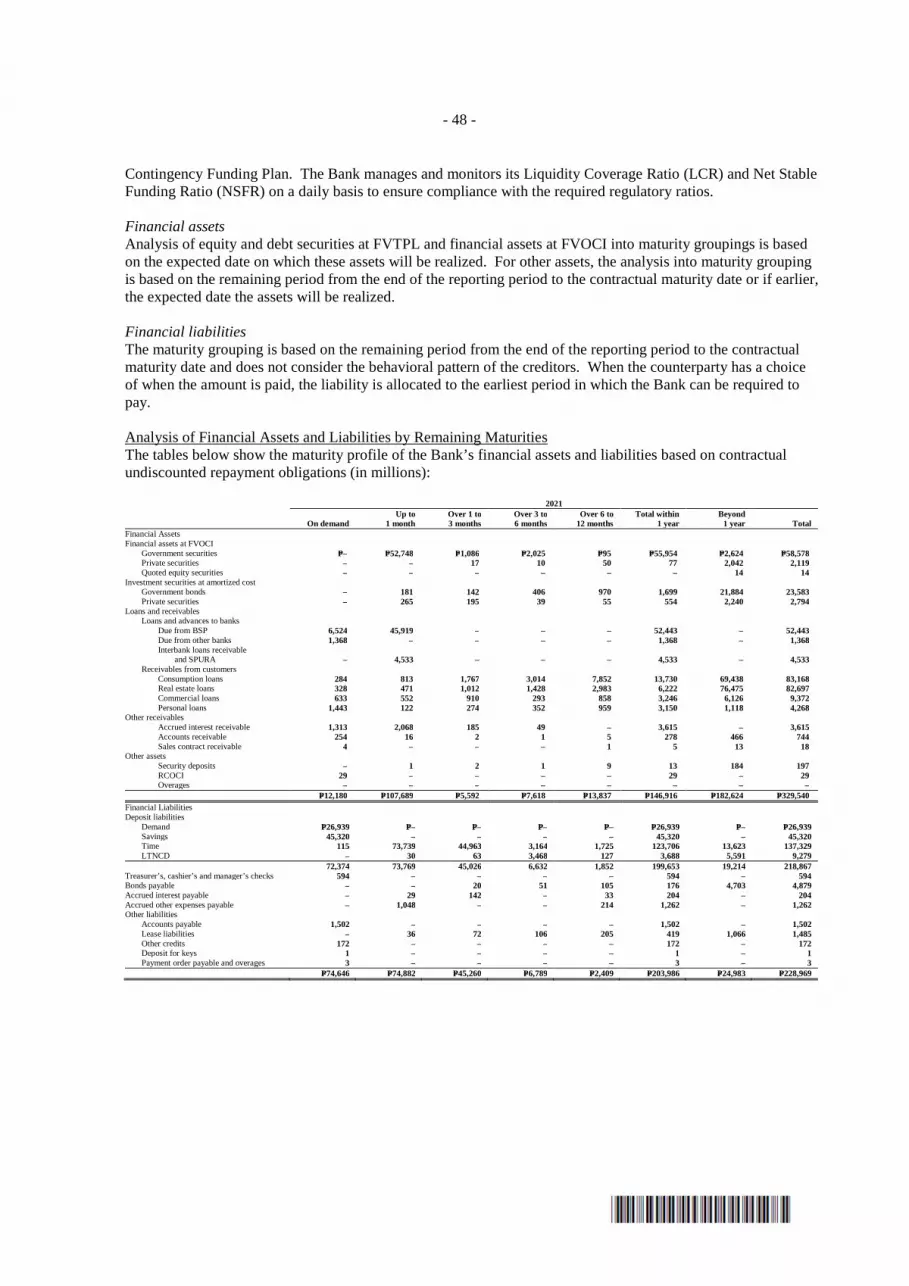
- 48 -
Contingency Funding Plan. The Bank manages and monitors its Liquidity Coverage Ratio (LCR) and Net Stable Funding Ratio (NSFR) on a daily basis to ensure compliance with the required regulatory ratios. Financial assets Analysis of equity and debt securities at FVTPL and financial assets at FVOCI into maturity groupings is based on the expected date on which these assets will be realized. For other assets, the analysis into maturity grouping is based on the remaining period from the end of the reporting period to the contractual maturity date or if earlier, the expected date the assets will be realized. Financial liabilities The maturity grouping is based on the remaining period from the end of the reporting period to the contractual maturity date and does not consider the behavioral pattern of the creditors. When the counterparty has a choice of when the amount is paid, the liability is allocated to the earliest period in which the Bank can be required to pay.
Analysis of Financial Assets and Liabilities by Remaining Maturities The tables below show the maturity profile of the Bank’s financial assets and liabilities based on contractual undiscounted repayment obligations (in millions): 2021
On demand Up to
1 month Over 1 to 3 months
Over 3 to 6 months
Over 6 to 12 months
Total within 1 year
Beyond 1 year Total
Financial Assets Financial assets at FVOCI Government securities P=– P=52,748 P=1,086 P=2,025 P=95 P=55,954 P=2,624 P=58,578 Private securities – – 17 10 50 77 2,042 2,119 Quoted equity securities – – – – – – 14 14 Investment securities at amortized cost Government bonds – 181 142 406 970 1,699 21,884 23,583 Private securities – 265 195 39 55 554 2,240 2,794 Loans and receivables Loans and advances to banks Due from BSP 6,524 45,919 – – – 52,443 – 52,443 Due from other banks 1,368 – – – – 1,368 – 1,368 Interbank loans receivable
and SPURA – 4,533 – – – 4,533 – 4,533 Receivables from customers Consumption loans 284 813 1,767 3,014 7,852 13,730 69,438 83,168 Real estate loans 328 471 1,012 1,428 2,983 6,222 76,475 82,697 Commercial loans 633 552 910 293 858 3,246 6,126 9,372 Personal loans 1,443 122 274 352 959 3,150 1,118 4,268 Other receivables Accrued interest receivable 1,313 2,068 185 49 – 3,615 – 3,615 Accounts receivable 254 16 2 1 5 278 466 744 Sales contract receivable 4 – – – 1 5 13 18 Other assets Security deposits – 1 2 1 9 13 184 197 RCOCI 29 – – – – 29 – 29 Overages – – – – – – – – P=12,180 P=107,689 P=5,592 P=7,618 P=13,837 P=146,916 P=182,624 P=329,540 Financial Liabilities Deposit liabilities Demand P=26,939 P=– P=– P=– P=– P=26,939 P=– P=26,939 Savings 45,320 – – – – 45,320 – 45,320 Time 115 73,739 44,963 3,164 1,725 123,706 13,623 137,329 LTNCD – 30 63 3,468 127 3,688 5,591 9,279 72,374 73,769 45,026 6,632 1,852 199,653 19,214 218,867 Treasurer’s, cashier’s and manager’s checks 594 – – – – 594 – 594 Bonds payable – – 20 51 105 176 4,703 4,879 Accrued interest payable – 29 142 – 33 204 – 204 Accrued other expenses payable – 1,048 – – 214 1,262 – 1,262 Other liabilities Accounts payable 1,502 – – – – 1,502 – 1,502 Lease liabilit ies – 36 72 106 205 419 1,066 1,485 Other credits 172 – – – – 172 – 172 Deposit for keys 1 – – – – 1 – 1 Payment order payable and overages 3 – – – – 3 – 3 P=74,646 P=74,882 P=45,260 P=6,789 P=2,409 P=203,986 P=24,983 P=228,969
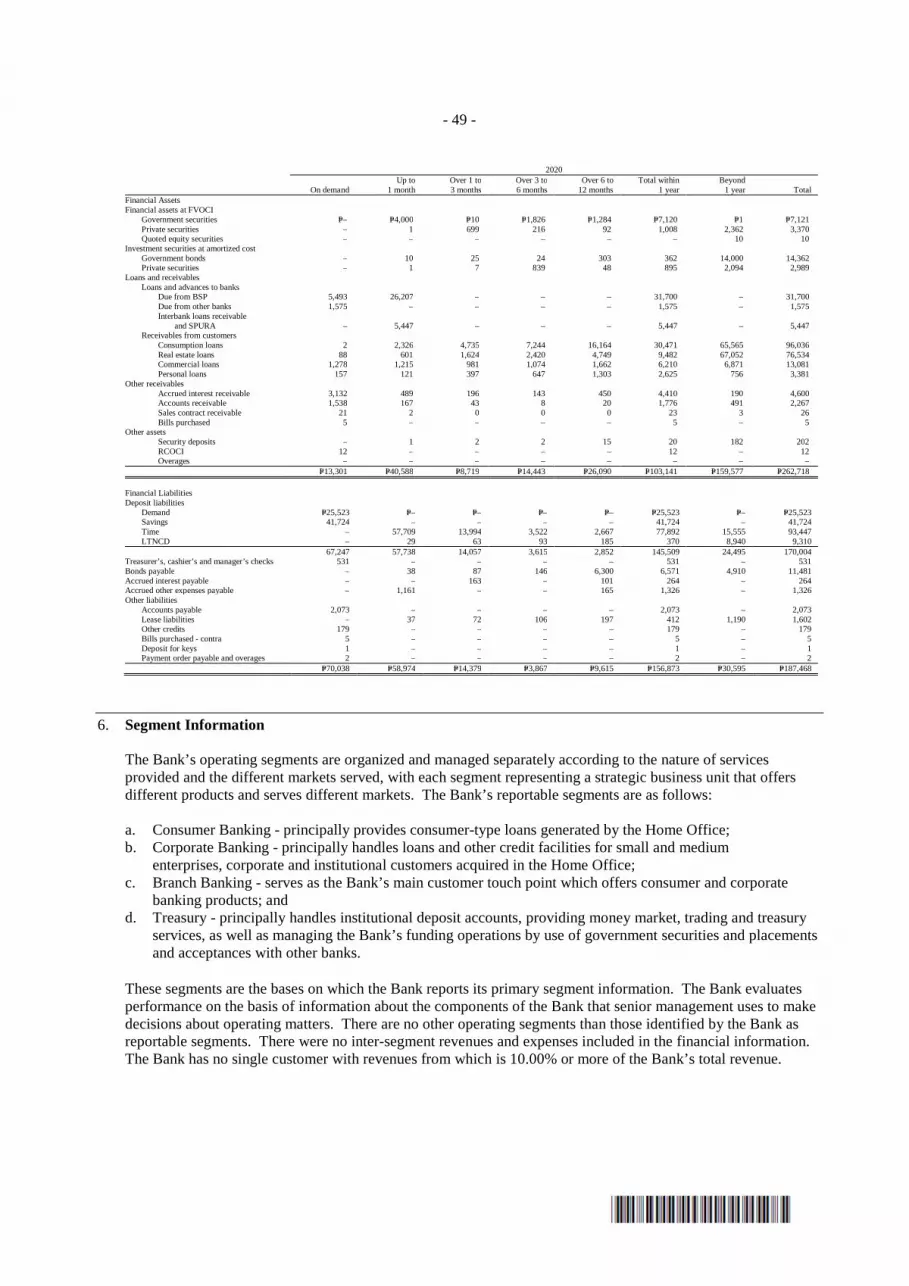
- 49 -
2020
On demand Up to
1 month Over 1 to 3 months
Over 3 to 6 months
Over 6 to 12 months
Total within 1 year
Beyond 1 year Total
Financial Assets Financial assets at FVOCI Government securities P=– P=4,000 P=10 P=1,826 P=1,284 P=7,120 P=1 P=7,121 Private securities – 1 699 216 92 1,008 2,362 3,370 Quoted equity securities – – – – – – 10 10 Investment securities at amortized cost Government bonds – 10 25 24 303 362 14,000 14,362 Private securities – 1 7 839 48 895 2,094 2,989 Loans and receivables Loans and advances to banks Due from BSP 5,493 26,207 – – – 31,700 – 31,700 Due from other banks 1,575 – – – – 1,575 – 1,575 Interbank loans receivable
and SPURA – 5,447 – – – 5,447 – 5,447 Receivables from customers Consumption loans 2 2,326 4,735 7,244 16,164 30,471 65,565 96,036 Real estate loans 88 601 1,624 2,420 4,749 9,482 67,052 76,534 Commercial loans 1,278 1,215 981 1,074 1,662 6,210 6,871 13,081 Personal loans 157 121 397 647 1,303 2,625 756 3,381 Other receivables Accrued interest receivable 3,132 489 196 143 450 4,410 190 4,600 Accounts receivable 1,538 167 43 8 20 1,776 491 2,267 Sales contract receivable 21 2 0 0 0 23 3 26 Bills purchased 5 – – – – 5 – 5 Other assets Security deposits – 1 2 2 15 20 182 202 RCOCI 12 – – – – 12 – 12 Overages – – – – – – – – P=13,301 P=40,588 P=8,719 P=14,443 P=26,090 P=103,141 P=159,577 P=262,718
Financial Liabilities Deposit liabilities Demand P=25,523 P=– P=– P=– P=– P=25,523 P=– P=25,523 Savings 41,724 – – – – 41,724 – 41,724 Time – 57,709 13,994 3,522 2,667 77,892 15,555 93,447 LTNCD – 29 63 93 185 370 8,940 9,310 67,247 57,738 14,057 3,615 2,852 145,509 24,495 170,004 Treasurer’s, cashier’s and manager’s checks 531 – – – – 531 – 531 Bonds payable – 38 87 146 6,300 6,571 4,910 11,481 Accrued interest payable – – 163 – 101 264 – 264 Accrued other expenses payable – 1,161 – – 165 1,326 – 1,326 Other liabilities Accounts payable 2,073 – – – – 2,073 – 2,073 Lease liabilities – 37 72 106 197 412 1,190 1,602 Other credits 179 – – – – 179 – 179 Bills purchased - contra 5 – – – – 5 – 5 Deposit for keys 1 – – – – 1 – 1 Payment order payable and overages 2 – – – – 2 – 2 P=70,038 P=58,974 P=14,379 P=3,867 P=9,615 P=156,873 P=30,595 P=187,468
6. Segment Information
The Bank’s operating segments are organized and managed separately according to the nature of services provided and the different markets served, with each segment representing a strategic business unit that offers different products and serves different markets. The Bank’s reportable segments are as follows: a. Consumer Banking - principally provides consumer-type loans generated by the Home Office; b. Corporate Banking - principally handles loans and other credit facilities for small and medium
enterprises, corporate and institutional customers acquired in the Home Office; c. Branch Banking - serves as the Bank’s main customer touch point which offers consumer and corporate
banking products; and d. Treasury - principally handles institutional deposit accounts, providing money market, trading and treasury
services, as well as managing the Bank’s funding operations by use of government securities and placements and acceptances with other banks.
These segments are the bases on which the Bank reports its primary segment information. The Bank evaluates performance on the basis of information about the components of the Bank that senior management uses to make decisions about operating matters. There are no other operating segments than those identified by the Bank as reportable segments. There were no inter-segment revenues and expenses included in the financial information. The Bank has no single customer with revenues from which is 10.00% or more of the Bank’s total revenue.
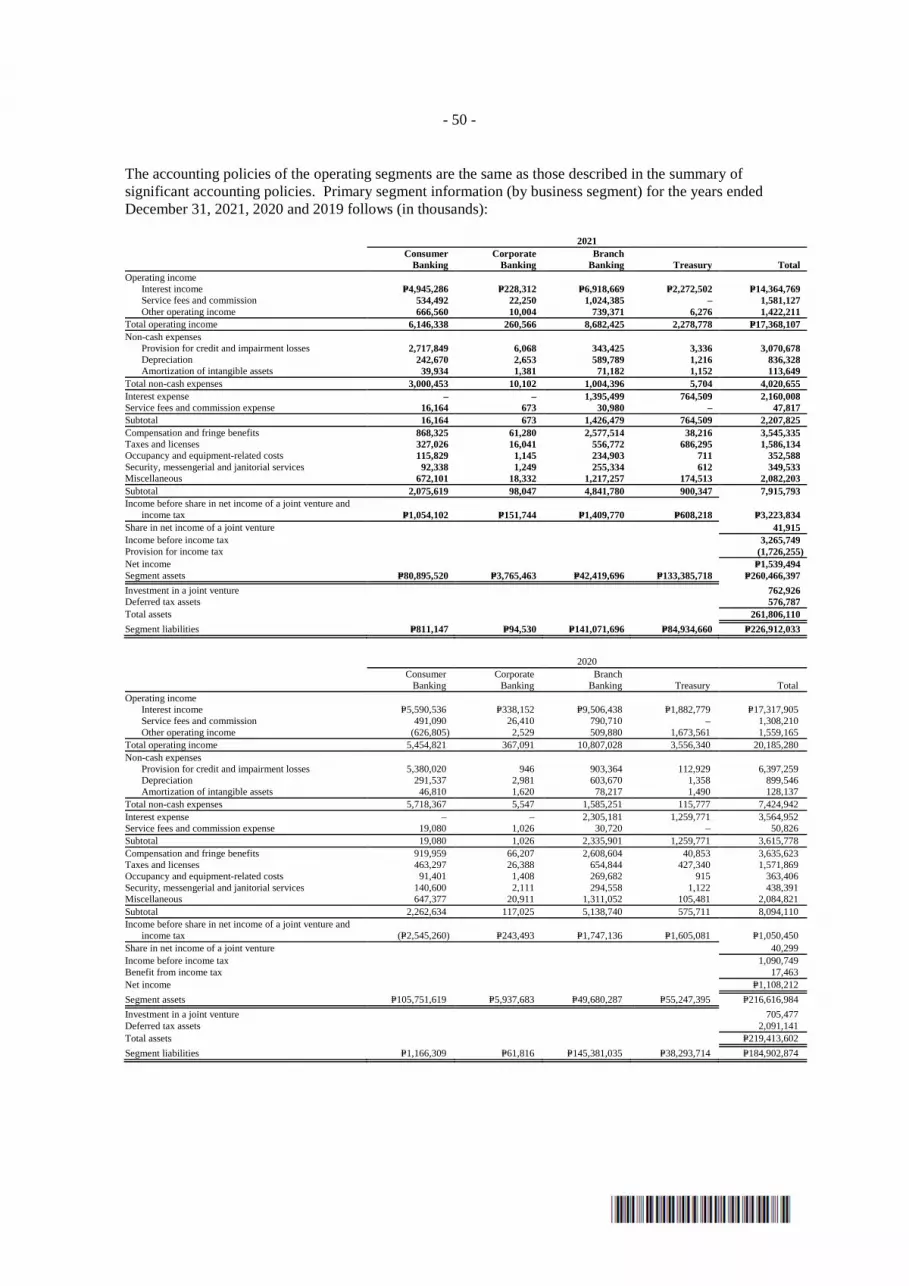
- 50 -
The accounting policies of the operating segments are the same as those described in the summary of significant accounting policies. Primary segment information (by business segment) for the years ended December 31, 2021, 2020 and 2019 follows (in thousands): 2021
Consumer
Banking Corporate
Banking Branch
Banking Treasury Total Operating income Interest income P=4,945,286 P=228,312 P=6,918,669 P=2,272,502 P=14,364,769 Service fees and commission 534,492 22,250 1,024,385 – 1,581,127 Other operating income 666,560 10,004 739,371 6,276 1,422,211 Total operating income 6,146,338 260,566 8,682,425 2,278,778 P=17,368,107 Non-cash expenses Provision for credit and impairment losses 2,717,849 6,068 343,425 3,336 3,070,678 Depreciation 242,670 2,653 589,789 1,216 836,328 Amortization of intangible assets 39,934 1,381 71,182 1,152 113,649 Total non-cash expenses 3,000,453 10,102 1,004,396 5,704 4,020,655 Interest expense – – 1,395,499 764,509 2,160,008 Service fees and commission expense 16,164 673 30,980 – 47,817 Subtotal 16,164 673 1,426,479 764,509 2,207,825 Compensation and fringe benefits 868,325 61,280 2,577,514 38,216 3,545,335 Taxes and licenses 327,026 16,041 556,772 686,295 1,586,134 Occupancy and equipment-related costs 115,829 1,145 234,903 711 352,588 Security, messengerial and janitorial services 92,338 1,249 255,334 612 349,533 Miscellaneous 672,101 18,332 1,217,257 174,513 2,082,203 Subtotal 2,075,619 98,047 4,841,780 900,347 7,915,793 Income before share in net income of a joint venture and
income tax P=1,054,102 P=151,744 P=1,409,770 P=608,218 P=3,223,834 Share in net income of a joint venture 41,915 Income before income tax 3,265,749 Provision for income tax (1,726,255) Net income P=1,539,494 Segment assets P=80,895,520 P=3,765,463 P=42,419,696 P=133,385,718 P=260,466,397
Investment in a joint venture 762,926 Deferred tax assets 576,787 Total assets 261,806,110
Segment liabilities P=811,147 P=94,530 P=141,071,696 P=84,934,660 P=226,912,033
2020
Consumer
Banking Corporate
Banking Branch
Banking Treasury Total Operating income Interest income P=5,590,536 P=338,152 P=9,506,438 P=1,882,779 P=17,317,905 Service fees and commission 491,090 26,410 790,710 – 1,308,210 Other operating income (626,805) 2,529 509,880 1,673,561 1,559,165 Total operating income 5,454,821 367,091 10,807,028 3,556,340 20,185,280 Non-cash expenses Provision for credit and impairment losses 5,380,020 946 903,364 112,929 6,397,259 Depreciation 291,537 2,981 603,670 1,358 899,546 Amortization of intangible assets 46,810 1,620 78,217 1,490 128,137 Total non-cash expenses 5,718,367 5,547 1,585,251 115,777 7,424,942 Interest expense – – 2,305,181 1,259,771 3,564,952 Service fees and commission expense 19,080 1,026 30,720 – 50,826 Subtotal 19,080 1,026 2,335,901 1,259,771 3,615,778 Compensation and fringe benefits 919,959 66,207 2,608,604 40,853 3,635,623 Taxes and licenses 463,297 26,388 654,844 427,340 1,571,869 Occupancy and equipment-related costs 91,401 1,408 269,682 915 363,406 Security, messengerial and janitorial services 140,600 2,111 294,558 1,122 438,391 Miscellaneous 647,377 20,911 1,311,052 105,481 2,084,821 Subtotal 2,262,634 117,025 5,138,740 575,711 8,094,110 Income before share in net income of a joint venture and
income tax (P=2,545,260) P=243,493 P=1,747,136 P=1,605,081 P=1,050,450 Share in net income of a joint venture 40,299 Income before income tax 1,090,749 Benefit from income tax 17,463 Net income P=1,108,212
Segment assets P=105,751,619 P=5,937,683 P=49,680,287 P=55,247,395 P=216,616,984
Investment in a joint venture 705,477 Deferred tax assets 2,091,141 Total assets P=219,413,602
Segment liabilities P=1,166,309 P=61,816 P=145,381,035 P=38,293,714 P=184,902,874
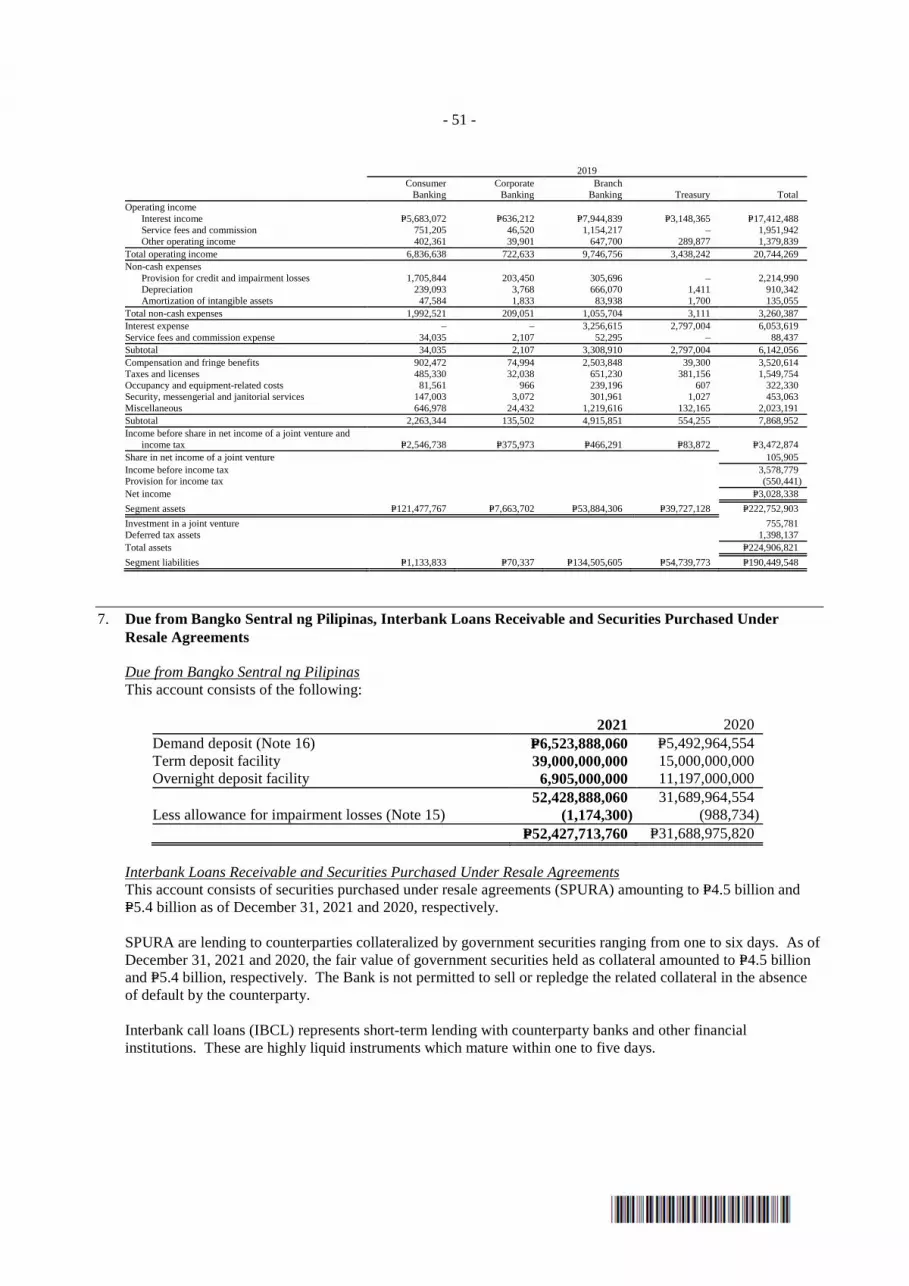
- 51 -
2019
Consumer
Banking Corporate
Banking Branch
Banking Treasury Total Operating income Interest income P=5,683,072 P=636,212 P=7,944,839 P=3,148,365 P=17,412,488 Service fees and commission 751,205 46,520 1,154,217 – 1,951,942 Other operating income 402,361 39,901 647,700 289,877 1,379,839 Total operating income 6,836,638 722,633 9,746,756 3,438,242 20,744,269 Non-cash expenses Provision for credit and impairment losses 1,705,844 203,450 305,696 – 2,214,990 Depreciation 239,093 3,768 666,070 1,411 910,342 Amortization of intangible assets 47,584 1,833 83,938 1,700 135,055 Total non-cash expenses 1,992,521 209,051 1,055,704 3,111 3,260,387 Interest expense – – 3,256,615 2,797,004 6,053,619 Service fees and commission expense 34,035 2,107 52,295 – 88,437 Subtotal 34,035 2,107 3,308,910 2,797,004 6,142,056 Compensation and fringe benefits 902,472 74,994 2,503,848 39,300 3,520,614 Taxes and licenses 485,330 32,038 651,230 381,156 1,549,754 Occupancy and equipment-related costs 81,561 966 239,196 607 322,330 Security, messengerial and janitorial services 147,003 3,072 301,961 1,027 453,063 Miscellaneous 646,978 24,432 1,219,616 132,165 2,023,191 Subtotal 2,263,344 135,502 4,915,851 554,255 7,868,952 Income before share in net income of a joint venture and
income tax P=2,546,738 P=375,973 P=466,291 P=83,872 P=3,472,874 Share in net income of a joint venture 105,905 Income before income tax 3,578,779 Provision for income tax (550,441) Net income P=3,028,338
Segment assets P=121,477,767 P=7,663,702 P=53,884,306 P=39,727,128 P=222,752,903
Investment in a joint venture 755,781 Deferred tax assets 1,398,137 Total assets P=224,906,821
Segment liabilities P=1,133,833 P=70,337 P=134,505,605 P=54,739,773 P=190,449,548
7. Due from Bangko Sentral ng Pilipinas, Interbank Loans Receivable and Securities Purchased Under
Resale Agreements
Due from Bangko Sentral ng Pilipinas This account consists of the following:
2021 2020 Demand deposit (Note 16) P=6,523,888,060 P=5,492,964,554 Term deposit facility 39,000,000,000 15,000,000,000 Overnight deposit facility 6,905,000,000 11,197,000,000 52,428,888,060 31,689,964,554 Less allowance for impairment losses (Note 15) (1,174,300) (988,734)
P=52,427,713,760 P=31,688,975,820
Interbank Loans Receivable and Securities Purchased Under Resale Agreements This account consists of securities purchased under resale agreements (SPURA) amounting to P=4.5 billion and P=5.4 billion as of December 31, 2021 and 2020, respectively.
SPURA are lending to counterparties collateralized by government securities ranging from one to six days. As of December 31, 2021 and 2020, the fair value of government securities held as collateral amounted to P=4.5 billion and P=5.4 billion, respectively. The Bank is not permitted to sell or repledge the related collateral in the absence of default by the counterparty.
Interbank call loans (IBCL) represents short-term lending with counterparty banks and other financial institutions. These are highly liquid instruments which mature within one to five days.
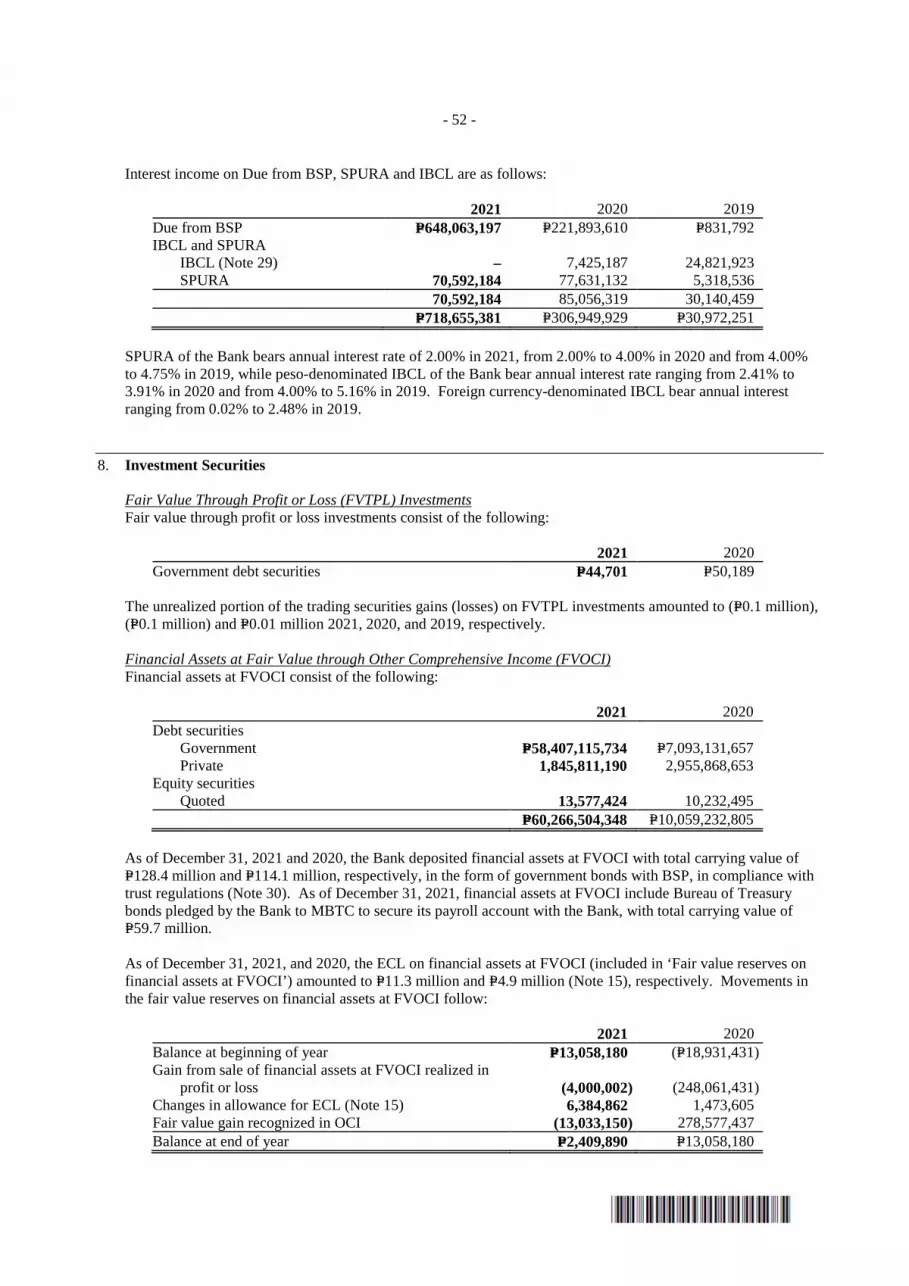
- 52 -
Interest income on Due from BSP, SPURA and IBCL are as follows:
2021 2020 2019 Due from BSP P=648,063,197 P=221,893,610 P=831,792 IBCL and SPURA IBCL (Note 29) – 7,425,187 24,821,923 SPURA 70,592,184 77,631,132 5,318,536 70,592,184 85,056,319 30,140,459 P=718,655,381 P=306,949,929 P=30,972,251
SPURA of the Bank bears annual interest rate of 2.00% in 2021, from 2.00% to 4.00% in 2020 and from 4.00% to 4.75% in 2019, while peso-denominated IBCL of the Bank bear annual interest rate ranging from 2.41% to 3.91% in 2020 and from 4.00% to 5.16% in 2019. Foreign currency-denominated IBCL bear annual interest ranging from 0.02% to 2.48% in 2019.
8. Investment Securities
Fair Value Through Profit or Loss (FVTPL) Investments Fair value through profit or loss investments consist of the following:
2021 2020 Government debt securities P=44,701 P=50,189
The unrealized portion of the trading securities gains (losses) on FVTPL investments amounted to (P=0.1 million), (P=0.1 million) and P=0.01 million 2021, 2020, and 2019, respectively.
Financial Assets at Fair Value through Other Comprehensive Income (FVOCI) Financial assets at FVOCI consist of the following:
2021 2020 Debt securities Government P=58,407,115,734 P=7,093,131,657 Private 1,845,811,190 2,955,868,653 Equity securities Quoted 13,577,424 10,232,495 P=60,266,504,348 P=10,059,232,805
As of December 31, 2021 and 2020, the Bank deposited financial assets at FVOCI with total carrying value of P=128.4 million and P=114.1 million, respectively, in the form of government bonds with BSP, in compliance with trust regulations (Note 30). As of December 31, 2021, financial assets at FVOCI include Bureau of Treasury bonds pledged by the Bank to MBTC to secure its payroll account with the Bank, with total carrying value of P=59.7 million. As of December 31, 2021, and 2020, the ECL on financial assets at FVOCI (included in ‘Fair value reserves on financial assets at FVOCI’) amounted to P=11.3 million and P=4.9 million (Note 15), respectively. Movements in the fair value reserves on financial assets at FVOCI follow:
2021 2020 Balance at beginning of year P=13,058,180 (P=18,931,431) Gain from sale of financial assets at FVOCI realized in
profit or loss (4,000,002) (248,061,431) Changes in allowance for ECL (Note 15) 6,384,862 1,473,605) Fair value gain recognized in OCI (13,033,150) 278,577,437) Balance at end of year P=2,409,890 P=13,058,180)
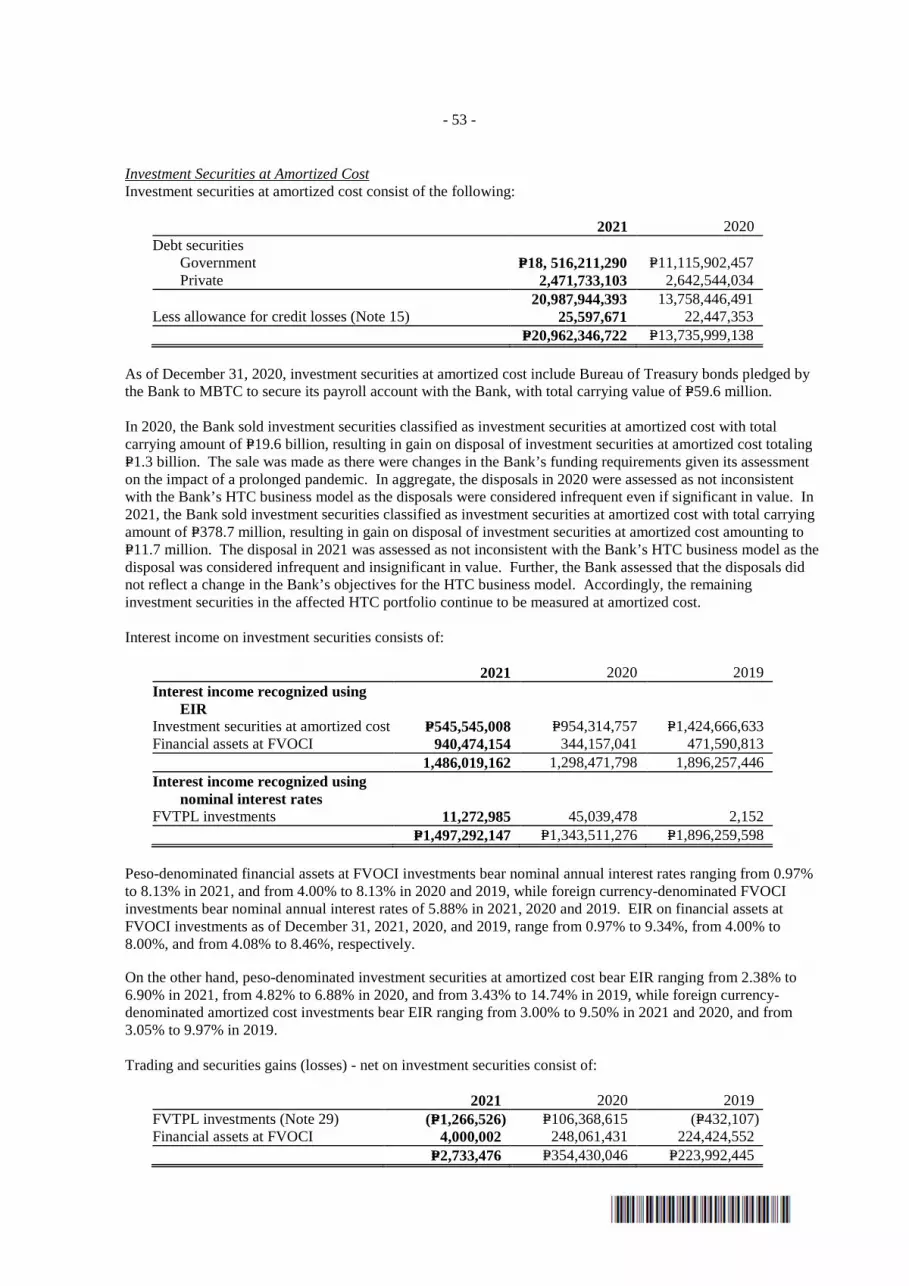
- 53 -
Investment Securities at Amortized Cost Investment securities at amortized cost consist of the following:
2021 2020 Debt securities Government P=18, 516,211,290 P=11,115,902,457 Private 2,471,733,103 2,642,544,034 20,987,944,393 13,758,446,491 Less allowance for credit losses (Note 15) 25,597,671 22,447,353 P=20,962,346,722 P=13,735,999,138
As of December 31, 2020, investment securities at amortized cost include Bureau of Treasury bonds pledged by the Bank to MBTC to secure its payroll account with the Bank, with total carrying value of P=59.6 million. In 2020, the Bank sold investment securities classified as investment securities at amortized cost with total carrying amount of P=19.6 billion, resulting in gain on disposal of investment securities at amortized cost totaling P=1.3 billion. The sale was made as there were changes in the Bank’s funding requirements given its assessment on the impact of a prolonged pandemic. In aggregate, the disposals in 2020 were assessed as not inconsistent with the Bank’s HTC business model as the disposals were considered infrequent even if significant in value. In 2021, the Bank sold investment securities classified as investment securities at amortized cost with total carrying amount of P=378.7 million, resulting in gain on disposal of investment securities at amortized cost amounting to P=11.7 million. The disposal in 2021 was assessed as not inconsistent with the Bank’s HTC business model as the disposal was considered infrequent and insignificant in value. Further, the Bank assessed that the disposals did not reflect a change in the Bank’s objectives for the HTC business model. Accordingly, the remaining investment securities in the affected HTC portfolio continue to be measured at amortized cost. Interest income on investment securities consists of:
2021 2020 2019 Interest income recognized using
EIR Investment securities at amortized cost P=545,545,008 P=954,314,757 P=1,424,666,633 Financial assets at FVOCI 940,474,154 344,157,041 471,590,813 1,486,019,162 1,298,471,798 1,896,257,446 Interest income recognized using
nominal interest rates FVTPL investments 11,272,985 45,039,478 2,152 P=1,497,292,147 P=1,343,511,276 P=1,896,259,598
Peso-denominated financial assets at FVOCI investments bear nominal annual interest rates ranging from 0.97% to 8.13% in 2021, and from 4.00% to 8.13% in 2020 and 2019, while foreign currency-denominated FVOCI investments bear nominal annual interest rates of 5.88% in 2021, 2020 and 2019. EIR on financial assets at FVOCI investments as of December 31, 2021, 2020, and 2019, range from 0.97% to 9.34%, from 4.00% to 8.00%, and from 4.08% to 8.46%, respectively. On the other hand, peso-denominated investment securities at amortized cost bear EIR ranging from 2.38% to 6.90% in 2021, from 4.82% to 6.88% in 2020, and from 3.43% to 14.74% in 2019, while foreign currency-denominated amortized cost investments bear EIR ranging from 3.00% to 9.50% in 2021 and 2020, and from 3.05% to 9.97% in 2019. Trading and securities gains (losses) - net on investment securities consist of:
2021 2020 2019 FVTPL investments (Note 29) (P=1,266,526) P=106,368,615 (P=432,107) Financial assets at FVOCI 4,000,002 248,061,431 224,424,552 P=2,733,476 P=354,430,046 P=223,992,445

- 54 -
9. Loans and Receivables
This account consists of:
2021 2020 Receivables from customers Consumption loans P=57,972,900,131 P=78,774,777,476 Real estate loans 45,408,001,767 50,568,710,722 Commercial loans 7,385,089,257 11,055,130,498 Personal loans (Note 29) 2,761,353,150 3,175,571,735 113,527,344,305 143,574,190,431 Less unearned discounts and capitalized interest (292,603,641) (427,738,496) 113,234,740,664 143,146,451,935 Other receivables Accrued interest receivable 3,615,211,724 4,599,937,201 Accounts receivable (Note 29) 744,079,396 2,267,294,584 Sales contract receivables 17,598,587 25,809,417 Bills purchased (Note 19) − 4,595,741 117,611,630,371 150,044,088,878 Less allowance for credit losses (Note 15) 7,500,124,545 7,519,744,354
P=110,111,505,826 P=142,524,344,524 Personal loans comprise deposit collateral loans, employee salary and consumer loan products such as money card, multi-purpose loan and flexi-loan.
As of December 31, 2021, 2020 and 2019, 42.38%, 42.92%, and 33.74%, respectively, of the total receivables from customers are subject to periodic interest repricing with average EIR of 7.74%, 7.68%, and 7.66% in 2021, 2020 and 2019. Remaining receivables earn average annual fixed interest rates of 15.91%, 16.69%, and 15.78%, in 2021, 2020 and 2019, respectively. Interest income on loans and receivables consists of:
2021 2020 2019 Receivables from customers Consumption loans P=6,268,592,270 P=9,276,969,797 P=9,144,507,633 Real estate loans 3,882,390,733 4,122,505,005 3,974,463,324 Personal loans (Note 29) 1,329,347,250 1,356,660,047 1,422,610,233 Commercial loans 665,758,611 905,767,767 932,004,186 Other receivables Sales contract receivables 2,685,306 4,363,171 7,604,057 P=12,148,774,170 P=15,666,265,787 P=15,481,189,433
Interest income from restructured loans amounted to P=5.0 million, P=7.1 million, and P=8.3 million in 2021, 2020, and 2019, respectively. On March 25, 2020, Republic Act (RA) No. 11469, otherwise known as the Bayanihan to Heal as One Act (“Bayanihan 1 Act”) was enacted. Bayanihan 1 Act provides that all covered institutions shall implement a 30-day grace period for all loans with principal and/or interest and lease amortization falling due within the ECQ Period without incurring interest on interest, penalties, fees and other charges. Subsequently, on September 11, 2020, RA No. 11494, otherwise known as the Bayanihan to Recover as One Act (“Bayanihan 2 Act”), was enacted. Under Bayanihan 2 Act, a one-time sixty (60)-day grace period is granted for the payment of all existing, current and outstanding loans falling due, or any part thereof, on or before December 31, 2020, without incurring interest on interests, penalties, fees, or other charges and thereby extending the maturity of the said loans. Furthermore, a minimum 30-day grace period shall also be granted by covered institutions to all payments due within the period of community quarantine on rent and utility-related expenditures without incurring penalties, interest, and other charges.
- 55 -
In 2020, total modification loss recognized in the statement of income under ‘Miscellaneous income’ amounted to P=508.8 million (Note 23). Subsequent accretion of modified loans amounting to P=134.6 million and P=82.2 million in 2021 and 2020, respectively (Note 23).
10. Investment in a Joint Venture
The Bank’s investment in a joint venture represents its 30.00% interest in Sumisho Motor Finance Corporation (SMFC) as of December 31, 2021 and 2020. SMFC was incorporated in the Philippines and registered with the Philippine Securities and Exchange Commission (SEC) on November 26, 2009 and started commercial operations in March 2010. Its principal office is located at 12th Floor, PSBank Center, 777 Paseo de Roxas corner Sedeño Street, Makati City. SMFC is engaged in the business of lending or leasing to retail customers for their purchase of motorcycles.
Management has assessed that the Bank continues to have joint control over SMFC together with GT Capital, Sumitomo Japan, and Sumitomo Corporation of the Philippines (Sumitomo Group), as all investors are bound by all terms and conditions of the original Joint Venture Agreement between the Bank and Sumitomo Group, where unanimous consent is required from all the parties for SMFC’s relevant activities.
The investment is measured using the equity method. As of December 31, 2021, and 2020, the Bank’s investment in a joint venture amounted to P=762.9 million, and P=705.5 million, respectively. Movement in this account follows (in thousands):
2021 2020 Balance at beginning of year P=705,477 P=755,781 Share in net income (Note 29) 41,914 40,299 Share in remeasurement gains (losses) on retirement plan
(Note 29) 4,162 (2,227) Share in hedge reserves (Note 29) 22,953 (35,097) Dividends received (11,580) (53,280) Ending balance P=762,926 P=705,477
The following table illustrates the summarized financial information of SMFC (in thousands):
2021 2020 Current assets P=6,049,856 P=7,277,686 Non-current assets 473,784 370,236 Current liabilities (3,920,528) (5,146,438) Non-current liabilities (60,025) (149,896) Net assets P=2,543,087 P=2,351,588
2021 2020 2019 Revenues P=1,962,096 P=1,955,338 P=1,684,260 Costs and expenses 1,588,374 1,732,393 1,174,697 373,722 222,945 509,563 Provision for income tax 234,006 88,614 156,545 Net income 139,716 134,331 353,018 Other comprehensive income 90,384 (124,414) (7,299) Total comprehensive income P=230,100 P=9,917 P=345,719
Cost of the investment as of December 31, 2021 and 2020 amounted to P=600.0 million.
- 56 -
On June 25, 2021, SMFC declared dividends of P=1.93 per share amounting to a total of P=38.6 million. The same was paid to shareholders on July 15, 2021. On June 26, 2020, SMFC declared dividends of P=8.88 per share amounting to a total of P=177.6 million. The same was paid to shareholders on July 17, 2020. SMFC is a private company and there is no quoted market price available for its shares. The net assets of SMFC consist mainly of financial assets and financial liabilities.
The Bank has no share in any contingent liabilities or capital commitments of SMFC as of December 31, 2021 and 2020. There are also no agreements entered into by SMFC that may restrict dividends and other capital contributions to be paid, loans and advances to be made or repaid to or from the Bank as of the said dates.
11. Property and Equipment
The composition of and movements in this account follow: 2021
Land Building
Furniture, Fixtures and
Equipment Leasehold
Improvements Right-of-use
Assets: Building Total Cost Balance at beginning of the
period P=976,443,676 P=1,140,698,130 P=2,900,936,102 P=1,059,719,128 P=1,711,018,243 P=7,788,815,279 Acquisitions/Additions – 13,035,832 93,579,310 11,442,774 330,419,191 448,477,107 Disposals/Retirement – – (43,599,563) – (235,452,622) (279,052,185) Balance at end of the period 976,443,676 1,153,733,962 2,950,915,849 1,071,161,902 1,805,984,812 7,958,240,201 Accumulated Depreciation Balance at beginning of the period – 526,450,270 2,604,818,362 965,787,480 601,944,585 4,699,000,697 Depreciation – 36,081,016 98,213,002 47,543,950 391,553,983 573,391,951 Disposals – – (17,155,674) – (235,452,622) (252,608,296) Balance at end of the period – 562,531,286 2,685,875,690 1,013,331,430 758,045,946 5,019,784,352 Net Book Value P=976,443,676 P=591,202,676 P=265,040,159 P=57,830,472 P=1,047,938,866 P=2,938,455,849
2020
Land Building
Furniture, Fixtures and
Equipment Leasehold
Improvements Right-of-use
Assets: Building Total Cost Balance at beginning of the
period P=976,443,676 P=1,130,831,484 P=2,836,318,148 P=1,029,895,946 P=1,596,365,909 P=7,569,855,163 Acquisitions/Additions – 9,866,646 119,531,739 29,823,182 243,849,256 403,070,823 Disposals/Retirement – – (54,913,785) – (129,196,922) (184,110,707) Balance at end of the period 976,443,676 1,140,698,130 2,900,936,102 1,059,719,128 1,711,018,243 7,788,815,279 Accumulated Depreciation Balance at beginning of the period – 490,393,692 2,519,274,130 899,092,622 348,258,593 4,257,019,037 Depreciation – 36,056,578 112,102,437 66,694,859 370,563,533 585,417,407 Disposals – – (26,558,205) – (116,877,541) (143,435,746) Balance at end of the period – 526,450,270 2,604,818,362 965,787,480 601,944,585 4,699,000,697 Net Book Value P=976,443,676 P=614,247,860 P=296,117,740 P=93,931,648 P=1,109,073,658 P=3,089,814,582
Gain on sale of property and equipment amounted to P=2.0 million in 2021 and 2020, and P=8.1 million in 2019.
The details of depreciation under the statements of income follow:
2021 2020 2019 Property and equipment P=573,391,951 P=585,417,407 P=650,450,033 Chattel mortgage properties (Note 14) 180,862,587 229,409,304 166,109,603 Investment properties (Note 12) 82,073,041 84,719,089 93,782,188 P=836,327,579 P=899,545,800 P=910,341,824
- 57 -
As of December 31, 2021 and 2020, property and equipment of the Bank with gross carrying amounts of P=2.3 billion and P=2.2 billion, respectively, are fully depreciated but are still being used.
12. Investment Properties
The composition of and movements in this account follow:
2021
Land Building
Improvements Total Cost Balance at beginning of year P=1,407,346,392 P=2,786,847,106 P=4,194,193,498 Additions (Note 32) 199,981,983 503,248,679 703,230,662 Disposals (286,878,842) (495,153,288) (782,032,130) Balance at end of year 1,320,449,533 2,794,942,497 4,115,392,030 Accumulated Depreciation Balance at beginning of year – 456,211,206 456,211,206 Depreciation (Note 11) – 82,073,041 82,073,041 Disposals – (86,346,709) (86,346,709) Balance at end of year – 451,937,538 451,937,538 Allowance for Impairment Losses Balance at beginning of year 62,338,981 89,671,355 152,010,336 Provisions for the year (Note 15) 8,047,128 18,803,525 26,850,653 Disposals (3,799,187) (20,205,416) (24,004,603) Balance at end of year 66,586,922 88,269,464 154,856,386 Net Book Value P=1,253,862,611 P=2,254,735,495 P=3,508,598,106
2020
Land Building
Improvements Total Cost Balance at beginning of year P=1,478,459,480 P=2,900,297,172 P=4,378,756,652 Additions (Note 32) 152,994,179 304,719,097 457,713,276 Disposals (224,107,267) (418,169,163) (642,276,430) Balance at end of year 1,407,346,392 2,786,847,106 4,194,193,498 Accumulated Depreciation Balance at beginning of year – 433,180,137 433,180,137 Depreciation (Note 11) – 84,719,089 84,719,089 Disposals – (61,688,020) (61,688,020) Balance at end of year – 456,211,206 456,211,206 Allowance for Impairment Losses Balance at beginning of year 66,674,125 113,153,694 179,827,819 Reversals for the year (Note 15) (568,693) (1,064,506) (1,633,199) Disposals (3,766,451) (22,417,833) (26,184,284) Balance at end of year 62,338,981 89,671,355 152,010,336 Net Book Value P=1,345,007,411 P=2,240,964,545 P=3,585,971,956
The details of the net book value of investment properties follow:
2021 2020 Real estate properties acquired in settlement of
loans and receivables P=3,425,944,999 P=3,499,490,423 Bank premises leased to third parties and held for capital
appreciation 82,653,107 86,481,533 P=3,508,598,106 P=3,585,971,956
As of December 31, 2021 and 2020, the aggregate fair value of investment properties amounted to P=5.7 billion and P=5.6 billion, respectively. Fair value of the properties was determined using sales comparison approach. Fair values are based on valuations performed by accredited external and in-house appraisers. Gain on foreclosure of investment properties amounted to P=256.5 million, P=182.3 million, and P=246.8 million in 2021, 2020 and 2019, respectively. The Bank realized gain on sale of investment properties amounting to P=314.8 million, P=144.6 million, and P=365.0 million in 2021, 2020 and 2019, respectively.
- 58 -
Rental income on investment properties included in miscellaneous income amounted to P=42.4 million, P=45.5 million, and P=37.5 million in 2021, 2020 and 2019, respectively (Notes 23 and 25). Operating expenses incurred in maintaining investment properties (included under miscellaneous expense - ‘Repairs and maintenance’) amounted to P=13.0 million, P=16.2 million, and P=20.1 million in 2021, 2020 and 2019, respectively (Note 26).
13. Intangible Assets and Goodwill
This account consists of:
2021 2020 Goodwill P=53,558,338 P=53,558,338 Intangible assets Software costs 270,511,009 350,461,044 Branch licenses 37,123,737 37,123,737 307,634,746 387,584,781 P=361,193,084 P=441,143,119
Movements in intangible assets follow:
2021
Software
Costs Branch
Licenses Total) Balance at beginning of year P=350,461,044 P=37,123,737 P=387,584,781 Additions 33,699,129 – 33,699,129 Amortization (113,649,164) – (113,649,164) Balance at beginning of year P=270,511,009 P=37,123,737 P=307,634,746
2020
Software Costs
Branch Licenses Total)
Balance at beginning of year P=389,774,423 P=37,123,737 P=426,898,160 Additions 97,105,773 – 97,105,773 Retirement and others (Note 32) (8,281,794) – (8,281,794) Amortization (128,137,358) – (128,137,358) Balance at end of year P=350,461,044 P=37,123,737 P=387,584,781
14. Other Assets
This account consists of:
2021 2020 Chattel mortgage properties - net P=408,519,774 P=1,215,977,923 Net retirement assets (Note 24) 241,839,962 – Security deposits (Note 29) 197,493,711 201,234,920 Prepayments (Note 29) 184,838,487 191,060,787 Documentary stamps on hand 79,073,890 68,226,337 Stationeries and supplies on hand 35,947,368 41,924,920 RCOCI 29,022,534 11,626,483 Creditable withholding tax 11,569,285 – Others 591,811 12,095,487 P=1,188,896,822 P=1,742,146,857
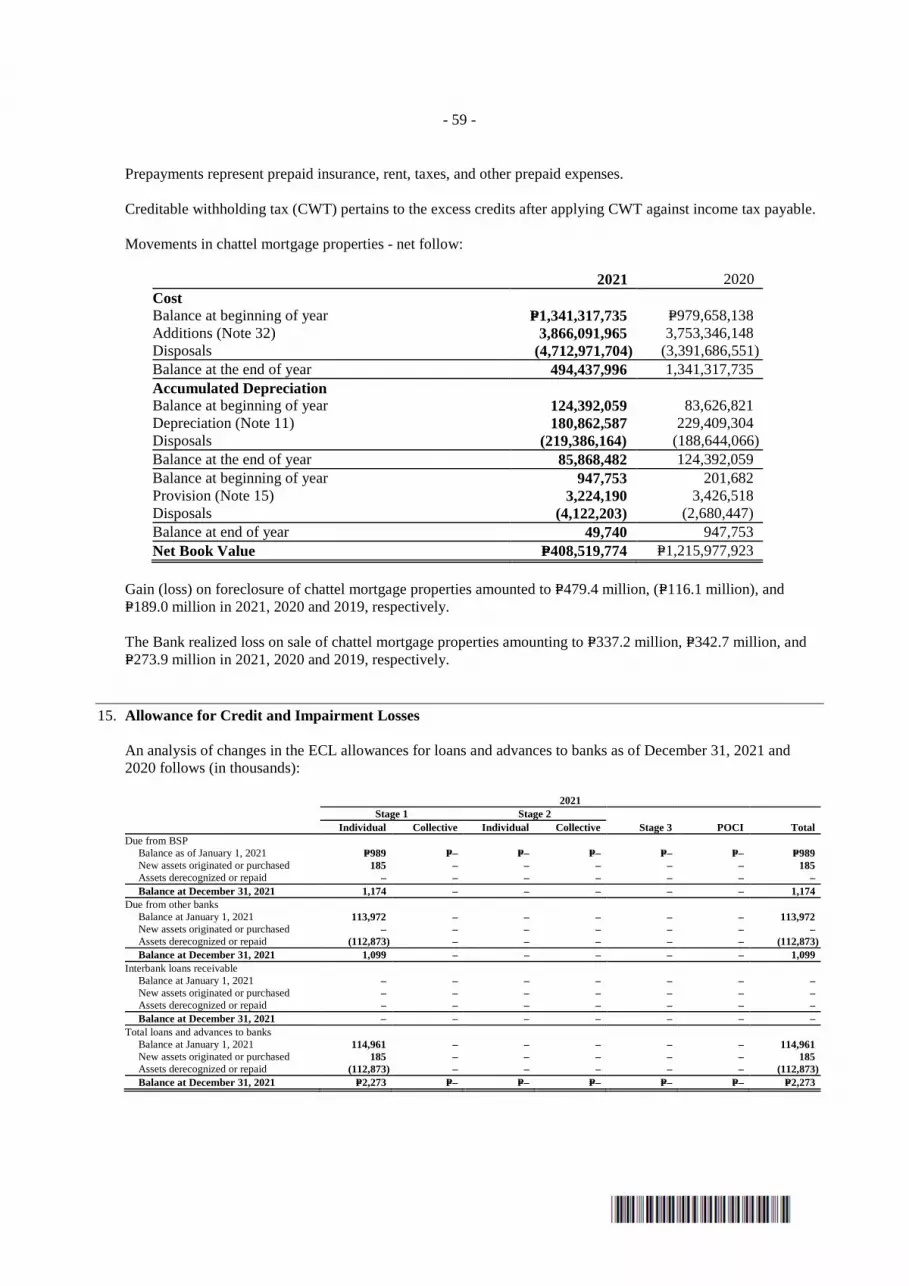
- 59 -
Prepayments represent prepaid insurance, rent, taxes, and other prepaid expenses. Creditable withholding tax (CWT) pertains to the excess credits after applying CWT against income tax payable.
Movements in chattel mortgage properties - net follow:
2021 2020 Cost Balance at beginning of year P=1,341,317,735 P=979,658,138 Additions (Note 32) 3,866,091,965 3,753,346,148 Disposals (4,712,971,704) (3,391,686,551) Balance at the end of year 494,437,996 1,341,317,735 Accumulated Depreciation Balance at beginning of year 124,392,059 83,626,821 Depreciation (Note 11) 180,862,587 229,409,304 Disposals (219,386,164) (188,644,066) Balance at the end of year 85,868,482 124,392,059 Balance at beginning of year 947,753 201,682 Provision (Note 15) 3,224,190 3,426,518 Disposals (4,122,203) (2,680,447) Balance at end of year 49,740 947,753 Net Book Value P=408,519,774 P=1,215,977,923
Gain (loss) on foreclosure of chattel mortgage properties amounted to P=479.4 million, (P=116.1 million), and P=189.0 million in 2021, 2020 and 2019, respectively. The Bank realized loss on sale of chattel mortgage properties amounting to P=337.2 million, P=342.7 million, and P=273.9 million in 2021, 2020 and 2019, respectively.
15. Allowance for Credit and Impairment Losses
An analysis of changes in the ECL allowances for loans and advances to banks as of December 31, 2021 and 2020 follows (in thousands): 2021 Stage 1 Stage 2 Individual Collective Individual Collective Stage 3 POCI Total Due from BSP
Balance as of January 1, 2021 P=989 P=– P=– P=– P=– P=– P=989 New assets originated or purchased 185 – – – – – 185 Assets derecognized or repaid – – – – – – – Balance at December 31, 2021 1,174 – – – – – 1,174
Due from other banks Balance at January 1, 2021 113,972 – – – – – 113,972 New assets originated or purchased – – – – – – – Assets derecognized or repaid (112,873) – – – – – (112,873) Balance at December 31, 2021 1,099 – – – – – 1,099
Interbank loans receivable Balance at January 1, 2021 – – – – – – – New assets originated or purchased – – – – – – – Assets derecognized or repaid – – – – – – – Balance at December 31, 2021 – – – – – – –
Total loans and advances to banks Balance at January 1, 2021 114,961 – – – – – 114,961 New assets originated or purchased 185 – – – – – 185 Assets derecognized or repaid (112,873) – – – – – (112,873) Balance at December 31, 2021 P=2,273 P=– P=– P=– P=– P=– P=2,273

- 60 -
2020 Stage 1 Stage 2 Individual Collective Individual Collective Stage 3 POCI Total Due from BSP
Balance as of January 1, 2020 P=1,226 P=– P=– P=– P=– P=– P=1,226 New assets originated or purchased – – – – – – – Assets derecognized or repaid (237) – – – – – (237) Balance at December 31, 2020 989 – – – – – 989
Due from other banks Balance at January 1, 2020 1,043 – – – – – 1,043 New assets originated or purchased 112,929 – – – – – 112,929 Assets derecognized or repaid – – – – – – – Balance at December 31, 2020 113,972 – – – – – 113,972
Interbank loans receivable Balance at January 1, 2020 – – – – – – – New assets originated or purchased – – – – – – – Assets derecognized or repaid – – – – – – – Balance at December 31, 2020 – – – – – – –
Total loans and advances to banks Balance at January 1, 2020 2,269 – – – – – 2,269 New assets originated or purchased 112,929 – – – – – 112,929 Assets derecognized or repaid (237) – – – – – (237) Balance at December 31, 2020 P=114,961 P=– P=– P=– P=– P=– P=114,961
An analysis of changes in the ECL allowances for investment securities as of December 31, 2021 and 2020 follows (in thousands): 2021 Stage 1 Stage 2 Individual Collective Individual Collective Stage 3 POCI Total Financial assets at FVOCI
Balance at January 1, 2021 P=4,893 P=– P=– P=– P=– P=– P=4,893 New assets originated or purchased 8,429 – – – – – 8,429 Assets derecognized or repaid (2,044) – – – – – (2,044)
Balance at December 31, 2021 11,278 – – – – – 11,278 Investment at amortized cost
Balance at January 1, 2021 22,447 – – – – – 22,447 New assets originated or purchased 3,819 – – – – – 3,819 Assets derecognized or repaid (668) – – – – – (668)
Balance at December 31, 2021 25,598 – – – – – 25,598 Total investment securities
Balance at January 1, 2021 27,340 – – – – – 27,340 New assets originated or purchased 12,248 – – – – – 12,248 Assets derecognized or repaid (2,712) – – – – – (2,712)
Balance at December 31, 2021 P=36,876 P=– P=– P=– P=– P=– P=36,876
2020 Stage 1 Stage 2 Individual Collective Individual Collective Stage 3 POCI Total Financial assets at FVOCI
Balance at January 1, 2020 P=3,419 P=– P=– P=– P=– P=– 3,419 New assets originated or purchased 6,318 – – – – – 6,318 Assets derecognized or repaid (4,844) – – – – – (4,844)
Balance at December 31, 2020 4,893 – – – – – 4,893 Investment at amortized cost
Balance at January 1, 2020 25,525 – – – – – 25,525 New assets originated or purchased – – – – – – Assets derecognized or repaid (3,078) – – – – – (3,078)
Balance at December 31, 2020 22,447 – – – – – 22,447 Total investment securities
Balance at January 1, 2020 28,944 – – – – – 28,944 New assets originated or purchased 6,318 – – – – – 6,318 Assets derecognized or repaid (7,922) – – – – – (7,922)
Balance at December 31, 2020 P=27,340 P=– P=– P=– P=– P=– P=27,340
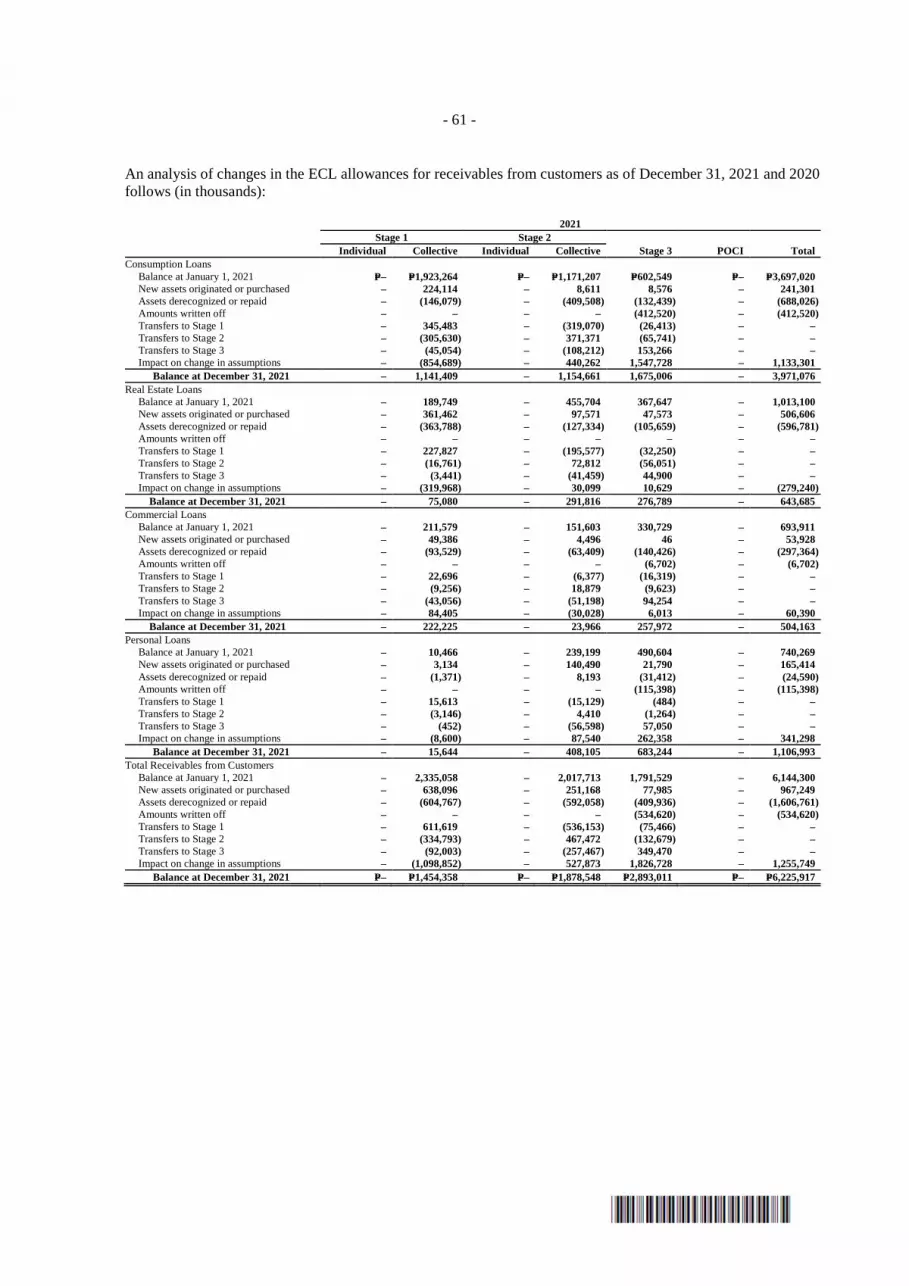
- 61 -
An analysis of changes in the ECL allowances for receivables from customers as of December 31, 2021 and 2020 follows (in thousands): 2021 Stage 1 Stage 2 Individual Collective Individual Collective Stage 3 POCI Total Consumption Loans
Balance at January 1, 2021 P=– P=1,923,264 P=– P=1,171,207 P=602,549 P=– P=3,697,020 New assets originated or purchased – 224,114 – 8,611 8,576 – 241,301 Assets derecognized or repaid – (146,079) – (409,508) (132,439) – (688,026) Amounts written off – – – – (412,520) – (412,520) Transfers to Stage 1 – 345,483 – (319,070) (26,413) – – Transfers to Stage 2 – (305,630) – 371,371 (65,741) – – Transfers to Stage 3 – (45,054) – (108,212) 153,266 – – Impact on change in assumptions – (854,689) – 440,262 1,547,728 – 1,133,301
Balance at December 31, 2021 – 1,141,409 – 1,154,661 1,675,006 – 3,971,076 Real Estate Loans
Balance at January 1, 2021 – 189,749 – 455,704 367,647 – 1,013,100 New assets originated or purchased – 361,462 – 97,571 47,573 – 506,606 Assets derecognized or repaid – (363,788) – (127,334) (105,659) – (596,781) Amounts written off – – – – – – – Transfers to Stage 1 – 227,827 – (195,577) (32,250) – – Transfers to Stage 2 – (16,761) – 72,812 (56,051) – – Transfers to Stage 3 – (3,441) – (41,459) 44,900 – – Impact on change in assumptions – (319,968) – 30,099 10,629 – (279,240) Balance at December 31, 2021 – 75,080 – 291,816 276,789 – 643,685
Commercial Loans Balance at January 1, 2021 – 211,579 – 151,603 330,729 – 693,911 New assets originated or purchased – 49,386 – 4,496 46 – 53,928 Assets derecognized or repaid – (93,529) – (63,409) (140,426) – (297,364) Amounts written off – – – – (6,702) – (6,702) Transfers to Stage 1 – 22,696 – (6,377) (16,319) – – Transfers to Stage 2 – (9,256) – 18,879 (9,623) – – Transfers to Stage 3 – (43,056) – (51,198) 94,254 – – Impact on change in assumptions – 84,405 – (30,028) 6,013 – 60,390 Balance at December 31, 2021 – 222,225 – 23,966 257,972 – 504,163
Personal Loans Balance at January 1, 2021 – 10,466 – 239,199 490,604 – 740,269 New assets originated or purchased – 3,134 – 140,490 21,790 – 165,414 Assets derecognized or repaid – (1,371) – 8,193 (31,412) – (24,590) Amounts written off – – – – (115,398) – (115,398) Transfers to Stage 1 – 15,613 – (15,129) (484) – – Transfers to Stage 2 – (3,146) – 4,410 (1,264) – – Transfers to Stage 3 – (452) – (56,598) 57,050 – – Impact on change in assumptions – (8,600) – 87,540 262,358 – 341,298
Balance at December 31, 2021 – 15,644 – 408,105 683,244 – 1,106,993 Total Receivables from Customers
Balance at January 1, 2021 – 2,335,058 – 2,017,713 1,791,529 – 6,144,300 New assets originated or purchased – 638,096 – 251,168 77,985 – 967,249 Assets derecognized or repaid – (604,767) – (592,058) (409,936) – (1,606,761) Amounts written off – – – – (534,620) – (534,620) Transfers to Stage 1 – 611,619 – (536,153) (75,466) – – Transfers to Stage 2 – (334,793) – 467,472 (132,679) – – Transfers to Stage 3 – (92,003) – (257,467) 349,470 – – Impact on change in assumptions – (1,098,852) – 527,873 1,826,728 – 1,255,749
Balance at December 31, 2021 P=– P=1,454,358 P=– P=1,878,548 P=2,893,011 P=– P=6,225,917
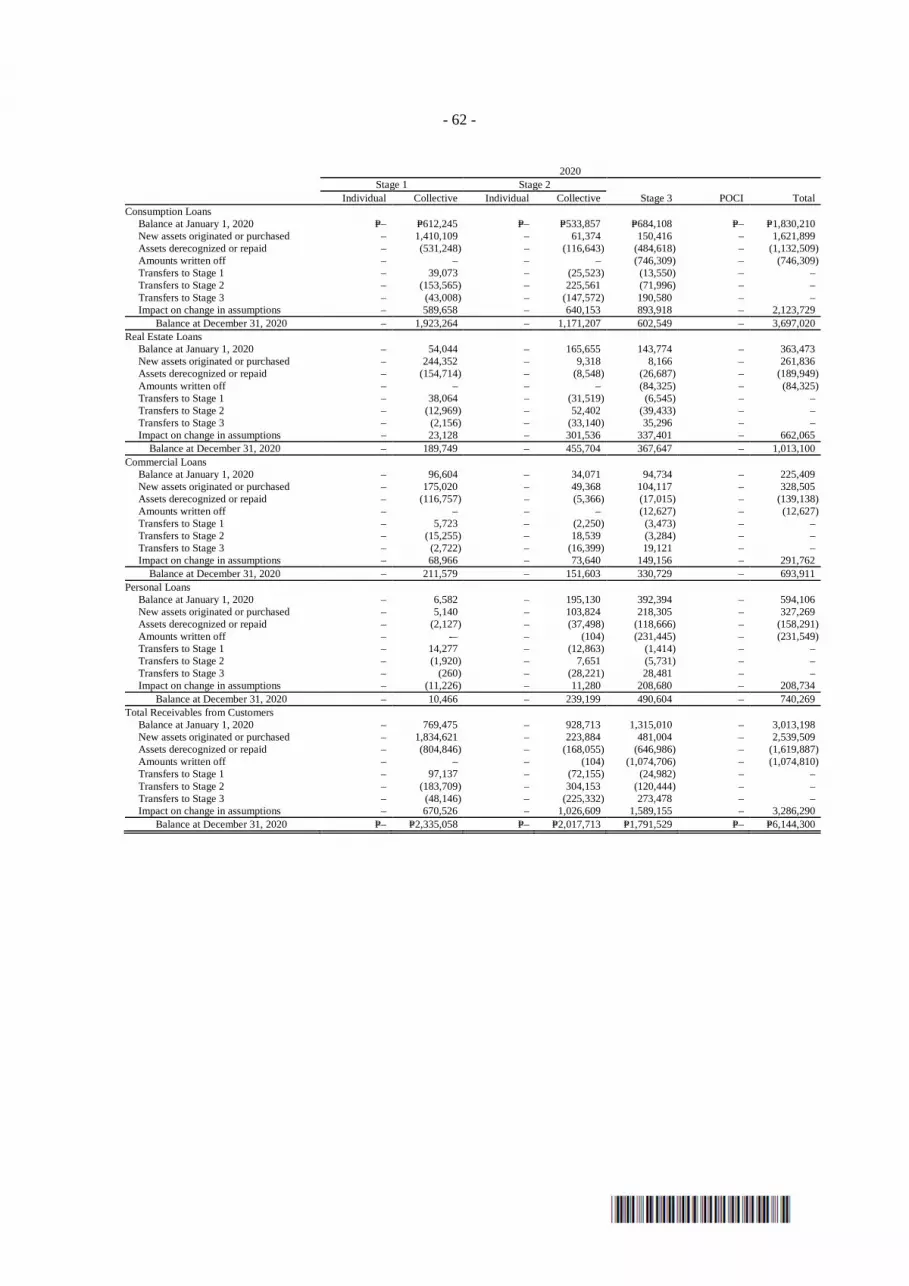
- 62 -
2020 Stage 1 Stage 2 Individual Collective Individual Collective Stage 3 POCI Total Consumption Loans
Balance at January 1, 2020 P=– P=612,245 P=– P=533,857 P=684,108 P=– P=1,830,210 New assets originated or purchased – 1,410,109 – 61,374 150,416 – 1,621,899 Assets derecognized or repaid – (531,248) – (116,643) (484,618) – (1,132,509) Amounts written off – – – – (746,309) – (746,309) Transfers to Stage 1 – 39,073 – (25,523) (13,550) – – Transfers to Stage 2 – (153,565) – 225,561 (71,996) – – Transfers to Stage 3 – (43,008) – (147,572) 190,580 – – Impact on change in assumptions – 589,658 – 640,153 893,918 – 2,123,729
Balance at December 31, 2020 – 1,923,264 – 1,171,207 602,549 – 3,697,020 Real Estate Loans
Balance at January 1, 2020 – 54,044 – 165,655 143,774 – 363,473 New assets originated or purchased – 244,352 – 9,318 8,166 – 261,836 Assets derecognized or repaid – (154,714) – (8,548) (26,687) – (189,949) Amounts written off – – – – (84,325) – (84,325) Transfers to Stage 1 – 38,064 – (31,519) (6,545) – – Transfers to Stage 2 – (12,969) – 52,402 (39,433) – – Transfers to Stage 3 – (2,156) – (33,140) 35,296 – – Impact on change in assumptions – 23,128 – 301,536 337,401 – 662,065 Balance at December 31, 2020 – 189,749 – 455,704 367,647 – 1,013,100
Commercial Loans Balance at January 1, 2020 – 96,604 – 34,071 94,734 – 225,409 New assets originated or purchased – 175,020 – 49,368 104,117 – 328,505 Assets derecognized or repaid – (116,757) – (5,366) (17,015) – (139,138) Amounts written off – – – – (12,627) – (12,627) Transfers to Stage 1 – 5,723 – (2,250) (3,473) – – Transfers to Stage 2 – (15,255) – 18,539 (3,284) – – Transfers to Stage 3 – (2,722) – (16,399) 19,121 – – Impact on change in assumptions – 68,966 – 73,640 149,156 – 291,762 Balance at December 31, 2020 – 211,579 – 151,603 330,729 – 693,911
Personal Loans Balance at January 1, 2020 – 6,582 – 195,130 392,394 – 594,106 New assets originated or purchased – 5,140 – 103,824 218,305 – 327,269 Assets derecognized or repaid – (2,127) – (37,498) (118,666) – (158,291) Amounts written off – -– – (104) (231,445) – (231,549) Transfers to Stage 1 – 14,277 – (12,863) (1,414) – – Transfers to Stage 2 – (1,920) – 7,651 (5,731) – – Transfers to Stage 3 – (260) – (28,221) 28,481 – – Impact on change in assumptions – (11,226) – 11,280 208,680 – 208,734
Balance at December 31, 2020 – 10,466 – 239,199 490,604 – 740,269 Total Receivables from Customers
Balance at January 1, 2020 – 769,475 – 928,713 1,315,010 – 3,013,198 New assets originated or purchased – 1,834,621 – 223,884 481,004 – 2,539,509 Assets derecognized or repaid – (804,846) – (168,055) (646,986) – (1,619,887) Amounts written off – – – (104) (1,074,706) – (1,074,810) Transfers to Stage 1 – 97,137 – (72,155) (24,982) – – Transfers to Stage 2 – (183,709) – 304,153 (120,444) – – Transfers to Stage 3 – (48,146) – (225,332) 273,478 – – Impact on change in assumptions – 670,526 – 1,026,609 1,589,155 – 3,286,290
Balance at December 31, 2020 P=– P=2,335,058 P=– P=2,017,713 P=1,791,529 P=– P=6,144,300
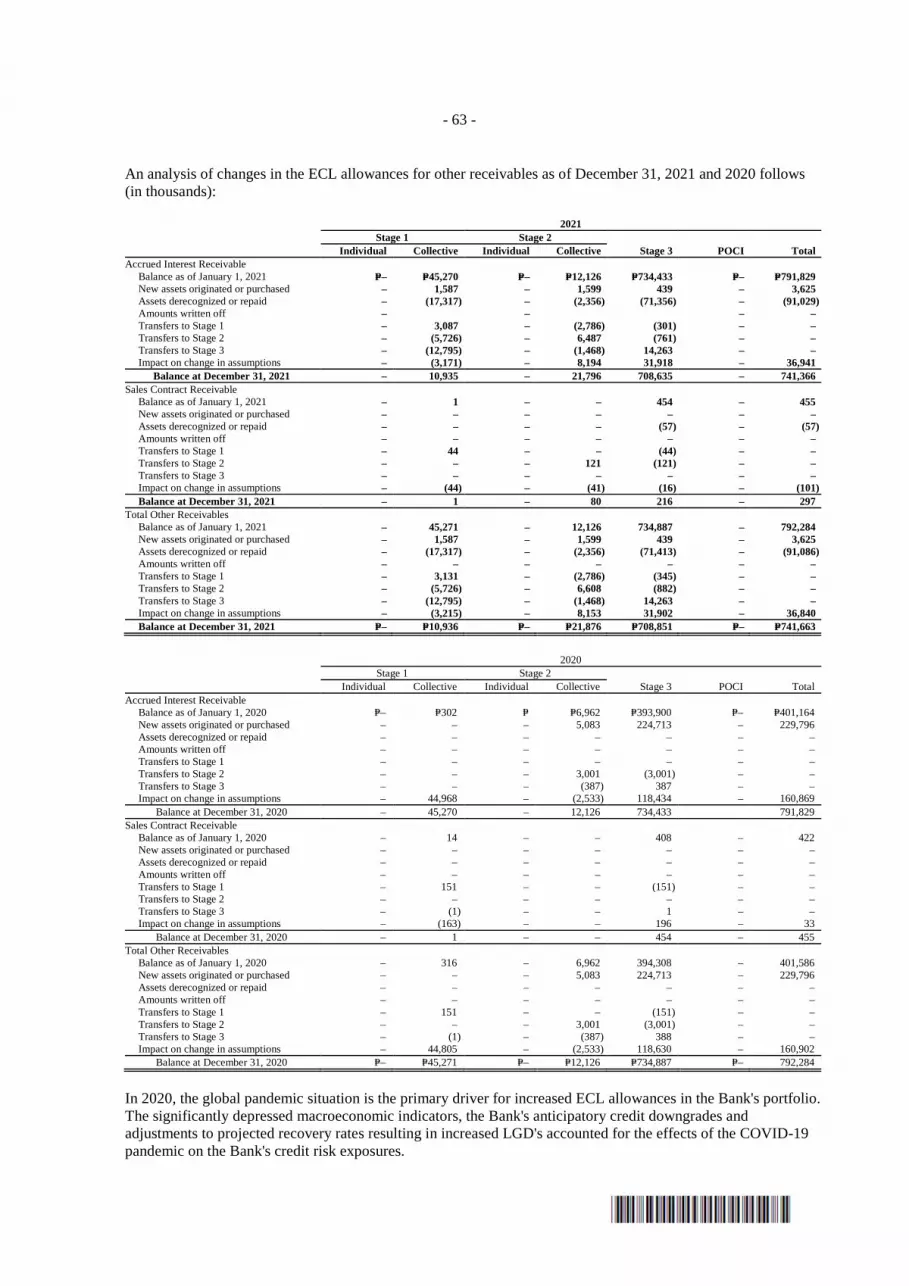
- 63 -
An analysis of changes in the ECL allowances for other receivables as of December 31, 2021 and 2020 follows (in thousands): 2021 Stage 1 Stage 2 Individual Collective Individual Collective Stage 3 POCI Total Accrued Interest Receivable
Balance as of January 1, 2021 P=– P=45,270 P=– P=12,126 P=734,433 P=– P=791,829 New assets originated or purchased – 1,587 – 1,599 439 – 3,625 Assets derecognized or repaid – (17,317) – (2,356) (71,356) – (91,029) Amounts written off – – – – Transfers to Stage 1 – 3,087 – (2,786) (301) – – Transfers to Stage 2 – (5,726) – 6,487 (761) – – Transfers to Stage 3 – (12,795) – (1,468) 14,263 – – Impact on change in assumptions – (3,171) – 8,194 31,918 – 36,941
Balance at December 31, 2021 – 10,935 – 21,796 708,635 – 741,366 Sales Contract Receivable
Balance as of January 1, 2021 – 1 – – 454 – 455 New assets originated or purchased – – – – – – – Assets derecognized or repaid – – – – (57) – (57) Amounts written off – – – – – – – Transfers to Stage 1 – 44 – – (44) – – Transfers to Stage 2 – – – 121 (121) – – Transfers to Stage 3 – – – – – – – Impact on change in assumptions – (44) – (41) (16) – (101) Balance at December 31, 2021 – 1 – 80 216 – 297
Total Other Receivables Balance as of January 1, 2021 – 45,271 – 12,126 734,887 – 792,284 New assets originated or purchased – 1,587 – 1,599 439 – 3,625 Assets derecognized or repaid – (17,317) – (2,356) (71,413) – (91,086) Amounts written off – – – – – – – Transfers to Stage 1 – 3,131 – (2,786) (345) – – Transfers to Stage 2 – (5,726) – 6,608 (882) – – Transfers to Stage 3 – (12,795) – (1,468) 14,263 – – Impact on change in assumptions – (3,215) – 8,153 31,902 – 36,840 Balance at December 31, 2021 P=– P=10,936 P=– P=21,876 P=708,851 P=– P=741,663
2020 Stage 1 Stage 2 Individual Collective Individual Collective Stage 3 POCI Total Accrued Interest Receivable
Balance as of January 1, 2020 P=– P=302 P= P=6,962 P=393,900 P=– P=401,164 New assets originated or purchased – – – 5,083 224,713 – 229,796 Assets derecognized or repaid – – – – – – – Amounts written off – – – – – – – Transfers to Stage 1 – – – – – – – Transfers to Stage 2 – – – 3,001 (3,001) – – Transfers to Stage 3 – – – (387) 387 – – Impact on change in assumptions – 44,968 – (2,533) 118,434 – 160,869
Balance at December 31, 2020 – 45,270 – 12,126 734,433 791,829 Sales Contract Receivable
Balance as of January 1, 2020 – 14 – – 408 – 422 New assets originated or purchased – – – – – – – Assets derecognized or repaid – – – – – – – Amounts written off – – – – – – – Transfers to Stage 1 – 151 – – (151) – – Transfers to Stage 2 – – – – – – – Transfers to Stage 3 – (1) – – 1 – – Impact on change in assumptions – (163) – – 196 – 33
Balance at December 31, 2020 – 1 – – 454 – 455 Total Other Receivables
Balance as of January 1, 2020 – 316 – 6,962 394,308 – 401,586 New assets originated or purchased – – – 5,083 224,713 – 229,796 Assets derecognized or repaid – – – – – – – Amounts written off – – – – – – – Transfers to Stage 1 – 151 – – (151) – – Transfers to Stage 2 – – – 3,001 (3,001) – – Transfers to Stage 3 – (1) – (387) 388 – – Impact on change in assumptions – 44,805 – (2,533) 118,630 – 160,902
Balance at December 31, 2020 P=– P=45,271 P=– P=12,126 P=734,887 P=– 792,284
In 2020, the global pandemic situation is the primary driver for increased ECL allowances in the Bank's portfolio. The significantly depressed macroeconomic indicators, the Bank's anticipatory credit downgrades and adjustments to projected recovery rates resulting in increased LGD's accounted for the effects of the COVID-19 pandemic on the Bank's credit risk exposures.

- 64 -
In 2021, the numerous efforts of governments and economies to adapt and mitigate the global pandemic outbreak started to take effect and create some level of stability. This is evident as ECL allowances decreased compared to previous year. Recalibration of the ECL models with new data generated from the COVID-19 pandemic period ensured that historical downturns are taken into account. This will provide long-run effectivity of the provisioning process to the Bank's credit risk exposures. The ECL allowance on accounts receivables of the Bank based on their aging as of December 31, 2021 and 2020 follows:
Age of accounts receivables 2021 2020 Up to 1 month P=22,003,247 P=117,234,413 > 1 to 2 months 8,487,475 93,692 > 2 to 3 months 662,347 234,543 More than 3 months 501,391,945 465,597,613 P=532,545,014 P=583,160,261
The details of provisions (reversals) under the statements of income follow:
2021 2020 Loans and receivables (Note 9) P=3,143,756,202 P=6,284,378,657 Due from other banks (112,873,568) 112,929,135 Investment properties (Note 12) 26,850,653 (1,633,199) Investment securities 9,535,181 (1,604,110) Chattel mortgage (Note 14) 3,224,190 3,426,518 Due from BSP 185,566 (237,615) P=3,070,678,224 P=6,397,259,386
16. Deposit Liabilities
Interest expense on deposit liabilities consists of:
2021 2020 2019 Time (Note 29) P=1,142,132,528 P=2,136,446,710 P=4,594,981,252 LTNCD 393,609,027 393,944,665 392,214,948 Demand (Note 29) 55,002,193 150,040,647 205,871,472 Savings 46,490,171 91,174,935 134,557,733 P=1,637,233,919 P=2,771,606,957 P=5,327,625,405
Peso-denominated deposit liabilities earn annual fixed interest rates ranging from 0.10% to 6.00% in 2021, and from 0.25% to 6.00% in 2020 and 2019, while foreign currency-denominated deposit liabilities earn annual fixed interest rates ranging from 0.05% to 0.38% in 2021, from 0.18% to 2.00% in 2020, and 0.25% to 3.00% in 2019. Effective interest rates on deposit liabilities range from 0.10% to 3.95% in 2021, from 0.24% to 3.60% in 2020, and from 1.09% to 3.68% in 2019.
In 2020, the Bangko Sentral ng Pilipinas issued BSP Circular No 1092 reducing the reserve requirements against deposit and deposit liabilities to 3% from 7%. In 2019, the Bangko Sentral ng Pilipinas issued BSP Circular Nos. 1041, 1056, and 1063 reducing the reserve requirements against non-FCDU deposit and deposit substitute liabilities to 4% from 8%. As of December 31, 2021 and 2020, Due from BSP amounting to P=6.5 billion and P=5.5 billion, respectively, was set aside as reserves for deposit liabilities. As reported to the BSP, the Bank is in compliance with such regulations as of December 31, 2021 and 2020. On December 8, 2016, the BSP authorized the Bank to issue LTNCDs up to P=10.0 billion through one or multiple tranches over a period of one year. On January 30, 2017, the Bank issued the first tranche of LTNCDs amounting to P=3.4 billion with a tenor of five (5) years and three (3) months and due on April 30, 2022 with interest rate of 3.50% per annum payable quarterly. The minimum investment size for the LTNCDs is P=50,000

- 65 -
with increments of P=50,000 thereafter. Subject to BSP Rules, the Bank has the option to pre-terminate the LTNCDs as a whole but not in part, prior to maturity and on any interest payment date at face value plus accrued interest covering the accrued and unpaid interest. On July 13, 2018, the BSP authorized the Bank to issue LTNCDs up to P=15.0 billion through one or multiple tranches over a period of one year. On August 9, 2018, the Bank issued the first tranche of LTNCDs amounting to P=5.1 billion with a tenor of five (5) years and six (6) months and due on February 9, 2024 with interest rate of 5.00% per annum payable quarterly. The minimum investment size for the LTNCDs is P=50,000 with increments of P=50,000 thereafter. Subject to BSP Rules, the Bank has the option to pre-terminate the LTNCDs as a whole but not in part, prior to maturity and on any interest payment date at face value plus accrued interest covering the accrued and unpaid interest. As of December 31, 2021 and 2020, deferred financing cost on LTNCDs amounted to P=18.0 million and P=34.1 million, respectively. Amortization of deferred financing cost amounted to P=16.1 million in 2021, and P=15.4 million in 2020.
17. Bills Payable, Bonds Payable and Subordinated Notes
Bills Payable On December 10, 2018, the Bank issued MTFNs amounting to 3.0 billion with a tenor of one (1) year and six (6) months and due on June 10, 2020 with interest rate of 7.07% per annum payable quarterly. Interest payment dates shall commence on March 10, 2019 and up to and including the maturity date. The minimum investment size for the MTFNs is P=10.0 million with increments of P=0.1 million thereafter. On June 10, 2020, the Bank paid its outstanding MTFNs.
Peso-denominated interbank borrowings of the Bank bear annual interest ranging from 3.97% to 4.00% in 2020, and from 3.94% to 5.25% in 2019. Foreign currency-denominated interbank borrowings bear annual interest ranging from 1.00% to 1.60%, and from 2.35% to 2.50%, in 2020, and 2019, respectively. Annual interest rate on dollar-denominated securities sold under resale agreement (SSURA) ranges from 1.90% to 2.00%, and from 2.70% to 2.79%, in 2020, and 2019, respectively.
As of December 31, 2020 and 2019, deferred financing cost on MTFNs amounted to nil and P=10.3 million, respectively. Amortization of deferred financing cost amounted to P=10.3 million and P=21.2 million in 2020 and 2019, respectively. Interest expense on bills payable in 2021, 2020, and 2019 amounted to P=42.0 thousand, P=110.4 million, and P=319.7 million, respectively (Note 29). Bonds Payable On February 4, 2020, the Bank issued fixed rate bonds amounting to P=4.7 billion with a tenor of three (3) years and due on February 4, 2023 with interest rate of 4.5% per annum payable quarterly. The minimum investment size for the bonds payable is P=0.5 million with increments of P=0.1 million thereafter. As of December 31, 2021 and 2020, the carrying amount of the bonds payable is P=4.6 billion. Debt issuance cost related to the issuance amounted to P=42.7 million.
Interest expense incurred on bonds due in 2023 amounted to P=223.4 million in 2021, and P=202.3 million in 2020. Amortization of debt issuance costs amounted to P=14.2 million in 2021 and P=12.1 million in 2020. On July 24, 2019, the Bank issued fixed rate bonds amounting to P=6.3 billion with a tenor of two (2) years and due on July 24, 2021 with interest rate of 5.6% per annum payable quarterly. The minimum investment size for the bonds payable is P=0.5 million with increments of P=0.1 million thereafter. As of December 31, 2021 and 2020, the carrying amount of the bonds payable is P=4.6 billion and P=10.9 billion, respectively. Debt issuance cost related to the issuance amounted to P=56.9 million.
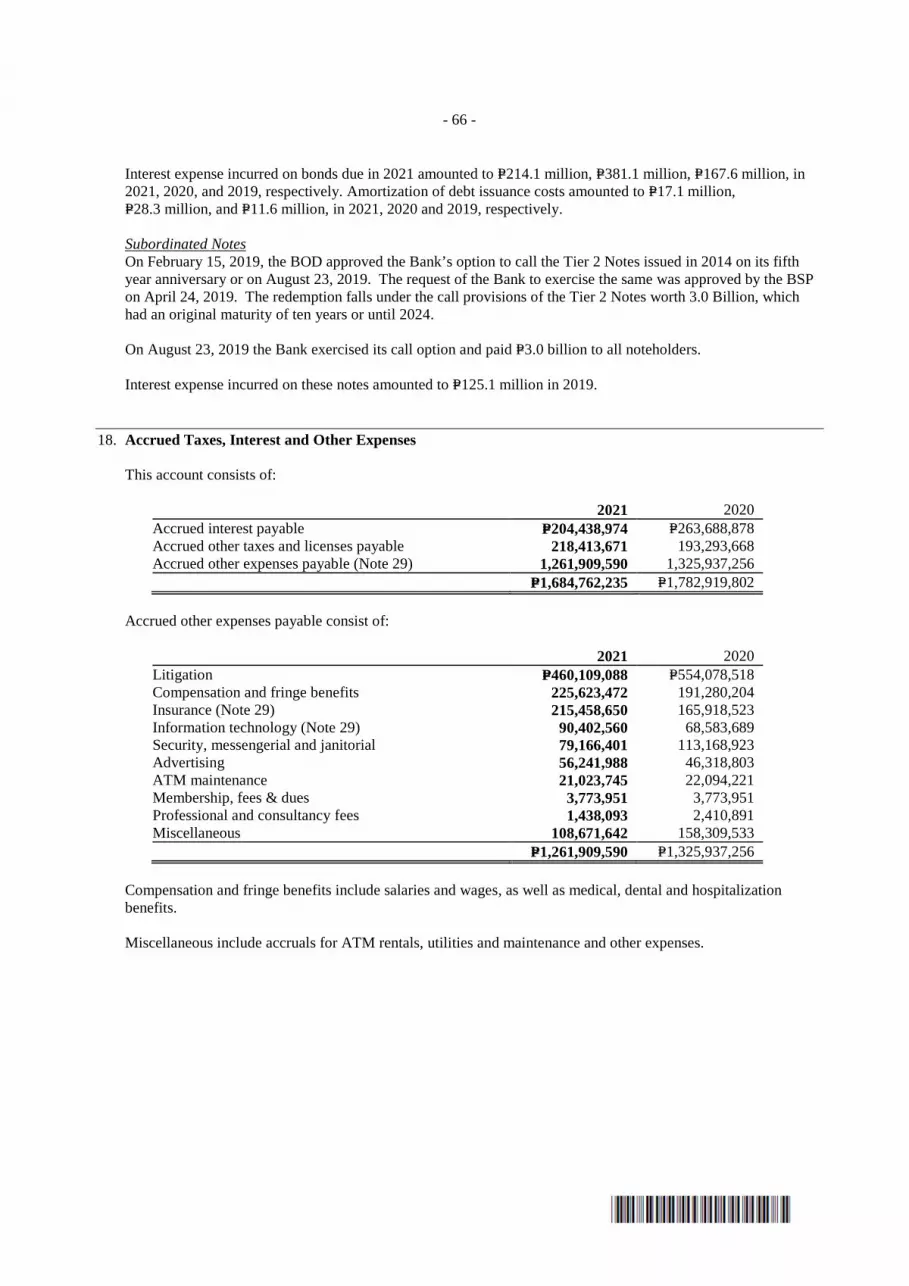
- 66 -
Interest expense incurred on bonds due in 2021 amounted to P=214.1 million, P=381.1 million, P=167.6 million, in 2021, 2020, and 2019, respectively. Amortization of debt issuance costs amounted to P=17.1 million, P=28.3 million, and P=11.6 million, in 2021, 2020 and 2019, respectively.
Subordinated Notes On February 15, 2019, the BOD approved the Bank’s option to call the Tier 2 Notes issued in 2014 on its fifth year anniversary or on August 23, 2019. The request of the Bank to exercise the same was approved by the BSP on April 24, 2019. The redemption falls under the call provisions of the Tier 2 Notes worth 3.0 Billion, which had an original maturity of ten years or until 2024.
On August 23, 2019 the Bank exercised its call option and paid P=3.0 billion to all noteholders. Interest expense incurred on these notes amounted to P=125.1 million in 2019.
18. Accrued Taxes, Interest and Other Expenses
This account consists of:
2021 2020 Accrued interest payable P=204,438,974 P=263,688,878 Accrued other taxes and licenses payable 218,413,671 193,293,668 Accrued other expenses payable (Note 29) 1,261,909,590 1,325,937,256 P=1,684,762,235 P=1,782,919,802
Accrued other expenses payable consist of:
2021 2020 Litigation P=460,109,088 P=554,078,518 Compensation and fringe benefits 225,623,472 191,280,204 Insurance (Note 29) 215,458,650 165,918,523 Information technology (Note 29) 90,402,560 68,583,689 Security, messengerial and janitorial 79,166,401 113,168,923 Advertising 56,241,988 46,318,803 ATM maintenance 21,023,745 22,094,221 Membership, fees & dues 3,773,951 3,773,951 Professional and consultancy fees 1,438,093 2,410,891 Miscellaneous 108,671,642 158,309,533 P=1,261,909,590 P=1,325,937,256
Compensation and fringe benefits include salaries and wages, as well as medical, dental and hospitalization benefits.
Miscellaneous include accruals for ATM rentals, utilities and maintenance and other expenses.
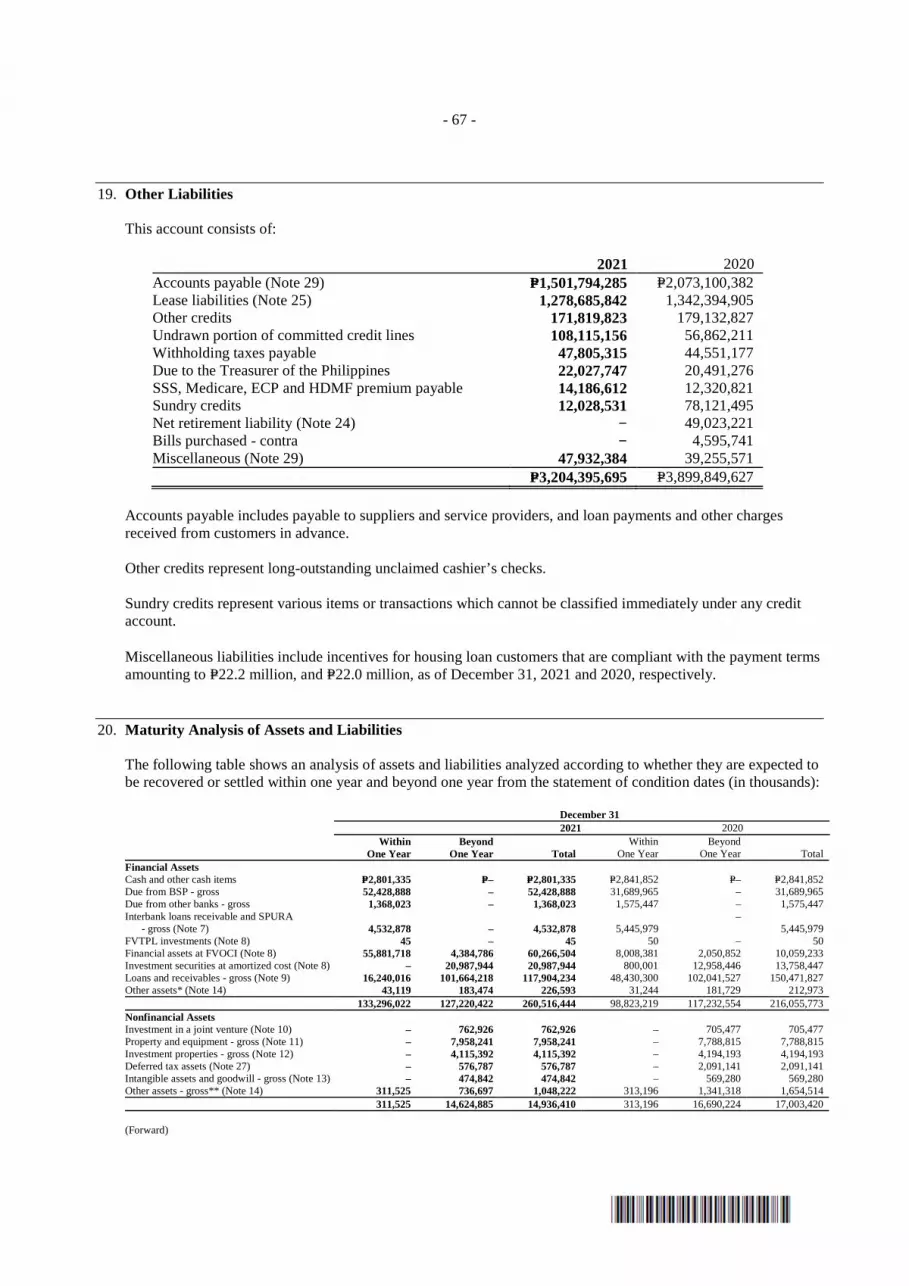
- 67 -
19. Other Liabilities
This account consists of:
2021 2020
Accounts payable (Note 29) P=1,501,794,285 P=2,073,100,382 Lease liabilities (Note 25) 1,278,685,842 1,342,394,905 Other credits 171,819,823 179,132,827 Undrawn portion of committed credit lines 108,115,156 56,862,211 Withholding taxes payable 47,805,315 44,551,177 Due to the Treasurer of the Philippines 22,027,747 20,491,276 SSS, Medicare, ECP and HDMF premium payable 14,186,612 12,320,821 Sundry credits 12,028,531 78,121,495 Net retirement liability (Note 24) − 49,023,221 Bills purchased - contra − 4,595,741 Miscellaneous (Note 29) 47,932,384 39,255,571 P=3,204,395,695 P=3,899,849,627
Accounts payable includes payable to suppliers and service providers, and loan payments and other charges received from customers in advance.
Other credits represent long-outstanding unclaimed cashier’s checks.
Sundry credits represent various items or transactions which cannot be classified immediately under any credit account.
Miscellaneous liabilities include incentives for housing loan customers that are compliant with the payment terms amounting to P=22.2 million, and P=22.0 million, as of December 31, 2021 and 2020, respectively.
20. Maturity Analysis of Assets and Liabilities
The following table shows an analysis of assets and liabilities analyzed according to whether they are expected to be recovered or settled within one year and beyond one year from the statement of condition dates (in thousands):
December 31 2021 2020
Within
One Year Beyond
One Year Total Within
One Year Beyond
One Year Total Financial Assets Cash and other cash items P=2,801,335 P=– P=2,801,335 P=2,841,852 P=– P=2,841,852 Due from BSP - gross 52,428,888 – 52,428,888 31,689,965 – 31,689,965 Due from other banks - gross 1,368,023 – 1,368,023 1,575,447 – 1,575,447 Interbank loans receivable and SPURA
- gross (Note 7) 4,532,878 – 4,532,878 5,445,979 –
5,445,979 FVTPL investments (Note 8) 45 – 45 50 – 50 Financial assets at FVOCI (Note 8) 55,881,718 4,384,786 60,266,504 8,008,381 2,050,852 10,059,233 Investment securities at amortized cost (Note 8) – 20,987,944 20,987,944 800,001 12,958,446 13,758,447 Loans and receivables - gross (Note 9) 16,240,016 101,664,218 117,904,234 48,430,300 102,041,527 150,471,827 Other assets* (Note 14) 43,119 183,474 226,593 31,244 181,729 212,973 133,296,022 127,220,422 260,516,444 98,823,219 117,232,554 216,055,773 Nonfinancial Assets Investment in a joint venture (Note 10) – 762,926 762,926 – 705,477 705,477 Property and equipment - gross (Note 11) – 7,958,241 7,958,241 – 7,788,815 7,788,815 Investment properties - gross (Note 12) – 4,115,392 4,115,392 – 4,194,193 4,194,193 Deferred tax assets (Note 27) – 576,787 576,787 – 2,091,141 2,091,141 Intangible assets and goodwill - gross (Note 13) – 474,842 474,842 – 569,280 569,280 Other assets - gross** (Note 14) 311,525 736,697 1,048,222 313,196 1,341,318 1,654,514 311,525 14,624,885 14,936,410 313,196 16,690,224 17,003,420 (Forward)
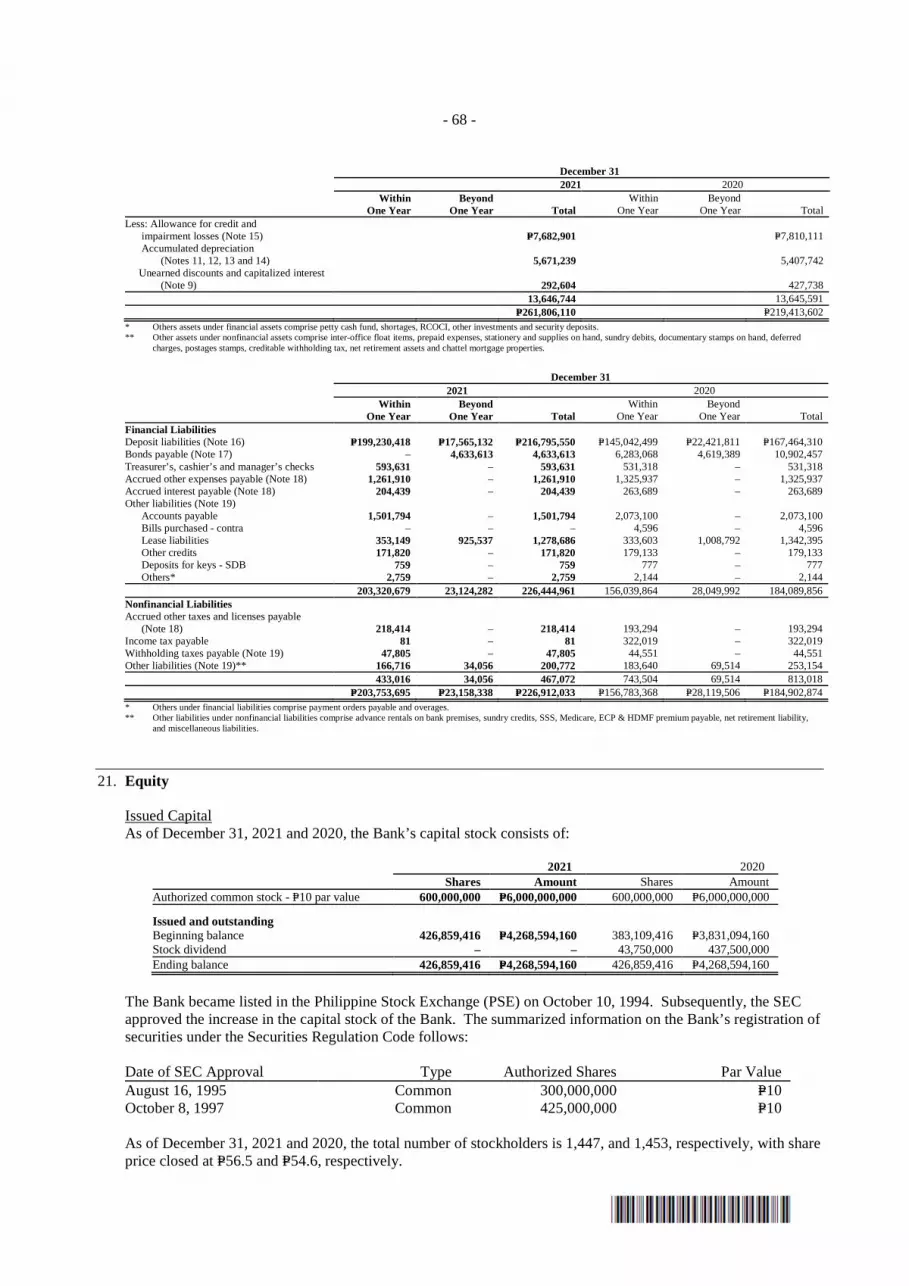
- 68 -
December 31 2021 2020
Within
One Year Beyond
One Year Total Within
One Year Beyond
One Year Total Less: Allowance for credit and
impairment losses (Note 15) P=7,682,901 P=7,810,111 Accumulated depreciation
(Notes 11, 12, 13 and 14) 5,671,239 5,407,742 Unearned discounts and capitalized interest
(Note 9) 292,604 427,738 13,646,744 13,645,591 P=261,806,110 P=219,413,602 * Others assets under financial assets comprise petty cash fund, shortages, RCOCI, other investments and security deposits. ** Other assets under nonfinancial assets comprise inter-office float items, prepaid expenses, stationery and supplies on hand, sundry debits, documentary stamps on hand, deferred
charges, postages stamps, creditable withholding tax, net retirement assets and chattel mortgage properties.
December 31 2021 2020
Within
One Year Beyond
One Year Total Within
One Year Beyond
One Year Total Financial Liabilities Deposit liabilities (Note 16) P=199,230,418 P=17,565,132 P=216,795,550 P=145,042,499 P=22,421,811 P=167,464,310 Bonds payable (Note 17) – 4,633,613 4,633,613 6,283,068 4,619,389 10,902,457 Treasurer’s, cashier’s and manager’s checks 593,631 – 593,631 531,318 – 531,318 Accrued other expenses payable (Note 18) 1,261,910 – 1,261,910 1,325,937 – 1,325,937 Accrued interest payable (Note 18) 204,439 – 204,439 263,689 – 263,689 Other liabilities (Note 19) Accounts payable 1,501,794 – 1,501,794 2,073,100 – 2,073,100 Bills purchased - contra – – – 4,596 – 4,596 Lease liabilities 353,149 925,537 1,278,686 333,603 1,008,792 1,342,395 Other credits 171,820 – 171,820 179,133 – 179,133 Deposits for keys - SDB 759 – 759 777 – 777 Others* 2,759 – 2,759 2,144 – 2,144 203,320,679 23,124,282 226,444,961 156,039,864 28,049,992 184,089,856 Nonfinancial Liabilities Accrued other taxes and licenses payable
(Note 18) 218,414 – 218,414 193,294 – 193,294 Income tax payable 81 – 81 322,019 – 322,019 Withholding taxes payable (Note 19) 47,805 – 47,805 44,551 – 44,551 Other liabilities (Note 19)** 166,716 34,056 200,772 183,640 69,514 253,154 433,016 34,056 467,072 743,504 69,514 813,018 P=203,753,695 P=23,158,338 P=226,912,033 P=156,783,368 P=28,119,506 P=184,902,874 * Others under financial liabilities comprise payment orders payable and overages. ** Other liabilities under nonfinancial liabilities comprise advance rentals on bank premises, sundry credits, SSS, Medicare, ECP & HDMF premium payable, net retirement liability,
and miscellaneous liabilities.
21. Equity
Issued Capital As of December 31, 2021 and 2020, the Bank’s capital stock consists of:
2021 2020 Shares Amount Shares Amount Authorized common stock - P=10 par value 600,000,000 P=6,000,000,000 600,000,000 P=6,000,000,000
Issued and outstanding Beginning balance 426,859,416 P=4,268,594,160 383,109,416 P=3,831,094,160 Stock dividend – – 43,750,000 437,500,000 Ending balance 426,859,416 P=4,268,594,160 426,859,416 P=4,268,594,160
The Bank became listed in the Philippine Stock Exchange (PSE) on October 10, 1994. Subsequently, the SEC approved the increase in the capital stock of the Bank. The summarized information on the Bank’s registration of securities under the Securities Regulation Code follows:
Date of SEC Approval Type Authorized Shares Par Value August 16, 1995 Common 300,000,000 P=10 October 8, 1997 Common 425,000,000 P=10
As of December 31, 2021 and 2020, the total number of stockholders is 1,447, and 1,453, respectively, with share price closed at P=56.5 and P=54.6, respectively.
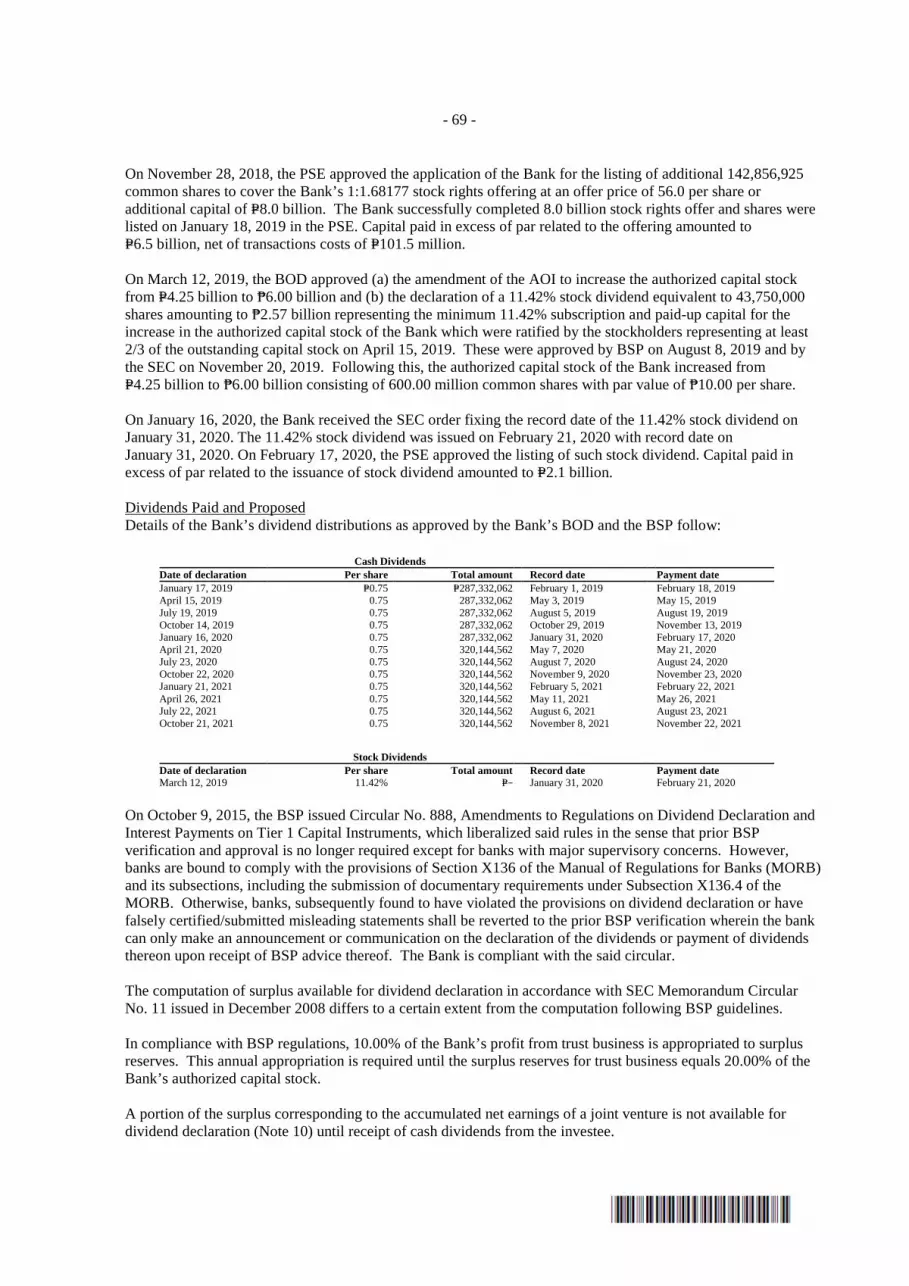
- 69 -
On November 28, 2018, the PSE approved the application of the Bank for the listing of additional 142,856,925 common shares to cover the Bank’s 1:1.68177 stock rights offering at an offer price of 56.0 per share or additional capital of P=8.0 billion. The Bank successfully completed 8.0 billion stock rights offer and shares were listed on January 18, 2019 in the PSE. Capital paid in excess of par related to the offering amounted to P=6.5 billion, net of transactions costs of P=101.5 million. On March 12, 2019, the BOD approved (a) the amendment of the AOI to increase the authorized capital stock from P=4.25 billion to ₱6.00 billion and (b) the declaration of a 11.42% stock dividend equivalent to 43,750,000 shares amounting to ₱2.57 billion representing the minimum 11.42% subscription and paid-up capital for the increase in the authorized capital stock of the Bank which were ratified by the stockholders representing at least 2/3 of the outstanding capital stock on April 15, 2019. These were approved by BSP on August 8, 2019 and by the SEC on November 20, 2019. Following this, the authorized capital stock of the Bank increased from P=4.25 billion to ₱6.00 billion consisting of 600.00 million common shares with par value of ₱10.00 per share. On January 16, 2020, the Bank received the SEC order fixing the record date of the 11.42% stock dividend on January 31, 2020. The 11.42% stock dividend was issued on February 21, 2020 with record date on January 31, 2020. On February 17, 2020, the PSE approved the listing of such stock dividend. Capital paid in excess of par related to the issuance of stock dividend amounted to P=2.1 billion.
Dividends Paid and Proposed Details of the Bank’s dividend distributions as approved by the Bank’s BOD and the BSP follow:
Cash Dividends Date of declaration Per share Total amount Record date Payment date January 17, 2019 P=0.75 P=287,332,062 February 1, 2019 February 18, 2019 April 15, 2019 0.75 287,332,062 May 3, 2019 May 15, 2019 July 19, 2019 0.75 287,332,062 August 5, 2019 August 19, 2019 October 14, 2019 0.75 287,332,062 October 29, 2019 November 13, 2019 January 16, 2020 0.75 287,332,062 January 31, 2020 February 17, 2020 April 21, 2020 0.75 320,144,562 May 7, 2020 May 21, 2020 July 23, 2020 0.75 320,144,562 August 7, 2020 August 24, 2020 October 22, 2020 0.75 320,144,562 November 9, 2020 November 23, 2020 January 21, 2021 0.75 320,144,562 February 5, 2021 February 22, 2021 April 26, 2021 0.75 320,144,562 May 11, 2021 May 26, 2021 July 22, 2021 0.75 320,144,562 August 6, 2021 August 23, 2021 October 21, 2021 0.75 320,144,562 November 8, 2021 November 22, 2021
Stock Dividends Date of declaration Per share Total amount Record date Payment date March 12, 2019 11.42% P=− January 31, 2020 February 21, 2020
On October 9, 2015, the BSP issued Circular No. 888, Amendments to Regulations on Dividend Declaration and Interest Payments on Tier 1 Capital Instruments, which liberalized said rules in the sense that prior BSP verification and approval is no longer required except for banks with major supervisory concerns. However, banks are bound to comply with the provisions of Section X136 of the Manual of Regulations for Banks (MORB) and its subsections, including the submission of documentary requirements under Subsection X136.4 of the MORB. Otherwise, banks, subsequently found to have violated the provisions on dividend declaration or have falsely certified/submitted misleading statements shall be reverted to the prior BSP verification wherein the bank can only make an announcement or communication on the declaration of the dividends or payment of dividends thereon upon receipt of BSP advice thereof. The Bank is compliant with the said circular.
The computation of surplus available for dividend declaration in accordance with SEC Memorandum Circular No. 11 issued in December 2008 differs to a certain extent from the computation following BSP guidelines.
In compliance with BSP regulations, 10.00% of the Bank’s profit from trust business is appropriated to surplus reserves. This annual appropriation is required until the surplus reserves for trust business equals 20.00% of the Bank’s authorized capital stock. A portion of the surplus corresponding to the accumulated net earnings of a joint venture is not available for dividend declaration (Note 10) until receipt of cash dividends from the investee.
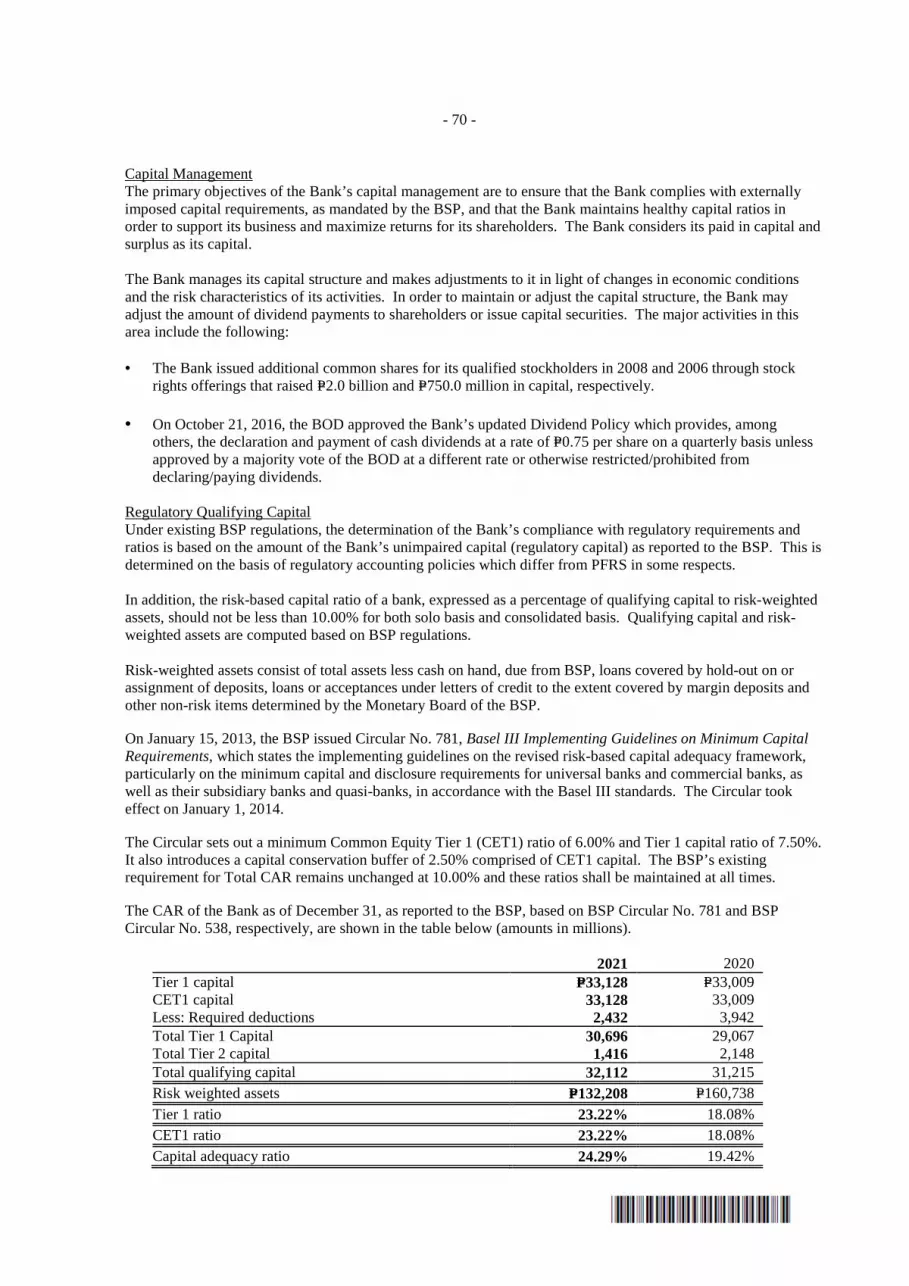
- 70 -
Capital Management The primary objectives of the Bank’s capital management are to ensure that the Bank complies with externally imposed capital requirements, as mandated by the BSP, and that the Bank maintains healthy capital ratios in order to support its business and maximize returns for its shareholders. The Bank considers its paid in capital and surplus as its capital.
The Bank manages its capital structure and makes adjustments to it in light of changes in economic conditions and the risk characteristics of its activities. In order to maintain or adjust the capital structure, the Bank may adjust the amount of dividend payments to shareholders or issue capital securities. The major activities in this area include the following:
• The Bank issued additional common shares for its qualified stockholders in 2008 and 2006 through stock
rights offerings that raised P=2.0 billion and P=750.0 million in capital, respectively.
• On October 21, 2016, the BOD approved the Bank’s updated Dividend Policy which provides, among others, the declaration and payment of cash dividends at a rate of P=0.75 per share on a quarterly basis unless approved by a majority vote of the BOD at a different rate or otherwise restricted/prohibited from declaring/paying dividends.
Regulatory Qualifying Capital Under existing BSP regulations, the determination of the Bank’s compliance with regulatory requirements and ratios is based on the amount of the Bank’s unimpaired capital (regulatory capital) as reported to the BSP. This is determined on the basis of regulatory accounting policies which differ from PFRS in some respects.
In addition, the risk-based capital ratio of a bank, expressed as a percentage of qualifying capital to risk-weighted assets, should not be less than 10.00% for both solo basis and consolidated basis. Qualifying capital and risk-weighted assets are computed based on BSP regulations.
Risk-weighted assets consist of total assets less cash on hand, due from BSP, loans covered by hold-out on or assignment of deposits, loans or acceptances under letters of credit to the extent covered by margin deposits and other non-risk items determined by the Monetary Board of the BSP.
On January 15, 2013, the BSP issued Circular No. 781, Basel III Implementing Guidelines on Minimum Capital Requirements, which states the implementing guidelines on the revised risk-based capital adequacy framework, particularly on the minimum capital and disclosure requirements for universal banks and commercial banks, as well as their subsidiary banks and quasi-banks, in accordance with the Basel III standards. The Circular took effect on January 1, 2014.
The Circular sets out a minimum Common Equity Tier 1 (CET1) ratio of 6.00% and Tier 1 capital ratio of 7.50%. It also introduces a capital conservation buffer of 2.50% comprised of CET1 capital. The BSP’s existing requirement for Total CAR remains unchanged at 10.00% and these ratios shall be maintained at all times.
The CAR of the Bank as of December 31, as reported to the BSP, based on BSP Circular No. 781 and BSP Circular No. 538, respectively, are shown in the table below (amounts in millions).
2021 2020 Tier 1 capital P=33,128 P=33,009 CET1 capital 33,128 33,009 Less: Required deductions 2,432 3,942 Total Tier 1 Capital 30,696 29,067 Total Tier 2 capital 1,416 2,148 Total qualifying capital 32,112 31,215 Risk weighted assets P=132,208 P=160,738 Tier 1 ratio 23.22% 18.08% CET1 ratio 23.22% 18.08% Capital adequacy ratio 24.29% 19.42%
- 71 -
Regulatory qualifying capital consists of Tier 1 (going concern) capital, which comprises capital stock, surplus, surplus reserves, net unrealized gains on FVOCI securities, cumulative foreign currency translation and remeasurements of net defined benefit asset. Certain adjustments are made to PFRS-based results and reserves, as prescribed by the BSP. The other component of regulatory capital is Tier 2 (gone-concern) capital, which is comprised of the Bank’s general loan loss provision and unsecured subordinated debt (refer to Note 17). Certain items are deducted from the regulatory Gross Qualifying Capital, such as but not limited to, outstanding unsecured credit accommodations, both direct and indirect, to DOSRI, and unsecured loans, other credit accommodations, and guarantees granted to subsidiaries and affiliates (net of specific provisions), deferred tax assets, goodwill, other intangible assets and significant minority investments in a joint venture.
Risk-weighted assets are determined by assigning defined risk weights to amounts of on-balance sheet exposures and to the credit equivalent amounts of off-balance sheet exposures.
As of December 31, 2021 and 2020, the Bank has complied with the requirements of BSP Circular No. 781 and BSP Circular No. 538.
On October 29, 2014, the BSP issued Circular No. 856 which covers the implementing guidelines on the framework for dealing with domestic systemically important banks (DSIBs) in accordance with the Basel III standards. Banks identified as DSIBs shall be required to have higher loss absorbency, on top of the minimum CET1 capital and capital conservation buffer. Compliance with this requirement was phased-in starting January 1, 2017, with full compliance on January 1, 2019. On September 27, 2019, the BSP issued Circular No. 1051 which covers the enhancements in the assessment methodology of D-SIBs. The Bank has complied with this requirement. The issuance of BSP Circular No. 639 covering the Internal Capital Adequacy Assessment Process (ICAAP) in 2009 supplements the BSP’s risk-based capital adequacy framework under BSP Circular No. 538. In compliance with this new circular, the Metrobank Group has adopted and developed its ICAAP framework to ensure that appropriate level and quality of capital are maintained by the Group. Under this framework, the assessment of risks extends beyond the Pillar 1 set of credit, market and operational risks and onto other risks deemed material by the Group. The level and structure of capital are assessed and determined in light of the Group’s business environment, plans, performance, risks and budget, as well as regulatory directives. The Bank follows the Group’s ICAAP framework and submits the result of its assessment to the Parent Company. Per BSP Circular No. 869, effective January 31, 2015, submission of an ICAAP document is required by BSP every March 31 of each year. The Bank has complied with this requirement.
The Bank has taken into consideration the impact of the foregoing requirements to ensure that the appropriate level and quality of capital are maintained on an ongoing basis.
BASEL III Leverage Ratio (BLR) On June 9, 2015, the BSP issued Circular No. 881 covering the implementing guidelines on the Basel III Leverage Ratio Framework which is designed to act as a supplementary measure to the risk-based capital requirements and shall not be less than 5.0 percent. The monitoring period has been set every quarter starting December 31, 2014 and extended until June 30, 2018 under BSP Circular No. 990 issued on January 22, 2018. Effective July 1, 2018, the monitoring of the leverage ratio was implemented as a Pillar I minimum requirement.
The Basel III Leverage Ratio is designed to act as a supplementary measure to the risk-based capital requirements. The Basel III Leverage Ratio is defined as the capital measure (the numerator) divided by the exposure measure (the denominator), with this ratio expressed as percentage. Capital measure is the Tier 1 capital. Exposure measure is the sum of on-balance sheet exposures, derivative exposures, security financing exposures and off-balance sheet items. The leverage ratio shall not be less than 5.0 percent computed on both solo (head office plus branches) and consolidated bases (including subsidiary financial allied undertakings but excluding insurance companies).
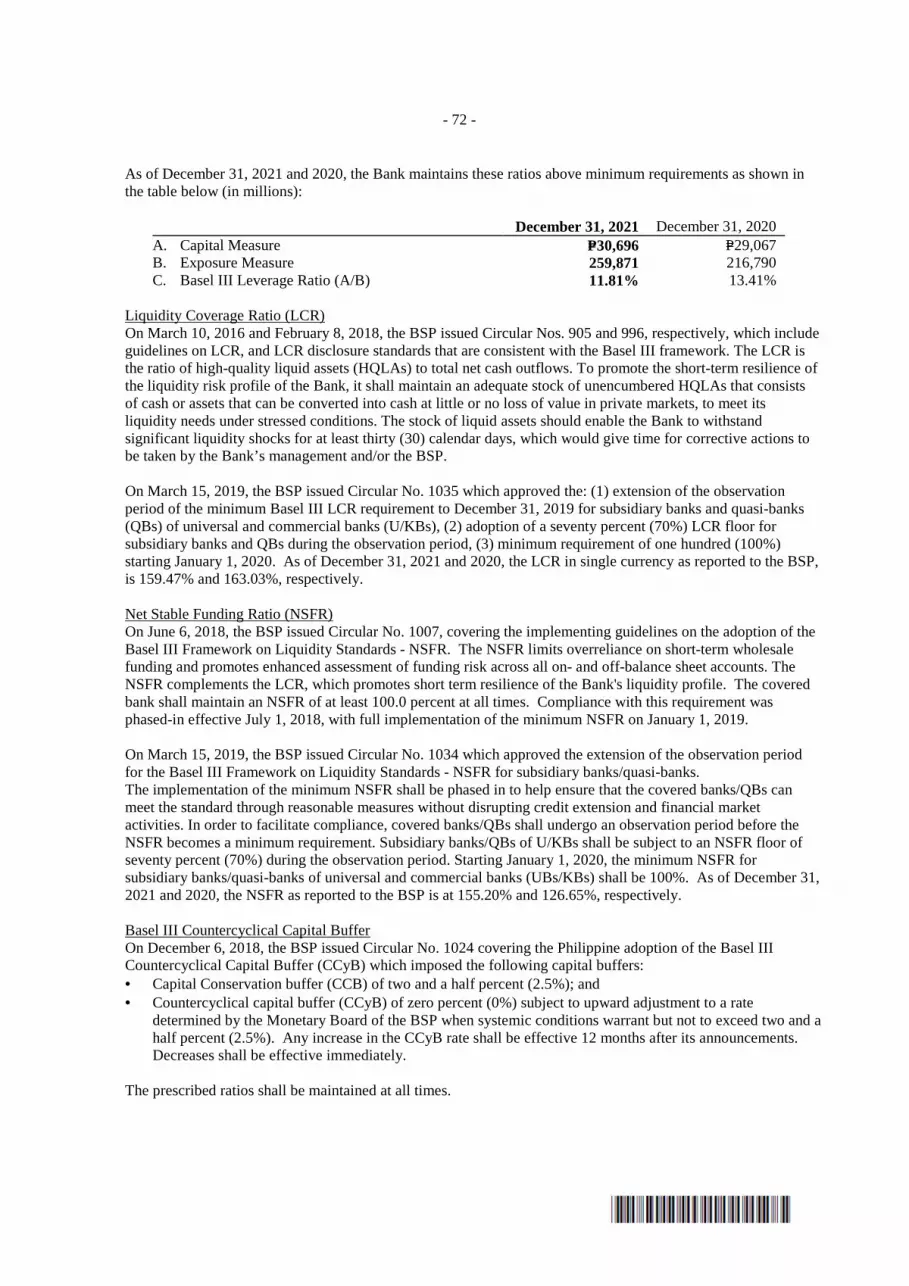
- 72 -
As of December 31, 2021 and 2020, the Bank maintains these ratios above minimum requirements as shown in the table below (in millions):
December 31, 2021 December 31, 2020 A. Capital Measure P=30,696 P=29,067 B. Exposure Measure 259,871 216,790 C. Basel III Leverage Ratio (A/B) 11.81% 13.41%
Liquidity Coverage Ratio (LCR) On March 10, 2016 and February 8, 2018, the BSP issued Circular Nos. 905 and 996, respectively, which include guidelines on LCR, and LCR disclosure standards that are consistent with the Basel III framework. The LCR is the ratio of high-quality liquid assets (HQLAs) to total net cash outflows. To promote the short-term resilience of the liquidity risk profile of the Bank, it shall maintain an adequate stock of unencumbered HQLAs that consists of cash or assets that can be converted into cash at little or no loss of value in private markets, to meet its liquidity needs under stressed conditions. The stock of liquid assets should enable the Bank to withstand significant liquidity shocks for at least thirty (30) calendar days, which would give time for corrective actions to be taken by the Bank’s management and/or the BSP.
On March 15, 2019, the BSP issued Circular No. 1035 which approved the: (1) extension of the observation period of the minimum Basel III LCR requirement to December 31, 2019 for subsidiary banks and quasi-banks (QBs) of universal and commercial banks (U/KBs), (2) adoption of a seventy percent (70%) LCR floor for subsidiary banks and QBs during the observation period, (3) minimum requirement of one hundred (100%) starting January 1, 2020. As of December 31, 2021 and 2020, the LCR in single currency as reported to the BSP, is 159.47% and 163.03%, respectively.
Net Stable Funding Ratio (NSFR) On June 6, 2018, the BSP issued Circular No. 1007, covering the implementing guidelines on the adoption of the Basel III Framework on Liquidity Standards - NSFR. The NSFR limits overreliance on short-term wholesale funding and promotes enhanced assessment of funding risk across all on- and off-balance sheet accounts. The NSFR complements the LCR, which promotes short term resilience of the Bank's liquidity profile. The covered bank shall maintain an NSFR of at least 100.0 percent at all times. Compliance with this requirement was phased-in effective July 1, 2018, with full implementation of the minimum NSFR on January 1, 2019.
On March 15, 2019, the BSP issued Circular No. 1034 which approved the extension of the observation period for the Basel III Framework on Liquidity Standards - NSFR for subsidiary banks/quasi-banks. The implementation of the minimum NSFR shall be phased in to help ensure that the covered banks/QBs can meet the standard through reasonable measures without disrupting credit extension and financial market activities. In order to facilitate compliance, covered banks/QBs shall undergo an observation period before the NSFR becomes a minimum requirement. Subsidiary banks/QBs of U/KBs shall be subject to an NSFR floor of seventy percent (70%) during the observation period. Starting January 1, 2020, the minimum NSFR for subsidiary banks/quasi-banks of universal and commercial banks (UBs/KBs) shall be 100%. As of December 31, 2021 and 2020, the NSFR as reported to the BSP is at 155.20% and 126.65%, respectively.
Basel III Countercyclical Capital Buffer On December 6, 2018, the BSP issued Circular No. 1024 covering the Philippine adoption of the Basel III Countercyclical Capital Buffer (CCyB) which imposed the following capital buffers: • Capital Conservation buffer (CCB) of two and a half percent (2.5%); and • Countercyclical capital buffer (CCyB) of zero percent (0%) subject to upward adjustment to a rate
determined by the Monetary Board of the BSP when systemic conditions warrant but not to exceed two and a half percent (2.5%). Any increase in the CCyB rate shall be effective 12 months after its announcements. Decreases shall be effective immediately.
The prescribed ratios shall be maintained at all times.

- 73 -
22. Net Service Fees and Commission Income
This account consists of:
2021 2020 2019 Service Fees and Commission Income Credit-related fees and commissions P=1,056,749,812 P=890,934,914 P=1,383,966,509 Deposit-related and other fees received
(Note 29) 478,174,952 374,192,384 531,415,495 Trust fees 46,202,084 43,083,232 36,559,669 1,581,126,848 1,308,210,530 1,951,941,673 Service Fees and Commission Expense Commissions 42,225,973 41,856,120 84,651,434 Brokerage 5,590,759 8,969,685 3,785,862 47,816,732 50,825,805 88,437,296 Net Service Fees and Commission
Income P=1,533,310,116 P=1,257,384,725 P=1,863,504,377
23. Miscellaneous Income
This account consists of:
2021 2020 2019 Recovery of charged-off assets P=360,147,032 P=234,282,740 P=305,034,325 Insurance commission income 110,057,949 105,684,417 146,397,446 Rental income (Notes 12, 25 and 29) 43,767,739 46,711,545 38,164,311 Others (Notes 9 and 29) 186,458,085 (371,212,674) 65,301,808 P=700,430,805 P=15,466,028 P=554,897,890
Rental income arises from the lease of properties and safety deposit boxes of the Bank. Other miscellaneous income includes renewal fees, checkbook charges, break funding cost and other miscellaneous income. In 2020, the Bank recorded modification loss amounting to P=508.8 million (Note 9). Subsequent accretion of modified loans amounted to P=134.6 million and P=82.2 million in 2021 and 2020, respectively (Note 9).
24. Retirement Benefits
The Bank has a funded, noncontributory defined benefit plan covering substantially all of its employees. The benefits are based on years of service and final compensation.
The plan administered by the Retirement Committee is composed of five (5) members appointed by the BOD of the Bank. The Retirement Committee has all the powers necessary or useful in the discharge of its duties of administration including, but not limited to determining the rights of Members under the Plan. The Retirement Committee may adopt such rules and regulations as it deems necessary and desirable, including those governing the establishment of procedures, the use of necessary forms, and the setting up of minimum periods where notice is required. The Retirement Committee may seek advice of counsel, and may appoint an independent accountant to audit the Plan and actuary to value the plan periodically, whose professional fees and expenses may be charged to the Fund. Under the existing regulatory framework, RA No. 7641, Retirement Pay Law, requires a provision for retirement pay to qualified private sector employees in the absence of any retirement plan in the entity, provided however that the employee’s retirement benefits under any collective bargaining and other agreements shall not be less than those provided under the law. The law does not require minimum funding of the plan. The date of the latest actuarial valuation is December 31, 2021.

- 74 -
The amounts of pension expense included in ‘Compensation and fringe benefits’ in the statements of income follow:
2021 2020 Current service cost P=245,929,229 P=280,603,012 Net interest cost (3,529,229) 13,286,975 P=242,400,000 P=293,889,987

- 75 -
The net retirement liability/retirement asset shown under ‘Other liabilities’/‘Other assets’ recognized in the Bank’s statements of condition follows (in thousands): 2021 Remeasurements in other comprehensive income
Net benefit cost
Return on plan assets (excluding
amount
Actuarial changes
arising from
Actuarial changes arising
from changes
Actuarial changes arising
from changes
January 1,
2021 Current
service cost Net
Interest Subtotal Benefits
paid included in
net interest) experience
adjustments in demographic
assumptions in financial
assumptions Subtotal Contribution by employer
December 31, 2021
Present value of defined benefit obligation P=3,256,193 P=245,929 P=110,804 P=356,733 (P=222,891) P=− P=99,684 P=− (P=376,666) (P=276,982) P=− P=3,113,053 Fair value of plan assets (3,207,170) − (114,333) (114,333) 222,891 83,346 − − − 83,346 (339,627) (3,354,893) Net retirement asset (Note 14) P=49,023 P=245,929 (P=3,529) P=242,400 P=− P=83,346 P=99,684 P=− (P=376,666) (P=193,636) (P=339,627) (P=241,840)
2020 Remeasurements in other comprehensive income
Net benefit cost
Return on plan assets (excluding
amount
Actuarial changes
arising from
Actuarial changes arising
from changes
Actuarial changes arising
from changes
January 1,
2020 Current
service cost Net
Interest Subtotal Benefits
paid included in
net interest) experience
adjustments in demographic
assumptions in financial
assumptions Subtotal Contribution by employer
December 31, 2020
Present value of defined benefit obligation P=3,340,316 P=280,603 P=155,046 P=435,649 (P=250,970) P=− (P=16,668) (P=88,011) (P=164,123) (P=268,802) P=− P=3,256,193 Fair value of plan assets (2,899,921) − (141,759) (141,759) P=250,970 (33,650) − − − (33,650) (382,810) (3,207,170) Net defined benefit liability (Note 19) P=440,395 P=280,603 P=13,287 P=293,890 P=− (P=33,650) (P=16,668) (P=88,011) (P=164,123) (P=302,452) (P=382,810) P=49,023
The maximum economic benefit available is a combination of expected refunds from the plan and reductions in future contributions. The Bank expects to contribute P=296.9 million to its noncontributory defined benefit plan in 2022.
- 76 -
The fair values of plan assets by each class as at the statements of condition date are as follows:
2021 2020 Investment in debt securities Government P=2,109,275,578 P=1,775,616,337 Private 1,017,480,730 1,218,154,420 Cash and cash equivalents Special deposit account 90,778,999 99,961,991 Unit Investment Trust Fund (UITF) 31,988,986 41,115,121 Investment in equity securities 90,298,224 68,516,666 Other assets 17,982,070 19,660,317 3,357,804,587 3,223,024,852 Expected withdrawals − 116,000,000 Expected contributions − (95,000,000) Expected earnings − (7,845,880) Other liabilities 2,911,307 2,700,780 2,911,307 15,854,900 P=3,354,893,280 P=3,207,169,952
The person exercising voting right for the foregoing equity instruments is currently a senior officer of the Bank.
The principal actuarial assumptions used in determining retirement liability as of December 31, 2021 and 2020 are shown below:
2021 2020 Discount rate 4.94% 3.56% Turnover rate 3.63%, 10.23% 3.63%, 10.23% Future salary increases 4.00% 4.00%
The sensitivity analysis below has been determined based on reasonably possible changes of each significant assumption on the defined benefit obligation as of the end of the reporting period, assuming all other assumptions were held constant:
December 31, 2021 December 31, 2020
Possible
Fluctuations Increase
(decrease) Possible
Fluctuations Increase
(decrease) Discount rate +1.00% (P=232,863,612) +1.00% (P=261,736,483) -1.00% 264,882,836 -1.00% 300,216,712 Turnover rate +1.00% (18,670,181) +1.00% (54,172,532) -1.00% 11,210,010 -1.00% 61,612,552 Future salary increase rate +1.00% 280,263,812 +1.00% 311,960,997 -1.00% (250,308,015) -1.00% (276,760,337)
The Retirement Committee ensures that there will be sufficient assets to pay pension benefits as they fall due and maintains the plan on an actuarially sound basis considering the benefits to members.
- 77 -
Shown below is the maturity analysis of the undiscounted benefit payments:
2021 2020 Less than one year P=251,146,266 P=260,001,350 One to less than five years 1,239,251,226 1,079,325,185 Five to less than 10 years 1,893,401,838 1,820,446,053 10 to less than 15 years 2,081,717,773 1,956,019,106 15 to less than 20 years 2,075,368,475 2,025,400,932 20 years and above 1,361,034,053 1,443,347,516
The average duration of the expected benefit payments at the statement of condition date is 12.12 years.
25. Leases
The Bank leases the premises occupied by its branches for periods ranging from 1 to 30 years renewable under certain terms and conditions. Various lease contracts include escalation clauses, most of which bear an annual rent increase of 10.00%.
As of December 31, 2021 and 2020, the carrying amounts of lease liabilities (included in ‘Other Liabilities’ in Note 19) are as follows:
2021 2020 Balance at beginning of year P=1,342,394,905 P=1,467,103,825 Additions 330,419,191 243,849,256 Expiry/termination − (12,924,409) Accretion of interest 85,201,992 99,539,323 Payments (479,330,246) (455,173,090) P=1,278,685,842 P=1,342,394,905
The Bank recognized interest expense on lease liabilities (included in ‘Interest expense’ in the statements of income) amounting to P=85.2 million, P=99.5 million and P=113.6 in 2021, 2020 and 2019, respectively, rent expense from short-term leases and leases of low-value assets amounting (included in ‘Occupancy and equipment-related costs’ in the statements of income) to P=130.9 million in 2021, P=140.7 million in 2020 and P=94.1 million in 2019.
Future minimum rentals payable under non-cancelable operating leases are as follows:
2021 2020 Within one year P=419,166,727 P=468,112,062 After one year but not more than five years 852,888,078 1,053,338,985 More than five years 205,507,135 238,684,657 P=1,477,561,940 P=1,760,135,704
The Bank has also entered into commercial property leases on its surplus office space. These non-cancelable leases have remaining non-cancelable lease terms between 1 and 5 years. As of December 31, 2021 and 2020, there is no contingent rental income. Rental income of the Bank related to these property leases amounting to P=42.4 million, P=45.5 million, and P=37.5 million in 2021, 2020 and 2019, respectively are shown under ‘Miscellaneous income’ in the statements of income (Notes 12 and 23). Future minimum rentals receivable under non-cancelable operating leases are as follows:
2021 2020 Within one year P=34,081,506 P=42,408,437 After one year but not more than five years 32,440,728 70,692,447 P=66,522,234 P=113,100,884

- 78 -
26. Miscellaneous Expenses
This account consists of:
2021 2020 2019 Insurance (Note 29) P=550,608,756 P=498,092,209 P=526,287,475 Litigation 442,289,577 364,647,454 282,384,260 Information technology (Note 29) 375,290,002 362,765,811 425,215,165 Communications 167,554,452 143,024,129 177,856,164 Fines, penalties and other charges 150,222,885 188,886,091 128,331,742 Repairs and maintenance (Note 12) 110,147,726 117,546,466 110,547,531 Supervision and examination fees 75,845,625 79,409,221 77,018,742 Transportation and traveling 50,559,908 127,736,459 94,905,835 Stationery and supplies 46,355,039 98,511,725 48,873,458 Management and professional fees 23,048,029 18,899,050 24,116,130 Advertising 11,076,666 50,064,780 69,277,788 Donations and charitable contributions 6,812,000 11,465,500 11,477,405 Banking activities expenses 4,642,771 4,670,840 8,038,978 Membership fees and dues 3,827,410 4,380,400 2,983,128 Training and seminars 2,449,846 1,973,526 8,452,923 Others 61,472,300 12,746,651 27,424,558 P=2,082,202,992 P=2,084,820,312 P=2,023,191,282
Insurance expense includes premiums paid to the Philippine Deposit Insurance Corporation (PDIC) amounting to P=412.9 million, P=345.7 million, and P=361.1 million in 2021, 2020 and 2019, respectively.
Other expenses include entertainment, amusement and recreation (EAR), rewards and incentives, meeting allowance, sponsorship expenses, home free loan expenses, appraisal fees and notarial fees. These also include payments to union members amounting to P=10.1 million, P=10.6 million and P=11.1 million in 2021, 2020 and 2019, respectively, for the successful completion of the collective bargaining agreement.
27. Income and Other Taxes
Under Philippine tax laws, the Bank is subject to percentage and other taxes (presented as ‘Taxes and licenses’ in the statements of income) as well as income taxes. Percentage and other taxes paid consist principally of gross receipts tax (GRT) and documentary stamp tax (DST). Income taxes include corporate income tax, further discussed below, and final taxes paid at the rate of 20.00%, which is a final withholding tax on gross interest income from government securities and other deposit substitutes. On March 26, 2021, RA No. 11534, otherwise known as Corporate Recovery and Tax Incentives for Enterprises (CREATE) Act was signed into law. CREATE reduced the RCIT rate from 30.00% to 25.00% depending on the criteria set by the law effective July 1, 2020. With the implementation of this Act, interest expense allowed as a deductible expense shall be reduced by 20.00% of the interest income subjected to final tax, compared to the 33.00% reduction prior to the Act.
The regulations also provide for MCIT of 2.00% (prior to CREATE) and 1.00% from (July 1, 2020 to June 30, 2023 before reverting to 2.00%) on modified gross income and allow a NOLCO. The MCIT and NOLCO may be applied against the Bank’s income tax liability and taxable income, respectively, over a three-year period from the year of inception. For the taxable years 2020 and 2021, the NOLCO incurred can be carried over as a deduction for the next five (5) consecutive taxable years, pursuant to Revenue Regulation (RR) No. 25-2020. Based on the provisions of RR No. 5-2021 dated April 8, 2021 issued by the BIR, the transitory RCIT and MCIT rates of the Bank for the taxable year 2020 are 27.50% and 1.50%, respectively. The reduced amounts were reflected in the Bank’s 2020 annual income tax returns filed in 2021. However, for financial reporting purposes, the changes were only recognized in the 2021 financial statements.
- 79 -
The deferred tax assets and liabilities as of December 31, 2020 were also remeasured using the lower RCIT rate of 25.00%. These reductions were recognized in the 2021 financial statements. Starting July 1, 2008, the Optional Standard Deduction (OSD) equivalent to 40.00% of gross income may be claimed as an alternative deduction in computing for the RCIT. The Bank elected to claim itemized expense deductions instead of the OSD in computing for the RCIT in 2021 and 2020. Current tax regulations also provide for the ceiling on the amount of EAR expense that can be claimed as a deduction against taxable income. Under the regulations, EAR expense allowed as a deductible expense for a service company is limited to the actual EAR paid or incurred but not to exceed 1.00% of net revenue.
FCDU offshore income (income from non-residents) is tax-exempt while gross onshore income (income from residents) is subject to 10.00% income tax. In addition, interest income on deposit placements with other FCDUs and OBUs is taxed at 15.00% in 2021 and 2020. Under current tax regulations, the income derived by the FCDU from foreign currency transactions with non-residents, OBUs, local commercial banks, including branches of foreign banks, is tax-exempt while interest income on foreign currency loans from residents other than OBUs or other depository banks under the expanded system is subject to 10.00% income tax.
Provision for income tax consists of:
2021 2020 2019 Current: Final tax P=356,565,831 P=265,200,890 P=260,917,208 Current income tax (44,382,280) 501,075,819 153,911,132 312,183,551 766,276,709 414,828,340 Deferred 1,414,071,157 (783,739,604) 135,612,443 P=1,726,254,708 (P=17,462,895) P=550,440,783
Net deferred tax assets consist of the following tax effects:
2021 2020 Deferred tax assets on: Allowance for credit and impairment losses P=282,454,212 P=1,619,828,518 Retirement benefit obligation 210,961,827 311,244,998 Unamortized pension cost contribution 173,550,556 220,479,926 Difference between book base and tax base of
investment property 96,772,332 118,557,427 Loan modification 72,967,041 127,955,219 Leases 59,297,005 72,270,513 896,002,973 2,470,336,601 Deferred tax liabilities on: Net unrealized gain on investment properties (312,384,257) (365,019,153) Unrealized foreign exchange gains (5,496,046) (12,739,353) Others (1,336,151) (1,437,248) (319,216,454) (379,195,754) P=576,786,519 P=2,091,140,847
Income tax effect credited (debited) in OCI amounted to (P=48.4 million) (excluding impact of CREATE), (P=90.7 million) and P=200.3 million in 2021, 2020 and 2019, respectively.
- 80 -
As of December 31, 2021 and 2020, the Bank did not recognize deferred tax assets on the following temporary differences:
2021 2020 Allowance for credit and impairment losses P=6,672,477,479 P=2,519,191,017 Excess MCIT over RCIT 34,998,663 − P=6,707,476,142 P=2,519,191,017
The Bank believes that it is not reasonably probable that the tax benefits of these temporary differences will be realized in the future.
Details of the excess MCIT over RCIT credits of the Bank follow:
Amount Used/Expired Balance Expiry Year 2021 P=34,998,663 − P=34,998,663 2024
The reconciliation between the statutory income tax and effective income tax follows (in thousands):
2021 2020 2019 Statutory income tax P=816,437 P=327,225 P=1,073,634 Tax effect of:
Change in unrecognized DTA 1,073,320 427,676 (7,056) Tax-paid and tax-exempt income (425,082) (928,629) (630,511) Nondeductible expenses 161,201 225,399 215,415 Effect of change in tax rate 174,295 – – FCDU income (87,686) (78,916) (100,331) Others 13,770 9,782 (710)
Effective income tax P=1,726,255 (P=17,463) P=550,441
28. Earnings Per Share
The following table presents information used to calculate basic EPS:
2021 2020 2019 a. Net income P=1,539,492,720 P=1,108,212,278 P=3,028,337,640 b. Weighted average number of
common shares for basic earnings per share 426,859,416 426,859,416 420,124,743
c. Basic/Diluted EPS (a/b) P=3.61 P=2.60 P=7.21
As of December 31, 2021, 2020 and 2019, there were no potential common shares with dilutive effect on the basic EPS of the Bank.
29. Related Party Transactions
Parties are considered to be related if one party has the ability, directly or indirectly, to control the other party or exercise significant influence over the other party in making financial and operating decisions. The Bank’s related parties are as follows:
• Bank’s Directors, Officers, Stockholders and their Related Interests (DOSRI) as defined per BSP’s existing
DOSRI rules and regulations; • Close Family Members (i.e., 2nd degree relatives) of the Bank’s Directors, Officers with rank of SVP and
up, and Individual Substantial Stockholders;
- 81 -
• Bank’s Subsidiaries and Affiliates as defined per BSP’s existing rules and regulations on lending to subsidiaries and affiliates;
• Any party that the Bank exerts direct or indirect control over or that exerts direct or indirect control over the Bank;
• Subsidiaries, Affiliates and Special Purpose Entities (SPEs) of any party that the Bank exerts direct or indirect control over or that exerts direct or indirect control over the Bank;
• Corresponding Persons in Affiliated Companies as defined in the Bank's Related Party Transaction (RPT) Policy; and
• Any natural person or juridical entity whose interest may pose potential conflict with the Bank’s interest.
The Bank has several business relationships with related parties. The terms of the transactions with such parties are listed below on substantially the same terms, including interest and collateral, as those prevailing at the time for comparable transactions with other parties, and are usually settled in cash. These transactions also did not involve more than the nominal risk of collectability or present other unfavorable conditions.
Transactions with the Retirement Plan On December 20, 2012, the SEC issued Memorandum Circular No. 12 providing for guidelines on the disclosure of transactions with retirement benefit funds. Under said circular, a reporting entity shall disclose information about any transaction with a related party (retirement fund, in this case) and outstanding balances necessary for an understanding of the potential effect of the relationship on the financial statements.
Under PFRS, certain post-employment benefit plans are considered as related parties. The Bank has business relationships with its retirement plan pursuant to which it provides trust and management services to the said plan. The retirement plan of the employees of the Bank is being managed and maintained by the Trust Division of the Bank. The total fair value of the retirement fund as of December 31, 2021 and 2020 amounted to P=3.4 billion and P=3.2 billion, respectively. The details of the assets of the fund as of December 31, 2021 and 2020 are disclosed in Note 24.
The following table shows the amount of outstanding balances of related party transactions of the Bank with the retirement plan of the employees of the Bank as of December 31, 2021 and 2020: 2021 Elements of Transaction Related Party Nature of Transaction Statement of Condition Statement of Income Philippine Savings Bank Savings Deposit P=3,778,999 P=– Investment in Money Market Fund* 31,988,896 – Income from UITF** – 238,430 Interest income – 28,525 First Metro ETF Equity investment*** 26,310,294 – *Includes fair value gains of P=0.1 million **Includes fair value loss of P=0.04 million ***Includes fair value loss of P=0.35 million
2020 Elements of Transaction Related Party Nature of Transaction Statement of Condition Statement of Income Philippine Savings Bank Savings Deposit P=1,227,169 P=– Investment in Money Market Fund* 40,650,542 – Income from UITF** – 836,424 Interest income – 20,436 First Metro ETF Equity investment*** 26,237,412 – *Includes fair value gains of P=3.4 million **Includes fair value loss of P=0.06 million ***Includes fair value loss of P=0.43 million
Transactions relating to the Bank’s retirement plan are approved by its Retirement Committee. The voting right over the investments in the Bank’s capital stocks is exercised by a member of the Retirement Committee as approved by all members of the Retirement Committee, whom are senior officers of the Bank.
Remunerations of Directors and Other Key Management Personnel Key management personnel are those persons having authority and responsibility for planning, directing and controlling the activities of the Bank, directly or indirectly. The Bank considers the members of the

- 82 -
Management Committee to constitute key management personnel for purposes of PAS 24, Related Party Disclosures.
Total remunerations of key management personnel (covering assistant vice presidents and up) [included under ‘Compensation and fringe benefits’ in the statements of income are as follows:
2021 2020 Short-term employee benefits P=326,973,490 P=332,208,598 Post-employment pension benefits 4,845,307 14,480,487 P=331,818,797 P=346,689,085
Short-term employee benefits include salaries and other non-monetary benefits. Remunerations given to directors, as approved by the Board Remuneration Committee, amounted to P=22.1 million, P=21.9 million, and P=19.0 million in 2021, 2020, and 2019, respectively.
The Bank also provides banking services to directors and other key management personnel and persons connected to them.
Other Related Party Transactions Other related party transactions of the Bank by category of related party are presented below. The following tables show the amount and outstanding balances included in the financial statements (in thousands): December 31, 2021
Category Amount/ Volume
Outstanding Balance Nature, Terms and Conditions
Parent Company Due from other banks
(P=267,443) P=1,106,884 Short term peso and foreign-currency denominated deposits with fixed rates ranging from 0.00% to 5.00%
Financial assets at FVOCI – 59,718 Pledged for security of MBTC’s payroll account with the Bank. Accounts receivable (payable) 7,698 5,789 Outstanding ATM service fees, rental and utility receivables, non-
interest bearing; no impairment Miscellaneous assets 114 1,948 Security deposits on lease contracts Miscellaneous liabilities – 5,919 Advance payments of security deposits from various tenants Accrued other expense payable 21,819 90,403 Outstanding information technology expense payable, charges on
current and savings accounts processing Rental income 12,099 – Income from leasing agreements with various lease terms ranging
from 2 to 5 years Miscellaneous income 22,033 – Service income received from collection services Information technology expense 154,170 – Payment of information technology expenses Trading and security loss (3,242) – Loss from securities transactions Securities transactions Outright purchases 11,770,583 – Outright purchase of FVTPL, AC and FVOCI investments Outright sales (150,000) – Outright sale of FVTPL and FVOCI investments
Joint Venture
Investment in a joint venture 57,449 762,926 Outstanding balance of capital investment in SMFC; movements in outstanding balance pertain to share in net income and other comprehensive income less dividends received
Dividends from joint venture 11,580 – Dividends from SMFC Accounts receivable 688 905 Outstanding rental and utility receivables, non-interest bearing Deposit liabilities
(474,007) 14,000 Demand and short-term peso time deposits with annual fixed rates of 1.25%
Miscellaneous liabilities 7,861 7,861 Payment of security deposits Rental income 16,288 – Income from leasing agreements Miscellaneous income 6,882 – Utilities and rental charges Interest expense 66 – Interest on deposit liabilities
Other Related Parties (DOSRI/Indirect)
Receivable from customers – 1,155,312 Loans granted bear interest of ranging 3.0% to 10.50% with terms from 12 to 60 months (excluding key personnel) Placements 1,159,611 –
Maturities 1,176,688 – Miscellaneous assets 353 2,949 Three months advance security deposits Accounts receivable (4,908) 1,785 Outstanding ATM service fees, rental and utility receivables, non-
interest bearing Prepaid expense 5,455 12,228 Payment for various motor car vehicles, fire, money, security,
payroll and robbery insurance Deposit liabilities 7,044,834 7,959,885 Demand, savings and short-term peso and foreign currency time
deposits with fixed rates ranging from 0.00% to 2.00% Accrued other expense payable – 1,151 Outstanding group life insurance (Forward)
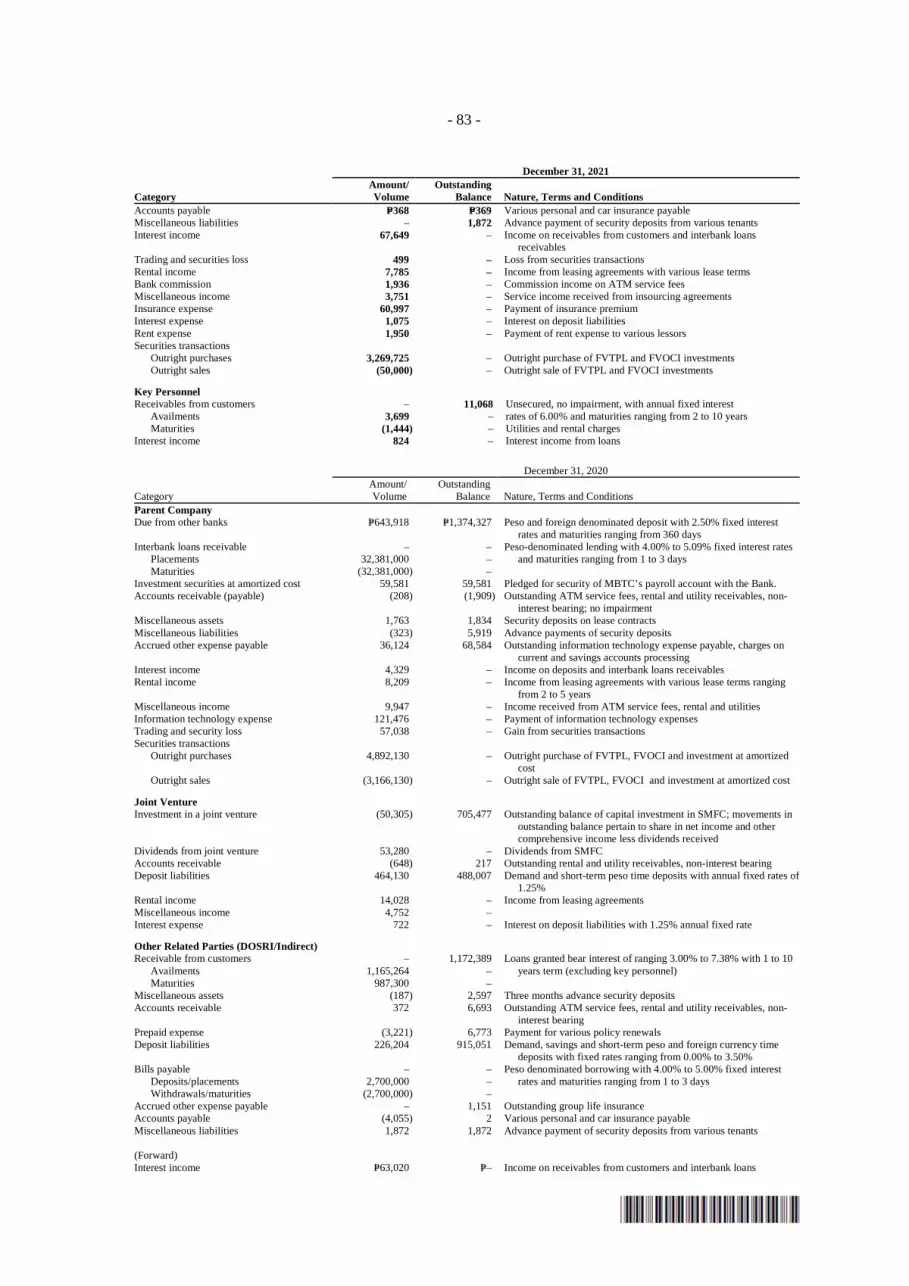
- 83 -
December 31, 2021
Category Amount/ Volume
Outstanding Balance Nature, Terms and Conditions
Accounts payable P=368 P=369 Various personal and car insurance payable Miscellaneous liabilities – 1,872 Advance payment of security deposits from various tenants Interest income 67,649 – Income on receivables from customers and interbank loans
receivables Trading and securities loss 499 – Loss from securities transactions Rental income 7,785 – Income from leasing agreements with various lease terms Bank commission 1,936 – Commission income on ATM service fees Miscellaneous income 3,751 – Service income received from insourcing agreements Insurance expense 60,997 – Payment of insurance premium Interest expense 1,075 – Interest on deposit liabilities Rent expense 1,950 – Payment of rent expense to various lessors Securities transactions Outright purchases 3,269,725 – Outright purchase of FVTPL and FVOCI investments Outright sales (50,000) – Outright sale of FVTPL and FVOCI investments
Key Personnel
Receivables from customers – 11,068 Unsecured, no impairment, with annual fixed interest Availments 3,699 – rates of 6.00% and maturities ranging from 2 to 10 years Maturities (1,444) – Utilities and rental charges Interest income 824 – Interest income from loans
December 31, 2020
Category Amount/ Volume
Outstanding Balance Nature, Terms and Conditions
Parent Company Due from other banks
P=643,918 P=1,374,327 Peso and foreign denominated deposit with 2.50% fixed interest rates and maturities ranging from 360 days
Interbank loans receivable – – Peso-denominated lending with 4.00% to 5.09% fixed interest rates and maturities ranging from 1 to 3 days Placements 32,381,000 –
Maturities (32,381,000) – Investment securities at amortized cost 59,581 59,581 Pledged for security of MBTC’s payroll account with the Bank. Accounts receivable (payable) (208) (1,909) Outstanding ATM service fees, rental and utility receivables, non-
interest bearing; no impairment Miscellaneous assets 1,763 1,834 Security deposits on lease contracts Miscellaneous liabilities (323) 5,919 Advance payments of security deposits Accrued other expense payable 36,124 68,584 Outstanding information technology expense payable, charges on
current and savings accounts processing Interest income 4,329 – Income on deposits and interbank loans receivables Rental income 8,209 – Income from leasing agreements with various lease terms ranging
from 2 to 5 years Miscellaneous income 9,947 – Income received from ATM service fees, rental and utilities Information technology expense 121,476 – Payment of information technology expenses Trading and security loss 57,038 – Gain from securities transactions Securities transactions Outright purchases 4,892,130 – Outright purchase of FVTPL, FVOCI and investment at amortized
cost Outright sales (3,166,130) – Outright sale of FVTPL, FVOCI and investment at amortized cost
Joint Venture
Investment in a joint venture (50,305) 705,477 Outstanding balance of capital investment in SMFC; movements in outstanding balance pertain to share in net income and other comprehensive income less dividends received
Dividends from joint venture 53,280 – Dividends from SMFC Accounts receivable (648) 217 Outstanding rental and utility receivables, non-interest bearing Deposit liabilities
464,130 488,007 Demand and short-term peso time deposits with annual fixed rates of 1.25%
Rental income 14,028 – Income from leasing agreements Miscellaneous income 4,752 – Interest expense 722 – Interest on deposit liabilities with 1.25% annual fixed rate
Other Related Parties (DOSRI/Indirect)
Receivable from customers – 1,172,389 Loans granted bear interest of ranging 3.00% to 7.38% with 1 to 10 years term (excluding key personnel) Availments 1,165,264 –
Maturities 987,300 – Miscellaneous assets (187) 2,597 Three months advance security deposits Accounts receivable 372 6,693 Outstanding ATM service fees, rental and utility receivables, non-
interest bearing Prepaid expense (3,221) 6,773 Payment for various policy renewals Deposit liabilities 226,204 915,051 Demand, savings and short-term peso and foreign currency time
deposits with fixed rates ranging from 0.00% to 3.50% Bills payable – – Peso denominated borrowing with 4.00% to 5.00% fixed interest
rates and maturities ranging from 1 to 3 days Deposits/placements 2,700,000 – Withdrawals/maturities (2,700,000) – Accrued other expense payable – 1,151 Outstanding group life insurance Accounts payable (4,055) 2 Various personal and car insurance payable Miscellaneous liabilities 1,872 1,872 Advance payment of security deposits from various tenants (Forward)
Interest income P=63,020 P=– Income on receivables from customers and interbank loans
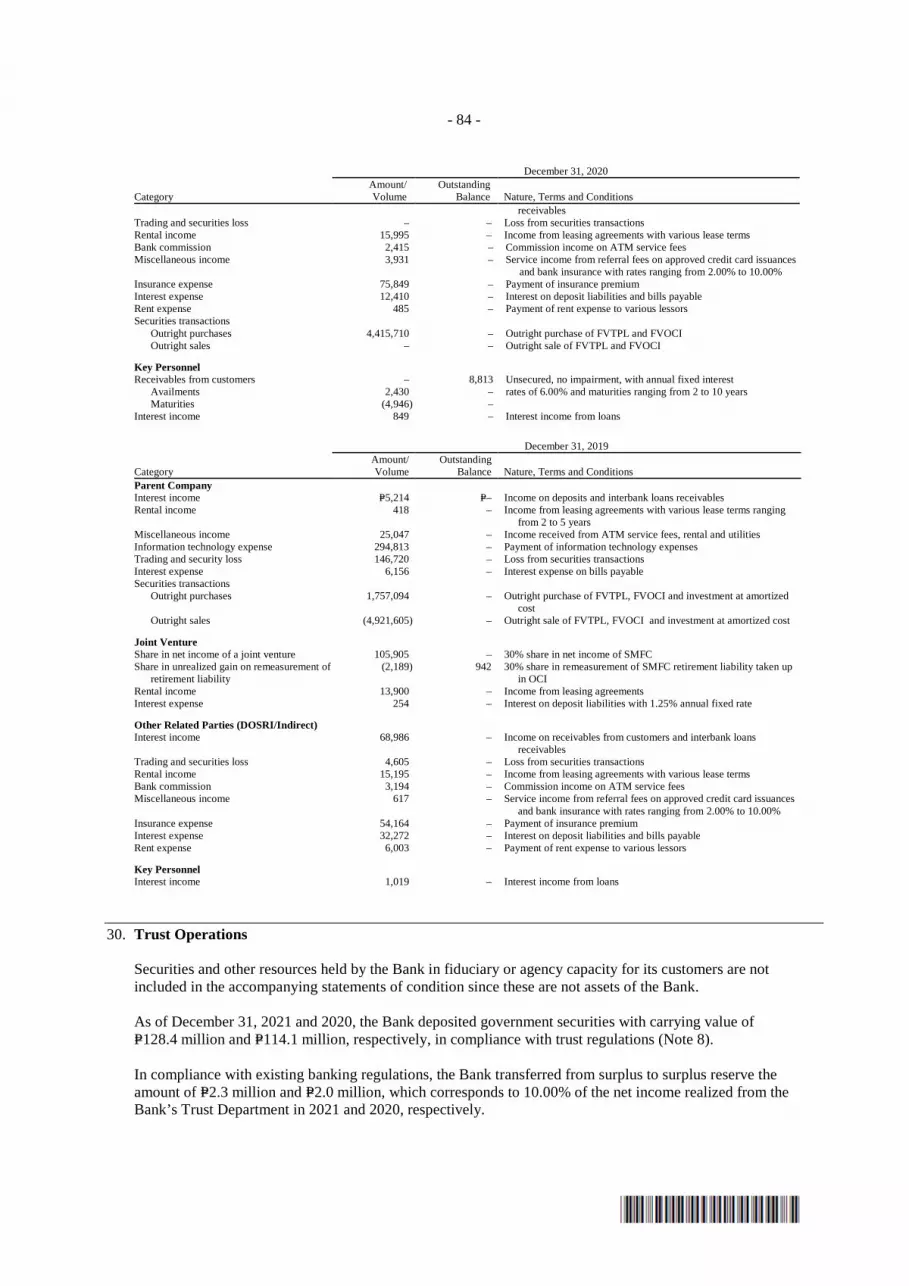
- 84 -
December 31, 2020
Category Amount/ Volume
Outstanding Balance Nature, Terms and Conditions
receivables Trading and securities loss – – Loss from securities transactions Rental income 15,995 – Income from leasing agreements with various lease terms Bank commission 2,415 – Commission income on ATM service fees Miscellaneous income 3,931 – Service income from referral fees on approved credit card issuances
and bank insurance with rates ranging from 2.00% to 10.00% Insurance expense 75,849 – Payment of insurance premium Interest expense 12,410 – Interest on deposit liabilities and bills payable Rent expense 485 – Payment of rent expense to various lessors Securities transactions Outright purchases 4,415,710 – Outright purchase of FVTPL and FVOCI Outright sales – – Outright sale of FVTPL and FVOCI
Key Personnel
Receivables from customers – 8,813 Unsecured, no impairment, with annual fixed interest Availments 2,430 – rates of 6.00% and maturities ranging from 2 to 10 years Maturities (4,946) – Interest income 849 – Interest income from loans
December 31, 2019
Category Amount/ Volume
Outstanding Balance Nature, Terms and Conditions
Parent Company Interest income P=5,214 P=– Income on deposits and interbank loans receivables Rental income 418 – Income from leasing agreements with various lease terms ranging
from 2 to 5 years Miscellaneous income 25,047 – Income received from ATM service fees, rental and utilities Information technology expense 294,813 – Payment of information technology expenses Trading and security loss 146,720 – Loss from securities transactions Interest expense 6,156 – Interest expense on bills payable Securities transactions Outright purchases 1,757,094 – Outright purchase of FVTPL, FVOCI and investment at amortized
cost Outright sales (4,921,605) – Outright sale of FVTPL, FVOCI and investment at amortized cost
Joint Venture
Share in net income of a joint venture 105,905 – 30% share in net income of SMFC Share in unrealized gain on remeasurement of
retirement liability (2,189) 942 30% share in remeasurement of SMFC retirement liability taken up
in OCI Rental income 13,900 – Income from leasing agreements Interest expense 254 – Interest on deposit liabilities with 1.25% annual fixed rate
Other Related Parties (DOSRI/Indirect)
Interest income 68,986 – Income on receivables from customers and interbank loans receivables
Trading and securities loss 4,605 – Loss from securities transactions Rental income 15,195 – Income from leasing agreements with various lease terms Bank commission 3,194 – Commission income on ATM service fees Miscellaneous income 617 – Service income from referral fees on approved credit card issuances
and bank insurance with rates ranging from 2.00% to 10.00% Insurance expense 54,164 – Payment of insurance premium Interest expense 32,272 – Interest on deposit liabilities and bills payable Rent expense 6,003 – Payment of rent expense to various lessors
Key Personnel
Interest income 1,019 – Interest income from loans
30. Trust Operations
Securities and other resources held by the Bank in fiduciary or agency capacity for its customers are not included in the accompanying statements of condition since these are not assets of the Bank.
As of December 31, 2021 and 2020, the Bank deposited government securities with carrying value of P=128.4 million and P=114.1 million, respectively, in compliance with trust regulations (Note 8). In compliance with existing banking regulations, the Bank transferred from surplus to surplus reserve the amount of P=2.3 million and P=2.0 million, which corresponds to 10.00% of the net income realized from the Bank’s Trust Department in 2021 and 2020, respectively.
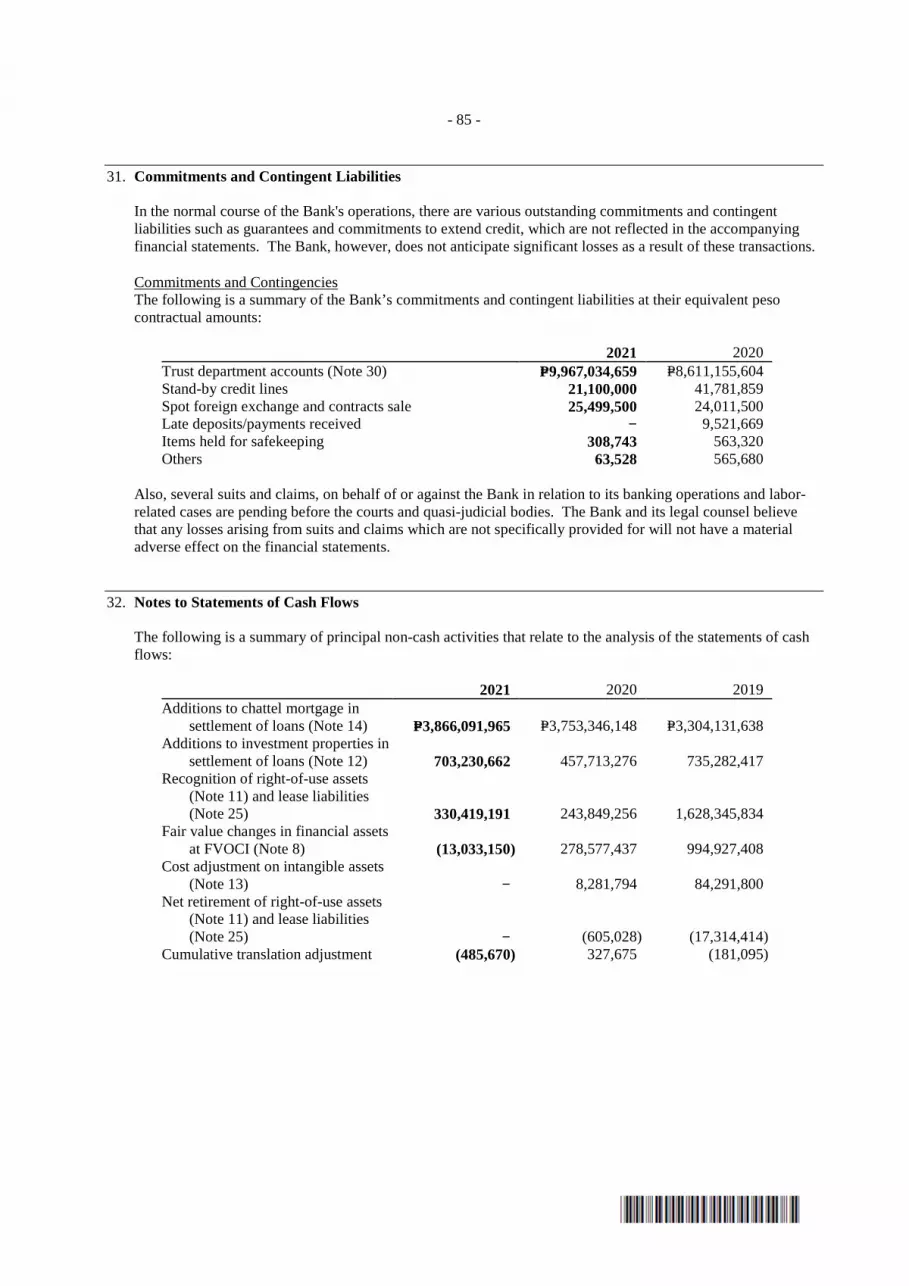
- 85 -
31. Commitments and Contingent Liabilities
In the normal course of the Bank's operations, there are various outstanding commitments and contingent liabilities such as guarantees and commitments to extend credit, which are not reflected in the accompanying financial statements. The Bank, however, does not anticipate significant losses as a result of these transactions.
Commitments and Contingencies The following is a summary of the Bank’s commitments and contingent liabilities at their equivalent peso contractual amounts:
2021 2020 Trust department accounts (Note 30) P=9,967,034,659 P=8,611,155,604 Stand-by credit lines 21,100,000 41,781,859 Spot foreign exchange and contracts sale 25,499,500 24,011,500 Late deposits/payments received − 9,521,669 Items held for safekeeping 308,743 563,320 Others 63,528 565,680
Also, several suits and claims, on behalf of or against the Bank in relation to its banking operations and labor-related cases are pending before the courts and quasi-judicial bodies. The Bank and its legal counsel believe that any losses arising from suits and claims which are not specifically provided for will not have a material adverse effect on the financial statements.
32. Notes to Statements of Cash Flows
The following is a summary of principal non-cash activities that relate to the analysis of the statements of cash flows:
2021 2020 2019 Additions to chattel mortgage in
settlement of loans (Note 14) P=3,866,091,965 P=3,753,346,148 P=3,304,131,638 Additions to investment properties in
settlement of loans (Note 12) 703,230,662 457,713,276 735,282,417 Recognition of right-of-use assets
(Note 11) and lease liabilities (Note 25) 330,419,191 243,849,256 1,628,345,834
Fair value changes in financial assets at FVOCI (Note 8) (13,033,150) 278,577,437 994,927,408
Cost adjustment on intangible assets (Note 13) − 8,281,794 84,291,800
Net retirement of right-of-use assets (Note 11) and lease liabilities (Note 25) − (605,028) (17,314,414)
Cumulative translation adjustment (485,670) 327,675 (181,095)

- 86 -
The table below provides for the changes in liabilities arising from financing activities in 2021 and 2020 (in millions):
Bills
Payable Bonds
Payable Lease
Liabilities
Total Liabilities from Financing
Activities January 1, 2021 P=− P=10,902 P=1,342 P=12,244 Cash flows from availments 414 − − 414 Cash flows from settlement (414) (6,300) (479) (7,193) Foreign exchange movement − − − − Others − 31 416 447 December 31, 2021 P=− P=4,633 P=1,279 P=5,912
Bills
Payable Bonds
Payable Lease
Liabilities
Total Liabilities from Financing
Activities January 1, 2020 P=4,190) P=6,255 P=1,467 P=11,912) Cash flows from availments 4,971) 4,607 −) 9,578) Cash flows from settlement (9,171) − (455) (9,626) Foreign exchange movement − − − − Others 10 40 330) 380) December 31, 2020 P=−) P=10,902 P=1,342) P=12,244)
Others include amortization of bills payable and bonds payable, additions to lease liabilities, and accretion and termination of lease liabilities.
As of December 31, 2021 and 2020, the Bank recognized allowance for credit losses from ‘Due from BSP’ and ‘Due from other banks’ as follows:
2021 2020 Due from BSP P=1,174,300 P=988,734 Due from other banks 1,098,686 113,972,254 P=2,272,986 P=114,960,988
33. Offsetting of Financial Assets and Liabilities
PFRS 7 requires the Bank to disclose information about rights of offset and related arrangements (such as collateral posting requirements) for financial instruments under an enforceable master netting agreements or similar arrangements. The effects of these arrangements are disclosed in the succeeding table. Financial assets As of December 31, 2021 and 2020, there were no derivative assets.
December 31, 2021
Financial assets recognized at the end of reporting period by type
Gross carrying amounts (before
offsetting)
Gross amounts offset in
accordance with the offsetting
criteria
Net amount presented in statement of
condition [a-b]
Effect of remaining rights of set-off (including rights to set-
off financial collateral) that do not meet PAS 32 offsetting
criteria
Net exposure [c-d]
Financial instruments
Fair value of financial collateral
[a] [b] [c] [d] [e] SPURA (Note 7) P=4,532,877,908 P=− P=4,532,877,908 P=− P=4,535,528,971 P=−
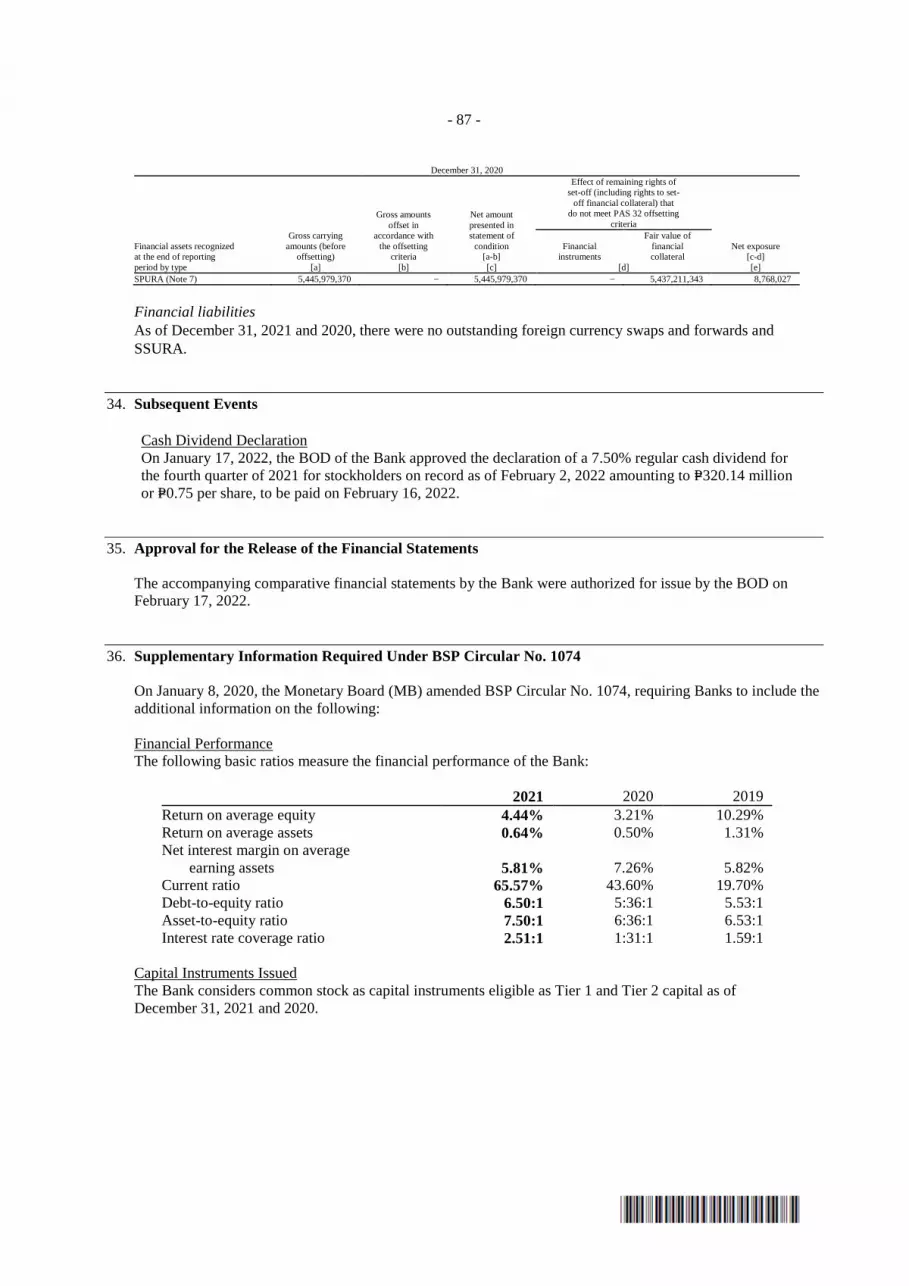
- 87 -
December 31, 2020
Financial assets recognized at the end of reporting period by type
Gross carrying amounts (before
offsetting)
Gross amounts offset in
accordance with the offsetting
criteria
Net amount presented in statement of
condition [a-b]
Effect of remaining rights of set-off (including rights to set-
off financial collateral) that do not meet PAS 32 offsetting
criteria
Net exposure [c-d]
Financial instruments
Fair value of financial collateral
[a] [b] [c] [d] [e] SPURA (Note 7) 5,445,979,370 − 5,445,979,370 − 5,437,211,343 8,768,027
Financial liabilities As of December 31, 2021 and 2020, there were no outstanding foreign currency swaps and forwards and SSURA.
34. Subsequent Events
Cash Dividend Declaration On January 17, 2022, the BOD of the Bank approved the declaration of a 7.50% regular cash dividend for the fourth quarter of 2021 for stockholders on record as of February 2, 2022 amounting to P=320.14 million or P=0.75 per share, to be paid on February 16, 2022.
35. Approval for the Release of the Financial Statements
The accompanying comparative financial statements by the Bank were authorized for issue by the BOD on February 17, 2022.
36. Supplementary Information Required Under BSP Circular No. 1074
On January 8, 2020, the Monetary Board (MB) amended BSP Circular No. 1074, requiring Banks to include the additional information on the following: Financial Performance The following basic ratios measure the financial performance of the Bank:
2021 2020 2019 Return on average equity 4.44% 3.21% 10.29% Return on average assets 0.64% 0.50% 1.31% Net interest margin on average
earning assets 5.81% 7.26% 5.82% Current ratio 65.57% 43.60% 19.70% Debt-to-equity ratio 6.50:1 5:36:1 5.53:1 Asset-to-equity ratio 7.50:1 6:36:1 6.53:1 Interest rate coverage ratio 2.51:1 1:31:1 1.59:1
Capital Instruments Issued The Bank considers common stock as capital instruments eligible as Tier 1 and Tier 2 capital as of December 31, 2021 and 2020.

- 88 -
Significant Credit Exposures as to Industry/Economic Sector Loan concentration as to economic activity follows (gross of unearned discounts, modification loss and allowance for credit losses): 2021 % 2020 % Activities of households as employers and
undifferentiated goods-and-services producing activities of households for own use
P=61,667,399,708 54.32% P=83,034,414,625 57.83
Real estate activities 40,119,887,182 35.34% 45,189,118,736 31.47 Wholesale and retail trade, repair of motor vehicles
and motorcycles 2,114,514,054 1.86% 2,362,772,977 1.65
Electricity, gas, steam and air-conditioning supply 1,659,095,301 1.46% 1,763,274,648 1.23 Financial and insurance activities 1,179,564,580 1.04% 1,196,454,574 0.83 Transportation and storage 1,007,628,902 0.89% 960,817,945 0.67 Construction 731,122,211 0.64% 654,610,491 0.46 Manufacturing 650,873,696 0.57% 668,284,576 0.47 Administrative and support service activities 424,041,758 0.37% 564,185,204 0.39 Accommodation and food service activities 309,925,265 0.27% 312,799,962 0.22 Human health and social work activities 164,649,094 0.15% 189,964,709 0.13 Education 136,667,404 0.12% 143,609,507 0.1 Professional, scientific and technical activities 124,626,806 0.11% 158,337,618 0.11 Arts, entertainment and recreation 94,065,201 0.08% 89,335,238 0.06 Information and communication 81,261,173 0.07% 538,639,977 0.38 Agriculture, forestry and fishing 64,293,253 0.06% 103,944,776 0.07 Water supply, sewerage, waste management and
remediation activities 54,329,723 0.05% 42,621,664 0.03
Mining and quarrying 18,235,240 0.02% 17,735,712 0.01 Others 2,925,163,754 2.58% 5,583,267,492 3.89 P=113,527,344,305 100.00% P=143,574,190,431 100.00
Others relate to other service activities including the activities of membership organizations, repair of computers, personal and household goods and a variety of personal service activities not covered elsewhere in the classification above.
Breakdowns of Total Loans as to Security The breakdown of loans and receivables from customers (gross of unearned discounts, modification loss and allowance for credit losses) as to secured and unsecured and as to type of security follows: 2021 % 2020 % Secured by: Chattel P=53,141,010,629 46.81% P=74,695,763,423 52.03% Real estate 32,642,162,497 28.75% 34,623,440,207 24.12% Deposit hold-out 505,841,926 0.45% 616,116,114 0.43% Others − 0.00% 1,121,142 0.00% 86,289,015,052 76.01% 109,936,440,886 76.57% Unsecured 27,238,329,253 23.99% 33,637,749,545 23.43% P=113,527,344,305 100.00% P=143,574,190,431 100.00%
Breakdown of Total Loans as to Status Details of non-performing loans (NPL) follow:
2021 2020 Secured P=5,264,508,163 P=7,602,430,965 Unsecured 1,865,349,291 2,372,479,952 P=7,129,857,454 P=9,974,910,917
Generally, NPLs refer to loans, investments, receivables, or any financial asset, even without any missed contractual payments, that satisfy any of the following conditions: 1. Impaired under existing accounting standards; 2. Classified as doubtful or loss; 3. In litigation, and/or; 4. There is evidence that full repayment of principal and interest is unlikely without foreclosure of collateral,
if any.

- 89 -
All other loans, even if not considered impaired, shall be considered non-performing if any principal and/or interest are: 1. Unpaid for more than ninety (90) days from contractual due date, or accrued interests for more than ninety
(90) days have been capitalized, refinanced, or delayed by agreement. 2. Microfinance and other small loans with similar credit characteristics shall be considered
non-performing after contractual due date or after it has become past due. 3. Restructured loans shall be considered non-performing. However, if prior to restructuring, the loans were
categorized as performing, such classification shall be retained.
The NPLs of the Bank not fully covered by allowance for credit losses follow:
2021 2020 Total NPLs P=7,129,857,454 P=9,974,910,917 Less NPLs fully covered by allowance for credit losses 1,728,737,382 705,833,911 P=5,401,120,072 P=9,269,077,006
Restructured loans as of December 31, 2021 and 2020 amounted to P=58.4 million, and P=68.8 million, respectively. The Bank’s loan portfolio includes non-risk loans as defined under BSP regulations totaling P=0.5 billion and P=0.6 billion as of December 31, 2021 and 2020, respectively.
Information on Related Party Loans As required under existing BSP rules and regulations, the Bank discloses loans and other credit accommodations granted to its DOSRI. These loans and other credit accommodations were made substantially on the same terms as with other individuals and businesses of comparable risks and were subject of prior BOD approval and entailing BSP reportorial requirements.
Existing banking regulations also limit the total amount of credit exposure to each of the Bank’s DOSRIs, at least 70.00% of which must be secured, to the total of their respective deposits and book value of their respective unencumbered deposits and, if any, book value of their respective paid-in capital contribution in the Bank. In the aggregate, the Bank’s total credit exposure to all its DOSRIs should not exceed its net worth or 15.00% of its total loan portfolio, whichever is lower, with any unsecured portion thereof not exceeding the lower between 30.00% of the aggregate limit or of the total actual exposure. However, loans and other credit accommodations to DOSRIs that are secured by assets considered by the BSP as non-risk are exempt from these ceilings. As of December 31, 2021, and 2020, the Bank's credit exposures to DOSRI are within the said regulatory limits. BSP Circular No. 423 dated March 15, 2004, as amended by BSP Circular No. 914 dated June 23, 2016, provide the rules and regulations governing credit exposures to DOSRI. The following table shows information relating to the loans, other credit accommodations and guarantees classified as DOSRI accounts under regulations existing prior to BSP Circular No. 423 and new DOSRI loans and other credit accommodations granted under said circular as of December 31, 2021 and 2020 (in thousands):
2021 2020
DOSRI
Loans Related
Party Loans DOSRI
Loans Related
Party Loans Total outstanding loans P=201,380 P=1,166,380 P=206,202 P=1,181,202 Percent of DOSRI/Related Party loans to total loan
portfolio 0.18% 1.03% 0.14% 0.82% Percent of unsecured DOSRI/Related Party loans to
total DOSRI/Related Party loans 94.51% 99.05% 98.35% 99.12% Percent of past-due DOSRI /Related Party loans to
total DOSRI/Related Party loans 0.00% 0.00% 0.00% 0.00% Percent of non-performing DOSRI/Related Party
loans to total DOSRI /Related Party loans 0.00% 0.00% 0.00% 0.00% Total interest income from DOSRI loans amounted to P=0.6 million in 2021, P=0.9 million in 2020, and P=5.7 million in 2019.
- 90 -
Aggregate Amount of Secured Liabilities and Assets Pledged as Security As of December 31, 2021, financial assets at FVOCI include Bureau of Treasury bonds pledged by the Bank to MBTC to secure its payroll account with the Bank, with total carrying value of P=59.7 million. As of December 31, 2020, investment securities at amortized cost include Bureau of Treasury bonds pledged by the Bank to MBTC to secure its payroll account with the Bank, with total carrying value of P=59.6 million.
Commitments and Contingencies The following is a summary of the Bank’s commitments and contingent liabilities at their equivalent peso contractual amounts:
2021 2020 Trust department accounts (Note 30) P=9,967,034,659 P=8,611,155,604 Stand-by credit lines 21,100,000 41,781,859 Spot foreign exchange and contracts sale 25,499,500 24,011,500 Late deposits/payments received − 9,521,669 Items held for safekeeping 308,743 563,320 Others 63,528 565,680
37. Report on the Supplementary Information Required Under Revenue Regulations (RR) No. 15-2010
On November 25, 2010, the BIR issued RR No. 15-2010 to amend certain provisions of RR No. 21-2002. The regulations provide that starting 2010, the notes to financial statements shall include information on taxes, duties and license fees paid or accrued during the taxable year.
The Bank reported and/or paid the following types of taxes for the year:
Taxes and Licenses For the taxable year ended December 31, 2021, taxes and licenses of the Bank consist of:
Gross receipts tax P=709,118,382 Documentary stamps tax 766,974,082 Local taxes 102,417,856 Fringe benefit tax 7,623,937 P=1,586,134,257
Withholding Taxes As of December 31, 2021, total remittances and balance of withholding taxes are as follows:
Total Remittances Balance Withholding taxes on compensation and benefits P=422,231,274 P=25,257,901 Final withholding taxes 215,979,534 12,461,289 Expanded withholding taxes 83,777,112 10,086,125 P=721,987,920 P=47,805,315
The Bank has no ongoing tax assessment as of December 31, 2021.
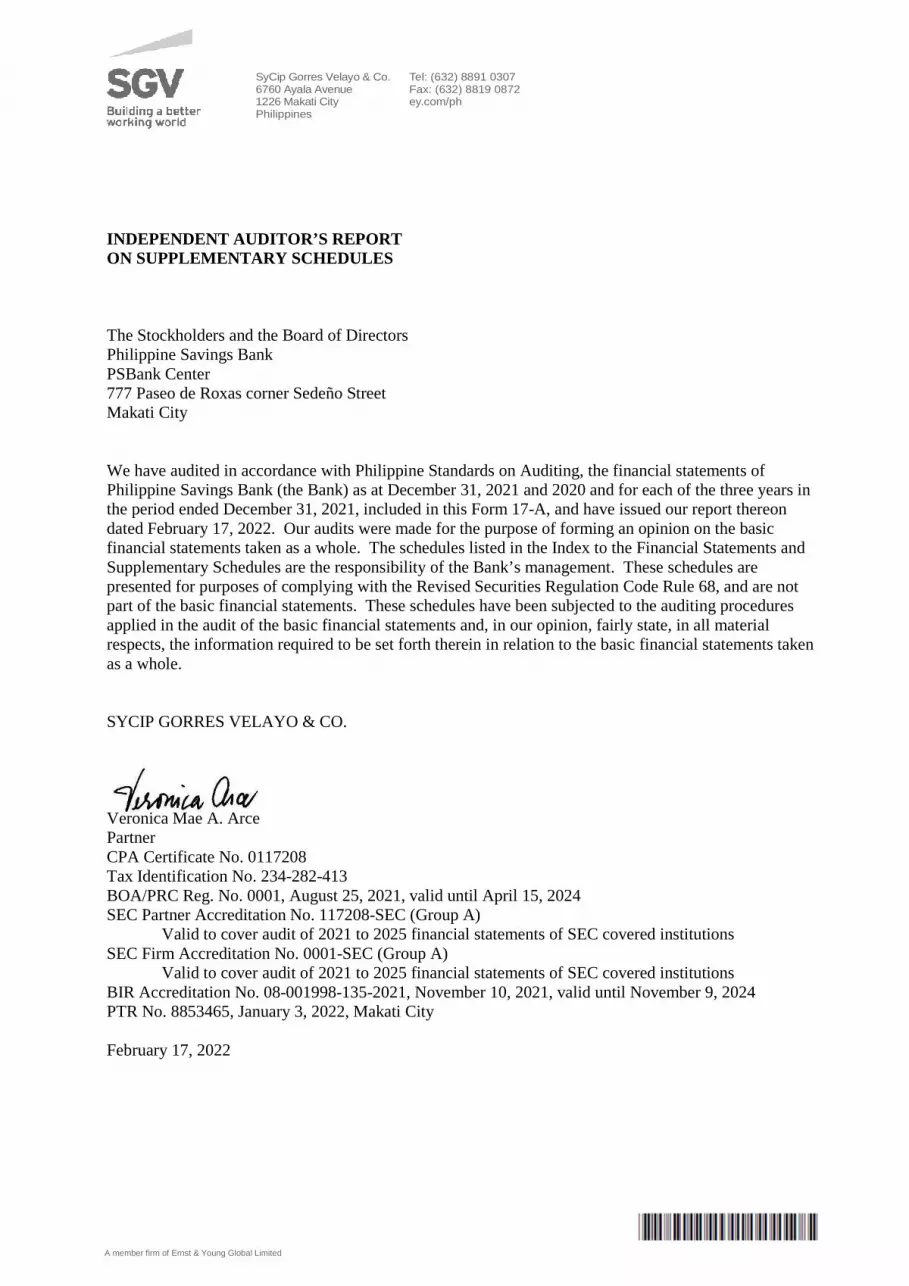
INDEPENDENT AUDITOR’S REPORT ON SUPPLEMENTARY SCHEDULES The Stockholders and the Board of Directors Philippine Savings Bank PSBank Center 777 Paseo de Roxas corner Sedeño Street Makati City We have audited in accordance with Philippine Standards on Auditing, the financial statements of Philippine Savings Bank (the Bank) as at December 31, 2021 and 2020 and for each of the three years in the period ended December 31, 2021, included in this Form 17-A, and have issued our report thereon dated February 17, 2022. Our audits were made for the purpose of forming an opinion on the basic financial statements taken as a whole. The schedules listed in the Index to the Financial Statements and Supplementary Schedules are the responsibility of the Bank’s management. These schedules are presented for purposes of complying with the Revised Securities Regulation Code Rule 68, and are not part of the basic financial statements. These schedules have been subjected to the auditing procedures applied in the audit of the basic financial statements and, in our opinion, fairly state, in all material respects, the information required to be set forth therein in relation to the basic financial statements taken as a whole. SYCIP GORRES VELAYO & CO. Veronica Mae A. Arce Partner CPA Certificate No. 0117208 Tax Identification No. 234-282-413 BOA/PRC Reg. No. 0001, August 25, 2021, valid until April 15, 2024 SEC Partner Accreditation No. 117208-SEC (Group A) Valid to cover audit of 2021 to 2025 financial statements of SEC covered institutions SEC Firm Accreditation No. 0001-SEC (Group A)
Valid to cover audit of 2021 to 2025 financial statements of SEC covered institutions BIR Accreditation No. 08-001998-135-2021, November 10, 2021, valid until November 9, 2024 PTR No. 8853465, January 3, 2022, Makati City February 17, 2022
SyCip Gorres Velayo & Co. 6760 Ayala Avenue 1226 Makati City Philippines
Tel: (632) 8891 0307 Fax: (632) 8819 0872 ey.com/ph
A member firm of Ernst & Young Global Limited
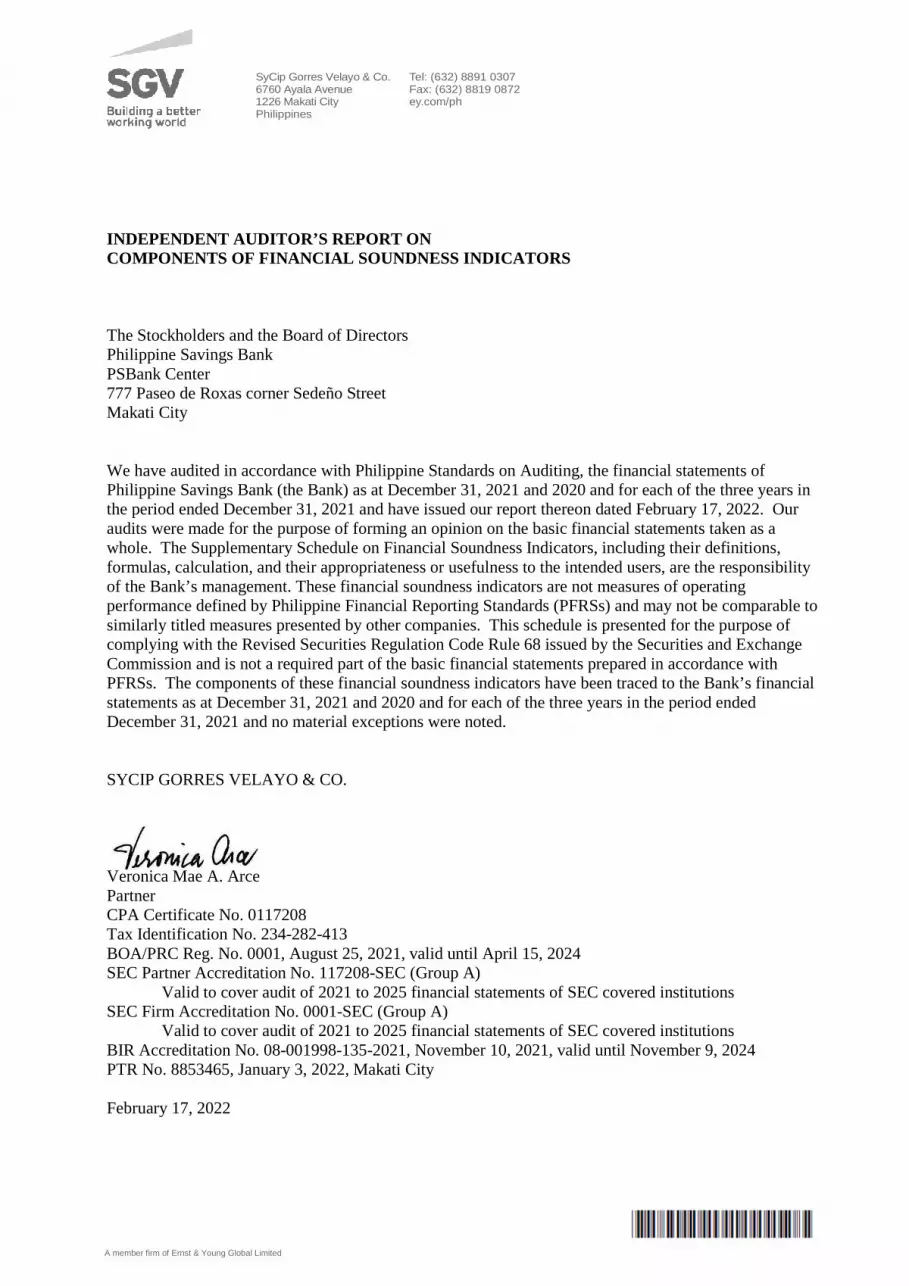
INDEPENDENT AUDITOR’S REPORT ON COMPONENTS OF FINANCIAL SOUNDNESS INDICATORS The Stockholders and the Board of Directors Philippine Savings Bank PSBank Center 777 Paseo de Roxas corner Sedeño Street Makati City We have audited in accordance with Philippine Standards on Auditing, the financial statements of Philippine Savings Bank (the Bank) as at December 31, 2021 and 2020 and for each of the three years in the period ended December 31, 2021 and have issued our report thereon dated February 17, 2022. Our audits were made for the purpose of forming an opinion on the basic financial statements taken as a whole. The Supplementary Schedule on Financial Soundness Indicators, including their definitions, formulas, calculation, and their appropriateness or usefulness to the intended users, are the responsibility of the Bank’s management. These financial soundness indicators are not measures of operating performance defined by Philippine Financial Reporting Standards (PFRSs) and may not be comparable to similarly titled measures presented by other companies. This schedule is presented for the purpose of complying with the Revised Securities Regulation Code Rule 68 issued by the Securities and Exchange Commission and is not a required part of the basic financial statements prepared in accordance with PFRSs. The components of these financial soundness indicators have been traced to the Bank’s financial statements as at December 31, 2021 and 2020 and for each of the three years in the period ended December 31, 2021 and no material exceptions were noted. SYCIP GORRES VELAYO & CO. Veronica Mae A. Arce Partner CPA Certificate No. 0117208 Tax Identification No. 234-282-413 BOA/PRC Reg. No. 0001, August 25, 2021, valid until April 15, 2024 SEC Partner Accreditation No. 117208-SEC (Group A) Valid to cover audit of 2021 to 2025 financial statements of SEC covered institutions SEC Firm Accreditation No. 0001-SEC (Group A)
Valid to cover audit of 2021 to 2025 financial statements of SEC covered institutions BIR Accreditation No. 08-001998-135-2021, November 10, 2021, valid until November 9, 2024 PTR No. 8853465, January 3, 2022, Makati City February 17, 2022
SyCip Gorres Velayo & Co. 6760 Ayala Avenue 1226 Makati City Philippines
Tel: (632) 8891 0307 Fax: (632) 8819 0872 ey.com/ph
A member firm of Ernst & Young Global Limited
PHILIPPINE SAVINGS BANK INDEX TO THE FINANCIAL STATEMENTS AND
SUPPLEMENTARY SCHEDULES I. Reconciliation of Retained Earnings Available for Dividend Declaration (Annex 68-D)
II. Map of the Relationships of the Companies within the Group III. Supplementary Schedules Required by Annex 68-J
A. Financial Assets B. Amounts Receivable from Directors, Officers, Employees, Related Parties
and Principal Stockholders (Other than Related Parties) C. Amounts Receivable from Related Parties which are Eliminated During
the Consolidation of Financial Statements D. Long-term Debt E. Indebtedness to Related Parties (Long-Term Loans from Related Companies) F. Guarantees of Securities of Other Issuers G. Capital Stock

PHILIPPINE SAVINGS BANK RECONCILIATION OF RETAINED EARNINGS AVAILABLE FOR D IVIDEND DECLARATION (ANNEX 68-D) AS OF DECEMBER 31, 2021 Unappropriated Retained Earnings, 12/31/2020 P=18,555,539,349 Prior year adjustments Less: Non-accrual/unrealized income net of tax
Equity in net income of a joint venture (141,859,019) Unrealized foreign exchange gains – net (42,464,510) Unrealized gains on investment properties (1,216,730,512) Recognized deferred tax assets (1,779,895,849) Mark to market gains on FVTPL (6,515) (3,180,956,405)
Unappropriated Retained Earnings, as adjusted to available for dividend distribution, beginning 15,374,582,944 Net Income during the period closed to Retained Earnings 1,539,492,720 Less: Non-accrual/unrealized income net of tax
Equity in net income of a joint venture (30,334,534) Unrealized foreign exchange gains - net 20,480,326 Unrealized gains on investment properties (32,806,514) Recognized deferred tax assets 1,414,071,157 Mark to market gains on FVTPL 12,003 1,371,422,438
Net income actually earned during the period 2,910,915,158 Less:
Dividend declarations during the period (1,280,578,249) Appropriations of Surplus Reserves during the period (2,305,370)
Retained Earnings Available for Dividend Distribution P=17,002,614,483
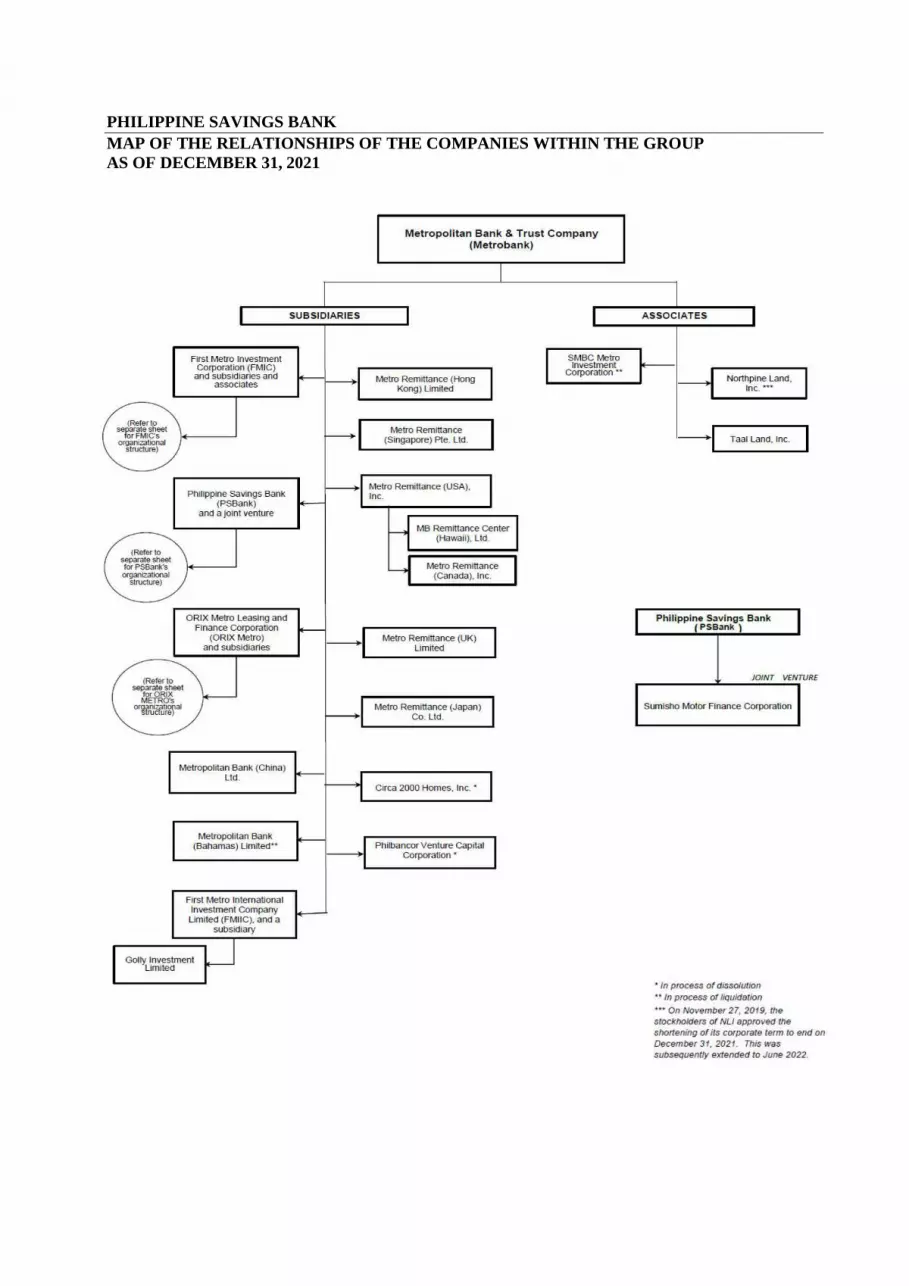
PHILIPPINE SAVINGS BANK MAP OF THE RELATIONSHIPS OF THE COMPANIES WITHIN TH E GROUP AS OF DECEMBER 31, 2021
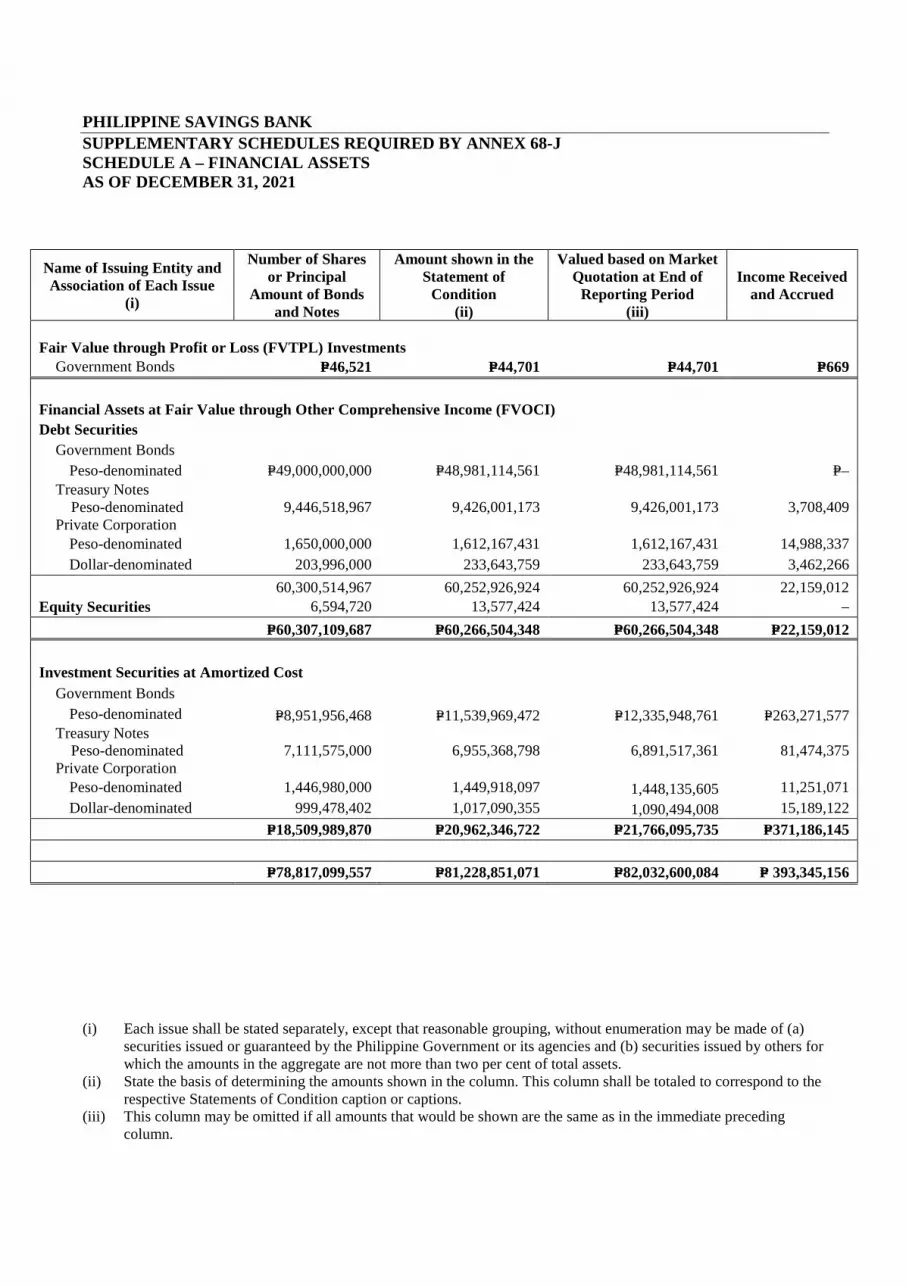
PHILIPPINE SAVINGS BANK SUPPLEMENTARY SCHEDULES REQUIRED BY ANNEX 68-J SCHEDULE A – FINANCIAL ASSETS AS OF DECEMBER 31, 2021
Name of Issuing Entity and Association of Each Issue
(i)
Number of Shares or Principal
Amount of Bonds and Notes
Amount shown in the Statement of
Condition (ii)
Valued based on Market Quotation at End of Reporting Period
(iii)
Income Received and Accrued
Fair Value through Profit or Loss (FVTPL) Investments
Government Bonds P=46,521 P=44,701 P=44,701 P=669
Financial Assets at Fair Value through Other Comprehensive Income (FVOCI) Debt Securities
Government Bonds Peso-denominated P=49,000,000,000 P=48,981,114,561 P=48,981,114,561 P=–
Treasury Notes Peso-denominated Private Corporation
9,446,518,967 9,426,001,173 9,426,001,173 3,708,409
Peso-denominated 1,650,000,000 1,612,167,431 1,612,167,431 14,988,337 Dollar-denominated 203,996,000 233,643,759 233,643,759 3,462,266
60,300,514,967 60,252,926,924 60,252,926,924 22,159,012 Equity Securities 6,594,720 13,577,424 13,577,424 –
P=60,307,109,687 P=60,266,504,348 P=60,266,504,348 P=22,159,012
Investment Securities at Amortized Cost
Government Bonds Peso-denominated P=8,951,956,468 P=11,539,969,472 P=12,335,948,761 P=263,271,577
Treasury Notes Peso-denominated Private Corporation
7,111,575,000 6,955,368,798 6,891,517,361 81,474,375
Peso-denominated 1,446,980,000 1,449,918,097 1,448,135,605 11,251,071 Dollar-denominated 999,478,402 1,017,090,355 1,090,494,008 15,189,122
P=18,509,989,870 P=20,962,346,722 P=21,766,095,735 P=371,186,145 P=78,817,099,557 P=81,228,851,071 P=82,032,600,084 P= 393,345,156
(i) Each issue shall be stated separately, except that reasonable grouping, without enumeration may be made of (a)
securities issued or guaranteed by the Philippine Government or its agencies and (b) securities issued by others for which the amounts in the aggregate are not more than two per cent of total assets.
(ii) State the basis of determining the amounts shown in the column. This column shall be totaled to correspond to the respective Statements of Condition caption or captions.
(iii) This column may be omitted if all amounts that would be shown are the same as in the immediate preceding column.
PHILIPPINE SAVINGS BANK SUPPLEMENTARY SCHEDULES REQUIRED BY ANNEX 68-J SCHEDULE B – AMOUNTS RECEIVABLE FROM DIRECTORS, OFF ICERS, EMPLOYEES, RELATED PARTIES, AND PRINCIPAL STOCKHOLDERS (OTHER THAN RELATED PARTIES) AS OF DECEMBER 31, 2021
Name and Designation of Debtor
(i)
Balance at Beginning
of the Period
Additions Amounts Collected
(ii)
Amounts Written- off
(iii) Current
Not Current
Balance at End of Period
NONE TO REPORT
Note: Transactions to these parties are made in the ordinary course of business.
(i) Show separately accounts receivables and note receivable. In case of notes receivable, indicate pertinent
information such as the due date, interest rate, terms or repayment and collateral, if any. (ii) If collection was other than in cash, explain. (iii) Give reasons for write-off.
PHILIPPINE SAVINGS BANK SUPPLEMENTARY SCHEDULES REQUIRED BY ANNEX 68-J SCHEDULE C – AMOUNTS RECEIVABLE FROM RELATED PARTIE S WHICH ARE ELIMINATED DURING THE CONSOLIDATION OF FINANCIAL ST ATEMENTS AS OF DECEMBER 31, 2021
NOT APPLICABLE
(i) If collection was other than in cash, explain. (ii) Give reasons for write off.
Name and Designation of debtors
Balance at Beginning of Period
Additions Amounts Collected
(i)
Amounts Written Off
(ii) Current
Not Current
Balance at End of Period

PHILIPPINE SAVINGS BANK SUPPLEMENTARY SCHEDULES REQUIRED BY ANNEX 68-J SCHEDULE D – LONG-TERM DEBT AS OF DECEMBER 31, 2021
Title of Issue and Type of Obligation
(i)
Amount Authorized by
Indenture
Amount shown under Caption
“Current Portion of Long-Term
Debt” in related Statement of
Condition (ii)
Amount shown under Caption “Long-Term
Debt” in related Statement of
Condition (iii)
Interest Rate Maturity Date
Bonds Payable P=4,650,000,000 P=− P=4,633,613,322 4.50% February 4, 2023
(i) Include in this column each type of obligation authorized. (ii) This column is to be totaled to correspond to the related Statements of Condition caption. (iii) Include in this column details as to interest rates, amounts or number of periodic installments, and maturity dates.
PHILIPPINE SAVINGS BANK SUPPLEMENTARY SCHEDULES REQUIRED BY ANNEX 68-J SCHEDULE E – INDEBTEDNESS TO RELATED PARTIES (LONG- TERM LOANS FROM RELATED COMPANIES) AS OF DECEMBER 31, 2021
NONE TO REPORT (i) The related parties named shall be grouped as in Schedule C. The information called for shall be stated separately
for any persons whose investments were shown separately in such related schedule. (ii) For each affiliate named in the first column, explain in a note hereto the nature and purpose of any material
increase during the period that is in excess of ten per cent (10%) of the related balance at either the beginning or end of the period.
Name of Related Party (i)
Balance at Beginning of Period
Balance at the End of Period (ii)
PHILIPPINE SAVINGS BANK SUPPLEMENTARY SCHEDULES REQUIRED BY ANNEX 68-J SCHEDULE F – GUARANTEES OF SECURITIES OF OTHER ISSUERS AS OF DECEMBER 31, 2021 Name of Issuing Entity of Securities Guaranteed by
the Company for which this Statement is filed
Title of Issue of each Class of
Securities Guaranteed
Total Amount Guaranteed and
Outstanding (i)
Amount Owned by Person for which Statement is Filed
Nature of Guarantee
(ii)
NONE TO REPORT (i) Indicate in a note any significant changes since the date of the last Statements of Condition filed. If this schedule
is filed in support of Consolidated Financial Statements, there shall be set forth guarantees by any person included in the consolidation except such guarantees of securities which are included in the Consolidated Statements of Condition.
(ii) There must be a brief statement of the nature of the guarantee, such as “Guarantee of principal and interest”, “Guarantee of interest”, or “Guarantee of dividends”. If the guarantee is of interest, dividends, or both, state the annual aggregate amount of interest or dividends so guaranteed.

PHILIPPINE SAVINGS BANK SUPPLEMENTARY SCHEDULES REQUIRED BY ANNEX 68-J SCHEDULE G – CAPITAL STOCK AS OF DECEMBER 31, 2021
Title of Issue (i)
Number of Shares
Authorized
Number of Shares Issued and
Outstanding as shown under
related Statement of Condition
Caption
Number of Shares
Reserved for Options,
Warrants, Conversion and
Other Rights
Number of Shares Held by Related
Parties (ii)
Directors, Officers,
and Employees
Others (iii)
Common Stock - P10 par value 600,000,000 426,859,416 – 377,279,068 4,459,642 45,120,706 (i) Include in this column each type of issue authorized. (ii) Related Parties referred to include persons for which separate financial statements are filed and those included in
consolidated financial statements, other than the issuer of the particular security. (iii) Indicate in a note any significant changes since the date of the last Statements of Condition filed.
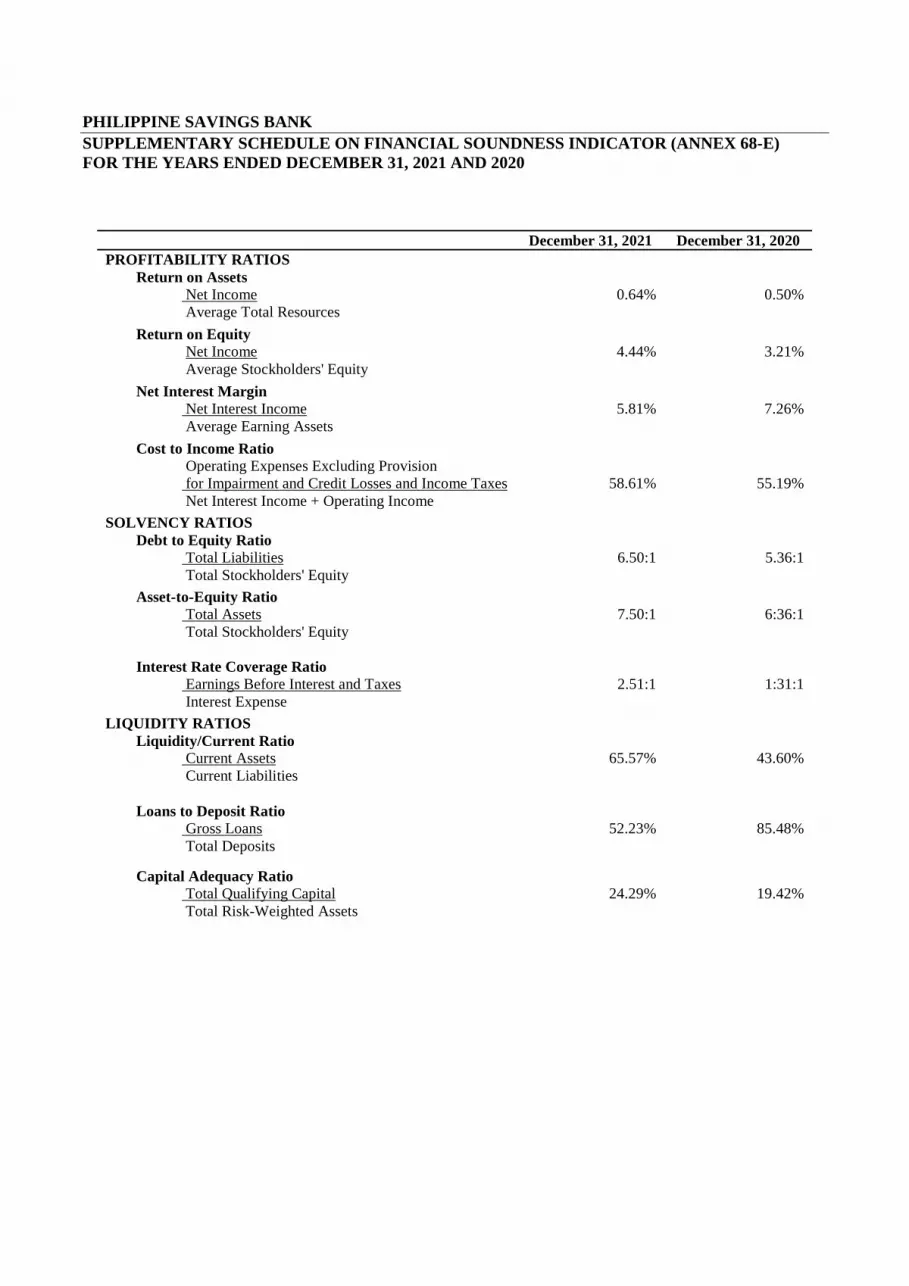
PHILIPPINE SAVINGS BANK SUPPLEMENTARY SCHEDULE ON FINANCIAL SOUNDNESS INDIC ATOR (ANNEX 68-E) FOR THE YEARS ENDED DECEMBER 31, 2021 AND 2020
December 31, 2021 December 31, 2020 PROFITABILITY RATIOS
Return on Assets Net Income 0.64% 0.50% Average Total Resources
Return on Equity Net Income 4.44% 3.21% Average Stockholders' Equity
Net Interest Margin Net Interest Income 5.81% 7.26% Average Earning Assets
Cost to Income Ratio Operating Expenses Excluding Provision for Impairment and Credit Losses and Income Taxes 58.61% 55.19% Net Interest Income + Operating Income
SOLVENCY RATIOS Debt to Equity Ratio
Total Liabilities 6.50:1 5.36:1 Total Stockholders' Equity
Asset-to-Equity Ratio Total Assets 7.50:1 6:36:1 Total Stockholders' Equity
Interest Rate Coverage Ratio Earnings Before Interest and Taxes 2.51:1 1:31:1 Interest Expense
LIQUIDITY RATIOS Liquidity/Current Ratio
Current Assets 65.57% 43.60% Current Liabilities
Loans to Deposit Ratio
Gross Loans 52.23% 85.48% Total Deposits
Capital Adequacy Ratio Total Qualifying Capital 24.29% 19.42% Total Risk-Weighted Assets

Philippine Savings Bank 2021 Sustainability Report
PAGE 1
Sustainability Report Financial Year 2021
EXHIBIT 9
Philippine Savings Bank 2021 Sustainability Report
PAGE 2
Contents Sustainability Report ....................................................................................................... 1
About PSBank ................................................................................................................. 3
Introduction ..................................................................................................................... 3
Board Statement ............................................................................................................. 4
ESG Materiality and Management Approach .................................................................. 6
PSBank Materiality Process ........................................................................................ 6
Management Approach ............................................................................................... 7
Economic Impact ........................................................................................................... 10
Direct Economic Impact ............................................................................................. 10
Financial Inclusion and Literacy ................................................................................. 10
Responsible Investment ............................................................................................ 11
Environmental Impact .................................................................................................... 12
Operational Greenhouse Gas Emissions ................................................................... 13
Electricity Consumption ............................................................................................. 13
Fuel Consumption...................................................................................................... 13
Water Use .................................................................................................................. 14
Waste Management ................................................................................................... 14
Social Impact ................................................................................................................. 15
Workforce Diversity .................................................................................................... 15
Workplace Safety and Labor Practices ...................................................................... 16
Employee Training and Development ........................................................................ 18
Governance ................................................................................................................... 19
Data Privacy and Information Security ....................................................................... 19
Systemic Risk Management ...................................................................................... 20
Stakeholder Management .......................................................................................... 21
Business Ethics ......................................................................................................... 22
Philippine Savings Bank 2021 Sustainability Report
PAGE 3
About PSBank Philippine Savings Bank (hereafter referred to as “PSBank” or the “Bank”), a subsidiary of the Metropolitan Bank and Trust Company (Metrobank), is headquartered in Makati City. To date, its physical channel footprint is composed of 250 branches and 545 onsite and offsite ATMs strategically located nationwide. It offers a wide range of banking products and services: deposits, loans, treasury products, digital banking services, bancassurance, credit card, and trust. PSBank has for its core customers those in the consumer and retail markets.
Throughout its more than 60 years of operation, the Bank’s service philosophy is to always be responsive to the needs of clients and deliver them exceptionally and consistently across all touchpoints. As the Bank gears towards being more sustainable and attain its commitments for Sustainable Finance, it continuously improves its products, service channels and overall customer service experience to provide more positive social and environmental impact. PSBank takes advantage of available and emerging technologies, not just to introduce innovative product offerings but also to improve on systems and processes for better operational efficiency and lower operating costs. With its customer in mind, the Bank strives to consistently make its banking processes simpler, thus allowing customers to perform their banking needs the fastest, simplest and safest way possible. Through its Online and Mobile Banking Facility, existing and new clients can, among others, open and maintain their accounts, send money and pay bills conveniently anytime and anywhere from the comfort of their homes thus allowing them to save time and lower their carbon footprint. The Bank also provides affordable loan products with one-day approval for Auto Loans, one-day credit decision for Home Loans for accredited properties, online applications for Auto Loan and Flexi Personal Loan. The Bank increasingly considers the economic, environmental and social impacts of its banking operations cognizant of the inherent risks and strategic opportunities it may bring. Through continuing education, engagement, community partnerships, and financial inclusion measures, it aims to address and mitigate more complex risks and issues associated with financial assets and investments. It recognizes the need to manage investments based on local and global norms to prevent reputational harm, brand damage, or even taxes and lawsuits. It continues to intensify the protection of data privacy and security. It aims to improve energy efficiency and tap alternative sources to reduce reliance on purchased electricity. With these efforts, the Bank can, directly or indirectly, reduce the likelihood of extraordinary expenses, improve market share, or even decrease liabilities.
Introduction On April 29, 2020, the Bangko Sentral ng Pilipinas (BSP) issued Circular 1085, otherwise known as the Sustainable Finance Framework which “expects banks to embed sustainability principles, including those covering environmental and social risk areas, in their corporate governance framework, risk management systems, and strategic objectives consistent with their size, risk profile and complexity of operations.” In compliance with the Circular, PSBank documented its transition plan which was subsequently approved by its Board of Directors (BOD) in October 2020. The Bank has since then established focus areas to support the UN’s 2030 Agenda for Sustainable Development and contribute to the aspirations set forth under the Philippine Development Plan. It has formalized its Sustainable Finance Framework to articulate the integration of environmental, social, and governance criteria into its day-to-day business operations, products and services, and distribution channels. The framework provides basis for defining targets and metrics to deliver on its commitment to support sustainable economic growth and the transition to a low-carbon economy.

Philippine Savings Bank 2021 Sustainability Report
PAGE 4
Scope The scope of the 2021 ESG Report includes information and progress of the Bank’s sustainable finance goals for the period 1 January 2021 to 31 December 2021 in line with common sustainability reporting frameworks and disclosure requirements of the Philippine Stock Exchange (PSE), the Securities and Exchange Commission (SEC), and select sustainability reporting frameworks. The Report should be read together with PSBank Annual Report 2021. All quantitative and qualitative information for relevant indicators have been disclosed for a minimum of two years where applicable.
Board Statement
The Board of Directors of PSBank reiterates its organizational level commitment to sustainable finance: “Believing that we have a role to play in promoting sustainable development, PSBank is committed to driving progress towards achieving the United Nations Sustainable Development Goals (SDGs). Through our products and services and the integration of digital technology, we aim to create added value to our clients, the general public, and the rest of society.”

Philippine Savings Bank 2021 Sustainability Report
PAGE 5
The Bank has made significant progress from 2020 to 2021 following its Board approved transition plan for Sustainable Finance.
Image Source:
This section has been designed using images from Freepik.com and Canva.com
2021
2020
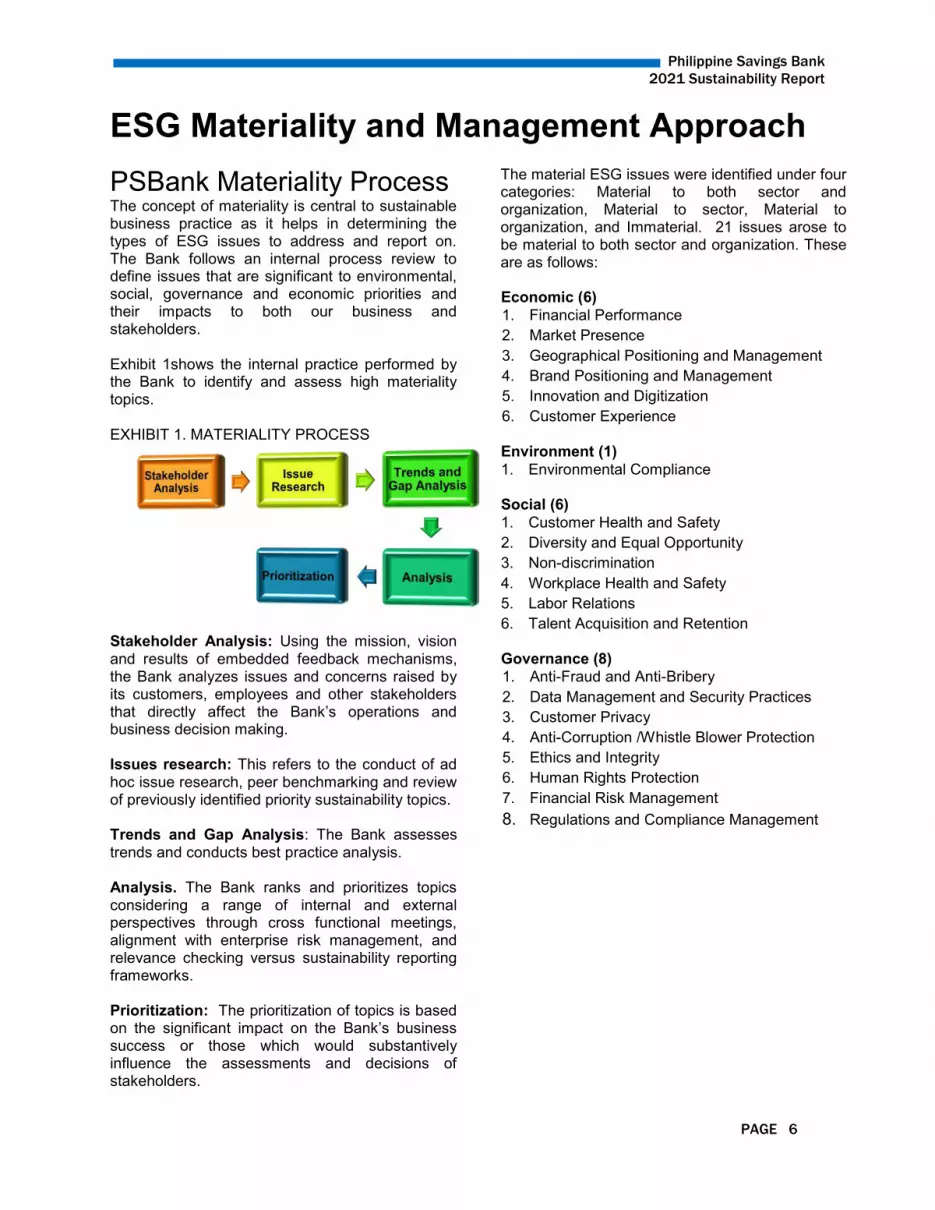
Philippine Savings Bank 2021 Sustainability Report
PAGE 6
ESG Materiality and Management Approach
PSBank Materiality Process The concept of materiality is central to sustainable business practice as it helps in determining the types of ESG issues to address and report on. The Bank follows an internal process review to define issues that are significant to environmental, social, governance and economic priorities and their impacts to both our business and stakeholders. Exhibit 1shows the internal practice performed by the Bank to identify and assess high materiality topics. EXHIBIT 1. MATERIALITY PROCESS
Stakeholder Analysis: Using the mission, vision and results of embedded feedback mechanisms, the Bank analyzes issues and concerns raised by its customers, employees and other stakeholders that directly affect the Bank’s operations and business decision making. Issues research: This refers to the conduct of ad hoc issue research, peer benchmarking and review of previously identified priority sustainability topics. Trends and Gap Analysis: The Bank assesses trends and conducts best practice analysis. Analysis. The Bank ranks and prioritizes topics considering a range of internal and external perspectives through cross functional meetings, alignment with enterprise risk management, and relevance checking versus sustainability reporting frameworks. Prioritization: The prioritization of topics is based on the significant impact on the Bank’s business success or those which would substantively influence the assessments and decisions of stakeholders.
The material ESG issues were identified under four categories: Material to both sector and organization, Material to sector, Material to organization, and Immaterial. 21 issues arose to be material to both sector and organization. These are as follows: Economic (6)
1. Financial Performance
2. Market Presence
3. Geographical Positioning and Management
4. Brand Positioning and Management
5. Innovation and Digitization
6. Customer Experience
Environment (1)
1. Environmental Compliance
Social (6)
1. Customer Health and Safety
2. Diversity and Equal Opportunity
3. Non-discrimination
4. Workplace Health and Safety
5. Labor Relations
6. Talent Acquisition and Retention
Governance (8) 1. Anti-Fraud and Anti-Bribery
2. Data Management and Security Practices
3. Customer Privacy
4. Anti-Corruption /Whistle Blower Protection
5. Ethics and Integrity
6. Human Rights Protection
7. Financial Risk Management
8. Regulations and Compliance Management
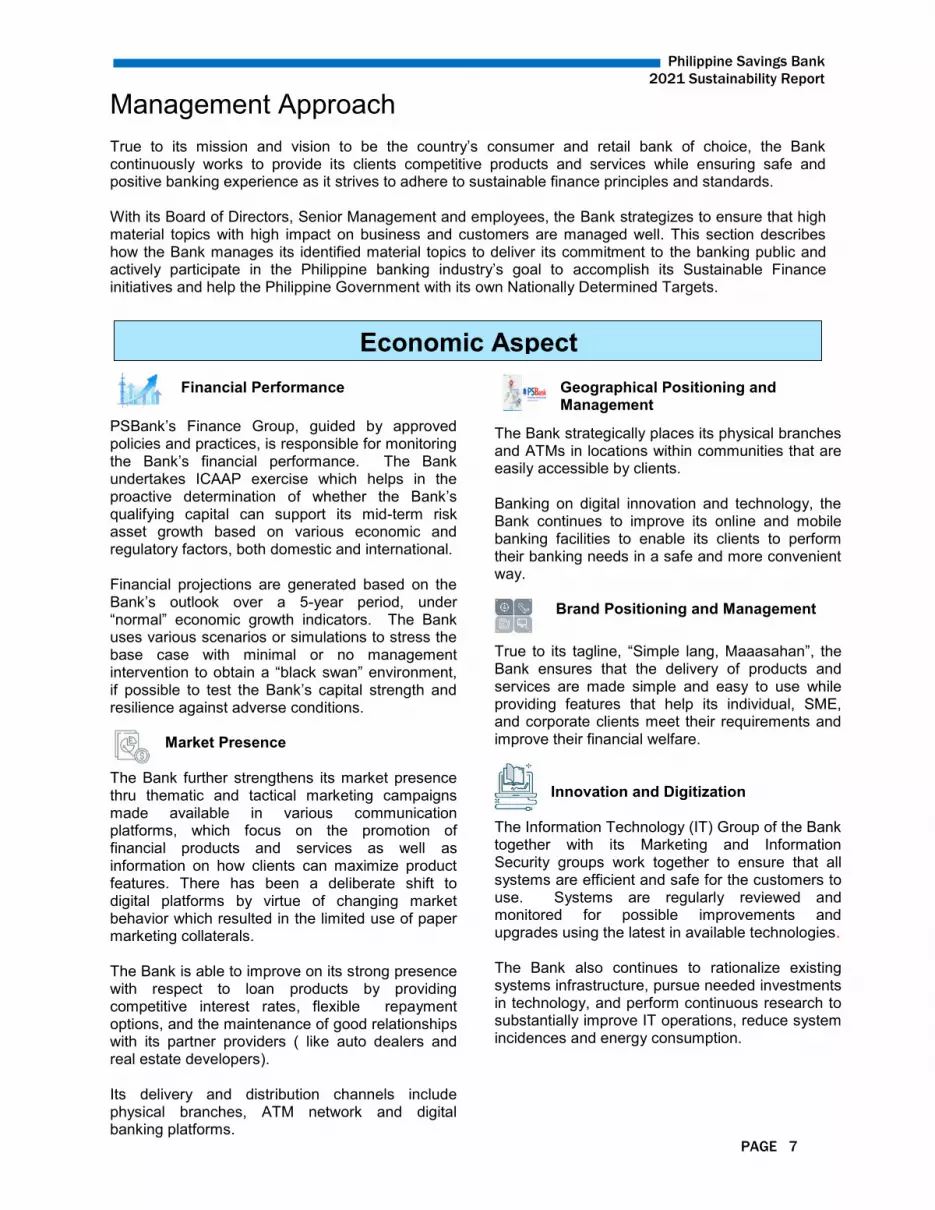
Philippine Savings Bank 2021 Sustainability Report
PAGE 7
Management Approach True to its mission and vision to be the country’s consumer and retail bank of choice, the Bank continuously works to provide its clients competitive products and services while ensuring safe and positive banking experience as it strives to adhere to sustainable finance principles and standards. With its Board of Directors, Senior Management and employees, the Bank strategizes to ensure that high material topics with high impact on business and customers are managed well. This section describes how the Bank manages its identified material topics to deliver its commitment to the banking public and actively participate in the Philippine banking industry’s goal to accomplish its Sustainable Finance initiatives and help the Philippine Government with its own Nationally Determined Targets.
Financial Performance
PSBank’s Finance Group, guided by approved policies and practices, is responsible for monitoring the Bank’s financial performance. The Bank undertakes ICAAP exercise which helps in the proactive determination of whether the Bank’s qualifying capital can support its mid-term risk asset growth based on various economic and regulatory factors, both domestic and international. Financial projections are generated based on the Bank’s outlook over a 5-year period, under “normal” economic growth indicators. The Bank uses various scenarios or simulations to stress the base case with minimal or no management intervention to obtain a “black swan” environment, if possible to test the Bank’s capital strength and resilience against adverse conditions.
Market Presence
The Bank further strengthens its market presence thru thematic and tactical marketing campaigns made available in various communication platforms, which focus on the promotion of financial products and services as well as information on how clients can maximize product features. There has been a deliberate shift to digital platforms by virtue of changing market behavior which resulted in the limited use of paper marketing collaterals. The Bank is able to improve on its strong presence with respect to loan products by providing competitive interest rates, flexible repayment options, and the maintenance of good relationships with its partner providers ( like auto dealers and real estate developers). Its delivery and distribution channels include physical branches, ATM network and digital banking platforms.
Geographical Positioning and Management
The Bank strategically places its physical branches and ATMs in locations within communities that are easily accessible by clients. Banking on digital innovation and technology, the Bank continues to improve its online and mobile banking facilities to enable its clients to perform their banking needs in a safe and more convenient way.
Brand Positioning and Management
True to its tagline, “Simple lang, Maaasahan”, the Bank ensures that the delivery of products and services are made simple and easy to use while providing features that help its individual, SME, and corporate clients meet their requirements and improve their financial welfare.
Innovation and Digitization
The Information Technology (IT) Group of the Bank together with its Marketing and Information Security groups work together to ensure that all systems are efficient and safe for the customers to use. Systems are regularly reviewed and monitored for possible improvements and upgrades using the latest in available technologies. The Bank also continues to rationalize existing systems infrastructure, pursue needed investments in technology, and perform continuous research to substantially improve IT operations, reduce system incidences and energy consumption.
Economic Aspect

Philippine Savings Bank 2021 Sustainability Report
PAGE 8
Customer Service
The Bank continuously strives to be the country's consumer and retail bank of choice, by conforming to the highest standards of integrity, professionalism and teamwork. The Bank commits to provide its customers superior products and reliable services that contribute to social and environmental sustainability.
Environmental Compliance
PSBank continues to manage the environmental impacts of its owned buildings and operations with appointed Pollution Control Officers and Managing Heads for the Head Office and Branch Clusters across the country to ensure full compliance with applicable environmental laws and regulations. Annual policy and process review is performed to ensure that they remain in accordance with existing and new laws and regulations.
Customer Health and Safety
To ensure that both customers and employees are able to engage with each other comfortably and safely amidst the rise of health issues and concerns, the Bank ensures that health and safety protocols are continuously strengthened and strictly followed by employees, customers and visitors. Strict monitoring mechanisms and contact tracing processes are in place. The Bank’s IT Group and Business Unit Project Sponsors deliver several online banking and digital products and services to ensure that identified environmental and social risks do not disrupt the Bank’s services to its banking public.
Diversity and Equal Opportunity
The Bank believes in the importance of diversity in promoting innovation, inclusive growth, and maintaining a collaborative environment. The Bank employs and promotes competent individuals regardless of gender, age, religion and cultural ethnicity.
Non-discrimination and Labor Relations
The Bank ensures strict implementation of its Code of Conduct and maintains a strong partnership with its Employee Union. Through CXHRG – People and Labor Relations Department, the Bank closely monitors the compliance of its Branches and Head Office Units with all necessary DOLE certification and requirements. This contributed to the Bank’s earning a satisfactory rating in the DOLE Audit Exercise.
Workplace Health and Safety
As the Covid-19 pandemic lingers, the Bank intensifies its awareness and educational drive on Health and Safety; and regularly conducts a bank-wide Basic Health and Safety Training Course.
Talent Acquisition and Retention
The Bank believes that each employee should be given equal opportunity to improve oneself and attain one’s highest potential. It uses a Competency Framework to ensure that all employees’ skill sets are considered, and matched with existing and future talent requirements of the business. The said framework helps strengthen the Bank’s succession planning initiatives to identify, grow and retain internal talents while ensuring a sustainable manpower pool for business continuity.
Human Rights
PSBank, governed by its policies and Code of Conduct, upholds the human rights of its stakeholders, customers and employees.
Anti-Fraud and Anti-Bribery; Anti-Corruption /Whistle Blower Protection
The Bank’s Fraud Management Group uses several tools and industry best practices for early detection, prevention, and management of internal and external fraud. The Bank’s Code of Conduct and whistleblowing policy are in place to guide employees in reporting impropriety or malpractice committed by co-employee(s) or third party(ies).
Environmental Aspect
Social Aspect
Governance Aspect
Philippine Savings Bank 2021 Sustainability Report
PAGE 9
The whistleblower is protected from any form of harassment as a result of any disclosure done in good faith.
Data Management and Security Practices
The Bank’s Data Privacy Manual is supported by its Data Security Framework. It ensures that client data are properly secured throughout their lifetime in the Bank – from the encrypted collection of data, to storage and processing, and secure disposal should the need or requirement arise.
Customer Privacy
We protect customer data through multiple layers of security, as well as policies that are closely intertwined with our business processes. Our Data Privacy Officer (DPO) is responsible for ensuring compliance with the guidelines and directives of the country’s strict Data Privacy law.
Ethics and Integrity
PSBank subscribes to and adopts the State’s policy to protect the: (1) integrity and confidentiality of accounts and ensure that it shall not be used as a money laundering/terrorism financing site and/or conduit for the proceeds of unlawful activities; and (2) life, liberty and property from acts of terrorism by condemning such acts and those who support and finance it as a crime against the Filipino people, against humanity, and against the law of nations. Image Source: This section has been designed using images from Freepik.com and canva.com
Financial Risk Management
In managing its liquidity position, the Bank ensures that it has more than adequate funds to meet maturing obligations. It uses tools to measure liquidity risk arising from mismatches of its assets and liabilities. It administers stress testing to assess its funding needs and strategies under various conditions.
Regulations and Compliance Management
The Bank continually strives to maintain a strong compliance culture in the midst of an ever-dynamic banking regulatory landscape. It proactively identifies, monitors, assesses, and addresses emerging compliance issues. It vigorously promotes continuing education through formal/informal trainings, compliance awareness testing, compliance checking, and advisory service through clear and open communication lines. The Bank also fosters a good corporate governance culture by benchmarking against industry best practices and standards.

Philippine Savings Bank 2021 Sustainability Report
PAGE 10
Economic Impact
Direct Economic Impact
In 2021, the Bank faced challenges brought by the lingering effects of the pandemic. The disrupted economic growth led to a decrease in overall credit quality in the market and tighter credit controls for banks. These factors contributed to a decrease in the Bank’s overall loan portfolio. Despite these, the Bank ensured to meet its commitments to internal and external stakeholders. It implemented policies and processes that will enable its resilient manpower compliment to adopt and ensure operational efficiency. The agile and adoptive strategies implemented as well as the conscious effort of the Bank to lower its operational cost enabled it to still end the year positive, and generate a direct economic value of Php12.1 billion, higher by 16% compared to the economic value generated in 2020. Shareholders and other capital payments amounted to Php1.2 billion or 12.19% while employees’ wages and benefits amounted to Php3.5 billion or 33.74%. The Bank’s operating cost amounted to Php3.6 billion or 34.5% of its total economic value. Contributions to government thru tax payments and licenses amounted to Php2 billion or 19.5%, while contributions to the community through donations amounted to Php6.8 million.
EXHIBIT 2. ECONOMIC VALUE, FY 2021
Financial Inclusion and Literacy PSBank does its share in improving overall financial literacy in the country. The Bank continues to run two financial literacy campaigns – “Be Aware” and “Good to Know”. The Be Aware campaign aims to raise awareness among the banking public on various scams they may encounter during financial transactions, and to empower them with the information and knowledge to protect their hard-earned savings and themselves from becoming victims of fraud. On the other hand, Good to Know aims to cultivate the value of saving and investing among the banking public and empower them with a holistic understanding of the Bank’s existing and new products and services to help them make better saving and investment decisions. Through the Be Aware campaign, the Bank developed 290 materials on Phishing, Pharming, Vishing, Skimming, SMShing, Email scam, Social Media scam, Identity Theft, Check Fraud, Clickbaits, Shopping scam, Travel scam, Unwanted Loans and Obligations, Employment scam, and Ransomware. The Bank released the materials in the following 9 channels: (a) PSBank Website "What's New" Section, (b) PSBank Social Media (Facebook, Twitter, Instagram), (c) PSBank Mobile app advisories/reminders (d) PSBank Online (Inbox) (e) Email blast to clients' personal email; (f) Press Releases; (g) SMS blast; (h) PSBank newsletter; (i) PSBank branch Q monitors.
In total, the Financial Inclusion and Literacy program of the Bank reached 3.52 million – excluding press releases issued in media for the general public.
PHP 12.1B Economic
Value Generated

Philippine Savings Bank 2021 Sustainability Report
PAGE 11
EXHIBIT 3.FINANCIAL INCLUSION AND LITERACY REACH, FY 2021
The pandemic continues to affect the business landscape, resulting to interruptions in the supply chain, drop in consumer spending, loss of revenue due to lockdowns, employment lay-offs, and closure of businesses. SMEs were not spared, and for PSBank, its SME portfolio saw a significant contraction in 2021. See Exhibit 4 for details. EXHIBIT 4. CREDIT LENDING FOR COMMUNITY AND SMEs, FY2020 VS FY2021
CREDIT LENDING 2020 2021
Credit Lending for Community
Total amount of loans outstanding qualified to promote community development (PHP)
0.197 billion 0.017 billion
Total number of loans outstanding qualified to promote community development
8 8
Credit Lending for SMEs
Total amount of loans outstanding qualified to promote small business (PHP)
6.026 billion 4.647 billion
Total number of loans outstanding qualified to promote small business
1,821 1,380
Responsible Investment PSBank supports the financial requirements of the SME sector. It offers term loans, credit lines, letters of credit and trust receipts, bills purchase, and discounting lines which are integral to support their capital requirements, acquisition of fixed assets, and funding for day-to-day operations. As such, the Bank contributes to the generation of employment and spurring of socio-economic growth. In 2021, the SME portfolio contracted as a result of the prolonged effect of the pandemic. The Philippine economy has adapted by being open for the most part which then created some level of normalcy and stability. However, businesses were still severely affected due to the start-stop nature of their operations during COVID infection surges. The Bank supported these borrowers with payment solutions tailored to their cash flow.

Philippine Savings Bank 2021 Sustainability Report
PAGE 12
PSBank uses an Environmental and Social Risk Checklist for its material exposures. This aids credit officers in determining the exposure to any future or present financial, legal, and reputational risks arising from environmental and social concerns. Results of this internal assessment are then disclosed to the approving committee for deliberation and action. Necessary licenses and permits from the applicable governing agencies are included as part of loan booking requirements. In turn, borrowers need to comply with social responsibility and environmental standards. The Bank’s loan portfolio is multi-faceted and contributes to several SDGs. Bulk of its lending portfolio supports SDG 9 – Industry Innovation and Infrastructure. Top 3 sectors which the Bank contributes to are: (1) 22% - Electricity, Gas, Steam and Air; (2) 17% - Wholesale and retail Trade; (3) 16% Financial and Insurance Activities. Please refer to Exhibit 5 – Sector wise credit lending for the detailed contribution distribution. EXHIBIT 5: SECTOR WISE CREDIT LENDING, FY2020 VS FY2021 Others (SDG3, SDG6, SDG9,
SDG13, SDG14, SDG15). Activities of Households as Employers and Undifferentiated Goods-and- Services- Producing Activities of Households for Own Use Construction (SDG9) Electricity, Gas, Steam and Air Conditioning Supply (SDG 9) Financial and Insurance Activities (SDG 8) Manufacturing (SDG9) Other Service Activities Real Estate Activities (SDG9) Transportation and Storage (SDG9) Wholesale and Retail Trade; Repair of Motor Vehicles and Motorcycles (SDG9)
As of reporting period, FY2021, PSBank made an investment of Php471 million on ESG themed projects.
Environmental Impact PSBank continues to manage the environmental impacts of its owned buildings and operations. Led by Pollution Control Officers and Managing Heads for the Head Office and Branch Clusters across the country, the Bank engages Service Providers that assist in its compliance with environmental regulations such as: Republic Act (RA) 8749 also known as the Philippine Clean Air Act of 1999; RA 6969 or The Toxic and Hazardous Substances and Nuclear Wastes Control Act of 1990; and RA 9275, also known as The Philippine Clean Water Act of 2004.
2020 Loan Exposure
2021 Loan Exposure
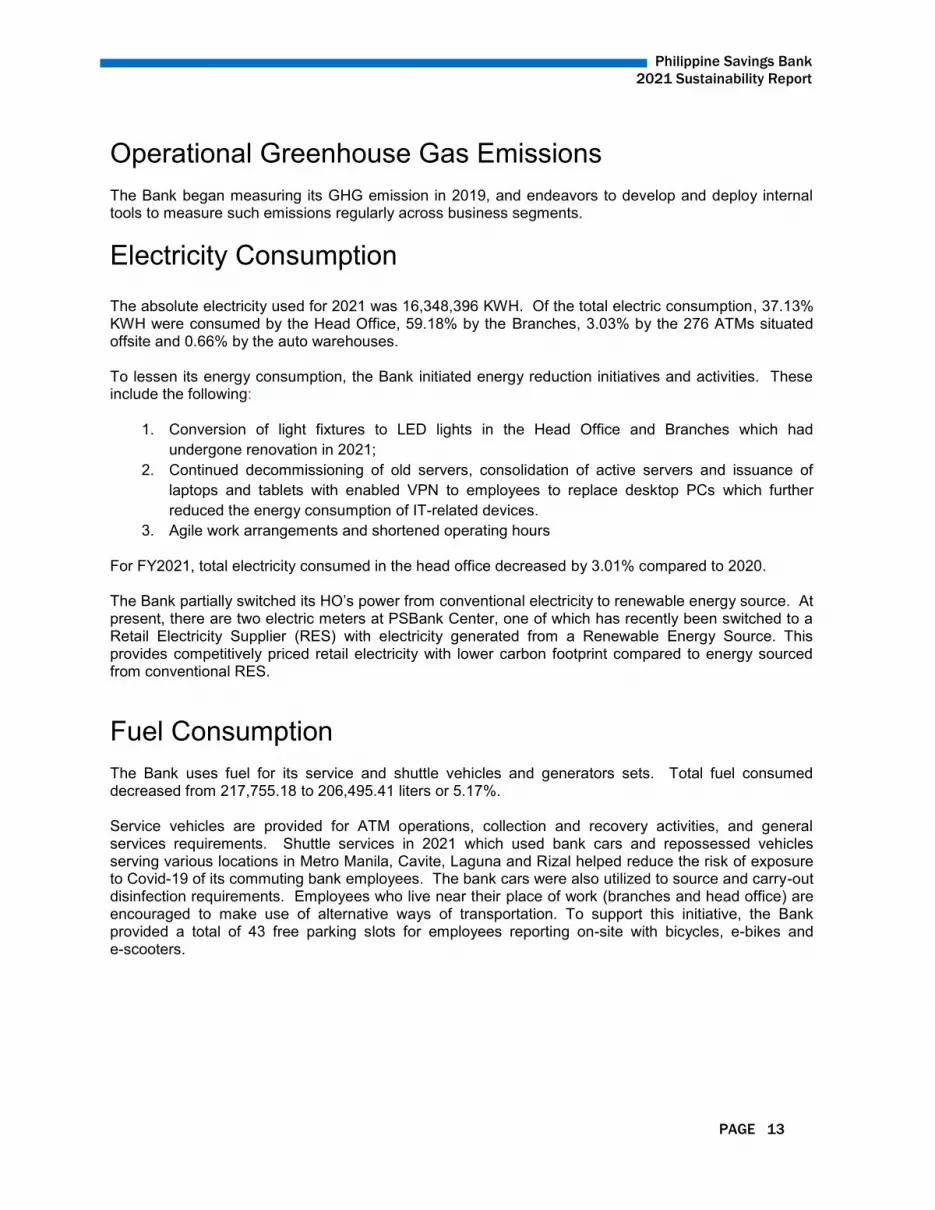
Philippine Savings Bank 2021 Sustainability Report
PAGE 13
Operational Greenhouse Gas Emissions
The Bank began measuring its GHG emission in 2019, and endeavors to develop and deploy internal tools to measure such emissions regularly across business segments.
Electricity Consumption The absolute electricity used for 2021 was 16,348,396 KWH. Of the total electric consumption, 37.13% KWH were consumed by the Head Office, 59.18% by the Branches, 3.03% by the 276 ATMs situated offsite and 0.66% by the auto warehouses. To lessen its energy consumption, the Bank initiated energy reduction initiatives and activities. These include the following:
1. Conversion of light fixtures to LED lights in the Head Office and Branches which had
undergone renovation in 2021;
2. Continued decommissioning of old servers, consolidation of active servers and issuance of
laptops and tablets with enabled VPN to employees to replace desktop PCs which further
reduced the energy consumption of IT-related devices.
3. Agile work arrangements and shortened operating hours
For FY2021, total electricity consumed in the head office decreased by 3.01% compared to 2020. The Bank partially switched its HO’s power from conventional electricity to renewable energy source. At present, there are two electric meters at PSBank Center, one of which has recently been switched to a Retail Electricity Supplier (RES) with electricity generated from a Renewable Energy Source. This provides competitively priced retail electricity with lower carbon footprint compared to energy sourced from conventional RES.
Fuel Consumption The Bank uses fuel for its service and shuttle vehicles and generators sets. Total fuel consumed decreased from 217,755.18 to 206,495.41 liters or 5.17%. Service vehicles are provided for ATM operations, collection and recovery activities, and general services requirements. Shuttle services in 2021 which used bank cars and repossessed vehicles serving various locations in Metro Manila, Cavite, Laguna and Rizal helped reduce the risk of exposure to Covid-19 of its commuting bank employees. The bank cars were also utilized to source and carry-out disinfection requirements. Employees who live near their place of work (branches and head office) are encouraged to make use of alternative ways of transportation. To support this initiative, the Bank provided a total of 43 free parking slots for employees reporting on-site with bicycles, e-bikes and e-scooters.
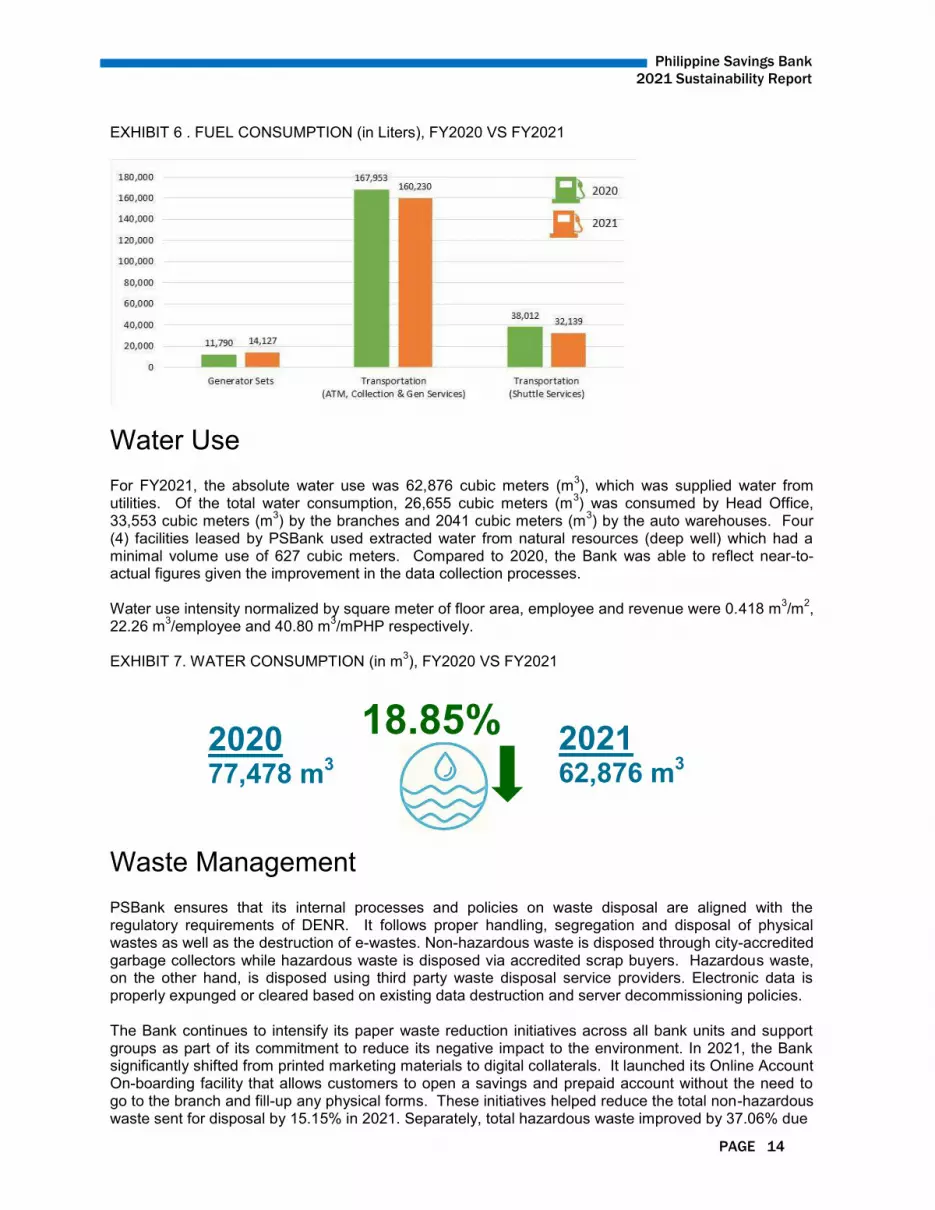
Philippine Savings Bank 2021 Sustainability Report
PAGE 14
EXHIBIT 6 . FUEL CONSUMPTION (in Liters), FY2020 VS FY2021
Water Use For FY2021, the absolute water use was 62,876 cubic meters (m
3), which was supplied water from
utilities. Of the total water consumption, 26,655 cubic meters (m3) was consumed by Head Office,
33,553 cubic meters (m3) by the branches and 2041 cubic meters (m
3) by the auto warehouses. Four
(4) facilities leased by PSBank used extracted water from natural resources (deep well) which had a minimal volume use of 627 cubic meters. Compared to 2020, the Bank was able to reflect near-to-actual figures given the improvement in the data collection processes. Water use intensity normalized by square meter of floor area, employee and revenue were 0.418 m
3/m
2,
22.26 m3/employee and 40.80 m
3/mPHP respectively.
EXHIBIT 7. WATER CONSUMPTION (in m
3), FY2020 VS FY2021
Waste Management PSBank ensures that its internal processes and policies on waste disposal are aligned with the regulatory requirements of DENR. It follows proper handling, segregation and disposal of physical wastes as well as the destruction of e-wastes. Non-hazardous waste is disposed through city-accredited garbage collectors while hazardous waste is disposed via accredited scrap buyers. Hazardous waste, on the other hand, is disposed using third party waste disposal service providers. Electronic data is properly expunged or cleared based on existing data destruction and server decommissioning policies. The Bank continues to intensify its paper waste reduction initiatives across all bank units and support groups as part of its commitment to reduce its negative impact to the environment. In 2021, the Bank significantly shifted from printed marketing materials to digital collaterals. It launched its Online Account On-boarding facility that allows customers to open a savings and prepaid account without the need to go to the branch and fill-up any physical forms. These initiatives helped reduce the total non-hazardous waste sent for disposal by 15.15% in 2021. Separately, total hazardous waste improved by 37.06% due
2020 77,478 m
3
2021 62,876 m
3
18.85%

Philippine Savings Bank 2021 Sustainability Report
PAGE 15
to fewer electronic scraps which more than offset the increase in waste from used batteries, empty printer cartridges and used genset or engine oil. The Bank endeavors to further reduce waste generation as it boosts its efforts towards digitalization, and heightened awareness on environmental concerns across the organization. EXHIBIT 8. WASTE DISPOSAL (in Tonnes), FY2020 VS FY2021
WASTE DISPOSAL 2020 2021 % Change
Total Non-Hazardous Waste (in tonnes)
564.08 478.61 -15.15%
Total Hazardous Waste (in tonnes)
10.36 6.52 -37.06%
Total Waste (in tonnes)
574.44 485.13 -15.55%
Social Impact PSBank has always been mindful of its social impact relative to providing financial products and services and its overall operations.
Workforce Diversity The Bank believes in the value of diversity to promote innovation, inclusive growth, and a collaborative organizational environment. It has 2,824 employees – 63.53% are female employees, and 36.47% are male. In terms of age, 71.39% are between ages 30 to 50, followed by the ones below 30 at 21.81% and those over age 50 at 6.80%. The Bank’s Board of Directors has 9 members, two of which are female or 22% of the board make-up.
EXHIBIT 9. WORKFORCE GROUP & GENDER DIVERSITY,FY2020 vs FY2021

Philippine Savings Bank 2021 Sustainability Report
PAGE 16
EXHIBIT 10. WORKFORCE AGE DIVERSITY,FY2020 vs FY2021
Workplace Safety and Labor Practices As with the rest of the country, PSBank continues to be affected by the ongoing COVID 19 pandemic. To lessen the impact and limit the spread of the COVID 19 virus, the Bank initiated several programs which addressed mental health, physical fitness, workplace wellness, social connection, spiritual consciousness, and environmental stewardship. In 2021, the total recorded incident rate (TRIR) increased by 3.89% with 2 recorded incidental deaths, 165 work-related ill-health from the virus, and 3 work-related injuries. The Bank’s Near Miss Frequency Rate (NMFR) also increased by 0.04%. Proper health and sanitation protocols were further intensified to ensure that similar incidents may be avoided or reduced. EXHIBIT 11. WORKPLACE SAFETY, FY2020 vs FY2021
WORKPLACE SAFETY 2020 2021 % Change
Total recordable incident rate (TRIR) 18.74% 22.63% 3.89%
Near miss frequency rate (NMFR) 0.24% 0.28% 0.04%
Among the highlights of the Bank’s efforts to protect its base are the following. Regular disinfection and strict observance of health protocols were continuously observed in all
Bank premises.
With the launch of #PSBakuna campaign, the Bank achieved 99.65% vaccination rate. 2,814 of
2,824 PSBankers became certified #PSBakunado in 2021.
Over-all Employee Well-being and Workplace Wellness were top priorities in 2021. Initiatives
led by the Health & Safety team include the 24/7 Flu Management team (24/7 monitoring,
assistance, sending of groceries, basic medicines, care kit, ambulance assistance) which
ensured high recovery rate at 99.75% (788/790) among PSBankers who tested positive to
COVID-19. The team also issued a total of 52 advisories on health and 4 on safety. The
Occupational Safety and Health Committee (OSHCom) met monthly to review the Bank’s Health & Safety protocols and align them with the Guidelines of DTI, DOLE, DOH, IATF, and
other concerned government agencies. Holding of spiritual activities and services for the soul
such as regular virtual masses for Catholics and virtual fellowships for other religious
denominations continued.
757
1,979
178
616
2,016
192
0
500
1000
1500
2000
2500
Under 30 30-50 Over 50
2020 2021
Philippine Savings Bank 2021 Sustainability Report
PAGE 17
The Bank continued its programs on Mental Health. These are the Mind Over Matter Program,
psychological consultation services, certification of 18 psychological first aiders and issuance of
52 advisories on mental health via #SelfcareSunday for its employees. For its customers, the
Bank launched the #PSBankCares Webinar Series – the first of which was “Loosening Grip on
Grief: Letting Go After Loss” which was open to and attended by customers and the general
public.
28 COVID-19 advisories and 81 HR advisories were released through People Communication
to ensure that all teams and employees are still connected, guided and apprised of the latest
safety protocols.
The PSBank Clinic also operated a Community Clinic which provides accessible healthcare to PSBankers reporting onsite. It offered PSBankers access to their basic medical needs all year-round. As the Bank’s Wellness Center, it continued with its mandate to provide immediate healthcare to employees as well as address further needs for outpatient care.
To ensure the continuity of the Bank’s operations while keeping the employees safe during the second year of the pandemic, several measures to manage workforce and productivity were adopted including the following:
o Disaster preparedness drills (i.e. fire and earthquake drills) and Business Continuity Plan (BCP) Refresher to ensure that operations are not hampered during an emergency scenario and that PSBankers are reminded of their respective roles during such scenarios. Reporting to the back-up site for certain critical units and services was activated and were proven ready for BAU requirements.
o Pick-up Point to PSBank (P2P) Shuttle Service continued operating and serving employees until November 2021. The shuttle services were offered FREE during the Enhanced Community Quarantine (ECQ) and other quarantine classifications. A route-based premium charging via contactless QR was put in place.
As a unionized organization, the Bank maintains an agreement with the PSBank Employee’s Union (PSBEU) with the intent and purpose of promoting and improving the economic and social relationship between the Bank and the Union through the Collective Bargaining Agreement (CBA). The CBA covers 59.95% of the Bank’s workforce. It establishes a better understanding relative to the rates of pay, hours of work and other terms and conditions of employment, providing expeditious means for the amicable adjustment of all industrial disputes, and to otherwise mutually confirm industrial peace and harmony. A CBA negotiation is held every three years between the Bank and the Union. For the 2022-2024 cycle, the Bank closed the negotiation in December 2021. It was the first to be done virtually from kick-off and actual negotiations to ceremonial signing. The Bank and PSBEU continues to align regularly through the Labor Management Council (LMC) appropriately called Talks on Employee Affairs and other Matters or TEAM. The Council is composed of three representatives each from management and union who meet once a month to discuss any or all matters affecting the employees of the Bank. To strengthen its Employee Discipline Management, the Bank beefed up its People and Labor
Relations team, resulting to significant improvement in the average turnaround time for employee case
handling from 34 days in 2020 to 16 days in 2021. There were no legal actions or employee grievances
involving forced or child labour.
The continuous challenge of the pandemic made the Bank even more committed to ensure a sound
Employee Experience despite the absence of physical activities. Virtual platforms were used to connect
with colleagues and observe various global, national, and institutional celebrations to boost Employee
Advocacy and Employee Engagement. These helped achieve the highest scores on record for both
Philippine Savings Bank 2021 Sustainability Report
PAGE 18
Workforce Engagement Score or WES-60 and employee-Net Promoter Score (e-NPS) since their
implementation in 2019 and 2016 respectively.
On WES-60, there are 60 questions that each employee rates for total of 5 different dimensions of employee engagement. With the highest possible score of 4.0, comparative data for 2020 vs 2021 are as follows:
o Company Support (3.66 to 3.73) o Job Performance (3.81 to 3.85) o Working Relationships (3.80 to 3.83) o Dedication (3.85 to 3.88); and o Company Policies and Goals (3.90 to 3.92) On e-NPS, the Bank achieved an all-time high of +87, a +7 increase from the previous year’s
+80. The Bank has always been committed to provide several government-mandated and voluntary benefits to its employees such as leaves, salary loans, several loans options, medical benefits, and other benefits. Many of the benefits administration activities were automated for greater efficiency of service delivery to employees and their dependents. The compulsory retirement age for regular employees (officers and staff) is at 55 years old based on the Bank’s Retirement and Gratuity Plan, duly approved by the Bureau of Internal Revenue. To aid in workforce planning, HR reviews the roster of employees and prepares for these expected employee movements for a smooth transition for both the retiring employee and affected business unit. The Bank accords deferential treatment, and provides Off-boarding Kit containing send-off tokens and mementos to retired employees. Voluntary turn-over rate in 2021 was lower at 5.4% alongside a lower involuntary turnover rate for employees at 0.7% EXHIBIT 12. LABOR PRACTICES, FY2020 vs FY2021
Employee Training and Development PSBank recognizes that training and education are critical components of the goal to strengthen employee skills and competencies, aside from supporting their professional and personal development. To achieve these, mandatory courses and minimum training hours are defined by job function. Through the PSBank Business Campus (PBC), the Bank’s official training arm, 45,184 hours were dedicated to employee training, with share of female employees at 64%. Training hours in 2021 decreased compared to 2020 due to lower employee headcount at 2,824. Total expenditure was Php3.8 million, which is 4.70% higher than the previous year’s expense because of dozens of additional training programs. A total of 665 trainings were conducted, significantly increasing the previous year’s total of only 189.
LABOR PRACTICES 2020 2021
Voluntary turnover rate for employees 8.6% 5.4%
Involuntary turnover rate for employees 1.2% 0.7%
Total amount of monetary losses as a result of legal proceedings associated with labor law violations and/or employment discrimination
None None
Percentage of employees earning minimum wage
0%. The Bank provides wages above minimum rate.
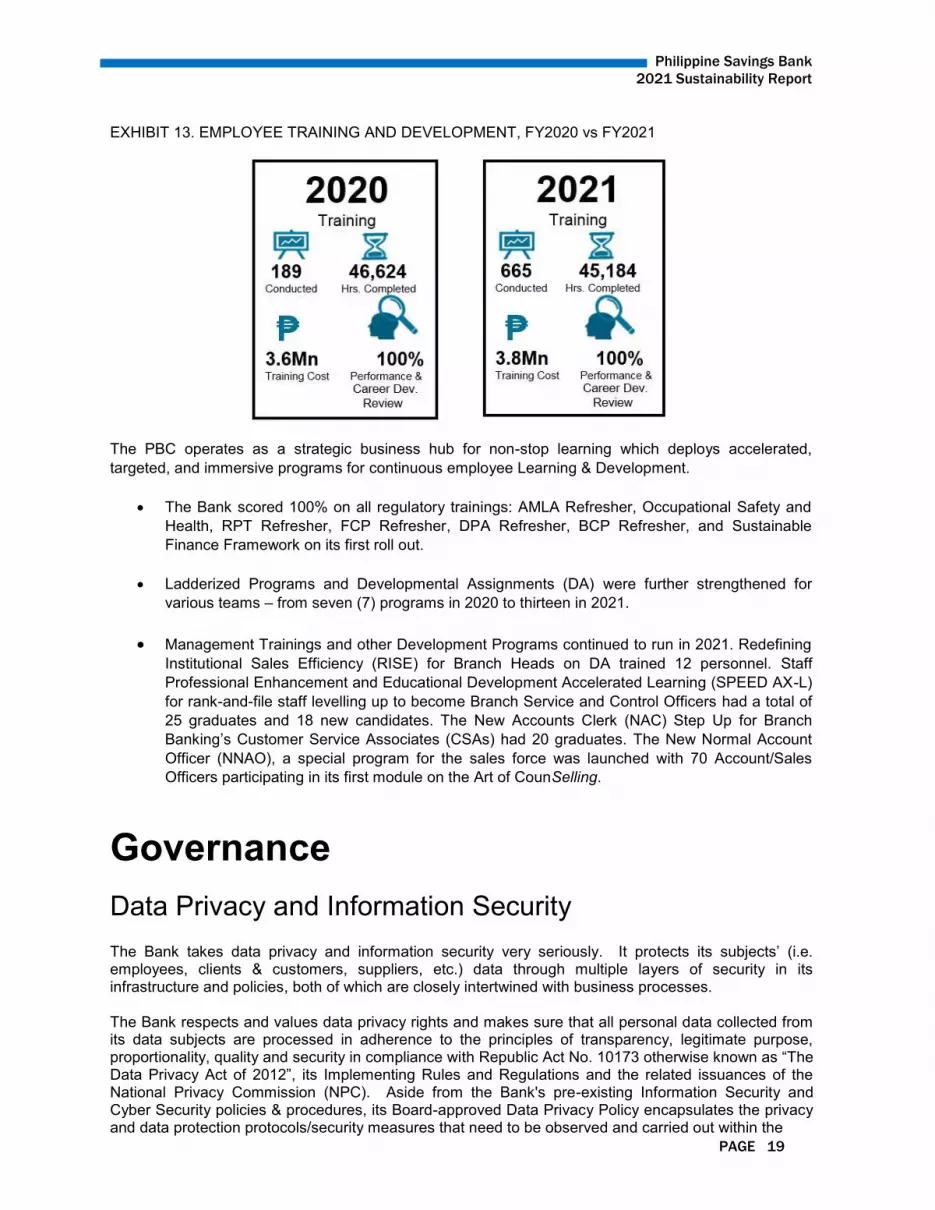
Philippine Savings Bank 2021 Sustainability Report
PAGE 19
EXHIBIT 13. EMPLOYEE TRAINING AND DEVELOPMENT, FY2020 vs FY2021
The PBC operates as a strategic business hub for non-stop learning which deploys accelerated,
targeted, and immersive programs for continuous employee Learning & Development.
The Bank scored 100% on all regulatory trainings: AMLA Refresher, Occupational Safety and
Health, RPT Refresher, FCP Refresher, DPA Refresher, BCP Refresher, and Sustainable
Finance Framework on its first roll out.
Ladderized Programs and Developmental Assignments (DA) were further strengthened for
various teams – from seven (7) programs in 2020 to thirteen in 2021.
Management Trainings and other Development Programs continued to run in 2021. Redefining
Institutional Sales Efficiency (RISE) for Branch Heads on DA trained 12 personnel. Staff
Professional Enhancement and Educational Development Accelerated Learning (SPEED AX-L)
for rank-and-file staff levelling up to become Branch Service and Control Officers had a total of
25 graduates and 18 new candidates. The New Accounts Clerk (NAC) Step Up for Branch
Banking’s Customer Service Associates (CSAs) had 20 graduates. The New Normal Account
Officer (NNAO), a special program for the sales force was launched with 70 Account/Sales
Officers participating in its first module on the Art of CounSelling.
Governance
Data Privacy and Information Security The Bank takes data privacy and information security very seriously. It protects its subjects’ (i.e. employees, clients & customers, suppliers, etc.) data through multiple layers of security in its infrastructure and policies, both of which are closely intertwined with business processes. The Bank respects and values data privacy rights and makes sure that all personal data collected from its data subjects are processed in adherence to the principles of transparency, legitimate purpose, proportionality, quality and security in compliance with Republic Act No. 10173 otherwise known as “The Data Privacy Act of 2012”, its Implementing Rules and Regulations and the related issuances of the National Privacy Commission (NPC). Aside from the Bank's pre-existing Information Security and Cyber Security policies & procedures, its Board-approved Data Privacy Policy encapsulates the privacy and data protection protocols/security measures that need to be observed and carried out within the
Philippine Savings Bank 2021 Sustainability Report
PAGE 20
Bank for specific circumstances (i.e. from collection to destruction) directed towards the fulfillment and realization of the rights of its data subjects and protection of personal data against natural dangers such as accidental loss or destruction, and human dangers such as unlawful access, fraudulent misuse, unlawful destruction, alteration and contamination. The Bank’s Data Privacy Officer (DPO) is not just responsible for ensuring compliance with the guidelines and directives of the country’s strict Data Privacy law, but is also tasked with creating a culture of heightened awareness in data privacy within the Bank through employee trainings and awareness campaigns. Protection of data is tightly integrated in the data security practices and policies of the Bank. The Bank’s Data Privacy Manual is supported by the Data Security Framework from the Bank’s Information Security Group; and ensures that the client’s data is properly secured throughout its lifetime in the Bank – from the encrypted collection of data, to storage and processing, and secure disposal when the need or requirement arises. Bank applications that collect data from clients use strong network encryption and go through a
rigorous and regular application security testing by both internal and 3rd-party security testing teams. Critical databases in the Bank are actively monitored for suspicious activities. Additional approvals from the DPO and the Chief Information Security Officer (CISO) are required before any client data can be exported, extracted, processed or shared with other groups in the Bank or with 3rd-party entities. Secure disposal of hard drives is in place such that digital data are securely wiped out and the drives physically destroyed beyond recovery. Security controls are in place for remote VPN and Bring Your Own Device (BYOD) users where the Bank utilizes Mobile Device Management (MDM) technologies to separate company data from personal data in the personal devices of employees.
Security awareness campaigns also play an important role in the Bank's data privacy and security efforts. Programs for security awareness are rolled out by the Bank through its internal advisories, anti-phishing campaigns and even extends to its customers via the award-winning Be Aware! fraud awareness program. As of December 31, 2021, a total of 995,044 individual customer data were maintained by PSBank and, to date, the Bank has not suffered any data security breaches. For more information on PSBank’s Data Privacy Policy, you may refer to: https://www.psbank.com.ph/footer/privacy-policy.
Systemic Risk Management PSBank undertakes ICAAP exercise which helps in the proactive determination of whether the Bank’s qualifying capital can support its mid-term risk asset growth based on various economic and regulatory factors, both domestic and international. Financial projections are generated based on the company’s outlook over a 5-year period, under “normal” economic growth indicators. This base case scenario is then subjected to stress indicators, which include assumptions to stress the Bank’s Capital Adequacy Ratio (CAR). The Bank performs financial simulations to stress the base case with minimal or no management intervention to obtain a “black swan” environment, if possible. These include impact assessment of environment-related events such as volcanic eruption and earthquake. The purpose of these stress scenarios is to test the Bank’s capital strength and resilience against adverse conditions.
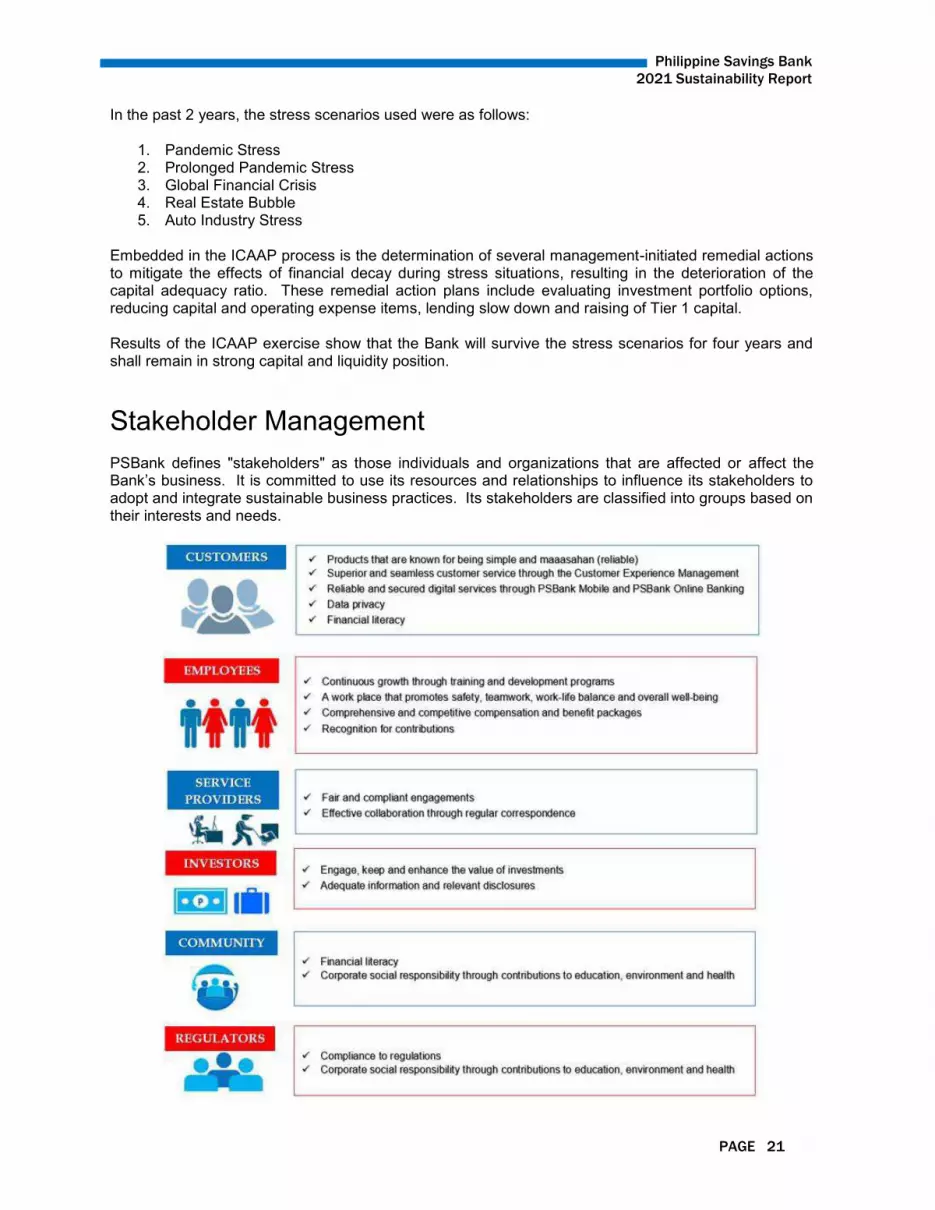
Philippine Savings Bank 2021 Sustainability Report
PAGE 21
In the past 2 years, the stress scenarios used were as follows:
1. Pandemic Stress 2. Prolonged Pandemic Stress 3. Global Financial Crisis 4. Real Estate Bubble 5. Auto Industry Stress
Embedded in the ICAAP process is the determination of several management-initiated remedial actions to mitigate the effects of financial decay during stress situations, resulting in the deterioration of the capital adequacy ratio. These remedial action plans include evaluating investment portfolio options, reducing capital and operating expense items, lending slow down and raising of Tier 1 capital. Results of the ICAAP exercise show that the Bank will survive the stress scenarios for four years and shall remain in strong capital and liquidity position.
Stakeholder Management
PSBank defines "stakeholders" as those individuals and organizations that are affected or affect the Bank’s business. It is committed to use its resources and relationships to influence its stakeholders to adopt and integrate sustainable business practices. Its stakeholders are classified into groups based on their interests and needs.

Philippine Savings Bank 2021 Sustainability Report
PAGE 22
For its customers, PSBank provides products and services that are known for being simple and maaasahan (reliable). In addition to having a network of 250 branches and 545 ATMs strategically located nationwide, it offers 24/7 banking services through PSBank Mobile and PSBank Online. With the effective adoption and integration of digital technology coupled with strong data analytics, the Bank gets better customer insights to meet the customers’ needs. The Bank is also accessible to customers through its Customer Experience Hotline, PSBank LiveChat, ISSA Chatbot, and PSBank Official accounts on social media. The Bank waived fees for interbank transfers thru InstaPay and PESONet to further promote digital payments. By mid-year, PSBank made available the booking of time deposits via Mobile and launched the national standard-compliant QR Code for use in fund transfers/payments. For the safety and convenience of loan customers, settlement of PSBank loans via InstaPay was also made available in the last quarter of the year. PSBank also continues to provide financial literacy through its award-winning financial literacy campaigns, “Be Aware!” and “Good to Know”. The Bank has put in place adequate information security and data protection policy guidelines, procedures, and control measures pursuant to information and cyber security rules, standards on data privacy and financial consumer protection. PSBank places high importance on the well-being, diversity, and development of its employees as it endeavors to provide a safe workplace that promotes safety, teamwork, and work-life balance thus helping them achieve their potentials. The Bank provides comprehensive compensation and benefit packages; and strives for employee retention through talent management and training and development programs. PSBank has in place the Personnel Committee (PERCOM) which oversees the evaluation of performance and career advancement of its employees, providing decisions on employee offenses/administrative cases, reviews personnel policies and procedures, including the Code of Conduct. The Retirement Committee is also in place to exclusively administer the Gratuity and Retirement Benefit Plan of the Bank. For its service providers, PSBank abides by Board-approved policies and regulations on engaging third-party suppliers or service providers covering accreditation, performance monitoring and renewal.
Business Ethics PSBank subscribes to and adopts the State’s policy to protect the: (1) integrity and confidentiality of accounts and to ensure that it shall not be used as a money laundering/terrorism financing site and/or conduit for the proceeds of unlawful activities; and (2) life, liberty and property from acts of terrorism by condemning such acts and those who support and finance it as a crime against the Filipino people, against humanity and against the law of nations. PSBank ensures that it executes all transactions with its customers in accordance with the AML/CFT policy guidelines, procedures, tools, and controls set forth in its regularly updated Money Laundering & Terrorism Financing Prevention Program (MLTFPP). Its MLTFPP, as posted in its intranet site for the guidance of all implementing personnel, primarily revolves around the basic AML/CFT controls required under existing AML/CFT laws, rules and regulations, namely: 1. Know Your Customer (KYC)/Customer Due Diligence (CDD) and Know Your Employee (KYE); 2. Ongoing Monitoring of Customers and their Transactions; 3. Covered and Suspicious Transactions Reporting; 4. Records Keeping and Retention; and 5. Employee Training and Continuing Education. Compliance with the requirements of this MLTFPP is continuously monitored by the Board-designated AML Compliance Officer (AMLCO) as the lead implementer under the Compliance Office.
Philippine Savings Bank 2021 Sustainability Report
PAGE 23
PSBank values all information received from whistle blowers and/or anonymous sources. It encourages all stakeholders to communicate, confidentially and without the risk of reprisal, legitimate concerns about illegal, unethical or questionable practices and transactions entered by any of its employees and officers. PSBank’s whistleblowing policy requires its employees to report any impropriety or malpractice committed by co-employee(s) or third party(ies) to their Group Heads or to the Customer Experience and Human Resources Group Head, the Fraud Management Group Head/ Division Heads, or the Chief Audit Executive/ Internal Audit Group Head for evaluation if it would warrant an investigation. The Anti-Corruption Policy of the Bank forms part of the Bank’s Code of Conduct. Violation of this Code merits the imposition of disciplinary sanctions/penalties ranging from reprimand, suspension to dismissal. The anti-corruption programs and procedures such as Reporting of Impropriety or Malpractice are likewise embodied in the Bank’s whistleblowing policy. EXHIBIT 14. GOVERNANCE INDICATORS, FY2021
GOVERNING POLICIES
Total amount of monetary losses as a result of legal proceedings associated with money laundering
None
Anti-money laundering policy in place? Yes
Whistle-Blower Protection Policy in place? Yes
Anti-corruption policy in place? Yes
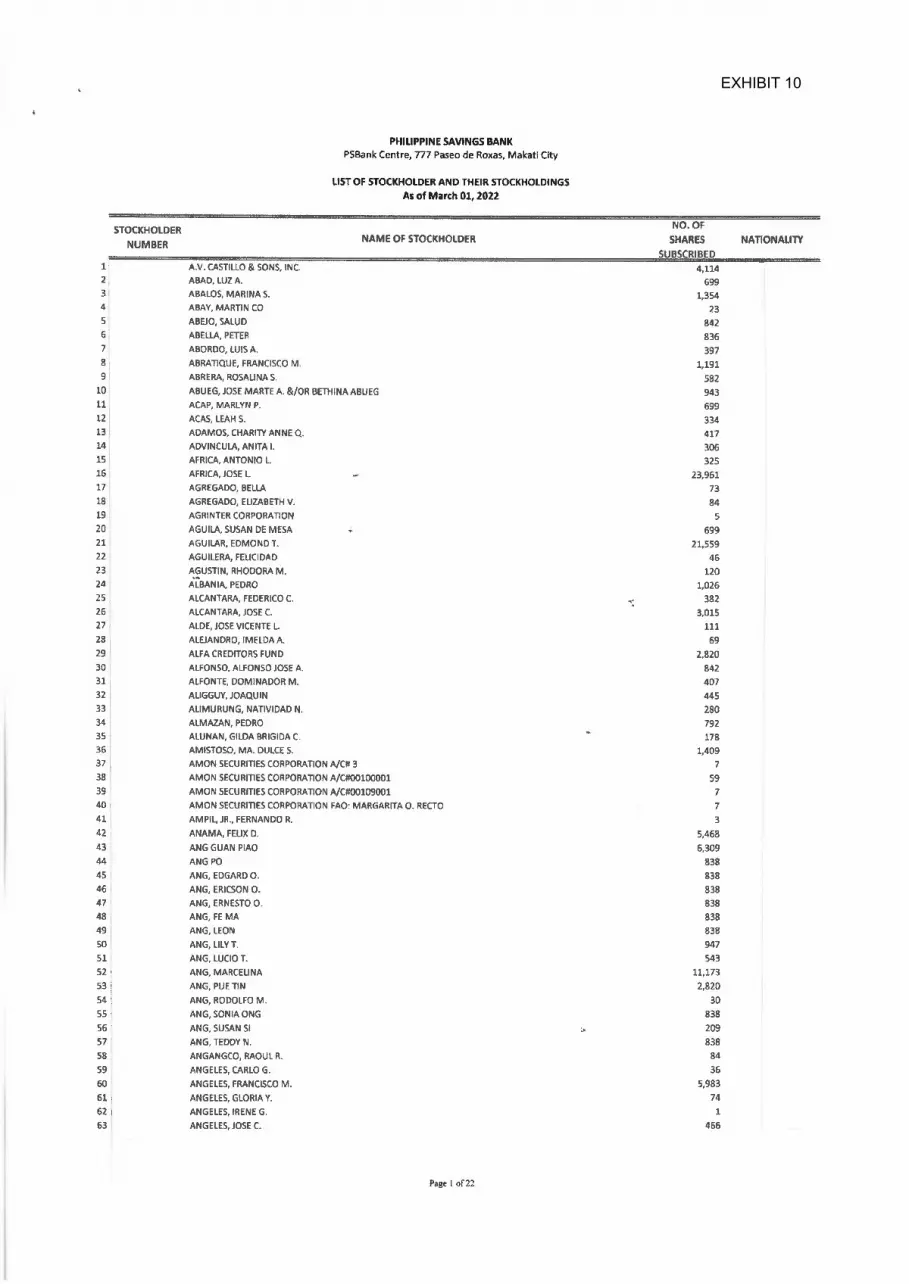
EXHIBIT 10

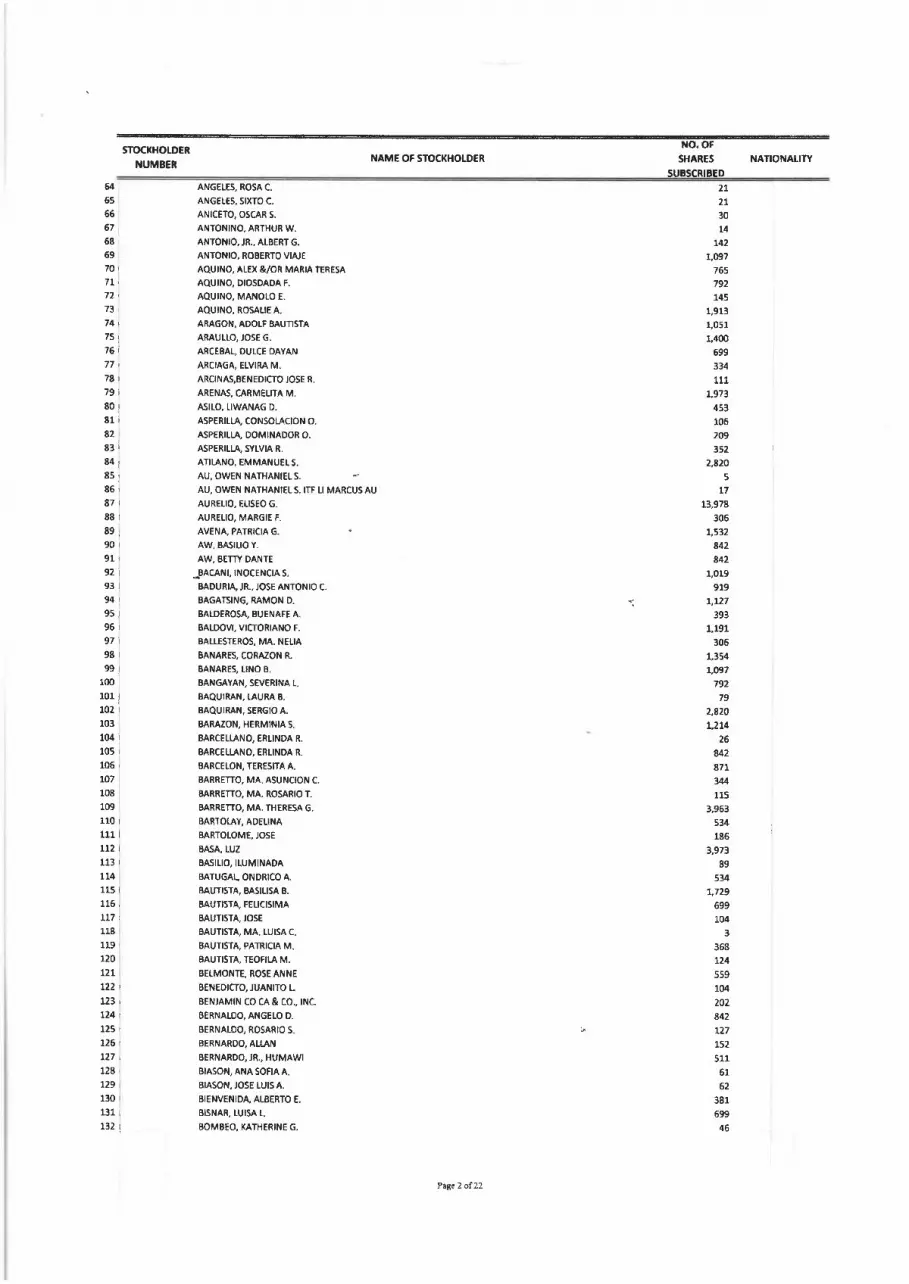
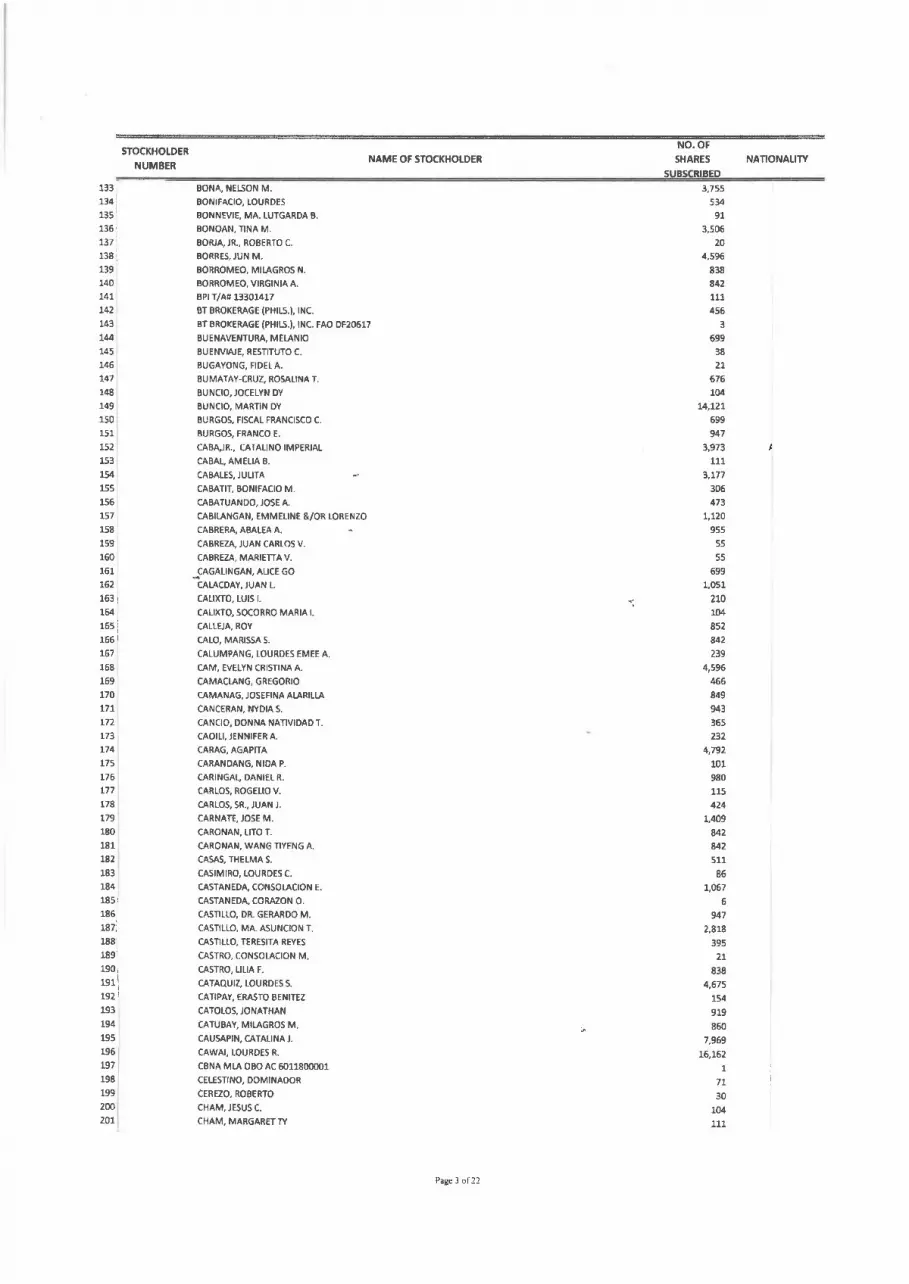
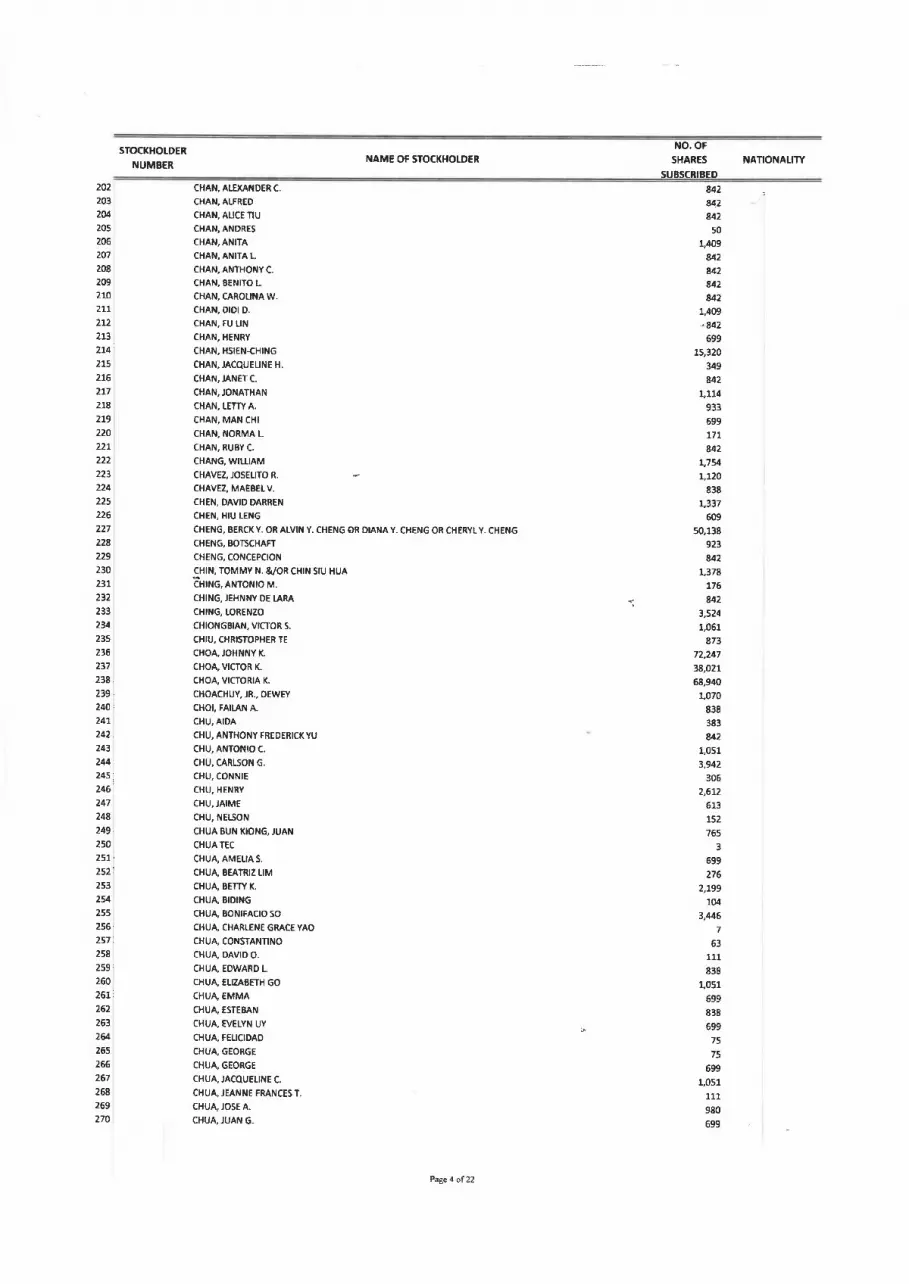
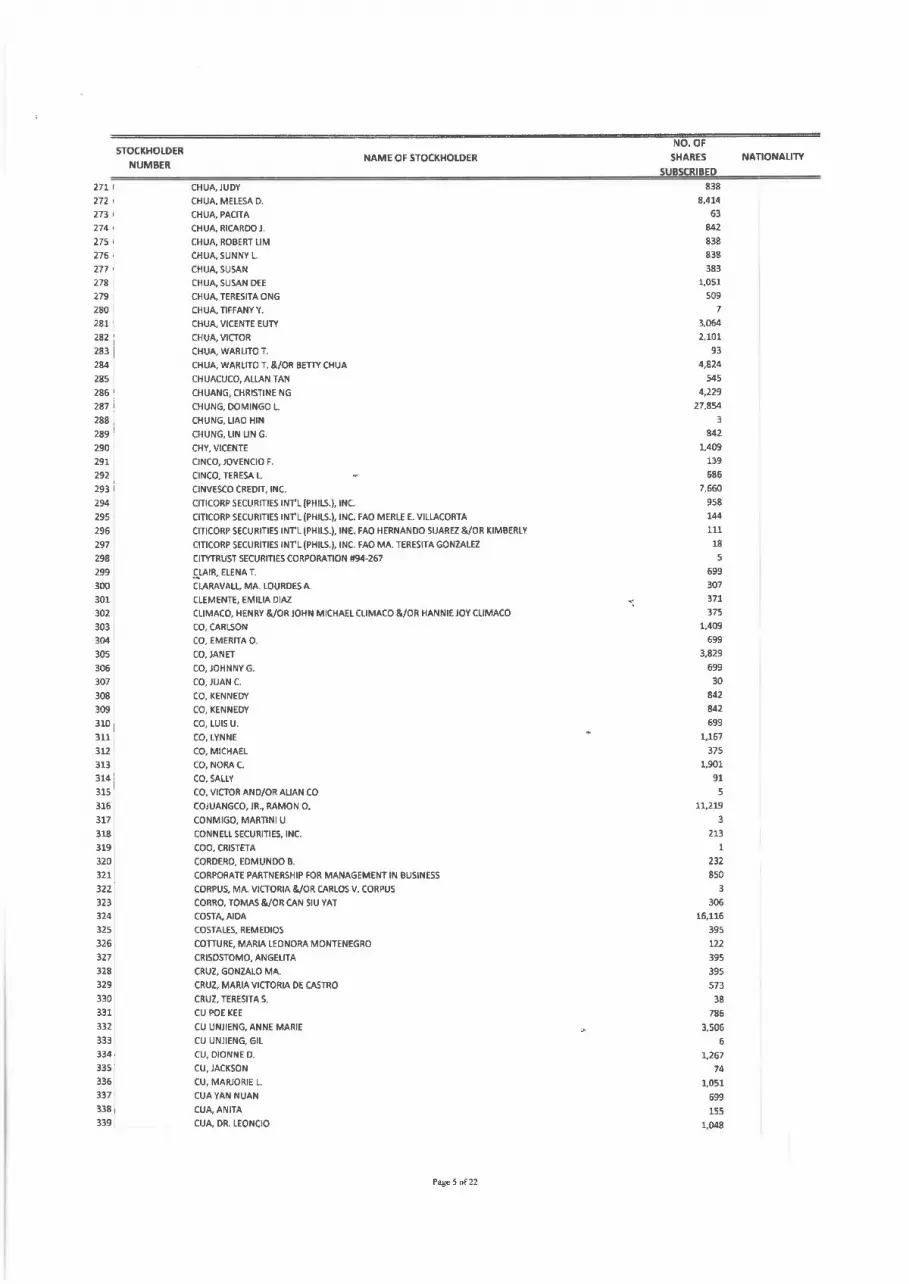

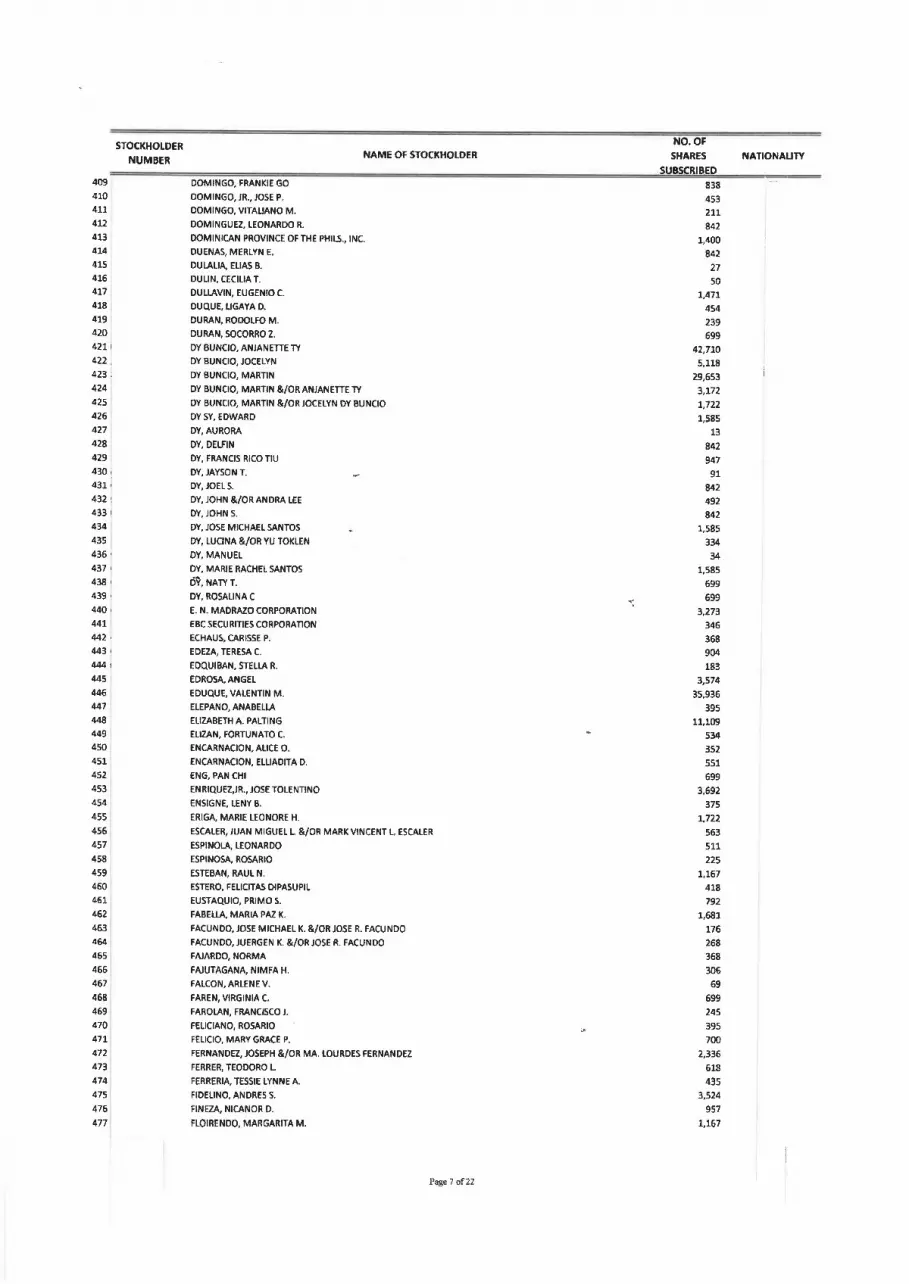

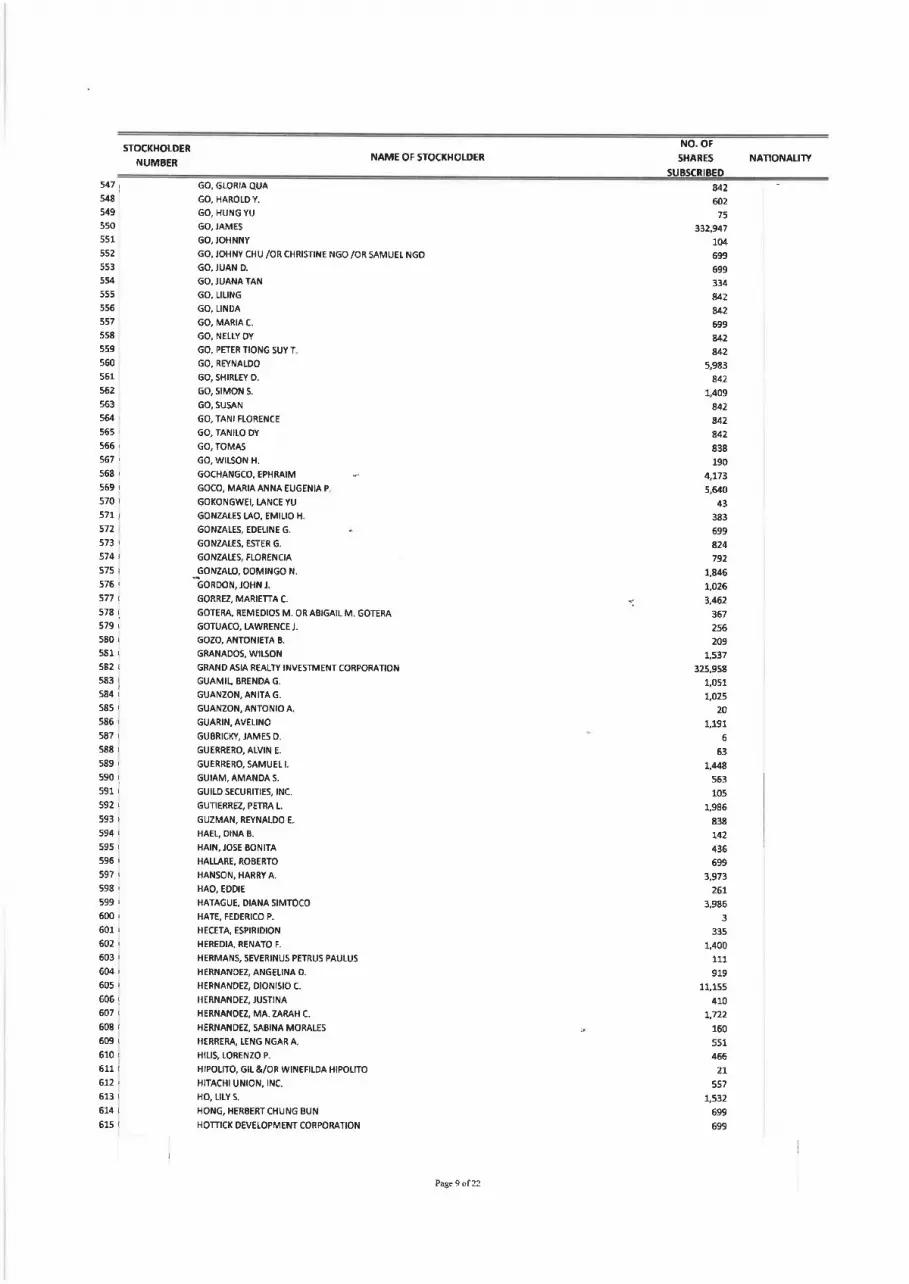
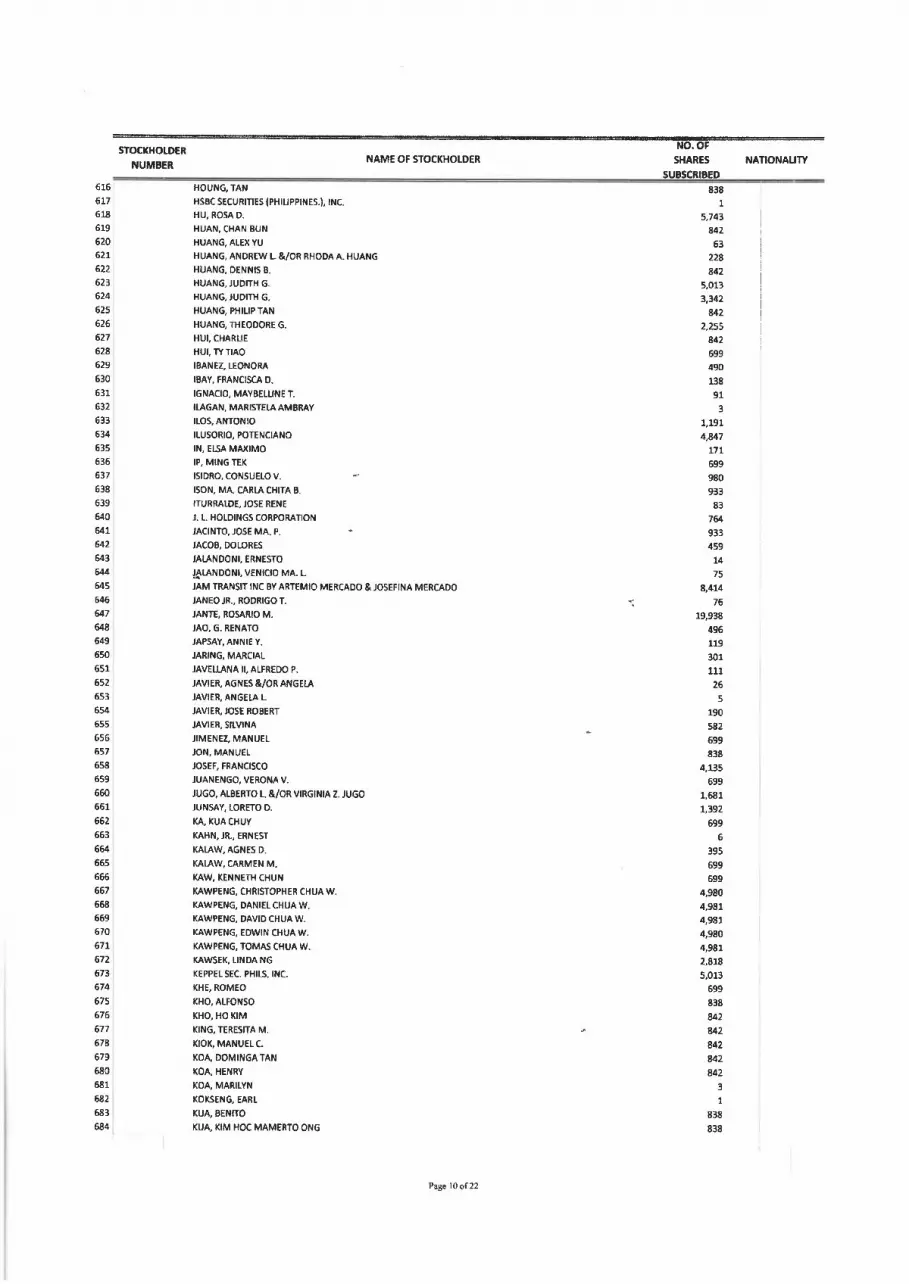
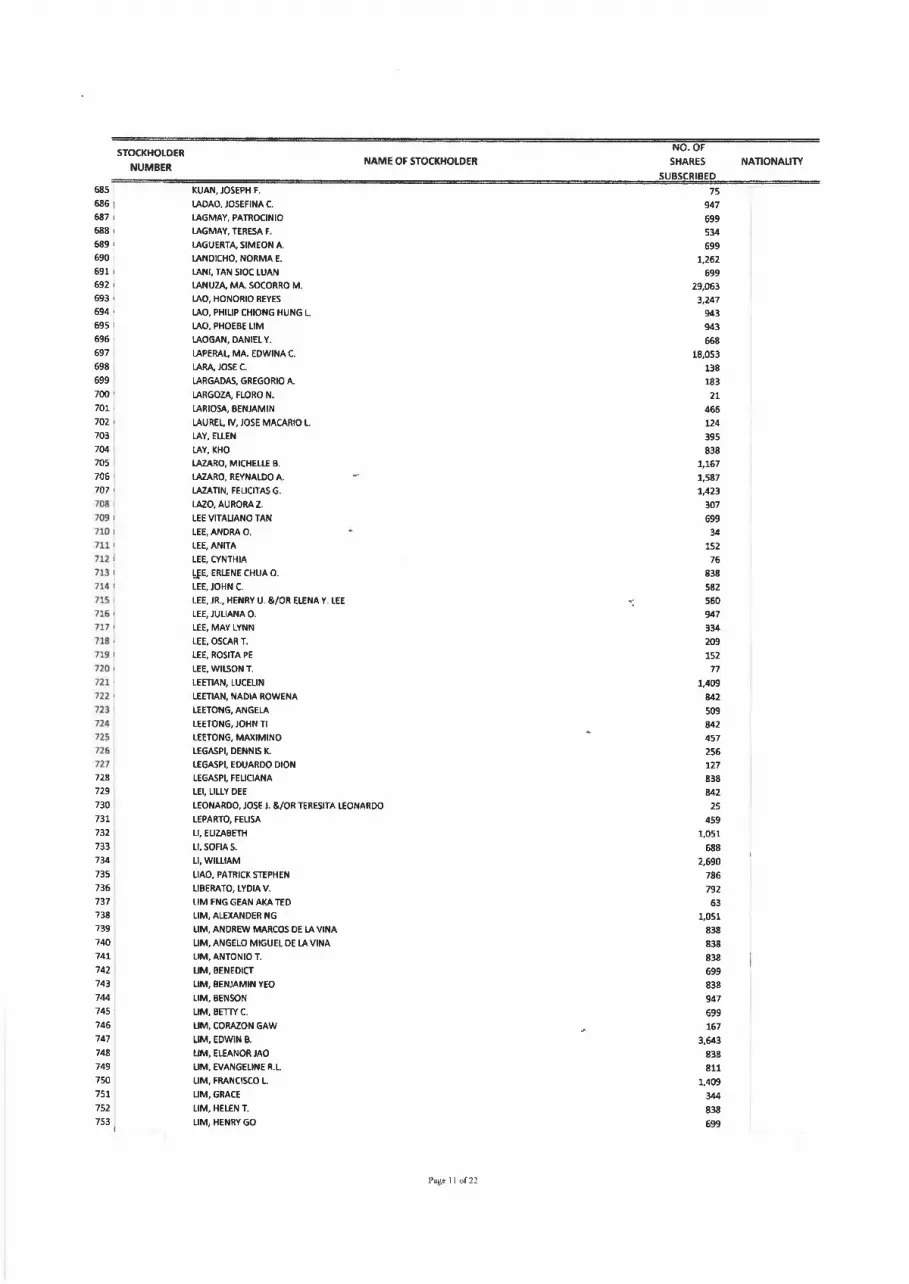
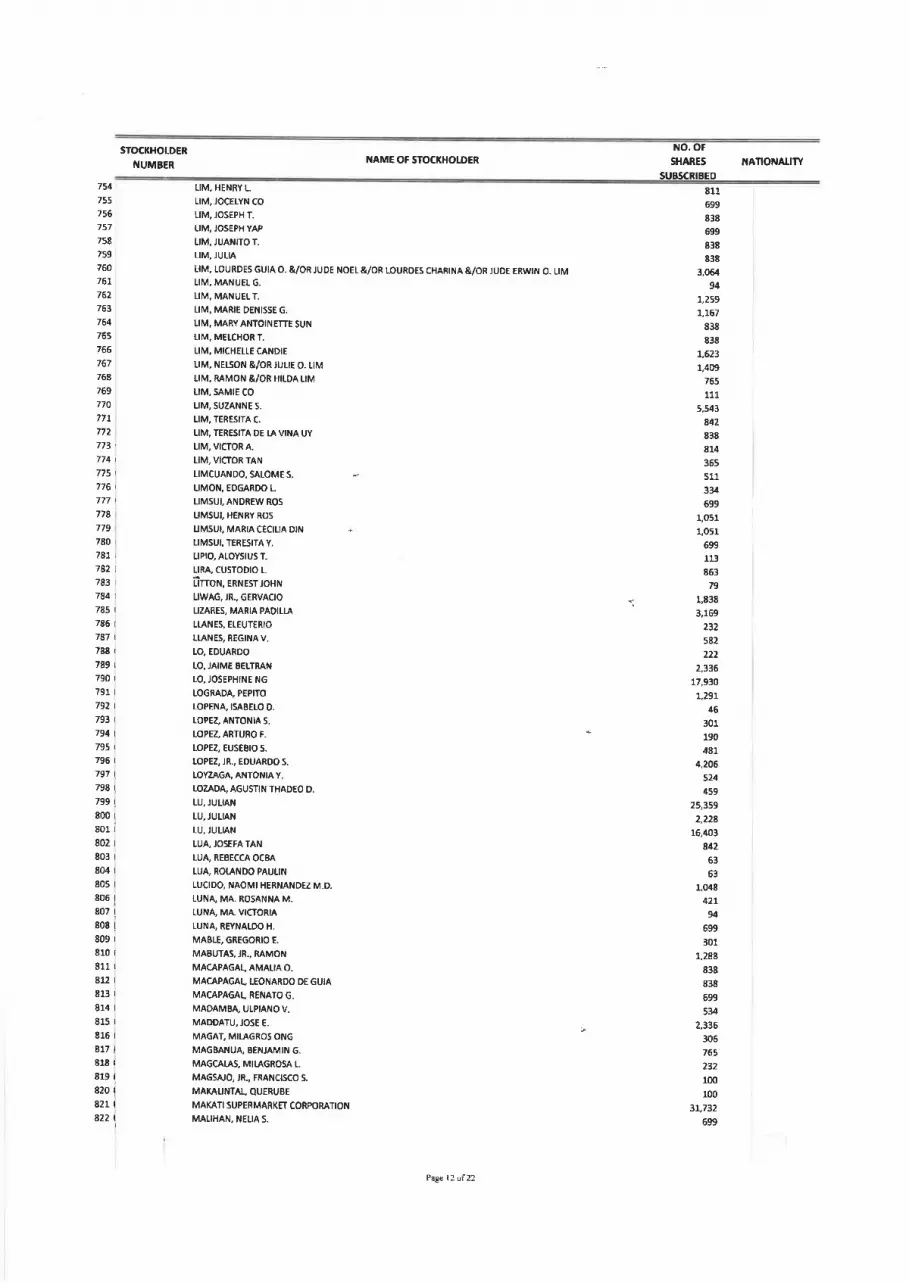
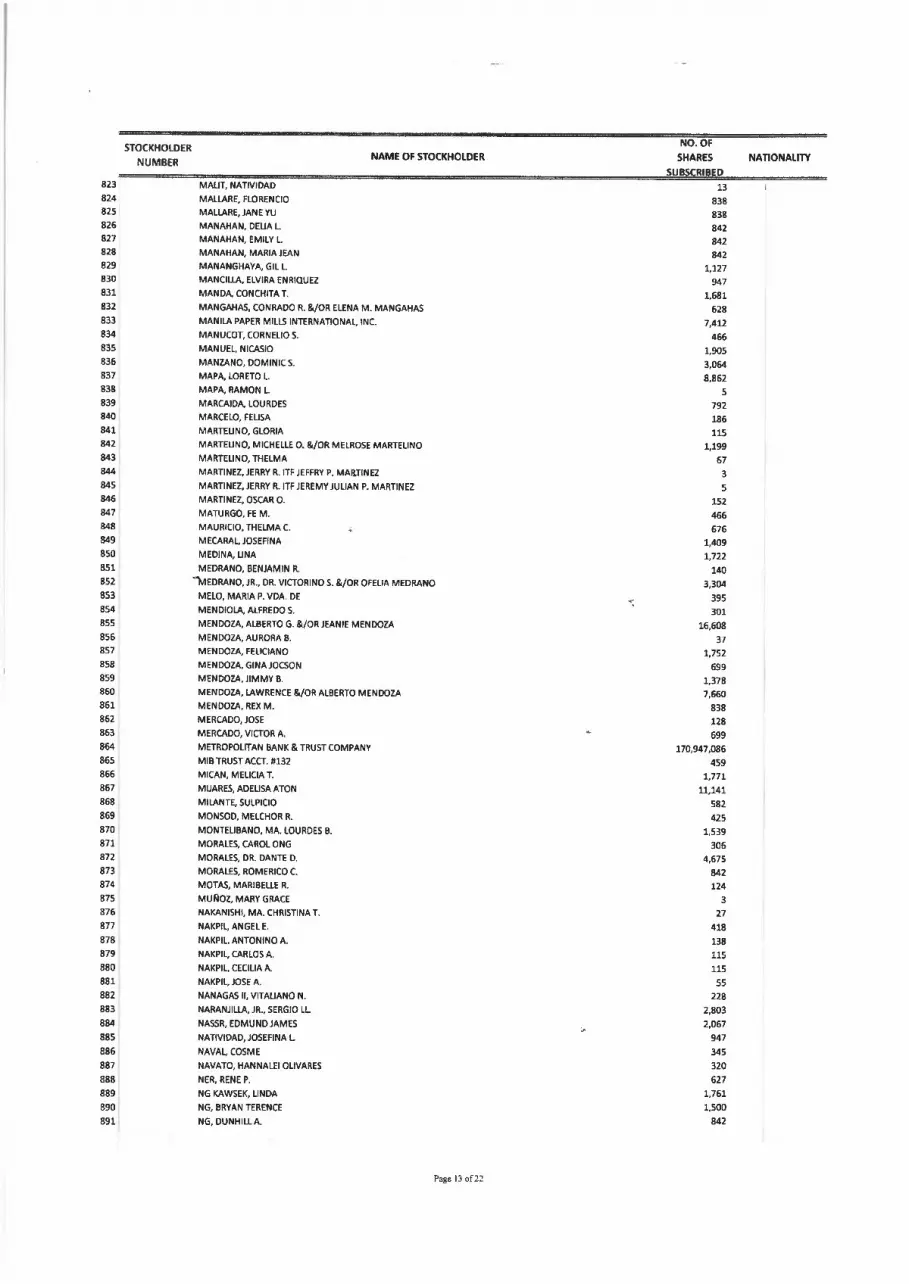
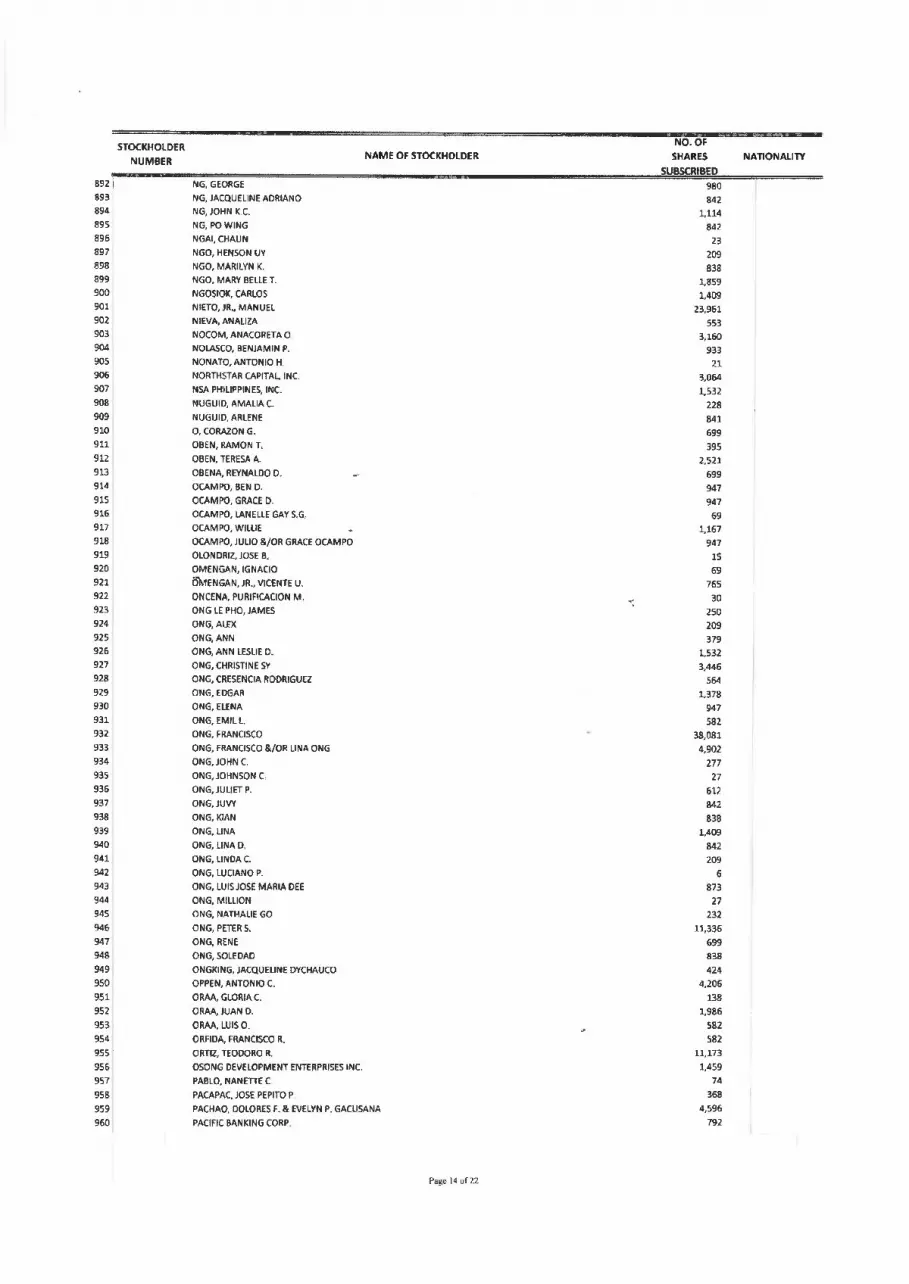


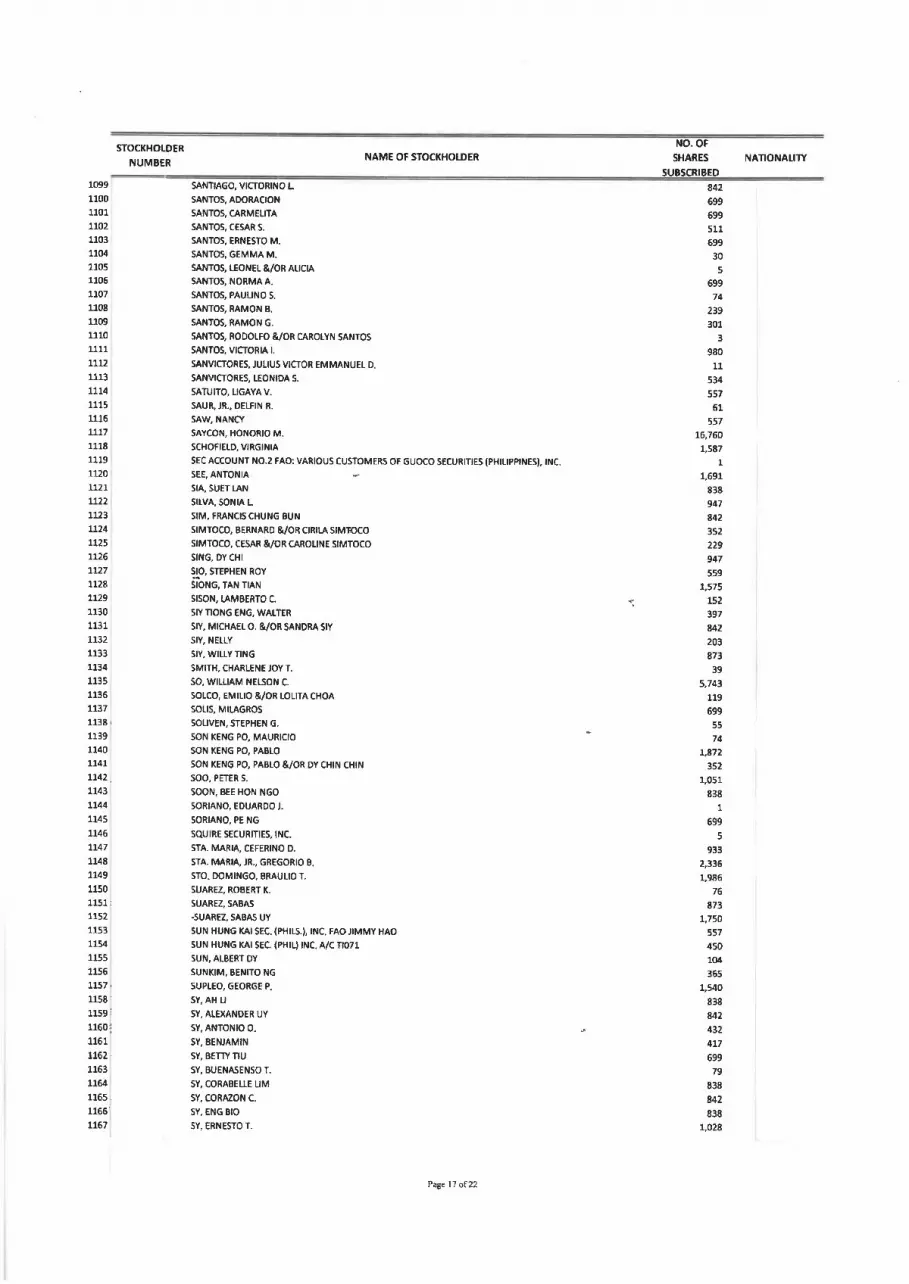
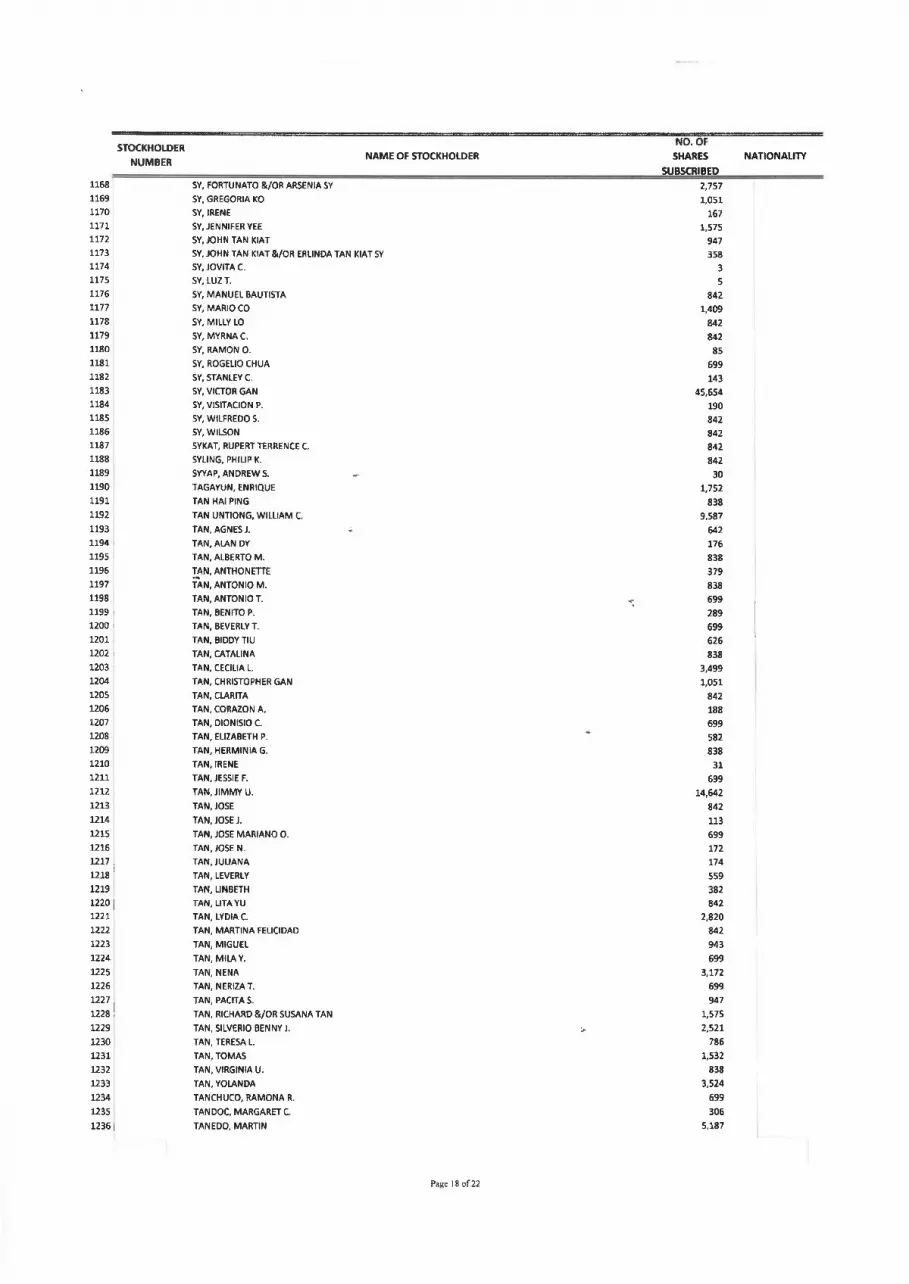
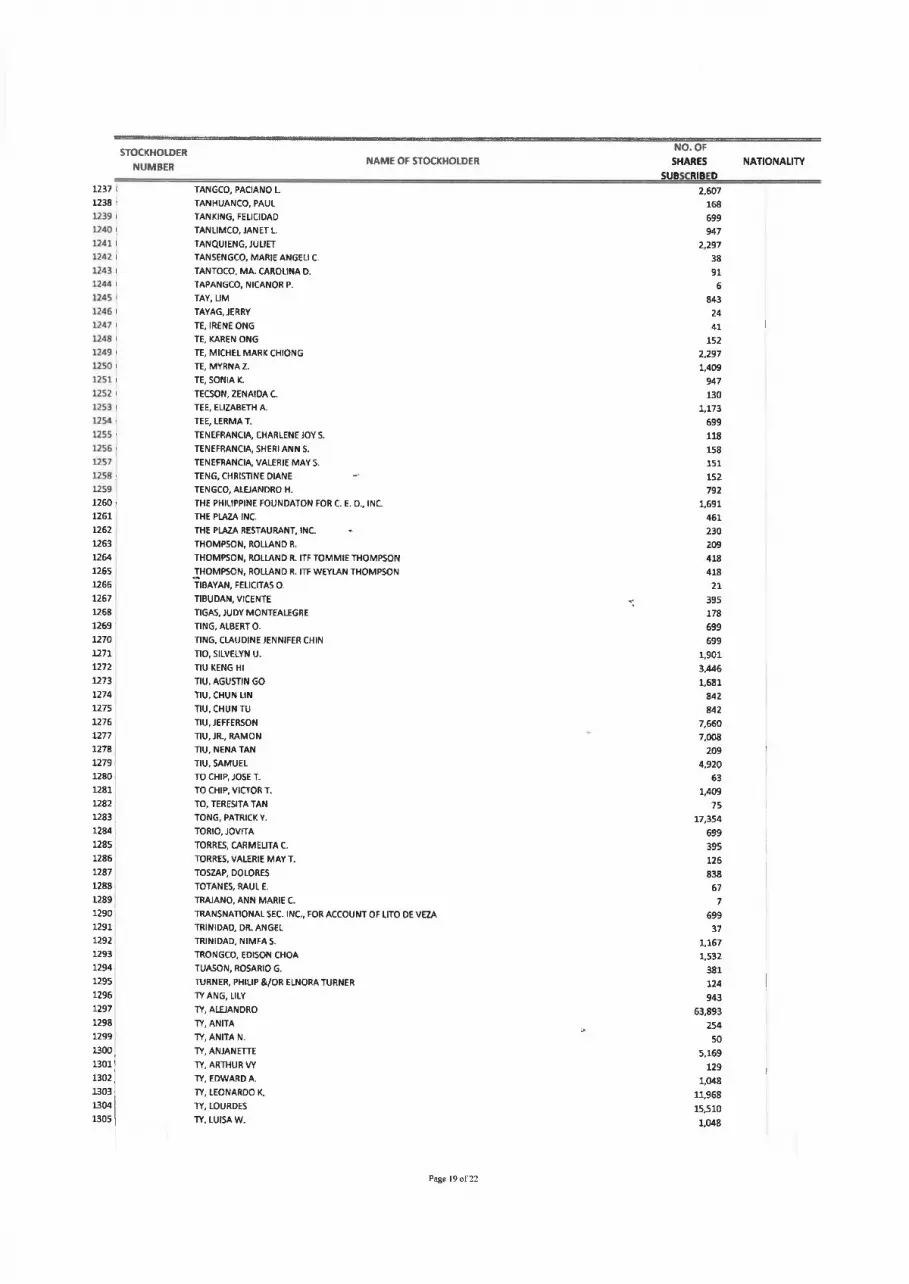


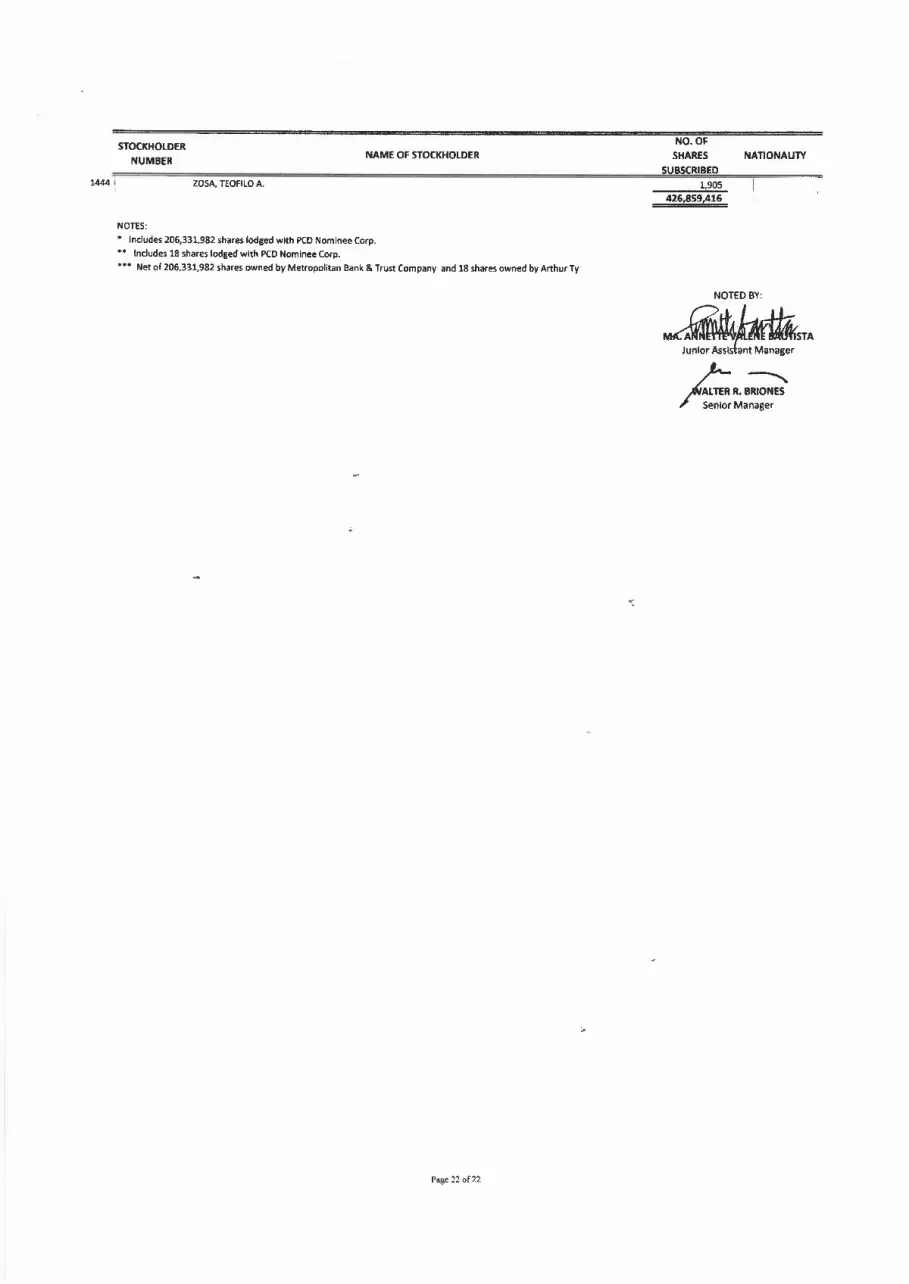
Related Documents