39th Annual Simulation Symposium Modeling, Simulation and Performance Evaluation for a CIOQ Switch Architecture Sponsored by FAPEMIG Antonio M. Alberti INATEL – National Institute of Telecommunications, MG, Brazil. Sebastiao R. de Aguiar Filho FEMC – Fundação Educacional Montes Claros, MG, Brazil. Anilton Salles Garcia UFES – Federal University of Espirito Santo, ES, Brazil.

Apresentação feita em 2006 no Annual Simulation Symposium.
Jul 17, 2015
Welcome message from author
This document is posted to help you gain knowledge. Please leave a comment to let me know what you think about it! Share it to your friends and learn new things together.
Transcript
39th Annual Simulation Symposium
Modeling, Simulation and Performance
Evaluation for a CIOQ Switch
Architecture
Sponsored by FAPEMIG
Antonio M. AlbertiINATEL – National Institute of
Telecommunications, MG, Brazil.
Sebastiao R. de Aguiar FilhoFEMC – Fundação Educacional Montes Claros,
MG, Brazil.
Anilton Salles GarciaUFES – Federal University of Espirito Santo,
ES, Brazil.
39th Annual Simulation Symposium
Presentation Outline
� Introduction
� Single Input Buffer CIOQ Architecture
� Class Based Input Buffer CIOQ Architecture
� Developed Models
� Performance Evaluation
� Final Remarks
39th Annual Simulation Symposium
Introduction
� In the past decade, data traffic has experimented a huge
growth, mainly due to Internet popularization.
� Telephony operators built new networks to transport end
users multimedia traffic.
� Technologies as ADSL and ATM (Asynchronous Transfer
Mode) emerged in access and core networks, respectively.
� Also, powerful routers have been developed to drain Internet
traffic.
39th Annual Simulation Symposium
Introduction
� Packet switching nodes and their architectures have
experienced a big development, not only in terms of capacity
and scalability, but also in terms of efficiency and QoS
support.
� An important portion of this deployment occurred in the
context of the ATM networks.
� Most of the ATM switch architectures are built arranging
multistage switching elements to form an interconnection
network.
39th Annual Simulation Symposium
Introduction
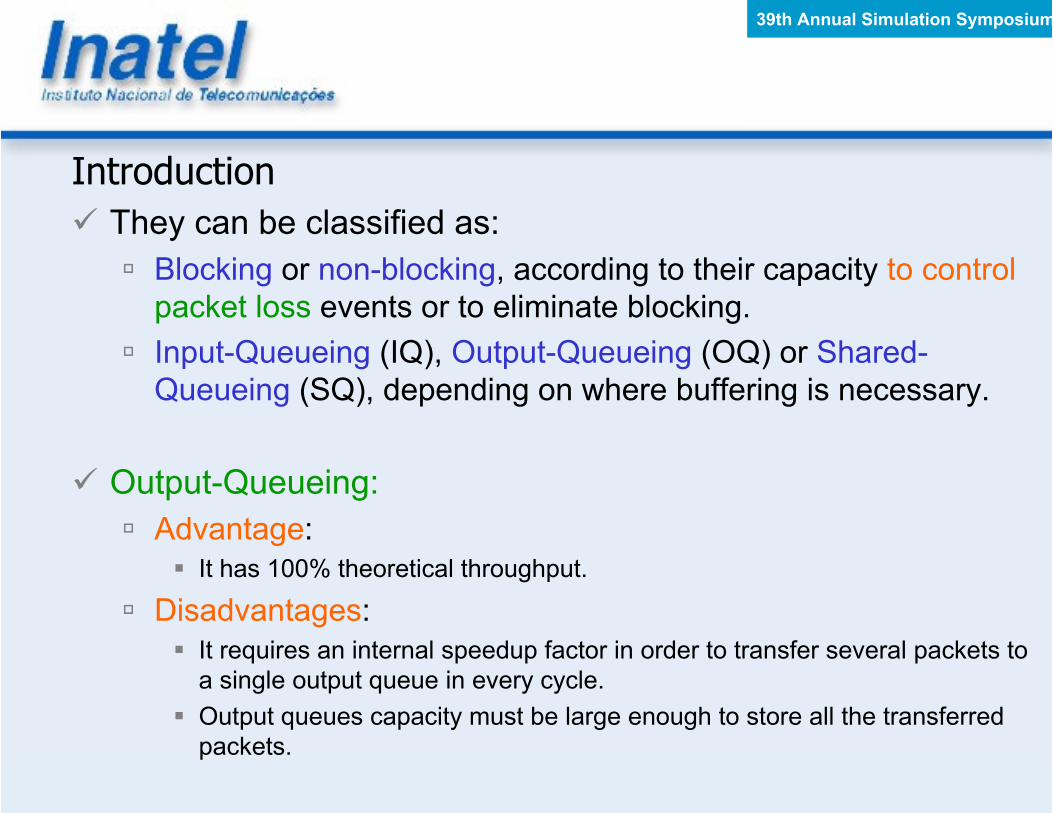
� They can be classified as:
� Blocking or non-blocking, according to their capacity to control
packet loss events or to eliminate blocking.
� Input-Queueing (IQ), Output-Queueing (OQ) or Shared-
Queueing (SQ), depending on where buffering is necessary.
� Output-Queueing:
� Advantage:
� It has 100% theoretical throughput.
� Disadvantages:
� It requires an internal speedup factor in order to transfer several packets to
a single output queue in every cycle.
� Output queues capacity must be large enough to store all the transferred
packets.

39th Annual Simulation Symposium
Introduction
� Input-Queueing:
� Advantage: � Overcomes the scalability problem, because they run as fast as the input line rate, therefore making possible to build very fast switches.
� Disadvantages: � It requires an internal speedup factor in order to transfer several packets to a single output queue in every cycle.
� Suffers from HOLB (Head-of-Line-Blocking), which limits the throughput to just 58.6%.
� Virtual Output Queueing (VOQ):
� Advantage: � Eliminates HOLB.
� Disadvantage: � High complexity and poor scalability, since the number of virtual queues in the input ports grows quadradically with the number of input ports.

39th Annual Simulation Symposium
Introduction
� Combined Input/Output Queue (CIOQ):
� Advantage:
� Combines input and output queueing and achieves a good balance
between performance and scalability.
� Capable to remove S packets from each input port and transfer up to S
packets to every output during an input time slot.
� Disadvantage:
� According to Luo et.al., CIOQ is very complex when compared with CICQ
(Combined Input-Crosspoint-Queueing).

39th Annual Simulation Symposium
Introduction
� Santos-Motoyama (SM) CIOQ:
� Advantages:
� Doesn’t need internal speedup.
� Can reduce HOLB while improving throughput.
� More simple than original CIOQ.
� These features motivated us to model, simulate and evaluate
SM CIOQ architectures. Also, we are interested on validate and
compare results with original SM paper.
� Santos-Motoyama developed two CIOQ Architectures:� Single Input Buffer CIOQ Architecture
� Class Based CIOQ Architecture
39th Annual Simulation Symposium
Single Input Buffer CIOQ Architecture
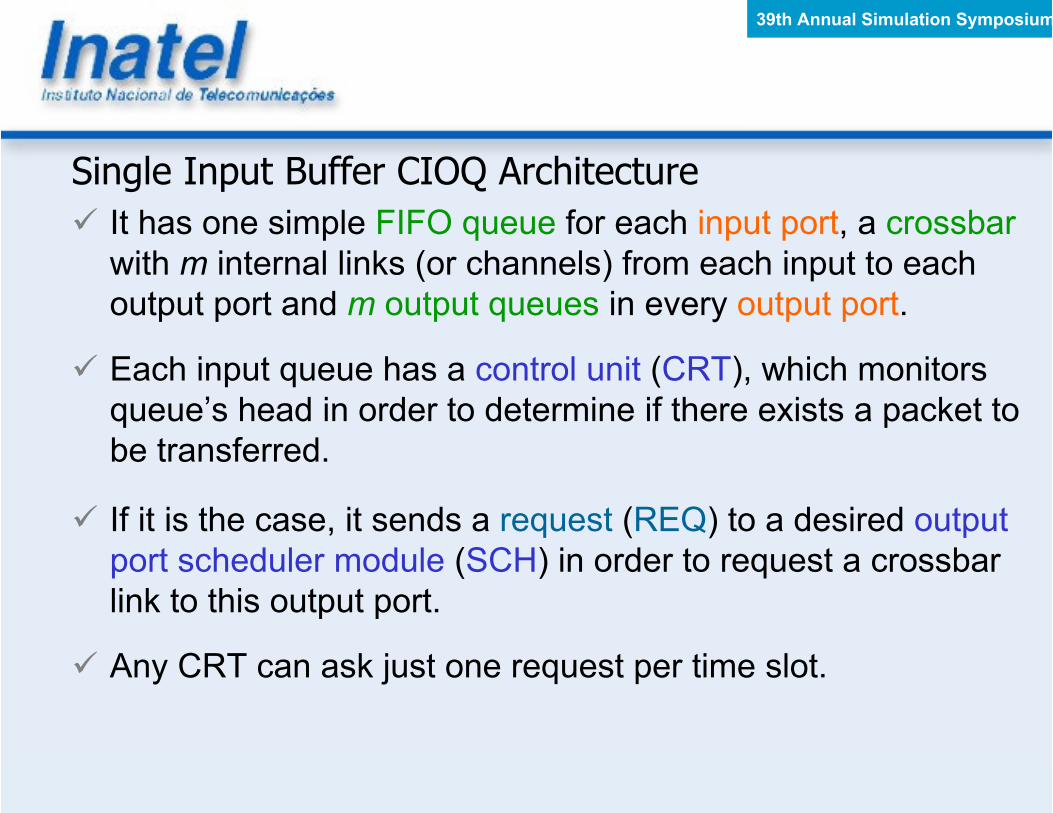
� It has one simple FIFO queue for each input port, a crossbar
with m internal links (or channels) from each input to each
output port and m output queues in every output port.
� Each input queue has a control unit (CRT), which monitors
queue’s head in order to determine if there exists a packet to
be transferred.
� If it is the case, it sends a request (REQ) to a desired output
port scheduler module (SCH) in order to request a crossbar
link to this output port.
� Any CRT can ask just one request per time slot.
39th Annual Simulation Symposium
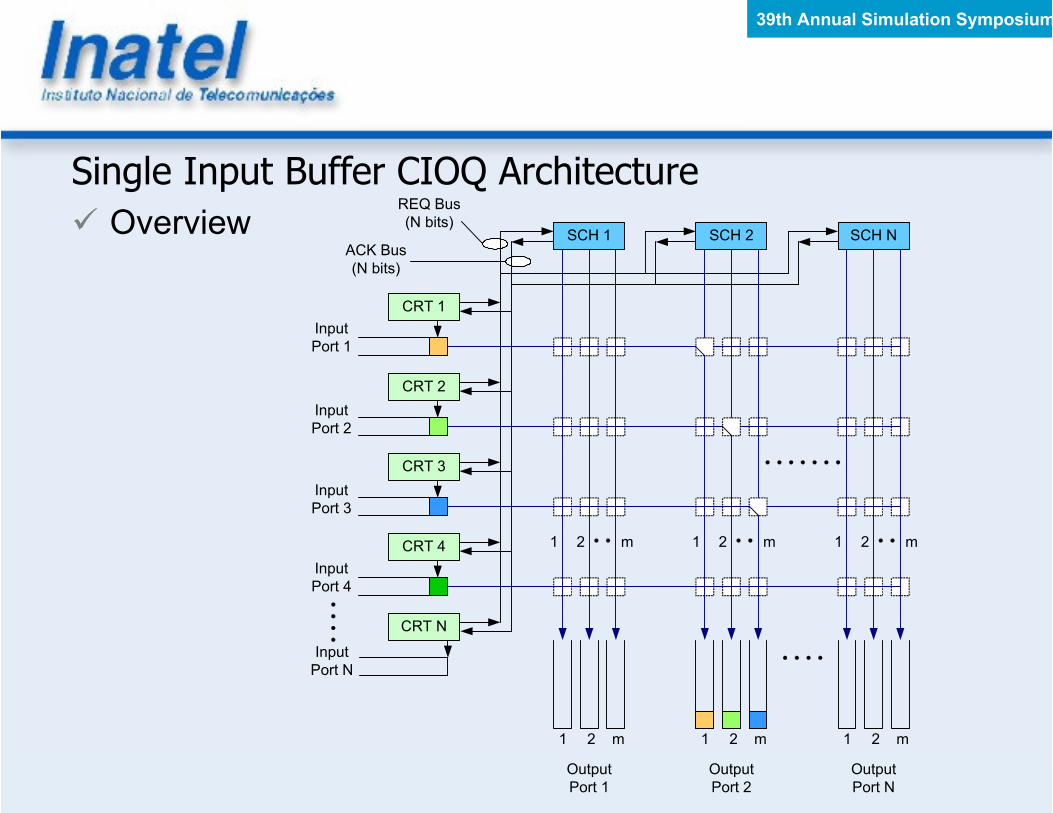
Single Input Buffer CIOQ Architecture
� Overview
Input
Port 1
CRT 1
Input
Port 2
CRT 2
Input
Port 3
CRT 3
Input
Port 4
CRT 4
Input
Port N
CRT N
SCH 1 SCH 2 SCH N
REQ Bus
(N bits)
ACK Bus
(N bits)
1 2 m 1 2 m 1 2 m
Output
Port 1
Output
Port 2
Output
Port N
1 2 m 1 2 m 1 2 m
39th Annual Simulation Symposium
Single Input Buffer CIOQ Architecture
� The SCH grants on a round-robin basis up to m links to the
asking CRTs.
� This is done through acknowledgement signals (ACKs).
� To be fair, in the next cycle SCH will begin to grant from the
input that wasn’t granted in the previous cycle.
� The output queues are also served in a round-robin basis.
39th Annual Simulation Symposium
Class Based Input Buffer CIOQ Architecture
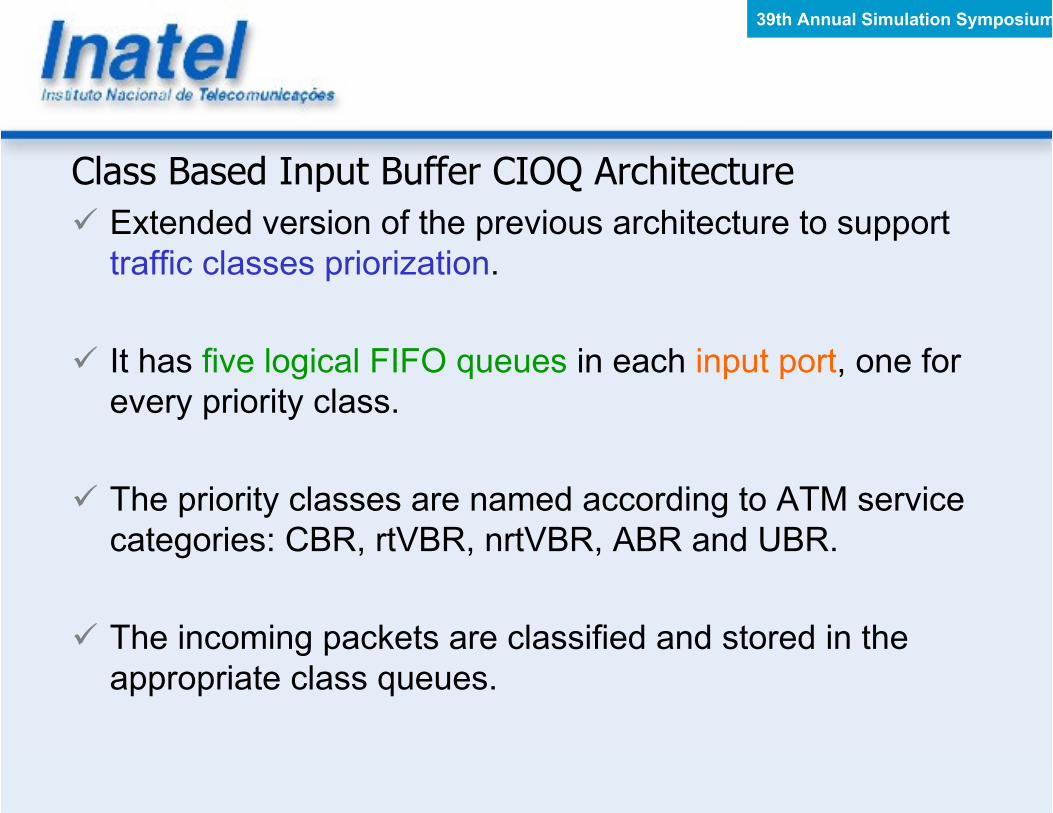
� Extended version of the previous architecture to support
traffic classes priorization.
� It has five logical FIFO queues in each input port, one for
every priority class.
� The priority classes are named according to ATM service
categories: CBR, rtVBR, nrtVBR, ABR and UBR.
� The incoming packets are classified and stored in the
appropriate class queues.
39th Annual Simulation Symposium
Class Based Input Buffer CIOQ Architecture
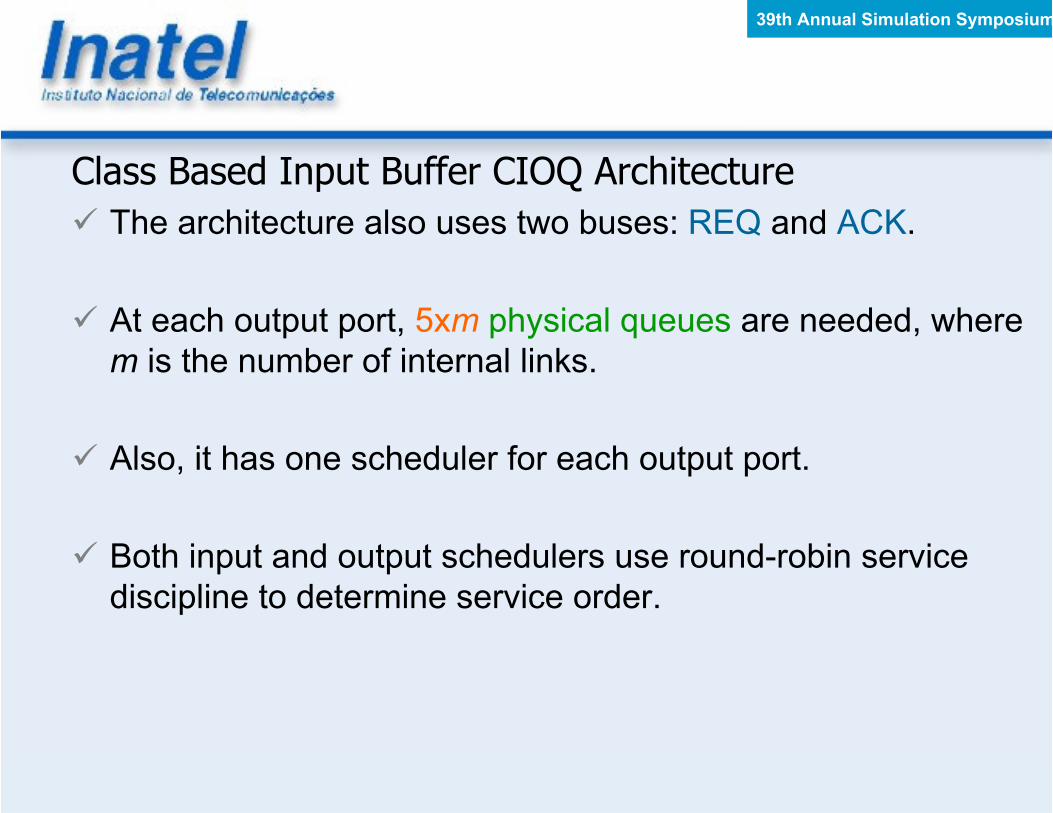
� The architecture also uses two buses: REQ and ACK.
� At each output port, 5xm physical queues are needed, where
m is the number of internal links.
� Also, it has one scheduler for each output port.
� Both input and output schedulers use round-robin service
discipline to determine service order.
39th Annual Simulation Symposium
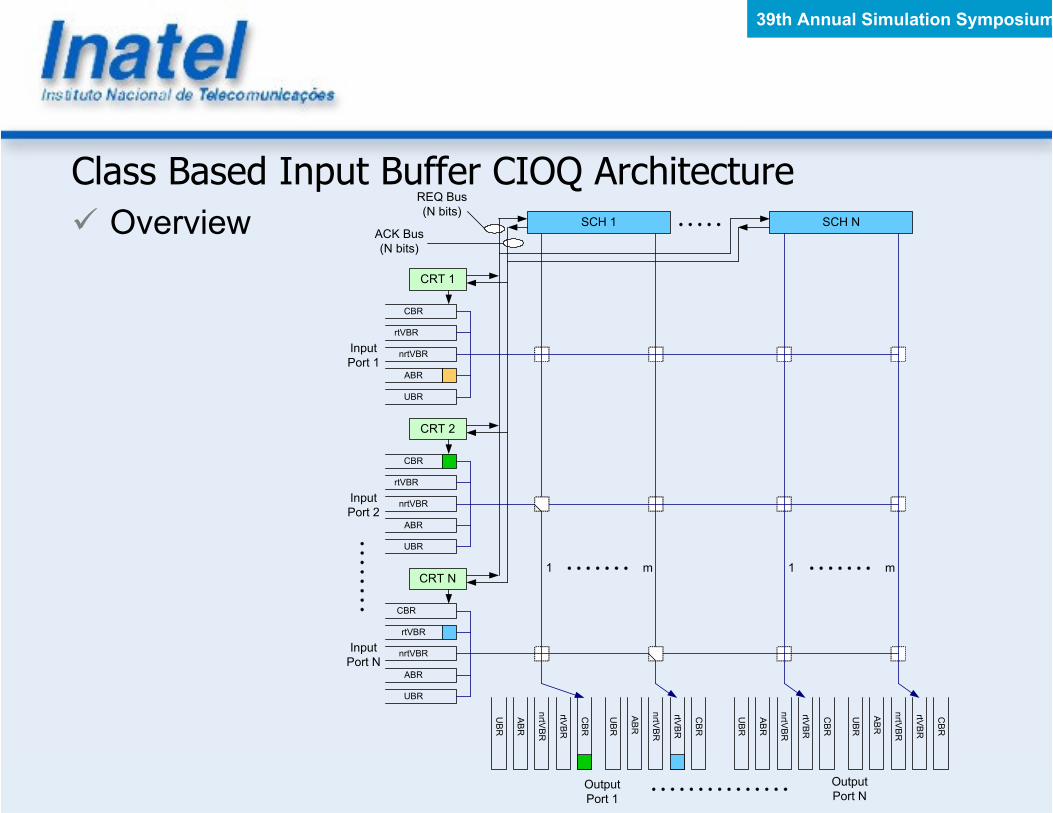
Class Based Input Buffer CIOQ Architecture
� Overview
Input
Port 1
CRT 1
SCH 1
REQ Bus
(N bits)
ACK Bus
(N bits)
CBR
rtVBR
nrtVBR
ABR
UBR
Input
Port N
CRT N
CBR
rtVBR
nrtVBR
ABR
UBR
Output
Port 1
Output
Port N
Input
Port 2
CRT 2
CBR
rtVBR
nrtVBR
ABR
UBR
SCH N
1 m1 m
CBR
rtVBR
nrtV
BR
ABR
UBR
CBR
rtVBR
nrtV
BR
ABR
UBR
CBR
rtVBR
nrtV
BR
ABR
UBR
CBR
rtVBR
nrtV
BR
ABR
UBR
39th Annual Simulation Symposium
Developed Models
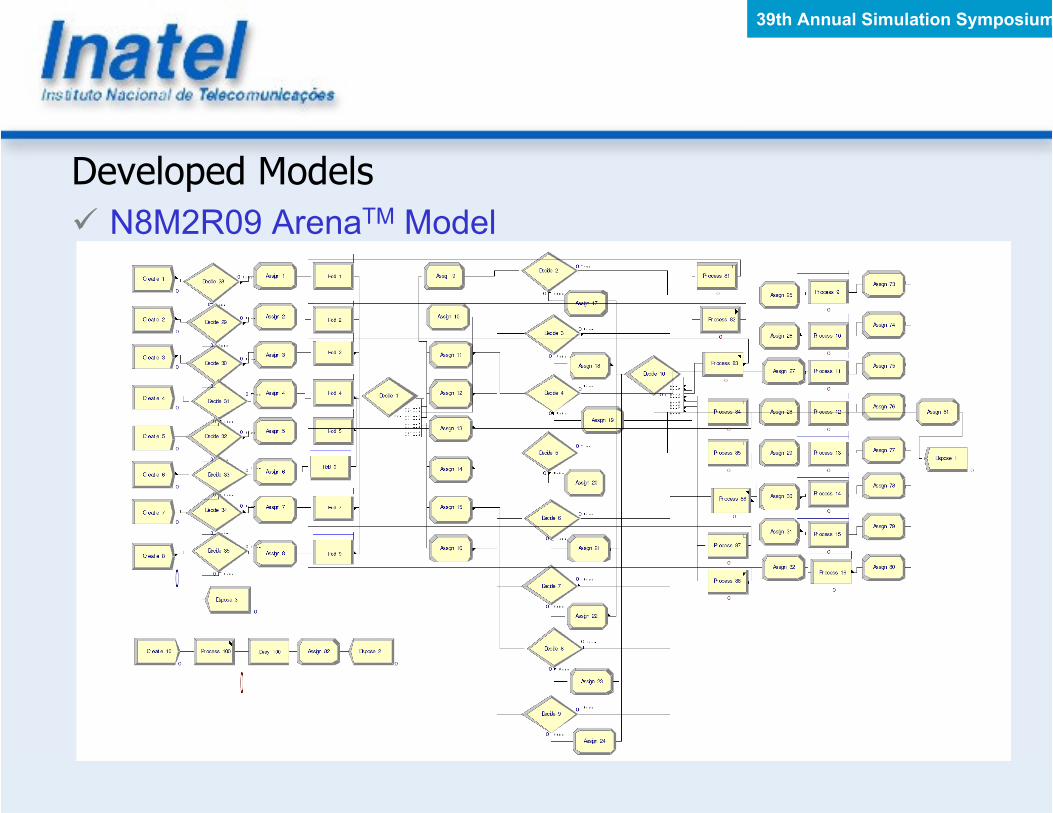
� We used Arena 5.0TM to develop and implement simulation
models for the SM CIOQ architectures.
� To each architecture we developed a basic model and
implemented several derived models varying the number of
input-output ports (N), the number of internal links (m) and the
offered load (r).
� At the end, we developed 181 simulation models.
� Model Example: N8M2R09 (N=8, m=2 and r=0.9) single
buffer CIOQ model.
39th Annual Simulation Symposium
Developed Models
� N8M2R09 ArenaTM Model
39th Annual Simulation Symposium
Developed Models
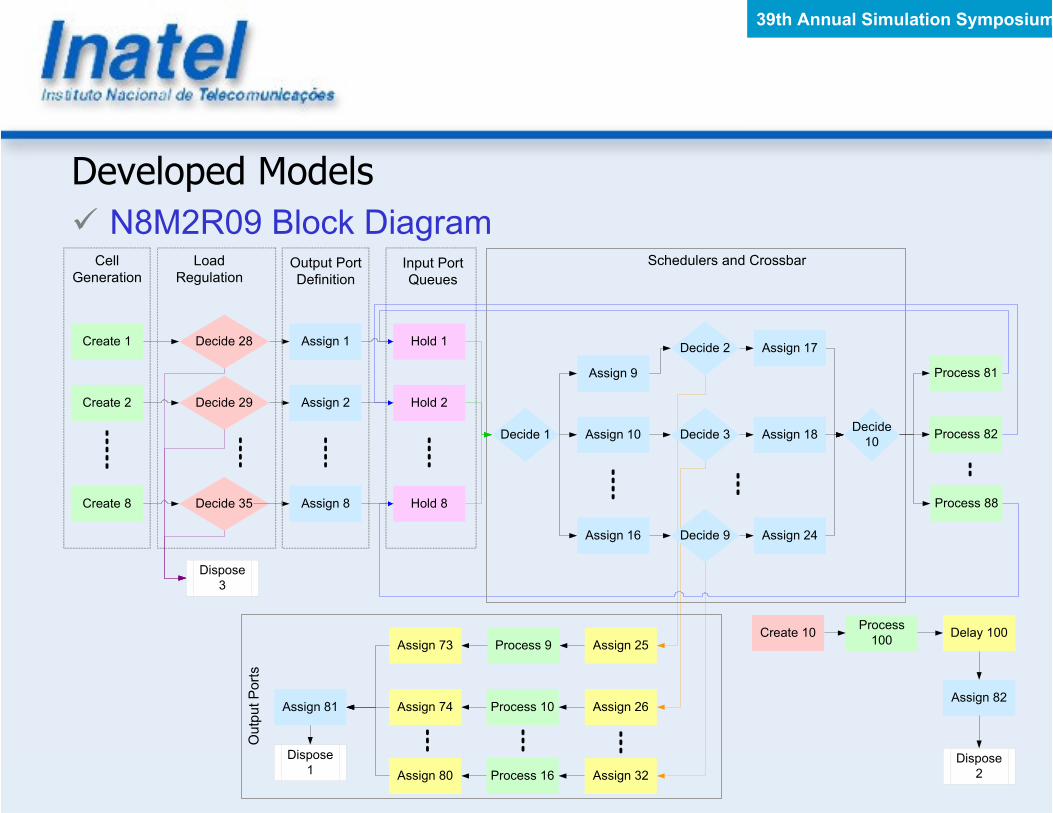
� N8M2R09 Block DiagramCell
Generation
Decide 28Create 1
Create 2 Decide 29
Create 8 Decide 35
Load
Regulation
Assign 1
Assign 2
Assign 8
Output Port
Definition
Hold 1
Hold 2
Hold 8
Input Port
Queues
Decide 1
Assign 9
Assign 10
Assign 16
Assign 18
Assign 24
Process 81
Process 82
Process 88
Decide 2 Assign 17
Assign 25
Assign 26
Assign 32
Schedulers and Crossbar
Decide
10
Process 9
Process 10
Process 16
Assign 73
Assign 74
Assign 80
Assign 81
Dispose
1
Dispose
3
Output Ports
Create 10Process
100Delay 100
Assign 82
Dispose
2
Decide 3
Decide 9

39th Annual Simulation Symposium
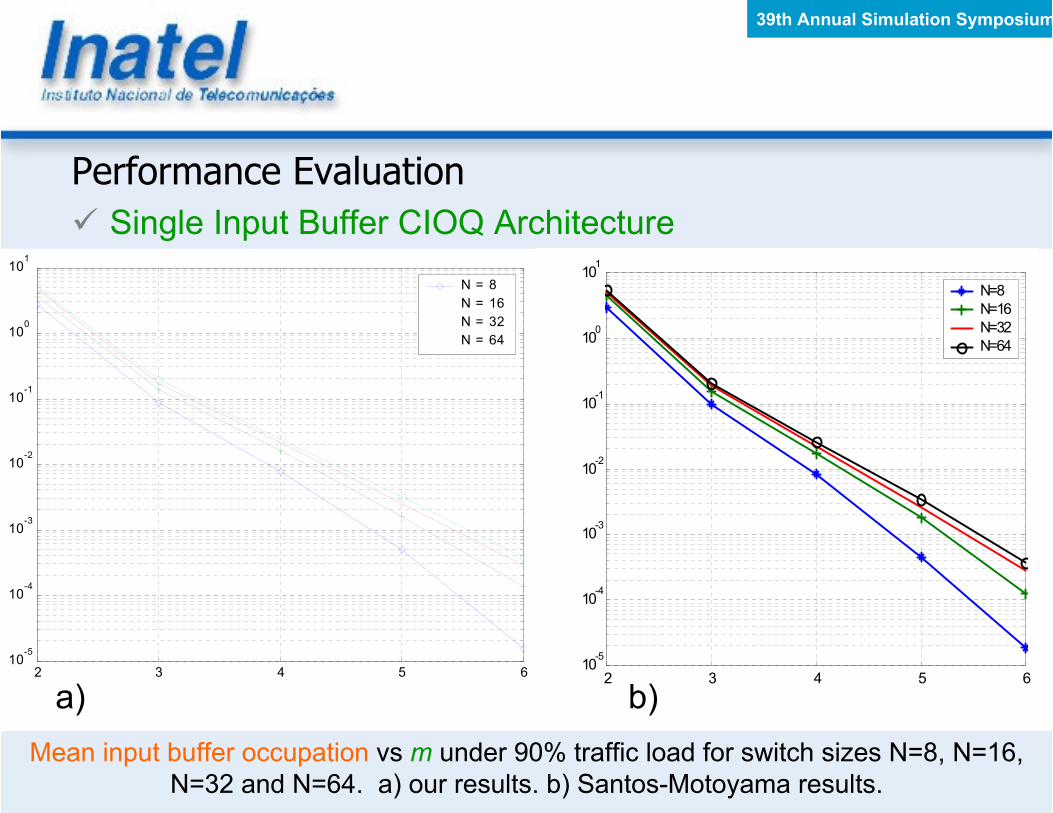
Performance Evaluation
� Single Input Buffer CIOQ Architecture
1 2 3 4 5 6 7 8 9 1010
-12
10-10
10-8
10-6
10-4
10-2
100
N = 16
N = 32
N = 64
Traffic Load = 0.9
1 2 3 4 5 6 7 8 9 1010
-12
10-10
10-8
10-6
10-4
10-2
100
Internal Links
Average Blocking Probability
Traffic Load=0.9
N=16
N=32
N=64
N=128
a) b)
HOLB vs. number of internal links under 90% traffic load for switch sizes N=16, N=32
and N=64. a) our results. b) Santos-Motoyama results.

39th Annual Simulation Symposium
Performance Evaluation
� Single Input Buffer CIOQ Architecture
1 2 3 4 5 6 7 8 9 1010
-10
10-8
10-6
10-4
10-2
100
Switch Size: 64 X 64
Traffic Load = 0.9
Traffic Load = 0.8
Traffic Load = 1.0
Traffic Load = 0.7
a)
1 2 3 4 5 6 7 8 9 1010
-10
10-8
10-6
10-4
10-2
100
Switch Size: 64 x 64
ρ = 0.7
ρ = 0.8
ρ = 0.9
ρ =1
b)
HOLB vs. number of internal links for a 64x64 switch under several traffic loads. a) our
results. b) Santos-Motoyama results.
39th Annual Simulation Symposium
Performance Evaluation
� Single Input Buffer CIOQ Architecture
Mean input buffer occupation vs m under 90% traffic load for switch sizes N=8, N=16,
N=32 and N=64. a) our results. b) Santos-Motoyama results.
2 3 4 5 610
-5
10-4
10-3
10-2
10-1
100
101
N=8
N=16
N=32
N=64
2 3 4 5 610
-5
10-4
10-3
10-2
10-1
100
101
N = 8
N = 16
N = 32
N = 64
a) b)

39th Annual Simulation Symposium
Performance Evaluation
� Single Input Buffer CIOQ Architecture
Maximum occupation for input queues under 90% traffic load.
�m
8 16 32 64
3 5 7 7 9
4 3 3 4 4
5 2 2 2 3
6 2 2 2 2

39th Annual Simulation Symposium
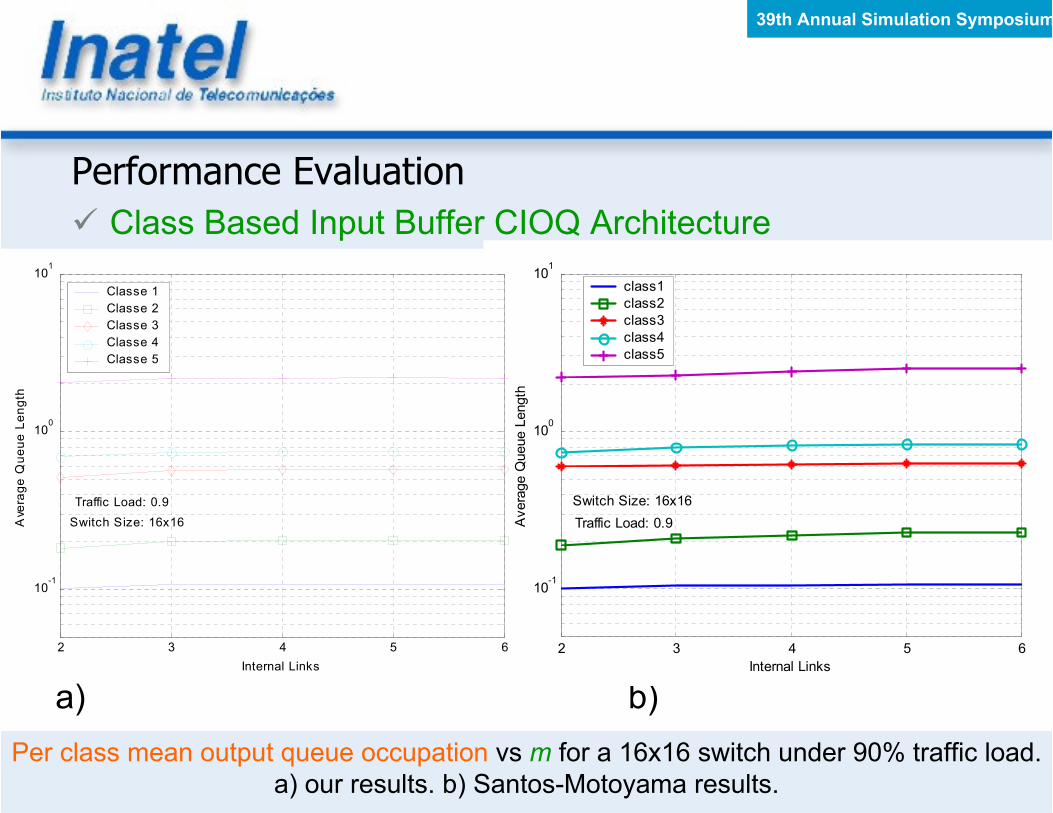
Performance Evaluation
� Class Based Input Buffer CIOQ Architecture
Per class mean input queue occupation vs m for a 16x16 switch under 90% traffic load.
a) our results. b) Santos-Motoyama results.
a)
2 3 4 5 610
-7
10-6
10-5
10-4
10-3
10-2
10-1
100
Internal Links
Average Queue Length
class1 - 40%
class2 - 20%
class3 - 20%
class4 - 10%
class5 - 10%
Switch Size: 16x16
Traffic Load: 0.9
2 3 4 5 610
-7
10-6
10-5
10-4
10-3
10-2
10-1
100
Class 1 - 40%
Class 2 - 20%
Class 3 - 20%
Class 4 - 10%
Class 5 - 10%
b)
39th Annual Simulation Symposium
Performance Evaluation
� Class Based Input Buffer CIOQ Architecture
Per class mean output queue occupation vs m for a 16x16 switch under 90% traffic load.
a) our results. b) Santos-Motoyama results.
a) b)
2 3 4 5 6
10-1
100
101
Internal Links
Average Queue Length
class1
class2
class3
class4
class5
Switch Size: 16x16
Traffic Load: 0.9
2 3 4 5 6
10-1
100
101
Internal Links
Average Q
ueue Length
Classe 1
Classe 2
Classe 3
Classe 4
Classe 5
Switch Size: 16x16
Traffic Load: 0.9
39th Annual Simulation Symposium
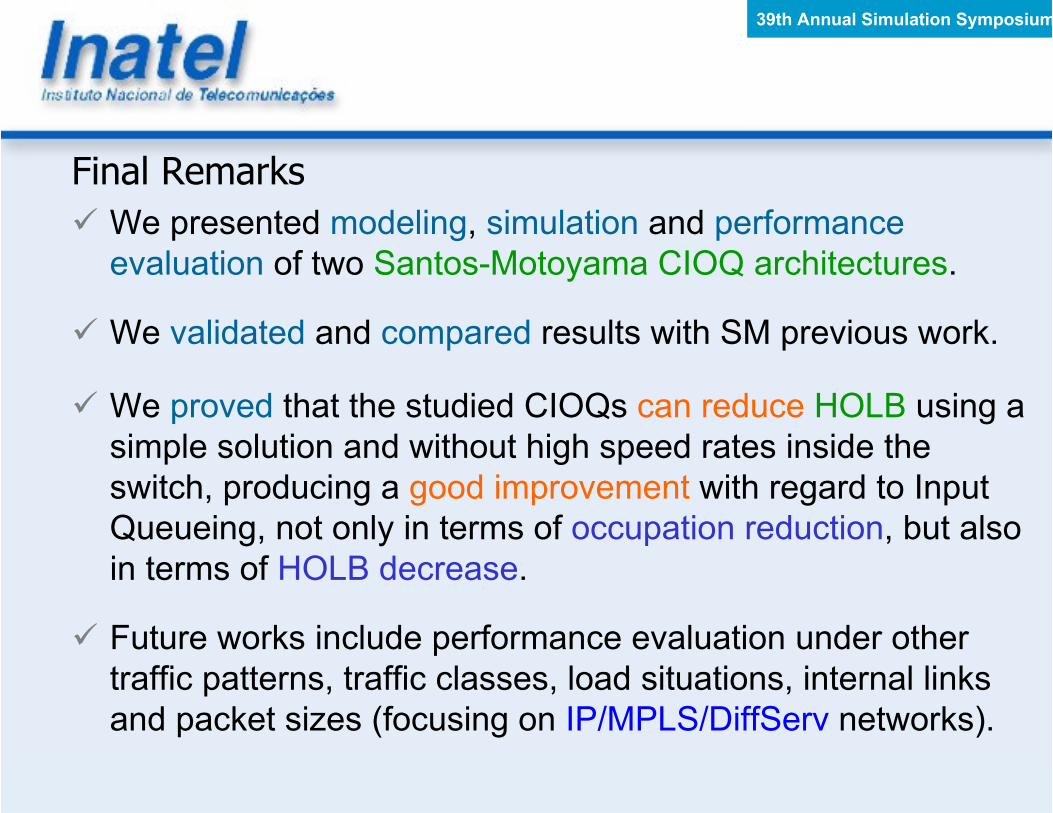
Final Remarks
� We presented modeling, simulation and performance
evaluation of two Santos-Motoyama CIOQ architectures.
� We validated and compared results with SM previous work.
� We proved that the studied CIOQs can reduce HOLB using a
simple solution and without high speed rates inside the
switch, producing a good improvement with regard to Input
Queueing, not only in terms of occupation reduction, but also
in terms of HOLB decrease.
� Future works include performance evaluation under other
traffic patterns, traffic classes, load situations, internal links
and packet sizes (focusing on IP/MPLS/DiffServ networks).
Related Documents